Embed Size (px)
Citation preview

THREE ESSAYS IN LABOUR ECONOMICS AND
THE ECONOMICS OF EDUCATION
by
Mohsen Javdani Haji
M.A. (Economics), University of British Columbia, 2006 B.A. (Economics), Shahid Beheshti University, 2005
Thesis Submitted in Partial Fulfillment
of the Requirements for the Degree of
Doctor of Philosophy
in the
Department of Economics
Faculty of Arts and Social Sciences
Mohsen Javdani Haji 2012
SIMON FRASER UNIVERSITY
Summer 2012
All rights reserved. However, in accordance with the Copyright Act of Canada, this work may
be reproduced, without authorization, under the conditions for “Fair Dealing.” Therefore, limited reproduction of this work for the
purposes of private study, research, criticism, review and news reporting is likely to be in accordance with the law, particularly if cited appropriately.

ii
Approval
Name: Mohsen Javdani Haji
Degree: Doctor of Philosophy
Title of Thesis: Three Essays in Labour Economics and the Economics of Education
Examining Committee:
Chair: Andrew McGee Assistant Professor, Department of Economics
Simon Woodcock Senior Supervisor Associate Professor, Department of Economics
Jane Friesen Co-Supervisor Associate Professor, Department of Economics
Krishna Pendakur Supervisor Professor, Department of Economics
Rachel Fouladi Internal Examiner Associate Professor, Department of Psychology Simon Fraser University
David Green External Examiner Professor, Department of Economics University of British Columbia
Date Defended/Approved: May 18, 2012

iii
Partial Copyright Licence

iv
Abstract
This thesis consists of three empirical essays. The first chapter is focused on the
economics of gender, and the other two chapters are focused on the economics of
education. A common theme in all these three chapters is studying the outcomes of
disadvantaged groups in society, with an eye to policy interventions that could improve
these outcomes.
The first chapter examines whether women face a glass ceiling in the labour
market, which would imply that they are under-represented in high wage regions of the
wage distribution. I also measure the extent to which the glass ceiling comes about
because women are segregated into lower-paying firms (glass doors), or because they
are segregated into lower-paying jobs within firms (within-firm glass ceilings). I find clear
evidence that women experience a glass ceiling that is driven mainly by their
disproportionate sorting across firm types rather than sorting across jobs within firms. I
find no evidence that gender differences in sorting across firms can be accounted for by
compensating differentials. However, my results are consistent with predictions of an
efficiency wage model where high-paying firms discriminate against females.
The second chapter estimates the effect of publicly-disseminated information
about school achievement on school choice decisions. We find that students are more
likely to leave their school when public information reveals poor school-level
performance. Some parents’ respond to information soon after it becomes available.
Others, including non-English-speaking parents, alter their school choice decisions only
in response to information that has been disseminated widely and discussed in the
media. Parents in low-income neighbourhoods are most likely to alter their school
choice decisions in response to new information.
The third chapter measures the extent to which cross-sectional differences in
schools’ average achievement on standardized tests are due to transitory factors. Test-
based measures of school performance are increasingly used to shape education policy,
and recent evidence shows that they also affect families’ school choice decisions. There
are, however, concerns about the precision of these measures. My results suggest that

v
sampling variation and one-time mean reverting shocks are a significant source of cross-
sectional variation in schools’ mean test scores.
Keywords: Gender Wage Gap; Glass Ceiling; Inter-Firm Gender Segregation; Test-Based School Achievement Measures; School Choice; Transitory Factors

vi
Dedication
To my patient wife, Shabnam, for her love and
support every step of the way.
And to my lovely parents, Hamid and Laleh,
for their encouragement and support.
I love you.

vii
Acknowledgements
I would like to express my gratitude to my senior supervisor, Simon Woodcock,
and my co-supervisor, Jane Friesen, for their excellent mentoring and invaluable
guidance, wisdom and support. I am indebted to them for the time and effort they spent
helping me finish this thesis. I would also like to thank my supervisor, Krishna Pendakur,
for helpful comments and suggestions. I also would like to thank Andrew McGee, Chris
Muris, Brian Krauth and Mark Campbell for helpful comments and discussions.
In addition, I would like to thank Lee Grenon, Chunling Fu and Raman Grover,
research analysts at Statistics Canada Research Data Centre at UBC and SFU, for their
help.
I would also like to thank my peers in the graduate program in economics at
Simon Fraser University. In particular Michele Battisti, Benjamin Harris and Pierre
Nguimkeu who have been great school-mates and dear friends.
And last but certainly not least, I would like to thank the staff members at the
department of economics who were always cheerful, kind and helpful. Especially Gwen
Wild, Kathleen Vieira-Ribeiro, Tim Coram and Kathy Godson.

viii
Table of Contents
Approval .............................................................................................................................ii Partial Copyright Licence .................................................................................................. iii Abstract .............................................................................................................................iv Dedication .........................................................................................................................vi Acknowledgements .......................................................................................................... vii Table of Contents ............................................................................................................ viii List of Tables ..................................................................................................................... x List of Figures................................................................................................................... xii
1. Glass Ceilings or Glass Doors? The Role of Firms in Gender Wage Disparities ............................................................................................................... 1
1.1. Introduction .............................................................................................................. 1 1.2. Previous Literature ................................................................................................... 3 1.3. Empirical Methodology ............................................................................................. 5
1.3.1. Glass Doors .................................................................................................. 6 1.3.2. Conditional Representation .......................................................................... 9
1.4. Data and Sample Characteristics ........................................................................... 11 1.5. Results ................................................................................................................... 14
1.5.1. Glass Ceilings and Glass Doors ................................................................. 14 1.5.2. Conditional Representation of Females and the Contribution of
Glass Doors ................................................................................................ 18 1.5.3. Possible Explanations: Compensating Differentials versus Efficiency
Wages ........................................................................................................ 19 1.6. Conclusion ............................................................................................................. 26 1.7. Reference ............................................................................................................... 28 1.8. Tables and Figures ................................................................................................ 32 1.9. Appendices ............................................................................................................ 49
1.9.1. Appendix A: Additional Tables .................................................................... 49 1.9.2. Appendix B: Data Appendix ........................................................................ 58
2. How do School “Report Cards” Affect School Choice Decisions? ................. 60 2.1. Introduction ............................................................................................................ 60 2.2. Previous Literature ................................................................................................. 62 2.3. Institutional Background ......................................................................................... 64
2.3.1. School Access and Funding in B.C. ........................................................... 64 2.3.2. Testing and Information .............................................................................. 64
2.4. The Effect of New Information on School Choice .................................................. 66 2.4.1. Basic Model ................................................................................................ 66 2.4.2. Model Dynamics ......................................................................................... 68
2.5. Methodology ........................................................................................................... 70 2.5.1. Empirical Model .......................................................................................... 70 2.5.2. Data ............................................................................................................ 74
2.6. Results ................................................................................................................... 76 2.6.1. Descriptive Statistics .................................................................................. 76 2.6.2. Econometric Estimates ............................................................................... 77
2.6.2.1. Difference-in-differences Estimates of Response to First Information Shock ........................................................................ 77

ix
2.6.2.2. Control Function Estimates .......................................................... 79 2.7. Conclusion ............................................................................................................. 82 2.8. References ............................................................................................................. 84 2.9. Tables .................................................................................................................... 88 2.10. Appendices ............................................................................................................ 93
2.10.1. Appendix A: Identification via the Control Function Estimation .................. 93 2.10.2. Appendix B: Additional Tables .................................................................... 97 2.10.3. Appendix C: Data Appendix ..................................................................... 108
2.10.3.1. Control Variables ....................................................................... 108 2.10.3.2. Coding of Neighborhood Characteristics ................................... 108 2.10.3.3. Coding of Distance and School Density Measures .................... 109 2.10.3.4. Coding of Other Key Variables .................................................. 110 2.10.3.5. Missing Data and Other Sample Restrictions ............................ 110
3. Noise or News? Learning About the Content of Test-Based School Achievement Measures ..................................................................................... 112
3.1. Introduction .......................................................................................................... 112 3.2. Previous Literature ............................................................................................... 114 3.3. Institutional Background and Data ....................................................................... 115
3.3.1. Testing and Information ............................................................................ 115 3.3.2. School Choice in B.C. ............................................................................... 116 3.3.3. Data .......................................................................................................... 116
3.4. Volatility in School Mean Test Scores .................................................................. 117 3.4.1. Sampling Variation ................................................................................... 119 3.4.2. Other Transitory Factors ........................................................................... 123
3.5. Conclusion ........................................................................................................... 125 3.6. Reference ............................................................................................................. 127 3.7. Tables and Figures .............................................................................................. 130

x
List of Tables
Table 1.1. Sample Means ............................................................................................ 38
Table 1.2. Gender Wage Gap and Glass Door Estimates ........................................... 41
Table 1.3. OLS Regression Results, Firm-Specific Premiums and Worker Characteristics ............................................................................................ 44
Table 1.4. Firm-Specific Premium and Firms Average Characteristics ....................... 46
Table 1.5. Firm’s Profitability and the Sex Composition of the Workforce ................... 47
Table 1.A1. Economy-wide and within-firm wage disparities, and glass door estimates – Using additional control variables ........................................... 49
Table 1.A2. Economy-wide and within-firm wage disparities, and glass door estimates – Excluding all immigrants ......................................................... 51
Table 1.A3. Economy-wide and within-firm wage disparities, and glass door estimates – Allowing returns to be different for subgroups ........................ 53
Table 1.A4. Decomposing the Glass Door Effect .......................................................... 55
Table 2.1. Information Shocks and Information Variables ........................................... 88
Table 2.2. Sample Percentages and School Separation Rates .................................. 89
Table 2.3. Frequency of Separations by Year of Kindergarten Entry .......................... 89
Table 2.4. Difference-in-Differences Estimates of the Effect of Information about School-level Achievement on Separation Probability ....................... 90
Table 2.5. Control Function Estimates of Effect of Information about School-Level Achievement on Separation Probability ............................................ 91
Table 2.6. Effect of Information about School-level Achievement on Separation Probability, by Home Language and Quartile of Distribution of Neighborhood Income ................................................................................ 92
Table 2.A1. Sample Means of Control Variables ........................................................... 97
Table 2.A2. Distribution of School Achievement Measures ........................................... 98
Table 2.A3. Complete Coefficient Estimates, Difference-in-Differences Estimator ....... 99
Table 2.A4. Complete Coefficient Estimates, Control Function Estimator ................... 101
Table 2.A5. Robustness Checks for Control Function Estimator ................................. 105

xi
Table 2.A6. Falsification Test 1 for Control Function Estimator ................................... 106
Table 2.A7. Falsification Test 2 for Control Function Estimator ................................... 107
Table 3.1. Sample Characteristics. Grade 4 Schools with valid FSA test scores between 1999-2006 .................................................................................. 132
Table 3.2.1. Proportion Ranking in the Top 20% on 4th Grade Test Scores 1999-2006.......................................................................................................... 133
Table 3.2.2. Proportion Ranking in the Top 20% on 7th Grade Test Scores 1999-2006.......................................................................................................... 134
Table 3.3.1. Decomposition of Variance in Schools’ Mean FSA Scores (Grade 4) ...... 135
Table 3.3.2. Decomposition of Variance in Schools’ Mean FSA Scores (Grade 7) ...... 136

xii
List of Figures
Figure 1.1. Distribution of Firm-Level Proportion of Females, for Male and Female Employees ................................................................................... 32
Figure 1.2. Distribution of Firm Effects by Different Firm-Level Proportion of Females .................................................................................................... 32
Figure 1.3. Sample of All Workers .............................................................................. 33
Figure 1.4. All Female Workers without any Dependent Child and All Male Workers ..................................................................................................... 33
Figure 1.5. All Female Workers with at Least One Dependent Child and All Male Workers ............................................................................................ 34
Figure 1.6. All Workers Younger Than 44 ................................................................... 34
Figure 1.7. All Workers Older Than 43 ........................................................................ 35
Figure 1.8. Younger versus Older Workers ................................................................. 35
Figure 1.9. All Single Workers without Dependent Children ....................................... 36
Figure 1.10. Single Females without Dependent Children and Non-Single Females, Versus Non-Single Males .......................................................... 36
Figure 1.11. Single Males without Dependent Children Versus Non-Single Males ........................................................................................................ 37
Figure 3.1.1. Single Females without Dependent Children and Non-Single Females, Versus Non-Single Males ........................................................ 130
Figure 3.1.2. Single Females without Dependent Children and Non-Single Females, Versus Non-Single Males ........................................................ 130
Figure 3.2.1. Single Females without Dependent Children and Non-Single Females, Versus Non-Single Males ........................................................ 131
Figure 3.2.2. Single Females without Dependent Children and Non-Single Females, Versus Non-Single Males ........................................................ 131

1
1. Glass Ceilings or Glass Doors? The Role of Firms in Gender Wage Disparities
1.1. Introduction
As in many countries, women earn lower wages than men in Canada. Despite
modest improvement in the late 1980s, this gap has been largely unchanged since 1992
(Baker and Drolet, 2009). Designing effective policies to improve women’s labor market
outcomes requires knowledge about the mechanisms that underlie this persistent gender
wage gap. Previous studies of the gender wage gap have mainly focused on gender
differences in conditional mean wages. While this comparison is interesting, it is only
indicative of the wage outcomes of “average” workers in each group. More recently,
there has been a growing interest in examining the gender wage gap throughout the
wage distribution. This has been mainly motivated by a popular notion that females face
a “glass ceiling” in the labor market; that is, females are over-represented (under-
represented) in low (high) wage regions of the wage distribution, and their under-
representation becomes more pronounced as we move to the top of the wage
distribution. As a consequence, the gap between male and female wages will be larger
at the top of the wage distribution than at the middle or bottom.
Developing policies that effectively address potential barriers that block the
advancement of women in the labor market requires knowledge about the magnitude of
any glass ceiling, and about the underlying mechanisms that give rise to it. For instance,
if the glass ceiling is driven by barriers to employment at “high-paying firms”, then
policies like employment equity policies that target employment decisions directly will be
more effective. On the other hand, if the glass ceiling is driven by gender wage
disparities within firms, then policies like pay equity policies that target wages directly will
be more effective.

2
This study uses quantile regression methods to estimate the gender wage gap at
different points of the conditional wage distribution in order to examine whether females
in Canada face a glass ceiling. I extend the previous empirical literature on glass
ceilings faced by women by applying a methodology developed by Pendakur and
Woodcock (2010) in the context of native-immigrant wage disparities. I quantify the
extent to which the observed economy-wide glass ceiling is driven by female
segregation into low-paying firms (defined as a “glass door” effect) versus female
segregation into low-paying jobs within firms (defined as a within-firm glass ceiling
effect).
Focusing on gender wage gaps at various quantiles is only partly informative of
women’s representation at high-paying and low-paying jobs, which might be of direct
policy importance. Therefore, following Pendakur et al. (2008), I also construct a
measure of female workers’ representation at high-paying and low-paying jobs. This
“representation index” measures the proportion of female workers in different regions of
the wage distribution, especially the tails, conditional on their personal and job
characteristics. I extend their methodology by estimating the extent to which these
patterns of over-representation and under-representation are driven by gender
segregation across high-paying and low-paying firms.
Finally, I investigate some of the potential underlying sources of inter-firm wage
differentials and inter-firm sex segregation. I empirically test the implications of two
competing theoretical models, the compensating differentials model and the efficiency
wage model with gender discrimination. The results help to illuminate some of the
underlying mechanisms that generate the observed difference in male-female sorting
across high-paying and low-paying firms.
I find clear evidence that females face an economy-wide glass ceiling: the gender
wage gap increases from -0.12 log points at the 10th percentile of the conditional wage
distribution to -0.20 log points at the 90th percentile. I find strong evidence that the
economy-wide glass ceiling is mainly driven by glass doors. Three quarters of the
increase in the gender wage gap between the 10th and 90th percentile of the conditional
wage distribution is due to differential sorting of males and females across high- and
low-paying firms (glass doors). I find no evidence that inter-firm wage differences, and

3
inter-firm gender differences in sorting, can be accounted for by compensating
differentials. However, my results are consistent with predictions of an efficiency wage
model where high-paying firms discriminate against females. My results also suggest
that after controlling for observables and inter-firm sorting, females still experience a
sizeable within-firm wage gap (about 11 percent) throughout the wage distribution.
1.2. Previous Literature
Beginning with the seminal contribution of Albrecht et al. (2003), there has been
a growing interest in how the gender wage gap varies throughout the wage distribution.
In contrast with most of the previous studies that compare gender differences in average
wages, this approach informs us about places in the wage distribution where these wage
gaps appear, and are more pronounced.1 This recent literature generally finds larger
gender wage gaps at the top of the wage distribution than in lower parts of the wage
distribution, even after controlling for observable person, job and firm characteristics
(Garfeazabal and Ugidos 2005; Nordman and Wolff 2007; Datta Gupta et al. 2006;
Arulampalam et al. 2007; de la Rica et al. 2008 ; Jellal et al. 2008). These results, all of
which are obtained using data from European labor markets, are consistent with what is
referred to as a glass ceiling effect. It is of substantial interest to learn whether wage
patterns are similar in Canada, where government policies, wage-setting institutions,
women’s relative market qualifications and the wage structure differ in important ways
from European environments.
The economy-wide glass ceilings found by these studies could stem from the fact
that females face glass ceilings within firms. However, as suggested by Dickens and
Katz (1987), Groshen (1990 and 1991a), Bronars and Famulari (1997), Wooden (1998),
1 For instance, any observed gender differences in average wages could be driven by large wage
gaps faced by females at the top of the wage distribution, or at the bottom of the wage distribution, or a uniform wage gap faced by females throughout the wage distribution. These different wage patterns have different implications and require different remedies.

4
Salvanes et al. (1998), Abowd, Kramarz and Margolis (1999), and Woodcock (2007),
inter-firm wage differentials explain a large portion of variation in individuals’ wages.
Therefore, an alternative explanation for the observed economy-wide glass ceiling
experienced by females is disproportionate sorting of men and women across high-
paying versus low-paying firms (the glass door effect). Similar to the glass ceiling effect
that truncates the distribution of wages for female workers, the glass door effect may
truncate the distribution of firms at which female workers might find employment. No
previous studies of the glass ceiling faced by females distinguish between within-firm
versus economy-wide wage outcomes, and the extent to which the glass ceiling faced by
females operates between firms versus within firms.
A separate literature focuses on inter-firm sex segregation and its effect on the
average gender wage gap. Early studies of inter-firm sex segregation use specialized
samples that are not representative of the national economy and cover only a narrow
range of industries, occupations or regions. They found that women are typically
segregated into lower-paying firms, even within occupations, and this inter-firm sex
segregation accounts for a considerable portion of the average gender wage gap
(McNulty 1967; Buckley 1971; Blau 1977; Pfeffer and Davis-Blake 1987; Groshen
1991b; Reilly and Wirjanto 1999; Carrington and Troske 1995; Griffin and Trejo 1995,
1997 and 1998). More recent studies (Milgrom et al. 2001; Bayard et al. 2003; Gupta
and Rothstein 2005; Amuedo-Dorantes and De la Rica 2006) use nationally
representative matched employer-employee data sets to quantify the contribution of sex
segregation by industry, occupation, establishment and occupation-establishment cell
(job cell) to the average gender wage gap. All these studies find that segregation of
females into lower-paying occupations, industries, establishments and occupations
within establishments accounts for a substantial portion of the average gender wage
gap. With the exception of Milgrom et al. (2001), they also find that there remains a
considerable within-job-cell average gender wage gap even after controlling for
observed worker characteristics and accounting for segregation of females into lower-
paying occupations, industries, establishments and occupations within establishments.
Pendakur and Woodcock’s (2010) methodology, which is developed in the
context of native-immigrant wage disparities, has several advantages over
methodologies used in other recent studies (Bayard et al. 2003; Gupta and Rothstein

5
2005; Amuedo-Dorantes and De la Rica 2006). First, it provides a way to measure the
effect of inter-firm segregation throughout the wage distribution, not only at the mean.
Second, it does not rely on estimates of the proportion female in the firm to quantify the
effects of inter-firm gender segregation on the gender wage gap.2 As pointed out by
Bayard et al. (2003), because only a sample of firm’s employees are observed in these
data, sampling error in these estimates can be severe. In addition, using the estimates
of the proportion of females in each firm to study the inter-firm sex segregation assumes
a particular functional form on the way segregation affects wages.
1.3. Empirical Methodology
I start by comparing average log wages of males and females, conditional on
their observed individual and job characteristics, using the following linear regression
model:
(1) | , ′ ,
where is the log hourly wage of worker ; is a vector of observable job-
related characteristics that influence wages (e.g. education, labor market experience,
ethnicity, etc.); is a gender indicator which is equal to one for females; and
measures the difference in average log wages of males and females with the same
observed characteristics .
To assess the existence of an economy-wide glass ceiling experienced by
females, I estimate the gender wage gap at several quantiles of the conditional wage
distribution. The existence of an economy-wide glass ceiling would imply that females
are over-represented (under-represented) in low (high) wage regions of the wage
distribution, and their under-representation becomes more pronounced as we move to
2 For example, to quantify the effect of inter-firm gender segregation, Bayard et al. (2003) use a
regression of wages on the estimates of the proportion of females in worker’s firm, as well as usual observable characteristics.

6
the top of the wage distribution. As a consequence, in the presence of an economy-
wide glass ceiling, the gap between male and female wages will be larger at the top of
the wage distribution than at the middle or bottom.
I measure the wage gap at the conditional quantile of the wage distribution
using the quantile regressions that satisfies
(2) Pr ′ , ,
where measures the returns to individual characteristics at the quantile,
and measures the difference between the quantile of log wages of males and
females, conditional on . Comparing estimates of at different quantiles enables me
to study how gender wage differentials vary over the conditional wage distribution and
allows me to examine the existence of a glass ceiling faced by females.
1.3.1. Glass Doors
The glass door effect arises if women are disproportionately sorted into lower-
paying firms, compared to their male counterparts. Such sorting may contribute to the
gender wage gap. I apply the methodology developed by Pendakur and Woodcock
(2010) in the context of native-immigrant wage differentials, to measure the glass door
effect by comparing within-firm and economy-wide gender wage gaps. The intuition
behind their methodology is that if females experience better wage outcomes within
firms than they do economy-wide, it implies that their low wage outcomes, relative to
their male counterparts, are partly due to segregation into lower–paying firm.
I consider three features of the conditional wage distribution in my investigation
of the glass door effect: conditional means, conditional quantiles and conditional
representation. I examine the effect of glass doors on conditional mean wages to
assess whether female workers are, on average, employed in firms that pay lower
wages relative to their male counterparts. I also estimate the glass door effect at
different quantiles of the conditional wage distribution to quantify the extent to which the
gender wage gap in different parts of the wage distribution, and its pattern of change
throughout the wage distribution, is driven by gender differences in sorting across firms.
This enables me to measure the contribution of glass doors to the economy-wide glass

7
ceiling. Finally, I measure the contribution of glass ceiling and glass doors to the
representation of females in different regions of the conditional wage distribution,
adopting and extending a methodology proposed by Pendakur et al. (2008).
To measure the glass door effect, I first need to construct within-firm measures of
average gender wage disparity, which could be obtained by adding firm effects to
equation (1). These firm effects will capture both observed and unobserved employer
characteristics that are common to all employees and constant over time. In the mean
regression case, we have
(3) | , , ′ ′ ,
where is a vector of indicators for each firm and is a vector of firm effects
that measure inter-firm differences in average wages, conditional on worker and job
characteristics and gender .3 Compared to equation (1), in equation (3) measures
the average gender wage gap conditional on observed individual characteristics and
both observed and unobserved employer characteristics that are constant over time.
Since is identified within firms, it measures the gender wage gap taking into account
gender differences in sorting across high-paying and low-paying firms.
Pendakur and Woodcock (2010) define the glass door effect as in the
hypothetical regression:
(4) ′ , ′ ′ .
The coefficient in this hypothetical regression would measure the average firm
effect of female workers relative to males, conditional on their characteristics.4 This
3 An implicit assumption in equation (3) is that firm effects are similar for all employees of a firm,
conditional on , and therefore the firm effects are a location shift of the conditional wage distribution. In other words, conditional on worker characteristics and gender, the shape of the wage distribution is the same at every firm, and it is only its mean (location) that differs across firms.
4 This is a hypothetical regression because we do not observe the true firm effects.

8
measures how wages are affected by gender differences in sorting across firms,
conditional on worker’s observed characteristics. Pendakur and Woodcock (2010) show
that is an unbiased estimator of , where and are estimates of from
equation (3) and (1), respectively. This is due to the well-known result that omitted
variable bias can be recovered as least squares coefficient in an artificial regression
(see, e.g., Greene 2003, pp. 148-149).
It should be noted that a zero glass door effect does not imply that firm effects do
not belong to the model. Rather, it implies that, conditional on worker characteristics,
firm effects are uncorrelated with gender. In other words, conditional on their
characteristics, male and female workers are similarly sorted across firms. Therefore,
under the null hypothesis of no glass door effect ( : 0 , both specifications
produce consistent estimates of the gender wage gap, , but the estimate in the
specification with firm effects is inefficient. However, under the alternative hypothesis of
a nonzero glass door effect ( : 0 , only estimates from the specification that
includes firm effects are consistent. This motivates a Hausman test for the presence of
a glass door effect:5
(5)
∼ .
I measure the contribution of glass doors to the gender wage gap at different
points of the wage distribution in an analogous fashion. I estimate quantile regression
with firm effects: 6
(6) Pr ′ ′ , , .
5 See Pendakur and Woodcock (2010) for the proof. 6 I use an estimator proposed by Canay (2011) to implement the quantile regressions with firm
effects. Pendakur and Woodcock (2010) use Koenker and Ng’s (2005) Frisch-Newton algorithm and subroutines in R to implement the quantile regression model with firm effects. However, the large number of firms and surveyed employees poses some computational challenge and creates some constraints for them. Canay’s proposed estimator, however, is quite simple to compute and can be implemented in standard econometrics packages.

9
Pendakur and Woodcock (2010) show that if equation (6) is correctly specified,
then has a similar interpretation as the mean regression case, where and
are coefficients on in quantile regressions that include and exclude firm effects,
respectively. Specifically, estimates the gender coefficient in a hypothetical
least square regression of ′ on and using quantile-specific weights.7 This
provides a measure of the glass door effect at the quantile of the conditional wage
distribution. As in the mean regression case, I can also test for the glass door effect at a
particular quantile using a Hausman test.
1.3.2. Conditional Representation
The location of a particular wage quantile for males and females does not
provide much information about their prevalence in (or access to) a region of the wage
distribution. For instance, knowing that the conditional top decile of earnings is $20,000
lower for women than men tells us that females are under-represented in the top decile
of the population conditional wage distribution, but it does not tell us the magnitude of
their under-representation. Since the glass ceiling effect causes women to be under-
represented in high-wage regions of the wage distribution, it would be interesting to
quantify their degree of under-representation as another measure of women’s labor
market outcomes.
I use an index developed by Pendakur et al. (2008) to measure females’
representation in different regions of the wage distribution, conditional on their observed
personal and job characteristics. To construct this index, I estimate quantiles of the
population wage distribution, conditional on characteristics , from the quantile
regression that satisfies
(7) Pr ′ .
7 These weights are large (small) for employees of firms with large (small) ψ at upper quantiles of
the conditional wage distribution, and the opposite at lower quantiles. For a more detailed description of these weights, see the discussion following the proof of Proposition 1 in Pendakur and Woodcock’s (2010) appendix.

10
The conditional representation of female workers above the quantile of the
population wage distribution is:
(8) Rτ ∑ ∈ ,
where N is the number of females, denotes the indicator function, and is
the quantile of the population wage distribution conditional on estimated by (7). Rτ
measures the proportion of female workers who earn more than the th quantile of the
population conditional wage distribution, given their characteristics .8
I extend this methodology to quantify the effect of gender differences in sorting
across high-paying and low-paying firms on females’ representation in different parts of
the wage distribution. I estimate quantiles of the population wage distribution,
conditional on characteristics, , and firm affiliation from the quantile regression that
satisfies:
(9) Pr ′ ′ .
The representation of females above the quantile, conditional on their
observed characteristics and their firm affiliation, is:
(10) Rτ ∑ I∈ .
Pendakur et al. (2008) show that comparing conditional and unconditional
representation indices is informative of the contribution of individual characteristics to
female’s over- or under-representation in different regions of the income distribution.
Using the same intuition, it follows that comparing females’ representation conditional on
their characteristics , and females’ representation conditional on their characteristics
8 If R 1 τ, the proportion of females above the τth quantile exceeds the population proportion and the group is overrepresented in that region. Similarly, if R 1 τ, the group is under-represented in that region. For example, if the conditional representation of female workers in the top decile of income is 0.08, then we can conclude that there are 20 percent less females in the top decile of income than we would expect given their characteristics.

11
and firm affiliation is informative of how inter-firm gender segregation affects females’
representation in different regions of the wage distribution.9 The value of R . measures
the proportion of females in the top decile of the economy-wide population wage
distribution, given their characteristics . In contrast, the value of R . measures the
proportion of females in the top decile of the within-firm population wage distribution,
given their characteristics . If Rτ >Rτ, then females’ segregation into low-paying firms
explains part (or if Rτ 0.1, all) of their under-representation in the top decile.
1.4. Data and Sample Characteristics
My estimates are based on the Workplace and Employee Survey (WES). This is
one of a few linked employer-employee databases worldwide, and the only such data for
Canada. The survey was administered from 1999 to 2005. The employer sample is
longitudinal and refreshed every second year (i.e. in 2001, 2003 and 2005) to maintain a
representative cross section. The target population of employers is all business
locations in Canada that have paid employees in March of each surveyed year, except
employers in Yukon, Nunavut and Northwest Territories and employers operating in crop
9 I run a simulation to confirm the validity of this interpretation. I assign males and females
randomly to high-paying and low-paying firms (no inter-firm gender segregation). I then use a DGP to construct an artificial economy-wide gender wage gap. In this new dataset, the estimated economy-wide and within-firm gender wage gap are the same since there is no inter-firm gender segregation. Estimating females’ representation using equations (8) and (10), I find that the difference between these two indices is zero. In other words, the glass door effect has no effect on over- or under-representation of female workers in different regions of the wage distribution if there is no inter-firm gender segregation.

12
production and animal production; fishing, hunting and trapping; private households,
religious organizations and public administration10.
A maximum of twenty-four employees were sampled from each firm in each odd
year, and were followed the next year. 11 My analysis is based on the pooled 1999, 2001,
2003 and 2005 cross-sections. The data from even-numbered years are not used to
avoid sample selection problems associated with employee attrition in these years.
I restrict the sample to non-Aboriginal workers between the age of 24 and 65. I
also restrict the sample of firms to those that report on average 6 employees or more per
year, and that have at least two workers sampled over the entire period they appear in
the data. The restricted sample comprises 73,251 employees of 6,584 firms. I observe
between 2 and 63 employees of each firm; the mean number is 16 and the median is 15.
I observe 2,373 firms in all 4 years, 1,519 firm in three years, 1,262 firms in two years
and the remaining 1,430 in one year.
I estimate wage differentials and representation indices for the sample of all
workers, as well as for five different subgroups including workers with at least one
dependent child, workers without dependent children, workers younger than 44 years of
age, workers older than 43 years of age, and single workers without dependent
children.12
10 Public Administration comprises establishments primarily engaged in activities of a
governmental nature, that is, the enactment and judicial interpretation of laws and their pursuant regulations, and the administration of programs based on them. Legislative activities, taxation, national defence, public order and safety, immigration services, foreign affairs and international assistance, and the administration of government programs are activities that are purely governmental in nature (Industry Canada: http://www.ic.gc.ca/cis-sic/cis-sic.nsf/IDE/cis-sic91defe.html). Public Administration’s share of employment in Canada is around 6.5 percent (Statistics Canada, Table 281-0024).
11 The number of workers sampled for each firm was proportional to firm’s size except workplaces with fewer than four employees where all employees are selected.
12 I use the sample of all workers and appropriate interactions with gender to identify the wage differentials for these subgroups. For instance, to estimate the average wage gap for workers younger than 44 and older than 43, I use the following regression: | , ′

13
My outcome measure is the natural logarithm of hourly wages.13 The individual
characteristics used in my main regression specification are: highest level of schooling
(8 categories), marital status (6 categories), age (9 categories), number of dependent
children (5 categories), a quartic in years of (actual) full-time labor market experience, a
quadratic in years of seniority with the current employer, an indicator for full-time
employment, occupation (6 categories), an indicator for membership in a union or
collective bargaining agreement, and indicators for being a Canadian born visible
minority, white immigrant, or a visible minority immigrant.
I estimate all specifications using employee sample weights provided by
Statistics Canada. Standard errors are estimated following Statistics Canada’s
recommended procedure, using 100 sets of bootstrap sample weights. 14
Table 1.1 reports weighted sample means for males and females. In comparison
to males, the average female is more educated, less likely to have children, and has
fewer years of fulltime labor market experience. In terms of job characteristics, the
average female has fewer years of employer seniority, is less likely to work fulltime,
more likely to be a member of union or collective bargaining agreement, less likely to
work flexible hours, less likely to be able to carry out work duties at home and less likely
to be a manager. In terms of employer characteristics, the average female is more likely
to work for a non-profit enterprise, and more likely to work for an employer with an
employment or pay equity program.
∗ 44 ∗ 43 44 Where “ 44” and “ 43” are indicators for workers younger than 44 and older than 43, respectively.
13 The hourly wage measure includes extra earnings such as over-time, bonus, profit sharing, etc. 14 The bootstrap weights will consider the potential non-independence of error terms for workers
within the same firm. They will also correctly adjust for the variation due to the two-stage sampling of employees, as well as the complex survey design of the WES (Drolet 2002).

14
1.5. Results
1.5.1. Glass Ceilings and Glass Doors
Figure 1.1 illustrates the distribution of the proportion of female employees at
firms in which male and female workers are employed, seperately.15 As the figure
suggests, firms tend to be quite segregated by gender. Males on average are employed
at firms where only 32 percent of workers are female, while females are on average
employed at firms where 62 percent of workers are female. Figure 1.2 illustrates the
distribution of estimated firm effects from equation (3) for four different categories of
firms: firms with proportion of female employees below 25 percent, between 25 and 50
percent, between 50 and 75 percent, and above 75 percent. Firm effects are on
average larger in firms that employ fewer females. Together, figure 1.1 and 1.2 suggest
that there is significant gender segregation at the firm level, and firms that employ fewer
females tend to pay higher wages, conditional on observed individual and job
characteristics. This result highlights the importance of studying the effect of gender
segregation across firms on gender wage gap.
Table 1.2 presents mean and quantile estimates of economy-wide and within-firm
gender wage gaps, and estimates of the glass door effect. Table 1.2 also reports
females’ representation index in different parts of the population wage distribution,
conditional on their characteristics, and firm affiliation.
Females face substantial economy-wide and within-firm average wage gaps
compared to their male counterparts: about -0.16 log points and -0.11 log points,
respectively, in the sample of all workers. Almost one-third (-0.05 log points) of the
economy-wide average wage gap that females face is due to the glass door effect.
There is also strong evidence that females face an economy-wide glass ceiling: the
wage gap increases from -0.12 log points at the 10th percentile of the conditional wage
15 Both figure 1.1 and figure 1.2 are generated using data from 2003 and 2005. This is because
the total number of female workers in each firm is a new variable added to WES in 2003.

15
distribution to -0.16 log points at 50th percentile and -0.20 log points at the 90th
percentile.
Females also face within-firm glass ceilings, but their effects are much less
pronounced than the economy-wide glass ceiling (-0.10 log points at the 10th percentile
versus -0.12 log points at the 90th percentile). Most of the economy-wide glass ceiling,
therefore, is due to the glass door effect. For example, out of an 8 percentage point
increase in the economy-wide wage gap experienced by females between the 10th and
90th percentiles of the conditional wage distribution, only one-fourth is due to the
increase in the within-firm gender wage gap. The remaining three-fourths is due to the
increasing contribution of gender differences in sorting across firms (i.e. glass door
effect). The same pattern holds when we compare the 50th and 90th percentiles.
Figure 1.3 further illustrates the importance of the glass door effect. The vertical
distance between the red line (the estimated economy-wide gender wage gap) and the
blue line (the estimated within-firm gender wage gap) measures the glass door effect at
different points of the conditional wage distribution. The upward slope of the economy-
wide gender wage gap across different quantiles is mostly due to the glass door effect.
Altogether, these results suggest that, conditional on their observed personal and job
characteristics, females tend to sort into lower-paying firms than their male counterparts,
and this differential sorting explains a substantial part of the gender wage gap.
Moreover, this differential sorting contributes more to the gender wage gap at the top of
the wage distribution and hence drives the economy-wide glass ceiling. As the other
panels of table 1.2 suggest, this general pattern holds for different subgroups of workers.
To assess the sensitivity of my estimates to the presence or absence of
dependent children for females, I present estimates of the gender wage gap for female
workers with and without dependent children, compared to all male workers, in panels 3
and 4 of table 1.2. Both groups face wage gaps similar to the overall sample of workers,
although economy-wide wage gaps are slightly larger for women with dependent
children than women without dependent children. Both groups face a substantial
economy-wide glass ceiling that is mostly due to the glass door effect.

16
Panel 2 of table 1.2 presents estimates for all single workers without dependent
children. In this group, there are fewer concerns regarding self-selection of females into
lower-paying jobs due to child or family responsibilities, which some might argue are
partly responsible for the observed gender wage gaps. The estimates reveal that single
female workers also experience a substantial, though smaller economy-wide mean wage
gap (-0.07 log points). Interestingly, the average glass door effect is small and
statistically insignificant for this group, so that the average within-firm gender wage gap
is about as large as the economy-wide wage gap. One might therefore conclude that
the sole source of the average economy-wide wage gap that single females experience
is the within-firm wage gap. Estimated wage gaps at different quantiles of the
conditional wage distribution, however, contradict such a conclusion. Single female
workers experience an economy-wide glass ceiling that is mainly driven by the glass
door effect. The economy-wide wage gap is small and statistically insignificant at the
bottom decile of the conditional wage distribution, while there exists a significantly large
within-firm gender wage gap. This large within-firm gender wage gap is offset by a
positive glass door effect. This result suggests that at the bottom of the conditional
wage distribution, single females tend to be employed at higher-paying firms than their
male counterparts. At the 50th percentile of the conditional wage distribution, females
face substantial economy-wide and within-firm wage gaps (-0.06 log points and -0.09 log
points, respectively). Again, a positive glass door effect offsets part of the within-firm
gender wage gap. At the top decile of the conditional wage distribution, however, the
economy-wide gender wage gap is more than twice as large as the median economy-
wide gender wage gap (-0.14 log points), which is mainly attributed to a large negative
glass door effect (-0.08 log points).
Single females without children are the only group of female workers that are
sorted into higher-paying firms than their male counterparts at lower parts of the
conditional wage distribution. To investigate the potential sources behind this difference,
I estimate the gender wage gap for single females without children and non-single
females, using non-single male workers as the comparison group. These estimates are
illustrated in figure 1.10 and suggest there are no significant differences between wage
outcomes of these two groups of female workers when compared with the same
comparison group. Hence, the difference in results reported for single workers without

17
children at lower parts of the wage distribution might be driven by poor wage outcomes
of single males without children. To test this hypothesis, I estimated economy-wide and
within-firm wage gaps between single males without children and non-single males.
These results are illustrated in figure 1.11 and suggest that single males without children
face substantial economy-wide wage gaps with non-single males that are mainly driven
by the glass door effect, except at the top of the wage distribution.16 This result
suggests that single males without children are sorted into lower-paying firms than non-
single males. Therefore, it seems reasonable to conclude that different wage outcomes
and the glass door effect faced by single females without children at lower parts of the
wage distribution are driven mainly by poor wage outcomes of the single males without
children that they are compared with.
As Albrecht et al. (2003) point out, a potential explanation for an economy-wide
glass ceiling is a compositional effect. If females’ labor market prospects have improved
over time relative to males, then the wage gap between older men and women will be
larger than the gap between younger men and women. On the other hand, since wages
increase with experience in the labor market, older workers tend to have higher wages
than younger workers. The combination of these two factors could generate an
increasing gender wage gap as we move to the top of the wage distribution, which looks
like a glass ceiling. The estimates reported in panels 5 and 6 of table 1.2 rule out this
hypothesis. Here we see that younger workers experience larger economy-wide wage
gaps than older workers. Therefore, the observed economy-wide glass ceiling in my
data cannot be explained through the compositional effect described.
The mean glass door effect is larger for younger female workers than older
female workers (-0.06 log points versus -0.03 log points, respectively). This result
suggests that younger workers are more under-represented in high-paying firms
compared to their male counterparts. Both younger and older women experience a
substantial economy-wide glass ceiling that is mainly driven by the glass door effect.
16 This result is consistent with findings of Peterson et al. (2011).

18
The estimates illustrated in figure 1.8 suggest that the magnitudes of the
economy-wide wage gap and the glass door effect are almost identical in the top half of
the conditional wage distribution for both younger and older female workers. In lower
parts of the conditional wage distribution, however, younger females face a glass door
effect while older females face no glass doors. This result could be due to an age effect
or a cohort effect. The age effect hypothesis suggests that as female workers stay
longer in the labor market, they sort into higher-paying firms in lower parts of the wage
distribution, thus eliminating the glass door effect they face. The cohort effect
hypothesis suggests that labor market conditions have deteriorated over time in ways
that have reduced females’ access to high-paying firms in lower parts of the wage
distribution. Therefore, younger females face glass doors at lower parts of the
conditional wage distribution.
Appendix A presents estimates of a number of additional robustness checks. In
each case, these alternative specifications yield estimates similar to those reported in
the main text.17
1.5.2. Conditional Representation of Females and the Contribution of Glass Doors
As it was explained before, I also examine the representation of females at
different regions of wage distribution, conditional on their characteristics. Furthermore, I
examine the extent to which females’ representation in different parts of the wage
17 Table 1.A1 re-estimates the above regressions by adding some additional control variables
including family income from employment (excluding worker); family income from other sources; four indicators for people who are willing but unable to work more hours due to unavailability of childcare, family responsibilities, going to school and transportation problems; an indicator for possibility to work flexible hours; and an indicator for possibility to carry out work duties at home. Table 1.A2 exclude the immigrant workers from the sample. Table 1.A3 allows the returns to observable characteristics to differ across different subgroups. Table 1.A4 decomposes the glass door effects to sorting across firms and across industries and sorting across firms and within industries. Following De la Rica et al. (2008), I also estimate the gender wage differentials for subsamples of workers stratified by education level. These results are not reported here but are available upon request. I find the same qualitative results for these subsamples.
19
distribution is influenced by their differential sorting across high-paying and low-paying
firms. These results are also summarized in table 1.2.
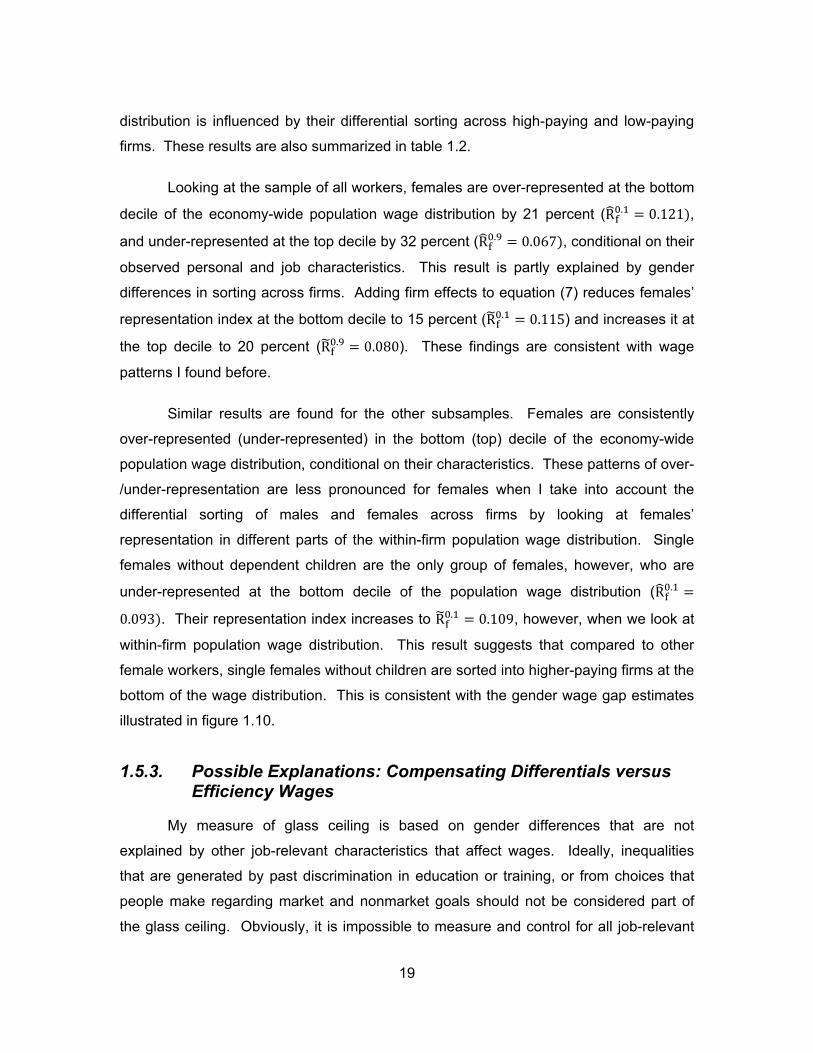
Looking at the sample of all workers, females are over-represented at the bottom
decile of the economy-wide population wage distribution by 21 percent (R . 0.121 ,
and under-represented at the top decile by 32 percent (R . 0.067 , conditional on their
observed personal and job characteristics. This result is partly explained by gender
differences in sorting across firms. Adding firm effects to equation (7) reduces females’
representation index at the bottom decile to 15 percent (R . 0.115) and increases it at
the top decile to 20 percent (R . 0.080). These findings are consistent with wage
patterns I found before.
Similar results are found for the other subsamples. Females are consistently
over-represented (under-represented) in the bottom (top) decile of the economy-wide
population wage distribution, conditional on their characteristics. These patterns of over-
/under-representation are less pronounced for females when I take into account the
differential sorting of males and females across firms by looking at females’
representation in different parts of the within-firm population wage distribution. Single
females without dependent children are the only group of females, however, who are
under-represented at the bottom decile of the population wage distribution (R .
0.093 . Their representation index increases to R . 0.109, however, when we look at
within-firm population wage distribution. This result suggests that compared to other
female workers, single females without children are sorted into higher-paying firms at the
bottom of the wage distribution. This is consistent with the gender wage gap estimates
illustrated in figure 1.10.
1.5.3. Possible Explanations: Compensating Differentials versus Efficiency Wages
My measure of glass ceiling is based on gender differences that are not
explained by other job-relevant characteristics that affect wages. Ideally, inequalities
that are generated by past discrimination in education or training, or from choices that
people make regarding market and nonmarket goals should not be considered part of
the glass ceiling. Obviously, it is impossible to measure and control for all job-relevant

20
characteristics that could affect wages. Therefore, part of the residual gender difference
in wages may reflect differences in productivity or preferences, not discrimination.
If unobserved gender differences in productivity are driving the observed glass
ceiling effect, this would imply that men are more productive than women, and this
productivity gap becomes larger as we move to the top of the wage distribution. As a
result, females will become increasingly under-represented in higher-paying firms. To
the best of my knowledge, this explanation does not have any theoretical or empirical
support. Moreover, as different studies suggest, women have smaller probabilities of
promotion into high-paying jobs, and therefore reaching high-wage regions of the wage
distribution, compared to their male counterparts.18 Regardless of the underlying
reasons behind this gender difference in promotion opportunities (such as superior
ability in non-market activities, discrimination or unmeasured differences in preferences,
commitment, and other unspecified factors), the sequential selection effect generated
through this process should reduce the unobservable differences between men and
women by the time they make it to the top of wage distribution.19 Therefore, if anything,
we would expect these unobservable differences in productivity to have smaller effects
on residual male-female wage gaps, and gender differences in sorting across firms, as
we move to the top of wage distribution.
Finally, as it is discussed below in more details, I find some evidence that
suggests there is a positive relationship between firm’s profitability and the proportion of
18 For instance, Lazear and Rosen (1988) develop a model of jobs where men and women have
the same distribution of labor market ability, but women have superior ability in non-market activities. Their results suggest that “a woman must have greater ability than a man to be promoted. Some women are denied a promotion that goes to a lower ability man.”
19 Imagine that we have 120 male and 120 female workers, and there are 2 levels of management hierarchy. Women have two-thirds the chance of being promoted. Therefore, 80 women and 120 men will be promoted to the second level. If females lower chance of promotion was purely due to discrimination, since these 80 females were more stringently selected compared to their male colleagues, they will have better job-related characteristics than their male counterparts, and therefore should face lower wage gaps. If the lower odds of promotion were purely due to differences in unobserved factors such as productivity or preferences, these differences should be on average smaller between men and women in the second level, and again women should face lower wage gaps.

21
females employed at the firm. If females’ under-representation in high-paying firms is
only a reflection of their lower productivity compared to their male counterparts, we
should not observe any relationship between profitability and the sex composition of
workforce across firms.
The theory of compensating differentials could provide an alternative explanation
for inter-firm wage differentials and subsequently gender differences in sorting across
firms, which could be used to explain the observed glass ceiling effect. In the context of
a compensating differentials model, the inter-firm wage differentials stem from inter-firm
differences in working conditions. High-paying firms offer higher wages on average, but
also have relatively harder working conditions. If men and women value job
characteristics differently, then gender pay differentials may be compensated by other
characteristics of female jobs such as more pleasant working conditions.20 Females will
choose low-paying firms because they care more about non-pecuniary aspects of a job,
while men will choose high-paying firms because they care more about wages. As a
result, females’ under-representation in high-paying firms will become more pronounced,
and gender wage gap will grow larger, if inter-firm differences in working conditions get
larger as we move to the top of the wage distribution. This will generate an increasing
gender wage gap that looks like a glass ceiling.
To test this possibility, I estimate a specification that controls for job
characteristics including flexible work hours; possibility to carry out work duties at home;
indicators of inability to work more hours due to unavailability of childcare, personal and
family responsibilities, going to school, or transportation problems. I also control for total
family income from employment and other sources. These results are reported in
20 The theory of compensating differentials is usually applied to explain the inter-occupational gender segregation and wage differentials while this study already controls for different occupations and looks at the segregation of females within occupations but across different firms. Filer (1985) and Jacob and Steinberg (1990) show that there are no significant differences in average measures of working conditions within occupations (even very broad categorization) and once we control for occupation the effect of these measures is not significant anymore. In addition, most of the studies that look at inter-industry wage differentials find no evidence in support of compensating differentials (Smith, 1979; Brown, 1980; Kruger and Summers, 1988).
22
appendix table 1.A1 and are quantitatively and qualitatively similar to the main results in
table 1.2. This result suggests that these job characteristics do not explain the observed
glass ceiling and glass door effects.
As a second and more comprehensive test, I examine whether reported job
satisfaction differs on average between workers employed in high-paying and low-paying
firms. If wages compensate for undesirable job characteristics, workers employed at
lower-paying firms should report higher levels of job satisfaction, conditional on observed
individual and job characteristics and worker’s pay satisfaction.21 I run a regression of
estimated firm effects from equation (3) on the observable worker and job characteristics
used in my main specification, as well as 4 indictors for pay satisfaction (very satisfied,
satisfied, dissatisfied and indifferent, with very dissatisfied as the omitted category) and
2 indicators for job satisfaction (very satisfied or satisfied, and indifferent, with
dissatisfied or very dissatisfied as the omitted category). I run this regression for the
sample of all workers and for male and female workers separately.
The results are reported in table 1.3. Those employed at lower-paying firms do
not report higher levels of job satisfaction, on average, than those employed at relatively
higher-paying firms, conditional on observed characteristics and pay satisfaction.22
Altogether, my results don’t provide any evidence that compensating differentials
contribute to the economy-wide glass ceiling through inter-firm gender differences in
sorting.
Efficiency wage theory provides another potential explanation for inter-firm wage
differentials. The efficiency wage hypothesis (See Shapiro and Stiglitz 1984, Stiglitz
1986, Bowles 1985, Bulow and Summers 1986, Yellen 1984 and Katz 1986) suggests
that firms might find it profitable to pay above market clearing wages to increase effort,
reduce shirking, lower turnover, attract a higher quality workforce, increase productivity,
21 The reason that I control for pay satisfaction rather than worker’s wage is that wages will be
mechanically correlated with the dependant variable. 22 These results are consistent for the sample of all workers, and for the samples of male workers
and female workers.

23
and improve worker morale and group work norms. If the conditions necessitating
efficiency wage payments differ across firms, then the optimal wage will also differ
across firms. This implies that workers with identical productive characteristics may be
paid differently depending on their firm affiliations. These wage differences for similar
workers might reflect firm characteristics that do not directly influence worker utility, and
thus would not require compensating differentials in a competitive labor market. Kruger
and Summers (1988), Katz and Summers (1989) and Groshen (1991a) find empirical
support in favor of efficiency wage theory.
I test the predictions of efficiency wage theory regarding the relationship between
firm-specific premium and firm’s characteristics such as productivity and quite rates by
regressing estimated firm effects from equation (3) on a wide set of firm-level
characteristics including industry (14 categories), firm size (4 categories), an indicator for
a pay equity program, an indicator for an employment equity program, foreign ownership
(4 categories), degree of competition faced (4 categories), quit rate, proportion of full-
time workers, an indicator for good labor-management relations, proportion of workers
covered by a collective bargaining agreement, a standardized z-score measure for
provision of non-wage benefits (e.g. dental care, life insurance, Supplemental medical,
Pension plan, Group RRSP, Stock purchase, etc), an indicator for incentive
compensation schemes (e.g. productivity/quality gain-sharing, individual incentive
systems, merit pay and skill-based pay, or profit sharing, etc), the logarithm of training
expenditures per worker, an indicator for innovative work practices in the firm (e.g. self-
directed work groups, problem-solving teams, employee suggestion groups, etc), and
productivity measured as the logarithm of value-added per worker.23
23 This regression is only run for the sample of for-profit firms since the productivity measure is
only available for these firms. I have run the same regression for all firms, without including a productivity measure, and my results are similar to those reported here. I also use other alternative measures of training and provision of different benefits by the firm, and I find the same qualitative results. These results are available upon request. Refer to the data appendix for a more detailed description of the variables.

24
The results are reported in table 1.4. Firms that pay higher premiums to their
employees (after accounting for inter-firm differences in workforce composition) are on
average larger, more likely to have a pay equity program, face more competition, are
more likely to provide non-wage benefits, have lower quit rates, have higher training
expenditures, have higher productivity, are more likely to have incentive compensation
schemes, and are less likely to have innovative work practices. These results support
the predictions of the efficiency wage theory such as lower quit rates and higher
productivity for higher-paying firms. In addition, the fact that higher-paying firms not only
offer higher premiums to their employees, but also provide more non-wage benefits and
training, provides further evidence against the compensating differentials theory.
The question that still remains is whether efficiency wage theory can help us to
understand the glass ceiling effect faced by females arising from inter-firm gender
differences in sorting? It is difficult to think of a supply-side reason that explains why
women would avoid jobs with efficiency wages. On the other hand, since a central
element in efficiency wage theory is wage differentials that are unrelated to productivity
differentials across workers, it is natural to think that it can provide the basis for a theory
of discrimination. Yellen (1984) argues that in the context of efficiency wage model,
employers can costlessly discriminate against a group of workers with some observable
characteristics. Bulow and Summers (1986) also develop an efficiency wage model that
rationalizes discrimination based on group differences that are unrelated to productivity.
Firms paying efficiency wages would believe it is not optimal to hire women if
they assume that females don’t alter their behavior in response to higher wages, for
instance because they are less career oriented or less productive. Or if they assume it
takes a higher wage increment to deter women’s behavior like shirking because they
have higher quite rates and as a result the cost of losing their job is less than the cost for
men. These assumptions could be based on stereotypes about female workers,
considering them as more communal, caring and family oriented compared to males
who might be considered as more assertive and work-oriented. If stereotype-based
assumptions about females are incorrect, these lower wages are discriminatory and
inefficient. Even if these assumptions about females are on average correct, it does not
rule out the possibility of statistical discrimination against females that could lead to
gender differences in sorting across firms. For instance, there could be statistical

25
discrimination against women based on beliefs in gender differences in turnover rates
(Aldrich and Buchele, 1989).
I adopt an empirical test proposed by Hellerstein et al. (2002) to examine the
presence of discrimination against women in the labor market in the context of efficiency
wage theory, which would limit females’ access to high-paying firms. I implement the
test by examining the cross-sectional relationship between profitability and the sex
composition of the workforce. If discrimination plays no role in gender differences in
sorting across firms, then there should be no relationship between profitability and the
sex composition of the workforce. In the absence of discrimination against females that
blocks their access to high-paying firms, females’ under-representation in high-paying
firms, and the gender wage gap generated through this sorting, must reflect only
observed or unobserved gender differences in productivity or preferences. Therefore,
lower-paying firms with higher proportion of females should earn no higher profits than
higher-paying firms with lower proportion of females. A finding that firms with higher
proportion of females earn higher profits, in contrast, would be consistent with sex
discrimination against females that limits their access to high-paying firms.
The profitability measure I use to test this hypothesis is the firm’s gross operating
revenue minus gross operating expenditures (including payroll and nonwage expenses,
and the purchase of goods) divided by gross operating revenue.24 The variable of
interest, proportion of females in the firm, is based on the actual number of females in
the firm reported by the employer.25 In examining the relationship between profitability
and the proportion of females in a firm, I include as control variables other demographic
characteristics of the workforce, and firm-level characteristics that are likely to affect
firm’s profitability. The results are reported in table 1.5 and are robust across different
specifications. They suggest that irrespective of the set of control variables included in
24 The average profit rate after eliminating observations with extreme values (about 1 percent of
the sample) is 17%. This is slightly lower than the number reported by Hellerstein et al. (1997) using US manufacturing linked employer-employee data (22%).
25Since the question regarding the total number of females in the firm was included in the WES from 2003, the regression is implemented using only pooled 2003 and 2005 firm-level data.

26
the regression, there is a positive relationship between the proportion of females in the
workforce and firm’s profitability. For example, the point estimate in column (6) indicates
that a ten percentage point increase in female employment in an average firm increases
the profit rate by 0.73 percentage point.
Altogether, my results suggest that gender differences in preferences or
productivity cannot explain inter-firm gender segregation and therefore the glass ceiling
faced by females. My results, however, favor the predictions of efficiency wage theory
with higher-paying firms discriminating against females.
1.6. Conclusion
I find clear evidence that females face economy-wide glass ceilings that are
mainly driven by glass doors (i.e. segregation of females in lower-paying firms). I find
similar patterns for different subgroups of the workforce (i.e. females without any
dependent child and all males, females with at least one dependent child and all males,
workers younger than 44, workers older than 43, and single workers without any
dependent children). Females are significantly under-represented (over-represented) at
the top (bottom) of the wage distribution, conditional on their observable personal and
job characteristics, and these patterns of over/under-representation are partly due to
glass doors they face. I also find that females experience substantial wage gaps
throughout the conditional wage distribution, even within firms. I find no evidence that
these wage patterns can be explained by compensating differentials. However, my
results support the predictions of the efficiency wage theory with higher-paying firms
discriminating against females.
The policy implications of my results are two-fold. First, policies that aim to
identify and eliminate the glass ceiling faced by females will be more effective if they
focus on mechanisms that lead women to sort into lower-paying firms. This is possible,
for instance, by addressing hiring practices in higher-paying firms. Employment equity
policies that target employment decisions directly could be effective in this context and
will have a bigger effect in reducing the gender wage gap in high wage regions of the
wage distribution. Second, more general policies that try to improve females’ labor
27
market outcomes throughout the wage distribution will be more effective if they focus on
practices that improve females’ labor market performance within firms. To the extent
that the jobs performed by males and females within firms require similar effort, skill,
responsibilities and working conditions, policies that target pay decisions directly, such
as pay equity programs, could be effective in reducing the within-firm gender wage gap.
Finally, the sizable within-firm gender wage gap found in my analysis throughout the
wage distribution suggests that further research is required to identify the sources of
within-firm gender wage gap.

28
1.7. Reference
Abowd, J. M., F. Kramarz, and D. N. Margolis (1999) “High Wage Workers and High Wage Firms”, Econometrica 67(2), 251- 334.
Albrecht, J., A. Bjorklund, and S. Vroman (2003) “Is There a Glass Ceiling in Sweden?”, Journal of Labor Economics 21(1), 145-177.
Aldrich, M. and R. Buchele (1989) “Where to Look for Comparable Worth: The Implications of Efficiency Wages.” in M.A. Hill and M. Killingsworth (eds.) Comparable Worth Analyses and Evidence. ILR Press: Ithaca, New York: 11-28.
Amuedo-Dorantes, Catalina and Sara De la Rica (2006) “The Role of Segregation and Pay Structure on the Gender Wage Gap: Evidence from Matched Employer-Employee Data for Spain”, The B.E. Journal of Economic Analysis & Policy, Berkeley Electronic Press, vol. 0(1), pages 10.
Angrist, J., V. Chernozhukov, and I. Fernández-Val (2006) “Quantile Regression under Misspecification, With an Application to the U.S. Wage Structure”, Econometrica 74(2), 539-563.
Arulampalam, W., A. L. Booth, and M. L. Bryan (2007) “Is There a Glass Ceiling Over Europe? Exploring the Gender Pay Gap across the Wages Distribution”, Industrial and Labor Relations Review 60(2), pp. 163-186.
Baker, Michael and Marrie Drolet (2009) “A New View of the Male/Female Pay Gap”, CLSRN Working Papers with number clsrn_admin-2009-67.
Bayard K. & J. Hellerstein & D. Neumark & K. Troske (2003). “New Evidence on Sex Segregation and Sex Differences in Wages from Matched Employee-Employer Data”. Journal of Labor Economics, University of Chicago Press, vol. 21(4), pages 887-922, October.
Blau F., Kahn L. (2000) “Gender Differences in Pay”, Journal of Economic Perspectives, vol. 14, 75-99.
Blau, Francine (1977) “Equal Pay in the Office”, Lexington, Mass., D.C. Heath.
Bowles, S. (1985) “The Production Process in a Competitive Economy: Walrasian, Neo—Hobbesjan and Marxian Models." American Economic Review 75: 16—36.
Bulow, J. I., and L. H. Summers (1986) “A theory of dual labor markets with appli cations to industrial policy, discrimination and Keynesian unemployment”, Journal of Labor Economics. Journal of Labor Economics, Vol.4, Issue 3.
Bronars, S., Famulari, M., (1997) “Wage, Tenure, and Wage Growth Variation Within and Across Establishments”, Journal of Labor Economics 15 (2), 285–317.

29
Brown, Charles (1980) “Equalizing Differences in the Labor Market”, Quarterly Journal of Economics, XCIV, 113-34.
Buckley, John (1971) “Pay Differences between Men and Women in the Same Job”, Monthly Labor Review, Vol. 94, No. 11, pp. 36-39.
Carrington, William J., and Troske, Kenneth R (1998) “Sex Segregation in U.S. Manufacturing”, Industrial and Labor Relations Review 51 (April 1998): 445–64.
Carrington, William J., and Kenneth R. Troske (1997) “On Measuring Segregation in Small Unit Samples”, Journal of Business and Economic Statistics, Vol. 15, No. 4, pp. 402-9.
Carrington, William J., and Kenneth R. Troske (1995) “Gender Segregation in Small Firms”, Journal of Human Resources, Vol. 30, No. 3, pp. 503-33.
Canay, I.A. (2011) “A Simple Approach to Quantile Regression for Panel Data”, The Econometrics Journal, forthcoming.
Cotter, D. A., J. M. Hersmen, Seth Ovadia, and Reeve Vanneman (2001) “The Glass Ceiling Effect”, Social Forces, Vol. 80, No. 2 (December 2001).
Datta Gupta N., Oaxaca R.L., Smith N. (2006). “Swimming Upstream, Floating Downstream: Comparing Women’s relative Wage Positions in the US and Denmark”, Industrial and Labor Relations Review, Vol. 59, No. 2, 243-266.
Datta Gupta N. and Donna S. Rothstein (2005) “The Impact of Worker and Establishment-level Characteristics on Male-Female Wage Differentials: Evidence from Danish Matched Employee-Employer Data”, LABOUR, CEIS, Fondazione Giacomo Brodolini and Wiley Blackwell Ltd, vol. 19(1), pages 1-34, 03.
de la Rica, S., J. J. Dolado, and V. Llorens.(2008) “Ceilings or Floors? Gender Wage Gaps by Education in Spain”, Journal of Population Economics. 21(3), 751-776 [181,182].
Dickens, William T., and Lawrence F. Katz (1987) “Inter-Industry Wage Differences and Industry Characteristics”, in Kevin Lang, and Jonathan Leonard, Unemployment and the Structure of Labor Markets (Oxford, UK: Basil Blackwell, 1987).
Filer R. K. (1985) “Male-Female Wage Differences: The Importance of Compensation Differentials”, Industrial and Labour Relations Review, Vol. 38, No. 3 (April 1985).
Gardeazabal J., Ugidos A. (2005) “Gender Wage Discrimination at Quantiles”, Journal of Population Economics, Vol. 18, 165-179.
Greene, W. H. (2003). Econometric Analysis (5th ed.) New Jersey: Prentice Hall.
Griffin, Peter, and Stephen Trejo (1995). “The Measurement of Gender Segregation Using Firm-Level Data”, Long Beach: Working paper, California State University.

30
Groshen, Erica L., (1990) “Five reasons why wages vary among employers”, Industrial Relations 30 (3), 350– 381.
Groshen, Erica L. (1991a) “Sources of Intraindustry Wage Dispersion: How Much Do Employers Matter?”, Quarterly Journal of Economics, CVI, 869-84.
Groshen, Erica L. (1991b) “The Structure of the Female/Male Wage Differential”, Journal of Human Resource, Vol. 26, No. 3, pp. 457-72.
Gunderson, M. (2006) “Male-Female Wage Differentials: How Can that Be?”, Canadian Journal of Economics, Vol. 39, No. 1 (February 2006) 1-21.
Hellerstein J. K.,David Neumark & Kenneth R. Troske (2002) “Market Forces and Sex Discrimination”, Journal of Human Resources, Vol. 37, No. 2, pp. 353-380.
Jacob J. A. and Ronnie J. Steinberg (1990) “Compensating Differentials and the Male-Female Wage Gap: A Reply to Filer”, Social Forces, Vol. 69, No. 2, December 1990.
Jellal M., Nordman C., Wolff F.C. (2006) “Theory and Evidence on the Glass Ceiling Effect Using Matched Worker-Firm Data”, DIAL Working paper, DT/2006/03, Paris.
Katz, L.F. (1986) “Efficiency Wage Theories: A Partial Evaluation.” In S. Fischer, ed., NBER Macroeconomics Annual 1986. Cambridge, Na. : MIT Press.
Katz, L. F. and Summers, L. H. (1989) “Industry Rents: Evidence and Implications. Brookings Papers: Microeconomics. Washington: Brookings Institution, pp. 209-75.
Koenker, R. and P. Ng (2005) “A Frisch-Newton Algorithm for Space Quantile Regression”, Acta Mathematicae Application Sinica (English Series) 21(2), 225-236.
Kruger, A. and Lawrence H. Summers (1988) “Efficiency Wage and the Inter-Industry Structure”, Econometrica, Vol. 56, No. 2, pp. 259-293.
Lazear, Edward P & Rosen, Sherwin (1990) “Male-Female Wage Differentials in Job Ladders”, Journal of Labor Economics, University of Chicago Press, vol. 8(1), pages S106-23, January.
McNulty, Donald (1967) “Differences in Pay Between Men and Women Workers”, Monthly Labor Review, Vol. 90, No. 12, pp. 40-43.
Meyersson Milgrom, E., T. Petersen and V. Snartland. (2001) “Equal Pay for equal Work? Evidence from Sweden and a Comparison with Norway and the US”, Scandinavian Journal of Economics, 103 (4): 559-583.
Nordman, C.J., F.C. Wolff (2007) “Is There a Glass Ceiling in Morocco? Evidence from Matched Worker-Firm Data”, DIAL Working paper, 2007/04, Paris.

31
Pendakur, K. and S. Woodcock (2010) “Glass Ceilings or Glass Doors? Wage Disparity Within and Between Firms”, Journal of Business and Economic Statistics, January 2010, Vol. 28, No.1.
Pendakur, K., R. Pendakur, and S. Woodcock (2008) “Representation and severity in the distribution of income”, The BE Journal of Economic Analysis and Policy, 8(1) (advances), Article 44. [182,183].
Petersen, Trond, Andrew M. Penner, Geir Hogsnes (2011) “The Male Marital Wage Premium: Sorting Vs. Differential Pay”, Industrial and Labor Relations Review, Vol. 64, No. 2.
Pfeffer, Jeffrey, and Alison Davis-Blake (1987) “The Effect of the Proportion of Women on Salaries: The Case of College Administrators”, Administrative Science Quarterly, Vol. 32, No. 1, pp. 1-24.
Reily, Kevin T., and Tony S. Wirjanto (1999) “Does More Mean Less? The Male/Female Wage Gap and the Proportion of Females at the Establishment Level”, The Canadian Journal of Economics, Vol. 32, No. 4, pp. 906-929.
Shapiro, C., and Stiglitz, J. (1984) “Involuntary Unemployment as a Worker Discipline Device”, American Economic Review 74, no. 3: 433-44.
Salvanes, K.G., Burgess, S., Lane, J., (1998) “Sources of earnings dispersion in a linked employer – employee dataset: evidence from Norway”, Paper presented to the US Census Bureau International Symposium on Linked Employer– Employee Data, Arlington, Virginia, 21– 22 May, 1998.
Stiglitz, J. (1986) “Theories of Wage Rigidities”, in Keynes' Economic Legacy: Contemporary Economic Theories. ed. by J. Butkiewicz, et al. New York: Praeger Publishers, pp. 153-206.
Smith, Robert (1979) “Compensating Wage Differentials and Public Policy: A Review”, Industrial and Labor Relations Review, XXXII, 339-52.
Woodcock, S. D. (2007) “Match Effects”, SFU Economics Discussion Paper dp07-13.
Woodcock, S. D. (2008) “Wage Differentials in the Presence of Unobserved Worker, Firm, and Match Heterogeneity”, Labour Economics 15(4), 2008: 771-793.
Wooden, M., (1998). “Explaining wage outcomes: the role of firm and workplace characteristics”, Paper presented to the US Census Bureau International Symposium on Linked Employer–Employee Data, Arlington, Virginia, 21–22 May, 1998.

32
1.8. Tables and Figures
Figure 1.1. Distribution of Firm-Level Proportion of Females, for Male and Female Employees
Figure 1.2. Distribution of Firm Effects by Different Firm-Level Proportion of Females

33
Figure 1.3. Sample of All Workers
Figure 1.4. All Female Workers without any Dependent Child and All Male Workers

34
Figure 1.5. All Female Workers with at Least One Dependent Child and All Male Workers
Figure 1.6. All Workers Younger Than 44

35
Figure 1.7. All Workers Older Than 43
Figure 1.8. Younger versus Older Workers

36
Figure 1.9. All Single Workers without Dependent Children
Figure1.10. Single Females without Dependent Children and Non-Single Females, Versus Non-Single Males

37
Figure 1.11. Single Males without Dependent Children Versus Non-Single Males

38
Table 1.1. Sample Means
Males Females Number of observations 40230 30115 Subsamples: Workers with at least one dependent child 52.53 50.12 Workers without dependent children 47.47 49.88 Workers younger than 44 43.84 43.95 Workers older than 43 56.16 56.05 Single workers without any child 18.20 18.54 Personal Characteristics: Hourly wage 24.12 19.01 Family income excluding worker (from employment) Ϯ 25,785 33,916 Family income (from other sources) Ϯ 2,486 2,480 Age 42.03 41.99 Years of (actual full-time) experience 20.01 16.70 Ethnicity Visible Minority Canadian 0.015 0.017 Visible Minority Immigrants 0.092 0.090 White Immigrants 0.116 0.104 White Canadians* 0.775 0.787 Highest educational attainment Ph.D., Master's, or M.D 0.052 0.044 Other graduate degree 0.023 0.024 Bachelor's degree 0.143 0.147 Some university 0.081 0.085 Completed college 0.168 0.253 Some college or trade certificate 0.248 0.204 High school degree 0.162 0.167 Less than high school* 0.119 0.072 Marital Status Married 0.623 0.581 Common law 0.144 0.132 Separated 0.023 0.035 Divorced 0.035 0.077 Widowed 0.004 0.015 Single* 0.168 0.157 Number of Dependent Children zero* 0.474 0.498 One 0.177 0.182 Two 0.247 0.235 Three 0.078 0.068 Four or more 0.022 0.014 Willing but unable to work more hours because of Ϯ Childcare not being available 0.001 0.002 Personal and family responsibilities 0.013 0.009 Going to school 0.002 0.003 Transportation problems 0.000 0.000

39
Table 1.1. Sample Means (Continued)
Males Females Job characteristics: Fulltime 0.870 0.589 Member of Union or CBA 0.288 0.306 Years of seniority with current employer 9.717 8.817 Possibility to work flexible hours Ϯ 0.375 0.322 Possibility to carry out work duties at home Ϯ 0.280 0.238 Occupation: Manager 0.181 0.093 Professionals 0.155 0.225 Technical/Trades 0.507 0.320 Marketing/Sales 0.029 0.081 Clerical/Administrative 0.060 0.219 Production workers * 0.068 0.062 Pay and benefits satisfaction considering the duties and responsibilities of the job Ϯ Very Satisfied 0.335 0.346 Satisfied 0.570 0.562 Dissatisfied 0.072 0.071 Very Dissatisfied 0.019 0.017 No opinion 0.002 0.001 Job Satisfaction Ϯ Very Satisfied 0.270 0.302 Satisfied 0.604 0.582 Dissatisfied 0.091 0.089 Very Dissatisfied 0.028 0.024 No opinion 0.003 0.000 Employer Characteristics Ϯ: Any employment equity program 0.227 0.257 Any pay equity program 0.236 0.291 Non-profit enterprise 0.136 0.322 log(revenue per worker) 11.945 11.712 Number of employees Less than 20* 0.216 0.226 20-99 0.357 0.321 100-499 0.245 0.225 500 or more 0.180 0.226 Number of competing firms Zero 0.024 0.018 1 to 5 0.285 0.222 6 to 20 0.288 0.200 More than 20* 0.212 0.185 Missing 0.189 0.373

40
Table 1.1. Sample Means (Continued)
Industry: Resource 0.025 0.007 Labour intensive tertiary manufacturing 0.061 0.045 Secondary product manufacturing 0.057 0.022 Capital intensive tertiary manufacturing 0.082 0.031 Construction 0.064 0.013 Transportation, warehousing, wholesale 0.145 0.072 Communication and other utilities 0.027 0.012 Retail trade and consumer services 0.162 0.206 Finance and insurance 0.031 0.066 Real estate, rental and leasing operations 0.015 0.012 Business services 0.106 0.103 Education and health services 0.120 0.356 Information and cultural industries 0.036 0.034 Primary product manufacturing* 0.063 0.014
Notes: * indicates reference category for regressions. Ϯ indicates that the variable is not used in the main regressions and is only used for robustness checks. All the means are computed using sample weights provided in the data (Statistics Canada does not allow the report of these means without using the weights).

41
Table 1.2. Gender Wage Gap and Glass Door Estimates
(1) All workers (2) All single workers without any dependent child
Economy wide
Within firms
Glass door
Economy wide
Within firms
Glass door
Mean Wage Differential -0.160*** -0.113*** -0.047*** -0.073 *** -0.076 *** 0.003 (0.008) (0.007) [0.000] (0.015) (0.011) [0.292] Quantile Differential 10th percentile -0.117*** -0.103*** -0.014 0.003 -0.073 *** 0.077*** (0.017) (0.010) [0.335] (0.032) (0.021) [0.000] Median -0.156*** -0.113*** -0.043*** -0.059 *** -0.091 *** 0.032*** (0.011) (0.006) [0.000] (0.017) (0.011) [0.018] 90th percentile -0.197*** -0.124*** -0.073*** -0.143*** -0.066 *** -0.076** (0.019) (0.013) [0.000] (0.039) (0.024) [0.012] Number of Observations
70345 70345 70345 70345
Females’ Representation Index
Below 10th percentile 0.121 0.115 0.093 0.109 Below Median 0.563 0.552 0.532 0.540 Above 90th percentile 0.067 0.080 0.077 0.093

42
Table 1.2. Gender Wage Gap and Glass Door Estimates (Continued)
(3) All female workers without any dependent child and all male
workers
(4) All female workers with at least one dependent child and all male
workers Economy
wide Within firms
Glass door
Economy wide
Within firms
Glass door
Mean Wage Differential -0.150*** -0.116*** -0.034*** -0.176*** -0.113*** -0.063*** (0.008) (0.006) [0.000] (0.011) (0.008) [0.000] Quantile Differential 10th percentile -0.101*** -0.108*** 0.007*** -0.123*** -0.099 *** -0.024** (0.014) (0.015) [0.000] (0.015) (0.012) [0.025] Median -0.149*** -0.116*** -0.033*** -0.174*** -0.109*** -0.065*** (0.011) (0.006) [0.000] (0.011) (0.006) [0.000] 90th percentile -0.188*** -0.125*** -0.063*** -0.212*** -0.124*** -0.088*** (0.016) (0.016) [0.000] (0.025) (0.018) [0.000] Number of Observations
70345 70345 70345 70345
Females’ Representation Index
Below 10th percentile 0.110 0.113 0.133 0.118 Below Median 0.542 0.542 0.584 0.562 Above 90th percentile 0.073 0.083 0.062 0.076

43
Table 1.2. Gender Wage Gap and Glass Door Estimates (Continued)
(5) All workers younger than 44 (6) All workers older than 43 Economy
wide Within firms
Glass door
Economy wide
Within firms
Glass door
Mean Wage Differential -0.165*** -0.106*** -0.059*** -0.153*** -0.121*** -0.032*** (0.011) (0.007) [0.000] (0.010) (0.010) [0.000] Quantile Differential 10th percentile -0.120*** -0.102*** -0.018 -0.112*** -0.103*** -0.009 (0.018) (0.012) [0.192] (0.019) (0.013) [0.527] Median -0.167*** -0.108*** -0.059*** -0.144*** -0.120*** -0.024** (0.013) (0.008) [0.000] (0.014) (0.008) [0.038] 90th percentile -0.196*** -0.123*** -0.073*** -0.200*** -0.127*** -0.073*** (0.031) (0.015) [0.000] (0.023) (0.022) [0.000] Number of Observations
70345 70345 70345 70345
Females’ Representation Index
Below 10th percentile 0.125 0.116 0.116 0.114 Below Median 0.571 0.553 0.554 0.550 Above 90th percentile 0.065 0.078 0.071 0.082
Notes: Standard errors are in parentheses, p-values for glass door test are in brackets. Simulated standard errors for estimates of females’ representation are all less than 0.002. Given the precision of our estimates, we omit standard errors from the tables to minimize clutter. Details are available on request. *** indicates statistically significant at 1%, ** indicates statistically significant at 5%, and * indicates statistically significant at 10%. All regressions are based on pooled samples of all males and females. Gender wage gap estimates for different subsamples are generated using interaction between gender and appropriate indicators.

44
Table 1.3. OLS Regression Results, Firm-Specific Premiums and Worker Characteristics
All workers Male only Female Only Female -0.044*** (0.005) PhD., Master’s, or MD 0.186*** 0.166*** 0.209*** (0.013) (0.018) (0.018) Other Graduate Degree 0.183*** 0.185*** 0.190*** (0.011) (0.019) (0.018) Bachelor Degree 0.183*** 0.174*** 0.198*** (0.011) (0.015) (0.014) Some University 0.112*** 0.075*** 0.153*** (0.014) (0.019) (0.016) Completed College 0.129*** 0.115*** 0.151*** (0.009) (0.012) (0.013) Some college or trade certificate 0.094*** 0.078*** 0.112*** (0.008) (0.011) (0.012) High school diploma 0.053*** 0.031** 0.079*** (0.008) (0.012) (0.012) Married 0.039*** 0.066*** 0.009 (0.007) (0.010) (0.009) Common Law 0.009 0.038*** -0.022* (0.009) (0.013) (0.011) Separated 0.020 0.037 0.002 (0.017) (0.027) (0.020) Divorced 0.039*** 0.052*** 0.016 (0.010) (0.014) (0.012) Widowed 0.008 0.032 -0.016 (0.021) (0.059) (0.020) Very satisfied or satisfied with current job -0.004 -0.001 -0.008 (0.007) (0.011) (0.010) Indifferent about current job 0.014 0.084 -0.094 (0.053) (0.053) (0.077) Very satisfied with job’s pay 0.173*** 0.179*** 0.160*** (0.015) (0.021) (0.017) Satisfied with job’s pay 0.109*** 0.106*** 0.106*** (0.014) (0.020) (0.015) Dissatisfied with job’s pay 0.049*** 0.053*** 0.043*** (0.013) (0.019) (0.015) Indifferent about job’s pay 0.005 -0.002 0.016 (0.051) (0.065) (0.080) One child -0.013** 0.004 -0.032*** (0.006) (0.007) (0.009) Two children 0.005 0.021*** -0.011 (0.005) (0.007) (0.008) Three children -0.006 0.022 -0.039** (0.012) (0.016) (0.016)

45
Table 1.3. OLS Regression Results, Firm-Specific Premiums and Worker Characteristics (Continued)
Notes: Standard errors are in parentheses. *** indicates statistically significant at 1%, ** indicates statistically significant at 5%, and * indicates statistically significant at 10%. All coefficients are estimated using sampling weights provided by Statistics Canada and all the standard errors are computed using 100 sets of bootstrap weights provided by Statistics Canada. The dependent variable is estimated firm effects after controlling for workers and job characteristics (estimates of ψ from equation 3). The regressions also include control for age (8 categories), quartic in experience and quadratic in years of seniority, immigration status and ethnicity (4 categories).
Four children or more -0.018 0.010 -0.053 (0.017) (0.019) (0.032) Experience 0.000 0.004 -0.000 (0.003) (0.005) (0.004) Fulltime 0.057*** 0.100*** 0.032*** (0.006) (0.012) (0.006) Member of Union or CBA 0.102*** 0.109*** 0.097*** (0.006) (0.008) (0.007) Years of seniority 0.002*** 0.001 0.004*** (0.001) (0.001) (0.001) Professionals 0.034** 0.013 0.061*** (0.014) (0.021) (0.020) Technical/Traders 0.121*** 0.115*** 0.129*** (0.011) (0.016) (0.016) Marketing/Sales 0.046*** 0.036** 0.049*** (0.010) (0.016) (0.013) Clerical/Administrative -0.122*** -0.074*** -0.131*** (0.015) (0.026) (0.018) Number of observations 70345 40230 30115 Adjusted R-squared 0.208 0.177 0.243

46
Table 1.4. Firm-Specific Premium and Firms Average Characteristics
Industry: Resource 0.150*** ( 0.020) Labour intensive tertiary manufacturing -0.117*** ( 0.020) Secondary product manufacturing 0.044*** ( 0.015) Capital intensive tertiary manufacturing 0.013 ( 0.017) Construction 0.157*** ( 0.020) Transportation, warehousing, wholesale - 0.012 ( 0.017) Communication and other utilities 0.064*** ( 0.016) Retail trade and consumer services -0.156*** ( 0.017) Finance and insurance 0.050** ( 0.021) Real estate, rental and leasing operations - 0.053* ( 0.031) Business services 0.072*** ( 0.023) Education and health services 0.109*** ( 0.028) Information and cultural industries 0.036* ( 0.020) Number of Employees: 20-99 0.027** ( 0.010) 100-499 0.081*** ( 0.013) 500 or more 0.122*** ( 0.031) Number of competing firms Zero - 0.025 ( 0.025) 1 to 5 - 0.066*** ( 0.018) 6 to 20 - 0.047*** ( 0.016) Foreign ownership 1 to 49 percent - 0.008 ( 0.027) 50 to 90 percent -0.104 ( 0.064) 90 to 100 percent 0.028 ( 0.018) Existence of any employment equity program 0.007 ( 0.027) Existence of any pay equity program 0.052* ( 0.028) Proportion of fulltime workers 0.142*** ( 0.032) Proportion of workers covered by a collective bargaining agreement 0.015 ( 0.023) Good rating of labor-management relations - 0.009 ( 0.012) Existence of any innovative work practices - 0.033** ( 0.015) Quit rate -0.171*** ( 0.063) Log of value added per worker (proxy for productivity) 0.066*** ( 0.007) Log of training expenditures per worker 0.006*** ( 0.002) z-score measure for provision of different benefits 0.006*** (0.001) Existence of incentive schemes in the compensation system 0.069*** ( 0.014) Number of observations 14015 Adjusted R-squared 0.416 Notes: Standard errors are in parentheses. *** indicates statistically significant at 1%, ** indicates statistically significant at 5%, and * indicates statistically significant at 10%. All coefficients are estimated using sampling weights provided by Statistics Canada and all the standard errors are computed using 100 sets of bootstrap weights provided by Statistics Canada. The dependent variable is estimated firm effects after controlling for workers and job characteristics (estimates of ψ from equation 3). For a detailed description of variables included in the regression please refer to the data appendix.
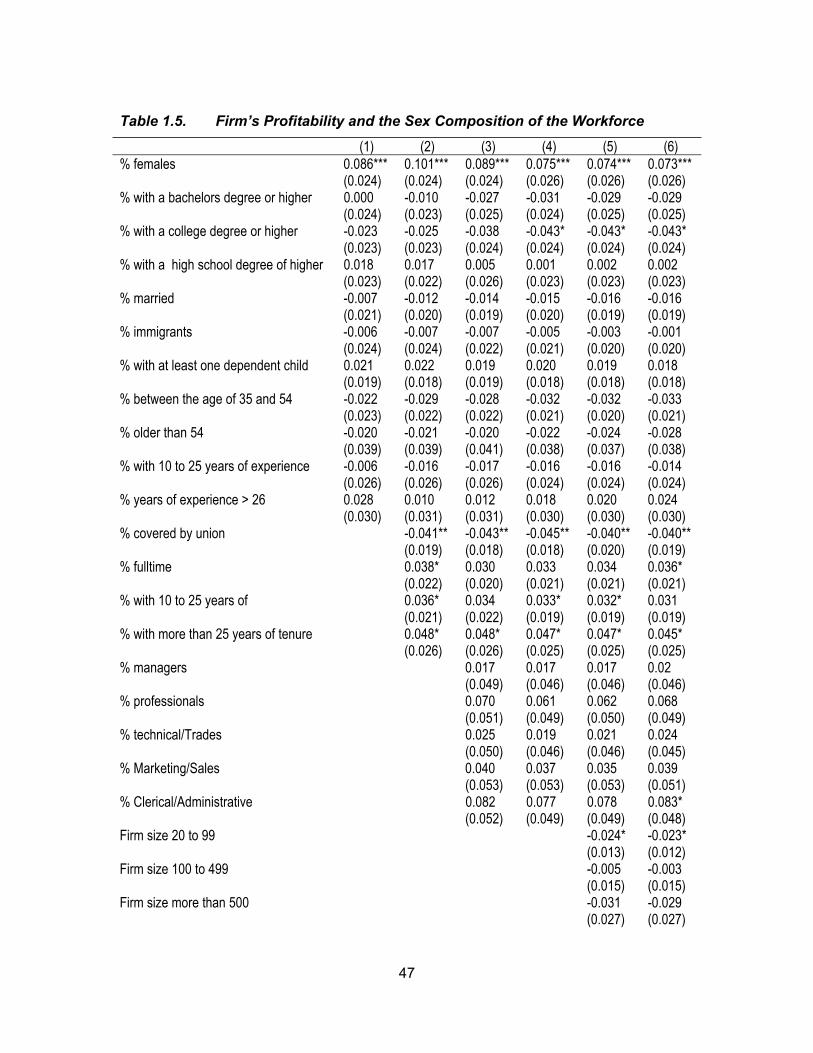
47
Table 1.5. Firm’s Profitability and the Sex Composition of the Workforce
(1) (2) (3) (4) (5) (6) % females 0.086*** 0.101*** 0.089*** 0.075*** 0.074*** 0.073*** (0.024) (0.024) (0.024) (0.026) (0.026) (0.026) % with a bachelors degree or higher 0.000 -0.010 -0.027 -0.031 -0.029 -0.029 (0.024) (0.023) (0.025) (0.024) (0.025) (0.025) % with a college degree or higher -0.023 -0.025 -0.038 -0.043* -0.043* -0.043* (0.023) (0.023) (0.024) (0.024) (0.024) (0.024) % with a high school degree of higher 0.018 0.017 0.005 0.001 0.002 0.002 (0.023) (0.022) (0.026) (0.023) (0.023) (0.023) % married -0.007 -0.012 -0.014 -0.015 -0.016 -0.016 (0.021) (0.020) (0.019) (0.020) (0.019) (0.019) % immigrants -0.006 -0.007 -0.007 -0.005 -0.003 -0.001 (0.024) (0.024) (0.022) (0.021) (0.020) (0.020) % with at least one dependent child 0.021 0.022 0.019 0.020 0.019 0.018 (0.019) (0.018) (0.019) (0.018) (0.018) (0.018) % between the age of 35 and 54 -0.022 -0.029 -0.028 -0.032 -0.032 -0.033 (0.023) (0.022) (0.022) (0.021) (0.020) (0.021) % older than 54 -0.020 -0.021 -0.020 -0.022 -0.024 -0.028 (0.039) (0.039) (0.041) (0.038) (0.037) (0.038) % with 10 to 25 years of experience -0.006 -0.016 -0.017 -0.016 -0.016 -0.014 (0.026) (0.026) (0.026) (0.024) (0.024) (0.024) % years of experience > 26 0.028 0.010 0.012 0.018 0.020 0.024 (0.030) (0.031) (0.031) (0.030) (0.030) (0.030) % covered by union -0.041** -0.043** -0.045** -0.040** -0.040** (0.019) (0.018) (0.018) (0.020) (0.019) % fulltime 0.038* 0.030 0.033 0.034 0.036* (0.022) (0.020) (0.021) (0.021) (0.021) % with 10 to 25 years of 0.036* 0.034 0.033* 0.032* 0.031 (0.021) (0.022) (0.019) (0.019) (0.019) % with more than 25 years of tenure 0.048* 0.048* 0.047* 0.047* 0.045* (0.026) (0.026) (0.025) (0.025) (0.025) % managers 0.017 0.017 0.017 0.02 (0.049) (0.046) (0.046) (0.046) % professionals 0.070 0.061 0.062 0.068 (0.051) (0.049) (0.050) (0.049) % technical/Trades 0.025 0.019 0.021 0.024 (0.050) (0.046) (0.046) (0.045) % Marketing/Sales 0.040 0.037 0.035 0.039 (0.053) (0.053) (0.053) (0.051) % Clerical/Administrative 0.082 0.077 0.078 0.083* (0.052) (0.049) (0.049) (0.048) Firm size 20 to 99 -0.024* -0.023* (0.013) (0.012) Firm size 100 to 499 -0.005 -0.003 (0.015) (0.015) Firm size more than 500 -0.031 -0.029 (0.027) (0.027)

48
Table 1.5. Firm’s Profitability and the Sex Composition of the Workforce (continued)
Number of competing firms: zero 0.024 (0.020) Number of competing firms: 1 to 5 0.004 (0.012) Number of competing firms:6 to 20 -0.007 (0.013) Control for Industry (14 categories) NO NO NO YES YES YES Number of observations 6089 6089 6089 6089 6089 6089
Notes: Standard errors are in parentheses. *** indicates statistically significant at 1%, ** indicates statistically significant at 5%, and * indicates statistically significant at 10%. All coefficients are estimated using sampling weights provided by Statistics Canada and all the standard errors are computed using 100 sets of bootstrap weights provided by Statistics Canada. The dependant variable is profit rate: (gross operating revenue – gross operating income) / gross operating income. Observations with extreme values on the dependant variable (around 1 percent of the sample) are deleted. The regressions are only based on 2003 and 2005 observations since the actual number of females in a firm was only reported for those years.

49
1.9. Appendices
1.9.1. Appendix A: Additional Tables
Table 1.A1. Economy-wide and within-firm wage disparities, and glass door estimates – Using additional control variables
(1)All workers (2)All single workers without any dependent child
Economy wide
Within firms
Glass door
Economy wide
Within firms
Glass door
Mean Wage Differential -0.161*** -0.108*** -0.053***
-0.075*** -0.078*** 0.003
(0.008 ) (0.006 ) [0.000] (0.015 ) (0.011 ) [0.735] Quantile Differential 10th Percentile -0.117*** -0.095*** -0.022* -0.012 -0.074 *** 0.062** (0.015 ) (0.009 ) [0.093] (0.030 ) (0.018 ) [0.012] Median -0.164*** -0.109*** -0.055*** -0.072*** -0.094 *** 0.022 (0.010 ) (0.005 ) [0.000] (0.023 ) (0.009 ) [0.292] 90th Percentile -0.195*** -0.120*** -0.075*** -0.121*** -0.059*** -0.062*** (0.017 ) (0.012 ) [0.000] (0.021 ) (0.021 ) [0.000] Observations 70345 70345 70345 70345 (3) All female workers without any
dependent child and all male workers
(4) All female workers with at least one dependent child and all
male workers
Economy wide
Within firms
Glass door
Economy wide
Within firms
Glass door
Mean Wage Differential -0.149*** -0.110*** -0.039***
-0.179*** -0.109*** -0.07***
(0.008 ) (0.006 ) [0.000] (0.011 ) (0.008 ) [0.000] Quantile Differential 10th Percentile -0.105*** -0.101*** -0.004 -0.123*** -0.093*** -0.03* (0.019 ) (0.010 ) [0.812] (0.019 ) (0.010 ) [0.078] Median -0.152*** -0.113*** -0.039*** -0.180*** -0.106*** -0.074*** (0.010 ) (0.005) [0.000] (0.014 ) (0.007 ) [0.000] 90th Percentile -0.183*** -0.115*** -0.068*** -0.213*** -0.122*** -0.091*** (0.017 ) (0.014 ) [0.000] (0.020 ) (0.014 ) [0.000] Observations 70345 70345 70345 70345

50
Table 1.A1. Economy-wide and within-firm wage disparities, and glass door estimates – Using additional control variables (Continued)
(5) All workers younger than 44 (6) All workers older than 43
Economy wide
Within firms
Glass door
Economy wide
Within firms
Glass door
Mean Wage Differential -0.167*** -0.102*** -0.065***
-0.154*** -0.116*** -0.038***
(0.011 ) (0.007 ) [0.000] (0.009 ) (0.010 ) [0.000] Quantile Differential 10th Percentile -0.120*** -0.094*** -0.026* -0.113*** -0.099*** -0.014 (0.019 ) (0.012 ) [0.099] (0.021 ) (0.011 ) [0.426] Median -0.171*** -0.107*** -0.064*** -0.156*** -0.113*** -0.043*** (0.013 ) (0.005 ) [0.000] (0.011 ) (0.009 ) [0.000] 90th Percentile -0.193*** -0.121*** -0.072*** -0.198*** -0.116*** -0.082*** (0.027 ) (0.016 ) [0.000] (0.021 ) (0.019 ) [0.000] Observations 70345 70345 70345 70345 Notes: Standard errors are in parentheses, p-values for glass door test are in brackets. *** indicates statistically significant at 1%, ** indicates statistically significant at 5%, and * indicates statistically significant at 10%. All coefficients are estimated using sampling weights provided by Statistics Canada and all the standard errors are computed using 100 sets of bootstrap weights provided by Statistics Canada. All regressions are based on pooled samples of all males and females. Gender wage gap estimates for different subsamples are generated using interaction between gender and appropriate indicators. Additional control variables used in these regressions are: family income from employment (excluding worker), family income from other sources, four indicator for people who are willing but unable to work more hours due to unavailability of childcare/family responsibilities/ going to school/ transportation problems, indicator for possibility to work flexible hours, indicator for possibility to carry our work duties at home.

51
Table 1.A2. Economy-wide and within-firm wage disparities, and glass door estimates – Excluding all immigrants
(1)All workers (2)All single workers without any dependent child
Economy wide
Within firms
Glass door
Economy wide
Within firms
Glass door
Mean Wage Differential -0.170*** -0.117*** -0.053***
-0.083*** -0.083*** 0.000
(0.012) (0.007) [0.000] (0.007) (0.006) [0.964] Quantile Differential 10th Percentile -0.124*** -0.111*** -0.013*** 0.000 -0.097*** 0.097*** (0.014) (0.011) [0.000] (0.035) (0.026) [0.000] Median -0.172*** -0.117*** -0.055*** -0.070*** -0.093*** 0.022* (0.015) (0.008) [0.000] (0.021) (0.015) [0.087] 90th Percentile -0.216*** -0.133*** -0.083*** -0.156*** -0.074*** -0.081*** (0.017) (0.013) [0.000] (0.037) (0.028) [0.000] Observations 58082 58082 58082 58082 -0.170*** -0.117*** -0.053*** -0.083*** -0.083*** 0.000 (3) All female workers without any
dependent child and all male workers
(4) All female workers with at least one dependent child and all male
workers
Economy wide
Within firms
Glass door
Economy wide
Within firms
Glass door
Mean Wage Differential -0.161*** -0.122*** -0.039***
-0.186*** -0.117*** -0.069***
(0.010) (0.008) [0.000] (0.013) (0.009) [0.000] Quantile Differential 0 10th Percentile -0.119*** -0.112*** -0.007 -0.130*** -0.107*** -0.023 (0.017) (0.011) [0.446] (0.023) (0.013) [0.102] Median -0.159*** -0.123*** -0.036*** -0.186*** -0.114*** -0.072*** (0.011) (0.007) [0.000] (0.016) (0.009) [0.000] 90th Percentile -0.202*** -0.133*** -0.069*** -0.238*** -0.135*** -0.103*** (0.022) (0.017) [0.000] (0.029) (0.029) [0.000] Pbservations 58082 58082 58082 58082

52
Table 1.A2. Economy-wide and within-firm wage disparities, and glass door estimates – Excluding All Immigrants (Continued)
(5) All workers younger than 44 (6) All workers older than 43
Economy wide
Within firms
Glass door
Economy wide
Within firms
Glass door
Mean Wage Differential -0.174*** -0.111*** -0.063***
-0.164*** -0.127*** -0.037***
(0.014) (0.008) [0.000] (0.012) (0.011) [0.000] Quantile Differential 10th Percentile -0.129*** -0.109*** -0.020* -0.115*** -0.113*** -0.002 (0.021) (0.013) [0.098] (0.020) (0.015) [0.806] Median -0.180*** -0.113*** -0.067*** -0.159*** -0.121*** -0.038*** (0.016) (0.010) [0.000] (0.017) (0.010) [0.005] 90th Percentile -0.220*** -0.131*** -0.089*** -0.214*** -0.139*** -0.075*** (0.026) (0.020) [0.000] (0.028) (0.017) [0.000] Observations 58082 58082 58082 58082
Notes: Standard errors are in parentheses, p-values for glass door test are in brackets. *** indicates statistically significant at 1%, ** indicates statistically significant at 5%, and * indicates statistically significant at 10%. All coefficients are estimated using sampling weights provided by Statistics Canada and all the standard errors are computed using 100 sets of bootstrap weights provided by Statistics Canada. All regressions are based on pooled samples of all males and females. Gender wage gap estimates for different subsamples are generated using interaction between gender and appropriate indicators

53
Table 1.A3. Economy-wide and within-firm wage disparities, and glass door estimates – Allowing returns to be different for subgroups
(1)All workers (2)All single workers without any dependent child
Economy wide
Within firms
Glass door
Economy wide
Within firms
Glass door
Mean Wage Differential -0.160*** -0.113*** -0.047***
-0.072*** -0.074*** 0.002
(0.008) (0.007) [0.000] (0.015) (0.014) [0.631] Quantile Differential 10th Percentile -0.117*** -0.103*** -0.014 0.007 -0.052*** 0.059*** (0.017) (0.010) [0.326] (0.029) (0.025) [0.003] Median -0.156*** -0.113*** -0.043*** -0.062*** -0.090*** 0.028** (0.011) (0.006) [0.000] (0.019) (0.016) [0.012] 90th Percentile -0.197*** -0.124*** -0.073*** -0.157*** -0.063*** -0.094*** (0.019) (0.013) [0.000] (0.036) (0.019) [0.002] Observations 70345 70345 11914 11914 (3) All female workers without any
dependent child and all male workers
(4) All female workers with at least one dependent child and all male
workers
Economy wide
Within firms
Glass door
Economy wide
Within firms
Glass door
Mean Wage Differential -0.112*** -0.113*** 0.001
-0.191*** -0.120*** -0.071***
(0.009) (0.007) [0.809] (0.012) (0.010) [0.000] Quantile Differential 10th Percentile -0.087*** -0.095*** 0.007 -0.152*** -0.115*** -0.037** (0.018) (0.011) [0.574] (0.019) (0.011) [0.014] Median -0.132*** -0.115*** -0.017 -0.188*** -0.119*** -0.069*** (0.012) (0.006) [0.101] (0.015) (0.007) [0.000] 90th Percentile -0.181*** -0.124*** -0.057*** -0.217*** -0.131*** -0.086*** (0.021) (0.021) [0.000] (0.020) (0.015) [0.000] Observations 55410 55410 55165 55165

54
Table 1.A3. Economy-wide and within-firm wage disparities, and glass door estimates – Allowing returns to be different for subgroups (Continued)
(5) All workers younger than 44 (6) All workers older than 43
Economy wide
Within firms
Glass door
Economy wide
Within firms
Glass door
Mean Wage Differential -0.163*** -0.106*** -0.057***
-0.149*** -0.118*** -0.031***
(0.011) (0.008) [0.000] (0.011) (0.010) [0.000] Quantile Differential 10th Percentile -0.120*** -0.095*** -0.024 -0.111*** -0.112*** 0.001 (0.021) (0.012) [0.163] (0.025) (0.010) [0.974] Median -0.170*** -0.110*** -0.06*** -0.148*** -0.116*** -0.032** (0.014) (0.007) [0.000] (0.015) (0.008) [0.014] 90th Percentile -0.204*** -0.124*** -0.08*** -0.185*** -0.122*** -0.063*** (0.030) (0.017) [0.000] (0.018) (0.017) [0.000] Observations 38430 38430 31915 31915
Notes: Standard errors are in parentheses, p-values for glass door test are in brackets. *** indicates statistically significant at 1%, ** indicates statistically significant at 5%, and * indicates statistically significant at 10%. All coefficients are estimated using sampling weights provided by Statistics Canada and all the standard errors are computed using 100 sets of bootstrap weights provided by Statistics Canada.

55
Table 1.A4. Decomposing the Glass Door Effect
(1)All workers
Mean wage differential
10th percentile
Median 90th percentile
(1) Economy-wide -0.16*** -0.117*** -0.156*** -0.197*** (-0.008) (0.017) (0.011) (0.019)
(2)Within-Industry -0.136*** -0.113*** -0.135*** -0.154*** (0.009) (0.014) (0.011) (0.022)
(3)Within-firm -0.113*** -0.103*** -0.113*** -0.124*** (0.007) (0.010) (0.006) (0.013)
(4) Sorting across firms, within and across industries [(1)-(3)]
-0.047*** -0.014 -0.043*** -0.073*** [0.000] [0.335] [0.000] [0.000]
(5)Sorting across firms and across industries [(1)-(2)]
-0.024*** -0.004 -0.021*** -0.043*** [0.000] [0.708] [0.000] [0.000]
(6)Sorting across firms and within industries [[(2)-(3)]
-0.023*** -0.01 -0.022** -0.03* [0.000] [0.305] [0.029] [0.094]
(2)All female workers without any dependent child and
all male workers
Mean wage differential
10th percentile
Median 90th percentile
(1) Economy-wide -0.150*** -0.101*** -0.149*** -0.188*** (0.008) (0.014) (0.011) (0.016)
(2)Within-Industry -0.129*** -0.093*** -0.127*** -0.148*** (0.009) (0.013) (0.0104) (0.020)
(3)Within-firm -0.116*** -0.108*** -0.116*** -0.125*** (0.006) (0.015) (0.006) (0.016)
(4) Sorting across firms, within and across industries [(1)-(3)]
-0.034*** 0.007*** -0.033*** -0.063*** [0.000] [0.000] [0.000] [0.000]
(5)Sorting across firms and across industries [(1)-(2)]
-0.021*** -0.0071* -0.022*** -0.04*** [0.000] [0.098] [0.000] [0.000]
(6)Sorting across firms and within industries [(2)-(3)]
-0.013*** 0.0141*** -0.011 -0.023* [0.000] [0.000] [0.176] [0.063]

56
Table 1.A4. Decomposing the Glass Door Effect (continued)
(3)All female workers with at least one dependent child
and all male workers
Mean wage differential
10th percentile
Median 90th percentile
(1) Economy-wide -0.176*** -0.123*** -0.174*** -0.212*** (0.011) (0.015) (0.011) (0.025)
(2)Within-Industry -0.147*** -0.125*** -0.146*** -0.174*** (0.012) (0.014) (0.013) (0.027)
(3)Within-firm -0.113*** -0.099 *** -0.109*** -0.124*** (0.008) (0.012) (0.006) (0.018)
(4) Sorting across firms, within and across industries [(1)-(3)]
-0.063*** -0.024** -0.065*** -0.088*** [0.000] [0.025] [0.000] [0.000]
(5)Sorting across firms and across industries [(1)-(2)]
-0.029*** 0.002 -0.028*** -0.038*** [0.000] [0.777] [0.000] [0.000]
(6)Sorting across firms and within industries [(2)-(3)]
-0.034*** -0.025*** -0.037*** -0.05** [0.000] [0.000] [0.002] [0.012]
(4)All workers younger than 44
Mean wage differential
10th percentile
Median 90th percentile
(1) Economy-wide -0.165*** -0.120*** -0.167*** -0.196*** (0.011) (0.018) (0.013) (0.031)
(2)Within-Industry -0.137*** -0.122*** -0.142*** -0.153*** (0.013) (0.017) (0.012) (0.017)
(3)Within-firm -0.106*** -0.102*** -0.108*** -0.123*** (0.007) (0.012) (0.008) (0.015)
(4) Sorting across firms, within and across industries [(1)-(3)]
-0.059*** -0.018 -0.059*** -0.073*** [0.000] [0.192] [0.000] [0.000]
(5)Sorting across firms and across industries [(1)-(2)]
-0.028*** 0.002 -0.025*** -0.043*** [0.000] [0.735] [0.000] [0.004]
(6)Sorting across firms and within industries [(2)-(3)]
-0.031*** -0.02 -0.034*** -0.03*** [0.000] [0.109] [0.000] [0.000]

57
Table 1.A4. Decomposing the Glass Door Effect (continued)
(5)All workers older than 43
Mean wage differential
10th percentile
Median 90th percentile
(1) Economy-wide -0.153*** -0.112*** -0.144*** -0.200*** (0.010) (0.019) (0.014) (0.023)
(2)Within-Industry -0.134*** -0.0988*** -0.123*** -0.158*** (0.010) (0.018) (0.015) (0.024)
(3)Within-firm -0.121*** -0.103*** -0.120*** -0.127*** (0.010) (0.013) (0.008) (0.022)
(4) Sorting across firms, within and across industries [(1)-(3)]
-0.032*** -0.009 -0.024** -0.073*** [0.000] [0.527] [0.038] [0.000]
(5)Sorting across firms and across industries [(1)-(2)]
-0.019*** -0.013*** -0.021*** -0.042*** [0.000] [0.000] [0.000] [0.000]
(6)Sorting across firms and within industries [(2)-(3)]
-0.013** 0.0042 -0.003 -0.031*** [0.045] [0.760] [0.817] [0.000]
(6)All single workers without any dependent child
Mean wage differential
10th percentile
Median 90th percentile
(1) Economy-wide -0.073 *** 0.003 -0.059 *** -0.143*** (0.015) (0.032) (0.017) (0.039)
(2)Within-Industry -0.0646*** -0.0115 -0.0669*** -0.110*** (0.015) (0.027) (0.018) (0.033)
(3)Within-firm -0.076 *** -0.073 *** -0.091 *** -0.066 *** (0.011) (0.021) (0.011) (0.024)
(4) Sorting across firms, within and across industries [(1)-(3)]
0.003 0.077*** 0.032*** -0.076** [0.292] [0.000] [0.018] [0.012]
(5)Sorting across firms and across industries [(1)-(2)]
-0.008*** 0.015 0.007 -0.033* [0.000] [0.384] [0.527] [0.083]
(6)Sorting across firms and within industries [(2)-(3)]
0.012*** 0.0624*** 0.024* -0.043** [0.000] [0.000] [0.084] [0.050]
Notes: Standard errors are in parentheses, p-values for glass door test are in brackets. *** indicates statistically significant at 1%, ** indicates statistically significant at 5%, and * indicates statistically significant at 10%. All regressions are based on pooled samples of all males and females. Gender wage gap estimates for different subsamples are generated using interaction between gender and appropriate indicators.

58
1.9.2. Appendix B: Data Appendix
In this section I provide more details regarding the variables used in our
regression analysis reported in table 1.4.
Non-wage benefits: Our measure of non-wage benefits is based on the following
categories of non-wage benefits provided by employers to all employees: (1) Dental
care, (2) Pension plan, (3) Group RRSP, (4) Stock purchase or other saving plans, (5)
Life insurance plan, (6) Supplemental medical (7) other non-wage benefits. I use the
sum of standardized z-scores of these binary indicators for each firm in every year as
our non-wage benefit measure.
Innovative work practices: I use an indicator which is equal to one if a given firm
in a given year has any of the following innovative work practices: (1) Employee
suggestion program, (2) Flexible job design, (3) Information sharing with employees, (4)
Problem-solving teams, (5) Joint Labour-management committees, (6) Self-directed
work groups.
Existence of incentive schemes in the compensation system: I use an indicator
which equal to one if a given firm in a given year has any of the following incentives in its
compensation system: (1) Productivity/Quality gain-sharing, which are systems that
reward individuals on the basis of group output or performance, (2) Individual incentive,
such as bonuses, piece-rate, and commissions are systems that reward individuals on
the basis of individual output or performance, (3) Merit pay and skill-based pay, which is
a reward or honour given for superior qualities, great abilities or expertise that comes
from training, practice etc., (4) Profit sharing, which is any plan by which employees
receive a share of the profits from the workplace.
Productivity: Our productivity measure is based on value added per worker,
where value-added is measured as gross revenue minus expenses on materials. I
approximate expenses on materials by subtracting payroll expenses and expenses on
non-wage benefits and training from gross operating expenditures (which includes
payroll, nonwage expenses and the purchase of goods). As it was mentioned before,
since the gross revenue is only provided for for-profit firms I can only include our
productivity measure in a specification that excludes nonprofit firms.

59
Quite rates: our measure of quit rate is constructed by total number of people
resigning between April 1st of year t-1 and March 31st of year t, divided by sum of
employment at April 1st of year t-1 and number of employees hired between April 1st of
year t-1 and March 31st of year t. To calculate the sum of employment at April 1st of year
t-1 and number of employees hired between April 1st of year t-1 and March 31st of year t
I use the sum of the following variables: (1) total employment in the last pay period of
March of year t, (2) total number of employees dismissed for a cause between April 1st
of year t-1 and March 31st of year t, (3) total number of employees laid-off between
April 1st of year t-1 and March 31st of year t, (4) total number of employees permanently
left the location because of special workforce reduction between April 1st of year t-1 and
March 31st of year t26, (5) total number of employees retired between April 1st of year t-1
and March 31st of year t, (6) total number of employees resigned between April 1st of
year t-1 and March 31st of year t, (7) total number of employees separated permanently
for other reasons between April 1st of year t-1 and March 31st of year t.
26 Special workforce reductions include resignations and early retirements induced through
special financial incentives (i.e. where employees voluntarily leave).

60
2. How do School “Report Cards” Affect School Choice Decisions?27
2.1. Introduction
Economists have long argued that policies designed to increase competition in
markets for education can improve educational outcomes by increasing disadvantaged
students’ access to high quality schools, and by causing underperforming schools to
become more effective or to shrink as families “vote with their feet” (Friedman 1955,
Becker 1995, Hoxby 2003). Recent evidence shows that providing information about
school-level achievement directly to parents can influence school choice (Hastings and
Weinstein 2008). However, it is unknown whether publicly disseminating information
about school achievement through the media has the same effect.28 On the one hand,
widespread dissemination has the potential to influence the choices of many parents,
and may therefore substantially increase the effectiveness of school choice policies.
However, a large increase in the demand for high-achieving schools will not increase
competitive pressure on weaker schools unless preferred schools can actually
accommodate more students. Furthermore, children whose parents have poor access
to media, or who are not part of well-informed social networks, may not benefit from
public dissemination strategies. In addition, if school achievement measures are subject
to substantial sampling variation, then parents could be misled or confused when
education authorities update public information about achievement. Our study
27 This chapter is based on a work co-authored with Jane Friesen, Justin Smith and Simon Woodcock and is published in the Canadian Journal of Economics (issue 45(2), May 2012).
28 Information about school achievement is publicly disseminated in jurisdictions including England (West and Pennell 2000), Chile (Urquiola, McEwan and Vegas 2007), New Zealand (Fiske and Ladd 2000), and many U.S. states (Figlio and Lucas 2004) and Canadian provinces (Cowley 2007).

61
addresses these issues by examining the effect of public information about school
achievement on school choice behavior in British Columbia (B.C.). Our estimates are
based on student-level longitudinal data for multiple cohorts of students that span the
introduction of standardized testing and the subsequent wide dissemination of school-
level results. We study the propensity of elementary school students to leave their
school in response to new information about school-level performance on those
standardized tests. We also investigate whether the response to information about
school achievement differs among parents who may face higher costs of accessing the
information, such as those with low income or those who do not speak English at home.
School-level achievement measures may be correlated with unmeasured
characteristics of schools that influence parents’ beliefs about school quality and affect
student mobility. We identify parents’ response to new information using two separate
identification strategies that exploit the timing of testing and the release of test results.
The first is a difference-in-differences approach that controls for unobserved factors that
jointly determine mobility and test scores by comparing the relationship between mobility
and lagged test scores before and after the public release of information about test
scores. The second is a control function approach (Navarro 2008) that uses current
cohort test scores to control for unobserved factors that jointly determine mobility and
test scores. Because test scores are not publicly revealed until the school year following
the exam, the current cohort’s exam results are a valid control for such unobservables,
and new information about the achievement of previous cohorts is a conditionally
exogenous shock to parent’s information about school quality.
We find that publicly disseminated information about school-level achievement
has a substantial effect on the inter-school mobility of some public school students. In
general, students are more likely to leave their school when they learn that their
schoolmates have performed relatively poorly. Families that speak English at home
respond strongly to early information releases, and continue to respond to subsequent
releases. Families that speak a language other than English respond only to the later,
more highly publicized information releases. The response is most pronounced among
English-speaking families in low-income neighborhoods. Arguably, these families may
have had poor private information about school quality, and hence valued the new public
information more highly than families in higher-income neighborhoods. The delayed

62
response of non-English speakers suggests they face high costs of accessing public
information.
2.2. Previous Literature
Hastings and Weinstein (2008) find that parents of children attending low-
achieving schools in a North Carolina school district were more likely to enroll their child
in a higher-achieving school when the district provided them with information about
school achievement. They also find that simplified information sheets distributed
randomly to parents in low- and middle-income schools doubled the estimated
preference parameter on school test scores in a school choice model. Using data from
the same school district, Hastings et al. (2009) find that test scores play a small role in
parents’ school choice decisions relative to travel distance and peer composition, and
that parents’ preferences vary substantially with characteristics such as income.
Unlike these studies, we focus on information that is disseminated to all parents,
at all schools, through public media. Public information may have different effects on
school choice behaviour compared to the private information strategies studied
previously, for several reasons. First, newly informed parents, especially those of
disadvantaged children, may face less competition for spaces in preferred schools when
they are part of a smaller, targeted group. Second, parents of children who attend low-
achieving schools may respond differently to new information than those of the broader
student population. Third, media dissemination may be a less effective way to inform
disadvantaged parents compared to direct communication from schools.

63
An alternative method for learning about the effect of public information about
school-level achievement on school choice is through its effect on housing prices.29
Figlio and Lucas (2004) and Fiva and Kirkebøen (2010) find that public information about
school-level achievement is capitalized into housing prices in Florida and Oslo
respectively, but the effect diminishes quickly over time. Kane et al. (2003) find that
while housing prices reflect long-run average school-level test scores, they do not
respond to year-to-year fluctuations in a given measure of school quality or to the
introduction of newly framed test score information.
Housing price studies only capture the effects of information about school
achievement on school choice decisions that operate through residential choice.
However, the link between residential and school choice decisions in many jurisdictions
is weakened by the availability of private schools, charter and magnet schools and/or
open enrolment policies. To the extent that information affects school choice decisions
along these margins, it will not be reflected in housing prices. Moreover, housing price
studies reveal little about the characteristics of the families whose decisions are affected.
Several studies examine the direct effect of public information about achievement
on school choice decisions. Mizala and Urquiola (2008) find that, when measures of
school achievement are already widely available, receiving a highly publicized SNED
award has no effect on enrollment levels, tuition fees, or socioeconomic composition of
Chilean schools. Hussain (2007) finds that enrollment falls by up to 6 percent in the
three years after English schools receive a public “fail" rating, while enrollment increases
by up to 2 percent in schools rated “very good."
Finally, publicly disseminated information in the form of “report cards” or rankings
like those examined here has been shown to affect consumer decisions in other
29 A large body of literature examines the relationship between school-level achievement
measures and real estate prices, but most studies do not focus on the effect of new information on prices (e.g. Black 1999; Barrow 2002; Bayer et al. 2004; Gibbons and Machin 2003, 2006; Ries and Somerville 2010). These studies typically find that residential property values are higher in neighborhoods with higher-achieving schools.

64
markets. These markets include health services (Dranove et al. 2003, Dafny and
Dranove 2008, Jin and Sorensen 2006) and restaurant patronage (Jin and Leslie 2003).
2.3. Institutional Background
2.3.1. School Access and Funding in B.C.
As in many other jurisdictions, B.C. students are guaranteed access to their
neighborhood “catchment” public school. B.C.’s provincial education authority (the
Ministry of Education) instituted an official “open boundaries” policy in July 2002 that
allows students to attend any public school that has space and facilities available after
catchment area students have enrolled. Provincial legislation requires that school
boards give priority to students who reside within the district; boards may elect to give
priority to children whose siblings are already enrolled, and must establish policies for
allocating spaces among students within a priority category. Entry into most public
magnet programs is restricted to students entering Kindergarten or Grade 1, and space
in popular programs is often allocated by lottery. Finally, students may choose a private
school.
Along with capital funding, the B.C. Ministry of Education provides districts with
operating funds in proportion to total district enrolment. Supplementary funding is
provided for each student who is Aboriginal, is gifted or disabled, or who qualifies for
English as a Second Language (ESL) instruction. Public districts are not authorized to
raise their own revenue. Private schools receive per-student operating grants of up to
50% of the base public school rate, and are responsible for teaching the provincial
curriculum and meeting various provincial administrative requirements (B.C. Ministry of
Education 2005).
2.3.2. Testing and Information
Prior to 1999, the BC Ministry of Education administered standardized Provincial
Learning Assessment Program (PLAP) exams, in various subject areas on a rotating
schedule, to students in grades 4, 7, and 10. These were replaced by standardized
Foundation Skills Assessment (FSA) exams in the 1999/2000 school year. The FSAs

65
are administered in the spring of each year to students in grades 4, 7, and 10 in reading
comprehension, writing, and numeracy.30 Neither the PLAP or FSA exams has any
academic consequences, and teachers and schools face no financial incentives related
to students’ exam performance.
PLAP exam results were never disseminated to parents or the public. The
Ministry of Education first released individual and provincial, district, and school-level
FSA exam results to schools in fall 2000 (based on the 1999/2000 exam). Schools were
instructed to share this information with parents upon request (B.C. Ministry of Education
2000). School-level results of the 1999/2000 and 2000/2001 FSA exams were first
posted on the Ministry’s website in October 2001 (B.C. Ministry of Education 2001).
Subsequent exam results have been posted on the Ministry’s website in the following fall
of each year. Since 2003, schools have been required to share individual students’
exam results with parents prior to September 30. Note that in each case, FSA results
are released in the school year following the year of the exam.
The Fraser Institute, an independent research and educational organization
(Fraser Institute 2008),31 began issuing annual “report cards” on B.C.’s elementary
schools in June 2003 (Cowley and Easton 2003).32 These include school scores and
rankings based on FSA results. From the outset, the school report cards have received
widespread media coverage in the province’s print, radio and television media.33
30 The grade 10 FSA exams were discontinued after the 2002/2003 school year. 31 The authors are not affiliated with the Fraser Institute in any way. 32 The Fraser Institute scores released in 2003 were based on school-average exam results in
reading, writing and numeracy in Grades 4 and 7, and the average gap between male and female scores on the Grade 7 reading and numeracy exams. The scores released in 2004 were constructed using different weights and included the percentage of students that did not “meet expectations” according to provincial standards (see Cowley and Easton (2008, p. 96) for details).
33 A ProQuest search of Vancouver’s two most widely-read daily newspapers (the Vancouver Sun and the Province) returned twelve articles (including editorial content) published about the Fraser Institute’s first elementary school report cards in June, 2003.

66
2.4. The Effect of New Information on School Choice
2.4.1. Basic Model
We present a highly simplified model of school choice that accounts for
uncertainty about school quality and focuses attention on the effects of new
information.34 Assume parent ’s utility ( ) depends on the quality ( ) of their child’s
school ,
(1)
where is a random taste-shifter with mean zero. We interpret as an index
of school characteristics that determine parents’ utility, such as teacher experience, peer
ability, the state of technology at the school, the quality of sports programs, and class
size.
We assume that parents cannot perfectly observe . They consequently form
beliefs about each school’s quality based on directly observable school characteristics
, such as neighbourhood income and the demographic composition of the student body.
Their prior beliefs are normally distributed with mean and precision , where is
the vector of weights given to observable characteristics. Parents are assumed to know
. Although prior precision is the same for all schools, it varies between parents to
reflect the idea that some (e.g., new immigrants) may have less precise beliefs about
school quality than others (e.g., a native born individual who has lived in the area for
many years).
Absent any additional information and given a set of available schools , a parent
chooses school if
(2)
34 The notation is adapted from Moretti (2010), where a similar model is used to study peer
effects in movie consumption.
Xs
E Uis | X s cis E Uik | X k cik k ,k s

67
where reflects the direct (e.g., tuition) and indirect (e.g., commuting distance)
costs of attending school . Given our assumed prior beliefs and utility function, this
implies that the average parent chooses school if
(3) .
Now suppose that parents also observe a noisy signal of each school's quality,
such as standardized test scores aggregated to the school level,
(4)
where . The noise component s has zero mean, implying that test
scores provide unbiased information about school quality. The precision of test scores
as a signal of school quality, , is known but varies across parents. This reflects the
possibility that test scores are more informative signals of school quality for some
parents than others.
Parents are assumed to update their expectations about each school's quality
using Bayes’ rule.35 Their posterior beliefs are normally distributed with mean sm and
precision iqi hh , where
(5) sqii
is
qii
qissss S
hh
hX
hh
hSXqEm
,| .
Parents’ updated expectation of school quality is a precision-weighted average of
the signal and their prior expectation. The greater is the precision of test scores relative
to prior information, the greater is the weight that parents will place on test scores. If test
35 For recent applications of Bayesian learning, see Moretti (2010), Ichino and Moretti (2009),
Erdem and Keane (1996), Altonji and Pierret (2001), Lange (2007), Chernew et al. (2008), and Woodcock (2010).
X s c is X k c ik k ,k s
s ~ N 0,hi1

68
scores are very noisy, prior information will continue to dominate parents’ beliefs about
school quality.
Defining as the weight that parents place on test scores, and
rearranging equation (5), we can write the average parent’s expected utility from
choosing school as
(6) .
Define to be the test score “shock,” which represents the new
information acquired from the signal. Parents will choose to enroll their child in school
if
(7) .
Parents choose school if the information shock is sufficiently good relative to
other schools that it outweighs any relative differences in the schools’ other
characteristics and attendance costs. Conversely, parents will choose school even if
they receive a relatively poor information shock, provided its characteristics are good
enough and attendance costs low enough to outweigh the “bad news” about school-level
test scores. Note also that test score information only affects school choice if it is
sufficiently precise to be useful (i > 0). Furthermore, i varies across individuals
because of interpersonal differences in the precision of prior beliefs, and differences in
the precision of test scores as a signal of school quality.
2.4.2. Model Dynamics
We now extend the model to accommodate a sequence of signals rather than a
one-time event. Suppose that in each period , parents observe an unbiased signal of
school quality that conforms to equation (4), such as the results of an annual
standardized test that are revealed to the public in each school year. We define parents’
beliefs about school quality recursively. After observing signals, parents’ beliefs are
normally distributed with mean sTm and precision iqi Thh , where
i hi hi hqi 1
E Uis | X s,Ss i Ss X s X s
Ss* Ss X s
i
Ss* Sk
* X k X s cik cis k ,k s

69
(8)
sTiqi
is
iqi
qi
sTiqi
isT
iqi
iqisTsssssT
SThh
ThX
Thh
h
SThh
hm
Thh
hThSSSXqEm
121
1,,,,|
and is the average of all observed signals.
From the first line of equation (8) we see that, as in the case of a single signal,
parents’ revised expectations about school quality are a precision-weighted average of
the new signal ( sTS ) and expected quality prior to observing the signal ( 1sTm ). We also
see that each new signal receives successively smaller weight in parents’ Bayesian
update, because the previous – 1 signals have already contributed to the precision of
their beliefs, and consequently increased the weight assigned to 1sTm . From the second
line of equation (8), however, we see that the combined weight assigned to the average
of all signals ( iTT , where ) increases with , and the weight
assigned to observable school characteristics consequently decreases.
Defining to be the information shock embodied in the new
signal, and rearranging the first line of equation (8), parents choose school over school
if
(9) isiksTkTkTsTiT ccmmSS 11**** .
The intuition behind this maximization condition is the same as before: parents
choose school if the information shock contains sufficient “good news” about school
quality relative to what was previously believed and attendance costs.
S sT T1 Sstt1
T
iT hi hqi Thi 1
SsT** SsT msT1

70
2.5. Methodology
2.5.1. Empirical Model
For tractability and because of data limitations, we treat residential location as
exogenous and examine inter-school mobility conditional on residential choice.
Specifically, we model the probability that a student separates from their current school
after September 30 of year and enrolls in a new school before September 30 of year
1, conditional on their residential location. In terms of our theoretical model, students
will separate from their current school if some alternative school satisfies equation (9).
The fundamental identification issue is that school-level achievement measures
may be correlated with unmeasured characteristics of schools that influence parents’
beliefs about school quality and affect student mobility. Our first estimator addresses
this problem by comparing the relationship between lagged school-average test scores
and the probability of separating from the current school, conditional on observable
characteristics, before and after lagged test scores were first released to the public in fall
2000. Under some identifying assumptions described below, this strategy allows us to
estimate the effect of the 1999/2000 test score information on separations in the year it
was released.36 The estimating equation takes the form
(10)
iststsiststitttSt
ttstist CXZdSdSy
2000
132000
2110
where is a binary variable indicating whether student separated from school
at the end of school year ; is a measure of lagged test scores; 2000ttd is a binary
indicator for the 2000/2001 school year; is a vector of observable student
36 According to our theoretical model, FSA scores will continue to affect school choice decisions in subsequent school years, but with a smaller weight. Estimating the effect of information on separations in years after 1999/2000 in the difference-in-differences framework therefore would require us to include higher order lags of test scores in our specification. This approach is not feasible because numeracy and reading exams were not administered regularly during the 1990s.

71
characteristics; is a vector of observable school characteristics; is a vector of
proxies for the student’s cost of attending school ; is a fixed school effect, st is a
random school-by-year effect that captures any unmeasured correlation among
students’ separation behavior in a given school and year;37 ist is a stochastic error term;
and ,,,,,, 3210 are coefficients to be estimated. The coefficient of interest, 3 ,
measures how the relationship between lagged test scores and separations differs
before and after the release of test score information to parents.
Since FSA testing began in 1999/2000, there is no lagged FSA score from which
to identify the baseline relationship between lagged test scores and separations in
1999/2000. Instead, we use the results of the PLAP reading exam as our measure of
pre-policy achievement, and use the FSA reading scores as our measure of post-policy
achievement. The use of the PLAP results as a proxy for baseline achievement raises
two issues. First, although the exams were not identical, they tested similar skills
(Raptis and Fleming 2006: 1204), so we expect that their underlying relationship with
mobility behavior would be similar. Second, because the PLAP reading test was not
administered in 1998/1999, we use the 1997/1998 PLAP reading results as a proxy for
the lagged baseline score. Our identifying assumption therefore is that the relationship
between the 2000/2001 separations and the 1999/2000 FSA test scores (written one
year previously) would have been the same as the relationship between the 1999/2000
separations and the 1997/1998 PLAP test scores (written two years previously), had
information about FSA performance not been released.
We estimate a second specification that allows us to identify the effects of a
series of information shocks on inter-school mobility, while separately identifying the
effect of new information versus the lagged effect of previously released information, and
that does not rely on proxy test score measures. This estimator includes the current
cohort’s average FSA score, , as a control for unobserved time-varying school
37 Stated differently, our reported standard errors account for clustering at the school-by-year level.
s

72
characteristics that jointly affect test scores and separations. We estimate the following
specification using data from the 1999/2000 through 2003/2004 school years:
(11)
yist 0 3jSsj
j1999
2002
dtjt1 4
jSsjj1999
2002
dtj t1 5Sst Z it X stt C ist t s st ist
As before, is a school-level aggregate of test scores. Here, however, we
have no need for test scores prior to 1999/2000, and therefore all test scores are
aggregates of FSA reading and math results. Each test score measure is interacted
with a pair of binary indicator variables: 1tjtd equals one when 1 and zero
otherwise; similarly 1tjtd equals one when 1. We call j
3 “news” coefficients
because they measure how each information release affected students’ separation
probability in the year in which that particular information first became available to
parents. Each information release also takes a separate “old news” coefficient j
4 that
measures its effect on separation probabilities in subsequent school years. As
discussed in more detail below, is the current cohort’s FSA score and takes
coefficient 5 ; and t is a fixed year effect. All other terms are as previously defined.
Note, however, that t now varies over time.38 This reflects our theoretical model’s
prediction that parents will give less weight to observable school characteristics as more
test-based information becomes available to them. As with the difference-in-differences
estimator, we include fixed school effects that control for any between-school differences
in average separation rates that may be correlated with between-school differences in
average achievement.
38 Specifically, varies across three information “regimes” that reflect the nature of information
available to parents. During the first regime (1999/2000), parents observed no formal measures of school-level achievement. Parents could observe school-average FSA exam results during the second regime (2000/2001 and 2001/2002), and they could observe both school-average FSA exam results and the Fraser Institute scores and rankings during the third regime (2002/2003 and 2003/2004).

73
We include the current cohort’s FSA score ( ) in equation (11) to control for
unmeasured time-varying school characteristics that have persistent effects on student
achievement and separation probabilities. Suppose, for example, that a school hires an
unusually bad grade 4 teacher in year 1 who produces lower FSA results. If her
continuing presence at the school negatively influences parents’ beliefs about school
quality in year , this directly increases students’ year separation probability. Absent
an adequate control, the bad teacher’s independent effect on year 1 FSA scores and
year separations will be confounded with parents’ year response to information about
year 1 FSA scores. It is reasonable to assume, however, that if the bad teacher
influences students’ separation probability in then she also influences students’ FSA
performance in . Because year FSA scores are not observed by parents until year
1, they are a valid control for the “bad teacher effect” in year , as well as any other
school-level unobservables that jointly affect mobility and performance and have
persistent effects over time. Controlling for the current cohort’s FSA scores ( ) thus
allows us to identify parents’ response to information from lagged test scores, under the
identifying assumption that unobserved time-varying factors that influenced previous
cohorts’ achievement are only correlated with current-year unmeasured heterogeneity in
separations ( st and ist ) via their persistent effect on achievement. When this
assumption is satisfied, lagged FSA scores are exogenous in the separation equation
conditional on current FSA scores. The formal proof of identification is provided in an
Appendix.
If parents at low-achieving schools were more constrained by neighborhood
enrolment policies than parents in high-achieving schools, then separations from low-
achieving schools might have increased relative to separations from high-achieving
schools when the open boundaries enrolment policy took effect in 2002/2003. We
therefore allow the coefficient on to differ before and after 2002/2003. Under our
maintained assumption that unobserved time-varying factors that influenced previous
cohorts’ achievement are only correlated with Ʋ and via their persistent effect on
achievement, this identifies the effect of information released in 2002/2003 separately
from the effect of the change in enrolment policy.

74
2.5.2. Data
Our investigation focuses on B.C.’s Lower Mainland region, a large metropolitan
area with a population of approximately 2.5 million that includes the city of Vancouver
and its suburbs. It encompasses fourteen public school districts with a total annual
enrollment of roughly 375,000 students in Kindergarten through Grade 12 (B.C. Ministry
of Education 2007:8).39
Our student-level data are based on two administrative databases, integrated via
a unique student identifier: an enrollment database (collected for each student on
September 30 of each year), and an FSA exam database. Our analysis is based on an
extract of the enrollment database that includes all students in the Lower Mainland who
entered Kindergarten between 1994/1995 and 2003/2004. We restrict our analysis to
public school students who made regular progress through the grades and remained in
the Lower Mainland through grade 5. Our regression estimates are based on the subset
of this population enrolled in grade 4, because the FSA exam is administered in this
grade.40,41 We create our indicator of separations, , by comparing the school at which
the student was enrolled on September 30 of their grade 4 year and the school at which
they were enrolled on September 30 of the following year. Because FSA results are
released in October, measures separations during or at the completion of the grade
4 year, following the release of FSA results.
39 The region is geographically isolated from other populated areas by the U.S. border to the
south, the Strait of Georgia to the west, and rugged mountains to the north and east. 40 Our control function approach relies on current cohort FSA scores to control for unobserved
time-varying factors that have persistent effects on FSA scores and separations. This identification strategy is most credible for those students in the current FSA cohort (grade 4). Focusing on grade 4 also allows us to control for students’ own FSA scores.
41 To test the hypothesis that parents’ response to new information might be strongest upon initial school entry, we have also used a difference-in-differences specification to estimate how kindergarten enrollment changed in response to the release of FSA test scores. We do not report these estimates for two reasons. First, they were too imprecise for us to be able to draw any reliable conclusions. Second, impacts on enrollment levels (unlike separations) might be muted by capacity constraints, and a full analysis under such constraints is beyond the scope of this paper.

75
We augment these data with: (1) school-by-grade average student
characteristics; (2) selected characteristics of each student’s neighborhood as measured
in the Census of Population; (3) school-average 1997/98 PLAP reading scores; (4)
annual Fraser Institute school scores and rankings for the 1999/2000 through 2003/2004
school years, and a three-year average score released in 2003; and (5) geographic
coordinates associated with each school’s postal code and each student’s residential
postal code.42
The complete set of information shocks and the variables we use to capture them
in our control function specification are summarized in Table 2.1. In each case, these
variables are based on school-average performance on the FSA reading and numeracy
exams. The first set of FSA results was released by the Ministry at the beginning of the
2000/2001 school year, and a new set was released in each subsequent year. The
Fraser Institute released their first scores and rankings in June 2003, based on the FSA
exams written in 1999/2000, 2000/2001 and 2001/2002. That release included overall
scores (out of 10) for each school in each of the three years, the three-year average
score (also out of 10), and school rankings based on the 2001/2002 score and the three-
year average score.43 The three-year average was arguably the most salient measure,
since schools were ordered on this measure in the ranking published in local
newspapers.44 The Fraser Institute released an additional set of scores and rankings
based on the 2002/2003 FSA exams in spring 2004. We normalize all information shock
variables in Table 2.1 to have mean zero and variance one over schools in each year.
42 We use these geographic coordinates to calculate measures of distance between the student’s
home and various schools. Details of how we construct these measures are provided in the Data Appendix (Appendix C).
43 Our estimation sample includes only students who attended schools for which a full set of Fraser Institute scores was released in both 2003 and 2004. See the Data Appendix (Appendix C) for details.
44 See, for example, “Elementary school rankings one useful tool for B.C.,” in The Province newspaper, June 8, 2003: pg. A.20. Also “Elementary schools get their grades, by Janet Steffenhagen in The Vancouver Sun newspaper, June 9, 2003: pg. B.1.

76
The specific control variables included in our regressions are listed in the table
notes and described further in Appendix C.
2.6. Results
2.6.1. Descriptive Statistics
Our estimation sample consists of 65,180 students who attend 361 public
elementary schools.45 We report sample means and mean separation rates for some
key characteristics in Table 2.2 (sample means for all control variables are reported in
Table 2.A1 in Appendix B). Almost five percent of students self-report as Aboriginal, and
these students have significantly higher separation rates than average (18.4% vs. 8.9%).
Almost one-third of students speak a language at home other than English, and overall
these students have a higher than average separation rate. Only a small fraction (3.6%)
has been diagnosed with disabilities at this early stage of their education and
approximately 7% of students attend a French Immersion program. The separation rate
of disabled students is higher than average (13.6%) and that of French Immersion
students is lower than average (6.4%).
Table 2.3 shows school separation rates by grade for the five Kindergarten
cohorts that we are able to follow through grade 5. Over 60% of students remain in the
same school throughout these grades, and about 30% separate once. The remaining
students experience multiple separations between Kindergarten and grade 5. The
separation rate is highest following Kindergarten, but is still fairly high (between 8% and
10%) following grade 4.
45 Students with missing data are excluded. In particular, note that our sample includes only
students who made regular progress through grades K-5 in a Lower Mainland school. This excludes students who separate and move to a school outside of the province. See the Data Appendix (Appendix C) for information about the nature and frequency of missing data.

77
2.6.2. Econometric Estimates
Our theoretical model contains a number of testable implications. Most
fundamentally, when parents observe new information about school quality, they may
alter their original school choice if the information shock makes an alternative school
appear more attractive. For this to occur, the shock must provide new information about
school quality rather than simply confirming what they already know, and the signal
cannot be so noisy relative to prior information that parents ignore it.
2.6.2.1. Difference-in-differences Estimates of Response to First Information Shock
We begin by investigating parents’ response to the first public release of
information about school-level achievement. On the one hand, we expect parents to
respond most strongly to this first shock, since our model predicts that parents’ response
to new releases of test score information gets weaker over time as information
accumulates and their beliefs about school quality become increasingly precise. On the
other hand, this first information release was not as widely publicized as subsequent
releases, so its effect may have been muted if some parents did not absorb and act on
this information.
Selected coefficient estimates from our difference-in-differences estimator (eq.
10) are presented in Table 2.4.46 Column 1 presents estimates for the full sample of
grade 4 students in 1999/2000 and 2000/2001. The estimated coefficient of interest (the
lagged test score interacted with an indicator for the first year test score information was
publicly released) is negative. This indicates that students’ separation probability
declined at public schools that received better news (higher school-average test scores),
46 Complete coefficient estimates are given in Appendix B, Table 2.A3. All else equal, the
probability of separation is higher among disabled students, and is strikingly higher among Aboriginal students. It is lower among high-achieving students and students in English as a Second Language programs. Distance to school has a significant positive effect on separations, but the magnitude is small. Unsurprisingly, prior mobility is a strong predictor of current separation. Students who live in neighborhoods where a greater proportion of household heads have a university degree are substantially more likely to leave their school.

78
relative to public schools where the news was worse. However the estimate is small and
imprecise and we cannot reject the null of no effect at conventional levels.
The remaining columns of Table 2.4 explore possible heterogeneity in parents’
response to the first information release. In columns 2 and 3, we divide the sample into
students who report speaking English at home and those who report speaking another
language. Language barriers may impede some parents’ access to information,
reducing the precision of test scores as signals of school quality.47 Indeed, we find no
evidence that non-English speakers responded to the first information release. In
contrast, we observe a substantive and statistically significant response among parents
who speak English at home: all else equal, a one standard deviation improvement in a
school’s average test score reduced students’ separation probability by a full percentage
point on a baseline separation rate of 8.3%.
In the remaining columns of Table 2.4, we investigate how parents’ responses to
the first information release varied by neighborhood income. Parents who live in
disadvantaged communities may have relatively poor access to private information (i.e.,
imprecise prior beliefs) or fewer school choice opportunities, both of which could mediate
their response to information about school achievement. We consequently break out
families who reside in Census EA/DAs in the top (richest) and bottom quartiles of the
distribution of average household income. The results in columns 4 and 6 suggest that
parents in top quartile neighborhoods do not respond to test score information,
regardless of home language. Families in high-income neighborhoods may already
have had good access to private information, so that the new public information did not
cause them to update their beliefs about schools in any meaningful way. In contrast,
English-speaking families in low-income neighborhoods responded quite strongly to new
information (column 5). We investigate this further below.
47 Home language may also proxy for preferences or cultural norms.

79
2.6.2.2. Control Function Estimates
Our estimates of parents’ response to the first release of school-average test
scores suggest that either this information did not reach certain groups, or the quantity or
quality of the news it contained was not sufficient to alter their school choices. Further
insight into the factors that shape parents’ heterogeneous responses can be gained by
investigating how they responded to subsequent releases of test scores, when this
information was more widely disseminated. We consequently turn to estimates for the
full series of information shocks, based on our control function specification. This
specification allows us to distinguish between the lingering effects of previous
information releases versus the effect of newly released information. Recall that our
theoretical model predicts that even after new information about school quality is
observed, “old news” continues to influence parents’ beliefs (via ) and hence their
choices.
The first column of Table 2.5 presents selected coefficient estimates for the full
sample of grade 4 students.48 We restrict the specification to a single information
measure in each year: FSA exam scores in the first two years (when these were the only
information measures available) and Fraser Institute scores in the latter two years (since
these were published in the media, and therefore are arguably more salient).49 In three
of four years, the coefficient estimates are negative, indicating that students’ separation
probability declined at schools where the news was better. The exception is the second
release of Fraser Institute scores, where the coefficient is effectively zero. The point
estimates imply that a one standard deviation increase in the 1999/2000 FSA score
relative to other schools reduced students’ separation probability by 0.9 percentage
48 Complete coefficient estimates are given in Appendix B, Table 2.A4. 49 Estimates for specifications that include the full set of information measures released in each
year (for those years where multiple measures were released, e.g., 2002/2003 when the Ministry published school-average FSA scores via its website and the Fraser Institute released their first set of scores and rankings) are available on request. Because contemporaneous information measures are highly correlated (see Appendix B, Table 2.A2), estimates from specifications that include multiple information measures for each year are imprecise and difficult to interpret. Hence we prefer the reported estimates.
msT 1

80
points. This is almost identical to the corresponding point estimate from the difference-
in-differences estimator. The corresponding figure for the 2000/2001 FSA score is 1.1
percentage points, and 3.5 percentage points for the first release of Fraser Institute
scores. Only the latter release had any effect beyond the initial year and, as predicted
by our model, the “old news” effect was smaller than the “news” effect (-0.027 versus -
0.035). The estimated “old news” effects associated with the other information releases
are all statistically insignificant, and the point estimates are small.
The coefficient on the current-year mean FSA score is statistically insignificant,
indicating no systematic relationship between current-year achievement and
separations.50 The sign of the point estimate on the interaction between the current-year
mean FSA score and an indicator for those years that the open enrolment policy was in
effect is positive, indicating that if anything open enrolment increased separations from
high-achieving schools relative to low-achieving schools. Thus we are confident that the
estimated negative effect of the first Fraser Institute release, which coincided with the
introduction of open enrolment, captures parents’ response to the release of the Fraser
Institute report cards, and not unobserved heterogeneity that jointly affects achievement
and mobility, or changes in behavior associated with the introduction of open enrolment.
Furthermore, the statistically significant response to FSA scores released by the Ministry
in 2000 and 2001, which predate the introduction of the open boundaries policy,
reinforces the impression that some parents were able to respond to new information
about school-level achievement even absent official open enrolment policies.
As with the difference-in-differences estimates, the point estimates in columns 2
and 3 indicate that parents of children who speak English at home responded to the first
release of FSA exam scores, while non-English speaking parents did not. The
magnitude of the point estimate is slightly larger than from the difference-in-differences
estimator, and implies that when a school scored one standard deviation higher in the
distribution of published school-average FSA scores, students’ separation probability
50 In other specifications reported below, the coefficient on current-year FSA scores differs
significantly from zero.

81
declined by 1.3 percentage points. On a base separation rate of about 8.3% per year,
this is quite a large response. Parents in this group responded further to the first release
of information by the Fraser Institute in 2002. The magnitude of the point estimate
implies that when a school scored one standard deviation higher in the distribution of
Fraser Institute scores, students’ separation probability declined by 3.1 percentage
points. Again, this is quite a large response.
As before, parents of children who report speaking a language other than English
at home did not respond to the release of FSA scores in 2000/01 and 2001/02.
However, they did respond to the release of Fraser Institute scores. The point estimate
implies that a one standard deviation increase in the first Fraser Institute score relative to
other schools reduced these students’ separation probability by 4.6 percentage points.
Such a large response suggests poor access to previously released information, rather
than resources or preferences, explains these parents’ delayed response to information
about school-level achievement.
A potential concern is that language barriers may not be the genuine cause of
observed heterogeneity in responses. Rather, heterogeneity could be driven by
correlates of language, such as income. In Table 2.6, we present estimates broken out
by quartiles of the distribution of neighborhood income. The results follow essentially the
same pattern as the difference-in-difference estimates for the first information release.
Parents in top quartile neighborhoods, both in the full sample and in the English-
speaking sub-sample, do not respond to test score information. In contrast, those in
low-income neighborhoods respond strongly. Public information releases evidently
contained substantial news for these parents, leading them to update their beliefs about
school quality and respond substantively. Non-English speaking parents do not respond
to the first or second release of FSA scores by the Ministry, regardless of neighborhood
income. However they do respond to subsequent releases of Fraser Institute scores,
although the timing of the response differs by neighborhood income. Overall, it seems
clear that access to information about test scores, rather than school choice
opportunities, preferences or financial resources, is the essential factor determining how
parents respond.

82
We explore the sensitivity of our results to sample composition and specification
in Table 2.A5 in Appendix B. These robustness checks show that English-language
parents’ estimated response to information is not driven by the behavior of Aboriginal
parents or parents of French Immersion students (as shown in Table 2.2, both of these
groups had unconditional separation rates significantly different from the average
student); nor are our estimates sensitive to specifying information measures based on
schools’ Fraser Institute rankings instead of Fraser Institute scores.
Under our identifying assumptions, our reported estimates can be interpreted as
causal. We cannot test these identifying assumptions directly. We therefore look for
contradictory evidence via two falsification tests for each specification reported in Tables
2.A6 and 2.A7. In each, we replace our “news” variables with false information
measures based on year 1 and year test scores respectively, and correspondingly
update the “oldnews” variables. Parents could not directly observe these false news
measures at the time they were making school choice decisions, and consequently there
should be no systematic relationship between them and separations. Estimates,
reported in Tables 2.A6 and 2.A7 in Appendix B confirm this to be true.
2.7. Conclusion
We find that the public release of information about school-level achievement
had a substantial effect on the inter-school mobility of some public school students in the
Lower Mainland of B.C. A substantial proportion of parents appear to revise their beliefs
about the relative quality of their child’s school in response to this information, and “vote
with their feet” by moving their child to a preferred school. This response is observed
primarily among parents who reside in low-income neighborhoods, and occurs the first
time that school-level achievement measures are placed in the public domain. While
both English and non-English language parents respond strongly to public information
about school achievement, non-English parents appear to face higher costs of accessing
school achievement information. They respond strongly to school achievement
information, but only when the media provided widespread coverage to the Fraser
Institute’s school report cards. These results suggest that high-profile dissemination can

83
play a crucial role in ensuring access to publicly provided information in environments
with culturally and linguistically diverse populations.
Jurisdictions that publicize school-level results typically update this information
annually, raising concerns that parents may respond to year-to-year fluctuations that are
largely noise (Kane and Staiger 2002, Mizala, Romaguera and Urquiola 2007). Our
results show that English-speaking parents in low-income neighborhoods respond
immediately to the first release of information, and continue to respond to subsequent
releases in later years. Our data provide no way to determine whether these ongoing
responses are a series of reactions to noisy information updates, or whether they simply
reflect the time it takes for information to reach all members of the community. Likewise,
the delayed response of non-English-speaking parents suggests substantial
heterogeneity in parents’ access to public information. Consequently, annual releases of
school achievement information that elicit ongoing media coverage may play an
important role in communicating that information to all segments of the community,
including recent immigrants.
Our results add to a growing body of evidence that information about school-level
achievement affects behavior in ways that may have real consequences for educational
outcomes. In addition to ensuring that all parents are able to access the information
provided, educational authorities should therefore take care to ensure that widely
disseminated information brings competitive pressure to bear on schools that are
ineffective, rather than on schools that serve disadvantaged populations. As a growing
literature attests, designing meaningful measures of school effectiveness continues to be
a challenge (Hægeland et al. 2004, Mizala, Romaguera and Urquiola 2007).

84
2.8. References
Altonji, Joseph G., and Charles R. Pierret (2001) “Employer learning and statistical discrimination”, The Quarterly Journal of Economics 116(1): 313-350.
Barrow, Lisa (2002) “School choice through relocation: evidence from the Washington, D.C. area”, Journal of Public Economics 86(2): 155-189.
Bayer, Patrick, Fernando Ferreira, and Robert McMillan (2004) “Tiebout sorting, social multipliers and the demand for school quality”, NBER Working Paper No. 10871, National Bureau of Economic Research.
Becker, G. S. (1995). “Human capital and poverty alleviation”, World Bank Human Resource and Operation Policy Working Paper Number 52 (Washington, D.C)
Berry, Steven, James Levinsohn, and Ariel Pakes (1995) “Automobile prices in market equilibrium”, Econometrica 63(4): 841-890.
Black, Sandra E. (1999). “Do better schools matter? Parental valuation of elementary education”, Quarterly Journal of Economics 114(2): 577-599.
B.C. Ministry of Education (1999) English as a Second Language Policy Framework (Victoria: Government of British Columbia).
B.C. Ministry of Education (2002) 2002/03 Operating Grants Manual to British Columbia School Boards (Victoria: Government of British Columbia.
B.C. Ministry of Education (2000) Interpreting and communicating Foundation Skills Assessment Results 2000 (Victoria: Government of British Columbia).
B.C. Ministry of Education (2001) Interpreting and communicating Foundation Skills Assessment Results 2001 (Victoria: Government of British Columbia).
B.C. Ministry of Education (2005) Overview of Independent Schools in British Columbia (Victoria: Government of British Columbia).
B.C. Ministry of Education (2007) 2006/07 Summary of Key Information (Victoria: Government of British Columbia)
Chernew, Michael, Gautam Gowrisankaran, and Dennis P. Scanlon (2008) “Learning and the value of information: Evidence from health plan report cards”, Journal of Econometrics 144 (1): 156-174.
Cowley, Peter (2007) Bringing Education into the Market Place: Part 1 - The Report Cards on Schools (Vancouver, B.C.: The Fraser Institute).
Cowley, Peter and Stephen T. Easton, (2003) Report Card on British Columbia’s Elementary Schools: 2003 Edition (Vancouver, B.C.: Fraser Institute).

85
Cowley, Peter, and Stephen T. Easton, (2008) Report Card on British Columbia’s Elementary Schools: 2008 Edition (Vancouver, B.C.: Fraser Institute).
Dafny, Leemore, and David Dranove (2008) “Do report cards tell consumers anything they don’t already know? The case of Medicare HMOs”, RAND Journal of Economics 39(3): 790-821.
Downes, T.A., and J.E. Zabel (2002) “The impact of school characteristics on house prices: Chicago 1987-1991”, Journal of Urban Economics 52(1): 1-25.
Dranove, David, Daniel Kessler, Mark McClellan, and Mark Satterthwaite (2003) “Is more information better? The effects of “report cards” on health care providers”, Journal of Political Economy 111(3): 555-588.
Erdem, Tulin, and Michael P. Keane (1996) “Decision-making under uncertainty: capturing dynamic brand choice processes in turbulent consumer goods markets”, Marketing Science 15(1): 1-20.
Figlio, David N., and Maurice E. Lucas (2004) “What's in a grade? School report cards and the housing market”, American Economic Review 94(3): 591-604.
Fiske, E. B., and H. F. Ladd (2000) When Schools Compete: A Cautionary Tale (Washington, DC: Brookings Institution Press).
Fiva, John F. and Lars J. Kirkebøen (2010) “Information shocks and the dynamics of the housing market”, Scandinavian Journal of Economics 113(3): 525-552.
Fraser Institute (2008). Who We Are. http://www.fraserinstitute.org/aboutus/whoweare/
Friedman, M. (1955) “The role of government in education”, in Economics and the Public Interest, ed. Solo (Piscataway, N.J.: Rutgers University Press).
Gibbons, S. and S. Machin (2003) “Valuing English primary schools”, Journal of Urban Economics 53: 197-219.
Gibbons, S. and S. Machin (2006) “Paying for primary schools: admissions constraints, school popularity or congestion?”, Economic Journal 116: 77-92.
Hanushek, Eric A., Kain, John F., and Rivkin, Steven G. (2002) “Inferring program effects for special populations: Does special education raise achievement for students with disabilities?”, Review of Economics and Statistics, 84: 584-599.
Hastings, Justine S., Thomas J. Kane, and Douglas O. Staiger (2009) “Heterogeneous preferences and the efficacy of public school choice”, mimeo, Yale University.
Hasting, J., and J. Weinstein (2008) “Information, school choice and academic achievement: evidence from two experiments”, Quarterly Journal of Economics 123(4): 1373-1414.

86
Hoxby, Caroline M. (2003) “School choice and school productivity (or could school choice be a tide that lifts all boats?”, in The Economics of School Choice, ed. C. Hoxby (Chicago: The University of Chicago Press).
Hussain, Iftikhar (2007) “School choice, information disclosure and sanctions: evidence from an unusually tough school accountability regime”, mimeo, University College London.
Ichino, Andrea, and Enrico Moretti (2009) “Biological gender differences, absenteeism, and the earnings gap”, American Economic Journal: Applied Economics 1(1): 183-218.
Jin, Ginger Zhe and Phillip Leslie (2003) “The effects of information on product quality: evidence from restaurant hygiene grade cards”, Quarterly Journal of Economics 118(2): 409-451 .
Jin, Ginger Zhe and Alan T. Sorensen (2006) “Information and consumer choice: the value of publicized health plan ratings”, Journal of Health Economics 25(2): 248-275.
Kane, Thomas and Douglas O. Staiger (2002) “The promise and pitfalls of using imprecise school accountability measures”, Journal of Economic Perspectives 16(4): 91-114.
Kane, Thomas J., Douglas O. Staiger and Gavin Samms (2003) “School accountability ratings and housing values”, Brookings-Wharton Papers on Urban Affairs: 83-137.
Lange, Fabian (2007) “The speed of employer learning”, The Journal of Labor Economics 25(1): 1-34.
McFadden, Daniel (1978) “Modeling the choice of residential location”, in Spatial Interaction Theory and Planning Models, ed. A. Karlquist et al., (New York: Elsevier North-Holland).
Mizala, Alejandra, Pilar Romaguera and Miguel Urquiola (2007) “Socioeconomic status or noise? Tradeoffs in the generation of school quality information”, Journal of Development Economics 84: 61-75.
Mizala, Alejandra and Miguel Urquiola (2008) “School markets: the impact of information approximating school effectiveness”, Working Paper, Columbia University.
Moretti, Enrico (2010) “Social learning and peer effects in consumption: Evidence from movie sales”, Review of Economic Studies, forthcoming.
Navarro, Salvador (2008) “Control functions”, in The New Palgrave Dictionary of Economics Online, ed. Steven N. Durlauf and Lawrence E. Blume, 18 December 2010, DOI:10.1057/9780230226203.0311 (Palgrave Macmillan).

87
Raptis, Helen and Thomas Fleming (2006) “Large-scale assessment outcomes in British Columbia”, Canadian Journal of Education 29: 1191-1222.
Ries, John and Tsur Somerville (2010) “School quality and residential values: Evidence from Vancouver zoning”, Review of Economics and Statistics 92(4): 928-944.
West, Anne and H. Pennell (2000) “Publishing school examination results in England: Incentives and consequences”, Educational Studies 26(4): 423-436.
Woodcock, Simon D. (2010) “Heterogeneity and learning in labor markets”, The B.E. Journal of Economic Analysis & Policy (Advances) 10(1): Article 85.

88
2.9. Tables
Table 2.1. Information Shocks and Information Variables
Information Date "News" Variables "Old News" Variables
1999/2000 cohort school mean FSA exam results released to parents on request
Oct. 2000
(1999 Mean FSA Score)*(Yr=2000)
(1999 Mean FSA Score)*(Yr>2000)
2000/2001 cohort school mean FSA exam results released on Ministry of Education website
Oct. 2001
(2000 Mean FSA Score)*(Yr=2001)
(2000 Mean FSA Score)*(Yr>2001)
2001/2002 cohort school mean FSA exam results released on Ministry of Education website
Oct. 2002
(2001 Mean FSA Score)*(Yr=2002)
(2001 Mean FSA Score)*(Yr>2002)
1999/2000, 2000/2001 and 2001/2002 cohort Fraser Institute (FI) scores and rankings released
June 2003
(1999-2001 Mean FI Score)*(Yr=2002);(2001 FI Score)*(Yr=2002)
(1999-2001 Mean FIScore)*(Yr>2002); (2001 FI Score)*(Yr>2002)
2002/2003 cohort school mean FSA exam results released on Ministry of Education website
Oct. 2003
(2002 Mean FSA Score)*(Yr=2003)
out of sample
2002/2003 cohort Fraser Institute scores and rankings released
June 2004
(2002 FI Score)*(Yr=2003) out of sample
Source: See text. Note: Calendar years in “News” and “Old news” variable names refer to the calendar year in which the school year began. For instance, “2001 FI Score” refers to the Fraser Institute score based on the FSA exam administered in the 2001/2002 school year. This measure was released in June 2003, and hence could first affect separations at the end of the 2002/2003 school year (Yr=2002).

89
Table 2.2. Sample Percentages and School Separation Rates
Sample Percent Separation Rate
All 100 8.9
Male 50.6 8.9
Non-English Home Language 32.4 10.1
English Home Language 67.6 8.3
English as a Second Language 30.7 10.1
Aboriginal 4.7 18.4
Disabled 3.6 13.6
Attends French Immersion 6.8 6.4
Source: Authors’ calculations based on B.C. Ministry of Education enrollment database.
Table 2.3. Frequency of Separations by Year of Kindergarten Entry
Kindergarten Entry Year
Never Separated Before Grade 5
Separated Once
Before Grade 5
Separated After…
Kinder- garten Grade 1 Grade 2 Grade 3 Grade 4
1995 0.610 0.292 0.151 0.120 0.107 0.094 0.091
1996 0.606 0.294 0.165 0.117 0.103 0.099 0.080
1997 0.618 0.292 0.147 0.111 0.096 0.090 0.097
1998 0.617 0.294 0.141 0.106 0.086 0.100 0.099
1999 0.605 0.305 0.138 0.098 0.109 0.103 0.103
Source: Authors’ calculations based on B.C. Ministry of Education enrollment database.

90
Table 2.4. Difference-in-Differences Estimates of the Effect of Information about School-level Achievement on Separation Probability
(1) (2) (3) (4) (5) (6) (7) Full Sample English Non-English
All English Non-
English Top
Quartile Bottom Quartile
Top Quartile
Bottom Quartile
Lagged Score -0.003 -0.003 -0.001 0.003 -0.009 -0.016 -0.019
(0.004) (0.004) (0.007) (0.007) (0.014) (0.035) (0.012)
Lagged Score*(Yr=2000) -0.007 -0.010** 0.003 0.000 -0.024* -0.010 0.021*
(0.004) (0.005) (0.008) (0.009) (0.014) (0.033) (0.013)
Number of Observations 26360 18599 7761 6207 3323 995 2709
Number of Schools 361 361 347 254 306 191 238
Source: Authors’ calculations based on B.C. Ministry of Education enrollment database and auxiliary data. Notes: “Lagged score” refers to the school-average 1998 PLAP reading score in 1999; and the school-average 1999/2000 FSA reading score in 2000. All scores are normalized to have mean zero and variance one over schools in each year. Additional control variables in these regressions are: main effects for student characteristics (non-English home language; Aboriginal; enrolled in ESL program; male; disabled; gifted; changed schools prior to Grade 4; enrolled in French Immersion, own FSA reading and numeracy scores, travel distance to school, and the numbers of public and private schools nearby), school proportions of student characteristics (non-English home language; Aboriginal; enrolled in ESL program; male; disabled; enrolled in French immersion) fully interacted with year dummy, school proportion excused from the FSA reading exam, Census characteristics for the student’s EA/DA of residence (mean and dispersion of household income; proportion visible minority; proportion one-parent families; unemployment rate; average dwelling value; proportion of dwellings owned; proportion moved last year and in last 5 years; proportion of household heads with less than grade 9 education, some high school, high school, and bachelor’s degree or higher; proportion immigrant), and fixed main effects for year and school. See Table 2.A3 in Appendix B for complete coefficient estimates for specifications in columns 1-3 and additional information. Complete coefficient estimates for all other specifications available from the authors on request. Robust standard errors in parentheses, clustered at the school-by-year level. ***indicates statistically significant at the 1% level, **indicates significant at the 5% level, *indicates significant at the 10% level.

91
Table 2.5. Control Function Estimates of Effect of Information about School-Level Achievement on Separation Probability
(1) (2) (3) Full Sample English Non-English
“News” Measures 1999 FSA Score*(Yr=2000) -0.009** -0.013*** 0.003
(0.005) (0.005) (0.007)
2000 FSA Score*(Yr=2001) -0.011* -0.011 -0.015
(0.006) (0.007) (0.010)
1999-2001 FI Score*(Yr=2002) -0.035*** -0.031*** -0.046***
(0.010) (0.011) (0.015)
2002 FI Score*(Yr=2003) 0.001 0.006 -0.011
(0.007) (0.009) (0.009)
“Old News” Measures 1999 FSA Score*(Yr>2000) -0.001 -0.003 0.006
(0.005) (0.006) (0.008)
2000 FSA Score*(Yr>2001) 0.009 0.006 0.016*
(0.007) (0.008) (0.009)
1999-2001 FI Score*(Yr>2002) -0.027*** -0.024** -0.032**
(0.010) (0.011) (0.016)
Current FSA Score -0.005 -0.002 -0.011*
(0.004) (0.004) (0.006)
Current FSA Score*(Yr>2001) 0.009* 0.003 0.020**
(0.005) (0.006) (0.009)
Number of Observations 65180 44077 21103
Number of Schools 361 361 360
Source: Authors’ calculations based on B.C. Ministry of Education enrollment database and auxiliary data. Notes: “FSA Score” refers to the school-average of FSA Reading and Numeracy scores. “FI Score” refers to the Fraser Institute school score. All scores are normalized to have mean zero and variance one over schools in each year. Additional control variables in these regressions are: main effects for student characteristics (as described in notes to Table 2.4), school proportions of student characteristics (as described in notes to Table 2.4) interacted with dummies for three information regimes (1999/2000, 2000/2001-2001/2002, 2002/2003-2003/2004), the school proportion excused from each FSA reading and numeracy exam interacted with the same “news” and “old news” year dummies as the corresponding test scores, Census characteristics for the student’s EA/DA of residence (as described in notes to Table 2.4), and fixed main effects for year and school. See Table 2.A4 in Appendix B for complete coefficient estimates for all three specifications. Robust standard errors in parentheses, clustered at the school-by-year level. ***indicates statistically significant at the 1% level, **indicates significant at the 5% level, *indicates significant at the 10% level.

92
Table 2.6. Effect of Information about School-level Achievement on Separation Probability, by Home Language and Quartile of Distribution of Neighborhood Income
(1) (2) (3)
All English Non-English
Top Bottom Top Bottom Top Bottom
Quartile Quartile Quartile Quartile Quartile Quartile
“News” Measures 1999 FSA Score*(Yr=2000) -0.003 -0.018** 0.001 -0.038*** -0.022 0.009
(0.009) (0.008) (0.010) (0.011) (0.023) (0.012)
2000 FSA Score*(Yr=2001) -0.000 -0.024** -0.002 -0.033** -0.008 -0.028
(0.010) (0.012) (0.011) (0.013) (0.026) (0.019)
1999-2001 FI Score*(Yr=2002) -0.002 -0.045*** 0.006 -0.078*** -0.046* -0.015
(0.010) (0.013) (0.010) (0.018) (0.027) (0.018)
2002 FI Score*(Yr=2003) 0.005 -0.031*** 0.001 -0.036* 0.022 -0.033**
(0.011) (0.012) (0.011) (0.018) (0.031) (0.014)
“Old News” Measures 1999 FSA Score*(Yr>2000) -0.008 0.002 -0.003 -0.006 -0.023 0.012
(0.009) (0.010) (0.010) (0.014) (0.023) (0.013)
2000 FSA Score*(Yr>2001) -0.008 0.012 -0.018 0.024 0.028 0.001
(0.011) (0.011) (0.013) (0.017) (0.027) (0.014)
1999-2001 FI Score*(Yr>2002) -0.016 -0.007 -0.001 -0.027 -0.078 0.019
(0.016) (0.016) (0.015) (0.023) (0.047) (0.020)
Current FSA Score -0.010 0.000 -0.004 0.001 -0.029 0.007
(0.007) (0.007) (0.008) (0.010) (0.019) (0.009)
Current FSA Score*(Yr>2001) 0.009 0.013 0.002 0.021 0.045* 0.002
(0.009) (0.009) (0.009) (0.013) (0.025) (0.013)
Number of Observations 17592 14928 14783 7705 2809 7223
Number of Schools 332 350 303 344 281 289
Source: Authors’ calculations based on B.C. Ministry of Education enrollment database and auxiliary data. Notes: For details of this specification refer to notes to Table 2.5. Complete estimates of all coefficients are available from the authors on request. Robust standard errors in parentheses, clustered at the school-by-year level. *** indicates statistically significant at the 1% level, ** indicates significant at the 5% level, * indicates significant at the 10% level.

93
2.10. Appendices
2.10.1. Appendix A: Identification via the Control Function Estimation
For illustrative purposes, consider a simplified version of equation (11):
(A1) istststtistist SXy 13 .
We have subsumed all observables, including the constant, fixed school and
year effects, and student characteristics, into . We have also omitted longer lags of
test scores for expositional clarity, and omitted the current test score, , to illustrate the
potential endogeneity problem. We assume observables are exogenous in the sense
that and are uncorrelated with st and ist .
Consider the projection of school-average test scores onto contemporaneous
observables:
(A2) stistst XS
where has mean zero and is orthogonal to by construction. It is helpful to
think of as a mean-zero “shock” that represents the effect of teachers and other time-
varying school-specific unobservables on test scores. Equation (A2) implies
111 stistst XS . Given exogeneity of , lagged test scores are therefore
endogenous in (A1) if and only if past shocks to achievement, , are correlated with
unobserved heterogeneity in separations ( st or ist ).
Suppose that shocks to achievement are correlated with unobserved time-
varying school-specific heterogeneity in separation probabilities. We represent this via
the projection:
(A3) ststst

94
where E st E stst 0 by construction. Suppose further that shocks to
achievement are persistent, as represented via the projection:
(A4) ststst 1
where 0 and .01 ststst EE It is easy to see that lagged test scores
are now endogenous in (A1), because .011 ststst VarE
Consider the “long” regression, analogous to (11), which includes current test
scores as a control:
(A5) istststtistist SSXy 413
where is the compound statistical error that arises when (A1) is the DGP.
Proposition:
Under the identifying assumption 0,|,| 11 stististststiststst SXESXE , the least
squares estimate of in the long regression (A5) is unbiased.51 In words, our
identifying assumption is that conditional on observables and current test scores,
unobserved time-varying school-specific factors that influenced previous cohorts’
achievement are only correlated with current-year unmeasured heterogeneity in
separations via their persistent effect on achievement.
Proof: Substituting (A3) into (A1), we can write the DGP as:
(A6) iststststtistist SXy 13 .
51 For equation (11), where the model also includes longer lags of test scores, a more complete
statement of our identifying assumption is E st jst | X ist ,Sst E st j ist | X ist ,Sst 0
for each included lag of test scores Sst j X ist j st j .

95
The least squares estimate of α3 from the long regression (A5) satisfies:
stististststiststststiststst SXSEVSXSEVSXSEVE ,|,|,|ˆ 11
11
11
33
where stistst SXSVarV ,|1 . stiststst SXSE ,|1 is the covariance between
and residuals from the regression of on and . These residuals are zero
from the definition of in (A2), and hence 0,|1 stiststst SXSE also. Similarly,
0,|,|,| 1111 stiststststistststiststiststst SXESXXESXSE
where the second equality follows from exogeneity of 1istX , and the final
equality is our identifying assumption. An identical argument gives,
0,|,|,| 1111 stististststististstiststististst SXESXXESXSE
and hence .ˆ 33 E
The intuition underlying this result is straightforward. Since is exogenous,
only the “shock” component of lagged test scores, 1st , is potentially endogenous.
Equation (A2) implies that is a valid control function for . Thus the only potential
source of endogeneity in the long regression is conditional covariation between 1st and
unobserved heterogeneity that is orthogonal to current test scores, i.e., st and the
component of ist that is orthogonal to . Our identifying assumption rules this out.
Our identifying assumption would be violated under the following conditions.
First, E st1st | Xist, Sst 0 if there are time-varying unobserved school-specific factors
(including school-level policy and teacher quality) that are correlated with lagged test
scores and current separations, but uncorrelated with current test scores (and ).
Similarly, E st1ist | Xist, Sst 0 if there are unobserved student characteristics that are
correlated with lagged test scores and current separations, but uncorrelated with current
test scores (and ). It is difficult to construct realistic examples where these conditions

96
would arise. We nevertheless implement several falsification tests (see the Results
section and Appendix B) to assess the validity of our identifying assumption, and find no
systematic evidence to the contrary.

97
2.10.2. Appendix B: Additional Tables
Table 2.A1. Sample Means of Control Variables
(1) (2)
Sample Mean or
Proportion Sample Standard
Deviation Individual Characteristics Male 0.506 0.500 Aboriginal 0.047 0.211 Non-English Home Language 0.324 0.468 Disabled 0.036 0.187 Gifted 0.017 0.128 Enrolled in ESL Program 0.307 0.461 Changed Schools Prior to Grade 4 0.348 0.476 Own FSA Reading Score 0.050 0.964 Own FSA Numeracy Score 0.062 0.983 School Characteristics Proportion Excused from FSA Reading 0.084 0.069 Proportion Excused from FSA Numeracy 0.086 0.070 Proportion Male 0.514 0.074 Proportion Aboriginal 0.038 0.048 Proportion Non-English Home Language 0.323 0.266 Proportion Disabled 0.060 0.045 Proportion Enrolled in ESL Program 0.250 0.245 Proportion Enrolled in French Immersion 0.062 0.168 Cost of Changing Schools Enrolled in French Immersion 0.068 0.251 Number of Public Schools Nearby 2.60 1.42 Number of Private Schools Nearby 8.64 6.05 Travel Distance to School (km) 1.19 2.20 Census Characteristics Mean Household Income / $1000 64.9 25.5 Proportion Visible Minority 0.329 0.257 Proportion One-Parent Families 0.146 0.088 Proportion of those Aged 25+ Unemployed 0.065 0.052 Average Value of Dwelling / $1000 292 133 Proportion Dwellings Owned 0.717 0.211 Proportion Moved Last Year 0.159 0.090 Proportion Moved in Last 5 Years 0.484 0.160 Proportion Less than Grade 9 Education 0.072 0.065 Proportion Some High School 0.185 0.082 Proportion with High School Diploma 0.131 0.051 Proportion with BA or higher 0.175 0.117 Proportion Immigrant 0.337 0.168
Source: Authors’ calculations based on B.C. Ministry of Education enrollment database and auxiliary data. Notes: “Nearby” is defined as a circle with radius equal to the 75th percentile of travel distance to school.

98
Table 2.A2. Distribution of School Achievement Measures
Correlation School-Average FSA Score Fraser Institute Score
Mean Std. Dev
1999 / 2000
2000 / 2001
2001 / 2002
2002 / 2003
3 Year Avg.
2001 / 2002
2002 / 2003
Public Schools
1999/2000 FSA 0 1 1
2000/2001 FSA 0 1 0.708 1
2001/2002 FSA 0 1 0.637 0.672 1
2002/2003 FSA 0 1 0.563 0.619 0.665 1
3 Year Avg. FI 0 1 0.790 0.808 0.784 0.669 1
2001/2002 FI 0 1 0.616 0.639 0.813 0.619 0.886 1
2002/2003 FI 0 1 0.667 0.632 0.661 0.801 0.782 0.713 1
Source: Authors’ calculations based on B.C. Ministry of Education enrollment database and auxiliary data. Notes: “FSA” refers to the school-average of FSA reading and numeracy scores. “FI Score” refers to the Fraser Institute school score. All scores are normalized to have mean zero and variance one over schools in each year.

99
Table 2.A3. Complete Coefficient Estimates, Difference-in-Differences Estimator
(1) Full Sample (2) English (3) Non-English Lagged Score -0.003 -0.003 -0.001 (0.004) (0.004) (0.007) Lagged Score*(Yr=2000) -0.007 -0.010** 0.003 (0.004) (0.005) (0.008) Yr = 2000 -0.047* -0.073** 0.033 (0.024) (0.028) (0.050) Proportion Disabled 0.015 0.059 -0.093 (0.060) (0.079) (0.102) Proportion Non-English Home Language 0.017 0.062 -0.107 (0.045) (0.061) (0.070) Proportion Aboriginal -0.133 -0.077 -0.330** (0.087) (0.106) (0.130) Proportion Enrolled in ESL Program -0.002 0.042 -0.027 (0.056) (0.076) (0.077) Proportion Male -0.046 -0.127*** 0.165*** (0.033) (0.041) (0.062) Proportion Enrolled in French Immersion -0.165** -0.122 -0.356** (0.072) (0.080) (0.154) Proportion Disabled*(Yr≥2000) -0.029 0.097 -0.291*** (0.079) (0.108) (0.110) Proportion Non-English*(Yr≥2000) 0.071** 0.092** 0.028 (0.034) (0.043) (0.061) Proportion Aboriginal*(Yr≥2000) 0.022 0.016 0.088 (0.073) (0.084) (0.126) Proportion Enrolled in ESL Program*(Yr≥2000) -0.052 -0.057 -0.025 (0.037) (0.053) (0.058) Proportion Male*(Yr≥2000) 0.060 0.096* -0.047 (0.045) (0.053) (0.090) Proportion French Immersion*(Yr≥2000) 0.027* 0.026 0.076** (0.015) (0.018) (0.036) Proportion Excused from FSA -0.040 -0.113** 0.005 (0.037) (0.053) (0.046) Non-English Home Language 0.011 0.000 0.000 (0.008) (0.000) (0.000) Aboriginal 0.074*** 0.073*** 0.055 (0.010) (0.010) (0.049) Enrolled in ESL Program -0.019** -0.041*** -0.003 (0.009) (0.013) (0.011) Male -0.002 -0.003 -0.004 (0.004) (0.004) (0.007) Disabled 0.025** 0.021* 0.032 (0.011) (0.012) (0.022) Gifted 0.000 0.004 0.002 (0.011) (0.013) (0.023) Changed Schools Prior to Grade 4 0.064*** 0.072*** 0.041***

100
(0.004) (0.005) (0.007) Own FSA Reading Score -0.005* -0.006* -0.005 (0.003) (0.003) (0.005) Own FSA Numeracy Score -0.006** -0.007** -0.002 (0.002) (0.003) (0.005) Mean Household Income / $1000 -0.000* -0.000 -0.001 (0.000) (0.000) (0.001) SE of Mean Household Income / $1000 0.001 0.000 -0.001 (0.001) (0.001) (0.002) Proportion Visible Minority 0.001 0.006 0.011 (0.030) (0.038) (0.052) Proportion One-Parent Families 0.014 -0.017 0.071 (0.034) (0.042) (0.059) Proportion of those Aged 25+ Unemployed 0.015 0.042 0.001 (0.054) (0.069) (0.087) Average Value of Dwelling / $1000 0.000 0.000 0.000 (0.000) (0.000) (0.000) Proportion of Dwellings Owned -0.016 -0.031 0.012 (0.017) (0.021) (0.031) Proportion Moved Last Year 0.047 0.054 0.008 (0.030) (0.040) (0.052) Proportion Moved in Last 5 Years 0.001 0.018 -0.032 (0.021) (0.024) (0.044) Proportion Less than Grade 9 Education 0.048 0.062 -0.029 (0.069) (0.093) (0.109) Proportion Some High School 0.013 0.028 -0.066 (0.044) (0.057) (0.079) Proportion with High School Diploma -0.010 0.030 -0.135 (0.051) (0.062) (0.093) Proportion with Bachelor’s or Higher 0.172*** 0.199*** 0.142 (0.046) (0.056) (0.088) Proportion Immigrant -0.009 -0.027 -0.002 (0.041) (0.049) (0.082) Travel Distance to School (km) 0.005*** 0.005*** 0.003 (0.001) (0.001) (0.002) Enrolled in French Immersion -0.019* -0.016 -0.033 (0.010) (0.011) (0.035) Number of Public Schools Nearby -0.002 -0.004 0.002 (0.002) (0.002) (0.003) Number of Private Schools Nearby 0.001 0.001 -0.001 (0.001) (0.002) (0.002) Constant 0.078** 0.084* 0.138* (0.037) (0.044) (0.078)
Notes: This table reports all coefficient estimates for the specifications reported in columns 1-3 of Table 2.4. Robust standard errors in parentheses, clustered at the school-by-year level. ***indicates statistically significant at the 1% level, **indicates significant at the 5% level, *indicates significant at the 10% level.

101
Table 2.A4. Complete Coefficient Estimates, Control Function Estimator
(1) (2) (3)
Full Sample English Non-English
1999 FSA Score*(Yr=2000) -0.009** -0.013*** 0.003 (0.005) (0.005) (0.007) 2000 FSA Score*(Yr=2001) -0.011* -0.011 -0.015 (0.006) (0.007) (0.010) 1999-2001 FI Score*(Yr=2002) -0.035*** -0.031*** -0.046*** (0.010) (0.011) (0.015) 2002 FI Score*(Yr=2003) 0.001 0.006 -0.011 (0.007) (0.009) (0.009) 1999 FSA Score*(Yr>2000) -0.001 -0.003 0.006 (0.005) (0.006) (0.008) 2000 FSA Score*(Yr>2001) 0.009 0.006 0.016* (0.007) (0.008) (0.009) 1999-2001 FI Score*(Yr>2002) -0.027*** -0.024** -0.032** (0.010) (0.011) (0.016) Current FSA Score -0.005 -0.002 -0.011* (0.004) (0.004) (0.006) Current FSA Score*(Yr>2001) 0.009* 0.003 0.020** (0.005) (0.006) (0.009) Proportion Male -0.047 -0.083** 0.048 (0.030) (0.035) (0.051) Proportion Disabled 0.044 0.113 -0.079 (0.064) (0.069) (0.098) Proportion Non-English Home Language -0.039 0.026 -0.122** (0.041) (0.047) (0.056) Proportion Aboriginal -0.100 -0.067 -0.172 (0.070) (0.088) (0.109) Proportion Enrolled in ESL Program 0.016 0.030 0.016 (0.043) (0.053) (0.053) Proportion Enrolled in French Immersion 0.014 0.009 0.066 (0.040) (0.042) (0.107) Proportion Disabled*(Yr ≥2000) 0.048 -0.001 0.110 (0.079) (0.097) (0.111) Proportion Non-English*(Yr≥2000) 0.038 -0.037 0.125** (0.038) (0.047) (0.053) Proportion Aboriginal*(Yr≥2000) 0.022 -0.026 0.071 (0.086) (0.106) (0.125) Proportion Enrolled in ESL Program*(Yr≥2000) -0.044 0.017 -0.113** (0.040) (0.049) (0.054) Proportion Male*(Yr≥2000) 0.061 0.106** -0.037 (0.042) (0.050) (0.075) Proportion French Immersion*(Yr≥2000) 0.017 0.025 -0.015 (0.019) (0.022) (0.037) Proportion Disabled*(Yr≥2002) -0.043 0.051 -0.199
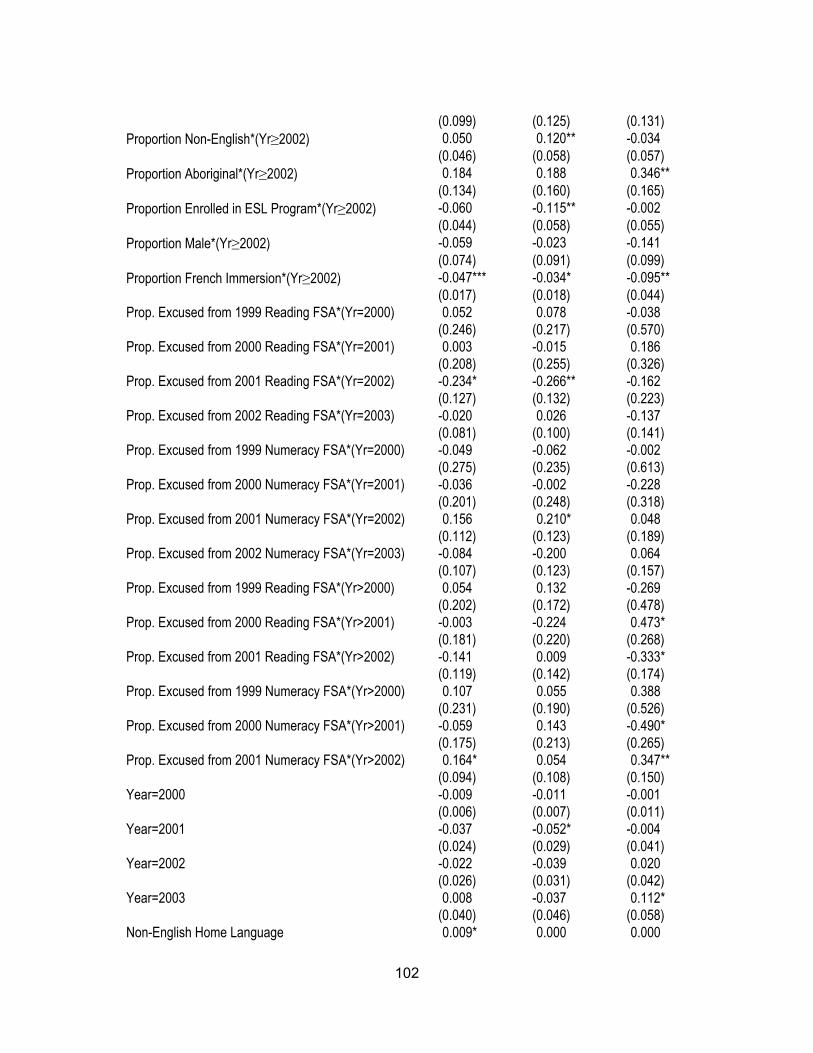
102
(0.099) (0.125) (0.131) Proportion Non-English*(Yr≥2002) 0.050 0.120** -0.034 (0.046) (0.058) (0.057) Proportion Aboriginal*(Yr≥2002) 0.184 0.188 0.346** (0.134) (0.160) (0.165) Proportion Enrolled in ESL Program*(Yr≥2002) -0.060 -0.115** -0.002 (0.044) (0.058) (0.055) Proportion Male*(Yr≥2002) -0.059 -0.023 -0.141 (0.074) (0.091) (0.099) Proportion French Immersion*(Yr≥2002) -0.047*** -0.034* -0.095** (0.017) (0.018) (0.044) Prop. Excused from 1999 Reading FSA*(Yr=2000) 0.052 0.078 -0.038 (0.246) (0.217) (0.570) Prop. Excused from 2000 Reading FSA*(Yr=2001) 0.003 -0.015 0.186 (0.208) (0.255) (0.326) Prop. Excused from 2001 Reading FSA*(Yr=2002) -0.234* -0.266** -0.162 (0.127) (0.132) (0.223) Prop. Excused from 2002 Reading FSA*(Yr=2003) -0.020 0.026 -0.137 (0.081) (0.100) (0.141) Prop. Excused from 1999 Numeracy FSA*(Yr=2000) -0.049 -0.062 -0.002 (0.275) (0.235) (0.613) Prop. Excused from 2000 Numeracy FSA*(Yr=2001) -0.036 -0.002 -0.228 (0.201) (0.248) (0.318) Prop. Excused from 2001 Numeracy FSA*(Yr=2002) 0.156 0.210* 0.048 (0.112) (0.123) (0.189) Prop. Excused from 2002 Numeracy FSA*(Yr=2003) -0.084 -0.200 0.064 (0.107) (0.123) (0.157) Prop. Excused from 1999 Reading FSA*(Yr>2000) 0.054 0.132 -0.269 (0.202) (0.172) (0.478) Prop. Excused from 2000 Reading FSA*(Yr>2001) -0.003 -0.224 0.473* (0.181) (0.220) (0.268) Prop. Excused from 2001 Reading FSA*(Yr>2002) -0.141 0.009 -0.333* (0.119) (0.142) (0.174) Prop. Excused from 1999 Numeracy FSA*(Yr>2000) 0.107 0.055 0.388 (0.231) (0.190) (0.526) Prop. Excused from 2000 Numeracy FSA*(Yr>2001) -0.059 0.143 -0.490* (0.175) (0.213) (0.265) Prop. Excused from 2001 Numeracy FSA*(Yr>2002) 0.164* 0.054 0.347** (0.094) (0.108) (0.150) Year=2000 -0.009 -0.011 -0.001 (0.006) (0.007) (0.011) Year=2001 -0.037 -0.052* -0.004 (0.024) (0.029) (0.041) Year=2002 -0.022 -0.039 0.020 (0.026) (0.031) (0.042) Year=2003 0.008 -0.037 0.112* (0.040) (0.046) (0.058) Non-English Home Language 0.009* 0.000 0.000

103
(0.005) (0.000) (0.000) Aboriginal 0.069*** 0.066*** 0.077** (0.007) (0.008) (0.037) Enrolled in ESL Program -0.013** -0.034*** 0.005 (0.005) (0.008) (0.007) Male -0.001 -0.002 -0.002 (0.002) (0.003) (0.004) Disabled 0.025*** 0.025*** 0.010 (0.007) (0.008) (0.015) Gifted 0.005 0.008 -0.002 (0.008) (0.009) (0.017) Changed Schools Prior to Grade 4 0.060*** 0.066*** 0.046*** (0.003) (0.004) (0.005) Own FSA Reading Score -0.004** -0.005** -0.002 (0.002) (0.002) (0.003) Own FSA Numeracy Score -0.006*** -0.009*** -0.003 (0.002) (0.002) (0.003) Mean Household Income / $1000 -0.000* -0.000* -0.000 (0.000) (0.000) (0.000) SE of Mean Household Income / $1000 0.000 0.001 -0.000 (0.000) (0.000) (0.001) Proportion Visible Minority 0.032* 0.034 0.036 (0.016) (0.021) (0.027) Proportion One-Parent Families 0.002 0.009 -0.015 (0.018) (0.021) (0.032) Proportion of those Aged 25+ Unemployed -0.000 -0.026 0.051 (0.032) (0.039) (0.051) Average Value of Dwelling 0.000 0.000 0.000 (0.000) (0.000) (0.000) Proportion of Dwellings Owned -0.013 -0.010 -0.021 (0.010) (0.013) (0.018) Proportion Moved Last Year 0.039** 0.033 0.037 (0.020) (0.025) (0.033) Proportion Moved in Last 5 Years -0.005 0.002 -0.017 (0.012) (0.013) (0.023) Proportion Less than Grade 9 Education 0.013 0.038 -0.013 (0.036) (0.046) (0.056) Proportion Some High School 0.044* 0.048 0.005 (0.026) (0.031) (0.043) Proportion with High School Diploma 0.010 0.023 -0.028 (0.027) (0.032) (0.051) Proportion with Bachelor’s or Higher 0.062*** 0.059** 0.068 (0.023) (0.027) (0.041) Proportion Immigrant -0.025 -0.029 -0.029 (0.022) (0.027) (0.039) Travel Distance to School (km) 0.005*** 0.005*** 0.003** (0.001) (0.001) (0.001) Enrolled in French Immersion -0.014 -0.006 -0.038**

104
(0.009) (0.010) (0.018) Number of Public Schools Nearby -0.000 -0.000 0.000 (0.001) (0.001) (0.002) Number of Private Schools Nearby -0.001 -0.001 -0.002 (0.001) (0.001) (0.001) Constant 0.088*** 0.070** 0.130** (0.025) (0.028) (0.054)
Source: Authors’ calculations based on B.C. Ministry of Education enrollment database and auxiliary data. Notes: This table reports all coefficient estimates for the specifications reported in Table 2.5 in the main text. Robust standard errors in parentheses, clustered at the school-by-year level. ***indicates statistically significant at the 1% level, **indicates significant at the 5% level, *indicates significant at the 10% level.

105
Table 2.A5. Robustness Checks for Control Function Estimator
(1) (2) (3) (4) (5)
English only
Fraser Institute Rankings
All
Without Aboriginals
Without Fr.Imm.
English Non-
English
1999 FSA Score*(Yr=2000) -0.013*** -0.011** -0.014*** -0.013** 0.003 (0.005) (0.005) (0.005) (0.005) (0.007) 2000 FSA Score*(Yr =2001) -0.011 -0.008 -0.010 -0.010 -0.015 (0.007) (0.008) (0.008) (0.007) (0.010) 1999-2001 Mean FI Score*(Yr =2002) -0.031*** -0.030*** -0.027*** (0.011) (0.011) (0.010) 2002 FI Score*(Yr=2003) 0.006 0.008 0.007 (0.009) (0.009) (0.009) 1999-2001 Mean FI Ranking*(Yr =2002) 0.027** 0.048*** (0.012) (0.015) 2002 FI Ranking*(Yr =2003) -0.005 0.010 (0.007) (0.008) 1999 FSA Score*(Yr >2000) -0.003 -0.006 -0.005 -0.005 0.006 (0.006) (0.006) (0.006) (0.006) (0.008) 2000 FSA Score*(Yr >2001) 0.006 0.010 0.007 0.005 0.018* (0.008) (0.008) (0.008) (0.008) (0.010) 1999-2001 Mean FI Score*(Yr>2002) -0.024** -0.026** -0.022* (0.011) (0.011) (0.011) 1999-2001 Mean FI Rank*(Yr >2002) 0.018* 0.033** (0.010) (0.015) Current Mean FSA Score -0.002 -0.004 -0.003 -0.001 -0.011* (0.004) (0.005) (0.005) (0.004) (0.006) Current Mean FSA Score*(Yr>2001) 0.003 0.002 0.002 0.001 0.020** (0.006) (0.006) (0.006) (0.006) (0.008) Number of Observations 44077 41149 40182 44077 21103 Number of Schools 361 361 357 361 360
Source: Authors’ calculations based on B.C. Ministry of Education enrollment database and auxiliary data. Notes: Column (1) reproduces estimates from column (2) of Table 2.5 in the main text. Column (2) excludes Aboriginal students and column (3) excludes French Immersion students. Columns (4) and (5) replace the school’s Fraser Institute score with the school’s rank based on the Fraser Institute score. “FSA Score” refers to the school-average of FSA reading and numeracy scores. “FI Score” is the Fraser Institute school score, and “FI Rank” is the school’s published Fraser Institute ranking based on FI Scores. Note that larger values of FSA Score and FI Score indicate better performance, whereas larger values of FI Rank indicate worse performance. See notes to Table 2.5 in the main text for additional control variables. Robust standard errors in parentheses, clustered at the school-by-year level. *** indicates statistically significant at the 1% level, ** indicates significant at the 5% level, * indicates significant at the 10% level.

106
Table 2.A6. Falsification Test 1 for Control Function Estimator
(1) (2) (3)
Full Sample English Non-English
False “News” Measures 2000 FSA Score*(Yr=2000) -0.005 -0.010* 0.008 (0.005) (0.006) (0.007) 2001 FSA Score*(Yr=2001) -0.009 -0.009 -0.011 (0.008) (0.008) (0.010) 2002 FSA Score*(Yr=2002) -0.011 -0.012 -0.005 (0.007) (0.008) (0.011) 2003 FSA Score*(Yr=2003) -0.012 -0.015* -0.001 (0.007) (0.008) (0.012) False “Old News” Measures 2000 FSA Score*(Yr>2000) -0.001 -0.004 0.005 (0.006) (0.007) (0.008) 2001 FSA Score*(Yr>2001) -0.001 -0.003 -0.001 (0.005) (0.006) (0.006) 2002 FSA Score*(Yr>2002) 0.005 0.009 -0.002 (0.008) (0.009) (0.008) Current Mean FSA Score 0.007 0.010* 0.000 (0.005) (0.006) (0.009) Number of Observations 65180 44077 21103 Number of Schools 361 361 360
Source: Authors’ calculations based on B.C. Ministry of Education enrollment database and auxiliary data. Notes: These estimates replicate the specifications reported in Table 2.5, except that all genuine “news” measures (based on lagged test scores that parents could observe) have been replaced with false “news” measures based on contemporaneous test scores (which parents could not observe until the following school year). All genuine “old news” measures have also been replaced with corresponding false measures. The interaction between the current mean FSA score and Year>2001 was dropped because of collinearity with the false news measures. Given the high degree of inter-temporal correlation between school-average test scores (see Table 2.A2 in this Appendix), it is not surprising that some estimates in column (2) are weakly statistically significant. On the whole, however, there is little evidence of a systematic relationship between false “news” and separations; and the overall pattern of results differs substantially from those reported in Table 2.5. See notes to Table 2.5 for details of specification. Complete coefficient estimates for these specifications are available from the authors on request. Robust standard errors in parentheses, clustered at the school-by-year level. ***indicates statistically significant at the 1% level, **indicates significant at the 5% level, *indicates significant at the 10% level.

107
Table 2.A7. Falsification Test 2 for Control Function Estimator
(1) (2) (3)
Full Sample English Non-English
False “News” Measures 2001 FSA Score*(Yr=2000) -0.007 -0.010* 0.003
(0.004) (0.005) (0.006)
2002 FSA Score*(Yr=2001) -0.004 -0.007 0.004
(0.005) (0.006) (0.007)
2003 FSA Score*(Yr=2002) -0.010* -0.014** -0.003
(0.006) (0.007) (0.009)
False “Old News” Measures 2001 FSA Score*(Yr>2000) -0.008 -0.010 -0.006
(0.005) (0.007) (0.007)
2002 FSA Score*(Yr>2001) 0.002 -0.001 0.009
(0.005) (0.007) (0.008)
Current Mean FSA Score 0.003 0.006 -0.002
(0.003) (0.004) (0.005)
Number of Observations 52381 35900 16481
Number of Schools 361 361 360
Source: Authors’ calculations based on B.C. Ministry of Education enrollment database and auxiliary data. Notes: These estimates replicate the specifications reported in Table 2.5, except that all genuine “news” measures (based on lagged test scores that parents could observe) have been replaced with false “news” measures based on future test scores (which parents could not observe). All genuine “old news” measures have also been replaced with corresponding false measures. The interaction between the current mean FSA score and Year>2001 was dropped because of collinearity with the false news measures. Because of the structure of false news measures, and because we have no 2004 FSA scores, this specification was estimated for 1999/2000-2002/2003 only. Given the high degree of inter-temporal correlation between school-average test scores (see Table 2.A2 in this Appendix), it is not surprising that some reported estimates are statistically significant. On the whole, however, there is little evidence of a systematic relationship between false “news” and separations; and the overall pattern of results differs substantially from those reported in Table 2.5. See notes to Table 2.5 for details of specification. Complete coefficient estimates for these specifications are available from the authors on request. Robust standard errors in parentheses, clustered at the school-by-year level. ***indicates statistically significant at the 1% level, **indicates significant at the 5% level, *indicates significant at the 10% level.

108
2.10.3. Appendix C: Data Appendix
2.10.3.1. Control Variables
Controls for individual characteristics include an indicator of whether the student
separated from their school in an earlier school year, and indicators for gender,
Aboriginal identity, language spoken at home (any language besides English), disability,
giftedness, ESL status, and the student’s own FSA exam score. We also control for a
set of socioeconomic characteristics of the Census Enumeration or Dissemination Area
(EA or DA, respectively) in which the student resides as proxies for unobserved student
background characteristics. Specifically, we control for the proportion of household
heads in the EA/DA who immigrated to Canada in the previous five years; whose
education level was less than grade 9, without a high school diploma, with a high school
diploma, and with a bachelor’s degree or higher (the omitted category is those with more
than high school but less than a bachelor’s degree); who are visible minority; who are
single parents; who moved into the EA or DA in the last year or in the last five years; and
the unemployment rate among those over age 25, the average dwelling value, average
household income, and the fraction who own their dwelling. Details of the construction of
these variables are provided below.
Controls for school characteristics include the proportion of grade 4 students who
are Aboriginal, speak a language other than English at home, are male, are disabled,
are in an ESL program, were excused from the reading or numeracy test, or are enrolled
in French Immersion. Finally, we include several proxies for students’ cost of changing
schools: their travel distance to school, the number of public and private schools within
the 75th percentile of the distribution of student travel distance to school, and an indicator
for attending a French Immersion program (because this program is offered in a limited
set of schools). French Immersion programs, which are the most popular form of
magnet programs in the Lower Mainland, provide French-only instruction to non-
francophone students.
2.10.3.2. Coding of Neighborhood Characteristics
Neighborhood characteristics are based on public-use aggregates of the Census
of Population “long form,” administered by Statistics Canada to one in five households in
1996 and 2001. The lowest level of geography for which Statistics Canada produced

109
aggregate statistics based on the 1996 Census is an Enumeration Area (EA). Statistics
based on the 2001 Census were produced at the Dissemination Area (DA) level. EAs
are geographic areas designated for the collection of Census data. Prior to the 2001
Census, EAs were used for both Census data collection and dissemination. In the 2001
Census, they were replaced by DAs for dissemination purposes. In the 1996 Census,
EAs were composed of one or more neighboring blocks containing between 125 and
440 dwellings (in rural and urban areas, respectively). In the 2001 Census, DAs were
composed of one or more neighboring blocks with a population of 400 to 700 persons.
These definitions are sufficiently similar for our purposes.
EA/DA-level Census characteristics were integrated with our enrollment data via
students’ residential postal code in each year. The integrated EA/DA characteristics are
based on the most recently administered Census for each year of our sample. We link
postal codes and EAs/DAs using Statistics Canada’s Postal Code Conversion File
(PCCF). The PCCF contains a complete longitudinal correspondence between postal
codes and EAs/DAs (postal codes are occasionally retired and subsequently recycled).
Postal codes are smaller than EAs/DAs and usually lie entirely within an EA/DA. In
cases where postal code boundaries span multiple EAs/DAs, we use the PCCF’s Single
Link Indicator (which identifies the best link to an EA/DA) to link to a unique EA/DA.
In a small number of cases, we were unable to assign EA/DA-level
characteristics to residential postal codes. This arose when residential postal codes did
not appear in the PCCF (most likely due to mis-reported postal codes), or when EA/DA-
level characteristics were suppressed by Statistics Canada for confidentiality reasons.
Overall, these cases comprised about 1 percent of grade 4 students in the enrollment
database.
2.10.3.3. Coding of Distance and School Density Measures
Our measures of the distance between students’ residence and the school they
attended are based on reported postal codes. We obtained postal codes for all schools
attended by grade 4 students who met our other sample restrictions from public sources
(most notably, school and district websites). We used the PCCF to assign a latitude and
longitude to each postal code in each year, and calculated the great circle distance (in
km) between the student’s residence and schools. For each residential postal code in

110
each year, we then calculated the number of active public and private schools within a
circle centered on the residential postal code and with radius equal to the 75th percentile
of in-sample travel distance to public and private schools, respectively.
2.10.3.4. Coding of Other Key Variables
In all regressions, the reference category for home language is students who
always report speaking English at home. Students are coded as speaking a non-English
language at home if they report speaking a language other than English at home in any
year between kindergarten and grade 5. Similarly, students are coded as Aboriginal,
disabled, or gifted if they ever report that status. Students are coded as ESL if they are
designated as such in the current school year. Annual school-by-grade averages of
these variables were computed by aggregating the student-level data.
2.10.3.5. Missing Data and Other Sample Restrictions
As reported in the main text, we restrict our analysis sample to students who
entered kindergarten at a Lower Mainland school between 1995/1996 and 1999/2000,
subsequently made regular progress through grade 5 at Lower Mainland schools, and
were enrolled in grade 4 at a public school between 1999/2000 and 2003/2004. By
regular progress, we mean students advanced through each grade level with their entry
cohort, and were observed attending a school in BC in each year from kindergarten
through grade 5. We excluded 6,681 observations where a student did not progress
through the grades along with her cohort, and we excluded 64 observations where the
measured distance between the student’s residence and the school they attended
exceeded 50km (since it is likely that this distance indicates measurement error in the
postal code). Our sample comprises 106,344 Grade 4 students after applying these
sample restrictions. Of these, 41,164 additional observations were excluded because of
missing data. The most commonly missing data items, including those described
elsewhere in this Appendix, were:
• the Fraser Institute school score/ranking, because the Fraser Institute only generated scores for schools with at least 15 students enrolled in both grade 4 and grade 7, and because two public school districts (Coquitlam and Chilliwack) were excluded from the 2003 report card (the three-year average Fraser Institute score is missing for 22,277 observations, the Fraser Institute

111
score based on the 2001/2002 exam is missing for 19,529 observations, and the score based on the 2002/2003 exam is missing for 4,313 observations);
• neighborhood characteristics, as described above (876 observations); and
• students’ own FSA exam result (6,849 observations were missing either a reading or numeracy score).

112
3. Noise or News? Learning About the Content of Test-Based School Achievement Measures
3.1. Introduction
Proponents of school choice argue that the structure of the public educational
system – where education is mainly provided by government with substantial monopoly
power and largely no competition – leaves educational consumers with limited choice
among schools. They further suggest that this may result in a disconnect between
school quality and parents’ preferences. There is a growing literature in economics that
suggests that expanding school choice could improve educational outcomes by
increasing disadvantaged children’s access to high quality schools, and by causing
underperforming schools to become more effective or to shrink as families “vote with
their feet” (Friedman 1955; Becker 1995; Hoxby 2003; Belfield and Levin 2003). 1 These
ideas have gained strong currency in education policy circles, leading to policy
innovations such as open enrollment systems, magnet and charter schools, private
school vouchers, and expanded public school choice for students in poorly performing
schools.
One suggested approach to make these policies more effective is to increase
parents’ access to information about school quality and performance. A growing body of
evidence suggests that information about school-level achievement affects behavior in
ways that may have real consequences for educational outcomes (Hastings et al. 2007;
Hastings and Weinstein 2008). For example, Friesen, Javdani, Smith and Woodcock
(2012) find that the public release of information about school-level achievement had a
substantial effect on the inter-school mobility of Grade 4 public school students.
1 However, it should be also mentioned that there are some concerns regarding these kinds of policies. For instance, some people argue that issues of equity will be passed over in the push for school choice, causing at-risk students to fall further behind.

113
However it remains an open question whether measures of school-level achievement
actually provide parents with meaningful information about school quality, or whether
they are too imprecise to do so.
A growing body of literature (Kane and Staiger 2002; Mizala, Romaguera and
Urquiola 2007), suggests that there are two sources of transitory variation in school
average test scores. The first is sampling variation which is purely a statistical
phenomenon. It is the variation in a school’s test score arising from random year-to-year
variation in the composition of its student body. In this context, we can think of different
cohorts of students entering a school over time as random draws from a local population
feeding that school. The magnitude of sampling variation depends on school size: it is
decreasing in the number of students who write the test. The second source of
transitory variation is idiosyncratic factors that generate non-persistent differences in
schools’ mean test scores; for example a school-wide illness at the time of the exam,
existence of a few disruptive students in a class, special chemistry between a teacher
and a cohort of students, inclement weather, etc. Throughout the paper, I refer to this
second source of transitory variance as “other transitory factors” to distinguish it from
sampling variation.
It is well-understood that mobility decisions are costly. Cullen et al. (2000) find
little evidence that students systematically achieve higher school quality (measured by
value-added of schools to student outcomes) by choosing a non-neighborhood school.
Hanushek et al. (1999) find that family-initiated moves with district changes, which are
largely the consequence of parents changing district in pursuit of a higher quality school,
reduce achievement growth. They also find that mobility generates negative
externalities for students who attend schools with high turnover rates. Together, these
results suggest that basing school choice decisions on highly transitory information
about school-average achievement might make many students worse off.
A related literature shows that information about school-average achievement
affects real estate prices (Figlio and Lucas 2004; Fiva and Kirkebøen 2008; and others).
Again, if test-based measures of school-average achievement are highly transitory, then
making costly location decisions to obtain access to (currently) high-achieving schools

114
could generate a lot of costly churning in the real estate market, making families worse
off.
I investigate the content of published information about schools’ average test
scores to determine whether they provide parents with meaningful information about
persistent or permanent inter-school differences in achievement and school quality. I
extend the work of Kane and Staiger (2002) with a more rigorous statistical model that
shows how one can separately measure the effect of sampling variation and other
transitory factors on the cross-sectional variance of school mean test scores. I find that
sampling variation and one-time mean reverting shocks are a significant source of
observed variation in schools’ average test scores.
3.2. Previous Literature
Not much is known about the statistical properties of school-level measures of
test-based achievement. Kane and Staiger (2001) find that test-based elementary
school rankings in North Carolina resemble a lottery, and argue that small within-school
sample size is the main cause. They decompose the variance of school-level test
scores and find that gain scores tend to have less signal variation and more variation
due to non-persistent factors than test score levels. Therefore, they caution against the
use of gain scores in evaluating schools’ or teachers’ performance. They also find little
evidence that schools with significant improvement in their test scores over time
improved on any measures of student engagement. In their 2002 study, Kane and
Staiger estimate that 14 to 15 percent of the variation in 4th grade math and reading test
scores for an average school in their sample is due to sampling variation. They also find
that 50 to 80 percent of the variance in the change in 4th grade mean test scores is due
to nonpersistent factors.
Mizala, Romaguera and Urquiola (2007) find evidence that test-based rankings
mostly reflect socioeconomic status. They also argue that the more correlated are test-
based achievement and socioeconomic status, the lower is the year-to-year volatility in
rankings based on test-based achievement. Finally, using evidence from Chile’s P-900
program, Chay, McEwan and Urquiola (2005) show that noise and mean-reverting

115
shocks in schools’ test scores complicate evaluation of policies to improve schools’
quality. They find that for a median-sized school, 33 percent and 21 percent of the
variance in language and math scores, respectively, are due to transitory factors. They
argue that such noise in mean test scores might limit the ability to identify “good” schools
from “bad” schools.
3.3. Institutional Background and Data
3.3.1. Testing and Information
Since the 1999/2000 school year, all public and provincially-funded private
schools in the province of British Columbia (B.C.) have been required to administer
standardized Foundation Skills Assessment (FSA) exams to students in Grades 4 and 7
in May of each year. Students are examined in Reading Comprehension, Writing, and
Numeracy. The FSA exams do not contribute to students’ academic records and play
no role in grade completion, and there are no financial incentives for teachers or schools
related to student performance.
The Ministry of Education first provided individual and provincial-, district-, and
school-level FSA exam results to schools in fall 2000, and instructed them to share the
information with parents upon request (B.C. Ministry of Education 2000). The results of
the 1999/2000 and 2000/2001 FSA exams were first posted on the Ministry’s website in
October 2001 (B.C. Ministry of Education 2001), and each subsequent set of FSA
results has been posted the following fall. Beginning in 2003, schools were required to
share individual students’ exam results with parents before September 30th of each
school year.
The Fraser Institute, an independent research and advocacy organization (Fraser
Institute 2008), began issuing annual “report cards” on B.C.’s elementary schools in
June 2003 (Cowley and Easton 2003). These include school scores constructed by the
Fraser Institute from FSA exam results, and rankings based on these scores. From the
outset, the Fraser Institute’s school report cards have received widespread media
coverage.

116
3.3.2. School Choice in B.C.
In 2002, the government of British Columbia made school catchment boundaries
permeable and gave B.C. parents and students the right to choose between schools.
However, students in a local catchment area still have the first priority to enroll in their
neighborhood school and cannot be displaced. This legislation was a departure from the
previous neighborhood school policy that offered uniform education service to all
students. Because students in the local catchment area still retain priority access to
schools under the new policy, however, residential location choice remains an important
component of school choice in British Columbia.
3.3.3. Data
The student-level data used in this study are derived from two administrative files
maintained by the B.C. Ministry of Education: an enrollment database and an FSA exam
database. The two databases are linked by a unique student identifier. Records in the
enrollment database are based on an annual enrollment form collected on September 30
of each year for all students in the public and private school system between 1999 and
2006. It includes personal characteristics including gender, aboriginal status, home
language, English as a second language (ESL) status, special education status, and
postal code.2 I use the postal code information to augment the raw data with selected
characteristics of each student’s neighborhood as measured in 2001 and 2006 Canadian
Census of Population at the Dissemination Area (DA) level.3 These proxy for parental
income, education, and demographic information not measured in the administrative
data.
Records in the FSA exam database include the student’s grade 4 and grade 7
reading and numeracy exam results in each year. All students who were registered in
grade 4 or grade 7 in a British Columbia public or private school between the 1999/2000
and 2006/2007 school years are included in the database, whether or not they wrote the
2 A postal code is an area as small as one side of the street on a city block in urban locations. 3 DA is the name given to a relatively stable area targeted to contain 400-700 people.

117
FSA exam. Each student has two indicators: whether or not the student was excused
from writing the test, and whether or not the student actually wrote the test.
I exclude public and private schools with fewer than 5 students with valid reading
and numeracy scores in any year between 1999 and 2006. Individual test scores are
normalized to have a mean of zero and standard deviation of one in each year. Table
3.1 provides summary statistics for some variables of interest. There are 1067 grade 4
schools and 798 grade 7 schools in my sample. Among schools that offer grade 4 and
meet my sample restriction, 87 percent are public and 13 percent are private. For grade
7, the numbers are 84 percent and 16 percent, respectively. Average enrolment among
schools offering grade 4 is 41, and 50 for grade 7. The proportion of aboriginal students
in my final sample is 8.5 percent in both grade 5 and grade 7. The proportion of
students who report a language other than English as their home language is 22.4
percent in grade 7 and 21 percent in grade 4. Other socioeconomic characteristics
obtained from the census such as neighborhood-level average family income, incidence
of low income and education seem to be very similar between grade 4 and grade 7
students.
3.4. Volatility in School Mean Test Scores
I begin with a descriptive analysis of variability in school-average test scores.
Then I decompose the variation in school-average test scores to two different
components: the variation that is due to sampling variation and the variation that is due
to other nonpersistent factors.
Figures 3.1.1 and 3.1.2 portray the distribution of regression-adjusted average
grade 4 and grade 7 reading and numeracy test scores by grade enrollment between

118
1999 and 2006.4 It is immediately apparent that there is more variation in average test
scores among small schools than big schools. The most likely cause is sampling
variation, since its magnitude is a decreasing function of school size. We return to this
hypothesis below. Although one might argue to the contrary that higher variability in
mean test scores among small schools is due to long-term differences between small
and large schools or unobserved heterogeneity, figures 3.2.1 and 3.2.2 suggest
otherwise. Specifically, they show that small schools also experience more year-to-year
fluctuation in their grade 4 and grade 7 average test scores compared to big schools,
which rules out this hypothesis.
Tables 3.2.1 and 3.2.2 further illustrate transitory year-to-year variation in grade 4
and grade 7 average test scores. They are based on the idea that if mean test scores
are strongly influenced by transitory factors, a ranking based on these scores will be
similar to a ranking based on a pure lottery. The upper panel of each table uses FSA
reading scores and the lower panel uses FSA numeracy scores to compare school
rankings under different scenarios.
Column 1 illustrates the case where school-average test scores are completely
stable over time. Under this scenario, 20 percent of schools will always appear in the
top 20 percent of the distribution of school-average test scores, and 80 percent of
schools will never appear in the top 20 percent.5 In contrast, column 2 illustrates the
case where schools are assigned to different percentiles based on a pure lottery: all
schools have an independent 20 percent probability of appearing in the top 20 percent of
the distribution of school-average test scores in each year. Under this scenario, we
expect nearly 17 percent of schools to never appear in the top 20 percent, only 0.1
4 School-average test scores are adjusted by regressing individual test scores on a series of observable socioeconomic status variables (indicators for: sex, aboriginal status, ESL status, whether the student is French Immersion, special need status, 3 categories of home language (Chinese, Punjabi, English), neighbourhood-level average family income, incidence of low income, proportion of total immigrants, proportion of parents without high school degree, with high school degree and with bachelor degree or higher) and fixed school effects.
5 It is clear that total stability of schools’ performance will never happen under any useful school achievement measure, but it will allow me to lay out a framework with two extreme scenarios to explore the extent to which different test-based rankings resemble a lottery.

119
percent appear in the top 20 percent 6 times out of 8, and none to appear in the top 20
percent in all 8 years.
Column 3 ranks schools based on their actual school-average FSA scores. The
data lie somewhere between the two extremes of complete stability and a lottery.
Looking at grade 4 results, 46 percent of schools never appear in the top 20 percent of
average FSA reading scores and 2.2 percent appear in the top 20 percent for all 8 years,
these numbers are 39 percent and 6 percent for grade 7, respectively. The results are
almost identical for numeracy scores. However, one should bear in mind that the
ranking based on simple levels does not account for differences in socioeconomic status
of students across schools. Controlling for students’ observable characteristics, columns
4 results more closely resemble a lottery.6 Columns 5 and 6 also control for students’
observable characteristics, but restrict the sample to schools with enrolment less than 30
and 20 students, respectively. The results suggest that among smaller schools, the
volatility in schools-average test scores is even more similar to a lottery. The most likely
cause is sampling variation, whose magnitude decreases with sample size.
Finally, as column 8 illustrates, school gain scores (the change in school-average
test score from one year to the next) are even more volatile than score levels, and
consequently rankings based on gain scores are even more similar to a lottery.7 This is
potentially due to the fact that gain scores are based on differences in test scores over
two consecutive years, which magnifies the effect of nonpersistent factors on variation in
schools’ test scores.
3.4.1. Sampling Variation
If we think of successive cohorts of students entering a school as random draws
from a local population feeding that school, then school-average test scores will vary
6 Adjusted levels are the vector of school-specific intercepts ( ) in the regression
where is the vector of student characteristics explained in footnote 4. 7 These results are in line with Kane and Staiger (2001) finding that gain scores exhibit more
volatility due to transitory factors compared to average test scores (levels).

120
from year to year due to sampling variation. There are two factors that determine the
magnitude of sampling variation: the number of students who write the test in the school,
and the variance of individual test scores in the local population. Conditional on all other
factors that could influence a school’s average test score over time, smaller schools will
experience more volatility in their mean test scores due to sampling variation than bigger
schools.
I apply basic sampling theory to estimate the expected amount of variance in a
school’s average test score due to sampling variation. Consider a simple model of test
score determination:
(1)
Here, y denotes student ’s test score at school in year t , λ is the school-
level permanent component of a student’s score, δ is the school-level time-varying
component (decomposed below into a persistent component and a transitory
component), θ is student-level permanent component (representing test-taking ability,
socioeconomic characteristics, and other factors), and U is a student-level transitory
shock.
Assumption 1: Transitory shocks are idiosyncratic:U ∼ iid 0, σ .
Assumption 2: Different cohorts of students entering a school in a given year are
analogous to random draws from a local population feeding that school, so that θ ∼
iid μ , σ for a local population.
Given equation (1), the average test score for a given school j in year t has the
form:
(2) ∑ є ∑ є ∑ є .
Where is enrolment level at school at time . The cross-sectional variance
in average test scores over all schools in a given year is:

121
(3) | ̅ | |
σ σ σ σ E .
Defining , I can re-write equation (1) as:
(4) Y λ δ ε .
An unbiased estimator of the within-school variance of individual test scores at a
given school is:
(5) | , ∑ ∑ ̅є
.
Therefore, the expected variance in school-average test scores due to sampling
variation is:
(6) | , ,
Averaging equation (6) over all schools gives the expected variance in mean test
scores due to sampling variation for an average school:
(7) ∑ | ,
∑ / .
Note this is an unbiased estimator of the last component in equation (3).The
average within-school variance of FSA reading and numeracy scores is 0.88 and 0.83,
respectively, for both grade 4 and grade 7. Since the overall variance of individual FSA
reading and numeracy scores is normalized to one, this implies that within the average

122
school, heterogeneity in students’ test scores is nearly as large as in the overall
population.8 In other words, on average, the test scores of two students drawn randomly
from a given school are likely to differ nearly as much as two students drawn from the
population of B.C. students at large.
The estimated expected variance in mean FSA reading and numeracy scores for
an average school due to sampling variation, from equation (7), is 0.028 (reading) and
0.025 (numeracy) for grade 4, and 0.026 (reading) and 0.024 (numeracy) for grade 7.9 If
we focus on schools of average size by looking only at the two middle quartiles of
enrolment by grade, the overall cross-sectional variance of school-average FSA reading
and numeracy scores is 0.13 and 0.17, respectively, for grade 4; and 0.13 and 0.19,
respectively, for grade 7. It follows that for these average-sized schools, 21.5 and 14.7
percent of the total variation in 4th grade mean FSA reading and numeracy scores,
respectively, is due to sampling variation. For grade 7, the figures are 20 and 12.6
percent, respectively. These estimates are similar in magnitude to those reported by
Kane and Staiger (2002) for grade 4 students.
In order to gain a better understanding of the importance of sampling variation, I
calculate the 95 percent confidence interval for an average school’s mean test score
using the estimated expected variance due to sampling variation:
_ 1.96 0.35, 0.34
_ 1.96 0.30, 0.32
Where Y is the overall mean of school-average FSA reading scores. The
confidence interval extends from roughly the 17th to 84th percentile of the distribution of
8 Here we are averaging over all years between 1999 and 2006. A similar result holds in each of those years.
9 As it is also pointed out by Staiger and Kane (2002), with any peer effects, the effect of sampling variation will be amplified and these calculations will underestimate sampling variation.

123
school-average FSA reading scores for grade 4, and from the 19th to 80th percentile for
grade 7. This implies that for an average grade 4 school in our sample, we cannot rule
out with 95 percent probability that its average score the following year is as large as the
84th percentile, or as small as the 17th percentile, due to variability induced by sampling
variation alone.
A more conservative measure is based on the 50 percent confidence interval for
an average school’s mean test score given sampling variation, which measures the
degree of variability induced by sampling variation with the probability of a coin toss.
This confidence interval extends from the 36th to 63rd percentile of the distribution of
school-average reading scores for both grade 4 and grade 7. This remains a very wide
interval.
3.4.2. Other Transitory Factors
Sampling variation is only one of the transitory factors that can affect school-
average test scores. There are other transitory shocks that generate nonpersistent
changes in schools’ mean test scores in addition to sampling variation. Specifically, the
school-level time-varying component of student test scores (i.e., in equation 1) will
also induce nonpersistent variation in school-average test scores. Real-world examples
include the existence of a disruptive student in a class, a dog barking in the playground
or construction noise on the day of the exam, a school-wide illness, or special chemistry
between a teacher and a class of students, etc.
Following Kane and Staiger (2002) and given the framework developed in
section 2.4.1, I apply an indirect method to estimate the nonpersistent variation in test
scores attributed to these other transitory factors. First, I estimate the total variation in
mean test scores due to all transitory factors by measuring the degree of persistence in
change in test scores between two consecutive years. Then I back out the portion due
to sampling variation. The remainder is component attributable to other transitory
factors.
I first decompose the school-level time-varying effect on student scores in
equation (1) into two components:

124
(8) δ ν τ
where is the persistent component which is assumed to pick up from where it
left off last year in addition to a new innovation each year ( ), and τ is
the transitory component.
Assumption 3: ∼ 0, and ∼ 0, )
The average test score for a given school j in year t will therefore have the
form:
(9) ̅
(10) ≡ ̅ ̅
The correlation between test score gains this year and last year can be written
as:
(11) ,,
∗
The numerator is the negative of the total variance of all transitory factors and the
denominator is the total variance of gain scores (Δy ). Since I can calculate the left
hand side of equation (11) directly, as well asVar y jt , I can recover the total variance
of all transitory factors from their product. Subtracting from this our earlier estimate of
the magnitude of sampling variation (from equation 7), I can back out the variance of all
other transitory factors.
Tables 3.3.1 and 3.3.2 summarize the results for different quartiles of grade 4
and grade 7 enrolment for both FSA reading and numeracy scores. The analysis is
done separately for different years, while the bottom panel of each table presents the
results of the variance decomposition for all years. As expected, the estimated sampling
variance is bigger for small schools than bigger schools and the magnitudes are stable
over time. The estimated variance of other transitory factors however varies over time,
which is due to the random nature of the events that generate them. Overall, the results

125
suggest that school-average FSA reading and numeracy scores are not very reliable
measures of persistent or permanent differences in school-average achievement,
particularly among small schools. Looking at the bottom panel of each table, nearly 47
percent of the variance of school-average grade 4 FSA reading scores and 40 percent of
FSA numeracy scores among schools in the smallest quartile of enrollment size is due to
sampling variation and other nonpersistent factors. For grade 7 the estimates are 38
percent and 34 percent respectively. As expected, transitory factors account for a
smaller share of the cross-sectional variance among larger schools. For the two middle
quartiles, 33 percent and 29 percent of the cross-sectional variance in grade 4 and
grade 7 average FSA reading scores is due to nonpersistent factors respectively. The
corresponding numbers are 30 percent and 23 percent for numeracy scores. For
schools in the largest quartile, 23 percent of the variance across schools in grade 4 and
grade 7 average FSA reading scores is due to transient factors, while for numeracy
scores these numbers are 21 percent and 17 percent for grade 4 and grade 7
respectively. It also worth mentioning that almost across the board, the amount of
imprecision in average FSA numeracy scores due to nonpersistent factors is smaller
than average FSA reading scores.
3.5. Conclusion
I find that sampling variation and one-time mean reverting shocks are a
significant source of observed variation in schools’ average test scores. This is of critical
importance because there is growing evidence that suggests providing information about
school-level achievement has real effects on parents’ school choice decisions. Since
these decisions are inherently costly, if they are shaped by imprecise or noisy measures
of school performance, they could potentially impose a net cost on parents and make
them worse off. Moreover, if it becomes apparent to parents that these measures are
very noisy and fluctuate significantly from one year to the next, they might stop paying
attention to new information about school-level achievement, undermining the
effectiveness of school choice policies that hinge upon ability to distinguish high-
achieving schools from low-achieving schools.

126
Nonpersistent factors induce greater year-to-year variation in average test scores
of small schools than bigger schools. This suggests that families should treat significant
changes in average test scores of big schools as a stronger signal about changes in
long-term performance compared to small schools.
These results also warn educational authorities against naïve policies or
interventions that attach monetary/nonmonetary rewards or sanctions to schools based
on noisy measures of school performance. As a growing literature attests, designing
meaningful measures of school effectiveness continues to be a challenge (Hægeland et
al. 2004; Mizala, Romaguera and Urquiola 2007).10 As Chay et al. (2005) suggest, it is
also critical to bear in mind that policy evaluations based on such noisy measures of
school effectiveness have the potential to be misleading.
10 Kane and Staiger (2001) propose a filtered estimation to generate a more reliable measure of
school achievement over time by exploiting the time-series dimension of them.

127
3.6. Reference
Altonji, Joseph G., and Charles R. Pierret (2001) “Employer Learning and Statistical Discrimination”, The Quarterly Journal of Economics.
Becker, G. S. (1995) “Human Capital and Poverty Alleviation”, World Bank Human Resource and Operation Policy Working Paper Number 52, Washington, D.C..
B.C. Ministry of Education (2001) Interpreting and communicating Foundation Skills Assessment Results 2001, http://www.bced.gov.bc.ca/assessment/fsa/pdfs/01interpret.pdf
B.C. Ministry of Education (2000) Interpreting and communicating Foundation Skills Assessment Results 2000, http://www.bced.gov.bc.ca/assessment/fsa/pdfs/00interpret.pdf.
Belfield, Clive and HM Levin (2003) “The effects of competition on educational outcomes: a review of US evidence”, Review of Educational Research.
Chay, Kenneth Y., Patrick J. McEwan, and Miguel Urquiola, M. (2005) “The central role of noise in evaluating interventions that use test scores to rank schools”, American Economic Review, Vol. 95, No. 4.
Chernew,Michael, Gautam Gowrisankaran, and Dennis P. Scanlon (2001) “Learning and the Value of Information: Evidence From Health Plan Report Cards”, Journal of Econometrics.
Cullen, J.B., Jacob, B., Levitt, S. (2000) “The Impact of School Choice on Student Outcomes: An Analysis of the Chicago Public Schools”, National Bureau of Economic Research, Cambridge, MA, Working Paper #7888.
Cowley, Peter and Stephen T. Easton, (2003) Report Card on British Columbia’s Elementary Schools: 2003 Edition, Vancouver, B.C.: Fraser Institute.
Erdem, Tulin, and Michael P. Keane (1996) “Decision-making under uncertainty: Capturing Dynamic Brand Choice Processes in Turbulent Consumer Goods Market,” Marketing Science 15(1), 1- 20.
Fraser Institute (2008) Who We Are, http://www.fraserinstitute.org/aboutus/whoweare/.
Friedman, M. (1955) “The role of government in education”, in Solo, ed., Economics and the Public Interest, Rutgers University Press.
Friesen, Jane, M. Javdani, J. Smith and S. Woodcock (2012) “How do school ‘report cards’ affect school choice decisions?”, Canadian Journal of Economics, Issue 45(2), pp. 784-807.

128
Hægeland, Torbjørn, Lars J. Kirkebøen, Oddbjørn Raaum and Kjell G. Salvanes (2004) Marks across lower secondary schools in Norway: What can be explained by the composition of pupils and school resources? Report 2004/11, Oslo-Kongsvinger: Statistics Norway.
Hanushek, Eric A., John F. Kain, and Steven G. Rivkin (1999) “The Cost of Switching Schools,” unpublished manuscript, presented at Meetings of the Society of Labor Economists, Boston, May 1999.
Hasting, J., R. Van Weelden and J. Weinstein (2007) “Preferences, information and parental choice behavior in public school choice”, NBER Working Paper No.12995, National Bureau of Economic Research.
Hasting, J., and J. Weinstein (2008) “Information, school choice and academic achievement: evidence from two experiments”, Quarterly Journal of Economics, forthcoming.
Hoxby, Caroline M. (2003) School choice and school productivity (or could school choice be a tide that lifts all boats? in C. Hoxby, ed., The Economics of School Choice, Chicago: The University of Chicago Press.
Ichino, Andrea, and Enrico Moretti (2006) “Biological Gender Differences, Absenteeesm and the Earning Gap”, NBER working paper 12369, National Bureau of Economic Research, Inc, July.
Kane T.J., D.O. Staiger (2002) “The promises and pitfalls of using imprecise school accountability measures”, Journal of Economic Perspectives 16 91–114.
Kane T.J., D.O. Staiger, S.K. Reigg (2005) “School quality, neighborhood and housing prices: The impacts of school desegregation”, Working paper #11347, National Bureau of Economic Research.
Kane T.J., D.O. Staiger, G. Samms (2003) “School accountability ratings and housing values”, Brookings-Wharton Papers on Urban Affairs 4 (2003) 83–137.
Kane, T., Staiger, D., (2002) “Volatility in School Test Scores: Implications of Test-Based Accountability Systems”, Working Paper, Brookings Papers on Education Policy.
Kane, Thomas and Staiger, Douglas (2001) “Improving School Accountability Measures”, National Bureau of Economic Research (Cambridge, MA) Working Paper No. 8156.
Lange, Fabian (2007) “The Speed of Employer Learning”, The Journal of Labor Economics 25(1), 1-34.
McClellan, Mark, and Douglas Staiger (1999) “The Quality of Health Care Providers”, NBER working paper No. 7327, National Bureau of Economic Research.

129
Mizala, Alejandra, Pilar Romoguera, and Miguel Urquiola (2007) “Socioeconomic status or noise? Tradeoffs in the generation of school quality information”, Journal of Development Economics.
Moretti, Enrico (2008) “Social Learning and Peer Effects in Consumption: Evidence From Movie Sales”, Mimo, University of California Berkeley.

130
3.7. Tables and Figures
Figure 3.1.1. Grade 4 Adjusted Reading and Numeracy Average Test Scores by Enrolment Level (1999-2006)
Figure 3.1.2 Grade 7 Adjusted Reading and Numeracy Average Test Scores by Enrolment Level (1999-2006)
-2-1
01
2sc
hoo
l_le
vel a
djus
ted
re
adin
g sc
ore
s
0 20 40 60 80 100school enrolment
-2-1
01
2sc
hoo
l_le
vel a
djus
ted
num
era
cy s
core
s
0 20 40 60 80 100school enrolment
-2-1
01
2sc
hoo
l_le
vel a
djus
ted
re
adin
g sc
ore
s
0 20 40 60 80 100school enrolment
-2-1
01
2sc
hoo
l_le
vel a
djus
ted
num
era
cy s
core
s
0 20 40 60 80 100school enrolment

131
Figure 3.2.1 Grade 4 Adjusted Reading and Numeracy Gains by Enrolment Level (1999-2006)
Figure 3.2.2 Grade 7 Adjusted Reading and Numeracy Gains by Enrolment Level (1999-2006)
-2-1
01
2sc
hoo
l_le
vel a
djus
ted
re
adin
g ga
in s
core
s
0 20 40 60 80 100school enrolment
-2-1
01
2sc
hoo
l_le
vel a
djus
ted
num
era
cy g
ain
sco
res
0 20 40 60 80 100school enrolment
-2-1
01
2sc
hoo
l_le
vel a
djus
ted
re
adin
g ga
in s
core
s
0 20 40 60 80 100school enrolment
-2-1
01
2sc
hoo
l_le
vel a
djus
ted
num
era
cy g
ain
sco
res
0 20 40 60 80 100school enrolment

132
Table 3.1. Sample Characteristics. Grade 4 Schools with valid FSA test scores between 1999-2006
Variable Grade 4 Sample percent
Grade 7 Sample percent
Number of schools in each year 1067 798
% Public Schools 87% 84%
% Private Schools 13% 16%
Average enrolment 41 50
School-level average proportion of students:
excused from reading test 4.4% 4.1%
excused from numeracy test 4.3% 4.2%
excused from both 3.9% 3.6%
Not excused and test written but no reading score 3.0% 2.3%
Not excused and test written but no numeracy score 2.6% 2.9%
% of aboriginal students 8.5% 8.5%
% of special need students 6.6% 8.0%
% of gifted students 1.4% 2.4%
% of students in French Immersion programs 5.5% 6.1%
% of students reporting non-English home language 21.0% 22.4%
% Chinese home language 6.7% 8.2%
% Punjabi home language 4.5% 3.6%
% other home language 9.7% 10.6%
% English as a second language (ESL) 15.0% 7.0%
Average Family Income (in 2000 C$) C$66034 C$67015
Average percentage of Incidence of low income 15.1% 15.2 %
Average proportion of parents with education:
Without high school 14.0% 14.0%
With high school 14.0% 14.3 %
With bachelor or higher 12.6 % 13.2 %

133
Table 3.2.1. Proportion Ranking in the Top 20% on 4th Grade Test Scores 1999-2006
# of years in top
20
Certainty Lottery Actual
average scores
Actual Adjusted average scores
Lottery Gain
Scores All schools
Enrol. < 30 (N=328)
Enrol. < 20 (N=116)
(1) (2) (3) (4) (5) (6) (7) (8)
School Ranking Based on Average Reading Scores
Never 80.0 16.7 45.8 37.6 27.1 24.1 20.9 16.4
1 year 0.0 33.5 19.1 22.6 23.4 20.6 36.7 40.9
2 years 0.0 29.3 9.5 15.7 21.0 21.5 27.5 30.9
3 years 0.0 14.6 7.9 9.4 11.2 14.6 11.4 9.9
4 years 0.0 2.6 5.6 4.5 5.1 5.1 2.8 1.7
5 years 0.0 0.9 3.8 4.0 4.8 7.7 0.4 0.0
6 years 0.0 0.1 2.8 3.0 4.5 5.1 0.0 0.0
7 years 0.0 0.0 3.0 1.6 1.8 0.0 0.0 0.0
8 years 20.0 0.0 2.2 1.0 0.6 0.8 NA NA
School Ranking Based on Average Numeracy Scores
Never 80.0 16.7 44.3 38.8 30.4 25.0 20.9 16.6
1 year 0.0 33.5 19.9 23.1 22.5 22.4 36.7 40.5
2 years 0.0 29.3 10.5 13.6 17.3 19.8 27.5 31.3
3 years 0.0 14.6 8.3 9.1 13.4 13.7 11.4 9.1
4 years 0.0 2.6 4.8 5.0 4.8 6.9 2.8 2.2
5 years 0.0 0.9 4.4 4.1 3.9 6.9 0.4 0.0
6 years 0.0 0.1 2.7 2.6 3.6 2.5 0.0 0.0
7 years 0.0 0.0 2.5 1.9 2.7 1.7 0.0 0.0
8 years 20.0 0.0 2.2 1.4 0.9 0.8 NA NA

134
Table 3.2.2. Proportion Ranking in the Top 20% on 7th Grade Test Scores 1999-2006
# of years in top
20
Certainty Lottery Actual
average scores
Actual Adjusted average scores
Lottery Gain
Scores All schools
Enrol. < 30 (N=241)
Enrol. < 20 (N=86)
(1) (2) (3) (4) (5) (6) (7) (8)
School Ranking Based on Average Reading Scores
Never 80.0 16.7 38.85 33.21 23.24 20.93 20.9 7.27
1 year 0.0 33.5 17.17 18.30 19.5 22.09 36.7 27.69
2 years 0.0 29.3 11.78 14.16 16.18 16.28 27.5 40.10
3 years 0.0 14.6 7.52 9.90 15.35 20.93 11.4 20.93
4 years 0.0 2.6 4.64 7.02 6.64 1.16 2.8 3.88
5 years 0.0 0.9 4.64 5.51 5.39 6.98 0.4 0.13
6 years 0.0 0.1 5.26 5.14 5.81 3.49 0.0 0.0
7 years 0.0 0.0 4.26 3.38 2.49 3.49 0.0 0.0
8 years 20.0 0.0 5.89 3.38 5.39 4.65 NA NA
School Ranking Based on Average Numeracy Scores
Never 80.0 16.7 38.22 32.46 21.58 19.77 20.9 7.52
1 year 0.0 33.5 15.66 18.92 22.41 20.93 36.7 26.82
2 years 0.0 29.3 11.9 13.53 16.60 18.60 27.5 40.98
3 years 0.0 14.6 8.65 10.28 10.79 16.28 11.4 20.80
4 years 0.0 2.6 7.02 8.02 13.28 9.30 2.8 3.76
5 years 0.0 0.9 4.76 6.02 5.39 6.98 0.4 0.13
6 years 0.0 0.1 4.39 4.26 2.07 1.16 0.0 0.0
7 years 0.0 0.0 5.26 3.13 2.90 2.33 0.0 0.0
8 years 20.0 0.0 4.14 3.38 4.98 4.65 NA NA

135
Table 3.3.1. Decomposition of Variance in Schools’ Mean FSA Scores (Grade 4)
School enrolment
quartile
Average size
Total variance
Sampling variance
Other non-
persistent variance
Total proportion
non- persistent
Total variance
Sampling variance
Other non- persistent variance
Total proportion
non- persistent
Grade 4 FSA Reading Scores Grade 4 FSA Numeracy Scores
Year = 2000
Bottom quartile 21 0.156 0.051 0.042 0.600 0.175 0.045 0.054 0.571 2 Middle quartiles 41 0.100 0.022 0.020 0.435 0.126 0.022 0.026 0.380
Top quartile 66 0.081 0.013 0.014 0.343 0.105 0.013 0.010 0.225
Year = 2001
Bottom quartile 20 0.202 0.049 0.036 0.424 0.267 0.045 0.048 0.349 2 Middle quartiles 40 0.151 0.022 0.026 0.326 0.187 0.021 0.037 0.317
Top quartile 68 0.109 0.013 0.012 0.234 0.137 0.012 0.014 0.197
Year = 2002
Bottom quartile 20 0.221 0.049 0.033 0.374 0.276 0.043 0.043 0.313 2 Middle quartiles 39 0.137 0.023 0.020 0.318 0.166 0.022 0.026 0.295
Top quartile 65 0.104 0.014 0.004 0.182 0.129 0.013 0.004 0.140
Year = 2003
Bottom quartile 20 0.178 0.051 0.037 0.499 0.234 0.042 0.051 0.402 2 Middle quartiles 40 0.131 0.023 0.020 0.333 0.167 0.022 0.021 0.261
Top quartile 67 0.115 0.013 0.016 0.259 0.156 0.013 0.017 0.199
Year = 2004
Bottom quartile 19 0.226 0.052 0.069 0.540 0.336 0.043 0.123 0.495 2 Middle quartiles 39 0.144 0.023 0.024 0.332 0.209 0.021 0.035 0.271
Top quartile 67 0.115 0.013 0.008 0.191 0.146 0.013 0.021 0.239
Year = 2005
Bottom quartile 19 0.235 0.052 0.051 0.440 0.244 0.043 0.040 0.345 2 Middle quartiles 39 0.140 0.023 0.025 0.344 0.175 0.022 0.030 0.300
Top quartile 66 0.099 0.013 0.005 0.193 0.133 0.013 0.019 0.246
All Years (2000-2005)
Bottom quartile 20 0.203 0.050 0.046 0.475 0.253 0.044 0.058 0.406 2 Middle quartiles 40 0.132 0.023 0.022 0.339 0.171 0.021 0.029 0.299
Top quartile 66 0.104 0.013 0.010 0.230 0.134 0.013 0.015 0.213
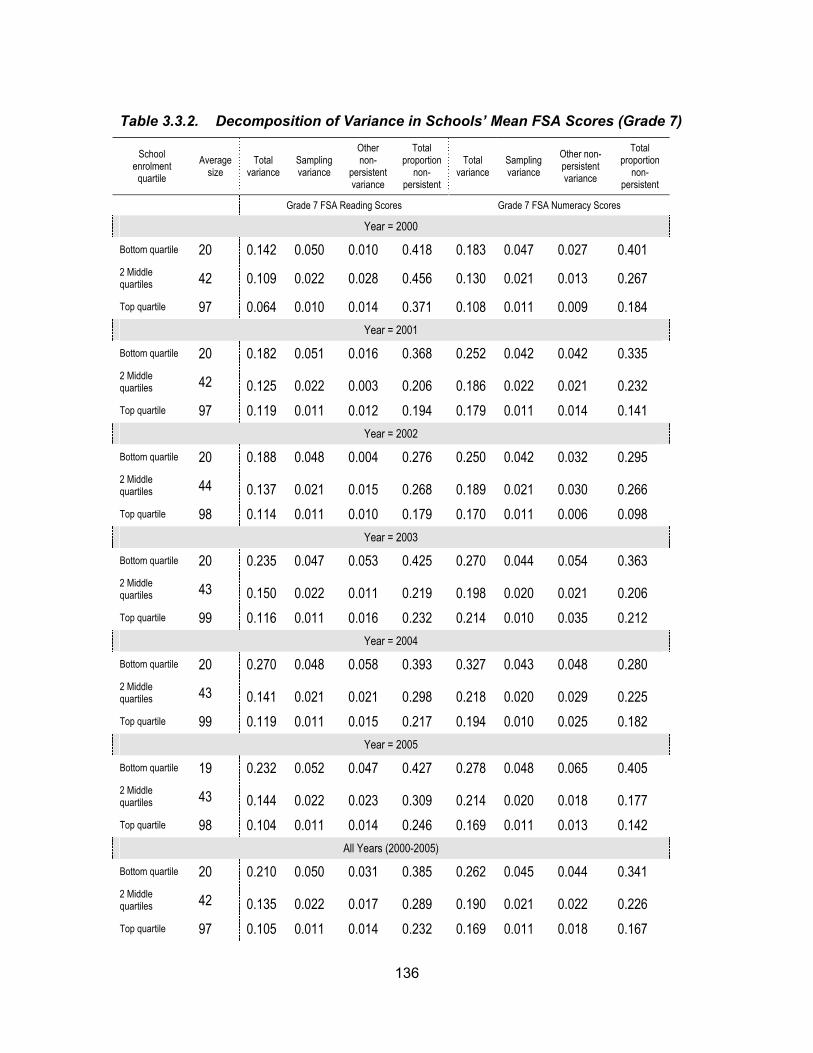
136
Table 3.3.2. Decomposition of Variance in Schools’ Mean FSA Scores (Grade 7)
School enrolment
quartile
Average size
Total variance
Sampling variance
Other non-
persistent variance
Total proportion
non- persistent
Total variance
Sampling variance
Other non- persistent variance
Total proportion
non- persistent
Grade 7 FSA Reading Scores Grade 7 FSA Numeracy Scores
Year = 2000
Bottom quartile 20 0.142 0.050 0.010 0.418 0.183 0.047 0.027 0.401 2 Middle quartiles 42 0.109 0.022 0.028 0.456 0.130 0.021 0.013 0.267
Top quartile 97 0.064 0.010 0.014 0.371 0.108 0.011 0.009 0.184
Year = 2001
Bottom quartile 20 0.182 0.051 0.016 0.368 0.252 0.042 0.042 0.335 2 Middle quartiles 42 0.125 0.022 0.003 0.206 0.186 0.022 0.021 0.232
Top quartile 97 0.119 0.011 0.012 0.194 0.179 0.011 0.014 0.141
Year = 2002
Bottom quartile 20 0.188 0.048 0.004 0.276 0.250 0.042 0.032 0.295 2 Middle quartiles 44 0.137 0.021 0.015 0.268 0.189 0.021 0.030 0.266
Top quartile 98 0.114 0.011 0.010 0.179 0.170 0.011 0.006 0.098
Year = 2003
Bottom quartile 20 0.235 0.047 0.053 0.425 0.270 0.044 0.054 0.363 2 Middle quartiles 43 0.150 0.022 0.011 0.219 0.198 0.020 0.021 0.206
Top quartile 99 0.116 0.011 0.016 0.232 0.214 0.010 0.035 0.212
Year = 2004
Bottom quartile 20 0.270 0.048 0.058 0.393 0.327 0.043 0.048 0.280 2 Middle quartiles 43 0.141 0.021 0.021 0.298 0.218 0.020 0.029 0.225
Top quartile 99 0.119 0.011 0.015 0.217 0.194 0.010 0.025 0.182
Year = 2005
Bottom quartile 19 0.232 0.052 0.047 0.427 0.278 0.048 0.065 0.405 2 Middle quartiles 43 0.144 0.022 0.023 0.309 0.214 0.020 0.018 0.177
Top quartile 98 0.104 0.011 0.014 0.246 0.169 0.011 0.013 0.142
All Years (2000-2005)
Bottom quartile 20 0.210 0.050 0.031 0.385 0.262 0.045 0.044 0.341 2 Middle quartiles 42 0.135 0.022 0.017 0.289 0.190 0.021 0.022 0.226
Top quartile 97 0.105 0.011 0.014 0.232 0.169 0.011 0.018 0.167