Embed Size (px)
Citation preview
ECONOMIC - FINANCIAL
REPORT
2017

Consolidated Financial Statements
Auditor’s Report on Consolidated Financial Statements
1
“Translation of original document issued in Spanish. In the event of a discrepancy,
the Spanish-language version prevails”
2
ACS, Actividades de Construcción
y Servicios, S.A. and Subsidiaries
Consolidated Financial Statements for the year
ended 31 December 2017, prepared in accordance
with International Financial Reporting Standards
(IFRSs) as adopted by the European Union

Consolidated Financial Statements - ACS GROUP
3
INDEX Page
CONSOLIDATED STATEMENT OF FINANCIAL POSITION AT 31 DECEMBER 2017 .............................................................. 6
CONSOLIDATED INCOME STATEMENT FOR THE YEAR ENDED 31 DECEMBER 2017 ....................................................... 8
CONSOLIDATED STATEMENT OF COMPREHENSIVE INCOME FOR THE YEAR ENDED 31 DECEMBER 2017 ................ 9
CONSOLIDATED STATEMENT OF CHANGES IN EQUITY ..................................................................................................... 10
FOR THE YEAR ENDED 31 DECEMBER 2017 ........................................................................................................................ 10
CONSOLIDATED STATEMENT OF CASH FLOWS FOR THE YEAR ENDED 31 DECEMBER 2017 ..................................... 11
Consolidated Financial Statements for the year ended 31 December 2017. ............................................................................. 12
01. Group Activity .................................................................................................................................................................... 12
02. Basis of Presentation of the Consolidated Financial Statements and Basis of Consolidation ........................................... 15 02.01. Basis of presentation ................................................................................................................................................................. 15 02.02. Consolidation principles ............................................................................................................................................................. 17
03. Accounting Policies ........................................................................................................................................................... 22 03.01. Goodwill..................................................................................................................................................................................... 22 03.02. Other intangible assets .............................................................................................................................................................. 23 03.03. Property, plant and equipment ................................................................................................................................................... 24 03.04. Non-current assets in projects ................................................................................................................................................... 25 03.05. Investment property ................................................................................................................................................................... 27 03.06. Impairment of tangible assets, property, plant and equipment and intangible assets excluding goodwill .................................... 27 03.07. Inventories ................................................................................................................................................................................. 28 03.08. Non-current and other financial assets ....................................................................................................................................... 28 03.09. Non-current assets held for sale, liabilities relating to non-current assets held for sale and discontinued operations .................. 29 03.10. Equity ........................................................................................................................................................................................ 34 03.11. Government grants .................................................................................................................................................................... 34 03.12. Financial liabilities ...................................................................................................................................................................... 35 03.13. Provisions .................................................................................................................................................................................. 36 03.14. Risk management policy ............................................................................................................................................................ 37 03.15. Financial derivatives .................................................................................................................................................................. 37 03.16. Revenue recognition .................................................................................................................................................................. 40 03.17. Expense recognition .................................................................................................................................................................. 42 03.18. Offsetting ................................................................................................................................................................................... 42 03.19. Income tax ................................................................................................................................................................................. 42 03.20. Earnings per share .................................................................................................................................................................... 43 03.21. Foreign currency transactions .................................................................................................................................................... 43 03.22. Entities and branches located in hyperinflationary economies .................................................................................................... 44 03.23. Consolidated Statement of Cash Flows ..................................................................................................................................... 44 03.24. Entry into force of new accounting standards ............................................................................................................................. 46
04. Intangible assets ................................................................................................................................................................ 51 04.01. Goodwill..................................................................................................................................................................................... 51 04.02. Other intangible assets .............................................................................................................................................................. 54
05. Property, plant and equipment ........................................................................................................................................... 55
06. Non-current assets in projects ........................................................................................................................................... 57
07. Investment property ........................................................................................................................................................... 60
08. Jointly agreements ............................................................................................................................................................ 61
09. Investments in companies accounted for using the equity method .................................................................................... 61
10. Financial assets ................................................................................................................................................................. 65 10.01. Equity instruments ..................................................................................................................................................................... 65 10.02. Loans to associates ................................................................................................................................................................... 67

4
10.03. Other loans ................................................................................................................................................................................ 68 10.04. Debt securities ........................................................................................................................................................................... 69 10.05. Other financial assets ................................................................................................................................................................ 69
11. Inventories ......................................................................................................................................................................... 70
12. Trade and other receivables .............................................................................................................................................. 70
13. Other current assets .......................................................................................................................................................... 74
14. Cash and cash equivalents................................................................................................................................................ 74
15. Equity ............................................................................................................................................................................... 74 15.01. Share Capital ............................................................................................................................................................................. 74 15.02. Share premium .......................................................................................................................................................................... 77 15.03. Retained earnings and other reserves ....................................................................................................................................... 77 15.04. Treasury shares ......................................................................................................................................................................... 78 15.05. Interim dividend ......................................................................................................................................................................... 79 15.06. Adjustments for changes in value .............................................................................................................................................. 80 15.07. Non-controlling interests ............................................................................................................................................................ 81
16. Grants ............................................................................................................................................................................... 83
17. Bank borrowings, debt instruments and other marketable securities ................................................................................. 84 17.01. Debt instruments and other marketable securities...................................................................................................................... 84 17.02. Loans and credit facilities ........................................................................................................................................................... 86 17.03. Finance lease obligations .......................................................................................................................................................... 88
18. Limited recourse financing of projects and debts ............................................................................................................... 89
19. Other financial liabilities ..................................................................................................................................................... 90
20. Provisions .......................................................................................................................................................................... 90
21. Financial risk and capital management ........................................................................................................................... 101
22. Derivative financial instruments ....................................................................................................................................... 108
23. Trade and other payables ................................................................................................................................................ 111
24. Other current liabilities ..................................................................................................................................................... 112
25. Segments ........................................................................................................................................................................ 112 25.01. Basis of segmentation ............................................................................................................................................................. 112 25.02. Basis and methodology for business segment reporting .......................................................................................................... 113
26. Tax matters ...................................................................................................................................................................... 120 26.01. Consolidated tax group ............................................................................................................................................................ 120 26.02. Reconciliation of the current income tax expense to accounting profit ...................................................................................... 120 26.03. Detail of income tax expense ................................................................................................................................................... 121 26.04. Taxes recognized in equity ...................................................................................................................................................... 122 26.05. Deferred tax ............................................................................................................................................................................. 122 26.06. Tax audit .................................................................................................................................................................................. 124
27. Income ............................................................................................................................................................................. 124
28. Expenses ......................................................................................................................................................................... 126 28.01. Procurements .......................................................................................................................................................................... 126 28.02. Staff costs ................................................................................................................................................................................ 126 28.03. Share-based remuneration systems ........................................................................................................................................ 127 28.04. Operating leases ..................................................................................................................................................................... 130 28.05. Changes in the fair value of financial instruments .................................................................................................................... 131 28.06. Financial income and financial costs ........................................................................................................................................ 131 28.07. Other profits or loss ................................................................................................................................................................. 131
29. Impairment and gains or losses on disposal of financial instruments .............................................................................. 132
30. Distribution of profit .......................................................................................................................................................... 132
31. Earnings per share .......................................................................................................................................................... 132 31.01. Basic earnings per share ......................................................................................................................................................... 132 31.02. Diluted earnings per share ....................................................................................................................................................... 133
32. Events after the reporting date ........................................................................................................................................ 133

Consolidated Financial Statements - ACS GROUP
5
33. Related party transactions and balances ......................................................................................................................... 134 33.01. Transactions with Associates ................................................................................................................................................... 134 33.02. Balances and transactions with other related parties ............................................................................................................... 134
34. Board of Directors and Senior Executives ....................................................................................................................... 136 34.01. Transactions with members of the Board of Directors .............................................................................................................. 137 34.02. Remuneration of Senior Executives ......................................................................................................................................... 137
35. Other disclosures concerning the Board of Directors ...................................................................................................... 137
36. Guarantee commitments to third parties and other contingent liabilities .......................................................................... 138
37. Information on the environment ....................................................................................................................................... 140
38. Auditors’ fees ................................................................................................................................................................... 141
39. Explanation added for translation to English.................................................................................................................... 142
APPENDICES .......................................................................................................................................................................... 143
6
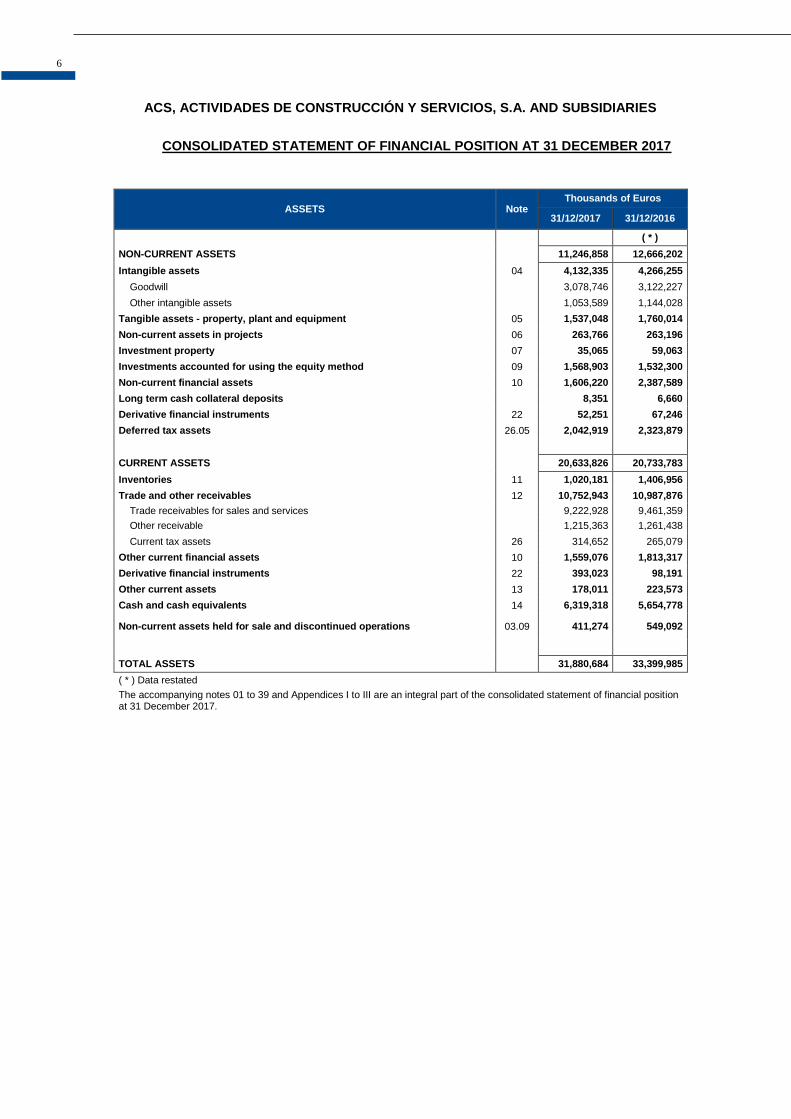
ACS, ACTIVIDADES DE CONSTRUCCIÓN Y SERVICIOS, S.A. AND SUBSIDIARIES
CONSOLIDATED STATEMENT OF FINANCIAL POSITION AT 31 DECEMBER 2017
ASSETS Note Thousands of Euros
31/12/2017 31/12/2016
( * )
NON-CURRENT ASSETS 11,246,858 12,666,202
Intangible assets 04 4,132,335 4,266,255
Goodwill 3,078,746 3,122,227
Other intangible assets 1,053,589 1,144,028
Tangible assets - property, plant and equipment 05 1,537,048 1,760,014
Non-current assets in projects 06 263,766 263,196
Investment property 07 35,065 59,063
Investments accounted for using the equity method 09 1,568,903 1,532,300
Non-current financial assets 10 1,606,220 2,387,589
Long term cash collateral deposits 8,351 6,660
Derivative financial instruments 22 52,251 67,246
Deferred tax assets 26.05 2,042,919 2,323,879
CURRENT ASSETS 20,633,826 20,733,783
Inventories 11 1,020,181 1,406,956
Trade and other receivables 12 10,752,943 10,987,876
Trade receivables for sales and services 9,222,928 9,461,359
Other receivable 1,215,363 1,261,438
Current tax assets 26 314,652 265,079
Other current financial assets 10 1,559,076 1,813,317
Derivative financial instruments 22 393,023 98,191
Other current assets 13 178,011 223,573
Cash and cash equivalents 14 6,319,318 5,654,778
Non-current assets held for sale and discontinued operations 03.09 411,274 549,092
TOTAL ASSETS 31,880,684 33,399,985
( * ) Data restated
The accompanying notes 01 to 39 and Appendices I to III are an integral part of the consolidated statement of financial position at 31 December 2017.
Consolidated Financial Statements - ACS GROUP
7
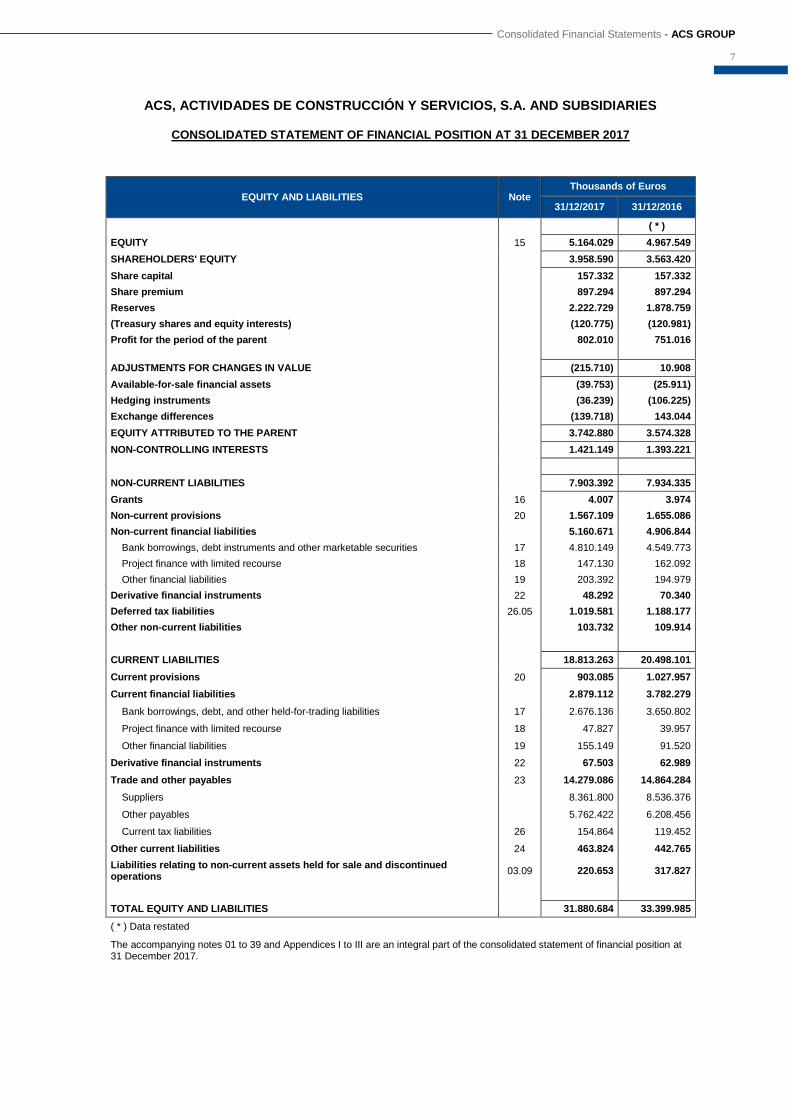
ACS, ACTIVIDADES DE CONSTRUCCIÓN Y SERVICIOS, S.A. AND SUBSIDIARIES
CONSOLIDATED STATEMENT OF FINANCIAL POSITION AT 31 DECEMBER 2017
EQUITY AND LIABILITIES Note Thousands of Euros
31/12/2017 31/12/2016
( * )
EQUITY 15 5.164.029 4.967.549
SHAREHOLDERS' EQUITY 3.958.590 3.563.420
Share capital 157.332 157.332
Share premium 897.294 897.294
Reserves 2.222.729 1.878.759
(Treasury shares and equity interests) (120.775) (120.981)
Profit for the period of the parent 802.010 751.016
ADJUSTMENTS FOR CHANGES IN VALUE (215.710) 10.908
Available-for-sale financial assets (39.753) (25.911)
Hedging instruments (36.239) (106.225)
Exchange differences (139.718) 143.044
EQUITY ATTRIBUTED TO THE PARENT 3.742.880 3.574.328
NON-CONTROLLING INTERESTS 1.421.149 1.393.221
NON-CURRENT LIABILITIES 7.903.392 7.934.335
Grants 16 4.007 3.974
Non-current provisions 20 1.567.109 1.655.086
Non-current financial liabilities 5.160.671 4.906.844
Bank borrowings, debt instruments and other marketable securities 17 4.810.149 4.549.773
Project finance with limited recourse 18 147.130 162.092
Other financial liabilities 19 203.392 194.979
Derivative financial instruments 22 48.292 70.340
Deferred tax liabilities 26.05 1.019.581 1.188.177
Other non-current liabilities 103.732 109.914
CURRENT LIABILITIES 18.813.263 20.498.101
Current provisions 20 903.085 1.027.957
Current financial liabilities 2.879.112 3.782.279
Bank borrowings, debt, and other held-for-trading liabilities 17 2.676.136 3.650.802
Project finance with limited recourse 18 47.827 39.957
Other financial liabilities 19 155.149 91.520
Derivative financial instruments 22 67.503 62.989
Trade and other payables 23 14.279.086 14.864.284
Suppliers 8.361.800 8.536.376
Other payables 5.762.422 6.208.456
Current tax liabilities 26 154.864 119.452
Other current liabilities 24 463.824 442.765
Liabilities relating to non-current assets held for sale and discontinued operations
03.09 220.653 317.827
TOTAL EQUITY AND LIABILITIES 31.880.684 33.399.985
( * ) Data restated
The accompanying notes 01 to 39 and Appendices I to III are an integral part of the consolidated statement of financial position at 31 December 2017.
8
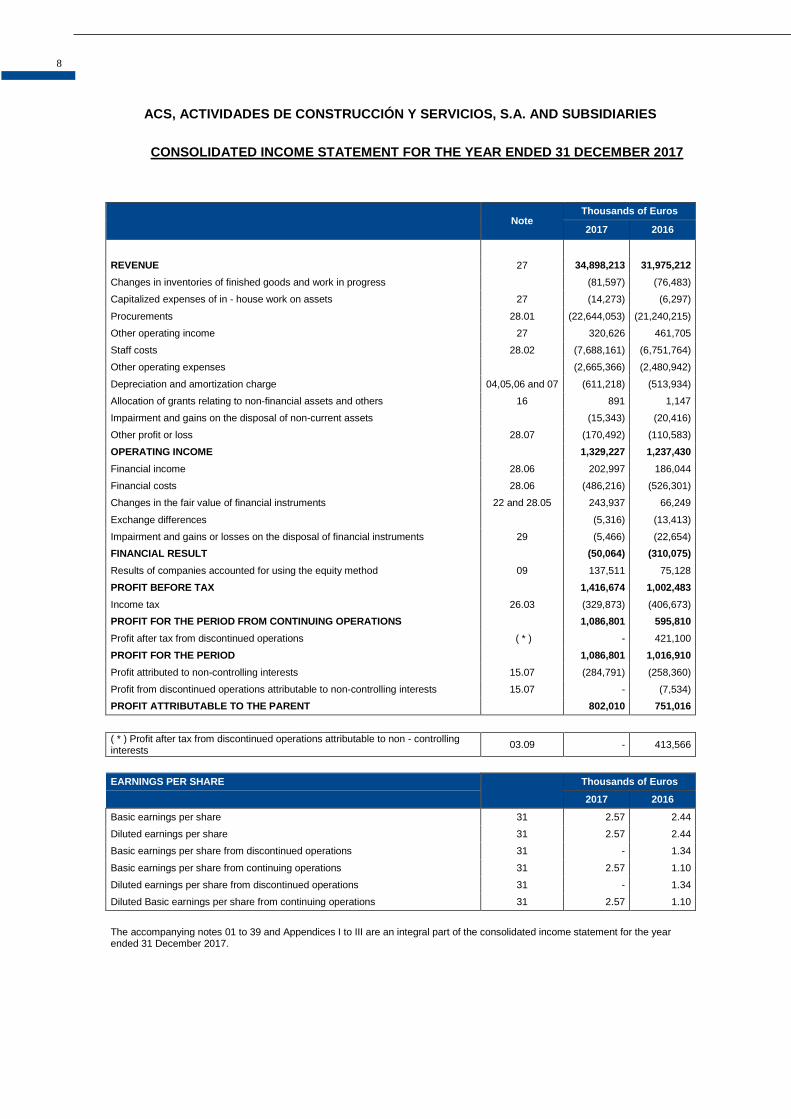
ACS, ACTIVIDADES DE CONSTRUCCIÓN Y SERVICIOS, S.A. AND SUBSIDIARIES
CONSOLIDATED INCOME STATEMENT FOR THE YEAR ENDED 31 DECEMBER 2017
Note Thousands of Euros
2017 2016
REVENUE 27 34,898,213 31,975,212
Changes in inventories of finished goods and work in progress (81,597) (76,483)
Capitalized expenses of in - house work on assets 27 (14,273) (6,297)
Procurements 28.01 (22,644,053) (21,240,215)
Other operating income 27 320,626 461,705
Staff costs 28.02 (7,688,161) (6,751,764)
Other operating expenses (2,665,366) (2,480,942)
Depreciation and amortization charge 04,05,06 and 07 (611,218) (513,934)
Allocation of grants relating to non-financial assets and others 16 891 1,147
Impairment and gains on the disposal of non-current assets (15,343) (20,416)
Other profit or loss 28.07 (170,492) (110,583)
OPERATING INCOME 1,329,227 1,237,430
Financial income 28.06 202,997 186,044
Financial costs 28.06 (486,216) (526,301)
Changes in the fair value of financial instruments 22 and 28.05 243,937 66,249
Exchange differences (5,316) (13,413)
Impairment and gains or losses on the disposal of financial instruments 29 (5,466) (22,654)
FINANCIAL RESULT (50,064) (310,075)
Results of companies accounted for using the equity method 09 137,511 75,128
PROFIT BEFORE TAX 1,416,674 1,002,483
Income tax 26.03 (329,873) (406,673)
PROFIT FOR THE PERIOD FROM CONTINUING OPERATIONS 1,086,801 595,810
Profit after tax from discontinued operations ( * ) - 421,100
PROFIT FOR THE PERIOD 1,086,801 1,016,910
Profit attributed to non-controlling interests 15.07 (284,791) (258,360)
Profit from discontinued operations attributable to non-controlling interests 15.07 - (7,534)
PROFIT ATTRIBUTABLE TO THE PARENT 802,010 751,016
( * ) Profit after tax from discontinued operations attributable to non - controlling interests
03.09 - 413,566
EARNINGS PER SHARE
Thousands of Euros
2017 2016
Basic earnings per share 31 2.57 2.44
Diluted earnings per share 31 2.57 2.44
Basic earnings per share from discontinued operations 31 - 1.34
Basic earnings per share from continuing operations 31 2.57 1.10
Diluted earnings per share from discontinued operations 31 - 1.34
Diluted Basic earnings per share from continuing operations 31 2.57 1.10
The accompanying notes 01 to 39 and Appendices I to III are an integral part of the consolidated income statement for the year ended 31 December 2017.

Consolidated Financial Statements - ACS GROUP
9
ACS, ACTIVIDADES DE CONSTRUCCIÓN Y SERVICIOS, S.A. AND SUBSIDIARIES
CONSOLIDATED STATEMENT OF COMPREHENSIVE INCOME FOR THE YEAR ENDED 31 DECEMBER 2017
Thousands of Euros
2017 2016
Of the Parent
Of non-controlling interests
Total Of the parent
Of non-controlling interests
Total
A) Total consolidated profit 802,010 284,791 1,086,801 751,016 265,894 1,016,910
Profit from continuing operations 802,010 284,791 1,086,801 337,450 258,360 595,810
Profit from discontinued operations - - - 413,566 7,534 421,100
B) Income and expenses recognized directly in equity (235,740) (152,854) (388,594) (53,687) 10,901 (42,786)
Measurement of financial instruments (10,851) (4,236) (15,087) (43,729) (2,765) (46,494)
Cash flow hedges 13,127 (2,618) 10,509 4,276 (7,097) (2,821)
Exchange differences (194,649) (142,900) (337,549) (40,020) 26,858 (13,162)
Actuarial profit and losses ( * ) 61,407 24,125 85,532 (60,613) (23,813) (84,426)
Equity method investment (82,625) (18,110) (100,735) 63,537 9,400 72,937
Tax effect (22,149) (9,115) (31,264) 22,862 8,318 31,180
C) Transfers to profit or loss 37,804 (3,681) 34,123 56,036 (765) 55,271
Reversal of financial instruments (13,506) (5,359) (18,865) (177,338) (9,680) (187,018)
Cash flow hedges 7,998 - 7,998 94,234 18,962 113,196
Exchange differences 13,912 1,678 15,590 62,860 (2,228) 60,632
Equity method investment 31,433 - 31,433 50,731 (5,848) 44,883
Tax effect (2,033) - (2,033) 25,549 (1,971) 23,578
TOTAL COMPREHENSIVE INCOME FOR THE YEAR 604,074 128,256 732,330 753,365 276,030 1,029,395
( * ) The only item of income and expense recognized directly in equity which cannot be subsequently subject to transfer to the consolidated income statement is the one corresponding to actuarial profit and losses.
The accompanying notes 01 to 39 and Appendices I to III are an integral part of the consolidated statement of comprehensive income for the year ended 31 December 2017.
10
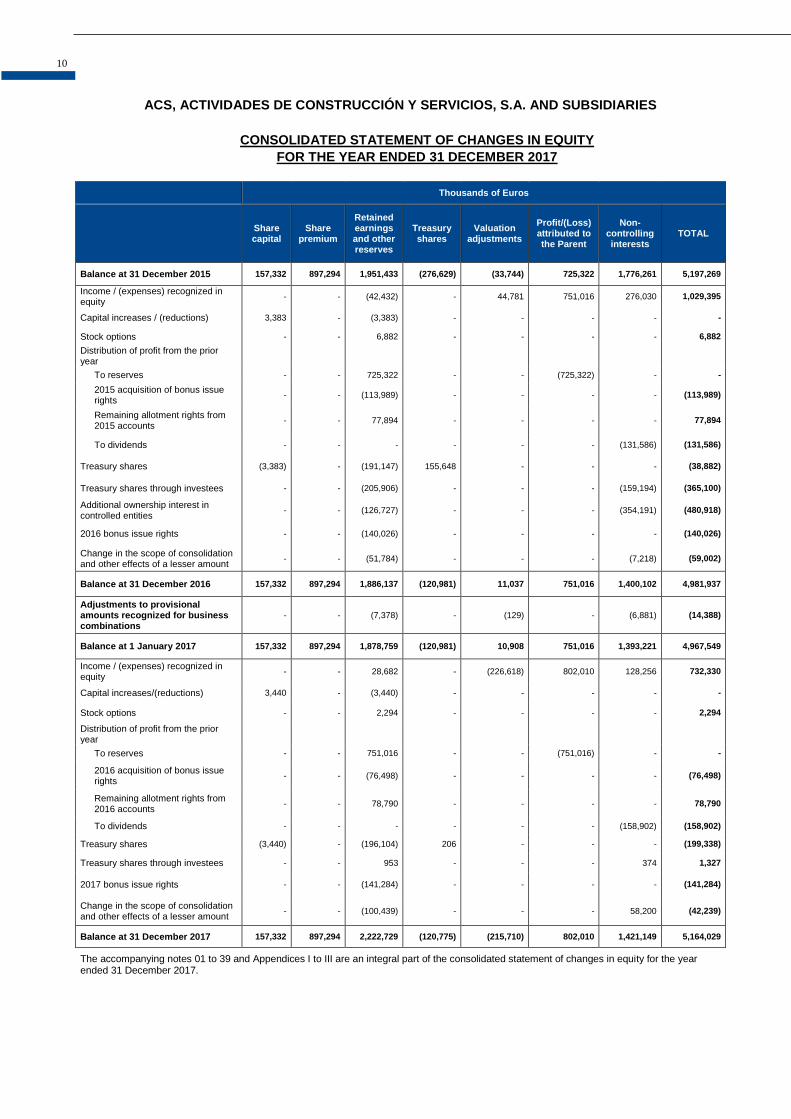
ACS, ACTIVIDADES DE CONSTRUCCIÓN Y SERVICIOS, S.A. AND SUBSIDIARIES
CONSOLIDATED STATEMENT OF CHANGES IN EQUITY
FOR THE YEAR ENDED 31 DECEMBER 2017
Thousands of Euros
Share capital
Share premium
Retained earnings and other reserves
Treasury shares
Valuation adjustments
Profit/(Loss) attributed to the Parent
Non-controlling interests
TOTAL
Balance at 31 December 2015 157,332 897,294 1,951,433 (276,629) (33,744) 725,322 1,776,261 5,197,269
Income / (expenses) recognized in equity
- - (42,432) - 44,781 751,016 276,030 1,029,395
Capital increases / (reductions) 3,383 - (3,383) - - - - -
Stock options - - 6,882 - - - - 6,882
Distribution of profit from the prior year
To reserves - - 725,322 - - (725,322) - -
2015 acquisition of bonus issue rights
- - (113,989) - - - - (113,989)
Remaining allotment rights from 2015 accounts
- - 77,894 - - - - 77,894
To dividends - - - - - - (131,586) (131,586)
Treasury shares (3,383) - (191,147) 155,648 - - - (38,882)
Treasury shares through investees - - (205,906) - - - (159,194) (365,100)
Additional ownership interest in controlled entities
- - (126,727) - - - (354,191) (480,918)
2016 bonus issue rights - - (140,026) - - - - (140,026)
Change in the scope of consolidation and other effects of a lesser amount
- - (51,784) - - - (7,218) (59,002)
Balance at 31 December 2016 157,332 897,294 1,886,137 (120,981) 11,037 751,016 1,400,102 4,981,937
Adjustments to provisional amounts recognized for business combinations
- - (7,378) - (129) - (6,881) (14,388)
Balance at 1 January 2017 157,332 897,294 1,878,759 (120,981) 10,908 751,016 1,393,221 4,967,549
Income / (expenses) recognized in equity
- - 28,682 - (226,618) 802,010 128,256 732,330
Capital increases/(reductions) 3,440 - (3,440) - - - - -
Stock options - - 2,294 - - - - 2,294
Distribution of profit from the prior year
To reserves - - 751,016 - - (751,016) - -
2016 acquisition of bonus issue rights
- - (76,498) - - - - (76,498)
Remaining allotment rights from 2016 accounts
- - 78,790 - - - - 78,790
To dividends - - - - - - (158,902) (158,902)
Treasury shares (3,440) - (196,104) 206 - - - (199,338)
Treasury shares through investees - - 953 - - - 374 1,327
2017 bonus issue rights - - (141,284) - - - - (141,284)
Change in the scope of consolidation and other effects of a lesser amount
- - (100,439) - - - 58,200 (42,239)
Balance at 31 December 2017 157,332 897,294 2,222,729 (120,775) (215,710) 802,010 1,421,149 5,164,029
The accompanying notes 01 to 39 and Appendices I to III are an integral part of the consolidated statement of changes in equity for the year ended 31 December 2017.
Consolidated Financial Statements - ACS GROUP
11
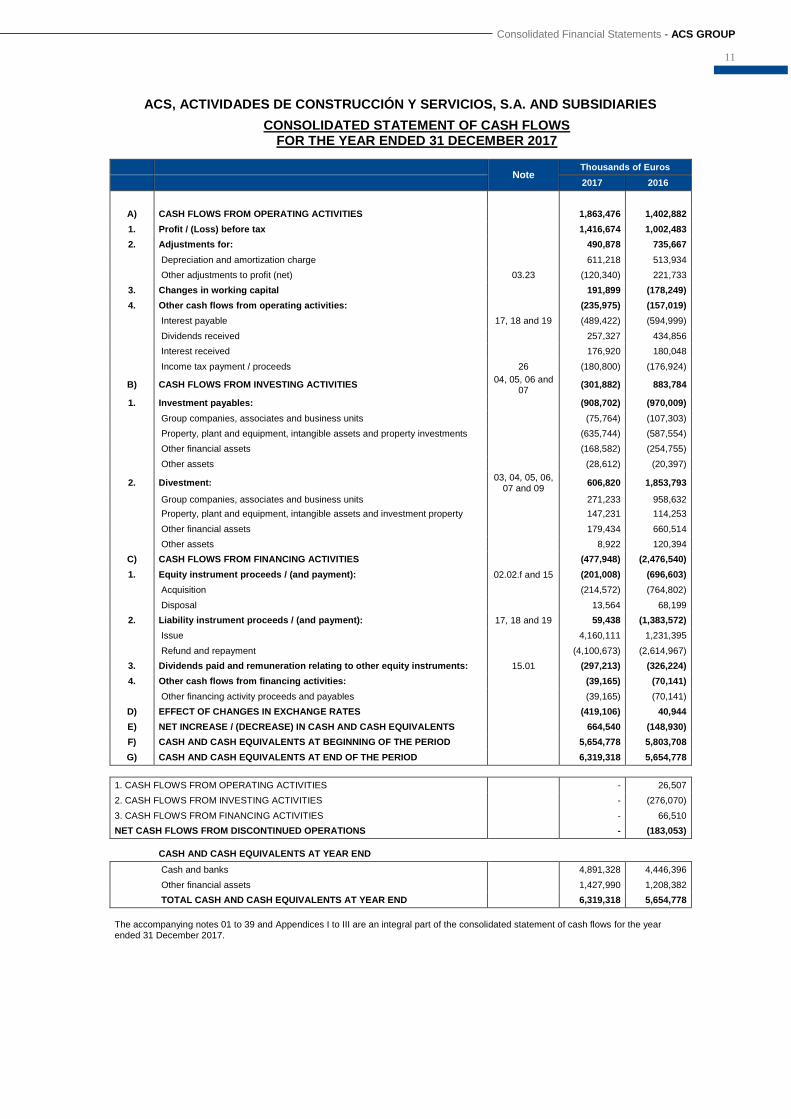
ACS, ACTIVIDADES DE CONSTRUCCIÓN Y SERVICIOS, S.A. AND SUBSIDIARIES
CONSOLIDATED STATEMENT OF CASH FLOWS FOR THE YEAR ENDED 31 DECEMBER 2017
Note
Thousands of Euros
2017 2016
A) CASH FLOWS FROM OPERATING ACTIVITIES 1,863,476 1,402,882
1. Profit / (Loss) before tax 1,416,674 1,002,483
2. Adjustments for: 490,878 735,667
Depreciation and amortization charge 611,218 513,934
Other adjustments to profit (net) 03.23 (120,340) 221,733
3. Changes in working capital 191,899 (178,249)
4. Other cash flows from operating activities: (235,975) (157,019)
Interest payable 17, 18 and 19 (489,422) (594,999)
Dividends received 257,327 434,856
Interest received 176,920 180,048
Income tax payment / proceeds 26 (180,800) (176,924)
B) CASH FLOWS FROM INVESTING ACTIVITIES 04, 05, 06 and
07 (301,882) 883,784
1. Investment payables: (908,702) (970,009)
Group companies, associates and business units (75,764) (107,303)
Property, plant and equipment, intangible assets and property investments (635,744) (587,554)
Other financial assets (168,582) (254,755)
Other assets (28,612) (20,397)
2. Divestment: 03, 04, 05, 06,
07 and 09 606,820 1,853,793
Group companies, associates and business units 271,233 958,632
Property, plant and equipment, intangible assets and investment property 147,231 114,253
Other financial assets 179,434 660,514
Other assets 8,922 120,394
C) CASH FLOWS FROM FINANCING ACTIVITIES (477,948) (2,476,540)
1. Equity instrument proceeds / (and payment): 02.02.f and 15 (201,008) (696,603)
Acquisition (214,572) (764,802)
Disposal 13,564 68,199
2. Liability instrument proceeds / (and payment): 17, 18 and 19 59,438 (1,383,572)
Issue 4,160,111 1,231,395
Refund and repayment (4,100,673) (2,614,967)
3. Dividends paid and remuneration relating to other equity instruments: 15.01 (297,213) (326,224)
4. Other cash flows from financing activities: (39,165) (70,141)
Other financing activity proceeds and payables (39,165) (70,141)
D) EFFECT OF CHANGES IN EXCHANGE RATES (419,106) 40,944
E) NET INCREASE / (DECREASE) IN CASH AND CASH EQUIVALENTS 664,540 (148,930)
F) CASH AND CASH EQUIVALENTS AT BEGINNING OF THE PERIOD 5,654,778 5,803,708
G) CASH AND CASH EQUIVALENTS AT END OF THE PERIOD 6,319,318 5,654,778
1. CASH FLOWS FROM OPERATING ACTIVITIES - 26,507
2. CASH FLOWS FROM INVESTING ACTIVITIES - (276,070)
3. CASH FLOWS FROM FINANCING ACTIVITIES - 66,510
NET CASH FLOWS FROM DISCONTINUED OPERATIONS - (183,053)
CASH AND CASH EQUIVALENTS AT YEAR END
Cash and banks 4,891,328 4,446,396
Other financial assets 1,427,990 1,208,382
TOTAL CASH AND CASH EQUIVALENTS AT YEAR END 6,319,318 5,654,778
The accompanying notes 01 to 39 and Appendices I to III are an integral part of the consolidated statement of cash flows for the year ended 31 December 2017.
12
ACS, Actividades de Construcción y Servicios, S.A. and Subsidiaries
Consolidated Financial Statements for the year ended 31 December 2017.
01. Group Activity
ACS, Actividades de Construcción y Servicios, S.A., the Parent, is a company incorporated in Spain in accordance with the Spanish Public Limited Liability Companies Law, and its registered office is at Avda. de Pío XII, 102, 28036 Madrid. In addition to the operations carried on directly thereby, ACS, Actividades de Construcción y Servicios, S.A. is the head of a group of subsidiaries that engage in various business activities and which compose, together with the Company, the ACS Group. Therefore, ACS, Actividades de Construcción y Servicios, S.A. is obliged to prepare, in addition to its own individual financial statements, the Group's Consolidated Financial Statements, which also include the interests in joint agreements and investments in associates. In accordance with its corporate purpose, the main business activities of ACS, Actividades de Construcción y Servicios, S.A., the Parent of the ACS Group, are as follows:
1. The business of constructing all kinds of public and private works, as well as the provision of services, for the conservation, maintenance and operation of motorways, freeways, roads and, in general any type of public or private ways and any other type of works, and any kind of industrial, commercial and financial actions and operations which bear a direct or indirect relationship thereto.
2. The promotion, construction, restoration and sale of housing developments and all kinds of buildings intended for industrial, commercial or residential purposes, either alone or through third parties. The conservation and maintenance of works, facilities and services, whether urban or industrial.
3. The direction and execution of all manner of works, facilities, assemblies and maintenance related to production plants and lines, electric power transmission and distribution, substations, transformation, interconnection and switching centers, generation and conversion stations, electric, mechanical and track installations for railways, metros and light rail, railway, light rail and trolleybus electrification, electric dam installations, purifying plants, drinking water treatment plants, wharfs, ports, airports, docks, ships, shipyards, pontoons, platforms, flotation elements, and any other elements for diagnostics, tests, security and protection, controls for interlocking, operating, metering - either directly remotely - for industries and buildings as well as those suited to the above listed facilities, electrification, public lighting and illumination, electric installations in mines, refineries and explosive environments; and in general all manner of facilities related to the production, transmission, distribution, upkeep, recovery and use of electric energy in all its stages and systems, as well as the operation repair, replacement and upkeep of the components thereof. Control and automation of all manner of electric networks and installations, remote controls and computer equipment required for the management, computerization and rationalization of all kinds of energy consumption.
4. The direction and execution of all manner of works, facilities, assemblies and maintenance related to the electronics of systems and networks for telephone, telegraph, signaling and S.O.S. communications, civil defense, defense and traffic, voice and data transmission and use, measurements and signals, as well as propagation, broadcast, repetition and reception of all kinds of waves, antennas, relays, radio-links, navigation aids, equipment and elements required for the execution of such works, assemblies and facilities.
5. The direction and execution of all manner of works, facilities, assemblies and maintenance related to the development, production, transformation, storage, transmission, channeling, distribution, use, metering and maintenance of any other kind of energy and energy product, and of any other energy that may be used in the future, including the supply of special equipment, elements required for installation and assembly, and materials of all kinds.
6. The direction and execution of all manner of works, assemblies, facilities and maintenance of hydroelectric works to develop, store, raise, drive or distribute water, and its piping, transport and distribution, including water and gas treatment facilities.
7. The direction and execution of all manner of works, assemblies, facilities and maintenance for developing, transporting, channeling and distributing liquid and solid gases for all kinds of uses.
8. The direction and execution of all manner of works, assemblies, facilities and maintenance of ventilation, heating, air conditioning and refrigeration works and works to improve the environment, for all kinds of uses.
Consolidated Financial Statements - ACS GROUP
13
9. The direction and execution of all manner of works, facilities, assemblies and maintenance related to cable cars, gondola lifts, chair lifts and aerial lifts for both passenger and material transport by means of systems of cables or any type of mechanical element. The retrieval of ships and submerged elements, maritime salvages, ship breaking, naval fleet repairs, repairs and assembly of engines and mechanical elements for ships, underwater work and sale of aquatic and sports material.
10. The manufacture, transformation, processing, handling, repair, maintenance and all manner of operations of an industrial nature for commercialization related to machinery, elements, tools, equipment, electric protection material, bare and insulated conductors, insulators, metal fittings, machines, tools and auxiliary equipment for assemblies and installation of railways, metros and light rail, electric power transmission and distribution plants, lines and networks and for telephone and telegraph communications, telecommunication, security, traffic, telematics and voice and data transmission systems; of elements and machines for the development, transformation, transmission and use of all kinds of energies and energy products; of fluid and gas lift pumps, piping and other elements, mechanisms, accessory instruments, spare parts and materials required for execution and performance of any industrial, agricultural, naval, transport, communication and mining works, facilities and assemblies and others listed in the preceding paragraphs. The production, sale and use of electricity and of other energy sources and the performance of studies relating thereto, and the production, exploration, sale and use of all manner of solid, liquid or gaseous primary energy resources, including specifically all forms and kinds of hydrocarbons and natural, liquefied or any other type of gas. Energy planning and rationalization of the use of energy and combined heat and power generation. The research, development and exploitation of communications and information technologies in all their facets.
11. The manufacture, installation, assembly, erection, supply, maintenance and commercialization of all kinds of products and elements pertaining to or derived from concrete, ceramics, resins, varnishes, paints, plastics or synthetic materials; as well as metal structures for industrial plants and buildings, bridges, towers and supports of metal or reinforced concrete or any synthetic material for all manner of communications and electric power transmission or distribution, or any other class of energy material or product related to all types of energy.
12. The manufacture, preparation, handling and finishing, diagnosis, treatment and impregnation for protection and preservation and sale of wood in general, and especially of posts used for electric, telephone and telegraph lines, impregnation or servicing for mine and gallery timbering, building supports, construction woodwork, crossties for railways and barricades, and the production and commercialization of antiseptic products and running of procedures for preserving wood, elements, tools and equipment of this nature. The acquisition, provision, application and use of paints, varnishes, coverings, plating and, in general, construction materials.
13. The management and execution of reforestation and agricultural and fishery restocking works, as well as the maintenance and improvement thereof. Landscaping, planting, revegetation, reforestation, maintenance and conservation of parks, gardens and accessory elements.
14. The manufacture, installation, distribution and use in any way of all manner of ads and advertising supports. The design, construction, fabrication, installation, maintenance, cleaning, upkeep and advertising use of all manner of street furniture and similar elements.
15. The provision of all manner of public and private services of an urban nature, including the execution of any necessary works and facilities, either by administrative concession or leasing. The treatment, recycling and recovery of all kinds of urban, urban-similar, industrial and sanitary waste; the treatment and sale of waste products, as well as the management and operation of waste treatment and transfer plants. Drafting and processing of all manner of environment-related projects.
16. The cleaning services for buildings, constructions and works of any kind, of offices, commercial premises and public places. Preparation, upkeep, maintenance, sterilization, disinfection and extermination of rodents. Cleaning, washing, ironing, sorting and transportation of clothing.
17. Furniture assemblies and installations, including tables, shelves, office material, and similar or complementary objects.
18. Transports of all kinds, especially ground transportation of passengers and merchandise, and the activities related thereto. Management and operation, as well as provision of auxiliary and complementary services, of all manner of buildings and properties or complexes for public or private use, intended for use as service areas or stations, recreational areas, and bus or intermodal transportation stations.
14
19. The provision of integral health care and social assistance services by qualified personnel (physicians, psychologists, educators, university graduates in nursing, social workers, physical therapists and therapists) and performance of the following tasks: home care service; tele-home care and social health care; total or partial running or management of homes, day care centers, therapeutic communities and other shelters and rehabilitation centers; transportation and accompaniment of the above-mentioned collectives; home hospitalization and medical and nursing home care; supply of oxygen therapy, gas control, electro-medicine, and associated activities.
20. Provision of auxiliary services in housing developments, urban properties, industrial facilities, roadway networks, shopping centers, official agencies and administrative departments, sports or recreational facilities, museums, fairgrounds, exhibition galleries, conference and congress halls, hospitals, conventions, inaugurations, cultural and sports centers, sporting, social and cultural events, exhibits, international conferences, annual general meetings and owners' association meetings, receptions, press conferences, teaching centers, parks, farming facilities (agricultural, livestock and fisheries), forests, rural farms, hunting reserves, recreational and entertainment areas, and in general all kinds of properties and events, by means of porters, superintendents, janitors, ushers, guards or controllers, console operators, auditorium personnel, concierges, receptionists, ticket clerks (including ticket collection), telephone operators, collectors, caretakers, first aid personnel, hostesses and similar personnel or personnel who complement their functions, consisting of the maintenance and upkeep of the premises, as well as attention and service to neighbors, occupants, visitors and/ or users, by undertaking the appropriate tasks, excluding in all cases those which the law reserves for security firms. Collection and tallying of cash, and the making, collection and charging of bills and receipts. The development, promotion, exhibition, performance, acquisition, sale and provision of services in the field of art, culture and recreation, in their different activities, forms, expressions and styles.
21. Provision of emergency, prevention, information, telephone switchboard, kitchen and dining hall services. Opening, closing and key custody. Turning on and off, running, supervision, maintenance and repair of engines and heating and air conditioning, electricity and lift installations, water, gas and other supply pipes, and fire protection systems. The operation of rapid communication systems with public assistance services, such as police, firemen, hospitals and medical centers. Fire fighting and prevention services in general, in woodlands, forests, rural farms, and industrial and urban facilities.
22. Integral management or operation of public or private educational or teaching centers, as well as surveillance, service, education and control of student bodies or other educational collectives.
23. Reading of water, gas and electricity meters, maintenance, repair and replacement thereof, monitoring and transcription of readouts, meter inspection, data acquisition and updating, and installment of alarms. Temperature and humidity measurements on roadways and, in general, all kinds of properties and real estate, and public and private facilities, providing all the controls required for proper upkeep and maintenance thereof, or of the goods deposited or guarded therein.
24. Handling, packing and distribution of food or consumer products; processing, flavoring and distribution of food for own consumption or supply to third parties; servicing, replacement and maintenance of equipment, machinery and dispensing machines of the mentioned products; and participation in operations with raw materials, manufactured goods and supplies.
25. Provision of ground services to passengers and aircraft. Integral logistic freight services, such as: loading, unloading, stowing and unstowing, transport, distribution, placement, sorting, warehouse control, inventory preparation, replacement, control of warehouse stocks and storage of all kinds of merchandise, excluding the activities subject to special legislation. Management and operation of places of distribution of merchandise and goods in general, and especially perishable products, such as fish exchanges and wholesale and retail markets. Reception, docking, mooring and service connections to boats.
26. Direct advertising services, franking and mailing of printed advertising and publicity material and, in general, all kinds of documents and packages, on behalf of the clients.
27. Management, operation, administration, maintenance, upkeep, refurbishment and fitting out of all kinds of concessions in the broadest sense of the word, including those that are part of the concessionary firm's shareholders and those that have any type of contractual relation to develop any of the above-listed activities.
Consolidated Financial Statements - ACS GROUP
15
28. The acquisition, holding, use, administration and disposal of all manner of own-account securities, excluding activities that special legislation, and in particular the legislation on the stock market, exclusively ascribes to other entities.
29. To manage and administer fixed-income and equity securities of companies not resident in Spain, through the related organization of the appropriate material and human resources.
30. Preparation of all manner of studies, reports and projects, and entering into contracts concerning the activities indicated in this article, as well as supervision, direction and consulting in the execution thereof.
31. Occupational training and recycling of people who provide the services described in the preceding points.
02. Basis of Presentation of the Consolidated Financial Statements and Basis of Consolidation
02.01. Basis of presentation
The ACS Group’s Consolidated Financial Statements for 2017 were prepared:
- By the directors of the Parent, at the Board of Directors' Meeting held on 22 March 2018.
- In accordance with International Financial Reporting Standards (IFRSs), as adopted by the European Union, in conformity with Regulation (EC) no. 1606/2002 of the European Parliament and of the Council and subsequent amendments. The consolidation bases and the principal accounting policies and measurement bases applied in preparing the Group's Consolidated Financial Statements for 2017 are summarized in Notes 02 and 03.
- Taking into account all the mandatory accounting policies and rules and measurement bases with a material effect on the consolidated financial statements, as well as the alternative treatments permitted by the relevant legislation in this connection, which are specified in Note 03 (Accounting Policies).
- So that they present fairly the Group's consolidated equity and financial position at 31 December 2017, and the results of its operations, the changes in consolidated equity and the consolidated cash flows in the year then ended.
- On the basis of the accounting records kept by the Company and by the other Group companies.
However, since the accounting policies and measurement bases used in preparing the Group's Consolidated Financial Statements for 2017 (IFRSs as adopted by the European Union) differ from those used by the Group companies (local standards), the required adjustments and reclassifications were made on consolidation to unify the policies and methods used and to make them compliant with the International Financial Reporting Standards adopted by the European Union. Except as indicated in the following paragraph, the bases of consolidation applied in 2017 are consistent with those applied in the 2016 Consolidated Financial Statements. The information contained in those consolidated financial statements corresponding to the year ended 31 December 2016 is presented solely for the purposes of comparison thereof with the information relating to the year ended 31 December 2017. When comparing the information, it is necessary to consider the sale of the Urbaser business which took place during December 2016, as an discontinued operation at 31 December 2016, as explained in Note 03.09, which resulted in the application of IFRS 5 "Non-current assets held for sale and discontinued operations.” Given that this was a significant line of business (approximately 5% of the net turnover) and one that represented the ACS Group's environmental operations segment from an operational point of view, the Group deemed it appropriate to record such operations as discontinued. In addition to that described in the paragraphs above, and as a result of the acquisition of UGL by Cimic (see Note 02.02.f) being undertaken very close to the end of fiscal year 2016, the fair value of the identifiable assets
16
and liabilities of UGL (Purchase Price Allocation or PPA) were provisional and had not been finalized. In accordance with current regulations, there is a twelve-month period to complete the definitive allocation of purchase of net assets, and at close on 31 December 2017 the accounting of the business combination had been completed, and therefore the comparative information in the consolidated statement of financial position at 31 December 2016 has been retrospectively re-expressed, increasing the fair value of accounts payable on the date of acquisition by EUR 41,107 (AUD 60.0 million) and increasing differed tax assets by EUR 12,333 thousand (AUD 18.0 million), as well as increasing goodwill and reducing net equity by EUR 14,387 thousand each (AUD 21.0 million) (see Note 02.02.f). The explanatory notes include events or changes that might appear significant in explaining changes in the financial position and consolidated results of the ACS Group since the date of the above-mentioned Consolidated Financial Statements of the Group. The ACS Group's Consolidated Financial Statements for 2016, (IFRSs as adopted by the European Union) were approved by the shareholders at the Annual General Meeting of ACS, Actividades de Construcción y Servicios, S.A. held on 4 May 2017. The 2017 Consolidated Financial Statements of the ACS Group have not yet been approved by the shareholders at the Annual General Meeting. However, the Parent's Board of Directors considers that the aforementioned financial statements will be approved without any material changes. Responsibility for the information and use of estimates The information in these Consolidated Financial Statements is the responsibility of the directors of the Group's Parent. The Consolidated Financial Statements were prepared from the 2017 accounting records of ACS, Actividades de Construcción y Servicios, S.A. and of its Group companies whose respective separate financial statements were approved by the directors of each company and business segment, once they had been adapted for consolidation in conformity with International Financial Reporting Standards as adopted by the European Union. In the ACS Group's Consolidated Financial Statements, estimates were occasionally made in order to quantify certain of the assets, liabilities, income, expenses and commitments reported herein. These estimates relate basically to the following:
- The measurement aimed at determining any impairment losses on certain assets (Notes 03.01, 03.06 and 10).
- The fair value of assets acquired in business combinations (Note 02.02.f). - The measurement of goodwill and the allocation of assets on acquisitions (Note 03.01). - The recognition of earnings in construction contracts (Note 03.16.01). - The amount of certain provisions (Note 03.13). - The assumptions used in the calculation of liabilities and obligations to employees (Note 03.12). - The market value of the derivatives (such as equity swaps, interest rate swaps, etc.) mentioned in Note 22. - The useful life of the intangible assets and property, plant and equipment (Notes 03.02 and 03.03). - The recovery of deferred tax assets (Note 26.05). - Financial risk management (Note 21).
Although these estimates were made on the basis of the best information available at the date of preparation of these Consolidated Financial Statements on the events analyzed, events that take place in the future might make it necessary to change these estimates (upwards or downwards) in coming years, which will be applied prospectively, recognizing the effects of the change in the accounting estimate in the corresponding future Consolidated Financial Statements. Changes in accounting estimates and policies and correction of fundamental errors Changes in accounting estimates.- The effect of any change in accounting estimates is recognized in the same income statement line item as that in which the expense or income measured using the previous estimate had been previously recognized. Changes in accounting policies and correction of fundamental errors.- In accordance with IAS 8, the effect of any change in accounting policies and of any correction of fundamental errors is recognized as follows: the cumulative

Consolidated Financial Statements - ACS GROUP
17
effect at the beginning of the year is adjusted in reserves, whereas the effect on the current year is recognized in profit or loss. Also, in these cases the financial data for the comparative year presented together with the year in course is restated. No errors were corrected in the 2016 Consolidated Financial Statements, nor have there been any significant accounting policy changes. Except as indicated in the following paragraph, the bases of consolidation applied in 2017 are consistent with those applied in the 2016 Consolidated Financial Statements. Functional currency These Consolidated Financial Statements are presented in euros, since this is the functional currency in the area in which the Group operates. Transactions in currencies other than the euro are recognized in accordance with the policies established in Note 03.21.
02.02. Consolidation principles a) Balances and transactions with Group companies and Associates
The significant intra-Group balances and transactions are eliminated on consolidation. Accordingly, all gains obtained by Associates up to their percentage of ownership interest and all gains obtained by fully consolidated companies were eliminated.
However, in accordance with the criteria provided by IFRIC 12, balances and transactions relating to construction projects undertaken by companies of the Construction and Industrial Services division for concession operators are not eliminated on consolidation since these transactions are considered to have been performed for third parties as the projects are being completed. b) Standardization of items In order to uniformly present the various items comprising these Consolidated Financial Statements, accounting standardization criteria have been applied to the individual financial statements of the companies included in the scope of consolidation. In 2017 and 2016 the reporting date of the financial statements of all the companies included in the scope of consolidation was the same or was temporarily brought into line with that of the Parent. c) Subsidiaries “Subsidiaries” are defined as companies over which the ACS Group has the capacity to exercise control, i.e. in accordance with IFRS 10, when it has the power to lead their relevant activities, it is exposed to variable revenues as a result of their stake in the subsidiary, and is able to exercise said power in order to influence its own revenues, either directly or through other companies it controls. The financial statements of the subsidiaries are fully consolidated with those of the Parent. Where necessary, adjustments are made to the financial statements of the subsidiaries to adapt the accounting policies used to those applied by the Group. At 31 December 2017, the ACS Group held an effective interest of less than 50% in companies that are considered subsidiaries, the most representative companies of which holding assets exceeding EUR 4 million are Consorcio Constructor Piques y Túneles Línea 6 Metro, S.A. and Salam Sice Tech Solutions Llc. Likewise, at 31 December 2016 the ACS Group had an effective interest of less than 50% in companies that were considered subsidiaries, the most representative of which holding assets exceeding EUR 5 million were Consorcio Constructor Piques y Túneles Línea 6 Metro, S.A. and Salam Sice Tech Solutions Llc. The main companies in the ACS Group with dividend rights of more than 50% which are not fully consolidated include: Bow Power S.L., Autovía de La Mancha, S.A., Concesionaria JCC Castilla La Mancha, Inversora de la Autovía de la Mancha, S.A., Autovía del Pirineo, S.A., Concesionaria Santiago Brión, S.A., Eix Diagonal Concessionària de la Generalitat de Catalunya, S.A., Reus-Alcover Concessionària de la Generalitat de
18
Catalunya, S.A., Autovía de los Pinares, S.A., Sociedad Concesionaria Ruta del Canal, S.A. and Benisaf Water Company, Spa. This circumstance arises either because the control over these companies is exercised by other shareholders or because decisions require the affirmative vote of another or other shareholders, and consequently, they have been accounted for using the equity method. The relevant decisions may vary for each agreement but, in general, the other shareholder can veto any decision relating to (i) appointment, renewal, removal or replacement of the General Manager (CEO), Chief Financial Officer (CFO) and Chief Operating Officer (COO), (ii) approval of the distribution of dividends and reserves not approved in the business plan, (iii) any change in business activity, (iv) approval of the business plan and budget and/or the final decision regarding investment in a development project, (v) refinancing or restructuring or rebalancing agreements, (vi) changes in financial policies (coverage, leverage, guarantees…), (vii) approval of the annual financial statements and application of the results, etc.
On acquisition, the assets, liabilities and contingent liabilities of a subsidiary are measured at their fair values at the date of acquisition. Any excess of the cost of acquisition over the fair values of the identifiable net assets acquired is recognized as goodwill. Any deficiency of the cost of acquisition below the fair values of the identifiable net assets acquired (i.e., a discount on acquisition) is credited to profit and loss on the acquisition date. The interest of non-controlling shareholders is stated at their proportion of the fair values of the assets and liabilities recognized. Also, the share of third parties of:
- The equity of their investees is presented within the Group's equity under "Non-controlling interests" in the consolidated statement of financial position.
- The profit for the year is presented under "Profit / (loss) attributed to non-controlling interests" and "Profit from
discontinued operations attributable to non-controlling interests" in the Group’s consolidated income statement and the consolidated statement of changes in equity.
The results of subsidiaries acquired during the year are included in the consolidated income statement from the date of acquisition to year-end. Similarly, the results of subsidiaries disposed of during the year are included in the consolidated income statement from the beginning of the year to the date of disposal. Appendix I to these Notes to the Consolidated Financial Statements details the subsidiaries and information thereon.
Section f) of this Note contains information on acquisitions and disposals, as well as increases and decreases in ownership interest. d) Jointly controlled entities
Contracts executed using the form of Spanish Unincorporated Joint Ventures (Uniones Temporales de Empresas - UTEs) or similar entities that meet the IFRS 11 requirements are consolidated using the proportional integration method, and in cases of joint control, there is direct control by partners in the assets, liabilities, revenues, expenses and joint and several liability therein. Within the joint agreements in which the ACS Group operates, mention should be made of the Uniones Temporales de Empresas and similar entities (various types of joint ventures) abroad, which are entities through which cooperation arrangements are entered into with other venturers in order to carry out a project or provide a service for a limited period of time. The assets and liabilities assigned to these types of entities are recognized in the consolidated statement of financial position, classified according to their specific nature on the basis of the existing percentage of ownership. Similarly, income and expenses arising from these entities is presented in the consolidated income statement on the basis of their specific nature and in proportion to the Group's ownership interest. Notes 08 and 09 contain relevant information on the relevant joint ventures.
Consolidated Financial Statements - ACS GROUP
19
e) Associates
The companies over which the ACS Group maintains significant influence or joint control are consolidated using the equity method in those cases where they do not meet the requirements of the IFRS 11 to be classified as Joint Agreements. Exceptionally, the following entities are not considered to be Group Associates since they do not have a significant influence, or are fully inoperative and irrelevant for the Group as a whole. Of note in this regard is Accesos de Madrid Concesionaria Española, S.A., which as a result of the agreements reached with the other partners, bring the lack of significant influence to an end. Therefore, the investments are recognized as available-for-sale financial assets under valuation adjustments to equity. Investments in Associates are accounted for using the equity method, whereby they are initially recognized at acquisition cost. Subsequently, on each reporting date, they are measured at cost, plus the changes in the net assets of the Associate based on the Group's percentage of ownership. The excess of the cost of acquisition over the Group's share of the fair value of the net assets of the Associate at the date of acquisition is recognized as goodwill. The goodwill relating to an Associate is included in the carrying amount of the investment and is not amortized. Any excess in the Group's share in the fair value of the net assets of the Associate over acquisition cost at the acquisition date is recognized in profit or loss. The profit or loss, net of tax, of the Associates is included in the Group’s consolidated income statement under "Results of companies accounted for using the equity method”, in proportion to the percentage of ownership. Previously, the appropriate adjustments were made to take into account the depreciation of the depreciable assets based on their fair value at the date of acquisition. If as a result of losses incurred by an Associate its equity is negative, the investment should be presented in the Group's consolidated statement of financial position with a zero value, unless the Group is obliged to give it financial support. Note 09 contains relevant information on the material entities. f) Changes in the scope of consolidation
The main changes in the scope of consolidation of the ACS Group (formed by ACS, Actividades de Construcción y Servicios, S.A. and its Subsidiaries) in the year ended 31 December 2017 are described in Appendix III. Acquisitions, sales, and other corporate transactions During 2017 and 2016 the inclusion of companies into the scope of consolidation occurred mainly due to the incorporation thereof, except for the acquisition of UGL and Sedgman in fiscal year 2016, detailed in the same Note. The following transactions were of particular note for fiscal year 2017: In February 2017 and having complied with the authorizations, the ACS Group, through its subsidiary ACS Servicios y Concesiones, S.L., completed the agreement reached in December 2016 with the French company Compagnie d’Affrètement et de Transport S.A.S. (CAT), for the sale of its total stake in Sintax, S.A. for EUR 55 million and with a net capital gain after tax on the transaction of EUR 5.8 million. In addition, through its subsidiary Concesiones Viarias Chile, S.A., the ACS Group has entered into an agreement for the sale of 100% of its ownership interest in the concessionaire Rutas del Canal, S.A., owner of the concession agreement for the implementation, conservation and exploitation of the public work called “Concesión Ruta 5, Tramo Puerto Montt – Pargua”, between the Public Investment Fund Penta Las Américas Infraestructura Tres, with a company value of 100% of EUR 142 million and an approximate gain of EUR 10 million. 2017 has seen the disposal of 80% of the ownership stake in Gestión de Centros Sanitarios Insulares, S.L. and 100% of the ownership stake in the Nea Odos Concession, Central Greece Motorway Concession, concessionaire Atención Primaria, S.A., Huesca Oriental Depura, S.A., concessionaire Vial del Pacífico, S.A.S. and concessionaire Vial del Mar S.A.S projects.
20
Finally, through its Portuguese subsidiary PROCME, the ACS Group has reached an agreement for the sale to Saeta Yield, S.A., of Lestenergia Exploraçao de Parques Eólicos, S.A., for a total company value of EUR 181 million, a price of EUR 104 million and a profit after tax and non-controlling interests of approximately EUR 12 million (see Note 09). The following transactions can be highlighted in 2016: Acquisition of UGL
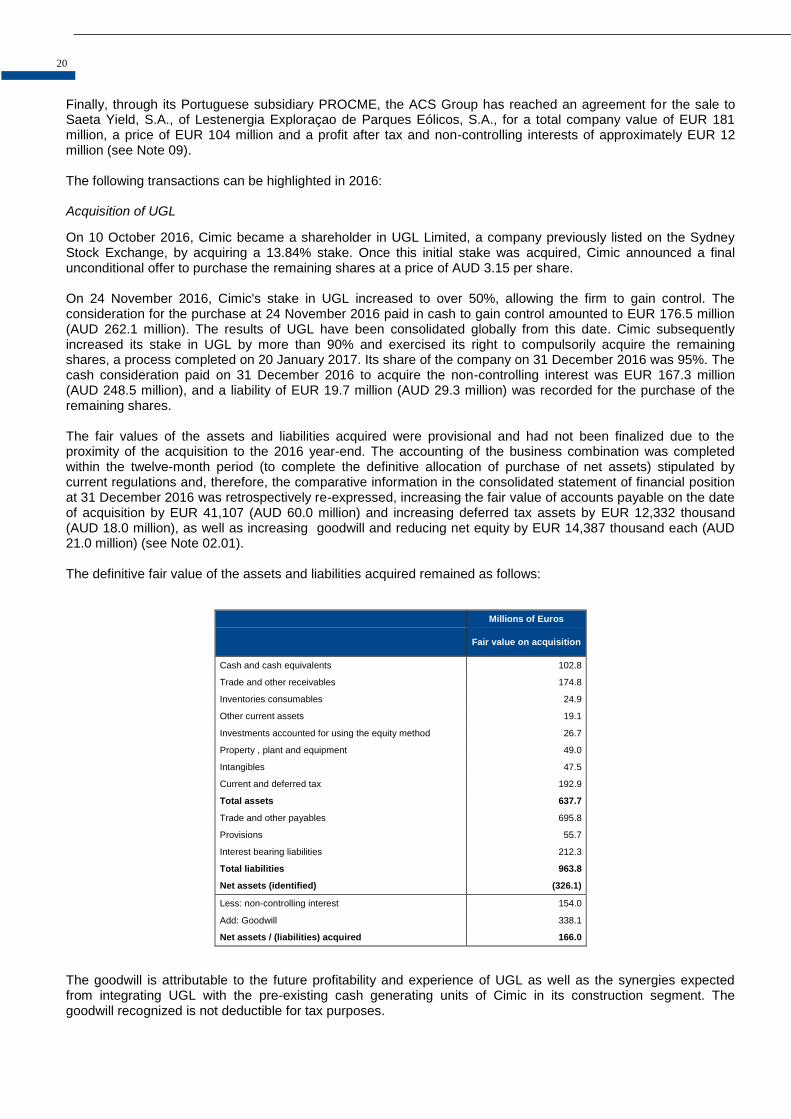
On 10 October 2016, Cimic became a shareholder in UGL Limited, a company previously listed on the Sydney Stock Exchange, by acquiring a 13.84% stake. Once this initial stake was acquired, Cimic announced a final unconditional offer to purchase the remaining shares at a price of AUD 3.15 per share. On 24 November 2016, Cimic's stake in UGL increased to over 50%, allowing the firm to gain control. The consideration for the purchase at 24 November 2016 paid in cash to gain control amounted to EUR 176.5 million (AUD 262.1 million). The results of UGL have been consolidated globally from this date. Cimic subsequently increased its stake in UGL by more than 90% and exercised its right to compulsorily acquire the remaining shares, a process completed on 20 January 2017. Its share of the company on 31 December 2016 was 95%. The cash consideration paid on 31 December 2016 to acquire the non-controlling interest was EUR 167.3 million (AUD 248.5 million), and a liability of EUR 19.7 million (AUD 29.3 million) was recorded for the purchase of the remaining shares. The fair values of the assets and liabilities acquired were provisional and had not been finalized due to the proximity of the acquisition to the 2016 year-end. The accounting of the business combination was completed within the twelve-month period (to complete the definitive allocation of purchase of net assets) stipulated by current regulations and, therefore, the comparative information in the consolidated statement of financial position at 31 December 2016 was retrospectively re-expressed, increasing the fair value of accounts payable on the date of acquisition by EUR 41,107 (AUD 60.0 million) and increasing deferred tax assets by EUR 12,332 thousand (AUD 18.0 million), as well as increasing goodwill and reducing net equity by EUR 14,387 thousand each (AUD 21.0 million) (see Note 02.01). The definitive fair value of the assets and liabilities acquired remained as follows:
Millions of Euros
Fair value on acquisition
Cash and cash equivalents 102.8
Trade and other receivables 174.8
Inventories consumables 24.9
Other current assets 19.1
Investments accounted for using the equity method 26.7
Property , plant and equipment 49.0
Intangibles 47.5
Current and deferred tax 192.9
Total assets 637.7
Trade and other payables 695.8
Provisions 55.7
Interest bearing liabilities 212.3
Total liabilities 963.8
Net assets (identified) (326.1)
Less: non-controlling interest 154.0
Add: Goodwill 338.1
Net assets / (liabilities) acquired 166.0
The goodwill is attributable to the future profitability and experience of UGL as well as the synergies expected from integrating UGL with the pre-existing cash generating units of Cimic in its construction segment. The goodwill recognized is not deductible for tax purposes.
Consolidated Financial Statements - ACS GROUP
21
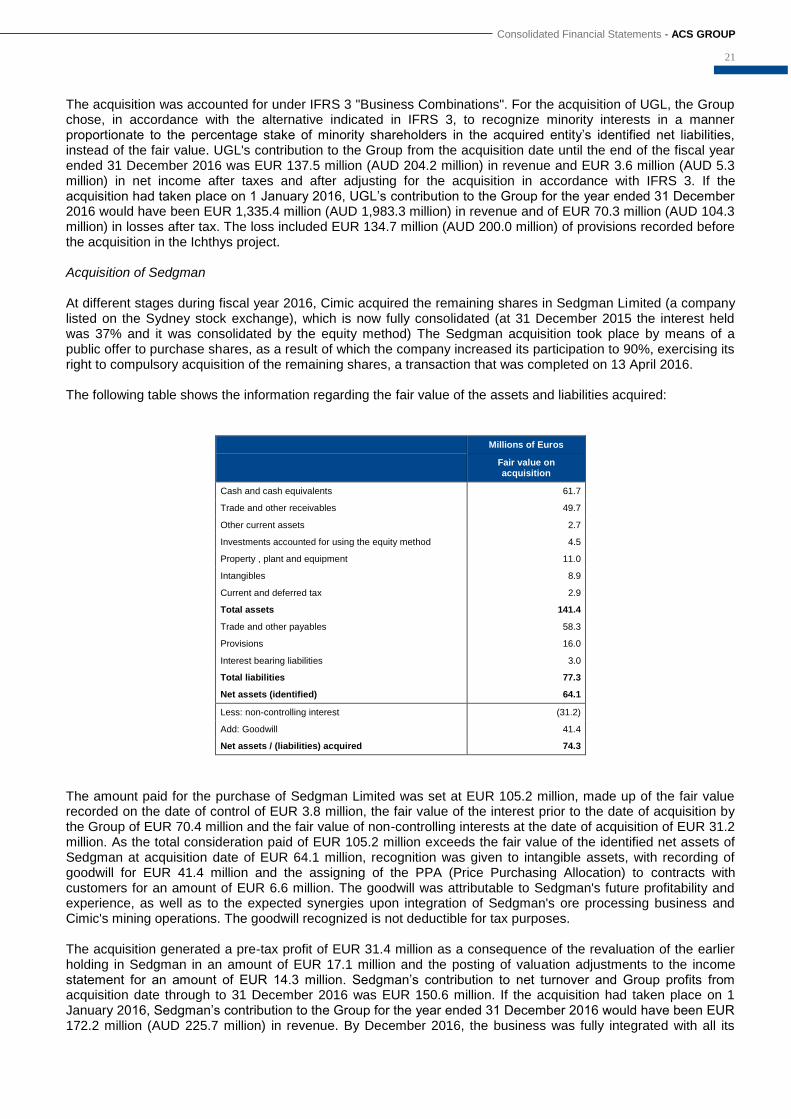
The acquisition was accounted for under IFRS 3 "Business Combinations". For the acquisition of UGL, the Group chose, in accordance with the alternative indicated in IFRS 3, to recognize minority interests in a manner proportionate to the percentage stake of minority shareholders in the acquired entity’s identified net liabilities, instead of the fair value. UGL's contribution to the Group from the acquisition date until the end of the fiscal year ended 31 December 2016 was EUR 137.5 million (AUD 204.2 million) in revenue and EUR 3.6 million (AUD 5.3 million) in net income after taxes and after adjusting for the acquisition in accordance with IFRS 3. If the acquisition had taken place on 1 January 2016, UGL’s contribution to the Group for the year ended 31 December 2016 would have been EUR 1,335.4 million (AUD 1,983.3 million) in revenue and of EUR 70.3 million (AUD 104.3 million) in losses after tax. The loss included EUR 134.7 million (AUD 200.0 million) of provisions recorded before the acquisition in the Ichthys project. Acquisition of Sedgman At different stages during fiscal year 2016, Cimic acquired the remaining shares in Sedgman Limited (a company listed on the Sydney stock exchange), which is now fully consolidated (at 31 December 2015 the interest held was 37% and it was consolidated by the equity method) The Sedgman acquisition took place by means of a public offer to purchase shares, as a result of which the company increased its participation to 90%, exercising its right to compulsory acquisition of the remaining shares, a transaction that was completed on 13 April 2016. The following table shows the information regarding the fair value of the assets and liabilities acquired:
Millions of Euros
Fair value on acquisition
Cash and cash equivalents 61.7
Trade and other receivables 49.7
Other current assets 2.7
Investments accounted for using the equity method 4.5
Property , plant and equipment 11.0
Intangibles 8.9
Current and deferred tax 2.9
Total assets 141.4
Trade and other payables 58.3
Provisions 16.0
Interest bearing liabilities 3.0
Total liabilities 77.3
Net assets (identified) 64.1
Less: non-controlling interest (31.2)
Add: Goodwill 41.4
Net assets / (liabilities) acquired 74.3
The amount paid for the purchase of Sedgman Limited was set at EUR 105.2 million, made up of the fair value recorded on the date of control of EUR 3.8 million, the fair value of the interest prior to the date of acquisition by the Group of EUR 70.4 million and the fair value of non-controlling interests at the date of acquisition of EUR 31.2 million. As the total consideration paid of EUR 105.2 million exceeds the fair value of the identified net assets of Sedgman at acquisition date of EUR 64.1 million, recognition was given to intangible assets, with recording of goodwill for EUR 41.4 million and the assigning of the PPA (Price Purchasing Allocation) to contracts with customers for an amount of EUR 6.6 million. The goodwill was attributable to Sedgman's future profitability and experience, as well as to the expected synergies upon integration of Sedgman's ore processing business and Cimic's mining operations. The goodwill recognized is not deductible for tax purposes. The acquisition generated a pre-tax profit of EUR 31.4 million as a consequence of the revaluation of the earlier holding in Sedgman in an amount of EUR 17.1 million and the posting of valuation adjustments to the income statement for an amount of EUR 14.3 million. Sedgman’s contribution to net turnover and Group profits from acquisition date through to 31 December 2016 was EUR 150.6 million. If the acquisition had taken place on 1 January 2016, Sedgman’s contribution to the Group for the year ended 31 December 2016 would have been EUR 172.2 million (AUD 225.7 million) in revenue. By December 2016, the business was fully integrated with all its
22
mining operations meaning that it was not possible to assess its contribution to the Group's net income in that fiscal year. In terms of sales it is worth highlighting the divestment in the Urbaser Group (see Note 03.09) that was considered as a discontinued operation. Also noteworthy under this heading is the gain on the sale in December 2016 of the remaining 29% stake in Nextgen held by Cimic to Ontario Teachers' Pension Plan amounting to EUR 47.2 million. Additionally, in 2016 the sale of the Tres Hermanas and Marcona wind farms and the sale of 50% of three companies holding electricity transmission line concessions in Brazil (Esperanza Transmissora de Energía, S.A., Odoyá Transmissora de Energía, S.A. and Transmissora José María de Macedo de Electricidad, S.A.) took place, giving rise to a combined profit of EUR 3,896 thousand.
03. Accounting Policies The principal accounting policies used in preparing the Group's Consolidated Financial Statements, in accordance with International Financial Reporting Standards (IFRSs), as adopted by the European Union, were as follows:
03.01. Goodwill Goodwill arising on consolidation represents the excess of the cost of acquisition over the Group's interest in the fair value of a subsidiary’s or jointly controlled entity’s identifiable assets and liabilities at the date of acquisition. Any excess of the cost of the investments in the consolidated companies over the corresponding underlying carrying amounts acquired, adjusted at the date of first-time consolidation, is allocated as follows:
- If it is attributable to specific assets and liabilities of the companies acquired, increasing the value of the assets (or reducing the value of the liabilities) whose market values were higher (lower) than the carrying amounts at which they had been recognized in their balance sheets and whose accounting treatment (amortization, accrual, etc.) was similar to that of the same assets (liabilities) of the Group. Those attributable to specific intangible assets are recognized explicitly in the consolidated statement of financial position provided that the fair value at the acquisition date can be measured reliably.
- Goodwill is only recognized when it has been acquired for consideration and represents, therefore, a payment made by the acquirer in anticipation of future economic benefits from assets of the acquired company that are not capable of being individually identified and separately recognized.
- Goodwill acquired on or after 1 January 2004, is measured at acquisition cost, and that acquired earlier is
recognized at the carrying amount at 31 December 2003.
In all cases, at the end of each reporting period goodwill is reviewed for impairment (i.e., a reduction in its recoverable amount to below its carrying amount) and, if there is any impairment, the goodwill is written down with a charge to "Impairment and gains on the disposal of non-current assets" in the consolidated income statement, since, as stipulated in IFRS 3, goodwill is not amortized. An impairment loss recognized for goodwill must not be reversed in a subsequent period. On disposal of a subsidiary or jointly controlled entity, the attributable amount of goodwill is included in the determination of the gain or loss on disposal. Goodwill arising on the acquisition of companies with a functional currency other than the euro is translated to euros at the exchange rates prevailing at the date of the consolidated statement of financial position, and changes are recognized as translation differences or impairment, as appropriate. Any negative differences between the cost of investments in consolidated companies and Associates below the related underlying carrying amounts acquired, adjusted at the date of first-time consolidation, is classified as negative goodwill and is allocated as follows:

Consolidated Financial Statements - ACS GROUP
23
- If the negative goodwill is attributable to specific assets and liabilities of the companies acquired, by increasing the value of the liabilities (or reducing the value of the assets) whose market values were higher (lower) than the carrying amounts at which they had been recognized in their balance sheets and whose accounting treatment (amortization, accrual, etc.) was similar to that of the same assets (liabilities) of the Group.
- The remaining amounts are presented under "Other profit or loss" in the consolidated income statement for the year in which the share capital of the subsidiary or Associate is acquired.
03.02. Other intangible assets
Intangible assets are identifiable non-monetary assets, without physical substance, which arise as a result of a legal transaction or which are developed internally by the consolidated companies. Only assets whose cost can be estimated reliably and from which the consolidated companies consider it probable that future economic benefits will be generated are recognized.
Intangible assets are measured initially at acquisition or production cost, and are subsequently measured at cost less any accumulated amortization and any accumulated impairment losses. These assets are amortized over their useful life.
The ACS Group recognizes any impairment loss on the carrying amount of these assets with a charge to "Impairment and gains on the disposal of non-current assets" in the consolidated income statement. The criteria used to recognize the impairment losses on these assets and, where applicable, the reversal of impairment losses recognized in prior years are similar to those used for property, plant and equipment (Note 03.06).
03.02.01 Development expenditure Development expenditure is only recognized as intangible assets if all of the following conditions are met:
- an identifiable asset is created (such as computer software or new processes); - it is probable that the asset created will generate future economic benefits; and - the development cost of the asset can be measured reliably.
Internally generated intangible assets are amortized on a straight-line basis over their useful lives (over a maximum of five years). Where no internally generated intangible asset can be recognized, development expenditure is recognized as an expense in the year in which it is incurred.
03.02.02 Administrative concessions Concessions may only be recognized as assets when they have been acquired by the company for a consideration (in the case of concessions that can be transferred) or for the amount of the expenses incurred to directly obtain the concession from the State or from the related public agency. Concessions are generally amortized on a straight-line basis over the term of the concession. In the event of non-compliance, leading to the loss of the concession rights, the carrying amount of the concession is written off.
03.02.03 Computer software The acquisition and development costs incurred in relation to the basic computer systems used in the Group's management are recorded with a charge to "Other intangible assets" in the consolidated statement of financial position. Computer system maintenance costs are recognized with a charge to the consolidated income statement for the year in which they are incurred. Computer software may be contained in a tangible asset or have physical substance and, therefore, incorporate both tangible and intangible elements. These assets will be recognized as property, plant and equipment if they constitute an integral part of the related tangible asset, which cannot operate without that specific software.
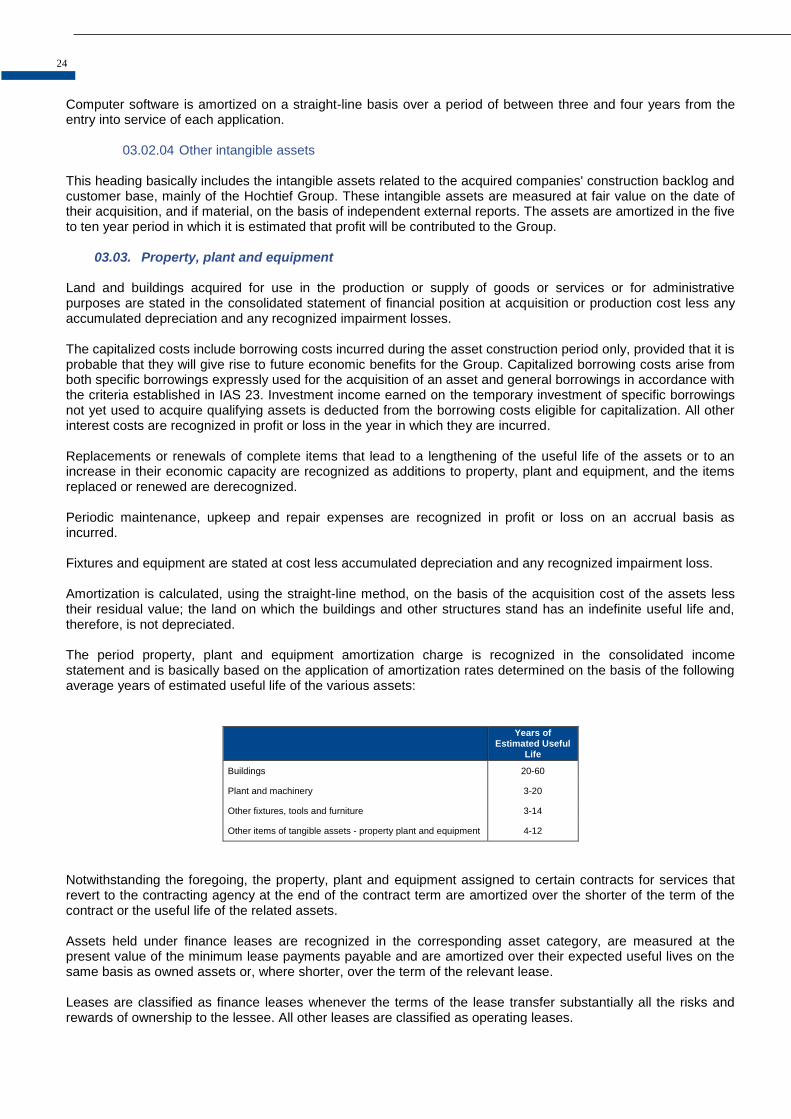
24
Computer software is amortized on a straight-line basis over a period of between three and four years from the entry into service of each application.
03.02.04 Other intangible assets This heading basically includes the intangible assets related to the acquired companies' construction backlog and customer base, mainly of the Hochtief Group. These intangible assets are measured at fair value on the date of their acquisition, and if material, on the basis of independent external reports. The assets are amortized in the five to ten year period in which it is estimated that profit will be contributed to the Group.
03.03. Property, plant and equipment
Land and buildings acquired for use in the production or supply of goods or services or for administrative purposes are stated in the consolidated statement of financial position at acquisition or production cost less any accumulated depreciation and any recognized impairment losses. The capitalized costs include borrowing costs incurred during the asset construction period only, provided that it is probable that they will give rise to future economic benefits for the Group. Capitalized borrowing costs arise from both specific borrowings expressly used for the acquisition of an asset and general borrowings in accordance with the criteria established in IAS 23. Investment income earned on the temporary investment of specific borrowings not yet used to acquire qualifying assets is deducted from the borrowing costs eligible for capitalization. All other interest costs are recognized in profit or loss in the year in which they are incurred. Replacements or renewals of complete items that lead to a lengthening of the useful life of the assets or to an increase in their economic capacity are recognized as additions to property, plant and equipment, and the items replaced or renewed are derecognized. Periodic maintenance, upkeep and repair expenses are recognized in profit or loss on an accrual basis as incurred. Fixtures and equipment are stated at cost less accumulated depreciation and any recognized impairment loss. Amortization is calculated, using the straight-line method, on the basis of the acquisition cost of the assets less their residual value; the land on which the buildings and other structures stand has an indefinite useful life and, therefore, is not depreciated. The period property, plant and equipment amortization charge is recognized in the consolidated income statement and is basically based on the application of amortization rates determined on the basis of the following average years of estimated useful life of the various assets:
Years of
Estimated Useful Life
Buildings 20-60
Plant and machinery 3-20
Other fixtures, tools and furniture 3-14
Other items of tangible assets - property plant and equipment 4-12
Notwithstanding the foregoing, the property, plant and equipment assigned to certain contracts for services that revert to the contracting agency at the end of the contract term are amortized over the shorter of the term of the contract or the useful life of the related assets. Assets held under finance leases are recognized in the corresponding asset category, are measured at the present value of the minimum lease payments payable and are amortized over their expected useful lives on the same basis as owned assets or, where shorter, over the term of the relevant lease. Leases are classified as finance leases whenever the terms of the lease transfer substantially all the risks and rewards of ownership to the lessee. All other leases are classified as operating leases.
Consolidated Financial Statements - ACS GROUP
25
Assets held under finance leases are amortized on a basis similar to that of owned assets. If there is no reasonable certainty that the lessee will ultimately obtain ownership of the asset upon the termination of the lease, the asset is depreciated over the shorter of its useful life or the term of the lease. Interest relating to the financing of non-current assets held under finance leases is charged to consolidated profit for the year using the effective interest method, on the basis of the repayment of the related borrowings. All other interest costs are recognized in profit or loss in the year in which they are incurred. The gain or loss arising on the disposal or retirement of an asset is determined as the difference between the sales proceeds and the carrying amount of the asset and is recognized in consolidated income. The future costs that the Group will have to incur in respect of dismantling, restoration and environmental rehabilitation of certain facilities are capitalized to the cost of the asset, at present value, and the related provision is recognized. The Group reviews each year its estimates of these future costs, adjusting the value of the provision recognized based on the related studies.
03.04. Non-current assets in projects
This heading includes the amount of investments, mainly in transport, energy and environmental infrastructures which are operated by the ACS Group subsidiaries and which are financed under a project finance arrangement (limited recourse financing applied to projects). These financing structures are applied to projects capable in their own right of providing sufficient guarantees to the participating financial institutions with regard to the repayment of the funds borrowed to finance them. Each project is performed through specific companies in which the project assets are financed, on the one hand, through a contribution of funds by the developers, which is limited to a given amount, and on the other, generally representing a larger amount, through borrowed funds in the form of non-current debt. The debt servicing of these credit facilities or loans is supported mainly by the cash flows to be generated by the project in the future and by security interests in the project's assets. These assets are valued at the costs directly allocable to construction incurred through their entry into operation (studies and designs, compulsory purchases, reinstatement of services, project execution, project management and administration expenses, installations and facilities and similar items) and the portion relating to other indirectly allocable costs, to the extent that they relate to the construction period. Also included under this heading will be the borrowing costs incurred prior to the entry into operation of the assets arising from external financing thereof. Capitalized borrowing costs arise from specific borrowings expressly used for the acquisition of an asset. Upkeep and maintenance expenses that do not lead to a lengthening of the useful life of the assets or an increase in their production capacity are expensed currently. The residual value, useful life and depreciation method applied to the companies’ assets are reviewed periodically to ensure that the depreciation method used reflects the pattern in which the economic benefits arising from operating the non-current assets in projects are consumed. This heading also includes the amount of the concessions to which IFRIC 12 has been applied. These mainly relate to investments in transport, energy and environmental infrastructures operated by the ACS Group subsidiaries and financed under a project finance arrangement (limited recourse financing applied to projects), regardless of whether the demand risk is assumed by the group or the financial institution. In general, the loans are supported by security interests over the project cash flows. The main features to be considered in relation to non-current assets in projects are as follows:
- The concession assets are owned by the concession grantor in most cases. - The grantor controls or regulates the service offered by the concession operator and the conditions under
which it should be provided.
- The assets are operated by the concession operator as established in the concession tender specifications for an established concession period. At the end of this period, the assets are returned to the grantor, and the concession operator has no right whatsoever over these assets.

26
- The concession operator receives revenues for the services provided either directly from the users or through the grantor.
In general, a distinction must be drawn between two clearly different phases: the first in which the concession operator provides construction or upgrade services which are recognized under intangible or financial assets by reference to the stage of completion pursuant to IAS 11, “Construction contracts” and; a second phase in which the concession operator provides a series of maintenance or operation services of the aforementioned infrastructure, which are recognized in accordance with IAS 18, “Ordinary income”. An intangible asset is recognized when the demand risk is borne by the concession operator and a financial asset is recognized when the demand risk is borne by the concession grantor since the operator has an unconditional contractual right to receive cash for the construction or upgrade services. These assets also include the amounts paid in relation to the fees for the award of the concessions. In certain mixed arrangements, the operator and the grantor may share the demand risk, although this is not common for the ACS Group. All the infrastructures of ACS Group concession operators were built by Group companies, and no infrastructures were built by third parties. The revenue and expenses relating to infrastructure construction or improvement services are recognized at their gross amount (record of sales and associated costs), the construction margin being recognized in the consolidated financial statements. Intangible assets For concessions classified as intangible assets, provisions for dismantling, removal and rehabilitation and any steps to improve and increase capacity, the revenue from which is contemplated in the initial contract, are capitalized at the start of the concession and the amortization of these assets and the adjustment for provision discounting are recognized in profit or loss. Also, provisions to replace and repair the infrastructure are systematically recognized in profit or loss as the obligation is incurred. Borrowing costs arising from the financing of the infrastructure are recognized in the period in which they are incurred, and those accruing from the construction until the entry into service of the infrastructure are capitalized only in the intangible asset model. Intangible assets are amortized on the basis of the pattern of consumption, taken to be the changes in and best estimates of the production units of each activity. The most important concession business in quantitative terms is the motorways activity, whose assets are depreciated or amortized on the basis of the concession traffic. Financial assets Concessions classified as a financial asset are recognized at the fair value of the construction or improvement services rendered. In accordance with the amortized cost method, the related revenue is allocated to profit or loss at the interest rate of the receivable arising on the cash flow and concession payment projections, which are presented as revenue on the accompanying consolidated income statement. As described previously, the revenue and expense relating to the provision of the operation and maintenance services are recognized in the consolidated income statement in accordance with IAS 18, “Ordinary income”, and the finance costs relating to the concession are recognized in the accompanying consolidated income statement according to their nature. Interest income on the concessions to which the accounts receivable model is applied is recognized as sales, since these are considered to be ordinary activities, forming part of the overall objective of the concession operator, and are carried on and provide income on a regular basis. Replacements or renewals of complete items that lead to a lengthening of the useful life of the assets or to an increase in their economic capacity are recognized as additions to financial assets, and the items replaced or renewed are derecognized. The work performed by the Group on non-current assets is measured at production cost, except for the work performed for concession operators, which is measured at selling price. Concession operators amortized these assets so that the carrying amount of the investment made is zero at the end of the concession.
Consolidated Financial Statements - ACS GROUP
27
Non-current assets in projects are depreciated on the basis of the pattern of use which, in the case of motorways, is generally determined by the traffic projected for each year. However, certain contracts have terms shorter than the useful life of the related non-current assets, in which case they are depreciated over the contract term. At least at each balance sheet date, the companies determine whether there is any indication that a financial asset or group of financial assets is impaired so that, as indicated in Note 03.06, an impairment loss can be recognized or reversed in order to adjust the carrying amount of the assets to their value in use. The companies consider that the periodic maintenance plans for their facilities, the cost of which is recognized as an expense in the year in which it is incurred, are sufficient to ensure delivery of the assets that have to be returned to the concession provider in good working order on expiry of the concession contracts and that, therefore, no significant expenses will arise as a result of their return.
03.05. Investment property The Group classifies as investment property the investments in land and structures held either to earn rentals or for capital appreciation, rather than for their use in the production or supply of goods or services or for administrative purposes; or for their sale in the ordinary course of business. Investment property is measured initially at cost, which is the fair value of the consideration paid for the acquisition thereof, including transaction costs. Subsequently, accumulated depreciation, and where applicable, impairment losses are deducted from the initial cost. In accordance with IAS 40, the ACS Group has elected not to periodically revaluate its investment property on the basis of its market value, but rather to recognize it at cost, net of the related accumulated depreciation, following the same criteria as for "Property, plant and equipment”. Properties in the course of construction for production, rental or administrative purposes, or for purposes not yet determined, are carried at cost, less any recognized impairment loss. Cost includes professional fees and, for qualifying assets, borrowing costs capitalized in accordance with the Group's accounting policy. Depreciation of these assets, on the same basis as other property assets, commences when the assets are ready for their intended use. Investment property is derecognized on disposal or when the investment property is permanently withdrawn from use and no future economic benefits are expected from its sale or disposal by any other means. Gains or losses arising from the retirement, sale or disposal of the investment property by other means are determined as the difference between the net disposal proceeds from the transaction and the carrying amount of the asset, and is recognized in profit or loss in the period of the retirement or disposal. Investment property is depreciated on a straight-line basis over its useful life, which is estimated to range from 25 to 50 years based on the features of each asset, less its residual value, if material.
03.06. Impairment of tangible assets, property, plant and equipment and intangible assets excluding goodwill
At each reporting date, the Group reviews the carrying amounts of its tangible and intangible assets, as well as its investment properties, to determine whether there is any indication that those assets might have suffered an impairment loss. If any such indication exists, the recoverable amount of the asset is estimated in order to determine the extent of the impairment loss (if any). Where the asset itself does not generate cash flows that are independent from other assets, the Group estimates the recoverable amount of the cash-generating unit to which the asset belongs. The recoverable amount is the higher of fair value less costs to sell and value in use. In assessing value in use, the estimated future cash flows are discounted to their present value using a pre-tax discount rate that reflects current market assessments of the time value of money and the risks specific to the asset for which the estimates of future cash flows have not been adjusted. If the recoverable amount of an asset (or cash-generating unit) is estimated to be less than its carrying amount, the carrying amount of the asset (cash-generating unit) is reduced to its recoverable amount. An impairment loss is recognized as an expense immediately.
28
Where an impairment loss subsequently reverses, the carrying amount of the asset (cash-generating unit) is increased to the revised estimate of its recoverable amount, but so that the increased carrying amount does not exceed the carrying amount that would have been determined had no impairment loss been recognized for the asset (cash-generating unit) in prior years. A reversal of the impairment loss is recognized as income immediately.
03.07. Inventories Inventories are stated at the lower of cost and net realizable value. Cost comprises direct materials and, where applicable, direct labor costs and overheads incurred in bringing the inventories to their present location and condition. Trade discounts, rebates and other similar items are deducted in determining the costs of purchase. The cost of inventories is calculated by using the weighted average cost formula. Net realizable value is the estimated selling price less the estimated costs of completion and costs to be incurred in marketing, selling and distribution. The Group assesses the net realizable value of the inventories at year-end and recognizes the appropriate loss if the inventories are overstated. When the circumstances that previously caused inventories to be written down no longer exist or when there is clear evidence of an increase in net realizable value because of changed economic circumstances, the amount of the write-down is reversed.
03.08. Non-current and other financial assets
Except in the case of financial assets at fair value through profit or loss, financial assets are initially recognized at fair value, plus any directly attributable transaction costs. The Group classifies its non-current and current financial assets, excluding investments in Associates and those held for sale, in four categories. In the consolidated statement of financial position, financial assets maturing within no more than 12 months are classified as current assets and those maturing within more than 12 months as non-current assets.
03.08.01 Loans and receivables These are non-derivative financial assets with fixed or determinable payments not traded in an active market. After their initial recognition, they are measured at amortized cost using the effective interest method. The "amortized cost" is understood to be the acquisition cost of a financial asset or liability minus principal repayments, plus or minus the cumulative amortization taken to profit or loss of any difference between that initial cost and the maturity amount. In the case of financial assets, amortized cost also includes any reduction for impairment. The effective interest rate is the discount rate that exactly matches the net carrying amount of a financial instrument to all its estimated cash flows of all kinds through its residual life. Deposits and guarantees given are recognized at the amount delivered to meet contractual commitments, regarding gas, water and lease agreements, etc. Period changes for impairment and reversals of impairment losses on financial assets are recognized in the consolidated income statement for the difference between their carrying amount and the present value of the recoverable cash flows.
03.08.02 Held-to-maturity investments These are non-derivative financial assets with fixed or determinable payments and fixed maturity that the Group has the positive intention and ability to hold to the date of maturity. After their initial recognition, they are also measured at amortized cost.
Consolidated Financial Statements - ACS GROUP
29
03.08.03 Financial assets at fair value through profit or loss
These include the financial assets held for trading and financial assets managed and measured using the fair value model. These assets are measured at fair value in the consolidated statement of financial position and changes are recognized in the consolidated income statement.
03.08.04 Available-for-sale investments
These are non-derivative financial assets designated as available for sale or not specifically classified within any of the previous categories. These relate mainly to investments in the share capital of companies not included in the scope of consolidation. After their initial recognition at cost of acquisition, these investments are measured at fair value, recognizing the gains or losses arising thereon in equity until the investment is sold or suffers impairment losses, at which time the cumulative gain or loss previously presented in equity under “Adjustments for changes in value” is transferred to profit or loss as gains or losses on the corresponding financial assets. The fair value of investments actively traded in organized financial markets is determined by reference to their closing market price at year-end. Investments for which there is no active market and whose fair value cannot be reliably determined are measured at cost or at their underlying carrying amount, or at a lower amount if there is any evidence of impairment.
03.08.05 Derecognition of financial assets The Group derecognizes a financial asset when it expires or when the rights to the cash flows from the financial asset have been transferred and substantially all the risks and rewards of ownership of the financial asset have been transferred, such as in the case of firm asset sales, factoring of trade receivables in which the Group does not retain any credit or interest rate risk, sales of financial assets under an agreement to repurchase them at fair value and the securitization of financial assets in which the transferor does not retain any subordinated debt, provide any kind of guarantee or assume any other kind of risk. However, the Group does not derecognize financial assets, and recognizes a financial liability for an amount equal to the consideration received, in transfers of financial assets in which substantially all the risks and rewards of ownership are retained, such as in the case of bill discounting, with-recourse factoring, sales of financial assets under an agreement to repurchase them at a fixed price or at the selling price plus interest and the securitization of financial assets in which the transferor retains a subordinated interest or any other kind of guarantee that absorbs substantially all the expected losses.
03.08.06 Fair value hierarchies Financial assets and liabilities measured at fair value are classified according to the hierarchy established in IFRS 7, as follows: Level 1: Quoted prices (unadjusted) on active markets for identical assets or liabilities. Level 2: Inputs other than prices quoted included within Level 1 that are observable for the asset or liability,
either directly (i.e., as prices) or indirectly (i.e., derived from prices). Level 3: Inputs for the asset or liability that are not based on observable market data.
03.09. Non-current assets held for sale, liabilities relating to non-current assets held for sale and discontinued operations
Discontinued operations At 31 December 2017 there were no assets and liabilities corresponding to any discontinued operations.
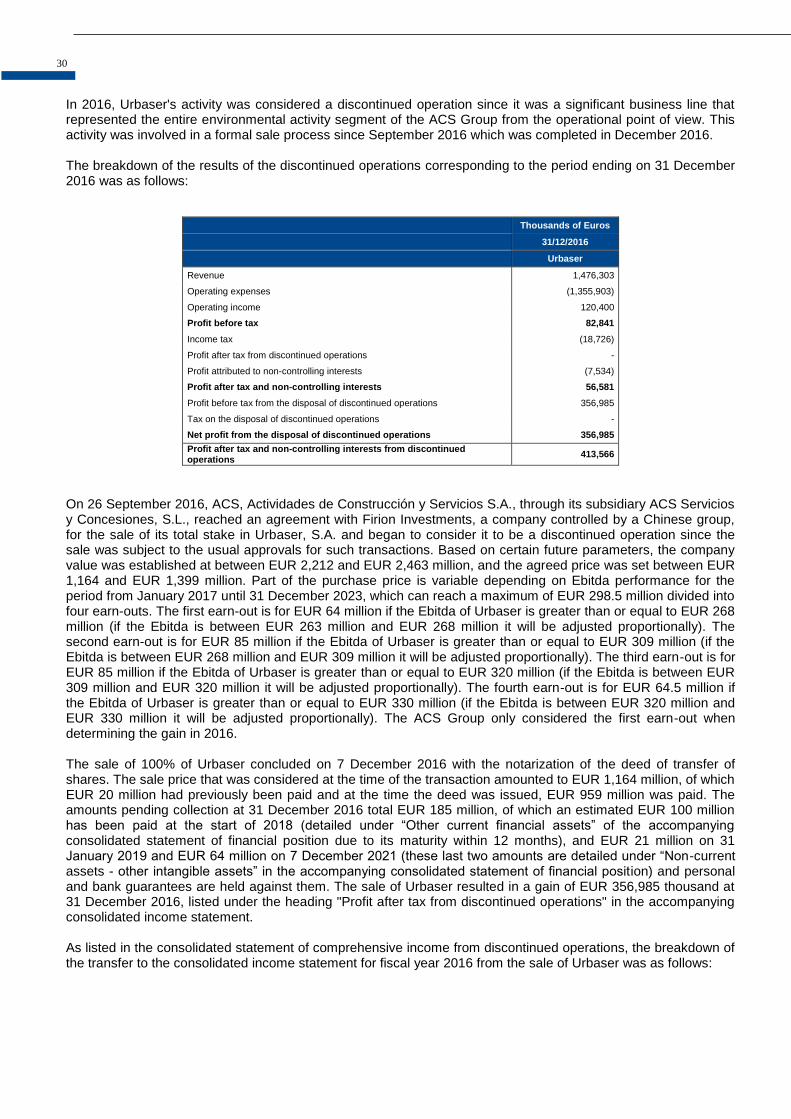
30
In 2016, Urbaser's activity was considered a discontinued operation since it was a significant business line that represented the entire environmental activity segment of the ACS Group from the operational point of view. This activity was involved in a formal sale process since September 2016 which was completed in December 2016. The breakdown of the results of the discontinued operations corresponding to the period ending on 31 December 2016 was as follows:
Thousands of Euros
31/12/2016
Urbaser
Revenue 1,476,303
Operating expenses (1,355,903)
Operating income 120,400
Profit before tax 82,841
Income tax (18,726)
Profit after tax from discontinued operations -
Profit attributed to non-controlling interests (7,534)
Profit after tax and non-controlling interests 56,581
Profit before tax from the disposal of discontinued operations 356,985
Tax on the disposal of discontinued operations -
Net profit from the disposal of discontinued operations 356,985
Profit after tax and non-controlling interests from discontinued operations
413,566
On 26 September 2016, ACS, Actividades de Construcción y Servicios S.A., through its subsidiary ACS Servicios y Concesiones, S.L., reached an agreement with Firion Investments, a company controlled by a Chinese group, for the sale of its total stake in Urbaser, S.A. and began to consider it to be a discontinued operation since the sale was subject to the usual approvals for such transactions. Based on certain future parameters, the company value was established at between EUR 2,212 and EUR 2,463 million, and the agreed price was set between EUR 1,164 and EUR 1,399 million. Part of the purchase price is variable depending on Ebitda performance for the period from January 2017 until 31 December 2023, which can reach a maximum of EUR 298.5 million divided into four earn-outs. The first earn-out is for EUR 64 million if the Ebitda of Urbaser is greater than or equal to EUR 268 million (if the Ebitda is between EUR 263 million and EUR 268 million it will be adjusted proportionally). The second earn-out is for EUR 85 million if the Ebitda of Urbaser is greater than or equal to EUR 309 million (if the Ebitda is between EUR 268 million and EUR 309 million it will be adjusted proportionally). The third earn-out is for EUR 85 million if the Ebitda of Urbaser is greater than or equal to EUR 320 million (if the Ebitda is between EUR 309 million and EUR 320 million it will be adjusted proportionally). The fourth earn-out is for EUR 64.5 million if the Ebitda of Urbaser is greater than or equal to EUR 330 million (if the Ebitda is between EUR 320 million and EUR 330 million it will be adjusted proportionally). The ACS Group only considered the first earn-out when determining the gain in 2016. The sale of 100% of Urbaser concluded on 7 December 2016 with the notarization of the deed of transfer of shares. The sale price that was considered at the time of the transaction amounted to EUR 1,164 million, of which EUR 20 million had previously been paid and at the time the deed was issued, EUR 959 million was paid. The amounts pending collection at 31 December 2016 total EUR 185 million, of which an estimated EUR 100 million has been paid at the start of 2018 (detailed under “Other current financial assets” of the accompanying consolidated statement of financial position due to its maturity within 12 months), and EUR 21 million on 31 January 2019 and EUR 64 million on 7 December 2021 (these last two amounts are detailed under “Non-current assets - other intangible assets” in the accompanying consolidated statement of financial position) and personal and bank guarantees are held against them. The sale of Urbaser resulted in a gain of EUR 356,985 thousand at 31 December 2016, listed under the heading "Profit after tax from discontinued operations" in the accompanying consolidated income statement. As listed in the consolidated statement of comprehensive income from discontinued operations, the breakdown of the transfer to the consolidated income statement for fiscal year 2016 from the sale of Urbaser was as follows:

Consolidated Financial Statements - ACS GROUP
31
Thousands of Euros
31/12/2016
Parent Company Minorities Total
Cash flow hedges 89,415 17,803 107,218
Recyling of exchange differences 79,172 1,344 80,516
Tax effect (22,354) (4,451) (26,805)
Transfers to the income statement 146,233 14,696 160,929
The breakdown of the cash flows statement from discontinued operations was as follows:
Thousands of Euros
31/12/2016
Urbaser
Cash flows from operating activities 26,507
Cash flows from investing activities (276,070)
Cash flows from financing activities 66,510
Net cash flows from discontinued operations (183,053)
Non-current assets held for sale 2017 At 31 December 2017, non-current assets held for sale mainly concerned certain assets relating to transmission lines included in the Industrial Services business segment. In addition, certain assets and liabilities associated with these non-current assets within non-material ACS Group companies are also included as non-current assets and liabilities held for sale. In all the above cases a formal decision was made by the Group to sell these assets, and a plan for their sale was initiated. These assets are currently available for sale and the sale is expected to be completed within a period of 12 months from the date of their classification as assets held for sale. It is noteworthy that the renewable assets, which had been classified as held for sale at 31 December 2016, had held in this category for a period of over twelve months, but they were not sold due to certain circumstances, which at the time of their classification were not likely. Once these circumstances were resolved, the sale proceeded. Paragraph B1 (c) of appendix B of IFRS 5 exempts a company from using a one year period as the maximum period for classifying an asset as held for sale if, during the aforementioned period, circumstances arise which were previously considered unlikely, the assets were actively sold at a reasonable price and they fulfill the requirements undertaken by Management and there is a high probability that the sale will occur within one year from the balance sheet date. The breakdown of the main assets and liabilities held for sale at 31 December 2017 is as follows:

32
Thousands of Euros
31/12/2017
Renewable
energy Transmission
line
PT Thiess Contractors Indonesia
Other Total
Tangible assets - property, plant and equipment 3 - 20,431 16,783 37,217
Intangible assets - - - 591 591
Non-current assets in projects 83,826 - - 13,497 97,323
Financial Assets - 120,137 - 5,201 125,338
Deferred tax assets 6 - - 8,027 8,033
Other non-current assets - - - 91,004 91,004
Current assets 7,850 - 552 43,366 51,768
Financial assets held for sale 91,685 120,137 20,983 178,469 411,274
Non-current liabilities - - - 88,081 88,081
Current liabilities 69,167 49,605 - 13,800 132,572
Liabilities relating to assets held for sale 69,167 49,605 - 101,881 220,653
Non-controlling interests held for sale - - - (1,651) (1,651)
The main variations in fiscal year ending 31 December 2017 relating to the assets in the consolidated statement of financial position at 31 December 2016, owe, on one hand, to the sale of Sintax, whose conditions were fulfilled in February 2017, and the sale of the wind farms, Lusobrisa, Ventos da Serra and Lestenergía, located in Portugal. On the other hand, five solar parks located in Brazil have been included as assets held for sale under the heading “Renewable energies”. Therefore, the decline during fiscal year 2017 in the total value of the non-current assets held for sale amounted to EUR 137,818 thousand, and the decline in their associated liabilities amounted to EUR 97,174 thousand, mainly as a result of the transactions described above. The amount relating to net debt included under assets held for sale and liabilities associated with these assets at 31 December 2017 totals EUR 162,219 thousand (EUR 223,105 thousand at 31 December 2016), of which EUR 48,618 thousand (EUR 108,248 thousand at 31 December 2016) in the case of renewable energies, EUR 49,604 thousand (EUR 27,204 thousand at 31 December 2016) in the case of transmission lines, and others for EUR 63,997 thousand (EUR 87,653 thousand at 31 December 2016). Within the total amount of the aforementioned net debt, EUR 122,052 thousand (EUR 190,403 thousand at 31 December 2016) corresponds to limited resource project financing. Net debt is calculated using the arithmetic sum of the current and non-current financial liabilities, less long-term deposits, other current financial assets and cash and cash equivalents.
2016 At 31 December 2016, non-current assets held for sale mainly concerned certain assets relating to the Syntax business, which were within the Services segment as a result of the agreement reached with CAT, as well as the renewable energy business relating to the wind farms located in Portugal, which were included within the Industrial Services segment. The detail of the main assets held for sale and liabilities associated with these assets at 31 December 2016 was as follows:
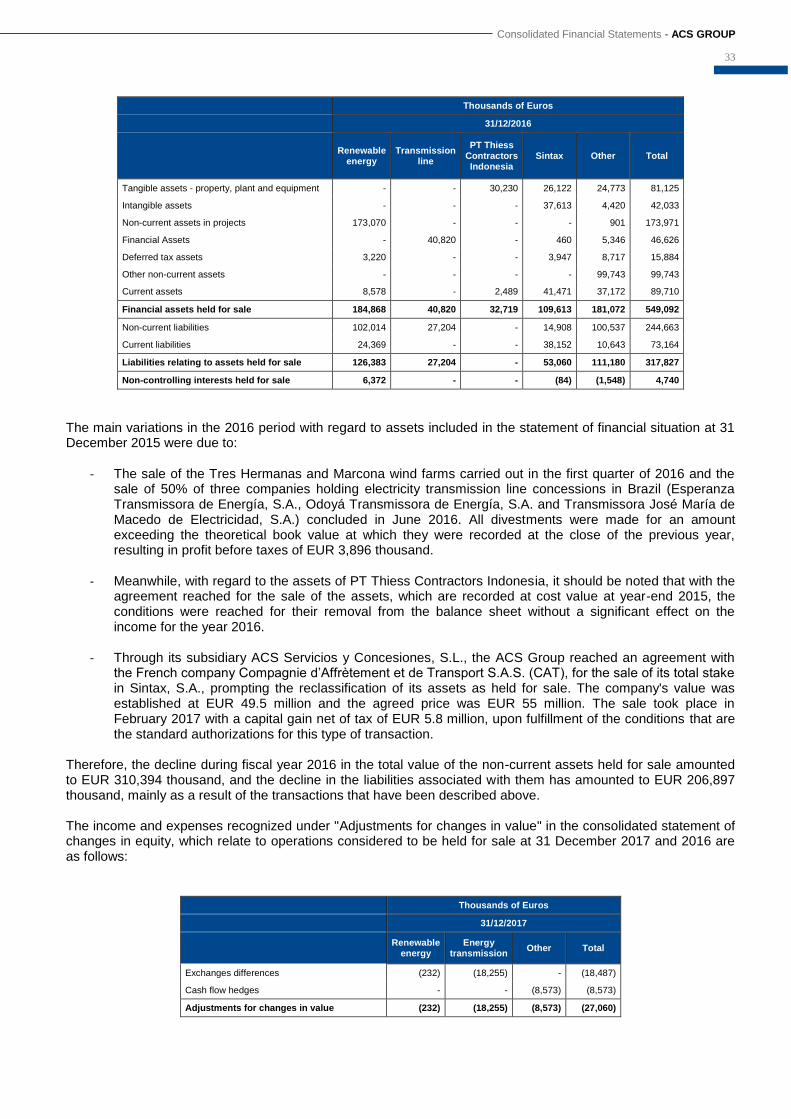
Consolidated Financial Statements - ACS GROUP
33
Thousands of Euros
31/12/2016
Renewable
energy Transmission
line
PT Thiess Contractors Indonesia
Sintax Other Total
Tangible assets - property, plant and equipment - - 30,230 26,122 24,773 81,125
Intangible assets - - - 37,613 4,420 42,033
Non-current assets in projects 173,070 - - - 901 173,971
Financial Assets - 40,820 - 460 5,346 46,626
Deferred tax assets 3,220 - - 3,947 8,717 15,884
Other non-current assets - - - - 99,743 99,743
Current assets 8,578 - 2,489 41,471 37,172 89,710
Financial assets held for sale 184,868 40,820 32,719 109,613 181,072 549,092
Non-current liabilities 102,014 27,204 - 14,908 100,537 244,663
Current liabilities 24,369 - - 38,152 10,643 73,164
Liabilities relating to assets held for sale 126,383 27,204 - 53,060 111,180 317,827
Non-controlling interests held for sale 6,372 - - (84) (1,548) 4,740
The main variations in the 2016 period with regard to assets included in the statement of financial situation at 31 December 2015 were due to:
- The sale of the Tres Hermanas and Marcona wind farms carried out in the first quarter of 2016 and the sale of 50% of three companies holding electricity transmission line concessions in Brazil (Esperanza Transmissora de Energía, S.A., Odoyá Transmissora de Energía, S.A. and Transmissora José María de Macedo de Electricidad, S.A.) concluded in June 2016. All divestments were made for an amount exceeding the theoretical book value at which they were recorded at the close of the previous year, resulting in profit before taxes of EUR 3,896 thousand.
- Meanwhile, with regard to the assets of PT Thiess Contractors Indonesia, it should be noted that with the agreement reached for the sale of the assets, which are recorded at cost value at year-end 2015, the conditions were reached for their removal from the balance sheet without a significant effect on the income for the year 2016.
- Through its subsidiary ACS Servicios y Concesiones, S.L., the ACS Group reached an agreement with
the French company Compagnie d’Affrètement et de Transport S.A.S. (CAT), for the sale of its total stake in Sintax, S.A., prompting the reclassification of its assets as held for sale. The company's value was established at EUR 49.5 million and the agreed price was EUR 55 million. The sale took place in February 2017 with a capital gain net of tax of EUR 5.8 million, upon fulfillment of the conditions that are the standard authorizations for this type of transaction.
Therefore, the decline during fiscal year 2016 in the total value of the non-current assets held for sale amounted to EUR 310,394 thousand, and the decline in the liabilities associated with them has amounted to EUR 206,897 thousand, mainly as a result of the transactions that have been described above. The income and expenses recognized under "Adjustments for changes in value" in the consolidated statement of changes in equity, which relate to operations considered to be held for sale at 31 December 2017 and 2016 are as follows:
Thousands of Euros
31/12/2017
Renewable
energy Energy
transmission Other Total
Exchanges differences (232) (18,255) - (18,487)
Cash flow hedges - - (8,573) (8,573)
Adjustments for changes in value (232) (18,255) (8,573) (27,060)

34
Thousands of Euros
31/12/2016
Renewable
energy Sintax Other Total
Exchanges differences (1,562) 12 - (1,550)
Cash flow hedges - - (9,519) (9,519)
Adjustments for changes in value (1,562) 12 (9,519) (11,069)
Non-current assets or disposal groups are classified as held for sale if their carrying amounts will be recovered principally through sale rather than through continuing use. For this to be the case, the assets or disposal groups must be available for immediate sale in their present condition, and their sale must be highly probable.
03.10. Equity An equity instrument represents a residual interest in the net assets of the Group after deducting all of its liabilities. Capital and other equity instruments issued by the Parent are recognized in equity at the proceeds received, net of direct issue costs.
03.10.01 Share capital Ordinary shares are classified as capital. There are no other types of shares. Expenses directly attributable to the issue or acquisition of new shares are recognized in equity as a deduction from the amount thereof.
03.10.02 Treasury shares The transactions involving treasury shares in 2017 and 2016 are summarized in Note 15.04. Treasury shares were deducted from equity in the accompanying statement of financial position at 31 December 2017 and 2016. When the Group acquires or sells treasury shares the amount paid or received for the treasury shares is recognized directly recognized in equity. No loss or gain from the purchase, sale, issue or amortization of the Group's own equity instruments is recognized in the consolidated income statement for the year. The shares of the Parent are measured at average acquisition cost.
03.10.03 Stock options The Group has granted options on ACS, Actividades de Construcción y Servicios, S.A. shares to certain employees. In accordance with IFRS 2, the options granted are considered equity-settled share-based payment. Accordingly, they are measured at their fair value on the date they are granted and charged to income, with a credit to equity, over the period in which they accrue based on the various periods of irrevocability of the options. Since market prices are not available, the value of the share options has been determined using valuation techniques taking into consideration all factors and conditions that would have been applied in an arm's length transaction between knowledgeable parties (Note 28.03). In addition, the Hochtief Group has granted options on Hochtief, A.G. shares to management members.
03.11. Government grants The ACS Group has received grants from various government agencies mainly to finance investments in property, plant and equipment for its Services business. Evidence of compliance with the conditions established in the relevant decisions granting the subsidies was provided to the relevant competent agencies.
Consolidated Financial Statements - ACS GROUP
35
Government grants received by the Group to acquire assets are taken to income over the same period and on the same basis as those used to depreciate the asset relating to the aforementioned grant. Government grants to compensate costs are recognized in profit or loss on a systematic basis over the periods in which the Group recognizes as expenses the related costs for which the grants are intended to compensate. A government grant receivable as compensation for expenses or losses already incurred or for the purpose of giving financial support with no future related costs is recognized in profit or loss of the period in which it becomes receivable.
03.12. Financial liabilities Financial liabilities are classified in accordance with the content and the substance of the contractual arrangements. The main financial liabilities held by the Group companies relate to held-to-maturity financial liabilities which are measured at amortized cost. The financial risk management policies of the ACS Group are detailed in Note 21.
03.12.01 Bank borrowings, debt and other securities Interest-bearing bank loans and overdrafts are recognized at the amount received, net of direct issue costs. Finance charges, including premiums payable on settlement or redemption and direct issue costs, are recognized in profit or loss on an accrual basis using the effective interest method and are added to the carrying amount of the instrument to the extent that they are not settled in the period in which they arise. Loans are classified as current items unless the Group has the unconditional right to defer repayment of the debt for at least 12 months from the end of the reporting period.
03.12.02 Trade and other payables Trade payables are not interest bearing and are stated at their nominal value, which does not differ significantly from their fair value. The heading of trade payables is also used to classify outstanding balances payable to suppliers made through confirming contracts with financial institutions and the payments related thereto are also classified as trade flows since these operations do not incorporate either specific guarantees granted as pledges on the payments to be made nor any modifications that alter the commercial nature of the transactions.
03.12.03 Current / Non-current classification In the accompanying consolidated statement of financial position, debts due to be settled within 12 months are classified as current items and those due to be settled within more than 12 months as non-current items. For short-term loans whose long-term refinancing is assured at the Group's discretion, through existing long-term credit loan facilities, are classified as non-current liabilities. “Proyect finance with limited recourse” is classified based on the same criteria, and the detail thereof is shown in Note 18.
03.12.04 Retirement benefit obligations a) Post-employment benefit obligations Certain Group companies have post-employment benefit obligations of various kinds to their employees. These obligations are classified by group of employees and may relate to defined contribution or defined benefit plans. Under the defined contribution plans, the contributions made are recognized as expenditure under "Staff costs" in the consolidated income statements as they accrue, whereas for the defined benefit plans actuarial studies are
36
conducted once a year by independent experts using market assumptions and the expenditure relating to the obligations is recognized on an accrual basis, classifying the normal cost for the current employees over their working lives under "Staff costs" and recognizing the associated finance cost, in the event that the obligation were to be financed, by applying the rates relating to investment-grade bonds on the basis of the obligation recognized at the beginning of each year (see Note 20). The post-employment benefit obligations include, inter alia, those arising from certain companies of the Hochtief Group, for which the Group has recognized the related liabilities and whose recognition criteria are explained in Note 03.13. b) Other employee benefit obligations The expense relating to termination benefits is recognized in full when there is an agreement or when the interested parties have a valid expectation that such an agreement will be reached that will enable the employees, individually or collectively and unilaterally or by mutual agreement with the company, to cease working for the Group in exchange for a termination benefit. If a mutual agreement is required, a provision is only recognized in situations in which the Group considers that it will give its consent to the termination of the employees.
03.12.05 Termination benefits Under current legislation, the Spanish consolidated companies and certain foreign companies are required to pay termination benefits to employees terminated without just cause. There are no employee redundancy plans that would make it necessary to record a provision in this connection.
03.13. Provisions The Group's Consolidated Financial Statements include all the material provisions with respect to which it is considered that it is more likely than not that the obligation will have to be settled. Contingent liabilities are not recognized in the consolidated financial statements, but rather are disclosed, as required by IAS 37. Provisions, which are quantified on the basis of the best information available on the consequences of the event giving rise to them and are reviewed and adjusted at the end of each year, are used to cater for the specific obligations for which they were originally recognized. Provisions are fully or partially reversed when such obligations cease to exist or are reduced. Litigation and / or claims in process At the end of 2017 certain litigation and claims were in process against the consolidated companies forming part of the ACS Group arising from the ordinary course of their operations, not representative at individual level. The Group's legal advisers and directors consider that the outcome of litigation and claims will not have a material effect on the financial statements for the years in which they are settled. The main legal proceedings and claims open at 31 December 2017 were those related to the Radial 3 and Radial 5 (R3 and R5) concessions, TP Ferro y Escal and the sanctions imposed by the CNMC (see Note 36). Likewise, individual significance is given to the arbitration claims due to the increase in the costs in the Cimic Gorgon LNG Jetty and Marine Structure project (see Note 12). Provisions for employee termination benefit costs Pursuant to current legislation, a provision is recognized to meet the cost of termination of temporary employees with a contract for project work. Provision for pensions and similar obligations In the case of foreign companies whose post-employment benefit obligations are not externalized, noteworthy are the provisions for pensions and similar obligations recorded by various Hochtief Group companies as explained below. Provisions for pensions and similar obligations are recognized for current and future benefit payments to active and former employees and their surviving dependents. The obligations primarily relate to pension benefits, partly
Consolidated Financial Statements - ACS GROUP
37
for basic pensions and partly for optional supplementary pensions. The individual benefit obligations vary from one country to another and are determined for the most part by length of service and pay scales. Turner’s obligations to meet healthcare costs for retired staff are likewise included in pension provisions due to their pension-like nature. Provisions for pensions and similar obligations are computed by the projected unit credit method. This determines the present value of future entitlements, taking into account current and future benefits already known at the reporting date plus anticipated future increases in salaries and pensions and, for the Turner Group, in healthcare costs. The computation is based on actuarial appraisals using biometric accounting principles. Plan assets as defined in IAS 19 are shown separately as deductions from pension obligations. Plan assets comprise assets transferred to pension funds to meet pension obligations, shares in investment funds purchased under deferred compensation arrangements, and qualifying insurance policies in the form of pension liability insurance. If the fair value of plan assets is greater than the present value of employee benefits, the difference is reported - subject to the limit in IAS 19 - under "Non-current assets". The amounts relating to the restatement of the defined benefit plans are recognized directly in the consolidated income statement during the period in which they arise. The current cost for the year is recognized under staff costs. The effect of interest on the increase in pension obligations, diminished by anticipated returns on plan assets (each calculated using the pension discount rate), is reported in net investment and interest income. Provisions for project completion Inspection fee expenses, estimated costs for site clearance and other expenses that may be incurred from completion of the project through final settlement thereof are accrued over the execution period on the basis of production volumes and are recognized under "Current provisions" on the liability side of the consolidated statements of financial position. Dismantling of non-current assets and environmental restoration The Group is obliged to dismantle certain facilities at the end of their useful life, such as those associated with the closing of landfills, and to ensure the environmental restoration of the sites where they are located. The related provisions have been made for this purpose and the present value of the cost of carrying out these tasks has been estimated, recognizing a concession asset as a balancing entry. Other provisions Other provisions include mainly provisions for warranty costs.
03.14. Risk management policy The ACS Group is exposed to certain risks which it manages by applying risk identification, measurement, concentration limitation and monitoring systems. The main principles defined by the ACS Group for its risk management policy are as follows:
Compliance with corporate governance rules.
The Group's various lines of business and companies establish the risk management controls required to assure that market transactions are performed in accordance with the policies, standards and procedures of the ACS Group.
Special attention to the management of financial risk, basically including interest rate risk, foreign currency risk, liquidity risk and credit risk (see Note 21).
The Group's risk management is of a preventative nature and is aimed at the medium and long term, taking into account the most probable scenarios with respect to the future changes in the variables affecting each risk.
03.15. Financial derivatives The Group's activities are exposed mainly to financial risks of changes in foreign exchange rates and interest rates. The transactions performed are in line with the risk management policy defined by the Group.

38
Derivatives are initially recognized at acquisition cost in the consolidated statement of financial position and the required valuation adjustments are subsequently made to reflect their fair value at all times. These adjustments are recorded under “Derivative financial instruments” (assets portion) in the consolidated statement of financial position if they are positive and under “Derivative financial instruments” (liabilities portion) if they are negative. Gains and losses from fair value changes are recognized in the consolidated income statement, unless the derivative has been designated and is highly effective as a hedge, in which case they are recognized according to their classification. Classification
- Fair value hedges The hedged item and hedging instrument are both measured at fair value, and changes in fair value are recognized in the consolidated income statement for their net amount under “Changes in the fair value of financial instruments”.
- Cash flow hedges Changes in the fair value of the derivatives are recognized, in respect of the effective portion of the hedges, in equity under “Adjustments for changes in value” in the accompanying consolidated statement of financial position. Hedges giving results of between 80% and 125% in the effectiveness test are considered to be or effective or efficient. The cumulative gain or loss recognized in this account is transferred to the consolidated income statement to the extent that the underlying has an impact on this account in relation to the hedged risk, and the related effect is deducted from the same heading in the consolidated income statement. Hedge accounting is discontinued when the hedging instrument expires or is sold, terminated or exercised, or no longer qualifies for hedge accounting. At that time, any cumulative gain or loss on the hedging instrument recognized in equity is retained in equity until the forecast transaction occurs. If a hedged transaction is no longer expected to occur, the net cumulative gain or loss recognized in equity is transferred to net profit or loss for the year. Derivatives embedded in other financial instruments or other host contracts are treated as separate derivatives when their risks and characteristics are not closely related to those of the host contracts and the host contracts are not carried at fair value with unrealized gains or losses reported in the consolidated income statement.
Assessment The fair value of the various derivative financial instruments is calculated using techniques widely used in financial markets, by discounting the flows envisaged in each contract on the basis of its characteristics, such as the notional amount and the collection and payment schedule based on spot and futures market conditions at the end of each year. Interest rate hedges are measured by using the zero-coupon rate curve, determined by employing the Black-Scholes methodology in the case of caps and floors for the deposits and rates that are traded at any given time, to obtain the discount factors. Equity swaps are measured as the result of the difference between the quoted price at year end and the strike price initially agreed upon, multiplied by the number of contracts reflected in the swap. Derivatives whose underlying asset is quoted on an organized market and are not qualified as hedges, are measured using the Black-Scholes methodology and applying market parameters such as implicit volatility and estimated dividends. For those derivatives whose underlying asset is quoted on an organized market, but in which the derivative forms part of financing agreement and where its arrangement substitutes the underlying assets, the measurement is based on the calculation of its intrinsic value at the calculation date. The fair value includes the assessment of the credit risk of the counterparty in the case of the assets or of the ACS Group in the case of liabilities in accordance with the IFRS 13. Therefore, when a derivative records an unrealized gain, this amount is adjusted downward according to the risk of the banking counterpart due to make
Consolidated Financial Statements - ACS GROUP
39
payment to a Group company, whereas when there are unrealized losses, this amount is reduced on the basis of own credit risk, as it will be the Group entity that will have to pay the counterparty. The evaluation of inherent and counterparty risk takes into account the existence of contractual guarantees (collateral), which can be used to compensate for a credit loss in the event of suspension of payments. For impaired derivatives, the inherent credit risk that applies to adjust the market price is that of each individual company or project evaluated and not the Group or sub-group to which they belong. To do so, an internal rating is prepared for each company/project using objective parameters such as ratios, indicators, etc. For derivatives with unrealized capital gains, since accounting standards do not provide a specific methodology that should be applied, an accepted best practice method has been used, which takes into account three elements to calculate the adjustment, to obtain the result by multiplying the level of exposure in the position by the probability of default and by the loss in the event of non-compliance. The level of exposure level measures the estimated risk that a given position can reach, as a result of changes in market conditions. For this purpose, a Monte Carlo method can be applied, an exercise to simulate probability scenarios allocated exogenously, or the market value at any given time as a better reference. In the case of Group, for the sake of simplicity, this last criterion is applied. In particular, for IRS (interest rate swap) transactions and exchange difference derivatives, the market price provided by the counterparties is used (reviewed by each company with its own valuation methods); while for options and equity swaps the market price of the contracted options premiums is calculated, by applying a standard options valuation method, which takes into account variables such as the price of the underlying asset, its volatility, the time until it is exercised, interest rates, etc. With regard to the likelihood of default, i.e. that the debtor counterparty will be unable to pay the contractual amounts at some point in the future, the figure used is calculated by dividing the credit differential by the anticipated loss rate. Where the loss rate is the unit minus the expected recovery rate in the event of default. The data used is obtained from estimates published by Moody's. With regard to the accuracy of the information on the credit differential, this depends on the extent to which the markets are liquid. Thus, for example,
- When a derivative has unrealized gains, to approximate the credit differential of the banking entity, which would have to be paid to a Group entity, the price of its credit default swap (CDS) is used. When the term quoted does not match the specific position, it is interpolated. If the CDS market for a banking entity exists, but its liquidity is low, a corrective coefficient is applied to the market price. When the CDS market for the banking entity acting as counterparty simply does not exist, the probability of default is calculated by the correlation between the ratings published by the agencies and the historical cumulative default rates according deadlines, according to the estimates of Standard and Poor’s.
- In the event that a derivative has unrealized losses, since there is not CDS market for the projects, the unlisted subsidiaries of the Group or for the holding company, the calculation of the probability of default distinguishes whether or not the company has issued listed bonds. If so, a reconciliation is performed between the credit differential of traded bonds issued by similar companies and an CDS index of companies for the different deadlines. When necessary, the deadlines are interpolated. Otherwise, a correlation between the assigned rating levels and the historical cumulative default rates is used. And for these purposes, shadow ratings prepared in-house or requested from third parties are employed.
Finally, to calculate the loss in the event of default:
- When there are unrealized capital gains in a derivative, the recovery rates for each banking entity are applied as published by Reuters or declared by the financial institution itself.
- If a derivative has unrealized losses, the recovery rate published by Moody’s is used, according to the activity sector of the projects, subsidiaries or holding company. In the case of projects, in particular, correction factors are also applied according to the actual phase of the project - construction period, launching (ramp-up) or consolidated exploitation.
Meanwhile, gains or losses on fair value for credit risk of derivatives are recognized in the income statement, when the derivatives are qualified as speculative (non-hedge); while if the derivatives are classified as hedging instruments, recorded directly in equity, then the gains or losses on fair value are also recognized in equity.
40
03.16. Revenue recognition Revenue is recognized to the extent that the economic benefits associated with the transaction flow to the Group. Revenue is measured at the fair value of the consideration received or receivable and represents the amounts receivable for the goods and services provided in the normal course of business, net of discounts, VAT and other sales-related taxes. Sales of goods are recognized when substantially all the risks and rewards arising from their ownership have been transferred. Revenue associated with the rendering of services is also recognized by reference to the stage of completion of the transaction at the reporting date, provided the outcome of the transaction can be estimated reliably. In an agency relationship, when the reporting company acts as a commission agent, the gross inflows of economic benefits for amounts collected on behalf of the principal do not result in increases in equity for the company. Therefore, these inflows are not revenue and, instead, only the amount of the commissions is recognized as revenue. Interest income is accrued on a time proportion basis, by reference to the principal outstanding and the effective interest rate applicable, which is the rate that exactly discounts estimated future cash receipts through the expected life of the financial asset to that asset's net carrying amount. Dividend income from investments is recognized when the shareholder's rights to receive payment have been established. Following is a disclosure of specific revenue recognition criteria for certain activities carried on by the Group.
03.16.01. Construction business In the construction business, the outcome of a construction contract is recognized by the percentage of completion method. The amount of production carried out until the reporting date is recognized as revenue on the basis of the percentage of completion of the entire project. The percentage of completion is measured by reference to the state of completion of the construction work, i.e. the percentage of work performed until the reporting date with respect to the total contract work performed. In the construction industry, the estimated revenue and costs of construction projects are susceptible to changes during contract performance which cannot be readily foreseen or objectively quantified. In this regard, the budgets used to calculate the stage of completion and the production of each year include the measurement at the sale price of the units completed, for which Management of the consolidated companies consider there is reasonable assurance of their being collected, as well as their estimated costs. Should the amount of output from inception, measured at the sale price, of each project be greater than the amount billed up to the end of the reporting period, the difference between the two amounts is recognized under "Trade and other receivables" on the asset side of the consolidated statement of financial position. Should the amount of output from inception be lower than the amount of the progress billings, the difference is recognized under "Trade and other payables - Customer advances” in liabilities in the consolidated statement of financial position. In relation to matters included in the previous paragraph, it should be pointed out that the Group maintains recorded under the heading "Trade receivables for sales and services" in the consolidated statement of financial position the balances associated with "Certifications pending collection" as well as concerning "Completed Work pending Certification". In this sense, this last heading includes three types of balances;
- differences between the production executed, valued at sale price, and the certification to date under the existing contract, which is called "Completed Work Pending Final Certification" arising from differences between the time in which the production of the work covered by the contract with the customer is executed, and the time in which it is certified,
- balances that are in the process of negotiation with customers owing to variations in scope, modifications or additional works referred to in the original contract,

Consolidated Financial Statements - ACS GROUP
41
- and balances, of the same nature as those above, which are in undergoing litigation or dispute resolution (in court or arbitration proceedings) stemming from lack of agreement between the parties, either because the arbitration is the form of a resolution contemplated in the contract for modifications to the original contract and balances associated with litigation or dispute resolution situations owing to events attributable to breaches by the customer of certain undertakings referred to in the contract and that are, usually, costs incurred by the Group arising from the impossibility of continuing a project due to actions or undertakings not performed by the customer, such as, for example, so-called "affected services" or "unperformed expropriations" or errors in the information provided by the customer concerning the work to be performed.
The balances corresponding to these last two items, are the so-called "Completed Work Pending Certificate Processing". It should be noted that sometimes there can be situations in which there are projects underway with open court or arbitration proceedings for disputes relating to certain units or parts thereof, without these affecting the normal execution of other parts of the project, although, projects subject to ongoing court or arbitration proceedings are usually halted or almost fully completed. Subject to the above, the group distinguishes between modifications and claims or disputes as set out in IAS 11 (paragraphs 13 and 14), where the first are works requested by the customer and that are related to the original contract, normally corresponding to the execution of complementary works or changes in work units or to the original design, and which are referred to in the current contract, and the second, are those works that the customer has refused or raised formal discrepancies to the acceptance of a particular works record or that are already subject to litigation or arbitration proceedings. In some cases such claims arise from amended works records that, following amicable negotiation periods are not finally accepted in their entirety by the customer, either owing to conflicting prices or for differences in the production units eventually presented by the Group to the customer. Having considered this, the Group understands that the recognition of income relating to the construction contracts it implements is fully compliant with the requirements set out in IAS 11. In this regard the Group, taking into account the conditions set out in IAS 11 (paragraph 13), recorded income for modifications only in those cases where customer acceptance is considered probable since the negotiations have been undertaken on a friendly footing, and additionally an analysis has been carried out by the Group engineers allowing the fair value of the amounts to be recovered in the negotiation process to be quantified. For clarification purposes, the Group has an internal scale that identifies the degree of negotiation reached by the various complementary or modified works certificate, not recognizing income until they are at an advanced stage and do not raise, with the information available to date, doubts regarding their successful outcome leading to certification and payment. This recognition of income is performed with the corresponding estimated profit margin. In the case of claims, the Group usually recognizes the costs incurred, without margin, although in some cases in which the recoverability of costs is not likely or there is uncertainty about when the situation will be resolved, these not are capitalized, recording losses in the project execution budget. Furthermore, if the projects enter arbitration or litigation proceedings, the Group does not record income, nor capitalization of any costs incurred until final rulings. For the registration of claims or works records in arbitration, as contemplated in IAS 11 (paragraph 14) favorable third-party technical and legal reports are required that support the successful outcome and quantification of the proceedings. In relation to these latest works records, they could be result of modifications that were unsuccessful in negotiations and had recognized margin in previous periods. In these situations, once the records are identified as claims, the Group, as a general practice, adjust them to their recoverable value, recording the necessary provisions. Machinery or other fixed assets acquired for a specific project are amortized over the estimated project execution period and on the basis of the consumption pattern thereof. Permanent facilities are depreciated on a straight-line basis over the project execution period. The other assets are depreciated in accordance with the general criteria indicated in these notes to financial statements. Late-payment interest arising in relation to delays in the collection of certification amounts is recognized when collected.
42
03.16.02 Industrial Services, Environment and Other Businesses Group companies recognize as the outcome from the rendering of services for each year the difference between production (valued at the sale price of the services provided during the period, which are covered by the initial contract entered into with the customer or in approved modifications or addenda thereto, and of services which have not yet been approved but there is reasonable assurance of recovery) and the costs incurred in the year. Price increases agreed in the initial contract entered into with the customer are recognized as revenue on an accrual basis, regardless of whether they have been approved annually by the customer. Late-payment interest is recognized as financial income when finally approved or collected.
03.17. Expense recognition
An expense is recognized in the consolidated income statement when there is a decrease in the future economic benefits as a result of a reduction of an asset, or an increase in a liability, which can be measured reliably. This means that an expense is recognized simultaneously to the recognition of the increase in a liability or the reduction of an asset. Additionally, an expense is recognized immediately when a disbursement does not give rise to future economic benefits or when the requirements for recognition as an asset are not met. Also, an expense is recognized when a liability is incurred and no asset is recognized, as in the case of a liability relating to a guarantee. In the specific case of expenses associated with commission income when the commission agent does not have any inventory risk, as in the case of certain Group logistics service companies, the cost to sell or to render the related service does not constitute an expense for the company (commission agent) since the latter does not assume the inherent risks. In these cases, as indicated in the section on revenue recognition, the sale or service rendered is recognized for the net amount of the commission.
03.18. Offsetting
Asset and liability balances must be offset and the net amount is presented in the consolidated statement of financial position when, and only when, they arise from transactions in which, contractually or by law, offsetting is permitted and the Group companies intend to settle them on a net basis, or to realize the asset and settle the liability simultaneously.
03.19. Income tax The corporation tax expense represents the sum of the current tax expense and the change in deferred tax assets and liabilities. The current income tax expense is calculated by aggregating the current tax arising from the application of the tax rate to the taxable profit (tax loss) for the year, after deducting the tax credits allowable for tax purposes, plus the change in deferred tax assets and liabilities. Deferred tax assets and liabilities include temporary differences measured at the amount expected to be payable or recoverable on differences between the carrying amounts of assets and liabilities and their tax bases, and tax loss and tax credit carryforwards. These amounts are measured at the tax rates that are expected to apply in the period when the asset is realized or the liability is settled. Deferred tax liabilities are recognized for all taxable temporary differences, unless the temporary difference arises from the initial recognition of goodwill or the initial recognition (except in the case of a business combination) of other assets and liabilities in a transaction that affects neither accounting profit (loss) nor taxable profit (tax loss). Deferred tax assets are recognized for temporary differences to the extent that it is considered probable that the consolidated companies will have sufficient taxable profits in the future against which the deferred tax asset can be utilized, and the deferred tax assets do not arise from the initial recognition (except in a business combination) of other assets and liabilities in a transaction that affects neither accounting profit (loss) nor taxable profit (tax
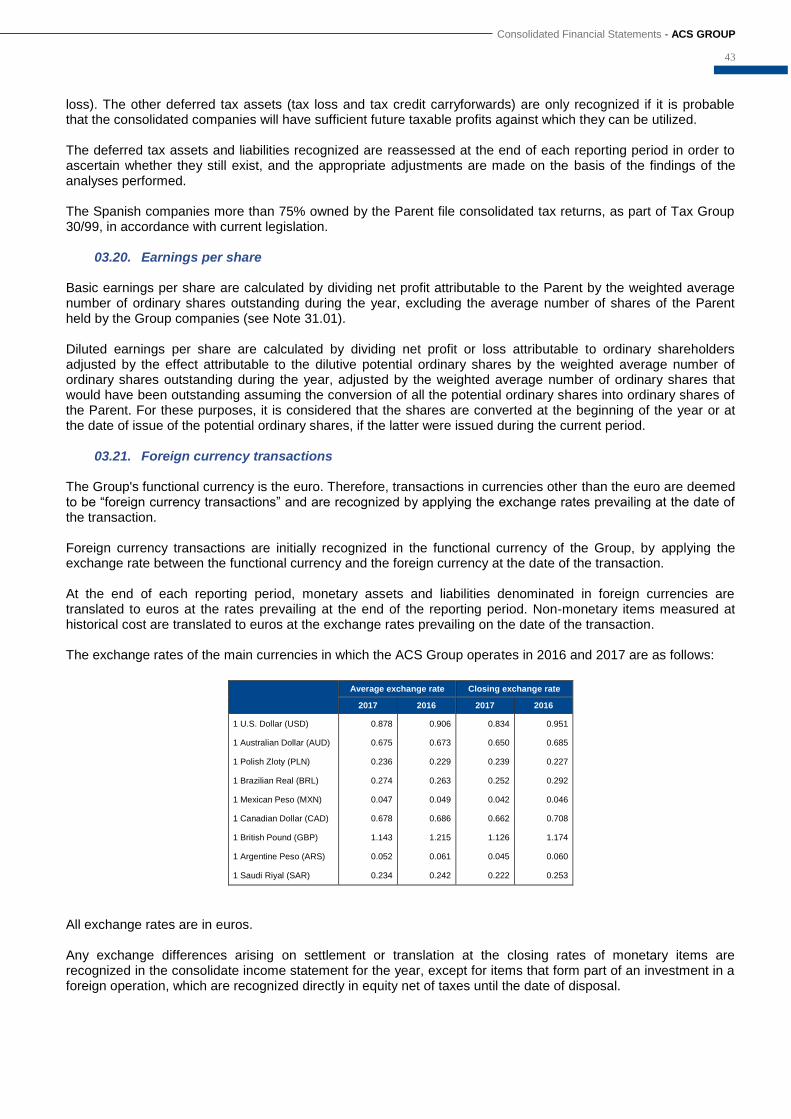
Consolidated Financial Statements - ACS GROUP
43
loss). The other deferred tax assets (tax loss and tax credit carryforwards) are only recognized if it is probable that the consolidated companies will have sufficient future taxable profits against which they can be utilized. The deferred tax assets and liabilities recognized are reassessed at the end of each reporting period in order to ascertain whether they still exist, and the appropriate adjustments are made on the basis of the findings of the analyses performed. The Spanish companies more than 75% owned by the Parent file consolidated tax returns, as part of Tax Group 30/99, in accordance with current legislation.
03.20. Earnings per share Basic earnings per share are calculated by dividing net profit attributable to the Parent by the weighted average number of ordinary shares outstanding during the year, excluding the average number of shares of the Parent held by the Group companies (see Note 31.01). Diluted earnings per share are calculated by dividing net profit or loss attributable to ordinary shareholders adjusted by the effect attributable to the dilutive potential ordinary shares by the weighted average number of ordinary shares outstanding during the year, adjusted by the weighted average number of ordinary shares that would have been outstanding assuming the conversion of all the potential ordinary shares into ordinary shares of the Parent. For these purposes, it is considered that the shares are converted at the beginning of the year or at the date of issue of the potential ordinary shares, if the latter were issued during the current period.
03.21. Foreign currency transactions The Group's functional currency is the euro. Therefore, transactions in currencies other than the euro are deemed to be “foreign currency transactions” and are recognized by applying the exchange rates prevailing at the date of the transaction. Foreign currency transactions are initially recognized in the functional currency of the Group, by applying the exchange rate between the functional currency and the foreign currency at the date of the transaction. At the end of each reporting period, monetary assets and liabilities denominated in foreign currencies are translated to euros at the rates prevailing at the end of the reporting period. Non-monetary items measured at historical cost are translated to euros at the exchange rates prevailing on the date of the transaction. The exchange rates of the main currencies in which the ACS Group operates in 2016 and 2017 are as follows:
Average exchange rate Closing exchange rate
2017 2016 2017 2016
1 U.S. Dollar (USD) 0.878 0.906 0.834 0.951
1 Australian Dollar (AUD) 0.675 0.673 0.650 0.685
1 Polish Zloty (PLN) 0.236 0.229 0.239 0.227
1 Brazilian Real (BRL) 0.274 0.263 0.252 0.292
1 Mexican Peso (MXN) 0.047 0.049 0.042 0.046
1 Canadian Dollar (CAD) 0.678 0.686 0.662 0.708
1 British Pound (GBP) 1.143 1.215 1.126 1.174
1 Argentine Peso (ARS) 0.052 0.061 0.045 0.060
1 Saudi Riyal (SAR) 0.234 0.242 0.222 0.253
All exchange rates are in euros. Any exchange differences arising on settlement or translation at the closing rates of monetary items are recognized in the consolidate income statement for the year, except for items that form part of an investment in a foreign operation, which are recognized directly in equity net of taxes until the date of disposal.

44
On certain occasions, in order to hedge its exposure to certain foreign currency risks, the Group enters into forward currency contracts and options (see Note 21 for details of the Group's accounting policies in respect of such derivative financial instruments). On consolidation, the assets and liabilities of the Group's foreign operations are translated to euros at the exchange rates prevailing at the date of the consolidated statement of financial position. Income and expense items are translated at the average exchange rates for the year, unless exchange rates fluctuate significantly. Any exchange differences arising are classified as equity. Such exchange differences are recognized as income or as expenses in the year in which the operation is disposed of. Goodwill and fair value adjustments arising on the acquisition of a company the functional currency of which is not the euro are treated as assets and liabilities of the foreign company and are translated at the closing rate.
03.22. Entities and branches located in hyperinflationary economies Given the economic situation in Venezuela and in accordance with the definition of hyperinflationary economy provided by IAS 29, the country has been classified as hyperinflationary since 2009 and at the end of 2017 it continued to be classified as such. The ACS Group has investments in Venezuela through its subsidiaries of the Construction, Services and Industrial Services segments, the amounts outstanding at 31 December 2017 and 2016, and the volume of transactions in the years 2017 and 2016 being immaterial. None of the functional currencies of the consolidated subsidiaries and associates located abroad relate to hyperinflationary economies as defined by IFRSs. Accordingly, at the 2017 and 2016 accounting close it was not necessary to adjust the financial statements of any of the subsidiaries or associates to correct for the effect of inflation.
03.23. Consolidated Statement of Cash Flows
The following terms are used in the consolidated cash flow statements with the meanings specified:
- Cash flows: inflows and outflows of cash and cash equivalents, which are short-term, highly liquid investments that are subject to an insignificant risk of changes in value.
- Operating activities: the principal revenue-producing activities of the Group and other activities that are not investing or financing activities.
- Investing activities: the acquisition and disposal of long-term assets and other investments not included in cash and cash equivalents.
- Financing activities: activities that result in changes in the size and composition of the equity and liabilities that are not operating activities.
In view of the diversity of its businesses and activities, the Group opted to report cash flows using the indirect method. In preparing the consolidated statement of cash flows, cash and cash equivalents were considered to be "cash on hand", demand deposits at banks and short-term, highly liquid investments that are easily convertible into cash and are subject to an insignificant risk of changes in value. The breakdown of the heading “Other adjustments to profit (net)” of the consolidated statement of cash flows for 2017 and 2016 is as follows:

Consolidated Financial Statements - ACS GROUP
45
Thousands of Euros
2017 2016
Financial income (202,997) (186,044)
Financial costs 486,216 526,301
Impairment and gains or losses on disposals of non-current assets 15,343 20,416
Results of companies accounted for using the equity method (137,511) (75,128)
Impairment and gains or losses on disposal of financial instruments 5,466 22,654
Changes in the fair value of financial instruments (243,937) (66,249)
Other effects (42,920) (20,217)
Total (120,340) 221,733
The distribution of the comparative consolidated statement of cash flows corresponding to the ACS Group, upon removal of the effect of Urbaser in fiscal year 2016, was as follows:
Thousands of Euros
31/12/2016
ACS ex Urbaser
Urbaser Total
Gross flows from operating activities 1,513,891 224,259 1,738,150
Changes in working capital (21,028) (157,221) (178,249)
Interest payable (531,592) (63,407) (594,999)
Dividends received 426,655 8,201 434,856
Interest received 159,164 20,884 180,048
Income tax payment/proceeds (170,715) (6,209) (176,924)
CASH FLOWS FROM OPERATING ACTIVITIES 1,376,375 26,507 1,402,882
Cash Flows Ordinary Investment Activities 200,854 (94,861) 105,993
Cash Flows from investing activities for the sale of Urbaser 959,000 (181,209) 777,791
CASH FLOWS FROM INVESTING ACTIVITIES 1,159,854 (276,070) 883,784
CASH FLOWS FROM FINANCING ACTIVITIES (2,543,050) 66,510 (2,476,540)
EFFECT OF CHANGES IN EXCHANGE RATES 47,217 (6,273) 40,944
NET INCREASE (DECREASE) IN CASH AND CASH EQUIVALENTS 40,396 (189,326) (148,930)
CASH AND CASH EQUIVALENTS AT BEGINNING OF THE PERIOD 5,614,382 189,326 5,803,708
CASH AND CASH EQUIVALENTS AT END OF THE PERIOD 5,654,778 - 5,654,778
In preparing the consolidated statement of cash flows for fiscal year 2017, under the section on cash flows from financing activities, “Equity instrument proceeds / (and payment)” includes, the acquisitions of ACS treasury shares, as well as the additional payment pending from 2016 upon the acquisition of UGL. It should also be noted that in preparing the consolidated statement of cash flows for fiscal year of 2016, the section on cash flows from financing activities “Equity instrument proceeds / (and payment)” included, in addition to the acquisitions of ACS treasury shares, and the treasury shares purchased by Hochtief and Cimic, as well as the additional investment made in Sedgman and UGL in the fiscal year upon the gaining of control thereof. Therefore, in preparing the consolidated statement of cash flows for fiscal year 2016, cash flows from investing activities in group companies, related companies and business units included as a lower amount of the investment in Sedgman and in UGL the amount corresponding to cash and cash equivalents included as a result of the consolidation of those companies for an amount of EUR 164.6 million that reduced the value of the investments disbursed in the acquisitions of these companies in that period by an amount of EUR 474.0 million, with EUR 218.9 million reflected as investment transactions and EUR 255.1 million reflected as financing transactions. The most significant receipt from divestment was the amount of EUR 959 million, received at the time of the execution of the sale deed for Urbaser in December 2016 (see Note 03.09).

46
In addition, the group recorded as a sale of financial assets the amounts effectively collected in the divestment in December 2015 from the sale of its 80% stake in the company Servicios, Transportes y Equipamientos Públicos Dos, S.L. which is the owner 50% of the concessionaire of the Line 9 section II of the Metro of Barcelona and the company in charge of maintenance of section II and section IV of this metro line for a total of EUR 109 million. Reconciliation of the carrying amount of liabilities resulting from financing transactions, separating cash changes and non-cash changes, is as follows for fiscal years 2017 and 2016:
Balance at 31/12/2016
Cash changes Non-cash changes
Balance at 31/12/2017 Borrowings
Principal repayments
Currency translation
adjustments Reclassifications
Changes in the scope of
consolidation
Long term financial liabilities 4,744,752 773,123 (366,293) (82,088) (68,459) 12,506 5,013,541
Short term financial liabilities 3,742,322 3,320,675 (3,712,805) (74,292) (230,451) (214,164) 2,831,285
Project finance 202,049 66,313 (21,575) (6,554) - (45,276) 194,957
Amounts due to banks 8,689,123 4,160,111 (4,100,673) (162,934) (298,910) (246,934) 8,039,783
Balance at 31/12/2015
Cash changes Non-cash changes
Balance at 31/12/2016 Borrowings
Principal repayments
Currency translation
adjustments Reclassifications
Changes in the scope of
consolidation
Long term financial liabilities 6,895,850 88,979 (1,629,677) 60,514 (90,473) (580,441) 4,744,752
Short term financial liabilities 3,308,165 1,134,603 (966,047) (16,399) 66,432 215,568 3,742,322
Project finance 540,845 7,813 (19,243) (18,067) 110 (309,409) 202,049
Amounts due to banks 10,744,860 1,231,395 (2,614,967) 26,048 (23,931) (674,282) 8,689,123
03.24. Entry into force of new accounting standards The following mandatory standards and interpretations, already adopted in the European Union, came into force in 2017 and, where applicable, were used by the Group in the preparation of the consolidated financial statements:
(1) New standards, amendments and interpretations whose application is mandatory in the year beginning 1 January 2017:
Approved for use in the European Union Mandatory application in the
years from:
Amendment to IAS 7 Disclosure initiative
(published in January 2016)
Introduces additional disclosure requirements on financing
activities. 1 January 2017.
Amendment to IAS 12 Recognition of deferred tax
assets for unrealized losses
(published in January 2016)
Clarification of the principles regarding the recognition of
deferred tax assets for unrealized losses.
Not approved for use in the European Union
Improvements to the 2014-2016 IFRS Cycle:
Clarification on IFRS 12
Clarification on the reach of IFRS 12 and its
interrelationship with IFRS 5 comes into force in this
period.
The application of the aforementioned new standards did not have a significant impact on the ACS Group.
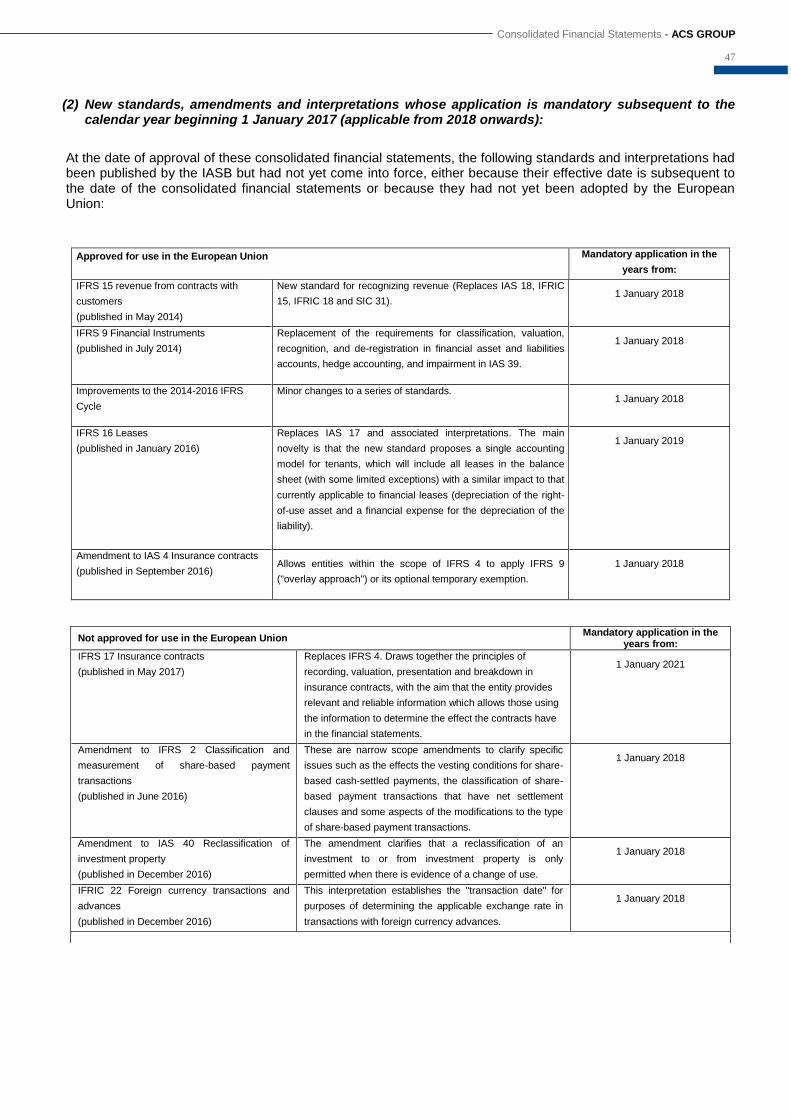
Consolidated Financial Statements - ACS GROUP
47
(2) New standards, amendments and interpretations whose application is mandatory subsequent to the calendar year beginning 1 January 2017 (applicable from 2018 onwards):
At the date of approval of these consolidated financial statements, the following standards and interpretations had been published by the IASB but had not yet come into force, either because their effective date is subsequent to the date of the consolidated financial statements or because they had not yet been adopted by the European Union:
Approved for use in the European Union Mandatory application in the
years from:
IFRS 15 revenue from contracts with
customers
(published in May 2014)
New standard for recognizing revenue (Replaces IAS 18, IFRIC
15, IFRIC 18 and SIC 31). 1 January 2018
IFRS 9 Financial Instruments
(published in July 2014)
Replacement of the requirements for classification, valuation,
recognition, and de-registration in financial asset and liabilities
accounts, hedge accounting, and impairment in IAS 39.
1 January 2018
Improvements to the 2014-2016 IFRS
Cycle
Minor changes to a series of standards.
1 January 2018
IFRS 16 Leases
(published in January 2016)
Replaces IAS 17 and associated interpretations. The main
novelty is that the new standard proposes a single accounting
model for tenants, which will include all leases in the balance
sheet (with some limited exceptions) with a similar impact to that
currently applicable to financial leases (depreciation of the right-
of-use asset and a financial expense for the depreciation of the
liability).
1 January 2019
Amendment to IAS 4 Insurance contracts
(published in September 2016) Allows entities within the scope of IFRS 4 to apply IFRS 9
("overlay approach") or its optional temporary exemption.
1 January 2018
Not approved for use in the European Union Mandatory application in the years from:
IFRS 17 Insurance contracts
(published in May 2017)
Replaces IFRS 4. Draws together the principles of
recording, valuation, presentation and breakdown in
insurance contracts, with the aim that the entity provides
relevant and reliable information which allows those using
the information to determine the effect the contracts have
in the financial statements.
1 January 2021
Amendment to IFRS 2 Classification and
measurement of share-based payment
transactions
(published in June 2016)
These are narrow scope amendments to clarify specific
issues such as the effects the vesting conditions for share-
based cash-settled payments, the classification of share-
based payment transactions that have net settlement
clauses and some aspects of the modifications to the type
of share-based payment transactions.
1 January 2018
Amendment to IAS 40 Reclassification of
investment property
(published in December 2016)
The amendment clarifies that a reclassification of an
investment to or from investment property is only
permitted when there is evidence of a change of use.
1 January 2018
IFRIC 22 Foreign currency transactions and
advances
(published in December 2016)
This interpretation establishes the "transaction date" for
purposes of determining the applicable exchange rate in
transactions with foreign currency advances.
1 January 2018

48
Not approved for use in the European Union Mandatory application in the years from:
IFRIC 23 Uncertainty over income tax
treatments
(published in June 2017)
This interpretation clarifies how to apply the recording and
valuation criteria from IAS 12 when there is uncertainty
regarding acceptability by the tax authority of a particular
tax treatment used by the entity.
1 January 2019
Amendment to IFRS 9 Prepayment features
with negative compensation
(published in October 2017)
Allows for valuation at amortized cost for some financial
instruments with prepay features, permitting the payment
of a lesser amount than unpaid capital and interest
amounts.
1 January 2019
Amendment to IAS 28 Long-term interests in
associates and joint ventures
(published in October 2017)
Clarifies that IFRS 9 must be applied to long-term interest
for an associate or joint venture if the equity method is not
used.
1 January 2019
Amendment to IAS 19 Plan amendment,
curtailment or settlement
In accordance with the proposed amendments, when a
change is produced in a defined benefit plan (through
amendment, curtailment or settlement), the entity will use
updated assumptions to determine the cost of the services
for the period following the plan modification.
1 January 2019
Amendment to IFRS 10 and IAS 28 – Sale or
contribution of assets between an investor and
its affiliate/joint venture
(published in September 2014)
Clarification regarding the result of these operations if they
are businesses or assets. No date defined
The most relevant impacts are produced with the application of IFRS 15 and, to a lesser extent, IFRS 9. IFRS 15: Revenue from contracts with customers IFRS 15 is the new comprehensive standard for the recognition of revenue from customers which will replace, in fiscal years from 1 January 2018 onwards, the following standards and interpretations currently in force: IAS 18 Revenue, IAS 11 Construction Contracts, IFRIC 13 Customer loyalty programs, IFRIC 15 Agreements for the construction of real estate, IFRIC 18 Transfers of assets from customers and SIC 31 Revenue - barter transactions involving advertising services. In accordance with the new requirements established by IFRS 15, revenue must be recognized in such a way that the transfer of assets or services to customers is shown by an amount that reflects the consideration to which the entity hopes to have rights in exchange for the aforementioned assets or services when the control of an asset or service is transferred to the customer. The ACS Group operates in different industrial and geographical sectors which are subject to different legal and contractual frameworks. Therefore, the Group has liaised with the different operating divisions and project teams within each business to evaluate the possible repercussions of the new standard on the various units within the Group. They are using key criteria and estimates to determine the likely effect, for example evaluating the probability that the customer will accept variations and the acceptance of claims, the estimates for project end dates and the assumed productivity levels for their execution. When conducting this evaluation, the status of each legal proceeding, including arbitration and litigation, has been taken into account for the relevant contracts. This revision is underway and, consequently, all effects are current estimations which are remain to be defined before final implementation.
Subsidiaries
Construction income
The contractual terms and the manner in which the Group implements its construction contracts mainly derive from projects which contain a single performance obligation. Contracted revenue will continue to be recognized over time; however, the new standard provides new requirements for variable consideration such as incentives, claims and changes such as contractual modifications which lead to a higher threshold for probability of recognition. Revenue is currently recognized when it appears likely that the work conducted will generate income,

Consolidated Financial Statements - ACS GROUP
49
whilst the new standard requires that revenue is recognized when it is highly likely that there is no significant revenue reversals for these changes.
Services income
Services income arises from maintenance and other services provided to assets and infrastructure installations which may include a range of services and processes. Under IFRS 15, these are mainly recognized over time as performance obligations are satisfied. Services which have been deemed a performance obligation are highly interconnected and are achieved over time, and as a result income continues to be recognized over time. Similarly to construction income, there are incentives, variations and claims which are subject to the same strict criteria which only recognize revenue when it is highly likely that there will be no significant revenue reversal.
Tender costs and agreement costs
Currently, under IAS 11 Construction contracts, the costs incurred during the tendering process are funded by the net contract debtors when it is considered likely that they will be awarded the contract. According to the new standard, the costs may only be claimed if it is expected that both will be recovered and that no charge would have been incurred if they had not been awarded the contract or if they were inherent to project delivery. Other significant contract or fulfillment costs are not anticipated.
Conclusion
Although the Group’s analysis is still underway, an adjustment to the reserves attributable to ACS shareholders and minority interests will be recognized in the opening balance at 1 January 2018 based on the current evaluation. Stricter recognition thresholds in the new standard could lead to a current estimate adjustment that would reduce net equity by EUR 1,145 million (net of tax).
Associates / Joint ventures The accounting value of the ACS Group investment in Associates and joint ventures reflects the Group’s stake in the operating revenues of these companies. Given that these companies are non-controlled entities, the ACS Group has carried out an analysis of the effect which could be expected upon adopting IFRS 15, on the basis of information currently available to ACS Group as a shareholder in the aforementioned companies and applying uniform recognition criteria as described under “Construction income". Although joint control agreements exist with many of the companies, the ACS Group does not exert the same degree of control on the implementation project of these companies as it does on itself and, therefore, the estimate of projected effect is subject to a greater degree of uncertainty. In accordance with this analysis, an adjustment to the accounting value of these entities will be recognized, which will also reflect the net equity of the ACS Group in the opening balance at 1 January 2018. The stricter recognition threshold in the new standard could lead to a current estimated adjustment that would reduce net equity by EUR 300 million (net of tax). This effect will mainly arise from the Group’s shareholding in HLG Contracting, with an approximate impact of EUR 160 million (net of tax).
Transition
The Group plans to adopt IFRS 15 using the cumulative effect method, first applying this recognized standard on the date it comes into force, i.e. on 1 January 2018. As a result, an adjustment to the Group’s net equity will be made in the opening balance. IFRS 9: Financial instruments
IFRS 9 will, from fiscal year beginning 1 January 2018, replace IAS 39 and affect both asset and liability financial instruments, covering three main topics:
- classification and measurement; - impairment of financial assets; - hedge accounting.
50
It also contains forward guidance on IAS 39 recognition and write-down for financial instruments. The standard will be obligatory for the publication of results in periods beginning after 1 January 2018. Although an update of comparative figures is not necessary, the comparative period can be updated without the need for retrospective application. For this reason, the Group has undertaken an evaluation of the effects of classification and measurement of the new standard and has predicted the following:
- The Group does not anticipate that the new standard will have a significant effect on the classification of its financial assets;
- with the exception of derivatives which do not qualify as hedges, the Group does not hold any financial liability with change in revenue and thus there is no effect from the new standard on financial liabilities;
- as a general rule, a greater number of hedging relationships could benefit from hedge accounting. Existing hedging relationships would move to become continued hedging relationships when the new standard is adopted;
- IFRS 9 will require the presentation of additional breakdowns, in particular relating to hedge accounting, credit risk and expected credit losses;
- on 1st January 2018, an adjustment of the reserves attributable to ACS Group shareholders and to minority interests will be recognized in the opening balance;
- where the calculation of impairment is concerned, the new accounting standard has moved from a model where impairment was based on the loss incurred, to a model where impairment is based on the projected loss from the impairment of financial assets. The new model could generate an estimated adjustment that would reduce equity by approximately EUR 435 million (net of tax), mainly affecting HLG Contracting non-current loans. Independent external consultants have been used to determine the expected credit loss from the date IFRS 9 comes into force;
- in addition to the above consideration, evaluations are currently being undertaken to ascertain if any specific financing obligation would require recognition of expected credit losses. If this is not the case, no significant increase in the provision for financial asset losses is expected.
The effect of IFRS 15 and IFRS 9 on tax purposes and net equity The adjustments in relation to the new standards are subject to tax effect accounting and, therefore, the deferred net tax position will be affected, despite finalizing all adjustments. The adoption of the new standards could generate an estimated increase in deferred tax assets for the Group of approximately EUR 220 million. The effects which are detailed in this note are after-tax estimates and, as such, have already taken into account this tax effect. The effect when first applying the two standards will be a reduction in own funds of approximately EUR 1,350 million and in minority interests of EUR 530 million.
Effect on cash flows It is not expected that the adjustments arising from the application of IFRS 9 and IFRS 15 will have any effect on ACS Group consolidated statement of cash flows.
IFRS 16: Leases IFRS 16 will come into force on 1 January 2019 and will replace IAS 17 and its current associated interpretations. The main novelty is that IFRS 16 proposes a single accounting model for tenants, which will require tenants to recognize the right-of-use asset and lease liabilities for almost all leases. The landlord’s accounting remains similar to the current standard, i.e. landlords will continue to classify leases as either financial or operating leases. At 31 December 2017, the ACS Group has non-cancelable operating lease commitments in the amount of EUR 963,696 thousand (of which EUR 785,599 thousand derive from the Hochtief Group). The ACS Group administers its owned and leased assets to ensure that there is a sufficient level of resources for it to meet its current obligations and solicit new tenders. The decision to lease or buy an asset depends on numerous considerations such as financing, risk management and operational strategies after the planned end to a project. Some of the current operating leases expire before the application of the standard and the decisions on future leases will be taken as projects go out to tender. As such, the Group has not finalized its quantification of the effect of the new standard, although the following consequences are anticipated:

Consolidated Financial Statements - ACS GROUP
51
- On the lease commencement date, the tenant should recognize the right-of-use asset and lease liability. The lease commencement date is defined in the standard as the date on which the landlord makes the underlying asset available to the tenant for his/her use;
- straight-line operating lease expenses will be replaced by a depreciation of the right-of-use asset and a decreasing interest expense of the lease liability (financial expense);
- interest expenses will be greater at the start of a lease term due to the greater principal value which will result in profit variability over the course of a lease term. This effect could be partially mitigated through a series of leases signed by the Group at different stages in the term;
- the repayment of the principal of all lease liabilities will be classified as financing activities.
As of today, the Group is evaluating the impact that this standard will have on its financial statements.
04. Intangible assets
04.01. Goodwill The detail by line of business of the changes in goodwill in 2017 and 2016 is as follows:
Line of Business
Thousands of Euros
Balance at 31/12/2016
( * ) Additions
Disposals and
allocations Impairment
Exchange differences
Transfers to/from other
assets
Balance at 31/12/2017
Parent 743,140 - - - - - 743,140
Construction 2,171,196 - (2,719) (2,776) (20,967) 634 2,145,368
Industrial Services 85,335 1,835 (2,429) (21,000) (3,347) - 60,394
Services 122,556 10,167 - (2,272) (638) 31 129,844
Total 3,122,227 12,002 (5,148) (26,048) (24,952) 665 3,078,746
Line of Business
Thousands of Euros
Balance at 31/12/2015
Change in consolidation
method Additions
Disposals and
allocations Impairment
Exchange differences
Transfers to/from other
assets
Balance at 31/12/2016
( * )
Parent 780,939 - - (37,799) - - - 743,140
Construction 1,798,342 - 379,737 (1,999) (4,143) 4,050 (4,791) 2,171,196
Industrial Services 91,955 (45) 378 (2,214) (6,213) 1,297 177 85,335
Services 243,905 - 8,651 (89,792) - (420) (39,788) 122,556
Total 2,915,141 (45) 388,766 (131,804) (10,356) 4,927 (44,402) 3,122,227
( * ) Data restated.
In accordance with the table above, the most significant goodwill is that arising from the full consolidation of Hochtief, A.G. amounting to EUR 1,388,901 thousand and that from the merger of the Parent with Grupo Dragados, S.A. which amounts to EUR 743,140 thousand. There have been no significant changes in fiscal year 2017. In addition to that described in the paragraphs above, and as a result of the acquisition of UGL by Cimic (see Note 02.02.f) being undertaken very close to the end of fiscal year 2016, the fair value of the identifiable assets and liabilities of UGL (Purchase Price Allocation or PPA) were provisional and had not been finalized. At 31 December 2017 the accounting for the business combination had been completed; therefore the comparative information from the consolidated statement of financial position at 31 December 2016 has been retrospectively re-expressed, increasing goodwill value by EUR 14,387 thousand (AUD 21.0 million). The most significant variation during fiscal year 2016 took place as a result of the purchase of the remaining interest in Sedgman (see Note 02.02.f) for an amount of EUR 41.4 million and the purchase of UGL for an amount of EUR 323.7 million. The write-down was due to the sale of the ownership interest in Urbaser, which, in addition to partially reducing the goodwill of the Dragados Group by EUR 37,799 thousand due to the portion assigned to the Urbaser CGU, reduced goodwill derived from the Urbaser Group itself by EUR 92,910 thousand.
52
As regards goodwill, each year the ACS Group compares the carrying amount of the related company or cash-generating unit (CGU) against its value in use, determined by the discounted cash flow method. As regards the goodwill generated by the purchase of Hochtief, A.G. in 2011, said goodwill was, in accordance with IAS 36.80, allocated to the main cash-generating units, namely Hochtief Asia Pacific and Hochtief Americas. The value of the goodwill allocated to the Hochtief Asia Pacific cash-generating unit (CGU) amounted to EUR 1.102 billion, while the CGU Hochtief Americas was allocated EUR 287 million. In 2017, the ACS Group evaluated the recoverability of these items. For the purpose of testing the impairment of the goodwill of Hochtief assigned to the business carried out by Hochtief Asia Pacific, the ACS Group based its valuation on the internal projections for 2018 to 2020 made according to the Hochtief business plan for this line of business together with the estimates for 2021 and 2022, discounting the free cash flows at a weighted average cost of capital (WACC) of 9.5%, and using a perpetual growth rate of 2.5%. The weighted average cost of capital (WACC) represents a profitability premium on the long-term rate of interest (10-year Australian Bond) published by Bloomberg at 31 December 2017 and standing at 690 basis points. Similarly, the perpetual growth rate used corresponds to the estimated CPI for Australia for the year 2022 as published by the IMF in its World Economic Outlook report for October 2017. In the case of the sensitivity analysis for the impairment test relating to the goodwill assigned to Hochtief’s Asia Pacific business, the most relevant aspects are that the goodwill test withstands a discount rate of up to approximately 14%, representing a range of approximately 450 basis points, as well as a perpetuity growth rate of minus 3%. Also, it would bear an annual drop in cash flows of approximately 55% with regard to the projected flows. In addition, this value has been compared to the average target price determined by CIMIC analysts according to Bloomberg at 31 December 2017 and to CIMIC’s market price at that same date, concluding that there is no deterioration in either of the scenarios analyzed. In the case of Hochtief Americas business unit, the following basic assumptions have been made:
- Forecasts used for 5 years, until 2020, according to Hochtief’s business plan for the division and estimates for the 2021-2022 period.
- Perpetual growth rate of 2.3%, according to the IMF estimate with regard to the CPI for the US in 2022, based on the World Economic Outlook report published by the IMF in October 2017.
- A discount rate of 9.6% has also been assumed.
As for the sensitivity analysis of the impairment test for the goodwill assigned to Hochtief Americas, the relevant aspects are that the goodwill test, even assuming a cash position of 0 euros, supports a discount rate of up to approximately 50%, representing a span of 4.040 basis points, and would withstand an annual fall in cash flows of more than 80% of the projections. All the assumptions listed above are supported by the historical financial information for the different units, allowing for future growth lower than those obtained in previous years. Additionally, it should be noted that the main variables of fiscal year 2017 did not differ significantly from those used in the impairment test of the previous year, and in some cases were higher than the forecasts. In addition, this value has been compared with the analysts' valuations for said division of Hochtief, and it has been concluded that it does not represent any impairment in any of the scenarios analyzed. It should also be noted that the market price at 31 December 2017 (EUR 147.60 per share) is significantly higher than the average consolidated carrying cost. Along with the goodwill arising from the aforementioned full consolidation of Hochtief, A.G., the most significant goodwill, which amounted to EUR 743,140 thousand (EUR 743,140 thousand at 31 December 2016), arose from the merger with Dragados Group in 2003 and related to the amount paid in excess of the value of the assets on the acquisition date. This goodwill was assigned mainly to the cash-generating units of the Construction and Industrial Services area according to the following breakdown:
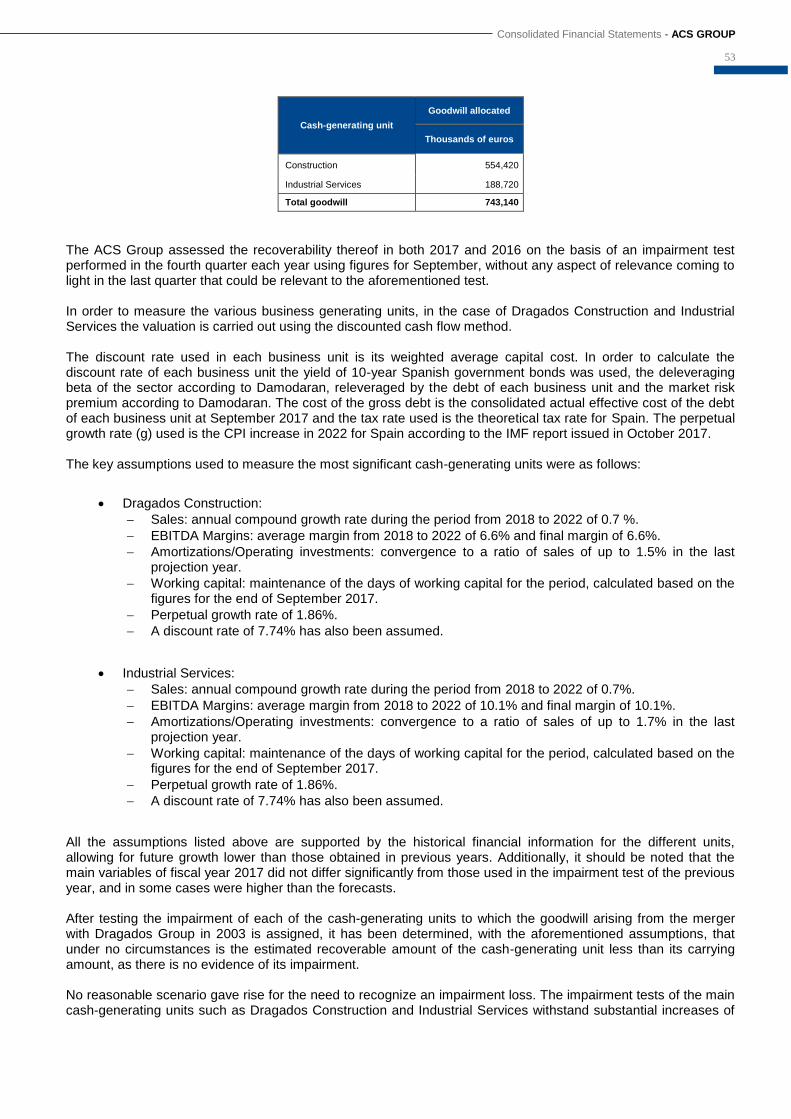
Consolidated Financial Statements - ACS GROUP
53
Cash-generating unit
Goodwill allocated
Thousands of euros
Construction 554,420
Industrial Services 188,720
Total goodwill 743,140
The ACS Group assessed the recoverability thereof in both 2017 and 2016 on the basis of an impairment test performed in the fourth quarter each year using figures for September, without any aspect of relevance coming to light in the last quarter that could be relevant to the aforementioned test. In order to measure the various business generating units, in the case of Dragados Construction and Industrial Services the valuation is carried out using the discounted cash flow method. The discount rate used in each business unit is its weighted average capital cost. In order to calculate the discount rate of each business unit the yield of 10-year Spanish government bonds was used, the deleveraging beta of the sector according to Damodaran, releveraged by the debt of each business unit and the market risk premium according to Damodaran. The cost of the gross debt is the consolidated actual effective cost of the debt of each business unit at September 2017 and the tax rate used is the theoretical tax rate for Spain. The perpetual growth rate (g) used is the CPI increase in 2022 for Spain according to the IMF report issued in October 2017. The key assumptions used to measure the most significant cash-generating units were as follows:
Dragados Construction:
Sales: annual compound growth rate during the period from 2018 to 2022 of 0.7 %.
EBITDA Margins: average margin from 2018 to 2022 of 6.6% and final margin of 6.6%.
Amortizations/Operating investments: convergence to a ratio of sales of up to 1.5% in the last projection year.
Working capital: maintenance of the days of working capital for the period, calculated based on the figures for the end of September 2017.
Perpetual growth rate of 1.86%.
A discount rate of 7.74% has also been assumed.
Industrial Services:
Sales: annual compound growth rate during the period from 2018 to 2022 of 0.7%.
EBITDA Margins: average margin from 2018 to 2022 of 10.1% and final margin of 10.1%.
Amortizations/Operating investments: convergence to a ratio of sales of up to 1.7% in the last projection year.
Working capital: maintenance of the days of working capital for the period, calculated based on the figures for the end of September 2017.
Perpetual growth rate of 1.86%.
A discount rate of 7.74% has also been assumed.
All the assumptions listed above are supported by the historical financial information for the different units, allowing for future growth lower than those obtained in previous years. Additionally, it should be noted that the main variables of fiscal year 2017 did not differ significantly from those used in the impairment test of the previous year, and in some cases were higher than the forecasts. After testing the impairment of each of the cash-generating units to which the goodwill arising from the merger with Dragados Group in 2003 is assigned, it has been determined, with the aforementioned assumptions, that under no circumstances is the estimated recoverable amount of the cash-generating unit less than its carrying amount, as there is no evidence of its impairment. No reasonable scenario gave rise for the need to recognize an impairment loss. The impairment tests of the main cash-generating units such as Dragados Construction and Industrial Services withstand substantial increases of
54
above 500 bps to the discount rates and significant negative deviations (greater than 50%) in budgeted cash flows without any impairment being recognized. According to the above, the Directors consider that the sensitivity ranges of the test with regard to the key assumptions are within a reasonable range, allowing no deterioration to be detected either in 2017 or in 2016. The remaining goodwill, excluding that generated by the merger between ACS and the Grupo Dragados and the goodwill arising from the full consolidation of Hochtief, A.G., is highly fragmented. Thus, in the case of the Industrial Services area, the total goodwill on the statement of financial position amounts to EUR 60,394 thousand (EUR 85,335 thousand at 31 December 2016), which relates to 17 companies from this business area, the most significant relating to the acquisition of Oficina Técnica de Estudios y Control de Obras, S.A. for EUR 12,350 thousand (EUR 12,350 thousand at 31 December 2016), Sociedad Ibérica de Construcciones Eléctricas, S.A. for EUR 11,709 thousand euros (EUR 11,709 thousand at 31 December 2016) and Midasco LLC for EUR 10,290 thousand (EUR 17,613 thousand at 31 December 2016). In the Services division, the total amount comes to EUR 129,844 thousand (EUR 122,556 thousand at 31 December 2016), corresponding to 18 different companies, the largest of which is that relating to the purchase of 25% of Clece for the amount of EUR 115,902 thousand. In 2016, as a result of the sale of Urbaser, the goodwill associated with that sub-group that was sold was written off, amounting to EUR 92,910 thousand. In the Construction area, in addition to the goodwill arising on the full consolidation of Hochtief, A.G., the goodwill arising on the acquisition of UGL towards the end of 2016 in the amount of EUR 338 million (see Note 1.10) should be highlighted, along with the goodwill arising on the acquisitions of Pol-Aqua for EUR 5,643 thousand (EUR 8,025 thousand at 31 December 2016), Pulice for EUR 51,555 thousand (EUR 58,828 thousand at 31 December 2016), John P. Picone for EUR 45,071 thousand (EUR 51,428 thousand at 31 December 2016), and Schiavone for EUR 49,775 thousand (EUR 56,797 thousand at 31 December 2016). With the exception of the goodwill of Pol-Aqua, which was partially amortized in 2017 for EUR 2,776 thousand and in 2016 in the amount of EUR 2,703 thousand, the differences in the goodwill arose as a result of translation differences with the US dollar and the zloty. In these areas, the calculated impairment test is based upon scenarios similar to those that have been described for each area of activity or, in the case of Dragados Group goodwill, taking into account the necessary adjustments based upon the peculiarities, geographic markets and specific circumstances of the affected companies, with no impairment being identified at close of fiscal year 2017 apart from impairment unrelated to Pol-Aqua. According to the estimates and projections available to the Directors of the Group and of each of the companies concerned, the projected cash flows attributable to these cash-generating units (or groups of units) to which the goodwill is allocated will make it possible to recover the net value of the goodwill recognized at 31 December 2017 and 2016. Impairment losses in relation to ACS Group goodwill during fiscal year 2017 amounted to EUR 26,048 thousand (EUR 10,356 thousand in fiscal year 2016).
04.02. Other intangible assets The changes in this heading in the consolidated statement of financial position in 2017 and 2016 were as follows:

Consolidated Financial Statements - ACS GROUP
55
Thousands of Euros
Development Computer software
Concessions Other
intangible assets
Total other intangible
assets
Accumulated amortization
Impairment losses
Total other intangible assets, net
Balance at 31 December of 2015 6,225 47,075 351,426 2,601,945 3,006,671 (1,397,560) (76,197) 1,532,914
Changes in the scope of consolidation (1,132) (11,246) (72,880) (560,739) (645,997) 371,961 - (274,036)
Additions or charges for the year 436 3,965 15,841 9,984 30,226 (127,815) (1,421) (99,010)
Disposals or reductions (633) (2,435) (5,313) (882) (9,263) 7,222 - (2,041)
Exchange differences 4 (145) 5,215 2,706 7,780 (1,824) (1,638) 4,318
Transfers to/from other assets - 6 (5,692) (35,602) (41,288) 2,958 20,213 (18,117)
Balance at 31 December of 2016 4,900 37,220 288,597 2,017,412 2,348,129 (1,145,058) (59,043) 1,144,028
Changes in the scope of consolidation - (57) (69) 22,030 21,904 1,101 - 23,005
Additions or charges for the year - 2,156 42,434 6,339 50,929 (137,230) (1,369) (87,670)
Disposals or reductions - (1,108) (2,556) (3,796) (7,460) 2,169 - (5,291)
Exchange differences (31) (553) (16,028) (23,261) (39,873) 15,178 6,318 (18,377)
Transfers to/from other assets (406) (38) (485) (16,647) (17,576) 13,774 1,696 (2,106)
Balance at 31 December of 2017 4,463 37,620 311,893 2,002,077 2,356,053 (1,250,066) (52,398) 1,053,589
The additions in fiscal year 2017 amounted to EUR 50,929 thousand (EUR 30,226 thousand in fiscal year 2016), relating mainly to the Services business in the amount of EUR 5,175 thousand (EUR 13,635 thousand in fiscal year 2016), Dragados in the amount of EUR 635 thousand (EUR 530 thousand in fiscal year 2016), Hochtief in the amount of EUR 17,756 thousand (EUR 13,249 thousand in fiscal year 2016), mainly from the allocation of the PPA in Sedgman to contracts with customers (see Note 02.02.f), and the Industrial Services business in the amount of EUR 27,303 thousand (EUR 2,318 thousand in fiscal year 2016). As a result of the sale of Urbaser in December 2016, EUR 329,233 thousand was written off under this heading in fiscal year 2016. During 2017 losses were recorded in the value of items classified as "Other intangible assets" for EUR 1,377 thousand. The losses incurred in fiscal year 2016 on the value of items classified under “Other intangible assets” amounted to EUR 1,845 thousand. Significant losses in value have not been carried forward into the consolidated income statements for fiscal years 2017 and 2016. The main assets recognized under "Other intangible assets" relate to Hochtief's construction backlog (mainly due to contracts in the Americas and Pacific Asia), prior to deteriorations and impairments, amounting to EUR 603,655 thousand (EUR 603,655 thousand at 31 December 2016), to the various trademarks of the Hochtief Group amounting to EUR 221,096 thousand (EUR 221,096 thousand at 31 December 2016) and to the contractual relationships with clients of the Hochtief Group amounting to EUR 722,779 thousand (EUR 722,779 thousand at 31 December 2016) generated in the first consolidation process (PPA). These assets, with the exception of the trademarks, are amortized in the period it is estimated that they generate revenue for the Group. Development expenditure recognized in the 2017 consolidated income statement as an expense amount to EUR 2,045 thousand (EUR 1,311 thousand in fiscal year 2016). At 31 December 2017, the amount of assets with an indefinite useful life other than those reported as ‘goodwill’, relate mainly to several trademarks of the Hochtief Group amounting to EUR 43,728 thousand (EUR 54,895 thousand at 31 December 2016). The changes in the period arose as a result of the rates of exchange. Trademarks are not amortized systematically, but are checked for possible impairment annually. In 2016 impairment losses were recognized on behalf of Devine in the Asia-Pacific division of Hochtief for EUR 6,733 thousand. No impairment losses were recognized in this connection in 2017. There were no material intangible asset items whose title was restricted in 2017 or 2016.
05. Property, plant and equipment The changes in this heading in the consolidated statement of financial position in 2017 and 2016 were as follows:
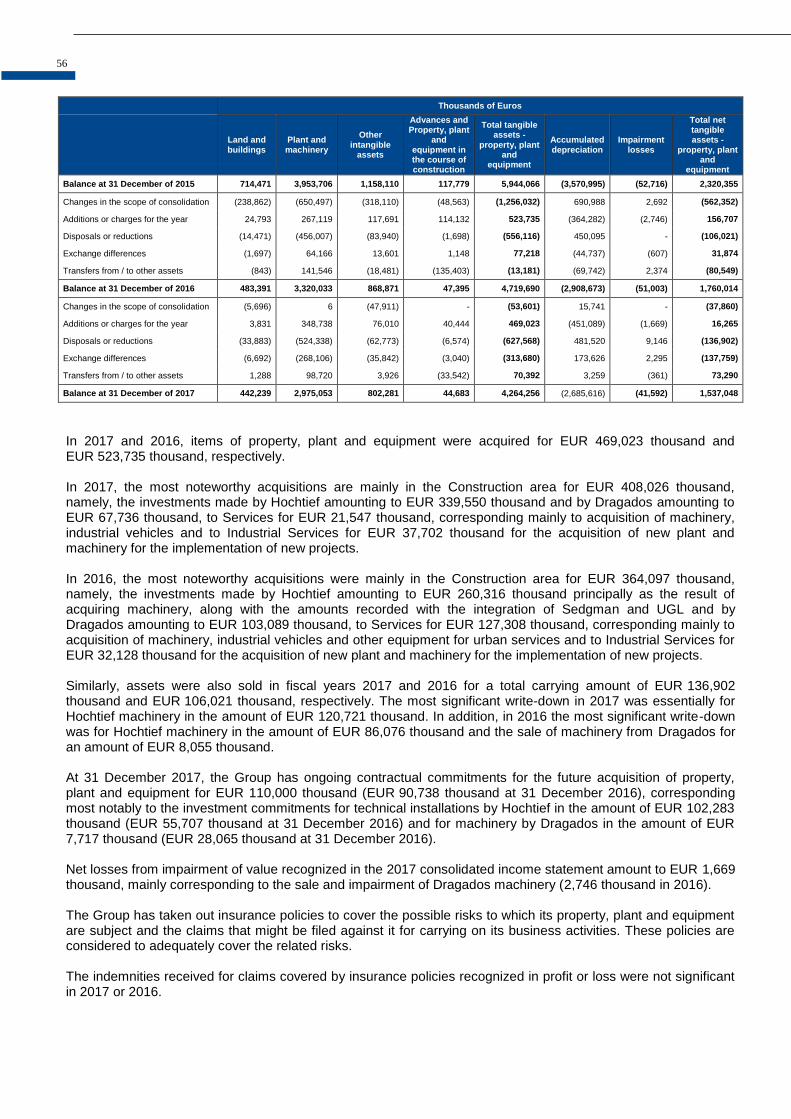
56
Thousands of Euros
Land and buildings
Plant and machinery
Other intangible
assets
Advances and Property, plant
and equipment in the course of construction
Total tangible assets -
property, plant and
equipment
Accumulated depreciation
Impairment losses
Total net tangible assets -
property, plant and
equipment
Balance at 31 December of 2015 714,471 3,953,706 1,158,110 117,779 5,944,066 (3,570,995) (52,716) 2,320,355
Changes in the scope of consolidation (238,862) (650,497) (318,110) (48,563) (1,256,032) 690,988 2,692 (562,352)
Additions or charges for the year 24,793 267,119 117,691 114,132 523,735 (364,282) (2,746) 156,707
Disposals or reductions (14,471) (456,007) (83,940) (1,698) (556,116) 450,095 - (106,021)
Exchange differences (1,697) 64,166 13,601 1,148 77,218 (44,737) (607) 31,874
Transfers from / to other assets (843) 141,546 (18,481) (135,403) (13,181) (69,742) 2,374 (80,549)
Balance at 31 December of 2016 483,391 3,320,033 868,871 47,395 4,719,690 (2,908,673) (51,003) 1,760,014
Changes in the scope of consolidation (5,696) 6 (47,911) - (53,601) 15,741 - (37,860)
Additions or charges for the year 3,831 348,738 76,010 40,444 469,023 (451,089) (1,669) 16,265
Disposals or reductions (33,883) (524,338) (62,773) (6,574) (627,568) 481,520 9,146 (136,902)
Exchange differences (6,692) (268,106) (35,842) (3,040) (313,680) 173,626 2,295 (137,759)
Transfers from / to other assets 1,288 98,720 3,926 (33,542) 70,392 3,259 (361) 73,290
Balance at 31 December of 2017 442,239 2,975,053 802,281 44,683 4,264,256 (2,685,616) (41,592) 1,537,048
In 2017 and 2016, items of property, plant and equipment were acquired for EUR 469,023 thousand and EUR 523,735 thousand, respectively. In 2017, the most noteworthy acquisitions are mainly in the Construction area for EUR 408,026 thousand, namely, the investments made by Hochtief amounting to EUR 339,550 thousand and by Dragados amounting to EUR 67,736 thousand, to Services for EUR 21,547 thousand, corresponding mainly to acquisition of machinery, industrial vehicles and to Industrial Services for EUR 37,702 thousand for the acquisition of new plant and machinery for the implementation of new projects. In 2016, the most noteworthy acquisitions were mainly in the Construction area for EUR 364,097 thousand, namely, the investments made by Hochtief amounting to EUR 260,316 thousand principally as the result of acquiring machinery, along with the amounts recorded with the integration of Sedgman and UGL and by Dragados amounting to EUR 103,089 thousand, to Services for EUR 127,308 thousand, corresponding mainly to acquisition of machinery, industrial vehicles and other equipment for urban services and to Industrial Services for EUR 32,128 thousand for the acquisition of new plant and machinery for the implementation of new projects. Similarly, assets were also sold in fiscal years 2017 and 2016 for a total carrying amount of EUR 136,902 thousand and EUR 106,021 thousand, respectively. The most significant write-down in 2017 was essentially for Hochtief machinery in the amount of EUR 120,721 thousand. In addition, in 2016 the most significant write-down was for Hochtief machinery in the amount of EUR 86,076 thousand and the sale of machinery from Dragados for an amount of EUR 8,055 thousand. At 31 December 2017, the Group has ongoing contractual commitments for the future acquisition of property, plant and equipment for EUR 110,000 thousand (EUR 90,738 thousand at 31 December 2016), corresponding most notably to the investment commitments for technical installations by Hochtief in the amount of EUR 102,283 thousand (EUR 55,707 thousand at 31 December 2016) and for machinery by Dragados in the amount of EUR 7,717 thousand (EUR 28,065 thousand at 31 December 2016). Net losses from impairment of value recognized in the 2017 consolidated income statement amount to EUR 1,669 thousand, mainly corresponding to the sale and impairment of Dragados machinery (2,746 thousand in 2016). The Group has taken out insurance policies to cover the possible risks to which its property, plant and equipment are subject and the claims that might be filed against it for carrying on its business activities. These policies are considered to adequately cover the related risks. The indemnities received for claims covered by insurance policies recognized in profit or loss were not significant in 2017 or 2016.
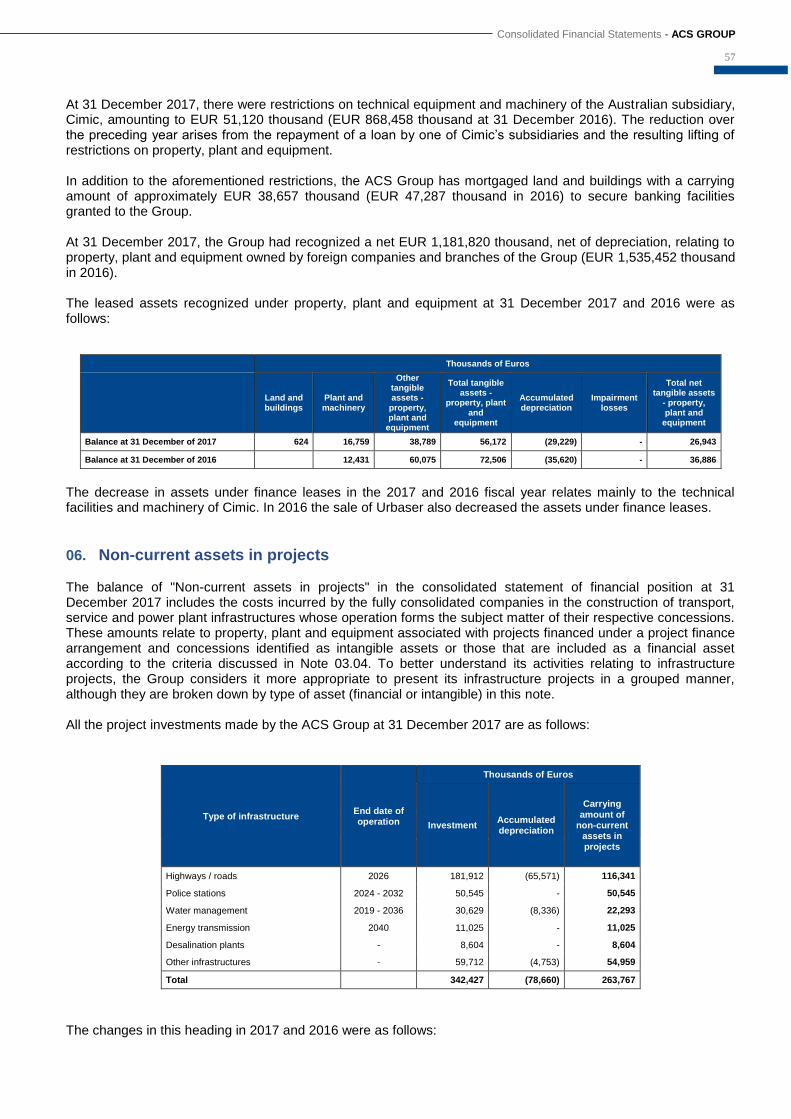
Consolidated Financial Statements - ACS GROUP
57
At 31 December 2017, there were restrictions on technical equipment and machinery of the Australian subsidiary, Cimic, amounting to EUR 51,120 thousand (EUR 868,458 thousand at 31 December 2016). The reduction over the preceding year arises from the repayment of a loan by one of Cimic’s subsidiaries and the resulting lifting of restrictions on property, plant and equipment. In addition to the aforementioned restrictions, the ACS Group has mortgaged land and buildings with a carrying amount of approximately EUR 38,657 thousand (EUR 47,287 thousand in 2016) to secure banking facilities granted to the Group. At 31 December 2017, the Group had recognized a net EUR 1,181,820 thousand, net of depreciation, relating to property, plant and equipment owned by foreign companies and branches of the Group (EUR 1,535,452 thousand in 2016). The leased assets recognized under property, plant and equipment at 31 December 2017 and 2016 were as follows:
Thousands of Euros
Land and buildings
Plant and machinery
Other tangible assets -
property, plant and
equipment
Total tangible assets -
property, plant and
equipment
Accumulated depreciation
Impairment losses
Total net tangible assets
- property, plant and
equipment
Balance at 31 December of 2017 624 16,759 38,789 56,172 (29,229) - 26,943
Balance at 31 December of 2016 12,431 60,075 72,506 (35,620) - 36,886
The decrease in assets under finance leases in the 2017 and 2016 fiscal year relates mainly to the technical facilities and machinery of Cimic. In 2016 the sale of Urbaser also decreased the assets under finance leases.
06. Non-current assets in projects The balance of "Non-current assets in projects" in the consolidated statement of financial position at 31 December 2017 includes the costs incurred by the fully consolidated companies in the construction of transport, service and power plant infrastructures whose operation forms the subject matter of their respective concessions. These amounts relate to property, plant and equipment associated with projects financed under a project finance arrangement and concessions identified as intangible assets or those that are included as a financial asset according to the criteria discussed in Note 03.04. To better understand its activities relating to infrastructure projects, the Group considers it more appropriate to present its infrastructure projects in a grouped manner, although they are broken down by type of asset (financial or intangible) in this note. All the project investments made by the ACS Group at 31 December 2017 are as follows:
Type of infrastructure End date of operation
Thousands of Euros
Investment Accumulated depreciation
Carrying amount of
non-current assets in projects
Highways / roads 2026 181,912 (65,571) 116,341
Police stations 2024 - 2032 50,545 - 50,545
Water management 2019 - 2036 30,629 (8,336) 22,293
Energy transmission 2040 11,025 - 11,025
Desalination plants - 8,604 - 8,604
Other infrastructures - 59,712 (4,753) 54,959
Total 342,427 (78,660) 263,767
The changes in this heading in 2017 and 2016 were as follows:

58
Thousands of Euros
2017 2016
Investment Accumulated depreciation
Net carrying amount
Investment Accumulated depreciation
Net carrying amount
Beginning balance 330,349 (67,153) 263,196 917,552 (214,978) 702,574
Changes in the scope of consolidation 44 1,760 1,804 (616,585) 151,658 (464,927)
Additions or charges for the year 43,022 (20,909) 22,113 22,929 (23,818) (889)
Exchange differences (6,574) 257 (6,317) 5,218 19,741 24,959
Disposals or reductions 11,952) 7,575 (4,377) (1,405) - (1,405)
Transfers (12,462) (190) (12,652) 2,640 244 2,884
Ending balance 342,427 (78,660) 263,767 330,349 (67,153) 263,196
The variations in perimeter for 2016 related mainly to Urbaser as a consequence of its consideration as a discontinued operation and subsequent sale in December 2016.
The breakdown of this heading by type, in accordance with IFRIC 12, is as follows:
- The concession assets identified as intangible assets, as a result of the Group assuming the demand risk, and the changes in the balance of this heading in fiscal years 2017 and 2016, are as follows:
Type of infrastructure End date of operation
Thousands of Euros
Investment Accumulated depreciation
Carrying amount of
non-current assets in projects
Highways / roads 2026 181,883 (65,542) 116,341
Water management 2020 - 2033 16,846 (7,698) 9,148
Other infrastructures - 7,687 (1,396) 6,291
Total 206,416 (74,636) 131,780
Thousands of Euros
2017 2016
Investment Accumulated depreciation
Net carrying amount
Investment Accumulated depreciation
Net carrying amount
Beginning balance 209,825 (63,807) 146,018 545,840 (157,900) 387,940
Changes in the scope of consolidation (1,760) 1,760 - (348,900) 106,682 (242,218)
Additions or charges for the year 1,668 (12,846) (11,178) 2,930 (12,965) (10,035)
Exchange differences (256) 257 1 (375) 376 1
Disposals or reductions (1,365) - (1,365) (9) - (9)
Transfers (1,696) - (1,696) 10,339 - 10,339
Ending balance 206,416 (74,636) 131,780 209,825 (63,807) 146,018
- The concession assets identified as financial assets, as a result of the Group not assuming the demand risk, and the changes in the balance of this heading in fiscal years 2017 and 2016, are as follows:

Consolidated Financial Statements - ACS GROUP
59
Type of infrastructure End date of operation
Thousands of Euros
Collection rights arising from concession
arrangements
Police stations 2024 - 2032 50,545
Energy transmission 2040 11,025
Water management 2032 - 2033 2,774
Other infrastructures - 33,751
Total 98,095
Thousands of Euros
2017 2016
Beginning balance 97,105 231,252
Changes in the scope of consolidation - (138,977)
Investment 24,177 16,474
Finance income 6,004 5,591
Collections (13,661) (13,411)
Disposals or reductions - (1,036)
Exchange differences (4,105) 4,936
Transfers from/to other assets (11,425) (7,724)
Ending balance 98,095 97,105
In accordance with the measurement bases of IFRIC 12 and Note 03.04, the amount of financial remuneration included under "Revenue" amounted to EUR 6,004 thousand in 2017 (EUR 5,591 thousand in 2016), with no amount in 2017 or 2016 corresponding to concession assets identified as financial assets classified as "Non-current assets held for sale and discontinued operations". The borrowing costs accrued in relation to the financing of the concessions classified under the financial asset model are immaterial in 2017 and 2016.
- The detail of the financial assets financed through a project finance arrangement that do not meet the requirements for recognition in accordance with IFRIC 12, and the changes in the balance of this heading in 2017 and 2016, are as follows:
Type of infrastructure End date of operation
Thousands of Euros
Investment Accumulated depreciation
Carrying amount of non-current assets
in projects
Water management 2019 - 2036 11,009 (638) 10,371
Desalination plants - 8,604 - 8,604
Other infrastructures - 18,302 (3,386) 14,916
Total 37,915 (4,024) 33,891
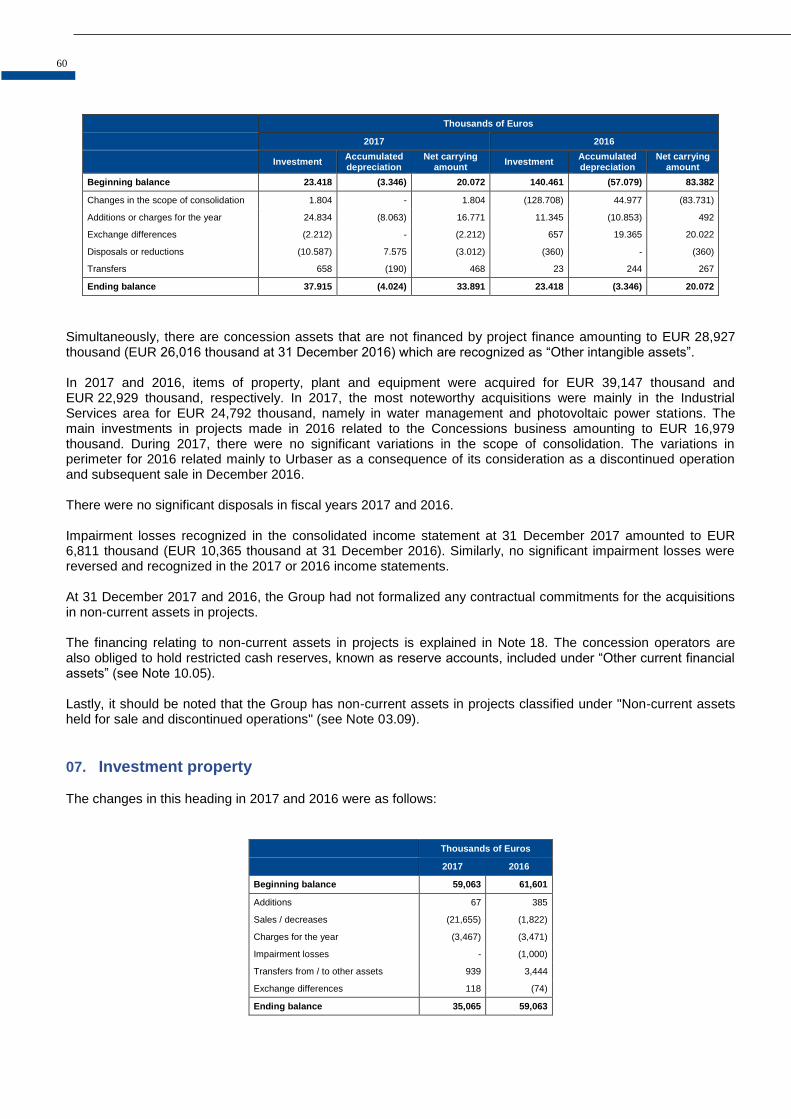
60
Thousands of Euros
2017 2016
Investment Accumulated depreciation
Net carrying amount
Investment Accumulated depreciation
Net carrying amount
Beginning balance 23.418 (3.346) 20.072 140.461 (57.079) 83.382
Changes in the scope of consolidation 1.804 - 1.804 (128.708) 44.977 (83.731)
Additions or charges for the year 24.834 (8.063) 16.771 11.345 (10.853) 492
Exchange differences (2.212) - (2.212) 657 19.365 20.022
Disposals or reductions (10.587) 7.575 (3.012) (360) - (360)
Transfers 658 (190) 468 23 244 267
Ending balance 37.915 (4.024) 33.891 23.418 (3.346) 20.072
Simultaneously, there are concession assets that are not financed by project finance amounting to EUR 28,927 thousand (EUR 26,016 thousand at 31 December 2016) which are recognized as “Other intangible assets”. In 2017 and 2016, items of property, plant and equipment were acquired for EUR 39,147 thousand and EUR 22,929 thousand, respectively. In 2017, the most noteworthy acquisitions were mainly in the Industrial Services area for EUR 24,792 thousand, namely in water management and photovoltaic power stations. The main investments in projects made in 2016 related to the Concessions business amounting to EUR 16,979 thousand. During 2017, there were no significant variations in the scope of consolidation. The variations in perimeter for 2016 related mainly to Urbaser as a consequence of its consideration as a discontinued operation and subsequent sale in December 2016. There were no significant disposals in fiscal years 2017 and 2016. Impairment losses recognized in the consolidated income statement at 31 December 2017 amounted to EUR 6,811 thousand (EUR 10,365 thousand at 31 December 2016). Similarly, no significant impairment losses were reversed and recognized in the 2017 or 2016 income statements. At 31 December 2017 and 2016, the Group had not formalized any contractual commitments for the acquisitions in non-current assets in projects. The financing relating to non-current assets in projects is explained in Note 18. The concession operators are also obliged to hold restricted cash reserves, known as reserve accounts, included under “Other current financial assets” (see Note 10.05). Lastly, it should be noted that the Group has non-current assets in projects classified under "Non-current assets held for sale and discontinued operations" (see Note 03.09).
07. Investment property The changes in this heading in 2017 and 2016 were as follows:
Thousands of Euros
2017 2016
Beginning balance 59,063 61,601
Additions 67 385
Sales / decreases (21,655) (1,822)
Charges for the year (3,467) (3,471)
Impairment losses - (1,000)
Transfers from / to other assets 939 3,444
Exchange differences 118 (74)
Ending balance 35,065 59,063
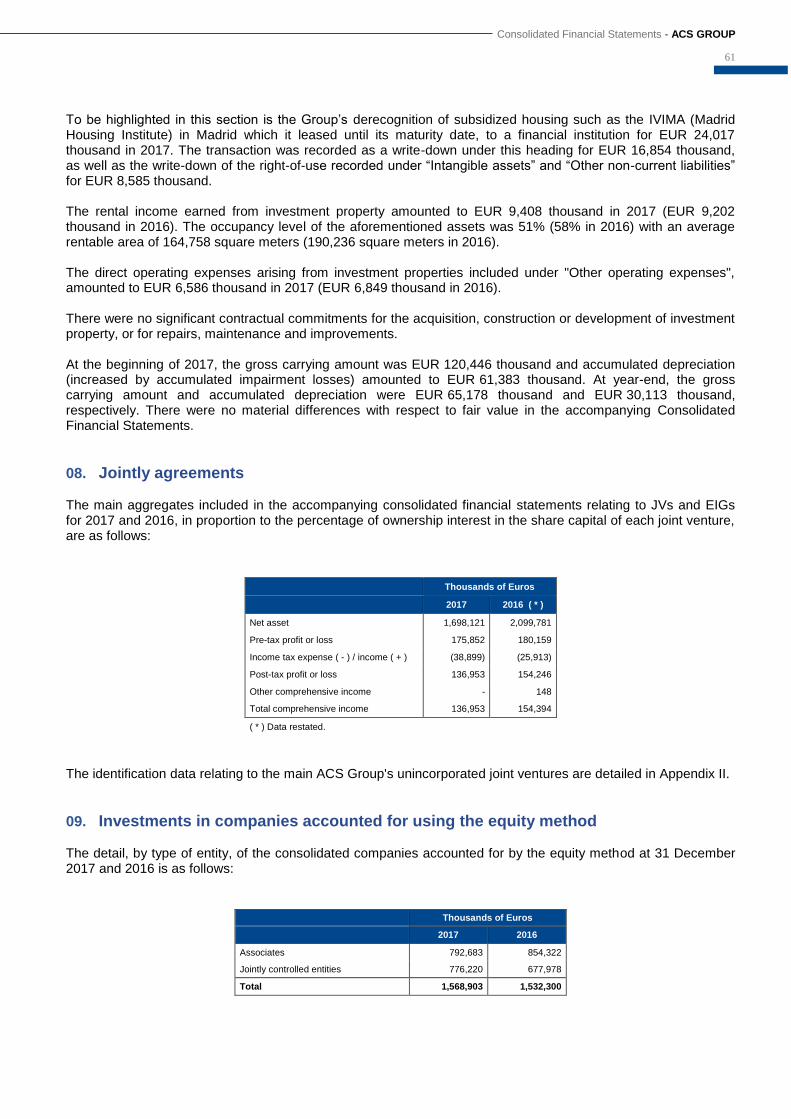
Consolidated Financial Statements - ACS GROUP
61
To be highlighted in this section is the Group’s derecognition of subsidized housing such as the IVIMA (Madrid Housing Institute) in Madrid which it leased until its maturity date, to a financial institution for EUR 24,017 thousand in 2017. The transaction was recorded as a write-down under this heading for EUR 16,854 thousand, as well as the write-down of the right-of-use recorded under “Intangible assets” and “Other non-current liabilities” for EUR 8,585 thousand. The rental income earned from investment property amounted to EUR 9,408 thousand in 2017 (EUR 9,202 thousand in 2016). The occupancy level of the aforementioned assets was 51% (58% in 2016) with an average rentable area of 164,758 square meters (190,236 square meters in 2016). The direct operating expenses arising from investment properties included under "Other operating expenses", amounted to EUR 6,586 thousand in 2017 (EUR 6,849 thousand in 2016). There were no significant contractual commitments for the acquisition, construction or development of investment property, or for repairs, maintenance and improvements. At the beginning of 2017, the gross carrying amount was EUR 120,446 thousand and accumulated depreciation (increased by accumulated impairment losses) amounted to EUR 61,383 thousand. At year-end, the gross carrying amount and accumulated depreciation were EUR 65,178 thousand and EUR 30,113 thousand, respectively. There were no material differences with respect to fair value in the accompanying Consolidated Financial Statements.
08. Jointly agreements The main aggregates included in the accompanying consolidated financial statements relating to JVs and EIGs for 2017 and 2016, in proportion to the percentage of ownership interest in the share capital of each joint venture, are as follows:
Thousands of Euros
2017 2016 ( * )
Net asset 1,698,121 2,099,781
Pre-tax profit or loss 175,852 180,159
Income tax expense ( - ) / income ( + ) (38,899) (25,913)
Post-tax profit or loss 136,953 154,246
Other comprehensive income - 148
Total comprehensive income 136,953 154,394
( * ) Data restated.
The identification data relating to the main ACS Group's unincorporated joint ventures are detailed in Appendix II.
09. Investments in companies accounted for using the equity method The detail, by type of entity, of the consolidated companies accounted for by the equity method at 31 December 2017 and 2016 is as follows:
Thousands of Euros
2017 2016
Associates 792,683 854,322
Jointly controlled entities 776,220 677,978
Total 1,568,903 1,532,300

62
The changes in this heading in 2017 and 2016 were as follows:
Thousands of Euros
2017 2016
Beginning balance 1,532,300 1,906,898
Additions 267,158 184,242
Disposals (110,163) (287,050)
Change in consolidation method 24,172 (88,349)
Profit for the year 137,511 75,128
Changes in the equity of associates
Exchange differences / other (104,386) 81,237
Cash flow hedges 48,230 55,794
Financial assets held for sale - (14,288)
Distribution of dividends (254,747) (431,274)
Others 28,828 49,962
Ending balance 1,568,903 1,532,300
The detail, by line of business, of the investments in companies accounted for by the equity method at 31 December 2017 and 2016 is as follows:
Line of Business
Thousands of Euros
31/12/2017 31/12/2016
Share of net assets
Profit/Loss for the year
Total carrying amount
Share of net assets
Profit/Loss for the year
Total carrying amount
Construction 759,005 133,449 892,454 746,293 88,866 835,159
Industrial Services 672,542 4,052 676,594 719,494 (13,695) 705,799
Services - - - 43 (43) -
Corporate unit and adjustments (155) 10 (145) (8,658) - (8,658)
Total 1,431,392 137,511 1,568,903 1,457,172 75,128 1,532,300
- Construction
The investments from the Hochtief Group accounted for using the equity method for EUR 593,151 thousand (EUR 721,819 thousand at 31 December 2016) are the most notable in the Construction business at 31 December 2017 and 2016, among which the most significant is the stake in HLG Contracting for EUR 160,089 thousand (EUR 251,080 thousand at 31 December 2016). The recoverable amount of this investment by the Group has been calculated using the value in use method. The inter-year variation results, on one hand, from divestment mainly through the sale by Iridium of 80% of its indirect stake in Concesionaria Hospital Universitari Son Espases, S.A. (Iridium holding 49.5% of the company share capital), Gran Hospital Can Misses, S.A. (Iridium holding 40% of the company share capital) and Operadora Can Missus, S.L. (Iridium holding 40% of the company share capital). The economic conditions of the operation have been a company value (100%) of the three assets of EUR 418 million, with a price in the amount of EUR 43.3 million, which generated a gain (net of transaction costs) of approximately EUR 7 million (see Note 29). Also worthy of note is the sale of its ownership interest in the concession operator Rutas del Canal, S.A., with a company value of 100% of EUR 142 million (see Note 02.01.f).
- Industrial Services
In this section, the most notable shareholdings are in Saeta Yield, S.A. and Pow Power, S.L., which at 31 December 2017 have a book value of EUR 341,474 thousand (EUR 287,553 thousand at 31st December 2016). With regard to the potential impairment of the shareholding in Saeta Yield, S.A., it should be noted that the ACS Group has a 24.21% ownership interest in Saeta Yield, S.A. At 31 December 2017, the book value of the
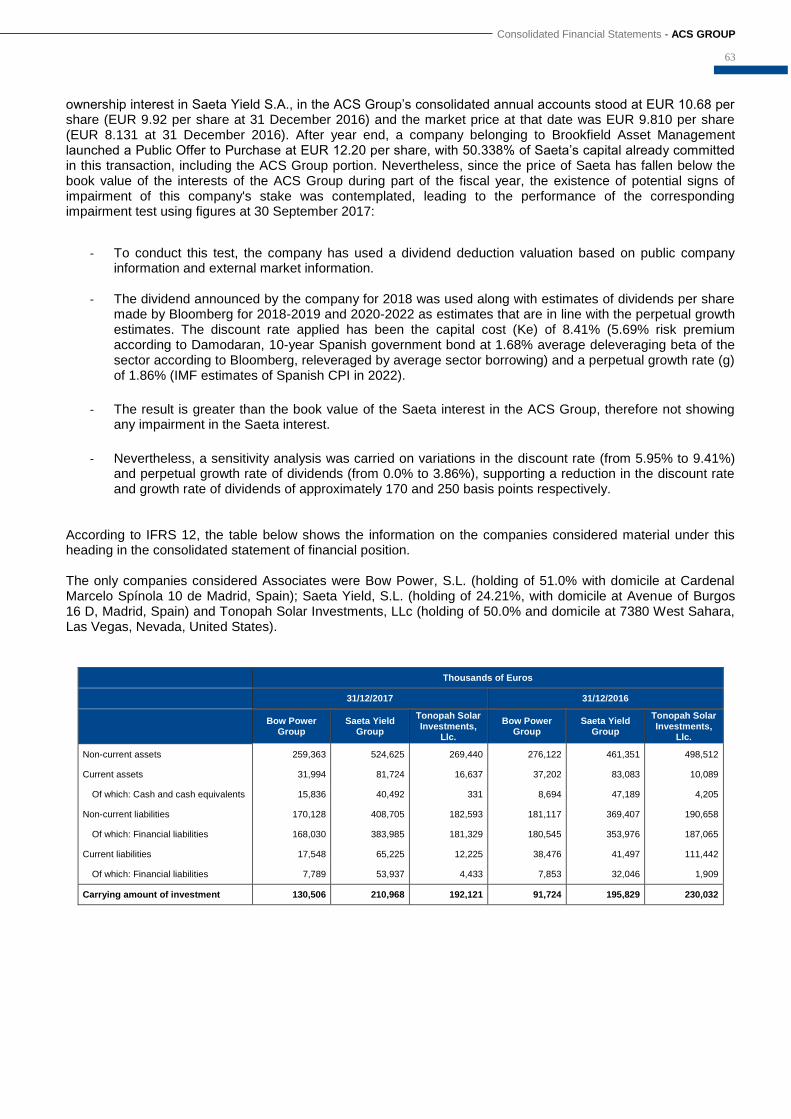
Consolidated Financial Statements - ACS GROUP
63
ownership interest in Saeta Yield S.A., in the ACS Group’s consolidated annual accounts stood at EUR 10.68 per share (EUR 9.92 per share at 31 December 2016) and the market price at that date was EUR 9.810 per share (EUR 8.131 at 31 December 2016). After year end, a company belonging to Brookfield Asset Management launched a Public Offer to Purchase at EUR 12.20 per share, with 50.338% of Saeta’s capital already committed in this transaction, including the ACS Group portion. Nevertheless, since the price of Saeta has fallen below the book value of the interests of the ACS Group during part of the fiscal year, the existence of potential signs of impairment of this company's stake was contemplated, leading to the performance of the corresponding impairment test using figures at 30 September 2017:
- To conduct this test, the company has used a dividend deduction valuation based on public company information and external market information.
- The dividend announced by the company for 2018 was used along with estimates of dividends per share made by Bloomberg for 2018-2019 and 2020-2022 as estimates that are in line with the perpetual growth estimates. The discount rate applied has been the capital cost (Ke) of 8.41% (5.69% risk premium according to Damodaran, 10-year Spanish government bond at 1.68% average deleveraging beta of the sector according to Bloomberg, releveraged by average sector borrowing) and a perpetual growth rate (g) of 1.86% (IMF estimates of Spanish CPI in 2022).
- The result is greater than the book value of the Saeta interest in the ACS Group, therefore not showing
any impairment in the Saeta interest.
- Nevertheless, a sensitivity analysis was carried on variations in the discount rate (from 5.95% to 9.41%)
and perpetual growth rate of dividends (from 0.0% to 3.86%), supporting a reduction in the discount rate and growth rate of dividends of approximately 170 and 250 basis points respectively.
According to IFRS 12, the table below shows the information on the companies considered material under this heading in the consolidated statement of financial position. The only companies considered Associates were Bow Power, S.L. (holding of 51.0% with domicile at Cardenal Marcelo Spínola 10 de Madrid, Spain); Saeta Yield, S.L. (holding of 24.21%, with domicile at Avenue of Burgos 16 D, Madrid, Spain) and Tonopah Solar Investments, LLc (holding of 50.0% and domicile at 7380 West Sahara, Las Vegas, Nevada, United States).
Thousands of Euros
31/12/2017 31/12/2016
Bow Power
Group Saeta Yield
Group
Tonopah Solar Investments,
Llc.
Bow Power Group
Saeta Yield Group
Tonopah Solar Investments,
Llc.
Non-current assets 259,363 524,625 269,440 276,122 461,351 498,512
Current assets 31,994 81,724 16,637 37,202 83,083 10,089
Of which: Cash and cash equivalents 15,836 40,492 331 8,694 47,189 4,205
Non-current liabilities 170,128 408,705 182,593 181,117 369,407 190,658
Of which: Financial liabilities 168,030 383,985 181,329 180,545 353,976 187,065
Current liabilities 17,548 65,225 12,225 38,476 41,497 111,442
Of which: Financial liabilities 7,789 53,937 4,433 7,853 32,046 1,909
Carrying amount of investment 130,506 210,968 192,121 91,724 195,829 230,032
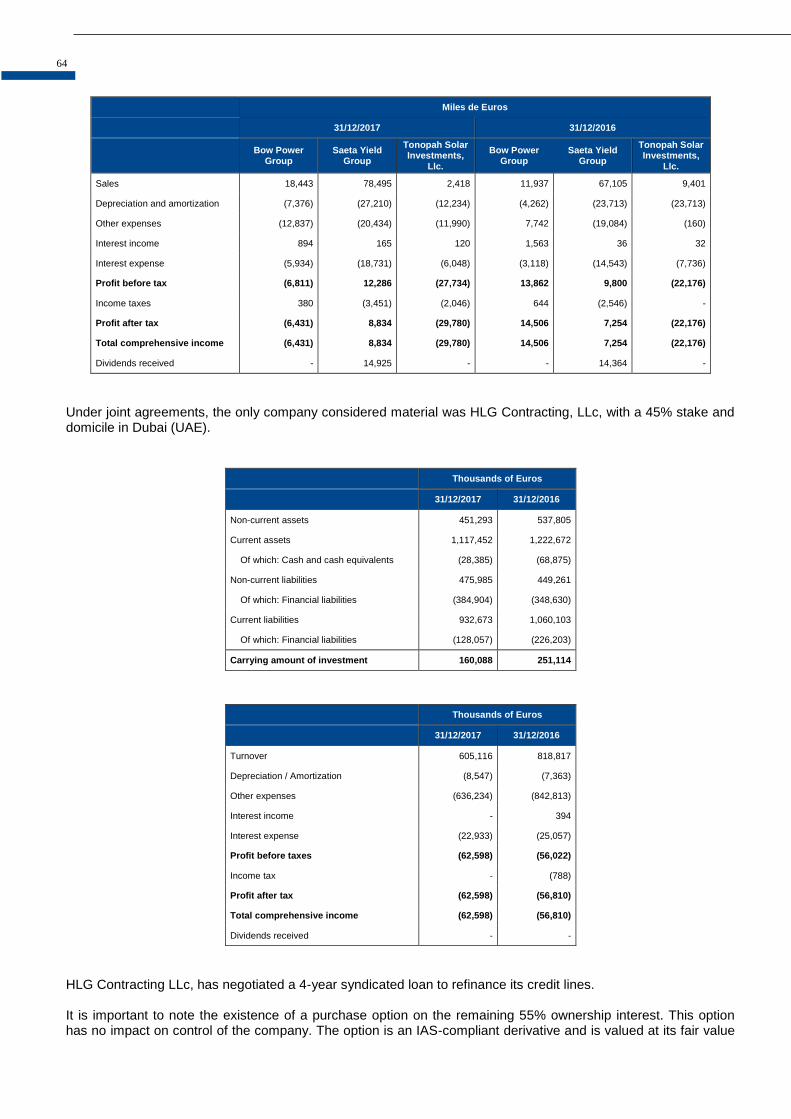
64
Miles de Euros
31/12/2017 31/12/2016
Bow Power
Group Saeta Yield
Group
Tonopah Solar Investments,
Llc.
Bow Power Group
Saeta Yield Group
Tonopah Solar Investments,
Llc.
Sales 18,443 78,495 2,418 11,937 67,105 9,401
Depreciation and amortization (7,376) (27,210) (12,234) (4,262) (23,713) (23,713)
Other expenses (12,837) (20,434) (11,990) 7,742 (19,084) (160)
Interest income 894 165 120 1,563 36 32
Interest expense (5,934) (18,731) (6,048) (3,118) (14,543) (7,736)
Profit before tax (6,811) 12,286 (27,734) 13,862 9,800 (22,176)
Income taxes 380 (3,451) (2,046) 644 (2,546) -
Profit after tax (6,431) 8,834 (29,780) 14,506 7,254 (22,176)
Total comprehensive income (6,431) 8,834 (29,780) 14,506 7,254 (22,176)
Dividends received - 14,925 - - 14,364 -
Under joint agreements, the only company considered material was HLG Contracting, LLc, with a 45% stake and domicile in Dubai (UAE).
Thousands of Euros
31/12/2017 31/12/2016
Non-current assets 451,293 537,805
Current assets 1,117,452 1,222,672
Of which: Cash and cash equivalents (28,385) (68,875)
Non-current liabilities 475,985 449,261
Of which: Financial liabilities (384,904) (348,630)
Current liabilities 932,673 1,060,103
Of which: Financial liabilities (128,057) (226,203)
Carrying amount of investment 160,088 251,114
Thousands of Euros
31/12/2017 31/12/2016
Turnover 605,116 818,817
Depreciation / Amortization (8,547) (7,363)
Other expenses (636,234) (842,813)
Interest income - 394
Interest expense (22,933) (25,057)
Profit before taxes (62,598) (56,022)
Income tax - (788)
Profit after tax (62,598) (56,810)
Total comprehensive income (62,598) (56,810)
Dividends received - -
HLG Contracting LLc, has negotiated a 4-year syndicated loan to refinance its credit lines. It is important to note the existence of a purchase option on the remaining 55% ownership interest. This option has no impact on control of the company. The option is an IAS-compliant derivative and is valued at its fair value
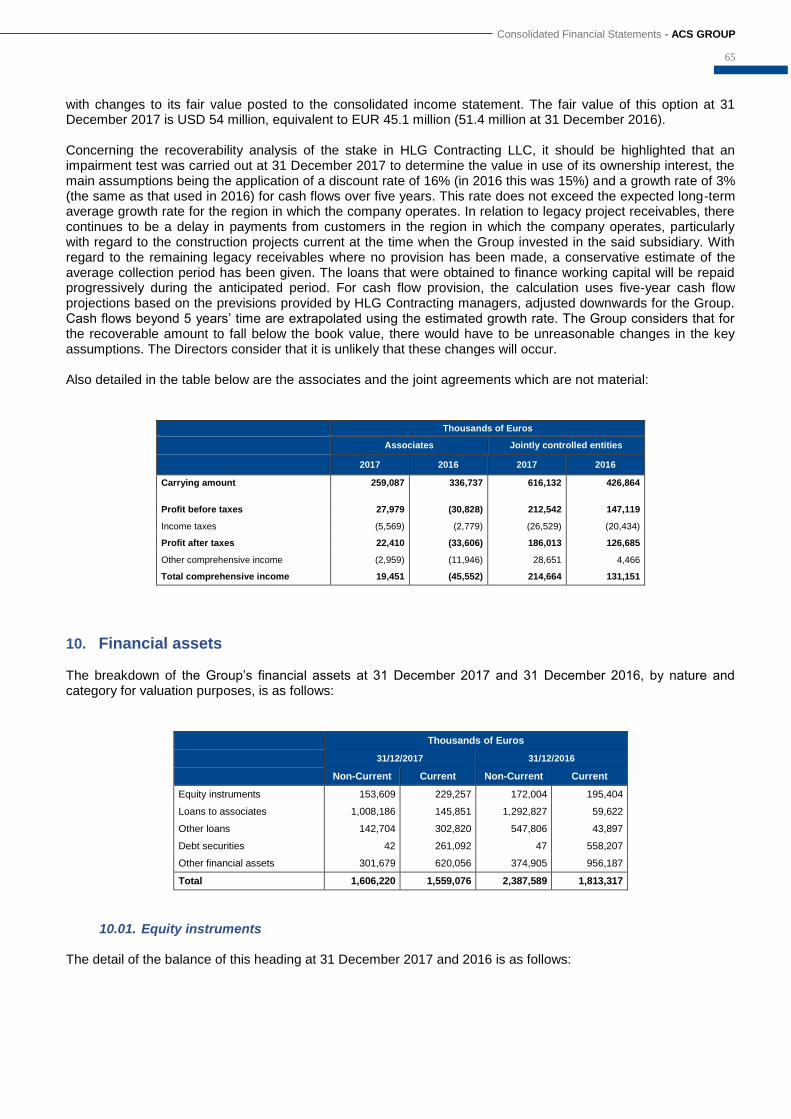
Consolidated Financial Statements - ACS GROUP
65
with changes to its fair value posted to the consolidated income statement. The fair value of this option at 31 December 2017 is USD 54 million, equivalent to EUR 45.1 million (51.4 million at 31 December 2016). Concerning the recoverability analysis of the stake in HLG Contracting LLC, it should be highlighted that an impairment test was carried out at 31 December 2017 to determine the value in use of its ownership interest, the main assumptions being the application of a discount rate of 16% (in 2016 this was 15%) and a growth rate of 3% (the same as that used in 2016) for cash flows over five years. This rate does not exceed the expected long-term average growth rate for the region in which the company operates. In relation to legacy project receivables, there continues to be a delay in payments from customers in the region in which the company operates, particularly with regard to the construction projects current at the time when the Group invested in the said subsidiary. With regard to the remaining legacy receivables where no provision has been made, a conservative estimate of the average collection period has been given. The loans that were obtained to finance working capital will be repaid progressively during the anticipated period. For cash flow provision, the calculation uses five-year cash flow projections based on the previsions provided by HLG Contracting managers, adjusted downwards for the Group. Cash flows beyond 5 years’ time are extrapolated using the estimated growth rate. The Group considers that for the recoverable amount to fall below the book value, there would have to be unreasonable changes in the key assumptions. The Directors consider that it is unlikely that these changes will occur. Also detailed in the table below are the associates and the joint agreements which are not material:
Thousands of Euros
Associates Jointly controlled entities
2017 2016 2017 2016
Carrying amount 259,087 336,737 616,132 426,864
Profit before taxes 27,979 (30,828) 212,542 147,119
Income taxes (5,569) (2,779) (26,529) (20,434)
Profit after taxes 22,410 (33,606) 186,013 126,685
Other comprehensive income (2,959) (11,946) 28,651 4,466
Total comprehensive income 19,451 (45,552) 214,664 131,151
10. Financial assets The breakdown of the Group’s financial assets at 31 December 2017 and 31 December 2016, by nature and category for valuation purposes, is as follows:
Thousands of Euros
31/12/2017 31/12/2016
Non-Current Current Non-Current Current
Equity instruments 153,609 229,257 172,004 195,404
Loans to associates 1,008,186 145,851 1,292,827 59,622
Other loans 142,704 302,820 547,806 43,897
Debt securities 42 261,092 47 558,207
Other financial assets 301,679 620,056 374,905 956,187
Total 1,606,220 1,559,076 2,387,589 1,813,317
10.01. Equity instruments The detail of the balance of this heading at 31 December 2017 and 2016 is as follows:
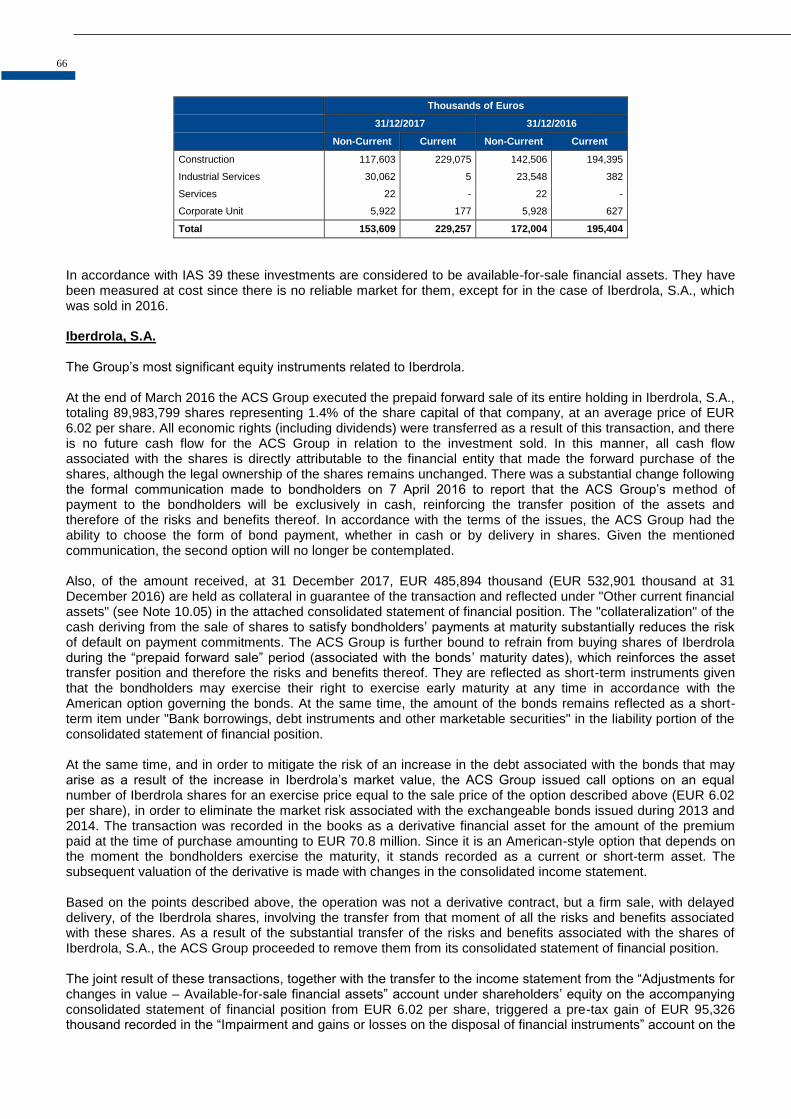
66
Thousands of Euros
31/12/2017 31/12/2016
Non-Current Current Non-Current Current
Construction 117,603 229,075 142,506 194,395
Industrial Services 30,062 5 23,548 382
Services 22 - 22 -
Corporate Unit 5,922 177 5,928 627
Total 153,609 229,257 172,004 195,404
In accordance with IAS 39 these investments are considered to be available-for-sale financial assets. They have been measured at cost since there is no reliable market for them, except for in the case of Iberdrola, S.A., which was sold in 2016. Iberdrola, S.A. The Group’s most significant equity instruments related to Iberdrola. At the end of March 2016 the ACS Group executed the prepaid forward sale of its entire holding in Iberdrola, S.A., totaling 89,983,799 shares representing 1.4% of the share capital of that company, at an average price of EUR 6.02 per share. All economic rights (including dividends) were transferred as a result of this transaction, and there is no future cash flow for the ACS Group in relation to the investment sold. In this manner, all cash flow associated with the shares is directly attributable to the financial entity that made the forward purchase of the shares, although the legal ownership of the shares remains unchanged. There was a substantial change following the formal communication made to bondholders on 7 April 2016 to report that the ACS Group’s method of payment to the bondholders will be exclusively in cash, reinforcing the transfer position of the assets and therefore of the risks and benefits thereof. In accordance with the terms of the issues, the ACS Group had the ability to choose the form of bond payment, whether in cash or by delivery in shares. Given the mentioned communication, the second option will no longer be contemplated. Also, of the amount received, at 31 December 2017, EUR 485,894 thousand (EUR 532,901 thousand at 31 December 2016) are held as collateral in guarantee of the transaction and reflected under "Other current financial assets" (see Note 10.05) in the attached consolidated statement of financial position. The "collateralization" of the cash deriving from the sale of shares to satisfy bondholders’ payments at maturity substantially reduces the risk of default on payment commitments. The ACS Group is further bound to refrain from buying shares of Iberdrola during the “prepaid forward sale” period (associated with the bonds’ maturity dates), which reinforces the asset transfer position and therefore the risks and benefits thereof. They are reflected as short-term instruments given that the bondholders may exercise their right to exercise early maturity at any time in accordance with the American option governing the bonds. At the same time, the amount of the bonds remains reflected as a short-term item under "Bank borrowings, debt instruments and other marketable securities" in the liability portion of the consolidated statement of financial position. At the same time, and in order to mitigate the risk of an increase in the debt associated with the bonds that may arise as a result of the increase in Iberdrola’s market value, the ACS Group issued call options on an equal number of Iberdrola shares for an exercise price equal to the sale price of the option described above (EUR 6.02 per share), in order to eliminate the market risk associated with the exchangeable bonds issued during 2013 and 2014. The transaction was recorded in the books as a derivative financial asset for the amount of the premium paid at the time of purchase amounting to EUR 70.8 million. Since it is an American-style option that depends on the moment the bondholders exercise the maturity, it stands recorded as a current or short-term asset. The subsequent valuation of the derivative is made with changes in the consolidated income statement. Based on the points described above, the operation was not a derivative contract, but a firm sale, with delayed delivery, of the Iberdrola shares, involving the transfer from that moment of all the risks and benefits associated with these shares. As a result of the substantial transfer of the risks and benefits associated with the shares of Iberdrola, S.A., the ACS Group proceeded to remove them from its consolidated statement of financial position. The joint result of these transactions, together with the transfer to the income statement from the “Adjustments for changes in value – Available-for-sale financial assets” account under shareholders’ equity on the accompanying consolidated statement of financial position from EUR 6.02 per share, triggered a pre-tax gain of EUR 95,326 thousand recorded in the “Impairment and gains or losses on the disposal of financial instruments” account on the

Consolidated Financial Statements - ACS GROUP
67
attached consolidated income statement for 2016 (see Note 29). The costs of the transaction were reflected in the consolidated income statement at the time of the forward sale of the shares, reducing the amount of capital gains. The shares, which were recognized as current equity instruments in the consolidated statement of financial position, before their forward sale, are pledged as collateral for bonds convertible into Iberdrola shares issued through ACS Actividades Finance B.V. and ACS Actividades Finance 2 B.V. (see Note 17.01), finally maturing at 31 December 2017 for EUR 250,200 thousand in October 2018 and EUR 235,300 thousand in March 2019, respectively, and the bondholders have the option of early payment under certain conditions. These bonds are reflected as current liabilities under "Bank borrowings, debt instruments and other marketable securities" in the accompanying consolidated statement of financial position. Further, as part of the above-mentioned transaction, the Group has notified bondholders that payment of the bonds to which these shares are linked will take place in cash. During 2017 bondholders of bonds maturing in October 2018 in the amount of EUR 47,400 thousand have requested their conversion, which has been actioned upon payment of the collateral and exercising of the contract derivative, without any significant effect on the consolidated income statement. Consequently, EUR 250,200 thousand with final maturity in October 2018 and EUR 235,300 thousand with final maturity in March 2019, were outstanding at 31 December 2017. After fiscal year end, EUR 39,400 thousand in bonds issued by ACS Actividades Finance B.V. were retired, reducing the corresponding collateral by EUR 39,462 thousand. The put spread over Ibedrola shares was finalized in 2016 without any significant impact in the ACS Group’s consolidated income statement and freed up the collateral associated with the derivative. Other investments At 31 December 2017, other investments notably refer to non-controlling interests including, among others, the ownership interests held by subsidiaries of Hochtief amounting to a net EUR 73,528 thousand (EUR 71,561 thousand at 31 December 2016), and those of Iridium amounting to a net EUR 39,521 thousand (EUR 68,036 thousand at 31 December 2016), through the sale of Greek motorways in October 2017. The Group has assessed the recoverability of the assets included under this heading, recognizing the related impairment on the basis of the recoverability analysis performed.
10.02. Loans to associates
The detail of the balance of “Loans to associates” and of the scheduled maturities at 31 December 2017, is as follows:
Thousands of Euros
Current Non-current
2018 2019 2020 2021
2022 and subsequent
years
Total non-current
Loans to associates 145,851 143,856 11,747 681,842 170,741 1,008,186
The detail of the balance of “Loans to associates” and of the scheduled maturities at 31 December 2016, is as follows:
Thousands of Euros
Current Non-current
2017 2018 2019 2020 2021 and
subsequent years
Total non-current
Loans to associates 59,622 931,503 482 11,747 349,095 1,292,827
“Loans to associates" relates mainly to the loans amounting to EUR 681,842 thousand (EUR 615,145 thousand at 31 December 2016) granted to HLG Contracting LLC. Regarding the former amount, it should be noted that it relates to one loan for USD 816.1 million with maturity on 30 September 2021 and is interest-bearing. Repayment of this debt is subordinate to the entity repaying the syndicated loan that it has received.
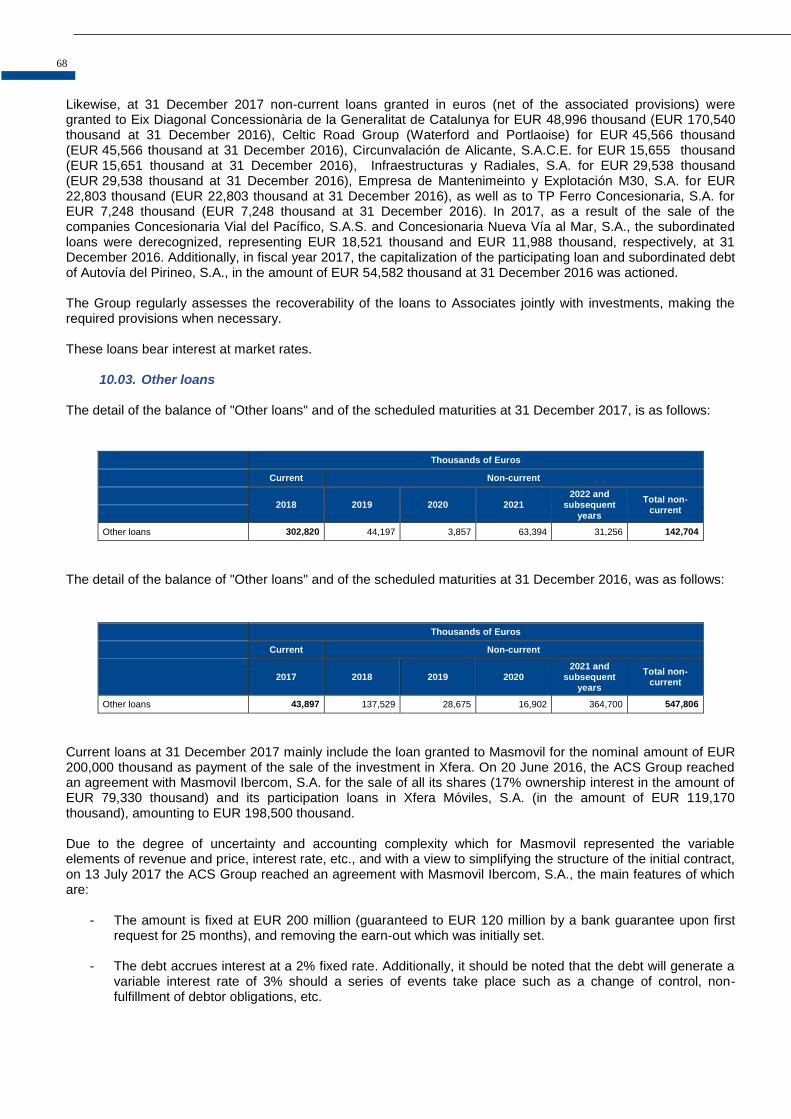
68
Likewise, at 31 December 2017 non-current loans granted in euros (net of the associated provisions) were granted to Eix Diagonal Concessionària de la Generalitat de Catalunya for EUR 48,996 thousand (EUR 170,540 thousand at 31 December 2016), Celtic Road Group (Waterford and Portlaoise) for EUR 45,566 thousand (EUR 45,566 thousand at 31 December 2016), Circunvalación de Alicante, S.A.C.E. for EUR 15,655 thousand (EUR 15,651 thousand at 31 December 2016), Infraestructuras y Radiales, S.A. for EUR 29,538 thousand (EUR 29,538 thousand at 31 December 2016), Empresa de Mantenimeinto y Explotación M30, S.A. for EUR 22,803 thousand (EUR 22,803 thousand at 31 December 2016), as well as to TP Ferro Concesionaria, S.A. for EUR 7,248 thousand (EUR 7,248 thousand at 31 December 2016). In 2017, as a result of the sale of the companies Concesionaria Vial del Pacífico, S.A.S. and Concesionaria Nueva Vía al Mar, S.A., the subordinated loans were derecognized, representing EUR 18,521 thousand and EUR 11,988 thousand, respectively, at 31 December 2016. Additionally, in fiscal year 2017, the capitalization of the participating loan and subordinated debt of Autovía del Pirineo, S.A., in the amount of EUR 54,582 thousand at 31 December 2016 was actioned. The Group regularly assesses the recoverability of the loans to Associates jointly with investments, making the required provisions when necessary. These loans bear interest at market rates.
10.03. Other loans The detail of the balance of "Other loans" and of the scheduled maturities at 31 December 2017, is as follows:
Thousands of Euros
Current Non-current
2018 2019 2020 2021
2022 and subsequent
years
Total non-current
Other loans 302,820 44,197 3,857 63,394 31,256 142,704
The detail of the balance of "Other loans" and of the scheduled maturities at 31 December 2016, was as follows:
Thousands of Euros
Current Non-current
2017 2018 2019 2020 2021 and
subsequent years
Total non-current
Other loans 43,897 137,529 28,675 16,902 364,700 547,806
Current loans at 31 December 2017 mainly include the loan granted to Masmovil for the nominal amount of EUR 200,000 thousand as payment of the sale of the investment in Xfera. On 20 June 2016, the ACS Group reached an agreement with Masmovil Ibercom, S.A. for the sale of all its shares (17% ownership interest in the amount of EUR 79,330 thousand) and its participation loans in Xfera Móviles, S.A. (in the amount of EUR 119,170 thousand), amounting to EUR 198,500 thousand. Due to the degree of uncertainty and accounting complexity which for Masmovil represented the variable elements of revenue and price, interest rate, etc., and with a view to simplifying the structure of the initial contract, on 13 July 2017 the ACS Group reached an agreement with Masmovil Ibercom, S.A., the main features of which are:
- The amount is fixed at EUR 200 million (guaranteed to EUR 120 million by a bank guarantee upon first request for 25 months), and removing the earn-out which was initially set.
- The debt accrues interest at a 2% fixed rate. Additionally, it should be noted that the debt will generate a variable interest rate of 3% should a series of events take place such as a change of control, non-fulfillment of debtor obligations, etc.
Consolidated Financial Statements - ACS GROUP
69
- If any change occurs in the commitment of debt assumption and capitalization in shares in that ACS compels Masmovil to assume the debt prior to 30 June 2021, ACS will be entitled to capitalize the outstanding debt at the date of the demand at the subscription of four million eight hundred thousand Masmovil shares.
- Masmovil’s obligations remain, such as delivery to ACS of the debt ratios, the need to have a qualified majority for taking certain important decisions such as the dismissal/appointment of senior executives (i.e. CEO or CFO of any operating company controlled by Masmovil), the adoption of a business plan other than the Business Plan or the annual budget if it differs materially from the Business Plan or a change in the national roaming agreement.
- The loan payment schedule ranges remains from 2023 to 2029, and there are certain early maturity assumptions.
- Similarly, certain contingency payments payable in shares are replaced by cash payments. As a result of the new agreement, the loan was measured at amortized cost with a book value at 31 December 2017 of EUR 135,181 thousand. As a result of the new agreement, the ACS Group have the right to a conversion option by which the fixed nominal amount of the note for EUR 200 million may be exchanged for a equally fixed number, 4.8 million shares in Masmovil Ibercom S.A., at any time prior to 30 June 2021, which means considering the existence of an embedded derivative. Therefore, and considering Masmovil’s market price at 31 December 2017, the Group has recorded the valuation of the existing derivative using the difference between the market price and the depreciation of the debt. Since it is an American-style option that depends on the moment the ACS Group exercises the conversion, it stands recorded as a current asset. The subsequent valuation of the derivative is made with changes in the consolidated income statement. The value of this derivative at 31 December 2017 amounts to EUR 286,739 thousand, and is recorded under “Derivative financial instruments” of the accompanying consolidated statement of financial position with a profit of EUR 219,337 thousand recorded under “Changes in fair value of financial instruments” in the accompanying consolidated statement of income. These loans earn interest tied to Euribor plus a market spread.
10.04. Debt securities At 31 December 2017, this heading included the investments in securities maturing in the short term relating mainly to investments in securities, investment funds and fixed-interest securities maturing at more than three months and which it does not intend to hold until maturity arising from Hochtief for EUR 199,683 thousand (EUR 269,028 thousand at 31 December 2016). Of the other amounts, those held by Cobra amounting to EUR 3,177 thousand (EUR 235,879 thousand at 31 December 2016) are of note.
10.05. Other financial assets At 31 December 2017, "Other financial assets" included short-term deposits amounting to EUR 517,145 thousand (EUR 754,792 thousand at 31 December 2016). This amount includes the amounts provided to cover certain derivatives arranged by the Group totaling EUR 487,530 thousand (EUR 564,609 thousand at 31 December 2016) (see Note 22), including the prepaid forward sale in 2016 of its entire shareholding in Iberdrola, S.A. (see Note 10.01). These amounts earn interest at market rates and their availability is restricted depending on the compliance with the coverage ratios. The balance of this heading also includes the current account with the securitization SPV for the amount of EUR 55,907 thousand (EUR 58,001 at 31 December 2016) (see Note 12) and the balance of the reserve accounts relating to activity of the projects. Impairment losses There were no significant losses from impairment value either in fiscal year 2017 or in fiscal year 2016. There were no significant reversals due to the impairment of financial assets in 2017 or 2016.
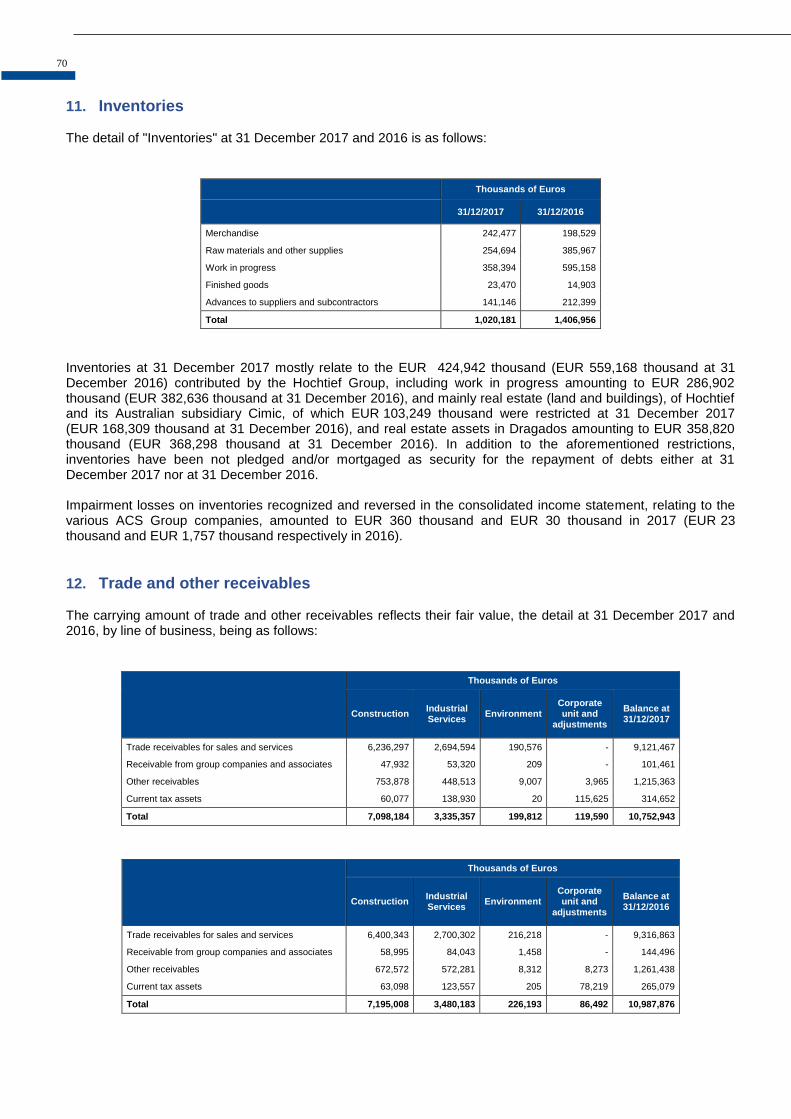
70
11. Inventories The detail of "Inventories" at 31 December 2017 and 2016 is as follows:
Thousands of Euros
31/12/2017 31/12/2016
Merchandise 242,477 198,529
Raw materials and other supplies 254,694 385,967
Work in progress 358,394 595,158
Finished goods 23,470 14,903
Advances to suppliers and subcontractors 141,146 212,399
Total 1,020,181 1,406,956
Inventories at 31 December 2017 mostly relate to the EUR 424,942 thousand (EUR 559,168 thousand at 31 December 2016) contributed by the Hochtief Group, including work in progress amounting to EUR 286,902 thousand (EUR 382,636 thousand at 31 December 2016), and mainly real estate (land and buildings), of Hochtief and its Australian subsidiary Cimic, of which EUR 103,249 thousand were restricted at 31 December 2017 (EUR 168,309 thousand at 31 December 2016), and real estate assets in Dragados amounting to EUR 358,820 thousand (EUR 368,298 thousand at 31 December 2016). In addition to the aforementioned restrictions, inventories have been not pledged and/or mortgaged as security for the repayment of debts either at 31 December 2017 nor at 31 December 2016. Impairment losses on inventories recognized and reversed in the consolidated income statement, relating to the various ACS Group companies, amounted to EUR 360 thousand and EUR 30 thousand in 2017 (EUR 23 thousand and EUR 1,757 thousand respectively in 2016).
12. Trade and other receivables The carrying amount of trade and other receivables reflects their fair value, the detail at 31 December 2017 and 2016, by line of business, being as follows:
Thousands of Euros
Construction Industrial Services
Environment Corporate unit and
adjustments
Balance at 31/12/2017
Trade receivables for sales and services 6,236,297 2,694,594 190,576 - 9,121,467
Receivable from group companies and associates 47,932 53,320 209 - 101,461
Other receivables 753,878 448,513 9,007 3,965 1,215,363
Current tax assets 60,077 138,930 20 115,625 314,652
Total 7,098,184 3,335,357 199,812 119,590 10,752,943
Thousands of Euros
Construction Industrial Services
Environment Corporate unit and
adjustments
Balance at 31/12/2016
Trade receivables for sales and services 6,400,343 2,700,302 216,218 - 9,316,863
Receivable from group companies and associates 58,995 84,043 1,458 - 144,496
Other receivables 672,572 572,281 8,312 8,273 1,261,438
Current tax assets 63,098 123,557 205 78,219 265,079
Total 7,195,008 3,480,183 226,193 86,492 10,987,876

Consolidated Financial Statements - ACS GROUP
71
Trade receivables for sales and services - Net trade receivables balance The detail of trade receivables for sales and services and net trade receivables balance, by line of business, at 31 December 2017 and 2016, is as follows:
Thousands of Euros
Construction Industrial Services
Environment Corporate unit and
adjustments
Balance at 31/12/2017
Trade receivables and notes receivable 3,903,382 1,410,579 169,744 4,497 5,488,202
Completed work pending certification 3,013,245 1,370,410 23,837 - 4,407,492
Allowances for doubtful debts (680,330) (86,395) (3,005) (4,497) (774,227)
Total receivables for sales and services 6,236,297 2,694,594 190,576 - 9,121,467
Advances received on orders (Note 23) (1,713,013) (820,522) (18) - (2,533,553)
Total net trade receivables balance 4,523,284 1,874,072 190,558 - 6,587,914
Thousands of Euros
Construction Industrial Services
Environment Corporate unit and
adjustments
Balance at 31/12/2016
Trade receivables and notes receivable 3,998,248 1,360,933 195,639 4,497 5,559,317
Completed work pending certification 3,144,691 1,419,007 24,600 - 4,588,298
Allowances for doubtful debts (742,596) (79,638) (4,021) (4,497) (830,752)
Total receivables for sales and services 6,400,343 2,700,302 216,218 - 9,316,863
Advances received on orders (Note 23) (1,963,481) (1,172,739) (65) - (3,136,285)
Total net trade receivables balance 4,436,862 1,527,563 216,153 - 6,180,578
At 31 December 2017, retentions held by customers for contract work in progress amounted to EUR 923,466 thousand (EUR 895,113 thousand at 31 December 2016). The Group companies assign trade receivables to financial institutions, without the possibility of recourse against them in the event of non-payment. The balance of receivables was reduced to EUR 1,022,753 thousand at 31 December 2017 (EUR 665,526 thousand at 31 December 2016). Substantially all the risks and rewards associated with the receivables, as well as control over them, were transferred through the sale and assignment of the receivables, since there are no repurchase agreements between the Group companies and the banks that have acquired the assets, and the banks may freely dispose of the acquired assets without the Group companies being able to limit this right in any manner. Consequently, the balances receivable relating to the receivables assigned or sold under the aforementioned conditions were derecognized in the consolidated statement of financial position. The Group companies continued to manage collection during the period. The balance of "Trade receivables and notes receivable" was reduced by the amounts received from the "CAP-TDA2 Fondo de Titulizacion de Activos", a securitization SPV which was set up on 19 May 2010. The ACS Group companies fully and unconditionally assign receivables to the securitization SPV. By means of this mechanism, at the date of assignment, the Company charges a set price (cash price) which does not reverse back to the securitization SPV for any reason. This securitization SPV, which is subject to Spanish law, transforms the receivables acquired into bonds. It is managed by a management company called Titulización de Activos, Sociedad Gestora de Fondos de Titulización, S.A. The amount of the receivables sold to the Securitization SPV was EUR 127,039 thousand at 31 December 2017 (EUR 118,618 thousand at 31 December 2016), of which EUR 55,907 thousand (EUR 58,001 thousand at 31 December 2016) were recognized as a current account with the Securitization SPV included under "Other current financial assets - Other loans" (see Note 10.03).
72
There was no customer at 31 December 2017 or 2016 that represented more than 10% of total revenue. Also, in connection with the Construction business, at 31 December 2017, the Group recorded EUR 2,265 million for amounts under negotiation or dispute (EUR 2,038 million in 2016) of which EUR 1,575 million were under litigation at 31 December 2017 (EUR 1,355 million at 31 December 2016) mainly with the arbitration of the Gorgon LNG Jetty and Marine Structure project which is detailed below in this Note. These amounts, that represent the accumulated delay in the collection of production over the past years, represent only 1.3% of the Construction activity of the ACS Group in that period. In relation to these amounts, the Group maintains claims of approximately EUR 5,041 million (EUR 4,723 million at 31 December 2016), of which 66% (60% at 31 December 2016) corresponds to the projects that are in litigation due to the arbitration of the Gorgon LNG Jetty and Marine Structure Project. Of the balances under “Completed Work Pending Certification” at 31 December 2017 which relate to works records under negotiation or dispute, the most significant of these is the Gorgon LNG Jetty and Marine Structure project (AUD 1,150 million, the same as at 31 December 2016, and equivalent to EUR 749.4 million at 31 December 2017), corresponding to the works performed by CPB Contractors Pty Ltd (CPB), which is a 100%-owned subsidiary of CIMIC, together with its partners in the consortium (Saipem SA and Saipem Portugal Comercio Marítimo LDA) that forms the Consortium and Chevron Australia Pty Ltd (Chevron) regarding the Gorgon LNG Jetty and Marine Structures Project (the Gorgon Agreement). In November 2009, the Consortium was announced as the preferred contractor to build the Chevron Gorgon LNG Jetty and Marine Structures Project of 2.1 kilometers in Barrow Island, 70 kilometers offshore from Pilbara, in Western Australia.
The scope of the works involved the design, supply of materials, manufacturing, construction and implementation of an LNG pier or dock (Liquefied Natural Gas). The scope also included the supply, manufacture and construction of marine structures including a heavy lift installation, tugs and navigational aids. The jetty comprised steel beams approximately 70 meters long, supported by concrete caissons leading to the loading platform approximately 4 kilometers from the coast. The initial acceptance of the jetty and marine structures took place on 15 August 2014. During the project, changes in the scope and conditions led the Consortium to make Change Order Requests. The Consortium, Chevron and Chevron agent held negotiations regarding the change order requests. On February 9, 2016, the Consortium formally issued a notice of dispute to Chevron in accordance with the provisions of the agreement. At the announcement date, CIMIC’s stake in the total negotiated amount of the Consortium was approximately AUD 1,860 million (Australian dollars). CIMIC confirms its view that CPB is still entitled to that amount plus interest (amounting to more than AUD 500 million that will continue to accrue) and costs. CIMIC has only recognized income equivalent to the costs incurred by the Gorgon Agreement, amounting to AUD 1,150 million (Australian dollars), approximately 50% of the total amount to which it considers it is entitled, which is recognized under "Trade and other receivables” in the consolidated statement of financial position of ACS at 31 December 2017 and 2016. After a period of negotiation, the parties entered into arbitration proceedings in accordance with the provisions of the Gorgon Agreement. On 20 August 2016, exercising its right under the agreement, the Cimic Group instigated proceedings in the USA against Chevron Corporation and KBR Inc. The start of this proceeding bears no effect on the negotiation process of the contract or on Cimic’s right to the amounts subject to negotiation and/or claims in arbitration. Since December 2016, the arbitration has proceeded as per the terms of the agreement. The arbitrators have been appointed and have issued the appropriate orders for the management of the proceeding and it is expected that hearings will take place in 2019 with a ruling following later. In addition to the above-mentioned work, the following work should be noted in the Group's international Construction activity in relation to “Completed Work Pending Certificate Processing” among investee companies in North America: the Seattle Tunnel - USA project in the amount of EUR 135,033 thousand (EUR 49,675 thousand in 2016) which relates mainly to costs incurred through repairs to the tunnel boring machine, cost overruns incurred due to suspension of works, plus additional costs of accelerating the works. The Group holds
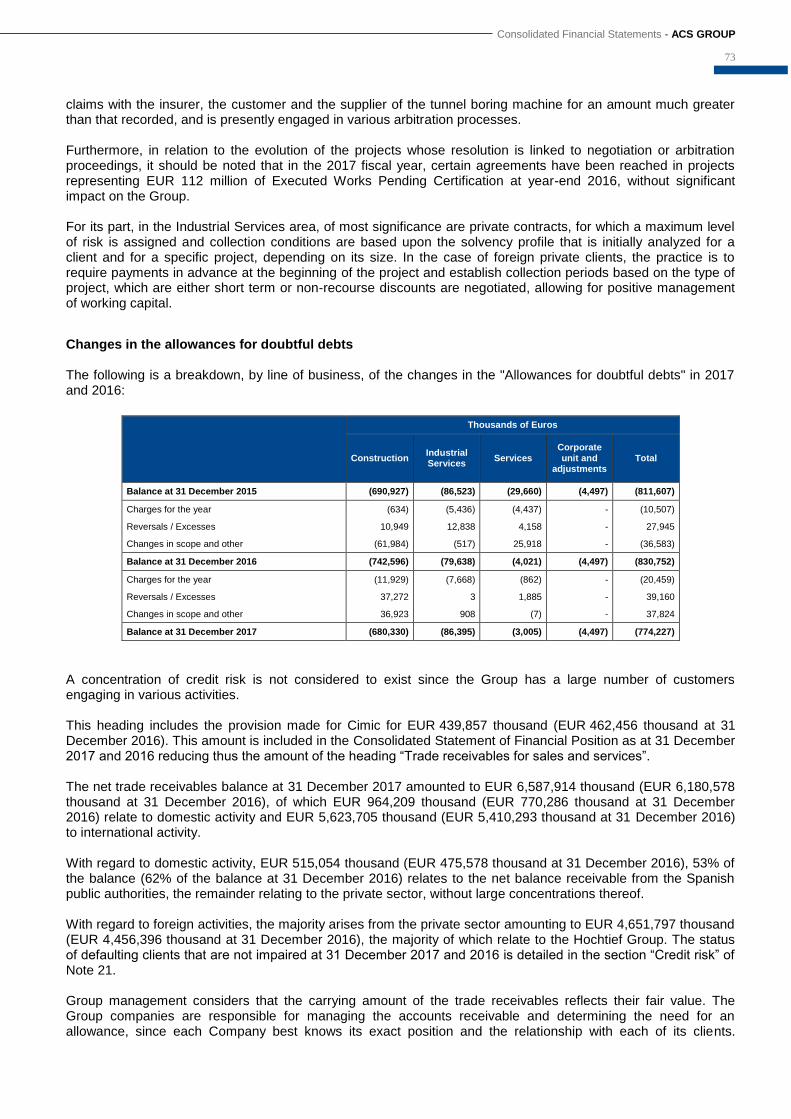
Consolidated Financial Statements - ACS GROUP
73
claims with the insurer, the customer and the supplier of the tunnel boring machine for an amount much greater than that recorded, and is presently engaged in various arbitration processes. Furthermore, in relation to the evolution of the projects whose resolution is linked to negotiation or arbitration proceedings, it should be noted that in the 2017 fiscal year, certain agreements have been reached in projects representing EUR 112 million of Executed Works Pending Certification at year-end 2016, without significant impact on the Group. For its part, in the Industrial Services area, of most significance are private contracts, for which a maximum level of risk is assigned and collection conditions are based upon the solvency profile that is initially analyzed for a client and for a specific project, depending on its size. In the case of foreign private clients, the practice is to require payments in advance at the beginning of the project and establish collection periods based on the type of project, which are either short term or non-recourse discounts are negotiated, allowing for positive management of working capital.
Changes in the allowances for doubtful debts The following is a breakdown, by line of business, of the changes in the "Allowances for doubtful debts" in 2017 and 2016:
Thousands of Euros
Construction Industrial Services
Services Corporate unit and
adjustments Total
Balance at 31 December 2015 (690,927) (86,523) (29,660) (4,497) (811,607)
Charges for the year (634) (5,436) (4,437) - (10,507)
Reversals / Excesses 10,949 12,838 4,158 - 27,945
Changes in scope and other (61,984) (517) 25,918 - (36,583)
Balance at 31 December 2016 (742,596) (79,638) (4,021) (4,497) (830,752)
Charges for the year (11,929) (7,668) (862) - (20,459)
Reversals / Excesses 37,272 3 1,885 - 39,160
Changes in scope and other 36,923 908 (7) - 37,824
Balance at 31 December 2017 (680,330) (86,395) (3,005) (4,497) (774,227)
A concentration of credit risk is not considered to exist since the Group has a large number of customers engaging in various activities. This heading includes the provision made for Cimic for EUR 439,857 thousand (EUR 462,456 thousand at 31 December 2016). This amount is included in the Consolidated Statement of Financial Position as at 31 December 2017 and 2016 reducing thus the amount of the heading “Trade receivables for sales and services”. The net trade receivables balance at 31 December 2017 amounted to EUR 6,587,914 thousand (EUR 6,180,578 thousand at 31 December 2016), of which EUR 964,209 thousand (EUR 770,286 thousand at 31 December 2016) relate to domestic activity and EUR 5,623,705 thousand (EUR 5,410,293 thousand at 31 December 2016) to international activity. With regard to domestic activity, EUR 515,054 thousand (EUR 475,578 thousand at 31 December 2016), 53% of the balance (62% of the balance at 31 December 2016) relates to the net balance receivable from the Spanish public authorities, the remainder relating to the private sector, without large concentrations thereof. With regard to foreign activities, the majority arises from the private sector amounting to EUR 4,651,797 thousand (EUR 4,456,396 thousand at 31 December 2016), the majority of which relate to the Hochtief Group. The status of defaulting clients that are not impaired at 31 December 2017 and 2016 is detailed in the section “Credit risk” of Note 21. Group management considers that the carrying amount of the trade receivables reflects their fair value. The Group companies are responsible for managing the accounts receivable and determining the need for an allowance, since each Company best knows its exact position and the relationship with each of its clients.
74
However, each line of business lays down certain guidelines on the basis that each client has its own peculiarities depending on the business activity performed. In this regard, for the Construction area, the accounts receivable from public authorities pose no recoverability problems of significance, and international activity mainly relates to work performed for public authorities in foreign countries, which reduces the possibility of experiencing significant insolvency. On the other hand, for private clients there is an established guarantee policy prior to the beginning of construction, which significantly reduces the risk of insolvency. Additionally, the existence of arrears and of a possible default are low since besides the fact that the Group also has the right to request late interest from public authorities, its private clients are assigned a maximum risk level before contracting a service. In the Industrial Services area, of most significance are private contracts, for which a maximum level of risk is assigned and collection conditions are based upon the solvency profile that is initially analyzed for a client and for a specific project, depending on its size. In the case of foreign private clients, the practice is to require payments in advance at the beginning of the project and establish collection periods based on the type of project, which are either short term or non-recourse discounts are negotiated, allowing for positive management of working capital.
13. Other current assets This heading in the statement of financial position includes mainly short-term accruals of prepaid expenses and interest.
14. Cash and cash equivalents "Cash and cash equivalents" includes the Group's cash and short-term bank deposits with an original maturity of three months or less. The carrying amount of these assets amounting to EUR 196,404 thousand (EUR 137,745 thousand at 31 December 2016) reflect their fair value and there are no restrictions as to their use.
15. Equity
15.01. Share Capital At 31 December 2017 and 31 December 2016, the share capital of the Parent amounted to EUR 157,332 thousand and was represented by 314,664,594 fully subscribed and paid shares with a par value of EUR 0.5 each, all with the same voting and dividend rights. Expenses directly attributable to the issue or acquisition of new shares are recognized in equity as a deduction from the amount thereof. The shareholders at the Annual General Meeting held on 29 May 2014 authorized, in accordance with that set forth in article 297 of the Consolidated Text of the Spanish Capital Companies Law [Texto Refundido de la Ley de Sociedades de Capital], the Company's Board of Directors to increase share capital by up to 50% at the date of this resolution on one or several occasions, and at the date, in the amount and under the conditions freely agreed in each case, within five years following 29 May 2014 and without having previously submitted a proposal to the shareholders at the Annual General Meeting. Accordingly, the Board of Directors may set all of the terms and conditions under which capital is increased as well as the features of the shares, investors and markets at which the increases are aimed and the issue procedure, freely offer the unsubscribed shares in the preferential subscription period, and in the event of incomplete subscription, cancel the capital increase or increase capital solely by the amount of the subscribed shares. The share capital increase or increases may be carried out by issuing new shares, either ordinary, without voting rights, preference or redeemable shares. The new shares shall be payable by means of monetary contributions equal to the par value of the shares and any share premium which may be agreed. Pursuant to that set forth in article 506 of the Consolidated Text of the Spanish Capital Companies Law, the Board of Directors was expressly empowered to exclude preferential subscription rights in full or in part in relation to all or some of the issues agreed under the scope of this authorization, where it is in the interest of the company and as long as the par value of the shares to be issued plus any share premium agreed is equal to the fair value
Consolidated Financial Statements - ACS GROUP
75
of the Company's shares based on a report to be drawn up at the Board's request, by an independent auditor other than the Company's auditor, who is appointed for this purpose by the Spanish Mercantile Registry on any occasion in which the power to exclude preferential subscription rights is exercised. Additionally, the Company's Board of Directors is authorized to request the listing or de-listing of any shares issued, in Spanish- or foreign-organized secondary markets. Similarly, at the Annual General Meeting held on 29 May 2014, the shareholders resolved to delegate to the Board of Directors, as far as permitted by the applicable legal provisions, the power to issue fixed income securities, either simple and exchangeable or convertible, and warrants on the Company’s or other companies’ newly issued shares or shares in circulation, as follows:
- Securities which the Board of Directors is empowered to issue may be debt securities, bonds, notes, and
other fixed-income securities of a similar nature, both simple and, in the case of debt securities and bonds, exchangeable for Company shares or shares in any other of the Group companies or other companies and/or convertible into Company shares or share in other companies, as well as warrants over newly issued shares, or Company shares outstanding or shares outstanding of other companies.
- Securities may be issued on one or more occasions within five years following the date of this agreement.
- The total amount of the issue or issues of securities agreed under this delegation, whatever their nature, plus the total number of shares listed by the Company, plus the total number of shares listed by the Company and outstanding at the issue date may not exceed a maximum limit of EUR 3 billion.
- By virtue of the authorization granted herein to the Board of Directors, the Board will establish, for every
issue, without limitation, the following: its amount, within the aforementioned limit; the location, date, and currency of the issue, establishing its equivalent in euros, if applicable; its denomination, be they bonds or debt securities, subordinate or not, warrants, or any other lawful security; the interest rate, dates, and procedures for payment; in the case of the warrants, the amount and mode of calculation, if applicable, of the premium and the exercise price; its nature as perpetual or amortizable; and, in the latter case, the term of amortization and the maturity dates; the type of repayment, premiums, and batches; guarantees; the form of representation, be they titles or annotations in account; right of preferential subscription, if applicable, and subscription system; applicable legislation; the request for admission to trading in official or non-official secondary markets, organized or not, national or foreign, of the securities issued; the appointment, if relevant, of the Commissioner and the approval of the rules governing the legal relationships between the Company and the Syndicate of the holders of the securities issued.
On the basis of these approvals by the Annual General Meeting of 29 May 2014, under the Euro Medium Term Note Program (EMTN Program), in 2015 ACS, Actividades de Construcción y Servicios, S.A. performed, among others, a Notes issue in the Euromarket for the amount of EUR 500 million admitted for trading on the Irish Stock Exchange, maturing at five years. Similarly, the Euro Commercial Paper (ECP) program has been renewed until maturity for a maximum amount of EUR 750 million (see Note 17.01) and has formalized the issuing of the Negotiable European Commercial Paper (NEU CP) for a maximum amount of EUR 300 million over a maximum period of 365 days, under Bank of France regulation (see Note 17.01). At the Annual General Meeting held on 4 May 2017, the Shareholders of ACS, Actividades de Construcción y Servicios, S.A. resolved, among other matters, to make a share capital increase and reduction. In this regard, the Company resolved to increase the share capital to a maximum of EUR 382 million with a charge to voluntary reserves, whereby the first capital increase may not exceed EUR 240 million and the second increase may not exceed EUR 142 million, indistinctly granting the Executive Commission, the Chairman of the Board of Directors and the Director Secretary the power to execute the resolution. The capital increase is expected to take place, in the case of the first increase, within the three months following the date of the Annual General Meeting held in 2017 and, in the case of the second increase, within the first quarter of 2018, thereby coinciding with the dates on which ACS, Actividades de Construcción y Servicios, S.A. has traditionally distributed the final dividend and the interim dividend. With regard to the capital reduction, the resolution adopted by the Board consists of reducing share capital through the redemption of the Company's treasury shares for a nominal amount equal to the nominal amount for which the aforementioned capital increase was effectively carried out. The Board of Directors is granted the power to execute these resolutions, on one or two occasions, simultaneously with each of the share capital increases.
76
In this regard, on 14 June 2017, ACS, Actividades de Construcción y Servicios, S.A. resolved to carry out the first capital increase charged to reserves, approved at the Ordinary Annual General Meeting held on 4 May 2017, so that once the process has concluded, the definitive number of ordinary shares, with a par value of EUR 0.5 each, to be issued is 4,344,623, and the nominal value of the related capital increase is EUR 2,172,311.50, with a simultaneous capital reduction of EUR 2,172,311.50, through the retirement of 4,344,623 treasury shares charged to free reserves, for the same amount of EUR 2,172,311.50 of the reserve provided for in Article 335.c of the Spanish Capital Companies Law, corresponding to the par value of the retired shares. On 9 January 2018, ACS Actividades de Construcción y Servicios, S.A., using the powers delegated by resolution of the Company’s Shareholders in the Annual General Meeting held on 4 May 2017 and with the approval of the Board of Directors dated 19 December 2017, agreed to execute the second capital increase charged against reserves for a maximum of EUR 142 million (equivalent to approximately EUR 0.45 per share), which was approved by the aforementioned General Meeting for the purpose of allowing the shareholders to opt between continuing to receive remuneration in cash or in Company shares. Following the period of negotiation of the bonus shares corresponding to the second increase in paid-up capital, the irrevocable commitment to purchase the rights assumed by ACS was accepted by holders of 32.15% of the bonus rights, which has determined the acquisition by ACS of the rights for a total gross amount of EUR 45,423 thousand. The definitive number issued of ordinary shares, each with a nominal value of EUR 0.5, amounts to 2,793,785, with the nominal amount of the corresponding capital increase amounting to EUR 1,396,892.50. Simultaneously a reduction took place in capital for EUR 1,396,892.50 by means of the redemption of 2,793,785 treasury shares and an allocation of an equal amount of EUR 1,396,892.50 to the reserve provided for in paragraph c) of Article 335 of the Spanish Capital Companies Law, equivalent to the nominal value of the redeemed shares (see Note 15.04). At the Annual General Meeting held on 5 May 2016, the Shareholders of ACS, Actividades de Construcción y Servicios, S.A. resolved, among other matters, to make a share capital increase and reduction. In this regard, the Company resolved to increase the share capital to a maximum of EUR 366 million with a charge to voluntary reserves, whereby the first capital increase may not exceed EUR 224 million and the second increase may not exceed EUR 142 million, indistinctly granting the Executive Commission, the Chairman of the Board of Directors and the Director Secretary the power to execute the resolution. The capital increase is expected to take place, in the case of the first increase, within the three months following the date of the Annual General Meeting held in 2016 and, in the case of the second increase, within the first quarter of 2017, thereby coinciding with the dates on which ACS, Actividades de Construcción y Servicios, S.A. has traditionally distributed the final dividend and the interim dividend. With regard to the capital reduction, the resolution adopted by the Board consists of reducing share capital through the redemption of the Company's treasury shares for a nominal amount equal to the nominal amount for which the aforementioned capital increase was effectively carried out. The Board of Directors is granted the power to execute these resolutions, on one or two occasions, simultaneously with each of the share capital increases. In this regard, on 14 June 2016, ACS, Actividades de Construcción y Servicios, S.A. resolved to carry out the first capital increase charged to reserves, approved at the Annual General Meeting held on 5 May 2016, so that once the process has concluded, the definitive number of ordinary shares, with a par value of EUR 0.5 each, to be issued is 3,825,354, and the nominal value of the related capital increase is EUR 1,912,677, with a simultaneous capital reduction of EUR 1,912,677, through the retirement of 3,825,354 treasury shares charged to free reserves, for the same amount of EUR 1,912,677 of the reserve provided for in Article 335.c of the Spanish Capital Companies Law, corresponding to the par value of the retired shares. On 9 January 2017, ACS Actividades de Construcción y Servicios, S.A., using the powers delegated by resolution of the Company’s Shareholders at the Annual General Meeting held on 5 May 2016, and with the approval of the Board of Directors dated 22 December 2016, agreed to execute the second capital increase charged against reserves for a maximum of EUR 142 million (equivalent to approximately EUR 0.45 per share), which was approved by the aforementioned General Meeting for the purpose of allowing the shareholders to opt between continuing to receive remuneration in cash or in Company shares. Following the period of negotiation of the bonus shares corresponding to the second increase in paid-up capital, the irrevocable commitment to purchase the rights assumed by ACS was accepted by holders of 43.73% of the bonus rights, which has determined the acquisition by ACS of the rights for a total gross amount of EUR 61,236 thousand. The definitive number issued of ordinary shares, each with a nominal value of EUR 0.5, amounts to 2,534,969, with the nominal amount of the corresponding capital increase amounting to EUR 1,267,484.50. Simultaneously a reduction took place in capital for EUR 1,267,484.50 by means of the redemption of 2,534,969 treasury shares and an allocation of an equal amount of EUR 1,267,484.50 to the reserve provided for in paragraph c) of Article 335 of the Spanish Capital Companies Law, equivalent to the nominal value of the redeemed shares (see Note 15.04).
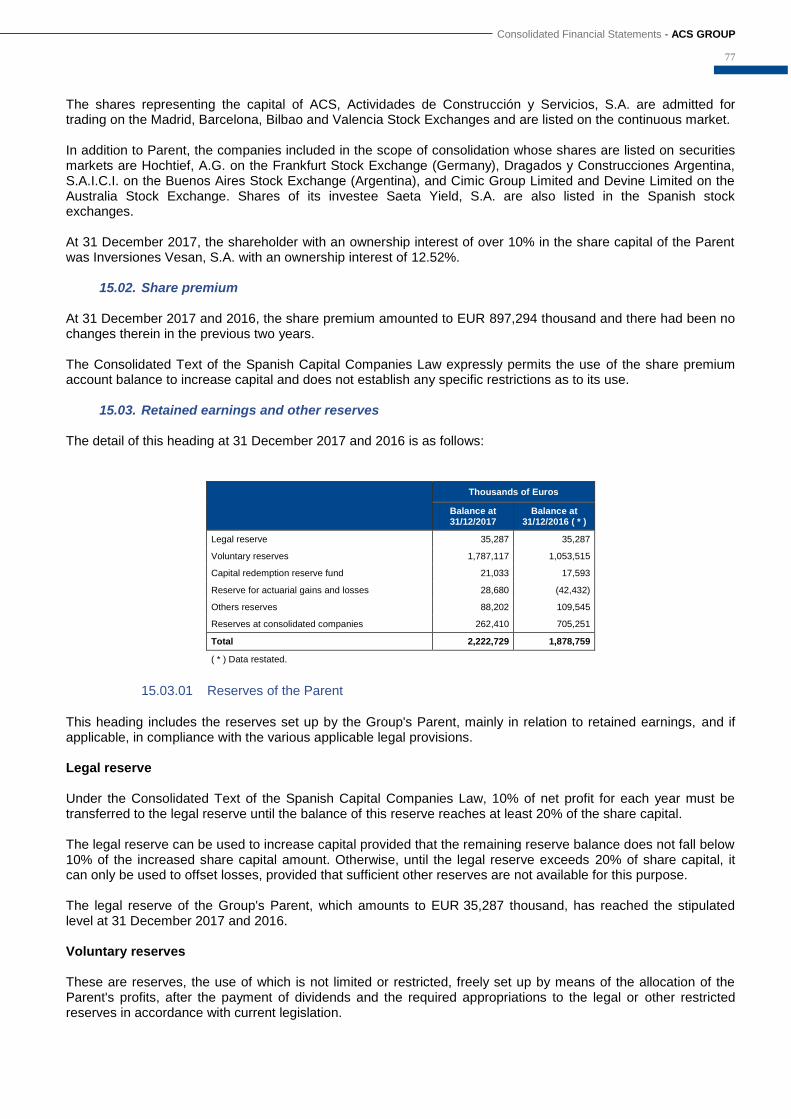
Consolidated Financial Statements - ACS GROUP
77
The shares representing the capital of ACS, Actividades de Construcción y Servicios, S.A. are admitted for trading on the Madrid, Barcelona, Bilbao and Valencia Stock Exchanges and are listed on the continuous market. In addition to Parent, the companies included in the scope of consolidation whose shares are listed on securities markets are Hochtief, A.G. on the Frankfurt Stock Exchange (Germany), Dragados y Construcciones Argentina, S.A.I.C.I. on the Buenos Aires Stock Exchange (Argentina), and Cimic Group Limited and Devine Limited on the Australia Stock Exchange. Shares of its investee Saeta Yield, S.A. are also listed in the Spanish stock exchanges. At 31 December 2017, the shareholder with an ownership interest of over 10% in the share capital of the Parent was Inversiones Vesan, S.A. with an ownership interest of 12.52%.
15.02. Share premium At 31 December 2017 and 2016, the share premium amounted to EUR 897,294 thousand and there had been no changes therein in the previous two years. The Consolidated Text of the Spanish Capital Companies Law expressly permits the use of the share premium account balance to increase capital and does not establish any specific restrictions as to its use.
15.03. Retained earnings and other reserves
The detail of this heading at 31 December 2017 and 2016 is as follows:
Thousands of Euros
Balance at 31/12/2017
Balance at 31/12/2016 ( * )
Legal reserve 35,287 35,287
Voluntary reserves 1,787,117 1,053,515
Capital redemption reserve fund 21,033 17,593
Reserve for actuarial gains and losses 28,680 (42,432)
Others reserves 88,202 109,545
Reserves at consolidated companies 262,410 705,251
Total 2,222,729 1,878,759
( * ) Data restated.
15.03.01 Reserves of the Parent
This heading includes the reserves set up by the Group's Parent, mainly in relation to retained earnings, and if applicable, in compliance with the various applicable legal provisions. Legal reserve Under the Consolidated Text of the Spanish Capital Companies Law, 10% of net profit for each year must be transferred to the legal reserve until the balance of this reserve reaches at least 20% of the share capital. The legal reserve can be used to increase capital provided that the remaining reserve balance does not fall below 10% of the increased share capital amount. Otherwise, until the legal reserve exceeds 20% of share capital, it can only be used to offset losses, provided that sufficient other reserves are not available for this purpose. The legal reserve of the Group's Parent, which amounts to EUR 35,287 thousand, has reached the stipulated level at 31 December 2017 and 2016. Voluntary reserves These are reserves, the use of which is not limited or restricted, freely set up by means of the allocation of the Parent's profits, after the payment of dividends and the required appropriations to the legal or other restricted reserves in accordance with current legislation.
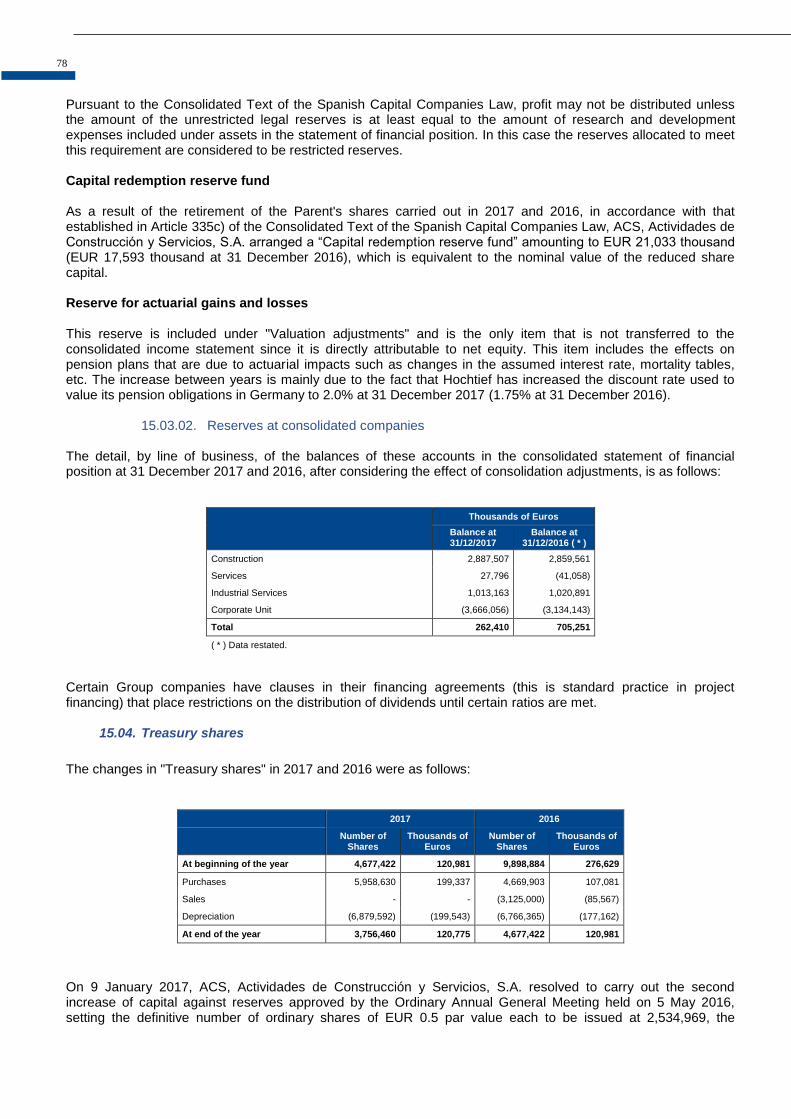
78
Pursuant to the Consolidated Text of the Spanish Capital Companies Law, profit may not be distributed unless the amount of the unrestricted legal reserves is at least equal to the amount of research and development expenses included under assets in the statement of financial position. In this case the reserves allocated to meet this requirement are considered to be restricted reserves. Capital redemption reserve fund As a result of the retirement of the Parent's shares carried out in 2017 and 2016, in accordance with that established in Article 335c) of the Consolidated Text of the Spanish Capital Companies Law, ACS, Actividades de Construcción y Servicios, S.A. arranged a “Capital redemption reserve fund” amounting to EUR 21,033 thousand (EUR 17,593 thousand at 31 December 2016), which is equivalent to the nominal value of the reduced share capital. Reserve for actuarial gains and losses This reserve is included under "Valuation adjustments" and is the only item that is not transferred to the consolidated income statement since it is directly attributable to net equity. This item includes the effects on pension plans that are due to actuarial impacts such as changes in the assumed interest rate, mortality tables, etc. The increase between years is mainly due to the fact that Hochtief has increased the discount rate used to value its pension obligations in Germany to 2.0% at 31 December 2017 (1.75% at 31 December 2016).
15.03.02. Reserves at consolidated companies The detail, by line of business, of the balances of these accounts in the consolidated statement of financial position at 31 December 2017 and 2016, after considering the effect of consolidation adjustments, is as follows:
Thousands of Euros
Balance at 31/12/2017
Balance at 31/12/2016 ( * )
Construction 2,887,507 2,859,561
Services 27,796 (41,058)
Industrial Services 1,013,163 1,020,891
Corporate Unit (3,666,056) (3,134,143)
Total 262,410 705,251
( * ) Data restated.
Certain Group companies have clauses in their financing agreements (this is standard practice in project financing) that place restrictions on the distribution of dividends until certain ratios are met.
15.04. Treasury shares
The changes in "Treasury shares" in 2017 and 2016 were as follows:
2017 2016
Number of
Shares Thousands of
Euros Number of
Shares Thousands of
Euros
At beginning of the year 4,677,422 120,981 9,898,884 276,629
Purchases 5,958,630 199,337 4,669,903 107,081
Sales - - (3,125,000) (85,567)
Depreciation (6,879,592) (199,543) (6,766,365) (177,162)
At end of the year 3,756,460 120,775 4,677,422 120,981
On 9 January 2017, ACS, Actividades de Construcción y Servicios, S.A. resolved to carry out the second increase of capital against reserves approved by the Ordinary Annual General Meeting held on 5 May 2016, setting the definitive number of ordinary shares of EUR 0.5 par value each to be issued at 2,534,969, the
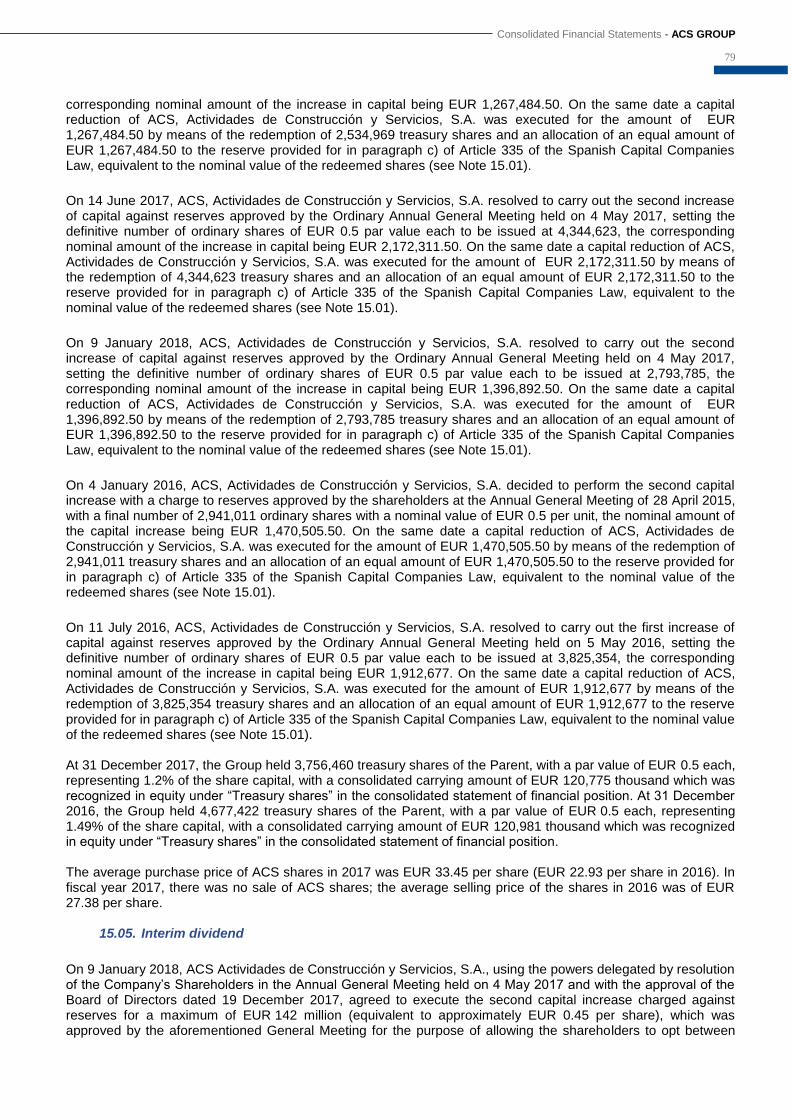
Consolidated Financial Statements - ACS GROUP
79
corresponding nominal amount of the increase in capital being EUR 1,267,484.50. On the same date a capital reduction of ACS, Actividades de Construcción y Servicios, S.A. was executed for the amount of EUR 1,267,484.50 by means of the redemption of 2,534,969 treasury shares and an allocation of an equal amount of EUR 1,267,484.50 to the reserve provided for in paragraph c) of Article 335 of the Spanish Capital Companies Law, equivalent to the nominal value of the redeemed shares (see Note 15.01).
On 14 June 2017, ACS, Actividades de Construcción y Servicios, S.A. resolved to carry out the second increase of capital against reserves approved by the Ordinary Annual General Meeting held on 4 May 2017, setting the definitive number of ordinary shares of EUR 0.5 par value each to be issued at 4,344,623, the corresponding nominal amount of the increase in capital being EUR 2,172,311.50. On the same date a capital reduction of ACS, Actividades de Construcción y Servicios, S.A. was executed for the amount of EUR 2,172,311.50 by means of the redemption of 4,344,623 treasury shares and an allocation of an equal amount of EUR 2,172,311.50 to the reserve provided for in paragraph c) of Article 335 of the Spanish Capital Companies Law, equivalent to the nominal value of the redeemed shares (see Note 15.01).
On 9 January 2018, ACS, Actividades de Construcción y Servicios, S.A. resolved to carry out the second increase of capital against reserves approved by the Ordinary Annual General Meeting held on 4 May 2017, setting the definitive number of ordinary shares of EUR 0.5 par value each to be issued at 2,793,785, the corresponding nominal amount of the increase in capital being EUR 1,396,892.50. On the same date a capital reduction of ACS, Actividades de Construcción y Servicios, S.A. was executed for the amount of EUR 1,396,892.50 by means of the redemption of 2,793,785 treasury shares and an allocation of an equal amount of EUR 1,396,892.50 to the reserve provided for in paragraph c) of Article 335 of the Spanish Capital Companies Law, equivalent to the nominal value of the redeemed shares (see Note 15.01).
On 4 January 2016, ACS, Actividades de Construcción y Servicios, S.A. decided to perform the second capital increase with a charge to reserves approved by the shareholders at the Annual General Meeting of 28 April 2015, with a final number of 2,941,011 ordinary shares with a nominal value of EUR 0.5 per unit, the nominal amount of the capital increase being EUR 1,470,505.50. On the same date a capital reduction of ACS, Actividades de Construcción y Servicios, S.A. was executed for the amount of EUR 1,470,505.50 by means of the redemption of 2,941,011 treasury shares and an allocation of an equal amount of EUR 1,470,505.50 to the reserve provided for in paragraph c) of Article 335 of the Spanish Capital Companies Law, equivalent to the nominal value of the redeemed shares (see Note 15.01).
On 11 July 2016, ACS, Actividades de Construcción y Servicios, S.A. resolved to carry out the first increase of capital against reserves approved by the Ordinary Annual General Meeting held on 5 May 2016, setting the definitive number of ordinary shares of EUR 0.5 par value each to be issued at 3,825,354, the corresponding nominal amount of the increase in capital being EUR 1,912,677. On the same date a capital reduction of ACS, Actividades de Construcción y Servicios, S.A. was executed for the amount of EUR 1,912,677 by means of the redemption of 3,825,354 treasury shares and an allocation of an equal amount of EUR 1,912,677 to the reserve provided for in paragraph c) of Article 335 of the Spanish Capital Companies Law, equivalent to the nominal value of the redeemed shares (see Note 15.01). At 31 December 2017, the Group held 3,756,460 treasury shares of the Parent, with a par value of EUR 0.5 each, representing 1.2% of the share capital, with a consolidated carrying amount of EUR 120,775 thousand which was recognized in equity under “Treasury shares” in the consolidated statement of financial position. At 31 December 2016, the Group held 4,677,422 treasury shares of the Parent, with a par value of EUR 0.5 each, representing 1.49% of the share capital, with a consolidated carrying amount of EUR 120,981 thousand which was recognized in equity under “Treasury shares” in the consolidated statement of financial position. The average purchase price of ACS shares in 2017 was EUR 33.45 per share (EUR 22.93 per share in 2016). In fiscal year 2017, there was no sale of ACS shares; the average selling price of the shares in 2016 was of EUR 27.38 per share.
15.05. Interim dividend
On 9 January 2018, ACS Actividades de Construcción y Servicios, S.A., using the powers delegated by resolution of the Company’s Shareholders in the Annual General Meeting held on 4 May 2017 and with the approval of the Board of Directors dated 19 December 2017, agreed to execute the second capital increase charged against reserves for a maximum of EUR 142 million (equivalent to approximately EUR 0.45 per share), which was approved by the aforementioned General Meeting for the purpose of allowing the shareholders to opt between

80
continuing to receive remuneration in cash or in Company shares. After the negotiation period for the free allocation rights corresponding to the second released capital increase, the irrevocable commitment to purchase the rights assumed by ACS was accepted by the holders of 32.15% of the free allocation rights. After the decision-making period granted to the shareholders had elapsed, on 6 February 2018 the following events took place:
The dividend was determined to be a total gross amount of EUR 45.422.771.60 (EUR 0.449 per share) and was paid on 7 February 2018.
The number of final shares subject to the capital increase was 2.793.785 for a nominal amount of EUR 1,396,892.50.
The ACS Group recorded under "Other current assets" in the accompanying consolidated statement of financial position at 31 December 2017 for the maximum amount of the potential liability at the aforementioned date for 100% of the fair value of the dividend approved which amounted to EUR 141,284 thousand, although the final amount was EUR 45,423 thousand. For this reason, EUR 95,861 thousand were reverted in 2018 into the ACS Group’s assets.
15.06. Adjustments for changes in value The net changes in the balance of this heading in 2017 and 2016 were as follows:
Thousands of Euros
2017 2016 ( * )
Beginning balance 10,908 (33,744)
Hedging Instruments 69,986 127,715
Available-for-sale financial assets (13,843) (167,748)
Exchange differences (282,761) 84,685
Ending balance (215,710) 10,908
( * ) Data restated.
The adjustments for hedging instruments relate to the reserve set up for the effective portion of changes in the fair value of the financial instruments designated and effective as cash flow hedges. They relate mainly to interest rate hedges and, to a lesser extent, foreign exchange rate hedges, tied to asset and liability items in the consolidated statement of financial position, and to future transaction commitments qualifying for hedge accounting because they meet the requirements provided for in IAS 39 on hedge accounting. The changes in the period arose mainly as a result of the rates of exchange for the US dollar, Brazilian real, Mexican peso and the Australian dollar. Additionally, the sale of Urbaser affected movement for fiscal year 2016 (see Note 03.09). The changes relating to available-for-sale financial assets include the unrealized gains or losses arising from changes in their fair value net of the related tax effect. The change in fiscal year 2016 arose mainly as a result of the value associated with the ownership interest in Iberdrola being posted to the consolidated statement of income as a result of its being written down in the books due to the substantial transfer of the risks and benefits in relation to this ownership interest (see Note 10.01). The translation differences at 1 January 2004 were recognized in the transition to IFRSs as opening reserves. Consequently, the amount presented in the Group's consolidated statement of financial position at 31 December 2017 relates exclusively to the difference arising in the period from 2004 to 2017, net of the related tax effect, between the closing and opening exchange rates, on non-monetary items whose fair value is adjusted against equity and on the translation to euros of the balances in the functional currencies of fully and proportionately consolidated companies and as companies accounted for using the equity method whose functional currency is not the euro. The main translation differences, at 31 December 2017 and 2016 by currency, were as follows:
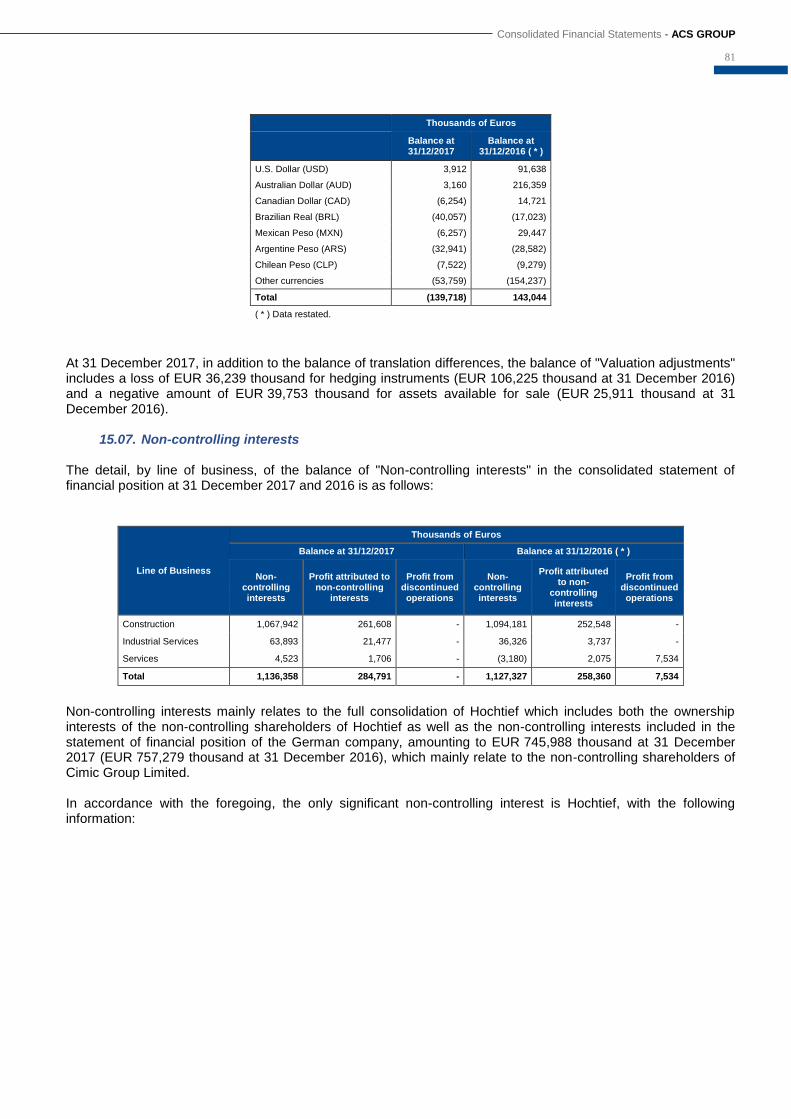
Consolidated Financial Statements - ACS GROUP
81
Thousands of Euros
Balance at 31/12/2017
Balance at 31/12/2016 ( * )
U.S. Dollar (USD) 3,912 91,638
Australian Dollar (AUD) 3,160 216,359
Canadian Dollar (CAD) (6,254) 14,721
Brazilian Real (BRL) (40,057) (17,023)
Mexican Peso (MXN) (6,257) 29,447
Argentine Peso (ARS) (32,941) (28,582)
Chilean Peso (CLP) (7,522) (9,279)
Other currencies (53,759) (154,237)
Total (139,718) 143,044
( * ) Data restated.
At 31 December 2017, in addition to the balance of translation differences, the balance of "Valuation adjustments" includes a loss of EUR 36,239 thousand for hedging instruments (EUR 106,225 thousand at 31 December 2016) and a negative amount of EUR 39,753 thousand for assets available for sale (EUR 25,911 thousand at 31 December 2016).
15.07. Non-controlling interests The detail, by line of business, of the balance of "Non-controlling interests" in the consolidated statement of financial position at 31 December 2017 and 2016 is as follows:
Line of Business
Thousands of Euros
Balance at 31/12/2017 Balance at 31/12/2016 ( * )
Non-controlling interests
Profit attributed to non-controlling
interests
Profit from discontinued operations
Non-controlling interests
Profit attributed to non-
controlling interests
Profit from discontinued operations
Construction 1,067,942 261,608 - 1,094,181 252,548 -
Industrial Services 63,893 21,477 - 36,326 3,737 -
Services 4,523 1,706 - (3,180) 2,075 7,534
Total 1,136,358 284,791 - 1,127,327 258,360 7,534
Non-controlling interests mainly relates to the full consolidation of Hochtief which includes both the ownership interests of the non-controlling shareholders of Hochtief as well as the non-controlling interests included in the statement of financial position of the German company, amounting to EUR 745,988 thousand at 31 December 2017 (EUR 757,279 thousand at 31 December 2016), which mainly relate to the non-controlling shareholders of Cimic Group Limited. In accordance with the foregoing, the only significant non-controlling interest is Hochtief, with the following information:
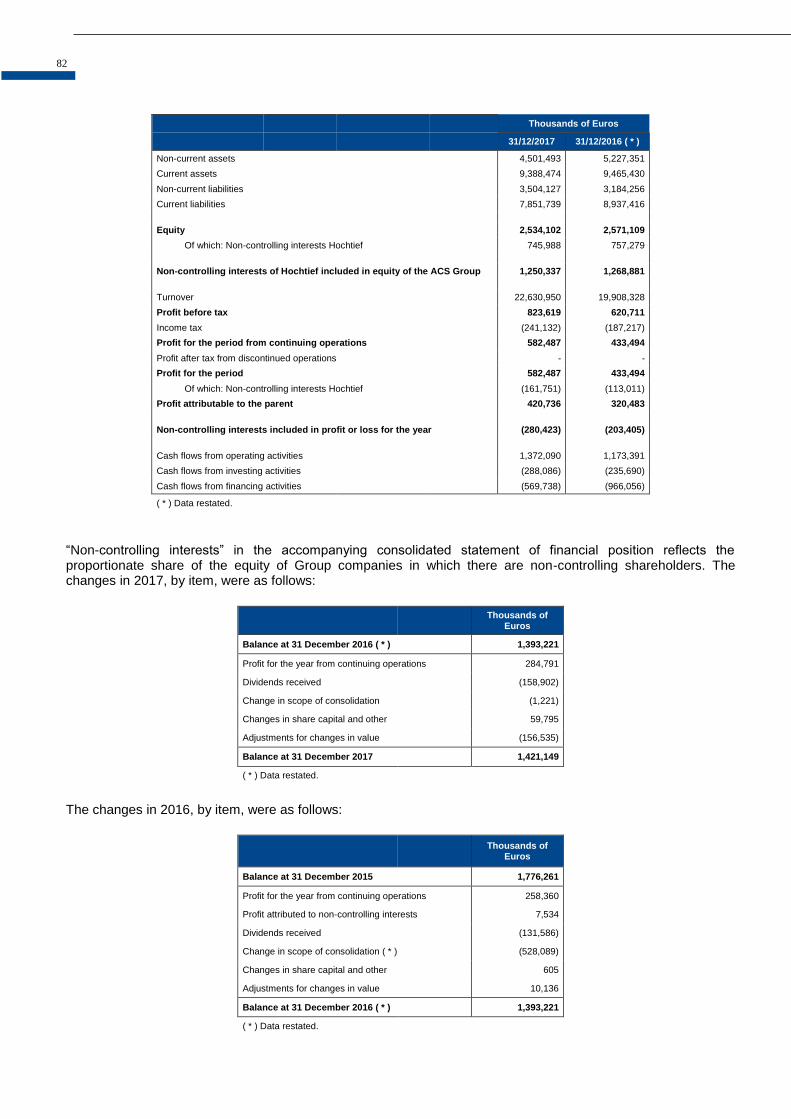
82
Thousands of Euros
31/12/2017 31/12/2016 ( * )
Non-current assets 4,501,493 5,227,351
Current assets
9,388,474 9,465,430
Non-current liabilities
3,504,127 3,184,256
Current liabilities
7,851,739 8,937,416
Equity
2,534,102 2,571,109
Of which: Non-controlling interests Hochtief 745,988 757,279
Non-controlling interests of Hochtief included in equity of the ACS Group 1,250,337 1,268,881
Turnover
22,630,950 19,908,328
Profit before tax
823,619 620,711
Income tax
(241,132) (187,217)
Profit for the period from continuing operations 582,487 433,494
Profit after tax from discontinued operations - -
Profit for the period
582,487 433,494
Of which: Non-controlling interests Hochtief (161,751) (113,011)
Profit attributable to the parent
420,736 320,483
Non-controlling interests included in profit or loss for the year (280,423) (203,405)
Cash flows from operating activities
1,372,090 1,173,391
Cash flows from investing activities
(288,086) (235,690)
Cash flows from financing activities (569,738) (966,056)
( * ) Data restated.
“Non-controlling interests” in the accompanying consolidated statement of financial position reflects the proportionate share of the equity of Group companies in which there are non-controlling shareholders. The changes in 2017, by item, were as follows:
Thousands of
Euros
Balance at 31 December 2016 ( * ) 1,393,221
Profit for the year from continuing operations 284,791
Dividends received
(158,902)
Change in scope of consolidation (1,221)
Changes in share capital and other 59,795
Adjustments for changes in value (156,535)
Balance at 31 December 2017 1,421,149
( * ) Data restated.
The changes in 2016, by item, were as follows:
Thousands of
Euros
Balance at 31 December 2015 1,776,261
Profit for the year from continuing operations 258,360
Profit attributed to non-controlling interests 7,534
Dividends received
(131,586)
Change in scope of consolidation ( * ) (528,089)
Changes in share capital and other 605
Adjustments for changes in value 10,136
Balance at 31 December 2016 ( * ) 1,393,221
( * ) Data restated.
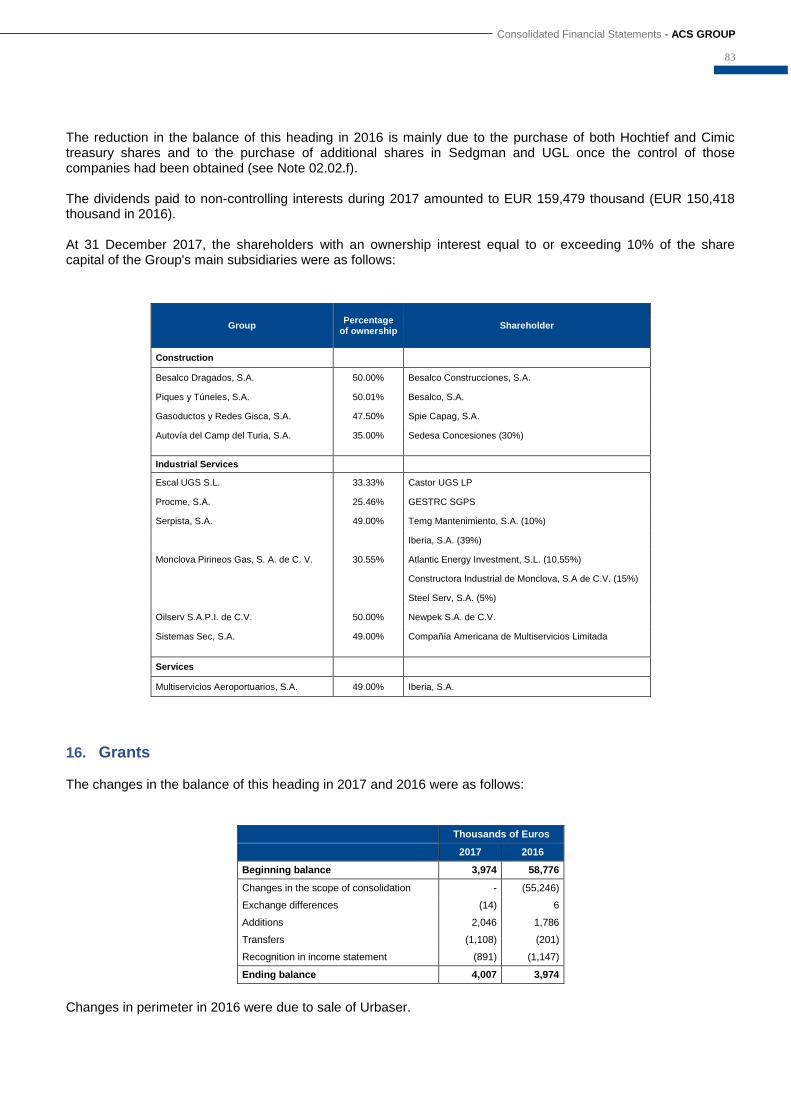
Consolidated Financial Statements - ACS GROUP
83
The reduction in the balance of this heading in 2016 is mainly due to the purchase of both Hochtief and Cimic treasury shares and to the purchase of additional shares in Sedgman and UGL once the control of those companies had been obtained (see Note 02.02.f). The dividends paid to non-controlling interests during 2017 amounted to EUR 159,479 thousand (EUR 150,418 thousand in 2016). At 31 December 2017, the shareholders with an ownership interest equal to or exceeding 10% of the share capital of the Group's main subsidiaries were as follows:
Group Percentage
of ownership Shareholder
Construction
Besalco Dragados, S.A. 50.00% Besalco Construcciones, S.A.
Piques y Túneles, S.A. 50.01% Besalco, S.A.
Gasoductos y Redes Gisca, S.A. 47.50% Spie Capag, S.A.
Autovía del Camp del Turia, S.A. 35.00% Sedesa Concesiones (30%)
Industrial Services
Escal UGS S.L. 33.33% Castor UGS LP
Procme, S.A. 25.46% GESTRC SGPS
Serpista, S.A. 49.00% Temg Mantenimiento, S.A. (10%)
Iberia, S.A. (39%)
Monclova Pirineos Gas, S. A. de C. V. 30.55% Atlantic Energy Investment, S.L. (10,55%)
Constructora Industrial de Monclova, S.A de C.V. (15%)
Steel Serv, S.A. (5%)
Oilserv S.A.P.I. de C.V. 50.00% Newpek S.A. de C.V.
Sistemas Sec, S.A. 49.00% Compañía Americana de Multiservicios Limitada
Services
Multiservicios Aeroportuarios, S.A. 49.00% Iberia, S.A.
16. Grants The changes in the balance of this heading in 2017 and 2016 were as follows:
Thousands of Euros
2017 2016
Beginning balance 3,974 58,776
Changes in the scope of consolidation - (55,246)
Exchange differences (14) 6
Additions 2,046 1,786
Transfers (1,108) (201)
Recognition in income statement (891) (1,147)
Ending balance 4,007 3,974
Changes in perimeter in 2016 were due to sale of Urbaser.
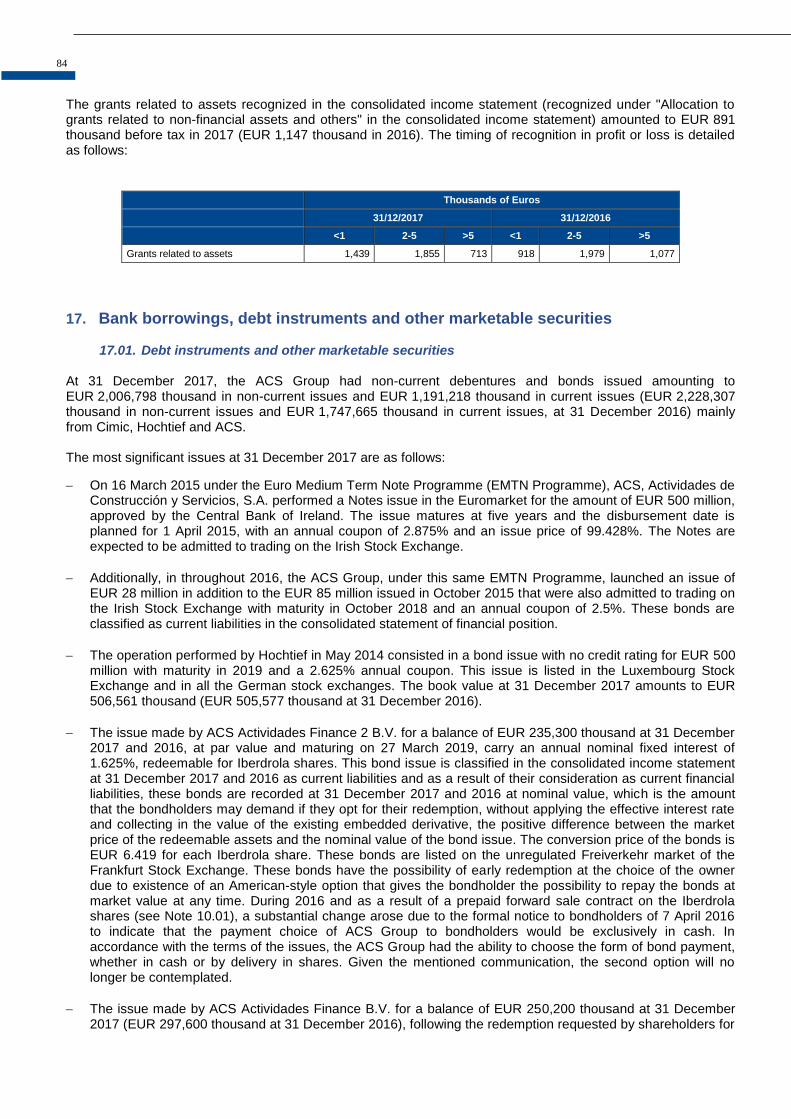
84
The grants related to assets recognized in the consolidated income statement (recognized under "Allocation to grants related to non-financial assets and others" in the consolidated income statement) amounted to EUR 891 thousand before tax in 2017 (EUR 1,147 thousand in 2016). The timing of recognition in profit or loss is detailed as follows:
Thousands of Euros
31/12/2017 31/12/2016
<1 2-5 >5 <1 2-5 >5
Grants related to assets 1,439 1,855 713 918 1,979 1,077
17. Bank borrowings, debt instruments and other marketable securities
17.01. Debt instruments and other marketable securities
At 31 December 2017, the ACS Group had non-current debentures and bonds issued amounting to EUR 2,006,798 thousand in non-current issues and EUR 1,191,218 thousand in current issues (EUR 2,228,307 thousand in non-current issues and EUR 1,747,665 thousand in current issues, at 31 December 2016) mainly from Cimic, Hochtief and ACS. The most significant issues at 31 December 2017 are as follows:
On 16 March 2015 under the Euro Medium Term Note Programme (EMTN Programme), ACS, Actividades de Construcción y Servicios, S.A. performed a Notes issue in the Euromarket for the amount of EUR 500 million, approved by the Central Bank of Ireland. The issue matures at five years and the disbursement date is planned for 1 April 2015, with an annual coupon of 2.875% and an issue price of 99.428%. The Notes are expected to be admitted to trading on the Irish Stock Exchange.
Additionally, in throughout 2016, the ACS Group, under this same EMTN Programme, launched an issue of EUR 28 million in addition to the EUR 85 million issued in October 2015 that were also admitted to trading on the Irish Stock Exchange with maturity in October 2018 and an annual coupon of 2.5%. These bonds are classified as current liabilities in the consolidated statement of financial position.
The operation performed by Hochtief in May 2014 consisted in a bond issue with no credit rating for EUR 500 million with maturity in 2019 and a 2.625% annual coupon. This issue is listed in the Luxembourg Stock Exchange and in all the German stock exchanges. The book value at 31 December 2017 amounts to EUR 506,561 thousand (EUR 505,577 thousand at 31 December 2016).
The issue made by ACS Actividades Finance 2 B.V. for a balance of EUR 235,300 thousand at 31 December 2017 and 2016, at par value and maturing on 27 March 2019, carry an annual nominal fixed interest of 1.625%, redeemable for Iberdrola shares. This bond issue is classified in the consolidated income statement at 31 December 2017 and 2016 as current liabilities and as a result of their consideration as current financial liabilities, these bonds are recorded at 31 December 2017 and 2016 at nominal value, which is the amount that the bondholders may demand if they opt for their redemption, without applying the effective interest rate and collecting in the value of the existing embedded derivative, the positive difference between the market price of the redeemable assets and the nominal value of the bond issue. The conversion price of the bonds is EUR 6.419 for each Iberdrola share. These bonds are listed on the unregulated Freiverkehr market of the Frankfurt Stock Exchange. These bonds have the possibility of early redemption at the choice of the owner due to existence of an American-style option that gives the bondholder the possibility to repay the bonds at market value at any time. During 2016 and as a result of a prepaid forward sale contract on the Iberdrola shares (see Note 10.01), a substantial change arose due to the formal notice to bondholders of 7 April 2016 to indicate that the payment choice of ACS Group to bondholders would be exclusively in cash. In accordance with the terms of the issues, the ACS Group had the ability to choose the form of bond payment, whether in cash or by delivery in shares. Given the mentioned communication, the second option will no longer be contemplated.
The issue made by ACS Actividades Finance B.V. for a balance of EUR 250,200 thousand at 31 December 2017 (EUR 297,600 thousand at 31 December 2016), following the redemption requested by shareholders for

Consolidated Financial Statements - ACS GROUP
85
a nominal amount of EUR 47,400 thousand at par value maturing on 22 October 2018, carry an annual nominal fixed interest of 2.625%, redeemable for Iberdrola shares. This bond issue is classified in the consolidated statement of financial position at 31 December 2017 and 2016 as current liabilities and as a result of their consideration as current financial liabilities, these bonds are recorded at 31 December 2017 and 2016 at nominal value, which is the amount that the bondholders may demand if they opt for their redemption, without applying the effective interest rate and collecting in the value of the existing embedded derivative, the positive difference between the market price of the redeemable assets and the nominal value of the bond issue. The conversion price of the bonds is EUR 5.7688 for each Iberdrola share. These bonds are listed on the unregulated Freiverkehr market of the Frankfurt Stock Exchange. These bonds have the possibility of early redemption at the choice of the owner due to existence of an American-style option that gives the bondholder the possibility to repay the bonds at market value at any time. During 2016 and as a result of a prepaid forward sale contract on the Iberdrola shares (see Note 10.01), a substantial change arose due to the formal notice to bondholders of 7 April 2016 to indicate that the payment choice of ACS Group to bondholders would be exclusively in cash. In accordance with the terms of the issues, the ACS Group had the ability to choose the form of bond payment, whether in cash or by delivery in shares. Given the mentioned communication, the second option will no longer be contemplated. After financial close 2017, bonds from this issue were also retired in the amount of EUR 39,400 thousand.
Corporate bond issue launched by Hochtief, A.G. on 14 March 2013 for a nominal amount of EUR 750 million maturing in March 2020, with an annual coupon of 3.875% and a book value at 31 December 2017 of EUR 769,914 thousand (EUR 768,566 thousand at 31 December 2016).
During 2017, ACS, Actividades de Construcción y Servicios, S.A. renewed the Euro Commercial Paper (ECP) program for a maximum amount of EUR 750 million, which was registered in the Irish Stock Exchange. Santander Global Banking & Markets is the arranger of program implementation, an entity that also acts as designated broker (dealer). Through this program, ACS may issue Notes maturing between 1 and 364 days, thus enabling the diversification of financing channels in the capital market. At 31 December 2017, the issues outstanding under the aforementioned programs amounted to EUR 415,495 thousand (EUR 427,954 thousand at 31 December 2016).
In addition, the use of the authorization granted at the Annual General Meeting held on 29th May 2014 and the implementation of the agreement of its Board of Directors on 28 July 2017, ACS, Actividades de Construcción y Servicios, S.A. has formalized a Negotiable European Commercial Paper (NEU CP) program for a maximum amount of EUR 300 million, with a maximum issue period of 365 days, under Bank of France regulation (pursuant to Article D.213-2 of the French Monetary and Financial Code) and a market price in the Luxembourg Stock Exchange. At 31 December 2017, the issues outstanding under the aforementioned program amounted to EUR 68,000 thousand.
The issue by Cimic of ten-year guaranteed bonds for a nominal amount of USD 500 million (maturity in November 2022) at a fixed annual rate of 5.95% and a carrying amount of EUR 168,169 thousand (191,543 thousand at 31 December 2016).
In 2010, Cimic issued a bond of USD 350 million with a current equivalent value of EUR 96,075 thousand (EUR 247,404 thousand at 31 December 2016). Of this bond, only the tranche which matures in 2020 with an interest rate of 5.78% remains, as the tranche which amounted to EUR 137,975 thousand matured in 2017.
In 2008, Cimic Group Limited issued USD 280 million through a private placement. The tranche pending maturity is due in 2018, with an interest rate of 7.66%. The carrying amount of this private placement at 31 December 2017 amounted to EUR 65,999 thousand (EUR 75,173 thousand at 31 December 2016).
During the year, the corporate bond issued in March 2012 by Hochtief, A.G. for a nominal amount of EUR 500 million and with an annual coupon of 5.5% matured.
The detail, by maturity, of these debentures and bonds at 31 December 2017 is as follows:
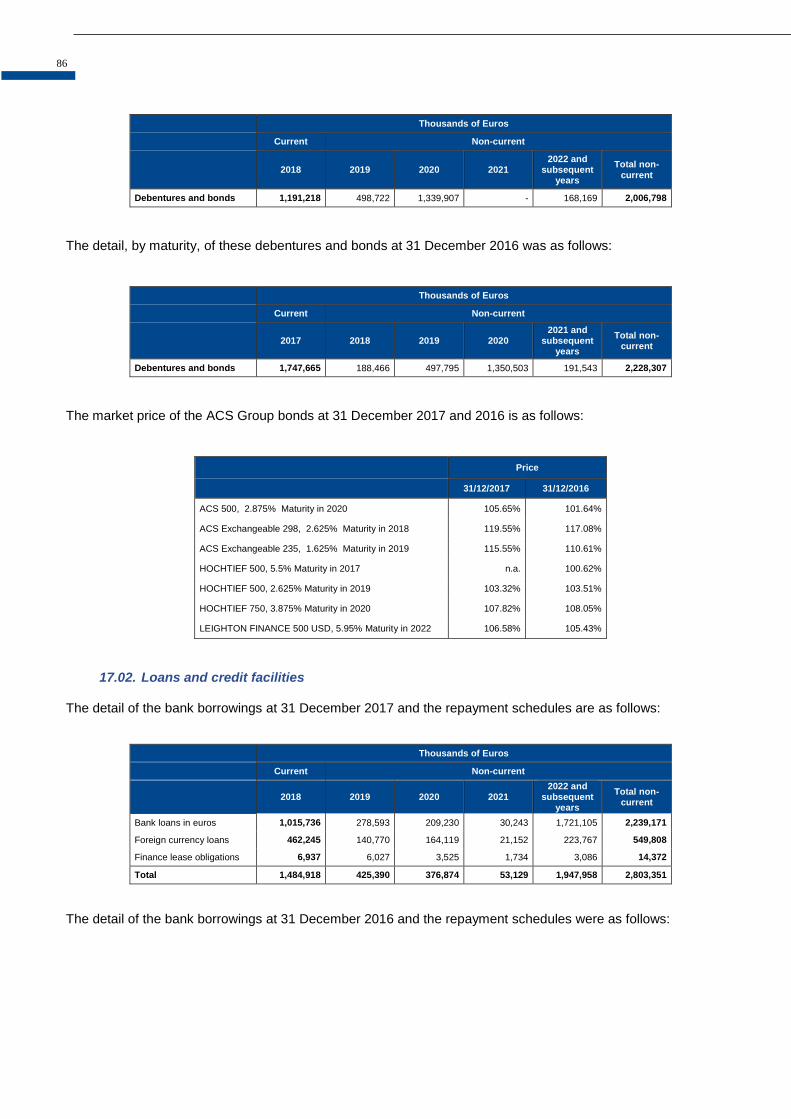
86
Thousands of Euros
Current Non-current
2018 2019 2020 2021 2022 and
subsequent years
Total non-current
Debentures and bonds 1,191,218 498,722 1,339,907 - 168,169 2,006,798
The detail, by maturity, of these debentures and bonds at 31 December 2016 was as follows:
Thousands of Euros
Current Non-current
2017 2018 2019 2020 2021 and
subsequent years
Total non-current
Debentures and bonds 1,747,665 188,466 497,795 1,350,503 191,543 2,228,307
The market price of the ACS Group bonds at 31 December 2017 and 2016 is as follows:
Price
31/12/2017 31/12/2016
ACS 500, 2.875% Maturity in 2020 105.65% 101.64%
ACS Exchangeable 298, 2.625% Maturity in 2018 119.55% 117.08%
ACS Exchangeable 235, 1.625% Maturity in 2019 115.55% 110.61%
HOCHTIEF 500, 5.5% Maturity in 2017 n.a. 100.62%
HOCHTIEF 500, 2.625% Maturity in 2019 103.32% 103.51%
HOCHTIEF 750, 3.875% Maturity in 2020 107.82% 108.05%
LEIGHTON FINANCE 500 USD, 5.95% Maturity in 2022 106.58% 105.43%
17.02. Loans and credit facilities
The detail of the bank borrowings at 31 December 2017 and the repayment schedules are as follows:
Thousands of Euros
Current Non-current
2018 2019 2020 2021 2022 and
subsequent years
Total non-current
Bank loans in euros 1,015,736 278,593 209,230 30,243 1,721,105 2,239,171
Foreign currency loans 462,245 140,770 164,119 21,152 223,767 549,808
Finance lease obligations 6,937 6,027 3,525 1,734 3,086 14,372
Total 1,484,918 425,390 376,874 53,129 1,947,958 2,803,351
The detail of the bank borrowings at 31 December 2016 and the repayment schedules were as follows:
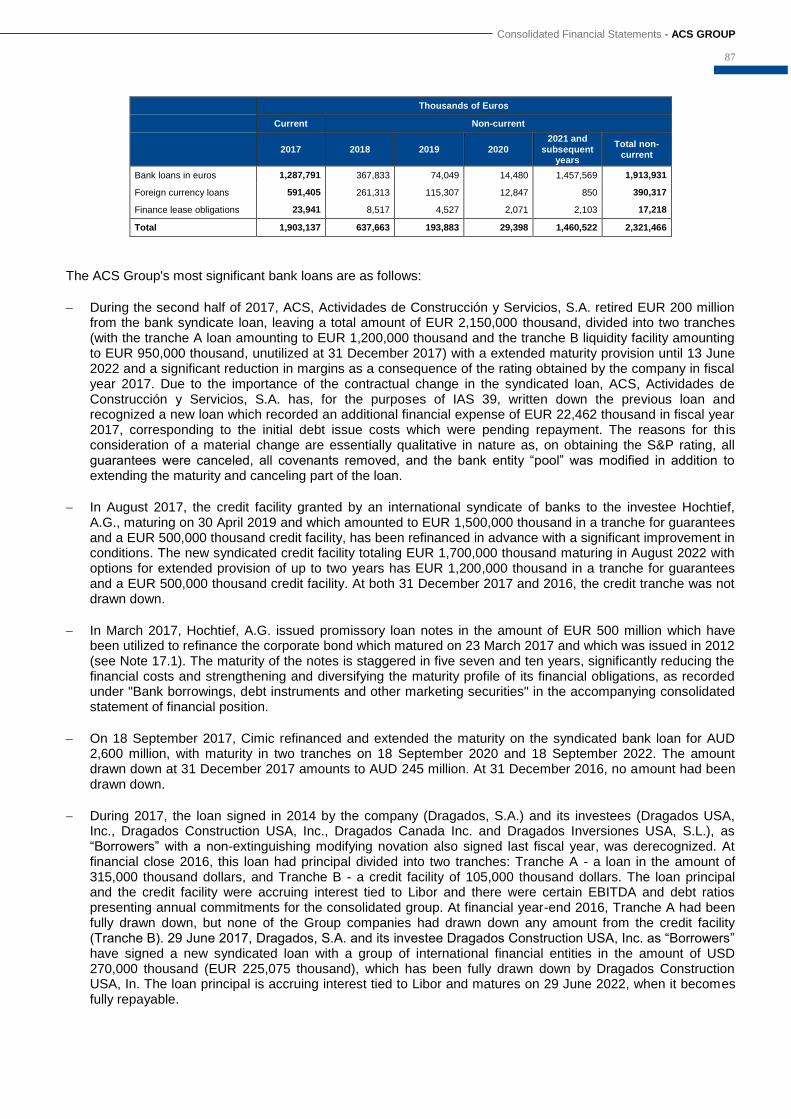
Consolidated Financial Statements - ACS GROUP
87
Thousands of Euros
Current Non-current
2017 2018 2019 2020 2021 and
subsequent years
Total non-current
Bank loans in euros 1,287,791 367,833 74,049 14,480 1,457,569 1,913,931
Foreign currency loans 591,405 261,313 115,307 12,847 850 390,317
Finance lease obligations 23,941 8,517 4,527 2,071 2,103 17,218
Total 1,903,137 637,663 193,883 29,398 1,460,522 2,321,466
The ACS Group's most significant bank loans are as follows:
During the second half of 2017, ACS, Actividades de Construcción y Servicios, S.A. retired EUR 200 million from the bank syndicate loan, leaving a total amount of EUR 2,150,000 thousand, divided into two tranches (with the tranche A loan amounting to EUR 1,200,000 thousand and the tranche B liquidity facility amounting to EUR 950,000 thousand, unutilized at 31 December 2017) with a extended maturity provision until 13 June 2022 and a significant reduction in margins as a consequence of the rating obtained by the company in fiscal year 2017. Due to the importance of the contractual change in the syndicated loan, ACS, Actividades de Construcción y Servicios, S.A. has, for the purposes of IAS 39, written down the previous loan and recognized a new loan which recorded an additional financial expense of EUR 22,462 thousand in fiscal year 2017, corresponding to the initial debt issue costs which were pending repayment. The reasons for this consideration of a material change are essentially qualitative in nature as, on obtaining the S&P rating, all guarantees were canceled, all covenants removed, and the bank entity “pool” was modified in addition to extending the maturity and canceling part of the loan.
In August 2017, the credit facility granted by an international syndicate of banks to the investee Hochtief, A.G., maturing on 30 April 2019 and which amounted to EUR 1,500,000 thousand in a tranche for guarantees and a EUR 500,000 thousand credit facility, has been refinanced in advance with a significant improvement in conditions. The new syndicated credit facility totaling EUR 1,700,000 thousand maturing in August 2022 with options for extended provision of up to two years has EUR 1,200,000 thousand in a tranche for guarantees and a EUR 500,000 thousand credit facility. At both 31 December 2017 and 2016, the credit tranche was not drawn down.
In March 2017, Hochtief, A.G. issued promissory loan notes in the amount of EUR 500 million which have been utilized to refinance the corporate bond which matured on 23 March 2017 and which was issued in 2012 (see Note 17.1). The maturity of the notes is staggered in five seven and ten years, significantly reducing the financial costs and strengthening and diversifying the maturity profile of its financial obligations, as recorded under "Bank borrowings, debt instruments and other marketing securities" in the accompanying consolidated statement of financial position.
On 18 September 2017, Cimic refinanced and extended the maturity on the syndicated bank loan for AUD 2,600 million, with maturity in two tranches on 18 September 2020 and 18 September 2022. The amount drawn down at 31 December 2017 amounts to AUD 245 million. At 31 December 2016, no amount had been drawn down.
During 2017, the loan signed in 2014 by the company (Dragados, S.A.) and its investees (Dragados USA, Inc., Dragados Construction USA, Inc., Dragados Canada Inc. and Dragados Inversiones USA, S.L.), as “Borrowers” with a non-extinguishing modifying novation also signed last fiscal year, was derecognized. At financial close 2016, this loan had principal divided into two tranches: Tranche A - a loan in the amount of 315,000 thousand dollars, and Tranche B - a credit facility of 105,000 thousand dollars. The loan principal and the credit facility were accruing interest tied to Libor and there were certain EBITDA and debt ratios presenting annual commitments for the consolidated group. At financial year-end 2016, Tranche A had been fully drawn down, but none of the Group companies had drawn down any amount from the credit facility (Tranche B). 29 June 2017, Dragados, S.A. and its investee Dragados Construction USA, Inc. as “Borrowers” have signed a new syndicated loan with a group of international financial entities in the amount of USD 270,000 thousand (EUR 225,075 thousand), which has been fully drawn down by Dragados Construction USA, In. The loan principal is accruing interest tied to Libor and matures on 29 June 2022, when it becomes fully repayable.
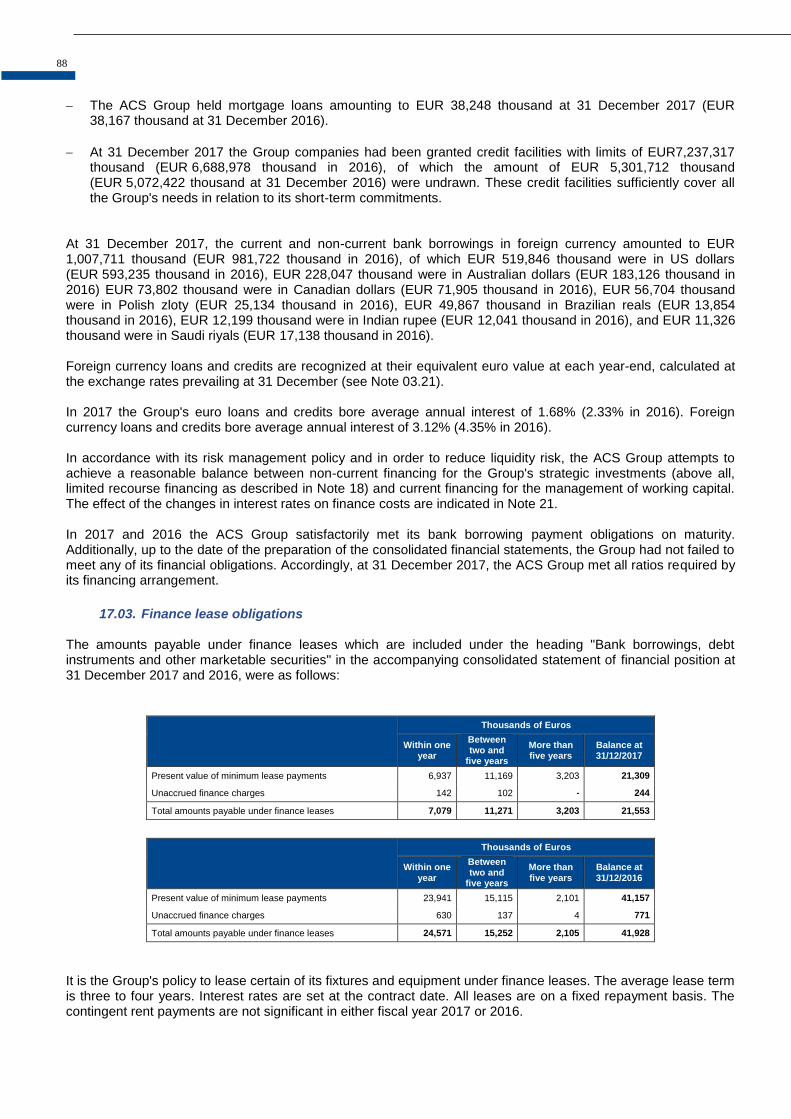
88
The ACS Group held mortgage loans amounting to EUR 38,248 thousand at 31 December 2017 (EUR 38,167 thousand at 31 December 2016).
At 31 December 2017 the Group companies had been granted credit facilities with limits of EUR7,237,317 thousand (EUR 6,688,978 thousand in 2016), of which the amount of EUR 5,301,712 thousand (EUR 5,072,422 thousand at 31 December 2016) were undrawn. These credit facilities sufficiently cover all the Group's needs in relation to its short-term commitments.
At 31 December 2017, the current and non-current bank borrowings in foreign currency amounted to EUR 1,007,711 thousand (EUR 981,722 thousand in 2016), of which EUR 519,846 thousand were in US dollars (EUR 593,235 thousand in 2016), EUR 228,047 thousand were in Australian dollars (EUR 183,126 thousand in 2016) EUR 73,802 thousand were in Canadian dollars (EUR 71,905 thousand in 2016), EUR 56,704 thousand were in Polish zloty (EUR 25,134 thousand in 2016), EUR 49,867 thousand in Brazilian reals (EUR 13,854 thousand in 2016), EUR 12,199 thousand were in Indian rupee (EUR 12,041 thousand in 2016), and EUR 11,326 thousand were in Saudi riyals (EUR 17,138 thousand in 2016). Foreign currency loans and credits are recognized at their equivalent euro value at each year-end, calculated at the exchange rates prevailing at 31 December (see Note 03.21). In 2017 the Group's euro loans and credits bore average annual interest of 1.68% (2.33% in 2016). Foreign currency loans and credits bore average annual interest of 3.12% (4.35% in 2016). In accordance with its risk management policy and in order to reduce liquidity risk, the ACS Group attempts to achieve a reasonable balance between non-current financing for the Group's strategic investments (above all, limited recourse financing as described in Note 18) and current financing for the management of working capital. The effect of the changes in interest rates on finance costs are indicated in Note 21. In 2017 and 2016 the ACS Group satisfactorily met its bank borrowing payment obligations on maturity. Additionally, up to the date of the preparation of the consolidated financial statements, the Group had not failed to meet any of its financial obligations. Accordingly, at 31 December 2017, the ACS Group met all ratios required by its financing arrangement.
17.03. Finance lease obligations
The amounts payable under finance leases which are included under the heading "Bank borrowings, debt instruments and other marketable securities" in the accompanying consolidated statement of financial position at 31 December 2017 and 2016, were as follows:
Thousands of Euros
Within one year
Between two and
five years
More than five years
Balance at 31/12/2017
Present value of minimum lease payments 6,937 11,169 3,203 21,309
Unaccrued finance charges 142 102 - 244
Total amounts payable under finance leases 7,079 11,271 3,203 21,553
Thousands of Euros
Within one year
Between two and
five years
More than five years
Balance at 31/12/2016
Present value of minimum lease payments 23,941 15,115 2,101 41,157
Unaccrued finance charges 630 137 4 771
Total amounts payable under finance leases 24,571 15,252 2,105 41,928
It is the Group's policy to lease certain of its fixtures and equipment under finance leases. The average lease term is three to four years. Interest rates are set at the contract date. All leases are on a fixed repayment basis. The contingent rent payments are not significant in either fiscal year 2017 or 2016.
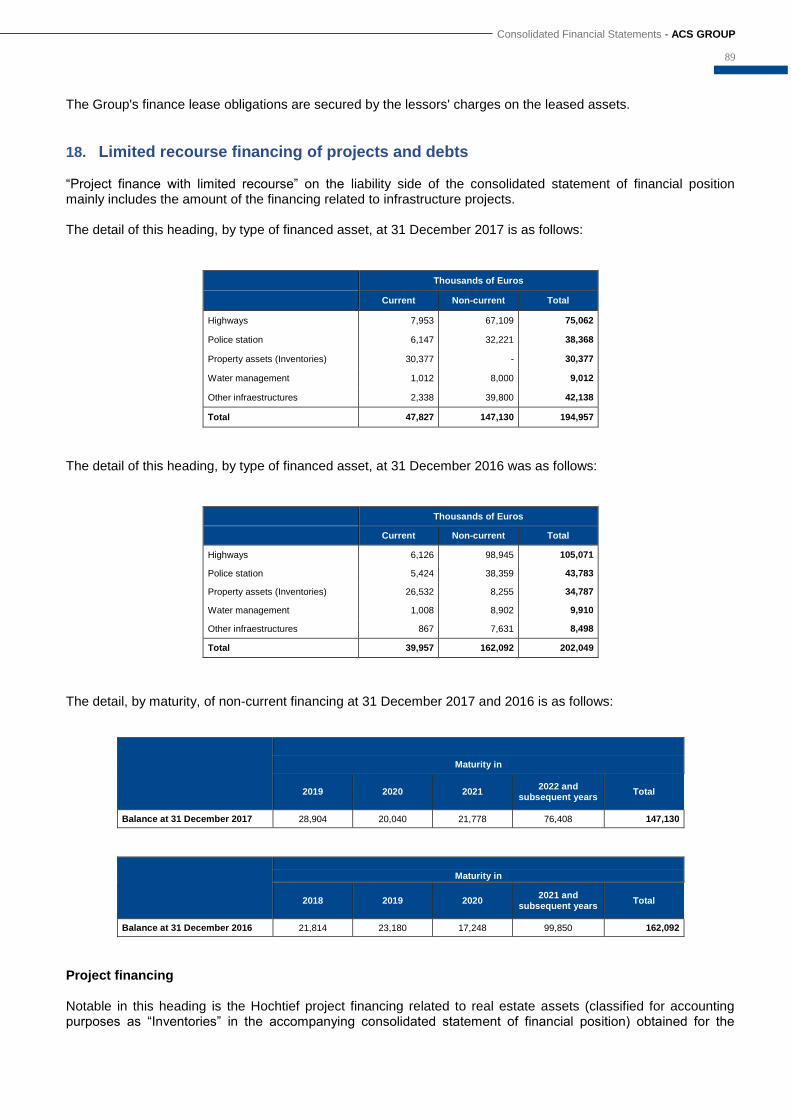
Consolidated Financial Statements - ACS GROUP
89
The Group's finance lease obligations are secured by the lessors' charges on the leased assets.
18. Limited recourse financing of projects and debts “Project finance with limited recourse” on the liability side of the consolidated statement of financial position mainly includes the amount of the financing related to infrastructure projects. The detail of this heading, by type of financed asset, at 31 December 2017 is as follows:
Thousands of Euros
Current Non-current Total
Highways 7,953 67,109 75,062
Police station 6,147 32,221 38,368
Property assets (Inventories) 30,377 - 30,377
Water management 1,012 8,000 9,012
Other infraestructures 2,338 39,800 42,138
Total 47,827 147,130 194,957
The detail of this heading, by type of financed asset, at 31 December 2016 was as follows:
Thousands of Euros
Current Non-current Total
Highways 6,126 98,945 105,071
Police station 5,424 38,359 43,783
Property assets (Inventories) 26,532 8,255 34,787
Water management 1,008 8,902 9,910
Other infraestructures 867 7,631 8,498
Total 39,957 162,092 202,049
The detail, by maturity, of non-current financing at 31 December 2017 and 2016 is as follows:
Maturity in
2019 2020 2021 2022 and
subsequent years Total
Balance at 31 December 2017 28,904 20,040 21,778 76,408 147,130
Maturity in
2018 2019 2020 2021 and
subsequent years Total
Balance at 31 December 2016 21,814 23,180 17,248 99,850 162,092
Project financing Notable in this heading is the Hochtief project financing related to real estate assets (classified for accounting purposes as “Inventories” in the accompanying consolidated statement of financial position) obtained for the

90
development of real estate assets, both of Hochtief, A.G. and Cimic. At 31 December 2017, this financing maintains collaterals by Hochtief, A.G. for the amount of EUR 30,377 thousand (EUR 34,787 thousand at 31 December 2016), with a maturity of less than one year, with no amounts of capital and subordinated debt pending disbursement on said date, nor at 31 December 2017, and no contingent contributions at that date, nor at 31 December 2017. The Group has arranged various interest rate hedges in connection with the aforementioned financing (see Note 22). The average interest rate for this type of project financing amounted to an annual 4.20% in 2017 and 4.37% in 2016. The debts relating to limited recourse financing are secured by non-current assets in projects and include clauses requiring that certain ratios be complied with by the project and which were being met in all cases at 31 December 2017. With the exception of that specifically mentioned in the foregoing paragraphs in connection to each of the most relevant financings, at 31 December 2017 there were no guarantees given as collateral (EUR 550 thousand at 31 December 2016). In 2017 and 2016 the ACS Group satisfactorily settled all its project financing debts with limited recourse on maturity. Additionally, up to the date of the preparation of the consolidated financial statements, the Group had complied with all its financial obligations.
19. Other financial liabilities The breakdown of the balances of this heading in the consolidated statements of financial position at 31 December 2017 and 2016 is as follows:
Thousands of Euros
Balance at 31/12/2017 Balance at 31/12/2016
Non-current Current Non-current Current
Non-bank borrowings at a reduced interest rate 47,685 8,291 39,332 9,475
Payable to associates 28,127 19,226 15,805 4,406
Other 127,580 127,632 139,842 77,639
Total 203,392 155,149 194,979 91,520
The amount corresponding to “Other financial liabilities” includes, essentially, the financing obtained from public bodies in various countries to carry out certain infrastructure projects. The "Non-bank borrowings at a reduced interest rate" are loans at reduced or zero interest rates granted by the Ministry of Economy, Industry and Competition and dependent agencies. The effect of the financing at market interest rates would not be material.
20. Provisions The changes in non-current provisions in 2017 have been as follows:

Consolidated Financial Statements - ACS GROUP
91
NON-CURRENT
Thousands of Euros
Provision for pensions and
similar obligations
Provision for taxes
Provision for third-party
liability
Provisions for actions on
infrastructure Total
Balance at 31 December 2016 600,473 186,239 831,807 36,567 1,655,086
Additions or charges for the year 30,881 3,779 130,530 1,770 166,960
Reversals (38,680) (734) (42,026) - (81,440)
Amounts used (145) (29,675) (44,449) - (74,269)
Effect of exchange rates on discount rates and increases due to time lapses
(52,282) - 67 - (52,215)
Exchange differences (24,731) - (34,211) - (58,942)
Changes in the scope of consolidation - - (25,276) - (25,276)
Transfers (386) (17,872) 76,663 (21,200) 37,205
Balance at 31 December 2017 515,130 141,737 893,105 17,137 1,567,109
The Group companies recognize provisions on the liability side of the accompanying consolidated statement of financial position for present obligations arising from past events which the companies consider will probably require an outflow of resources embodying economic benefits to settle them on maturity. These provisions are recognized when the related obligation arises and the amount recognized is the best estimate at the date of the accompanying consolidated financial statements of the present value of the future expenditure required to settle the obligation. The change in the year relating to the discount to present value is recognized as interest cost in the consolidated income statement. Following is detailed information on the Group's provisions, distributed into three large groups: Provision for pensions and similar obligations On the one hand, defined benefit pension commitments were entered into by companies included in the group as a result of the merger by absorption of Dragados Group in 2003. These commitments were externalized through collective life insurance contracts, in which investments have been allocated whose flows coincide in time and amounts with the amounts and payment timetable of the insured benefits. Based on the valuation made, the amounts required to meet the commitments to current and retired employees amounted at 31 December 2017 to EUR 6,864 thousand (EUR 6,665 thousand in 2016) and EUR 161,702 thousand (EUR 176,058 thousand in 2016), respectively. The actuarial assumptions used in 2017 and 2016 valuations detailed above, are as follows:
Annual rate of increase of maximum social security pension deficit 2.00%
Annual wage increase 2.35%
Annual CPI growth rate 2.00%
Mortality table (*) PERM/F-2000 P
(*) Guaranteed assumptions which will not vary
The interest rates applied since the pension obligations were externalized ranged from a maximum of 5.93% to a minimum 1.09%. The interest rate applied was 1.09% in 2017 and 1.14% in 2016. The aforementioned amounts relating to pension obligations recognized under "Staff costs" in the consolidated income statement for 2017, gave rise to expenditure of EUR 64 thousand in 2017 (EUR 283 thousand of income in 2016). Additionally, ACS, Actividades de Construcción y Servicios, S.A. and other Group companies have alternative pension system obligations to certain members of the management team and Board of Directors of the Parent. These obligations have been formalized through several group savings insurance policies which provide benefits in the form of a lump sum, which represented a contribution in 2017 of EUR 3,899 thousand and was recognized under "Staff costs" in the consolidated income statement. In 2016, the contribution in this connection amounted to EUR 3,723 thousand. The portion relating to the Parent's directors who performed executive duties in 2017 amounted to EUR 1,904 thousand (EUR 1,673 thousand in 2016) (see Note 34).
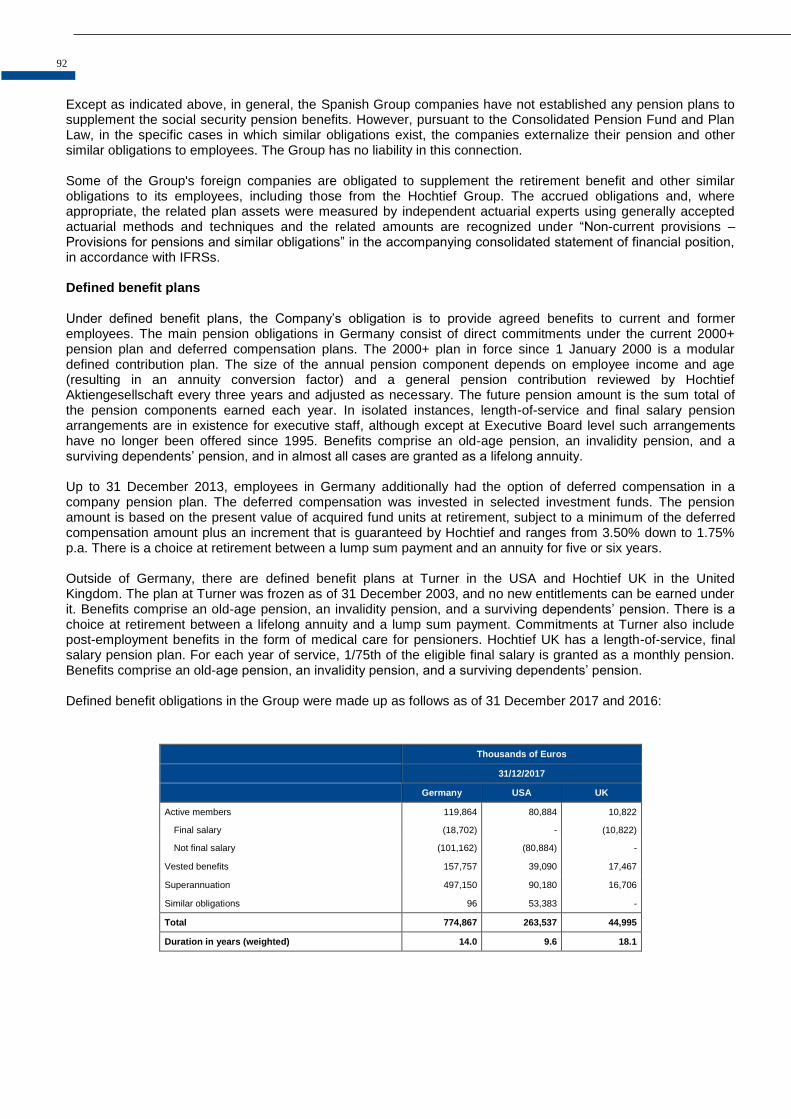
92
Except as indicated above, in general, the Spanish Group companies have not established any pension plans to supplement the social security pension benefits. However, pursuant to the Consolidated Pension Fund and Plan Law, in the specific cases in which similar obligations exist, the companies externalize their pension and other similar obligations to employees. The Group has no liability in this connection. Some of the Group's foreign companies are obligated to supplement the retirement benefit and other similar obligations to its employees, including those from the Hochtief Group. The accrued obligations and, where appropriate, the related plan assets were measured by independent actuarial experts using generally accepted actuarial methods and techniques and the related amounts are recognized under “Non-current provisions – Provisions for pensions and similar obligations” in the accompanying consolidated statement of financial position, in accordance with IFRSs. Defined benefit plans Under defined benefit plans, the Company’s obligation is to provide agreed benefits to current and former employees. The main pension obligations in Germany consist of direct commitments under the current 2000+ pension plan and deferred compensation plans. The 2000+ plan in force since 1 January 2000 is a modular defined contribution plan. The size of the annual pension component depends on employee income and age (resulting in an annuity conversion factor) and a general pension contribution reviewed by Hochtief Aktiengesellschaft every three years and adjusted as necessary. The future pension amount is the sum total of the pension components earned each year. In isolated instances, length-of-service and final salary pension arrangements are in existence for executive staff, although except at Executive Board level such arrangements have no longer been offered since 1995. Benefits comprise an old-age pension, an invalidity pension, and a surviving dependents’ pension, and in almost all cases are granted as a lifelong annuity. Up to 31 December 2013, employees in Germany additionally had the option of deferred compensation in a company pension plan. The deferred compensation was invested in selected investment funds. The pension amount is based on the present value of acquired fund units at retirement, subject to a minimum of the deferred compensation amount plus an increment that is guaranteed by Hochtief and ranges from 3.50% down to 1.75% p.a. There is a choice at retirement between a lump sum payment and an annuity for five or six years. Outside of Germany, there are defined benefit plans at Turner in the USA and Hochtief UK in the United Kingdom. The plan at Turner was frozen as of 31 December 2003, and no new entitlements can be earned under it. Benefits comprise an old-age pension, an invalidity pension, and a surviving dependents’ pension. There is a choice at retirement between a lifelong annuity and a lump sum payment. Commitments at Turner also include post-employment benefits in the form of medical care for pensioners. Hochtief UK has a length-of-service, final salary pension plan. For each year of service, 1/75th of the eligible final salary is granted as a monthly pension. Benefits comprise an old-age pension, an invalidity pension, and a surviving dependents’ pension. Defined benefit obligations in the Group were made up as follows as of 31 December 2017 and 2016:
Thousands of Euros
31/12/2017
Germany USA UK
Active members 119,864 80,884 10,822
Final salary (18,702) - (10,822)
Not final salary (101,162) (80,884) -
Vested benefits 157,757 39,090 17,467
Superannuation 497,150 90,180 16,706
Similar obligations 96 53,383 -
Total 774,867 263,537 44,995
Duration in years (weighted) 14.0 9.6 18.1

Consolidated Financial Statements - ACS GROUP
93
Thousands of Euros
31/12/2016
Germany USA UK
Active members 128,813 94,097 15,249
Final salary (17,861) - (15,249)
Not final salary (110,952) (94,097) -
Vested benefits 184,463 44,877 19,177
Superannuation 505,168 109,053 14,849
Similar obligations 95 60,470 -
Total 818,539 308,497 49,275
Duration in years (weighted) 14.6 8.7 19.0
Plan assets Germany There are no statutory or regulatory minimum funding requirements for pension plans in Germany. Domestic pension obligations are entirely funded. The funded plans take the form of a contractual trust arrangement (CTA). Since 1 January 2015 the transferred assets have been administered in trust by an external trustee and serve exclusively to finance pension obligations in Germany. The transferred cash is invested in the capital market in accordance with investment principles set out in the trust agreement. The investment decisions are not taken by the trustee, but by an investment committee. The investment guidelines and decisions are based on the findings of an asset liability matching (ALM) study compiled by outside specialists at regular intervals of three to five years. This uses Monte Carlo simulation to model the development of the pension liabilities and other key economic factors over a very long forward horizon and in numerous combinations. Based on the ALM study, a range of criteria are then applied to determine the optimum asset allocation in order to ensure that pension liabilities can be met in the long term. To assure an optimum conservative risk structure, we have also established risk overlay management using the services of an external overlay manager who is given a fixed risk budget and works fully autonomously in a clearly structured risk overlay management process. Hochtief aims to ensure full funding of pension obligations and to fund new vested benefits on the basis of current service cost annually or at least on a timely basis. The companies pay in additional amounts from time to time in the event of any shortfall. Pension commitments in Germany in excess of the contribution assessment ceiling applied in the statutory pension insurance scheme are additionally covered using pension liability insurance. Pension liabilities from deferred employee compensation offered at 31 December 2013 were funded by the purchase of retail fund units. Funding of the obligations served by Hochtief Pension Trust e.V. as of 31 December 2017 amounts to about 56% (55% in 2016); the figure for Germany as a whole is about 62% (60% in 2016). It should be noted in this connection that the size of pension obligations has increased significantly in recent years due to the low level of market interest rates and that the funding ratio will go up again when interest rates recover. USA The frozen defined benefit obligations in the Turner Group are likewise managed in a pension fund. Plan assets are administered in trust by BNY Mellon and serve exclusively to fund the plan. Investment decisions are not made by the trust but by a special committee. The investment of plan assets is based on a regularly compiled ALM study. The investment objectives are to maximize the funding ratio and reduce volatility in the funding ratio. By fully capitalizing pension obligations, high-risk investments in equities will be reduced to prioritize fixed-interest bonds. These ideally perform in line with plan liabilities, thus ensuring full funding. There is no statutory minimum funding requirement, but low funding levels result in higher contributions to the Pension Benefit Guarantee Corporation, hence maximum funding is aimed for. The funding of obligations covered by plan assets at Turner as of 31 December 2017 is about 100% (86% in 2016); funding at Turner overall is about 79% (69% in 2016). United Kingdom Funding of plan assets at Hochtief UK is likewise on a trust basis. Statutory minimum funding requirements apply. If funding is insufficient to make up a funding shortfall, an additional restructuring plan is drawn up. Plan funding is

94
reviewed at least once every three years. Funding of pension obligations at Hochtief (UK) is about 74% (69% in 2016). Defined benefit obligations are covered by plan assets as follows: Coverage of defined benefit obligations by plan assets
Thousands of Euros
31/12/2017 31/12/2016
Defined benefit obligations
Plan assets Defined benefit
obligations Plan assets
Uncovered by plan assets 54,552 - 61,858 -
Partially covered by plan assets 961,696 648,497 1,046,057 667,669
Incompletely covered by plan assets 1,016,248 648,497 1,107,915 667,669
Fully covered by plan assets 67,151 72,615 68,396 70,971
Total 1,083,399 721,112 1,176,311 738,640
Actuarial assumptions The size of pension provisions is determined on an actuarial basis. This necessarily involves estimates. Specifically, the actuarial assumptions used in 2017 and 2016 are as follows:
Percent
2017 2016
Germany USA UK Germany USA UK
Discount factor* 2.00 3.68 2.55 1.75 4.04 2.65
Salary increases 2.75 - 2.00 2.75 - 2.30
Pension increases* 1.75 - 3.27 1.75 - 3.53
Health cost increases - 5.00 - - 5.00 -
* Weighted average
The discount factors are derived from the Mercer Pension Discount Yield Curve (MPDYC) model, taking into account the company-specific duration of pension liabilities. Salary and pension increases ceased to be taken into account in the USA (Turner Group) in 2004 due to the changeover in pension arrangements. Biometric mortality assumptions are based on published country-specific statistics and experience. To carry out the actuarial calculation of pension obligations, the following mortality tables were used:
Germany Heubeck 2005G mortality tables
USA RP 2014 mortality table projected generationally with MP2017 RP 2017 mortality table projected generationally with MP2017 (Healthcare costs)
UK S2PxA CMI_2016 (1.25%) year of birth
Changes in the present value of defined benefit obligations and of the market value of plan assets are as follows:

Consolidated Financial Statements - ACS GROUP
95
Changes in the present value of defined benefit obligations
Thousands of Euros
2017 2016
Germany International Total Germany International Total
Defined benefit obligations at start of year 818,539 357,772 1,176,311 759,459 339,509 1,098,968
Current service costs 7,928 2,004 9,932 5,943 1,764 7,707
Past service cost (1,504) - (1,504) - - -
Interest expense 13,991 12,432 26,423 18,495 13,265 31,760
Remeasurements
Actuarial gains / (losses) arising from changes in demographic assumptions
- (15,098) (15,098) - 3,537 3,537
Actuarial gains / (losses) arising from changes in financial assumptions
(27,979) 9,771 (18,208) 81,203 14,565 95,768
Actuarial gains / (losses) arising from experience adjustments
1,320 (801) 519 (8,060) 1,326 (6,734)
Benefits paid from Company assets (330) (2,879) (3,209) (442) (3,264) (3,706)
Benefits paid from fund assets (37,040) (16,176) (53,216) (38,004) (16,055) (54,059)
Employee contributions - 132 132 - 162 162
Effect of transfers (58) - (58) (55) - (55)
Currency adjustments - (38,625) (38,625) - 2,963 2,963
Defined benefit obligations at end of year 774,867 308,532 1,083,399 818,539 357,772 1,176,311
Changes in the market value of plan assets
Thousands of Euros
2017 2016
Germany International Total Germany International Total
Plan assets at start of year 491,451 247,189 738,640 506,877 244,857 751,734
Interest on plan assets 8,560 8,279 16,839 12,618 9,290 21,908
Plan expenses paid from plan assets recognized in profit or loss
- (1,499) (1,499) - (1,369) (1,369)
Remeasurements
Return on plan assets no included in net interest expense / income
7,713 22,784 30,497 4,521 8,240 12,761
Difference between plan expenses expected and recognized in profit or loss
- (1) (1) - (176) (176)
Employer contributions 8,441 9,461 17,902 5,439 835 6,274
Employee contributions - 132 132 - 162 162
Benefits paid (37,040) (16,176) (53,216) (38,004) (16,055) (54,059)
Currency adjustments - (28,182) (28,182) - 1,405 1,405
Plan assets at end of year 479,125 241,987 721,112 491,451 247,189 738,640
Investing plan assets to cover future pension obligations generated actual returns of EUR 47,336 thousand in 2017 (charge of EUR 34,669 thousand in 2016). The pension provisions are determined as follows. Reconciliation of pension obligations to provisions for pensions and similar obligations:
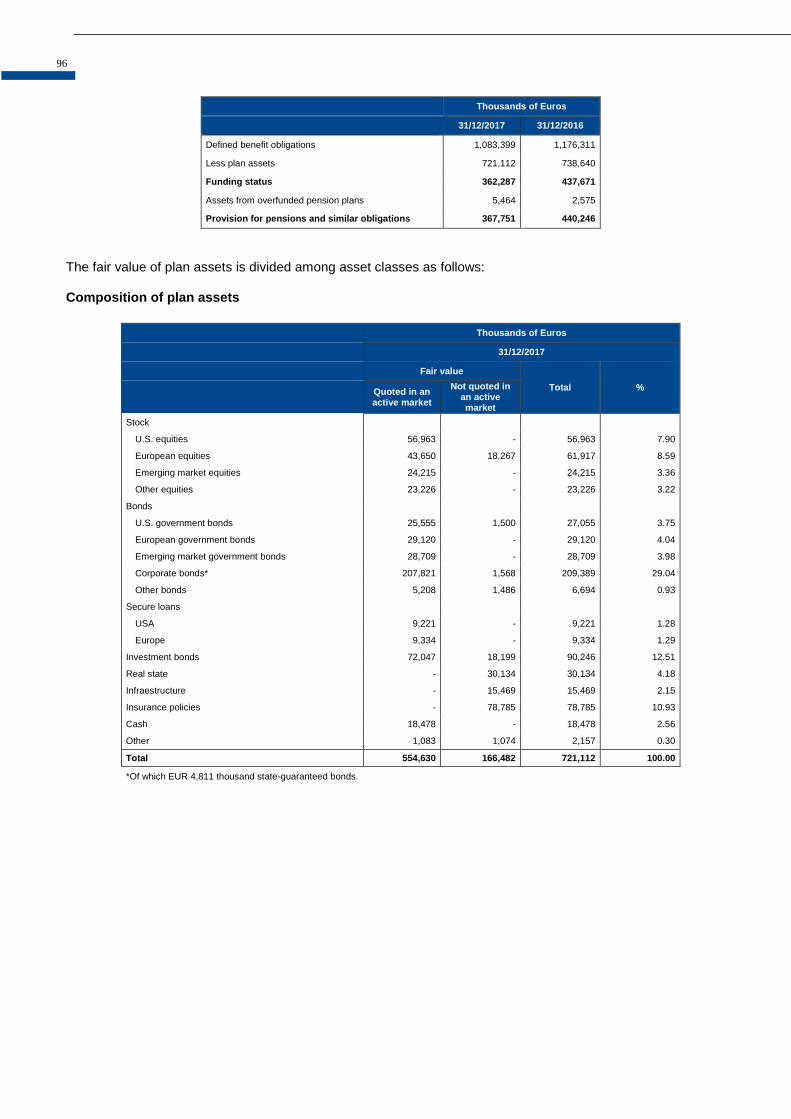
96
Thousands of Euros
31/12/2017 31/12/2016
Defined benefit obligations 1,083,399 1,176,311
Less plan assets 721,112 738,640
Funding status 362,287 437,671
Assets from overfunded pension plans 5,464 2,575
Provision for pensions and similar obligations 367,751 440,246
The fair value of plan assets is divided among asset classes as follows: Composition of plan assets
Thousands of Euros
31/12/2017
Fair value
Total %
Quoted in an active market
Not quoted in an active market
Stock
U.S. equities 56,963 - 56,963 7.90
European equities 43,650 18,267 61,917 8.59
Emerging market equities 24,215 - 24,215 3.36
Other equities 23,226 - 23,226 3.22
Bonds
U.S. government bonds 25,555 1,500 27,055 3.75
European government bonds 29,120 - 29,120 4.04
Emerging market government bonds 28,709 - 28,709 3.98
Corporate bonds* 207,821 1,568 209,389 29.04
Other bonds 5,208 1,486 6,694 0.93
Secure loans
USA 9,221 - 9,221 1.28
Europe 9,334 - 9,334 1.29
Investment bonds 72,047 18,199 90,246 12.51
Real state - 30,134 30,134 4.18
Infraestructure - 15,469 15,469 2.15
Insurance policies - 78,785 78,785 10.93
Cash 18,478 - 18,478 2.56
Other 1,083 1,074 2,157 0.30
Total 554,630 166,482 721,112 100.00
*Of which EUR 4,811 thousand state-guaranteed bonds.
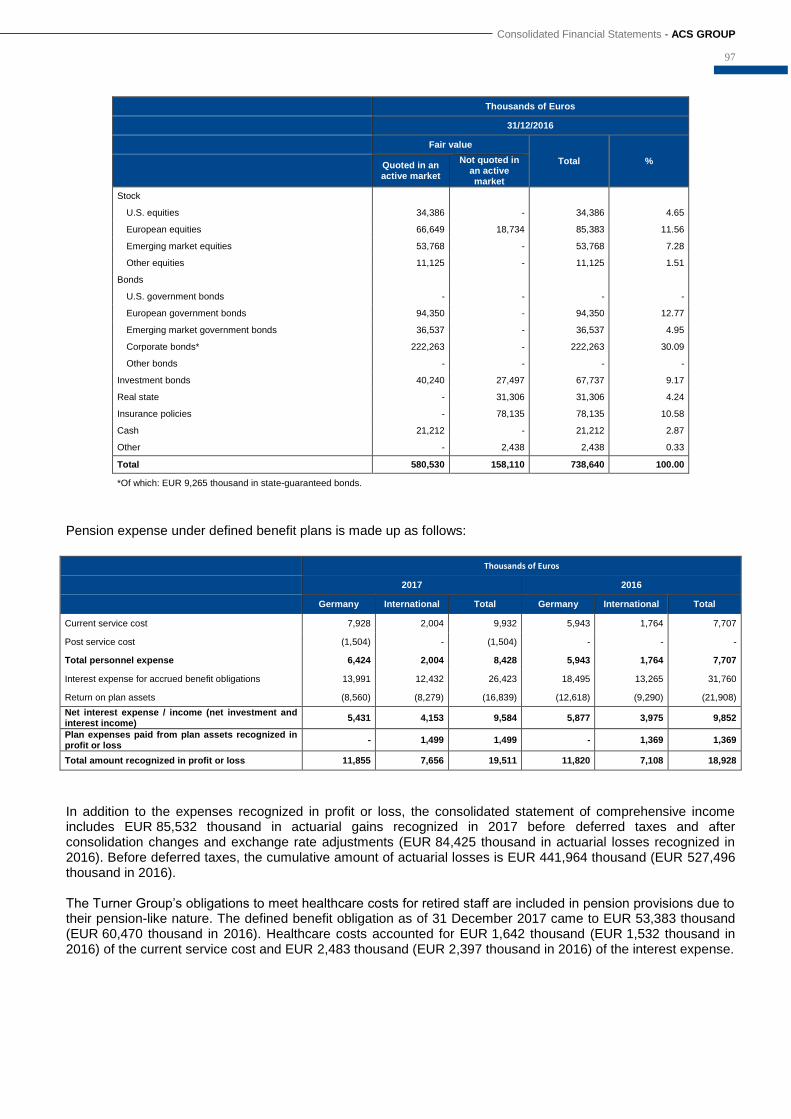
Consolidated Financial Statements - ACS GROUP
97
Thousands of Euros
31/12/2016
Fair value
Total %
Quoted in an active market
Not quoted in an active market
Stock
U.S. equities 34,386 - 34,386 4.65
European equities 66,649 18,734 85,383 11.56
Emerging market equities 53,768 - 53,768 7.28
Other equities 11,125 - 11,125 1.51
Bonds
U.S. government bonds - - - -
European government bonds 94,350 - 94,350 12.77
Emerging market government bonds 36,537 - 36,537 4.95
Corporate bonds* 222,263 - 222,263 30.09
Other bonds - - - -
Investment bonds 40,240 27,497 67,737 9.17
Real state - 31,306 31,306 4.24
Insurance policies - 78,135 78,135 10.58
Cash 21,212 - 21,212 2.87
Other - 2,438 2,438 0.33
Total 580,530 158,110 738,640 100.00
*Of which: EUR 9,265 thousand in state-guaranteed bonds.
Pension expense under defined benefit plans is made up as follows:
Thousands of Euros
2017 2016
Germany International Total Germany International Total
Current service cost 7,928 2,004 9,932 5,943 1,764 7,707
Post service cost (1,504) - (1,504) - - -
Total personnel expense 6,424 2,004 8,428 5,943 1,764 7,707
Interest expense for accrued benefit obligations 13,991 12,432 26,423 18,495 13,265 31,760
Return on plan assets (8,560) (8,279) (16,839) (12,618) (9,290) (21,908)
Net interest expense / income (net investment and interest income)
5,431 4,153 9,584 5,877 3,975 9,852
Plan expenses paid from plan assets recognized in profit or loss
- 1,499 1,499 - 1,369 1,369
Total amount recognized in profit or loss 11,855 7,656 19,511 11,820 7,108 18,928
In addition to the expenses recognized in profit or loss, the consolidated statement of comprehensive income includes EUR 85,532 thousand in actuarial gains recognized in 2017 before deferred taxes and after consolidation changes and exchange rate adjustments (EUR 84,425 thousand in actuarial losses recognized in 2016). Before deferred taxes, the cumulative amount of actuarial losses is EUR 441,964 thousand (EUR 527,496 thousand in 2016). The Turner Group’s obligations to meet healthcare costs for retired staff are included in pension provisions due to their pension-like nature. The defined benefit obligation as of 31 December 2017 came to EUR 53,383 thousand (EUR 60,470 thousand in 2016). Healthcare costs accounted for EUR 1,642 thousand (EUR 1,532 thousand in 2016) of the current service cost and EUR 2,483 thousand (EUR 2,397 thousand in 2016) of the interest expense.

98
Sensitivity analysis Interest rate risk For defined contribution plans, (notional) contributions are translated into benefits using a table of fixed interest rates, independent of the current market interest rate. Hochtief thus bears the risk of general capital market interest rate changes with regard to the determination of benefits. Pension obligations have increased significantly in recent years due to the generally low level of capital market interest rates. The correspondingly strong impact is due to the relatively long term of the obligations. Inflation risk By law, company pensions in Germany must be raised level with the inflation rate at least every three years. German company pensions under the 2000+ plan rise at a fixed 1% p.a., hence there is only minor inflation risk in the pension phase. Turner plans are free from inflation risk as the main defined benefit plan is frozen and no more adjustments to the company pension are made. Longevity risk The granting of lifelong pensions means that Hochtief bears the risk of pensioners living longer than actuarial calculations predict. This risk normally averages out collectively across all pension plan members and only comes into play if life expectancy is longer than expected. The impact of the stated risks on the defined benefit obligations under a corresponding change in actuarial assumptions is shown in the sensitivity analysis that follows. Impact on the defined benefit obligations:
Thousands of Euros
31/12/2017
Germany International Total
Increase Decrease Increase Decrease Increase Decrease
Discount rate +0,50% / -0,50% (51,166) 57,728 (15,936) 17,616 (67,102) 75,344
Discount rate +1,00% / -1,00% (96,707) 123,157 (30,404) 37,158 (127,111) 160,315
Salary increases +0,50% / -0,50% 558 (537) 420 (404) 978 (941)
Pension increases +0,25% / -0,25% 19,259 (18,433) 1,070 (975) 20,329 (19,408)
Medical costs +1,00% / -1,00% - - 83 (76) 83 (76)
Life expectancy +1 year 34,920 n/a 7,687 n/a 42,607 n/a
Thousands of Euros
31/12/2016
Germany International Total
Increase Decrease Increase Decrease Increase Decrease
Discount rate +0,50% / -0,50% (56,175) 63,408 (16,395) 18,078 (72,570) 81,486
Discount rate +1,00% / -1,00% (105,939) 135,647 (31,314) 38,088 (137,253) 173,735
Salary increases +0,50% / -0,50% 418 (572) 659 (613) 1,077 (1,185)
Pension increases +0,25% / -0,25% 19,881 (19,186) 1,336 (1,500) 21,217 (20,686)
Medical costs +1,00% / -1,00% - - 93 (87) 93 (87)
Life expectancy +1 year 37,295 n/a 7,510 n/a 44,805 n/a
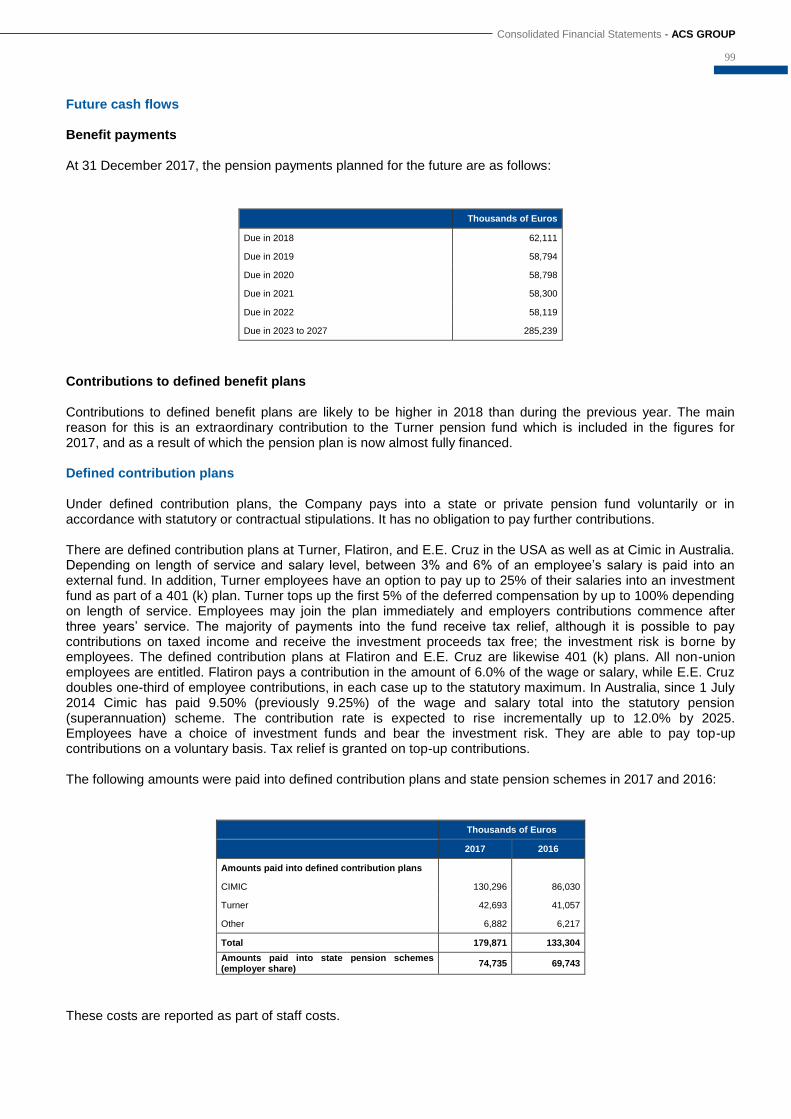
Consolidated Financial Statements - ACS GROUP
99
Future cash flows Benefit payments At 31 December 2017, the pension payments planned for the future are as follows:
Thousands of Euros
Due in 2018 62,111
Due in 2019 58,794
Due in 2020 58,798
Due in 2021 58,300
Due in 2022 58,119
Due in 2023 to 2027 285,239
Contributions to defined benefit plans Contributions to defined benefit plans are likely to be higher in 2018 than during the previous year. The main reason for this is an extraordinary contribution to the Turner pension fund which is included in the figures for 2017, and as a result of which the pension plan is now almost fully financed. Defined contribution plans Under defined contribution plans, the Company pays into a state or private pension fund voluntarily or in accordance with statutory or contractual stipulations. It has no obligation to pay further contributions. There are defined contribution plans at Turner, Flatiron, and E.E. Cruz in the USA as well as at Cimic in Australia. Depending on length of service and salary level, between 3% and 6% of an employee’s salary is paid into an external fund. In addition, Turner employees have an option to pay up to 25% of their salaries into an investment fund as part of a 401 (k) plan. Turner tops up the first 5% of the deferred compensation by up to 100% depending on length of service. Employees may join the plan immediately and employers contributions commence after three years’ service. The majority of payments into the fund receive tax relief, although it is possible to pay contributions on taxed income and receive the investment proceeds tax free; the investment risk is borne by employees. The defined contribution plans at Flatiron and E.E. Cruz are likewise 401 (k) plans. All non-union employees are entitled. Flatiron pays a contribution in the amount of 6.0% of the wage or salary, while E.E. Cruz doubles one-third of employee contributions, in each case up to the statutory maximum. In Australia, since 1 July 2014 Cimic has paid 9.50% (previously 9.25%) of the wage and salary total into the statutory pension (superannuation) scheme. The contribution rate is expected to rise incrementally up to 12.0% by 2025. Employees have a choice of investment funds and bear the investment risk. They are able to pay top-up contributions on a voluntary basis. Tax relief is granted on top-up contributions. The following amounts were paid into defined contribution plans and state pension schemes in 2017 and 2016:
Thousands of Euros
2017 2016
Amounts paid into defined contribution plans
CIMIC 130,296 86,030
Turner 42,693 41,057
Other 6,882 6,217
Total 179,871 133,304
Amounts paid into state pension schemes (employer share)
74,735 69,743
These costs are reported as part of staff costs.

100
Provisions for taxes Non-current provisions include the amounts estimated by the Group to settle claims brought in connection with the payment of various taxes, levies and local taxes, mainly property tax and other possible contingencies, as well as the estimated consideration required to settle probable or certain liabilities and outstanding obligations for which the exact amount of the corresponding payment cannot be determined or for which the actual settlement date is not known, since they are contingent upon meeting certain terms and conditions. These provisions have been provided in accordance with the specific analysis of the probability that the related tax contingency or challenge, might be contrary to the interests of the ACS Group, under the consideration of the country in which it has its origin, and in accordance with the tax rates in this country. Since the timing for these provisions is dependent on certain facts which are in some cases associated with the decisions handed down by the courts or similar bodies, the Group does not update these provisions given the uncertainty of the exact time in which the related risk may arise or disappear. In 2016 this heading notably includes an extraordinary provision of EUR 155,000 thousand, reserved for covering the estimated impact of Royal Decree Law 3/2016 in Spain on the recoverability of deferred tax assets of all the entities that are members of the Tax Group in Spain, especially those linked to the impairment losses of subsidiaries and investees. In 2017 this gave rise to a lower expense of EUR 29,600 thousand, originating from coinciding with certain circumstances during the fiscal year which allowed for the immediate tax deductibility of specific impairments or a more certain application of the corresponding deferred tax assets (see Note 26.03). Provisions for third-party liability These relate mainly to the following: Provisions for litigation
These provisions cover the risks arising from ACS Group companies which are party to certain legal proceedings due to the liability inherent to the activities carried on by them. The lawsuits, although numerous, represent scantly material amounts when considered individually based on the size of the ACS Group. Period charges to these provisions are made based on an analysis of the lawsuits or claims in progress, according to the reports prepared by the legal advisers of the ACS Group. As in the case of provisions for taxes, these amounts are not updated to the extent that the time at which the risk arises or disappears depends on circumstances linked to judgments or arbitration and it is impossible to determine the date on which they will be resolved. Additionally, these provisions are not derecognized until the judgments handed down are final and payment is made, or there is no doubt as to the disappearance of the associated risk. Note 36 describes the ACS Group’s main contingencies. Environmental Provisions
The ACS Group has an environmental policy that goes beyond strict compliance with current legislation in the area of environmental improvement and protection to include the establishment of preventative planning and the analysis and minimization of the environmental impact of the activities carried on by the Group. These provisions are made to cover any likely environmental risks which might arise. Guarantees and contractual and legal obligations This heading includes the provisions to cover the expenses relating to obligations arising from contractual and legal obligations which are not of an environmental nature. A significant portion of these provisions is made by increasing the value of those assets related to the obligations in relation to administrative concession, whose effect on profit or loss occurs when the asset is depreciated in accordance with depreciation rates. Additionally, it includes provisions for motorway concession companies, in relation to the costs of future expropriations borne by the concession companies in accordance with agreements with the grantors, as well as the current value of the investments made in concession contracts, according to the respective financial economic models. Period charges to these provisions are generally mainly made to cover the costs associated with motorway concession contracts and other activities undertaken in the form of a concession. Such provisions are made when the associated commitments arise, the timing of their use being associated with the use of the infrastructure and/or its wear. Timing is analyzed according to the financial and economic model of each concession,
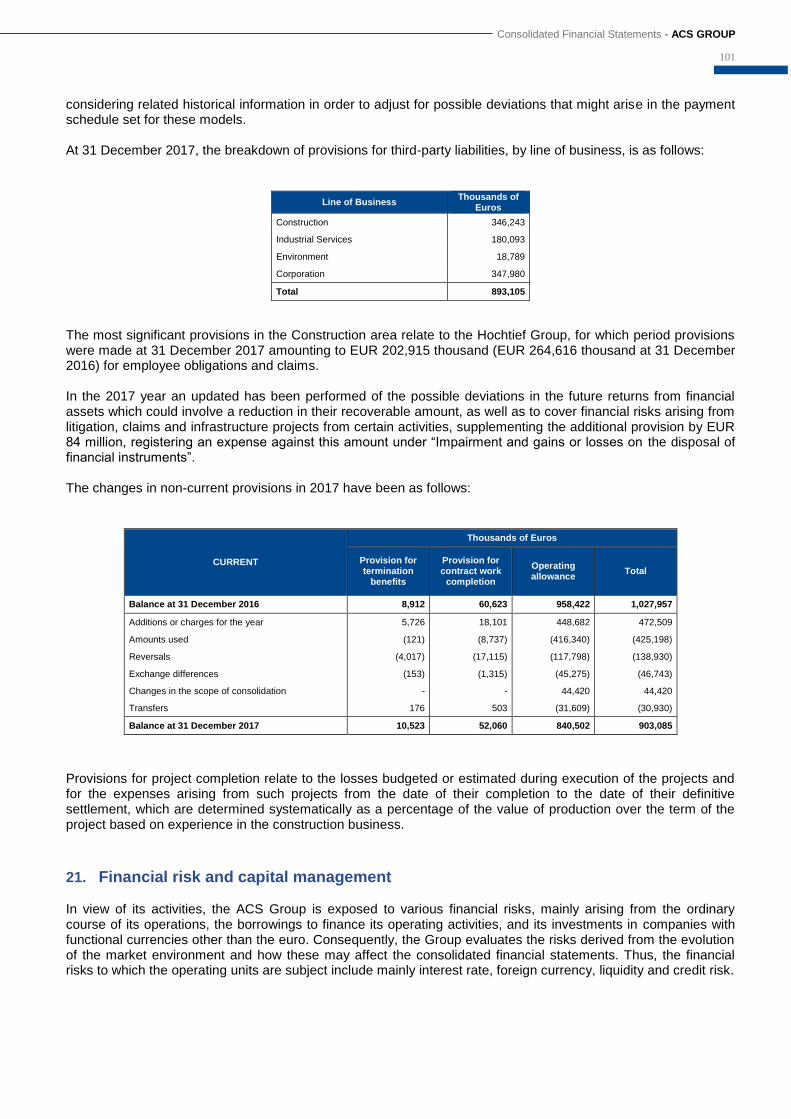
Consolidated Financial Statements - ACS GROUP
101
considering related historical information in order to adjust for possible deviations that might arise in the payment schedule set for these models. At 31 December 2017, the breakdown of provisions for third-party liabilities, by line of business, is as follows:
Line of Business Thousands of
Euros
Construction 346,243
Industrial Services 180,093
Environment 18,789
Corporation 347,980
Total 893,105
The most significant provisions in the Construction area relate to the Hochtief Group, for which period provisions were made at 31 December 2017 amounting to EUR 202,915 thousand (EUR 264,616 thousand at 31 December 2016) for employee obligations and claims. In the 2017 year an updated has been performed of the possible deviations in the future returns from financial assets which could involve a reduction in their recoverable amount, as well as to cover financial risks arising from litigation, claims and infrastructure projects from certain activities, supplementing the additional provision by EUR 84 million, registering an expense against this amount under “Impairment and gains or losses on the disposal of financial instruments”. The changes in non-current provisions in 2017 have been as follows:
CURRENT
Thousands of Euros
Provision for termination
benefits
Provision for contract work
completion
Operating allowance
Total
Balance at 31 December 2016 8,912 60,623 958,422 1,027,957
Additions or charges for the year 5,726 18,101 448,682 472,509
Amounts used (121) (8,737) (416,340) (425,198)
Reversals (4,017) (17,115) (117,798) (138,930)
Exchange differences (153) (1,315) (45,275) (46,743)
Changes in the scope of consolidation - - 44,420 44,420
Transfers 176 503 (31,609) (30,930)
Balance at 31 December 2017 10,523 52,060 840,502 903,085
Provisions for project completion relate to the losses budgeted or estimated during execution of the projects and for the expenses arising from such projects from the date of their completion to the date of their definitive settlement, which are determined systematically as a percentage of the value of production over the term of the project based on experience in the construction business.
21. Financial risk and capital management In view of its activities, the ACS Group is exposed to various financial risks, mainly arising from the ordinary course of its operations, the borrowings to finance its operating activities, and its investments in companies with functional currencies other than the euro. Consequently, the Group evaluates the risks derived from the evolution of the market environment and how these may affect the consolidated financial statements. Thus, the financial risks to which the operating units are subject include mainly interest rate, foreign currency, liquidity and credit risk.

102
Cash flow interest rate risk This risk arises from changes in future cash flows relating to borrowings bearing interest at floating rates (or with current maturity and likely renewal) as a result of fluctuations in market interest rates. The objective of the management of this risk is to mitigate the impact on the cost of the debt arising from fluctuations in interest rates. For this purpose, financial derivatives which guarantee fixed interest rates or rates with caps and floors are arranged for a substantial portion of the borrowings that may be affected by this risk (see Note 22). The sensitivity of the ACS Group’s profit and equity to changes in interest rates, taking into account its existing hedging instruments and fixed rate financing, is as follows:
Year Increase / Decrease in the interest rate
(basic points)
Thousands of Euros
Effect on profit or loss
Effect on equity
(prior to tax) (after tax)
2017 50 14,393 28,421
-50 (14,393) (28,421)
2016 50 13,339 40,950
-50 (13,339) (40,950)
Foreign currency risk The foreign currency risk arises mainly from the foreign operations of the ACS Group which makes investments and carries out business transactions in functional currencies other than the euro, and from loans granted to Group companies in currencies other than those of the countries in which they are located. To hedge the risk inherent to structural investments in foreign operations with a functional currency other than the euro, the Group endeavors to make these investments in the same functional currency as the assets being financed. For the hedging of net positions in currencies other than the euro in the performance of contracts in force and contracts in the backlog, the Group uses various financial instruments for the purpose of mitigating exposure to foreign currency risk (see Note 22). The sensitivity analysis shown below reflects the potential effect on the ACS Group, both on equity and on the consolidated income statement, of a five per cent fluctuation in the most significant currencies in comparison with the functional currency of each Group company, based on the situation at the end of the reporting period. Effect on profit or loss before tax
Thousands of Euros
2017 2016
Functional currency Currency 5% -5% 5% -5%
EUR MXN 8.1 -8.1 3.8 -3.8
EUR USD -4.8 4.8 31.0 -31.0
USD CAD -7.0 7.0 -5.6 5.6
AUD USD 4.8 -4.8 -20.2 20.2
EUR SAR 4.0 -4.0 -0.2 0.2
EUR BRL 3.1 -3.1 1.4 -1.4
EUR PLN 1.8 -1.8 2.7 -2.7
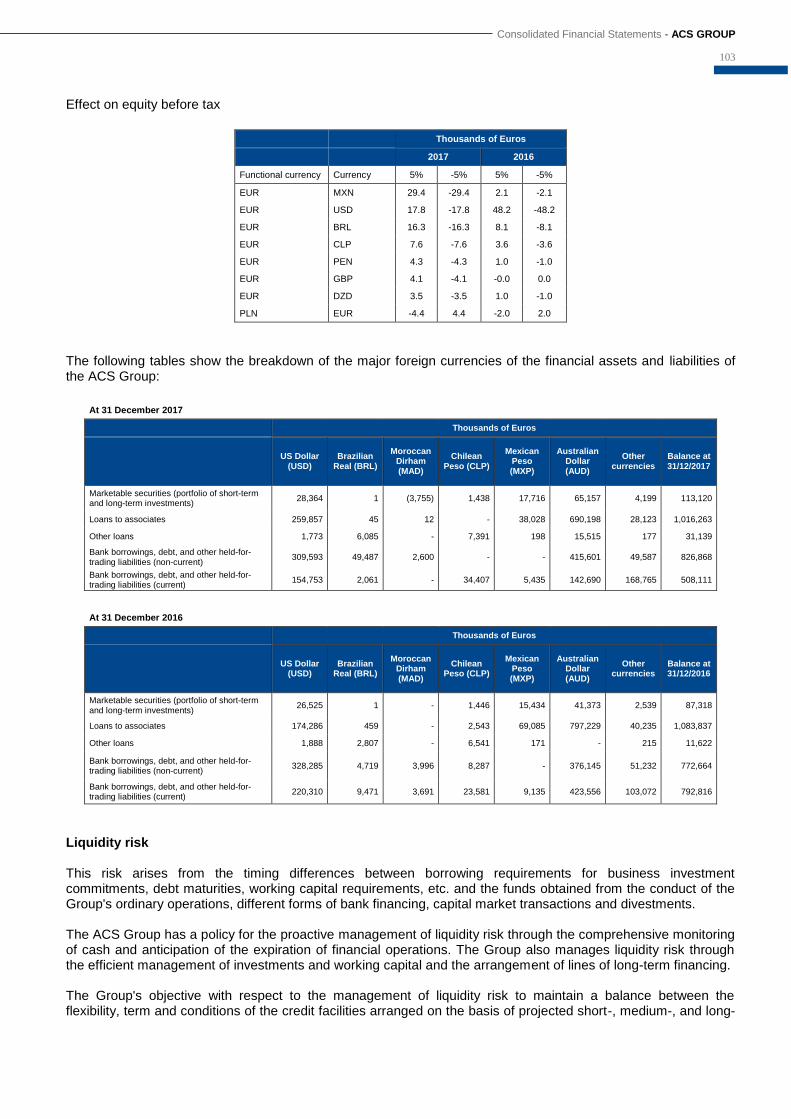
Consolidated Financial Statements - ACS GROUP
103
Effect on equity before tax
Thousands of Euros
2017 2016
Functional currency Currency 5% -5% 5% -5%
EUR MXN 29.4 -29.4 2.1 -2.1
EUR USD 17.8 -17.8 48.2 -48.2
EUR BRL 16.3 -16.3 8.1 -8.1
EUR CLP 7.6 -7.6 3.6 -3.6
EUR PEN 4.3 -4.3 1.0 -1.0
EUR GBP 4.1 -4.1 -0.0 0.0
EUR DZD 3.5 -3.5 1.0 -1.0
PLN EUR -4.4 4.4 -2.0 2.0
The following tables show the breakdown of the major foreign currencies of the financial assets and liabilities of the ACS Group:
At 31 December 2017
Thousands of Euros
US Dollar
(USD) Brazilian
Real (BRL)
Moroccan Dirham (MAD)
Chilean Peso (CLP)
Mexican Peso (MXP)
Australian Dollar (AUD)
Other currencies
Balance at 31/12/2017
Marketable securities (portfolio of short-term and long-term investments)
28,364 1 (3,755) 1,438 17,716 65,157 4,199 113,120
Loans to associates 259,857 45 12 - 38,028 690,198 28,123 1,016,263
Other loans 1,773 6,085 - 7,391 198 15,515 177 31,139
Bank borrowings, debt, and other held-for-trading liabilities (non-current)
309,593 49,487 2,600 - - 415,601 49,587 826,868
Bank borrowings, debt, and other held-for-trading liabilities (current)
154,753 2,061 - 34,407 5,435 142,690 168,765 508,111
At 31 December 2016
Thousands of Euros
US Dollar
(USD) Brazilian
Real (BRL)
Moroccan Dirham (MAD)
Chilean Peso (CLP)
Mexican Peso (MXP)
Australian Dollar (AUD)
Other currencies
Balance at 31/12/2016
Marketable securities (portfolio of short-term and long-term investments)
26,525 1 - 1,446 15,434 41,373 2,539 87,318
Loans to associates 174,286 459 - 2,543 69,085 797,229 40,235 1,083,837
Other loans 1,888 2,807 - 6,541 171 - 215 11,622
Bank borrowings, debt, and other held-for-trading liabilities (non-current)
328,285 4,719 3,996 8,287 - 376,145 51,232 772,664
Bank borrowings, debt, and other held-for-trading liabilities (current)
220,310 9,471 3,691 23,581 9,135 423,556 103,072 792,816
Liquidity risk This risk arises from the timing differences between borrowing requirements for business investment commitments, debt maturities, working capital requirements, etc. and the funds obtained from the conduct of the Group's ordinary operations, different forms of bank financing, capital market transactions and divestments. The ACS Group has a policy for the proactive management of liquidity risk through the comprehensive monitoring of cash and anticipation of the expiration of financial operations. The Group also manages liquidity risk through the efficient management of investments and working capital and the arrangement of lines of long-term financing. The Group's objective with respect to the management of liquidity risk to maintain a balance between the flexibility, term and conditions of the credit facilities arranged on the basis of projected short-, medium-, and long-
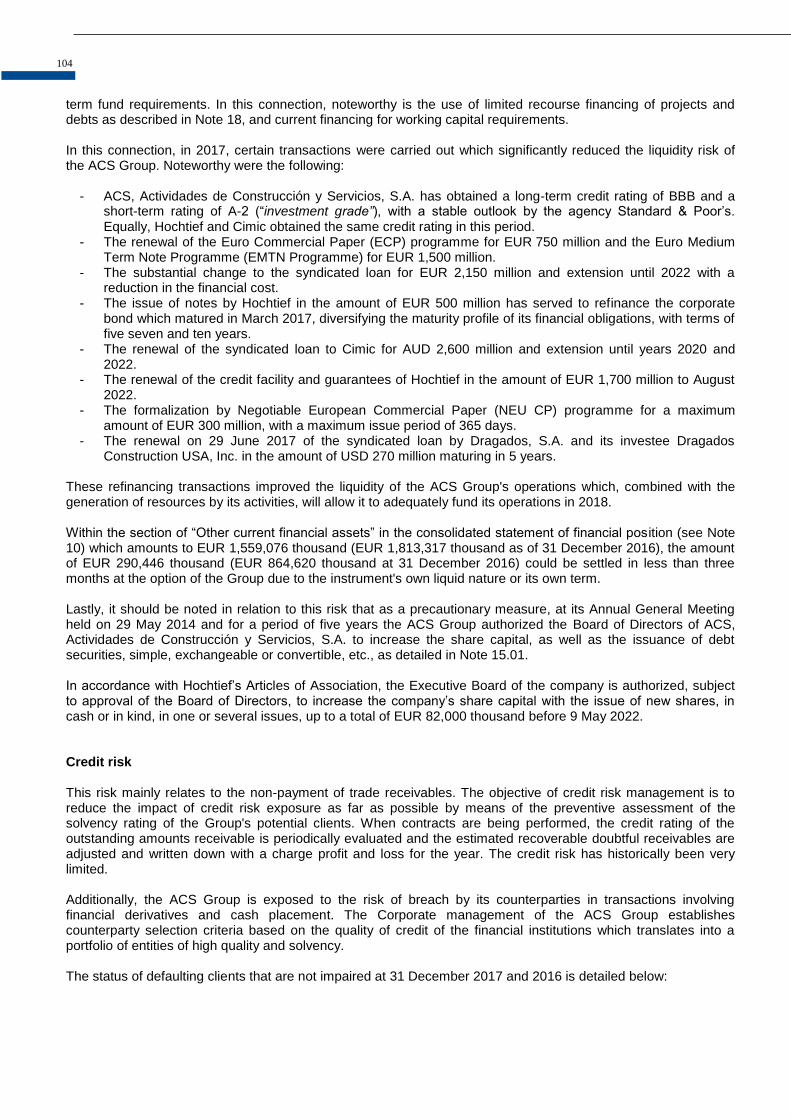
104
term fund requirements. In this connection, noteworthy is the use of limited recourse financing of projects and debts as described in Note 18, and current financing for working capital requirements. In this connection, in 2017, certain transactions were carried out which significantly reduced the liquidity risk of the ACS Group. Noteworthy were the following:
- ACS, Actividades de Construcción y Servicios, S.A. has obtained a long-term credit rating of BBB and a short-term rating of A-2 (“investment grade”), with a stable outlook by the agency Standard & Poor’s. Equally, Hochtief and Cimic obtained the same credit rating in this period.
- The renewal of the Euro Commercial Paper (ECP) programme for EUR 750 million and the Euro Medium Term Note Programme (EMTN Programme) for EUR 1,500 million.
- The substantial change to the syndicated loan for EUR 2,150 million and extension until 2022 with a reduction in the financial cost.
- The issue of notes by Hochtief in the amount of EUR 500 million has served to refinance the corporate bond which matured in March 2017, diversifying the maturity profile of its financial obligations, with terms of five seven and ten years.
- The renewal of the syndicated loan to Cimic for AUD 2,600 million and extension until years 2020 and 2022.
- The renewal of the credit facility and guarantees of Hochtief in the amount of EUR 1,700 million to August 2022.
- The formalization by Negotiable European Commercial Paper (NEU CP) programme for a maximum amount of EUR 300 million, with a maximum issue period of 365 days.
- The renewal on 29 June 2017 of the syndicated loan by Dragados, S.A. and its investee Dragados Construction USA, Inc. in the amount of USD 270 million maturing in 5 years.
These refinancing transactions improved the liquidity of the ACS Group's operations which, combined with the generation of resources by its activities, will allow it to adequately fund its operations in 2018. Within the section of “Other current financial assets” in the consolidated statement of financial position (see Note 10) which amounts to EUR 1,559,076 thousand (EUR 1,813,317 thousand as of 31 December 2016), the amount of EUR 290,446 thousand (EUR 864,620 thousand at 31 December 2016) could be settled in less than three months at the option of the Group due to the instrument's own liquid nature or its own term. Lastly, it should be noted in relation to this risk that as a precautionary measure, at its Annual General Meeting held on 29 May 2014 and for a period of five years the ACS Group authorized the Board of Directors of ACS, Actividades de Construcción y Servicios, S.A. to increase the share capital, as well as the issuance of debt securities, simple, exchangeable or convertible, etc., as detailed in Note 15.01. In accordance with Hochtief’s Articles of Association, the Executive Board of the company is authorized, subject to approval of the Board of Directors, to increase the company’s share capital with the issue of new shares, in cash or in kind, in one or several issues, up to a total of EUR 82,000 thousand before 9 May 2022. Credit risk This risk mainly relates to the non-payment of trade receivables. The objective of credit risk management is to reduce the impact of credit risk exposure as far as possible by means of the preventive assessment of the solvency rating of the Group's potential clients. When contracts are being performed, the credit rating of the outstanding amounts receivable is periodically evaluated and the estimated recoverable doubtful receivables are adjusted and written down with a charge profit and loss for the year. The credit risk has historically been very limited. Additionally, the ACS Group is exposed to the risk of breach by its counterparties in transactions involving financial derivatives and cash placement. The Corporate management of the ACS Group establishes counterparty selection criteria based on the quality of credit of the financial institutions which translates into a portfolio of entities of high quality and solvency. The status of defaulting clients that are not impaired at 31 December 2017 and 2016 is detailed below:
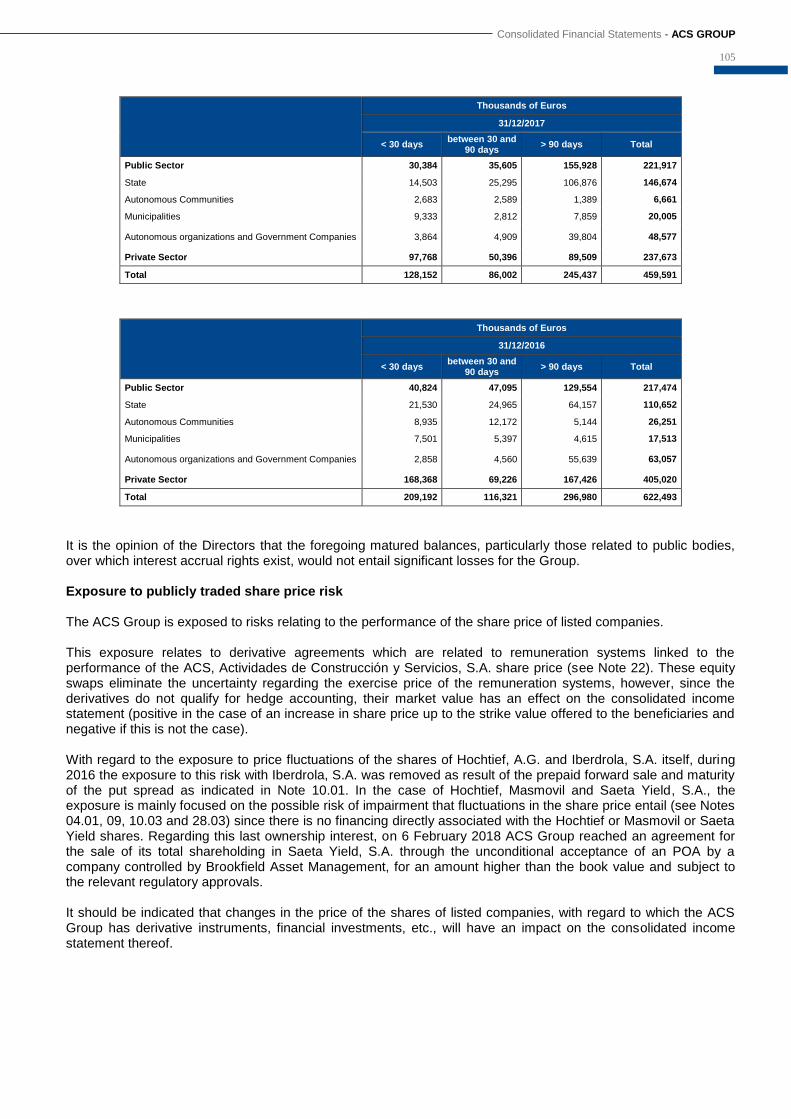
Consolidated Financial Statements - ACS GROUP
105
Thousands of Euros
31/12/2017
< 30 days between 30 and
90 days > 90 days Total
Public Sector 30,384 35,605 155,928 221,917
State 14,503 25,295 106,876 146,674
Autonomous Communities 2,683 2,589 1,389 6,661
Municipalities 9,333 2,812 7,859 20,005
Autonomous organizations and Government Companies 3,864 4,909 39,804 48,577
Private Sector 97,768 50,396 89,509 237,673
Total 128,152 86,002 245,437 459,591
Thousands of Euros
31/12/2016
< 30 days between 30 and
90 days > 90 days Total
Public Sector 40,824 47,095 129,554 217,474
State 21,530 24,965 64,157 110,652
Autonomous Communities 8,935 12,172 5,144 26,251
Municipalities 7,501 5,397 4,615 17,513
Autonomous organizations and Government Companies 2,858 4,560 55,639 63,057
Private Sector 168,368 69,226 167,426 405,020
Total 209,192 116,321 296,980 622,493
It is the opinion of the Directors that the foregoing matured balances, particularly those related to public bodies, over which interest accrual rights exist, would not entail significant losses for the Group. Exposure to publicly traded share price risk The ACS Group is exposed to risks relating to the performance of the share price of listed companies. This exposure relates to derivative agreements which are related to remuneration systems linked to the performance of the ACS, Actividades de Construcción y Servicios, S.A. share price (see Note 22). These equity swaps eliminate the uncertainty regarding the exercise price of the remuneration systems, however, since the derivatives do not qualify for hedge accounting, their market value has an effect on the consolidated income statement (positive in the case of an increase in share price up to the strike value offered to the beneficiaries and negative if this is not the case). With regard to the exposure to price fluctuations of the shares of Hochtief, A.G. and Iberdrola, S.A. itself, during 2016 the exposure to this risk with Iberdrola, S.A. was removed as result of the prepaid forward sale and maturity of the put spread as indicated in Note 10.01. In the case of Hochtief, Masmovil and Saeta Yield, S.A., the exposure is mainly focused on the possible risk of impairment that fluctuations in the share price entail (see Notes 04.01, 09, 10.03 and 28.03) since there is no financing directly associated with the Hochtief or Masmovil or Saeta Yield shares. Regarding this last ownership interest, on 6 February 2018 ACS Group reached an agreement for the sale of its total shareholding in Saeta Yield, S.A. through the unconditional acceptance of an POA by a company controlled by Brookfield Asset Management, for an amount higher than the book value and subject to the relevant regulatory approvals. It should be indicated that changes in the price of the shares of listed companies, with regard to which the ACS Group has derivative instruments, financial investments, etc., will have an impact on the consolidated income statement thereof.
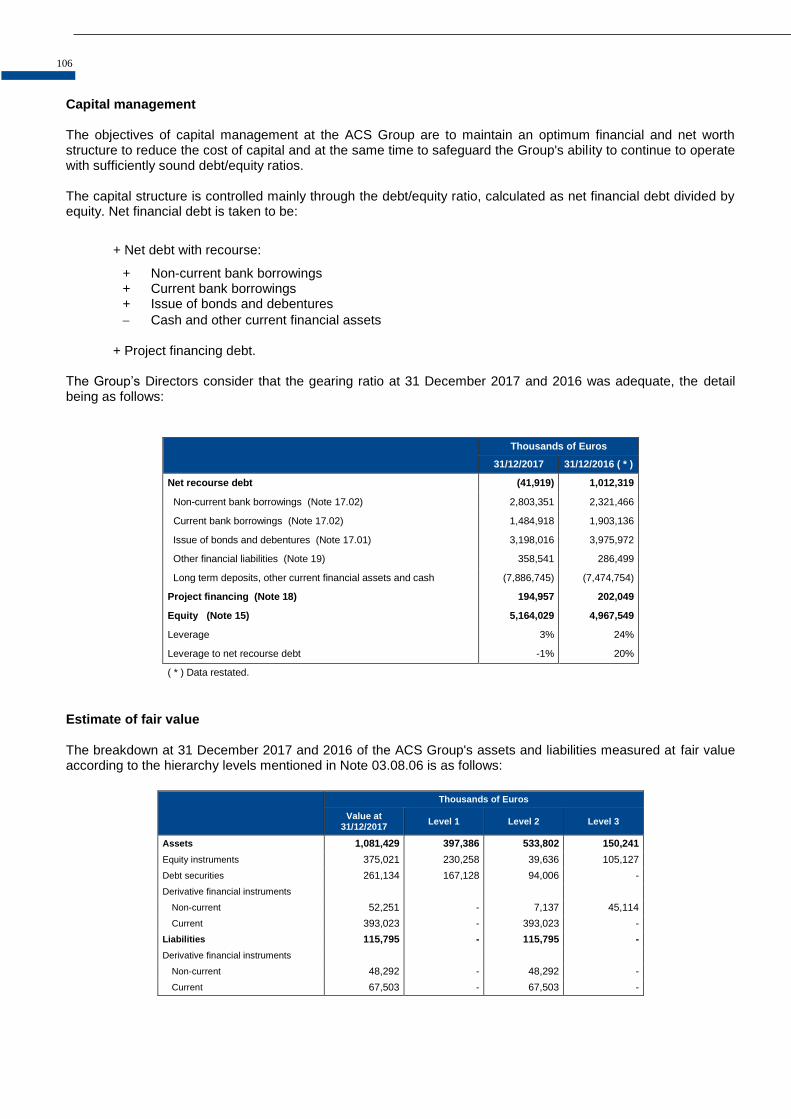
106
Capital management The objectives of capital management at the ACS Group are to maintain an optimum financial and net worth structure to reduce the cost of capital and at the same time to safeguard the Group's ability to continue to operate with sufficiently sound debt/equity ratios. The capital structure is controlled mainly through the debt/equity ratio, calculated as net financial debt divided by equity. Net financial debt is taken to be:
+ Net debt with recourse:
+ Non-current bank borrowings + Current bank borrowings + Issue of bonds and debentures
Cash and other current financial assets + Project financing debt. The Group’s Directors consider that the gearing ratio at 31 December 2017 and 2016 was adequate, the detail being as follows:
Thousands of Euros
31/12/2017 31/12/2016 ( * )
Net recourse debt (41,919) 1,012,319
Non-current bank borrowings (Note 17.02) 2,803,351 2,321,466
Current bank borrowings (Note 17.02) 1,484,918 1,903,136
Issue of bonds and debentures (Note 17.01) 3,198,016 3,975,972
Other financial liabilities (Note 19) 358,541 286,499
Long term deposits, other current financial assets and cash (7,886,745) (7,474,754)
Project financing (Note 18) 194,957 202,049
Equity (Note 15) 5,164,029 4,967,549
Leverage 3% 24%
Leverage to net recourse debt -1% 20%
( * ) Data restated.
Estimate of fair value The breakdown at 31 December 2017 and 2016 of the ACS Group's assets and liabilities measured at fair value according to the hierarchy levels mentioned in Note 03.08.06 is as follows:
Thousands of Euros
Value at 31/12/2017
Level 1 Level 2 Level 3
Assets 1,081,429 397,386 533,802 150,241
Equity instruments 375,021 230,258 39,636 105,127
Debt securities 261,134 167,128 94,006 -
Derivative financial instruments
Non-current 52,251 - 7,137 45,114
Current 393,023 - 393,023 -
Liabilities 115,795 - 115,795 -
Derivative financial instruments
Non-current 48,292 - 48,292 -
Current 67,503 - 67,503 -
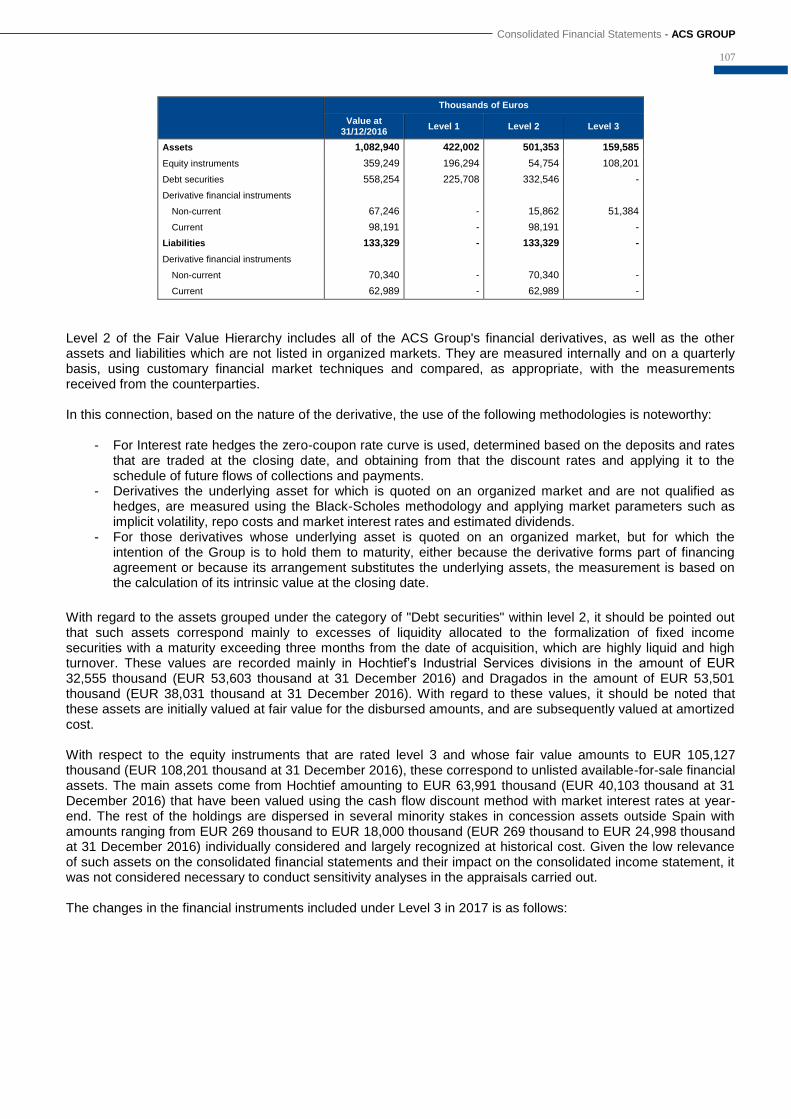
Consolidated Financial Statements - ACS GROUP
107
Thousands of Euros
Value at 31/12/2016
Level 1 Level 2 Level 3
Assets 1,082,940 422,002 501,353 159,585
Equity instruments 359,249 196,294 54,754 108,201
Debt securities 558,254 225,708 332,546 -
Derivative financial instruments
Non-current 67,246 - 15,862 51,384
Current 98,191 - 98,191 -
Liabilities 133,329 - 133,329 -
Derivative financial instruments
Non-current 70,340 - 70,340 -
Current 62,989 - 62,989 -
Level 2 of the Fair Value Hierarchy includes all of the ACS Group's financial derivatives, as well as the other assets and liabilities which are not listed in organized markets. They are measured internally and on a quarterly basis, using customary financial market techniques and compared, as appropriate, with the measurements received from the counterparties. In this connection, based on the nature of the derivative, the use of the following methodologies is noteworthy:
- For Interest rate hedges the zero-coupon rate curve is used, determined based on the deposits and rates that are traded at the closing date, and obtaining from that the discount rates and applying it to the schedule of future flows of collections and payments.
- Derivatives the underlying asset for which is quoted on an organized market and are not qualified as hedges, are measured using the Black-Scholes methodology and applying market parameters such as implicit volatility, repo costs and market interest rates and estimated dividends.
- For those derivatives whose underlying asset is quoted on an organized market, but for which the intention of the Group is to hold them to maturity, either because the derivative forms part of financing agreement or because its arrangement substitutes the underlying assets, the measurement is based on the calculation of its intrinsic value at the closing date.
With regard to the assets grouped under the category of "Debt securities" within level 2, it should be pointed out that such assets correspond mainly to excesses of liquidity allocated to the formalization of fixed income securities with a maturity exceeding three months from the date of acquisition, which are highly liquid and high turnover. These values are recorded mainly in Hochtief’s Industrial Services divisions in the amount of EUR 32,555 thousand (EUR 53,603 thousand at 31 December 2016) and Dragados in the amount of EUR 53,501 thousand (EUR 38,031 thousand at 31 December 2016). With regard to these values, it should be noted that these assets are initially valued at fair value for the disbursed amounts, and are subsequently valued at amortized cost. With respect to the equity instruments that are rated level 3 and whose fair value amounts to EUR 105,127 thousand (EUR 108,201 thousand at 31 December 2016), these correspond to unlisted available-for-sale financial assets. The main assets come from Hochtief amounting to EUR 63,991 thousand (EUR 40,103 thousand at 31 December 2016) that have been valued using the cash flow discount method with market interest rates at year-end. The rest of the holdings are dispersed in several minority stakes in concession assets outside Spain with amounts ranging from EUR 269 thousand to EUR 18,000 thousand (EUR 269 thousand to EUR 24,998 thousand at 31 December 2016) individually considered and largely recognized at historical cost. Given the low relevance of such assets on the consolidated financial statements and their impact on the consolidated income statement, it was not considered necessary to conduct sensitivity analyses in the appraisals carried out.
The changes in the financial instruments included under Level 3 in 2017 is as follows:
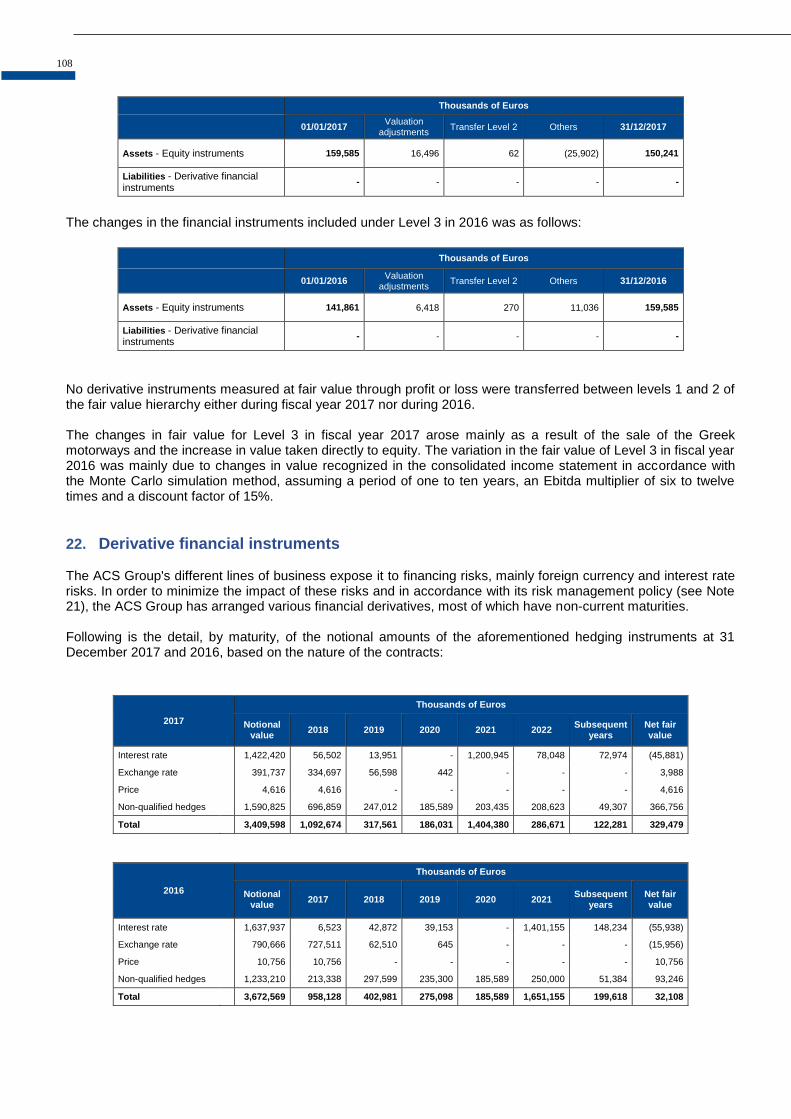
108
Thousands of Euros
01/01/2017 Valuation
adjustments Transfer Level 2 Others 31/12/2017
Assets - Equity instruments 159,585 16,496 62 (25,902) 150,241
Liabilities - Derivative financial instruments
- - - - -
The changes in the financial instruments included under Level 3 in 2016 was as follows:
Thousands of Euros
01/01/2016 Valuation
adjustments Transfer Level 2 Others 31/12/2016
Assets - Equity instruments 141,861 6,418 270 11,036 159,585
Liabilities - Derivative financial instruments
- - - - -
No derivative instruments measured at fair value through profit or loss were transferred between levels 1 and 2 of the fair value hierarchy either during fiscal year 2017 nor during 2016. The changes in fair value for Level 3 in fiscal year 2017 arose mainly as a result of the sale of the Greek motorways and the increase in value taken directly to equity. The variation in the fair value of Level 3 in fiscal year 2016 was mainly due to changes in value recognized in the consolidated income statement in accordance with the Monte Carlo simulation method, assuming a period of one to ten years, an Ebitda multiplier of six to twelve times and a discount factor of 15%.
22. Derivative financial instruments The ACS Group's different lines of business expose it to financing risks, mainly foreign currency and interest rate risks. In order to minimize the impact of these risks and in accordance with its risk management policy (see Note 21), the ACS Group has arranged various financial derivatives, most of which have non-current maturities. Following is the detail, by maturity, of the notional amounts of the aforementioned hedging instruments at 31 December 2017 and 2016, based on the nature of the contracts:
2017
Thousands of Euros
Notional value
2018 2019 2020 2021 2022 Subsequent
years Net fair value
Interest rate 1,422,420 56,502 13,951 - 1,200,945 78,048 72,974 (45,881)
Exchange rate 391,737 334,697 56,598 442 - - - 3,988
Price 4,616 4,616 - - - - - 4,616
Non-qualified hedges 1,590,825 696,859 247,012 185,589 203,435 208,623 49,307 366,756
Total 3,409,598 1,092,674 317,561 186,031 1,404,380 286,671 122,281 329,479
2016
Thousands of Euros
Notional value
2017 2018 2019 2020 2021 Subsequent
years Net fair value
Interest rate 1,637,937 6,523 42,872 39,153 - 1,401,155 148,234 (55,938)
Exchange rate 790,666 727,511 62,510 645 - - - (15,956)
Price 10,756 10,756 - - - - - 10,756
Non-qualified hedges 1,233,210 213,338 297,599 235,300 185,589 250,000 51,384 93,246
Total 3,672,569 958,128 402,981 275,098 185,589 1,651,155 199,618 32,108
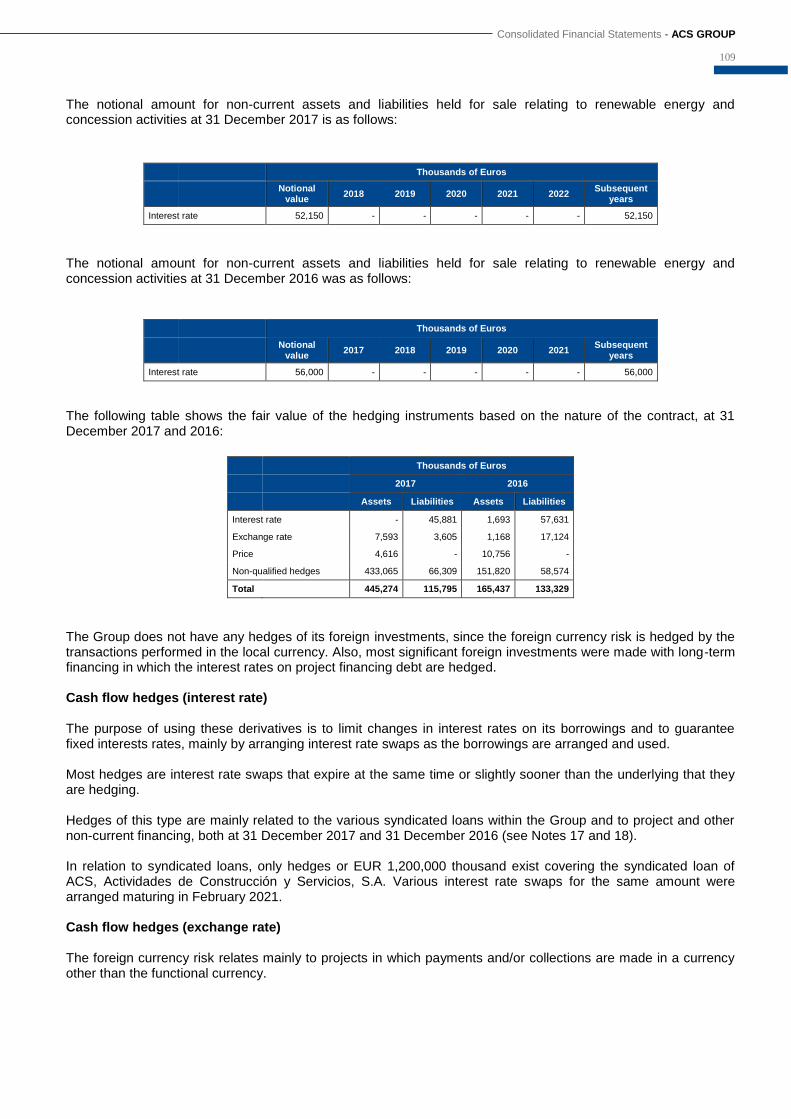
Consolidated Financial Statements - ACS GROUP
109
The notional amount for non-current assets and liabilities held for sale relating to renewable energy and concession activities at 31 December 2017 is as follows:
Thousands of Euros
Notional value
2018 2019 2020 2021 2022 Subsequent
years
Interest rate 52,150 - - - - - 52,150
The notional amount for non-current assets and liabilities held for sale relating to renewable energy and concession activities at 31 December 2016 was as follows:
Thousands of Euros
Notional value
2017 2018 2019 2020 2021 Subsequent
years
Interest rate 56,000 - - - - - 56,000
The following table shows the fair value of the hedging instruments based on the nature of the contract, at 31 December 2017 and 2016:
Thousands of Euros
2017 2016
Assets Liabilities Assets Liabilities
Interest rate - 45,881 1,693 57,631
Exchange rate 7,593 3,605 1,168 17,124
Price 4,616 - 10,756 -
Non-qualified hedges 433,065 66,309 151,820 58,574
Total 445,274 115,795 165,437 133,329
The Group does not have any hedges of its foreign investments, since the foreign currency risk is hedged by the transactions performed in the local currency. Also, most significant foreign investments were made with long-term financing in which the interest rates on project financing debt are hedged. Cash flow hedges (interest rate) The purpose of using these derivatives is to limit changes in interest rates on its borrowings and to guarantee fixed interests rates, mainly by arranging interest rate swaps as the borrowings are arranged and used. Most hedges are interest rate swaps that expire at the same time or slightly sooner than the underlying that they are hedging. Hedges of this type are mainly related to the various syndicated loans within the Group and to project and other non-current financing, both at 31 December 2017 and 31 December 2016 (see Notes 17 and 18). In relation to syndicated loans, only hedges or EUR 1,200,000 thousand exist covering the syndicated loan of ACS, Actividades de Construcción y Servicios, S.A. Various interest rate swaps for the same amount were arranged maturing in February 2021.
Cash flow hedges (exchange rate) The foreign currency risk relates mainly to projects in which payments and/or collections are made in a currency other than the functional currency.
110
The most significant derivatives contracted correspond to Industrial Services and are derivatives relate to exchange rate hedges for foreign projects for a nominal amount of EUR 80,280 thousand in 2017 which mature in 2018 and 2019 (EUR 141,984 thousand in 2016 which mature in 2017 and 2018). Also noteworthy for their importance are the derivatives contracted from Hochtief for a notional amount of EUR 310,496 thousand, which mature between 2018 and 2020 (EUR 718,085 thousand in 2016, maturing between 2017 and 2019). Derivative instruments not classified as hedges The assets and liabilities relating to financial instruments not qualified as hedges include the fair value of the derivatives which do not meet hedging conditions. The most noteworthy income in this section relates to a conversion option on the fixed nominal amount of the Note for EUR 200 million with Masmovil to be exchanged for a equally fixed number, 4.8 million shares in Masmovil Ibercom, S.A. This is an American-style option which, as it depends on the moment en which the ACS Group exercises the conversion, it is recorded as a current asset. The subsequent valuation of the derivative is made with changes in the consolidated income statement. The value of this derivative at 31 December 2017 (see Note 10.03) amounts to EUR 286,739 thousand, and is recorded under “Derivative financial instruments” of the accompanying consolidated statement of financial position with a profit of the same amount recorded under “Changes in the fair value of financial instruments” in the accompanying consolidated income statement (see Note 28.05). It should be noted that there were embedded derivatives in the issues of bonds exchangeable for Iberdrola shares for a nominal amount of EUR 485,500 thousand (see Note 17), which were recognized at fair value with changes to their fair value posted to the income statement. The fair value of the derivatives related to the issue of convertible Iberdrola bonds amounted to EUR 59,266 thousand at 31 December 2017 (EUR 37,468 thousand at 31 December 2016) and was recognized under “Derivative financial instruments” in the accompanying consolidated statement of financial position. With regard to this financing, in order for the Group to be able to guarantee the possible future monetarization of the Iberdrola, S.A. shares, and ensure their share options can be settled in cash, a future sales agreement was entered into in the first quarter of 2016 for the purchase of 52.9 million American-style purchase options falling due in the last quarter of 2018 on Iberdrola shares and a further 37.09 million American-style call options on Iberdrola shares falling due in the first quarter of 2019. These American-style purchase options were made at a reference price of EUR 6.02 per share exercisable, at the option of ACS, in the period between the signing of the prepaid forward and the maturity of each bond issue (fourth quarter of 2018 and first quarter of 2019) on an equal number of shares in Iberdrola. This derivative was entered into with the aim of mitigating the risk of an increase in the debt associated with the bonds that might derive from a rise in the market price of Iberdrola shares. Doing so further strengthened the position for the transfer of all risks and benefits associated with Iberdrola’s share price. The derivative financial asset in the amount of the first disbursement was recognized as a current asset at the moment of its contracting in an amount of EUR 70.8 million. Subsequent valuation of the derivative is recorded by means of changes in the consolidated income statement that are fully offset in the consolidated income statement by the value of the embedded derivatives of the bonds. The market value of the American-style purchase options on Iberdrola shares at 31 December 2017 amounted to EUR 80,858 thousand (EUR 88,189 thousand at 31 December 2016), recorded under “Derivative financial instruments” (under current assets) on the accompanying consolidated statement of financial position. The global effect on the consolidated income statement of all these derivatives in relation to the issues of convertible Iberdrola bonds in fiscal year 2017 has not been significant, while in fiscal year 2016 it represented a gain of EUR 16,985 thousand (see Note 28.05). During the first half of 2017 ACS finalized the stock options plan for ACS shares, executing it as it enters into force (see Note 28.03). As a result, this has lead to revenue in the consolidated income statement of EUR 24,413 thousand corresponding to the reversal of liabilities registered at 31 December 2016 by this options plan as the plan had already been externalized with a financial entity. The financial institution had acquired these shares on the market to then be delivered to executives who are beneficiaries of the plan in accordance with the conditions included therein and at the exercise price of the option EUR 33.8992 per share). The change in fair value of this instrument has been included under “Changes in the fair value of financial instruments” in the accompanying consolidated income statement (see Note 28.05). In the contract with the financial institution, the latter did not assume any risk relating to the drop in the market price of the share below the exercise price assumed by ACS, Actividades de Construcción y Servicios, S.A. This put option in favor of the financial institution was recognized at fair value at the end of the reporting period and, therefore, the Group recognized a liability in profit or loss with respect to the value of the option in the previous year. The risk of an increase in the market price of the share is
Consolidated Financial Statements - ACS GROUP
111
not assumed by the financial institution or the Group, since, in this case, executives exercise their call option and directly acquire the shares from the financial institution, which agrees to sell them to the beneficiaries at the exercise price. ACS, Actividades de Construcción y Servicios, S.A., at 31 December 2017, holds derivatives on ACS shares with different financial entities with the aim that these are submitted to beneficiary directors under the Plan, as acquired through approvals granted by the ACS Annual General Meeting, upon the assignment thereto of a call option price. These derivatives do not fulfill the accounting requirements to qualify for hedge accounting, therefore their measurement is recorded by means of changes in the consolidated income statement. The change in fair value of this instrument is included under “Changes in the fair value of financial instruments” in the accompanying consolidated income statement (see Note 28.05). Pursuant to the contracts with the financing entities, the latter do not assume any risk arising from the decline of the share price below the call price. The fair value of the derivatives related to the ACS shares at 31 December 2017 amounted to EUR 19,635 thousand and was recognized under “Derivative financial instruments” (Current Assets) and EUR 4,374 thousand under “Derivative financial instruments” (current liabilities) (EUR 3,331 thousand under “Derivative financial instruments” (current assets) and EUR 24,413 thousand at 31 December 2016, under “Derivative financial instruments” (current liabilities) in the accompanying consolidated statement of financial position. The amounts provided as collateral (see Note 10.05) relating to the aforementioned derivatives arranged by the Group totaled EUR 485,894 thousand at 31 December 2017 (EUR 564,609 thousand at 31 December 2016). The Group has recognized both its own credit risk and that of the counterparty based on each derivative for all derivative instruments measured at fair value through profit or loss, in accordance with IFRS 13.
23. Trade and other payables This heading mainly includes the amounts outstanding for trade purchases and related costs, as well as customer advances for contract work amounting to EUR 1,448,432 thousand in 2017 (EUR 2,002,738 thousand in 2016) (see Note 12), and the amount of the work certified in advance was EUR 1,085,121 thousand in 2017 (EUR 1,133,547 thousand in 2016). The Group has signed confirming lines and similar contracts with various financial institutions to facilitate payment in advance to its suppliers, according to which, the supplier can exercise its right of recovery against the companies or Group entities, recovering the invoiced amount minus financial costs of discounts and fees applied by the aforementioned institutions and, in some cases, minus the amounts withheld in guarantee. The total amount of lines contracted amounts to EUR 1,659,116 thousand (EUR 1,527,218 at 31 December 2016), with a balance drawn down of EUR 612,207 thousand at 31 December 2017 (EUR 533,267 thousand at 31 December 2016). These contracts do not modify the main payment conditions thereof (interest rate, term or amount), which remain classified as trading liabilities. Disclosures on deferred payments to suppliers Final Provision Two of Law 31/2014, of 3 December The disclosures required by Final Provision Two of Law 31/2014, of 3 December are shown below, prepared in accordance with Resolution of 29 January 2016 of the Spanish Accounting and Audit Institute, concerning the information to be included in the financial statements with regard to the average period of payment to suppliers in trade transactions at national level:
2017 2016
Days
Average period of payment to suppliers 65 82
Ratio of transactions paid 66 84
Ratio of transactions pending payment 64 78
Thousands of Euros
Total payments made 2,403,985 2,626,562
Total payments pending 1,494,087 1,613,286
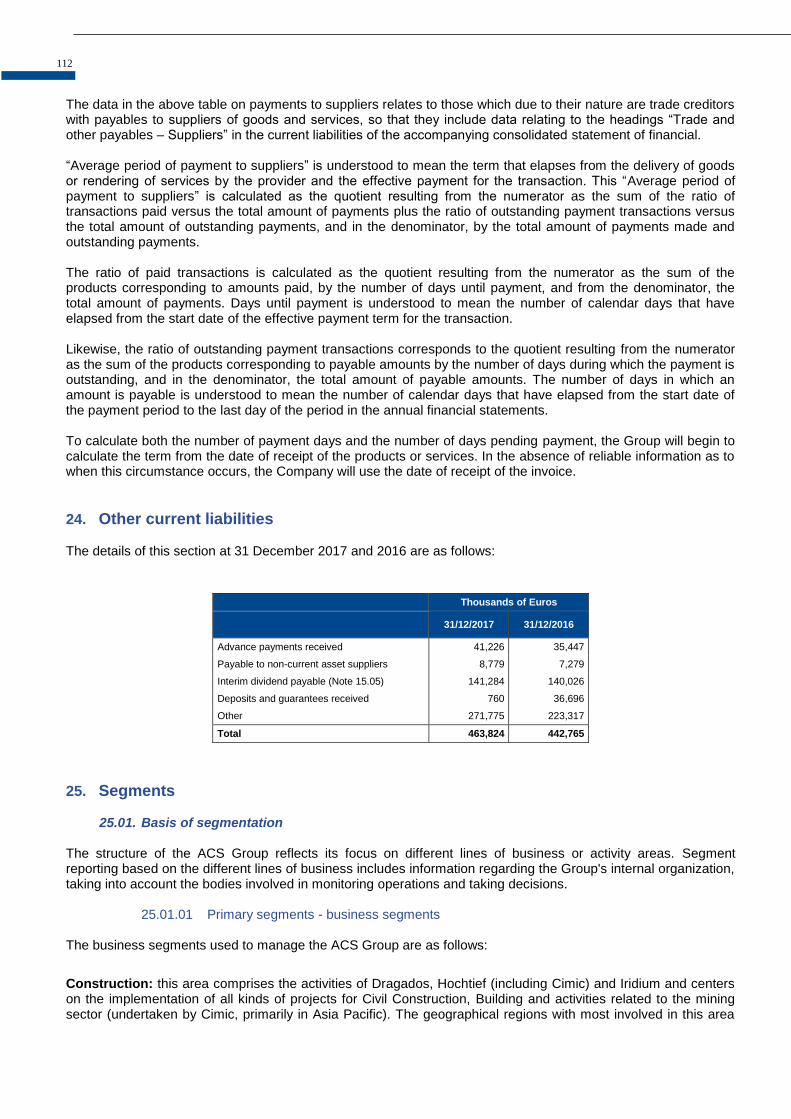
112
The data in the above table on payments to suppliers relates to those which due to their nature are trade creditors with payables to suppliers of goods and services, so that they include data relating to the headings “Trade and other payables – Suppliers” in the current liabilities of the accompanying consolidated statement of financial. “Average period of payment to suppliers” is understood to mean the term that elapses from the delivery of goods or rendering of services by the provider and the effective payment for the transaction. This “Average period of payment to suppliers” is calculated as the quotient resulting from the numerator as the sum of the ratio of transactions paid versus the total amount of payments plus the ratio of outstanding payment transactions versus the total amount of outstanding payments, and in the denominator, by the total amount of payments made and outstanding payments. The ratio of paid transactions is calculated as the quotient resulting from the numerator as the sum of the products corresponding to amounts paid, by the number of days until payment, and from the denominator, the total amount of payments. Days until payment is understood to mean the number of calendar days that have elapsed from the start date of the effective payment term for the transaction. Likewise, the ratio of outstanding payment transactions corresponds to the quotient resulting from the numerator as the sum of the products corresponding to payable amounts by the number of days during which the payment is outstanding, and in the denominator, the total amount of payable amounts. The number of days in which an amount is payable is understood to mean the number of calendar days that have elapsed from the start date of the payment period to the last day of the period in the annual financial statements. To calculate both the number of payment days and the number of days pending payment, the Group will begin to calculate the term from the date of receipt of the products or services. In the absence of reliable information as to when this circumstance occurs, the Company will use the date of receipt of the invoice.
24. Other current liabilities The details of this section at 31 December 2017 and 2016 are as follows:
Thousands of Euros
31/12/2017 31/12/2016
Advance payments received 41,226 35,447
Payable to non-current asset suppliers 8,779 7,279
Interim dividend payable (Note 15.05) 141,284 140,026
Deposits and guarantees received 760 36,696
Other 271,775 223,317
Total 463,824 442,765
25. Segments
25.01. Basis of segmentation The structure of the ACS Group reflects its focus on different lines of business or activity areas. Segment reporting based on the different lines of business includes information regarding the Group's internal organization, taking into account the bodies involved in monitoring operations and taking decisions.
25.01.01 Primary segments - business segments The business segments used to manage the ACS Group are as follows:
Construction: this area comprises the activities of Dragados, Hochtief (including Cimic) and Iridium and centers on the implementation of all kinds of projects for Civil Construction, Building and activities related to the mining sector (undertaken by Cimic, primarily in Asia Pacific). The geographical regions with most involved in this area

Consolidated Financial Statements - ACS GROUP
113
are North America, Asia Pacific and Europe, primarily operating in developed markets with good geopolitical, macroeconomic and legal security.
Industrial Services: the area dedicated to applied industrial engineering, implementing construction, maintenance and the operation of energy, industrial and mobility infrastructures through a wide group of companies led by the Cobra Group and Dragados Industrial. Services: this area solely comprises the integral building, public spaces and organization maintenance services provided by Clece, as well as personal assistance. This area is primarily based in Spain. Corporate Unit: Includes the corporate activity undertaken by ACS, Actividades de Construcción y Servicios, S.A.
25.01.02 Geographical segments
The ACS Group is managed by business segments making management based on geographical segments irrelevant. Accordingly, a distinction is made only between Spain and the rest of the world, in accordance with the stipulations of IFRS 8.
25.02. Basis and methodology for business segment reporting The reporting structure is designed in accordance with the effective management of the various segments comprising the ACS Group. Each segment has its own resources based on the entities engaging in the related business, and accordingly, has the assets required to operate the business. Each of the business segments relates mainly to a legal structure, in which the companies report to a holding company representing each activity for business purposes. Accordingly, each legal entity has the assets and resources required to perform its business activities in an autonomous manner. The following is the business segment reporting before the allocation of expenses to subsidiaries in the income statement.
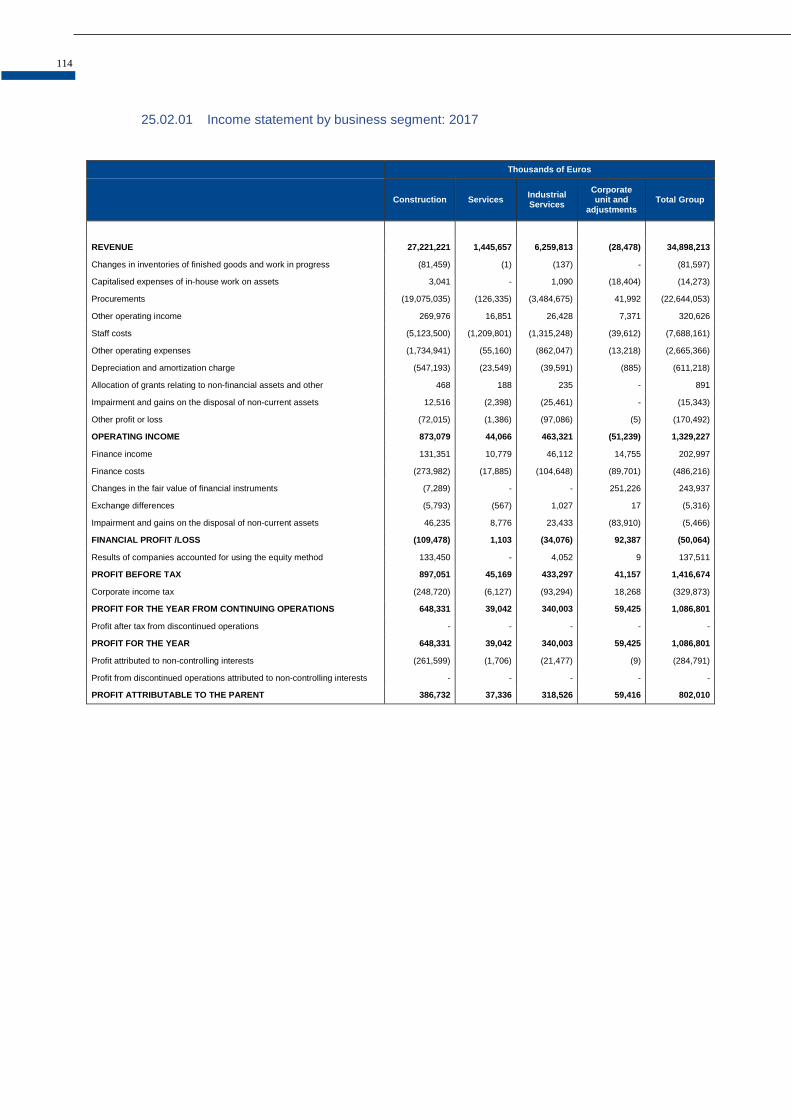
114
25.02.01 Income statement by business segment: 2017
Thousands of Euros
Construction Services Industrial Services
Corporate unit and
adjustments Total Group
REVENUE 27,221,221 1,445,657 6,259,813 (28,478) 34,898,213
Changes in inventories of finished goods and work in progress (81,459) (1) (137) - (81,597)
Capitalised expenses of in-house work on assets 3,041 - 1,090 (18,404) (14,273)
Procurements (19,075,035) (126,335) (3,484,675) 41,992 (22,644,053)
Other operating income 269,976 16,851 26,428 7,371 320,626
Staff costs (5,123,500) (1,209,801) (1,315,248) (39,612) (7,688,161)
Other operating expenses (1,734,941) (55,160) (862,047) (13,218) (2,665,366)
Depreciation and amortization charge (547,193) (23,549) (39,591) (885) (611,218)
Allocation of grants relating to non-financial assets and other 468 188 235 - 891
Impairment and gains on the disposal of non-current assets 12,516 (2,398) (25,461) - (15,343)
Other profit or loss (72,015) (1,386) (97,086) (5) (170,492)
OPERATING INCOME 873,079 44,066 463,321 (51,239) 1,329,227
Finance income 131,351 10,779 46,112 14,755 202,997
Finance costs (273,982) (17,885) (104,648) (89,701) (486,216)
Changes in the fair value of financial instruments (7,289) - - 251,226 243,937
Exchange differences (5,793) (567) 1,027 17 (5,316)
Impairment and gains on the disposal of non-current assets 46,235 8,776 23,433 (83,910) (5,466)
FINANCIAL PROFIT /LOSS (109,478) 1,103 (34,076) 92,387 (50,064)
Results of companies accounted for using the equity method 133,450 - 4,052 9 137,511
PROFIT BEFORE TAX 897,051 45,169 433,297 41,157 1,416,674
Corporate income tax (248,720) (6,127) (93,294) 18,268 (329,873)
PROFIT FOR THE YEAR FROM CONTINUING OPERATIONS 648,331 39,042 340,003 59,425 1,086,801
Profit after tax from discontinued operations - - - - -
PROFIT FOR THE YEAR 648,331 39,042 340,003 59,425 1,086,801
Profit attributed to non-controlling interests (261,599) (1,706) (21,477) (9) (284,791)
Profit from discontinued operations attributed to non-controlling interests - - - - -
PROFIT ATTRIBUTABLE TO THE PARENT 386,732 37,336 318,526 59,416 802,010
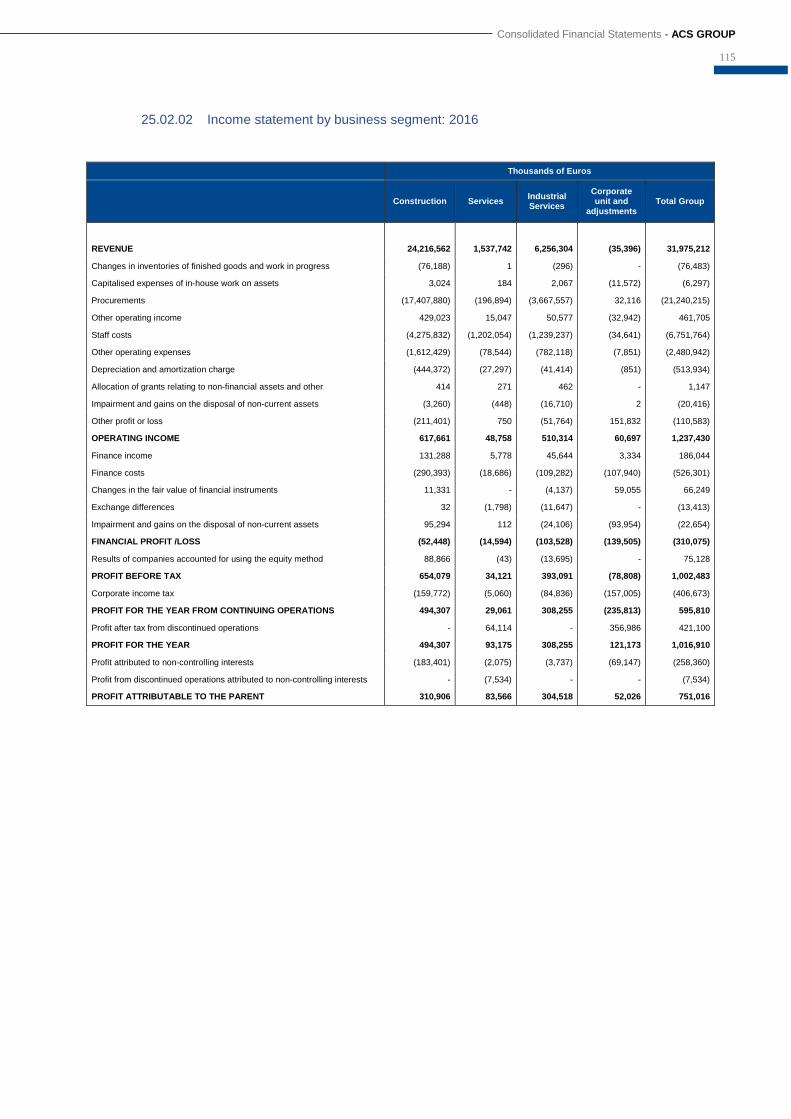
Consolidated Financial Statements - ACS GROUP
115
25.02.02 Income statement by business segment: 2016
Thousands of Euros
Construction Services Industrial Services
Corporate unit and
adjustments Total Group
REVENUE 24,216,562 1,537,742 6,256,304 (35,396) 31,975,212
Changes in inventories of finished goods and work in progress (76,188) 1 (296) - (76,483)
Capitalised expenses of in-house work on assets 3,024 184 2,067 (11,572) (6,297)
Procurements (17,407,880) (196,894) (3,667,557) 32,116 (21,240,215)
Other operating income 429,023 15,047 50,577 (32,942) 461,705
Staff costs (4,275,832) (1,202,054) (1,239,237) (34,641) (6,751,764)
Other operating expenses (1,612,429) (78,544) (782,118) (7,851) (2,480,942)
Depreciation and amortization charge (444,372) (27,297) (41,414) (851) (513,934)
Allocation of grants relating to non-financial assets and other 414 271 462 - 1,147
Impairment and gains on the disposal of non-current assets (3,260) (448) (16,710) 2 (20,416)
Other profit or loss (211,401) 750 (51,764) 151,832 (110,583)
OPERATING INCOME 617,661 48,758 510,314 60,697 1,237,430
Finance income 131,288 5,778 45,644 3,334 186,044
Finance costs (290,393) (18,686) (109,282) (107,940) (526,301)
Changes in the fair value of financial instruments 11,331 - (4,137) 59,055 66,249
Exchange differences 32 (1,798) (11,647) - (13,413)
Impairment and gains on the disposal of non-current assets 95,294 112 (24,106) (93,954) (22,654)
FINANCIAL PROFIT /LOSS (52,448) (14,594) (103,528) (139,505) (310,075)
Results of companies accounted for using the equity method 88,866 (43) (13,695) - 75,128
PROFIT BEFORE TAX 654,079 34,121 393,091 (78,808) 1,002,483
Corporate income tax (159,772) (5,060) (84,836) (157,005) (406,673)
PROFIT FOR THE YEAR FROM CONTINUING OPERATIONS 494,307 29,061 308,255 (235,813) 595,810
Profit after tax from discontinued operations - 64,114 - 356,986 421,100
PROFIT FOR THE YEAR 494,307 93,175 308,255 121,173 1,016,910
Profit attributed to non-controlling interests (183,401) (2,075) (3,737) (69,147) (258,360)
Profit from discontinued operations attributed to non-controlling interests - (7,534) - - (7,534)
PROFIT ATTRIBUTABLE TO THE PARENT 310,906 83,566 304,518 52,026 751,016
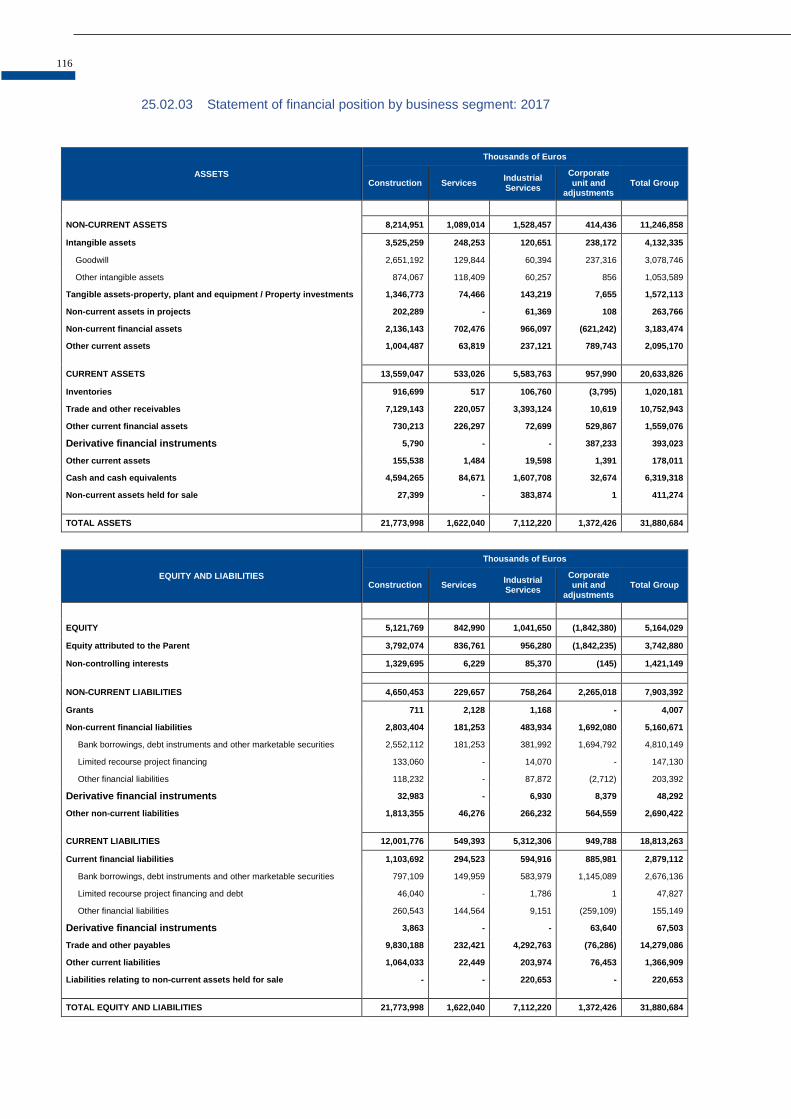
116
25.02.03 Statement of financial position by business segment: 2017
ASSETS
Thousands of Euros
Construction Services Industrial Services
Corporate unit and
adjustments Total Group
NON-CURRENT ASSETS 8,214,951 1,089,014 1,528,457 414,436 11,246,858
Intangible assets 3,525,259 248,253 120,651 238,172 4,132,335
Goodwill 2,651,192 129,844 60,394 237,316 3,078,746
Other intangible assets 874,067 118,409 60,257 856 1,053,589
Tangible assets-property, plant and equipment / Property investments 1,346,773 74,466 143,219 7,655 1,572,113
Non-current assets in projects 202,289 - 61,369 108 263,766
Non-current financial assets 2,136,143 702,476 966,097 (621,242) 3,183,474
Other current assets 1,004,487 63,819 237,121 789,743 2,095,170
CURRENT ASSETS 13,559,047 533,026 5,583,763 957,990 20,633,826
Inventories 916,699 517 106,760 (3,795) 1,020,181
Trade and other receivables 7,129,143 220,057 3,393,124 10,619 10,752,943
Other current financial assets 730,213 226,297 72,699 529,867 1,559,076
Derivative financial instruments 5,790 - - 387,233 393,023
Other current assets 155,538 1,484 19,598 1,391 178,011
Cash and cash equivalents 4,594,265 84,671 1,607,708 32,674 6,319,318
Non-current assets held for sale 27,399 - 383,874 1 411,274
TOTAL ASSETS 21,773,998 1,622,040 7,112,220 1,372,426 31,880,684
EQUITY AND LIABILITIES
Thousands of Euros
Construction Services Industrial Services
Corporate unit and
adjustments Total Group
EQUITY 5,121,769 842,990 1,041,650 (1,842,380) 5,164,029
Equity attributed to the Parent 3,792,074 836,761 956,280 (1,842,235) 3,742,880
Non-controlling interests 1,329,695 6,229 85,370 (145) 1,421,149
NON-CURRENT LIABILITIES 4,650,453 229,657 758,264 2,265,018 7,903,392
Grants 711 2,128 1,168 - 4,007
Non-current financial liabilities 2,803,404 181,253 483,934 1,692,080 5,160,671
Bank borrowings, debt instruments and other marketable securities 2,552,112 181,253 381,992 1,694,792 4,810,149
Limited recourse project financing 133,060 - 14,070 - 147,130
Other financial liabilities 118,232 - 87,872 (2,712) 203,392
Derivative financial instruments 32,983 - 6,930 8,379 48,292
Other non-current liabilities 1,813,355 46,276 266,232 564,559 2,690,422
CURRENT LIABILITIES 12,001,776 549,393 5,312,306 949,788 18,813,263
Current financial liabilities 1,103,692 294,523 594,916 885,981 2,879,112
Bank borrowings, debt instruments and other marketable securities 797,109 149,959 583,979 1,145,089 2,676,136
Limited recourse project financing and debt 46,040 - 1,786 1 47,827
Other financial liabilities 260,543 144,564 9,151 (259,109) 155,149
Derivative financial instruments 3,863 - - 63,640 67,503
Trade and other payables 9,830,188 232,421 4,292,763 (76,286) 14,279,086
Other current liabilities 1,064,033 22,449 203,974 76,453 1,366,909
Liabilities relating to non-current assets held for sale - - 220,653 - 220,653
TOTAL EQUITY AND LIABILITIES 21,773,998 1,622,040 7,112,220 1,372,426 31,880,684
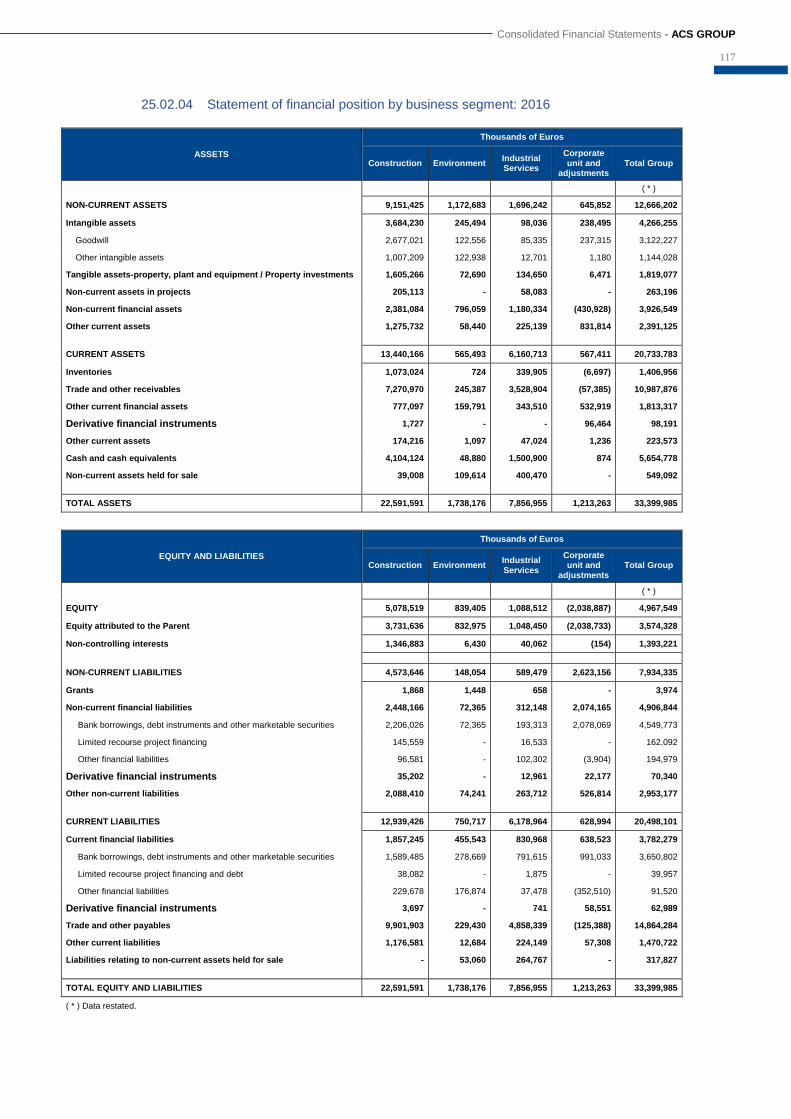
Consolidated Financial Statements - ACS GROUP
117
25.02.04 Statement of financial position by business segment: 2016
ASSETS
Thousands of Euros
Construction Environment Industrial Services
Corporate unit and
adjustments Total Group
( * )
NON-CURRENT ASSETS 9,151,425 1,172,683 1,696,242 645,852 12,666,202
Intangible assets 3,684,230 245,494 98,036 238,495 4,266,255
Goodwill 2,677,021 122,556 85,335 237,315 3,122,227
Other intangible assets 1,007,209 122,938 12,701 1,180 1,144,028
Tangible assets-property, plant and equipment / Property investments 1,605,266 72,690 134,650 6,471 1,819,077
Non-current assets in projects 205,113 - 58,083 - 263,196
Non-current financial assets 2,381,084 796,059 1,180,334 (430,928) 3,926,549
Other current assets 1,275,732 58,440 225,139 831,814 2,391,125
CURRENT ASSETS 13,440,166 565,493 6,160,713 567,411 20,733,783
Inventories 1,073,024 724 339,905 (6,697) 1,406,956
Trade and other receivables 7,270,970 245,387 3,528,904 (57,385) 10,987,876
Other current financial assets 777,097 159,791 343,510 532,919 1,813,317
Derivative financial instruments 1,727 - - 96,464 98,191
Other current assets 174,216 1,097 47,024 1,236 223,573
Cash and cash equivalents 4,104,124 48,880 1,500,900 874 5,654,778
Non-current assets held for sale 39,008 109,614 400,470 - 549,092
TOTAL ASSETS 22,591,591 1,738,176 7,856,955 1,213,263 33,399,985
EQUITY AND LIABILITIES
Thousands of Euros
Construction Environment Industrial Services
Corporate unit and
adjustments Total Group
( * )
EQUITY 5,078,519 839,405 1,088,512 (2,038,887) 4,967,549
Equity attributed to the Parent 3,731,636 832,975 1,048,450 (2,038,733) 3,574,328
Non-controlling interests 1,346,883 6,430 40,062 (154) 1,393,221
NON-CURRENT LIABILITIES 4,573,646 148,054 589,479 2,623,156 7,934,335
Grants 1,868 1,448 658 - 3,974
Non-current financial liabilities 2,448,166 72,365 312,148 2,074,165 4,906,844
Bank borrowings, debt instruments and other marketable securities 2,206,026 72,365 193,313 2,078,069 4,549,773
Limited recourse project financing 145,559 - 16,533 - 162,092
Other financial liabilities 96,581 - 102,302 (3,904) 194,979
Derivative financial instruments 35,202 - 12,961 22,177 70,340
Other non-current liabilities 2,088,410 74,241 263,712 526,814 2,953,177
CURRENT LIABILITIES 12,939,426 750,717 6,178,964 628,994 20,498,101
Current financial liabilities 1,857,245 455,543 830,968 638,523 3,782,279
Bank borrowings, debt instruments and other marketable securities 1,589,485 278,669 791,615 991,033 3,650,802
Limited recourse project financing and debt 38,082 - 1,875 - 39,957
Other financial liabilities 229,678 176,874 37,478 (352,510) 91,520
Derivative financial instruments 3,697 - 741 58,551 62,989
Trade and other payables 9,901,903 229,430 4,858,339 (125,388) 14,864,284
Other current liabilities 1,176,581 12,684 224,149 57,308 1,470,722
Liabilities relating to non-current assets held for sale - 53,060 264,767 - 317,827
TOTAL EQUITY AND LIABILITIES 22,591,591 1,738,176 7,856,955 1,213,263 33,399,985
( * ) Data restated.
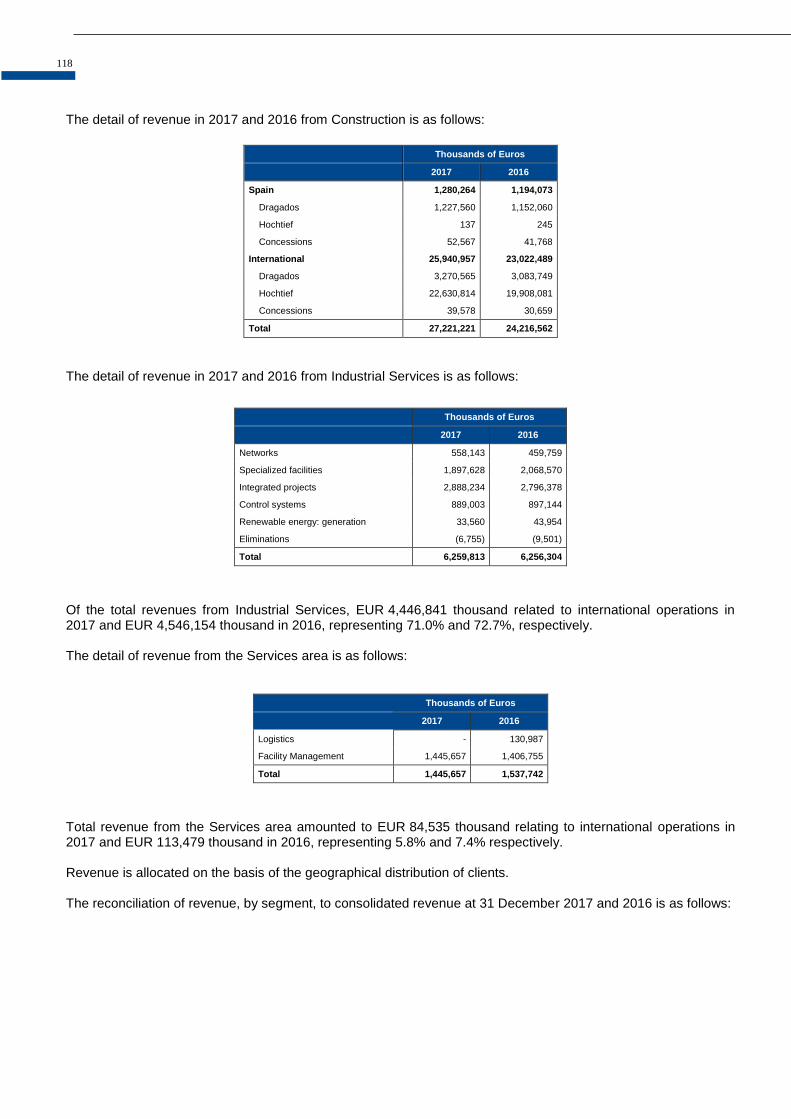
118
The detail of revenue in 2017 and 2016 from Construction is as follows:
Thousands of Euros
2017 2016
Spain 1,280,264 1,194,073
Dragados 1,227,560 1,152,060
Hochtief 137 245
Concessions 52,567 41,768
International 25,940,957 23,022,489
Dragados 3,270,565 3,083,749
Hochtief 22,630,814 19,908,081
Concessions 39,578 30,659
Total 27,221,221 24,216,562
The detail of revenue in 2017 and 2016 from Industrial Services is as follows:
Thousands of Euros
2017 2016
Networks 558,143 459,759
Specialized facilities 1,897,628 2,068,570
Integrated projects 2,888,234 2,796,378
Control systems 889,003 897,144
Renewable energy: generation 33,560 43,954
Eliminations (6,755) (9,501)
Total 6,259,813 6,256,304
Of the total revenues from Industrial Services, EUR 4,446,841 thousand related to international operations in 2017 and EUR 4,546,154 thousand in 2016, representing 71.0% and 72.7%, respectively. The detail of revenue from the Services area is as follows:
Thousands of Euros
2017 2016
Logistics - 130,987
Facility Management 1,445,657 1,406,755
Total 1,445,657 1,537,742
Total revenue from the Services area amounted to EUR 84,535 thousand relating to international operations in 2017 and EUR 113,479 thousand in 2016, representing 5.8% and 7.4% respectively. Revenue is allocated on the basis of the geographical distribution of clients. The reconciliation of revenue, by segment, to consolidated revenue at 31 December 2017 and 2016 is as follows:

Consolidated Financial Statements - ACS GROUP
119
Segments
Thousands of Euros
2017 2016
External income Inter-segment
income Total income External income
Inter-segment income
Total income
Construction 27,211,604 9,617 27,221,221 24,210,649 5,913 24,216,562
Services 1,443,285 2,372 1,445,657 1,535,561 2,181 1,537,742
Industrial Services 6,243,324 16,489 6,259,813 6,229,002 27,302 6,256,304
(-) Adjustments and eliminations of ordinary inter-segment income
- (28,478) (28,478) - (35,396) (35,396)
Total 34,898,213 - 34,898,213 31,975,212 - 31,975,212
Inter-segment sales are made at market prices. The reconciliation of the profit/loss, by business, with consolidated profit/loss before taxes at 31 December 2017 and 2016 is as follows:
Thousands of Euros
2017 2016
Segments
Construction 648,331 494,307
Services 39,042 93,175
Industrial Services 340,003 308,255
Total profit of the segments reported upon 1,027,376 895,737
(+/-) Non-assigned profit 59,425 113,639
(+/-) Elimination of internal profit (between segments) - -
(+/-) Other profits (loss) - -
(+/-) Income tax and / or profit (loss) from discontinued operations 329,873 (6,893)
Profit / (Loss) before tax 1,416,674 1,002,483
Revenue by geographical area at 31 December 2017 and 2016 is as follows:
Revenue by Geographical Area Thousands of Euros
2017 2016
Domestic market 4,427,347 4,293,089
Foreign market 30,470,866 27,682,123
a) European Union 2,476,227 2,537,567
b) O.E.C.D countries 23,192,902 20,273,155
c) Rest of countries 4,801,737 4,871,401
Total 34,898,213 31,975,212
The following table shows the detail by geographical area of certain of the Group's consolidated balances:
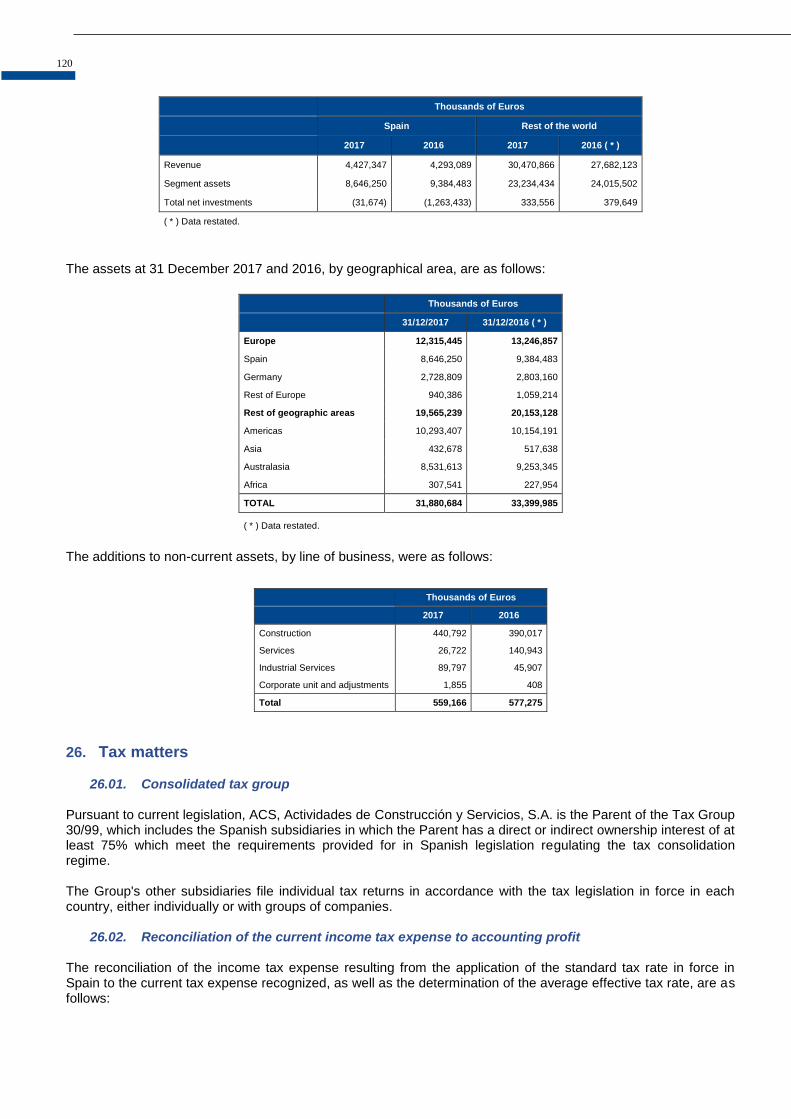
120
Thousands of Euros
Spain Rest of the world
2017 2016 2017 2016 ( * )
Revenue 4,427,347 4,293,089 30,470,866 27,682,123
Segment assets 8,646,250 9,384,483 23,234,434 24,015,502
Total net investments (31,674) (1,263,433) 333,556 379,649
( * ) Data restated.
The assets at 31 December 2017 and 2016, by geographical area, are as follows:
Thousands of Euros
31/12/2017 31/12/2016 ( * )
Europe 12,315,445 13,246,857
Spain 8,646,250 9,384,483
Germany 2,728,809 2,803,160
Rest of Europe 940,386 1,059,214
Rest of geographic areas 19,565,239 20,153,128
Americas 10,293,407 10,154,191
Asia 432,678 517,638
Australasia 8,531,613 9,253,345
Africa 307,541 227,954
TOTAL 31,880,684 33,399,985
( * ) Data restated.
The additions to non-current assets, by line of business, were as follows:
Thousands of Euros
2017 2016
Construction 440,792 390,017
Services 26,722 140,943
Industrial Services 89,797 45,907
Corporate unit and adjustments 1,855 408
Total 559,166 577,275
26. Tax matters
26.01. Consolidated tax group Pursuant to current legislation, ACS, Actividades de Construcción y Servicios, S.A. is the Parent of the Tax Group 30/99, which includes the Spanish subsidiaries in which the Parent has a direct or indirect ownership interest of at least 75% which meet the requirements provided for in Spanish legislation regulating the tax consolidation regime. The Group's other subsidiaries file individual tax returns in accordance with the tax legislation in force in each country, either individually or with groups of companies.
26.02. Reconciliation of the current income tax expense to accounting profit The reconciliation of the income tax expense resulting from the application of the standard tax rate in force in Spain to the current tax expense recognized, as well as the determination of the average effective tax rate, are as follows:
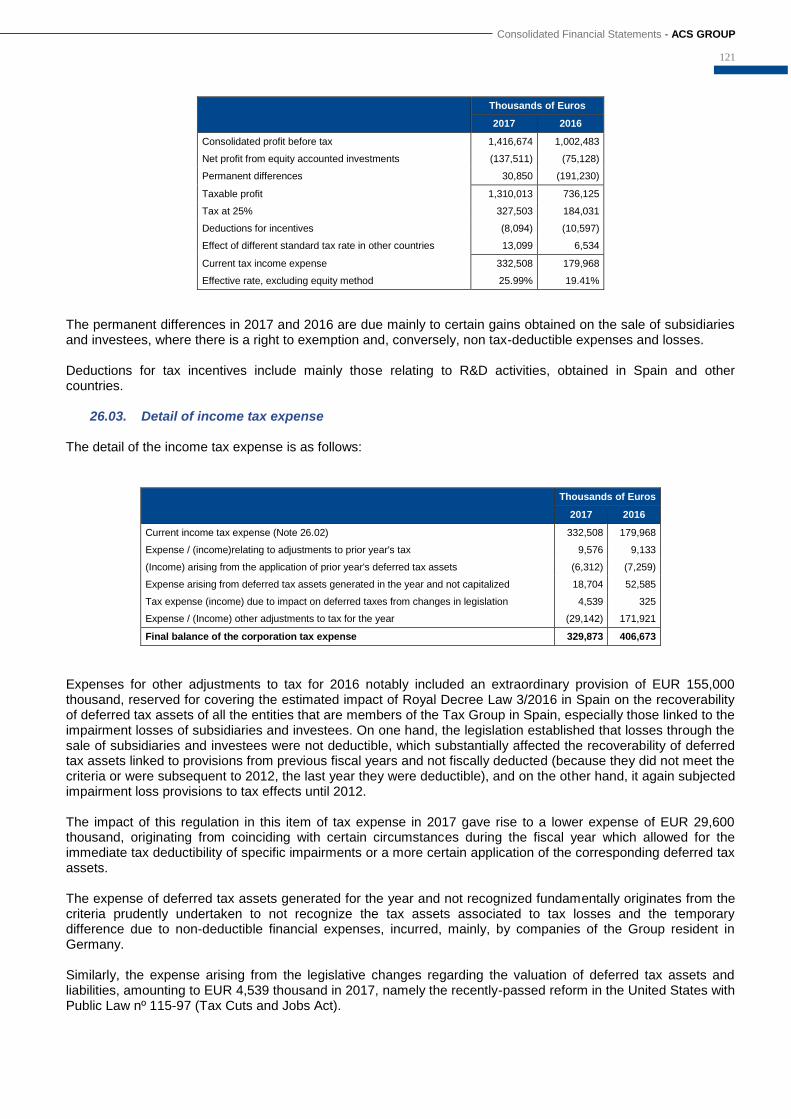
Consolidated Financial Statements - ACS GROUP
121
Thousands of Euros
2017 2016
Consolidated profit before tax 1,416,674 1,002,483
Net profit from equity accounted investments (137,511) (75,128)
Permanent differences 30,850 (191,230)
Taxable profit 1,310,013 736,125
Tax at 25% 327,503 184,031
Deductions for incentives (8,094) (10,597)
Effect of different standard tax rate in other countries 13,099 6,534
Current tax income expense 332,508 179,968
Effective rate, excluding equity method 25.99% 19.41%
The permanent differences in 2017 and 2016 are due mainly to certain gains obtained on the sale of subsidiaries and investees, where there is a right to exemption and, conversely, non tax-deductible expenses and losses. Deductions for tax incentives include mainly those relating to R&D activities, obtained in Spain and other countries.
26.03. Detail of income tax expense The detail of the income tax expense is as follows:
Thousands of Euros
2017 2016
Current income tax expense (Note 26.02) 332,508 179,968
Expense / (income)relating to adjustments to prior year's tax 9,576 9,133
(Income) arising from the application of prior year's deferred tax assets (6,312) (7,259)
Expense arising from deferred tax assets generated in the year and not capitalized 18,704 52,585
Tax expense (income) due to impact on deferred taxes from changes in legislation 4,539 325
Expense / (Income) other adjustments to tax for the year (29,142) 171,921
Final balance of the corporation tax expense 329,873 406,673
Expenses for other adjustments to tax for 2016 notably included an extraordinary provision of EUR 155,000 thousand, reserved for covering the estimated impact of Royal Decree Law 3/2016 in Spain on the recoverability of deferred tax assets of all the entities that are members of the Tax Group in Spain, especially those linked to the impairment losses of subsidiaries and investees. On one hand, the legislation established that losses through the sale of subsidiaries and investees were not deductible, which substantially affected the recoverability of deferred tax assets linked to provisions from previous fiscal years and not fiscally deducted (because they did not meet the criteria or were subsequent to 2012, the last year they were deductible), and on the other hand, it again subjected impairment loss provisions to tax effects until 2012. The impact of this regulation in this item of tax expense in 2017 gave rise to a lower expense of EUR 29,600 thousand, originating from coinciding with certain circumstances during the fiscal year which allowed for the immediate tax deductibility of specific impairments or a more certain application of the corresponding deferred tax assets. The expense of deferred tax assets generated for the year and not recognized fundamentally originates from the criteria prudently undertaken to not recognize the tax assets associated to tax losses and the temporary difference due to non-deductible financial expenses, incurred, mainly, by companies of the Group resident in Germany. Similarly, the expense arising from the legislative changes regarding the valuation of deferred tax assets and liabilities, amounting to EUR 4,539 thousand in 2017, namely the recently-passed reform in the United States with Public Law nº 115-97 (Tax Cuts and Jobs Act).
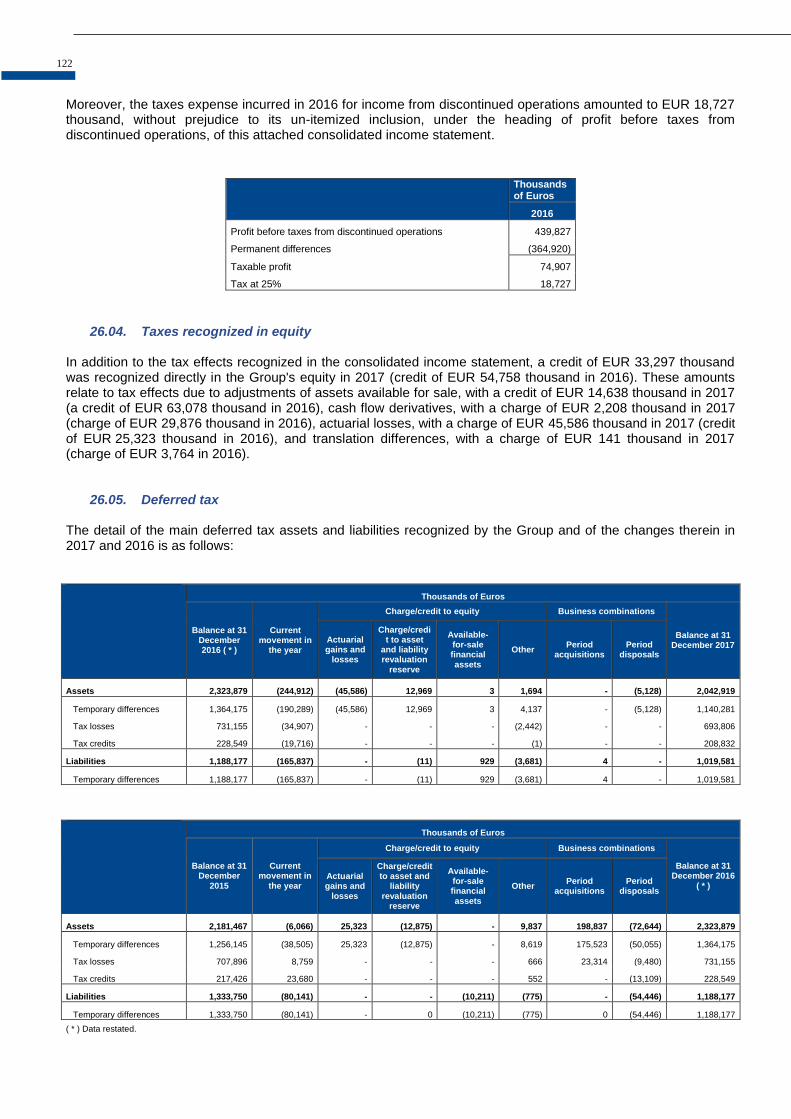
122
Moreover, the taxes expense incurred in 2016 for income from discontinued operations amounted to EUR 18,727 thousand, without prejudice to its un-itemized inclusion, under the heading of profit before taxes from discontinued operations, of this attached consolidated income statement.
Thousands of Euros
2016
Profit before taxes from discontinued operations 439,827
Permanent differences (364,920)
Taxable profit 74,907
Tax at 25% 18,727
26.04. Taxes recognized in equity In addition to the tax effects recognized in the consolidated income statement, a credit of EUR 33,297 thousand was recognized directly in the Group's equity in 2017 (credit of EUR 54,758 thousand in 2016). These amounts relate to tax effects due to adjustments of assets available for sale, with a credit of EUR 14,638 thousand in 2017 (a credit of EUR 63,078 thousand in 2016), cash flow derivatives, with a charge of EUR 2,208 thousand in 2017 (charge of EUR 29,876 thousand in 2016), actuarial losses, with a charge of EUR 45,586 thousand in 2017 (credit of EUR 25,323 thousand in 2016), and translation differences, with a charge of EUR 141 thousand in 2017 (charge of EUR 3,764 in 2016).
26.05. Deferred tax The detail of the main deferred tax assets and liabilities recognized by the Group and of the changes therein in 2017 and 2016 is as follows:
Thousands of Euros
Balance at 31 December 2016 ( * )
Current movement in
the year
Charge/credit to equity Business combinations
Balance at 31 December 2017
Actuarial gains and
losses
Charge/credit to asset
and liability revaluation
reserve
Available-for-sale financial assets
Other Period
acquisitions Period
disposals
Assets 2,323,879 (244,912) (45,586) 12,969 3 1,694 - (5,128) 2,042,919
Temporary differences 1,364,175 (190,289) (45,586) 12,969 3 4,137 - (5,128) 1,140,281
Tax losses 731,155 (34,907) - - - (2,442) - - 693,806
Tax credits 228,549 (19,716) - - - (1) - - 208,832
Liabilities 1,188,177 (165,837) - (11) 929 (3,681) 4 - 1,019,581
Temporary differences 1,188,177 (165,837) - (11) 929 (3,681) 4 - 1,019,581
Thousands of Euros
Balance at 31 December
2015
Current movement in
the year
Charge/credit to equity Business combinations
Balance at 31 December 2016
( * ) Actuarial gains and
losses
Charge/credit to asset and
liability revaluation
reserve
Available-for-sale financial assets
Other Period
acquisitions Period
disposals
Assets 2,181,467 (6,066) 25,323 (12,875) - 9,837 198,837 (72,644) 2,323,879
Temporary differences 1,256,145 (38,505) 25,323 (12,875) - 8,619 175,523 (50,055) 1,364,175
Tax losses 707,896 8,759 - - - 666 23,314 (9,480) 731,155
Tax credits 217,426 23,680 - - - 552 - (13,109) 228,549
Liabilities 1,333,750 (80,141) - - (10,211) (775) - (54,446) 1,188,177
Temporary differences 1,333,750 (80,141) - 0 (10,211) (775) 0 (54,446) 1,188,177
( * ) Data restated.
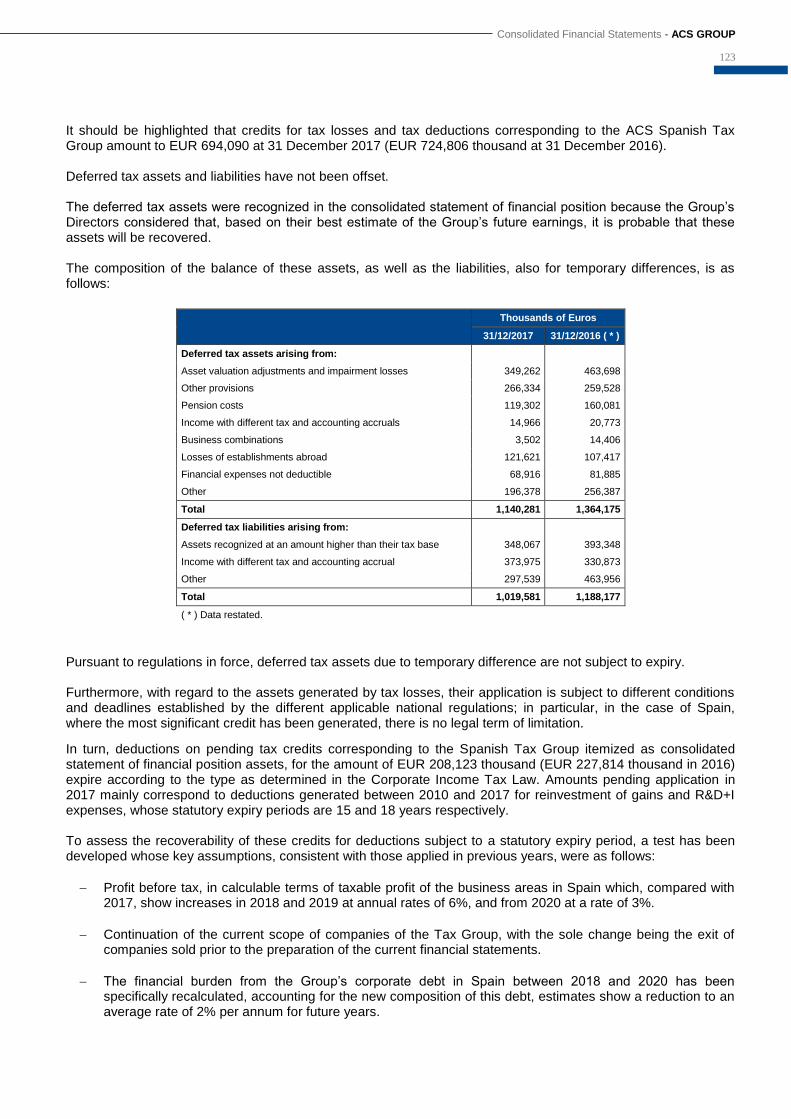
Consolidated Financial Statements - ACS GROUP
123
It should be highlighted that credits for tax losses and tax deductions corresponding to the ACS Spanish Tax Group amount to EUR 694,090 at 31 December 2017 (EUR 724,806 thousand at 31 December 2016). Deferred tax assets and liabilities have not been offset. The deferred tax assets were recognized in the consolidated statement of financial position because the Group’s Directors considered that, based on their best estimate of the Group’s future earnings, it is probable that these assets will be recovered. The composition of the balance of these assets, as well as the liabilities, also for temporary differences, is as follows:
Thousands of Euros
31/12/2017 31/12/2016 ( * )
Deferred tax assets arising from:
Asset valuation adjustments and impairment losses 349,262 463,698
Other provisions 266,334 259,528
Pension costs 119,302 160,081
Income with different tax and accounting accruals 14,966 20,773
Business combinations 3,502 14,406
Losses of establishments abroad 121,621 107,417
Financial expenses not deductible 68,916 81,885
Other 196,378 256,387
Total 1,140,281 1,364,175
Deferred tax liabilities arising from:
Assets recognized at an amount higher than their tax base 348,067 393,348
Income with different tax and accounting accrual 373,975 330,873
Other 297,539 463,956
Total 1,019,581 1,188,177
( * ) Data restated.
Pursuant to regulations in force, deferred tax assets due to temporary difference are not subject to expiry. Furthermore, with regard to the assets generated by tax losses, their application is subject to different conditions and deadlines established by the different applicable national regulations; in particular, in the case of Spain, where the most significant credit has been generated, there is no legal term of limitation.
In turn, deductions on pending tax credits corresponding to the Spanish Tax Group itemized as consolidated statement of financial position assets, for the amount of EUR 208,123 thousand (EUR 227,814 thousand in 2016) expire according to the type as determined in the Corporate Income Tax Law. Amounts pending application in 2017 mainly correspond to deductions generated between 2010 and 2017 for reinvestment of gains and R&D+I expenses, whose statutory expiry periods are 15 and 18 years respectively. To assess the recoverability of these credits for deductions subject to a statutory expiry period, a test has been developed whose key assumptions, consistent with those applied in previous years, were as follows:
Profit before tax, in calculable terms of taxable profit of the business areas in Spain which, compared with 2017, show increases in 2018 and 2019 at annual rates of 6%, and from 2020 at a rate of 3%.
Continuation of the current scope of companies of the Tax Group, with the sole change being the exit of companies sold prior to the preparation of the current financial statements.
The financial burden from the Group’s corporate debt in Spain between 2018 and 2020 has been specifically recalculated, accounting for the new composition of this debt, estimates show a reduction to an average rate of 2% per annum for future years.

124
It has been considered that in the next 10 years the temporary differences that will reduce the tax base of tax loss of affiliates and branches, financial and other expenses will be reversed by EUR 640 million approximately, an adjustment that restricts the use of deductions.
On the basis of these assumptions, the tax credits for deductions would be used before their expiry. Notwithstanding, it is worth noting that significant negative deviations between the aforementioned profits and the estimates used in the impairment test, in overall terms, i.e., that may not be offset by subsequent positive deviations within the expiration period, could represent a recoverability risk with regard to the tax credit. In particular, in accordance with the test conducted, negative variations in the profit from Spanish Tax Group in global terms, throughout the relevant period and with regard to the average profits generated during the last two fiscal years, would determine the start of the partial expiry of the deductions. In addition to the amounts recognized on the asset side of the statement of financial position, as detailed above, the Group has other deferred tax assets and tax credits not recognized on the asset side of the consolidated financial statement because it is impossible to predict the related future flows of profit, which are significant in the Group companies domiciled in Germany. Therefore, the tax assets relating to income tax loss carryforwards and temporary differences in financial expenses amounting to EUR 1,159,092 thousand (EUR 977,501 thousand in 2016), and to municipal taxes amounting to EUR 1,174,471 thousand (EUR 1,016,228 thousand in 2016) were not recognized.
26.06. Tax audit Under current legislation, taxes cannot be deemed to have been definitively settled until the tax returns filed have been reviewed by the tax authorities or until the statute-of-limitations period has expired. In 2016 the general verification proceedings initiated in 2014 by the Spanish State Tax Administration Agency on the parent company and several significant subsidiaries of the Spanish Tax Group affecting the 2009 to 2012 Income Tax and other taxes from 2010 to 2012 were completed. The adjustment records were filed with no material effect on ACS Group’s consolidated financial statements. In view of the varying interpretations that can be made of the applicable tax legislation, the outcome of the tax audits of the open years that could be conducted by the tax authorities in the future could give rise to tax liabilities which cannot be objectively quantified at the present time. However, the directors of the ACS Group consider that the liabilities that might arise, if any, would not have a material effect on the Group's earnings. In particular, the various matters that led to the adjustment record referred to above do not arise in tax returns of later years that remain open to verification.
27. Income The distribution of revenue relating to the Group's ordinary operations in 2017 and 2016, by business segment, is as follows:
Thousands of Euros
2017 2016
Construction 27,221,221 24,216,562
Industrial Services 6,259,813 6,256,304
Services 1,445,657 1,537,742
Corporate unit and other (28,478) (35,396)
Total 34,898,213 31,975,212
In 2017 foreign currency transactions relating to sales and services amounted to EUR 28,175,151 thousand (EUR 24,269,908 thousand in 2016) and those relating to purchases and services received amounted to EUR 20,537,575 thousand (EUR 18,370,496 thousand in 2016). The distribution of revenue relating to the Group's ordinary operations in 2017 and 2016, by the main countries where it operates, is as follows:

Consolidated Financial Statements - ACS GROUP
125
Revenue by Geographical Area
Thousands of Euros
2017 2016
United States 13,331,255 12,224,916
Australia 7,013,067 5,078,964
Spain 4,427,347 4,293,089
Hong Kong 1,419,681 1,601,934
Canada 1,206,035 1,049,931
Mexico 945,864 1,393,873
Germany 922,654 940,669
Saudi Arabia 613,711 648,619
Poland 492,803 492,015
Indonesia 481,341 396,635
Brazil 444,600 371,963
Chile 402,688 363,571
United Kingdom 345,619 361,600
Peru 334,227 322,285
South Africa 264,007 150,635
Czech Republic 213,765 175,967
Japan 210,915 79,836
Portugal 177,438 252,549
Other 1,651,196 1,776,161
Total 34,898,213 31,975,212
The backlog by line of business at 31 December 2017 and 2016 is as follows:
Thousands of Euros
31/12/2017 31/12/2016
Construction 55,529,171 55,769,414
Industrial Services 9,285,750 8,761,937
Services 2,266,693 1,994,953
Total 67,081,614 66,526,304
Capitalized expenses amounting to EUR 14,273 thousand (EUR 6,627 thousand in 2016), relating mainly to in-house work on property, plant and equipment and intangible assets, were recognized under "Capitalized expenses of in-house work on assets" in the consolidated income statement in 2017. "Other operating income" includes mainly the supplies billed to joint ventures in the Construction area, the activity in Poland through consortia (the operation of such “joint agreements” in that country means re-billing the partners for their percentage in accordance with their stake) along with grants related to income received by the Group. The details of this section at 31 December 2017 and 2016 are as follows:
Thousands of Euros
31/12/2017 31/12/2016
Construction 269,976 429,023
Industrial Services 26,428 50,577
Services 16,851 15,047
Corporate unit and adjustments 7,371 (32,942)
Total 320,626 461,705
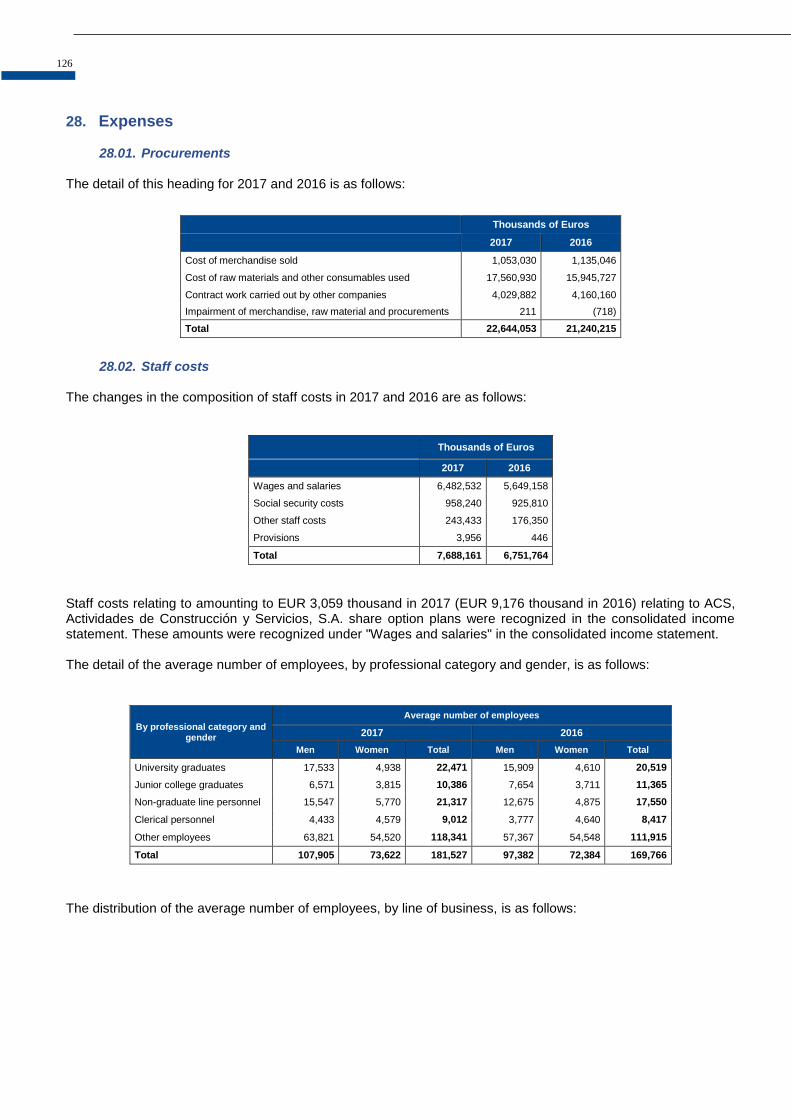
126
28. Expenses
28.01. Procurements The detail of this heading for 2017 and 2016 is as follows:
Thousands of Euros
2017 2016
Cost of merchandise sold 1,053,030 1,135,046
Cost of raw materials and other consumables used 17,560,930 15,945,727
Contract work carried out by other companies 4,029,882 4,160,160
Impairment of merchandise, raw material and procurements 211 (718)
Total 22,644,053 21,240,215
28.02. Staff costs The changes in the composition of staff costs in 2017 and 2016 are as follows:
Thousands of Euros
2017 2016
Wages and salaries 6,482,532 5,649,158
Social security costs 958,240 925,810
Other staff costs 243,433 176,350
Provisions 3,956 446
Total 7,688,161 6,751,764
Staff costs relating to amounting to EUR 3,059 thousand in 2017 (EUR 9,176 thousand in 2016) relating to ACS, Actividades de Construcción y Servicios, S.A. share option plans were recognized in the consolidated income statement. These amounts were recognized under "Wages and salaries" in the consolidated income statement. The detail of the average number of employees, by professional category and gender, is as follows:
By professional category and gender
Average number of employees
2017 2016
Men Women Total Men Women Total
University graduates 17,533 4,938 22,471 15,909 4,610 20,519
Junior college graduates 6,571 3,815 10,386 7,654 3,711 11,365
Non-graduate line personnel 15,547 5,770 21,317 12,675 4,875 17,550
Clerical personnel 4,433 4,579 9,012 3,777 4,640 8,417
Other employees 63,821 54,520 118,341 57,367 54,548 111,915
Total 107,905 73,622 181,527 97,382 72,384 169,766
The distribution of the average number of employees, by line of business, is as follows:

Consolidated Financial Statements - ACS GROUP
127
Average number of employees
2017 2016
Construction 67,543 57,607
Industrial Services 41,085 40,085
Services 72,846 72,022
Corporate Unit and other 53 52
Total 181,527 169,766
The average number of employees with disabilities in companies with headquarters in Spain of the ACS Group in 2017 amounts to 6,041 people (5,551 people in 2016). This represents 6.4% (5.9% in 2016) of ACS Group's national average workforce. The detail of the average number of employees, by gender and professional category with disabilities greater or equal to 33% in Spain is as follows:
Average number of employees with disabilities >33% in Spain
2017 2016
Men Women Total Men Women Total
University graduates 17 9 26 16 9 25
Junior college graduates 28 51 79 25 43 68
Non-graduate line personnel 76 124 200 67 90 157
Clerical personnel 50 91 141 51 87 138
Other employees 2,152 3,443 5,595 1,886 3,277 5,163
Total 2,323 3,718 6,041 2,045 3,506 5,551
28.03. Share-based remuneration systems ACS ACS, Actividades de Construcción y Servicios, S.A.’s Share Option Plan (Share Option Plan 2014), agreed at the proposal of the Appointments and Remuneration Committee in July 2014, matured during fiscal year 2017 and was governed as follows:
- The number of shares subject to the option plan was a maximum of 6,293,291 shares, of EUR 0.50 par value each.
- The beneficiaries were 62 executives with options from 540,950 to 46,472. - The acquisition price was EUR 33.8992 per share. This price would change by the corresponding amount
should a dilution take place. - The options were exercised in two equal parts, cumulative if the beneficiary so wishes, during the second
and third years after 1 May 2014, inclusive. However, in the case of an employee being terminated without just cause or if it is the beneficiary's own will, the options were able to be exercised six months following the event in question in the cases of death, retirement, early retirement or permanent disability, and after 30 days in all other cases.
- Tax withholdings and the taxes payable where applicable as a result of exercising the share options were borne exclusively by the beneficiaries.
All the pending options in the 2014 Share Options Plan were executed during fiscal year 2017 with an average weighted market price to beneficiaries of EUR 33.9851 per share. Remuneration from this plan relating to board members has amounted to EUR 78 thousand while remuneration corresponding to directors has amounted to EUR 179 thousand. Cover for the plan was provided through a financing entity (see Note 22). The stock market price of ACS shares at 31 December 2016 was EUR 30.020 per share.
128
The commitments arising from these plans were hedged through financial institutions (see Note 22). In relation to plan described above, the share options were to be settled through equity instruments and never in cash. However, since the Parent Company hedged the commitments arising from these plans with a financial institution, their settlement did not involve, under any circumstances, the issue of equity instruments additional to those outstanding at 31 December 2016. In 2017 EUR 3,059 thousand (see Note 28.02) (EUR 9,176 thousand in 2016) related to share-based remuneration were recognized under staff costs in the consolidated income statement, with a balancing entry in equity. For the calculation of the total cost of the aforementioned share plans, the Parent Company considered the financial cost of the shares on the date on which the plan was granted based upon the futures curve on the notional value of each of them, the effect of the estimate of future dividends during the period, as well as the “put” value granted to the financial institution by applying the Black Scholes formula. This cost is distributed over the years of plan irrevocability. HOCHTIEF Within the Hochtief Group there are also share-based payment remuneration systems for the group's management. All of these stock option plans form part of the remuneration system for Senior Executives of Hochtief, and long-term incentive plans. The total amount provisioned for these share-based payment plans at 31 December 2017 is EUR 12,365 thousand (EUR 15,574 thousand at 31 December 2016). EUR 5,299 thousand (EUR 5,537 thousand in 2016) were taken to the consolidated income statement in this connection in fiscal year 2017. To hedge the risk of exposure to changes in the market price of the Hochtief, A.G. shares, it has a number of derivatives which are not considered to be accounting hedges. The following share-based remuneration plans were in force for managerial staff of Hochtief, A.G. and its affiliates in 2017: Top Executive Retention Plan 2008 The Executive Board of Hochtief also resolved in June 2008 to launch a Top Executive Retention Plan 2008 (TERP 2008) for selected managerial employees. This plan was based on stock awards and consisted of three tranches. The first tranche was granted in July 2008, the second in July 2009, and the third in July 2010. The total term of the plan was ten years. The waiting period after the granting of each tranche was three years. The exercise period was between five and seven years, depending on the tranche. The conditions stipulated that, after the waiting period, entitled individuals received for each stock award either a Hochtief share or, at Hochtief Aktiengesellschaft’s discretion, a compensatory cash amount equal to the closing price of Hochtief stock on the last stock market trading day before the exercise date. The gain was capped for each year of the exercise period. The cap rose annually up to a maximum gain at the end of the term. The maximum gain was set to EUR 160 per stock award for the first tranche, EUR 81.65 for the second tranche, and EUR 166.27 for the third tranche. The first tranche was fully drawn in 2015, the third in 2016 and the second in 2017. Long-term incentive plan 2010 The Long-term Incentive Plan 2010 (LTIP 2010) was launched by resolution of the Supervisory Board and is open to Executive Board members and upper managerial employees of Hochtief Aktiengesellschaft and its investees. In addition to the granting of stock appreciation rights (SAR), the LTIP 2010 also provided for grants of stock awards. The SARs could only be exercised if, for at least ten consecutive stock market trading days before the exercise date, the ten-day average (arithmetic mean) stock market closing price of Hochtief stock were higher relative to the issue price compared with the ten-day average closing level of the MDAX index relative to the index base (relative performance threshold) and, additionally, return on net assets (RONA) in the then most recently approved set of consolidated financial statements were at least 10% (absolute performance threshold). The relative performance threshold was waived if the average stock market price of Hochtief stock exceeded the issue price by at least 10% on ten consecutive stock market trading days after the end of the waiting period. Provided that the targets were met, the SARs can be exercised at any time after a four-year waiting period except during a short period before publication of any business results. When SARs were exercised, the issuing entity paid out
Consolidated Financial Statements - ACS GROUP
129
the difference between the current stock price at that time and the issue price. The maximum gain was set at EUR 27.28 per SAR. The LTIP conditions for stock awards stipulated that for each stock award exercised within a two-year exercise period following a three-year waiting period, entitled individuals received at Hochtief Aktiengesellschaft’s discretion either a Hochtief share or a compensatory cash amount equal to the closing price of Hochtief stock on the last stock market trading day before the exercise date. The maximum gain on each stock award was limited to EUR 81.83 per stock award. The stock award plan concluded in 2015 and the SAR plan in 2017. Long-term incentive plan 2012 The Long-term Incentive Plan 2012 (LTIP 2012) was launched by resolution of the Supervisory Board in 2012 and is open to Executive Board members and upper managerial employees of Hochtief Aktiengesellschaft and its investees. The plan conditions differ from those of LTIP 2010 in two points: 1. Return on net assets (RONA) as per the most recently approved Consolidated Financial Statements must be at least 15%. 2. The waiting time for stock awards was extended from three to four years and the total term of the plan accordingly from five to six years. The gain is limited to EUR 25.27 per SAR and EUR 75.81 per stock award. Long-term incentive plan 2013 The Long-term Incentive Plan 2013 (LTIP 2013) was launched in that year by resolution of the Supervisory Board and is open to Executive Board members. The plan conditions differ from those of LTIP 2012 in only one point: The RONA performance target was replaced by a yield target linked to the adjusted free cash flow. The number of SARs that can be exercised depended on attainment of the planned value range for adjusted free cash flow. This value range is set in the business plan for each exercise year. The gain is limited to EUR 24.61 per SAR and EUR 73.83 per stock award. The plan was fully drawn down in 2017. Long-term incentive plan 2014 The Long-term Incentive Plan 2014 (LTIP 2014) was launched in that year by resolution of the Supervisory Board and was open to Executive Board members. The plan conditions do not differ in any material respect from those of LTIP 2013. The gain is limited to EUR 30.98 per SAR and EUR 92.93 per stock award. Long-term incentive plan 2015 The Long-term Incentive Plan 2015 (LTIP 2015) was launched in that year by resolution of the Supervisory Board and was open to Executive Board members. The plan conditions do not differ in any material respect from those of LTIP 2014. The gain is limited to EUR 31.68 per SAR and EUR 95.04 per stock award. Long-term incentive plan 2016 The Long-term Incentive Plan 2016 (LTIP 2016) was launched in that year by resolution of the Supervisory Board and is open to Executive Board members. The conditions of the plan differ from those of LTIP 2015 only as far as the grace period was reduced from four to three years and the total plan terms were proportionally reduced to six years (SAR) and five years (stock award).
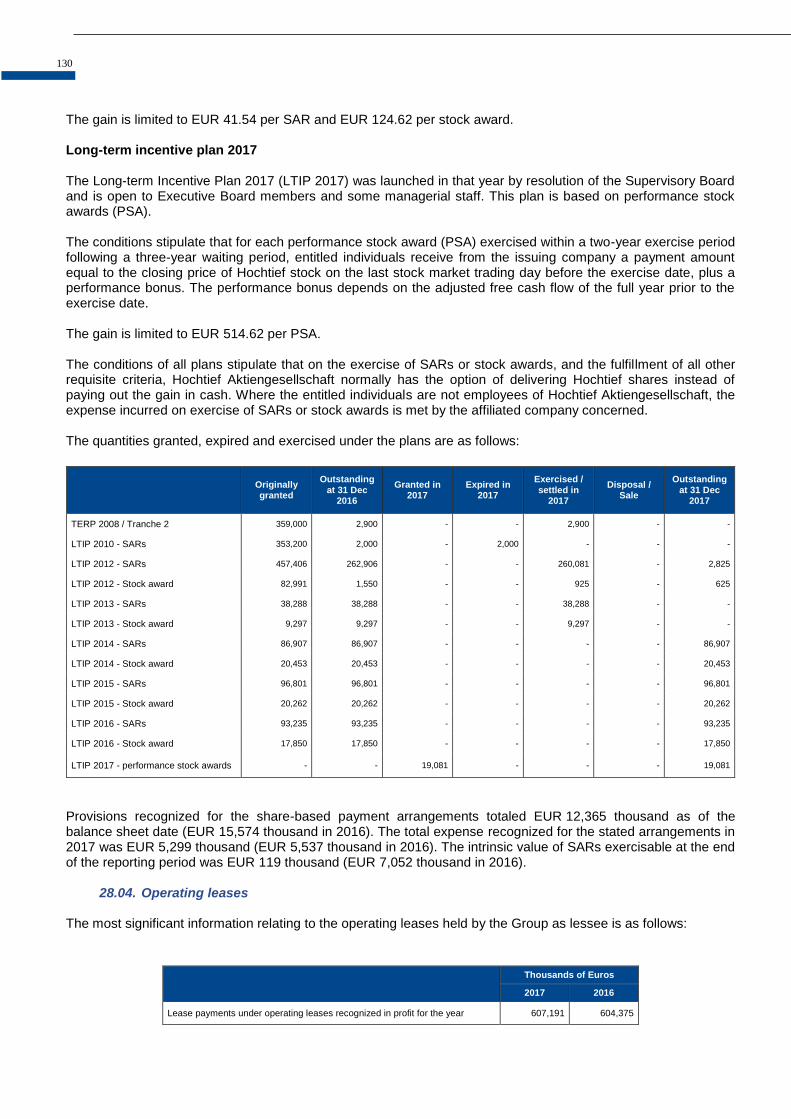
130
The gain is limited to EUR 41.54 per SAR and EUR 124.62 per stock award. Long-term incentive plan 2017 The Long-term Incentive Plan 2017 (LTIP 2017) was launched in that year by resolution of the Supervisory Board and is open to Executive Board members and some managerial staff. This plan is based on performance stock awards (PSA). The conditions stipulate that for each performance stock award (PSA) exercised within a two-year exercise period following a three-year waiting period, entitled individuals receive from the issuing company a payment amount equal to the closing price of Hochtief stock on the last stock market trading day before the exercise date, plus a performance bonus. The performance bonus depends on the adjusted free cash flow of the full year prior to the exercise date. The gain is limited to EUR 514.62 per PSA. The conditions of all plans stipulate that on the exercise of SARs or stock awards, and the fulfillment of all other requisite criteria, Hochtief Aktiengesellschaft normally has the option of delivering Hochtief shares instead of paying out the gain in cash. Where the entitled individuals are not employees of Hochtief Aktiengesellschaft, the expense incurred on exercise of SARs or stock awards is met by the affiliated company concerned. The quantities granted, expired and exercised under the plans are as follows:
Originally granted
Outstanding at 31 Dec
2016
Granted in 2017
Expired in 2017
Exercised / settled in
2017
Disposal / Sale
Outstanding at 31 Dec
2017
TERP 2008 / Tranche 2 359,000 2,900 - - 2,900 - -
LTIP 2010 - SARs 353,200 2,000 - 2,000 - - -
LTIP 2012 - SARs 457,406 262,906 - - 260,081 - 2,825
LTIP 2012 - Stock award 82,991 1,550 - - 925 - 625
LTIP 2013 - SARs 38,288 38,288 - - 38,288 - -
LTIP 2013 - Stock award 9,297 9,297 - - 9,297 - -
LTIP 2014 - SARs 86,907 86,907 - - - - 86,907
LTIP 2014 - Stock award 20,453 20,453 - - - - 20,453
LTIP 2015 - SARs 96,801 96,801 - - - - 96,801
LTIP 2015 - Stock award 20,262 20,262 - - - - 20,262
LTIP 2016 - SARs 93,235 93,235 - - - - 93,235
LTIP 2016 - Stock award 17,850 17,850 - - - - 17,850
LTIP 2017 - performance stock awards - - 19,081 - - - 19,081
Provisions recognized for the share-based payment arrangements totaled EUR 12,365 thousand as of the balance sheet date (EUR 15,574 thousand in 2016). The total expense recognized for the stated arrangements in 2017 was EUR 5,299 thousand (EUR 5,537 thousand in 2016). The intrinsic value of SARs exercisable at the end of the reporting period was EUR 119 thousand (EUR 7,052 thousand in 2016).
28.04. Operating leases The most significant information relating to the operating leases held by the Group as lessee is as follows:
Thousands of Euros
2017 2016
Lease payments under operating leases recognized in profit for the year 607,191 604,375

Consolidated Financial Statements - ACS GROUP
131
At the end of the reporting period, the Group had outstanding commitments for future minimum lease payments under non-cancellable operating leases, which fall due as follows:
Thousands of Euros
2017 2016
Within one year 267,378 239,845
Between two and five years 523,534 495,456
Over five years 172,784 219,643
The Group does not have any material operating leases as a lessor.
28.05. Changes in the fair value of financial instruments This heading includes the effect on the consolidated income statement of derivative instruments which do not meet the efficiency criteria provided in IAS 39, or which are not hedging instruments. The most significant effect of the 2017 fiscal year corresponds to the valuation at market price of the embedded derivatives on Masmovil shares, which entailed a net profit of EUR 219,337 thousand and the derivatives on ACS shares, the latter entailing a profit of EUR 32,193 thousand (EUR 43,263 thousand in 2016) as detailed in Note 22. Moreover in 2016, the valuation at market price of the Iberdrola derivatives resulted in a profit of EUR 16,985 thousand.
28.06. Financial income and financial costs The changes in financial expenses in 2017 and 2016 are as follows:
Financial expenses Millions of Euros % Millions of Euros %
2017 2016
Debt-related financial expenses 335.9 69 366.7 70
Linked to Gross Debt 320.4 66 350.1 67
From Debt linked to assets held for sale 15.5 3 16.6 3
Financial expenses for Collateral and Guarantees 53.5 11 68.4 13
Other financial expenses 96.8 20 91.2 17
Total 486.2 100 526.3 100
The changes in financial income in 2017 and 2016 are as follows:
Financial income Millions of Euros % Millions of Euros %
2017 2016
Linked to cash and cash equivalents 82.9 41 65.2 35
Dividends and Financial Income of Affiliates 84.8 42 82.4 44
Others 35.2 17 38.4 21
Total 202.9 100 186.0 100
28.07. Other profits or loss The most significant effect in fiscal years 2017 and 2016 relates to the costs incurred in the restructuring carried out in international investees as well as in other construction projects abroad, partly offset in 2016 by the reversal of the provision for certain assets generated in the Purchase Price Allocation process at the time of taking control of Hochtief for a net amount of EUR 66,678 thousand.

132
29. Impairment and gains or losses on disposal of financial instruments This section of the accompanying consolidated income statement mainly describes the gain in 2017 corresponding to the sale of Sintax in the amount of EUR 5,743 thousand, the sale of 80% of the indirect stake in certain concessionaires of the three hospitals in the Balearics in the amount of EUR 6,725 thousand and the sale of the Lestenergía wind farms in the amount of EUR 21,081 thousand. This heading in the accompanying consolidated income statement for fiscal year 2016 mainly highlighted the result of the execution of the prepaid forward sale of its entire holding in Iberdrola, S.A. and the simultaneous purchase of call options on the same number of Iberdrola shares to eliminate the market risk associated with the exchangeable bonds maturing in 2018 and 2019. As a result of the substantial transfer of the risks and benefits associated with the shares of Iberdrola, S.A., the ACS Group removes them from its consolidated statement of financial condition. The joint result of these transactions, together with the transfer to the consolidated income statement from the “Adjustments for changes in value – Available-for-sale financial assets” account under shareholders’ equity on the accompanying consolidated statement of financial position, triggered a pre-tax gain of EUR 95,326 thousand (see Note 10.01). Also noteworthy under this heading is the gain on the sale in December 2016 of the remaining 29% stake in Nextgen held by Cimic to Ontario Teachers' Pension Plan amounting to EUR 47.2 million (AUD 70.1 million).
30. Distribution of profit As in previous years, at the date of the call notice of the Annual General Meeting, the Parent's Board of Directors agreed to propose an alternative remuneration system allowing shareholders to receive bonus shares of the Company, or cash through the sale of the corresponding bonus issue rights. This option would be instrumented through an increase in paid-in capital, which will be subject to approval by the shareholders at the Annual General Meeting. In the event that it is approved, the increase in paid-in capital may be executed by the Board of Directors up to two times, in July and at the start of the following year, coinciding with the times when dividends are customarily paid. During each capital increase, each shareholder of the Company receives a bonus issue right for each share. The free allotment rights will be traded on the Madrid, Barcelona, Bilbao and Valencia stock exchanges. Depending on the alternative chosen, shareholders would be able to either receive additional bonus shares of the Company or sell their bonus issue rights on the market or sell them to the company at a specific price calculated using the formula to be established. The distribution of the profit for 2017 that the Board of Directors of the Parent will propose for approval by the shareholders at the Annual General Meeting is the transfer of voluntary reserves of the total profit for the year of ACS, Actividades de Construcción y Servicios, S.A. for an amount of EUR 654,495 thousand.
31. Earnings per share
31.01. Basic earnings per share Basic earnings per share are calculated by dividing the net profit attributable to the Group by the weighted average number of ordinary shares outstanding during the year, excluding the average number of treasury shares held in the year. Accordingly:
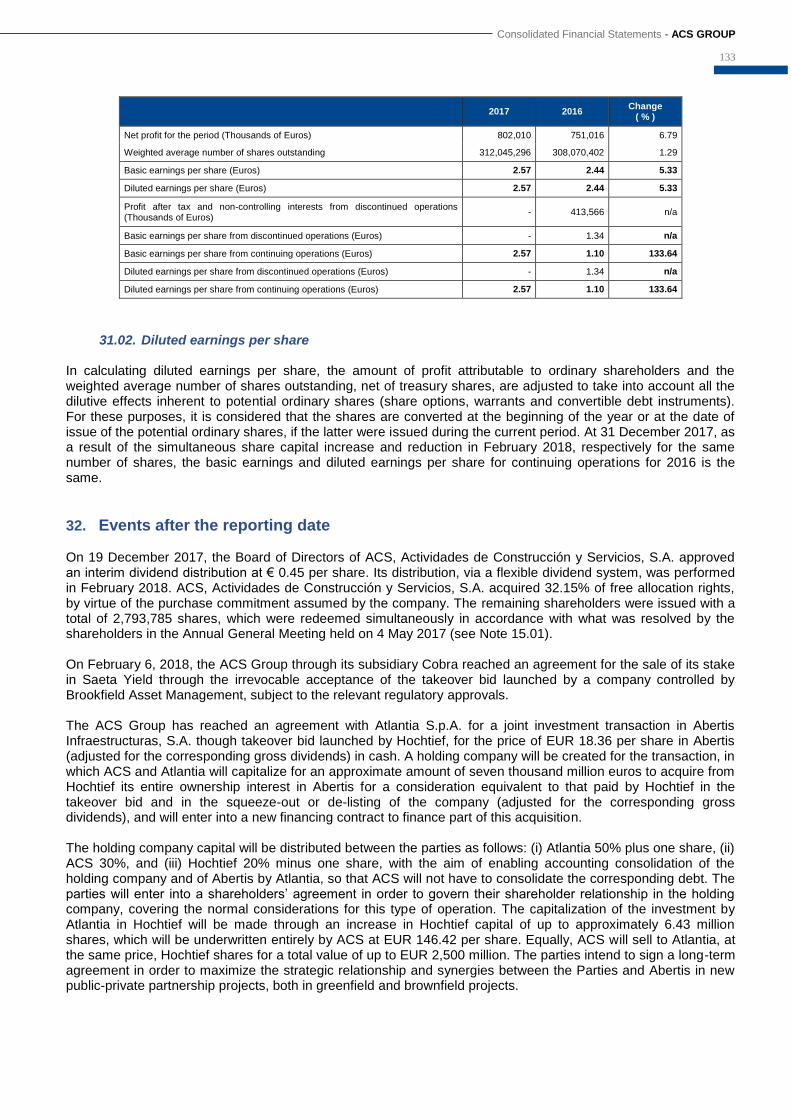
Consolidated Financial Statements - ACS GROUP
133
2017 2016 Change
( % )
Net profit for the period (Thousands of Euros) 802,010 751,016 6.79
Weighted average number of shares outstanding 312,045,296 308,070,402 1.29
Basic earnings per share (Euros) 2.57 2.44 5.33
Diluted earnings per share (Euros) 2.57 2.44 5.33
Profit after tax and non-controlling interests from discontinued operations (Thousands of Euros)
- 413,566 n/a
Basic earnings per share from discontinued operations (Euros) - 1.34 n/a
Basic earnings per share from continuing operations (Euros) 2.57 1.10 133.64
Diluted earnings per share from discontinued operations (Euros) - 1.34 n/a
Diluted earnings per share from continuing operations (Euros) 2.57 1.10 133.64
31.02. Diluted earnings per share In calculating diluted earnings per share, the amount of profit attributable to ordinary shareholders and the weighted average number of shares outstanding, net of treasury shares, are adjusted to take into account all the dilutive effects inherent to potential ordinary shares (share options, warrants and convertible debt instruments). For these purposes, it is considered that the shares are converted at the beginning of the year or at the date of issue of the potential ordinary shares, if the latter were issued during the current period. At 31 December 2017, as a result of the simultaneous share capital increase and reduction in February 2018, respectively for the same number of shares, the basic earnings and diluted earnings per share for continuing operations for 2016 is the same.
32. Events after the reporting date On 19 December 2017, the Board of Directors of ACS, Actividades de Construcción y Servicios, S.A. approved an interim dividend distribution at € 0.45 per share. Its distribution, via a flexible dividend system, was performed in February 2018. ACS, Actividades de Construcción y Servicios, S.A. acquired 32.15% of free allocation rights, by virtue of the purchase commitment assumed by the company. The remaining shareholders were issued with a total of 2,793,785 shares, which were redeemed simultaneously in accordance with what was resolved by the shareholders in the Annual General Meeting held on 4 May 2017 (see Note 15.01). On February 6, 2018, the ACS Group through its subsidiary Cobra reached an agreement for the sale of its stake in Saeta Yield through the irrevocable acceptance of the takeover bid launched by a company controlled by Brookfield Asset Management, subject to the relevant regulatory approvals. The ACS Group has reached an agreement with Atlantia S.p.A. for a joint investment transaction in Abertis Infraestructuras, S.A. though takeover bid launched by Hochtief, for the price of EUR 18.36 per share in Abertis (adjusted for the corresponding gross dividends) in cash. A holding company will be created for the transaction, in which ACS and Atlantia will capitalize for an approximate amount of seven thousand million euros to acquire from Hochtief its entire ownership interest in Abertis for a consideration equivalent to that paid by Hochtief in the takeover bid and in the squeeze-out or de-listing of the company (adjusted for the corresponding gross dividends), and will enter into a new financing contract to finance part of this acquisition. The holding company capital will be distributed between the parties as follows: (i) Atlantia 50% plus one share, (ii) ACS 30%, and (iii) Hochtief 20% minus one share, with the aim of enabling accounting consolidation of the holding company and of Abertis by Atlantia, so that ACS will not have to consolidate the corresponding debt. The parties will enter into a shareholders’ agreement in order to govern their shareholder relationship in the holding company, covering the normal considerations for this type of operation. The capitalization of the investment by Atlantia in Hochtief will be made through an increase in Hochtief capital of up to approximately 6.43 million shares, which will be underwritten entirely by ACS at EUR 146.42 per share. Equally, ACS will sell to Atlantia, at the same price, Hochtief shares for a total value of up to EUR 2,500 million. The parties intend to sign a long-term agreement in order to maximize the strategic relationship and synergies between the Parties and Abertis in new public-private partnership projects, both in greenfield and brownfield projects.

134
33. Related party transactions and balances Transactions between the Parent and its subsidiaries, which are related parties, have been eliminated on consolidation and are not disclosed in this Note. Transactions between the Group and its associates are disclosed below. Transactions between the Parent and its Subsidiaries and associates are disclosed in the Parent's individual financial statements. The Company performs all its transactions with related parties on an arm's length basis. Also, the transfer prices are adequately supported and, therefore, the Company's directors consider that there are no material risks in this connection that might give rise to significant liabilities in the future.
33.01. Transactions with Associates
During the year, Group companies performed the following transactions with related parties which do not form part of the Group:
Thousands of Euros
2017 2016
Sale of goods and services 150,894 111,875
Purchase of goods and services 838 6,332
Accounts receivable 1,274,689 1,518,255
Accounts payable 152,044 114,304
Transactions between related parties are carried under normal market conditions.
33.02. Balances and transactions with other related parties The following information relating to transactions with related parties is disclosed in accordance with the Spanish Ministry of Economy and Finance Order EHA/3050/2004, of 15 September, and applied through the Spanish National Securities Market Commission. Transactions between individuals, companies or Group entities related to Group shareholders or directors
Transactions carried out in 2017 are as follows (in thousands of euros):
2017 Related transactions Other related parties
Expenses and income Fidalser,
S.L.
Terratest Técnicas
Especiales, S.A.
Zardoya Otis, S.A.
Others Total
Management or collaboration agreements - 703 - - 703
Leases 208 - - - 208
Services received 116 2,341 1,629 - 4,086
Expenses 324 3,044 1,629 - 4,997
Services rendered - - 58 418 476
Income - - 58 418 476
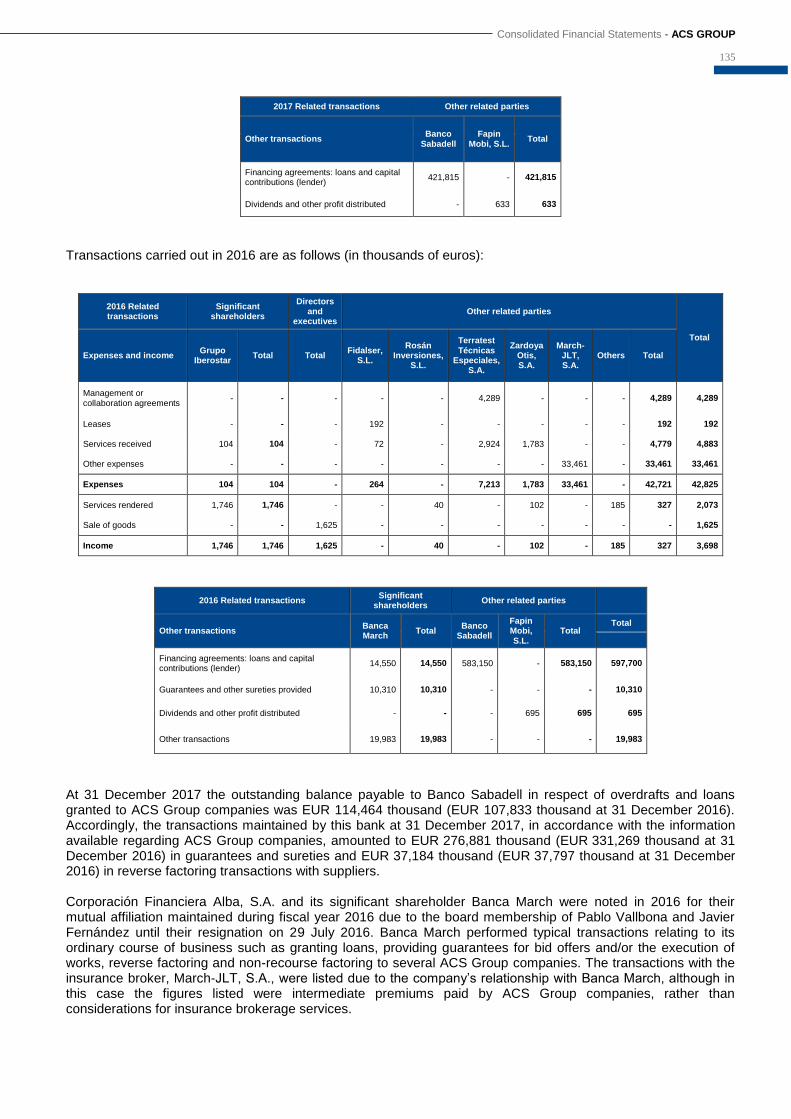
Consolidated Financial Statements - ACS GROUP
135
2017 Related transactions Other related parties
Other transactions Banco
Sabadell Fapin
Mobi, S.L. Total
Financing agreements: loans and capital contributions (lender)
421,815 - 421,815
Dividends and other profit distributed - 633 633
Transactions carried out in 2016 are as follows (in thousands of euros):
2016 Related transactions
Significant shareholders
Directors and
executives Other related parties
Total
Expenses and income Grupo
Iberostar Total Total
Fidalser, S.L.
Rosán Inversiones,
S.L.
Terratest Técnicas
Especiales, S.A.
Zardoya Otis, S.A.
March-JLT, S.A.
Others Total
Management or collaboration agreements
- - - - - 4,289 - - - 4,289 4,289
Leases - - - 192 - - - - - 192 192
Services received 104 104 - 72 - 2,924 1,783 - - 4,779 4,883
Other expenses - - - - - - - 33,461 - 33,461 33,461
Expenses 104 104 - 264 - 7,213 1,783 33,461 - 42,721 42,825
Services rendered 1,746 1,746 - - 40 - 102 - 185 327 2,073
Sale of goods - - 1,625 - - - - - - - 1,625
Income 1,746 1,746 1,625 - 40 - 102 - 185 327 3,698
2016 Related transactions Significant
shareholders Other related parties
Other transactions Banca March
Total Banco
Sabadell
Fapin Mobi, S.L.
Total Total
Financing agreements: loans and capital contributions (lender)
14,550 14,550 583,150 - 583,150 597,700
Guarantees and other sureties provided 10,310 10,310 - - - 10,310
Dividends and other profit distributed - - - 695 695 695
Other transactions 19,983 19,983 - - - 19,983
At 31 December 2017 the outstanding balance payable to Banco Sabadell in respect of overdrafts and loans granted to ACS Group companies was EUR 114,464 thousand (EUR 107,833 thousand at 31 December 2016). Accordingly, the transactions maintained by this bank at 31 December 2017, in accordance with the information available regarding ACS Group companies, amounted to EUR 276,881 thousand (EUR 331,269 thousand at 31 December 2016) in guarantees and sureties and EUR 37,184 thousand (EUR 37,797 thousand at 31 December 2016) in reverse factoring transactions with suppliers. Corporación Financiera Alba, S.A. and its significant shareholder Banca March were noted in 2016 for their mutual affiliation maintained during fiscal year 2016 due to the board membership of Pablo Vallbona and Javier Fernández until their resignation on 29 July 2016. Banca March performed typical transactions relating to its ordinary course of business such as granting loans, providing guarantees for bid offers and/or the execution of works, reverse factoring and non-recourse factoring to several ACS Group companies. The transactions with the insurance broker, March-JLT, S.A., were listed due to the company’s relationship with Banca March, although in this case the figures listed were intermediate premiums paid by ACS Group companies, rather than considerations for insurance brokerage services.
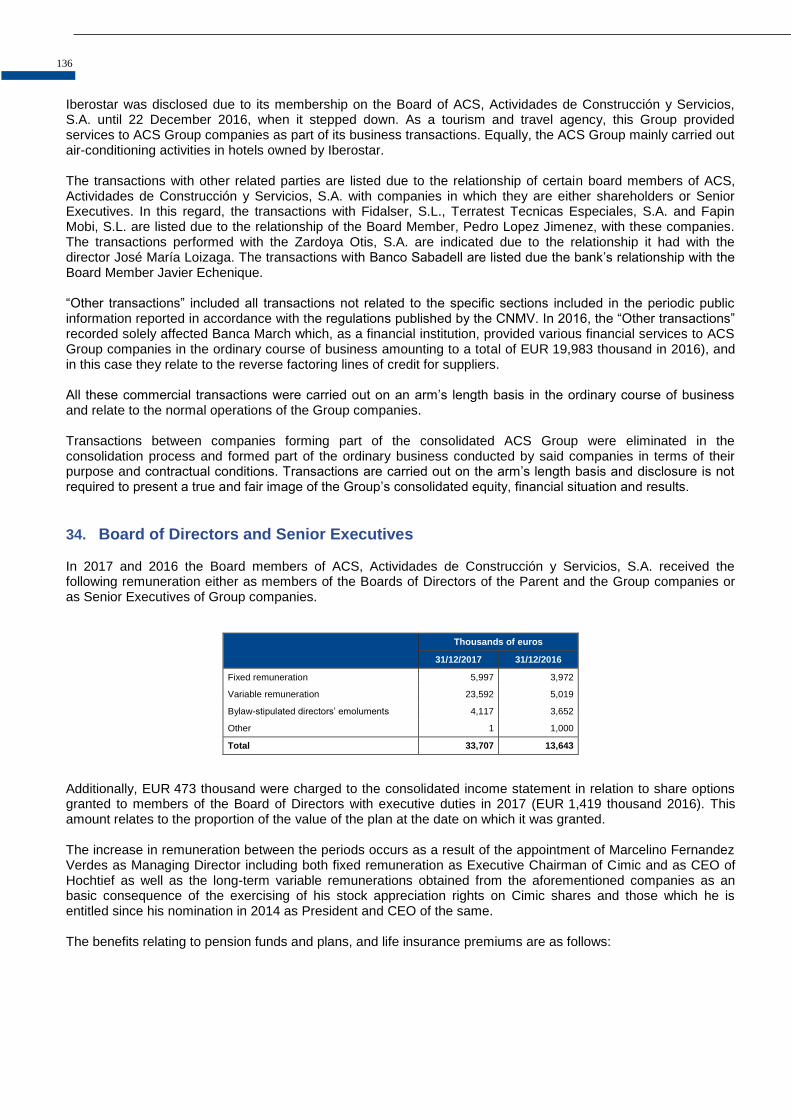
136
Iberostar was disclosed due to its membership on the Board of ACS, Actividades de Construcción y Servicios, S.A. until 22 December 2016, when it stepped down. As a tourism and travel agency, this Group provided services to ACS Group companies as part of its business transactions. Equally, the ACS Group mainly carried out air-conditioning activities in hotels owned by Iberostar. The transactions with other related parties are listed due to the relationship of certain board members of ACS, Actividades de Construcción y Servicios, S.A. with companies in which they are either shareholders or Senior Executives. In this regard, the transactions with Fidalser, S.L., Terratest Tecnicas Especiales, S.A. and Fapin Mobi, S.L. are listed due to the relationship of the Board Member, Pedro Lopez Jimenez, with these companies. The transactions performed with the Zardoya Otis, S.A. are indicated due to the relationship it had with the director José María Loizaga. The transactions with Banco Sabadell are listed due the bank’s relationship with the Board Member Javier Echenique. “Other transactions” included all transactions not related to the specific sections included in the periodic public information reported in accordance with the regulations published by the CNMV. In 2016, the “Other transactions” recorded solely affected Banca March which, as a financial institution, provided various financial services to ACS Group companies in the ordinary course of business amounting to a total of EUR 19,983 thousand in 2016), and in this case they relate to the reverse factoring lines of credit for suppliers. All these commercial transactions were carried out on an arm’s length basis in the ordinary course of business and relate to the normal operations of the Group companies. Transactions between companies forming part of the consolidated ACS Group were eliminated in the consolidation process and formed part of the ordinary business conducted by said companies in terms of their purpose and contractual conditions. Transactions are carried out on the arm’s length basis and disclosure is not required to present a true and fair image of the Group’s consolidated equity, financial situation and results.
34. Board of Directors and Senior Executives In 2017 and 2016 the Board members of ACS, Actividades de Construcción y Servicios, S.A. received the following remuneration either as members of the Boards of Directors of the Parent and the Group companies or as Senior Executives of Group companies.
Thousands of euros
31/12/2017 31/12/2016
Fixed remuneration 5,997 3,972
Variable remuneration 23,592 5,019
Bylaw-stipulated directors’ emoluments 4,117 3,652
Other 1 1,000
Total 33,707 13,643
Additionally, EUR 473 thousand were charged to the consolidated income statement in relation to share options granted to members of the Board of Directors with executive duties in 2017 (EUR 1,419 thousand 2016). This amount relates to the proportion of the value of the plan at the date on which it was granted. The increase in remuneration between the periods occurs as a result of the appointment of Marcelino Fernandez Verdes as Managing Director including both fixed remuneration as Executive Chairman of Cimic and as CEO of Hochtief as well as the long-term variable remunerations obtained from the aforementioned companies as an basic consequence of the exercising of his stock appreciation rights on Cimic shares and those which he is entitled since his nomination in 2014 as President and CEO of the same. The benefits relating to pension funds and plans, and life insurance premiums are as follows:

Consolidated Financial Statements - ACS GROUP
137
Other benefits Thousands of euros
31/12/2017 31/12/2016
Pension funds and plans: Contributions 1,904 1,673
Life insurance premiums 23 20
The amount recognized under "Pension funds and plans: Contributions” includes the portion corresponding to the net payments made by the Parent during the fiscal year. In addition, since ACS’s Managing Director’s appointment at the Annual General Meeting on 4 May 2017 as Hochtief, A.G. Executive Board member, he has rights to a pension commitment from that company by way of an individual contract specifying a minimum provision at the retirement age of 65 as described in Note 20 in relation to German pension plans. Pension costs borne by Hochtief in 2017 amounted to EUR 1,916 thousand. In addition to the costs borne by Hochtief, there is a pension provision for EUR 821 thousand in Spain. The ACS Group has not granted any advances, loans or guarantees to any of the board members.
34.01. Transactions with members of the Board of Directors The transactions with members of the Board of Directors or with companies in which they have an ownership interest giving rise to a relation with the ACS Group are indicated in Note 33.02 on transactions with related parties.
34.02. Remuneration of Senior Executives
The remuneration in fiscal years 2017 and 2016 of the Group’s Senior Executives who are not also Executive Directors was as follows:
Thousands of euros
31/12/2017 31/12/2016
Salary remuneration (fixed and variable) 29,047 28,135
Pension plans 1,879 1,704
Life insurances 37 28
At 31 December 2017, EUR 2,585 thousand have been charged to the income statement in relation to share options granted to the Group's Senior Executives (EUR 7,756 thousand at 31 December 2016), and these are not contained in the previously mentioned remuneration. Similarly, as indicated in the case of directors, these amounts relate to the proportion of the value of the plan on the date it was granted.
35. Other disclosures concerning the Board of Directors
In accordance with the information held by the Company, no situations of direct or indirect conflict with the interests of the Company have arisen pursuant to applicable regulations (currently, Article 229 of the Spanish Capital Companies Law), all without prejudice to the information on related transactions contained in the notes to the financial statements. The amount corresponding to the civil liability insurance premium covering the Directors of the Parent, as well as other insured persons, amounts to EUR 375 thousand in 2017 (EUR 461 thousand in 2016). In 2017 and 2016, the Company had commercial relationships with companies in which certain of its directors perform management functions. All these commercial relationships were carried out on an arm’s-length basis in the ordinary course of business, and related to ordinary Company transactions.
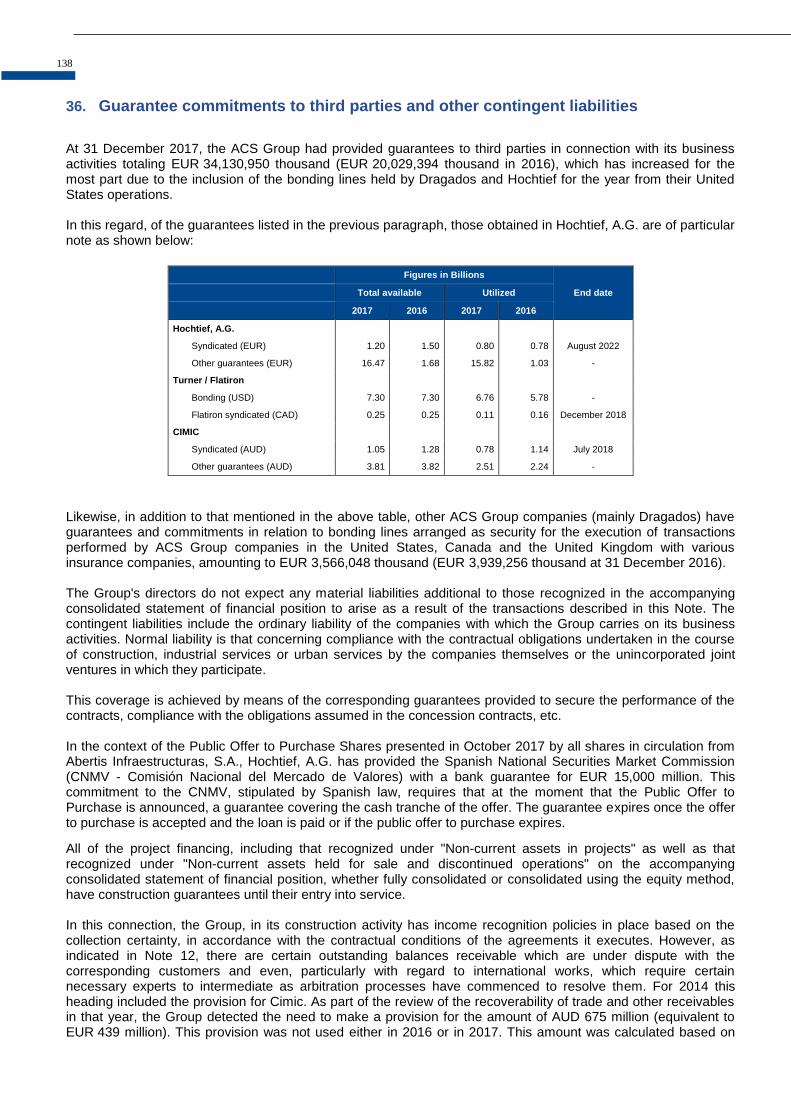
138
36. Guarantee commitments to third parties and other contingent liabilities
At 31 December 2017, the ACS Group had provided guarantees to third parties in connection with its business activities totaling EUR 34,130,950 thousand (EUR 20,029,394 thousand in 2016), which has increased for the most part due to the inclusion of the bonding lines held by Dragados and Hochtief for the year from their United States operations. In this regard, of the guarantees listed in the previous paragraph, those obtained in Hochtief, A.G. are of particular note as shown below:
Figures in Billions
End date Total available Utilized
2017 2016 2017 2016
Hochtief, A.G.
Syndicated (EUR) 1.20 1.50 0.80 0.78 August 2022
Other guarantees (EUR) 16.47 1.68 15.82 1.03 -
Turner / Flatiron
Bonding (USD) 7.30 7.30 6.76 5.78 -
Flatiron syndicated (CAD) 0.25 0.25 0.11 0.16 December 2018
CIMIC
Syndicated (AUD) 1.05 1.28 0.78 1.14 July 2018
Other guarantees (AUD) 3.81 3.82 2.51 2.24 -
Likewise, in addition to that mentioned in the above table, other ACS Group companies (mainly Dragados) have guarantees and commitments in relation to bonding lines arranged as security for the execution of transactions performed by ACS Group companies in the United States, Canada and the United Kingdom with various insurance companies, amounting to EUR 3,566,048 thousand (EUR 3,939,256 thousand at 31 December 2016). The Group's directors do not expect any material liabilities additional to those recognized in the accompanying consolidated statement of financial position to arise as a result of the transactions described in this Note. The contingent liabilities include the ordinary liability of the companies with which the Group carries on its business activities. Normal liability is that concerning compliance with the contractual obligations undertaken in the course of construction, industrial services or urban services by the companies themselves or the unincorporated joint ventures in which they participate. This coverage is achieved by means of the corresponding guarantees provided to secure the performance of the contracts, compliance with the obligations assumed in the concession contracts, etc. In the context of the Public Offer to Purchase Shares presented in October 2017 by all shares in circulation from Abertis Infraestructuras, S.A., Hochtief, A.G. has provided the Spanish National Securities Market Commission (CNMV - Comisión Nacional del Mercado de Valores) with a bank guarantee for EUR 15,000 million. This commitment to the CNMV, stipulated by Spanish law, requires that at the moment that the Public Offer to Purchase is announced, a guarantee covering the cash tranche of the offer. The guarantee expires once the offer to purchase is accepted and the loan is paid or if the public offer to purchase expires.
All of the project financing, including that recognized under "Non-current assets in projects" as well as that recognized under "Non-current assets held for sale and discontinued operations" on the accompanying consolidated statement of financial position, whether fully consolidated or consolidated using the equity method, have construction guarantees until their entry into service. In this connection, the Group, in its construction activity has income recognition policies in place based on the collection certainty, in accordance with the contractual conditions of the agreements it executes. However, as indicated in Note 12, there are certain outstanding balances receivable which are under dispute with the corresponding customers and even, particularly with regard to international works, which require certain necessary experts to intermediate as arbitration processes have commenced to resolve them. For 2014 this heading included the provision for Cimic. As part of the review of the recoverability of trade and other receivables in that year, the Group detected the need to make a provision for the amount of AUD 675 million (equivalent to EUR 439 million). This provision was not used either in 2016 or in 2017. This amount was calculated based on
Consolidated Financial Statements - ACS GROUP
139
the client portfolio and considered the residual value of the risks evaluated through their exposure due to the potential non-recovery of pending receivables. The Group continues to maintain its collection rights in each individually considered project, and undertakes to pursue the recovery of all outstanding amounts. Both the investment of ACS Group in Alazor and the accounts receivable for Alazor have been fully provided for in the Consolidated Financial Statements of the ACS Group for 2017. In addition, in February 2014 the Group received a notice of guarantee enforcement towards Desarrollo de Concesiones Viarias Uno, S.L. and ACS, Actividades de Construcción y Servicios, S.A. from the financial institutions, amounting to EUR 73,350 thousand (including both the principal and estimated costs), which was recorded under “Other current financial assets” in the consolidated statement of financial position and which has been consigned to the account of Madrid First Tier Tribunal no. 51. In March 2015, the court issued an order rejecting the opposition to the enforcement and ordering delivery of these amounts to the banks, provisionally effective in May 2016, transferring to these institutions the amount corresponding to the principal claimed. Through an order on 19 September 2017, the Audiencia Provincial considered the appeal against the enforcement delivery, overturning it and ordering the lifting of all measures adopted by the Court, with costs payable by the implementors. In fulfillment of the Order of the Audiencia Provincial, the implementors have reintegrated the amounts received. Thus, the shareholder Desarrollo de Concesiones Viarias Uno, S.L. has received a total of EUR 87.854 thousand (the difference with the amount initially assigned follows the acquisition by said company in October 2016 of the 3.9% stake of Iperpista in Alazor) in various payments made between 12 December 2017 and 6 February 2018. On the matter of the declaratory proceeding brought by the financial institutions against the shareholders of Alazor claiming the payment of funds to Accesos de Madrid in compliance with the agreements on the financing of excess expropriation and other costs, a favorable ruling was obtained in the first instance that was appealed by the Banks, and the National Court of Appeal confirmed the ruling in the second instance on 27 November 2015. The Banks proceeded to file an appeal to the Supreme Court it has not yet pronounced it will hear the appeal. With regard to the insolvency proceedings, it is noted that although the agreement proposal corresponding to Accesos de Madrid obtained support in excess of 75%, as it also wished the agreement to be approved with the parent Alazor but which did not obtain the necessary support, the Juzgado de lo Mercantil Nº6 (Commercial Court) judge ordered the entry into liquidation of the two concessionaires on 2 November 2017. The Judge declared the company administrators should cease, the dissolution of the Companies and the early maturity of all credits, requesting the respective liquidators to present their Liquidation Plans, which they did on 24 November 2017 for Accesos de Madrid and on 28 December 2017 for Alazor. In the plans of both liquidators, the effective delivery of the operation to Sociedad Estatal de Infraestructuras del Transporte Terrestre, S.A. will take place during the first quarter of 2018. The Company currently values this investment at zero, and does not consider it necessary to record additional provisions, as the Group has issued no guarantees in relation to this project. As there was insufficient quorum to approve the proposed Agreement, the judge ruled that TP Ferro should enter into liquidation in 2016. At the end of 2016, the States (France and Spain) gave notice of the commencement of the administrative termination proceedings of the concession contract, ending the concession and assuming management of the infrastructure from 2017. The States have not yet provided the result of the calculation of the amount subject to compensation for the termination of the concession, in clear breach of the Concession Contract which stipulates 6 months after termination. On 16 January 2017, the Liquidation Plan for TP Ferro was approved. In March 2017, a report was issued proposing the qualification of the insolvency proceedings as a force majeure, to which there were no claims received. From the Liquidator’s successive reports, it can be inferred that they have initiated various proceedings against TP Ferro, essentially without repercussions for the Group. In relation to the concession agreement of the Lima Metro Line 2 Project in Peru, on 16 January 2017 the concessionaire Metro de Lima Línea 2, S.A. (in which Iridium Concesiones de Infraestructuras, S.A. holds a 25% stake) filed an application for arbitration against the Republic of Peru (Ministry of Transport and Communications) before the International Center for the Settlement of Investment Disputes between States and Nationals of other States (ICSID) for serious breach by the Republic of Peru in the concession agreement mainly consisting of: (i) the non-delivery of the Concession Area in the terms and conditions established in the concession agreement, and (ii) the lack of approval and delayed approval of the Detailed Engineering Studies. Through the petition presented by the concessionaire on 23 January 2018, an extension of the implementation period for the Project

140
works and compensation for damages in excess of USD 400 million have been requested, which include damages incurred by different participants in the Project (construction group, rolling stock supplier, etc.) whose legitimacy to claim these could be called into question. The arbitration ruling is likely to be issued in July 2019. On 3 December 2015, the CNMC (Spanish National Commission for Markets and Competition) delivered a judgment in the proceedings against various companies, including Dragados, S.A., for alleged restrictive practices to competition in relation to the modular construction business. The amount of the decision, which totals EUR 8.6 million, it was the subject of an appeal filed during 2016. The Group’s Management considers that its potential effect will not be significant. Through the Group company Escal UGS, S.L., the Group is involved in a series of processes which are described here:
- In November 2015, Escal UGS, S.L. submitted an appeal against the General Directorate of Energy and Mining Policy on 18 November on the grounds that they believed the approved compensation was unreasonable. In January 2017, an administrative appeal was lodged which at the date of these financial accounts had not yet been ruled on.
- In December 2014, the Prosecution Service brought proceedings for an alleged offense against the environment and natural resources as a result of microseisms detected in the Castor gas storage area. This claim is currently in the early stages and the judge has not yet set the date for any ruling.
Based on the above-described proceedings and the opinion of their legal advisers, the Group’s Directors, consider that the outcome of these would not produce a significant adverse effect on the consolidated financial statements for the fiscal years when they are decided. Additionally, on 21 December 2017, the Spanish Constitutional Court issued a ruling for which partial provision is being made. Essentially, certain articles of RDL13/2014 have been declared void, the Court ruling that the enabling budget (criteria of extraordinary and urgent need) did not apply in the case of the amendment to the Decree-Law. The Group, with the support of its legal advisors, does not consider that there will be any negative impact resulting from this situation.
37. Information on the environment The ACS combines its business aims with the objective of protecting the environment and appropriately managing the expectations of its stakeholders in this area. The environmental policy of ACS defines general guidelines that are sufficiently flexible as to accommodate the elements of policy and planning developed by the companies in the different business areas and to comply with the requirements of the ISO 14001 Standard. These guidelines include:
- Commitment to complying with the legislation. - Commitment to preventing pollution. - Commitment to continuous improvement. - Commitment to transparency, communication and the training of Group employees, suppliers, clients and
other stakeholders. The significant level of implementation of an environmental management system, present in companies representing 96.8% of Group sales, is based on the objective of seeking adoption of the ISO 14001 standard in the majority of the Group’s activities, which is implemented in 76.4% of ACS Group sales. In order to be able articulate and deploy a policy on these environmental commitments, the most significant are identified at corporate level and are compared with each company's management system and the environmental priorities for each business. Specifically and operationally, the key environmental measures are ( * ):
- the fight against climate change - efficient use of resources
- respect for biodiversity.
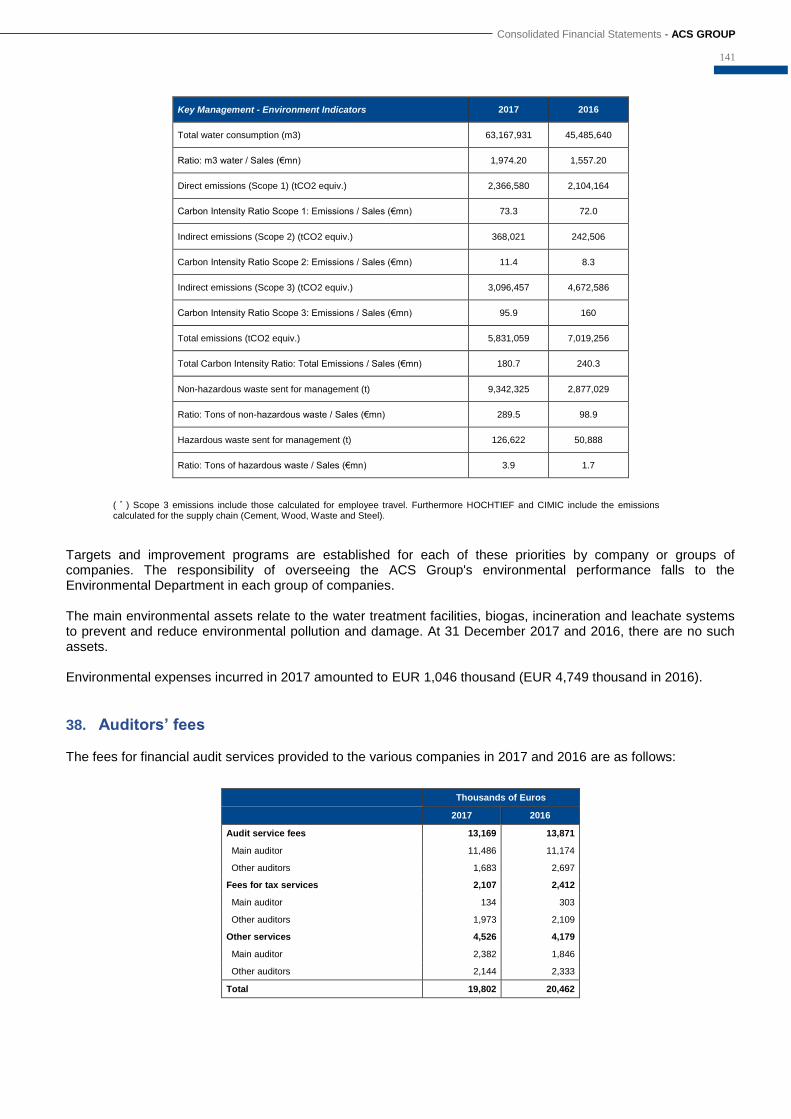
Consolidated Financial Statements - ACS GROUP
141
Key Management - Environment Indicators 2017 2016
Total water consumption (m3) 63,167,931 45,485,640
Ratio: m3 water / Sales (€mn) 1,974.20 1,557.20
Direct emissions (Scope 1) (tCO2 equiv.) 2,366,580 2,104,164
Carbon Intensity Ratio Scope 1: Emissions / Sales (€mn) 73.3 72.0
Indirect emissions (Scope 2) (tCO2 equiv.) 368,021 242,506
Carbon Intensity Ratio Scope 2: Emissions / Sales (€mn) 11.4 8.3
Indirect emissions (Scope 3) (tCO2 equiv.) 3,096,457 4,672,586
Carbon Intensity Ratio Scope 3: Emissions / Sales (€mn) 95.9 160
Total emissions (tCO2 equiv.) 5,831,059 7,019,256
Total Carbon Intensity Ratio: Total Emissions / Sales (€mn) 180.7 240.3
Non-hazardous waste sent for management (t) 9,342,325 2,877,029
Ratio: Tons of non-hazardous waste / Sales (€mn) 289.5 98.9
Hazardous waste sent for management (t) 126,622 50,888
Ratio: Tons of hazardous waste / Sales (€mn) 3.9 1.7
( * ) Scope 3 emissions include those calculated for employee travel. Furthermore HOCHTIEF and CIMIC include the emissions calculated for the supply chain (Cement, Wood, Waste and Steel).
Targets and improvement programs are established for each of these priorities by company or groups of companies. The responsibility of overseeing the ACS Group's environmental performance falls to the Environmental Department in each group of companies. The main environmental assets relate to the water treatment facilities, biogas, incineration and leachate systems to prevent and reduce environmental pollution and damage. At 31 December 2017 and 2016, there are no such assets. Environmental expenses incurred in 2017 amounted to EUR 1,046 thousand (EUR 4,749 thousand in 2016).
38. Auditors’ fees The fees for financial audit services provided to the various companies in 2017 and 2016 are as follows:
Thousands of Euros
2017 2016
Audit service fees 13,169 13,871
Main auditor 11,486 11,174
Other auditors 1,683 2,697
Fees for tax services 2,107 2,412
Main auditor 134 303
Other auditors 1,973 2,109
Other services 4,526 4,179
Main auditor 2,382 1,846
Other auditors 2,144 2,333
Total 19,802 20,462

142
39. Explanation added for translation to English These consolidated financial statements are presented on the basis of IFRSs as adopted by the European Union. Certain accounting practices applied by the Group that conform with IFRSs may not conform with other generally accepted accounting principles

Consolidated Financial Statements - ACS GROUP
143
APPENDICES

144
As stated in Note 02 to the financial statements, Appendices I and II list the Subsidiaries, Joint Ventures and EIGs in the ACS Group in 2017, including their registered office and the Group's effective percentage of ownership. The effective percentage indicated in the Appendices includes, in the event it is applicable to subsidiaries, the proportionate part of the treasury shares held by the subsidiary. For the companies domiciled in the four main countries of the group, Spain, Germany, Australia and the United States, covering about 74% of sales, a breakdown is performed for the domicile of the main headquarters or management office, expressly declared for tax on profits in the country of residence (in particular, domicilio fiscal in Spain, geschaftsanschrift in Germany, business address of main business in Australia, and corporation´s principal office or place of business in the United States). In the other countries, the domicile given is the address considered legally relevant in each case.
The information is grouped in accordance with the management criteria of the ACS Group on the basis of the different business segments or lines of business carried on.
1. CORPORATE UNIT
This includes the Parent of the Group, ACS, Actividades de Construcción y Servicios, S.A., and companies with ownership interests mainly in energy and telecommunications.
2. CONSTRUCTION
Information is separated on the basis of the companies heading this line of business:
Dragados
This includes both domestic and foreign activities relating to civil construction works (motorways and roads, railways, hydraulic infrastructures, coasts and ports, etc.), as well as residential and non-residential buildings.
Hochtief
This segment includes the activities carried on by the different business segments of this company:
Hochtief Americas – Its activity is mainly carried on in the USA and Canada and relates to the construction of buildings (public and private), infrastructures, civil engineering, and educational and Sports facilities.
Hochtief Asia Pacific – Its activities are carried on by its Australian subsidiary Cimic, noteworthy being construction, mining contracts and the operation and development of real estate infrastructures.
Hochtief Europe – This segment mainly operates through Hochtief Solutions, A.G., which designs, develops, constructs, operates and manages infrastructure projects, real estate and facilities.
Iridium
It carries out infrastructure promotion and development, both in relation to transport and public facilities, managing different public-private collaboration models.
3. INDUSTRIAL SERVICES
The area dedicated to applied industrial engineering, implementing construction, maintenance and the operation of energy, industrial and mobility infrastructures through a wide group of companies led by the Cobra Group and Dragados Industrial.
4. SERVICES
This area solely comprises the integral building, public spaces and organization maintenance services provided by Clece, as well as personal assistance. This area is primarily based in Spain.

Subsidiaries
Company Registered Office % Effective Ownership
PARENT
ACS, Actividades de Construcción y Servicios, S.A. Avda. de Pío XII, 102. 28036 Madrid. España. -ACS Actividades Finance 2, B.V. Herikerbergweg, 238.Amsterdam. Holanda. 100.00%ACS Actividades Finance, B.V. Herikerbergweg, 238.Amsterdam. Holanda. 100.00%Altomira Eólica, S.L. Cardenal Marcelo Spínola, 10. 28016 Madrid. España. 100.00%Andasol 4 Central Termosolar Cuatro, S.L. Cardenal Marcelo Spínola, 10. 28016 Madrid. España. 100.00%Binding Statement, S.A. Avda. de Pío XII, 102. 28036 Madrid. España. 100.00%Cariátide, S.A. Avda. de Pío XII, 102. 28036 Madrid. España. 100.00%Central Solar Termoeléctrica Cáceres, S.A.U. Cardenal Marcelo Spínola, 10. 28016 Madrid. España. 100.00%Funding Statement, S.A. Avda. de Pío XII, 102. 28036 Madrid. España. 100.00%Infraestructuras Energéticas Medioambientales Extremeñas, S.L. Polígono Industrial Las Capellanías. Parcela 238B. Cáceres. España. 100.00%Parque Cortado Alto, S.L. Cardenal Marcelo Spínola, 10. 28016 Madrid. España. 51.00%Parque Eólico de Valdecarro, S.L. Cardenal Marcelo Spínola, 10. 28016 Madrid. España. 100.00%Parque Eólico Donado, S.L. Cardenal Marcelo Spínola, 10. 28016 Madrid. España. 100.00%Parque Eólico La Val, S.L. Cardenal Marcelo Spínola, 10. 28016 Madrid. España. 51.00%Residencial Monte Carmelo, S.A.U. Avda. de Pío XII, 102. 28036 Madrid. España. 100.00%Statement Structure, S.A. Avda. de Pío XII, 102. 28036 Madrid. España. 100.00%
CONSTRUCTION - DRAGADOS
Acainsa, S.A. C/ Orense, 34-1º. 28020 Madrid. España 100.00%
Aparcamiento Tramo C. Rambla-Coslada, S.L. C/ Orense, 34-1º. 28020 Madrid. España 100.00%
Besalco Dragados, S.A. Avda. Tajamar nº 183 piso 1º Las Condes. Santiago de Chile. Chile 50.00%
Blue Clean Water, Llc. 150 Meadowlands Parkway, 3rd Fl.Seacaucus. New Jersey 07094. Estados Unidos. 76.40%
Comunidades Gestionadas, S.A. (COGESA) C/ Orense, 34-1º. 28020 Madrid. España 100.00%Consorcio Constructor Puente Santa Elvira, S.A. Avenida Tajamar 183, piso 5. Las Condes.Santiago. Chile. 49.99%Consorcio Dragados Conpax Dos S.A. Avda. Vitacura 2939 ofic 2201. Las Condes.Santiago de Chile Chile 55.00%
Consorcio Dragados Conpax, S.A. Avda. Vitacura 2939 ofic. 2201.Las Condes - Santiago de Chile. Chile. 60.00%
Consorcio Embalse Chironta, S.A. Avda. Vitacura nº 2939. 2201 Las Condes. Santiago de Chile. Chile. 49.99%Consorcio Tecdra, S.A. Almirante Pastene, 244.702 Providencia. Santiago de Chile. Chile. 100.00%Construcciones y Servicios del Egeo, S.A. Alamanas,1 151 25 Maroussi.Atenas. Grecia. 100.00%
Constructora Dycven, S.A. Avda Veracruz Edif. Torreón, Piso 3 Ofic 3-B, Urbaniz. Las Mercedes.Caracas. Venezuela. 100.00%
Constructora Vespucio Norte, S.A. Avda. Vitacura 2939 Of.2201, Las Condes. Santiago de Chile. Chile 54.00%
Construrail, S.A. C/ Orense, 11. 28020 Madrid. España 51.00%
Continental Rail, S.A. C/ Orense, 11. 28020 Madrid. España 100.00%
DRACE Infraestructuras S.A. Avda. del Camino de Santiago, 50. 28050 Madrid. España 100.00%
Drace Infraestructures UK, Ltd. Regina House second floor, 1-5 Queen Street.Londres EC4N 15W. Reino Unido 100.00%
Drace Infrastructures USA, Llc. 701 5 th Avenue, Suite 7170 Seattle, WA 98104.Washington. Estados Unidos. 100.00%
Dragados Australia PTY Ltd. Suite 1603, Level 16, 99 Mount Street - North Sydney - 2060 - NSW Australia 100.00%
Dragados Canadá, Inc. 150 King Street West, Suite 2103.Toronto ON. Canadá. 100.00%
Dragados Construction USA, Inc. 810 Seventh Ave. 9th Fl.New York, NY 10019. Estados Unidos. 100.00%
Dragados CVV Constructora, S.A. Avda. Vitacura 2939 of.2201.Las Condes.Santiago de Chile. Chile. 80.00%
Dragados Infraestructuras Colombia, SAS Calle 93, Nº 12-14, Oficina 603 Edificio Tempo 93 - Bogotá - D.C. Colombia 100.00%
Dragados Inversiones USA, S.L. Avda. Camino de Santiago, 50 - 28050 Madrid. España. 100.00%
Dragados Ireland Limited Unit 3 B, Bracken Business park, Bracken Road-Sandyford-Dublín 18-Ireland 100.00%
Dragados Obra Civil y Edificac México S.A de C.V. C/Aristóteles, 77 piso 5. Polanco Chapultepec. Miguel Hidalgo. Distrito Federal-11560. México 100.00%
Dragados UK Ltd. Regina House 2Nd Floor, 1-5. Queen Street. EC4N 1SW-London-Reino Unido 100.00%
Dragados USA, Inc. 810 Seventh Ave. 9th Fl.New York, NY 10019. Estados Unidos. 100.00%
Dragados, S.A. Avda. del Camino de Santiago, 50. 28050 Madrid. España 100.00%
Dycasa S.A. Avda.Leandro N.Alem.986 Piso 4º.Buenos Aires Argentina 66.10%
Gasoductos y Redes Gisca, S.A. C/ Orense, 6. 2ª Planta 28020 Madrid. España 52.50%
Geocisa UK Ltd. Chester House, Kennington Park, 1-3 Brixton Road. Londres SW9 6DE. Reino Unido 100.00%
Geocisa USA Inc. 810 Seventh Ave. 9th Fl.New York, NY 10019. Estados Unidos. 100.00%
Geotecnia y Cimientos del Perú, S.A.C. Avda. Reducto, 1360, Int. 301, Urban Armendariz. Miraflores, Lima. Perú 100.00%
Geotecnia y Cimientos, S.A. C/ Los Llanos de Jerez, 10-12. 28823 Coslada. Madrid. España 100.00%
Gestifisa, S.A. C/ Orense, 34 1º. 28020 Madrid. España 100.00%Inmobiliaria Alabega, S.A. C/ Orense, 34-1º. 28020 Madrid. España 100.00%J.F. White Contracting Company 10 Burr Street, Framingham, MA 01701. Estados Unidos. 100.00%
John P. Picone Inc. 31 Garden Lane. Lawrence.NY 11559 Estados Unidos. 100.00%
Lining Precast, L.L.C . P.O. Box 12274.Seattle, WA 98102. Estados Unidos. 100.00%
Lucampa, S.A. C/ Orense, 34-1º. 28020 Madrid. España 100.00%
Mostostal Pomorze, S.A. 80-557 Gdansk ul. Marynarki Polskiej 59. Polonia 100.00%
Muelle Melbourne & Clark, S.A. Avenida Tajamar 183, piso 5.Las Condes. Santiago. Chile 50.00%
Newark Real Estate Holdings, Inc. 810 Seventh Ave. 9th Fl.New York, NY 10019. Estados Unidos. 100.00%
PA CONEX Sp. z.o.o. 09-500 Gostynin ul. Ziejkowa 2a. Polonia 100.00%
PA Wyroby Betonowe Sp. z.o.o. 82-300 Elblag ul. Plk. Dabka 215. Polonia 100.00%
Piques y Túneles, S. A. Avda. Tajamar 183, piso 5. Las Condes.Santiago de Chile. Chile 49.99%
Placidus Investments Sp. z.o.o. 00-728 Warszawa ul. Kierbedzia 4. Polonia 60.00%Polaqua Sp. z o. o. Dworska 1, 05-500 Piaseczno (Wólka Kozodawska). Polonia. 100.00%POLAQUA Wostok Sp. z.o.o. 115184 Moscow ul. Nowokuznieckaja 9. Rusia 51.00%
Prince Contracting, LLC. 10210 Highland Manor Drive, Suite 110.Tampa, FL, 33610. Estados Unidos. 100.00%
Protide, S.A. C/ Orense,34-1º 28020 Madrid - España 100.00%
Pulice Construction, Inc. 2033 W Mountain View Rd. Phoenix. AZ 85021Phoenix. Estados Unidos. 100.00%
Residencial Leonesa, S.A. C/ Orense, 34-1º. 28020 Madrid. España 100.00%
Schiavone Construction Company 150 Meadowlands Parkway, 3rd Fl.Seacaucus. New Jersey 07094-Estados Unidos. 100.00%
Sicsa Rail Transport, S.A. C/ Orense, 11. 28020 Madrid. España 76.00%
Sussex Realty, Llc. 31 Garden Lane Lawrence, NY 11559. EE.UU. 100.00%
Técnicas e Imagen Corporativa, S.L. Avda. de Paris, 1 - 19200 Azuqueca de Henares.Guadalajara.España 100.00%
TECO Sp. z.o.o. 51-501 Wroclaw ul. Swojczycka 21-41. Polonia 100.00%
Tecsa Empresa Constructora, S.A. Plaza Circular Nº 4, planta 5ª. 48001 Bilbao. España. 100.00%Tedra Australia Pty. L.T.D. 293 Queen Street, Altona, Meadows VIC 3028 - Australia 100.00%Vias Canada Inc. 150 King Street West, Suite 2103.Toronto ON, M5H 1J9. Canadá. 100.00%
Vias USA Inc. 810 7th Avenue, 9th Floor. 10019 Nueva York. Estados Unidos. 100.00%
Vias y Construcciones UK Limited Regina House 2nd Floor, 1-5. Queen Street.London. Reino Unido 100.00%
Vías y Construcciones, S.A. Avenida del Camino de Santiago, nº 50.. 28050 Madrid. España. 100.00%
APPENDIX I
145
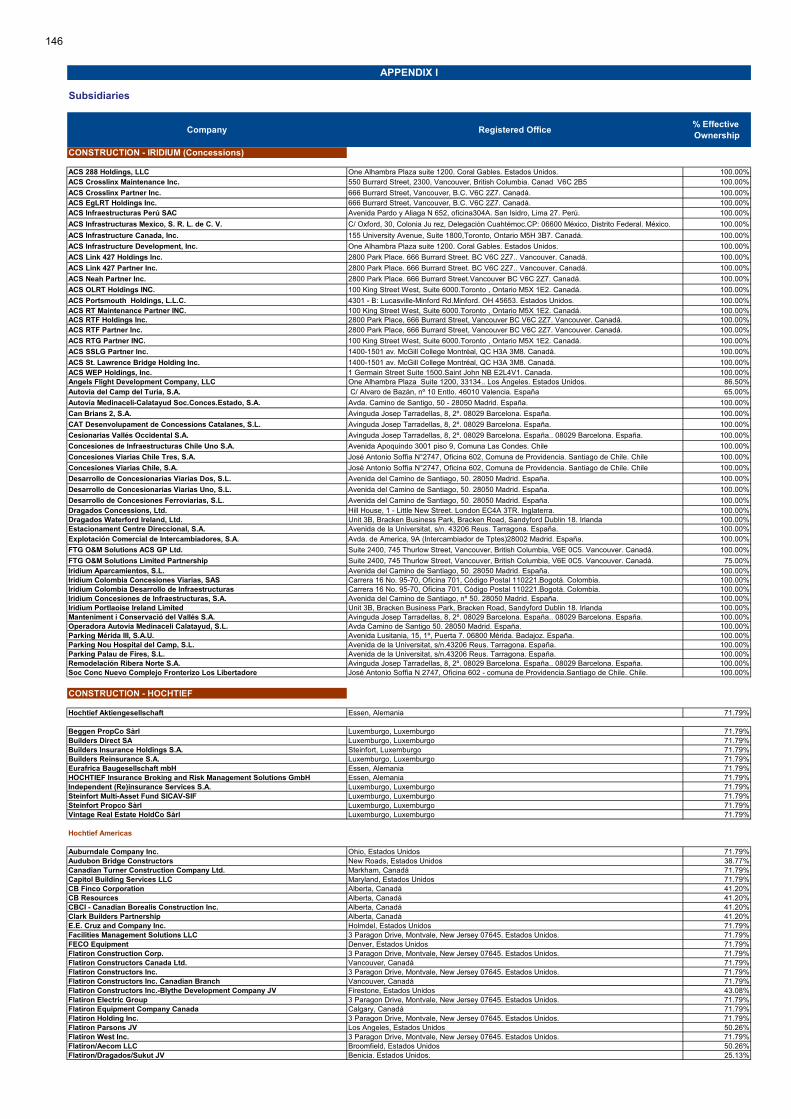
Subsidiaries
Company Registered Office % Effective Ownership
APPENDIX I
CONSTRUCTION - IRIDIUM (Concessions)
ACS 288 Holdings, LLC One Alhambra Plaza suite 1200. Coral Gables. Estados Unidos. 100.00%ACS Crosslinx Maintenance Inc. 550 Burrard Street, 2300, Vancouver, British Columbia. Canad V6C 2B5 100.00%
ACS Crosslinx Partner Inc. 666 Burrard Street, Vancouver, B.C. V6C 2Z7. Canadá. 100.00%ACS EgLRT Holdings Inc. 666 Burrard Street, Vancouver, B.C. V6C 2Z7. Canadá. 100.00%ACS Infraestructuras Perú SAC Avenida Pardo y Aliaga N 652, oficina304A. San Isidro, Lima 27. Perú. 100.00%
ACS Infrastructuras Mexico, S. R. L. de C. V. C/ Oxford, 30, Colonia Ju rez, Delegación Cuahtémoc.CP: 06600 México, Distrito Federal. México. 100.00%
ACS Infrastructure Canada, Inc. 155 University Avenue, Suite 1800,Toronto, Ontario M5H 3B7. Canadá. 100.00%
ACS Infrastructure Development, Inc. One Alhambra Plaza suite 1200. Coral Gables. Estados Unidos. 100.00%
ACS Link 427 Holdings Inc. 2800 Park Place. 666 Burrard Street. BC V6C 2Z7.. Vancouver. Canadá. 100.00%
ACS Link 427 Partner Inc. 2800 Park Place. 666 Burrard Street. BC V6C 2Z7.. Vancouver. Canadá. 100.00%
ACS Neah Partner Inc. 2800 Park Place. 666 Burrard Street.Vancouver BC V6C 2Z7. Canadá. 100.00%
ACS OLRT Holdings INC. 100 King Street West, Suite 6000.Toronto , Ontario M5X 1E2. Canadá. 100.00%
ACS Portsmouth Holdings, L.L.C. 4301 - B: Lucasville-Minford Rd.Minford. OH 45653. Estados Unidos. 100.00%ACS RT Maintenance Partner INC. 100 King Street West, Suite 6000.Toronto , Ontario M5X 1E2. Canadá. 100.00%ACS RTF Holdings Inc. 2800 Park Place, 666 Burrard Street, Vancouver BC V6C 2Z7. Vancouver. Canadá. 100.00%ACS RTF Partner Inc. 2800 Park Place, 666 Burrard Street, Vancouver BC V6C 2Z7. Vancouver. Canadá. 100.00%
ACS RTG Partner INC. 100 King Street West, Suite 6000.Toronto , Ontario M5X 1E2. Canadá. 100.00%
ACS SSLG Partner Inc. 1400-1501 av. McGill College Montréal, QC H3A 3M8. Canadá. 100.00%
ACS St. Lawrence Bridge Holding Inc. 1400-1501 av. McGill College Montréal, QC H3A 3M8. Canadá. 100.00%ACS WEP Holdings, Inc. 1 Germain Street Suite 1500.Saint John NB E2L4V1. Canada. 100.00%Angels Flight Development Company, LLC One Alhambra Plaza Suite 1200, 33134.. Los Ángeles. Estados Unidos. 86.50%Autovia del Camp del Turia, S.A. C/ Alvaro de Bazán, nº 10 Entlo. 46010 Valencia. España 65.00%
Autovía Medinaceli-Calatayud Soc.Conces.Estado, S.A. Avda. Camino de Santigo, 50 - 28050 Madrid. España. 100.00%
Can Brians 2, S.A. Avinguda Josep Tarradellas, 8, 2º. 08029 Barcelona. España. 100.00%
CAT Desenvolupament de Concessions Catalanes, S.L. Avinguda Josep Tarradellas, 8, 2º. 08029 Barcelona. España. 100.00%
Cesionarias Vallés Occidental S.A. Avinguda Josep Tarradellas, 8, 2º. 08029 Barcelona. España.. 08029 Barcelona. España. 100.00%
Concesiones de Infraestructuras Chile Uno S.A. Avenida Apoquindo 3001 piso 9, Comuna Las Condes. Chile 100.00%
Concesiones Viarias Chile Tres, S.A. José Antonio Soffia N°2747, Oficina 602, Comuna de Providencia. Santiago de Chile. Chile 100.00%
Concesiones Viarias Chile, S.A. José Antonio Soffia N°2747, Oficina 602, Comuna de Providencia. Santiago de Chile. Chile 100.00%
Desarrollo de Concesionarias Viarias Dos, S.L. Avenida del Camino de Santiago, 50. 28050 Madrid. España. 100.00%
Desarrollo de Concesionarias Viarias Uno, S.L. Avenida del Camino de Santiago, 50. 28050 Madrid. España. 100.00%
Desarrollo de Concesiones Ferroviarias, S.L. Avenida del Camino de Santiago, 50. 28050 Madrid. España. 100.00%Dragados Concessions, Ltd. Hill House, 1 - Little New Street. London EC4A 3TR. Inglaterra. 100.00%Dragados Waterford Ireland, Ltd. Unit 3B, Bracken Business Park, Bracken Road, Sandyford Dublin 18. Irlanda 100.00%Estacionament Centre Direccional, S.A. Avenida de la Universitat, s/n. 43206 Reus. Tarragona. España. 100.00%Explotación Comercial de Intercambiadores, S.A. Avda. de America, 9A (Intercambiador de Tptes)28002 Madrid. España. 100.00%
FTG O&M Solutions ACS GP Ltd. Suite 2400, 745 Thurlow Street, Vancouver, British Columbia, V6E 0C5. Vancouver. Canadá. 100.00%
FTG O&M Solutions Limited Partnership Suite 2400, 745 Thurlow Street, Vancouver, British Columbia, V6E 0C5. Vancouver. Canadá. 75.00%Iridium Aparcamientos, S.L. Avenida del Camino de Santiago, 50. 28050 Madrid. España. 100.00%Iridium Colombia Concesiones Viarias, SAS Carrera 16 No. 95-70, Oficina 701, Código Postal 110221.Bogotá. Colombia. 100.00%Iridium Colombia Desarrollo de Infraestructuras Carrera 16 No. 95-70, Oficina 701, Código Postal 110221.Bogotá. Colombia. 100.00%Iridium Concesiones de Infraestructuras, S.A. Avenida del Camino de Santiago, nº 50. 28050 Madrid. España. 100.00%Iridium Portlaoise Ireland Limited Unit 3B, Bracken Business Park, Bracken Road, Sandyford Dublin 18. Irlanda 100.00%Manteniment i Conservació del Vallés S.A. Avinguda Josep Tarradellas, 8, 2º. 08029 Barcelona. España.. 08029 Barcelona. España. 100.00%Operadora Autovia Medinaceli Calatayud, S.L. Avda Camino de Santigo 50. 28050 Madrid. España. 100.00%Parking Mérida III, S.A.U. Avenida Lusitania, 15, 1º, Puerta 7. 06800 Mérida. Badajoz. España. 100.00%Parking Nou Hospital del Camp, S.L. Avenida de la Universitat, s/n.43206 Reus. Tarragona. España. 100.00%Parking Palau de Fires, S.L. Avenida de la Universitat, s/n.43206 Reus. Tarragona. España. 100.00%Remodelación Ribera Norte S.A. Avinguda Josep Tarradellas, 8, 2º. 08029 Barcelona. España.. 08029 Barcelona. España. 100.00%Soc Conc Nuevo Complejo Fronterizo Los Libertadore José Antonio Soffia N 2747, Oficina 602 - comuna de Providencia.Santiago de Chile. Chile. 100.00%
CONSTRUCTION - HOCHTIEF
Hochtief Aktiengesellschaft Essen, Alemania 71.79%0
Beggen PropCo Sàrl Luxemburgo, Luxemburgo 71.79%Builders Direct SA Luxemburgo, Luxemburgo 71.79%Builders Insurance Holdings S.A. Steinfort, Luxemburgo 71.79%Builders Reinsurance S.A. Luxemburgo, Luxemburgo 71.79%Eurafrica Baugesellschaft mbH Essen, Alemania 71.79%HOCHTIEF Insurance Broking and Risk Management Solutions GmbH Essen, Alemania 71.79%Independent (Re)insurance Services S.A. Luxemburgo, Luxemburgo 71.79%Steinfort Multi-Asset Fund SICAV-SIF Luxemburgo, Luxemburgo 71.79%Steinfort Propco Sàrl Luxemburgo, Luxemburgo 71.79%Vintage Real Estate HoldCo Sàrl Luxemburgo, Luxemburgo 71.79%
0Hochtief Americas 0
0Auburndale Company Inc. Ohio, Estados Unidos 71.79%Audubon Bridge Constructors New Roads, Estados Unidos 38.77%Canadian Turner Construction Company Ltd. Markham, Canadá 71.79%Capitol Building Services LLC Maryland, Estados Unidos 71.79%CB Finco Corporation Alberta, Canadá 41.20%CB Resources Alberta, Canadá 41.20%CBCI - Canadian Borealis Construction Inc. Alberta, Canadá 41.20%Clark Builders Partnership Alberta, Canadá 41.20%E.E. Cruz and Company Inc. Holmdel, Estados Unidos 71.79%Facilities Management Solutions LLC 3 Paragon Drive, Montvale, New Jersey 07645. Estados Unidos. 71.79%FECO Equipment Denver, Estados Unidos 71.79%Flatiron Construction Corp. 3 Paragon Drive, Montvale, New Jersey 07645. Estados Unidos. 71.79%Flatiron Constructors Canada Ltd. Vancouver, Canadá 71.79%Flatiron Constructors Inc. 3 Paragon Drive, Montvale, New Jersey 07645. Estados Unidos. 71.79%Flatiron Constructors Inc. Canadian Branch Vancouver, Canadá 71.79%Flatiron Constructors Inc.-Blythe Development Company JV Firestone, Estados Unidos 43.08%Flatiron Electric Group 3 Paragon Drive, Montvale, New Jersey 07645. Estados Unidos. 71.79%Flatiron Equipment Company Canada Calgary, Canadá 71.79%Flatiron Holding Inc. 3 Paragon Drive, Montvale, New Jersey 07645. Estados Unidos. 71.79%Flatiron Parsons JV Los Angeles, Estados Unidos 50.26%Flatiron West Inc. 3 Paragon Drive, Montvale, New Jersey 07645. Estados Unidos. 71.79%Flatiron/Aecom LLC Broomfield, Estados Unidos 50.26%Flatiron/Dragados/Sukut JV Benicia. Estados Unidos. 25.13%
146

Subsidiaries
Company Registered Office % Effective Ownership
APPENDIX I
Flatiron/Goodfellow Top Grade JV 3 Paragon Drive, Montvale, New Jersey 07645. Estados Unidos. 52.05%Flatiron/Turner Construction of New York LLC New York, Estados Unidos 71.79%Flatiron-Blythe Development Company JV Firestone, Estados Unidos 50.26%Flatiron-Lane JV Longmont, Estados Unidos 39.49%Flatiron-Skanska-Stacy and Witbec JV San Marcos, Estados Unidos 28.72%Flatiron-Zachrya JV Firestone, Estados Unidos 39.49%HOCHTIEF Americas GmbH Essen, Alemania 71.79%HOCHTIEF Argentina S.A. Buenos Aires, Argentina 71.79%HOCHTIEF USA Inc. Dallas, Estados Unidos 71.79%Lathrop / D.A.G. JV (Moseley Hall Renovation Ohio, Estados Unidos 36.62%LightHorse Innovation Alberta, Canadá 41.20%Maple Red Insurance Company Vermont, Estados Unidos 71.79%McKissack & McKissack / Turner / Tompkins / Gilford JV (MLK Jr. Memorial) New York, Estados Unidos 39.49%Metacon Technology Solutions LLC Texas, Estados Unidos 71.79%Mideast Construction Services Inc. 3 Paragon Drive, Montvale, New Jersey 07645. Estados Unidos. 71.79%Misener Constru-Marina S.A. de C.V. Ciudad Juarez, Mexico 71.79%OMM Inc. Plantation, Estados Unidos 71.79%Saddleback Constructors Mission Viejo, Estados Unidos 38.77%Services Products Buildings Inc. Ohio, Estados Unidos 71.79%The Lathrop Company Inc. 3 Paragon Drive, Montvale, New Jersey 07645. Estados Unidos. 71.79%The Turner Corporation Dallas, Estados Unidos 71.79%Time Management International Ltd. Islas Virgenes, Gran Bretaña 10.77%Tompkins Builders Inc. Washington, Estados Unidos 71.79%Tompkins/Ballard JV (Richmond City Jail) Distrito de Columbia, Estados Unidos 53.85%Tompkins/Gilford JV (Prince George’s Community College Center) Distrito de Columbia, Estados Unidos 50.26%Turner (East Asia) Pte. Ltd. Singapur 71.79%Turner AECOM-Hunt NFL JV (NFL Stadium) Inglewood, Canadá 35.90%Turner Canada Holdings Inc. New Brunswick, Canadá 71.79%Turner Canada LLC New York, Estados Unidos 71.79%Turner Clayco Memorial Stadium JV (UIUC Memorial Stadium) Chicago, Estados Unidos 36.62%Turner Clayco Willis Tower JV (Willis Tower) Chicago, Estados Unidos 36.62%Turner Construction Company New York, Estados Unidos 71.79%Turner Construction Company – Singapore (US) Singapur 71.79%Turner Construction Company of Ohio LLC Ohio, Estados Unidos 71.79%Turner Development Corporation 3 Paragon Drive, Montvale, New Jersey 07645. Estados Unidos. 71.79%Turner Executive CNA JV (CNA Corp. HQ relocation) Chicago, Estados Unidos 35.90%Turner International (East Asia) Pte. Ltd. Sri Lanka 71.79%Turner International (Hong Kong) Ltd. Hongkong 71.79%Turner International (UK) Ltd. London, Reino Unido 71.79%Turner International Consulting (Thailand) Ltd. Thailand 35.16%Turner International Consulting India Pvt. Ltd. Indien 71.79%Turner International Industries Inc. 3 Paragon Drive, Montvale, New Jersey 07645. Estados Unidos. 71.79%Turner International LLC 3 Paragon Drive, Montvale, New Jersey 07645. Estados Unidos. 71.79%Turner International Malaysia Sdn. Bhd. Malasia 71.79%Turner International Mexico LLC Estados Unidos 71.79%Turner International Professional Services (Ireland) Irlanda 71.79%Turner International Professional Services, S. de R.L. de C.V. Mexico 71.79%Turner International Proje Yonetimi Limited Sirket Turquía 71.79%Turner International Pte. Ltd. Singapur 71.79%Turner International Support Services, S. de R.L. de C.V. Mexico 71.79%Turner JLN JV (Lyndhurst Elementary) Baltimore, Estados Unidos 50.26%Turner Logistics Canada Ltd. New Brunswick, Canadá 71.79%Turner Logistics LLC 3 Paragon Drive, Montvale, New Jersey 07645. Estados Unidos. 71.79%Turner Management Consulting (Shanghai) Co. Ltd. Shanghai, China 71.79%Turner Partnership Holdings Inc. New Brunswick, Canadá 71.79%Turner Project Management India Pvt. Ltd. India 71.79%Turner Regency (Lakewood City Schools) New York, Estados Unidos 36.62%Turner Sabinal JV (SAISD 2010 Bond Program) New York, Estados Unidos 57.44%Turner Sanorubin JV Albany, Estados Unidos 43.08%Turner Southeast Europe Doo Beograd Belgrad, Serbia 71.79%Turner Surety & Insurance Brokerage Inc. New Jersey, Estados Unidos 71.79%Turner Vietnam Co. Ltd. Vietnam 71.79%Turner/Commercial/Mahogony Triventure (Exelon Baltimore) Baltimore, Estados Unidos 35.18%Turner/Con-Real – University of Arkansas Texas, Estados Unidos 36.62%Turner/Con-Real- Terrell High School Academy Texas, Estados Unidos 41.64%Turner/HGR (Tyler Junior College) Texas, Estados Unidos 36.62%Turner/Hoist (Artic Escalators) District of Columbia, Estados Unidos 36.62%Turner/JGM JV (Proposition Q) New York, Estados Unidos 48.10%Turner/Ozanne (First Energy Stadium Modernization / Huntington Park Garage) Ohio, Estados Unidos 54.56%Turner/Ozanne/VAA (Cleveland Convention Center Hotel) Ohio, Estados Unidos 36.62%Turner/VAA (Kent State University Science Center) Ohio, Estados Unidos 53.85%Turner/White JV (Sinai Grace Hospital) New York, Estados Unidos 43.08%Turner-Flatiron, JV (Denver Intl Airport) Colorado, Estados Unidos 71.79%Turner-Kiewit JV (Goaa South Airport) New York, Estados Unidos 43.08%Turner-Marhnos S A P I De CV Mexico City, Mexico 36.62%Turner-McKissack JV New York, Estados Unidos 43.08%Turner-PCL JV (LAX Midfield) New York, Estados Unidos 35.90%Turner-PCL JV (San Diego Airport) San Diego, Estados Unidos 35.90%Turner-Penick JV (US Marine Corp BEQ Pkg 4 & 7) New York, Estados Unidos 43.08%Turner-SG Contracting (Hartfield Jackson) Georgia, Estados Unidos 53.85%Turner-Welty JV (Duke Energy Corp.) North Carolina, Estados Unidos 43.08%Universal Construction Company Inc. 3 Paragon Drive, Montvale, New Jersey 07645. Estados Unidos. 71.79%West Coast Rail Constructors San Marco, Estados Unidos 46.67%White-Turner JV (City of Detroit Public Safety) New York, Estados Unidos 35.90%
Hochtief Asia Pacific
512 Wickham Street Pty. Ltd. New South Wales, Australia 52.18%512 Wickham Street Trust New South Wales, Australia 52.18%A.C.N. 126 130 738 Pty. Ltd. Victoria, Australia 52.18%A.C.N. 151 868 601 Pty. Ltd. Victoria, Australia 52.18%Arus Tenang Sdn. Bhd. Malasia 52.18%Ashmore Developments Pty. Ltd. New South Wales, Australia 52.18%Ausindo Holdings Pte. Ltd. Singapur 52.18%BCJHG Nominees Pty. Ltd. Victoria, Australia 52.18%BCJHG Trust Australia 52.18%BKP Electrical Ltd. Fidschi 52.18%Boggo Road Project Pty. Ltd. Queensland, Australia 52.18%
147
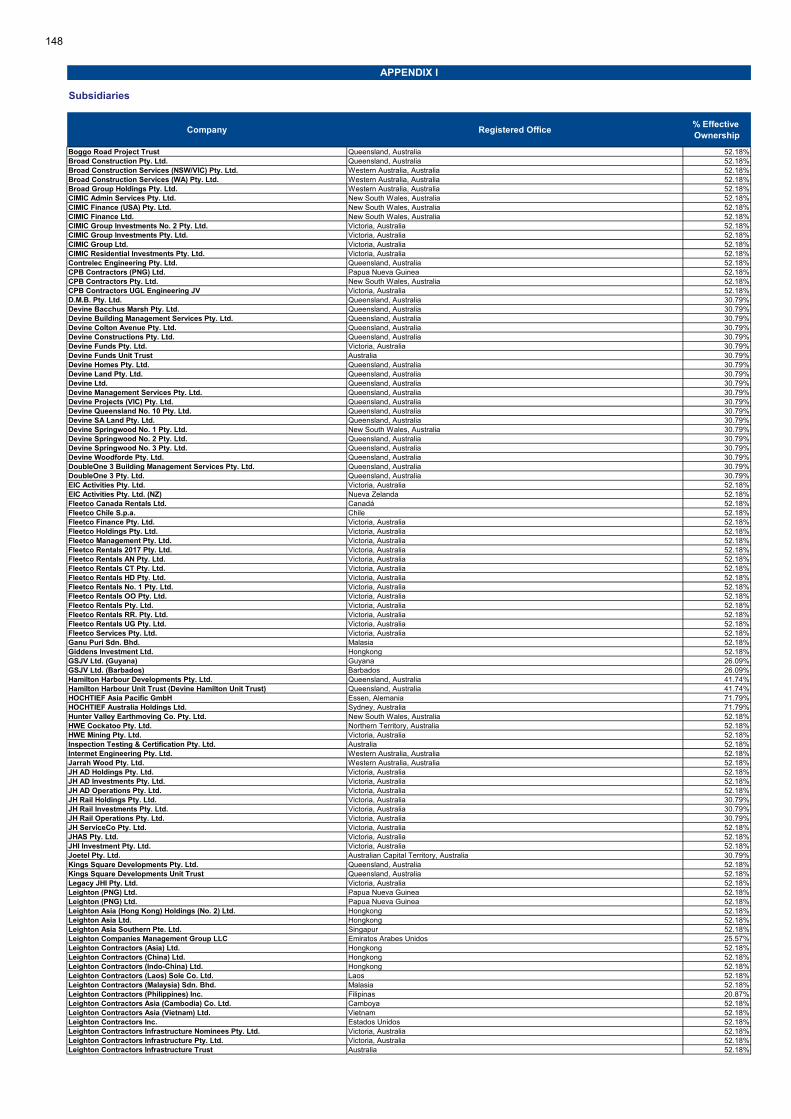
Subsidiaries
Company Registered Office % Effective Ownership
APPENDIX I
Boggo Road Project Trust Queensland, Australia 52.18%Broad Construction Pty. Ltd. Queensland, Australia 52.18%Broad Construction Services (NSW/VIC) Pty. Ltd. Western Australia, Australia 52.18%Broad Construction Services (WA) Pty. Ltd. Western Australia, Australia 52.18%Broad Group Holdings Pty. Ltd. Western Australia, Australia 52.18%CIMIC Admin Services Pty. Ltd. New South Wales, Australia 52.18%CIMIC Finance (USA) Pty. Ltd. New South Wales, Australia 52.18%CIMIC Finance Ltd. New South Wales, Australia 52.18%CIMIC Group Investments No. 2 Pty. Ltd. Victoria, Australia 52.18%CIMIC Group Investments Pty. Ltd. Victoria, Australia 52.18%CIMIC Group Ltd. Victoria, Australia 52.18%CIMIC Residential Investments Pty. Ltd. Victoria, Australia 52.18%Contrelec Engineering Pty. Ltd. Queensland, Australia 52.18%CPB Contractors (PNG) Ltd. Papua Nueva Guinea 52.18%CPB Contractors Pty. Ltd. New South Wales, Australia 52.18%CPB Contractors UGL Engineering JV Victoria, Australia 52.18%D.M.B. Pty. Ltd. Queensland, Australia 30.79%Devine Bacchus Marsh Pty. Ltd. Queensland, Australia 30.79%Devine Building Management Services Pty. Ltd. Queensland, Australia 30.79%Devine Colton Avenue Pty. Ltd. Queensland, Australia 30.79%Devine Constructions Pty. Ltd. Queensland, Australia 30.79%Devine Funds Pty. Ltd. Victoria, Australia 30.79%Devine Funds Unit Trust Australia 30.79%Devine Homes Pty. Ltd. Queensland, Australia 30.79%Devine Land Pty. Ltd. Queensland, Australia 30.79%Devine Ltd. Queensland, Australia 30.79%Devine Management Services Pty. Ltd. Queensland, Australia 30.79%Devine Projects (VIC) Pty. Ltd. Queensland, Australia 30.79%Devine Queensland No. 10 Pty. Ltd. Queensland, Australia 30.79%Devine SA Land Pty. Ltd. Queensland, Australia 30.79%Devine Springwood No. 1 Pty. Ltd. New South Wales, Australia 30.79%Devine Springwood No. 2 Pty. Ltd. Queensland, Australia 30.79%Devine Springwood No. 3 Pty. Ltd. Queensland, Australia 30.79%Devine Woodforde Pty. Ltd. Queensland, Australia 30.79%DoubleOne 3 Building Management Services Pty. Ltd. Queensland, Australia 30.79%DoubleOne 3 Pty. Ltd. Queensland, Australia 30.79%EIC Activities Pty. Ltd. Victoria, Australia 52.18%EIC Activities Pty. Ltd. (NZ) Nueva Zelanda 52.18%Fleetco Canada Rentals Ltd. Canadá 52.18%Fleetco Chile S.p.a. Chile 52.18%Fleetco Finance Pty. Ltd. Victoria, Australia 52.18%Fleetco Holdings Pty. Ltd. Victoria, Australia 52.18%Fleetco Management Pty. Ltd. Victoria, Australia 52.18%Fleetco Rentals 2017 Pty. Ltd. Victoria, Australia 52.18%Fleetco Rentals AN Pty. Ltd. Victoria, Australia 52.18%Fleetco Rentals CT Pty. Ltd. Victoria, Australia 52.18%Fleetco Rentals HD Pty. Ltd. Victoria, Australia 52.18%Fleetco Rentals No. 1 Pty. Ltd. Victoria, Australia 52.18%Fleetco Rentals OO Pty. Ltd. Victoria, Australia 52.18%Fleetco Rentals Pty. Ltd. Victoria, Australia 52.18%Fleetco Rentals RR. Pty. Ltd. Victoria, Australia 52.18%Fleetco Rentals UG Pty. Ltd. Victoria, Australia 52.18%Fleetco Services Pty. Ltd. Victoria, Australia 52.18%Ganu Puri Sdn. Bhd. Malasia 52.18%Giddens Investment Ltd. Hongkong 52.18%GSJV Ltd. (Guyana) Guyana 26.09%GSJV Ltd. (Barbados) Barbados 26.09%Hamilton Harbour Developments Pty. Ltd. Queensland, Australia 41.74%Hamilton Harbour Unit Trust (Devine Hamilton Unit Trust) Queensland, Australia 41.74%HOCHTIEF Asia Pacific GmbH Essen, Alemania 71.79%HOCHTIEF Australia Holdings Ltd. Sydney, Australia 71.79%Hunter Valley Earthmoving Co. Pty. Ltd. New South Wales, Australia 52.18%HWE Cockatoo Pty. Ltd. Northern Territory, Australia 52.18%HWE Mining Pty. Ltd. Victoria, Australia 52.18%Inspection Testing & Certification Pty. Ltd. Australia 52.18%Intermet Engineering Pty. Ltd. Western Australia, Australia 52.18%Jarrah Wood Pty. Ltd. Western Australia, Australia 52.18%JH AD Holdings Pty. Ltd. Victoria, Australia 52.18%JH AD Investments Pty. Ltd. Victoria, Australia 52.18%JH AD Operations Pty. Ltd. Victoria, Australia 52.18%JH Rail Holdings Pty. Ltd. Victoria, Australia 30.79%JH Rail Investments Pty. Ltd. Victoria, Australia 30.79%JH Rail Operations Pty. Ltd. Victoria, Australia 30.79%JH ServiceCo Pty. Ltd. Victoria, Australia 52.18%JHAS Pty. Ltd. Victoria, Australia 52.18%JHI Investment Pty. Ltd. Victoria, Australia 52.18%Joetel Pty. Ltd. Australian Capital Territory, Australia 30.79%Kings Square Developments Pty. Ltd. Queensland, Australia 52.18%Kings Square Developments Unit Trust Queensland, Australia 52.18%Legacy JHI Pty. Ltd. Victoria, Australia 52.18%Leighton (PNG) Ltd. Papua Nueva Guinea 52.18%Leighton (PNG) Ltd. Papua Nueva Guinea 52.18%Leighton Asia (Hong Kong) Holdings (No. 2) Ltd. Hongkong 52.18%Leighton Asia Ltd. Hongkong 52.18%Leighton Asia Southern Pte. Ltd. Singapur 52.18%Leighton Companies Management Group LLC Emiratos Arabes Unidos 25.57%Leighton Contractors (Asia) Ltd. Hongkong 52.18%Leighton Contractors (China) Ltd. Hongkong 52.18%Leighton Contractors (Indo-China) Ltd. Hongkong 52.18%Leighton Contractors (Laos) Sole Co. Ltd. Laos 52.18%Leighton Contractors (Malaysia) Sdn. Bhd. Malasia 52.18%Leighton Contractors (Philippines) Inc. Filipinas 20.87%Leighton Contractors Asia (Cambodia) Co. Ltd. Camboya 52.18%Leighton Contractors Asia (Vietnam) Ltd. Vietnam 52.18%Leighton Contractors Inc. Estados Unidos 52.18%Leighton Contractors Infrastructure Nominees Pty. Ltd. Victoria, Australia 52.18%Leighton Contractors Infrastructure Pty. Ltd. Victoria, Australia 52.18%Leighton Contractors Infrastructure Trust Australia 52.18%
148
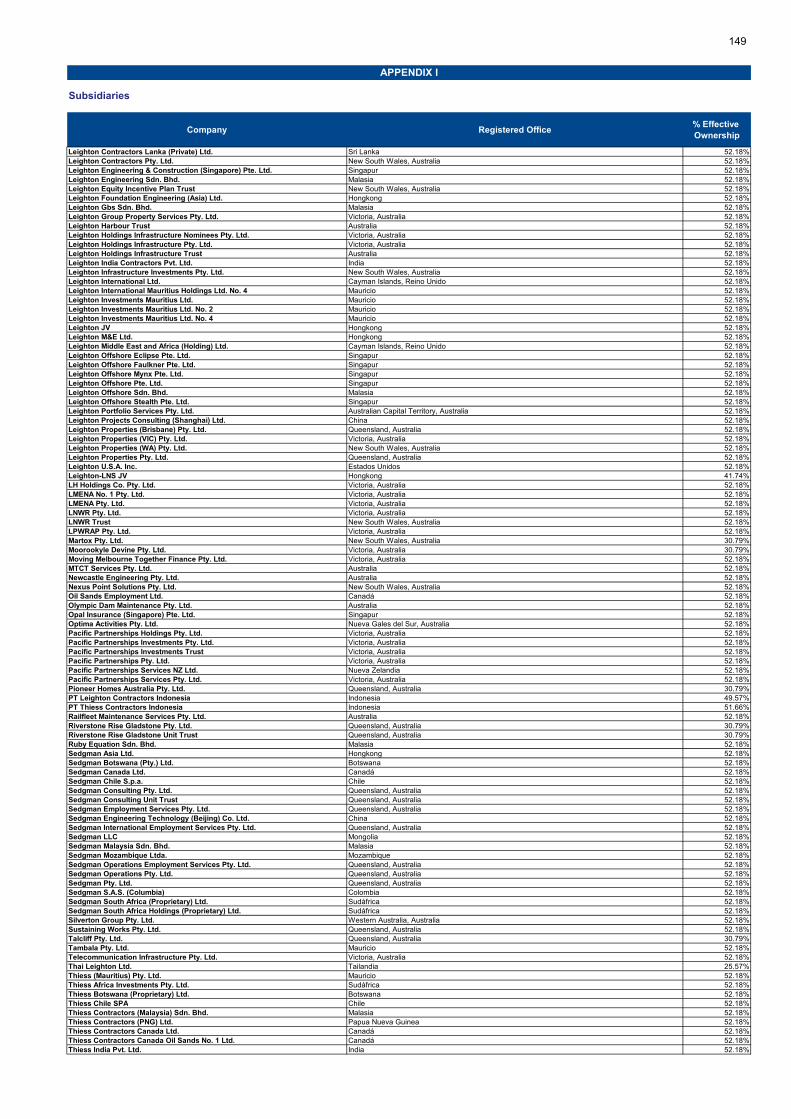
Subsidiaries
Company Registered Office % Effective Ownership
APPENDIX I
Leighton Contractors Lanka (Private) Ltd. Sri Lanka 52.18%Leighton Contractors Pty. Ltd. New South Wales, Australia 52.18%Leighton Engineering & Construction (Singapore) Pte. Ltd. Singapur 52.18%Leighton Engineering Sdn. Bhd. Malasia 52.18%Leighton Equity Incentive Plan Trust New South Wales, Australia 52.18%Leighton Foundation Engineering (Asia) Ltd. Hongkong 52.18%Leighton Gbs Sdn. Bhd. Malasia 52.18%Leighton Group Property Services Pty. Ltd. Victoria, Australia 52.18%Leighton Harbour Trust Australia 52.18%Leighton Holdings Infrastructure Nominees Pty. Ltd. Victoria, Australia 52.18%Leighton Holdings Infrastructure Pty. Ltd. Victoria, Australia 52.18%Leighton Holdings Infrastructure Trust Australia 52.18%Leighton India Contractors Pvt. Ltd. India 52.18%Leighton Infrastructure Investments Pty. Ltd. New South Wales, Australia 52.18%Leighton International Ltd. Cayman Islands, Reino Unido 52.18%Leighton International Mauritius Holdings Ltd. No. 4 Mauricio 52.18%Leighton Investments Mauritius Ltd. Mauricio 52.18%Leighton Investments Mauritius Ltd. No. 2 Mauricio 52.18%Leighton Investments Mauritius Ltd. No. 4 Mauricio 52.18%Leighton JV Hongkong 52.18%Leighton M&E Ltd. Hongkong 52.18%Leighton Middle East and Africa (Holding) Ltd. Cayman Islands, Reino Unido 52.18%Leighton Offshore Eclipse Pte. Ltd. Singapur 52.18%Leighton Offshore Faulkner Pte. Ltd. Singapur 52.18%Leighton Offshore Mynx Pte. Ltd. Singapur 52.18%Leighton Offshore Pte. Ltd. Singapur 52.18%Leighton Offshore Sdn. Bhd. Malasia 52.18%Leighton Offshore Stealth Pte. Ltd. Singapur 52.18%Leighton Portfolio Services Pty. Ltd. Australian Capital Territory, Australia 52.18%Leighton Projects Consulting (Shanghai) Ltd. China 52.18%Leighton Properties (Brisbane) Pty. Ltd. Queensland, Australia 52.18%Leighton Properties (VIC) Pty. Ltd. Victoria, Australia 52.18%Leighton Properties (WA) Pty. Ltd. New South Wales, Australia 52.18%Leighton Properties Pty. Ltd. Queensland, Australia 52.18%Leighton U.S.A. Inc. Estados Unidos 52.18%Leighton-LNS JV Hongkong 41.74%LH Holdings Co. Pty. Ltd. Victoria, Australia 52.18%LMENA No. 1 Pty. Ltd. Victoria, Australia 52.18%LMENA Pty. Ltd. Victoria, Australia 52.18%LNWR Pty. Ltd. Victoria, Australia 52.18%LNWR Trust New South Wales, Australia 52.18%LPWRAP Pty. Ltd. Victoria, Australia 52.18%Martox Pty. Ltd. New South Wales, Australia 30.79%Moorookyle Devine Pty. Ltd. Victoria, Australia 30.79%Moving Melbourne Together Finance Pty. Ltd. Victoria, Australia 52.18%MTCT Services Pty. Ltd. Australia 52.18%Newcastle Engineering Pty. Ltd. Australia 52.18%Nexus Point Solutions Pty. Ltd. New South Wales, Australia 52.18%Oil Sands Employment Ltd. Canadá 52.18%Olympic Dam Maintenance Pty. Ltd. Australia 52.18%Opal Insurance (Singapore) Pte. Ltd. Singapur 52.18%Optima Activities Pty. Ltd. Nueva Gales del Sur, Australia 52.18%Pacific Partnerships Holdings Pty. Ltd. Victoria, Australia 52.18%Pacific Partnerships Investments Pty. Ltd. Victoria, Australia 52.18%Pacific Partnerships Investments Trust Victoria, Australia 52.18%Pacific Partnerships Pty. Ltd. Victoria, Australia 52.18%Pacific Partnerships Services NZ Ltd. Nueva Zelandia 52.18%Pacific Partnerships Services Pty. Ltd. Victoria, Australia 52.18%Pioneer Homes Australia Pty. Ltd. Queensland, Australia 30.79%PT Leighton Contractors Indonesia Indonesia 49.57%PT Thiess Contractors Indonesia Indonesia 51.66%Railfleet Maintenance Services Pty. Ltd. Australia 52.18%Riverstone Rise Gladstone Pty. Ltd. Queensland, Australia 30.79%Riverstone Rise Gladstone Unit Trust Queensland, Australia 30.79%Ruby Equation Sdn. Bhd. Malasia 52.18%Sedgman Asia Ltd. Hongkong 52.18%Sedgman Botswana (Pty.) Ltd. Botswana 52.18%Sedgman Canada Ltd. Canadá 52.18%Sedgman Chile S.p.a. Chile 52.18%Sedgman Consulting Pty. Ltd. Queensland, Australia 52.18%Sedgman Consulting Unit Trust Queensland, Australia 52.18%Sedgman Employment Services Pty. Ltd. Queensland, Australia 52.18%Sedgman Engineering Technology (Beijing) Co. Ltd. China 52.18%Sedgman International Employment Services Pty. Ltd. Queensland, Australia 52.18%Sedgman LLC Mongolia 52.18%Sedgman Malaysia Sdn. Bhd. Malasia 52.18%Sedgman Mozambique Ltda. Mozambique 52.18%Sedgman Operations Employment Services Pty. Ltd. Queensland, Australia 52.18%Sedgman Operations Pty. Ltd. Queensland, Australia 52.18%Sedgman Pty. Ltd. Queensland, Australia 52.18%Sedgman S.A.S. (Columbia) Colombia 52.18%Sedgman South Africa (Proprietary) Ltd. Sudáfrica 52.18%Sedgman South Africa Holdings (Proprietary) Ltd. Sudáfrica 52.18%Silverton Group Pty. Ltd. Western Australia, Australia 52.18%Sustaining Works Pty. Ltd. Queensland, Australia 52.18%Talcliff Pty. Ltd. Queensland, Australia 30.79%Tambala Pty. Ltd. Mauricio 52.18%Telecommunication Infrastructure Pty. Ltd. Victoria, Australia 52.18%Thai Leighton Ltd. Tailandia 25.57%Thiess (Mauritius) Pty. Ltd. Mauricio 52.18%Thiess Africa Investments Pty. Ltd. Sudáfrica 52.18%Thiess Botswana (Proprietary) Ltd. Botswana 52.18%Thiess Chile SPA Chile 52.18%Thiess Contractors (Malaysia) Sdn. Bhd. Malasia 52.18%Thiess Contractors (PNG) Ltd. Papua Nueva Guinea 52.18%Thiess Contractors Canada Ltd. Canadá 52.18%Thiess Contractors Canada Oil Sands No. 1 Ltd. Canadá 52.18%Thiess India Pvt. Ltd. India 52.18%
149
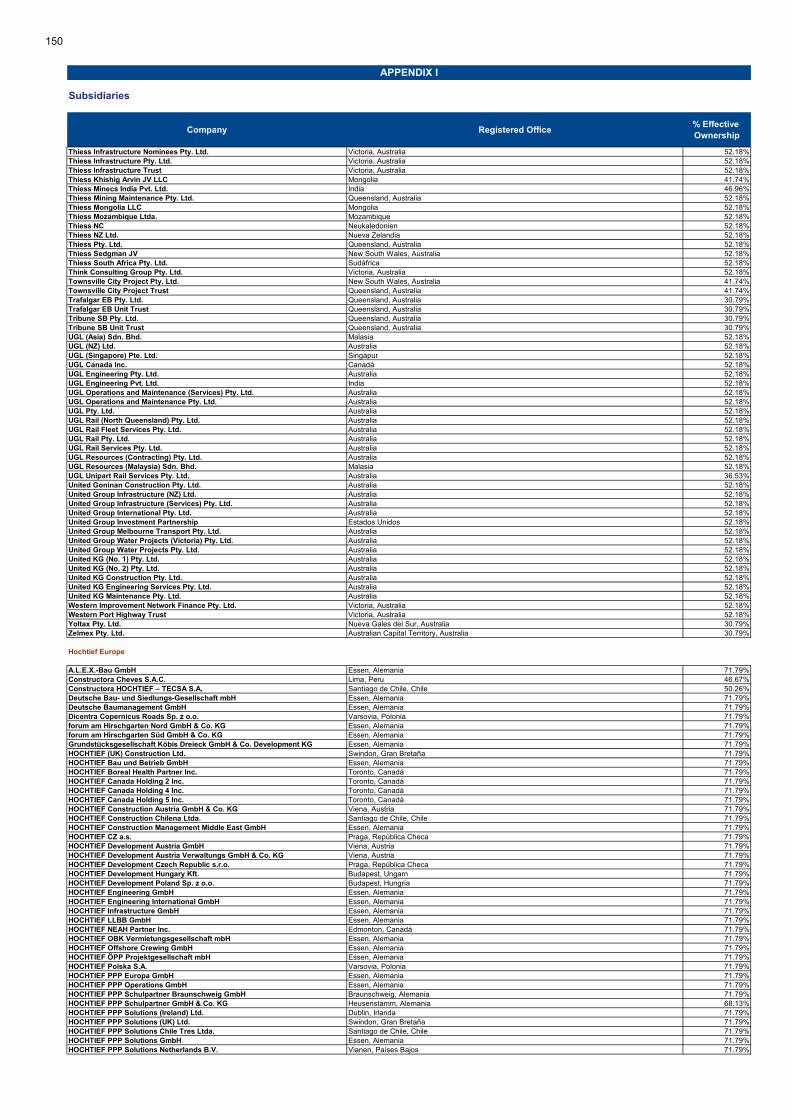
Subsidiaries
Company Registered Office % Effective Ownership
APPENDIX I
Thiess Infrastructure Nominees Pty. Ltd. Victoria, Australia 52.18%Thiess Infrastructure Pty. Ltd. Victoria, Australia 52.18%Thiess Infrastructure Trust Victoria, Australia 52.18%Thiess Khishig Arvin JV LLC Mongolia 41.74%Thiess Minecs India Pvt. Ltd. India 46.96%Thiess Mining Maintenance Pty. Ltd. Queensland, Australia 52.18%Thiess Mongolia LLC Mongolia 52.18%Thiess Mozambique Ltda. Mozambique 52.18%Thiess NC Neukaledonien 52.18%Thiess NZ Ltd. Nueva Zelandia 52.18%Thiess Pty. Ltd. Queensland, Australia 52.18%Thiess Sedgman JV New South Wales, Australia 52.18%Thiess South Africa Pty. Ltd. Sudáfrica 52.18%Think Consulting Group Pty. Ltd. Victoria, Australia 52.18%Townsville City Project Pty. Ltd. New South Wales, Australia 41.74%Townsville City Project Trust Queensland, Australia 41.74%Trafalgar EB Pty. Ltd. Queensland, Australia 30.79%Trafalgar EB Unit Trust Queensland, Australia 30.79%Tribune SB Pty. Ltd. Queensland, Australia 30.79%Tribune SB Unit Trust Queensland, Australia 30.79%UGL (Asia) Sdn. Bhd. Malasia 52.18%UGL (NZ) Ltd. Australia 52.18%UGL (Singapore) Pte. Ltd. Singapur 52.18%UGL Canada Inc. Canadá 52.18%UGL Engineering Pty. Ltd. Australia 52.18%UGL Engineering Pvt. Ltd. India 52.18%UGL Operations and Maintenance (Services) Pty. Ltd. Australia 52.18%UGL Operations and Maintenance Pty. Ltd. Australia 52.18%UGL Pty. Ltd. Australia 52.18%UGL Rail (North Queensland) Pty. Ltd. Australia 52.18%UGL Rail Fleet Services Pty. Ltd. Australia 52.18%UGL Rail Pty. Ltd. Australia 52.18%UGL Rail Services Pty. Ltd. Australia 52.18%UGL Resources (Contracting) Pty. Ltd. Australia 52.18%UGL Resources (Malaysia) Sdn. Bhd. Malasia 52.18%UGL Unipart Rail Services Pty. Ltd. Australia 36.53%United Goninan Construction Pty. Ltd. Australia 52.18%United Group Infrastructure (NZ) Ltd. Australia 52.18%United Group Infrastructure (Services) Pty. Ltd. Australia 52.18%United Group International Pty. Ltd. Australia 52.18%United Group Investment Partnership Estados Unidos 52.18%United Group Melbourne Transport Pty. Ltd. Australia 52.18%United Group Water Projects (Victoria) Pty. Ltd. Australia 52.18%United Group Water Projects Pty. Ltd. Australia 52.18%United KG (No. 1) Pty. Ltd. Australia 52.18%United KG (No. 2) Pty. Ltd. Australia 52.18%United KG Construction Pty. Ltd. Australia 52.18%United KG Engineering Services Pty. Ltd. Australia 52.18%United KG Maintenance Pty. Ltd. Australia 52.18%Western Improvement Network Finance Pty. Ltd. Victoria, Australia 52.18%Western Port Highway Trust Victoria, Australia 52.18%Yoltax Pty. Ltd. Nueva Gales del Sur, Australia 30.79%Zelmex Pty. Ltd. Australian Capital Territory, Australia 30.79%
0Hochtief Europe 0
0A.L.E.X.-Bau GmbH Essen, Alemania 71.79%Constructora Cheves S.A.C. Lima, Peru 46.67%Constructora HOCHTIEF – TECSA S.A. Santiago de Chile, Chile 50.26%Deutsche Bau- und Siedlungs-Gesellschaft mbH Essen, Alemania 71.79%Deutsche Baumanagement GmbH Essen, Alemania 71.79%Dicentra Copernicus Roads Sp. z o.o. Varsovia, Polonia 71.79%forum am Hirschgarten Nord GmbH & Co. KG Essen, Alemania 71.79%forum am Hirschgarten Süd GmbH & Co. KG Essen, Alemania 71.79%Grundstücksgesellschaft Köbis Dreieck GmbH & Co. Development KG Essen, Alemania 71.79%HOCHTIEF (UK) Construction Ltd. Swindon, Gran Bretaña 71.79%HOCHTIEF Bau und Betrieb GmbH Essen, Alemania 71.79%HOCHTIEF Boreal Health Partner Inc. Toronto, Canadá 71.79%HOCHTIEF Canada Holding 2 Inc. Toronto, Canadá 71.79%HOCHTIEF Canada Holding 4 Inc. Toronto, Canadá 71.79%HOCHTIEF Canada Holding 5 Inc. Toronto, Canadá 71.79%HOCHTIEF Construction Austria GmbH & Co. KG Viena, Austria 71.79%HOCHTIEF Construction Chilena Ltda. Santiago de Chile, Chile 71.79%HOCHTIEF Construction Management Middle East GmbH Essen, Alemania 71.79%HOCHTIEF CZ a.s. Praga, República Checa 71.79%HOCHTIEF Development Austria GmbH Viena, Austria 71.79%HOCHTIEF Development Austria Verwaltungs GmbH & Co. KG Viena, Austria 71.79%HOCHTIEF Development Czech Republic s.r.o. Praga, República Checa 71.79%HOCHTIEF Development Hungary Kft. Budapest, Ungarn 71.79%HOCHTIEF Development Poland Sp. z o.o. Budapest, Hungría 71.79%HOCHTIEF Engineering GmbH Essen, Alemania 71.79%HOCHTIEF Engineering International GmbH Essen, Alemania 71.79%HOCHTIEF Infrastructure GmbH Essen, Alemania 71.79%HOCHTIEF LLBB GmbH Essen, Alemania 71.79%HOCHTIEF NEAH Partner Inc. Edmonton, Canadá 71.79%HOCHTIEF OBK Vermietungsgesellschaft mbH Essen, Alemania 71.79%HOCHTIEF Offshore Crewing GmbH Essen, Alemania 71.79%HOCHTIEF ÖPP Projektgesellschaft mbH Essen, Alemania 71.79%HOCHTIEF Polska S.A. Varsovia, Polonia 71.79%HOCHTIEF PPP Europa GmbH Essen, Alemania 71.79%HOCHTIEF PPP Operations GmbH Essen, Alemania 71.79%HOCHTIEF PPP Schulpartner Braunschweig GmbH Braunschweig, Alemania 71.79%HOCHTIEF PPP Schulpartner GmbH & Co. KG Heusenstamm, Alemania 68.13%HOCHTIEF PPP Solutions (Ireland) Ltd. Dublin, Irlanda 71.79%HOCHTIEF PPP Solutions (UK) Ltd. Swindon, Gran Bretaña 71.79%HOCHTIEF PPP Solutions Chile Tres Ltda. Santiago de Chile, Chile 71.79%HOCHTIEF PPP Solutions GmbH Essen, Alemania 71.79%HOCHTIEF PPP Solutions Netherlands B.V. Vianen, Países Bajos 71.79%
150
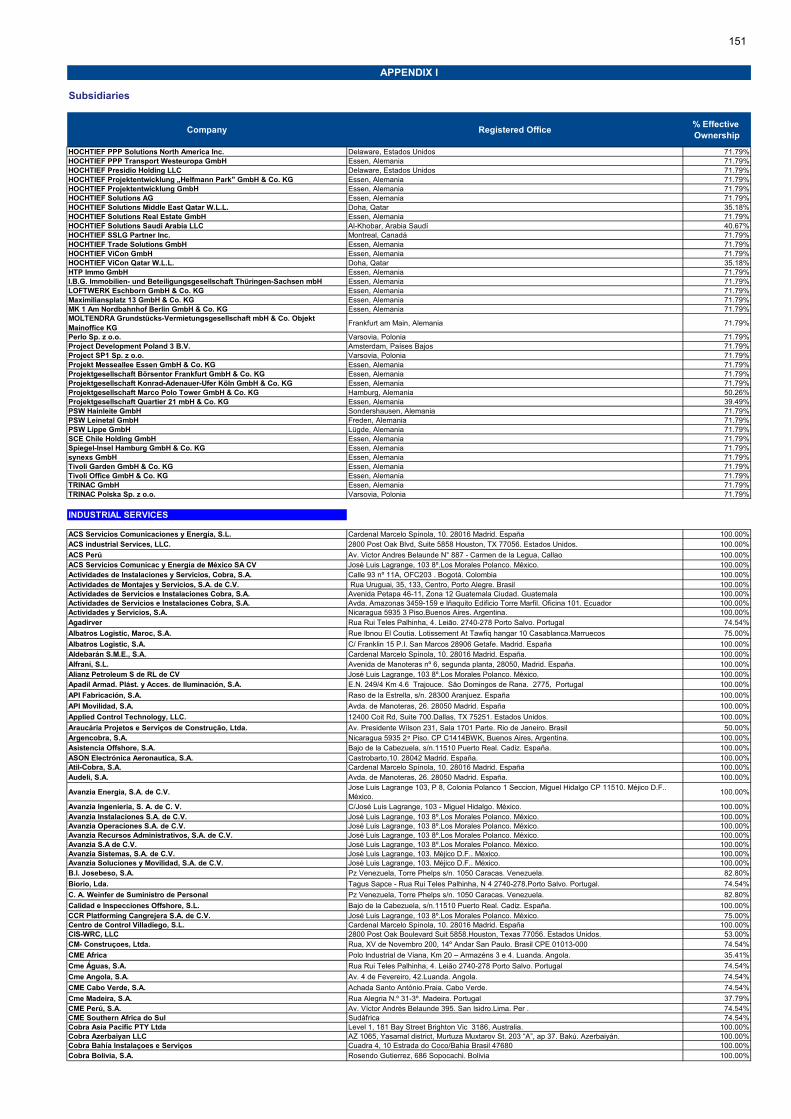
Subsidiaries
Company Registered Office % Effective Ownership
APPENDIX I
HOCHTIEF PPP Solutions North America Inc. Delaware, Estados Unidos 71.79%HOCHTIEF PPP Transport Westeuropa GmbH Essen, Alemania 71.79%HOCHTIEF Presidio Holding LLC Delaware, Estados Unidos 71.79%HOCHTIEF Projektentwicklung „Helfmann Park" GmbH & Co. KG Essen, Alemania 71.79%HOCHTIEF Projektentwicklung GmbH Essen, Alemania 71.79%HOCHTIEF Solutions AG Essen, Alemania 71.79%HOCHTIEF Solutions Middle East Qatar W.L.L. Doha, Qatar 35.18%HOCHTIEF Solutions Real Estate GmbH Essen, Alemania 71.79%HOCHTIEF Solutions Saudi Arabia LLC Al-Khobar, Arabia Saudí 40.67%HOCHTIEF SSLG Partner Inc. Montreal, Canadá 71.79%HOCHTIEF Trade Solutions GmbH Essen, Alemania 71.79%HOCHTIEF ViCon GmbH Essen, Alemania 71.79%HOCHTIEF ViCon Qatar W.L.L. Doha, Qatar 35.18%HTP Immo GmbH Essen, Alemania 71.79%I.B.G. Immobilien- und Beteiligungsgesellschaft Thüringen-Sachsen mbH Essen, Alemania 71.79%LOFTWERK Eschborn GmbH & Co. KG Essen, Alemania 71.79%Maximiliansplatz 13 GmbH & Co. KG Essen, Alemania 71.79%MK 1 Am Nordbahnhof Berlin GmbH & Co. KG Essen, Alemania 71.79%MOLTENDRA Grundstücks-Vermietungsgesellschaft mbH & Co. Objekt Mainoffice KG
Frankfurt am Main, Alemania 71.79%
Perlo Sp. z o.o. Varsovia, Polonia 71.79%Project Development Poland 3 B.V. Amsterdam, Países Bajos 71.79%Project SP1 Sp. z o.o. Varsovia, Polonia 71.79%Projekt Messeallee Essen GmbH & Co. KG Essen, Alemania 71.79%Projektgesellschaft Börsentor Frankfurt GmbH & Co. KG Essen, Alemania 71.79%Projektgesellschaft Konrad-Adenauer-Ufer Köln GmbH & Co. KG Essen, Alemania 71.79%Projektgesellschaft Marco Polo Tower GmbH & Co. KG Hamburg, Alemania 50.26%Projektgesellschaft Quartier 21 mbH & Co. KG Essen, Alemania 39.49%PSW Hainleite GmbH Sondershausen, Alemania 71.79%PSW Leinetal GmbH Freden, Alemania 71.79%PSW Lippe GmbH Lügde, Alemania 71.79%SCE Chile Holding GmbH Essen, Alemania 71.79%Spiegel-Insel Hamburg GmbH & Co. KG Essen, Alemania 71.79%synexs GmbH Essen, Alemania 71.79%Tivoli Garden GmbH & Co. KG Essen, Alemania 71.79%Tivoli Office GmbH & Co. KG Essen, Alemania 71.79%TRINAC GmbH Essen, Alemania 71.79%TRINAC Polska Sp. z o.o. Varsovia, Polonia 71.79%
0
INDUSTRIAL SERVICES
ACS Servicios Comunicaciones y Energía, S.L. Cardenal Marcelo Spínola, 10. 28016 Madrid. España 100.00%ACS industrial Services, LLC. 2800 Post Oak Blvd, Suite 5858 Houston, TX 77056. Estados Unidos. 100.00%
ACS Perú Av. Victor Andres Belaunde N° 887 - Carmen de la Legua, Callao 100.00%ACS Servicios Comunicac y Energía de México SA CV José Luis Lagrange, 103 8º.Los Morales Polanco. México. 100.00%Actividades de Instalaciones y Servicios, Cobra, S.A. Calle 93 nº 11A, OFC203 . Bogotá. Colombia 100.00%Actividades de Montajes y Servicios, S.A. de C.V. Rua Uruguai, 35, 133, Centro, Porto Alegre. Brasil 100.00%Actividades de Servicios e Instalaciones Cobra, S.A. Avenida Petapa 46-11, Zona 12 Guatemala Ciudad. Guatemala 100.00%Actividades de Servicios e Instalaciones Cobra, S.A. Avda. Amazonas 3459-159 e Iñaquito Edificio Torre Marfil. Oficina 101. Ecuador 100.00%Actividades y Servicios, S.A. Nicaragua 5935 3 Piso.Buenos Aires. Argentina. 100.00%Agadirver Rua Rui Teles Palhinha, 4. Leião. 2740-278 Porto Salvo. Portugal 74.54%
Albatros Logistic, Maroc, S.A. Rue Ibnou El Coutia. Lotissement At Tawfiq hangar 10 Casablanca.Marruecos 75.00%
Albatros Logistic, S.A. C/ Franklin 15 P.I. San Marcos 28906 Getafe. Madrid. España 100.00%Aldebarán S.M.E., S.A. Cardenal Marcelo Spínola, 10. 28016 Madrid. España. 100.00%Alfrani, S.L. Avenida de Manoteras nº 6, segunda planta, 28050, Madrid. España. 100.00%Alianz Petroleum S de RL de CV José Luis Lagrange, 103 8º.Los Morales Polanco. México. 100.00%Apadil Armad. Plást. y Acces. de Iluminación, S.A. E.N. 249/4 Km 4.6 Trajouce. Sâo Domingos de Rana. 2775, Portugal 100.00%
API Fabricación, S.A. Raso de la Estrella, s/n. 28300 Aranjuez. España 100.00%
API Movilidad, S.A. Avda. de Manoteras, 26. 28050 Madrid. España 100.00%
Applied Control Technology, LLC. 12400 Coit Rd, Suite 700.Dallas, TX 75251. Estados Unidos. 100.00%
Araucária Projetos e Serviços de Construção, Ltda. Av. Presidente Wilson 231, Sala 1701 Parte. Rio de Janeiro. Brasil 50.00%Argencobra, S.A. Nicaragua 5935 2٥ Piso. CP C1414BWK, Buenos Aires, Argentina. 100.00%Asistencia Offshore, S.A. Bajo de la Cabezuela, s/n.11510 Puerto Real. Cadiz. España. 100.00%ASON Electrónica Aeronautica, S.A. Castrobarto,10. 28042 Madrid. España. 100.00%Atil-Cobra, S.A. Cardenal Marcelo Spínola, 10. 28016 Madrid. España 100.00%Audeli, S.A. Avda. de Manoteras, 26. 28050 Madrid. España. 100.00%
Avanzia Energia, S.A. de C.V.Jose Luis Lagrange 103, P 8, Colonia Polanco 1 Seccion, Miguel Hidalgo CP 11510. Méjico D.F.. México.
100.00%
Avanzia Ingenieria, S. A. de C. V. C/José Luis Lagrange, 103 - Miguel Hidalgo. México. 100.00%Avanzia Instalaciones S.A. de C.V. José Luis Lagrange, 103 8º.Los Morales Polanco. México. 100.00%Avanzia Operaciones S.A. de C.V. José Luis Lagrange, 103 8º.Los Morales Polanco. México. 100.00%Avanzia Recursos Administrativos, S.A. de C.V. José Luis Lagrange, 103 8º.Los Morales Polanco. México. 100.00%Avanzia S.A de C.V. José Luis Lagrange, 103 8º.Los Morales Polanco. México. 100.00%Avanzia Sistemas, S.A. de C.V. José Luis Lagrange, 103. Méjico D.F.. México. 100.00%Avanzia Soluciones y Movilidad, S.A. de C.V. José Luis Lagrange, 103. Méjico D.F.. México. 100.00%B.I. Josebeso, S.A. Pz Venezuela, Torre Phelps s/n. 1050 Caracas. Venezuela. 82.80%
Biorio, Lda. Tagus Sapce - Rua Rui Teles Palhinha, N 4 2740-278.Porto Salvo. Portugal. 74.54%
C. A. Weinfer de Suministro de Personal Pz Venezuela, Torre Phelps s/n. 1050 Caracas. Venezuela. 82.80%
Calidad e Inspecciones Offshore, S.L. Bajo de la Cabezuela, s/n.11510 Puerto Real. Cadiz. España. 100.00%CCR Platforming Cangrejera S.A. de C.V. José Luis Lagrange, 103 8º.Los Morales Polanco. México. 75.00%Centro de Control Villadiego, S.L. Cardenal Marcelo Spínola, 10. 28016 Madrid. España 100.00%CIS-WRC, LLC 2800 Post Oak Boulevard Suit 5858.Houston, Texas 77056. Estados Unidos. 53.00%CM- Construçoes, Ltda. Rua, XV de Novembro 200, 14º Andar San Paulo. Brasil CPE 01013-000 74.54%
CME Africa Polo Industrial de Viana, Km 20 – Armazéns 3 e 4. Luanda. Angola. 35.41%
Cme Águas, S.A. Rua Rui Teles Palhinha, 4. Leião 2740-278 Porto Salvo. Portugal 74.54%
Cme Angola, S.A. Av. 4 de Fevereiro, 42.Luanda. Angola. 74.54%
CME Cabo Verde, S.A. Achada Santo António.Praia. Cabo Verde. 74.54%
Cme Madeira, S.A. Rua Alegria N.º 31-3º. Madeira. Portugal 37.79%CME Perú, S.A. Av. Víctor Andrés Belaunde 395. San Isidro.Lima. Per . 74.54%CME Southern Africa do Sul Sudáfrica 74.54%Cobra Asia Pacific PTY Ltda Level 1, 181 Bay Street Brighton Vic 3186, Australia. 100.00%Cobra Azerbaiyan LLC AZ 1065, Yasamal district, Murtuza Muxtarov St. 203 “A”, ap 37. Bakú. Azerbaiyán. 100.00%Cobra Bahía Instalaçoes e Serviços Cuadra 4, 10 Estrada do Coco/Bahia Brasil 47680 100.00%Cobra Bolivia, S.A. Rosendo Gutierrez, 686 Sopocachi. Bolivia 100.00%
151

Subsidiaries
Company Registered Office % Effective Ownership
APPENDIX I
Cobra Brasil Serviços, Comunicaçoes e Energia, S.A. Avda. Marechal Camera 160, sala 1808.Rio de Janeiro. Brasil. 100.00%Cobra Chile Servicios S.A. Los Militares 5885, Piso 10, Las Condes, Santiago de Chile. Chile 100.00%Cobra Concesiones Brasil, S.L. Cardenal Marcelo Spínola, 10. 28016 Madrid. España 100.00%Cobra Concesiones, S.L. Cardenal Marcelo Spínola, 10. 28016 Madrid. España 100.00%Cobra Energy Investment Finance, LLC 2800 Post Oak Blvd, Suite 5858 Houston, TX 77056. Estados Unidos. 100.00%Cobra Energy Investment, LLC. 2800 Post Oak Blvd, Suite 5858 Houston, TX 77056. Estados Unidos. 100.00%Cobra Energy, Ltd 60 Solonos street, Atenas. Grecia 100.00%Cobra Georgia, Llc. Old Tbilisi Region, 27/9 Brother Zubalashvili Street. Georgia 100.00%Cobra Gestión de Infraestructuras, S.A.U Cardenal Marcelo Spínola, 10. 28016 Madrid. España 100.00%Cobra Great Island Limited 160 Shelbourne Road Ballbridge. Dublin. IrlandaIrlanda Dublin. 100.00%Cobra Industrial Services Pty 15 alice Lane 9 floor. Morningside Gauteng 2196 Johannesburgo. Sudáfrica. 100.00%Cobra Industrial Services, Inc. 3511 Silverside road.Wilmington Delaware. Estados Unidos. 100.00%Cobra Infraestructuras Hidraúlicas Peru, S.A. Av. Amador Merino Reyna.. Lima. Perú. 100.00%Cobra Infraestructuras Hidráulicas, S.A. Cardenal Marcelo Spínola, 10. 28016 Madrid. España 100.00%Cobra Infraestructuras Internacional, S.A. Cardenal Marcelo Spínola, 10. 28016 Madrid. España 100.00%Cobra Instalaciones y Servicios India PVT 1rst Floor, Malhan One, Sunlight Colony, Ashram. India 100.00%Cobra Instalaciones y Servicios Internacional, S.L. Cardenal Marcelo Spínola, 10. 28016 Madrid. España 100.00%Cobra Instalaciones y Servicios Malaysia SDN BHD Jalan Bangsar Utama,1 5900. Kuala Lumpur. Malasia. 100.00%
Cobra Instalaciones y Servicios República Dominicana Av. Gustavo Mejia Ricart, esq. Abraham Lincoln 102, Piso 10 (Local 1002), Piantini, Santo Domingo. 100.00%Cobra Instalaciones y Servicios, S.A. Cardenal Marcelo Spínola, 10. 28016 Madrid. España 100.00%Cobra Instalaçoes y Servicios, Ltda. Rua Uruguai, 35, Porto Alegre, Rio Grande do Sul. Brasil. 100.00%Cobra La Rioja Sur Nicaragua 5935 2٥ Piso. CP C1414BWK, Buenos Aires, Argentina. 100.00%Cobra Perú II, S.A. Cal. Amador Merino Reyna N° 267 Int. 902 - San Isidro. Perú 100.00%Cobra Perú, S.A. Cal. Amador Merino Reyna N° 267 Int. 902 - San Isidro. Perú 100.00%Cobra Railways UK Limited Vintage Yard 59-63 Bermondsey Street. Londres. Reino Unido. 100.00%Cobra Servicios Auxiliares, S.A. Cardenal Marcelo Spínola, 10. 28016 Madrid. España 100.00%Cobra Sistemas de Seguridad, S.A. Cardenal Marcelo Spínola, 10. 28016 Madrid. España 100.00%Cobra Sistemas y Redes, S.A. Cardenal Marcelo Spínola, 10. 28016 Madrid. España 100.00%
Cobra Thermosolar Plants, Inc. 7380 West Sahara Avenue, Suite 160 Las Vegas, Nevada, 89117. Estados Unidos. 100.00%Cobra Wind Intenacional, Ltd 13 Qeens Road. Aberdeen. Reino Unido. 100.00%
Codehon Instalaciones y Servicios S de RLEdificio Corporativo Torre Alianza No. 2, Piso 10, cubículos 1005/1006, Boulevard San Juan Bosco, Tegucigalpa, Honduras.
100.00%
Cogeneración Cadereyta S.A. de C.V. Jose Luis Lagrange, 103 Piso 8 Los Morales Miguel Hidalgo. Méjico D.F. Méjico. 100.00%COICISA Industrial, S.A. de C.V. Jose Luis Lagrange, 103 Piso 8 Los Morales Miguel Hidalgo. Méjico D.F. Méjico. 60.00%Coinsal Instalaciones y Servicios, S.A. de C.V. Residencial Palermo, Pasaje 3, polígono G Casa #4 San Salvador, El Salvador 100.00%Coinsmar Instalaciones y Servicios, SARLAU 210 Boulevard Serketouni Angle Boulevard Roudani nº 13, Maarif 2100. Casablanca. Marruecos 100.00%Comercial y Servicios Larco Medellín S.A. Calle 128 No. 49-52 Prado Veraniego 6 No 50 - 80. Bogotá. Colombia. 100.00%Concesionaria Angostura Siguas, S.A. Cal. Amador Merino Reyna N° 267 Int. 902 - San Isidro. Lima.Perú 60.00%Concesionaria Desaladora del Sur, S.A. Cal. Amador Merino Reyna N° 267 Int. 902 - San Isidro. Lima.Perú 100.00%Consorcio Agua Para Gamboa Calle 50, Edificio F & F Tower, Oficina 27A Panamá, Panamá 50.00%Consorcio Ejecutor Lima Av. Mariscal La Mar, 638 Of 606 – Miraflores – Lima. Lima. Perú. 100.00%Consorcio Especializado Medio Ambiente, S.A.de C.V Jose Luis Lagrange, 103 Piso 8 Los Morales Miguel Hidalgo. Méjico D.F. Méjico. 60.00%Consorcio Makim Calle Jirón Carabaya, 341. Lima. Perú. 95.00%Consorcio Ofiteco Geoandina Cra 25 N.96 81. Oficina 203.Bogota . Colombia. 60.00%Consorcio Saneamiento INCA Avenida Mariscal la Mar, 638. Lima. Perú. 51.00%Consorcio Santa María Avenida Mariscal la Mar, 638. Lima. Perú. 99.00%Consorcio Sice Disico Cra 25 N.96 81. Oficina 203.Bogota . Colombia. 50.00%Consorcio Tráfico Urbano de Medellín Cra 12 Nº 96-81 Of 203. Bogotá. Colombia. 100.00%Consorcio Tunel del Mar Cra.12 Nº 96-81 Of. 203.Colombia. Bogotá. 50.00%
Construçao e Manutençao Electromecánica S.A. (CME) Rua Rui Teles Palhinha 4 Leião 2740-278 Porto Salvo. Portugal 74.54%
Construcciones Dorsa, S.A. Cristóbal Bordiú, 35-5º oficina 515-517. Madrid. España 100.00%Constructora Las Pampas de Siguas, S.A. Cal. Amador Merino Reyna N° 267 Int. 902 - San Isidro. Lima.Perú 60.00%Control y Montajes Industriales Cymi Chile, Ltda. C/Apoquindo 3001 Piso 9.206-744 Las Condes. Santiago de Chile. Chile. 100.00%
Control y Montajes Industriales CYMI, S.A. Avda de Manoteras 26 4 planta. 28050 Madrid. España. 100.00%Control y Montajes Industriales de Méjico, S.A. de C.V. Jose Luis Lagrange, 103 Piso 8 Los Morales Miguel Hidalgo. Méjico D.F. Méjico. 100.00%Conyblox Proprietary Limited 9th Floor, The Towers, 15 Alice Lane Sandton.Johannesburgo. Sudafrica. 65.00%Conyceto Pty Ltd. 9th Floor, The Towers, 15 Alice Lane Sandton.Johannesburgo. Sudafrica. 92.00%Corporación Ygnus Air, S.A. Avda. de Manoteras, 26. 28050 Madrid. España. 100.00%
Cosersa, S.A. Avda. de Manoteras, 26. 28050 Madrid. España 100.00%
Cymi Canada. INC. 160 Elgin Street, Suite 2600.Ottawa, Ontario. Canada K1P1C3 100.00%
Cymi Construçoes e Paticipaçoes, S.A. Av. Presid Wilson 231 Sala 1701 Parte Centro. Rio de Janeiro. Brasil 100.00%
Cymi DK, LLC 12400 Coit Rd, Suite 700.Dallas, TX 75251. Estados Unidos. 100.00%
Cymi do Brasil, Ltda. Av. Presidente Wilson 231, sala 1701 20030-020 Rio de Janeiro. Brasil 100.00%
Cymi Industrial INC. 12400 Coit Rd, Suite 700.Dallas, TX 75251. Estados Unidos. 100.00%
Cymi Investment USA, S.L. Avda de Manoteras 26 4 planta. 28050 Madrid. España. 100.00%
Cymi Seguridad, S.A. Avda Manoteras 26 4 planta 28050 Madrid. Madrid. España. 100.00%
Cymi Tech Soluçoes e Sistemas Ltda Av. Presidente Wilson 231, Sala 1701 Parte. Rio de Janeiro. Brasil 100.00%
Cymimasa, S.A. Avda República de El Salvador 1084.. Quito. Ecuador. 100.00%Dankocom Pty Ltd 9th Floor, The Towers, 15 Alice Lane Sandton.Johannesburgo. Sudafrica. 80.00%Debod PV Plant SAE 124 Othman' Bin Affan Street. El Cairo. Egipto. 100.00%Debod Wind Farm 124 Othman' Bin Affan Street. El Cairo. Egipto. 100.00%Delta P I, LLC. 12400 Coit Rd, Suite 700.Dallas, TX 75251. Estados Unidos. 100.00%
Depuradoras del Bajo Aragón S.A. Paraíso 3- 50410 Cuarte de Huerva. Zaragoza. España 55.00%
Desarrollo Informático, S.A. Avda. de Santa Eugenia, 6. 28031 Madrid. España 100.00%
Dimática, S.A. C/ Saturnino Calleja, 20. 28002 Madrid. España 100.00%
Dracena I Parque Solar, S.A. Avda. Marechal Camera, 160 Sala 323.Rio de Janeiro. Brasil. 99.99%Dracena II Parque Solar, S.A. Avda. Marechal Camera, 160 Sala 323.Rio de Janeiro. Brasil. 100.00%Dracena III Parque Solar, S.A. Avda. Marechal Camera, 160 Sala 323.Rio de Janeiro. Brasil. 100.00%Dracena IV Parque Solar, S.A. Avda. Marechal Camera, 160 Sala 323.Rio de Janeiro. Brasil. 100.00%Dragados Construc. Netherlands, S.A. Claude Debussylaan 24, 1082 MD Amsterdam. Holanda. 100.00%
Dragados Gulf Construction, Ltda. P. O Box 3140 Al Khobar 31952 Kingdom of Saudi Arabia 100.00%
Dragados Industrial , S.A.U. Cardenal Marcelo Spínola, 10. 28016 Madrid. España 100.00%Dragados Industrial Algerie S.P.A. 12 Rue Hocine Beladjel 5ª état-16500 Algerie 100.00%Dragados Industrial Canada, Inc. 620 Rene Levesque West Suite 1000 H3B 1 N7 Montreal. Quebec. Canadá 100.00%Dragados Offshore de Méjico, S.A. de C.V. Juan Racine n 112, piso 8, Col. Los Morales 11510 México D.F. 100.00%
Dragados Offshore Mexico Analisis y Soluciones, S.A. de C.V. Juan Racine, 112. Piso 8, Col. Los Morales 11510 México D.F. México. 100.00%
Dragados Offshore Mexico Estudios Integrales, S.A. de C.V. Juan Racine, 112. Piso 8, Col. Los Morales 11510 México D.F. México. 100.00%
Dragados Offshore Mexico Operaciones y Construcciones, S.A. de C.V. Juan Racine, 112. Piso 8, Col. Los Morales 11510 México D.F. México. 100.00%
Dragados Offshore USA, Inc. One Riwerway, Suite 1700.77056 Texas. Houston. Estados Unidos. 100.00%
Dragados Offshore, S.A. Bajo de la Cabezuela, s/n. 11510 Puerto Real. Cádiz. España 100.00%Dragados Proyectos Industriales de Méjico, S.A. de C.V. C/ Jose Luis Lagrange, 103 Piso 8. Los Morales Polanco.11510 Mexico DF. Mexico. 100.00%Dragados-Swiber Offshore, S.A.P.I. de C.V. Juan Racine, 112. Piso 8, Col.Los Morales 11510 México D.F. México. 51.00%
152
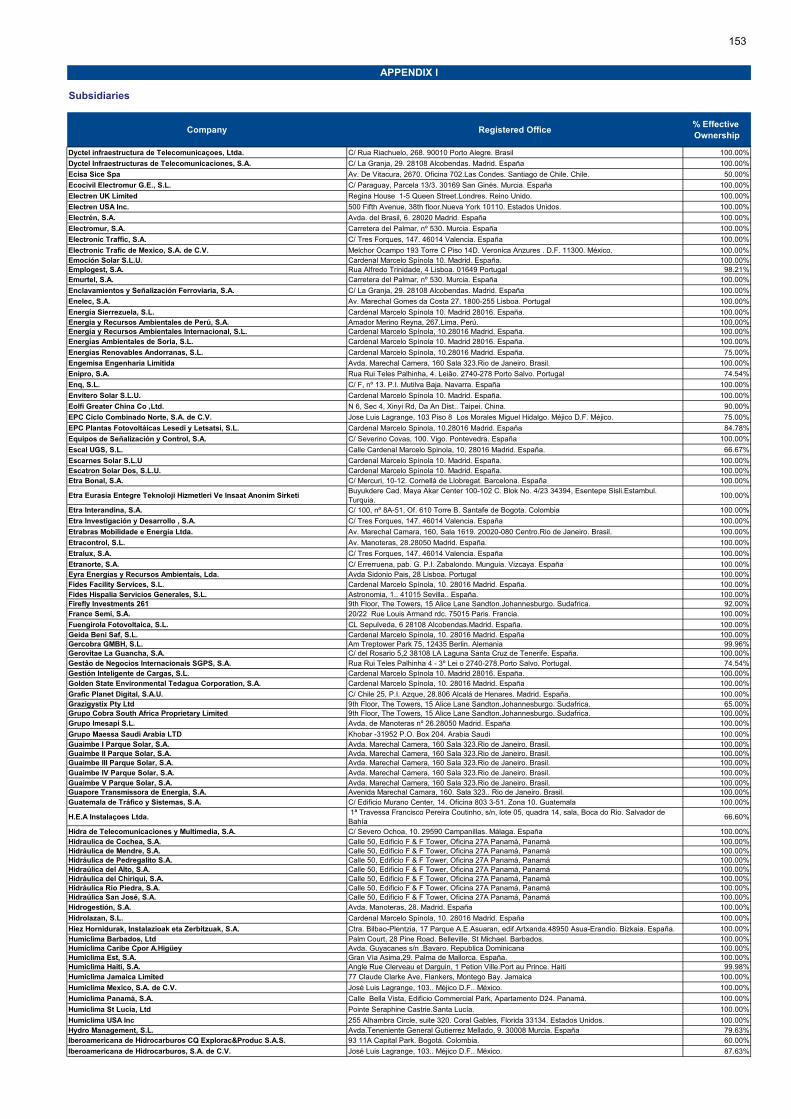
Subsidiaries
Company Registered Office % Effective Ownership
APPENDIX I
Dyctel infraestructura de Telecomunicaçoes, Ltda. C/ Rua Riachuelo, 268. 90010 Porto Alegre. Brasil 100.00%
Dyctel Infraestructuras de Telecomunicaciones, S.A. C/ La Granja, 29. 28108 Alcobendas. Madrid. España 100.00%
Ecisa Sice Spa Av. De Vitacura, 2670. Oficina 702.Las Condes. Santiago de Chile. Chile. 50.00%
Ecocivil Electromur G.E., S.L. C/ Paraguay, Parcela 13/3. 30169 San Ginés. Murcia. España 100.00%
Electren UK Limited Regina House 1-5 Queen Street.Londres. Reino Unido. 100.00%
Electren USA Inc. 500 Fifth Avenue, 38th floor.Nueva York 10110. Estados Unidos. 100.00%
Electrén, S.A. Avda. del Brasil, 6. 28020 Madrid. España 100.00%
Electromur, S.A. Carretera del Palmar, nº 530. Murcia. España 100.00%
Electronic Traffic, S.A. C/ Tres Forques, 147. 46014 Valencia. España 100.00%
Electronic Trafic de Mexico, S.A. de C.V. Melchor Ocampo 193 Torre C Piso 14D. Veronica Anzures . D.F. 11300. México. 100.00%Emoción Solar S.L.U. Cardenal Marcelo Spínola 10. Madrid. España. 100.00%Emplogest, S.A. Rua Alfredo Trinidade, 4 Lisboa. 01649 Portugal 98.21%Emurtel, S.A. Carretera del Palmar, nº 530. Murcia. España 100.00%
Enclavamientos y Señalización Ferroviaria, S.A. C/ La Granja, 29. 28108 Alcobendas. Madrid. España 100.00%
Enelec, S.A. Av. Marechal Gomes da Costa 27. 1800-255 Lisboa. Portugal 100.00%
Energía Sierrezuela, S.L. Cardenal Marcelo Spínola 10. Madrid 28016. España. 100.00%Energia y Recursos Ambientales de Perú, S.A. Amador Merino Reyna, 267.Lima. Perú. 100.00%Energía y Recursos Ambientales Internacional, S.L. Cardenal Marcelo Spínola, 10.28016 Madrid. España. 100.00%Energías Ambientales de Soria, S.L. Cardenal Marcelo Spínola 10. Madrid 28016. España. 100.00%
Energías Renovables Andorranas, S.L. Cardenal Marcelo Spínola, 10.28016 Madrid. España. 75.00%
Engemisa Engenharia Limitida Avda. Marechal Camera, 160 Sala 323.Rio de Janeiro. Brasil. 100.00%
Enipro, S.A. Rua Rui Teles Palhinha, 4. Leião. 2740-278 Porto Salvo. Portugal 74.54%
Enq, S.L. C/ F, nº 13. P.I. Mutilva Baja. Navarra. España 100.00%
Envitero Solar S.L.U. Cardenal Marcelo Spínola 10. Madrid. España. 100.00%
Eolfi Greater China Co ,Ltd. N 6, Sec 4, Xinyi Rd, Da An Dist.. Taipei. China. 90.00%
EPC Ciclo Combinado Norte, S.A. de C.V. Jose Luis Lagrange, 103 Piso 8 Los Morales Miguel Hidalgo. Méjico D.F. Méjico. 75.00%
EPC Plantas Fotovoltáicas Lesedi y Letsatsi, S.L. Cardenal Marcelo Spinola, 10.28016 Madrid. España 84.78%
Equipos de Señalización y Control, S.A. C/ Severino Covas, 100. Vigo. Pontevedra. España 100.00%
Escal UGS, S.L. Calle Cardenal Marcelo Spinola, 10, 28016 Madrid. España. 66.67%
Escarnes Solar S.L.U Cardenal Marcelo Spínola 10. Madrid. España. 100.00%Escatron Solar Dos, S.L.U. Cardenal Marcelo Spínola 10. Madrid. España. 100.00%Etra Bonal, S.A. C/ Mercuri, 10-12. Cornellá de Llobregat. Barcelona. España 100.00%
Etra Eurasia Entegre Teknoloji Hizmetleri Ve Insaat Anonim SirketiBuyukdere Cad. Maya Akar Center 100-102 C. Blok No. 4/23 34394, Esentepe Sisli.Estambul. Turquia.
100.00%
Etra Interandina, S.A. C/ 100, nº 8A-51, Of. 610 Torre B. Santafe de Bogota. Colombia 100.00%
Etra Investigación y Desarrollo , S.A. C/ Tres Forques, 147. 46014 Valencia. España 100.00%
Etrabras Mobilidade e Energia Ltda. Av. Marechal Camara, 160, Sala 1619. 20020-080 Centro.Rio de Janeiro. Brasil. 100.00%
Etracontrol, S.L. Av. Manoteras, 28.28050 Madrid. España. 100.00%
Etralux, S.A. C/ Tres Forques, 147. 46014 Valencia. España 100.00%
Etranorte, S.A. C/ Errerruena, pab. G. P.I. Zabalondo. Munguia. Vizcaya. España 100.00%Eyra Energías y Recursos Ambientais, Lda. Avda Sidonio Pais, 28 Lisboa. Portugal 100.00%Fides Facility Services, S.L. Cardenal Marcelo Spínola, 10. 28016 Madrid. España. 100.00%Fides Hispalia Servicios Generales, S.L. Astronomia, 1.. 41015 Sevilla.. España. 100.00%Firefly Investments 261 9th Floor, The Towers, 15 Alice Lane Sandton.Johannesburgo. Sudafrica. 92.00%France Semi, S.A. 20/22 Rue Louis Armand rdc. 75015 Paris. Francia. 100.00%
Fuengirola Fotovoltaica, S.L. CL Sepulveda, 6 28108 Alcobendas.Madrid. España. 100.00%Geida Beni Saf, S.L. Cardenal Marcelo Spínola, 10. 28016 Madrid. España 100.00%Gercobra GMBH, S.L. Am Treptower Park 75, 12435 Berlin. Alemania 99.96%Gerovitae La Guancha, S.A. C/ del Rosario 5,2 38108 LA Laguna Santa Cruz de Tenerife. España. 100.00%Gestâo de Negocios Internacionais SGPS, S.A. Rua Rui Teles Palhinha 4 - 3º Lei o 2740-278.Porto Salvo. Portugal. 74.54%Gestión Inteligente de Cargas, S.L. Cardenal Marcelo Spínola 10. Madrid 28016. España. 100.00%Golden State Environmental Tedagua Corporation, S.A. Cardenal Marcelo Spínola, 10. 28016 Madrid. España 100.00%
Grafic Planet Digital, S.A.U. C/ Chile 25, P.I. Azque, 28.806 Alcalá de Henares. Madrid. España. 100.00%Grazigystix Pty Ltd 9th Floor, The Towers, 15 Alice Lane Sandton.Johannesburgo. Sudafrica. 65.00%Grupo Cobra South Africa Proprietary Limited 9th Floor, The Towers, 15 Alice Lane Sandton.Johannesburgo. Sudafrica. 100.00%Grupo Imesapi S.L. Avda. de Manoteras nº 26.28050 Madrid. España 100.00%
Grupo Maessa Saudi Arabia LTD Khobar -31952 P.O. Box 204. Arabia Saudi 100.00%Guaimbe I Parque Solar, S.A. Avda. Marechal Camera, 160 Sala 323.Rio de Janeiro. Brasil. 100.00%Guaimbe II Parque Solar, S.A. Avda. Marechal Camera, 160 Sala 323.Rio de Janeiro. Brasil. 100.00%Guaimbe III Parque Solar, S.A. Avda. Marechal Camera, 160 Sala 323.Rio de Janeiro. Brasil. 100.00%Guaimbe IV Parque Solar, S.A. Avda. Marechal Camera, 160 Sala 323.Rio de Janeiro. Brasil. 100.00%Guaimbe V Parque Solar, S.A. Avda. Marechal Camera, 160 Sala 323.Rio de Janeiro. Brasil. 100.00%Guapore Transmissora de Energia, S.A. Avenida Marechal Camara, 160. Sala 323.. Rio de Janeiro. Brasil. 100.00%Guatemala de Tráfico y Sistemas, S.A. C/ Edificio Murano Center, 14. Oficina 803 3-51. Zona 10. Guatemala 100.00%
H.E.A Instalaçoes Ltda. 1ª Travessa Francisco Pereira Coutinho, s/n, lote 05, quadra 14, sala, Boca do Rio. Salvador de Bahía
66.60%
Hidra de Telecomunicaciones y Multimedia, S.A. C/ Severo Ochoa, 10. 29590 Campanillas. Málaga. España 100.00%Hidraulica de Cochea, S.A. Calle 50, Edificio F & F Tower, Oficina 27A Panamá, Panamá 100.00%Hidráulica de Mendre, S.A. Calle 50, Edificio F & F Tower, Oficina 27A Panamá, Panamá 100.00%Hidráulica de Pedregalito S.A. Calle 50, Edificio F & F Tower, Oficina 27A Panamá, Panamá 100.00%Hidraúlica del Alto, S.A. Calle 50, Edificio F & F Tower, Oficina 27A Panamá, Panamá 100.00%Hidráulica del Chiriqui, S.A. Calle 50, Edificio F & F Tower, Oficina 27A Panamá, Panamá 100.00%Hidráulica Río Piedra, S.A. Calle 50, Edificio F & F Tower, Oficina 27A Panamá, Panamá 100.00%Hidraúlica San José, S.A. Calle 50, Edificio F & F Tower, Oficina 27A Panamá, Panamá 100.00%Hidrogestión, S.A. Avda. Manoteras, 28. Madrid. España 100.00%
Hidrolazan, S.L. Cardenal Marcelo Spínola, 10. 28016 Madrid. España 100.00%
Hiez Hornidurak, Instalazioak eta Zerbitzuak, S.A. Ctra. Bilbao-Plentzia, 17 Parque A.E.Asuaran, edif.Artxanda.48950 Asua-Erandio. Bizkaia. España. 100.00%Humiclima Barbados, Ltd Palm Court, 28 Pine Road. Belleville. St Michael. Barbados. 100.00%Humiclima Caribe Cpor A.Higüey Avda. Guyacanes s/n .Bavaro. Republica Dominicana 100.00%Humiclima Est, S.A. Gran Vía Asima,29. Palma de Mallorca. España. 100.00%Humiclima Haiti, S.A. Angle Rue Clerveau et Darguin, 1 Petion Ville.Port au Prince. Haiti 99.98%Humiclima Jamaica Limited 77 Claude Clarke Ave, Flankers, Montego Bay. Jamaica 100.00%
Humiclima Mexico, S.A. de C.V. José Luis Lagrange, 103.. Méjico D.F.. México. 100.00%
Humiclima Panamá, S.A. Calle Bella Vista, Edificio Commercial Park, Apartamento D24. Panamá. 100.00%
Humiclima St Lucia, Ltd Pointe Seraphine Castrie.Santa Lucía. 100.00%
Humiclima USA Inc 255 Alhambra Circle, suite 320. Coral Gables, Florida 33134. Estados Unidos. 100.00%Hydro Management, S.L. Avda.Teneniente General Gutierrez Mellado, 9. 30008 Murcia. España 79.63%Iberoamericana de Hidrocarburos CQ Explorac&Produc S.A.S. 93 11A Capital Park. Bogotá. Colombia. 60.00%
Iberoamericana de Hidrocarburos, S.A. de C.V. José Luis Lagrange, 103.. Méjico D.F.. México. 87.63%
153
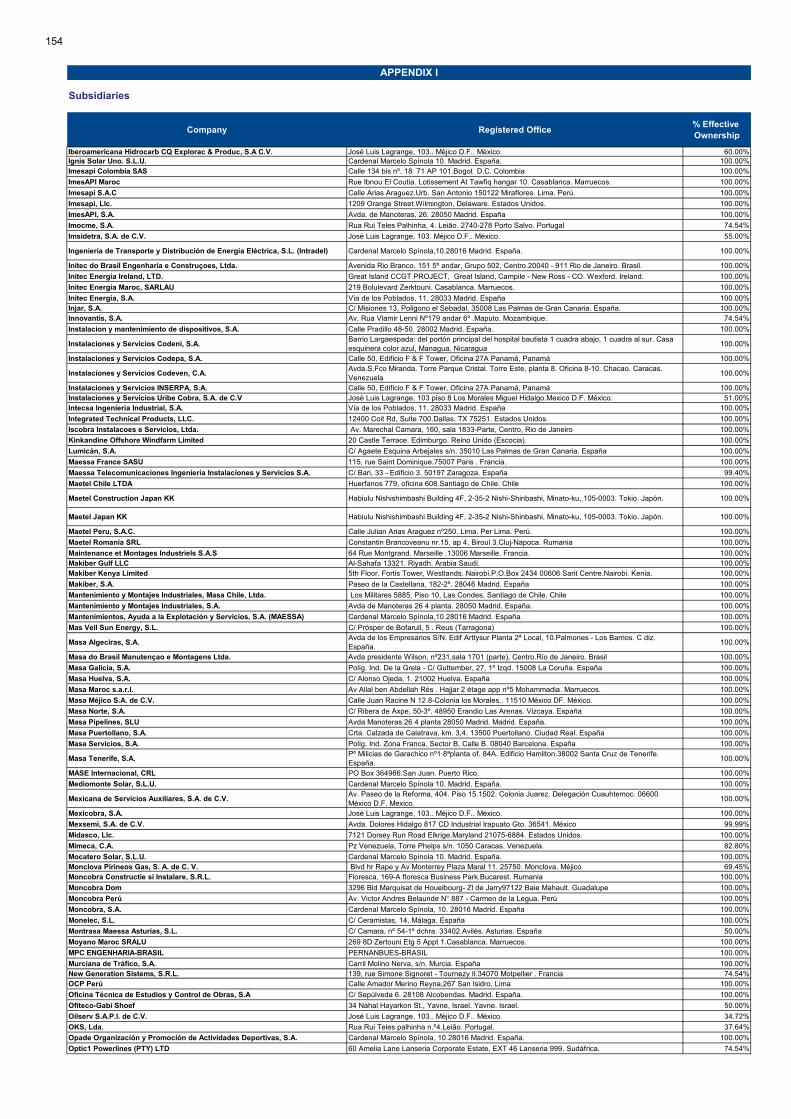
Subsidiaries
Company Registered Office % Effective Ownership
APPENDIX I
Iberoamericana Hidrocarb CQ Explorac & Produc, S.A C.V. José Luis Lagrange, 103.. Méjico D.F.. México. 60.00%Ignis Solar Uno. S.L.U. Cardenal Marcelo Spínola 10. Madrid. España. 100.00%Imesapi Colombia SAS Calle 134 bis nº. 18 71 AP 101.Bogot D.C. Colombia 100.00%
ImesAPI Maroc Rue Ibnou El Coutia. Lotissement At Tawfiq hangar 10. Casablanca. Marruecos. 100.00%
Imesapi S.A.C Calle Arias Araguez.Urb. San Antonio 150122 Miraflores. Lima. Perú. 100.00%
Imesapi, Llc. 1209 Orange Street.Wilmington, Delaware. Estados Unidos. 100.00%
ImesAPI, S.A. Avda. de Manoteras, 26. 28050 Madrid. España 100.00%
Imocme, S.A. Rua Rui Teles Palhinha, 4. Leião. 2740-278 Porto Salvo. Portugal 74.54%
Imsidetra, S.A. de C.V. José Luis Lagrange, 103. Méjico D.F.. México. 55.00%
Ingenieria de Transporte y Distribución de Energía Eléctrica, S.L. (Intradel) Cardenal Marcelo Spínola,10.28016 Madrid. España. 100.00%
Initec do Brasil Engenharia e Construçoes, Ltda. Avenida Rio Branco, 151 5º andar, Grupo 502, Centro.20040 - 911 Rio de Janeiro. Brasil. 100.00%
Initec Energía Ireland, LTD. Great Island CCGT PROJECT, Great Island, Campile - New Ross - CO. Wexford. Ireland. 100.00%
Initec Energía Maroc, SARLAU 219 Bolulevard Zerktouni. Casablanca. Marruecos. 100.00%
Initec Energía, S.A. Vía de los Poblados, 11. 28033 Madrid. España 100.00%Injar, S.A. C/ Misiones 13, Poligono el Sebadal, 35008 Las Palmas de Gran Canaria. España. 100.00%Innovantis, S.A. Av. Rua Vlamir Lenni Nº179 andar 6º .Maputo. Mozambique. 74.54%
Instalacion y mantenimiento de dispositivos, S.A. Calle Pradillo 48-50. 28002 Madrid. España. 100.00%
Instalaciones y Servicios Codeni, S.A.Barrio Largaespada: del portón principal del hospital bautista 1 cuadra abajo, 1 cuadra al sur. Casa esquinera color azul, Managua. Nicaragua
100.00%
Instalaciones y Servicios Codepa, S.A. Calle 50, Edificio F & F Tower, Oficina 27A Panamá, Panamá 100.00%
Instalaciones y Servicios Codeven, C.A.Avda.S.Fco Miranda. Torre Parque Cristal. Torre Este, planta 8. Oficina 8-10. Chacao. Caracas. Venezuela
100.00%
Instalaciones y Servicios INSERPA, S.A. Calle 50, Edificio F & F Tower, Oficina 27A Panamá, Panamá 100.00%Instalaciones y Servicios Uribe Cobra, S.A. de C.V José Luis Lagrange, 103 piso 8 Los Morales Miguel Hidalgo.Mexico D.F. México. 51.00%Intecsa Ingeniería Industrial, S.A. Vía de los Poblados, 11. 28033 Madrid. España 100.00%
Integrated Technical Products, LLC. 12400 Coit Rd, Suite 700.Dallas, TX 75251. Estados Unidos. 100.00%
Iscobra Instalacoes e Servicios, Ltda. Av. Marechal Camara, 160, sala 1833-Parte, Centro, Rio de Janeiro 100.00%
Kinkandine Offshore Windfarm Limited 20 Castle Terrace. Edimburgo. Reino Unido (Escocia). 100.00%
Lumicán, S.A. C/ Agaete Esquina Arbejales s/n. 35010 Las Palmas de Gran Canaria. España 100.00%
Maessa France SASU 115, rue Saint Dominique.75007 Paris . Francia. 100.00%
Maessa Telecomunicaciones Ingeniería Instalaciones y Servicios S.A. C/ Bari, 33 - Edificio 3. 50197 Zaragoza. España 99.40%
Maetel Chile LTDA Huerfanos 779, oficina 608.Santiago de Chile. Chile 100.00%
Maetel Construction Japan KK Habiulu Nishishimbashi Building 4F, 2-35-2 Nishi-Shinbashi, Minato-ku, 105-0003. Tokio. Japón. 100.00%
Maetel Japan KK Habiulu Nishishimbashi Building 4F, 2-35-2 Nishi-Shinbashi, Minato-ku, 105-0003. Tokio. Japón. 100.00%
Maetel Peru, S.A.C. Calle Julian Arias Araguez nº250. Lima. Per Lima. Perú. 100.00%
Maetel Romania SRL Constantin Brancoveanu nr.15, ap 4, Biroul 3.Cluj-Napoca. Rumania 100.00%
Maintenance et Montages Industriels S.A.S 64 Rue Montgrand. Marseille .13006 Marseille. Francia. 100.00%Makiber Gulf LLC Al-Sahafa 13321. Riyadh. Arabia Saudí. 100.00%Makiber Kenya Limited 5th Floor. Fortis Tower, Westlands. Nairobi.P.O.Box 2434 00606 Sarit Centre.Nairobi. Kenia. 100.00%
Makiber, S.A. Paseo de la Castellana, 182-2º. 28046 Madrid. España 100.00%
Mantenimiento y Montajes Industriales, Masa Chile, Ltda. Los Militares 5885, Piso 10, Las Condes, Santiago de Chile. Chile 100.00%
Mantenimiento y Montajes Industriales, S.A. Avda de Manoteras 26 4 planta. 28050 Madrid. España. 100.00%
Mantenimientos, Ayuda a la Explotación y Servicios, S.A. (MAESSA) Cardenal Marcelo Spínola,10.28016 Madrid. España. 100.00%
Mas Vell Sun Energy, S.L. C/ Prósper de Bofarull, 5 . Reus (Tarragona) 100.00%
Masa Algeciras, S.A.Avda de los Empresarios S/N. Edif Arttysur Planta 2ª Local, 10.Palmones - Los Barrios. C diz. España.
100.00%
Masa do Brasil Manutençao e Montagens Ltda. Avda presidente Wilson, nº231,sala 1701 (parte), Centro.Río de Janeiro. Brasil 100.00%
Masa Galicia, S.A. Políg. Ind. De la Grela - C/ Guttember, 27, 1º Izqd. 15008 La Coruña. España 100.00%
Masa Huelva, S.A. C/ Alonso Ojeda, 1. 21002 Huelva. España 100.00%
Masa Maroc s.a.r.l. Av Allal ben Abdellah Rés . Hajjar 2 étage app nº5 Mohammadia. Marruecos. 100.00%
Masa Méjico S.A. de C.V. Calle Juan Racine N 12 8-Colonia los Morales.. 11510 México DF. México. 100.00%
Masa Norte, S.A. C/ Ribera de Axpe, 50-3º. 48950 Erandio Las Arenas. Vizcaya. España 100.00%
Masa Pipelines, SLU Avda Manoteras 26 4 planta 28050 Madrid. Madrid. España. 100.00%
Masa Puertollano, S.A. Crta. Calzada de Calatrava, km. 3,4. 13500 Puertollano. Ciudad Real. España 100.00%
Masa Servicios, S.A. Políg. Ind. Zona Franca, Sector B, Calle B. 08040 Barcelona. España 100.00%
Masa Tenerife, S.A.Pº Milicias de Garachico nº1 8ªplanta of. 84A. Edificio Hamilton.38002 Santa Cruz de Tenerife. España.
100.00%
MASE Internacional, CRL PO Box 364966.San Juan. Puerto Rico. 100.00%
Mediomonte Solar, S.L.U. Cardenal Marcelo Spínola 10. Madrid. España. 100.00%
Mexicana de Servicios Auxiliares, S.A. de C.V.Av. Paseo de la Reforma, 404. Piso 15.1502. Colonia Juarez. Delegación Cuauhtemoc. 06600 México D.F. Mexico.
100.00%
Mexicobra, S.A. José Luis Lagrange, 103.. Méjico D.F.. México. 100.00%
Mexsemi, S.A. de C.V. Avda. Dolores Hidalgo 817 CD Industrial Irapuato Gto. 36541. México 99.99%
Midasco, Llc. 7121 Dorsey Run Road Elkrige.Maryland 21075-6884. Estados Unidos. 100.00%
Mimeca, C.A. Pz Venezuela, Torre Phelps s/n. 1050 Caracas. Venezuela. 82.80%
Mocatero Solar, S.L.U. Cardenal Marcelo Spínola 10. Madrid. España. 100.00%Monclova Pirineos Gas, S. A. de C. V. Blvd hr Rape y Av Monterrey Plaza Maral 11. 25750. Monclova. Méjico 69.45%Moncobra Constructie si Instalare, S.R.L. Floresca, 169-A floresca Business Park.Bucarest. Rumania 100.00%
Moncobra Dom 3296 Bld Marquisat de Houelbourg- Zl de Jarry97122 Baie Mahault. Guadalupe 100.00%
Moncobra Perú Av. Victor Andres Belaunde N° 887 - Carmen de la Legua. Perú 100.00%
Moncobra, S.A. Cardenal Marcelo Spínola, 10. 28016 Madrid. España 100.00%
Monelec, S.L. C/ Ceramistas, 14. Málaga. España 100.00%
Montrasa Maessa Asturias, S.L. C/ Camara, nº 54-1º dchra. 33402 Avilés. Asturias. España 50.00%
Moyano Maroc SRALU 269 8D Zertouni Etg 5 Appt 1.Casablanca. Marruecos. 100.00%
MPC ENGENHARIA-BRASIL PERNANBUES-BRASIL 100.00%
Murciana de Tráfico, S.A. Carril Molino Nerva, s/n. Murcia. España 100.00%New Generation Sistems, S.R.L. 139, rue Simone Signoret - Tournezy II.34070 Motpellier . Francia 74.54%OCP Perú Calle Amador Merino Reyna,267 San Isidro, Lima 100.00%
Oficina Técnica de Estudios y Control de Obras, S.A C/ Sepúlveda 6. 28108 Alcobendas. Madrid. España. 100.00%
Ofiteco-Gabi Shoef 34 Nahal Hayarkon St., Yavne, Israel. Yavne. Israel. 50.00%
Oilserv S.A.P.I. de C.V. José Luis Lagrange, 103.. Méjico D.F.. México. 34.72%
OKS, Lda. Rua Rui Teles palhinha n.º4.Leião. Portugal. 37.64%
Opade Organización y Promoción de Actividades Deportivas, S.A. Cardenal Marcelo Spínola, 10.28016 Madrid. España. 100.00%
Optic1 Powerlines (PTY) LTD 60 Amelia Lane Lanseria Corporate Estate, EXT 46 Lanseria 999. Sudáfrica. 74.54%
154

Subsidiaries
Company Registered Office % Effective Ownership
APPENDIX I
P.E. Monte das Aguas, S.L. Cardenal Marcelo Spínola, 10. 28016 Madrid. España 60.00%Parque Eólico Buseco, S.L. Comandante Caballero, 8. 33005 Oviedo. Asturias. España 80.00%
Parque Eólico Tadeas, S.L. Cardenal Marcelo Spínola, 10. 28016 Madrid. España 51.48%
Parque Eólico Valdehierro, S.L. Cardenal Marcelo Spínola, 10. 28016 Madrid. España 51.48%
Peaker Solar, S.L.U. Cardenal Marcelo Spínola 10. Madrid. España. 100.00%
Percomex, S.A. Jose Luis Lagrange, 103 Piso 8 Los Morales Miguel Hidalgo. Méjico D.F. Méjico. 100.00%
Petrolíferos Tierra Blanca, S.A. de C.V. Calle 6 206, Pozarica de Hidalgo. Méjico. 34.72%
Pilot Offshore Renewables Limited 20 Castle Terrace. Edimburgo. Reino Unido (Escocia). 100.00%
Planta de Tratamiento de Aguas Residuales, S.A. Cal. Amador Merino Reyna N° 267 Int. 902 - San Isidro. Perú 100.00%
Procme Southern Africa do Sul PO BOX 151, Lanseria 1748. Joahnesburgo. Sudáfrica. 74.54%
Procme, S.A. Rua Rui Teles Palhinha, 4. Leião 2740-278 Porto Salvo. Portugal. 74.54%
Promosolar Juwi 17, S.L. Moro Zeit, 11 3º.. Valencia. España. 100.00%
Railways Infraestructures Instalac y Servicios LLCAlameer Sultan Street North, Alnaeem dist. (4), Ahmed Al-Hamoody Street Building no. (8) Jeddah. Arabia Saudi
100.00%
Recursos Eólicos de Mexico, S.A. de C.V. José Luis Lagrande, 103 P-8.Los Morales Polanco. México. 100.00%
Remodelación Diesel Cadereyta, S.A. de C.V. Jose Luis Lagrange, 103 Piso 8 Los Morales Miguel Hidalgo.Méjico D.F. Méjico 100.00%
Remodelación el Sauz, S.A. de C.V. José Luis Lagrande, 103 P-8.Los Morales Polanco. México. 100.00%
Repotenciación C.T. Manzanillo, S.A. de C.V. José Luis Lagrande, 103 P-8.Los Morales Polanco. México. 100.00%
Restel, SAS Grenoble City Business Center. Grenoble. Francia. 80.00%
Ribagrande Energía, S.L. Cardenal Marcelo Spínola 10. Madrid 28016. España. 100.00%
Rioparque, Lda. Tagus Sapce - Rua Rui Teles Palhinha, N 4 2740-278.Porto Salvo. Portugal. 74.54%
Robledo Eólica, S.L. Cardenal Marcelo Spínola 10. Madrid 28016. España. 100.00%
Roura Cevasa México, S.A. de C.V Calle Oxford, 30, Colonia Juarez, CP 06600, Cuauhtemoc. Ciudad de México. México. 100.00%
Roura Cevasa, S.A. C/ Chile 25, P.I. Azque, 28.806 Alcalá de Henares. Madrid. España. 100.00%Salam Sice Tech Solutions, Llc. Salam Tower West Bay P.O. Box 15224 DOHA (Qatar)Box 15224 Doha. Qatar 49.00%Sarl Maintenance Cobra Algerie Rue de Zacar hydra, 21, Argelia 100.00%
Sarl Ofiteco Argelia Rue du Sahel, 14. Hydra.Argel. Argelia. 49.00%
Sedmive, C.A. (Soc. Españ. Montajes Indus Venezuela)Av. Francisco de Miranda, con Av. Eugenio Mendoza, Edf. Sede Gerencial La Castellana, Piso 8, Oficina 8A, La Castellana. Caracas. Venezuela.
100.00%
Semi Chile Spa Almirante Pastene 333.Santiago de Chile. Chile. 100.00%
Semi El Salvador Limitada de Capital Variable Final 85 Av. Norte número 912, Colonia Escalón, San Salvador.. San Salvador. El Salvador. 100.00%
Semi Ingenieria, S.r.L.Ave. Abraham Lincoln No. 1003, Torre Biltmore I, suite 404, Piantini. Santo Domingo. República Dominicana.
99.90%
Semi Italia, SRL. Via Uberto Visconti Di Modrone 3.Milan. Italia. 100.00%
Semi Maroc, S.A. 5 Rue Fakir Mohamed .Casablanca Sidi Belyout. Marruecos. 100.00%
SEMI Panamá, S.A. Edificio Domino, oficina 5. Via España. Panamá. 100.00%
Semi Peru Montajes Industriales S.A.C. Av. Nicolás Ayllón Nº2925 ; El Agustino. Lima. Perú. 100.00%
Semi Procoin Solar Spa Calle Apoquindo Nº 3001 Piso 9, Region Metropolitana.Santiago De Chile. Chile. 65.00%
SEMI SaudiSEMI Saudi Ground Floor office No: 02 (AL-MARWAH- DIST./7 - Amer Bin Abi Rabeah St.). Jeddah. Arabia Saudí
100.00%
Semi USA Corporation 6701 Democracy Blvd., Suite 200. 20817 Bethesda - MD. Estados Unidos. 100.00%
SEMIUR Montajes Industriales, S.A. C/ 25 de mayo 604 oficina 202. 11000 Montevideo. Uruguay. 100.00%
Semona, S.R.L.Ave. Abraham Lincoln No. 1003, Torre Biltmore I, suite 404, Piantini. Santo Domingo. República Dominicana.
70.00%
Sermacon Joel, C.A. Pz Venezuela, Torre Phelps s/n. 1050 Caracas. Venezuela. 82.80%
Sermicro do Brasil Servicos e Informática Ltda.Avda. Das Nacoes Unidas nº 12.551 9º e 7º edif. World Trade Center.Brooklin Paulista.Sao Paulo 04578-000 . Brasil. .
100.00%
Sermicro Perú S.A.C Avenida Mariscal la Mar, 638. Lima. Perú. 100.00%
Sermicro, S.A. C/ Pradillo, 46. 28002 Madrid. España. 100.00%
Serpimex, S.A. de C.V. C/ Jose Luis Lagrange, 103 Piso 8. Los Morales Polanco.11510 Mexico DF. Mexico. 99.99%
Serpista, S.A. Cardenal Marcelo Spínola, 10. 28016 Madrid. España 51.00%
Serveis Catalans, Serveica, S.A. Avda. de Manoteras, 26. 28050 Madrid. España 100.00%
Servicios Cymimex, S.A. de C.V. José Luis Lagrande, 103 P-8.Los Morales Polanco. México. 99.80%Servicios Logísticos y Auxiliares de Occidente, SA Avenida Petapa 46-11, Zona 12 Guatemala Ciudad 01012. Guatemala 100.00%Sete Lagoas Transmissora de Energia, Ltda. Avda. Marechal Camera, 160.Río de Janeiro. Brasil. 100.00%
Setec Soluçoes Energeticas de Transmissao e Controle, Ltda. Av. Presidente Wilson 231, sala 1701 20030-020 Rio de Janeiro. Brasil 100.00%SICE Ardan projects 4, Hagavish Street. Netanya 42101. Netanya. Israel. 51.00%Sice Canada, Inc. 100 King Street West, Suite 1600.Toronto On M5X 1G5. Canadá. 100.00%
Sice Energía, S.L. C/ Sepúlveda, 6. 28108 Alcobendas. Madrid. España 100.00%Sice Hellas Sistemas Tecnológicos Sociedad Unipersonal de Responsabilidad Limitada
C/Omirou. 14562 Kifissia. Grecia 100.00%
Sice NZ Limited Level 4, Corner Kent & Crowhurst Streets, New Market.Auckland, 1149. Australia. 100.00%
SICE PTY, Ltd. 200 Carlisle Street. St kilda. 3182 VIC. Australia. 100.00%
Sice Societatea de Inginerie Si Constructii Electrice, S.R.L. Calea Dorobantilor, 1.Timisiora. Rumania. 100.00%
Sice South Africa Pty, Ltd. C/ PO Box 179. 009 Pretoria, Sudáfrica 100.00%
Sice Tecnología y Sistemas, S.A. C/ Sepúlveda, 6. 28108 Alcobendas. Madrid. España 100.00%
SICE, Inc. 14350 NW 56th. Court Unit 105. Miami. 33054 Florida. Estados Unidos. 100.00%
SICE, LLC. Rublesvkoye Shosse 83/1 121467 Moscu. Rusia 100.00%
Sistemas Integrales de Mantenimiento, S.A. Avda de Manoteras 26 4 planta. 28050 Madrid. España. 100.00%
Sistemas Radiantes F. Moyano, S.A. C/ De La Cañada, 53. 28850 Torrejón de Ardoz. Madrid. España 100.00%
Sistemas Sec, S.A. C/ Miraflores 383. Santiago de Chile. Chile 51.00%
Small Medium Enterprises Consulting, B.V. Claude Debussylaan, 44, 1082 MD.Amsterdam. Holanda. 74.54%
Soc Iberica de Construcciones Electricas de Seguridad, S.L. C/ La Granja 29. 28108 Alcobendas. Madrid. España 100.00%
Sociedad Española de Montajes Industriales, S.A. (SEMI) Avenida de Manoteras nº 6, segunda planta, 28050, Madrid. España. 100.00%
Sociedad Ibéric de Construcciones Eléctricas en Chile, Spa Cl Dardignac, 160. Recoleta. Santiago de Chile 100.00%
Sociedad Ibérica de Construcciones Eléctricas, S.A. C/ Sepúlveda, 6. 28108 Alcobendas. Madrid. España 100.00%
Sociedad Industrial de Construccion Eléctricas, S.A C/ Aquilino de la Guardia. Edificio IGRA Local 2. Urbanización Bella Vista Panamá 100.00%
Sociedad Industrial de Construcciones Eléctricas de Costa Rica, S.A. C/ San Jose Barrio Los Yoses - Final Avenida Diez.25 m.norte y 100 este. San Jose. Costa Rica 100.00%
Sociedad Industrial de Construcciones Eléctricas Siceandina, S.A. C/ Chinchinal, 350. Barrio El Inca. Pichincha - Quito. Ecuador. 100.00%
Sociedad Industrial de Construcciones Eléctricas, S.A. de C.V.Paseo de la Reforma, 404. Despacho 1502, Piso 15Col. Juarez 06600 Delegación Cuauhtemoc Mexico D.F.
100.00%
Sociedad Industrial de Construcciones Eléctricas, S.L., Ltda. CL 94 NO. 15 32 P 8. Bogot D.C. Colombia 100.00%
Société Industrielle de Construction Electrique, S.A.R.L. Espace Porte D Anfa 3 Rue Bab Mansour Imm C 20000 Casa Blanca. Marruecos 100.00%
Soluciones Auxiliares de Guatemala, S.A. Avenida Petapa 46-11, Zona 12 Guatemala Ciudad 01012. Guatemala 100.00%
Soluciones Eléctricas Integrales de Guatemala, S.A. Avenida Petapa 46-11, Zona 12 Guatemala Ciudad 01012. Guatemala 100.00%
Spcobra Instalaçoes e Serviços, Ltda. Avenida Artur de Queirós, 915, Casa Branca, Santo Andre. Brasil 99.99%
Sumipar, S.A. Carretera de la Santa Creu de Calafell 47 Portal B. 08830 Sant Boi de Llobregat. Barcelona. España 100.00%
155
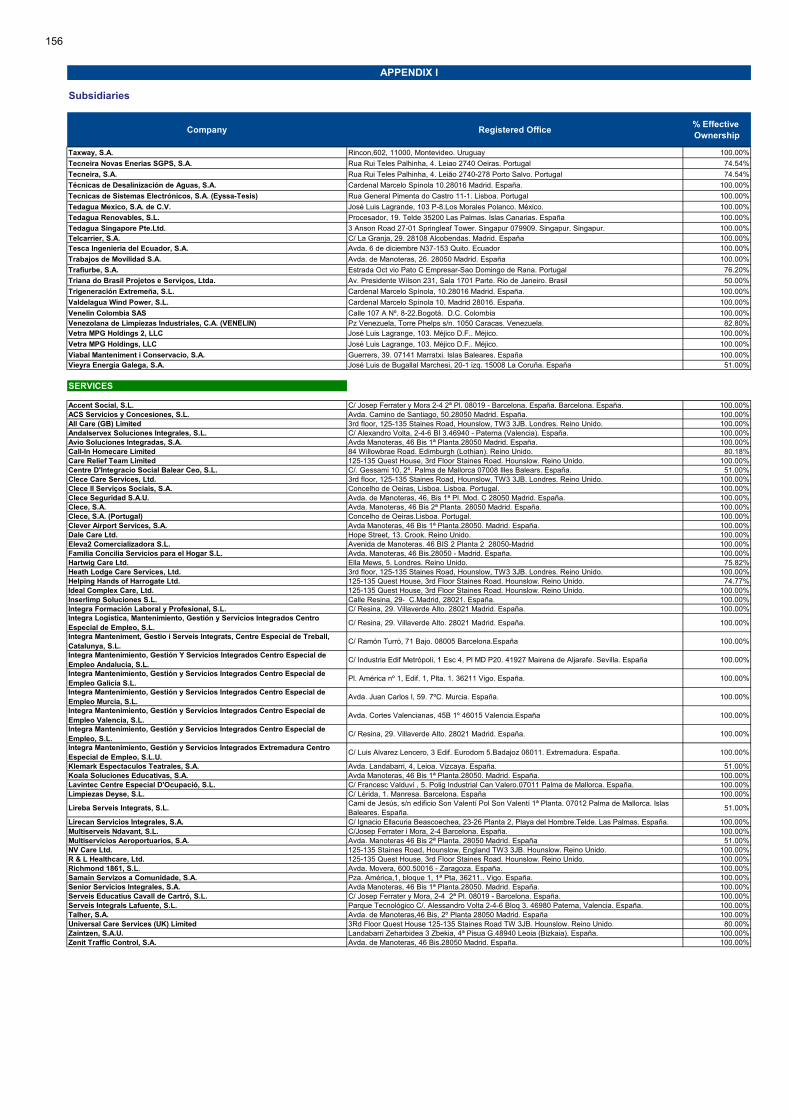
Subsidiaries
Company Registered Office % Effective Ownership
APPENDIX I
Taxway, S.A. Rincon,602, 11000, Montevideo. Uruguay 100.00%
Tecneira Novas Enerias SGPS, S.A. Rua Rui Teles Palhinha, 4. Leiao 2740 Oeiras. Portugal 74.54%
Tecneira, S.A. Rua Rui Teles Palhinha, 4. Leião 2740-278 Porto Salvo. Portugal 74.54%
Técnicas de Desalinización de Aguas, S.A. Cardenal Marcelo Spínola 10.28016 Madrid. España. 100.00%
Tecnicas de Sistemas Electrónicos, S.A. (Eyssa-Tesis) Rua General Pimenta do Castro 11-1. Lisboa. Portugal 100.00%
Tedagua Mexico, S.A. de C.V. José Luis Lagrande, 103 P-8.Los Morales Polanco. México. 100.00%
Tedagua Renovables, S.L. Procesador, 19. Telde 35200 Las Palmas. Islas Canarias. España 100.00%
Tedagua Singapore Pte.Ltd. 3 Anson Road 27-01 Springleaf Tower. Singapur 079909. Singapur. Singapur. 100.00%Telcarrier, S.A. C/ La Granja, 29. 28108 Alcobendas. Madrid. España 100.00%Tesca Ingenieria del Ecuador, S.A. Avda. 6 de diciembre N37-153 Quito. Ecuador 100.00%
Trabajos de Movilidad S.A. Avda. de Manoteras, 26. 28050 Madrid. España 100.00%
Trafiurbe, S.A. Estrada Oct vio Pato C Empresar-Sao Domingo de Rana. Portugal 76.20%
Triana do Brasil Projetos e Serviços, Ltda. Av. Presidente Wilson 231, Sala 1701 Parte. Rio de Janeiro. Brasil 50.00%
Trigeneración Extremeña, S.L. Cardenal Marcelo Spínola, 10.28016 Madrid. España. 100.00%
Valdelagua Wind Power, S.L. Cardenal Marcelo Spínola 10. Madrid 28016. España. 100.00%
Venelin Colombia SAS Calle 107 A Nº. 8-22.Bogotá. D.C. Colombia 100.00%Venezolana de Limpiezas Industriales, C.A. (VENELIN) Pz Venezuela, Torre Phelps s/n. 1050 Caracas. Venezuela. 82.80%Vetra MPG Holdings 2, LLC José Luis Lagrange, 103. Méjico D.F.. Méjico. 100.00%
Vetra MPG Holdings, LLC José Luis Lagrange, 103. Méjico D.F.. Méjico. 100.00%
Viabal Manteniment i Conservacio, S.A. Guerrers, 39. 07141 Marratxi. Islas Baleares. España 100.00%Vieyra Energía Galega, S.A. José Luis de Bugallal Marchesi, 20-1 izq. 15008 La Coruña. España 51.00%
SERVICES
Accent Social, S.L. C/ Josep Ferrater y Mora 2-4 2ª Pl. 08019 - Barcelona. España. Barcelona. España. 100.00%ACS Servicios y Concesiones, S.L. Avda. Camino de Santiago, 50.28050 Madrid. España. 100.00%All Care (GB) Limited 3rd floor, 125-135 Staines Road, Hounslow, TW3 3JB. Londres. Reino Unido. 100.00%Andalservex Soluciones Integrales, S.L. C/ Alexandro Volta, 2-4-6 BI 3.46940 - Paterna (Valencia). España. 100.00%Avio Soluciones Integradas, S.A. Avda Manoteras, 46 Bis 1ª Planta.28050 Madrid. España. 100.00%Call-In Homecare Limited 84 Willowbrae Road. Edimburgh (Lothian). Reino Unido. 80.18%Care Relief Team Limited 125-135 Quest House, 3rd Floor Staines Road. Hounslow. Reino Unido. 100.00%Centre D'Integracio Social Balear Ceo, S.L. C/. Gessami 10, 2º. Palma de Mallorca 07008 Illes Balears. España. 51.00%Clece Care Services, Ltd. 3rd floor, 125-135 Staines Road, Hounslow, TW3 3JB. Londres. Reino Unido. 100.00%Clece II Serviҫos Sociais, S.A. Concelho de Oeiras, Lisboa. Lisboa. Portugal. 100.00%Clece Seguridad S.A.U. Avda. de Manoteras, 46, Bis 1ª Pl. Mod. C 28050 Madrid. España. 100.00%Clece, S.A. Avda. Manoteras, 46 Bis 2ª Planta. 28050 Madrid. España. 100.00%Clece, S.A. (Portugal) Concelho de Oeiras.Lisboa. Portugal. 100.00%Clever Airport Services, S.A. Avda Manoteras, 46 Bis 1ª Planta.28050. Madrid. España. 100.00%Dale Care Ltd. Hope Street, 13. Crook. Reino Unido. 100.00%Eleva2 Comercializadora S.L. Avenida de Manoteras. 46 BIS 2 Planta 2 28050-Madrid 100.00%Familia Concilia Servicios para el Hogar S.L. Avda. Manoteras, 46 Bis.28050 - Madrid. España. 100.00%Hartwig Care Ltd. Ella Mews, 5. Londres. Reino Unido. 75.82%Heath Lodge Care Services, Ltd. 3rd floor, 125-135 Staines Road, Hounslow, TW3 3JB. Londres. Reino Unido. 100.00%Helping Hands of Harrogate Ltd. 125-135 Quest House, 3rd Floor Staines Road. Hounslow. Reino Unido. 74.77%Ideal Complex Care, Ltd. 125-135 Quest House, 3rd Floor Staines Road. Hounslow. Reino Unido. 100.00%Inserlimp Soluciones S.L. Calle Resina, 29- C.Madrid, 28021. España. 100.00%Integra Formación Laboral y Profesional, S.L. C/ Resina, 29. Villaverde Alto. 28021 Madrid. España. 100.00%Integra Logística, Mantenimiento, Gestión y Servicios Integrados Centro Especial de Empleo, S.L.
C/ Resina, 29. Villaverde Alto. 28021 Madrid. España. 100.00%
Integra Manteniment, Gestio i Serveis Integrats, Centre Especial de Treball, Catalunya, S.L.
C/ Ramón Turró, 71 Bajo. 08005 Barcelona.España 100.00%
Integra Mantenimiento, Gestión Y Servicios Integrados Centro Especial de Empleo Andalucia, S.L.
C/ Industria Edif Metrópoli, 1 Esc 4, Pl MD P20. 41927 Mairena de Aljarafe. Sevilla. España 100.00%
Integra Mantenimiento, Gestión y Servicios Integrados Centro Especial de Empleo Galicia S.L.
Pl. América nº 1, Edif. 1, Plta. 1. 36211 Vigo. España. 100.00%
Integra Mantenimiento, Gestión y Servicios Integrados Centro Especial de Empleo Murcia, S.L.
Avda. Juan Carlos I, 59. 7ºC. Murcia. España. 100.00%
Integra Mantenimiento, Gestión y Servicios Integrados Centro Especial de Empleo Valencia, S.L.
Avda. Cortes Valencianas, 45B 1º 46015 Valencia.España 100.00%
Integra Mantenimiento, Gestión y Servicios Integrados Centro Especial de Empleo, S.L.
C/ Resina, 29. Villaverde Alto. 28021 Madrid. España. 100.00%
Integra Mantenimiento, Gestión y Servicios Integrados Extremadura Centro Especial de Empleo, S.L.U.
C/ Luis Alvarez Lencero, 3 Edif. Eurodom 5.Badajoz 06011. Extremadura. España. 100.00%
Klemark Espectaculos Teatrales, S.A. Avda. Landabarri, 4, Leioa. Vizcaya. España. 51.00%Koala Soluciones Educativas, S.A. Avda Manoteras, 46 Bis 1ª Planta.28050. Madrid. España. 100.00%Lavintec Centre Especial D'Ocupació, S.L. C/ Francesc Valduví , 5. Polig Industrial Can Valero.07011 Palma de Mallorca. España. 100.00%Limpiezas Deyse, S.L. C/ Lérida, 1. Manresa. Barcelona. España 100.00%
Lireba Serveis Integrats, S.L.Cami de Jesús, s/n edificio Son Valentí Pol Son Valentí 1ª Planta. 07012 Palma de Mallorca. Islas Baleares. España.
51.00%
Lirecan Servicios Integrales, S.A. C/ Ignacio Ellacuria Beascoechea, 23-26 Planta 2, Playa del Hombre.Telde. Las Palmas. España. 100.00%Multiserveis Ndavant, S.L. C/Josep Ferrater i Mora, 2-4 Barcelona. España. 100.00%Multiservicios Aeroportuarios, S.A. Avda. Manoteras 46 Bis 2ª Planta. 28050 Madrid. España 51.00%NV Care Ltd. 125-135 Staines Road, Hounslow, England TW3 3JB. Hounslow. Reino Unido. 100.00%R & L Healthcare, Ltd. 125-135 Quest House, 3rd Floor Staines Road. Hounslow. Reino Unido. 100.00%Richmond 1861, S.L. Avda. Movera, 600.50016 - Zaragoza. España. 100.00%Samain Servizos a Comunidade, S.A. Pza. América,1, bloque 1, 1ª Pta, 36211.. Vigo. España. 100.00%Senior Servicios Integrales, S.A. Avda Manoteras, 46 Bis 1ª Planta.28050. Madrid. España. 100.00%Serveis Educatius Cavall de Cartró, S.L. C/ Josep Ferrater y Mora, 2-4 2ª Pl. 08019 - Barcelona. España. 100.00%Serveis Integrals Lafuente, S.L. Parque Tecnológico C/. Alessandro Volta 2-4-6 Bloq 3. 46980 Paterna, Valencia. España. 100.00%Talher, S.A. Avda. de Manoteras,46 Bis, 2º Planta 28050 Madrid. España 100.00%Universal Care Services (UK) Limited 3Rd Floor Quest House 125-135 Staines Road TW 3JB. Hounslow. Reino Unido. 80.00%Zaintzen, S.A.U. Landabarri Zeharbidea 3 Zbekia, 4ª Pisua G.48940 Leoia (Bizkaia). España. 100.00%Zenit Traffic Control, S.A. Avda. de Manoteras, 46 Bis.28050 Madrid. España. 100.00%
156
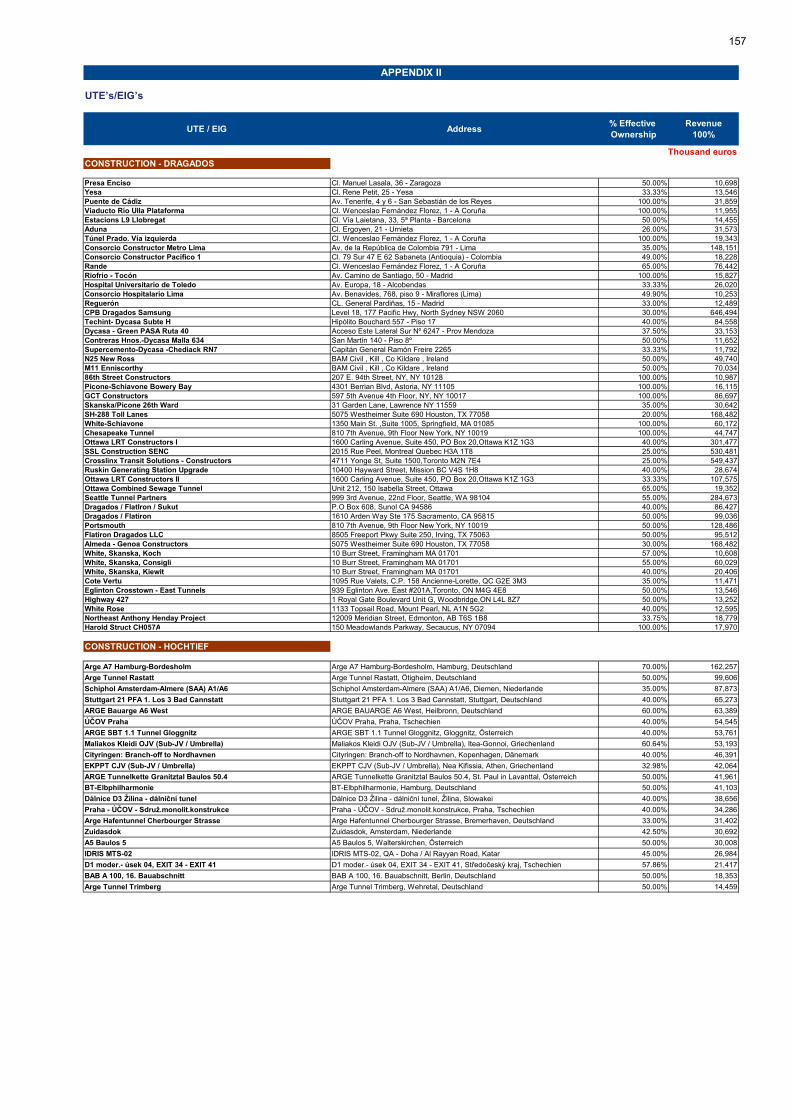
UTE’s/EIG’s
UTE / EIG Address% Effective Ownership
Revenue100%
Thousand eurosCONSTRUCTION - DRAGADOS
Presa Enciso Cl. Manuel Lasala, 36 - Zaragoza 50.00% 10,698Yesa Cl. Rene Petit, 25 - Yesa 33.33% 13,546Puente de Cádiz Av. Tenerife, 4 y 6 - San Sebastián de los Reyes 100.00% 31,859Viaducto Río Ulla Plataforma Cl. Wenceslao Fernández Florez, 1 - A Coruña 100.00% 11,955Estacions L9 Llobregat Cl. Vía Laietana, 33, 5ª Planta - Barcelona 50.00% 14,455Aduna Cl. Ergoyen, 21 - Urnieta 26.00% 31,573Túnel Prado. Vía izquierda Cl. Wenceslao Fernández Florez, 1 - A Coruña 100.00% 19,343Consorcio Constructor Metro Lima Av. de la República de Colombia 791 - Lima 35.00% 148,151Consorcio Constructor Pacífico 1 Cl. 79 Sur 47 E 62 Sabaneta (Antioquia) - Colombia 49.00% 18,228Rande Cl. Wenceslao Fernández Florez, 1 - A Coruña 65.00% 76,442Riofrío - Tocón Av. Camino de Santiago, 50 - Madrid 100.00% 15,827Hospital Universitario de Toledo Av. Europa, 18 - Alcobendas 33.33% 26,020Consorcio Hospitalario Lima Av. Benavides, 768, piso 9 - Miraflores (Lima) 49.90% 10,253Reguerón CL. General Pardiñas, 15 - Madrid 33.00% 12,489CPB Dragados Samsung Level 18, 177 Pacific Hwy, North Sydney NSW 2060 30.00% 646,494Techint- Dycasa Subte H Hipólito Bouchard 557 - Piso 17 40.00% 84,558Dycasa - Green PASA Ruta 40 Acceso Este Lateral Sur Nº 6247 - Prov Mendoza 37.50% 33,153Contreras Hnos.-Dycasa Malla 634 San Martín 140 - Piso 8º 50.00% 11,652Supercemento-Dycasa -Chediack RN7 Capitán General Ramón Freire 2265 33.33% 11,792N25 New Ross BAM Civil , Kill , Co Kildare , Ireland 50.00% 49,740M11 Enniscorthy BAM Civil , Kill , Co Kildare , Ireland 50.00% 70,03486th Street Constructors 207 E. 94th Street, NY, NY 10128 100.00% 10,987Picone-Schiavone Bowery Bay 4301 Berrian Blvd, Astoria, NY 11105 100.00% 16,115GCT Constructors 597 5th Avenue 4th Floor, NY, NY 10017 100.00% 86,697Skanska/Picone 26th Ward 31 Garden Lane, Lawrence NY 11559 35.00% 30,642SH-288 Toll Lanes 5075 Westheimer Suite 690 Houston, TX 77058 20.00% 168,482White-Schiavone 1350 Main St. ,Suite 1005, Springfield, MA 01085 100.00% 60,172Chesapeake Tunnel 810 7th Avenue, 9th Floor New York, NY 10019 100.00% 44,747Ottawa LRT Constructors I 1600 Carling Avenue, Suite 450, PO Box 20,Ottawa K1Z 1G3 40.00% 301,477SSL Construction SENC 2015 Rue Peel, Montreal Quebec H3A 1T8 25.00% 530,481Crosslinx Transit Solutions - Constructors 4711 Yonge St, Suite 1500,Toronto M2N 7E4 25.00% 549,437Ruskin Generating Station Upgrade 10400 Hayward Street, Mission BC V4S 1H8 40.00% 28,674Ottawa LRT Constructors II 1600 Carling Avenue, Suite 450, PO Box 20,Ottawa K1Z 1G3 33.33% 107,575Ottawa Combined Sewage Tunnel Unit 212, 150 Isabella Street, Ottawa 65.00% 19,352Seattle Tunnel Partners 999 3rd Avenue, 22nd Floor, Seattle, WA 98104 55.00% 284,673Dragados / FlatIron / Sukut P.O Box 608, Sunol CA 94586 40.00% 86,427Dragados / Flatiron 1610 Arden Way Ste 175 Sacramento, CA 95815 50.00% 99,036Portsmouth 810 7th Avenue, 9th Floor New York, NY 10019 50.00% 128,486Flatiron Dragados LLC 8505 Freeport Pkwy Suite 250, Irving, TX 75063 50.00% 95,512Almeda - Genoa Constructors 5075 Westheimer Suite 690 Houston, TX 77058 30.00% 168,482White, Skanska, Koch 10 Burr Street, Framingham MA 01701 57.00% 10,608White, Skanska, Consigli 10 Burr Street, Framingham MA 01701 55.00% 60,029White, Skanska, Kiewit 10 Burr Street, Framingham MA 01701 40.00% 20,406Cote Vertu 1095 Rue Valets, C.P. 158 Ancienne-Lorette, QC G2E 3M3 35.00% 11,471Eglinton Crosstown - East Tunnels 939 Eglinton Ave. East #201A,Toronto, ON M4G 4E8 50.00% 13,546Highway 427 1 Royal Gate Boulevard Unit G, Woodbridge,ON L4L 8Z7 50.00% 13,252White Rose 1133 Topsail Road, Mount Pearl, NL A1N 5G2 40.00% 12,595Northeast Anthony Henday Project 12009 Meridian Street, Edmonton, AB T6S 1B8 33.75% 18,779Harold Struct CH057A 150 Meadowlands Parkway, Secaucus, NY 07094 100.00% 17,970
CONSTRUCTION - HOCHTIEF
Arge A7 Hamburg-Bordesholm Arge A7 Hamburg-Bordesholm, Hamburg, Deutschland 70.00% 162,257
Arge Tunnel Rastatt Arge Tunnel Rastatt, Ötigheim, Deutschland 50.00% 99,606
Schiphol Amsterdam-Almere (SAA) A1/A6 Schiphol Amsterdam-Almere (SAA) A1/A6, Diemen, Niederlande 35.00% 87,873
Stuttgart 21 PFA 1. Los 3 Bad Cannstatt Stuttgart 21 PFA 1. Los 3 Bad Cannstatt, Stuttgart, Deutschland 40.00% 65,273
ARGE Bauarge A6 West ARGE BAUARGE A6 West, Heilbronn, Deutschland 60.00% 63,389
ÚČOV Praha ÚČOV Praha, Praha, Tschechien 40.00% 54,545
ARGE SBT 1.1 Tunnel Gloggnitz ARGE SBT 1.1 Tunnel Gloggnitz, Gloggnitz, Österreich 40.00% 53,761
Maliakos Kleidi OJV (Sub-JV / Umbrella) Maliakos Kleidi OJV (Sub-JV / Umbrella), Itea-Gonnoi, Griechenland 60.64% 53,193
Cityringen: Branch-off to Nordhavnen Cityringen: Branch-off to Nordhavnen, Kopenhagen, Dänemark 40.00% 46,391
EKPPT CJV (Sub-JV / Umbrella) EKPPT CJV (Sub-JV / Umbrella), Nea Kifissia, Athen, Griechenland 32.98% 42,064
ARGE Tunnelkette Granitztal Baulos 50.4 ARGE Tunnelkette Granitztal Baulos 50.4, St. Paul in Lavanttal, Österreich 50.00% 41,961
BT-Elbphilharmonie BT-Elbphilharmonie, Hamburg, Deutschland 50.00% 41,103
Dálnice D3 Žilina - dálniĉní tunel Dálnice D3 Žilina - dálniĉní tunel, Žilina, Slowakei 40.00% 38,656
Praha - ÚČOV - Sdruž.monolit.konstrukce Praha - ÚČOV - Sdruž.monolit.konstrukce, Praha, Tschechien 40.00% 34,286
Arge Hafentunnel Cherbourger Strasse Arge Hafentunnel Cherbourger Strasse, Bremerhaven, Deutschland 33.00% 31,402
Zuidasdok Zuidasdok, Amsterdam, Niederlande 42.50% 30,692
A5 Baulos 5 A5 Baulos 5, Walterskirchen, Österreich 50.00% 30,008
IDRIS MTS-02 IDRIS MTS-02, QA - Doha / Al Rayyan Road, Katar 45.00% 26,984
D1 moder.- úsek 04, EXIT 34 - EXIT 41 D1 moder.- úsek 04, EXIT 34 - EXIT 41, Středočeský kraj, Tschechien 57.86% 21,417
BAB A 100, 16. Bauabschnitt BAB A 100, 16. Bauabschnitt, Berlin, Deutschland 50.00% 18,353
Arge Tunnel Trimberg Arge Tunnel Trimberg, Wehretal, Deutschland 50.00% 14,459
APPENDIX II
157
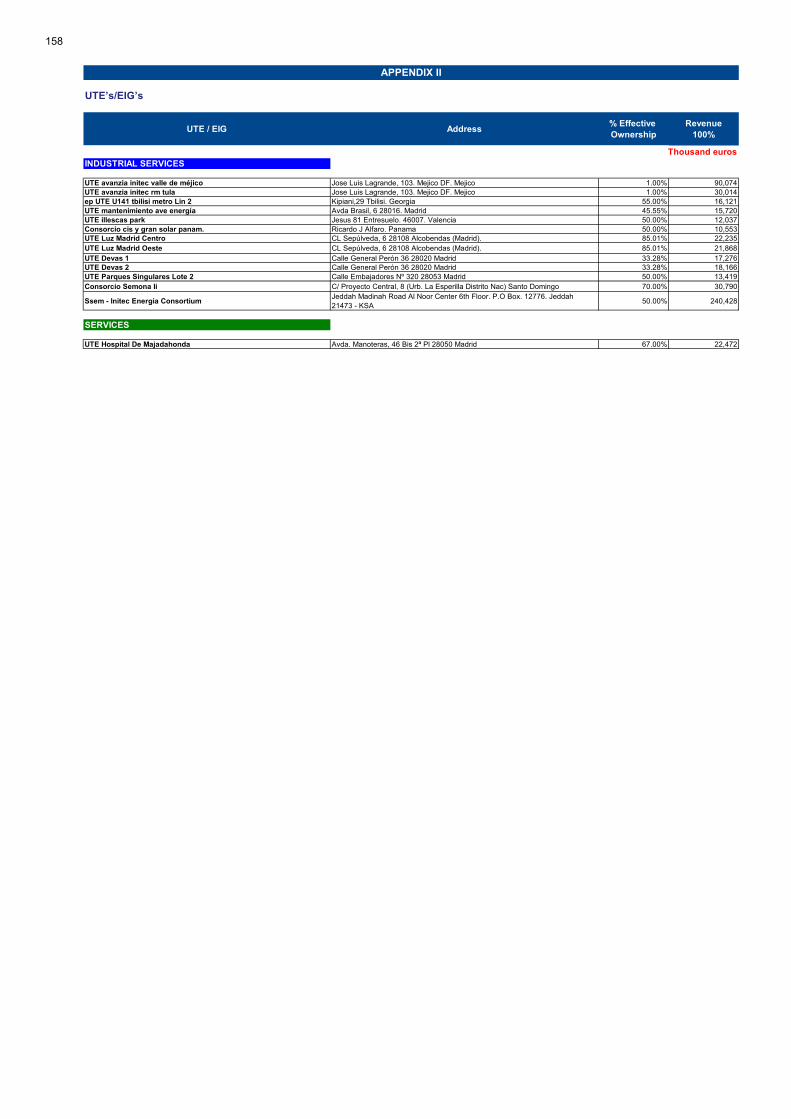
UTE’s/EIG’s
UTE / EIG Address% Effective Ownership
Revenue100%
Thousand euros
APPENDIX II
INDUSTRIAL SERVICES
UTE avanzia initec valle de méjico Jose Luis Lagrande, 103. Mejico DF. Mejico 1.00% 90,074UTE avanzia initec rm tula Jose Luis Lagrande, 103. Mejico DF. Mejico 1.00% 30,014ep UTE U141 tbilisi metro Lin 2 Kipiani,29 Tbilisi. Georgia 55.00% 16,121UTE mantenimiento ave energía Avda Brasil, 6 28016. Madrid 45.55% 15,720UTE illescas park Jesus 81 Entresuelo. 46007. Valencia 50.00% 12,037Consorcio cis y gran solar panam. Ricardo J Alfaro. Panama 50.00% 10,553UTE Luz Madrid Centro CL Sepúlveda, 6 28108 Alcobendas (Madrid). 85.01% 22,235UTE Luz Madrid Oeste CL Sepúlveda, 6 28108 Alcobendas (Madrid). 85.01% 21,868UTE Devas 1 Calle General Perón 36 28020 Madrid 33.28% 17,276UTE Devas 2 Calle General Perón 36 28020 Madrid 33.28% 18,166UTE Parques Singulares Lote 2 Calle Embajadores Nº 320 28053 Madrid 50.00% 13,419Consorcio Semona Ii C/ Proyecto Central, 8 (Urb. La Esperilla Distrito Nac) Santo Domingo 70.00% 30,790
Ssem - Initec Energia ConsortiumJeddah Madinah Road Al Noor Center 6th Floor. P.O Box. 12776. Jeddah 21473 - KSA
50.00% 240,428
SERVICES
UTE Hospital De Majadahonda Avda. Manoteras, 46 Bis 2ª Pl 28050 Madrid 67.00% 22,472
158
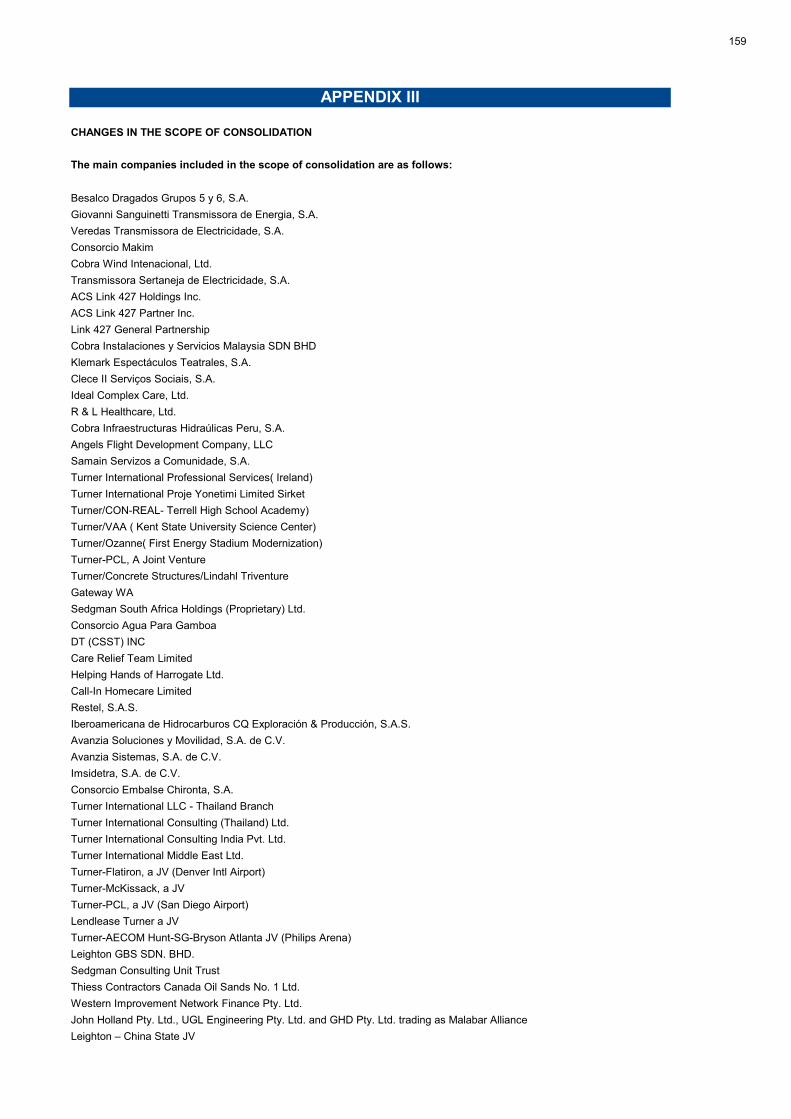
APPENDIX III
CHANGES IN THE SCOPE OF CONSOLIDATION
The main companies included in the scope of consolidation are as follows:
Besalco Dragados Grupos 5 y 6, S.A.
Giovanni Sanguinetti Transmissora de Energia, S.A.
Veredas Transmissora de Electricidade, S.A.
Consorcio Makim
Cobra Wind Intenacional, Ltd.
Transmissora Sertaneja de Electricidade, S.A.
ACS Link 427 Holdings Inc.
ACS Link 427 Partner Inc.
Link 427 General Partnership
Cobra Instalaciones y Servicios Malaysia SDN BHD
Klemark Espectáculos Teatrales, S.A.
Clece II Serviҫos Sociais, S.A.
Ideal Complex Care, Ltd.
R & L Healthcare, Ltd.
Cobra Infraestructuras Hidraúlicas Peru, S.A.
Angels Flight Development Company, LLC
Samain Servizos a Comunidade, S.A.
Turner International Professional Services( Ireland)
Turner International Proje Yonetimi Limited Sirket
Turner/CON-REAL- Terrell High School Academy)
Turner/VAA ( Kent State University Science Center)
Turner/Ozanne( First Energy Stadium Modernization)
Turner-PCL, A Joint Venture
Turner/Concrete Structures/Lindahl Triventure
Gateway WA
Sedgman South Africa Holdings (Proprietary) Ltd.
Consorcio Agua Para Gamboa
DT (CSST) INC
Care Relief Team Limited
Helping Hands of Harrogate Ltd.
Call-In Homecare Limited
Restel, S.A.S.
Iberoamericana de Hidrocarburos CQ Exploración & Producción, S.A.S.
Avanzia Soluciones y Movilidad, S.A. de C.V.
Avanzia Sistemas, S.A. de C.V.
Imsidetra, S.A. de C.V.
Consorcio Embalse Chironta, S.A.
Turner International LLC - Thailand Branch
Turner International Consulting (Thailand) Ltd.
Turner International Consulting India Pvt. Ltd.
Turner International Middle East Ltd.
Turner-Flatiron, a JV (Denver Intl Airport)
Turner-McKissack, a JV
Turner-PCL, a JV (San Diego Airport)
Lendlease Turner a JV
Turner-AECOM Hunt-SG-Bryson Atlanta JV (Philips Arena)
Leighton GBS SDN. BHD.
Sedgman Consulting Unit Trust
Thiess Contractors Canada Oil Sands No. 1 Ltd.
Western Improvement Network Finance Pty. Ltd.
John Holland Pty. Ltd., UGL Engineering Pty. Ltd. and GHD Pty. Ltd. trading as Malabar Alliance
Leighton – China State JV
159

APPENDIX III
CHANGES IN THE SCOPE OF CONSOLIDATION
Universal Care Services (UK) Limited
Humiclima St Lucia, Ltd.
Cymimasa, S.A.
Guapore Transmissora de Energia, S.A.
Promosolar Juwi 17, S.L.
Iberoamericana Hidrocarburos CQ Exploración & Produccción, S.A C.V.
Idetra S.A. de C.V.
Optima Activities Pty. Ltd.
Oil Sansd Employment Ltd.
ACS RTF Holdings Inc.
ACS RTF Partner Inc.
Rideau Transit Finance Stage 2 General Partnership
Carreteras de Cohauila y San Luis
Emoción Solar S.L.U.
Envitero Solar S.L.U.
Escarnes Solar S.L.U
Escatron Solar Dos, S.L.U.
Ignis Solar Uno, S.L.U.
Mediomonte Solar, S.L.U.
Mocatero Solar, S.L.U.
Peaker Solar, S.L.U.
Red Eléctrica del Norte, S.A.
Avanzia Energia, S.A. de C.V.
Caitan Spa
Semi El Salvador Limitada de Capital Variable
Initec Energía Maroc, SARLAU
Consorcio Ejecutor Lima
Roura Cevasa México, S.A. de C.V
Eolfi Greater China Co ,Ltd.
Turner Clayco Memorial Stadium JV (UIUC Memorial Stadium)
Turner Executive CNA Joint Venture (CNA Corp. HQ relocation)
Flatiron/Dragados/Sukut, A JV
Flatiron-Aecon JV - Peace River
Broad Construction Pty Ltd
Eic Activities Pty Limited (Nz)
Fleetco Rentals 2017 Pty Limited
CH2-UGL JV
CPB & BMD JV
CPB & Bombardier JV
CPB & JHG JV
CPB SOUTHBASE JV
JH & CPB & GHELLA JV
Leighton - Chun Wo Joint Venture (Bn 56113156-000)
Thiess Wirlu-Murra Joint Venture
WSO M7 STAGE 3 JV
GSJV SCC
GSJV Guyana Inc.
Turner International Consulting (Thailand) Ltd.
The main companies no longer included in the scope of consolidation are as follows:
Grupo Sintax
Huesca Oriental Depura, S.A.
Copernicus D3 Sp. z o.o.
160
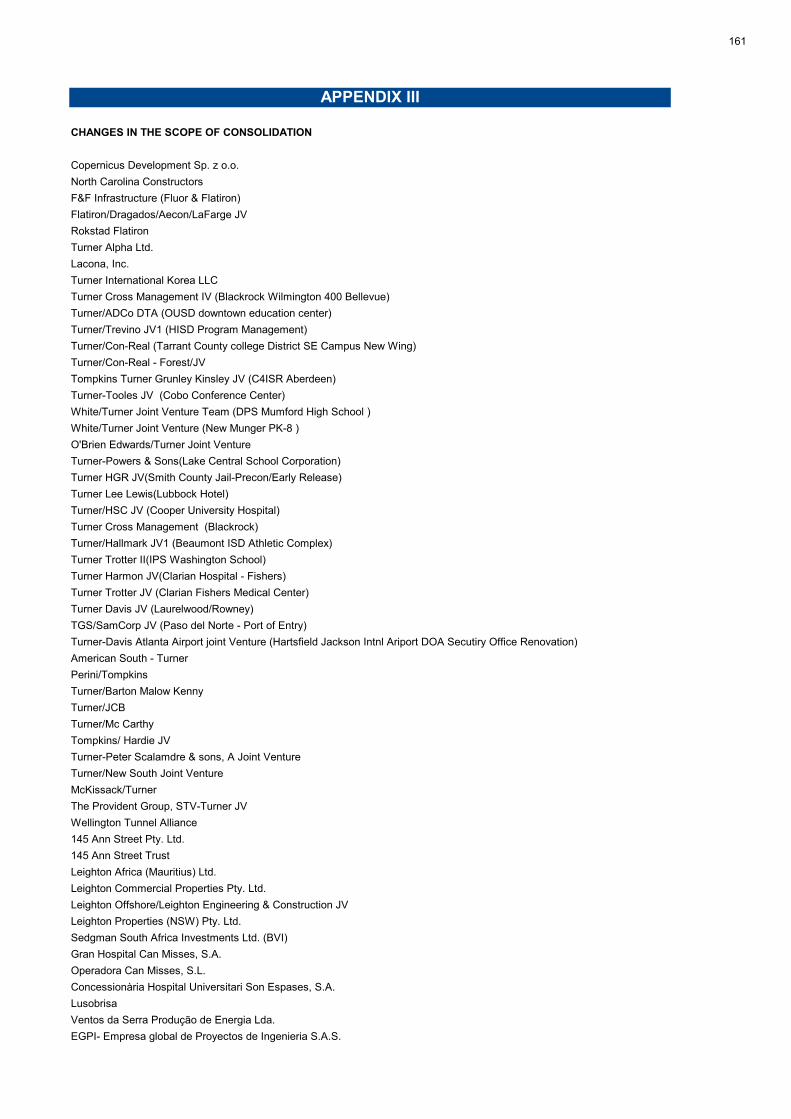
APPENDIX III
CHANGES IN THE SCOPE OF CONSOLIDATION
Copernicus Development Sp. z o.o.
North Carolina Constructors
F&F Infrastructure (Fluor & Flatiron)
Flatiron/Dragados/Aecon/LaFarge JV
Rokstad Flatiron
Turner Alpha Ltd.
Lacona, Inc.
Turner International Korea LLC
Turner Cross Management IV (Blackrock Wilmington 400 Bellevue)
Turner/ADCo DTA (OUSD downtown education center)
Turner/Trevino JV1 (HISD Program Management)
Turner/Con-Real (Tarrant County college District SE Campus New Wing)
Turner/Con-Real - Forest/JV
Tompkins Turner Grunley Kinsley JV (C4ISR Aberdeen)
Turner-Tooles JV (Cobo Conference Center)
White/Turner Joint Venture Team (DPS Mumford High School )
White/Turner Joint Venture (New Munger PK-8 )
O'Brien Edwards/Turner Joint Venture
Turner-Powers & Sons(Lake Central School Corporation)
Turner HGR JV(Smith County Jail-Precon/Early Release)
Turner Lee Lewis(Lubbock Hotel)
Turner/HSC JV (Cooper University Hospital)
Turner Cross Management (Blackrock)
Turner/Hallmark JV1 (Beaumont ISD Athletic Complex)
Turner Trotter II(IPS Washington School)
Turner Harmon JV(Clarian Hospital - Fishers)
Turner Trotter JV (Clarian Fishers Medical Center)
Turner Davis JV (Laurelwood/Rowney)
TGS/SamCorp JV (Paso del Norte - Port of Entry)
Turner-Davis Atlanta Airport joint Venture (Hartsfield Jackson Intnl Ariport DOA Secutiry Office Renovation)
American South - Turner
Perini/Tompkins
Turner/Barton Malow Kenny
Turner/JCB
Turner/Mc Carthy
Tompkins/ Hardie JV
Turner-Peter Scalamdre & sons, A Joint Venture
Turner/New South Joint Venture
McKissack/Turner
The Provident Group, STV-Turner JV
Wellington Tunnel Alliance
145 Ann Street Pty. Ltd.
145 Ann Street Trust
Leighton Africa (Mauritius) Ltd.
Leighton Commercial Properties Pty. Ltd.
Leighton Offshore/Leighton Engineering & Construction JV
Leighton Properties (NSW) Pty. Ltd.
Sedgman South Africa Investments Ltd. (BVI)
Gran Hospital Can Misses, S.A.
Operadora Can Misses, S.L.
Concessionària Hospital Universitari Son Espases, S.A.
Lusobrisa
Ventos da Serra Produção de Energia Lda.
EGPI- Empresa global de Proyectos de Ingenieria S.A.S.
161

APPENDIX III
CHANGES IN THE SCOPE OF CONSOLIDATION
Pilatequia S.L.
Innovtec S.R.L.U.
Recursos Ambientales de Guadalajara S.L.
Bau und Grund Verwaltungsgesellschaft mbH i.L.
Turner International Ltd.
Misener Servicios S.A. de D.V.
Lei Shun Employment Ltd.
Leighton Funds Management Pty. Ltd.
Leighton Property Funds Management Ltd.
Leighton Property Management Pty. Ltd.
Leighton (PNG) Ltd.
Applemead Pty. Ltd.
Barclay Mowlem Thiess JV
Leighton Construction India (Private) Ltd.
S.A.N.T. (MGT-Holding) Pty. Ltd.
S.A.N.T. (TERM-Holding) Pty. Ltd.
Wedgewood Road Hallam No. 1 Pty. Ltd.
Leighton Offshore – John Holland JV (LTA Project)
Andasol 1, S.A.
Andasol 2, S.A.
Cobra Gibraltar Limited
Sice Tecnología en Minería, S.A.
Semi Servicios de Energia Industrial y Comercio, S.L.
The Currituck Development Group Llc.
I 595 ITS Solutions Llc.
Interligaçao Elétrica Norte e Nordeste S.A.
Lestenergia
Turner Consulting and Management Services Private Limited (TCMS)
MacMahon Holdings Ltd.
Wedgewood Road Hallam Trust
Wrap Southbank Unit Trust
Doubleone 3 Unit Trust
LCS Employment Agency Ltd.
Leighton – Total JO
Bacchus Marsh JV
Thiess Sedgman JV
HWE Newman Assets Pty. Ltd
Thiess Sedgman JV
HOCHTIEF DEVELOPMENT ROMANIA S.R.L.
HOCHTIEF Construction Erste Vermögensverwaltungsgesellschaft mbH
PSW Zollernalb GmbH i.L.
Tag Red, S.A.
Semi Germany, S.A.
Sedmiruma, S.R.L.
Consorcio Sice-Comasca TLP, S.A.
Sociedad Concesionaria Ruta del Canal, S.A.
ACS Telefonía Móvil, S.L.
Concesionaria Atención Primaria, S.A.
Concesionaria Vial del Pacífico, S.A.S
Concesionaria Nueva Vía al Mar, S.A.
CME Chile, SPA.
LTE Energia Ltda.
Gestway – Gestão de infra estruturas Ltda.
Consorcio Constructor Bahía Chilota S.A.
162
APPENDIX III
CHANGES IN THE SCOPE OF CONSOLIDATION
ABC Marine (Granite / Parsons / FCI)
APM Group (AUST) Pty Ltd & Broad Construction Services (NSW/VIC) Pty Ltd
Auckland Road Maintenance Alliance (West) Management JV
Bac Devco Pty Limited
Broad Construction Services (QLD) Pty Ltd
Copernicus JV B.V.
FCI Constructors/Balfour Beatty, a Joint Venture
Flatiron/United a JV
Flatiron-Manson, a Joint Venture
Flatiron-Tidewater Skanska, a Joint Venture
Fleetco Rentals LB Pty. Limited
Hochtief Development Schweden AB
Hochtief PP Südosthessen Bewirtschaftungs GmbH
Hochtief PP Südosthessen Vermietungs GmbH
Hochtief Solutions Bahrain S.P.C
John Holland Pty. Ltd., UGL Engineering Pty. Ltd. and GHD Pty. Ltd. trading as Malabar Alliance, former CH2-UGL
Leighton / Ngarda Joint Venture (LNJV)
Leighton Contractors & Baulderstone Hornibrook Bilfinger Berger Joint Venture
Leighton Holland Browse JV
Leighton Pacific St Leonards Pty Limited
Leighton Pacific St Leonards Unit Trust
Sedgman – Cardero Resource Corp.
Sedgman – Convertible Note Exergen
Sedgman - Red Mountain Mining RMX.ASX
Sedgman – Vital Metals
HC Immobiliengesellschaft Essen 1 GmbH & Co. KG
DFH Objektgesellschaft Auge Darmstadt GmbH & Co. KG
163