Embed Size (px)
Citation preview

Deutsche Post DHLInvestor Relations
August 2014

Strong EBIT growth in Q2, despite continuing FX headwinds
INTRODUCTORY HIGHLIGHTS
Flat PeP EBIT including higher factor costs and one less working day Continued strong Express EBIT growth with margin at 10.7% for the quarter Solid cash flow generation with dividend payment in Q2 2014 Group guidance confirmed
2015 guidance modified, introduction of 2016 guidance
Ensure successful implementation of NFE Streamline Supply Chain organization and exit unattractive businesses/contracts
PAGE 2INVESTOR RELATIONS | AUGUST 2014
Further actions under evaluation to strengthen Forwarding and Supply Chain divisions

OUR NEXT HORIZON: ACCELERATING ORGANIC GROWTH
INVESTOR RELATIONS | AUGUST 2014 PAGE 3
Inorganic expansion
1998–2008
Create the base
1990–1997 2014–2020
Accelerating organic expansion
Unlocking our potential
2009–2015

Our markets are affected by four major actionable global trends
STRUCTURAL MARKET GROWTH TRENDS
Automation drives efficiencies
Importance of data leads to new ways of running businesses
Increasing importance of social and ethical behavior
Growing need for greener solutions
More “fine distribution” and direct shipping, also in B2B
Multi-channel delivery for B2C
Growth in long-haul trade and transport slowing down
Importance of emerging markets still increasing
Accelerating impact of process technology and automation
Continued global trade growth but shift in pattern
Acceleration of eCommerceand more demand for last-mile solutions
Increasing demands for responsible business
INVESTOR RELATIONS | AUGUST 2014 PAGE 4
LOGISTICS MARKETS OFFER ATTRACTIVE GROWTH
INVESTOR RELATIONS | AUGUST 2014 PAGE 5
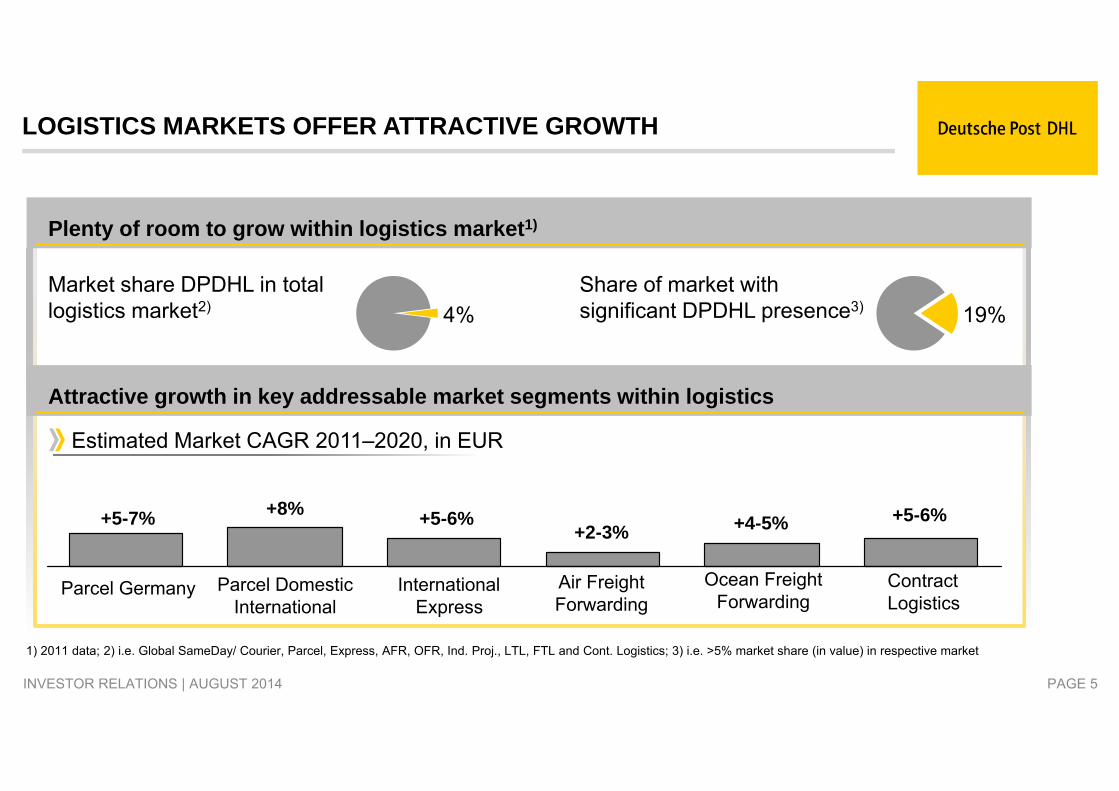
Plenty of room to grow within logistics market1)
Attractive growth in key addressable market segments within logistics
Market share DPDHL in total logistics market2)
Share of market with significant DPDHL presence3) 19%4%
Estimated Market CAGR 2011‒2020, in EUR
+5-7% +8% +5-6%+4-5%+2-3%+5-6%
Parcel Germany InternationalExpress
Air FreightForwarding
ContractLogistics
Parcel Domestic International
Ocean FreightForwarding
1) 2011 data; 2) i.e. Global SameDay/ Courier, Parcel, Express, AFR, OFR, Ind. Proj., LTL, FTL and Cont. Logistics; 3) i.e. >5% market share (in value) in respective market

We expand in new segments …
1. Leader in eCommerce related logistics
2. Accelerate footprint shift towards emerging markets
3. Tap new market opportunities for organic expansion
… to achieve sustainable above-market growth.
We connect across the organization …
1. One global team
2. Certified specialists for everything we do
3. Connected approach in operations, commercial, green solutions and shared services
… to achieve quality leader-ship and service excellence.
We focus on what has made us successful…
1. Logistics as our core
2. Committed to the needs of our stakeholders & our planet
3. A family of divisions
… to further expand margins.
INVESTOR RELATIONS | AUGUST 2014
Strategy 2020
STRATEGY 2020: FOCUS. CONNECT. GROW.
FOCUS. CONNECT. GROW.
PAGE 6

Parcel Europe Leverage & invest in
businesses transferred from DHL (BNL, PL, CZ)
Re-orient and broaden service offering towards B2C
Gradually expand European coverage
The key element of future profit growth
Parcel Germany Continue success story
Expand and innovate production capacity
Invest in new service features e.g., private parcelbox, allyouneed.com
DHL Parcel
Americas Asia Build on existing businesses
Global Mail US
Blue Dart India
Int’l B2C shipping services/Domestic and destination based eFulfillment as a start in emerging markets
Aspiration: Integrated offer of all eCommerce-related logistics and eFacilitation services
DHL eCommerce
INVESTOR RELATIONS | AUGUST 2014 PAGE 7
PeP: STRATEGY FOR SUBDIVISION “eCommerce & Parcel”

Consumer centric innovation leader on the first and last mile in Germany
DHL Paketshops
Shopping platforms
Packstation
Private parcelbox
Evening delivery/Flexible delivery
Grocery delivery
EXAMPLES
INVESTOR RELATIONS | AUGUST 2014 PAGE 8
PeP: SUCCESSFUL PARCEL MODEL IN GERMANY

MotivatedPeople Great Service Quality
QCC
LoyalCustomers
ProfitableNetwork
10% margin by 2015
CIS program is a key success factor enabling our
employees to deliver the best performance for our
customers
Focus on the best service for our TDI customers
driving industry-leading volume growth
Insanely customer centric, supported by strengthening
brand awareness
Strict discipline on pricing tools / principles
Virtual airline balances service quality, planning flexibility and operating
costs
Focus on costs and cash generation
INVESTOR RELATIONS | AUGUST 2014
EXPRESS: KEEP EXECUTING OUR SUCCESSFUL FOCUS STRATEGY
PAGE 9

EXPRESS GLOBAL TDI MARKET SHARES
Global [EUR 20.1bn]
DHL TNT UPS FedEx Others
Updated market study confirms market share gains
+x% Change vs 2012 MI study
Source: MI study 2014, annual reports ; like-for-like definition of regions vs 2012 MI dataAM: BR, CA, MX, US; EU: AT, DE, DK, ES, FR, IT, NL, RU, TR, UK MEA: AE, ZA ;SA AP: CN, HK, ID, IN, JP, KR, SG
PAGE 10
51%
5%9%
12%
23%
42%
19%
10%
4%
24%
47%
33%
16%4%
41%
25%
12%
10%
12%
Europe [EUR 6.0bn]Americas [EUR 6.8bn ] Asia Pacific [EUR 6.8bn] MEA [EUR 0.5bn]
+/-0%
+1% +1%+1%
33%
26%
22%
5%
13%
+1%
INVESTOR RELATIONS | AUGUST 2014

NFE: TRANSFORMATION PROCESS FOR GLOBAL FORWARDING
NFE is the right solution, we want to maximize the opportunity
NFE System Rollout Organisational Alignment
Key observations from first pilots Platform delivers expected
functionalities in terms of better transparency to drive Expected productivity improvements Enhanced customer service
However, data migration and depth of process changes require more time-intensive transition and training than initially expected
Integral part of NFE Current status: over 30 countries fully
aligned to new organization, 50 more just added leaving some 60 more to come
Deep change in operations and organization come with the challenge to ensure successful NFE implementation with minimum impact on daily business and performance
PAGE 11INVESTOR RELATIONS | AUGUST 2014

DHL Supply Chain established as a solid EBIT contributor to the group but performance can be further enhanced to strengthen delivery towards 2020 targets
SUPPLY CHAIN: TAKING PERFORMANCE TO THE NEXT LEVEL
Key objectives Leverage process standardization to improve efficiencies and scalability Achieve maximum leverage of overhead (through shared service centers) Address underperforming businesses Shift portfolio to higher growth segments and regions
Key Implications Non-recurring restructuring charges in 2015 – amount under
evaluation
PAGE 12INVESTOR RELATIONS | AUGUST 2014

GUIDANCE SUMMARY
EBIT FY 2014 FY 2015 FY 2016
PeP ~ EUR 1.3bn (from ~ EUR 1.2bn) Better than 2014 > EUR 1.3bn
DHL EUR 2.0–2.2bn (from EUR 2.1-2.3bn) Better than 2014 EUR 2.45-2.75bn
CC/Other Better thanEUR -400m ~ EUR -350m ~ EUR -350m
Group EUR 2.9-3.1bn Significantlybetter than 2014 EUR 3.4-3.7bn
Shift in composition of 2014 guidance - 2015 guidance modified - new 2016 targets introduced
2014 Free Cash Flow to at least cover 2013 dividend Tax rate around 16% (from ~19%) Gross Capex of around EUR 1.9bn
PAGE 13INVESTOR RELATIONS | AUGUST 2014

GUIDANCE SUMMARY
EBIT
PeP
DHL
CC/Other
Group
2020 guidance and assumptions remain unchanged
Free cash flow generation to remain priority No ambition for major M&A Finance policy including payout ratio range to remain unchanged
FY 2020
~3% CAGR 2013-20
~10% CAGR 2013-20
< 0.5% of Group revenue
>8% CAGR 2013-20
2013 base
EUR 1.286bn
EUR 1.997bn
EUR -422m
EUR 2.861bn
PAGE 14INVESTOR RELATIONS | AUGUST 2014

Target / maintain rating BBB+
Dividend payout ratio to remain between 40–60% of net profit (continuity and Cash Flow performance considered)
Excess liquidity will be used for Stepwise pension funding
and / or
Share buybacks and/or extraordinary dividends
Deployment of Free Cash Flow
CONFIRMATION OF FINANCE POLICY
INVESTOR RELATIONS | AUGUST 2014 PAGE 15

Leverage e-Commerce & EM growth Promote sustainable, organic growth
Continue EBIT margin expansion Increase free cash flow
PAGE 16
STRATEGY 2020: ENTERING THE EXECUTION PHASE
INVESTOR RELATIONS | AUGUST 2014
DEFINING THE LOGISTICS INDUSTRY
Delivering good EBIT growth in H1 2014 despite FX and weak macro enviroment
Near term targets adjusted as our focus shifts towards Strategy 2020
Additional measures currently under evaluation to strengthen our footing

Appendix
INVESTOR RELATIONS | AUGUST 2014 PAGE 17

DEUTSCHE POST DHL AT A GLANCE
1) Average FTEs FY 2013
The postal service for Germany
Post - eCommerce - Parcel
Sales: EUR 14,452m EBIT: EUR 1,226mEmpl.1): 149,692
The logistics company for the world
International and Domestic Express
Sales: EUR 12,712m EBIT: EUR 1,133mEmpl.1): 84,986
Global Air, Ocean and Road Freight
Sales: EUR 14,838m EBIT: EUR 483mEmpl.1): 44,174
Global Supply Chain Solutions
Sales: EUR 14,277mEBIT: EUR 441mEmpl.1): 143,761
Corporate Center / Other: Sales: EUR 1,251m; EBIT: EUR -422m
2013 key figures Group: Sales: EUR 55,085m; EBIT: EUR 2,861m; Employees1): 435,520
INVESTOR RELATIONS | AUGUST 2014 PAGE 18

Small reported revenue increase as adverse currency effects (-2.7%) continue. Organic increase of +4.2% supported by growth in all divisions
Strong growth in Group EBIT: excluding Q2 2013 one-offs, EBIT growth of +11% despite significant FX headwinds
PeP EBIT flat excl. EUR 50m one-off in Q2 2013 as good volumes as well as price increases offset factor cost increases and one less working day
DHL EBIT well up despite significant FX effects and weakness in Forwarding. Strong EBIT growth and margin increase in Express
Financial result comparison primarily affected by positive one-time effect in Q2 2013
Lower taxes reflect updated estimated full year tax rate of 16% - related to recognition of additional deferred tax assets
Net profit up +9% yoy as better EBIT and tax rate offset lower financial result
GROUP P&L Q2 2014
1) 2013 One-offs: EUR 50m postage stamp provision utilization2) 2013 One-offs: EUR -21m SC disposal losses & restructuring3) Positive one-time effect of EUR 42m in Q2 20134) Attributable to Deutsche Post AG shareholders
EUR m Q2 2013 Q2 2014 Chg.
Revenue 13,605 13,695 +0.7%
EBIT 619 654 +5.7%
t/o PeP1) 238 188 -21.0%
t/o DHL2) 488 540 +10.7%
Financial result3) -40 -95 >-100%
Taxes -127 -70 +44.9%
Consolidated net profit4) 422 461 +9.2%
EPS (in EUR) 0.35 0.38 +8.6%
PAGE 19INVESTOR RELATIONS | AUGUST 2014

Major Free Cash Flow components close to previous year levels
Cash-out for capex only slightly up yoy due to phasing of investments (end of 2013 phasing effects having been absorbed in Q1)
FFO/Debt at 30.8%(year-end 2013: 34.4%)
FREE CASH FLOW Q2 2014
EUR m Q2 2013 Q2 2014
Cash from operating activities beforechanges in Working Capital 732 729
Changes in Working Capital -236 -246
Net cash from operating activities after changes in Working Capital 496 483
Net Capex -216 -235
Net M&A -11 3
Net Interest -34 -43
Free Cash Flow 235 208
FCF generation in line with good previous year performance
PAGE 20INVESTOR RELATIONS | AUGUST 2014
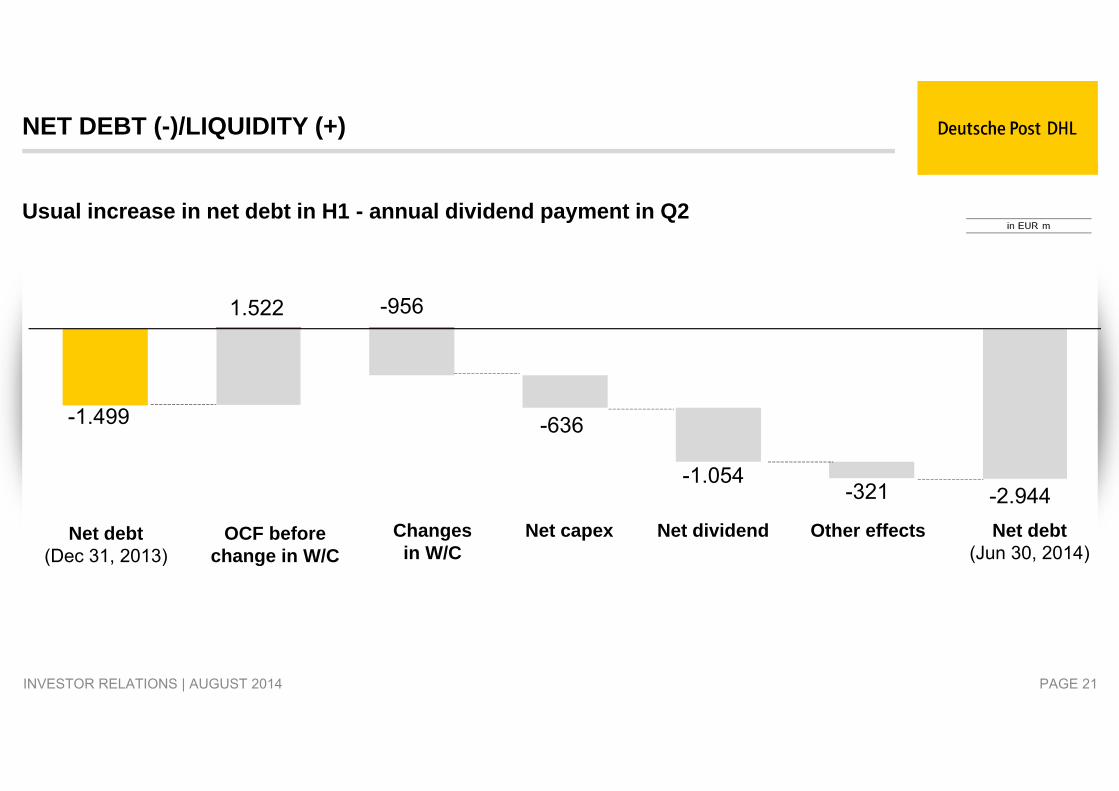
NET DEBT (-)/LIQUIDITY (+)
-2.944-321
-636
-9561.522
-1.499
-1.054
Usual increase in net debt in H1 - annual dividend payment in Q2
Net debt(Jun 30, 2014)
Other effectsNet capexChangesin W/C
Net debt(Dec 31, 2013)
OCF before change in W/C
Net dividend
PAGE 21INVESTOR RELATIONS | AUGUST 2014

5.381 6.016
10.02310.310
MOVEMENTS IN NET PENSION PROVISION
Net Pension Provision
Plan assets
Mar 31, 2014
in EURbn
Total Defined Benefit Obligation
EUR 15.4bn • Net pension provision roseprimarily as a result of decliningdiscount rates.
• Plan assets rose as returns wereabove calculated interest income
Highlights
June 30, 2014
Total Defined Benefit Obligation
EUR 16.3bn
INVESTOR RELATIONS | AUGUST 2014 PAGE 22
Mar. 31, 2013 Jun. 30, 2014
Germany 3.50% 3.00%
UK 4.25% 4.25%
Other 3.27% 2.00%
Total 3.70% 3.37%

GROUP
PeP
SUPPLY CHAIN
FORW. FREIGHT
EXPRESS
Gross Capex / Sales ratio -Group & by division
0,0%
1,0%
2,0%
3,0%
4,0%
5,0%
6,0%
2007 2008 2009 2010 2011 2012 2013
EXPRESS GROUP PeP SUPPLY CHAIN DGF
STABLE CAPITAL INTENSITY EXPECTED
Gross Capex intensity2007-13 average
~3%
~3%
~2%
~1%
~4%
INVESTOR RELATIONS | AUGUST 2014 PAGE 23

2013 DIVIDEND: INCREASE OF 14%
• Net profit growth driven by operating performance, better financial result and lower tax rate
• Dividend of EUR 0.80 per share of EUR 967m total was paid on May 28, 2014 to shareholders
• Adjusted for major non-recurring items this reflects a payout ratio of 49%: in line with our dividend policy target payout ratio of 40–60%
1) Adjusted for Postbank effects as well as non-recurring items
2013
EUR 0.65
53%
40%
59%49%
2010
58%
2012
60%
2011
EUR 0.70EUR 0.70EUR 0.80
Underlying Payout Ratio1)
Dividend of EUR 0.80 per share
INVESTOR RELATIONS | AUGUST 2014 PAGE 24

Strong EBIT growth converted into even stronger OCF increase Major drivers:
-2.000
-1.000
0
1.000
2.000
3.000
2009 2010 2011 2012 2013 2009 2010 2011 2012 2013 2009 2010 2011 2012 20132009 2010 2011 2012 2013
EBIT Change in Provisions Change in WC OCFSome volatility from timing effects and economic cycle, but overall low WC intensity
Declining cash-outs (utilization), mainly due to restructuring provisions tailing off
1) Adjusted for non-recurring items
1)1)
OPERATING CASH FLOW DEVELOPMENT 2009-2013
INVESTOR RELATIONS | AUGUST 2014
3,000
2,000
1,000
-1,000
-2,000
EUR m
PAGE 25

Turnaround in FCF generation lays base for further improvementMajor drivers:
-1.500
-500
500
1.500
2.500
2009 2010 2011 2012 2013 2009 2010 2011 2012 2013
1) Adjusted for non-recurring items
1)
FREE CASH FLOW DEVELOPMENT 2009-2013
2009 2010 2011 2012 2013 2009 2010 2011 2012 20131)
INVESTOR RELATIONS | AUGUST 2014
OCF Net Capex Net Cash from M&A FCF
2,500
1,500
-1,500
EUR m
PAGE 26

PROFITABILITY IMPROVEMENT SEES FURTHER PROGRESS BUT STILL MORE WORK TO BE DONE
Margin improvement >100bps in 2013 driven by:• Increasing core TDI share in product mix• Efficiency gains and scale effects in ground and air
Margin slightly up, reflecting:• Benefits from internal optimization programs and new
contracts • Weak economic environment, esp. in Europe• One-off effects net out over the full year
Margin stable as cost containment made up for:• Weak volume environment• Increase in NFE costs
1) EXPRESS FY2012 margin excl. EUR 113m one-off items from VAT, restructuring provision release and disposal gain in Q2 2012 2) FY2010 margins excl. non-recurring items (restructuring)
8.9%8.7%7.8%7.1%7.8%1)
2013 shows expected margin acceleration in Express
3.3%3.3%2.9%2.8%
FY 2013
3.1%
FY 2012
2.9%
FY 2011
2.7%
FY 2010
2.1%2)
INVESTOR RELATIONS | AUGUST 2014 PAGE 27
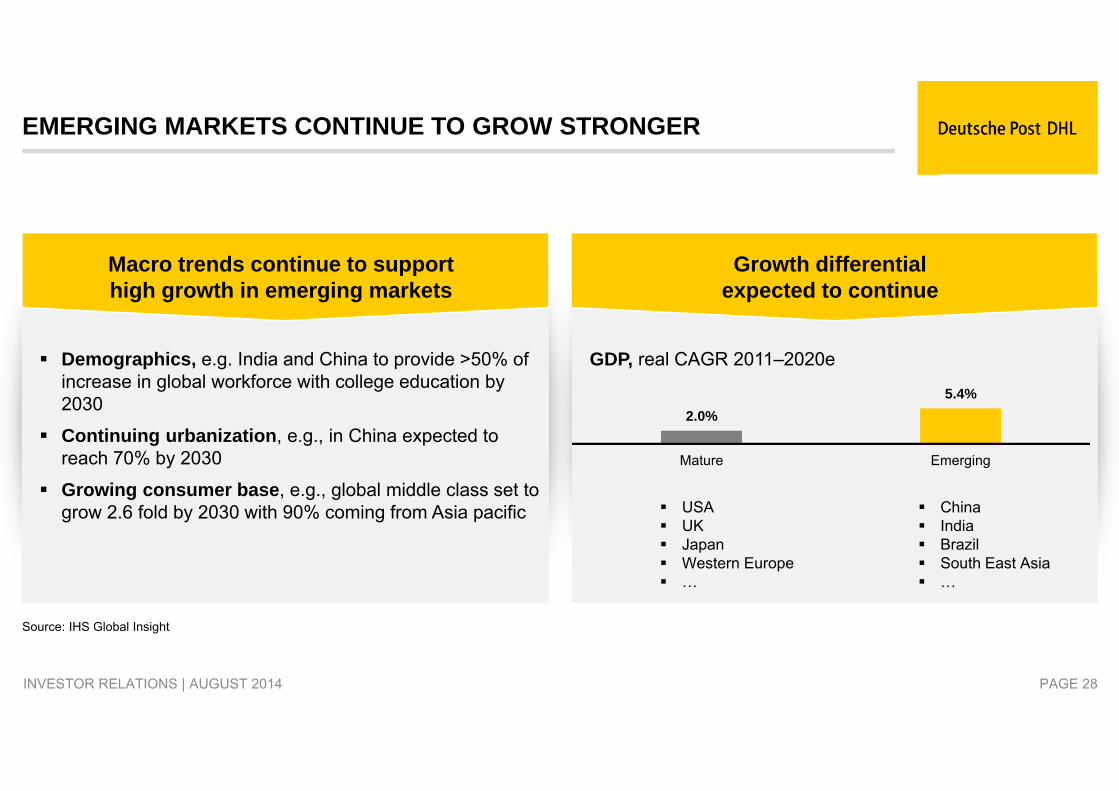
GDP, real CAGR 2011‒2020e Demographics, e.g. India and China to provide >50% of increase in global workforce with college education by 2030
Continuing urbanization, e.g., in China expected to reach 70% by 2030
Growing consumer base, e.g., global middle class set to grow 2.6 fold by 2030 with 90% coming from Asia pacific
Macro trends continue to support high growth in emerging markets
Growth differential expected to continue
2.0%5.4%
Mature Emerging
USA UK Japan Western Europe …
China India Brazil South East Asia …
EMERGING MARKETS CONTINUE TO GROW STRONGER
Source: IHS Global Insight
INVESTOR RELATIONS | AUGUST 2014 PAGE 28

STRUCTURAL TREND “EMERGING MARKETS” INTACT AS DEVELOPING MARKETS POSTING ABOVE-AVERAGE GROWTH
24%
9.6
2009
15%16%
2013
32%
12.3
2009 2013
12%
12.014.2
9%7% 7%
2009
7.8
26%14%
2013
10.6
28%17%
Revenue1): EUR bn
+9%+14%
+7%CAGR
1) Based on external 3rd party revenue, region according to customer invoice
Emerging Markets drive growth across DHL Divisions
Express
Global TDI leadership with key strengths in growth markets
+14%+9%
+8%
Forwarding
Global No. 1 in Air freight, No. 2 in Ocean freight
+12%+17%
+4%
Supply Chain
Market leader in contract logistics in Asia and Latin America
Revenue1): EUR bn Revenue1): EUR bnCAGR CAGR
Asia PacificLatin America, Middle East, Africa
INVESTOR RELATIONS | AUGUST 2014 PAGE 29

Group revenue footprint
22% 30%
78% 70%
Today Target
Mature Markets Emerging Markets
Building on our leading market positions in growth regions, 30% emerging market targets is AMBITIOUS BUT ACHIEVABLE
2020 target2013
OUR AMBITION FOR THE EMERGING MARKETS
INVESTOR RELATIONS | AUGUST 2014 PAGE 30

INVESTOR RELATIONS | AUGUST 2014
POST, E-COMMERCE & PARCEL
Focus. Connect. Grow.
PAGE 31

PEP – SOLID VOLUME DEVELOPMENT
Mail Communication volumes (in m pieces)
2.091 2.093
Q2 13 Q2 14
PeP – SOLID VOLUME DEVELOPMENT
Volume increase in Post products reflects Flat Mail Communication volumes,
supported by EU and regional elections Increase in Dialogue Marketing volumes
due to elections
Continued growth in German Parcel business driven by B2C trend towards e-commerce
Dialogue Marketing volumes (in m pieces)
2.206 2.305
Q2 13 Q2 14
Parcel Germany volumes (in m pieces)
PAGE 32
Business Highlights
223 236
Q2 13 Q2 14
INVESTOR RELATIONS | AUGUST 2014

Revenue flat despite one less working day - driven by stamp price increase and positive volume development
EBIT flat yoy excluding last year’s postage stamp provision utilization (EUR 50m) despite rising factor costs – i.e. 3.1% yoy wage increase and higher costs related to Parcel infrastructure investments
Cash flow down yoy due to financing of parcel infrastructure and very positive working capital development in Q2 last year
Capex below previous years’ level due to timing differences. Main investments going towards Parcel infrastructure upgrade and expansion
PeP – DIVISIONAL RESULTS Q2 2014
PAGE 33
1) 2013 One-offs: EUR 50m postage stamp provision utilization
EUR m Q2 2013 Q2 2014 Chg.
Revenue 3,642 3,642 +/-0.0%
EBIT1) 238 188 -21.0%
Operating Cash Flow 308 188 -39.0%
Capex 71 62 -12.7%
INVESTOR RELATIONS | AUGUST 2014

4 years after launch E-POST is firmly established in the secure communications market
Partnerships with major business customers in key sectors e.g. insurance, banking, technology and energy
More than EUR200m revenue planned for 2014
Break even planned for 2015
34
New digital services E-POST is a success
New customers
PVS: Payment clearing system for doctors and hospitals
End-to-End encryption provides a legally compliant basis for doctors, lawyers and public officials for electronic communication1)
E-POSTBRIEF successfully tested with various insurance companies
E-POST allows business customers to transform their information management systems through digitalization and processing of incoming and outgoing mail
New customers
Regular additions to the E-POSTportfolio for private and for business customers e.g.
E-POST KontoPilotAll payment solutions in one place
E-POSTSCANReceive letter mail digitally via smartphone, tablet, PC
E-POSTBUSINESS BOX Plug-and-play device for E-Postbrief business customers
1) §203 StgB (German Criminal Code): Personal data privacy protected by law
E-POST – ON TRACK TO BREAK EVEN IN 2015
INVESTOR RELATIONS | AUGUST 2014

MAIL Division
Mail Communication
Dialogue Marketing
Press Services
Retail Outlets
Pension Services
Global Mail
Parcel Germany
Post
All letters including import /export fromand to Germany. Also includes newservices like E-Post and ADAC Postbus
2013 Revenue, restated: EUR 9,984m
eCommerce - Parcel
Domestic and cross-border parcels and parcel operations in selective markets
2013 Revenue, restated: EUR 5,307m
Asset shifts
Domestic Parcel in Czech Republic, Netherlands, Belgium,Poland and India
Post - eCommerce – Parcel: NEW REVENUE REPORTING STRUCTURE
Letters → Post
Parcels → eCommerce - Parcel
PAGE 35
Old Structure New Structure
INVESTOR RELATIONS | AUGUST 2014

MAIL: PROPOSED LETTER PRICING REGULATIONNEW PRICE CAP FORMULA REVISED TO CPI-0.2%
Revised price cap regime offering more potential to partially offset factor cost inflation
• Proposed price cap of Federal Network Agency1)
– Formula: x-factor reduced from 0.6 to 0.2%– Regulation valid until Dec 31, 2018– Allowing potential average price increase of 1.6%
on Jan 1, 20142)
Directly impacted Mail revenues of EUR 3.3bn3)
1) Federal Network Agency = Bundesnetzagentur; CPI = German Consumer Price Index 2) 1.6% = 1.8% inflation rate minus 0.2% x-factor; based on arithmetic average of the monthly CPI values for reference period from July 2012 - June 2013: 1.6% price increase applicable based on weighted average across the relevant Mail product portfolio as per price-cap regulation; 3) 2012 revenues affected subject to price-cap regime
PAGE 36INVESTOR RELATIONS | AUGUST 2014

OVERALL UNCHANGED VOLUME TRENDS IN GERMANY
Overall volumes in Mail Germany declined at an average rate of only 1.8% through Strategy 2015
Mail Communication benefitted from discontinuation of product “Infobrief” in 2013
Dialogue Marketing volumes continue to be under pressure
Parcel Germany continues to show strong development. Market growth rates should come down slightly (expected CAGR ~6%)
Volume development
7.96
MailCommunication
2013
7.82
2009
10.90
DialogueMarketing
9.75
in bn items
0.761ParcelGermany
1.026in bn items
20132009
20132009
19.65
21.16Mail Germany
20132009
INVESTOR RELATIONS | AUGUST 2014 PAGE 37

WORKING DAYS GERMANY
2012 2013 2014 2015
Q1 64.2 61.6 62.2 62.2
Q2 59.3 60.3 59.3 59.3
H1 123.5 121.9 121.5 121.5
Q3 64.8 65.8 65.8 66
9M 188.3 187.7 187.3 187.5
Q4 60.2 60.2 60.9 63
H2 125 126 126.7 129
FY 248.5 247.9 248.2 250.5
INVESTOR RELATIONS | AUGUST 2014 PAGE 38

EXPRESS
Focus. Connect. Grow.
INVESTOR RELATIONS | AUGUST 2014 PAGE 39

EXPRESS – STRONG TDI GROWTH CONTINUED
Time Definite International (TDI)Revenues per day in EUR m
Time Definite International (TDI)Shipments per day ‘000s
647700
Q2 13 Q2 14
35,438,5
Q2 13 Q2 14
Continued strong TDI shipment growth – with all regions contributing
Highest TDI shipment per day growth rates in Asia Pacific (+11.9%), followed by the Americas (+11.7%) and MEA (+10.3%) while Europe (+3.9%) again posted slower growth reflecting active yield management
TDI revenue per day growth staying ahead of volume growth driven by increase in average weight
Strong margin increase driven by better product mix, higher network utilization and ongoing process improvement initiatives
Business Highlights
PAGE 40INVESTOR RELATIONS | AUGUST 2014

Revenues increase by +2.5% as strong TDI volume growth is substantially offset by negative currency effects. Organic revenue growth +7.2%
EBIT up 17.7% yoy as result of increased TDI volume, higher efficiency in aviation as well as indirect costs management. EBIT margin at a record of 10.7%
Major one-offs mutually off-set in the quarter withEUR 104m release of restructuring provision and EUR -104m aviation fleet impairment
Strong operating cash flow increase in line with trend in operating performance
EXPRESS – DIVISIONAL RESULTS Q2 2014
EUR m Q2 2013 Q2 2014 Chg.
Revenue 3,015 3,089 +2.5%
EBIT 282 332 +17.7%
Operating Cash Flow 276 345 +25.0%
Capex 81 85 +4.9%
PAGE 41INVESTOR RELATIONS | AUGUST 2014

EXPRESS: NETWORK EXPANSION ENABLING GROWTH
East Midlands hub (£90 million) Southern hub, near LHR (£32 million) New facilities in Manchester, Croydon and Sheffield (£34 million)
UK – GBP 156m
Largest global gateway opening 2016
Tokyo – EUR 67m
Leipzig European hub(€150 million) Stuttgart air-road depot(€28 million)
Germany – EUR 178m
QueretaroConversion of domestic hub to air hubMexico Total investments of USD 160m expected in 2012-17
Mexico – USD 14m
Three new gateways in Saudi Arabia ($95 million)New country Office in Cairo ($55 million)Largest MEA ground facility in UAE ($27 million)
MEA – USD 177m
PAGE 42INVESTOR RELATIONS | AUGUST 2014

Continue successful FOCUS strategy
58%
12%
5%
14%
11%
2009 Revenue distribution
TDI TDD DDI DDD ACS / Other
70%
9%
4%5%
12%
2013 Revenue distribution
FOCUS. DHL EXPRESS
INVESTOR RELATIONS | AUGUST 2014 PAGE 43
75%
7%
3%
2% 13%
Q2 2014 Revenue distribution

BALANCED, “VIRTUAL AIRLINE” BUSINESS MODEL INCREASES FLEXIBILITY
Cost Position
Asset Intensity
Flexibility
Capacity Commitment
1) Commercial Air Linehaul
1)
22%
26%
52%
0 - 90 Days (incl. CAL) 91 - 360 Days Fixed
INVESTOR RELATIONS | AUGUST 2014 PAGE 44

Selling air cargo space purely helps to offset aviation costs and is not a TDI product sold by the core sales team; DHL Global Forwarding (DGF) is the main customer
AIR CAPACITY SALES (ACS) – 4 DIFFERENT PRODUCT OFFERINGS
1 Block Space Agreement, guaranteed air cargo product.
2 Express TDI core product, capacity based on average utilization, adjusted on a daily basis
Total Spare Capacity (TSC), average capacity not utilised by Block Space or TDI Core on a planned basis. To be sold by air cargo product
3+4
CORE Flex & Air Capacity Sales Flex, a set amount of the Total Spare Capacity to be utilised for TDI core volume surge and/or air cargo filler traffic
4
Air cargo guaranteed, a set amount of the Total Spare Capacity guaranteed for priority traffic & key customers3
• More than ACS 500,000 bookings per year
• For DGF we improved from no. 8 in 2010 to the no. 3 supplier in 2012
• DGF is the biggest customer from DHL Aviation
• More than ACS 500,000 bookings per year
• For DGF we improved from no. 8 in 2010 to the no. 3 supplier in 2012
• DGF is the biggest customer from DHL Aviation
INVESTOR RELATIONS | AUGUST 2014 PAGE 45

FORWARDING, FREIGHT
Focus. Connect. Grow.
INVESTOR RELATIONS | AUGUST 2014 PAGE 46

GLOBAL FORWARDING, FREIGHT: VOLUMES IMPROVING, YIELDS STILL WEAK
1)Twenty Foot Equivalent Unit
Air Freight ´000s Tons
Ocean Freight ‘000s TEU1)
709749
Q2 13 Q2 14
987 1.008
Q2 13 Q2 14
Air Freight and Ocean Freight volume growth improving, reflecting stronger demand in Asia and new customer wins
GP/unit decline yoy in Air Freight and Ocean Freight
NFE expenditure in line with project plan in Q2
Business Highlights
PAGE 47INVESTOR RELATIONS | AUGUST 2014

Revenue down yoy due to FX effects. Organic revenue growth of +2.2% reflecting volume growth in Air Freight and Ocean Freight
Gross profit decline reflecting FX effects and competitive markets
EBIT improved sequentially but still down yoy due to weaker GP margin
Operating cash flow down in line with lower EBIT, also reflecting some increase in working capital
Capex significantly up yoy mainly related to NFE implementation
GLOBAL FORWARDING, FREIGHT – DIVISIONAL RESULTS Q2 2014
EUR m Q2 2013 Q2 2014 Chg.
Revenue 3,709 3,638 -1.9%
Gross Profit 939 885 -5.8%
EBIT 127 100 -21.3%
Operating Cash Flow 94 45 -52.1%
Capex 23 60 >100%
PAGE 48INVESTOR RELATIONS | AUGUST 2014

MAXIMIZED PROFITABILITY: GP ON PRODUCT LEVEL REFLECTS OUR SIZE ADVANTAGE AND PRODUCT PORTFOLIO
• Performance benchmarking on product level is impacted by differences in accounting – key DGF competitors allocate value added services to AFR or OFR
• DGF has chosen to account for VAS separately under category called ‘Others’. This allows to measure true performance on product level
• When relevant VAS (customs, handling, cartage) are allocated to AFR & OFR to improve comparability, DGF’s GP margin is in line with peers
• GP margin in AFR benefits from DGF’s large scale, while OFR reflects its share of uncontrolled volumes
Gross Profit margin 2013(in %, Air Freight)
Gross Profit margin 2013(in %, Ocean Freight)
1) Including value-added services; Note: GP margin absolute level not fully comparable due to different revenue recognition principles across competitorsSource: Official company publications
20.7%21.9%25.2%20.1%
25.4%
DG
F
DG
Fco
mpa
rabl
e1)
17.7%20.8%19.6%19.3%
21.7%
DG
F
DG
Fco
mpa
rabl
e1)
INVESTOR RELATIONS | AUGUST 2014 PAGE 49

SUPPLY CHAIN
Focus. Connect. Grow.
INVESTOR RELATIONS | AUGUST 2014 PAGE 50

SUPPLY CHAIN – HEALTHY BUSINESS WINS
1) Annualized revenue gains
Normalization of new signings after lower Q1
Continued selective approach to new business signings
Automotive and Life Sciences & Healthcare showing strongest revenue growth yoy
Revenue growth excluding FX effects strongest in emerging markets at 8.2%
Business HighlightsNew signings, EUR m1)
Revenue by Sector Q2 2014
330350 335
Q2 2012 Q2 2013 Q2 2014
PAGE 51
10%
Technology10%
Life Sciences &Healthcare
20%Consumer
19%
Retail25%
Others
5%Williams Lea9%Energy
2%
Automotive
INVESTOR RELATIONS | AUGUST 2014
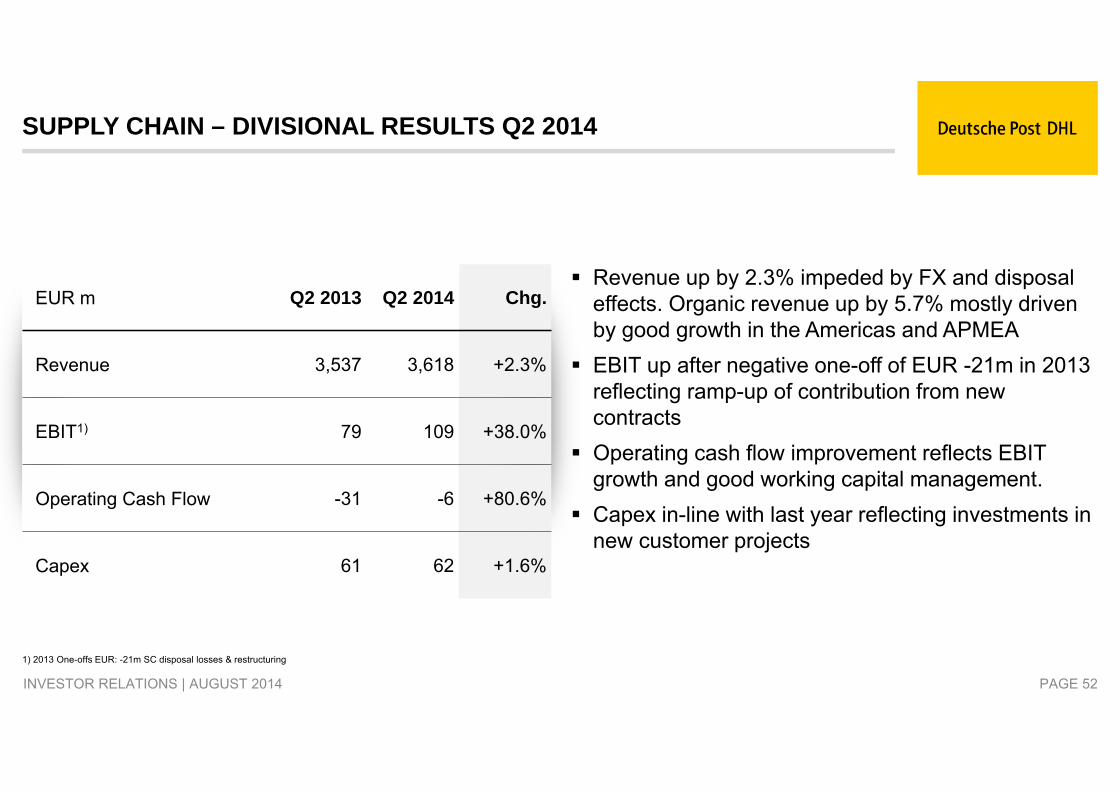
Revenue up by 2.3% impeded by FX and disposal effects. Organic revenue up by 5.7% mostly driven by good growth in the Americas and APMEA
EBIT up after negative one-off of EUR -21m in 2013 reflecting ramp-up of contribution from new contracts
Operating cash flow improvement reflects EBIT growth and good working capital management.
Capex in-line with last year reflecting investments in new customer projects
SUPPLY CHAIN – DIVISIONAL RESULTS Q2 2014
EUR m Q2 2013 Q2 2014 Chg.
Revenue 3,537 3,618 +2.3%
EBIT1) 79 109 +38.0%
Operating Cash Flow -31 -6 +80.6%
Capex 61 62 +1.6%
1) 2013 One-offs EUR: -21m SC disposal losses & restructuring
PAGE 52INVESTOR RELATIONS | AUGUST 2014

INVESTOR RELATIONS | AUGUST 2014
DHL SUPPLY CHAIN: STRONG STRATEGIC POSITIONING
PAGE 53
2009 2013
12%
12.014.2
9%7% 7%
CAGR
+12%
+17%
+4%
Market leader in contract logistics in Asia and Latin America
Revenue: EUR bn
Asia Pacific
Latin America, Middle East, Africa
1) DHL projection based on forecasts from IHS Global Insight and Transport Intelligence; suppliers with global footprint
Outsourced contract logistics: market shares
~13%87%
3 largest providers
~13%
2,2%2,4%
8,2%
OtherLargest Providers1)
K+NCEVADHL
DHL is by far market leader in a stronglyfragmented market
DHL Supply Chain profiting from strong EM footprint

FOCUS. CC/OTHER COSTS
0,1%
0,2%
0,3%
0,4%
0,5%
0,6%
0,7%
0,8%
2009 2010 2011 2012 2013 2020
TAR
GE
T
0.5%
Corporate bodies (e.g. CB, SVB)and legal obligations/ foundations
Investments into growth & cross-divisional initiatives
Core Corporate Center costs
CC / Other cost, as % of revenue CC / Other cost structure, 2014
20%
60%
20%
INVESTOR RELATIONS | AUGUST 2014 PAGE 54

THIS PRESENTATION CONTAINS CERTAIN STATEMENTS THAT ARE NEITHER REPORTED RESULTS NOR OTHERHISTORICAL INFORMATION. THESE FORWARD-LOOKING STATEMENTS ARE SUBJECT TO RISKS ANDUNCERTAINTIES THAT COULD CAUSE ACTUAL RESULTS TO DIFFER MATERIALLY FROM THOSE EXPRESSED INTHE FORWARD-LOOKING STATEMENTS. MANY OF THESE RISKS AND UNCERTAINTIES RELATE TO FACTORS THATARE BEYOND DEUTSCHE POST AG’S ABILITY TO CONTROL OR ESTIMATE PRECISELY, SUCH AS FUTURE MARKETAND ECONOMIC CONDITIONS, THE BEHAVIOR OF OTHER MARKET PARTICIPANTS, THE ABILITY TOSUCCESSFULLY INTEGRATE ACQUIRED BUSINESSES AND ACHIEVE ANTICIPATED SYNERGIES AND THE ACTIONSOF GOVERNMENT REGULATORS. READERS ARE CAUTIONED NOT TO PLACE UNDUE RELIANCE ON THESEFORWARD-LOOKING STATEMENTS, WHICH APPLY ONLY AS OF THE DATE OF THIS PRESENTATION. DEUTSCHEPOST AG DOES NOT UNDERTAKE ANY OBLIGATION TO PUBLICLY RELEASE ANY REVISIONS TO THESE FORWARD-LOOKING STATEMENTS TO REFLECT EVENTS OR CIRCUMSTANCES AFTER THE DATE OF THIS PRESENTATION.
THIS PRESENTATION DOES NOT CONSTITUTE AN OFFER TO SELL OR THE SOLICITATION OF AN OFFER TOSUBSCRIBE FOR OR BUY ANY SECURITY, NOR SHALL THERE BE ANY SALE, ISSUANCE OR TRANSFER OF THESECURITIES REFERRED TO IN THIS PRESENTATION IN ANY JURISDICTION IN CONTRAVENTION OF APPLICABLELAW.
COPIES OF THIS PRESENTATION AND ANY DOCUMENTATION RELATING TO THE OFFER ARE NOT BEING, ANDMUST NOT BE, DIRECTLY OR INDIRECTLY, MAILED OR OTHERWISE FORWARDED, DISTRIBUTED OR SENT IN ORINTO OR FROM AUSTRALIA, CANADA OR JAPAN OR ANY OTHER JURISDICTION WHERE TO DO SO WOULD BEUNLAWFUL.
THIS DOCUMENT REPRESENTS THE COMPANY‘S JUDGMENT AS OF DATE OF THIS PRESENTATION.
DISCLAIMER
INVESTOR RELATIONS | AUGUST 2014 PAGE 55

INVESTOR RELATIONS CONTACTS
Sarah Bowman• +1 212 381 3463 • E-mail: [email protected]
Sebastian Slania• +49 228 182 63203• E-mail: [email protected]
Daniel Stengel• +49 228 182 63202• E-mail: [email protected]
Martin Ziegenbalg, Head of Investor Relations• +49 228 182 63000• E-mail: [email protected]
Robert Schneider• +49 228 182 63201• E-mail: [email protected]
Christian Rottler• +49 228 182 63206• E-mail: [email protected]
INVESTOR RELATIONS | AUGUST 2014 PAGE 56