Embed Size (px)
Citation preview
2014 annual report
2014 Annual Report
Deutsche Post AGHeadquartersInvestor relations53250 BonnGermany
dpdhl.com
WHEN YOU THINK OF LOGISTICS

2 — 11THINK DEUTSCHE POST DHL
WE WANT YOU TO THINK OF US.

2 — 11THINK DEUTSCHE POST DHL
WE WANT YOU TO THINK OF US.

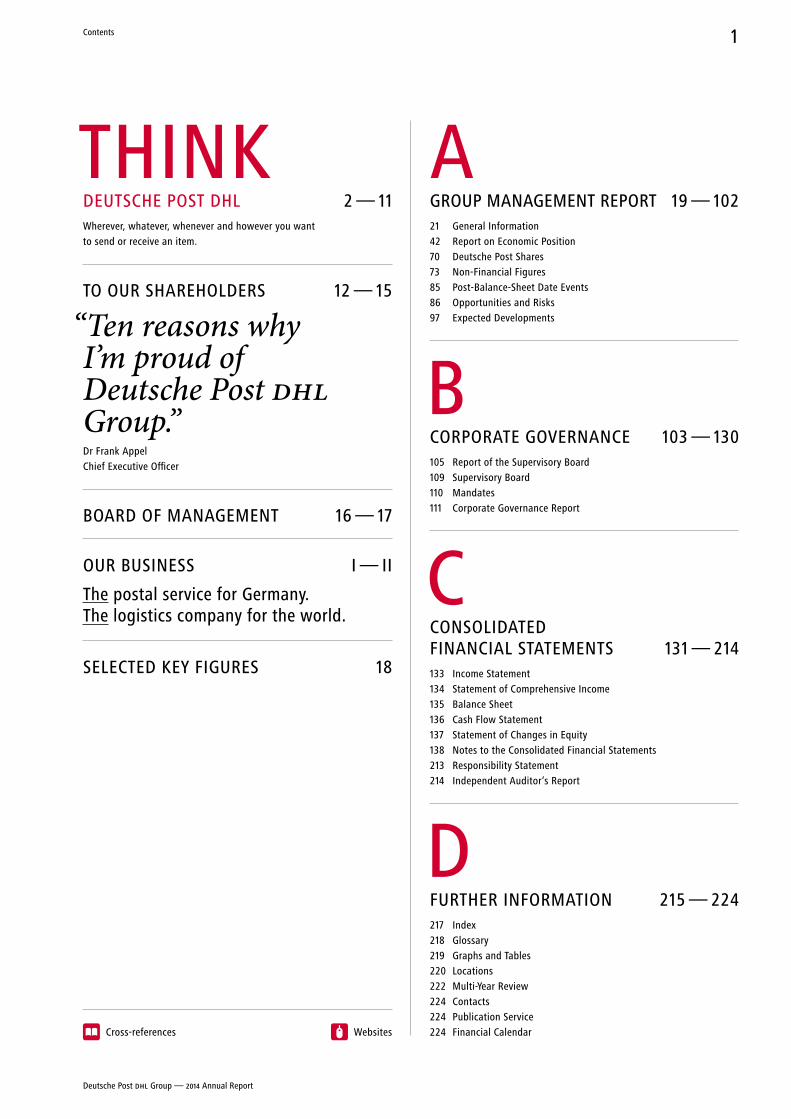
AGROUP MANAGEMENT REPORT 19 — 10221 General Information 42 Report on Economic Position 70 Deutsche Post Shares 73 Non-Financial Figures 85 Post-Balance-Sheet Date Events86 Opportunities and Risks 97 Expected Developments
BCORPORATE GOVERNANCE 103 — 130105 Report of the Supervisory Board 109 Supervisory Board 110 Mandates111 Corporate Governance Report
CCONSOLIDATED FINANCIAL STATEMENTS 131 — 214133 Income Statement134 Statement of Comprehensive Income135 Balance Sheet136 Cash Flow Statement137 Statement of Changes in Equity138 Notes to the Consolidated Financial Statements213 Responsibility Statement214 Independent Auditor’s Report
DFURTHER INFORMATION 215 — 224217 Index218 Glossary219 Graphs and Tables220 Locations222 Multi-Year Review224 Contacts224 Publication Service224 Financial Calendar Cross-references Websites
THINKDEUTSCHE POST DHL 2 — 11Wherever, whatever, whenever and however you want to send or receive an item.
TO OUR SHAREHOLDERS 12 — 15
“Ten reasons why I’m proud of Deutsche Post DHL Group.”Dr Frank Appel Chief Executive Officer
BOARD OF MANAGEMENT 16 — 17
OUR BUSINESS I — II
The postal service for Germany. The logistics company for the world.
SELECTED KEY FIGURES 18
Deutsche Post DHL Group — 2014 Annual Report
Contents 1

NO MATTER HOW MUCH YOU WANTOnline shoppers look forward to receiving their new purchases quickly. That’s why DHL delivers orders six days a week. Once collected from the retailer, DHL processes the items directly. Parcels sent via DHL generally arrive at your door on the very next workday.
Deutsche Post DHL Group — 2014 Annual Report
2

AND WHAT INTERESTS YOUThe Track & Trace service, available via the DHL app or website, allows you to check the status of your item at any time, and with our parcel notification and preferred-day services you can receive free notification of the delivery date via text message or e-mail and select the day on which you wish to receive your parcel.
THINK ONLINE
Deutsche Post DHL Group — 2014 Annual Report
3
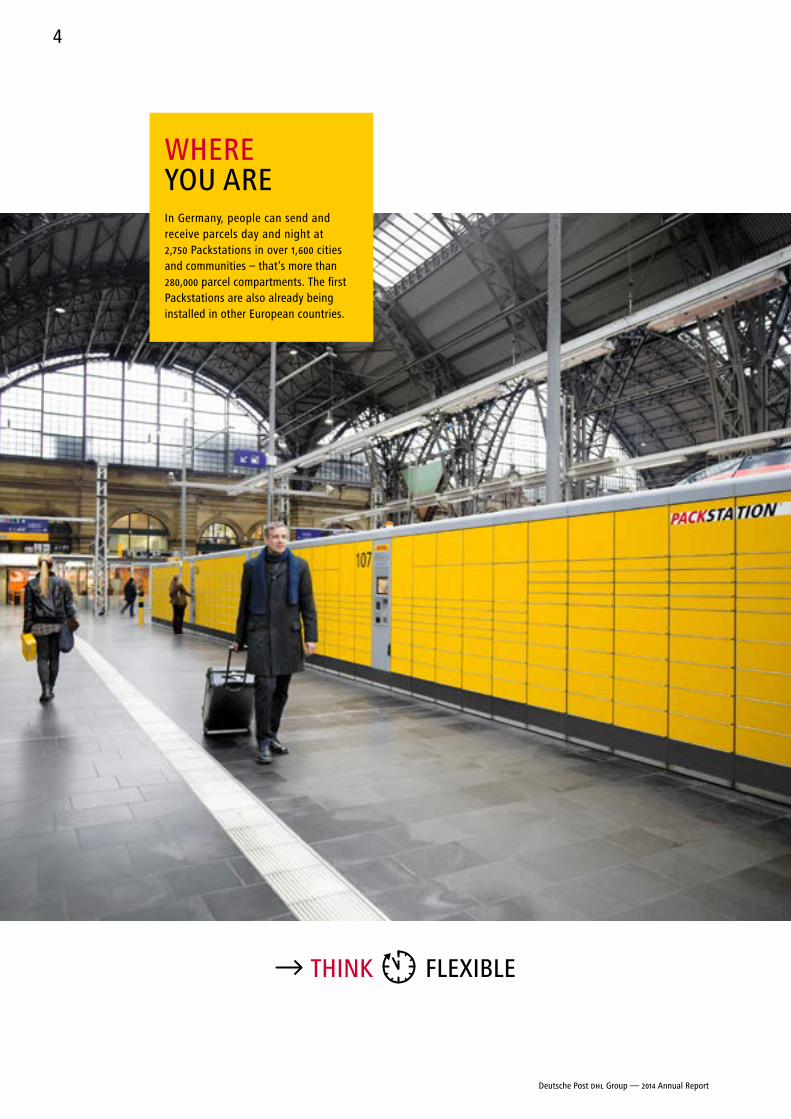
THINK FLEXIBLE
WHERE YOU AREIn Germany, people can send and receive parcels day and night at 2,750 Packstations in over 1,600 cities and communities – that’s more than 280,000 parcel compartments. The first Packstations are also already being installed in other European countries.
Deutsche Post DHL Group — 2014 Annual Report
4

AND WHEN YOU HAVE TIMEThe online supermarket Allyouneed.com allows you to shop conveniently online and have fresh groceries delivered to your door. At no extra charge, you can choose to have DHL’s courier service deliver your order right away or in selectable time slots in the evening on the same day.
Deutsche Post DHL Group — 2014 Annual Report
5

ON WHOM YOU CAN RELY DHL is the Official Logistics Partner of Canada-based Cirque du Soleil, globally known for its spectacular and breath-taking live performances. DHL provides event logistics support for the world- touring live shows, assisting with trans-port between event locations as well as many other requirements.
Deutsche Post DHL Group — 2014 Annual Report
6

THINK SPECIALISED
AND WHICH GOALS YOU ARE PURSUINGFormula E stands for sustainable techno logies, teamwork and innovation. DHL not only transports the electric racing cars, its environmentally friendly logistics solutions also take care of all the associated equipment. The series is made up of nine races over ten months.
Deutsche Post DHL Group — 2014 Annual Report
7
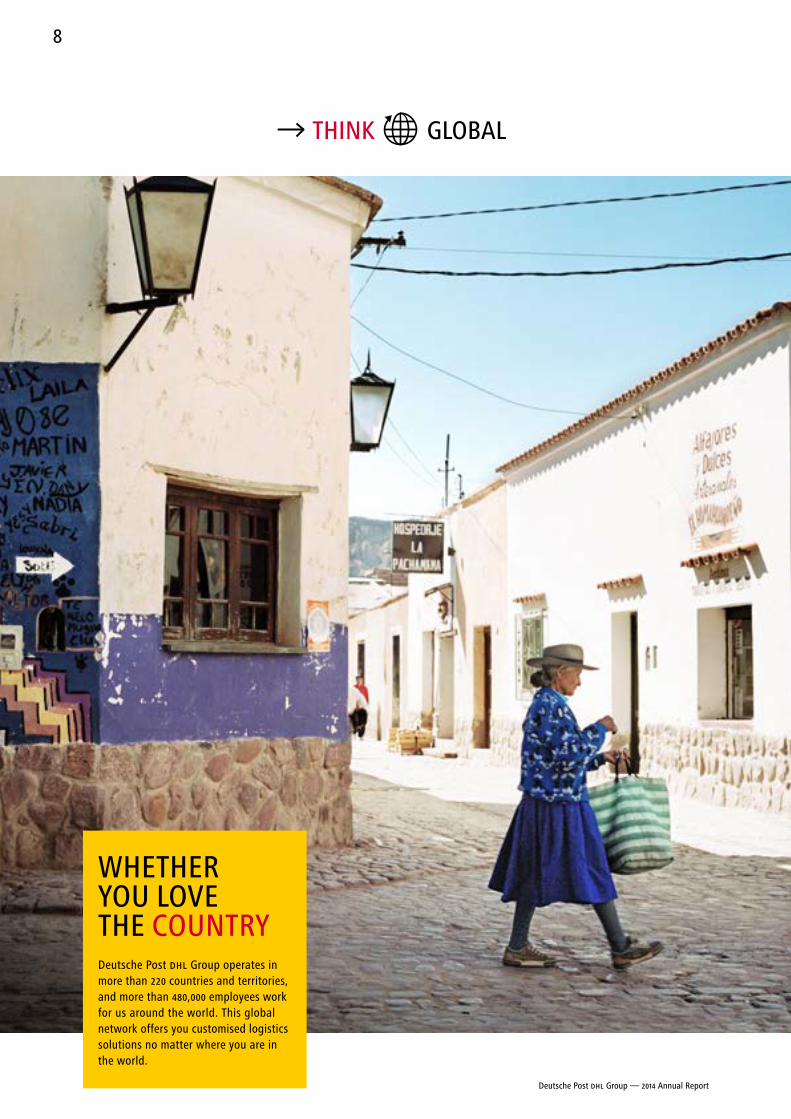
THINK GLOBAL
WHETHER YOU LOVE THE COUNTRYDeutsche Post DHL Group operates in more than 220 countries and territories, and more than 480,000 employees work for us around the world. This global network offers you customised logistics solutions no matter where you are in the world.
Deutsche Post DHL Group — 2014 Annual Report
8

OR CALL A MEGACITY HOMEGrowing cities and emerging markets require new logistics solutions. DHL is investing constantly in the network, adding, for instance, new facilities in the Middle East and North Africa region.
Deutsche Post DHL Group — 2014 Annual Report
9

10
NO MATTER HOW URGENT IT MIGHT BEDHL is looking into ways to deliver urgent items quickly and reliably in inner cities. In New York, Los Angeles and London, we offer a helicopter service to deliver time-critical documents, primarily for bank customers.
Deutsche Post DHL Group — 2014 Annual Report
10
11
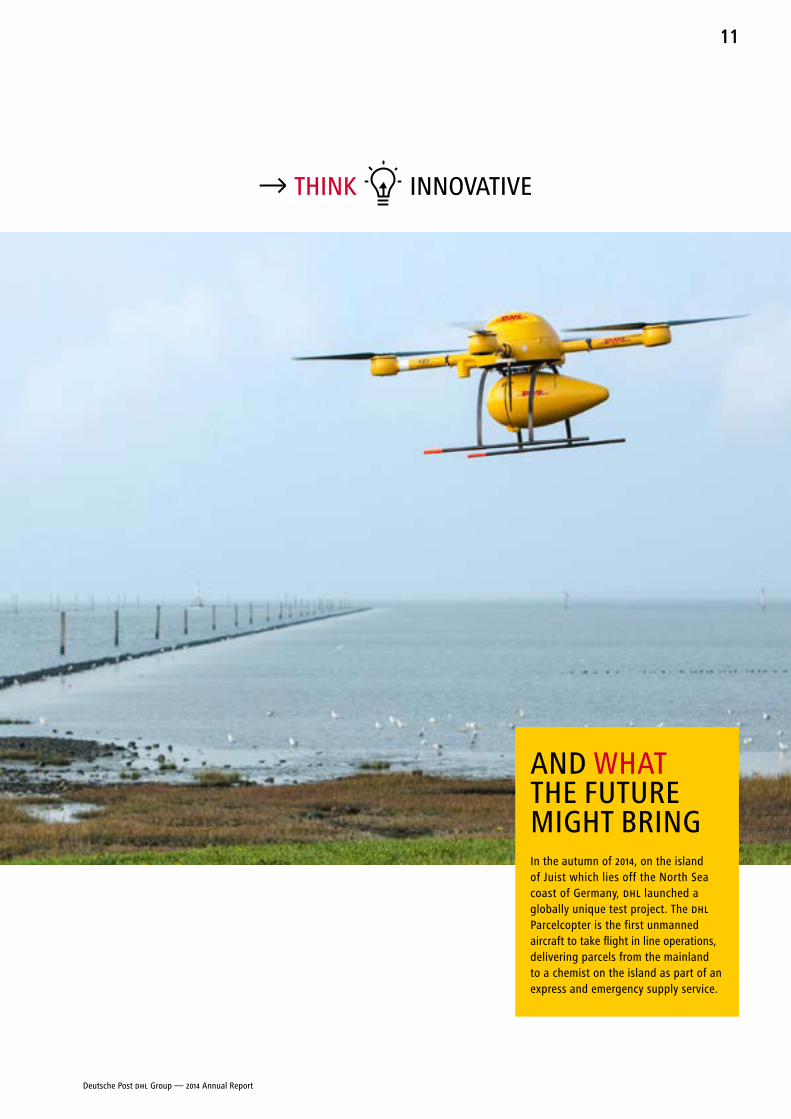
THINK INNOVATIVE
AND WHAT THE FUTURE MIGHT BRINGIn the autumn of 2014, on the island of Juist which lies off the North Sea coast of Germany, DHL launched a globally unique test project. The DHL Parcelcopter is the first unmanned aircraft to take flight in line operations, delivering parcels from the mainland to a chemist on the island as part of an express and emergency supply service.
Deutsche Post DHL Group — 2014 Annual Report
11
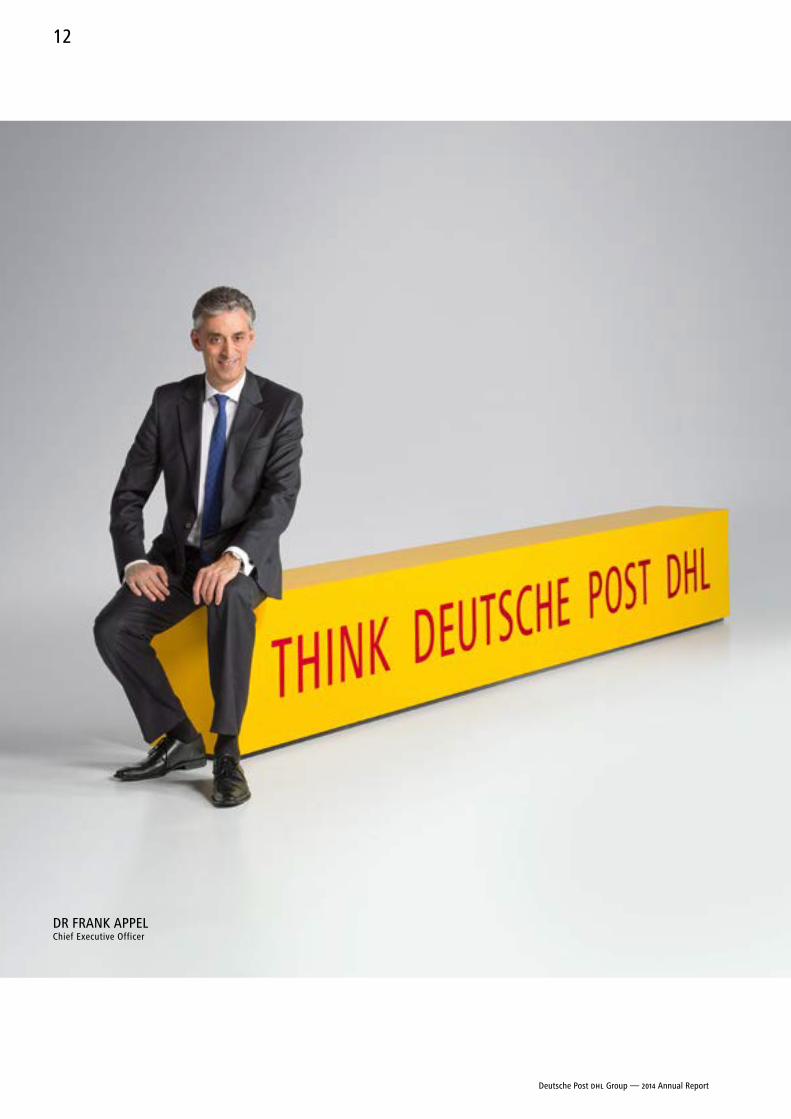
DR FRANK APPELChief Executive Officer
Deutsche Post DHL Group — 2014 Annual Report
12
“Ten reasons why I’m proud of Deutsche Post DHL Group.”DR FRANK APPEL
1 WE CAN LOOK BACK PROUDLY OVER A RICH HISTORY. The first postal services in Germany were introduced 525 years ago. With DHL Express we created the international express business nearly 50 years ago. Around 200 years ago Danzas − which became DHL Global Forwarding, Freight − laid the cornerstone of the modern freight forwarding business. Moreover, our DHL Supply Chain division has redefined logistics and developed innovative approaches for supply chains time and again. This history not only demonstrates that we have tradition of which we can be proud, but also that we rise to new challenges – often assuming the role of the initiator of change ourselves.
2 WE HAVE THE COURAGE TO DO THE RIGHT THING AT THE RIGHT TIME. Change demands strength and can sometimes also be painful. I remember our retraction from the US domestic express business in 2009 only too well. Today, we continue to face many challenges. For years, our Mail business has been experiencing a structural shift towards digital communication. Falling mail volumes and rising costs require new solutions. Our Supply Chain business is being reorganised to take better advantage of our size. In our Global Forwarding business unit, we are in the midst of a fundamental transformation. With our strategic project, New Forwarding Environment, we are redefining how we work – and are, once again, more than ready to do what has to be done to secure our competitiveness and profitability for the long term.
3 WE HAVE A SOUND CORPORATE STRATEGY. The title of this annual report is intrinsic to our strategy: when people think logistics, we want them to think Deutsche Post DHL Group. It’s an ambitious goal. Our “Strategy 2020: Focus.Connect.Grow.” underscores our goal of becoming the company that defines the logistics industry. In recent years we have made enormous strides as we work towards becoming the provider of choice for customers, the employer of choice for our staff and an attractive investment for shareholders. We aim to build on these successes and continue to grow. Increasing digitalisation, booming e-commerce and momentum in the emerging countries number amongst the most important drivers of our business.
Deutsche Post DHL Group — 2014 Annual Report
To our Shareholders 13
4 WE HAVE UNPARALLELED CAPABILITIES. We are the number one provider of mail and parcel services in Germany and among the top providers for leading air and ocean freight logistics. DHL Express is the world’s most international business, while our Supply Chain business is the largest provider of third-party logistics solutions globally. We are who we are as a result of our dedication and commitment.
5 WE HAVE A GREAT CUSTOMER VALUE PROPOSITION. We invest in our network and expand it where transport volumes are increasing. Our aim is to be internationally renowned not only as a highly customer-centric company but also as leaders in quality. The fact that customer satisfaction with our products and services is continuously rising in all divisions shows that we are achieving this goal. Our mail transit times and parcel business are amongst the best in Europe. Furthermore, the Net Promoter Approach allows DHL customers to rate our services immediately, which, in turn, makes it possible for us to continuously turn feedback into improvements.
6 WE HAVE PIONEERING IDEAS. Another strength of Deutsche Post DHL Group is our tremendous willingness to innovate. In the Post - eCommerce - Parcel division, this is evident in our E-POST products, parcel recipient services, our own online shopping portal and the parcelcopter. In the Express division, we have developed the Certified International Specialist training programme for our employees − and will now launch the initiative throughout the Group. In the Global Forwarding, Freight division, we expanded our portfolio of multimodal and temperature-controlled transport, whilst in the Supply Chain division, our focus remains on developing innovative services for key sectors such as Life Sciences & Healthcare. Our innovations are more than just new ideas. To us, innovation is also about being willing to change things and continuously improve the way we work.
7 WE ARE CONSTANTLY IMPROVING. For years now, establishing the First Choice methodology of continuous improvement within our organisation has been part of corporate strategy. Beyond its tools and methodologies, the First Choice Way epitomises our ambitious goal of striving for improvement every day.
8 WE DELIVER GOOD RESULTS. Deutsche Post DHL Group reached the targets it had set for financial year 2014. Although the global economy only registered cautious growth overall, the Group’s revenue, EBIT and operating cash flow all increased. The German parcel business and the inter national express business continued to generate dynamic growth. Earnings in the Supply Chain division likewise benefited from a high level of new business and continuing restructuring
Deutsche Post DHL Group — 2014 Annual Report
14
programmes, whereas margin pressure and transformation costs had a noticeable impact on the Global Forwarding, Freight division. Overall, we achieved positive results and our shareholders should benefit from this. At the Annual General Meeting we shall propose a dividend of €0.85 per share for 2014. Forecasts for 2015 indicate that the global economy will continue to experience regional variations and only demonstrate moderate growth on the whole. We expect consolidated EBIT to reach €3.05 billion to €3.20 billion in financial year 2015. The Post - eCommerce - Parcel division is likely to contribute at least €1.3 billion to this figure. Compared with the previous year, we expect an additional improvement in overall earnings to €2.1 billion to €2.25 billion in the DHL divisions. The Corporate Center / Other result is projected to remain at around €−0.35 billion. The earnings forecast that we presented for 2016 remains unchanged.
“We reached the targets we set for 2014.”9 WE HAVE COMMITTED PEOPLE. More than 480,000 people work for Deutsche Post DHL Group around the world. That makes us one of the largest employers and trainers – a responsibility of which I am more than conscious. For this reason, I am all the more pleased that it’s not only our customers who are increasingly satisfied with our performance, it’s also our employees. We systematically survey our employees across the entire Group on an annual basis. During the past six years, favourable answers to the key performance indicator, Employee Engagement, has risen from 61 % to 72 %. Our employees are not only committed to their workplace, but to their commu-nities as well. The high number of participants in our annual Global Volunteer Day demonstrates their deep commitment to voluntary work. It is also wonderful to see our employees donate to help their colleagues in need.
10 WE SERVE A GREATER PURPOSE. Everything we do brings people closer together − through mail and parcel deliveries, express shipments, goods transported by road, rail, air and ocean, and the warehouses we operate. We connect people, and in doing so, improve their lives. This is our commitment – no more and no less. Indeed, it’s one of the many reasons why I’m proud of Deutsche Post DHL Group.
Deutsche Post DHL Group — 2014 Annual Report
To our Shareholders 15
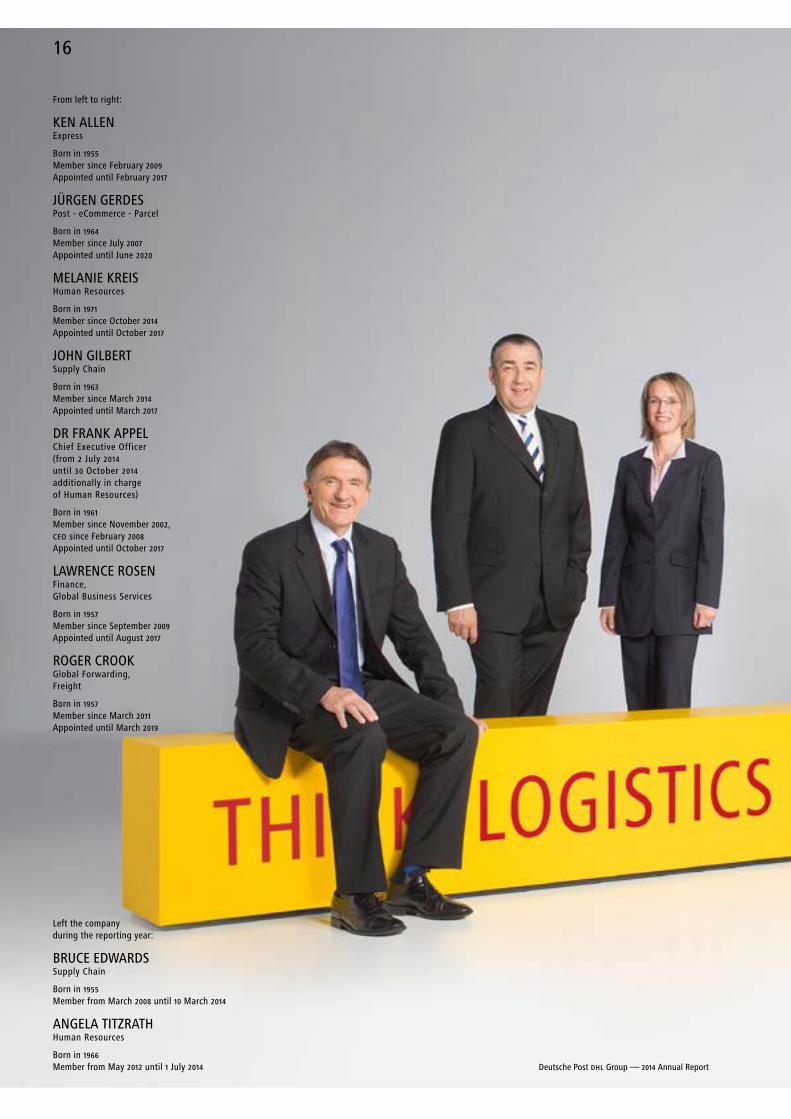
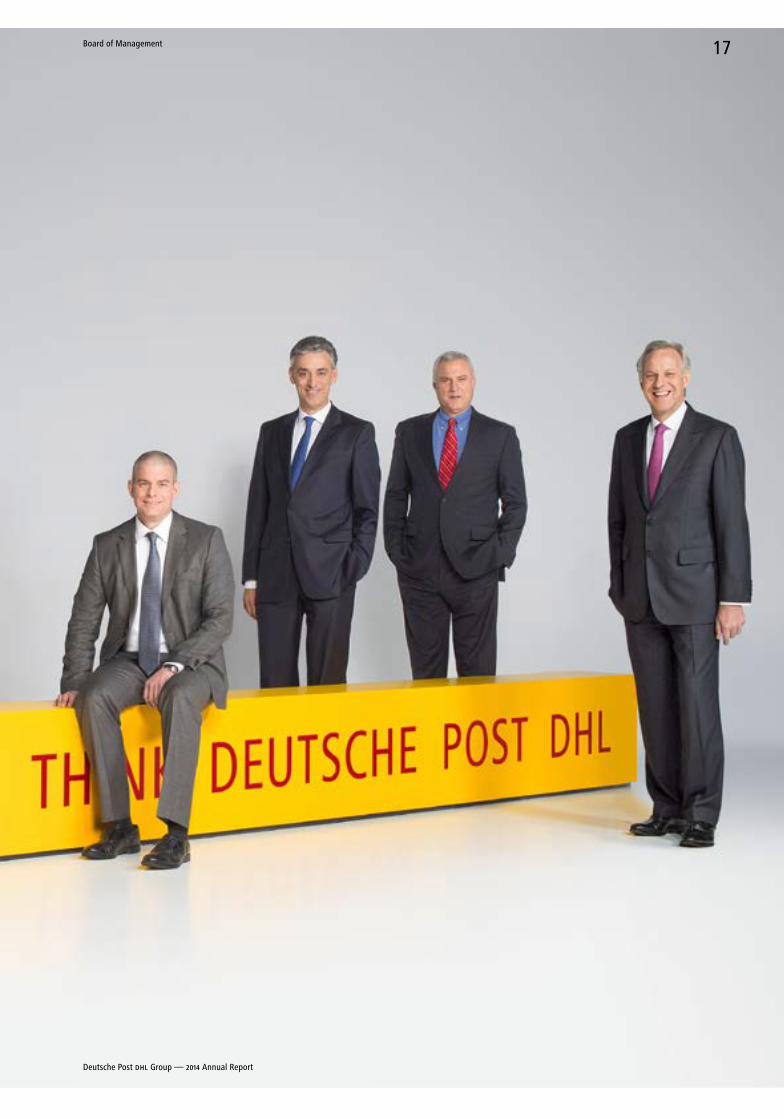
From left to right:
KEN ALLENExpress
Born in 1955Member since February 2009 Appointed until February 2017
JÜRGEN GERDESPost - eCommerce - Parcel
Born in 1964Member since July 2007 Appointed until June 2020
MELANIE KREISHuman Resources
Born in 1971Member since October 2014Appointed until October 2017
JOHN GILBERT Supply Chain
Born in 1963Member since March 2014Appointed until March 2017
DR FRANK APPELChief Executive Officer (from 2 July 2014 until 30 October 2014 additionally in charge of Human Resources)
Born in 1961 Member since November 2002, CEO since February 2008 Appointed until October 2017
LAWRENCE ROSENFinance, Global Business Services
Born in 1957Member since September 2009 Appointed until August 2017
ROGER CROOKGlobal Forwarding, Freight
Born in 1957Member since March 2011Appointed until March 2019
Left the company during the reporting year:
BRUCE EDWARDSSupply Chain
Born in 1955Member from March 2008 until 10 March 2014
ANGELA TITZRATHHuman Resources
Born in 1966Member from May 2012 until 1 July 2014 Deutsche Post DHL Group — 2014 Annual Report
16
Deutsche Post DHL Group — 2014 Annual Report
17Board of Management
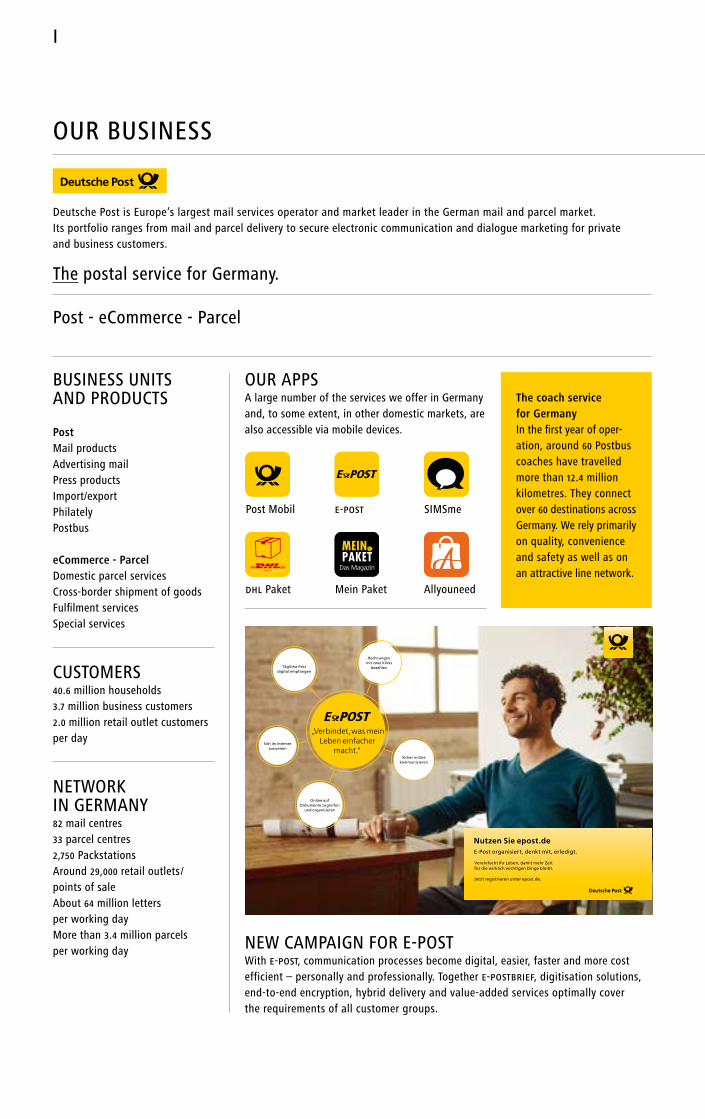
Deutsche Post is Europe’s largest mail services operator and market leader in the German mail and parcel market. Its port folio ranges from mail and parcel delivery to secure electronic communication and dialogue marketing for private and business customers.
The postal service for Germany.
Post - eCommerce - Parcel
BUSINESS UNITS AND PRODUCTS
PostMail productsAdvertising mailPress productsImport/exportPhilatelyPostbus
eCommerce - ParcelDomestic parcel servicesCross-border shipment of goodsFulfilment servicesSpecial services
CUSTOMERS 40.6 million households3.7 million business customers2.0 million retail outlet customers per day
NETWORK IN GERMANY82 mail centres33 parcel centres2,750 PackstationsAround 29,000 retail outlets / points of saleAbout 64 million letters per working dayMore than 3.4 million parcels per working day
OUR APPSA large number of the services we offer in Germany and, to some extent, in other domestic markets, are also accessible via mobile devices.
The coach service for GermanyIn the first year of oper-ation, around 60 Postbus coaches have travelled more than 12.4 million kilometres. They connect over 60 destinations across Germany. We rely primarily on quality, convenience and safety as well as on an attractive line network.
Sicher online kommunizieren
Rechnungen mit zwei Klicks
bezahlen
Online auf Dokumente zugreifen
und organisieren
Tägliche Post digital empfangen
Sich im Internet ausweisen
„Verbindet, was mein Leben einfacher
macht.“
Nutzen Sie epost.deE-Post organisiert, denkt mit, erledigt.
Vereinfacht Ihr Leben, damit mehr Zeit für die wirklich wichtigen Dinge bleibt.
Jetzt registrieren unter epost.de.
NEW CAMPAIGN FOR E-POSTWith E-POST, communication processes become digital, easier, faster and more cost efficient – personally and professionally. Together E-POSTBRIEF, digitisation solutions, end-to-end encryption, hybrid delivery and value-added services optimally cover the requirements of all customer groups.
Post Mobil E-POST SIMSme
DHL Paket Mein Paket
Das Magazin
MEINPAKET
Allyouneed
OUR BUSINESS
I
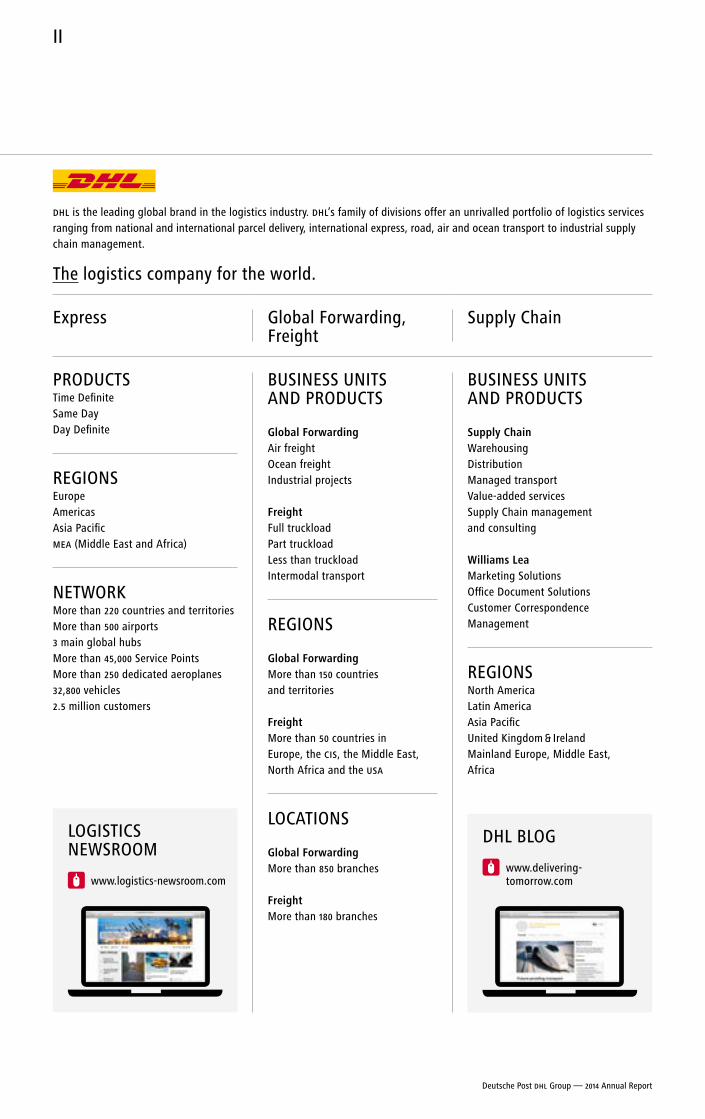
DHL is the leading global brand in the logistics industry. DHL’s family of divisions offer an unrivalled portfolio of logistics services ranging from national and international parcel delivery, international express, road, air and ocean transport to industrial supply chain management.
The logistics company for the world.
Express Global Forwarding, Freight
Supply Chain
PRODUCTS Time DefiniteSame DayDay Definite
REGIONS EuropeAmericasAsia PacificMEA (Middle East and Africa)
NETWORKMore than 220 countries and territoriesMore than 500 airports3 main global hubsMore than 45,000 Service PointsMore than 250 dedicated aeroplanes32,800 vehicles2.5 million customers
BUSINESS UNITS AND PRODUCTS
Global ForwardingAir freightOcean freightIndustrial projects
FreightFull truckloadPart truckloadLess than truckloadIntermodal transport
REGIONS
Global ForwardingMore than 150 countries and territories
FreightMore than 50 countries in Europe, the CIS, the Middle East, North Africa and the USA
LOCATIONS
Global ForwardingMore than 850 branches
FreightMore than 180 branches
BUSINESS UNITS AND PRODUCTS
Supply ChainWarehousingDistributionManaged transportValue-added servicesSupply Chain management and consulting
Williams LeaMarketing SolutionsOffice Document SolutionsCustomer Correspondence Management
REGIONSNorth AmericaLatin AmericaAsia PacificUnited Kingdom & IrelandMainland Europe, Middle East, Africa
LOGISTICS NEWSROOM
www.logistics-newsroom.com
DHL BLOG
www.delivering- tomorrow.com
OUR BUSINESS
Deutsche Post DHL Group — 2014 Annual Report
II
01 SELECTED KEY FIGURES
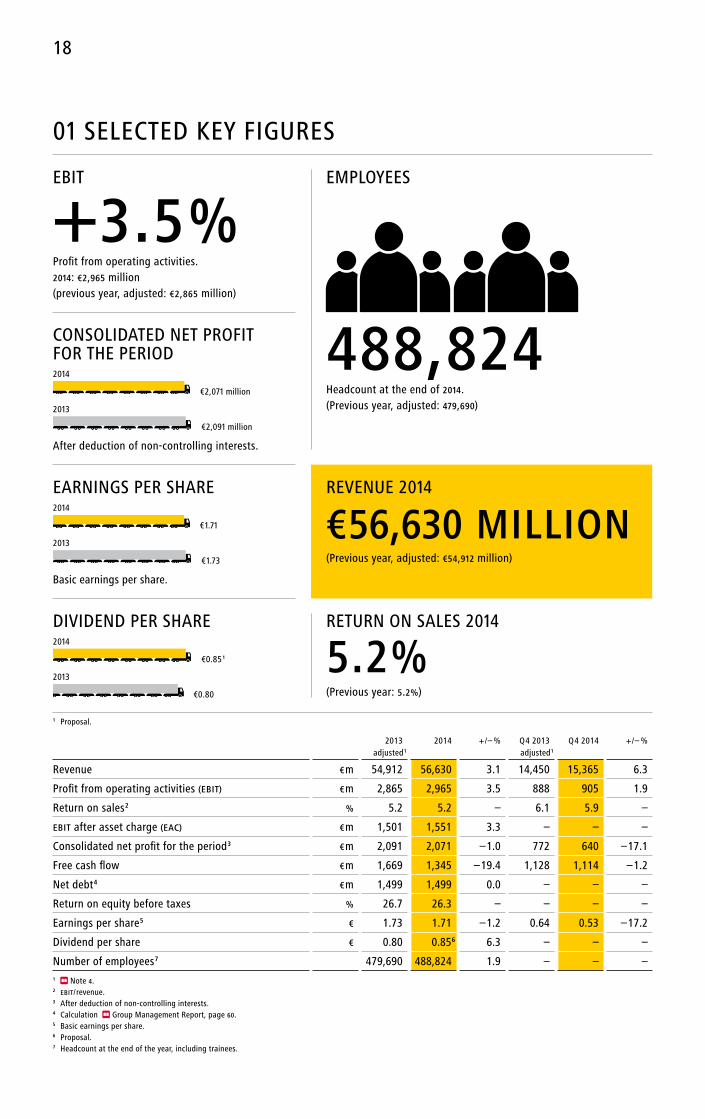
EBIT
+3.5%Profit from operating activities.2014: €2,965 million (previous year, adjusted: €2,865 million)
EMPLOYEES
488,824Headcount at the end of 2014.(Previous year, adjusted: 479,690)
CONSOLIDATED NET PROFIT FOR THE PERIOD2014
€2,071 million
2013
€2,091 million
After deduction of non-controlling interests.
EARNINGS PER SHARE2014
€ 1.71
2013
€ 1.73
Basic earnings per share.
REVENUE 2014
€56,630 MILLIOn(Previous year, adjusted: €54,912 million)
DIVIDEND PER SHARE2014
€0.85 1
2013
€0.80
RETURN ON SALES 2014
5.2%(Previous year: 5.2%)
1 Proposal.
2013
adjusted 1
2014 + / – % Q 4 2013 adjusted 1
Q 4 2014 + / – %
Revenue € m 54,912 56,630 3.1 14,450 15,365 6.3
Profit from operating activities (EBIT) € m 2,865 2,965 3.5 888 905 1.9
Return on sales 2 % 5.2 5.2 – 6.1 5.9 –
EBIT after asset charge (EAC) € m 1,501 1,551 3.3 – – –
Consolidated net profit for the period 3 € m 2,091 2,071 –1.0 772 640 –17.1
Free cash flow € m 1,669 1,345 –19.4 1,128 1,114 –1.2
Net debt 4 € m 1,499 1,499 0.0 – – –
Return on equity before taxes % 26.7 26.3 – – – –
Earnings per share 5 € 1.73 1.71 –1.2 0.64 0.53 –17.2
Dividend per share € 0.80 0.85 6 6.3 – – –
Number of employees 7 479,690 488,824 1.9 – – –1 Note 4.2 EBIT / revenue.3 After deduction of non-controlling interests.4 Calculation Group Management Report, page 60.5 Basic earnings per share.6 Proposal.7 Headcount at the end of the year, including trainees.
18
AA
GR
OU
P MA
NA
GEM
ENT R
EPOR
T
19 — 102
GROUP MANAGEMENT REPORT
AGROUP MANAGEMENT REPORT
21 GENERAL INFORMATION 21 Business model and organisation 24 Business units and market positions 30 Objectives and strategies 35 Group management 37 Disclosures required by takeover law 41 Remuneration of the Board of Management and the Supervisory Board 41 Research and development
42 REPORT ON ECONOMIC POSITION 42 Overall Board of Management assessment of the economic position 42 Forecast / actual comparison 43 Economic parameters 47 Significant events 47 Results of operations 50 Financial position 59 Net assets 61 Business performance in the divisions
70 DEUTSCHE POST SHARES
73 NON-FINANCIAL FIGURES 73 Employees 77 Health and safety 78 Corporate responsibility 80 Procurement 81 Customers and quality 84 Brands
85 POST-BALANCE-SHEET DATE EVENTS
86 OPPORTUNITIES AND RISKS 86 Overall Board of Management assessment of opportunity and risk situation 86 Opportunity and risk management processes 90 Categories of opportunities and risks
97 EXPECTED DEVELOPMENTS 97 Overall Board of Management assessment of the future economic position 97 Forecast period 97 Future organisation 98 Future economic parameters 100 Revenue and earnings forecast 101 Expected financial position 102 Development of further indicators relevant for internal management
GENERAL INFORMATIONDeutsche Post DHL Group is the world’s leading mail and logistics services provider. The
Deutsche Post and DHL corporate brands represent a one-of-a-kind portfolio of logistics
(DHL) and communications (Deutsche Post) services. We provide our customers with both
easy-to-use standardised products as well as innovative and tailored solutions ranging
from dialogue marketing to industrial supply chains. More than 480,000 employees in over
220 countries and territories form a global network focused on service, quality and sustain-
ability. With programmes in the areas of environmental protection, disaster management
and education, we are committed to social responsibility.
Business model and organisation
Four operating divisions
Deutsche Post AG is a listed corporation domiciled in Bonn, Germany. The Group is organised into four operating divisions, each of which is under the control of its own divisional headquarters and subdivided into business units for reporting purposes.
We are the only provider of universal postal services in Germany. Our Post - eCommerce - Parcel division handles both domestic and international mail and we are specialists in dialogue marketing, nationwide press distribution services and all the elec-tronic services associated with mail delivery. Outside Germany, we also offer domestic parcel services in other markets and we are constantly expanding our portfolio of cross-border parcel and goods shipping services.
Our Express division offers time-definite courier and express services to business and private customers in more than 220 countries and territories, the most compre-hensive network in the world.
Our Global Forwarding, Freight division handles the transport of goods by rail, road, air and sea, with services extending from standardised container transport to highly specialised end-to-end solutions for industrial projects and solutions tailored to specific sectors.
Our Supply Chain division delivers customised logistics solutions to its customers based on globally standardised modular components including warehousing, transport and value-added services. Moreover, through Williams Lea, we offer specialised Busi-ness Process Outsourcing (BPO) and marketing communications solutions tailored to customers’ needs.
We consolidate the internal services that support the entire Group, including Finance, IT, Procurement and Legal, in our Global Business Services (GBS). This allows us to make even more efficient use of our resources whilst reacting flexibly to the rapidly changing demands of our business and our customers.
Group management functions are centralised in the Corporate Center.
Glossary, page 218
Deutsche Post DHL Group — 2014 Annual Report
21Group Management Report — GeneraL InForMaTIon — Business model and organisation
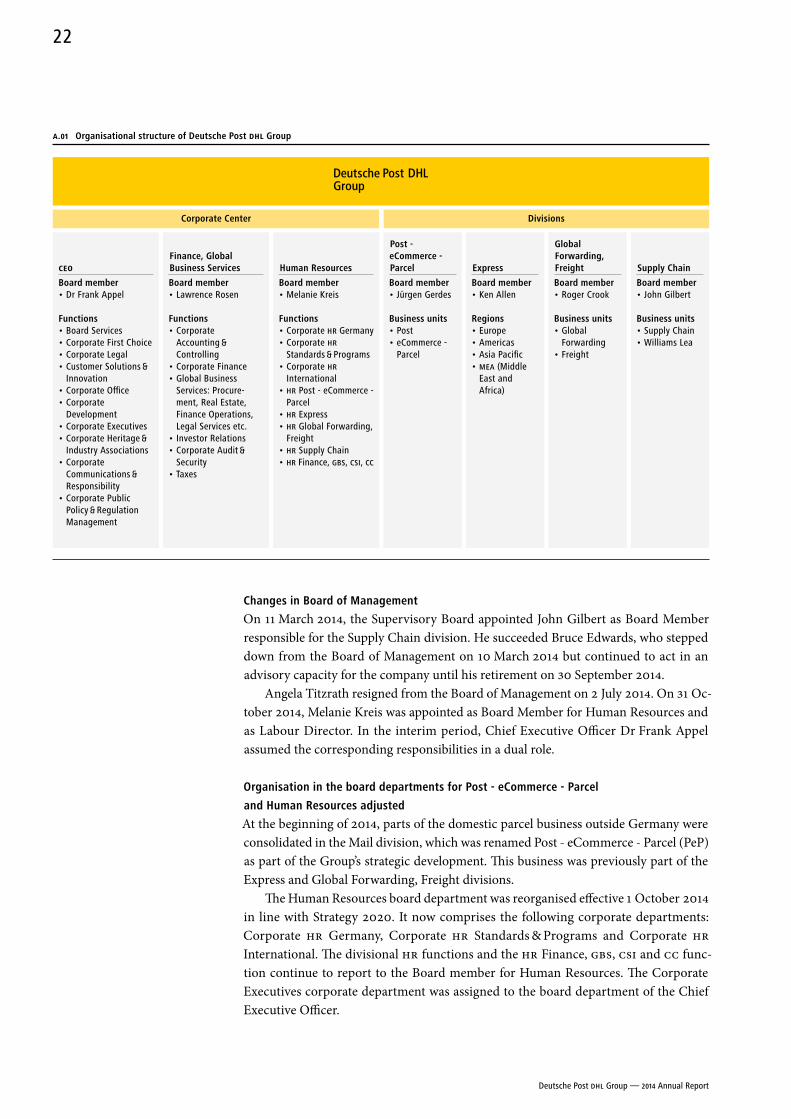
Changes in Board of Management
On 11 March 2014, the Supervisory Board appointed John Gilbert as Board Member responsible for the Supply Chain division. He succeeded Bruce Edwards, who stepped down from the Board of Management on 10 March 2014 but continued to act in an advisory capacity for the company until his retirement on 30 September 2014.
Angela Titzrath resigned from the Board of Management on 2 July 2014. On 31 Oc-tober 2014, Melanie Kreis was appointed as Board Member for Human Resources and as Labour Director. In the interim period, Chief Executive Officer Dr Frank Appel assumed the corresponding responsibilities in a dual role.
organisation in the board departments for Post - eCommerce - Parcel
and Human resources adjusted
At the beginning of 2014, parts of the domestic parcel business outside Germany were consolidated in the Mail division, which was renamed Post - eCommerce - Parcel (PeP) as part of the Group’s strategic development. This business was previously part of the Express and Global Forwarding, Freight divisions.
The Human Resources board department was reorganised effective 1 October 2014 in line with Strategy 2020. It now comprises the following corporate departments: Corporate HR Germany, Corporate HR Standards & Programs and Corporate HR Inter national. The divisional HR functions and the HR Finance, GBS, CSI and CC func-tion continue to report to the Board member for Human Resources. The Corporate Executives corporate department was assigned to the board department of the Chief Executive Officer.
A.01 organisational structure of Deutsche Post DHL Group
Corporate Center Divisions
CEOFinance, Global Business Services Human resources
Post - eCommerce - Parcel express
Global Forwarding, Freight Supply Chain
Board member• Dr Frank Appel
Functions• Board Services• Corporate First Choice• Corporate Legal• Customer Solutions &
Innovation• Corporate Office• Corporate
Development• Corporate Executives• Corporate Heritage &
Industry Associations• Corporate
Communications & Responsibility
• Corporate Public Policy & Regulation Management
Board member• Lawrence Rosen
Functions• Corporate
Accounting & Controlling
• Corporate Finance• Global Business
Services: Procure-ment, Real Estate, Finance Operations, Legal Services etc.
• Investor Relations• Corporate Audit &
Security• Taxes
Board member• Melanie Kreis
Functions• Corporate HR Germany• Corporate HR
Standards & Programs• Corporate HR
International• HR Post - eCommerce -
Parcel• HR Express• HR Global Forwarding,
Freight• HR Supply Chain• HR Finance, GBS, CSI, CC
Board member• Jürgen Gerdes
Business units• Post• eCommerce -
Parcel
Board member• Ken Allen
regions• Europe• Americas• Asia Pacific• MEA (Middle
East and Africa)
Board member• Roger Crook
Business units• Global
Forwarding• Freight
Board member• John Gilbert
Business units• Supply Chain• Williams Lea
Deutsche Post DHL Group — 2014 Annual Report
22
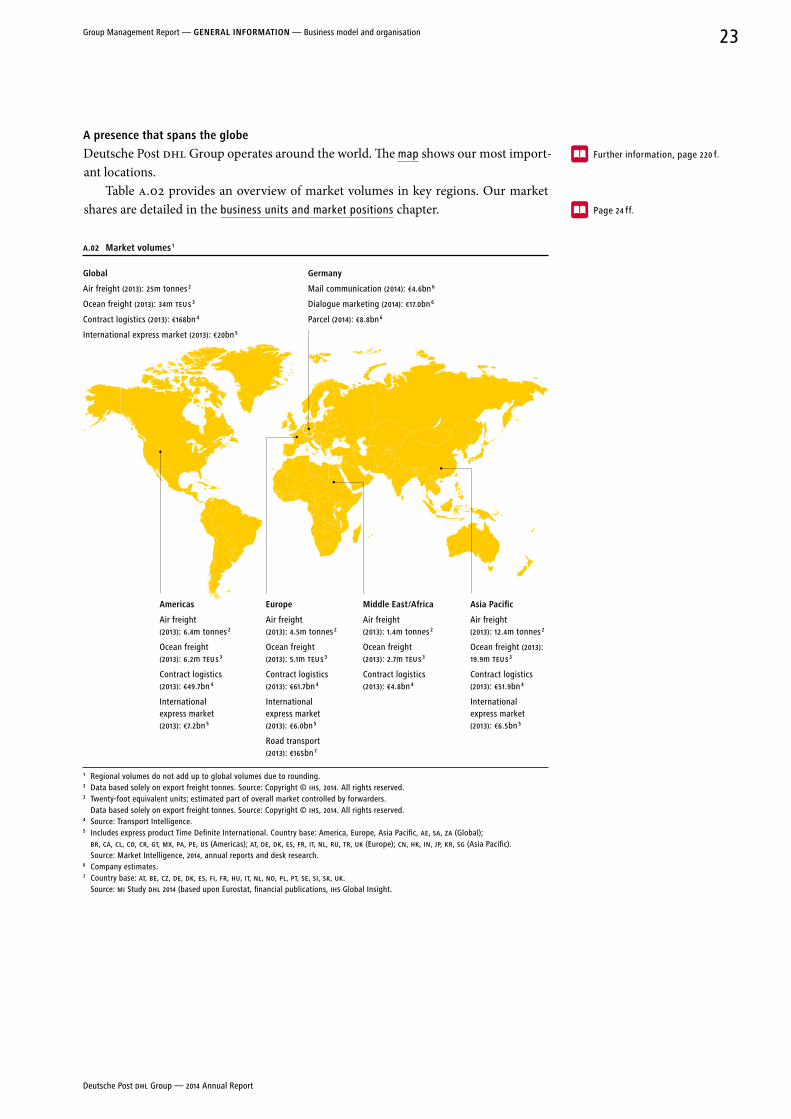
a presence that spans the globe
Deutsche Post DHL Group operates around the world. The map shows our most import-ant locations.
Table A.02 provides an overview of market volumes in key regions. Our market shares are detailed in the business units and market positions chapter.
A.02 Market volumes 1
Global
Air freight (2013): 25m tonnes 2
Ocean freight (2013): 34m TEU s 3
Contract logistics (2013): €168bn 4
International express market (2013): €20bn 5
asia Pacific
Air freight (2013): 12.4m tonnes 2
Ocean freight (2013): 19.9m TEU s 3
Contract logistics (2013): €51.9bn 4
International express market (2013): €6.5bn 5
europe
Air freight (2013): 4.5m tonnes 2
Ocean freight (2013): 5.1m TEU s 3
Contract logistics (2013): €61.7bn 4
International express market (2013): €6.0bn 5
Road transport (2013): €165bn 7
Middle east / africa
Air freight (2013): 1.4m tonnes 2
Ocean freight (2013): 2.7m TEU s 3
Contract logistics (2013): €4.8bn 4
Germany
Mail communication (2014): €4.6bn 6
Dialogue marketing (2014): €17.0bn 6
Parcel (2014): €8.8bn 6
americas
Air freight (2013): 6.4m tonnes 2
Ocean freight (2013): 6.2m TEU s 3
Contract logistics (2013): €49.7bn 4
International express market (2013): €7.2bn 5
1 Regional volumes do not add up to global volumes due to rounding.2 Data based solely on export freight tonnes. Source: Copyright © IHS, 2014. All rights reserved.3 Twenty-foot equivalent units; estimated part of overall market controlled by forwarders.
Data based solely on export freight tonnes. Source: Copyright © IHS, 2014. All rights reserved.4 Source: Transport Intelligence.5 Includes express product Time Definite International. Country base: America, Europe, Asia Pacific, AE, SA, ZA (Global);
BR, CA, CL, CO, CR, GT, MX, PA, PE, US (Americas); AT, DE, DK, ES, FR, IT, nL, RU, TR, UK (Europe); Cn, HK, In, JP, KR, SG (Asia Pacific). Source: Market Intelligence, 2014, annual reports and desk research.
6 Company estimates.7 Country base: AT, BE, CZ, DE, DK, ES, FI, FR, HU, IT, nL, nO, PL, PT, SE, SI, SK, UK.
Source: MI Study DHL 2014 (based upon Eurostat, financial publications, IHS Global Insight.
Further information, page 220 f.
Page 24 ff.
Deutsche Post DHL Group — 2014 Annual Report
23Group Management Report — GeneraL InForMaTIon — Business model and organisation
Business units and market positions
POST - ECOMMERCE - PARCEL DIVISION
The postal service for Germany
As Europe’s largest postal company, we deliver about 64 million letters every working day in Germany. We offer all types of products and services to both private and business customers, ranging from physical, hybrid and electronic letters and merchandise to special services such as cash on delivery, registered mail and insured items. Our E-POST product provides a secure, confidential and reliable platform for electronic communi-cation. It allows companies, public authorities and private individuals to send secure communications whilst reducing processing costs.
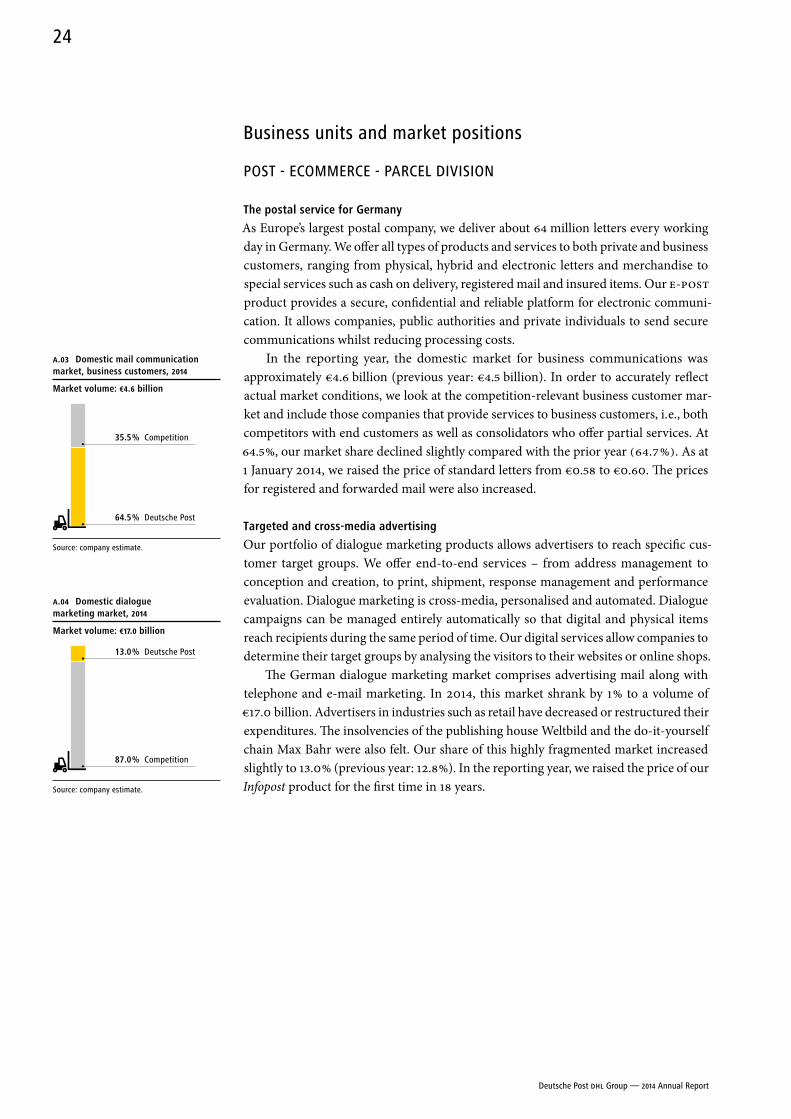
In the reporting year, the domestic market for business communications was approx imately €4.6 billion (previous year: €4.5 billion). In order to accurately reflect actual market conditions, we look at the competition-relevant business customer mar-ket and include those companies that provide services to business customers, i. e., both competitors with end customers as well as consolidators who offer partial services. At 64.5 %, our market share declined slightly compared with the prior year (64.7 %). As at 1 January 2014, we raised the price of standard letters from €0.58 to €0.60. The prices for registered and forwarded mail were also increased.
Targeted and cross-media advertising
Our portfolio of dialogue marketing products allows advertisers to reach specific cus-tomer target groups. We offer end-to-end services – from address management to conception and creation, to print, shipment, response management and performance evaluation. Dialogue marketing is cross-media, personalised and automated. Dialogue campaigns can be managed entirely automatically so that digital and physical items reach recipients during the same period of time. Our digital services allow companies to determine their target groups by analysing the visitors to their websites or online shops.
The German dialogue marketing market comprises advertising mail along with telephone and e-mail marketing. In 2014, this market shrank by 1 % to a volume of €17.0 billion. Advertisers in industries such as retail have decreased or restructured their expenditures. The insolvencies of the publishing house Weltbild and the do-it-yourself chain Max Bahr were also felt. Our share of this highly fragmented market increased slightly to 13.0 % (previous year: 12.8 %). In the reporting year, we raised the price of our Infopost product for the first time in 18 years.
A.03 Domestic mail communication market, business customers, 2014
Market volume: €4.6 billion
Source: company estimate.
35.5 % Competition
64.5 % Deutsche Post
A.04 Domestic dialogue marketing market, 2014
Market volume: €17.0 billion
Source: company estimate.
13.0 % Deutsche Post
87.0 % Competition
Deutsche Post DHL Group — 2014 Annual Report
24
Sending mail and parcels internationally
We carry mail and lightweight merchandise shipments across borders and provide in-ternational dialogue marketing services. We offer international shipping services for business customers in key European mail markets and by offering innovative products we set ourselves apart from the competition. For example, we are developing inter-national shipping solutions for consumers (B2C) in the growing e-commerce sector. Our port folio also comprises consulting and services for all physical and digital dia-logue marketing needs. Furthermore, we offer physical, hybrid and electronic written communications for international business customers. Customers outside Germany benefit from our expertise and experience in order to do business successfully in the German market.
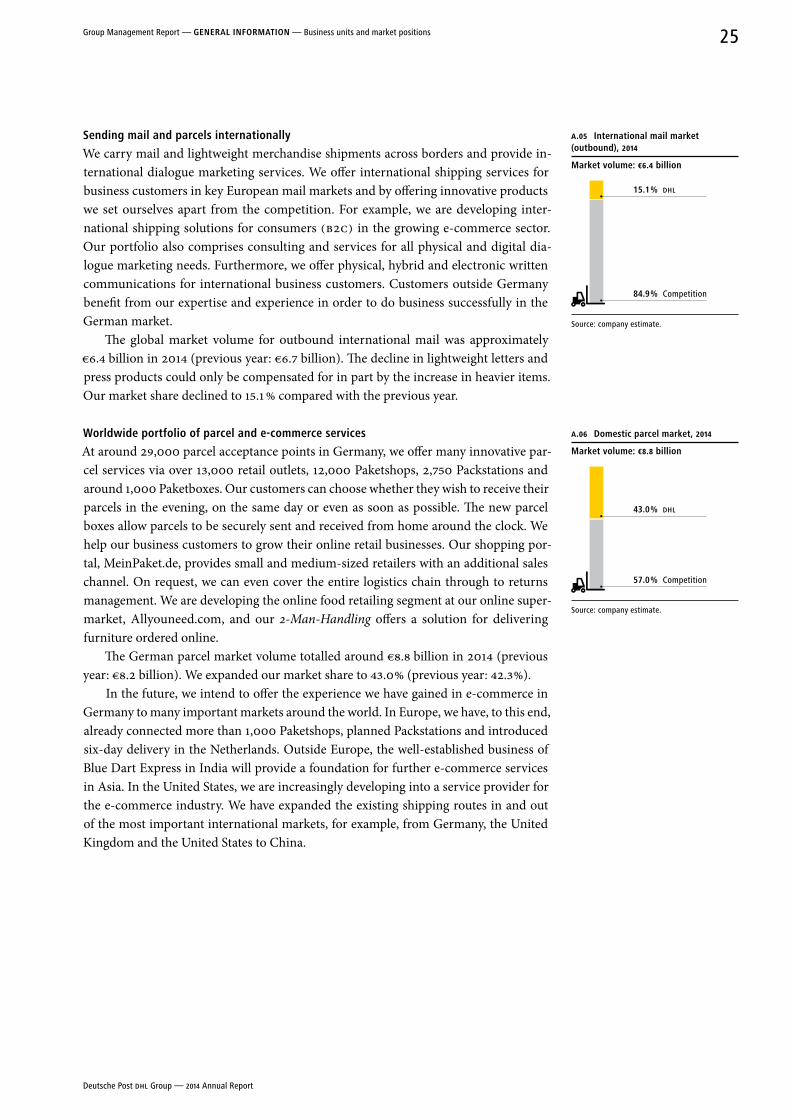
The global market volume for outbound international mail was approximately €6.4 billion in 2014 (previous year: €6.7 billion). The decline in lightweight letters and press products could only be compensated for in part by the increase in heavier items. Our market share declined to 15.1 % compared with the previous year.
Worldwide portfolio of parcel and e-commerce services
At around 29,000 parcel acceptance points in Germany, we offer many innovative par-cel services via over 13,000 retail outlets, 12,000 Paketshops, 2,750 Packstations and around 1,000 Paketboxes. Our customers can choose whether they wish to receive their parcels in the evening, on the same day or even as soon as possible. The new parcel boxes allow parcels to be securely sent and received from home around the clock. We help our business customers to grow their online retail businesses. Our shopping por-tal, MeinPaket.de, provides small and medium-sized retailers with an additional sales channel. On request, we can even cover the entire logistics chain through to returns management. We are developing the online food retailing segment at our online super-market, Allyouneed.com, and our 2-Man-Handling offers a solution for delivering furniture ordered online.
The German parcel market volume totalled around €8.8 billion in 2014 (previous year: €8.2 billion). We expanded our market share to 43.0 % (previous year: 42.3 %).
In the future, we intend to offer the experience we have gained in e-commerce in Germany to many important markets around the world. In Europe, we have, to this end, already connected more than 1,000 Paketshops, planned Packstations and introduced six-day delivery in the Netherlands. Outside Europe, the well-established business of Blue Dart Express in India will provide a foundation for further e-commerce services in Asia. In the United States, we are increasingly developing into a service provider for the e-commerce industry. We have expanded the existing shipping routes in and out of the most important international markets, for example, from Germany, the United Kingdom and the United States to China.
A.05 International mail market (outbound), 2014
Market volume: €6.4 billion
Source: company estimate.
15.1 % DHL
84.9 % Competition
A.06 Domestic parcel market, 2014
Market volume: €8.8 billion
Source: company estimate.
43.0 % DHL
57.0 % Competition
Deutsche Post DHL Group — 2014 Annual Report
25Group Management Report — GeneraL InForMaTIon — Business units and market positions
EXPRESS DIVISION
Leading provider of international express services
In the Express division, we transport urgent documents and goods reliably and on time from door to door. Our network spans more than 220 countries and territories, in which some 80,000 employees provide services to more than 2.5 million customers. As a global network operator that applies standardised processes, we are constantly optimis-ing our service to keep our customer commitments and respond specifically to custom-ers’ wishes. All of this makes us the leading provider of international express services.
International time-definite shipments are our core business
Our main product is Time Definite International (TDI), which offers pre-defined deliv-ery services. We also provide industry-specific services to complement this product. Our Medical Express transport solution, which is tailored specifically to customers in the Life Sciences & Healthcare sector, for example, offers various types of thermal packaging for temperature-controlled, chilled and frozen content. These shipments are specially monitored due to their sensitive nature. Collect and Return is used predominantly by customers in high-tech industries. Technical products are collected from the user, taken in for repairs and then returned.
our virtual airline
As an express service provider, we operate a global network consisting of several airlines, some of which we own 100 %. With an annual average of 3.4 million transported tonnes, our virtual airline is one of the leading international air freight carriers.
The combination of our own and purchased capacities, which include varied terms of contract, allows us to respond flexibly to fluctuating demand. We do not enter into long-term capacity obligations until our demand for cargo space exceeds the existing offering. We use the available cargo space for our main product TDI for long-term freight contracts – block space agreements – and we sell temporary excess capacity on the air freight market. The largest buyer of this is the DHL Global Forwarding business unit.
In the reporting year we launched further initiatives to renew our fleet. In Europe and the United States in particular, we are replacing aircraft that have reached the end of their life cycle with newer aircraft which are more efficient and have higher capacity.
Market leadership in international express business extended
We succeeded again in extending our leading market position in the international express business: at 34 % (previous year: 33 %), we were well ahead of the competition in 2013. In financial year 2014, the international express business continued to benefit from e-commerce and the growing importance of small and medium-sized enterprises in international trade.
Glossary, page 218
Deutsche Post DHL Group — 2014 Annual Report
26
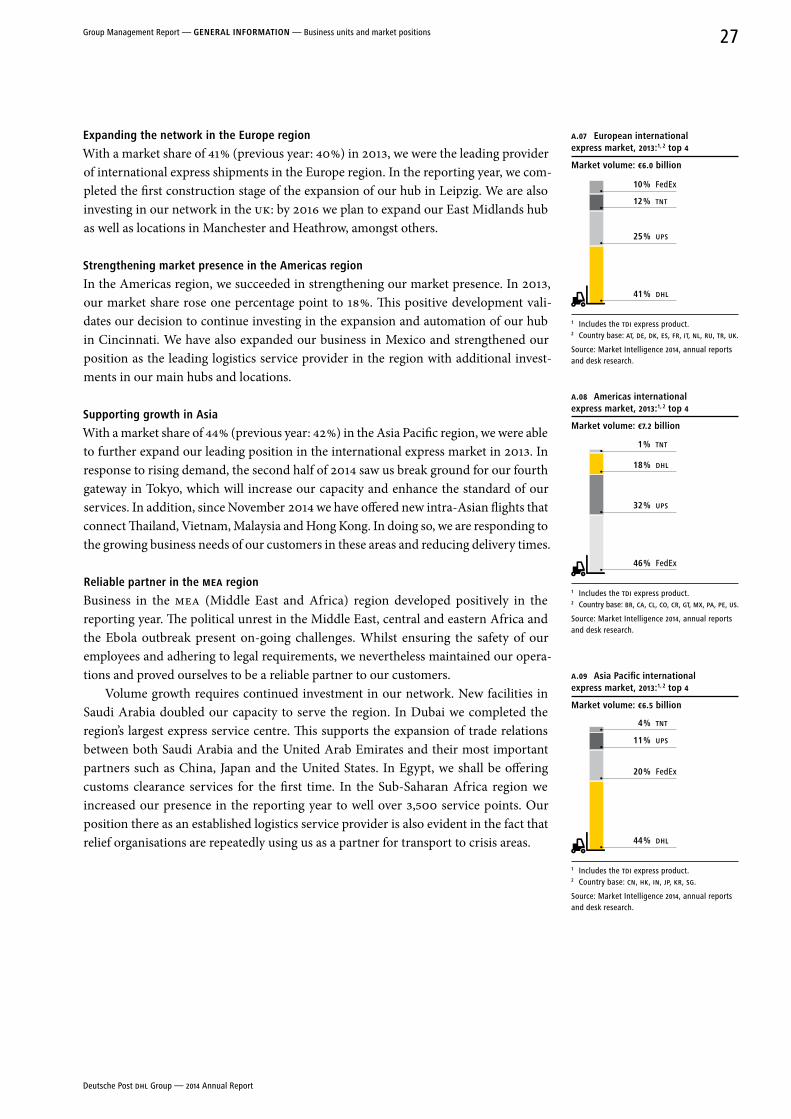
expanding the network in the europe region
With a market share of 41 % (previous year: 40 %) in 2013, we were the leading provider of international express shipments in the Europe region. In the reporting year, we com-pleted the first construction stage of the expansion of our hub in Leipzig. We are also investing in our network in the UK: by 2016 we plan to expand our East Midlands hub as well as locations in Manchester and Heathrow, amongst others.
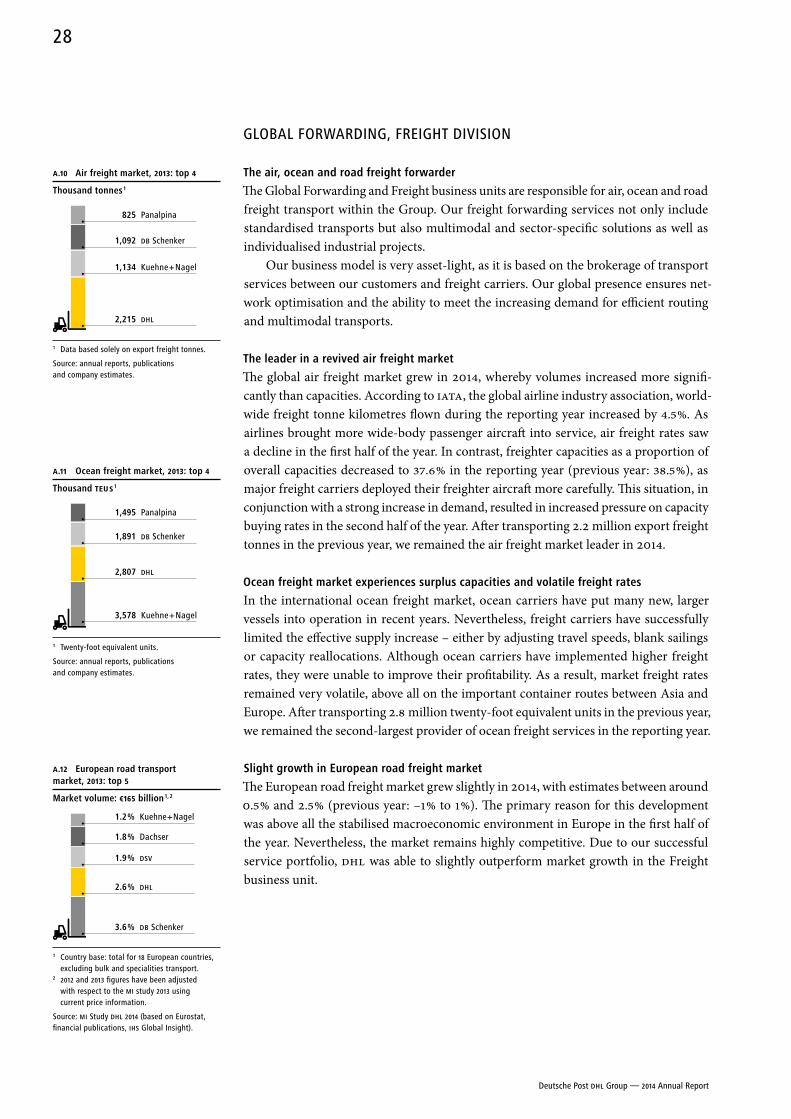
Strengthening market presence in the americas region
In the Americas region, we succeeded in strengthening our market presence. In 2013, our market share rose one percentage point to 18 %. This positive development vali-dates our decision to continue investing in the expansion and automation of our hub in Cincinnati. We have also expanded our business in Mexico and strengthened our position as the leading logistics service provider in the region with additional invest-ments in our main hubs and locations.
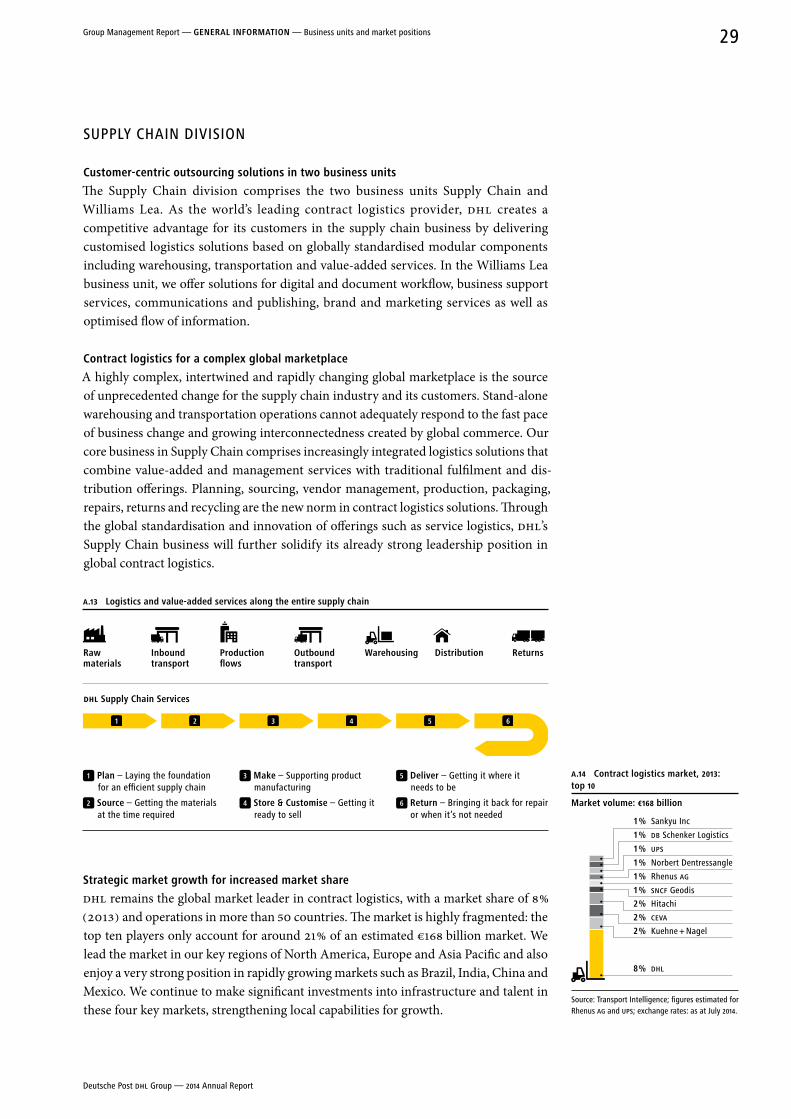
Supporting growth in asia
With a market share of 44 % (previous year: 42 %) in the Asia Pacific region, we were able to further expand our leading position in the international express market in 2013. In response to rising demand, the second half of 2014 saw us break ground for our fourth gateway in Tokyo, which will increase our capacity and enhance the standard of our services. In addition, since November 2014 we have offered new intra-Asian flights that connect Thailand, Vietnam, Malaysia and Hong Kong. In doing so, we are responding to the growing business needs of our customers in these areas and reducing delivery times.
reliable partner in the MEA region
Business in the MEA (Middle East and Africa) region developed positively in the reporting year. The political unrest in the Middle East, central and eastern Africa and the Ebola outbreak present on-going challenges. Whilst ensuring the safety of our employees and adhering to legal requirements, we nevertheless maintained our opera-tions and proved ourselves to be a reliable partner to our customers.
Volume growth requires continued investment in our network. New facilities in Saudi Arabia doubled our capacity to serve the region. In Dubai we completed the region’s largest express service centre. This supports the expansion of trade relations between both Saudi Arabia and the United Arab Emirates and their most important partners such as China, Japan and the United States. In Egypt, we shall be offering customs clearance services for the first time. In the Sub-Saharan Africa region we increased our presence in the reporting year to well over 3,500 service points. Our position there as an established logistics service provider is also evident in the fact that relief organisations are repeatedly using us as a partner for transport to crisis areas.
A.07 european international express market, 2013:1, 2 top 4
Market volume: €6.0 billion
1 Includes the TDI express product.2 Country base: AT, DE, DK, ES, FR, IT, nL, RU, TR, UK.
Source: Market Intelligence 2014, annual reports and desk research.
25 % UPS
12 % TnT
10 % FedEx
41 % DHL
A.08 americas international express market, 2013:1, 2 top 4
Market volume: €7.2 billion
1 Includes the TDI express product.2 Country base: BR, CA, CL, CO, CR, GT, MX, PA, PE, US.
Source: Market Intelligence 2014, annual reports and desk research.
32 % UPS
18 % DHL
1 % TnT
46 % FedEx
A.09 asia Pacific international express market, 2013:1, 2 top 4
Market volume: €6.5 billion
1 Includes the TDI express product.2 Country base: Cn, HK, In, JP, KR, SG.
Source: Market Intelligence 2014, annual reports and desk research.
20 % FedEx
11 % UPS
4 % TnT
44 % DHL
Deutsche Post DHL Group — 2014 Annual Report
27Group Management Report — GeneraL InForMaTIon — Business units and market positions
GLOBAL FORWARDING, FREIGHT DIVISION
The air, ocean and road freight forwarder
The Global Forwarding and Freight business units are responsible for air, ocean and road freight transport within the Group. Our freight forwarding services not only include standardised transports but also multimodal and sector-specific solutions as well as individualised industrial projects.
Our business model is very asset-light, as it is based on the brokerage of transport services between our customers and freight carriers. Our global presence ensures net-work optimisation and the ability to meet the increasing demand for efficient routing and multimodal transports.
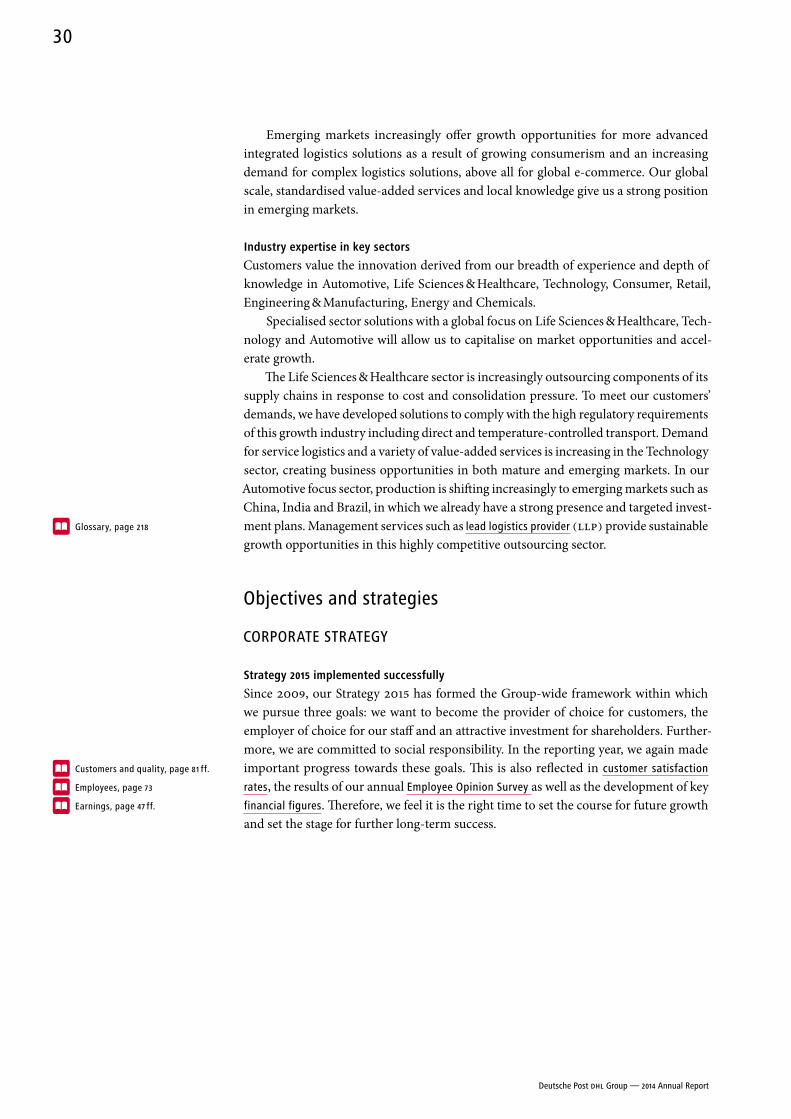
The leader in a revived air freight market
The global air freight market grew in 2014, whereby volumes increased more signifi-cantly than capacities. According to IATA, the global airline industry association, world-wide freight tonne kilometres flown during the reporting year increased by 4.5 %. As airlines brought more wide-body passenger aircraft into service, air freight rates saw a decline in the first half of the year. In contrast, freighter capacities as a proportion of overall capacities decreased to 37.6 % in the reporting year (previous year: 38.5 %), as major freight carriers deployed their freighter aircraft more carefully. This situation, in conjunction with a strong increase in demand, resulted in increased pressure on capacity buying rates in the second half of the year. After transporting 2.2 million export freight tonnes in the previous year, we remained the air freight market leader in 2014.
ocean freight market experiences surplus capacities and volatile freight rates
In the international ocean freight market, ocean carriers have put many new, larger vessels into operation in recent years. Nevertheless, freight carriers have successfully limited the effective supply increase – either by adjusting travel speeds, blank sailings or capacity reallocations. Although ocean carriers have implemented higher freight rates, they were unable to improve their profitability. As a result, market freight rates remained very volatile, above all on the important container routes between Asia and Europe. After transporting 2.8 million twenty-foot equivalent units in the previous year, we remained the second-largest provider of ocean freight services in the reporting year.
Slight growth in european road freight market
The European road freight market grew slightly in 2014, with estimates between around 0.5 % and 2.5 % (previous year: –1 % to 1 %). The primary reason for this development was above all the stabilised macroeconomic environment in Europe in the first half of the year. Nevertheless, the market remains highly competitive. Due to our successful service portfolio, DHL was able to slightly outperform market growth in the Freight business unit.
A.10 air freight market, 2013: top 4
Thousand tonnes 1
1 Data based solely on export freight tonnes.
Source: annual reports, publications and company estimates.
1,134 Kuehne + Nagel
1,092 DB Schenker
825 Panalpina
2,215 DHL
A.11 ocean freight market, 2013: top 4
Thousand TEU s 1
1 Twenty-foot equivalent units.
Source: annual reports, publications and company estimates.
2,807 DHL
1,891 DB Schenker
1,495 Panalpina
3,578 Kuehne + Nagel
A.12 european road transport market, 2013: top 5
Market volume: €165 billion 1, 2
1 Country base: total for 18 European countries, excluding bulk and specialities transport.
2 2012 and 2013 figures have been adjusted with respect to the MI study 2013 using current price information.
Source: MI Study DHL 2014 (based on Eurostat, financial publications, IHS Global Insight).
1.9 % DSV
2.6 % DHL
1.8 % Dachser
1.2 % Kuehne + Nagel
3.6 % DB Schenker
Deutsche Post DHL Group — 2014 Annual Report
28
SUPPLY CHAIN DIVISION
Customer-centric outsourcing solutions in two business units
The Supply Chain division comprises the two business units Supply Chain and Williams Lea. As the world’s leading contract logistics provider, DHL creates a competitive advantage for its customers in the supply chain business by delivering customised logistics solutions based on globally standardised modular components including warehousing, transportation and value-added services. In the Williams Lea business unit, we offer solutions for digital and document workflow, business support services, communications and publishing, brand and marketing services as well as optimised flow of information.
Contract logistics for a complex global marketplace
A highly complex, intertwined and rapidly changing global marketplace is the source of unprecedented change for the supply chain industry and its customers. Stand-alone warehousing and transportation operations cannot adequately respond to the fast pace of business change and growing interconnectedness created by global commerce. Our core business in Supply Chain comprises increasingly integrated logistics solutions that combine value-added and management services with traditional fulfilment and dis-tribution offerings. Planning, sourcing, vendor management, production, packaging, repairs, returns and recycling are the new norm in contract logistics solutions. Through the global standardisation and innovation of offerings such as service logistics, DHL’s Supply Chain business will further solidify its already strong leadership position in global contract logistics.
A.13 Logistics and value-added services along the entire supply chain
raw materials
DistributionProduction flows
returnsInbound transport
outbound transport
Warehousing
DHL Supply Chain Services
1 2 3 54 6
1 Plan – Laying the foundation for an efficient supply chain
2 Source – Getting the materials at the time required
3 Make – Supporting product manufacturing
4 Store & Customise – Getting it ready to sell
5 Deliver – Getting it where it needs to be
6 return – Bringing it back for repair or when it’s not needed
Strategic market growth for increased market share
DHL remains the global market leader in contract logistics, with a market share of 8 % (2013) and operations in more than 50 countries. The market is highly fragmented: the top ten players only account for around 21 % of an estimated €168 billion market. We lead the market in our key regions of North America, Europe and Asia Pacific and also enjoy a very strong position in rapidly growing markets such as Brazil, India, China and Mexico. We continue to make significant investments into infrastructure and talent in these four key markets, strengthening local capabilities for growth.
A.14 Contract logistics market, 2013: top 10
Market volume: €168 billion
Source: Transport Intelligence; figures estimated for Rhenus AG and UPS; exchange rates: as at July 2014.
1 % Norbert Dentressangle
1 % DB Schenker Logistics
1 % UPS
1 % Sankyu Inc
1 % Rhenus AG
1 % SnCF Geodis
2 % Hitachi
2 % CEVA
2 % Kuehne + Nagel
8 % DHL
Deutsche Post DHL Group — 2014 Annual Report
29Group Management Report — GeneraL InForMaTIon — Business units and market positions
Emerging markets increasingly offer growth opportunities for more advanced integrated logistics solutions as a result of growing consumerism and an increasing demand for complex logistics solutions, above all for global e-commerce. Our global scale, standardised value-added services and local knowledge give us a strong position in emerging markets.
Industry expertise in key sectors
Customers value the innovation derived from our breadth of experience and depth of knowledge in Automotive, Life Sciences & Healthcare, Technology, Consumer, Retail, Engineering & Manufacturing, Energy and Chemicals.
Specialised sector solutions with a global focus on Life Sciences & Healthcare, Tech-nology and Automotive will allow us to capitalise on market opportunities and accel-erate growth.
The Life Sciences & Healthcare sector is increasingly outsourcing components of its supply chains in response to cost and consolidation pressure. To meet our customers’ demands, we have developed solutions to comply with the high regulatory requirements of this growth industry including direct and temperature-controlled transport. Demand for service logistics and a variety of value-added services is increasing in the Technology sector, creating business opportunities in both mature and emerging markets. In our Automotive focus sector, production is shifting increasingly to emerging markets such as China, India and Brazil, in which we already have a strong presence and targeted invest-ment plans. Management services such as lead logistics provider (LLP) provide sustainable growth opportunities in this highly competitive outsourcing sector.
Objectives and strategies
CORPORATE STRATEGY
Strategy 2015 implemented successfully
Since 2009, our Strategy 2015 has formed the Group-wide framework within which we pursue three goals: we want to become the provider of choice for customers, the employer of choice for our staff and an attractive investment for shareholders. Further-more, we are committed to social responsibility. In the reporting year, we again made important progress towards these goals. This is also reflected in customer satisfaction
rates, the results of our annual Employee Opinion Survey as well as the development of key financial figures. Therefore, we feel it is the right time to set the course for future growth and set the stage for further long-term success.
Glossary, page 218
Customers and quality, page 81 ff.
Employees, page 73
Earnings, page 47 ff.
Deutsche Post DHL Group — 2014 Annual Report
30
Introducing Strategy 2020: Focus.Connect.Grow.
Announced in April 2014, “Strategy 2020: Focus.Connect.Grow.” underscores Deutsche Post DHL Group’s goal of becoming the company that defines the logistics industry. We have outlined our strategic priorities for the coming years, providing fresh impetus and at the same time continuing on the path we forged with Strategy 2015. We aim to build on these successes and further accelerate our growth.
As a result of the timely preparations we undertook to accommodate changes in the markets and customer needs, our company is equipped to benefit from the numerous opportunities that exist. Some of the most important factors for our business in the future will be increasing digitalisation, accelerated growth in the e-commerce segment and the momentum in developing and emerging countries. Strategy 2020 sets priorities for our investments and actions:
Focus: We concentrate on our core mail and logistics business and continue to pursue our goal of being the provider, employer and investment of choice. We view Deutsche Post DHL Group as a family of divisions, each focused on a well defined market segment. All the while, these divisions are unified through a common understanding of customer needs and linked by Group-wide service units. The divisions work together where it makes sense.
Connect: We are further increasing connectivity within our organisation in order to deliver consistent, first-class service to our customers. A central component of this is Certified, our Group-wide initiative that enables all employees to gain specific skills and knowledge relevant to their roles. It builds upon the Certified International Specialist programme developed by our Express division and aims to certify each and every one of our employees. In addition, we are developing Group-wide co-operation platforms and processes, for example, operational processes and resources, increased digitalisation and leadership development.
Grow: Our Grow pillar encompasses our growth plans, most specifically in e-com-merce and emerging markets. We aim to expand our successful parcel business in Germany and to export its successful model to other countries, both in terms of domestic parcel delivery as well as in other e-commerce-related services. Emerging markets also represent a priority focus. Our general aim is to increase our presence where the long-term growth potential is greatest. By 2020 we shall significantly increase our presence in emerging markets, with the goal of 30 % of Group revenue coming from these economies by the year 2020. During the coming years we shall develop and assess further initiatives intended to accelerate our company’s organic growth.
Our strategy is designed to establish a unique market presence by the year 2020 – both geographically and in terms of our portfolios’ performance. Our aim is to be internationally renowned not only as a highly customer-centric company but also as quality leaders. When people think logistics, we want them to think Deutsche Post DHL Group.
Deutsche Post DHL Group — 2014 Annual Report
31Group Management Report — GeneraL InForMaTIon — Business units and market positions — Objectives and strategies
STRATEGY AND GOALS OF THE DIVISIONS
Strategic priorities of the divisions
The priorities of the operating divisions are anchored in the divisional business strategies. Here, too, our focus is on strengthening our profitability.
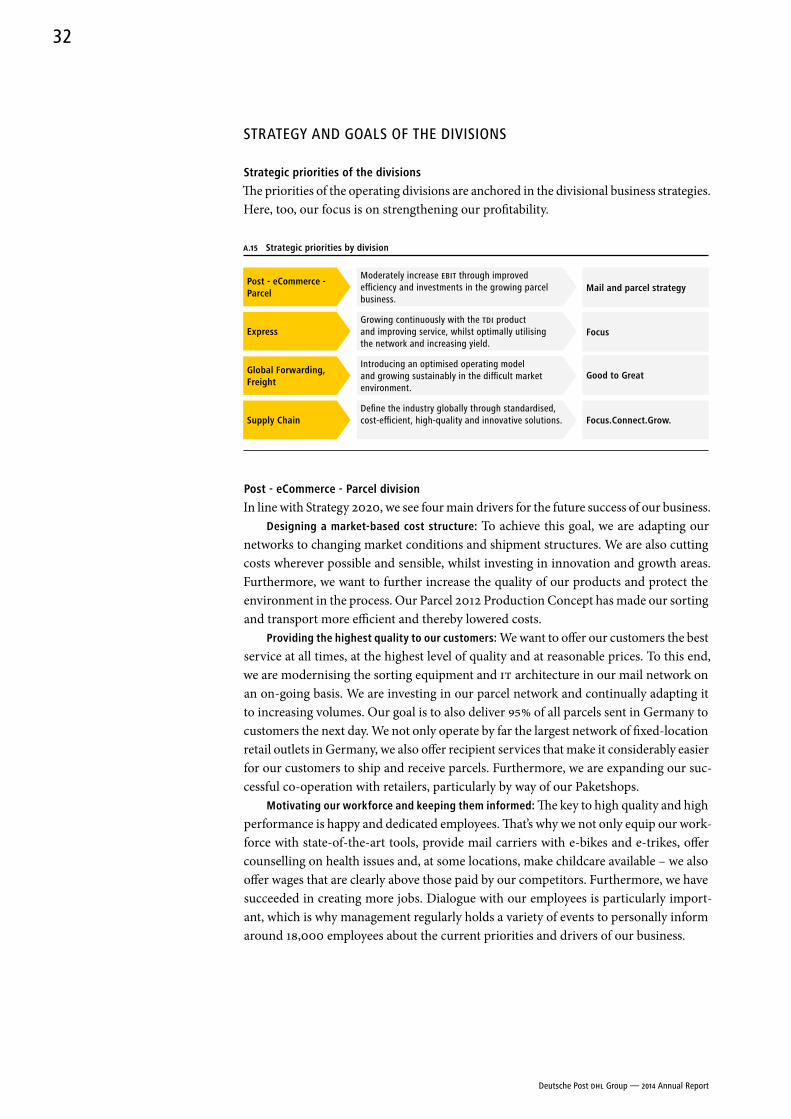
A.15 Strategic priorities by division
Post - eCommerce - Parcel division
In line with Strategy 2020, we see four main drivers for the future success of our business.Designing a market-based cost structure: To achieve this goal, we are adapting our
networks to changing market conditions and shipment structures. We are also cutting costs wherever possible and sensible, whilst investing in innovation and growth areas. Furthermore, we want to further increase the quality of our products and protect the environment in the process. Our Parcel 2012 Production Concept has made our sorting and transport more efficient and thereby lowered costs.
Providing the highest quality to our customers: We want to offer our customers the best service at all times, at the highest level of quality and at reasonable prices. To this end, we are modernising the sorting equipment and IT architecture in our mail network on an on-going basis. We are investing in our parcel network and continually adapting it to increasing volumes. Our goal is to also deliver 95 % of all parcels sent in Germany to customers the next day. We not only operate by far the largest network of fixed- location retail outlets in Germany, we also offer recipient services that make it considerably easier for our customers to ship and receive parcels. Furthermore, we are expanding our suc-cessful co-operation with retailers, particularly by way of our Paketshops.
Motivating our workforce and keeping them informed: The key to high quality and high performance is happy and dedicated employees. That’s why we not only equip our work-force with state-of-the-art tools, provide mail carriers with e-bikes and e-trikes, offer counselling on health issues and, at some locations, make childcare available – we also offer wages that are clearly above those paid by our competitors. Furthermore, we have succeeded in creating more jobs. Dialogue with our employees is particularly import-ant, which is why management regularly holds a variety of events to personally inform around 18,000 employees about the current priorities and drivers of our business.
Mail and parcel strategy
Focus
Good to Great
Focus.Connect.Grow.
Post - eCommerce - Parcel
express
Global Forwarding, Freight
Supply Chain
Moderately increase EBIT through improved efficiency and investments in the growing parcel business.
Growing continuously with the TDI product and improving service, whilst optimally utilising the network and increasing yield.
Introducing an optimised operating model and growing sustainably in the difficult market environment.
Define the industry globally through standardised, cost-efficient, high-quality and innovative solutions.
Deutsche Post DHL Group — 2014 Annual Report
32
Tapping into new online and offline markets: We are taking advantage of our expertise in physical communications to offer effective digital communications. The internet is making it increasingly easy for customers to access our services, allowing them to cal-culate and purchase postage and also locate retail outlets and Packstations online and by mobile device. We are also investing in future growth areas in all our businesses: beyond our E-POST product, we are a leading provider of target-group marketing in digital media, provide advertisers with consistent, cross-media targeting and are the first parcel delivery service in Germany to operate its own shopping portals. By acquiring Allyouneed.com we have established an online supermarket, where together with retail customers we are now piloting same-day food delivery. At MeinPaket.de we offer one of the largest online marketplaces in Germany and we have also taken our expertise in transport and network management into the recently deregulated German coach market with the Postbus. As part of our Strategy 2020, we are working intensively to inter-nationalise the eCommerce - Parcel business unit. In a number of new markets, we in-tend to go beyond delivery services to offer domestic value-added e-commerce services.
EXPRESS division
In line with our strategic programme “Focus”, we have expanded our business, increased our market share and strengthened our margins in recent years. In the reporting year, our focus was on merging all areas to respond more flexibly and effectively to customer requirements and changing economic parameters in the future. This will save costs and enable a more rapid exchange of best practices.
Managing revenue and costs: Our return on sales rises when growing volumes lead to economies of scale in the network, innovation and automation improve productiv-ity and costs are strictly managed. We minimise indirect costs through simplified and standardised processes. For example, we are streamlining our IT system architecture step-by-step whilst paying particular attention to adherence to global standards and quality requirements.
Structuring sales and prices: Using global campaigns, we specifically target small and medium-sized businesses, which could benefit the most from increasing export. We concentrate upon items whose size and weight optimally match our network and thereby create economies of scale. In terms of our pricing policy, we encourage global co- ordination and discipline. At the same time we also work to continuously improve our customer approach. Our Insanely Customer Centric Culture programme is intended to resolve problems more quickly and meet customer expectations more effectively.
Managing the network: Most of our costs are attributable to the air and ground net-work. We replace aeroplanes with newer, more efficient, and thus more cost-effective air-craft. We sell available cargo space to freight and forwarding companies, especially DHL Global Forwarding, improving our network utilisation and reducing costs in the process. On the ground, we are automating and standardising processes. For example, vehicles are equipped by default with shelves and can be loaded directly from the conveyor belt. We also plan our pickup and delivery routes to maximise time and cost savings.
Customers and quality, page 82
Deutsche Post DHL Group — 2014 Annual Report
33Group Management Report — GeneraL InForMaTIon — Objectives and strategies
Motivating our workforce: Our proven Certified International Specialist (CIS) train-ing programme ensures that our employees have the requisite knowledge of the inter-national express business at their disposal. Training is carried out in each function as well as on a cross-functional basis delivered by our own employees, some of whom are executives. This adds to mutual understanding whilst reinforcing a team atmosphere and loyalty within the division. The modules under the Certified International Manager (CIM) umbrella are for managers and are intended to strengthen the unified leadership culture within the division. We want to sustainedly motivate our employees around the world. Systematic and continuous recognition of outstanding performance is one way of contributing to this.
GLOBAL FORWARDING, FREIGHT division
With our global product offering in air and ocean freight as well as in overland transport, we aim to achieve growth that exceeds the market average and consolidate our leading position. To achieve this goal, we are continuously expanding our product and service portfolio and improving our internal processes.
expanding product and service portfolio: In the Global Forwarding business unit, we are expanding the geographical coverage of our multimodal transport services, for example, in Asia. Our offering covers the production and commercial centres of Shang-hai and Suzhou in northern China, and the western city of Chengdu, which is one of the main distribution centres and a hub for the high-tech sector and the automobile industry. Since the beginning of 2014, we have offered the first temperature-controlled rail service between China and Europe. Our new Railconnect service allows companies of all sizes to better manage their inventory flows by dispatching shipments in smaller consignments. In the overland transport business, our daily Eurapid service provides fast, reliable and day-definite deliveries to Europe’s major markets. The number of par-ticipating terminals doubled in the reporting year from 25 to 50.
Simplifying and standardising processes: With our strategic project New Forwarding Environ ment (NFE), we are gradually introducing a forward-looking operating model with efficient processes and state-of-the-art IT systems, which is intended to under-pin our position as industry leader. NFE will allow us to manage our processes better, standardise products and offer modular services. In future we intend to have a globally harmonised and unified organisation with dedicated customer service, which will allow customers to benefit from shorter response times. The new structure is also better tailored to the needs of our customers’ products and ultimately delivers targeted, item- specific information. We are increasing the transparency and quality of data for sales volumes, customer figures, capacities, operations and freight. In the reporting year, NFE was put into operation in additional countries. We intend to implement it throughout the entire Global Forwarding business unit.
SUPPLY CHAIN division
We intend to define our industry globally through standardised, cost-efficient, high- quality and innovative solutions. To achieve this whilst increasing our profitability, we reviewed our business in the reporting year and defined a strategic framework with nine initiatives and four supporting activities. In line with our Group strategy, our approach is built on the three pillars of “Focus”, “Connect” and “Grow”.
Deutsche Post DHL Group — 2014 Annual Report
34
Our Focus agenda is aimed at increasing our efficiency and quality through stand-ardisation and reducing complexity. We intend to adopt best-in-class operating stand-ards and roll them out worldwide. We also aim to establish a globally harmonised process to enable innovative and customer-centric solutions. By applying First Choice methodology and our best-practice solutions, we expect to improve our operational performance.
The Connect pillar is about connecting our people and processes to achieve efficiency gains on a global scale. A lean management structure and the use of shared service centres will improve our cost structure and establish industry-wide best-in-class functions. To accompany these organisational changes, we are training our staff using the Certified Supply Chain Specialist (CSCS) programme which is based upon a proven approach that was applied successfully by the Express division.
Finally, the Grow pillar focuses on shifting our portfolio to address those market segments that offer the most potential for higher profitability and stronger growth. The inclusion of more value-added services in our portfolio will help drive this shift. Likewise, a pivot towards global business models for key sectors, such as Life Science & Healthcare, will help accelerate future growth.
Group management
FINANCIAL PERFORMANCE INDICATORS
Impact on management compensation
Deutsche Post DHL Group uses both financial and non-financial performance indicators in its management of the Group. The monthly, quarterly and annual changes in these indicators are compared with the data from the prior year as well as the data indicated in the plan to assist in making management decisions. The year-to-year changes in financial and non-financial performance metrics portrayed here are also relevant for calculating management remuneration.
The Group’s financial performance indicators are intended to preserve a balance between profitability, efficient use of resources and sufficient liquidity. The performance of these indicators in the reporting year is described in the Report on economic position.
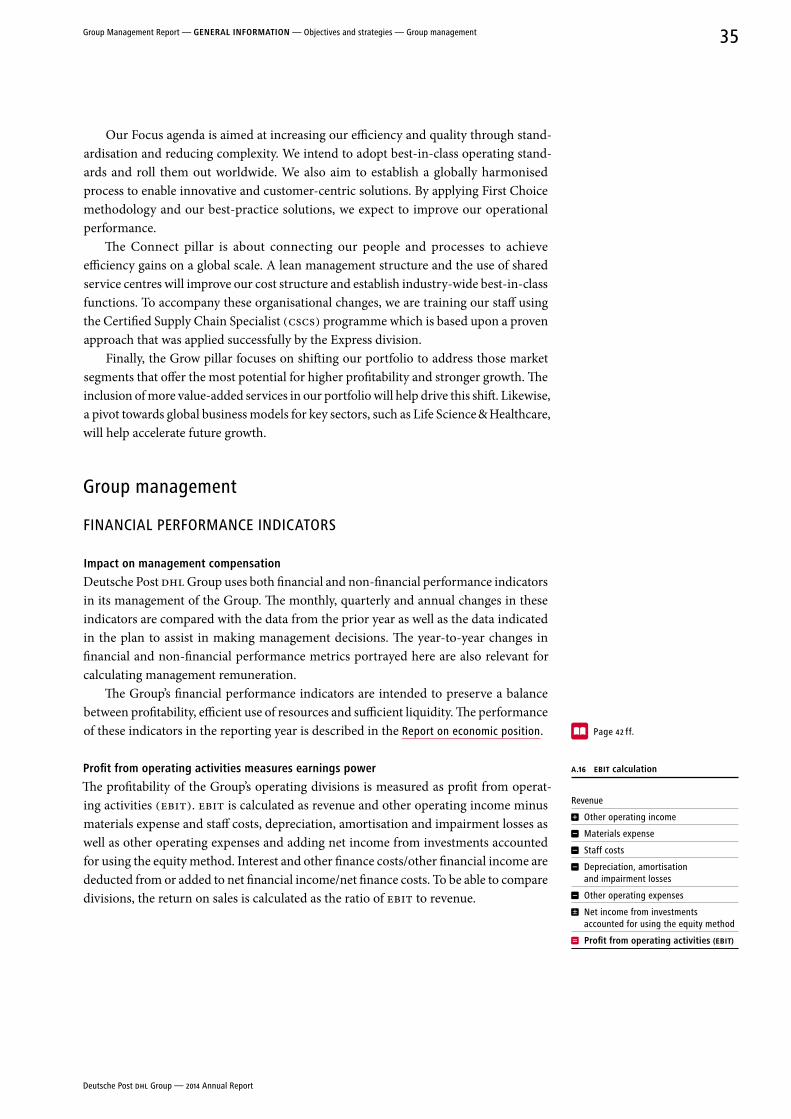
Profit from operating activities measures earnings power
The profitability of the Group’s operating divisions is measured as profit from operat-ing activities (EBIT). EBIT is calculated as revenue and other operating income minus materials expense and staff costs, depreciation, amortisation and impairment losses as well as other operating expenses and adding net income from investments accounted for using the equity method. Interest and other finance costs/other financial income are deducted from or added to net financial income/net finance costs. To be able to compare divisions, the return on sales is calculated as the ratio of EBIT to revenue.
Page 42 ff.
A.16 EBIT calculation
Revenue
Other operating income
Materials expense
Staff costs
Depreciation, amortisation and impairment losses
Other operating expenses
Net income from investments accounted for using the equity method
Profit from operating activities (EBIT)
Deutsche Post DHL Group — 2014 Annual Report
35Group Management Report — GeneraL InForMaTIon — Objectives and strategies — Group management
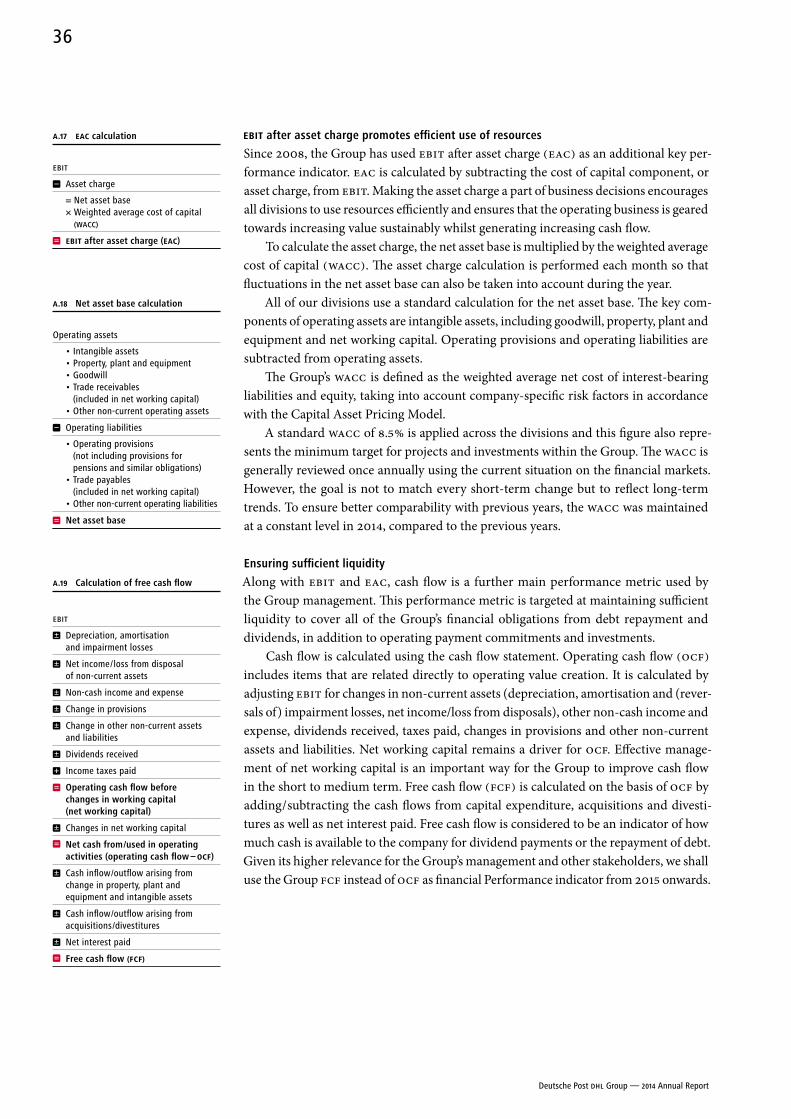
EBIT after asset charge promotes efficient use of resources
Since 2008, the Group has used EBIT after asset charge (EAC) as an additional key per-formance indicator. EAC is calculated by subtracting the cost of capital component, or asset charge, from EBIT. Making the asset charge a part of business decisions encourages all divisions to use resources efficiently and ensures that the operating business is geared towards increasing value sustainably whilst generating increasing cash flow.
To calculate the asset charge, the net asset base is multiplied by the weighted average cost of capital (WACC). The asset charge calculation is performed each month so that fluctuations in the net asset base can also be taken into account during the year.
All of our divisions use a standard calculation for the net asset base. The key com-ponents of operating assets are intangible assets, including goodwill, property, plant and equipment and net working capital. Operating provisions and operating liabilities are subtracted from operating assets.
The Group’s WACC is defined as the weighted average net cost of interest-bearing liabilities and equity, taking into account company-specific risk factors in accordance with the Capital Asset Pricing Model.
A standard WACC of 8.5 % is applied across the divisions and this figure also repre-sents the minimum target for projects and investments within the Group. The WACC is generally reviewed once annually using the current situation on the financial markets. However, the goal is not to match every short-term change but to reflect long-term trends. To ensure better comparability with previous years, the WACC was maintained at a constant level in 2014, compared to the previous years.
ensuring sufficient liquidity
Along with EBIT and EAC, cash flow is a further main performance metric used by the Group management. This performance metric is targeted at maintaining sufficient liquidity to cover all of the Group’s financial obligations from debt repayment and dividends, in addition to operating payment commitments and investments.
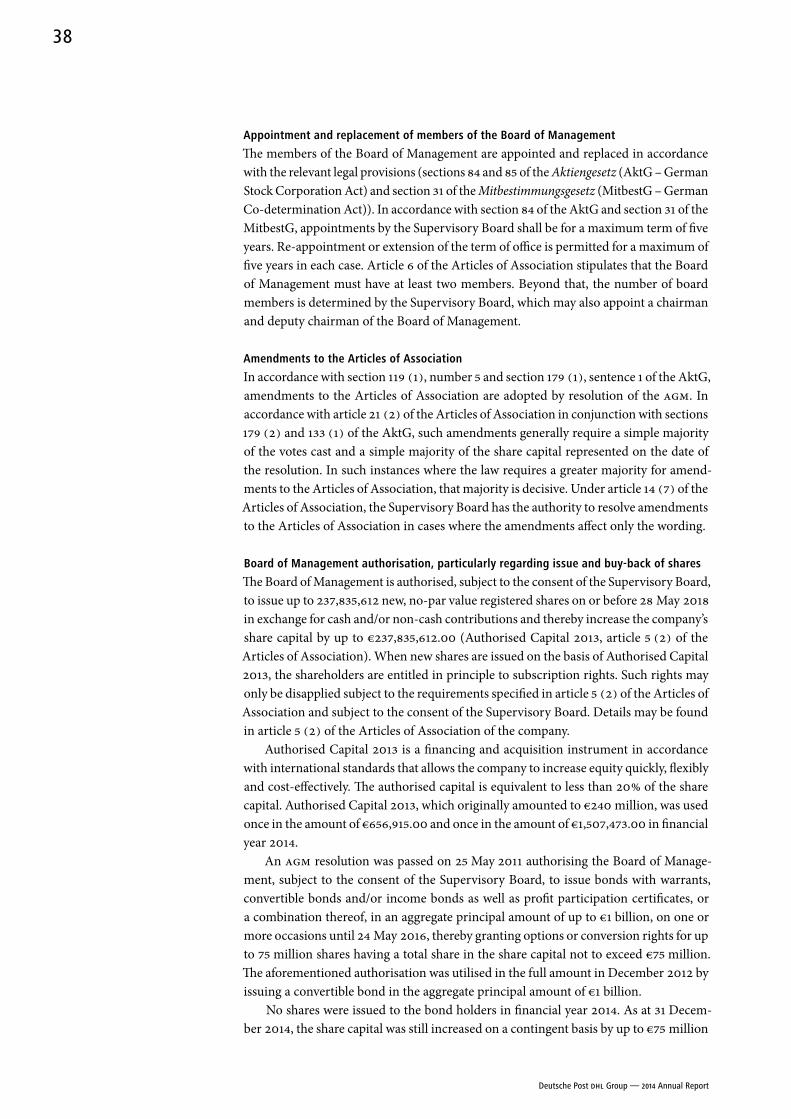
Cash flow is calculated using the cash flow statement. Operating cash flow (OCF) includes items that are related directly to operating value creation. It is calculated by adjusting EBIT for changes in non-current assets (depreciation, amortisation and (rever-sals of) impair ment losses, net income/loss from disposals), other non-cash income and expense, dividends received, taxes paid, changes in provisions and other non-current assets and liabilities. Net working capital remains a driver for OCF. Effective manage-ment of net working capital is an important way for the Group to improve cash flow in the short to medium term. Free cash flow (FCF) is calculated on the basis of OCF by adding / subtracting the cash flows from capital expenditure, acquisitions and divesti-tures as well as net interest paid. Free cash flow is considered to be an indicator of how much cash is available to the company for dividend payments or the repayment of debt. Given its higher relevance for the Group’s management and other stakeholders, we shall use the Group FCF instead of OCF as financial Performance indicator from 2015 onwards.
A.17 EAC calculation
EBIT
Asset charge
= Net asset base × Weighted average cost of capital
(WACC)
EBIT after asset charge (EAC)
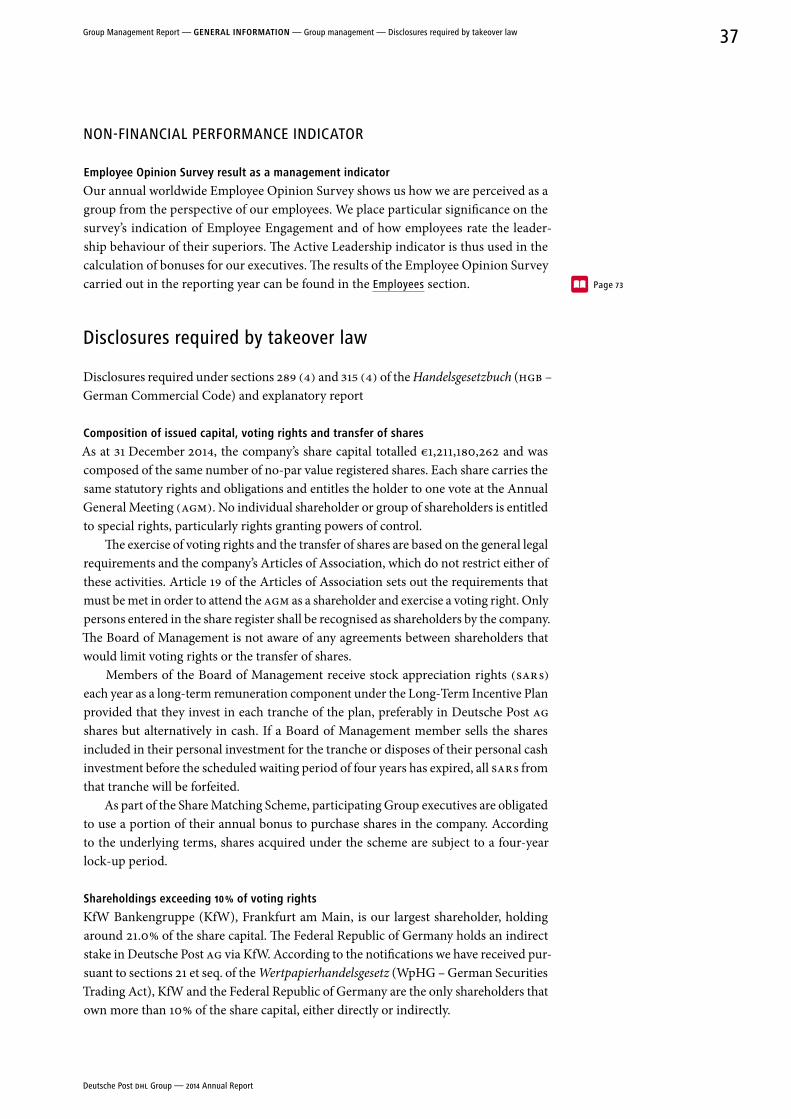
A.18 net asset base calculation
Operating assets
• Intangible assets• Property, plant and equipment• Goodwill• Trade receivables
( included in net working capital)• Other non-current operating assets
Operating liabilities
• Operating provisions (not including provisions for pensions and similar obligations)
• Trade payables ( included in net working capital)
• Other non-current operating liabilities
net asset base
A.19 Calculation of free cash flow
EBIT
Depreciation, amortisation and impairment losses
Net income / loss from disposal of non-current assets
Non-cash income and expense
Change in provisions
Change in other non-current assets and liabilities
Dividends received
Income taxes paid
operating cash flow before changes in working capital (net working capital)
Changes in net working capital
net cash from /used in operating activities (operating cash flow – OCF)
Cash inflow /outflow arising from change in property, plant and equipment and intangible assets
Cash inflow /outflow arising from acquisitions /divestitures
Net interest paid
Free cash flow (FCF)
Deutsche Post DHL Group — 2014 Annual Report
36
NON-FINANCIAL PERFORMANCE INDICATOR
employee opinion Survey result as a management indicator
Our annual worldwide Employee Opinion Survey shows us how we are perceived as a group from the perspective of our employees. We place particular significance on the survey’s indication of Employee Engagement and of how employees rate the leader-ship behaviour of their superiors. The Active Leadership indicator is thus used in the calculation of bonuses for our executives. The results of the Employee Opinion Survey carried out in the reporting year can be found in the Employees section.
Disclosures required by takeover law
Disclosures required under sections 289 (4) and 315 (4) of the Handelsgesetzbuch (HGB – German Commercial Code) and explanatory report
Composition of issued capital, voting rights and transfer of shares
As at 31 December 2014, the company’s share capital totalled €1,211,180,262 and was composed of the same number of no-par value registered shares. Each share carries the same statutory rights and obligations and entitles the holder to one vote at the Annual General Meeting (AGM). No individual shareholder or group of shareholders is entitled to special rights, particularly rights granting powers of control.
The exercise of voting rights and the transfer of shares are based on the general legal requirements and the company’s Articles of Association, which do not restrict either of these activities. Article 19 of the Articles of Association sets out the requirements that must be met in order to attend the AGM as a shareholder and exercise a voting right. Only persons entered in the share register shall be recognised as shareholders by the company. The Board of Management is not aware of any agreements between shareholders that would limit voting rights or the transfer of shares.
Members of the Board of Management receive stock appreciation rights (SAR s) each year as a long-term remuneration component under the Long-Term Incentive Plan provided that they invest in each tranche of the plan, preferably in Deutsche Post AG shares but alternatively in cash. If a Board of Management member sells the shares included in their personal investment for the tranche or disposes of their personal cash investment before the scheduled waiting period of four years has expired, all SAR s from that tranche will be forfeited.
As part of the Share Matching Scheme, participating Group executives are obligated to use a portion of their annual bonus to purchase shares in the company. According to the underlying terms, shares acquired under the scheme are subject to a four-year lock-up period.
Shareholdings exceeding 10 % of voting rights
KfW Bankengruppe (KfW), Frankfurt am Main, is our largest shareholder, holding around 21.0 % of the share capital. The Federal Republic of Germany holds an indirect stake in Deutsche Post AG via KfW. According to the notifications we have received pur-suant to sections 21 et seq. of the Wertpapierhandelsgesetz (WpHG – German Securities Trading Act), KfW and the Federal Republic of Germany are the only shareholders that own more than 10 % of the share capital, either directly or indirectly.
Page 73
Deutsche Post DHL Group — 2014 Annual Report
37Group Management Report — GeneraL InForMaTIon — Group management — Disclosures required by takeover law
appointment and replacement of members of the Board of Management
The members of the Board of Management are appointed and replaced in accordance with the relevant legal provisions (sections 84 and 85 of the Aktiengesetz (AktG – German Stock Corporation Act) and section 31 of the Mitbestimmungsgesetz (MitbestG – German Co-determination Act)). In accordance with section 84 of the AktG and section 31 of the MitbestG, appointments by the Supervisory Board shall be for a maximum term of five years. Re-appointment or extension of the term of office is permitted for a maximum of five years in each case. Article 6 of the Articles of Association stipulates that the Board of Management must have at least two members. Beyond that, the number of board members is determined by the Supervisory Board, which may also appoint a chairman and deputy chairman of the Board of Management.
amendments to the articles of association
In accordance with section 119 (1), number 5 and section 179 (1), sentence 1 of the AktG, amendments to the Articles of Association are adopted by resolution of the AGM. In accordance with article 21 (2) of the Articles of Association in conjunction with sections 179 (2) and 133 (1) of the AktG, such amendments generally require a simple majority of the votes cast and a simple majority of the share capital represented on the date of the resolution. In such instances where the law requires a greater majority for amend-ments to the Articles of Association, that majority is decisive. Under article 14 (7) of the Articles of Association, the Supervisory Board has the authority to resolve amendments to the Articles of Association in cases where the amendments affect only the wording.
Board of Management authorisation, particularly regarding issue and buy-back of shares
The Board of Management is authorised, subject to the consent of the Supervisory Board, to issue up to 237,835,612 new, no-par value registered shares on or before 28 May 2018 in exchange for cash and/or non-cash contributions and thereby increase the company’s share capital by up to €237,835,612.00 (Authorised Capital 2013, article 5 (2) of the Articles of Association). When new shares are issued on the basis of Authorised Capital 2013, the shareholders are entitled in principle to subscription rights. Such rights may only be disapplied subject to the requirements specified in article 5 (2) of the Articles of Association and subject to the consent of the Supervisory Board. Details may be found in article 5 (2) of the Articles of Association of the company.
Authorised Capital 2013 is a financing and acquisition instrument in accordance with international standards that allows the company to increase equity quickly, flexibly and cost-effectively. The authorised capital is equivalent to less than 20 % of the share capital. Authorised Capital 2013, which originally amounted to €240 million, was used once in the amount of €656,915.00 and once in the amount of €1,507,473.00 in financial year 2014.
An AGM resolution was passed on 25 May 2011 authorising the Board of Manage-ment, subject to the consent of the Supervisory Board, to issue bonds with warrants, convertible bonds and/or income bonds as well as profit participation certificates, or a combination thereof, in an aggregate principal amount of up to €1 billion, on one or more occasions until 24 May 2016, thereby granting options or conversion rights for up to 75 million shares having a total share in the share capital not to exceed €75 million. The aforementioned authorisation was utilised in the full amount in December 2012 by issuing a convertible bond in the aggregate principal amount of €1 billion.
No shares were issued to the bond holders in financial year 2014. As at 31 Decem-ber 2014, the share capital was still increased on a contingent basis by up to €75 million
Deutsche Post DHL Group — 2014 Annual Report
38
in order to grant shares to the holders or creditors of the options, conversion rights or conversion obligations arising from the resolution of 25 May 2011 after exercise of their rights for the purpose of settling the entitlements related to the options or rights or fulfilling the conversion obligations (Contingent Capital 2011, article 5 (3) of the Articles of Association).
An AGM resolution was passed on 29 May 2013 authorising the Board of Manage-ment, subject to the consent of the Supervisory Board, to issue bonds with warrants, convertible bonds and/or income bonds as well as profit participation certificates, or a combination thereof (hereinafter referred to collectively as “bonds”), in an aggregate principal amount of up to €1.5 billion, on one or more occasions until 28 May 2018, thereby granting options or conversion rights for up to 75 million shares with a total share in the share capital not exceeding €75 million. The bond conditions may also stipulate an obligation to exercise options or conversion rights or may entitle the com-pany to grant the bond holders or creditors shares in the company in lieu of payment of all or part of the sum of money owed, either at the time of maturity of the bonds or at another time. The share capital is increased on a contingent basis by up to €75 million in order to grant shares to the holders or creditors of the bonds after exercise of their options or conversion rights or to fulfil their option or conversion obligations, or to grant them shares in lieu of monetary payment (Contingent Capital 2013, article 5 (4) of the Articles of Association). When issuing bonds, subscription rights may only be disapplied subject to the terms of the aforementioned resolution and subject to the consent of the Supervisory Board. Further details may be found in the motion adopted by the AGM under agenda item 7 of the AGM of 29 May 2013.
Authorisation to issue bonds is standard practice amongst publicly listed companies. This allows the company to finance its activities flexibly and promptly and gives it the financial leeway necessary to take advantage of favourable market conditions at short notice, for example by offering bonds with options or conversion rights, or conversion obligations on shares in the company as a consideration within the context of company mergers, and when acquiring companies or shareholdings in companies. To date, the Board of Management has not exercised this authority.
An AGM resolution was passed on 27 May 2014 authorising the Board of Manage-ment to issue up to 40 million performance share units with pre-emptive subscription rights to a total of up to 40 million shares with a total share in the share capital not exceeding €40 million, subject to the provisions of the authorisation resolution, on or before 26 May 2019 to members of the management of entities in which the company is the majority shareholder and to executives of the company and the entities in which it is a majority shareholder. The performance share units may also be issued by entities in which the company is the majority shareholder with the consent of the Board of Management. The issue of shares arising from the subscription rights associated with the performance share units depends upon certain performance targets being met after expiry of a four-year waiting period, with it being possible to issue up to four shares for every six subscription rights granted, if and insofar as performance targets for the share price, which have been specified in detail, are met, and up to two shares if and insofar as certain outperformance targets based on the percentage change of the STOXX Europe 600 Index are met. The share capital is increased on a contingent basis by up to €40 mil-lion in order to grant shares in the company to the executives entitled to subscription rights, in accordance with the provisions of the authorisation resolution (Contingent Capital 2014, article 5 (5) of the Articles of Association). Further details may be found in the motion adopted by the AGM under agenda item 8 of the AGM of 27 May 2014.
Deutsche Post DHL Group — 2014 Annual Report
39Group Management Report — GeneraL InForMaTIon — Disclosures required by takeover law
The Performance Share Plan is intended to replace the programme established in 2006 to provide long-term incentive to executives by issuing stock appreciation rights (SAR s).
Finally, the AGM of 27 May 2014 authorised the company to buy back shares on or before 26 May 2019 up to an amount not to exceed 10 % of the share capital existing as at the date of the resolution. Such authorisation is subject to the proviso that at no time should the shares thus acquired, together with the shares already held by the company, account for more than 10 % of the share capital. The shares may be purchased through the stock market, a public offer, a public call for offers of sale from the company’s share-holders or by some other means in accordance with section 53 a of the AktG. The shares purchased may be used for any legally permissible purpose. In addition to a sale via the stock exchange or by public offer to all shareholders, it is permitted in particular to use the shares with pre-emptive shareholder subscription rights disapplied in accordance with the provisions of the authorisation resolution or to call in the shares without an additional resolution of the Annual General Meeting. Further details may be found in the motion adopted by the AGM under agenda item 6 of the AGM of 27 May 2014.
In addition to this, the AGM of 27 May 2014 also authorised the Board of Manage-ment, within the scope specified in agenda item 6, to acquire treasury shares, including through the use of derivatives. This is to occur by servicing options that, upon their exercise, require the company to acquire treasury shares (put options), by exercising options that, upon their exercise, grant the company the right to acquire treasury shares (call options), as a result of purchase agreements where there are more than two trading days between conclusion of the purchase agreement for Deutsche Post shares and ser-vicing by way of the delivery of Deutsche Post shares (forward purchases) or by servicing or exercising a combination of put options, call options and/or forward purchases. All share acquisitions using the aforementioned derivatives are limited to a maximum of 5 % of the share capital existing on the date of the resolution. The term of the individual derivatives may not exceed 18 months, must expire by no later than 26 May 2019 and be selected such that treasury shares may not be acquired by exercising the derivatives after 26 May 2019. Further details may be found in the motion adopted by the AGM under agenda item 7 of the AGM of 27 May 2014.
It is standard business practice amongst publicly listed companies in Germany for the AGM to authorise the company to buy back shares. The authorisation to repurchase shares using derivatives is merely intended to supplement share buy-back as a tool and give the company the opportunity to structure share repurchase in an advantageous manner.
Any public offer to acquire shares in the company is governed solely by law and the Articles of Association, including the provisions of the Wertpapiererwerbs- und Über-nahmegesetz (WpÜG – German Securities Acquisition and Takeover Act). The AGM has not authorised the Board of Management to undertake actions within its sphere of competence to block possible takeover bids.
Significant agreements that are conditional upon a change of control
following a takeover bid and agreements with members of the Board of Management
or employees providing for compensation in the event of a change of control
Deutsche Post AG took out a syndicated credit facility with a volume of €2 billion from a consortium of banks. If a change of control within the meaning of the contract occurs, each member of the bank consortium is entitled under certain conditions to cancel its share of the credit line as well as its share of outstanding loans and request repayment.
Deutsche Post DHL Group — 2014 Annual Report
40
The terms and conditions of the bonds issued under the Debt Issuance Programme established in March 2012 and of the convertible bond issued in December 2012 also contain change of control clauses. In case of a change of control within the meaning of the terms and conditions, creditors are, under certain conditions, granted the right to demand early redemption of the respective bonds. Furthermore, a framework agree-ment exists concerning the supply of fuel, based on which fuel in the value of a high double-digit million amount was obtained in the reporting year and which, in case of a change of control, grants the supplier the right to bring the business relationship to a close without notice.
In the event of a change in control, any member of the Board of Management is entitled to resign their office for good cause within a period of six months following the change in control, after giving three months’ notice at the end of a given month, and to terminate their Board of Management contract (right to early termination). In the event the right to early termination is exercised or a Board of Management contract is terminated by mutual consent within nine months of the change of control, the Board of Management member is entitled to payment to compensate the remaining term of their Board of Management contract. Such payment is limited to the cap pursuant to the recommendation of No. 4.2.3 of the German Corporate Governance Code, with the specification outlined in the remuneration report. With respect to options from the Long-Term Incentive Plan, the Board of Management member will be treated as if the waiting period for all options had already expired upon cessation of the Board of Management contract. The options eligible for exercise may then be exercised within six months of cessation of the contract. With regard to the Share Matching Scheme for executives, the holding period for the shares will become invalid with immediate effect in the event of a change of control of the company. In any such case, the employer will be responsible for any tax disadvantages resulting from reduction of the holding period. Exempt from this are taxes normally incurred after the holding period.
Remuneration of the Board of Management and the Supervisory Board
The basic features of the remuneration system for the Board of Management and the Super visory Board are described in the Corporate Governance Report under Remuner-
ation report. The latter also forms part of the Group Management Report.
Research and development
As a service provider, the Group does not engage in research and development activ-ities in the narrower sense and therefore has no significant expenses to report in this connection.
Corporate Governance, page 117 ff.
Deutsche Post DHL Group — 2014 Annual Report
41Group Management Report — GeneraL InForMaTIon — Disclosures required by takeover law — Remuneration of the Board of Management and the Supervisory Board — Research and development
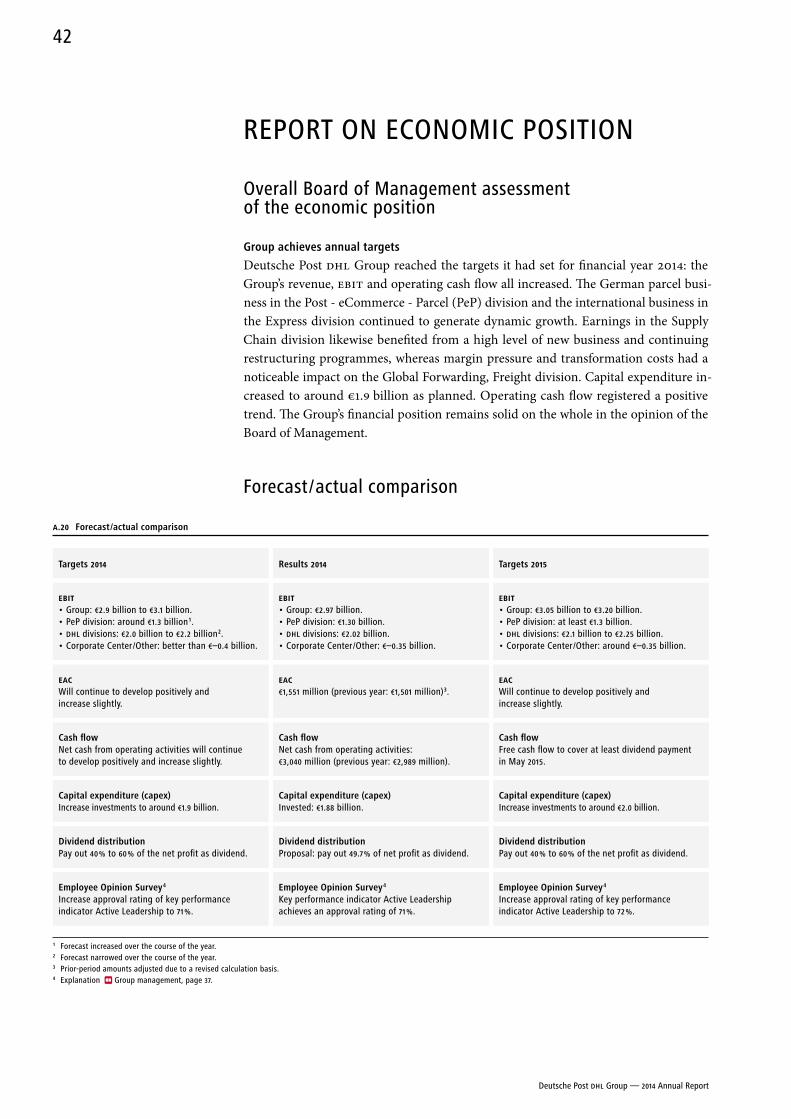
REPORT ON ECONOMIC POSITION
Overall Board of Management assessment of the economic position
Group achieves annual targets
Deutsche Post DHL Group reached the targets it had set for financial year 2014: the Group’s revenue, EBIT and operating cash flow all increased. The German parcel busi-ness in the Post - eCommerce - Parcel (PeP) division and the international business in the Express division continued to generate dynamic growth. Earnings in the Supply Chain division likewise benefited from a high level of new business and continuing restructuring programmes, whereas margin pressure and transformation costs had a noticeable impact on the Global Forwarding, Freight division. Capital expenditure in-creased to around €1.9 billion as planned. Operating cash flow registered a positive trend. The Group’s financial position remains solid on the whole in the opinion of the Board of Management.
Forecast / actual comparison
A.20 Forecast /actual comparison
Targets 2014 results 2014 Targets 2015
EBIT• Group: €2.9 billion to €3.1 billion.• PeP division: around €1.3 billion 1.• DHL divisions: €2.0 billion to €2.2 billion 2.• Corporate Center /Other: better than €–0.4 billion.
EBIT• Group: €2.97 billion.• PeP division: €1.30 billion.• DHL divisions: €2.02 billion.• Corporate Center /Other: €–0.35 billion.
EBIT• Group: €3.05 billion to €3.20 billion.• PeP division: at least €1.3 billion.• DHL divisions: €2.1 billion to €2.25 billion.• Corporate Center /Other: around €–0.35 billion.
EACWill continue to develop positively and increase slightly.
EAC€1,551 million (previous year: €1,501 million) 3.
EACWill continue to develop positively and increase slightly.
Cash flowNet cash from operating activities will continue to develop positively and increase slightly.
Cash flowNet cash from operating activities: €3,040 million (previous year: €2,989 million).
Cash flowFree cash flow to cover at least dividend payment in May 2015.
Capital expenditure (capex)Increase investments to around €1.9 billion.
Capital expenditure (capex)Invested: €1.88 billion.
Capital expenditure (capex)Increase investments to around €2.0 billion.
Dividend distributionPay out 40 % to 60 % of the net profit as dividend.
Dividend distributionProposal: pay out 49.7 % of net profit as dividend.
Dividend distributionPay out 40 % to 60 % of the net profit as dividend.
employee opinion Survey 4
Increase approval rating of key performance indicator Active Leadership to 71 %.
employee opinion Survey 4
Key performance indicator Active Leadership achieves an approval rating of 71 %.
employee opinion Survey 4
Increase approval rating of key performance indicator Active Leadership to 72 %.
1 Forecast increased over the course of the year.2 Forecast narrowed over the course of the year.3 Prior-period amounts adjusted due to a revised calculation basis.4 Explanation Group management, page 37.
Deutsche Post DHL Group — 2014 Annual Report
42
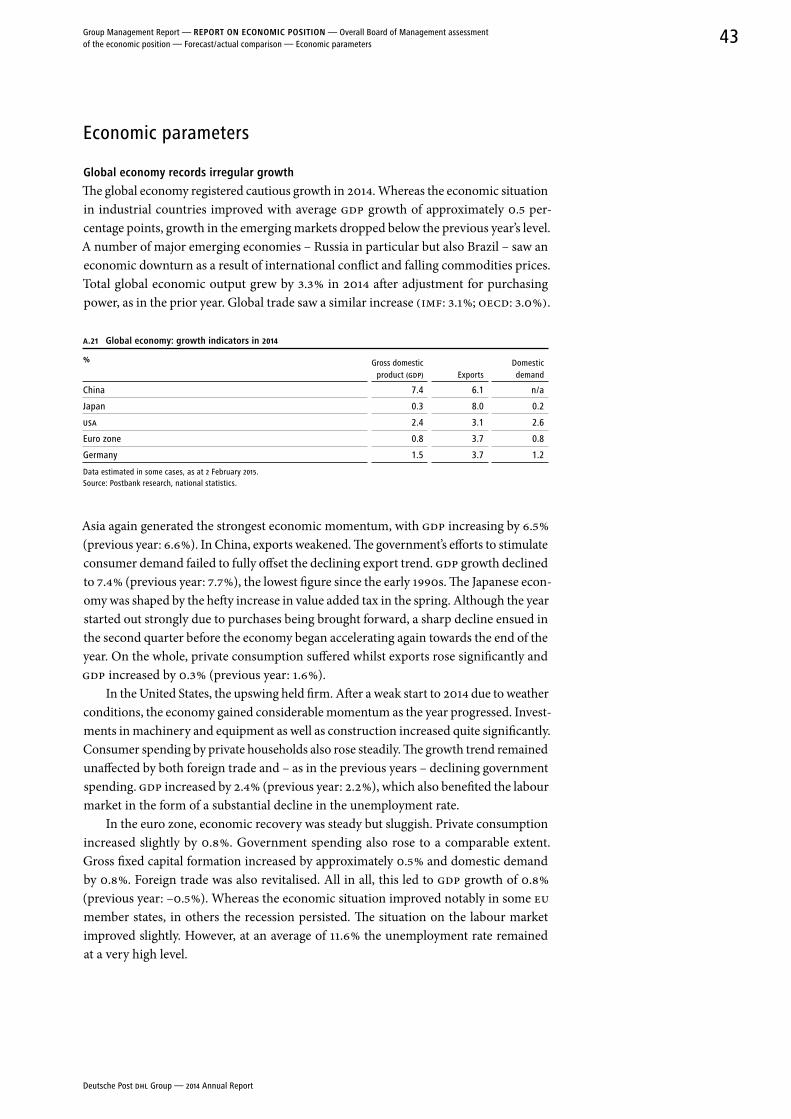
Economic parameters
Global economy records irregular growth
The global economy registered cautious growth in 2014. Whereas the economic situation in industrial countries improved with average GDP growth of approximately 0.5 per-centage points, growth in the emerging markets dropped below the previous year’s level. A number of major emerging economies – Russia in particular but also Brazil – saw an economic downturn as a result of international conflict and falling commodities prices. Total global economic output grew by 3.3 % in 2014 after adjustment for purchasing power, as in the prior year. Global trade saw a similar increase (IMF: 3.1 %; OECD: 3.0 %).
A.21 Global economy: growth indicators in 2014
% Gross domestic product (GDP) Exports
Domestic demand
China 7.4 6.1 n / a
Japan 0.3 8.0 0.2
USA 2.4 3.1 2.6
Euro zone 0.8 3.7 0.8
Germany 1.5 3.7 1.2
Data estimated in some cases, as at 2 February 2015.Source: Postbank research, national statistics.
Asia again generated the strongest economic momentum, with GDP increasing by 6.5 % (previous year: 6.6 %). In China, exports weakened. The government’s efforts to stimulate consumer demand failed to fully offset the declining export trend. GDP growth declined to 7.4 % (previous year: 7.7 %), the lowest figure since the early 1990s. The Japanese econ-omy was shaped by the hefty increase in value added tax in the spring. Although the year started out strongly due to purchases being brought forward, a sharp decline ensued in the second quarter before the economy began accelerating again towards the end of the year. On the whole, private consumption suffered whilst exports rose significantly and GDP increased by 0.3 % (previous year: 1.6 %).
In the United States, the upswing held firm. After a weak start to 2014 due to weather conditions, the economy gained considerable momentum as the year progressed. Invest-ments in machinery and equipment as well as construction increased quite significantly. Consumer spending by private households also rose steadily. The growth trend remained unaffected by both foreign trade and – as in the previous years – declining government spending. GDP increased by 2.4 % (previous year: 2.2 %), which also benefited the labour market in the form of a substantial decline in the unemployment rate.
In the euro zone, economic recovery was steady but sluggish. Private consumption increased slightly by 0.8 %. Government spending also rose to a comparable extent. Gross fixed capital formation increased by approximately 0.5 % and domestic demand by 0.8 %. Foreign trade was also revitalised. All in all, this led to GDP growth of 0.8 % (previous year: –0.5 %). Whereas the economic situation improved notably in some EU member states, in others the recession persisted. The situation on the labour market improved slightly. However, at an average of 11.6 % the unemployment rate remained at a very high level.
Deutsche Post DHL Group — 2014 Annual Report
43Group Management Report — rePorT on eConoMIC PoSITIon — Overall Board of Management assessment of the economic position — Forecast / actual comparison — Economic parameters
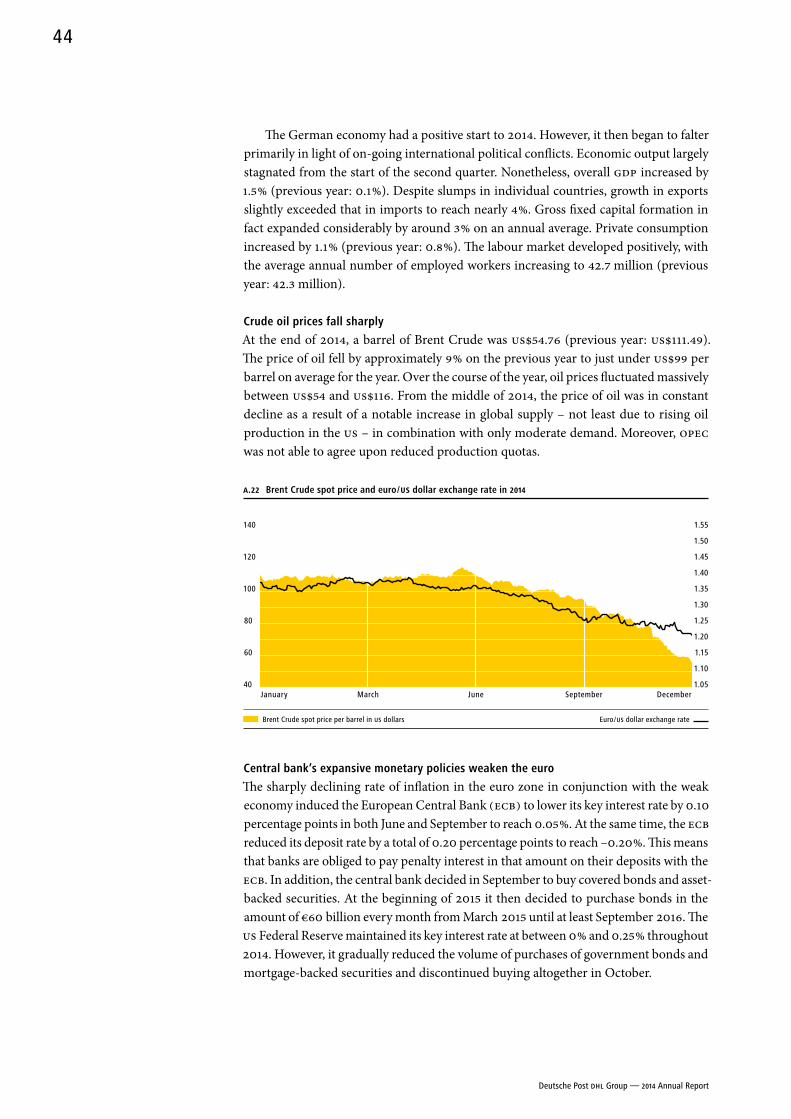
The German economy had a positive start to 2014. However, it then began to falter primarily in light of on-going international political conflicts. Economic output largely stagnated from the start of the second quarter. Nonetheless, overall GDP increased by 1.5 % (previous year: 0.1 %). Despite slumps in individual countries, growth in exports slightly exceeded that in imports to reach nearly 4 %. Gross fixed capital formation in fact expanded considerably by around 3 % on an annual average. Private consumption increased by 1.1 % (previous year: 0.8 %). The labour market developed positively, with the average annual number of employed workers increasing to 42.7 million (previous year: 42.3 million).
Crude oil prices fall sharply
At the end of 2014, a barrel of Brent Crude was US$54.76 (previous year: US$111.49). The price of oil fell by approximately 9 % on the previous year to just under US$99 per barrel on average for the year. Over the course of the year, oil prices fluctuated massively between US$54 and US$116. From the middle of 2014, the price of oil was in constant decline as a result of a notable increase in global supply – not least due to rising oil production in the US – in combination with only moderate demand. Moreover, OPEC was not able to agree upon reduced production quotas.
A.22 Brent Crude spot price and euro / US dollar exchange rate in 2014
140 1.55
1.50
120 1.45
1.40
100 1.35
1.30
80 1.25
1.20
60 1.15
1.10
40 1.05January March June September December
Brent Crude spot price per barrel in US dollars Euro / US dollar exchange rate
Central bank’s expansive monetary policies weaken the euro
The sharply declining rate of inflation in the euro zone in conjunction with the weak economy induced the European Central Bank (ECB) to lower its key interest rate by 0.10 percentage points in both June and September to reach 0.05 %. At the same time, the ECB reduced its deposit rate by a total of 0.20 percentage points to reach –0.20 %. This means that banks are obliged to pay penalty interest in that amount on their deposits with the ECB. In addition, the central bank decided in September to buy covered bonds and asset- backed securities. At the beginning of 2015 it then decided to purchase bonds in the amount of €60 billion every month from March 2015 until at least September 2016. The US Federal Reserve maintained its key interest rate at between 0 % and 0.25 % throughout 2014. However, it gradually reduced the volume of purchases of government bonds and mortgage-backed securities and discontinued buying altogether in October.
Deutsche Post DHL Group — 2014 Annual Report
44
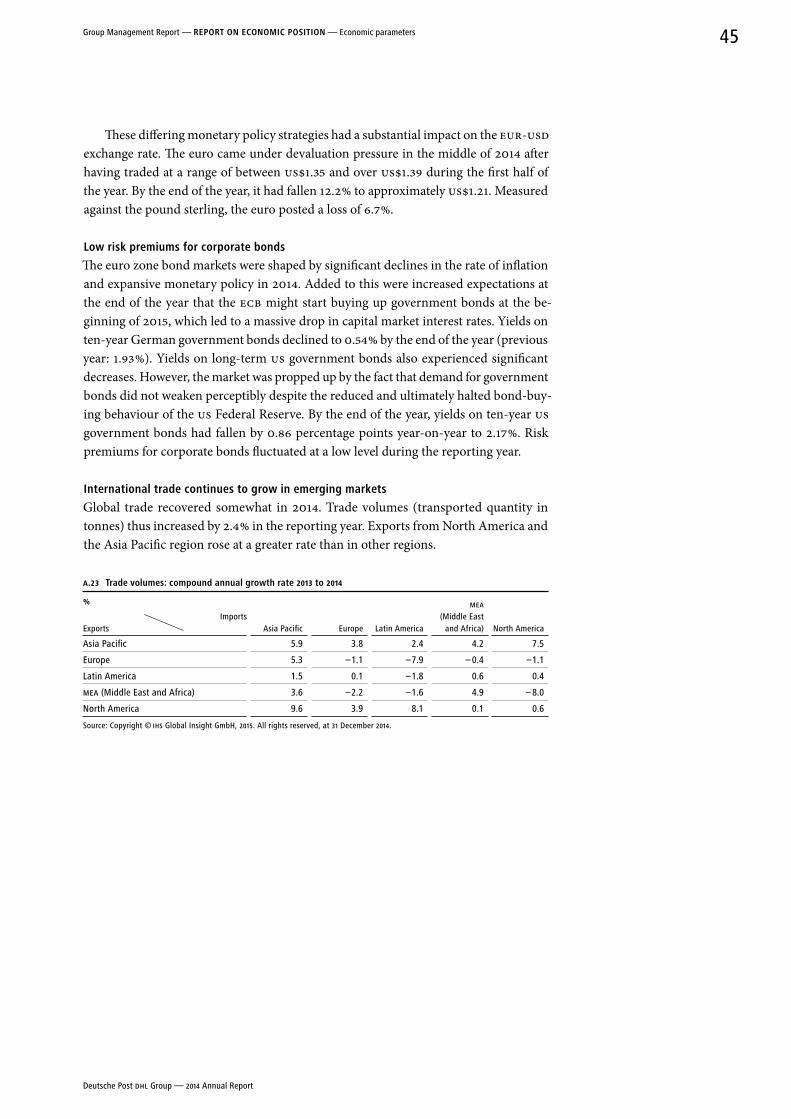
These differing monetary policy strategies had a substantial impact on the EUR-USD exchange rate. The euro came under devaluation pressure in the middle of 2014 after having traded at a range of between US$1.35 and over US$1.39 during the first half of the year. By the end of the year, it had fallen 12.2 % to approximately US$1.21. Measured against the pound sterling, the euro posted a loss of 6.7 %.
Low risk premiums for corporate bonds
The euro zone bond markets were shaped by significant declines in the rate of inflation and expansive monetary policy in 2014. Added to this were increased expectations at the end of the year that the ECB might start buying up government bonds at the be-ginning of 2015, which led to a massive drop in capital market interest rates. Yields on ten-year German government bonds declined to 0.54 % by the end of the year (previous year: 1.93 %). Yields on long-term US government bonds also experienced significant decreases. However, the market was propped up by the fact that demand for government bonds did not weaken perceptibly despite the reduced and ultimately halted bond-buy-ing behaviour of the US Federal Reserve. By the end of the year, yields on ten-year US government bonds had fallen by 0.86 percentage points year-on-year to 2.17 %. Risk premiums for corporate bonds fluctuated at a low level during the reporting year.
International trade continues to grow in emerging markets
Global trade recovered somewhat in 2014. Trade volumes (transported quantity in tonnes) thus increased by 2.4 % in the reporting year. Exports from North America and the Asia Pacific region rose at a greater rate than in other regions.
A.23 Trade volumes: compound annual growth rate 2013 to 2014
%
Asia Pacific Europe Latin America
MEA (Middle East
and Africa) North America Imports Exports
Asia Pacific 5.9 3.8 2.4 4.2 7.5
Europe 5.3 –1.1 –7.9 – 0.4 –1.1
Latin America 1.5 0.1 –1.8 0.6 0.4
MEA (Middle East and Africa) 3.6 –2.2 –1.6 4.9 – 8.0
North America 9.6 3.9 8.1 0.1 0.6
Source: Copyright © IHS Global Insight GmbH, 2015. All rights reserved, at 31 December 2014.
Deutsche Post DHL Group — 2014 Annual Report
45Group Management Report — rePorT on eConoMIC PoSITIon — Economic parameters
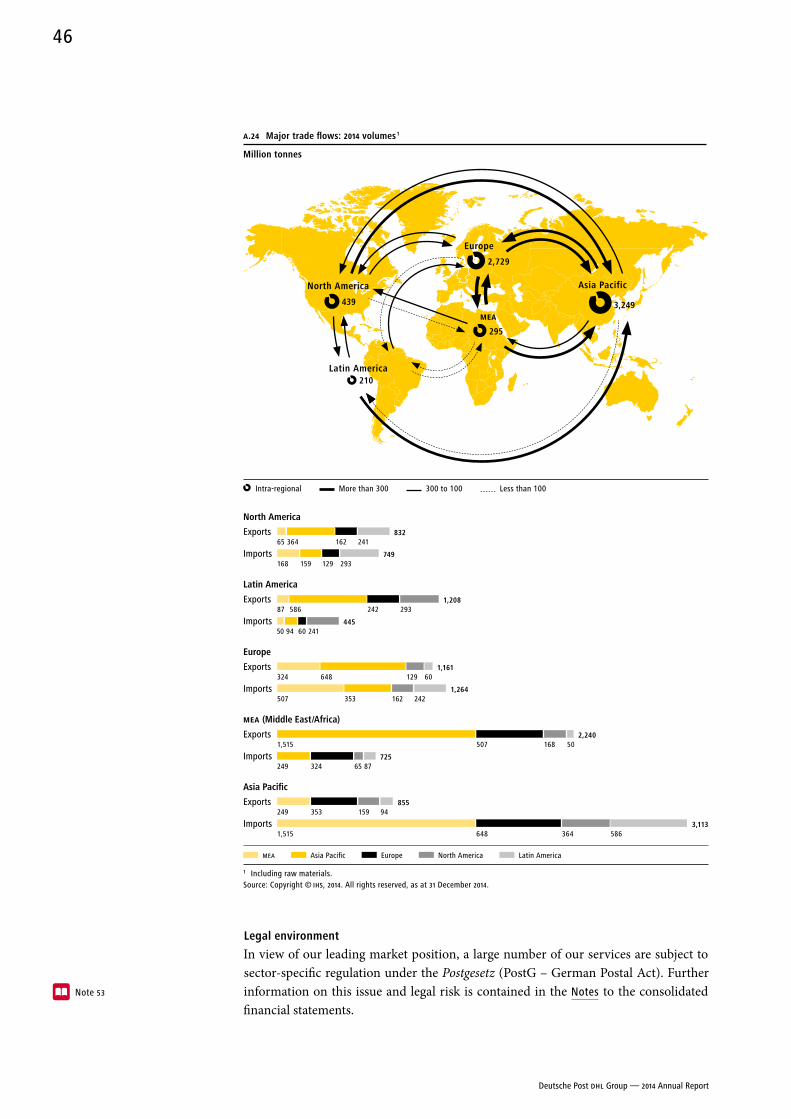
Legal environment
In view of our leading market position, a large number of our services are subject to sector-specific regulation under the Postgesetz (PostG – German Postal Act). Further information on this issue and legal risk is contained in the Notes to the consolidated financial statements.
A.24 Major trade flows: 2014 volumes 1
Million tonnes
Intra-regional More than 300 300 to 100 Less than 100
north america
Exports65
364
162
241
832
Imports168
159
129
293
749
Latin america
Exports87
586
242
293
1,208
Imports50
94
60
241
445
europe
Exports324
648
129
60
1,161
Imports507
353
162
242
1,264
MEA (Middle east /africa)
Exports1,515
507
168
50
2,240
Imports249
324
65
87
725
asia Pacific
Exports249
353
159
94
855
Imports1,515
648
364
586
3,113
MEA Asia Pacific Europe North America Latin America
1 Including raw materials.Source: Copyright © IHS, 2014. All rights reserved, as at 31 December 2014.
europe
2,729
MEA
295
Latin america 210
asia Pacific
3,249
north america
439
Note 53
Deutsche Post DHL Group — 2014 Annual Report
46
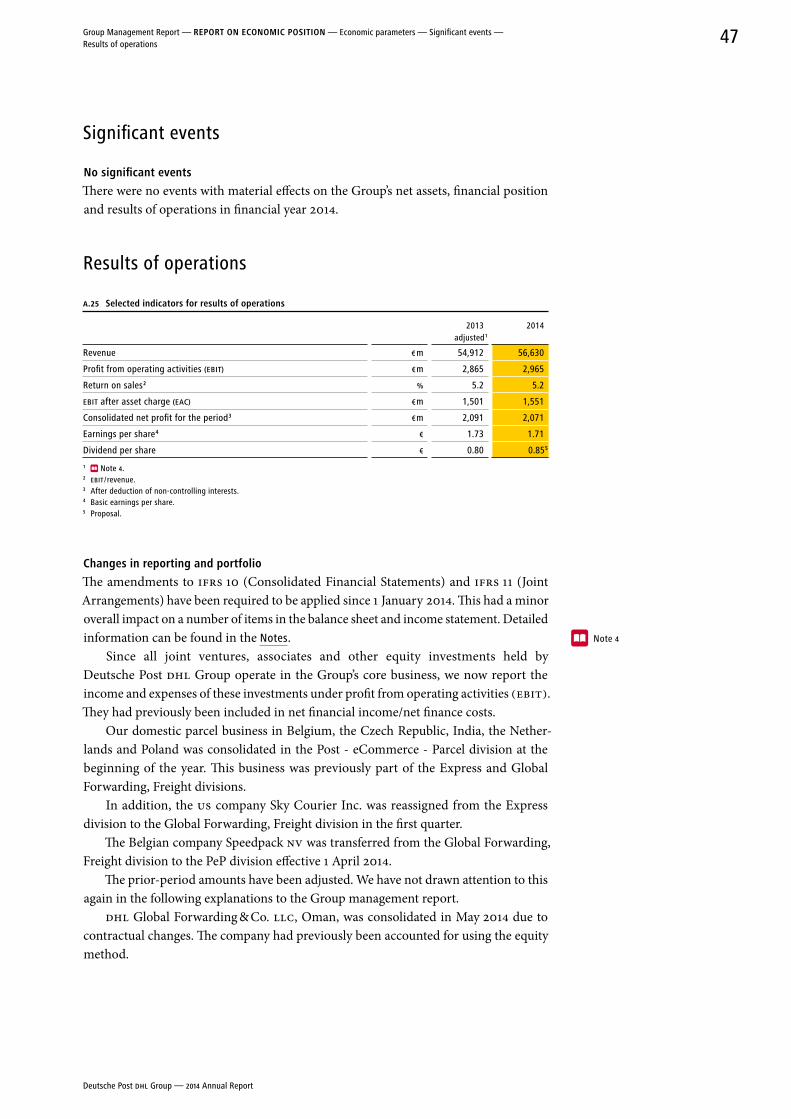
Significant events
no significant events
There were no events with material effects on the Group’s net assets, financial position and results of operations in financial year 2014.
Results of operations
A.25 Selected indicators for results of operations
2013
adjusted 1
2014
Revenue € m 54,912 56,630
Profit from operating activities (EBIT) € m 2,865 2,965
Return on sales 2 % 5.2 5.2
EBIT after asset charge (EAC) € m 1,501 1,551
Consolidated net profit for the period 3 € m 2,091 2,071
Earnings per share 4 € 1.73 1.71
Dividend per share € 0.80 0.85 5
1 Note 4.2 EBIT / revenue.3 After deduction of non-controlling interests.4 Basic earnings per share.5 Proposal.
Changes in reporting and portfolio
The amendments to IFRS 10 (Consolidated Financial Statements) and IFRS 11 (Joint Arrangements) have been required to be applied since 1 January 2014. This had a minor overall impact on a number of items in the balance sheet and income statement. Detailed information can be found in the Notes.
Since all joint ventures, associates and other equity investments held by Deutsche Post DHL Group operate in the Group’s core business, we now report the income and expenses of these investments under profit from operating activities (EBIT). They had previously been included in net financial income/net finance costs.
Our domestic parcel business in Belgium, the Czech Republic, India, the Nether-lands and Poland was consolidated in the Post - eCommerce - Parcel division at the beginning of the year. This business was previously part of the Express and Global Forwarding, Freight divisions.
In addition, the US company Sky Courier Inc. was reassigned from the Express division to the Global Forwarding, Freight division in the first quarter.
The Belgian company Speedpack NV was transferred from the Global Forwarding, Freight division to the PeP division effective 1 April 2014.
The prior-period amounts have been adjusted. We have not drawn attention to this again in the following explanations to the Group management report.
DHL Global Forwarding & Co. LLC, Oman, was consolidated in May 2014 due to contractual changes. The company had previously been accounted for using the equity method.
Note 4
Deutsche Post DHL Group — 2014 Annual Report
47Group Management Report — rePorT on eConoMIC PoSITIon — Economic parameters — Significant events — Results of operations
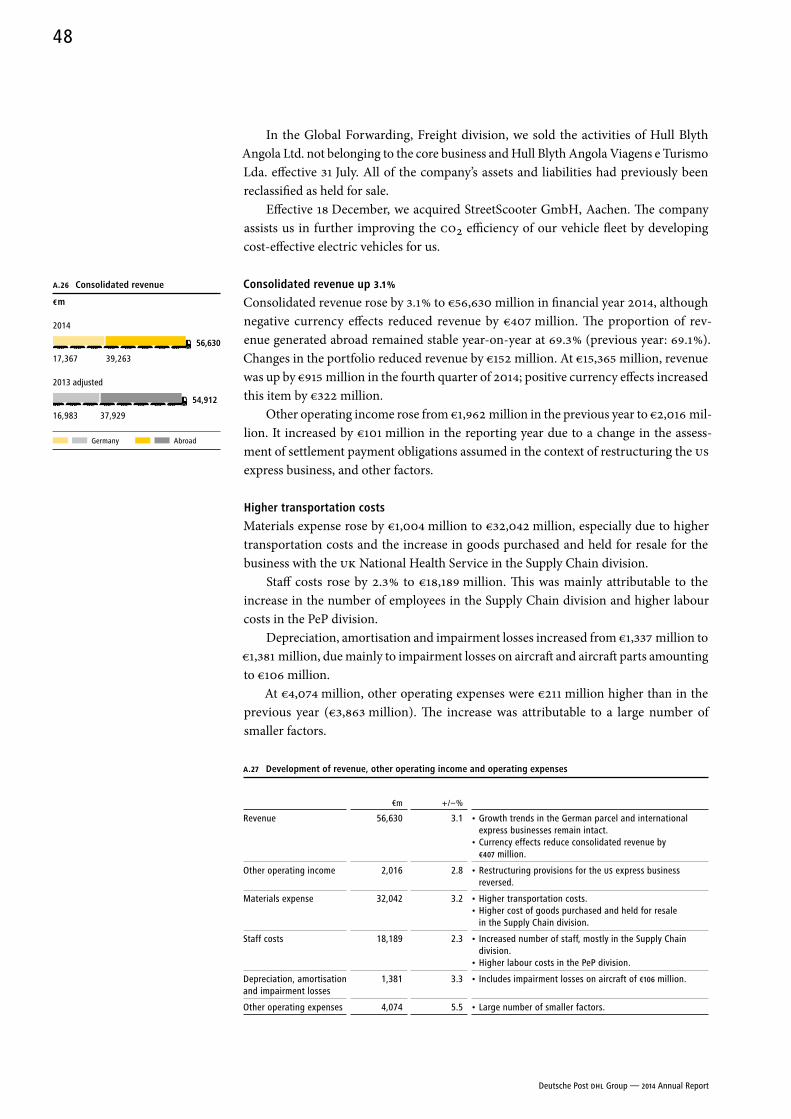
In the Global Forwarding, Freight division, we sold the activities of Hull Blyth Angola Ltd. not belonging to the core business and Hull Blyth Angola Viagens e Turismo Lda. effective 31 July. All of the company’s assets and liabilities had previously been reclassified as held for sale.
Effective 18 December, we acquired StreetScooter GmbH, Aachen. The company assists us in further improving the CO2 efficiency of our vehicle fleet by developing cost-effective electric vehicles for us.
Consolidated revenue up 3.1 %
Consolidated revenue rose by 3.1 % to €56,630 million in financial year 2014, although negative currency effects reduced revenue by €407 million. The proportion of rev-enue generated abroad remained stable year-on-year at 69.3 % (previous year: 69.1 %). Changes in the portfolio reduced revenue by €152 million. At €15,365 million, rev enue was up by €915 million in the fourth quarter of 2014; positive currency effects increased this item by €322 million.
Other operating income rose from €1,962 million in the previous year to €2,016 mil-lion. It increased by €101 million in the reporting year due to a change in the assess-ment of settlement payment obligations assumed in the context of restructuring the US express business, and other factors.
Higher transportation costs
Materials expense rose by €1,004 million to €32,042 million, especially due to higher transportation costs and the increase in goods purchased and held for resale for the business with the UK National Health Service in the Supply Chain division.
Staff costs rose by 2.3 % to €18,189 million. This was mainly attributable to the increase in the number of employees in the Supply Chain division and higher labour costs in the PeP division.
Depreciation, amortisation and impairment losses increased from €1,337 million to €1,381 million, due mainly to impairment losses on aircraft and aircraft parts amounting to €106 million.
At €4,074 million, other operating expenses were €211 million higher than in the previous year (€3,863 million). The increase was attributable to a large number of smaller factors.
A.27 Development of revenue, other operating income and operating expenses
€m + / – %
Revenue
56,630
3.1
• Growth trends in the German parcel and international express businesses remain intact.
• Currency effects reduce consolidated revenue by €407 million.
Other operating income 2,016 2.8 • Restructuring provisions for the US express business reversed.
Materials expense
32,042
3.2
• Higher transportation costs.• Higher cost of goods purchased and held for resale
in the Supply Chain division.
Staff costs
18,189
2.3
• Increased number of staff, mostly in the Supply Chain division.
• Higher labour costs in the PeP division.
Depreciation, amortisation and impairment losses
1,381 3.3 • Includes impairment losses on aircraft of €106 million.
Other operating expenses 4,074 5.5 • Large number of smaller factors.
A.26 Consolidated revenue
€ m
2014
56,630
17,367 39,263
2013 adjusted
54,912
16,983 37,929
Germany Abroad
Deutsche Post DHL Group — 2014 Annual Report
48
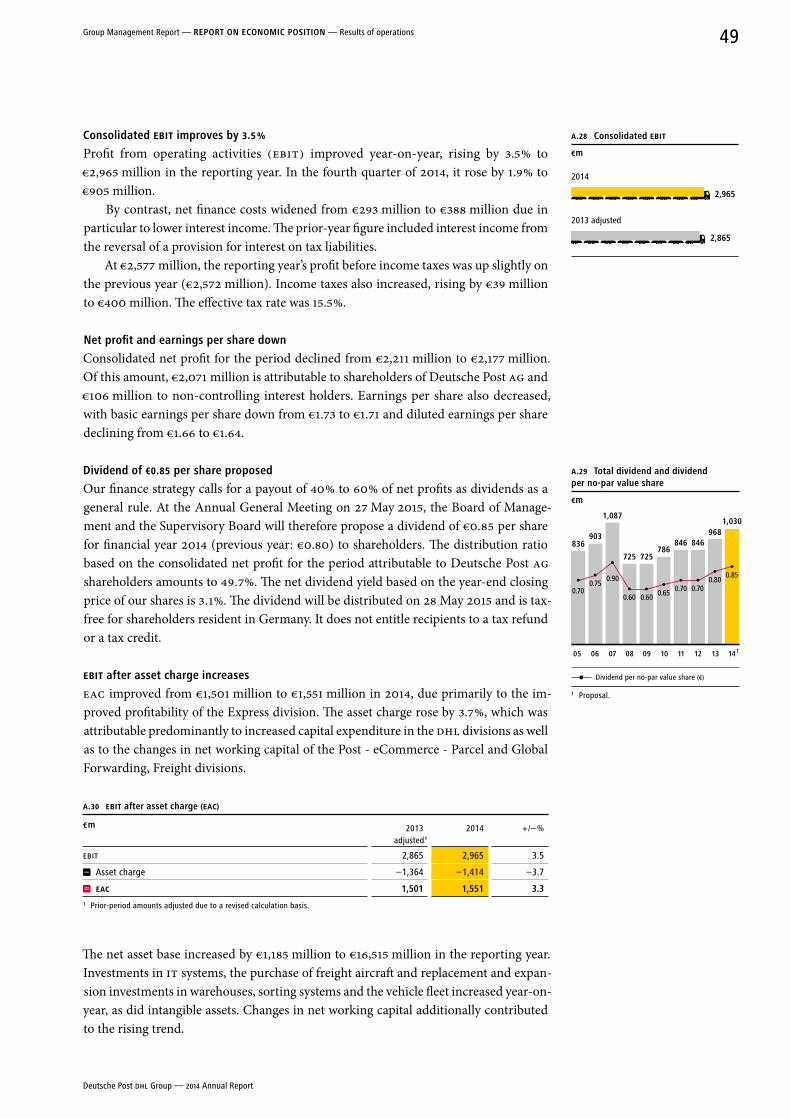
Consolidated EBIT improves by 3.5 %
Profit from operating activities (EBIT) improved year-on-year, rising by 3.5 % to €2,965 million in the reporting year. In the fourth quarter of 2014, it rose by 1.9 % to €905 million.
By contrast, net finance costs widened from €293 million to €388 million due in particular to lower interest income. The prior-year figure included interest income from the reversal of a provision for interest on tax liabilities.
At €2,577 million, the reporting year’s profit before income taxes was up slightly on the previous year (€2,572 million). Income taxes also increased, rising by €39 million to €400 million. The effective tax rate was 15.5 %.
net profit and earnings per share down
Consolidated net profit for the period declined from €2,211 million to €2,177 million. Of this amount, €2,071 million is attributable to shareholders of Deutsche Post AG and €106 million to non-controlling interest holders. Earnings per share also decreased, with basic earnings per share down from €1.73 to €1.71 and diluted earnings per share declining from €1.66 to €1.64.
Dividend of €0.85 per share proposed
Our finance strategy calls for a payout of 40 % to 60 % of net profits as dividends as a general rule. At the Annual General Meeting on 27 May 2015, the Board of Manage-ment and the Supervisory Board will therefore propose a dividend of €0.85 per share for finan cial year 2014 (previous year: €0.80) to shareholders. The distribution ratio based on the consolidated net profit for the period attributable to Deutsche Post AG shareholders amounts to 49.7%. The net dividend yield based on the year-end closing price of our shares is 3.1%. The dividend will be distributed on 28 May 2015 and is tax-free for shareholders resident in Germany. It does not entitle recipients to a tax refund or a tax credit.
EBIT after asset charge increases
EAC improved from €1,501 million to €1,551 million in 2014, due primarily to the im-proved profitability of the Express division. The asset charge rose by 3.7 %, which was attributable predominantly to increased capital expenditure in the DHL divisions as well as to the changes in net working capital of the Post - eCommerce - Parcel and Global Forwarding, Freight divisions.
A.30 EBIT after asset charge (EAC)
€ m 2013 adjusted 1
2014 + / – %
EBIT 2,865 2,965 3.5
Asset charge –1,364 –1,414 –3.7
EAC 1,501 1,551 3.31 Prior-period amounts adjusted due to a revised calculation basis.
The net asset base increased by €1,185 million to €16,515 million in the reporting year. Invest ments in IT systems, the purchase of freight aircraft and replacement and expan-sion investments in warehouses, sorting systems and the vehicle fleet increased year-on-year, as did intangible assets. Changes in net working capital additionally contributed to the rising trend.
A.28 Consolidated EBIT
€m
2014
2,965
2013 adjusted
2,865
0.800.85
0.60 0.60 0.65
0.900.75
0.70 0.70 0.70
9681,030
846846
1,087
725 725786
903836
A.29 Total dividend and dividend per no-par value share
€m
05 06 07 08 09 10 11 12 13 14 1
Dividend per no-par value share (€)
1 Proposal.
Deutsche Post DHL Group — 2014 Annual Report
49Group Management Report — rePorT on eConoMIC PoSITIon — Results of operations
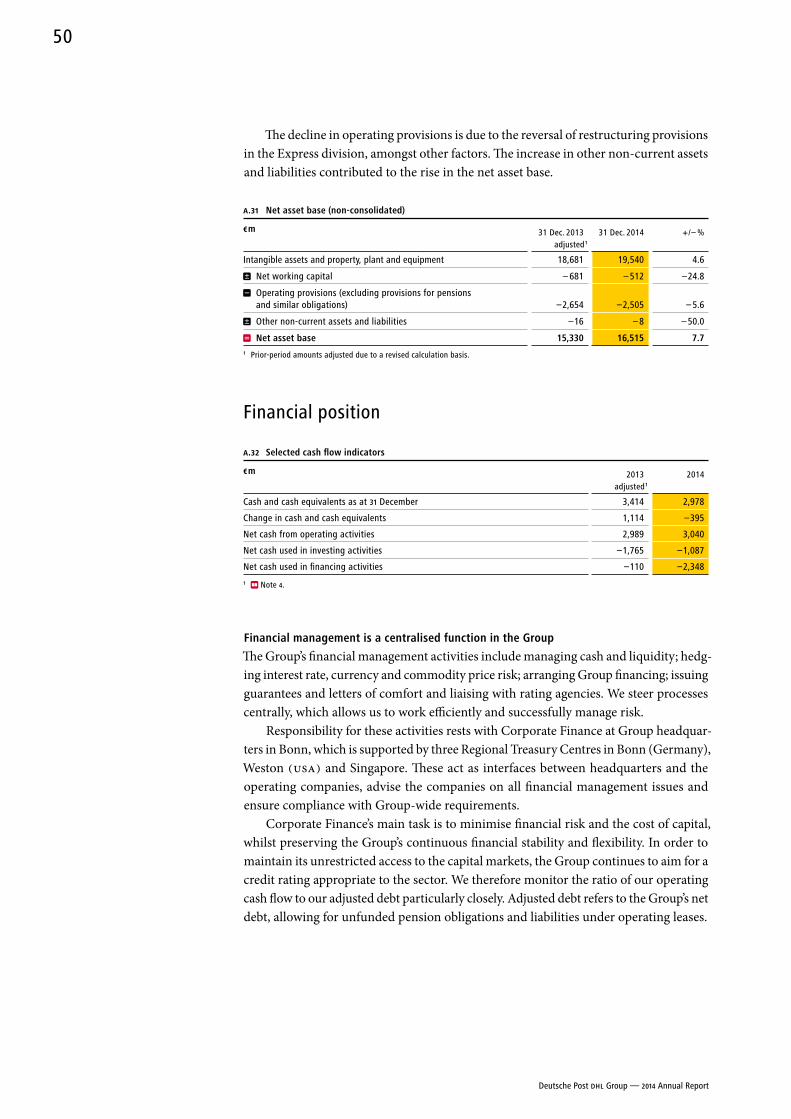
The decline in operating provisions is due to the reversal of restructuring provisions in the Express division, amongst other factors. The increase in other non-current assets and liabilities contributed to the rise in the net asset base.
A.31 net asset base (non-consolidated)
€ m 31 Dec. 2013 adjusted 1
31 Dec. 2014 + / – %
Intangible assets and property, plant and equipment 18,681 19,540 4.6
Net working capital – 681 – 512 –24.8
Operating provisions (excluding provisions for pensions and similar obligations) –2,654 –2,505 – 5.6
Other non-current assets and liabilities –16 – 8 – 50.0
net asset base 15,330 16,515 7.71 Prior-period amounts adjusted due to a revised calculation basis.
Financial position
A.32 Selected cash flow indicators
€ m 2013 adjusted 1
2014
Cash and cash equivalents as at 31 December 3,414 2,978
Change in cash and cash equivalents 1,114 –395
Net cash from operating activities 2,989 3,040
Net cash used in investing activities –1,765 –1,087
Net cash used in financing activities –110 –2,348
1 Note 4.
Financial management is a centralised function in the Group
The Group’s financial management activities include managing cash and liquidity; hedg-ing interest rate, currency and commodity price risk; arranging Group financing; issuing guarantees and letters of comfort and liaising with rating agencies. We steer processes centrally, which allows us to work efficiently and successfully manage risk.
Responsibility for these activities rests with Corporate Finance at Group headquar-ters in Bonn, which is supported by three Regional Treasury Centres in Bonn (Germany), Weston (USA) and Singapore. These act as interfaces between headquarters and the operating companies, advise the companies on all financial management issues and ensure compliance with Group-wide requirements.
Corporate Finance’s main task is to minimise financial risk and the cost of capital, whilst preserving the Group’s continuous financial stability and flexibility. In order to maintain its unrestricted access to the capital markets, the Group continues to aim for a credit rating appropriate to the sector. We therefore monitor the ratio of our operating cash flow to our adjusted debt particularly closely. Adjusted debt refers to the Group’s net debt, allowing for unfunded pension obligations and liabilities under operating leases.
Deutsche Post DHL Group — 2014 Annual Report
50
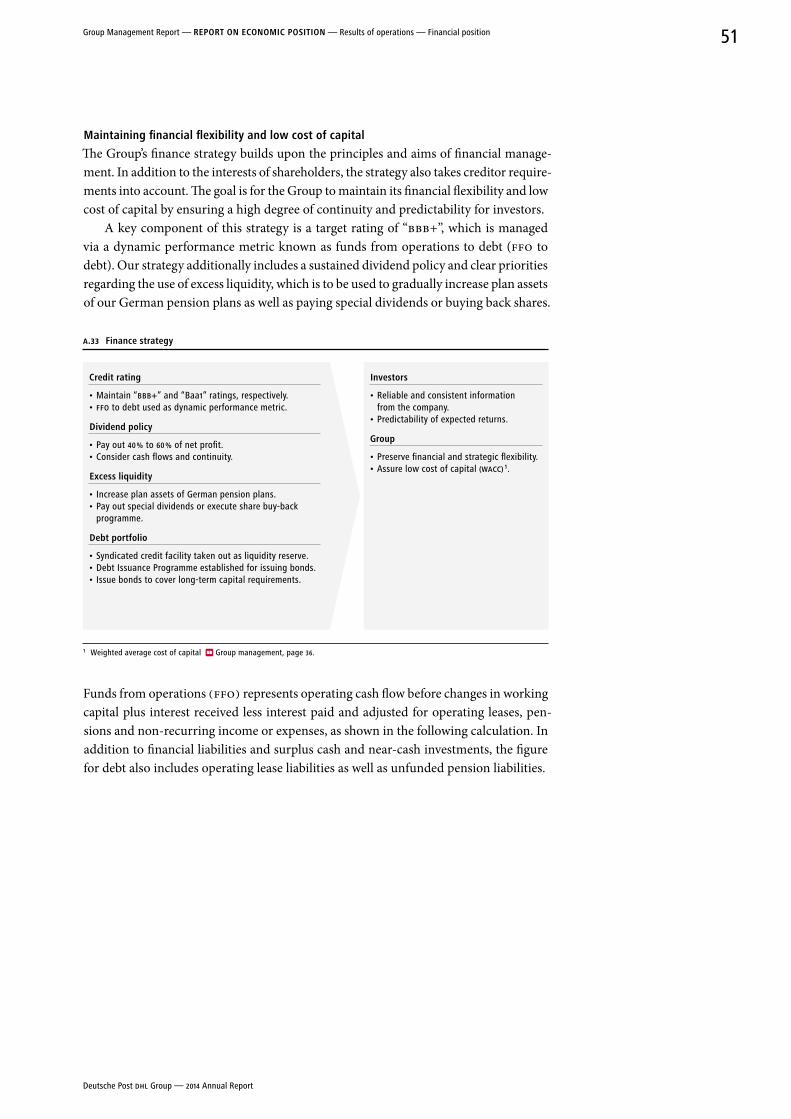
Maintaining financial flexibility and low cost of capital
The Group’s finance strategy builds upon the principles and aims of financial manage-ment. In addition to the interests of shareholders, the strategy also takes creditor require-ments into account. The goal is for the Group to maintain its financial flexibility and low cost of capital by ensuring a high degree of continuity and predictability for investors.
A key component of this strategy is a target rating of “BBB+”, which is managed via a dynamic performance metric known as funds from operations to debt (FFO to debt). Our strategy additionally includes a sustained dividend policy and clear priorities regarding the use of excess liquidity, which is to be used to gradually increase plan assets of our German pension plans as well as paying special dividends or buying back shares.
A.33 Finance strategy
Credit rating
• Maintain “BBB+” and “Baa1” ratings, respectively.• FFO to debt used as dynamic performance metric.
Dividend policy
• Pay out 40 % to 60 % of net profit.• Consider cash flows and continuity.
excess liquidity
• Increase plan assets of German pension plans.• Pay out special dividends or execute share buy-back
programme.
Debt portfolio
• Syndicated credit facility taken out as liquidity reserve.• Debt Issuance Programme established for issuing bonds.• Issue bonds to cover long-term capital requirements.
Investors
• Reliable and consistent information from the company.
• Predictability of expected returns.
Group
• Preserve financial and strategic flexibility.• Assure low cost of capital (WACC) 1.
1 Weighted average cost of capital Group management, page 36.
Funds from operations (FFO) represents operating cash flow before changes in working capital plus interest received less interest paid and adjusted for operating leases, pen-sions and non-recurring income or expenses, as shown in the following calculation. In addition to financial liabilities and surplus cash and near-cash investments, the figure for debt also includes operating lease liabilities as well as unfunded pension liabilities.
Deutsche Post DHL Group — 2014 Annual Report
51Group Management Report — rePorT on eConoMIC PoSITIon — Results of operations — Financial position
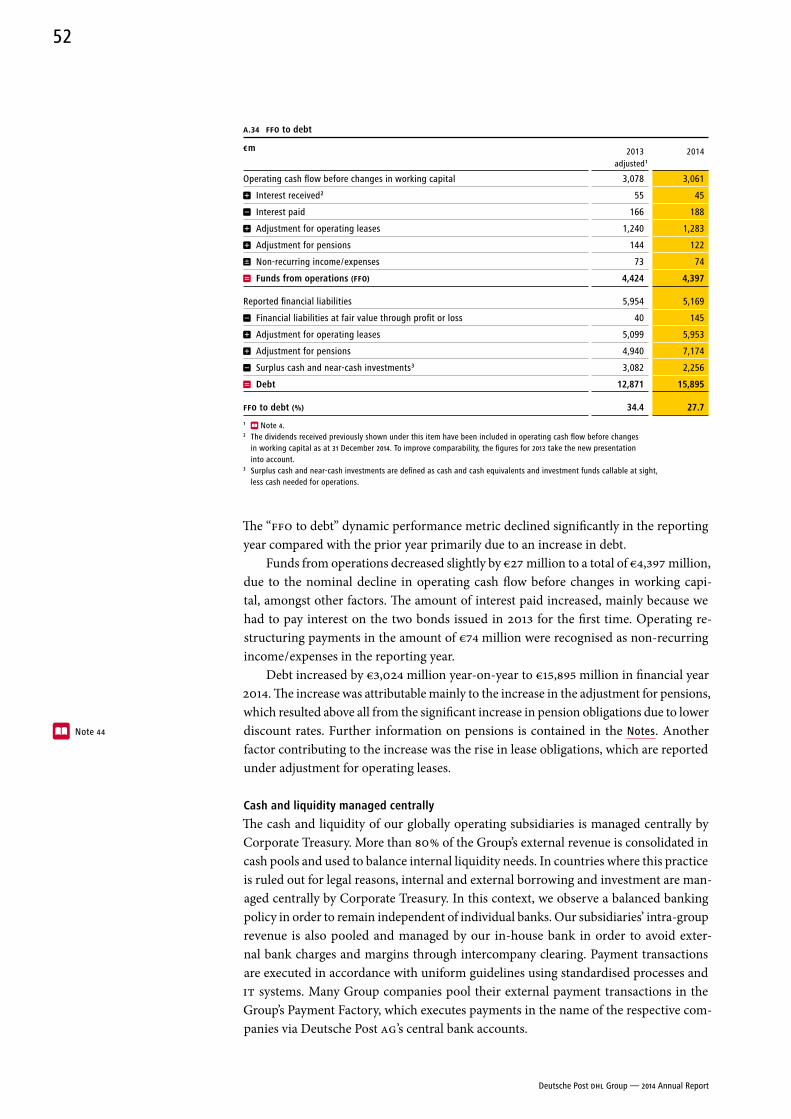
A.34 FFO to debt
€ m 2013 adjusted 1
2014
Operating cash flow before changes in working capital 3,078 3,061
Interest received 2 55 45
Interest paid 166 188
Adjustment for operating leases 1,240 1,283
Adjustment for pensions 144 122
Non-recurring income / expenses 73 74
Funds from operations (FFO) 4,424 4,397
Reported financial liabilities 5,954 5,169
Financial liabilities at fair value through profit or loss 40 145
Adjustment for operating leases 5,099 5,953
Adjustment for pensions 4,940 7,174
Surplus cash and near-cash investments 3 3,082 2,256
Debt 12,871 15,895
FFO to debt (%) 34.4 27.7
1 Note 4.2 The dividends received previously shown under this item have been included in operating cash flow before changes
in working capital as at 31 December 2014. To improve comparability, the figures for 2013 take the new presentation into account.
3 Surplus cash and near-cash investments are defined as cash and cash equivalents and investment funds callable at sight, less cash needed for operations.
The “FFO to debt” dynamic performance metric declined significantly in the reporting year compared with the prior year primarily due to an increase in debt.
Funds from operations decreased slightly by €27 million to a total of €4,397 million, due to the nominal decline in operating cash flow before changes in working capi-tal, amongst other factors. The amount of interest paid increased, mainly because we had to pay interest on the two bonds issued in 2013 for the first time. Operating re-structuring payments in the amount of €74 million were recognised as non-recurring income / expenses in the reporting year.
Debt increased by €3,024 million year-on-year to €15,895 million in financial year 2014. The increase was attributable mainly to the increase in the adjustment for pensions, which resulted above all from the significant increase in pension obligations due to lower discount rates. Further information on pensions is contained in the Notes. Another factor contributing to the increase was the rise in lease obligations, which are reported under adjustment for operating leases.
Cash and liquidity managed centrally
The cash and liquidity of our globally operating subsidiaries is managed centrally by Corporate Treasury. More than 80 % of the Group’s external revenue is consolidated in cash pools and used to balance internal liquidity needs. In countries where this practice is ruled out for legal reasons, internal and external borrowing and investment are man-aged centrally by Corporate Treasury. In this context, we observe a balanced banking policy in order to remain independent of individual banks. Our subsidiaries’ intra-group revenue is also pooled and managed by our in-house bank in order to avoid exter-nal bank charges and margins through intercompany clearing. Payment trans actions are executed in accordance with uniform guidelines using standardised processes and IT systems. Many Group companies pool their external payment transactions in the Group’s Payment Factory, which executes payments in the name of the respective com-panies via Deutsche Post AG’s central bank accounts.
Note 44
Deutsche Post DHL Group — 2014 Annual Report
52
Limiting market risk
The Group uses both primary and derivative financial instruments to limit market risk. Interest rate risk is managed exclusively via swaps. Currency risk is hedged additionally using forward transactions, cross-currency swaps and options. We pass on most of the risk arising from commodity fluctuations to our customers and, to some extent, use commodity swaps to manage the remaining risk. The parameters, responsibilities and controls governing the use of derivatives are laid down in internal guidelines.
Flexible and stable financing
The Group covers its long-term financing requirements by means of equity and liabil-ities. This ensures our financial stability and also provides adequate flexibility. Our most important source of funds is net cash from operating activities.
We also have a syndicated credit facility in a total volume of €2 billion that guaran-tees us favourable market conditions and acts as a secure, long-term liquidity reserve. The facility was extended in 2013 and renewed in the reporting year by one year and now runs until 2019. Moreover, there is an option to renew it for another year. The syndicated credit facility does not contain any covenants concerning the Group’s financial indica-tors. In view of our solid liquidity, it was not drawn down during the year under review.
As part of our banking policy, we spread our business volume widely and maintain long-term relationships with the financial institutions we entrust with our business. In addition to credit lines, we meet our borrowing requirements through other independ-ent sources of financing, such as bonds and operating leases. Most debt is taken out centrally in order to leverage economies of scale and specialisation benefits and hence minimise borrowing costs.
No bonds were issued in the reporting year and a bond falling due in January 2014 was repaid. Further information on the existing bonds is contained in the Notes.
Group issues sureties, letters of comfort and guarantees
Deutsche Post AG provides security for the loan agreements, leases and supplier con-tracts entered into by Group companies, associates or joint ventures by issuing letters of comfort, sureties or guarantees as needed. This practice allows better conditions to be negotiated locally. The sureties are provided and monitored centrally.
Group’s credit rating improved
Credit ratings represent an independent and current assessment of a company’s credit standing. Ratings are based upon a quantitative analysis and measurement of the an-nual report and appropriate planning data. Qualitative factors, such as industry-specific features and the company’s market position and range of products and services, are also taken into account.
Note 46
Deutsche Post DHL Group — 2014 Annual Report
53Group Management Report — rePorT on eConoMIC PoSITIon — Financial position
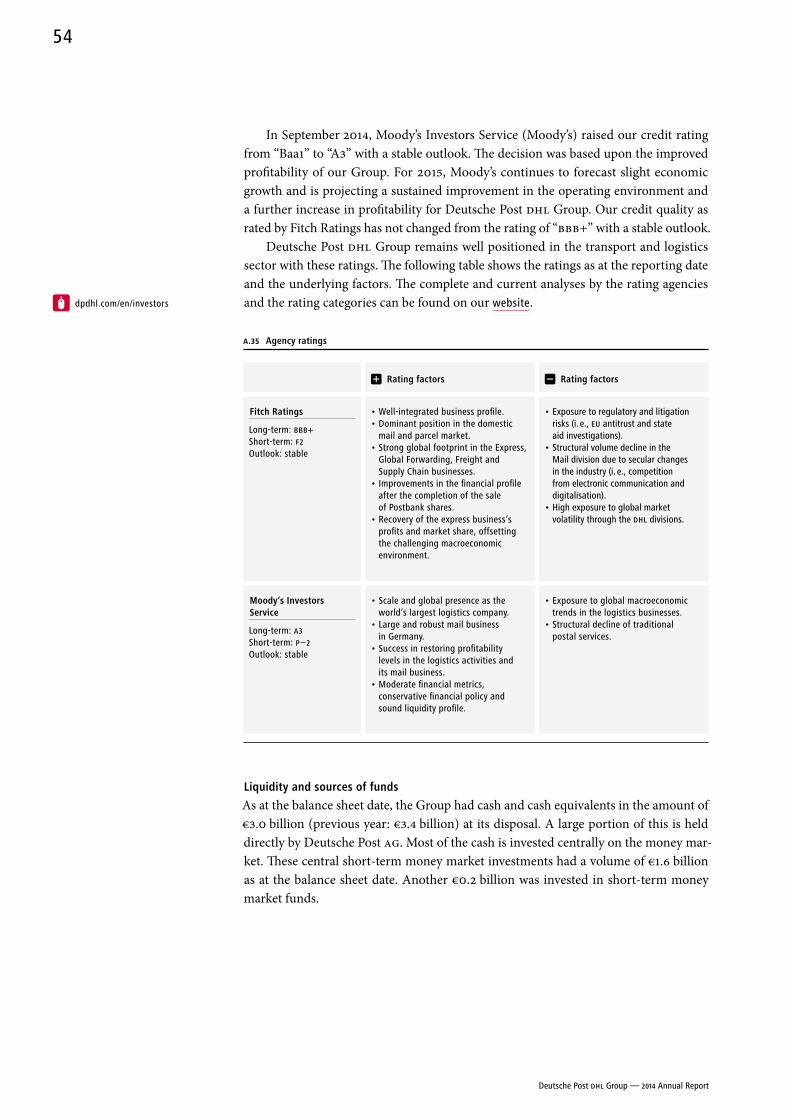
In September 2014, Moody’s Investors Service (Moody’s) raised our credit rating from “Baa1” to “A3” with a stable outlook. The decision was based upon the improved profitability of our Group. For 2015, Moody’s continues to forecast slight economic growth and is projecting a sustained improvement in the operating environment and a further increase in profitability for Deutsche Post DHL Group. Our credit quality as rated by Fitch Ratings has not changed from the rating of “BBB+” with a stable outlook.
Deutsche Post DHL Group remains well positioned in the transport and logistics sector with these ratings. The following table shows the ratings as at the reporting date and the underlying factors. The complete and current analyses by the rating agencies and the rating categories can be found on our website.
A.35 agency ratings
rating factors rating factors
Fitch ratings
Long-term: BBB+Short-term: F2Outlook: stable
• Well-integrated business profile.• Dominant position in the domestic
mail and parcel market.• Strong global footprint in the Express,
Global Forwarding, Freight and Supply Chain businesses.
• Improvements in the financial profile after the completion of the sale of Postbank shares.
• Recovery of the express business’s profits and market share, offsetting the challenging macroeconomic environment.
• Exposure to regulatory and litigation risks (i. e., EU antitrust and state aid investigations).
• Structural volume decline in the Mail division due to secular changes in the industry (i. e., competition from electronic communication and digitalisation).
• High exposure to global market volatility through the DHL divisions.
Moody’s Investors Service
Long-term: A3Short-term: P – 2Outlook: stable
• Scale and global presence as the world’s largest logistics company.
• Large and robust mail business in Germany.
• Success in restoring profitability levels in the logistics activities and its mail business.
• Moderate financial metrics, conservative financial policy and sound liquidity profile.
• Exposure to global macroeconomic trends in the logistics businesses.
• Structural decline of traditional postal services.
Liquidity and sources of funds
As at the balance sheet date, the Group had cash and cash equivalents in the amount of €3.0 billion (previous year: €3.4 billion) at its disposal. A large portion of this is held directly by Deutsche Post AG. Most of the cash is invested centrally on the money mar-ket. These central short-term money market investments had a volume of €1.6 billion as at the balance sheet date. Another €0.2 billion was invested in short-term money market funds.
dpdhl.com/en/investors
Deutsche Post DHL Group — 2014 Annual Report
54
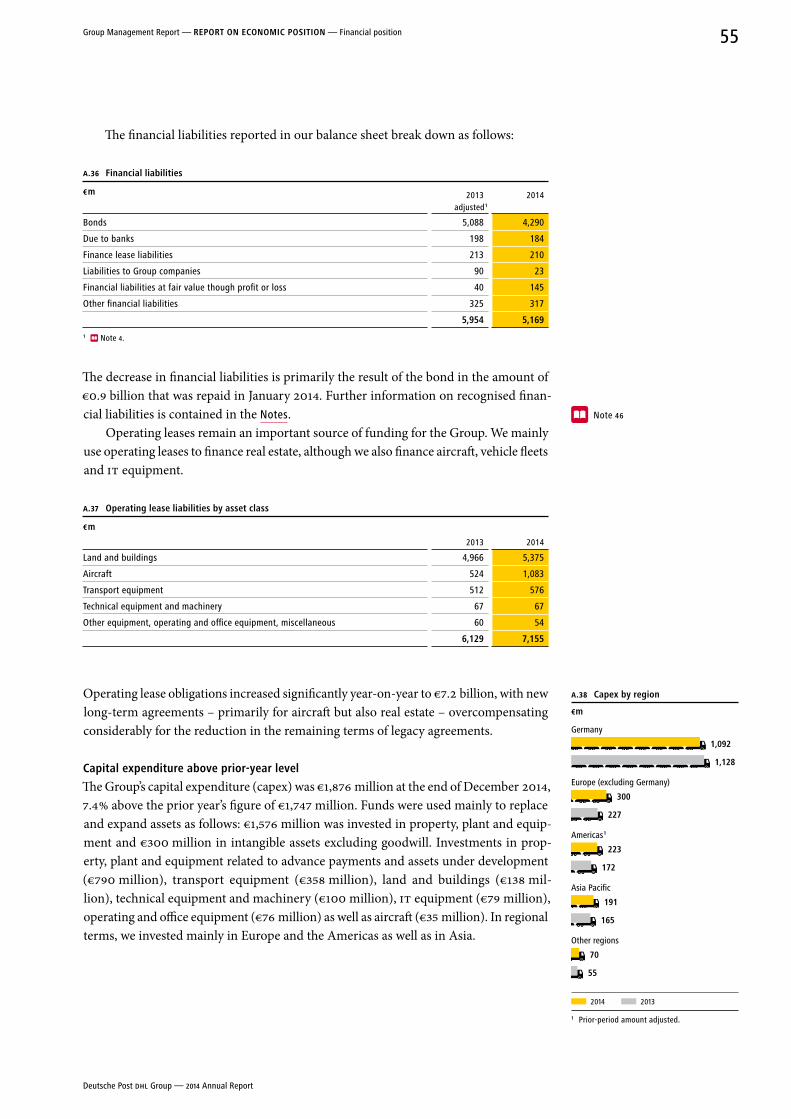
The financial liabilities reported in our balance sheet break down as follows:
A.36 Financial liabilities
€ m 2013 adjusted 1
2014
Bonds 5,088 4,290
Due to banks 198 184
Finance lease liabilities 213 210
Liabilities to Group companies 90 23
Financial liabilities at fair value though profit or loss 40 145
Other financial liabilities 325 317
5,954 5,169
1 Note 4.
The decrease in financial liabilities is primarily the result of the bond in the amount of €0.9 billion that was repaid in January 2014. Further information on recognised finan-cial liabilities is contained in the Notes.
Operating leases remain an important source of funding for the Group. We mainly use operating leases to finance real estate, although we also finance aircraft, vehicle fleets and IT equipment.
A.37 operating lease liabilities by asset class
€ m
2013 2014
Land and buildings 4,966 5,375
Aircraft 524 1,083
Transport equipment 512 576
Technical equipment and machinery 67 67
Other equipment, operating and office equipment, miscellaneous 60 54
6,129 7,155
Operating lease obligations increased significantly year-on-year to €7.2 billion, with new long-term agreements – primarily for aircraft but also real estate – overcompensating considerably for the reduction in the remaining terms of legacy agreements.
Capital expenditure above prior-year level
The Group’s capital expenditure (capex) was €1,876 million at the end of December 2014, 7.4 % above the prior year’s figure of €1,747 million. Funds were used mainly to replace and expand assets as follows: €1,576 million was invested in property, plant and equip-ment and €300 million in intangible assets excluding goodwill. Investments in prop-erty, plant and equipment related to advance payments and assets under development (€790 million), transport equipment (€358 million), land and buildings (€138 mil-lion), technical equipment and machinery (€100 million), IT equipment (€79 million), operating and office equipment (€76 million) as well as aircraft (€35 million). In regional terms, we invested mainly in Europe and the Americas as well as in Asia.
Note 46
A.38 Capex by region
€m
Germany
1,092
1,128
Europe (excluding Germany)
300
227
Americas 1
223
172
Asia Pacific
191
165
Other regions
70
55
2014 2013
1 Prior-period amount adjusted.
Deutsche Post DHL Group — 2014 Annual Report
55Group Management Report — rePorT on eConoMIC PoSITIon — Financial position
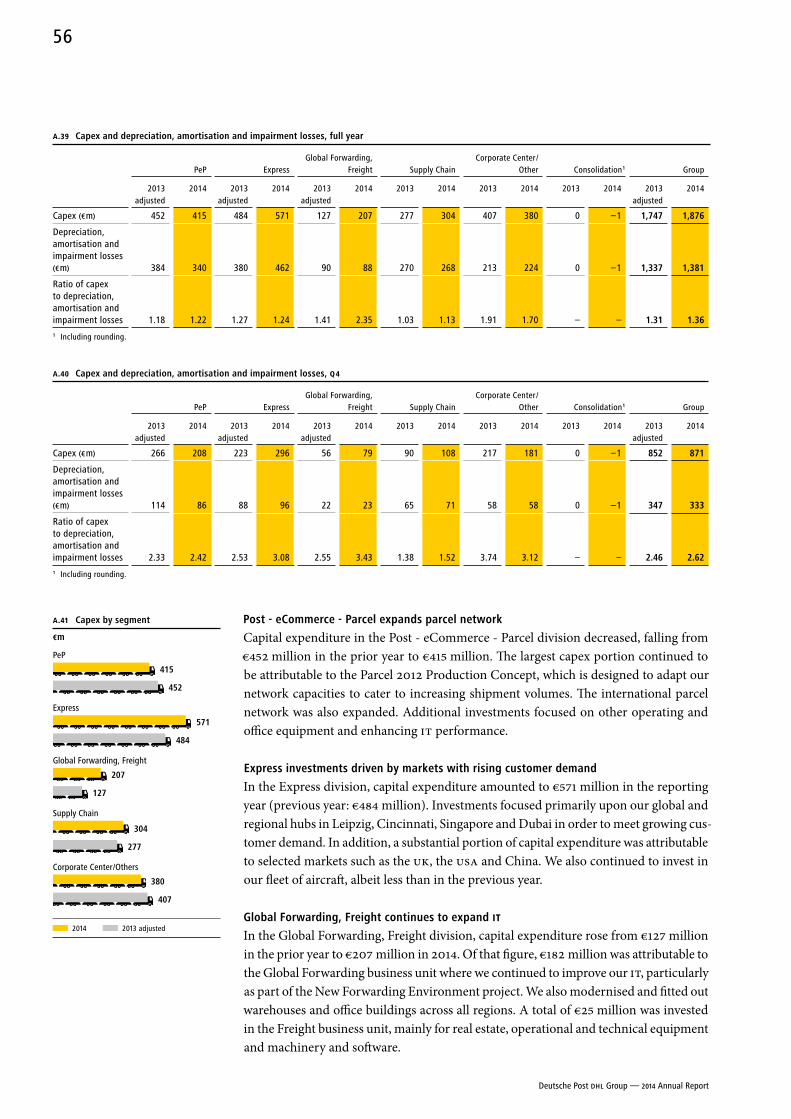
Post - eCommerce - Parcel expands parcel network
Capital expenditure in the Post - eCommerce - Parcel division decreased, falling from €452 million in the prior year to €415 million. The largest capex portion continued to be attributable to the Parcel 2012 Production Concept, which is designed to adapt our network capacities to cater to increasing shipment volumes. The international parcel network was also expanded. Additional investments focused on other operating and office equipment and enhancing IT performance.
express investments driven by markets with rising customer demand
In the Express division, capital expenditure amounted to €571 million in the reporting year (previous year: €484 million). Investments focused primarily upon our global and regional hubs in Leipzig, Cincinnati, Singapore and Dubai in order to meet growing cus-tomer demand. In addition, a substantial portion of capital expenditure was attributable to selected markets such as the UK, the USA and China. We also continued to invest in our fleet of aircraft, albeit less than in the previous year.
Global Forwarding, Freight continues to expand IT
In the Global Forwarding, Freight division, capital expenditure rose from €127 million in the prior year to €207 million in 2014. Of that figure, €182 million was attributable to the Global Forwarding business unit where we continued to improve our IT, particularly as part of the New Forwarding Environment project. We also modernised and fitted out warehouses and office buildings across all regions. A total of €25 million was invested in the Freight business unit, mainly for real estate, operational and technical equipment and machinery and software.
A.39 Capex and depreciation, amortisation and impairment losses, full year
PeP ExpressGlobal Forwarding,
Freight Supply ChainCorporate Center /
Other Consolidation 1 Group
2013
adjusted2014 2013
adjusted2014 2013
adjusted2014 2013 2014 2013 2014 2013 2014 2013
adjusted2014
Capex (€ m) 452 415 484 571 127 207 277 304 407 380 0 –1 1,747 1,876
Depreciation, amortisation and impairment losses (€ m) 384 340 380 462 90 88 270 268 213 224 0 –1 1,337 1,381
Ratio of capex to depreciation, amortisation and impairment losses 1.18 1.22 1.27 1.24 1.41 2.35 1.03 1.13 1.91 1.70 – – 1.31 1.361 Including rounding.
A.40 Capex and depreciation, amortisation and impairment losses, Q 4
PeP ExpressGlobal Forwarding,
Freight Supply ChainCorporate Center /
Other Consolidation 1 Group
2013
adjusted2014 2013
adjusted2014 2013
adjusted2014 2013 2014 2013 2014 2013 2014 2013
adjusted2014
Capex (€ m) 266 208 223 296 56 79 90 108 217 181 0 –1 852 871
Depreciation, amortisation and impairment losses (€ m) 114 86 88 96 22 23 65 71 58 58 0 –1 347 333
Ratio of capex to depreciation, amortisation and impairment losses 2.33 2.42 2.53 3.08 2.55 3.43 1.38 1.52 3.74 3.12 – – 2.46 2.621 Including rounding.
A.41 Capex by segment
€m
PeP
415
452
Express
571
484
Global Forwarding, Freight
207
127
Supply Chain
304
277
Corporate Center /Others
380
407
2014 2013 adjusted
Deutsche Post DHL Group — 2014 Annual Report
56
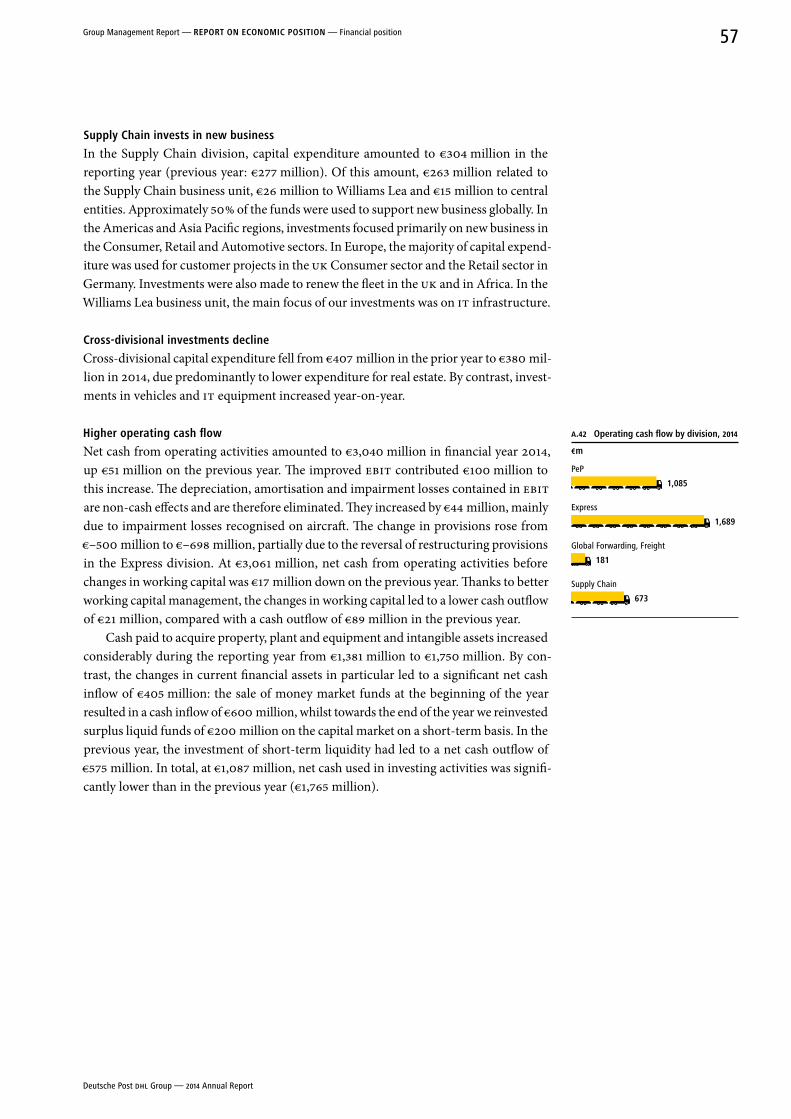
Supply Chain invests in new business
In the Supply Chain division, capital expenditure amounted to €304 million in the reporting year (previous year: €277 million). Of this amount, €263 million related to the Supply Chain business unit, €26 million to Williams Lea and €15 million to central entities. Approximately 50 % of the funds were used to support new business globally. In the Americas and Asia Pacific regions, investments focused primarily on new business in the Consumer, Retail and Automotive sectors. In Europe, the majority of capital expend-iture was used for customer projects in the UK Consumer sector and the Retail sector in Germany. Investments were also made to renew the fleet in the UK and in Africa. In the Williams Lea business unit, the main focus of our investments was on IT infrastructure.
Cross-divisional investments decline
Cross-divisional capital expenditure fell from €407 million in the prior year to €380 mil-lion in 2014, due predominantly to lower expenditure for real estate. By contrast, invest-ments in vehicles and IT equipment increased year-on-year.
Higher operating cash flow
Net cash from operating activities amounted to €3,040 million in financial year 2014, up €51 million on the previous year. The improved EBIT contributed €100 million to this increase. The depreciation, amortisation and impairment losses contained in EBIT are non-cash effects and are therefore eliminated. They increased by €44 million, mainly due to impairment losses recognised on aircraft. The change in provisions rose from €–500 million to €–698 million, partially due to the reversal of restructuring provisions in the Express division. At €3,061 million, net cash from operating activities before changes in working capital was €17 million down on the previous year. Thanks to better working capital management, the changes in working capital led to a lower cash outflow of €21 million, compared with a cash outflow of €89 million in the previous year.
Cash paid to acquire property, plant and equipment and intangible assets increased considerably during the reporting year from €1,381 million to €1,750 million. By con-trast, the changes in current financial assets in particular led to a significant net cash inflow of €405 million: the sale of money market funds at the beginning of the year resulted in a cash inflow of €600 million, whilst towards the end of the year we reinvested surplus liquid funds of €200 million on the capital market on a short-term basis. In the previous year, the investment of short-term liquidity had led to a net cash outflow of €575 million. In total, at €1,087 million, net cash used in investing activities was signifi-cantly lower than in the previous year (€1,765 million).
A.42 operating cash flow by division, 2014
€m
PeP
1,085
Express
1,689
Global Forwarding, Freight
181
Supply Chain
673
Deutsche Post DHL Group — 2014 Annual Report
57Group Management Report — rePorT on eConoMIC PoSITIon — Financial position
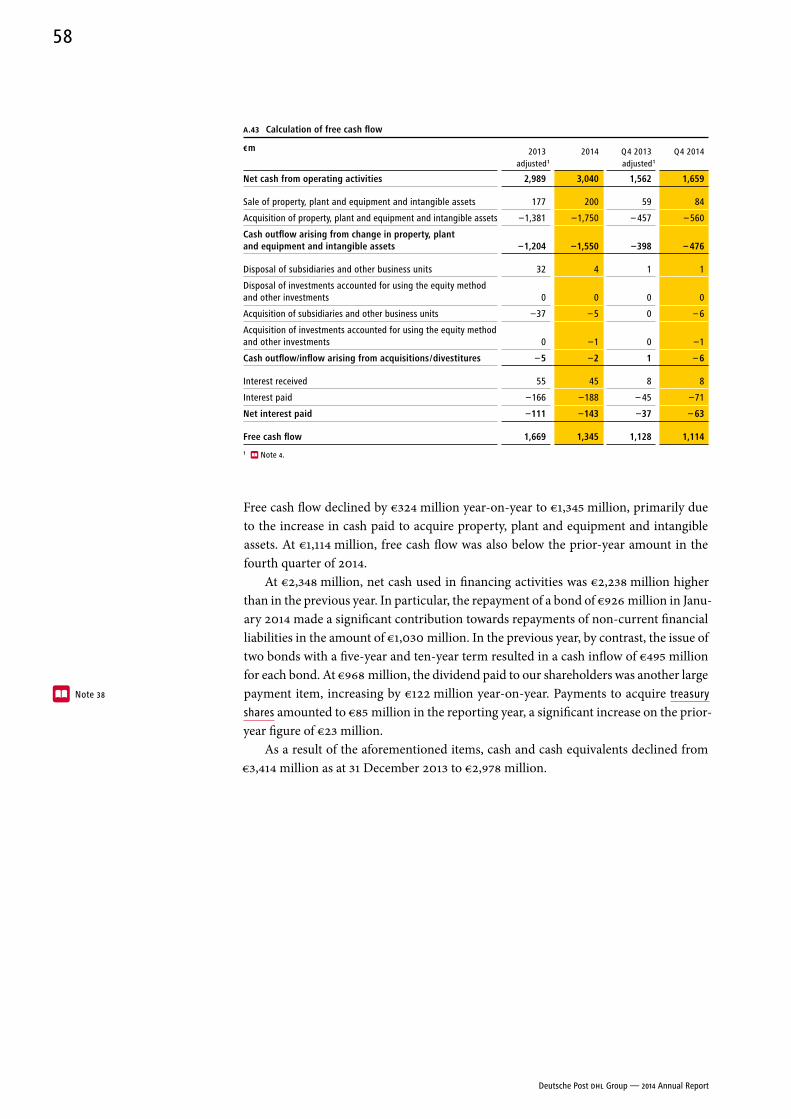
A.43 Calculation of free cash flow
€ m 2013 adjusted 1
2014 Q 4 2013 adjusted 1
Q 4 2014
net cash from operating activities 2,989 3,040 1,562 1,659
Sale of property, plant and equipment and intangible assets 177 200 59 84
Acquisition of property, plant and equipment and intangible assets –1,381 –1,750 – 457 – 560
Cash outflow arising from change in property, plant and equipment and intangible assets –1,204 –1,550 –398 – 476
Disposal of subsidiaries and other business units 32 4 1 1
Disposal of investments accounted for using the equity method and other investments 0 0 0 0
Acquisition of subsidiaries and other business units –37 – 5 0 – 6
Acquisition of investments accounted for using the equity method and other investments 0 –1 0 –1
Cash outflow/inflow arising from acquisitions / divestitures – 5 –2 1 – 6
Interest received 55 45 8 8
Interest paid –166 –188 – 45 –71
net interest paid –111 –143 –37 – 63
Free cash flow 1,669 1,345 1,128 1,114
1 Note 4.
Free cash flow declined by €324 million year-on-year to €1,345 million, primarily due to the increase in cash paid to acquire property, plant and equipment and intangible assets. At €1,114 million, free cash flow was also below the prior-year amount in the fourth quarter of 2014.
At €2,348 million, net cash used in financing activities was €2,238 million higher than in the previous year. In particular, the repayment of a bond of €926 million in Janu-ary 2014 made a significant contribution towards repayments of non-current financial liabilities in the amount of €1,030 million. In the previous year, by contrast, the issue of two bonds with a five-year and ten-year term resulted in a cash inflow of €495 million for each bond. At €968 million, the dividend paid to our shareholders was another large payment item, increasing by €122 million year-on-year. Payments to acquire treasury
shares amounted to €85 million in the reporting year, a significant increase on the prior- year figure of €23 million.
As a result of the aforementioned items, cash and cash equivalents declined from €3,414 million as at 31 December 2013 to €2,978 million.
Note 38
Deutsche Post DHL Group — 2014 Annual Report
58
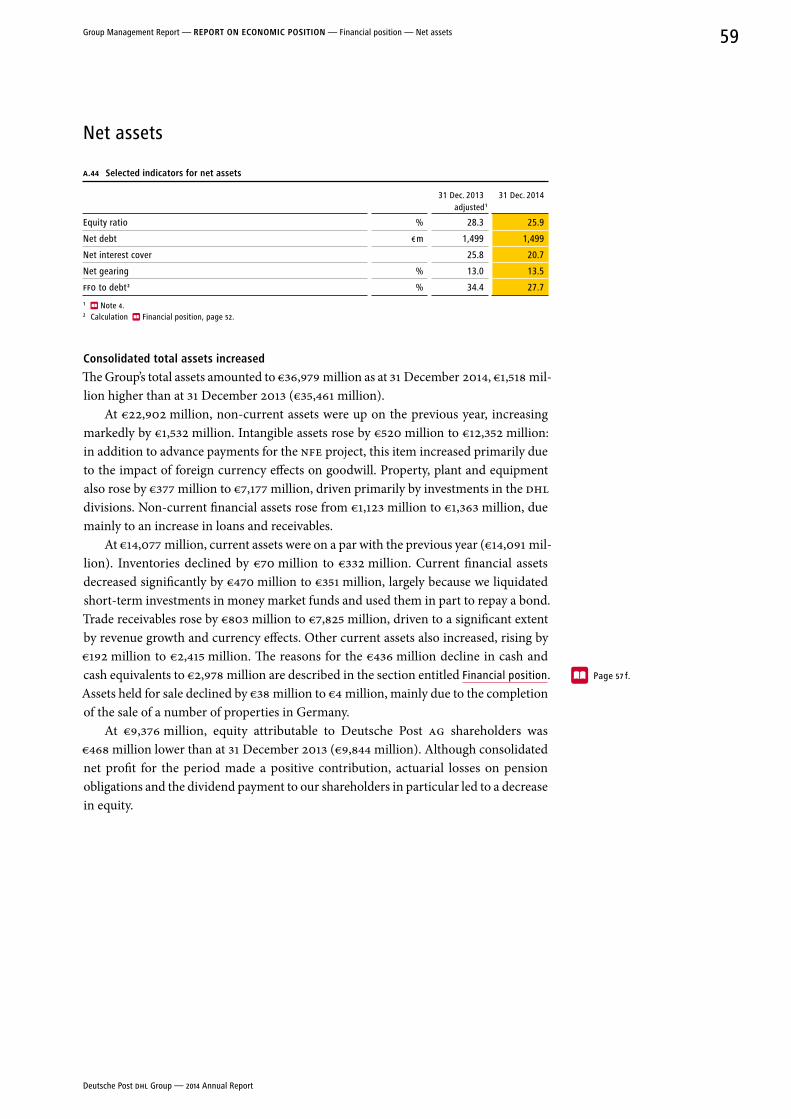
Net assets
A.44 Selected indicators for net assets
31 Dec. 2013 adjusted 1
31 Dec. 2014
Equity ratio % 28.3 25.9
Net debt € m 1,499 1,499
Net interest cover 25.8 20.7
Net gearing % 13.0 13.5
FFO to debt 2 % 34.4 27.7
1 Note 4.2 Calculation Financial position, page 52.
Consolidated total assets increased
The Group’s total assets amounted to €36,979 million as at 31 December 2014, €1,518 mil-lion higher than at 31 December 2013 (€35,461 million).
At €22,902 million, non-current assets were up on the previous year, increasing markedly by €1,532 million. Intangible assets rose by €520 million to €12,352 million: in addition to advance payments for the NFE project, this item increased primarily due to the impact of foreign currency effects on goodwill. Property, plant and equipment also rose by €377 million to €7,177 million, driven primarily by investments in the DHL divisions. Non-current financial assets rose from €1,123 million to €1,363 million, due mainly to an increase in loans and receivables.
At €14,077 million, current assets were on a par with the previous year (€14,091 mil-lion). Inventories declined by €70 million to €332 million. Current financial assets decreased significantly by €470 million to €351 million, largely because we liquidated short-term investments in money market funds and used them in part to repay a bond. Trade receivables rose by €803 million to €7,825 million, driven to a significant extent by revenue growth and currency effects. Other current assets also increased, rising by €192 million to €2,415 million. The reasons for the €436 million decline in cash and cash equivalents to €2,978 million are described in the section entitled Financial position. Assets held for sale declined by €38 million to €4 million, mainly due to the completion of the sale of a number of properties in Germany.
At €9,376 million, equity attributable to Deutsche Post AG shareholders was €468 million lower than at 31 December 2013 (€9,844 million). Although consolidated net profit for the period made a positive contribution, actuarial losses on pension obligations and the dividend payment to our shareholders in particular led to a decrease in equity.
Page 57 f.
Deutsche Post DHL Group — 2014 Annual Report
59Group Management Report — rePorT on eConoMIC PoSITIon — Financial position — Net assets
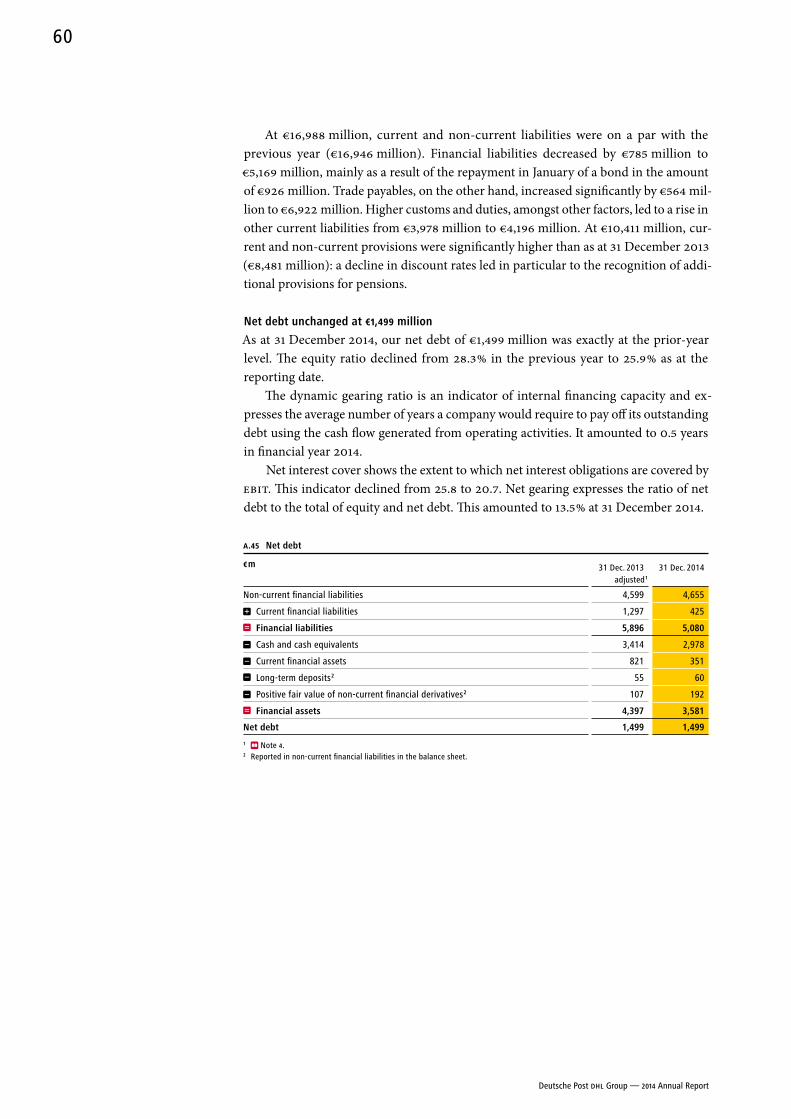
At €16,988 million, current and non-current liabilities were on a par with the previous year (€16,946 million). Financial liabilities decreased by €785 million to €5,169 million, mainly as a result of the repayment in January of a bond in the amount of €926 million. Trade payables, on the other hand, increased significantly by €564 mil-lion to €6,922 million. Higher customs and duties, amongst other factors, led to a rise in other current liabilities from €3,978 million to €4,196 million. At €10,411 million, cur-rent and non-current provisions were significantly higher than as at 31 December 2013 (€8,481 million): a decline in discount rates led in particular to the recognition of addi-tional provisions for pensions.
net debt unchanged at €1,499 million
As at 31 December 2014, our net debt of €1,499 million was exactly at the prior- year level. The equity ratio declined from 28.3 % in the previous year to 25.9 % as at the reporting date.
The dynamic gearing ratio is an indicator of internal financing capacity and ex-presses the average number of years a company would require to pay off its outstanding debt using the cash flow generated from operating activities. It amounted to 0.5 years in financial year 2014.
Net interest cover shows the extent to which net interest obligations are covered by EBIT. This indicator declined from 25.8 to 20.7. Net gearing expresses the ratio of net debt to the total of equity and net debt. This amounted to 13.5 % at 31 December 2014.
A.45 net debt
€ m 31 Dec. 2013 adjusted 1
31 Dec. 2014
Non-current financial liabilities 4,599 4,655
Current financial liabilities 1,297 425
Financial liabilities 5,896 5,080
Cash and cash equivalents 3,414 2,978
Current financial assets 821 351
Long-term deposits 2 55 60
Positive fair value of non-current financial derivatives 2 107 192
Financial assets 4,397 3,581
net debt 1,499 1,499
1 Note 4.2 Reported in non-current financial liabilities in the balance sheet.
Deutsche Post DHL Group — 2014 Annual Report
60
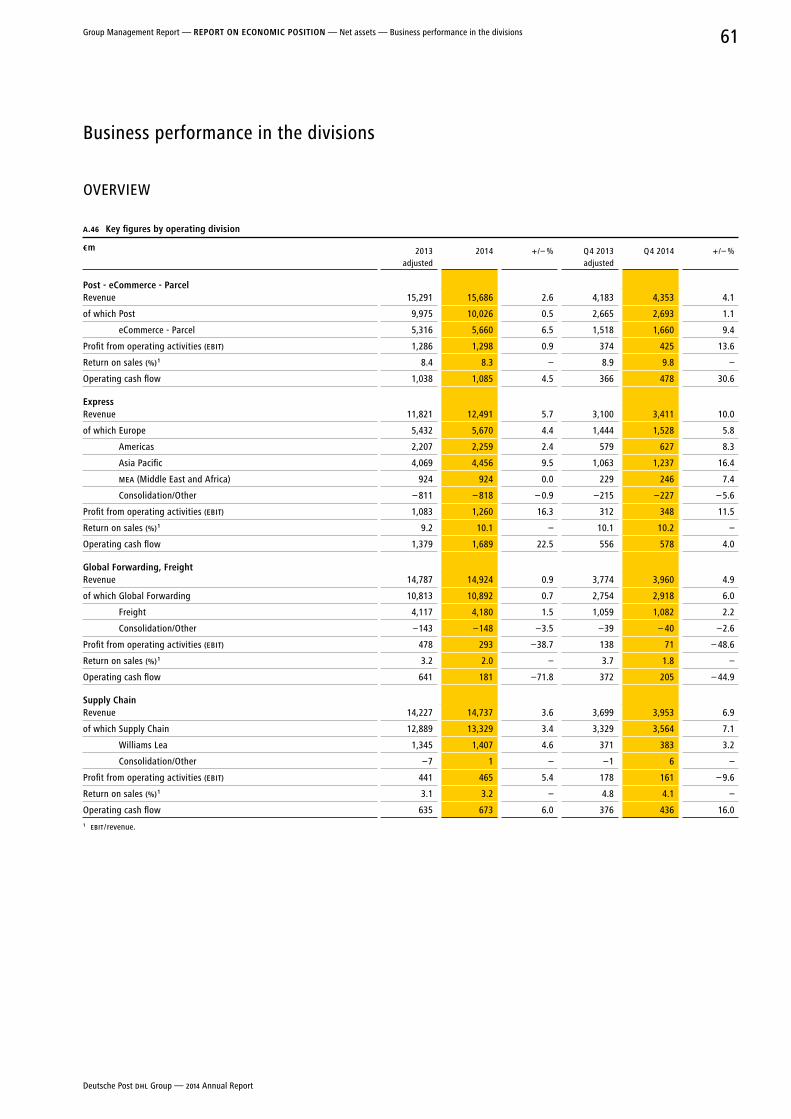
Business performance in the divisions
OVERVIEW
A.46 Key figures by operating division
€ m 2013 adjusted
2014 + / – % Q 4 2013 adjusted
Q 4 2014 + / – %
Post - eCommerce - ParcelRevenue 15,291 15,686 2.6 4,183 4,353 4.1
of which Post 9,975 10,026 0.5 2,665 2,693 1.1
eCommerce - Parcel 5,316 5,660 6.5 1,518 1,660 9.4
Profit from operating activities (EBIT) 1,286 1,298 0.9 374 425 13.6
Return on sales (%) 1 8.4 8.3 – 8.9 9.8 –
Operating cash flow 1,038 1,085 4.5 366 478 30.6
expressRevenue 11,821 12,491 5.7 3,100 3,411 10.0
of which Europe 5,432 5,670 4.4 1,444 1,528 5.8
Americas 2,207 2,259 2.4 579 627 8.3
Asia Pacific 4,069 4,456 9.5 1,063 1,237 16.4
MEA (Middle East and Africa) 924 924 0.0 229 246 7.4
Consolidation/Other – 811 – 818 – 0.9 –215 –227 – 5.6
Profit from operating activities (EBIT) 1,083 1,260 16.3 312 348 11.5
Return on sales (%) 1 9.2 10.1 – 10.1 10.2 –
Operating cash flow 1,379 1,689 22.5 556 578 4.0
Global Forwarding, FreightRevenue 14,787 14,924 0.9 3,774 3,960 4.9
of which Global Forwarding 10,813 10,892 0.7 2,754 2,918 6.0
Freight 4,117 4,180 1.5 1,059 1,082 2.2
Consolidation/Other –143 –148 –3.5 –39 – 40 –2.6
Profit from operating activities (EBIT) 478 293 –38.7 138 71 – 48.6
Return on sales (%) 1 3.2 2.0 – 3.7 1.8 –
Operating cash flow 641 181 –71.8 372 205 – 44.9
Supply ChainRevenue 14,227 14,737 3.6 3,699 3,953 6.9
of which Supply Chain 12,889 13,329 3.4 3,329 3,564 7.1
Williams Lea 1,345 1,407 4.6 371 383 3.2
Consolidation/Other –7 1 – –1 6 –
Profit from operating activities (EBIT) 441 465 5.4 178 161 – 9.6
Return on sales (%) 1 3.1 3.2 – 4.8 4.1 –
Operating cash flow 635 673 6.0 376 436 16.01 EBIT / revenue.
Deutsche Post DHL Group — 2014 Annual Report
61Group Management Report — rePorT on eConoMIC PoSITIon — Net assets — Business performance in the divisions
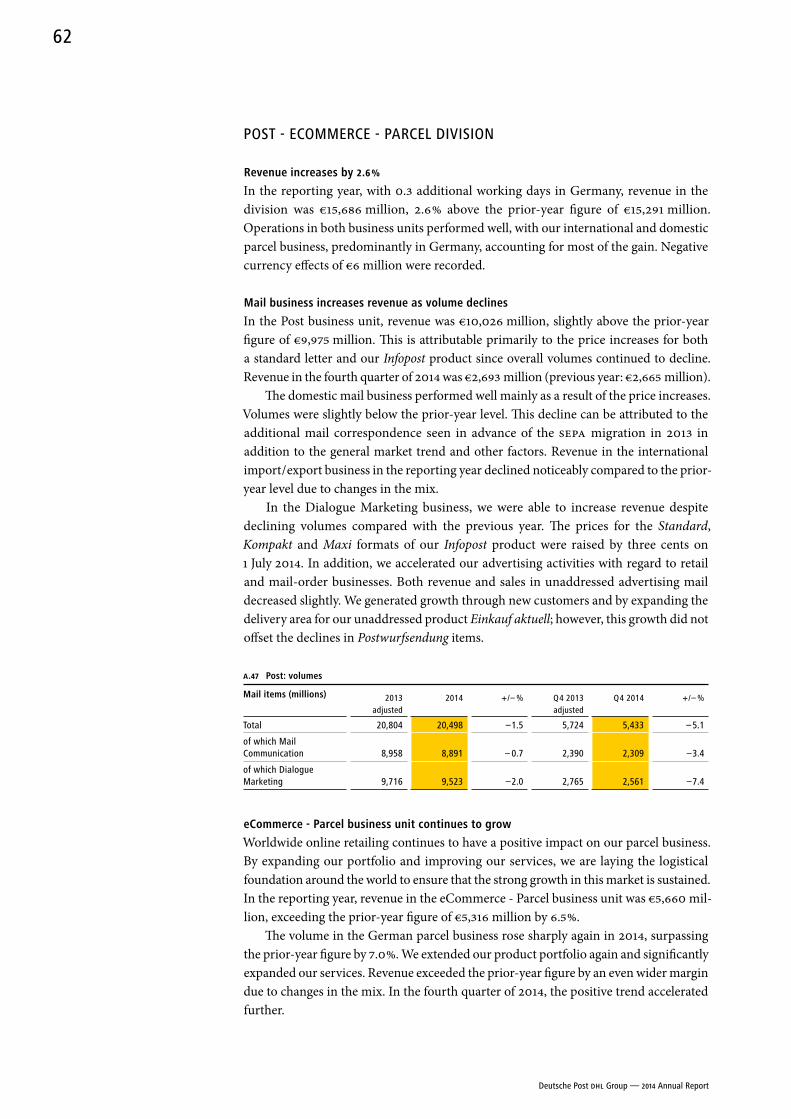
POST - ECOMMERCE - PARCEL DIVISION
revenue increases by 2.6 %
In the reporting year, with 0.3 additional working days in Germany, revenue in the division was €15,686 million, 2.6 % above the prior- year figure of €15,291 million. Operations in both business units performed well, with our international and domestic parcel business, predominantly in Germany, accounting for most of the gain. Negative currency effects of €6 million were recorded.
Mail business increases revenue as volume declines
In the Post business unit, revenue was €10,026 million, slightly above the prior-year figure of €9,975 million. This is attributable primarily to the price increases for both a standard letter and our Infopost product since overall volumes continued to decline. Revenue in the fourth quarter of 2014 was €2,693 million (previous year: €2,665 million).
The domestic mail business performed well mainly as a result of the price increases. Volumes were slightly below the prior-year level. This decline can be attributed to the additional mail correspondence seen in advance of the SEPA migration in 2013 in addition to the general market trend and other factors. Revenue in the international import / export business in the reporting year declined noticeably compared to the prior- year level due to changes in the mix.
In the Dialogue Marketing business, we were able to increase revenue despite declining volumes compared with the previous year. The prices for the Standard, Kompakt and Maxi formats of our Infopost product were raised by three cents on 1 July 2014. In addition, we accelerated our advertising activities with regard to retail and mail-order businesses. Both revenue and sales in unaddressed advertising mail decreased slightly. We generated growth through new customers and by expanding the delivery area for our unaddressed product Einkauf aktuell; however, this growth did not offset the declines in Postwurfsendung items.
A.47 Post: volumes
Mail items (millions) 2013 adjusted
2014 + / – % Q 4 2013 adjusted
Q 4 2014 + / – %
Total 20,804 20,498 –1.5 5,724 5,433 – 5.1
of which Mail Communication 8,958 8,891 – 0.7 2,390 2,309 –3.4
of which Dialogue Marketing 9,716 9,523 –2.0 2,765 2,561 –7.4
eCommerce - Parcel business unit continues to grow
Worldwide online retailing continues to have a positive impact on our parcel business. By expanding our portfolio and improving our services, we are laying the logistical foundation around the world to ensure that the strong growth in this market is sustained. In the reporting year, revenue in the eCommerce - Parcel business unit was €5,660 mil-lion, exceeding the prior-year figure of €5,316 million by 6.5 %.
The volume in the German parcel business rose sharply again in 2014, surpassing the prior-year figure by 7.0 %. We extended our product portfolio again and significantly expanded our services. Revenue exceeded the prior-year figure by an even wider margin due to changes in the mix. In the fourth quarter of 2014, the positive trend accelerated further.
Deutsche Post DHL Group — 2014 Annual Report
62
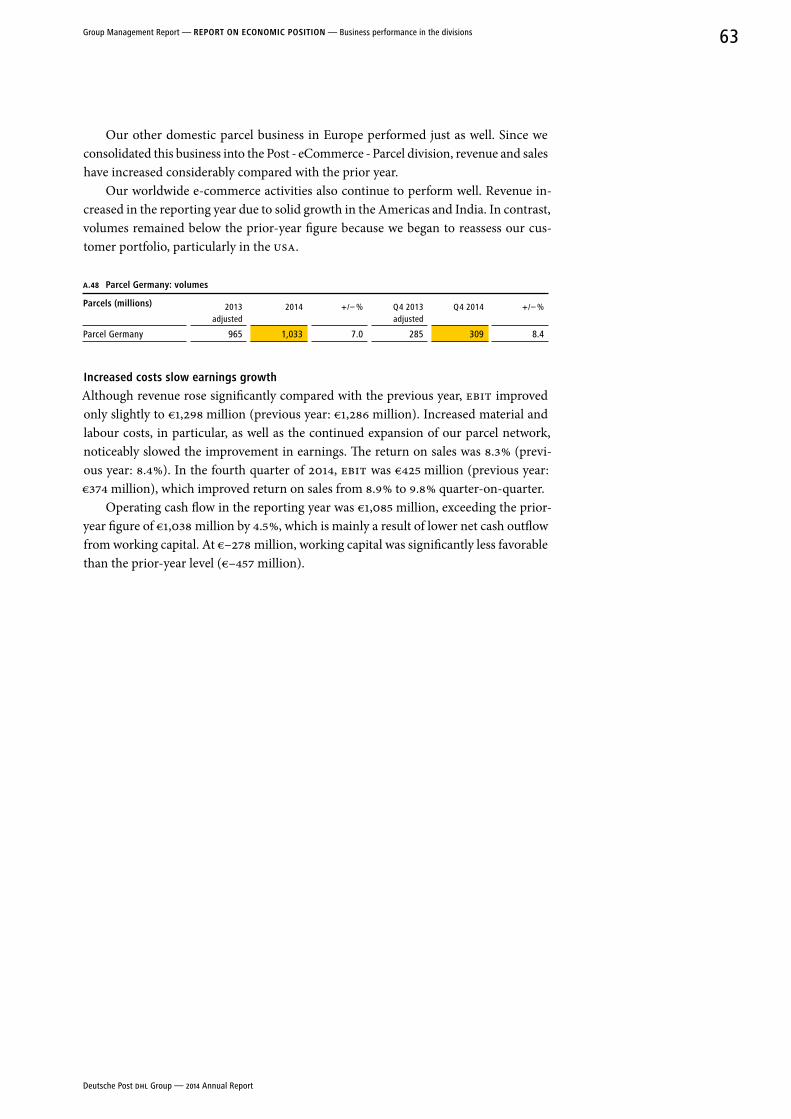
Our other domestic parcel business in Europe performed just as well. Since we consolidated this business into the Post - eCommerce - Parcel division, revenue and sales have increased considerably compared with the prior year.
Our worldwide e-commerce activities also continue to perform well. Revenue in-creased in the reporting year due to solid growth in the Americas and India. In contrast, volumes remained below the prior-year figure because we began to reassess our cus-tomer portfolio, particularly in the USA.
A.48 Parcel Germany: volumes
Parcels (millions) 2013 adjusted
2014 + / – % Q 4 2013 adjusted
Q 4 2014 + / – %
Parcel Germany 965 1,033 7.0 285 309 8.4
Increased costs slow earnings growth
Although revenue rose significantly compared with the previous year, EBIT improved only slightly to €1,298 million (previous year: €1,286 million). Increased material and labour costs, in particular, as well as the continued expansion of our parcel network, noticeably slowed the improvement in earnings. The return on sales was 8.3 % (previ-ous year: 8.4 %). In the fourth quarter of 2014, EBIT was €425 million (previous year: €374 million), which improved return on sales from 8.9 % to 9.8 % quarter-on-quarter.
Operating cash flow in the reporting year was €1,085 million, exceeding the prior- year figure of €1,038 million by 4.5 %, which is mainly a result of lower net cash outflow from working capital. At €–278 million, working capital was significantly less favorable than the prior-year level (€–457 million).
Deutsche Post DHL Group — 2014 Annual Report
63Group Management Report — rePorT on eConoMIC PoSITIon — Business performance in the divisions
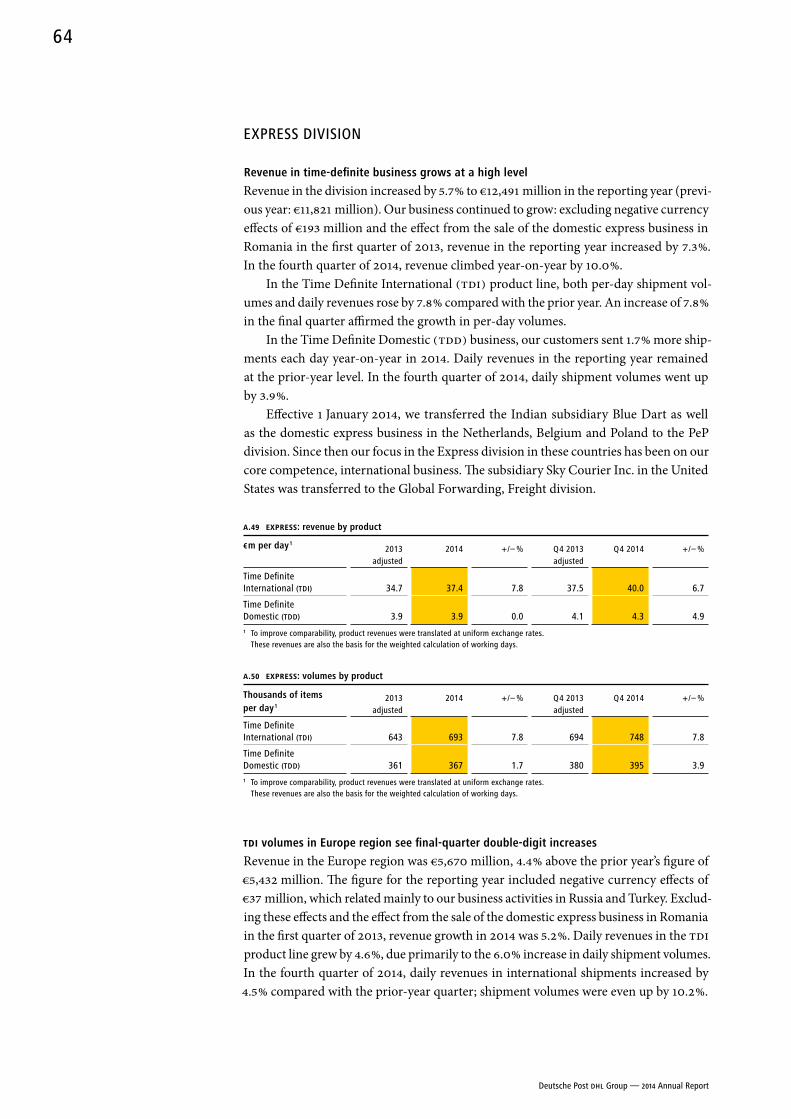
EXPRESS DIVISION
revenue in time-definite business grows at a high level
Revenue in the division increased by 5.7 % to €12,491 million in the reporting year (previ-ous year: €11,821 million). Our business continued to grow: excluding negative currency effects of €193 million and the effect from the sale of the domestic express business in Romania in the first quarter of 2013, revenue in the reporting year increased by 7.3 %. In the fourth quarter of 2014, revenue climbed year-on-year by 10.0 %.
In the Time Definite International (TDI) product line, both per-day shipment vol-umes and daily revenues rose by 7.8 % compared with the prior year. An increase of 7.8 % in the final quarter affirmed the growth in per-day volumes.
In the Time Definite Domestic (TDD) business, our customers sent 1.7 % more ship-ments each day year-on-year in 2014. Daily revenues in the reporting year remained at the prior-year level. In the fourth quarter of 2014, daily shipment volumes went up by 3.9 %.
Effective 1 January 2014, we transferred the Indian subsidiary Blue Dart as well as the domestic express business in the Netherlands, Belgium and Poland to the PeP division. Since then our focus in the Express division in these countries has been on our core competence, international business. The subsidiary Sky Courier Inc. in the United States was transferred to the Global Forwarding, Freight division.
A.49 EXPRESS: revenue by product
€ m per day 1 2013 adjusted
2014 + / – % Q 4 2013 adjusted
Q 4 2014 + / – %
Time Definite International (TDI) 34.7 37.4 7.8 37.5 40.0 6.7
Time Definite Domestic (TDD) 3.9 3.9 0.0 4.1 4.3 4.91 To improve comparability, product revenues were translated at uniform exchange rates.
These revenues are also the basis for the weighted calculation of working days.
A.50 EXPRESS: volumes by product
Thousands of items per day 1
2013 adjusted
2014 + / – % Q 4 2013 adjusted
Q 4 2014 + / – %
Time Definite International (TDI) 643 693 7.8 694 748 7.8
Time Definite Domestic (TDD) 361 367 1.7 380 395 3.91 To improve comparability, product revenues were translated at uniform exchange rates.
These revenues are also the basis for the weighted calculation of working days.
TDI volumes in europe region see final-quarter double-digit increases
Revenue in the Europe region was €5,670 million, 4.4 % above the prior year’s figure of €5,432 million. The figure for the reporting year included negative currency effects of €37 million, which related mainly to our business activities in Russia and Turkey. Exclud-ing these effects and the effect from the sale of the domestic express business in Romania in the first quarter of 2013, revenue growth in 2014 was 5.2 %. Daily revenues in the TDI product line grew by 4.6 %, due primarily to the 6.0 % increase in daily shipment volumes. In the fourth quarter of 2014, daily revenues in international shipments increased by 4.5 % compared with the prior-year quarter; shipment volumes were even up by 10.2 %.
Deutsche Post DHL Group — 2014 Annual Report
64
Business growth stable in the americas region
Revenue in the Americas region increased by 2.4 % in the reporting year to €2,259 mil-lion (previous year: €2,207 million). The figure for the reporting year included major negative currency effects of €99 million, which related mainly to our business activities in South America – above all Venezuela and Argentina. Excluding these effects, revenue in the region rose by 6.8 % in the reporting year. In the TDI product line, daily revenues and per-day volumes increased by 6.8 % and 7.0 %, respectively. In the fourth quarter of 2014, daily shipment volumes slightly exceeded the prior-year level by 0.5 %.
Performance in asia Pacific region remains dynamic
In the Asia Pacific region, we increased revenue by 9.5 % to €4,456 million (previous year: €4,069 million). The figure for the reporting year included negative currency effects of €41 million. Excluding these effects, the revenue increase was a strong 10.5 %. Daily rev-enues in the TDI product line were up by 11.3 % in 2014, due primarily to the 9.6 % rise in daily shipment volumes. The encouraging growth was also maintained in the fourth quarter: revenues in daily international shipments increased by 11.1 % whilst shipment volumes grew by 8.0 %.
Time-definite shipments rise in the MEA region
In the MEA region (Middle East and Africa), revenue in the reporting year was €924 mil-lion and thus at the prior-year level. Excluding negative currency effects of €11 million, revenue grew by 1.2 % in the reporting year. In the TDI product line, daily revenues increased by 8.7 % and per-day volumes by 10.5 %. In the fourth quarter of 2014 daily revenues in international shipments increased by 8.8 %, and shipment volumes by 10.0 %, compared with the previous quarter.
EBIT exceeds high prior-year figure again
In the reporting year, EBIT in the division increased year-on-year by 16.3 % to €1,260 mil-lion (previous year: €1,083 million). Increased revenues, the higher operating profitabil-ity of our network and strict cost management in particular contributed to this improve-ment. The EBIT figure for the previous year included a €12 million deconsolidation gain on the divestment of the domestic express business in Romania. The reversal of restructuring provisions in the United States resulted in income that was offset mainly by impairment losses on aircraft. Return on sales in the reporting year rose from 9.2 % to 10.1 %. In the final quarter, EBIT climbed by 11.5 % to €348 million, which improved return on sales from 10.1 % to 10.2 %.
As a result of the improved operating profit, operating cash flow increased in the reporting year by 22.5 % to €1,689 million (previous year: €1,379 million).
Deutsche Post DHL Group — 2014 Annual Report
65Group Management Report — rePorT on eConoMIC PoSITIon — Business performance in the divisions
GLOBAL FORWARDING, FREIGHT DIVISION
Freight forwarding volumes recovered slightly during the year
Revenue in the division increased by 0.9 % to €14,924 million in the reporting year (previous year: €14,787 million). Excluding negative currency effects of €339 million, revenue was 3.2 % above the previous year. After declining in the first half of the year, the freight forwarding business recovered slightly over the course of the year. In the fourth quarter, revenue was up year-on-year by 4.9 % to €3,960 million (previous year: €3,774 million). The fourth-quarter figure included positive currency effects of €15 mil-lion. Excluding currency effects, revenue saw a 4.5 % year-on-year increase. Our rev enue continued to be impacted by reduced prices.
In the Global Forwarding business unit, revenue in the reporting year increased slightly by 0.7 % to €10,892 million (previous year: €10,813 million). Excluding negative currency effects of €281 million, the increase was 3.3 %. Gross profit declined by 4.9 % to €2,403 million (previous year: €2,526 million).
Implementation of our NFE strategic project is on-going.
Volume rise in air and ocean freight confirmed
Revenues and volumes in air and ocean freight increased year-on-year in the reporting year.
Our air freight volumes grew in financial year 2014 by 2.4 % compared with the previous year. Margin pressure continued to rise over the course of the year. In light of the falling oil price, major customers engaged in aggressive competitive bidding in the second half of the year. Furthermore, airlines reduced their capacities, in particular along the very busy routes from Asia. Our revenue in the reporting period grew by 2.2 %; however, gross profit declined by 8.9 %. In the fourth quarter, volumes were 2.7 % and revenue 6.6 % above the prior-year quarter.
Ocean freight volumes for 2014 as a whole were up by 4.6 % year-on-year, driven mainly by newly acquired customers and increased volumes from existing customers. Asia remains the largest growth engine. Despite the fact that new, larger vessels are being put into operation, ocean carriers continued to reduce effective capacity and therefore maintain the balance between supply and demand. At the same time, rates were in-creased, which added pressure to the margins. Our ocean freight revenue increased by 1.3 % in the reporting year. Although we implemented strict operational cost control measures, gross profit declined by 4.1 %. In the fourth quarter, volumes were 3.4 % and revenue 9.3 % above the prior-year quarter.
Our industrial project business (in table A.51, reported as part of Other in the Global Forwarding business unit) saw weaker performance compared with the prior year. In the reporting year, the share of revenue related to industrial project business and reported under Other was 34.7 % and therefore down year-on-year (previous year: 37.1 %). Gross profit therefore declined by 10.8 % compared with the prior-year period.
Deutsche Post DHL Group — 2014 Annual Report
66
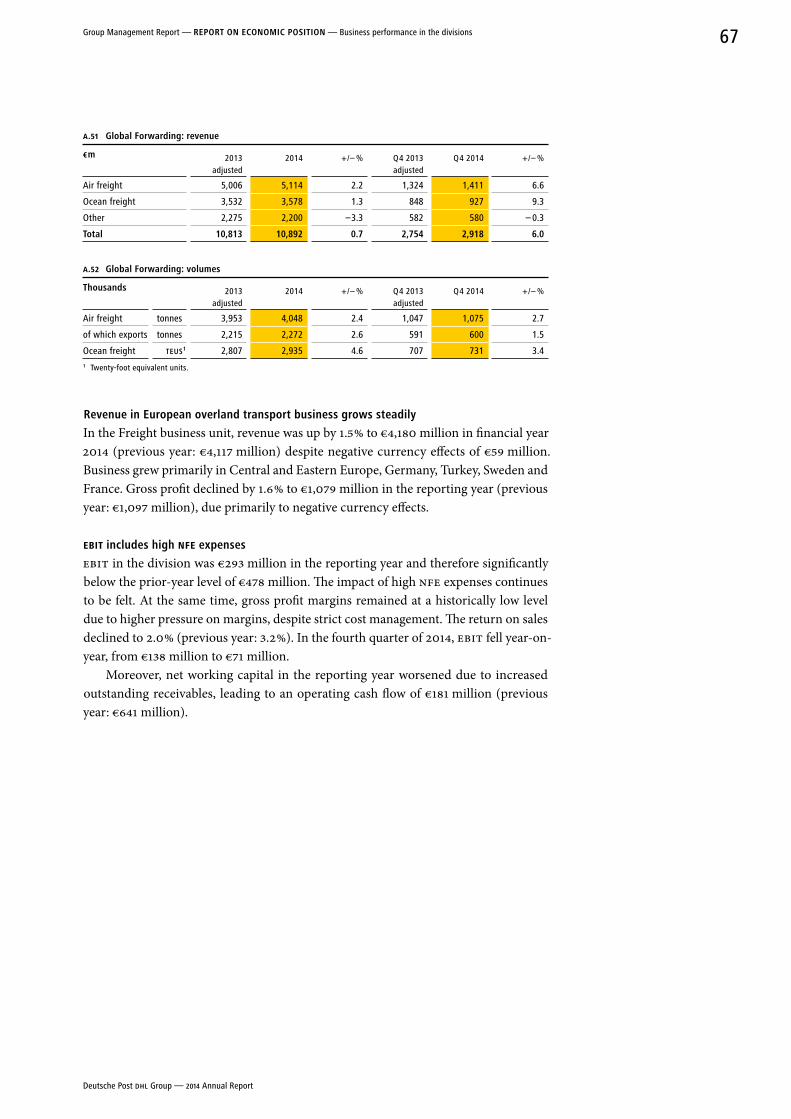
A.51 Global Forwarding: revenue
€ m 2013 adjusted
2014 + / – % Q 4 2013 adjusted
Q 4 2014 + / – %
Air freight 5,006 5,114 2.2 1,324 1,411 6.6
Ocean freight 3,532 3,578 1.3 848 927 9.3
Other 2,275 2,200 –3.3 582 580 – 0.3
Total 10,813 10,892 0.7 2,754 2,918 6.0
A.52 Global Forwarding: volumes
Thousands
2013
adjusted2014 + / – % Q 4 2013
adjustedQ 4 2014 + / – %
Air freight tonnes 3,953 4,048 2.4 1,047 1,075 2.7
of which exports tonnes 2,215 2,272 2.6 591 600 1.5
Ocean freight TEUS 1 2,807 2,935 4.6 707 731 3.41 Twenty-foot equivalent units.
revenue in european overland transport business grows steadily
In the Freight business unit, revenue was up by 1.5 % to €4,180 million in financial year 2014 (previous year: €4,117 million) despite negative currency effects of €59 million. Business grew primarily in Central and Eastern Europe, Germany, Turkey, Sweden and France. Gross profit declined by 1.6 % to €1,079 million in the reporting year (previous year: €1,097 million), due primarily to negative currency effects.
EBIT includes high NFE expenses
EBIT in the division was €293 million in the reporting year and therefore significantly below the prior-year level of €478 million. The impact of high NFE expenses continues to be felt. At the same time, gross profit margins remained at a historically low level due to higher pressure on margins, despite strict cost management. The return on sales declined to 2.0 % (previous year: 3.2 %). In the fourth quarter of 2014, EBIT fell year-on-year, from €138 million to €71 million.
Moreover, net working capital in the reporting year worsened due to increased outstanding receivables, leading to an operating cash flow of €181 million (previous year: €641 million).
Deutsche Post DHL Group — 2014 Annual Report
67Group Management Report — rePorT on eConoMIC PoSITIon — Business performance in the divisions
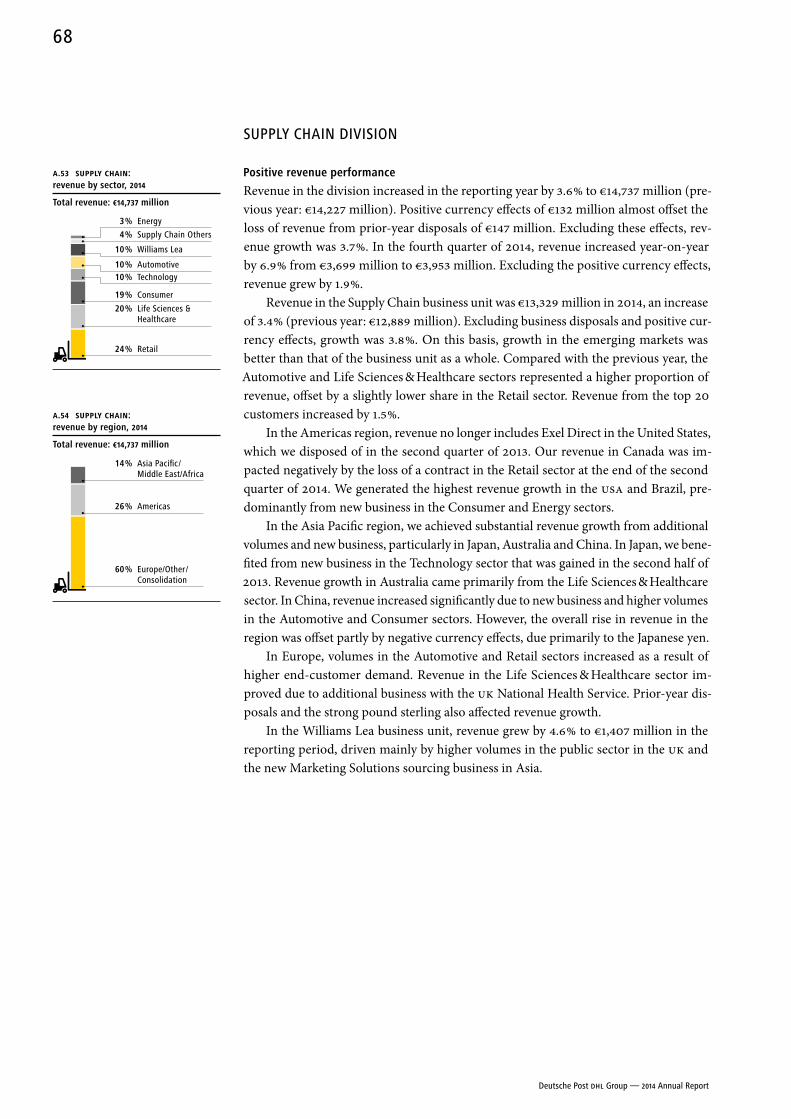
SUPPLY CHAIN DIVISION
Positive revenue performance
Revenue in the division increased in the reporting year by 3.6 % to €14,737 million (pre-vious year: €14,227 million). Positive currency effects of €132 million almost offset the loss of revenue from prior-year disposals of €147 million. Excluding these effects, rev-enue growth was 3.7 %. In the fourth quarter of 2014, revenue increased year-on-year by 6.9 % from €3,699 million to €3,953 million. Excluding the positive currency effects, revenue grew by 1.9 %.
Revenue in the Supply Chain business unit was €13,329 million in 2014, an increase of 3.4 % (previous year: €12,889 million). Excluding business disposals and positive cur-rency effects, growth was 3.8 %. On this basis, growth in the emerging markets was better than that of the business unit as a whole. Compared with the previous year, the Automotive and Life Sciences & Healthcare sectors represented a higher proportion of revenue, offset by a slightly lower share in the Retail sector. Revenue from the top 20 customers increased by 1.5 %.
In the Americas region, revenue no longer includes Exel Direct in the United States, which we disposed of in the second quarter of 2013. Our revenue in Canada was im-pacted negatively by the loss of a contract in the Retail sector at the end of the second quarter of 2014. We generated the highest revenue growth in the USA and Brazil, pre-dominantly from new business in the Consumer and Energy sectors.
In the Asia Pacific region, we achieved substantial revenue growth from additional volumes and new business, particularly in Japan, Australia and China. In Japan, we bene-fited from new business in the Technology sector that was gained in the second half of 2013. Revenue growth in Australia came primarily from the Life Sciences & Healthcare sector. In China, revenue increased significantly due to new business and higher volumes in the Automotive and Consumer sectors. However, the overall rise in revenue in the region was offset partly by negative currency effects, due primarily to the Japanese yen.
In Europe, volumes in the Automotive and Retail sectors increased as a result of higher end-customer demand. Revenue in the Life Sciences & Healthcare sector im-proved due to additional business with the UK National Health Service. Prior-year dis-posals and the strong pound sterling also affected revenue growth.
In the Williams Lea business unit, revenue grew by 4.6 % to €1,407 million in the reporting period, driven mainly by higher volumes in the public sector in the UK and the new Marketing Solutions sourcing business in Asia.
A.53 SUPPLY CHAIN: revenue by sector, 2014
Total revenue: €14,737 million
4 % Supply Chain Others
3 % Energy
10 % Williams Lea
10 % Automotive10 % Technology
20 % Life Sciences & Healthcare
19 % Consumer
24 % Retail
A.54 SUPPLY CHAIN: revenue by region, 2014
Total revenue: €14,737 million
26 % Americas
14 % Asia Pacific / Middle East/Africa
60 % Europe/Other / Consolidation
Deutsche Post DHL Group — 2014 Annual Report
68
new business worth around €1,220 million secured
In the reporting year, the Supply Chain business unit concluded additional contracts worth around €1,220 million in annualised revenue with both new and existing custom-ers in the reporting year. The Consumer, Retail, Automotive, Life Sciences & Healthcare and Technology sectors accounted for the majority of the gains. The annualised contract renewal rate remained at a consistently high level.
EBIT further improved in the reporting year
EBIT in the division was €465 million in the reporting year (previous year: €441 million). The previous year included a gain of €50 million from the adjustment of pension plans as well as charges of €30 million for restructuring, charges associated with the Chapter 11 insolvency filing of a major customer and expenses arising from business disposals. The improved EBIT can be attributed both to the high level of new business and to continuing restructuring programmes. The return on sales was 3.2 % (previous year: 3.1 %). In the fourth quarter of 2014, EBIT decreased from €178 million to €161 million, reflecting pri-marily the prior- year net gain from the pension plan adjustment and restructuring costs.
Operating cash flow for the reporting year increased to €673 million, from €635 mil-lion in the previous year.
Deutsche Post DHL Group — 2014 Annual Report
69Group Management Report — rePorT on eConoMIC PoSITIon — Business performance in the divisions
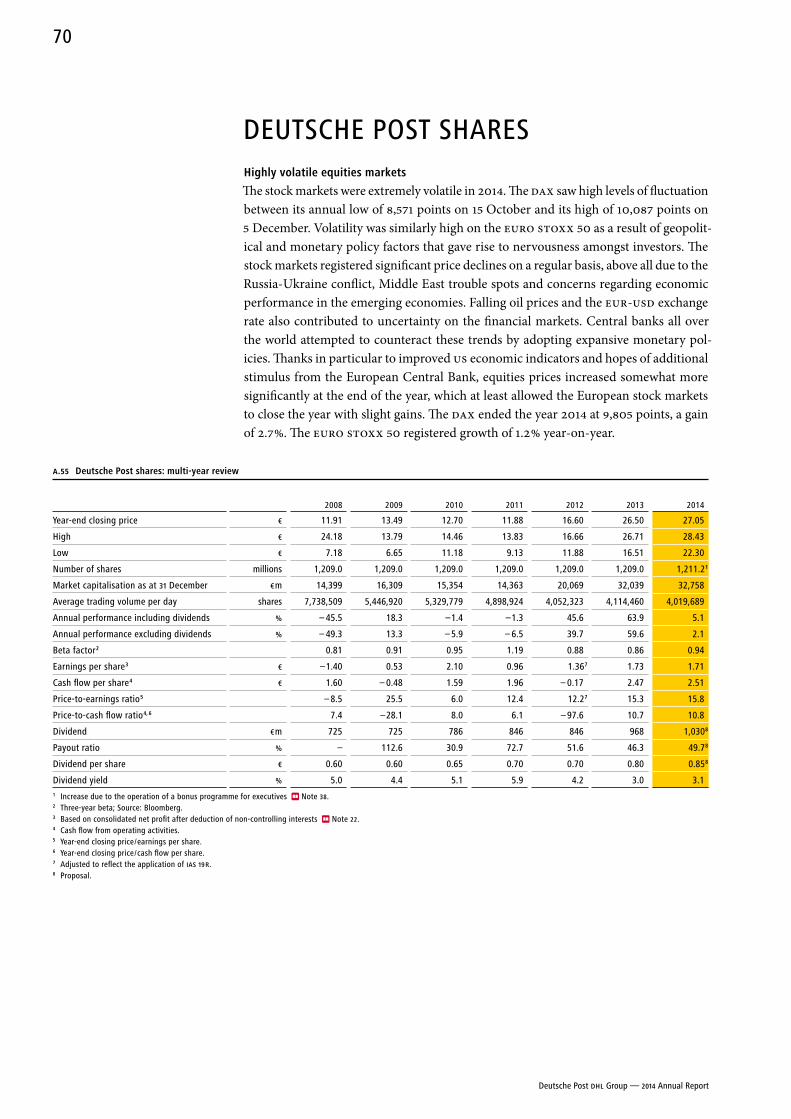
DEUTSCHE POST SHARESHighly volatile equities markets
The stock markets were extremely volatile in 2014. The DAX saw high levels of fluctuation between its annual low of 8,571 points on 15 October and its high of 10,087 points on 5 December. Volatility was similarly high on the EURO STOXX 50 as a result of geopolit-ical and monetary policy factors that gave rise to nervousness amongst investors. The stock markets registered significant price declines on a regular basis, above all due to the Russia-Ukraine conflict, Middle East trouble spots and concerns regarding economic performance in the emerging economies. Falling oil prices and the EUR-USD exchange rate also contributed to uncertainty on the financial markets. Central banks all over the world attempted to counteract these trends by adopting expansive monetary pol-icies. Thanks in particular to improved US economic indicators and hopes of additional stimulus from the European Central Bank, equities prices increased somewhat more significantly at the end of the year, which at least allowed the European stock markets to close the year with slight gains. The DAX ended the year 2014 at 9,805 points, a gain of 2.7 %. The EURO STOXX 50 registered growth of 1.2 % year-on-year.
A.55 Deutsche Post shares: multi-year review
2008 2009 2010 2011 2012 2013 2014
Year-end closing price € 11.91 13.49 12.70 11.88 16.60 26.50 27.05
High € 24.18 13.79 14.46 13.83 16.66 26.71 28.43
Low € 7.18 6.65 11.18 9.13 11.88 16.51 22.30
Number of shares millions 1,209.0 1,209.0 1,209.0 1,209.0 1,209.0 1,209.0 1,211.2 1
Market capitalisation as at 31 December € m 14,399 16,309 15,354 14,363 20,069 32,039 32,758
Average trading volume per day shares 7,738,509 5,446,920 5,329,779 4,898,924 4,052,323 4,114,460 4,019,689
Annual performance including dividends % – 45.5 18.3 –1.4 –1.3 45.6 63.9 5.1
Annual performance excluding dividends % – 49.3 13.3 – 5.9 – 6.5 39.7 59.6 2.1
Beta factor 2 0.81 0.91 0.95 1.19 0.88 0.86 0.94
Earnings per share 3 € –1.40 0.53 2.10 0.96 1.36 7 1.73 1.71
Cash flow per share 4 € 1.60 – 0.48 1.59 1.96 – 0.17 2.47 2.51
Price-to-earnings ratio 5 – 8.5 25.5 6.0 12.4 12.2 7 15.3 15.8
Price-to-cash flow ratio 4, 6 7.4 –28.1 8.0 6.1 – 97.6 10.7 10.8
Dividend € m 725 725 786 846 846 968 1,030 8
Payout ratio % – 112.6 30.9 72.7 51.6 46.3 49.7 8
Dividend per share € 0.60 0.60 0.65 0.70 0.70 0.80 0.85 8
Dividend yield % 5.0 4.4 5.1 5.9 4.2 3.0 3.11 Increase due to the operation of a bonus programme for executives Note 38.2 Three-year beta; Source: Bloomberg.3 Based on consolidated net profit after deduction of non-controlling interests Note 22.4 Cash flow from operating activities.5 Year-end closing price / earnings per share.6 Year-end closing price / cash flow per share.7 Adjusted to reflect the application of IAS 19 R.8 Proposal.
Deutsche Post DHL Group — 2014 Annual Report
70
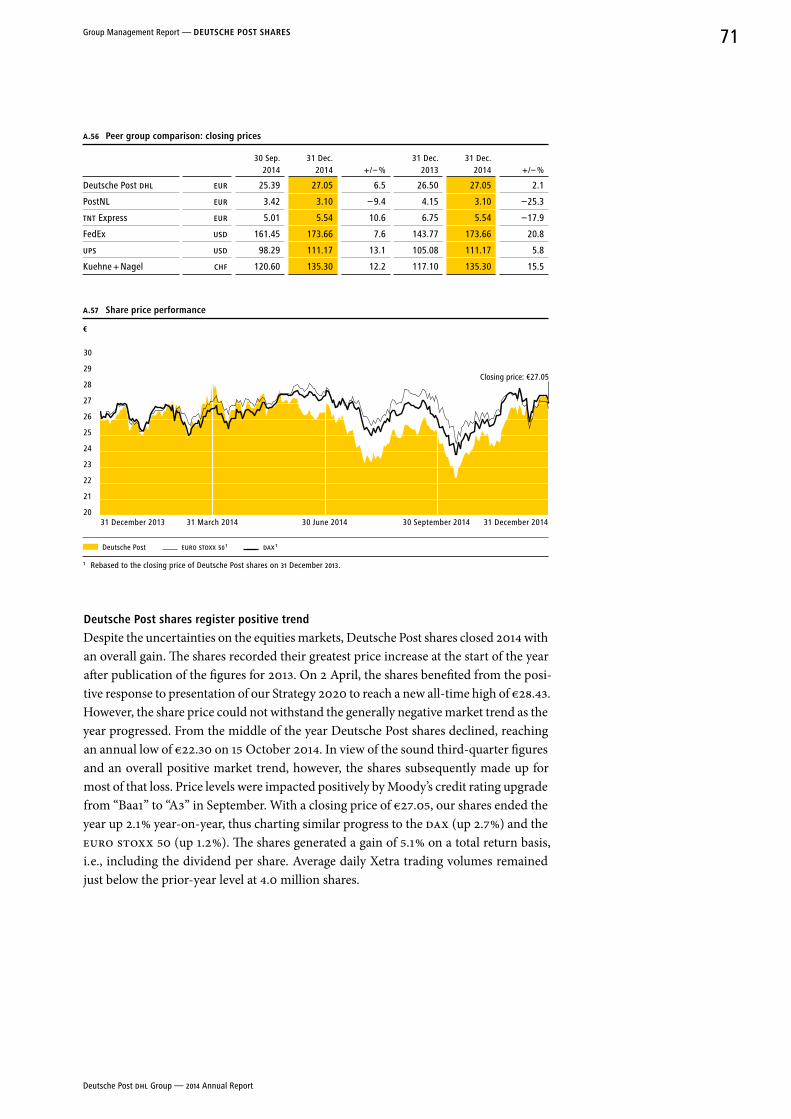
A.56 Peer group comparison: closing prices
30 Sep.
201431 Dec.
2014 + / – %31 Dec.
201331 Dec.
2014 + / – %
Deutsche Post DHL EUR 25.39 27.05 6.5 26.50 27.05 2.1
PostNL EUR 3.42 3.10 – 9.4 4.15 3.10 –25.3
TnT Express EUR 5.01 5.54 10.6 6.75 5.54 –17.9
FedEx USD 161.45 173.66 7.6 143.77 173.66 20.8
UPS USD 98.29 111.17 13.1 105.08 111.17 5.8
Kuehne + Nagel CHF 120.60 135.30 12.2 117.10 135.30 15.5
A.57 Share price performance
€
30
29
28
27
26
25
24
23
22
21
2031 December 2013 31 March 2014 30 June 2014 30 September 2014 31 December 2014
Deutsche Post EURO STOXX 50 1 DAX 1
1 Rebased to the closing price of Deutsche Post shares on 31 December 2013.
Deutsche Post shares register positive trend
Despite the uncertainties on the equities markets, Deutsche Post shares closed 2014 with an overall gain. The shares recorded their greatest price increase at the start of the year after publication of the figures for 2013. On 2 April, the shares benefited from the posi-tive response to presentation of our Strategy 2020 to reach a new all-time high of €28.43. However, the share price could not withstand the generally negative market trend as the year progressed. From the middle of the year Deutsche Post shares declined, reaching an annual low of €22.30 on 15 October 2014. In view of the sound third-quarter figures and an overall positive market trend, however, the shares subsequently made up for most of that loss. Price levels were impacted positively by Moody’s credit rating upgrade from “Baa1” to “A3” in September. With a closing price of €27.05, our shares ended the year up 2.1 % year-on-year, thus charting similar progress to the DAX (up 2.7 %) and the EURO STOXX 50 (up 1.2 %). The shares generated a gain of 5.1 % on a total return basis, i. e., including the dividend per share. Average daily Xetra trading volumes remained just below the prior-year level at 4.0 million shares.
Closing price: €27.05
Deutsche Post DHL Group — 2014 Annual Report
71Group Management Report — DeuTSCHe PoST SHareS
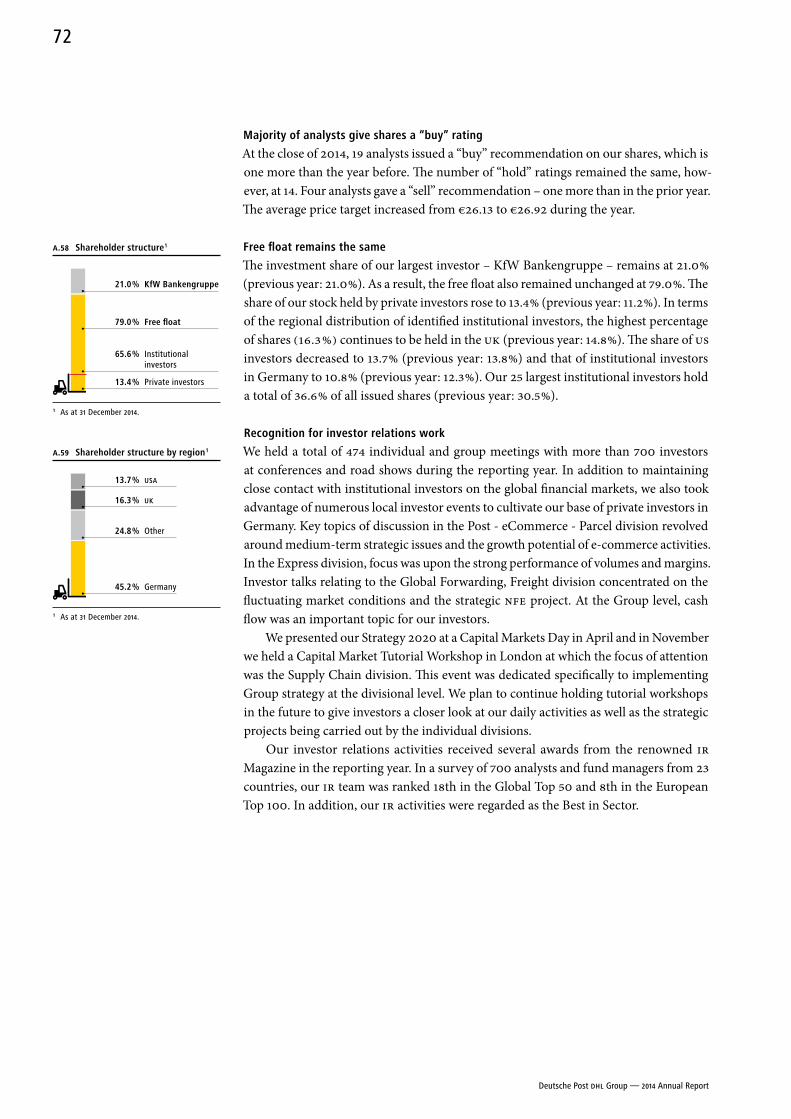
Majority of analysts give shares a “buy” rating
At the close of 2014, 19 analysts issued a “buy” recommendation on our shares, which is one more than the year before. The number of “hold” ratings remained the same, how-ever, at 14. Four analysts gave a “sell” recommendation – one more than in the prior year. The average price target increased from €26.13 to €26.92 during the year.
Free float remains the same
The investment share of our largest investor – KfW Bankengruppe – remains at 21.0 % (previous year: 21.0 %). As a result, the free float also remained unchanged at 79.0 %. The share of our stock held by private investors rose to 13.4 % (previous year: 11.2 %). In terms of the regional distribution of identified institutional investors, the highest percentage of shares (16.3 %) continues to be held in the UK (previous year: 14.8 %). The share of US investors decreased to 13.7 % (previous year: 13.8 %) and that of institutional investors in Germany to 10.8 % (previous year: 12.3 %). Our 25 largest institutional investors hold a total of 36.6 % of all issued shares (previous year: 30.5 %).
recognition for investor relations work
We held a total of 474 individual and group meetings with more than 700 investors at conferences and road shows during the reporting year. In addition to maintaining close contact with institutional investors on the global financial markets, we also took advantage of numerous local investor events to cultivate our base of private investors in Germany. Key topics of discussion in the Post - eCommerce - Parcel division revolved around medium-term strategic issues and the growth potential of e-commerce activities. In the Express division, focus was upon the strong performance of volumes and margins. Investor talks relating to the Global Forwarding, Freight division concentrated on the fluctuating market conditions and the strategic NFE project. At the Group level, cash flow was an important topic for our investors.
We presented our Strategy 2020 at a Capital Markets Day in April and in November we held a Capital Market Tutorial Workshop in London at which the focus of attention was the Supply Chain division. This event was dedicated specifically to implementing Group strategy at the divisional level. We plan to continue holding tutorial workshops in the future to give investors a closer look at our daily activities as well as the strategic projects being carried out by the individual divisions.
Our investor relations activities received several awards from the renowned IR Magazine in the reporting year. In a survey of 700 analysts and fund managers from 23 countries, our IR team was ranked 18th in the Global Top 50 and 8th in the European Top 100. In addition, our IR activities were regarded as the Best in Sector.
A.58 Shareholder structure 1
1 As at 31 December 2014.
21.0 % KfW Bankengruppe
79.0 % Free float
13.4 % Private investors
65.6 % Institutional investors
A.59 Shareholder structure by region 1
1 As at 31 December 2014.
13.7 % USA
16.3 % UK
24.8 % Other
45.2 % Germany
Deutsche Post DHL Group — 2014 Annual Report
72
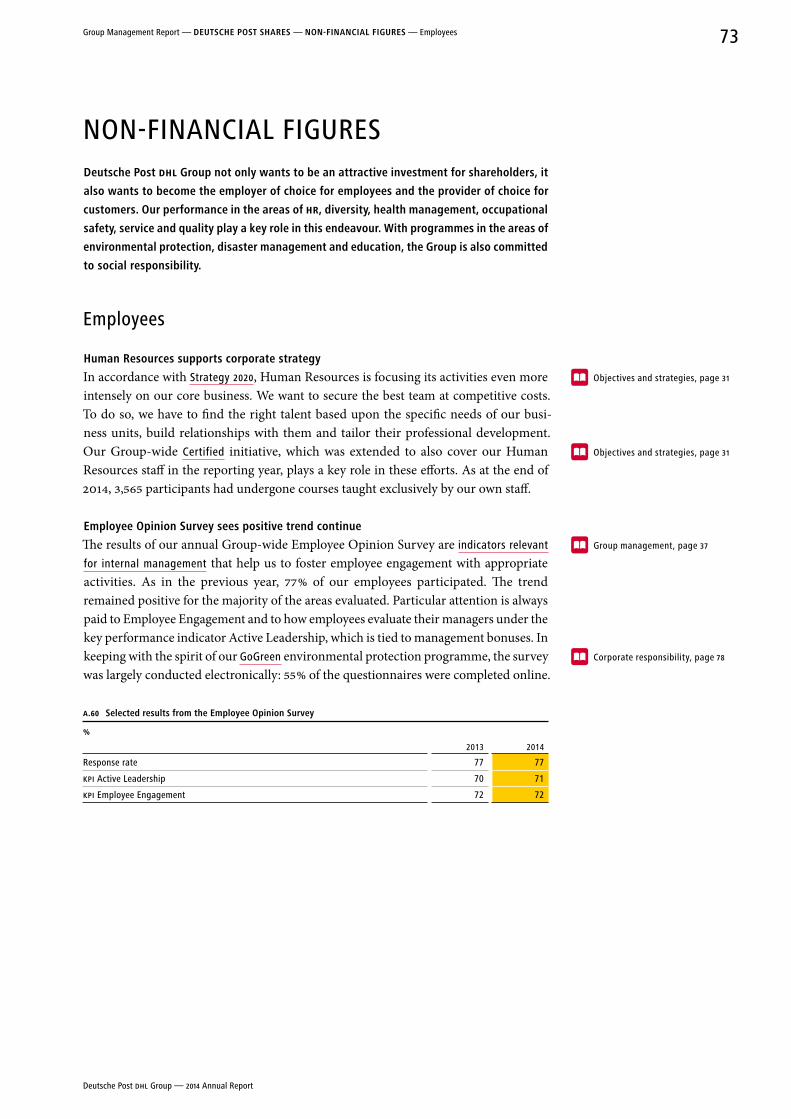
NON-FINANCIAL FIGURESDeutsche Post DHL Group not only wants to be an attractive investment for shareholders, it
also wants to become the employer of choice for employees and the provider of choice for
customers. our performance in the areas of HR, diversity, health management, occupational
safety, service and quality play a key role in this endeavour. With programmes in the areas of
environmental protection, disaster management and education, the Group is also committed
to social responsibility.
Employees
Human resources supports corporate strategy
In accordance with Strategy 2020, Human Resources is focusing its activities even more intensely on our core business. We want to secure the best team at competitive costs. To do so, we have to find the right talent based upon the specific needs of our busi-ness units, build relationships with them and tailor their professional development. Our Group-wide Certified initiative, which was extended to also cover our Human Resources staff in the reporting year, plays a key role in these efforts. As at the end of 2014, 3,565 participants had undergone courses taught exclusively by our own staff.
employee opinion Survey sees positive trend continue
The results of our annual Group-wide Employee Opinion Survey are indicators relevant
for internal management that help us to foster employee engagement with appropriate activities. As in the previous year, 77 % of our employees participated. The trend remained positive for the majority of the areas evaluated. Particular attention is always paid to Employee Engagement and to how employees evaluate their managers under the key performance indicator Active Leadership, which is tied to management bonuses. In keeping with the spirit of our GoGreen environmental protection programme, the survey was largely conducted electronically: 55 % of the questionnaires were completed online.
A.60 Selected results from the employee opinion Survey
%
2013 2014
Response rate 77 77
KPI Active Leadership 70 71
KPI Employee Engagement 72 72
Objectives and strategies, page 31
Objectives and strategies, page 31
Group management, page 37
Corporate responsibility, page 78
Deutsche Post DHL Group — 2014 Annual Report
73Group Management Report — DeuTSCHe PoST SHareS — non-FInanCIaL FIGureS — Employees
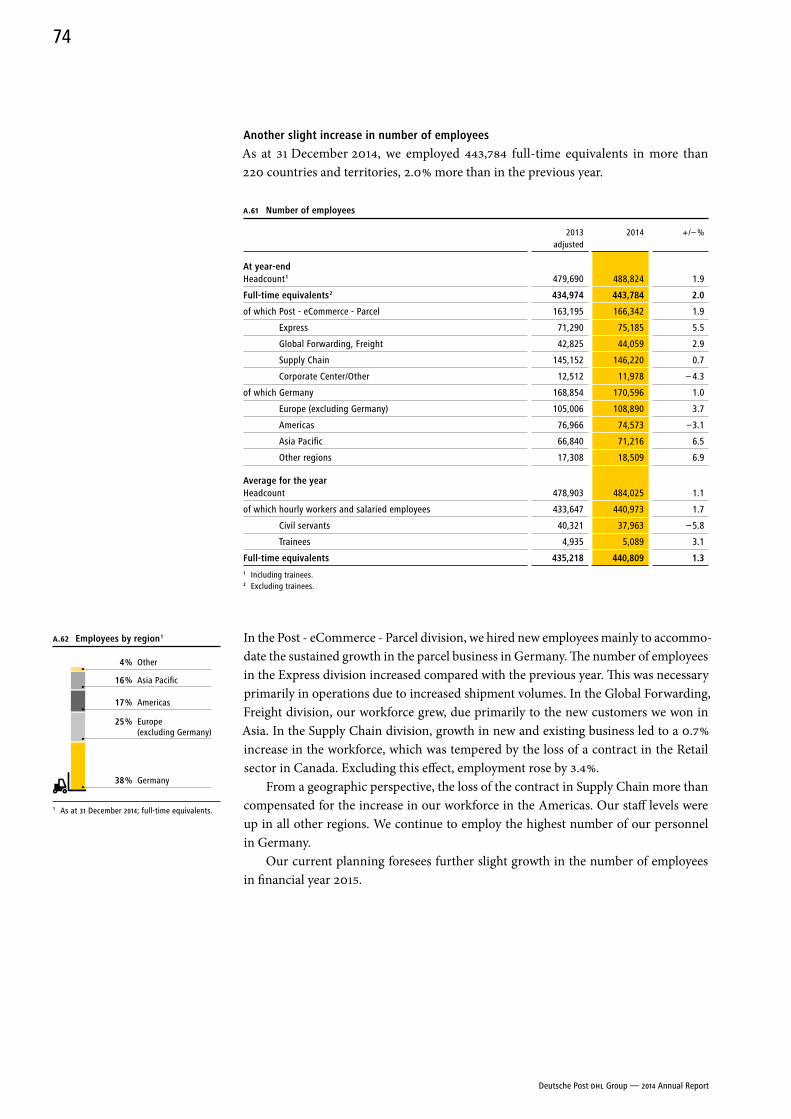
another slight increase in number of employees
As at 31 December 2014, we employed 443,784 full-time equivalents in more than 220 countries and territories, 2.0 % more than in the previous year.
A.61 number of employees
2013 adjusted
2014 + / – %
at year-endHeadcount 1 479,690 488,824 1.9
Full-time equivalents 2 434,974 443,784 2.0
of which Post - eCommerce - Parcel 163,195 166,342 1.9
Express 71,290 75,185 5.5
Global Forwarding, Freight 42,825 44,059 2.9
Supply Chain 145,152 146,220 0.7
Corporate Center/Other 12,512 11,978 – 4.3
of which Germany 168,854 170,596 1.0
Europe (excluding Germany) 105,006 108,890 3.7
Americas 76,966 74,573 –3.1
Asia Pacific 66,840 71,216 6.5
Other regions 17,308 18,509 6.9
average for the yearHeadcount 478,903 484,025 1.1
of which hourly workers and salaried employees 433,647 440,973 1.7
Civil servants 40,321 37,963 – 5.8
Trainees 4,935 5,089 3.1
Full-time equivalents 435,218 440,809 1.31 Including trainees.2 Excluding trainees.
In the Post - eCommerce - Parcel division, we hired new employees mainly to accommo-date the sustained growth in the parcel business in Germany. The number of employees in the Express division increased compared with the previous year. This was necessary primarily in operations due to increased shipment volumes. In the Global Forwarding, Freight division, our workforce grew, due primarily to the new customers we won in Asia. In the Supply Chain division, growth in new and existing business led to a 0.7 % increase in the workforce, which was tempered by the loss of a contract in the Retail sector in Canada. Excluding this effect, employment rose by 3.4 %.
From a geographic perspective, the loss of the contract in Supply Chain more than compensated for the increase in our workforce in the Americas. Our staff levels were up in all other regions. We continue to employ the highest number of our personnel in Germany.
Our current planning foresees further slight growth in the number of employees in financial year 2015.
A.62 employees by region 1
1 As at 31 December 2014; full-time equivalents.
25 % Europe (excluding Germany)
4 % Other
16 % Asia Pacific
17 % Americas
38 % Germany
Deutsche Post DHL Group — 2014 Annual Report
74
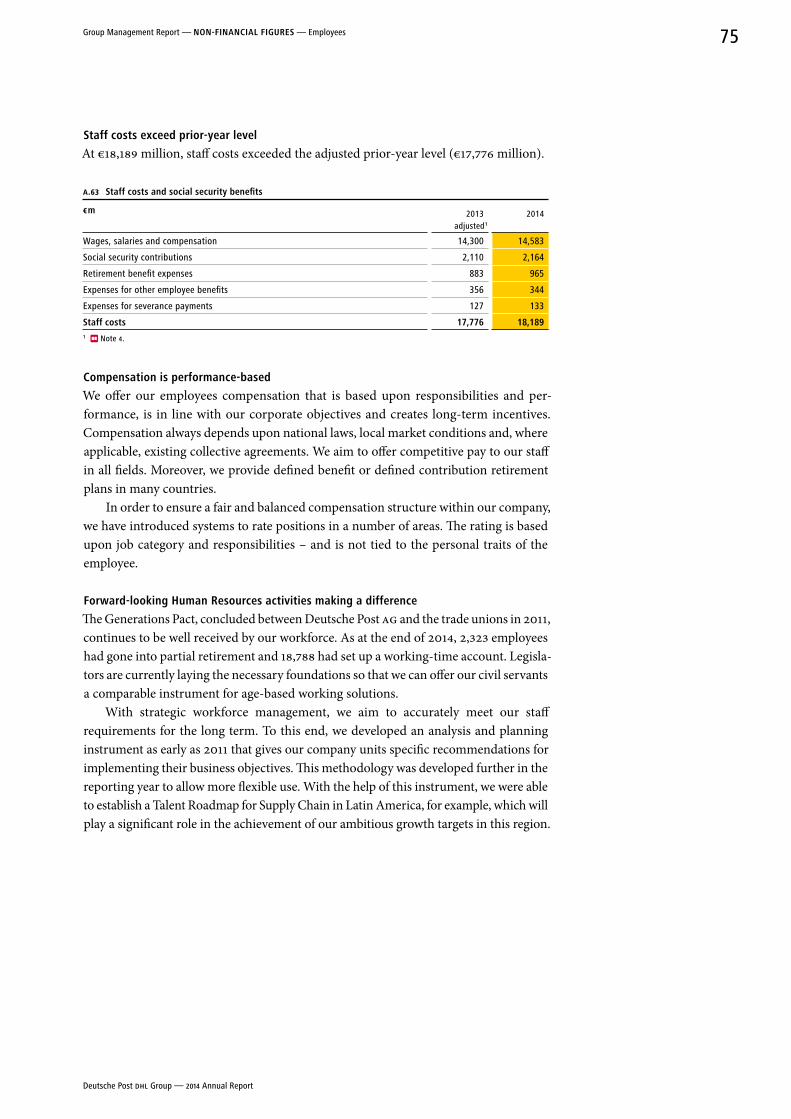
Staff costs exceed prior-year level
At €18,189 million, staff costs exceeded the adjusted prior-year level (€17,776 million).
A.63 Staff costs and social security benefits
€ m 2013 adjusted 1
2014
Wages, salaries and compensation 14,300 14,583
Social security contributions 2,110 2,164
Retirement benefit expenses 883 965
Expenses for other employee benefits 356 344
Expenses for severance payments 127 133
Staff costs 17,776 18,1891 Note 4.
Compensation is performance-based
We offer our employees compensation that is based upon responsibilities and per-formance, is in line with our corporate objectives and creates long-term incentives. Compensation always depends upon national laws, local market conditions and, where applicable, existing collective agreements. We aim to offer competitive pay to our staff in all fields. Moreover, we provide defined benefit or defined contribution retirement plans in many countries.
In order to ensure a fair and balanced compensation structure within our company, we have introduced systems to rate positions in a number of areas. The rating is based upon job category and responsibilities – and is not tied to the personal traits of the employee.
Forward-looking Human resources activities making a difference
The Generations Pact, concluded between Deutsche Post AG and the trade unions in 2011, continues to be well received by our workforce. As at the end of 2014, 2,323 employees had gone into partial retirement and 18,788 had set up a working-time account. Legisla-tors are currently laying the necessary foundations so that we can offer our civil servants a comparable instrument for age-based working solutions.
With strategic workforce management, we aim to accurately meet our staff requirements for the long term. To this end, we developed an analysis and planning instrument as early as 2011 that gives our company units specific recommendations for implementing their business objectives. This methodology was developed further in the reporting year to allow more flexible use. With the help of this instrument, we were able to establish a Talent Roadmap for Supply Chain in Latin America, for example, which will play a significant role in the achievement of our ambitious growth targets in this region.
Deutsche Post DHL Group — 2014 Annual Report
75Group Management Report — non-FInanCIaL FIGureS — Employees
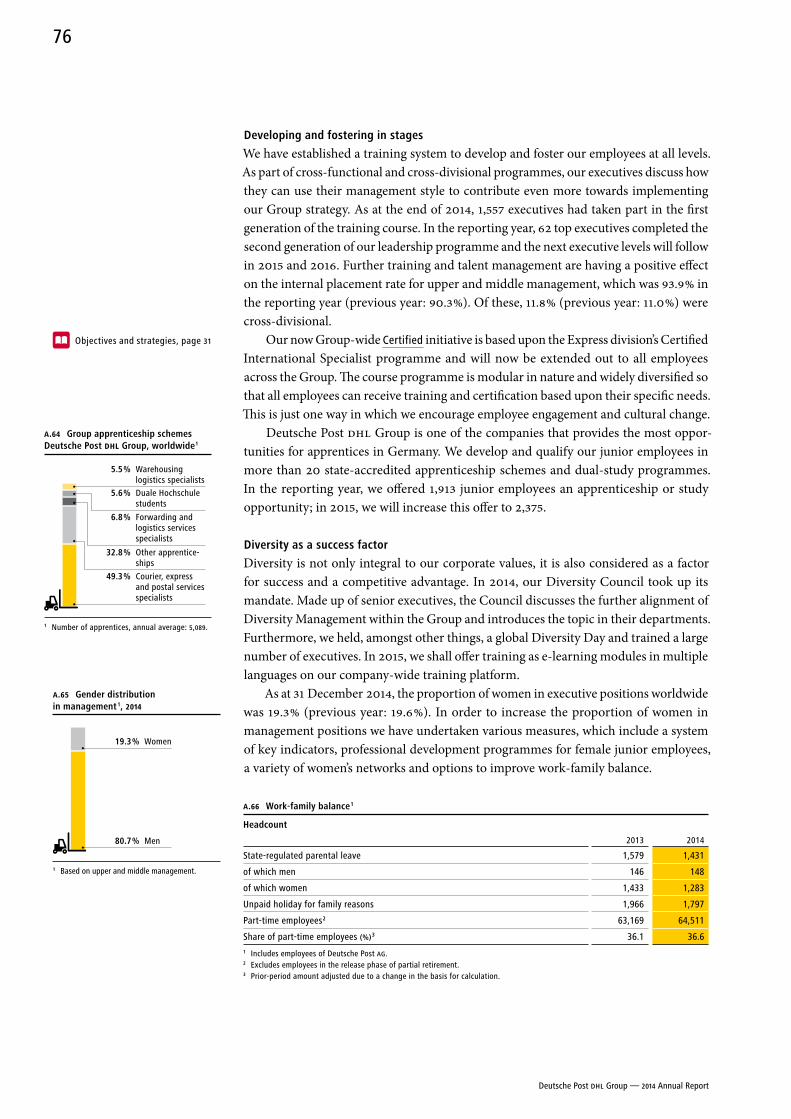
Developing and fostering in stages
We have established a training system to develop and foster our employees at all levels. As part of cross-functional and cross-divisional programmes, our executives discuss how they can use their management style to contribute even more towards implementing our Group strategy. As at the end of 2014, 1,557 executives had taken part in the first generation of the training course. In the reporting year, 62 top executives completed the second generation of our leadership programme and the next executive levels will follow in 2015 and 2016. Further training and talent management are having a positive effect on the internal placement rate for upper and middle management, which was 93.9 % in the reporting year (previous year: 90.3 %). Of these, 11.8 % (previous year: 11.0 %) were cross-divisional.
Our now Group-wide Certified initiative is based upon the Express division’s Certified International Specialist programme and will now be extended out to all employees across the Group. The course programme is modular in nature and widely diversified so that all employees can receive training and certification based upon their specific needs. This is just one way in which we encourage employee engagement and cultural change.
Deutsche Post DHL Group is one of the companies that provides the most oppor-tunities for apprentices in Germany. We develop and qualify our junior employees in more than 20 state-accredited apprenticeship schemes and dual-study programmes. In the reporting year, we offered 1,913 junior employees an apprenticeship or study opportunity; in 2015, we will increase this offer to 2,375.
Diversity as a success factor
Diversity is not only integral to our corporate values, it is also considered as a factor for success and a competitive advantage. In 2014, our Diversity Council took up its mandate. Made up of senior executives, the Council discusses the further alignment of Diversity Management within the Group and introduces the topic in their departments. Furthermore, we held, amongst other things, a global Diversity Day and trained a large number of executives. In 2015, we shall offer training as e-learning modules in multiple languages on our company-wide training platform.
As at 31 December 2014, the proportion of women in executive positions worldwide was 19.3 % (previous year: 19.6 %). In order to increase the proportion of women in manage ment positions we have undertaken various measures, which include a system of key indicators, professional development programmes for female junior employees, a variety of women’s networks and options to improve work-family balance.
A.66 Work-family balance 1
Headcount
2013 2014
State-regulated parental leave 1,579 1,431
of which men 146 148
of which women 1,433 1,283
Unpaid holiday for family reasons 1,966 1,797
Part-time employees 2 63,169 64,511
Share of part-time employees (%) 3 36.1 36.61 Includes employees of Deutsche Post AG.2 Excludes employees in the release phase of partial retirement.3 Prior-period amount adjusted due to a change in the basis for calculation.
Objectives and strategies, page 31
A.64 Group apprenticeship schemes Deutsche Post DHL Group, worldwide 1
1 Number of apprentices, annual average: 5,089.
5.6 % Duale Hochschule students
6.8 % Forwarding and logistics services specialists
49.3 % Courier, express and postal services specialists
32.8 % Other apprentice-ships
5.5 % Warehousing logistics specialists
A.65 Gender distribution in management 1, 2014
1 Based on upper and middle management.
19.3 % Women
80.7 % Men
Deutsche Post DHL Group — 2014 Annual Report
76
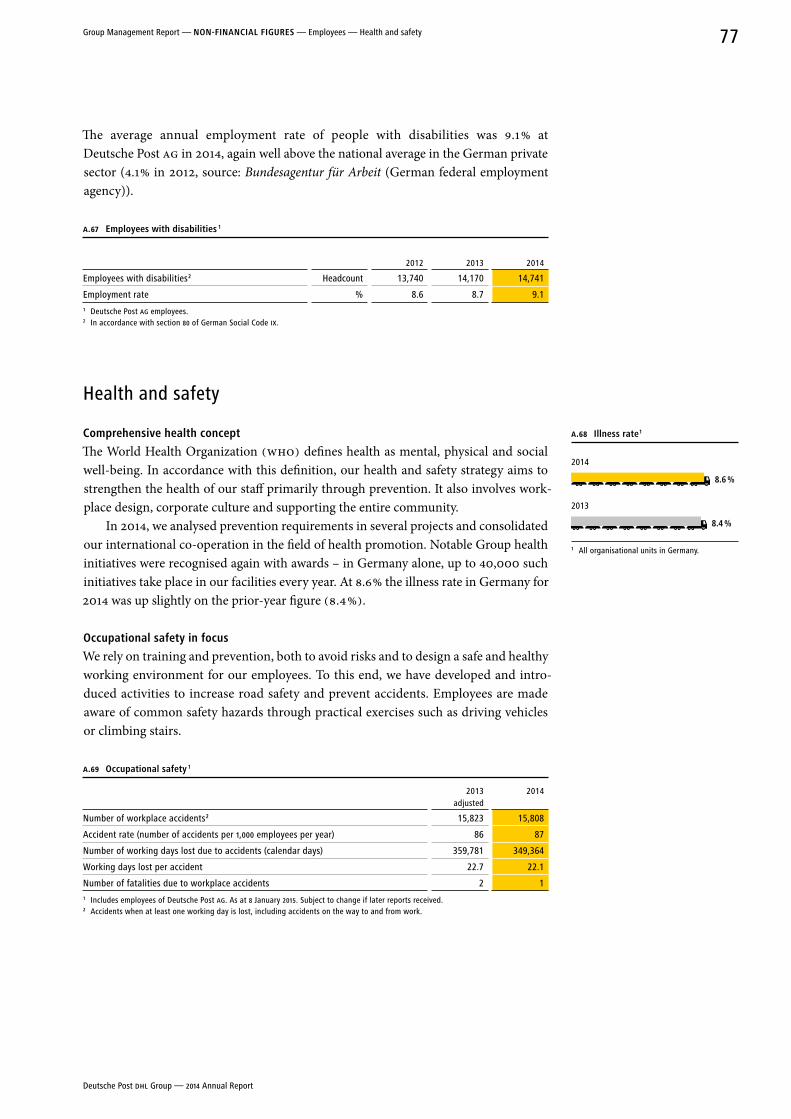
The average annual employment rate of people with disabilities was 9.1 % at Deutsche Post AG in 2014, again well above the national average in the German private sector (4.1 % in 2012, source: Bundesagentur für Arbeit (German federal employment agency)).
A.67 employees with disabilities 1
2012 2013 2014
Employees with disabilities 2 Headcount 13,740 14,170 14,741
Employment rate % 8.6 8.7 9.11 Deutsche Post AG employees.2 In accordance with section 80 of German Social Code IX.
Health and safety
Comprehensive health concept
The World Health Organization (WHO) defines health as mental, physical and social well-being. In accordance with this definition, our health and safety strategy aims to strengthen the health of our staff primarily through prevention. It also involves work-place design, corporate culture and supporting the entire community.
In 2014, we analysed prevention requirements in several projects and consolidated our international co-operation in the field of health promotion. Notable Group health initiatives were recognised again with awards – in Germany alone, up to 40,000 such initiatives take place in our facilities every year. At 8.6 % the illness rate in Germany for 2014 was up slightly on the prior-year figure (8.4 %).
occupational safety in focus
We rely on training and prevention, both to avoid risks and to design a safe and healthy working environment for our employees. To this end, we have developed and intro-duced activities to increase road safety and prevent accidents. Employees are made aware of common safety hazards through practical exercises such as driving vehicles or climbing stairs.
A.69 occupational safety 1
2013 adjusted
2014
Number of workplace accidents 2 15,823 15,808
Accident rate (number of accidents per 1,000 employees per year) 86 87
Number of working days lost due to accidents (calendar days) 359,781 349,364
Working days lost per accident 22.7 22.1
Number of fatalities due to workplace accidents 2 11 Includes employees of Deutsche Post AG. As at 8 January 2015. Subject to change if later reports received.2 Accidents when at least one working day is lost, including accidents on the way to and from work.
A.68 Illness rate 1
2014
8.6 %
2013
8.4 %
1 All organisational units in Germany.
Deutsche Post DHL Group — 2014 Annual Report
77Group Management Report — non-FInanCIaL FIGureS — Employees — Health and safety
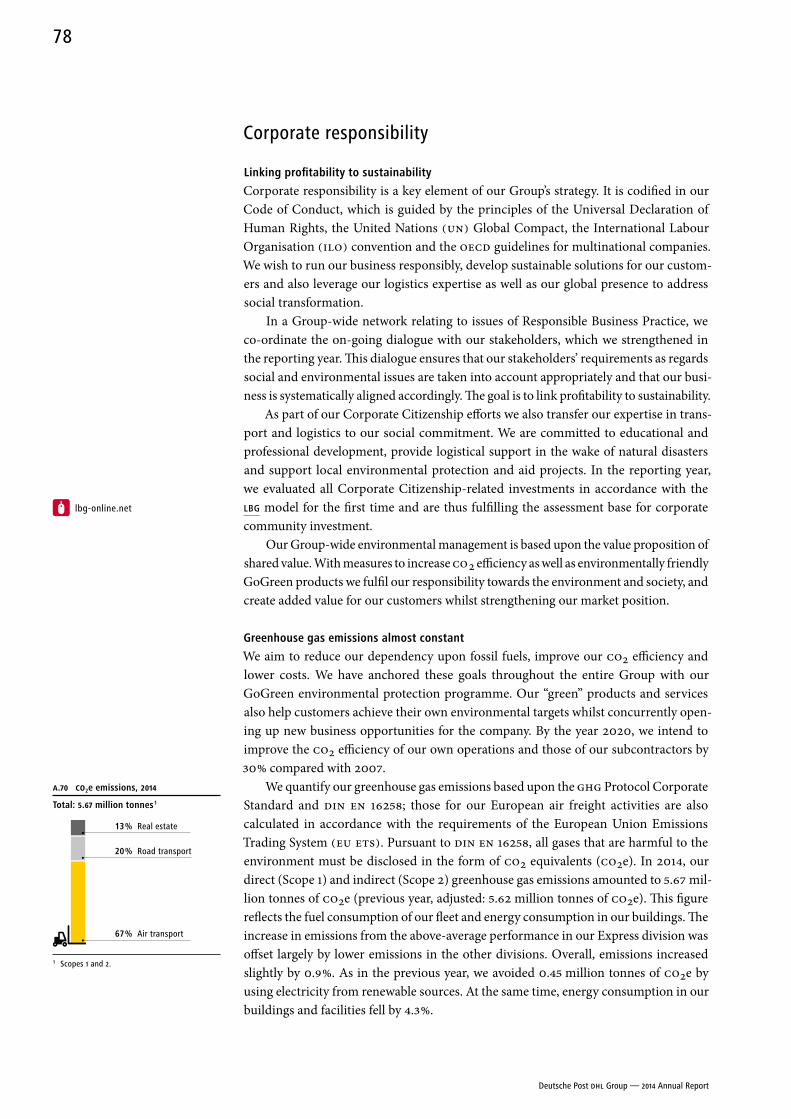
Corporate responsibility
Linking profitability to sustainability
Corporate responsibility is a key element of our Group’s strategy. It is codified in our Code of Conduct, which is guided by the principles of the Universal Declaration of Human Rights, the United Nations (UN) Global Compact, the International Labour Organisation (ILO) convention and the OECD guidelines for multinational companies. We wish to run our business responsibly, develop sustainable solutions for our custom-ers and also leverage our logistics expertise as well as our global presence to address social transformation.
In a Group-wide network relating to issues of Responsible Business Practice, we co-ordinate the on-going dialogue with our stakeholders, which we strengthened in the reporting year. This dialogue ensures that our stakeholders’ requirements as regards social and environmental issues are taken into account appropriately and that our busi-ness is systematically aligned accordingly. The goal is to link profitability to sustainability.
As part of our Corporate Citizenship efforts we also transfer our expertise in trans-port and logistics to our social commitment. We are committed to educational and professional development, provide logistical support in the wake of natural disasters and support local environmental protection and aid projects. In the reporting year, we evaluated all Corporate Citizenship-related investments in accordance with the LBG model for the first time and are thus fulfilling the assessment base for corporate community investment.
Our Group-wide environmental management is based upon the value proposition of shared value. With measures to increase CO 2 efficiency as well as environmentally friendly GoGreen products we fulfil our responsibility towards the environment and society, and create added value for our customers whilst strengthening our market position.
Greenhouse gas emissions almost constant
We aim to reduce our dependency upon fossil fuels, improve our CO2 efficiency and lower costs. We have anchored these goals throughout the entire Group with our GoGreen environmental protection programme. Our “green” products and services also help customers achieve their own environmental targets whilst concurrently open-ing up new business opportunities for the company. By the year 2020, we intend to improve the CO2 efficiency of our own operations and those of our subcontractors by 30 % compared with 2007.
We quantify our greenhouse gas emissions based upon the GHG Protocol Corporate Standard and DIN EN 16258; those for our European air freight activities are also calculated in accordance with the requirements of the European Union Emissions Trading System (EU ETS). Pursuant to DIN EN 16258, all gases that are harmful to the environment must be disclosed in the form of CO2 equivalents (CO2e). In 2014, our direct (Scope 1) and indirect (Scope 2) greenhouse gas emissions amounted to 5.67 mil-lion tonnes of CO2e (previous year, adjusted: 5.62 million tonnes of CO2e). This figure reflects the fuel consumption of our fleet and energy consumption in our buildings. The increase in emissions from the above-average performance in our Express division was offset largely by lower emissions in the other divisions. Overall, emissions increased slightly by 0.9 %. As in the previous year, we avoided 0.45 million tonnes of CO2e by using electricity from renewable sources. At the same time, energy consumption in our buildings and facilities fell by 4.3 %.
lbg-online.net
A.70 CO2e emissions, 2014
Total: 5.67 million tonnes 1
1 Scopes 1 and 2.
20 % Road transport
13 % Real estate
67 % Air transport
Deutsche Post DHL Group — 2014 Annual Report
78
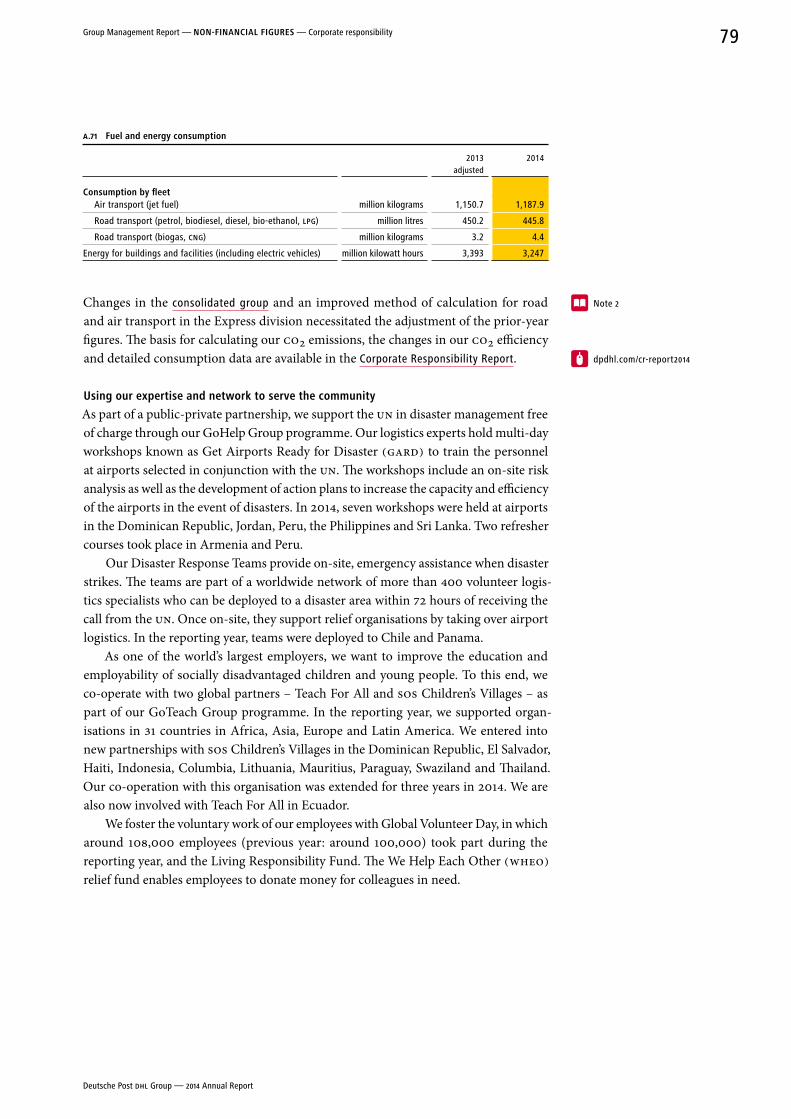
A.71 Fuel and energy consumption
2013 adjusted
2014
Consumption by fleetAir transport (jet fuel) million kilograms 1,150.7 1,187.9
Road transport (petrol, biodiesel, diesel, bio-ethanol, LPG) million litres 450.2 445.8
Road transport (biogas, CnG) million kilograms 3.2 4.4
Energy for buildings and facilities (including electric vehicles) million kilowatt hours 3,393 3,247
Changes in the consolidated group and an improved method of calculation for road and air transport in the Express division necessitated the adjustment of the prior-year figures. The basis for calculating our CO2 emissions, the changes in our CO2 efficiency and detailed consumption data are available in the Corporate Responsibility Report.
using our expertise and network to serve the community
As part of a public-private partnership, we support the UN in disaster management free of charge through our GoHelp Group programme. Our logistics experts hold multi-day workshops known as Get Airports Ready for Disaster (GARD) to train the personnel at airports selected in conjunction with the UN. The workshops include an on-site risk analysis as well as the development of action plans to increase the capacity and efficiency of the airports in the event of disasters. In 2014, seven workshops were held at airports in the Dominican Republic, Jordan, Peru, the Philippines and Sri Lanka. Two refresher courses took place in Armenia and Peru.
Our Disaster Response Teams provide on-site, emergency assistance when disaster strikes. The teams are part of a worldwide network of more than 400 volunteer logis-tics specialists who can be deployed to a disaster area within 72 hours of receiving the call from the UN. Once on-site, they support relief organisations by taking over airport logistics. In the reporting year, teams were deployed to Chile and Panama.
As one of the world’s largest employers, we want to improve the education and employability of socially disadvantaged children and young people. To this end, we co- operate with two global partners – Teach For All and SOS Children’s Villages – as part of our GoTeach Group programme. In the reporting year, we supported organ-isations in 31 countries in Africa, Asia, Europe and Latin America. We entered into new partnerships with SOS Children’s Villages in the Dominican Republic, El Salvador, Haiti, Indonesia, Columbia, Lithuania, Mauritius, Paraguay, Swaziland and Thailand. Our co-operation with this organisation was extended for three years in 2014. We are also now involved with Teach For All in Ecuador.
We foster the voluntary work of our employees with Global Volunteer Day, in which around 108,000 employees (previous year: around 100,000) took part during the reporting year, and the Living Responsibility Fund. The We Help Each Other (WHEO) relief fund enables employees to donate money for colleagues in need.
Note 2
dpdhl.com/cr-report2014
Deutsche Post DHL Group — 2014 Annual Report
79Group Management Report — non-FInanCIaL FIGureS — Corporate responsibility
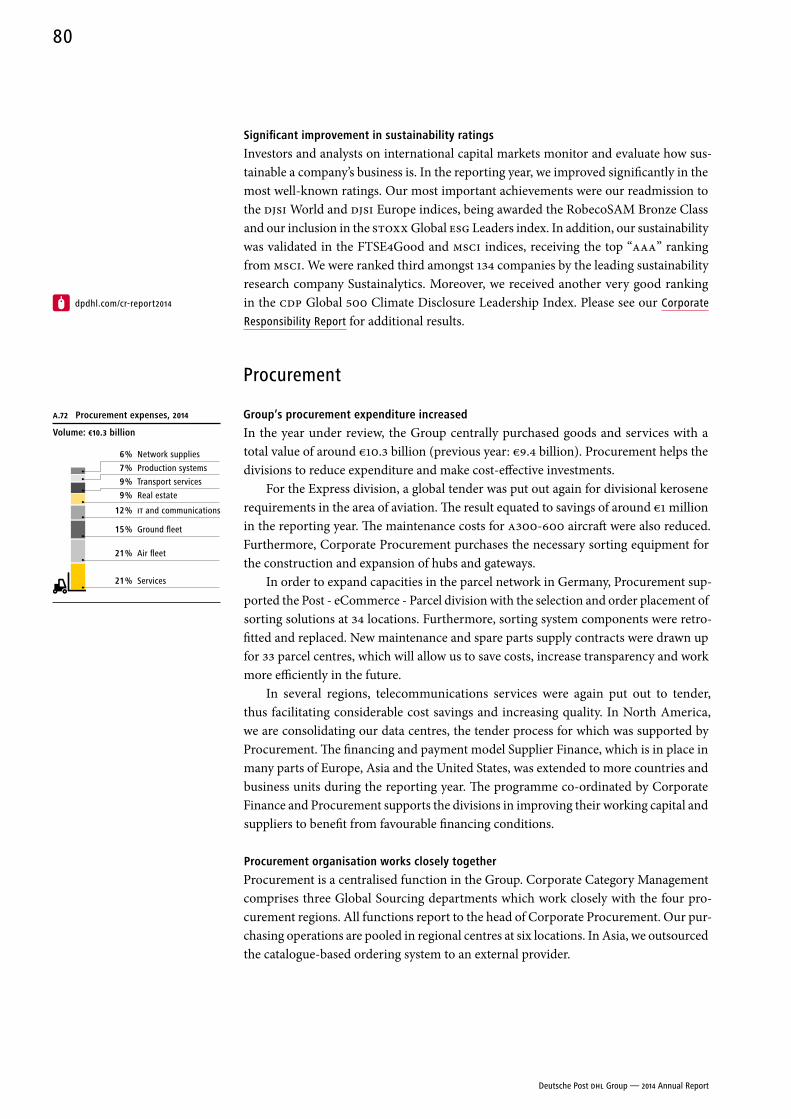
Significant improvement in sustainability ratings
Investors and analysts on international capital markets monitor and evaluate how sus-tainable a company’s business is. In the reporting year, we improved significantly in the most well-known ratings. Our most important achievements were our readmission to the DJSI World and DJSI Europe indices, being awarded the RobecoSAM Bronze Class and our inclusion in the STOXX Global ESG Leaders index. In addition, our sustainability was validated in the FTSE4Good and MSCI indices, receiving the top “AAA” ranking from MSCI. We were ranked third amongst 134 companies by the leading sustainability research company Sustainalytics. Moreover, we received another very good ranking in the CDP Global 500 Climate Disclosure Leadership Index. Please see our Corporate
Responsibility Report for additional results.
Procurement
Group’s procurement expenditure increased
In the year under review, the Group centrally purchased goods and services with a total value of around €10.3 billion (previous year: €9.4 billion). Procurement helps the divisions to reduce expenditure and make cost-effective investments.
For the Express division, a global tender was put out again for divisional kerosene requirements in the area of aviation. The result equated to savings of around €1 million in the reporting year. The maintenance costs for A300-600 aircraft were also reduced. Furthermore, Corporate Procurement purchases the necessary sorting equipment for the construction and expansion of hubs and gateways.
In order to expand capacities in the parcel network in Germany, Procurement sup-ported the Post - eCommerce - Parcel division with the selection and order placement of sorting solutions at 34 locations. Furthermore, sorting system components were retro-fitted and replaced. New maintenance and spare parts supply contracts were drawn up for 33 parcel centres, which will allow us to save costs, increase transparency and work more efficiently in the future.
In several regions, telecommunications services were again put out to tender, thus facilitating considerable cost savings and increasing quality. In North America, we are consolidating our data centres, the tender process for which was supported by Procure ment. The financing and payment model Supplier Finance, which is in place in many parts of Europe, Asia and the United States, was extended to more countries and business units during the reporting year. The programme co-ordinated by Corporate Finance and Procurement supports the divisions in improving their working capital and suppliers to benefit from favourable financing conditions.
Procurement organisation works closely together
Procurement is a centralised function in the Group. Corporate Category Management comprises three Global Sourcing departments which work closely with the four pro-curement regions. All functions report to the head of Corporate Procurement. Our pur-chasing operations are pooled in regional centres at six locations. In Asia, we outsourced the catalogue-based ordering system to an external provider.
dpdhl.com/cr-report2014
A.72 Procurement expenses, 2014
Volume: €10.3 billion
21 % Air fleet
15 % Ground fleet
12 % IT and communications
9 % Real estate
21 % Services
7 % Production systems
6 % Network supplies
9 % Transport services
Deutsche Post DHL Group — 2014 Annual Report
80
Procurement considers environmental aspects
When purchasing products and services, Procurement works closely together with those responsible for the various product categories and regions in order to take environ-mental aspects into consideration. Deutsche Post DHL Group obtains up to 60 % of its electricity from renewable sources and works closely with its business partners to help them achieve their environmental targets. This includes the use of energy efficient light-ing, digital measuring devices, co-generation heat and power plants and heat-reflective wall paints. In the reporting year, we also modernised our operational vehicle fleet. A total of 11,682 emissions-efficient Euro class 5 and 6 vehicles were put into operation in Germany and 1,864 company cars were ordered in these two Euro classes. In addition, we purchased 60 electric vehicles, which are currently being tested on delivery routes. Individual projects are described in our Corporate Responsibility Report.
Procurement systems further expanded
The use of IT applications to procure goods and services more efficiently increased again in the reporting year. For instance, our electronic ordering system “GeT” is now available in the 48 countries with the highest procurement rates and further roll-out in other countries is also planned. The IT systems used for purchasing are currently being updated and positioned on a standardised platform. This ensures that all information about a supplier is stored in one place – from determining demand quantities to auto-mated tenders and supplier ratings.
Simplifying and standardising supplier management
We continuously review whether our suppliers comply with the ethical and environ-mental standards set forth in our Code of Conduct. In the reporting year, we simplified and standardised these procedures in line with the criteria in the anti-corruption and competition compliance policy. Consequently, the self-assessment process for suppliers, business partners, subcontractors, joint venture partners, representatives, agents and consultants was updated in close co-operation with the Corporate Compliance Office and all associated units. In addition to the self-assessment initiative, we now require additional evidence which gives us objective, verifiable supplier ratings.
Customers and quality
Innovative technology translates into competitive advantage
in the mail and parcel business
We operate a first-class, efficient and environmentally friendly nationwide transport and delivery network in Germany consisting of 82 mail centres and 33 parcel centres that process about 64 million letters and in excess of 3.4 million parcels each working day. In the reporting year, the high level of automation in our mail business, which exceeds 90 %, saw a further slight increase. In our parcel network, we have increased our overall sorting capacity by 50 % since the launch of our Parcel 2012 Production Concept by upgrading existing facilities. Additional parcel centres are currently under construction.
Our customers rate the quality of our services based on whether posted items reach their destinations quickly, reliably and undamaged. We again achieved excellent results in letter transit times within Germany: according to surveys conducted by Quotas, a quality research institute, 94 % of the letters posted during our daily opening hours or before final collection are delivered to their recipients the next day. This places us far
Corporate responsibility, page 78
dpdhl.com/cr-report2014
Deutsche Post DHL Group — 2014 Annual Report
81Group Management Report — non-FInanCIaL FIGureS — Corporate responsibility — Procurement — Customers and quality
above the legal requirement of 80 %. In order to ensure this level of quality in the long term, our quality management is based on a system that is certified each year by TÜV NORD, a recognised certification and testing organisation. Transit times for international letters are determined by the International Post Corporation. Here, we rank amongst the top postal companies.
In the parcel business, items usually reach their recipients the next working day. This is based on parcels that were collected from business customers and then delivered the next day. Our internal system for measuring parcel transit times has been certified by TÜV Rheinland since 2008. The German consumer organisation Stiftung Warentest declared DHL the winner of its parcel delivery services test on account of our outstand-ing transit time, damage-free deliveries, fair working conditions and compliance with environmental standards.
E-POST has established itself in the digital communication market, and in 2014 we expanded its portfolio. Companies of all sizes can send items directly from their own company software either digitally or by conventional post. Private customers can receive their mail digitally on their computers or mobile devices, are able to securely store their documents and pay invoices online.
The average weekly opening time of our 29,000-plus sales points was 55 hours in the reporting year (previous year: 55 hours). The annual survey conducted by Kunden monitor Deutschland, the largest consumer study in Germany, also showed a high acceptance of our exclusively partner-operated retail outlets: 91 % of customers were satisfied with our quality and service (previous year: 91 %). In addition, impartial mystery shoppers from TNS Infratest tested the postal outlets in retail stores around 38,000 times over the year. The results showed that 94.5 % of customers were served within three minutes.
Another central characteristic of the quality of our products is environmental pro-tection. We employ a TÜV NORD-certified environmental management system in our mail and parcel businesses in Germany. Our GoGreen products offer private and busi-ness customers climate-neutral shipping options. Moreover, we operate one of the largest electric vehicle fleets in the world, comprising over 200 vehicles. Furthermore, we use innovative technologies in our buildings and operating facilities, such as LED s, and we have also increased our use of renewable energies.
Service quality translates into competitive advantage in the express business
We want to offer our customers the best possible service quality all around the world and thus place high demands on our products, processes, infrastructure and employees. Therefore, we keep a constant eye on the changing requirements of our customers, for example, through our Insanely Customer Centric Culture (ICCC) programme. When-ever our employees – as couriers, in customer service or in sales – are in contact with a customer, their feedback is documented, evaluated and made available to all respon-sible departments within the company. As part of the Net Promoter Approach, our managers talk specifically to dissatisfied customers personally in order to find out the root causes of their dissatisfaction. In this way we are able to continuously turn feedback into improve ments.
Deutsche Post DHL Group — 2014 Annual Report
82
Online, we provide the MyDHL portal as well as the Small Business Solutions section of our website. These portals make it easier for, above all, small and medium- sized business customers to send their shipments. They also receive comprehensive information on the topic of shipping. In Europe, we can provide our global customers with a central point of contact with our European Key Account Support. The staff of this service team speak several languages, are available every weekday and co-ordinate the services of various DHL business units in multiple countries. Upon request, shipment information can even be updated directly in the customer’s systems.
We use quality control centres to track shipments worldwide and adjust our pro-cesses as required. Should unforeseen events occur, flight and shipment routes can be altered immediately. All our premium products are tracked by default – for example, Medical Express shipments – until they are delivered. In the case of sensitive shipments, we also immediately take all necessary measures to ensure that they reach the recipient at the agreed time and in the agreed quality. In the reporting year, we substantially in-creased the number of staff in our quality control centres. As a result, we are able to track shipments precisely, even when volumes go up, and respond rapidly when necessary.
Our operational safety, compliance with standards and the quality of service at our facilities are reviewed regularly in co-operation with government authorities. More than 250 locations – over 100 of which are in Europe – have been certified by the Transported Asset Protection Association (TAPA), one of the world’s most renowned safety associations, making us the leader in this area. In 2010, we began recording all certification processes in a standardised system and managing them globally. Our sites have had global ISO 9001:2008 certification since 2013, thus validating our policy of harmonising quality standards. In Europe, our facilities are also certified to ISO 14001.
Continuous improvement translates into competitive advantage
in the freight forwarding business
We strive to use customer feedback to systematically improve our offering. To this end, we survey our customers annually to determine their level of satisfaction with our ser-vices. As part of our Net Promoter Approach, customers rate us directly after interacting with us. The knowledge gained is used to adapt local services where necessary and im-prove internal processes. We currently use this approach in more than a dozen countries. Over the reporting year, more than 10,000 customers were asked to rate our services.
Our top priority is always the interests of our customers, and the benefits of this are clear. As part of our new Customer Improvement Programme, for example, we were able to achieve further improvements with selected customers. Since the programme began in April 2014, it has seen the launch of over 30 projects – over half of which have already been completed successfully. We are stabilising our operational processes through continuous improvement methods. Moreover, by 2014, over 5,400 employees had been trained in First Choice methodology and more than 1,000 improvements were made during the reporting year. Aside from our operational service performance, we are also continuously improving our cost structure and thus those of our customers, for example, through worldwide optimised routing. Our efforts are not going unnoticed by our customers – as in 2014, they again honoured us with multiple awards.
Deutsche Post DHL Group — 2014 Annual Report
83Group Management Report — non-FInanCIaL FIGureS — Customers and quality
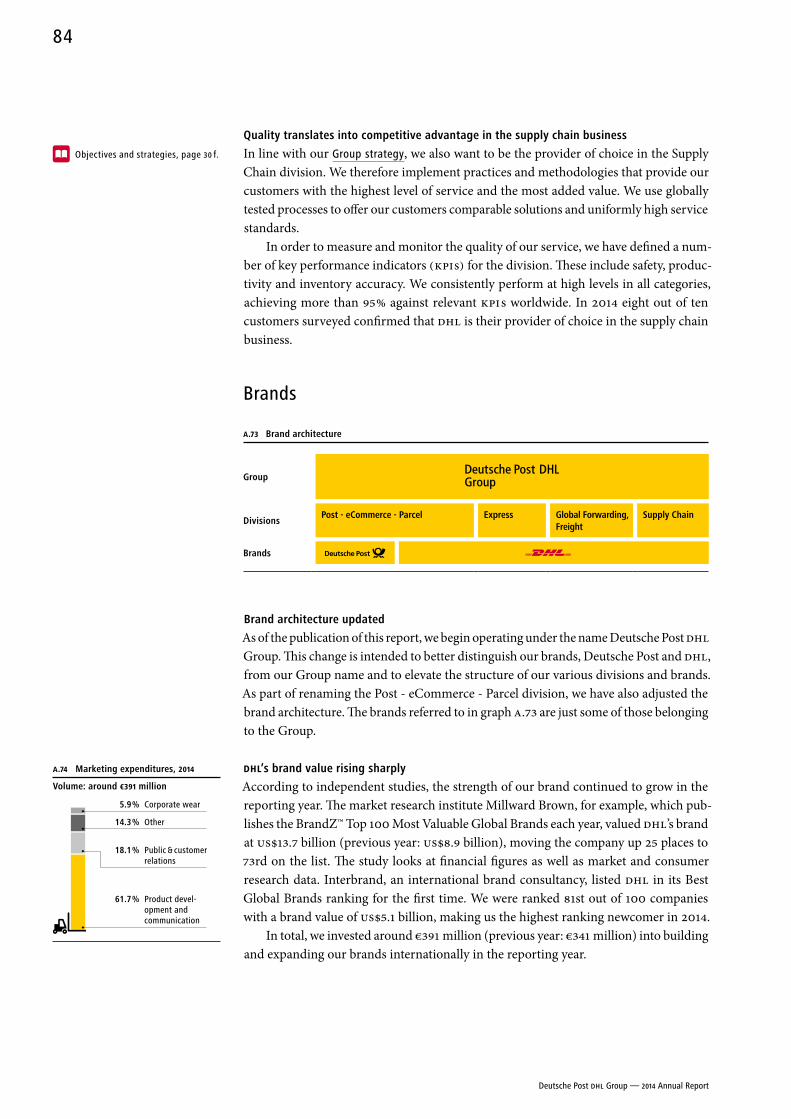
Quality translates into competitive advantage in the supply chain business
In line with our Group strategy, we also want to be the provider of choice in the Supply Chain division. We therefore implement practices and methodologies that provide our customers with the highest level of service and the most added value. We use globally tested processes to offer our customers comparable solutions and uniformly high service standards.
In order to measure and monitor the quality of our service, we have defined a num-ber of key performance indicators (KPI s) for the division. These include safety, produc-tivity and inventory accuracy. We consistently perform at high levels in all categories, achieving more than 95 % against relevant KPI s worldwide. In 2014 eight out of ten customers surveyed confirmed that DHL is their provider of choice in the supply chain business.
Brands
A.73 Brand architecture
Group
DivisionsPost - eCommerce - Parcel express Global Forwarding,
FreightSupply Chain
Brands
Brand architecture updated
As of the publication of this report, we begin operating under the name Deutsche Post DHL Group. This change is intended to better distinguish our brands, Deutsche Post and DHL, from our Group name and to elevate the structure of our various divisions and brands. As part of renaming the Post - eCommerce - Parcel division, we have also adjusted the brand architecture. The brands referred to in graph A.73 are just some of those belonging to the Group.
DHL’s brand value rising sharply
According to independent studies, the strength of our brand continued to grow in the reporting year. The market research institute Millward Brown, for example, which pub-lishes the BrandZ™ Top 100 Most Valuable Global Brands each year, valued DHL’s brand at US$13.7 billion (previous year: US$8.9 billion), moving the company up 25 places to 73rd on the list. The study looks at financial figures as well as market and consumer research data. Interbrand, an international brand consultancy, listed DHL in its Best Global Brands ranking for the first time. We were ranked 81st out of 100 companies with a brand value of US$5.1 billion, making us the highest ranking newcomer in 2014.
In total, we invested around €391 million (previous year: €341 million) into building and expanding our brands internationally in the reporting year.
Objectives and strategies, page 30 f.
A.74 Marketing expenditures, 2014
Volume: around €391 million
14.3 % Other
5.9 % Corporate wear
61.7 % Product devel-opment and communication
18.1 % Public & customer relations
Deutsche Post DHL Group — 2014 Annual Report
84
Deutsche Post is the brand of the football world champions
Sports sponsorships strengthen people’s emotional ties with the Deutsche Post brand, which is why we are involved with the DFB cup and the German national teams in partner ship with the Deutsche Fußball-Bund (DFB – German football federation). During the 2014 FIFA World Cup Brazil™, we ran an attention-grabbing multimedia brand campaign. Furthermore, in co-operation with the DFB, we have been co-provid-ers of a new national amateur football platform – www.fussball.de – since mid-2014. We have also con tinued our sponsorship of the Deutsche Tourenwagen Masters (DTM – German Touring Car Masters) race series as well as our partnership with FC Bayern Munich’s federal league basketball team. Since the end of 2014, we have increased our brand presence in winter sports as well: the sleds and suits of the athletes of the Bob- und Schlittenverbands (German bobsleigh, luge and skeleton federation) are now designed to incorporate the Deutsche Post brand. Furthermore, on 15 October 2014, the well-known Königssee bobsleigh, luge, and skeleton track became Deutsche Post Eisarena Königssee.
DHL showcases a new brand look
We want our customers to associate more strongly with the DHL brand and have carefully developed our corporate design with that goal in mind. Our new look is more dynamic and versatile; optimised for online channels it refrains from graphically highlighting the DHL brand areas.
International events rely on DHL logistics
As the global logistics partner of Formula 1™, the Formula E Championship, IMG Fashion Weeks, Manchester United as well as other events, we have showcased the DHL brand to the public and the media in connection with 328 events in 44 countries in the reporting year. At the beginning of 2014, DHL also began handling event logistics for the world touring live show of Canada’s Cirque du Soleil. Moreover, since August 2014, DHL has been a platinum sponsor of FC Bayern Munich football club.
POST-BALANCE-SHEET DATE EVENTSDHL Delivery GmbH creates new jobs
In order to secure the increased demand for labour as a result of continued sustained growth in the parcel business, Deutsche Post DHL Group has founded numerous regional companies under the umbrella of DHL Delivery GmbH. The goal is to create up to 10,000 new positions by 2020. Staff working in the new companies shall be employed in line with the regionally applicable collective terms and conditions for the forwarding and logistics sector.
Shares held in King’s Cross to be reduced
The requirements for classifying an asset as held for sale in accordance with IFRS 5 were met in the period between the balance sheet date and the preparation of the consolidated financial statements by the Board of Management so that the shares held in King’s Cross Central Property Trust, UK, and in King’s Cross Central General Partner Ltd., UK, can be reduced as planned.
Deutsche Post DHL Group — 2014 Annual Report
85Group Management Report — non-FInanCIaL FIGureS — Customers and quality — Brands — PoST-BaLanCe-SHeeT DaTe eVenTS
OPPORTUNITIES AND RISKS
Overall Board of Management assessment of opportunity and risk situation
no foreseeable risk to the Group
Identifying opportunities and risks – and swiftly capitalising upon or counteracting them – is an important objective for our Group. This is why we already account for the anticipated impact of potential events and developments in our current business plan. The opportunities and risks reported here represent additional potential deviations from the Group’s projected earnings. In consideration of our current business plan, the Group’s overall opportunity and risk situation has not changed significantly compared with last year. No new risks have been identified that could have a potentially critical impact on the Group’s result. Based on the Group’s early warning system and in the estimation of its Board of Management, there were no identifiable risks for the Group in the current forecast period which, individually or collectively, cast doubt upon the Group’s ability to continue as a going concern. Nor are any such risks apparent in the foreseeable future. The assessment of a stable to positive outlook is moreover reflected in the Group’s credit ratings.
Opportunity and risk management processes
uniform reporting standards for opportunity and risk management
As an internationally operating logistics company, we are faced with numerous changes. Our aim is to identify the resulting opportunities and risks at an early stage and take the necessary measures in the specific areas affected in due time to ensure that we achieve a sustained increase in enterprise value. Our Group-wide opportunity and risk manage-ment system facilitates this aim. Each quarter, managers estimate the impact of future scenarios, evaluate opportunities and risks in their departments and present planned measures as well as those already taken. Queries are made and approvals given on a hierarchical basis to ensure that different managerial levels are involved in the process. Opportunities and risks can also be reported at any time on an ad hoc basis.
Our early identification process links the Group’s opportunity and risk management with uniform reporting standards. We continuously improve the IT application used for this purpose. Furthermore, we use a Monte Carlo simulation for the purpose of aggregating opportunities and risks in standard evaluations.
This stochastic model takes the probability of occurrence of the underlying risks and opportunities into consideration and is based on the law of large numbers. From the distribution function of each individual opportunity and risk one million randomly selected scenarios – one for each opportunity and risk – are combined. The resulting totals are shown in a graph of frequency of occurrence. The following graph shows an example of such a simulation:
Financial position, page 53 f.
Deutsche Post DHL Group — 2014 Annual Report
86
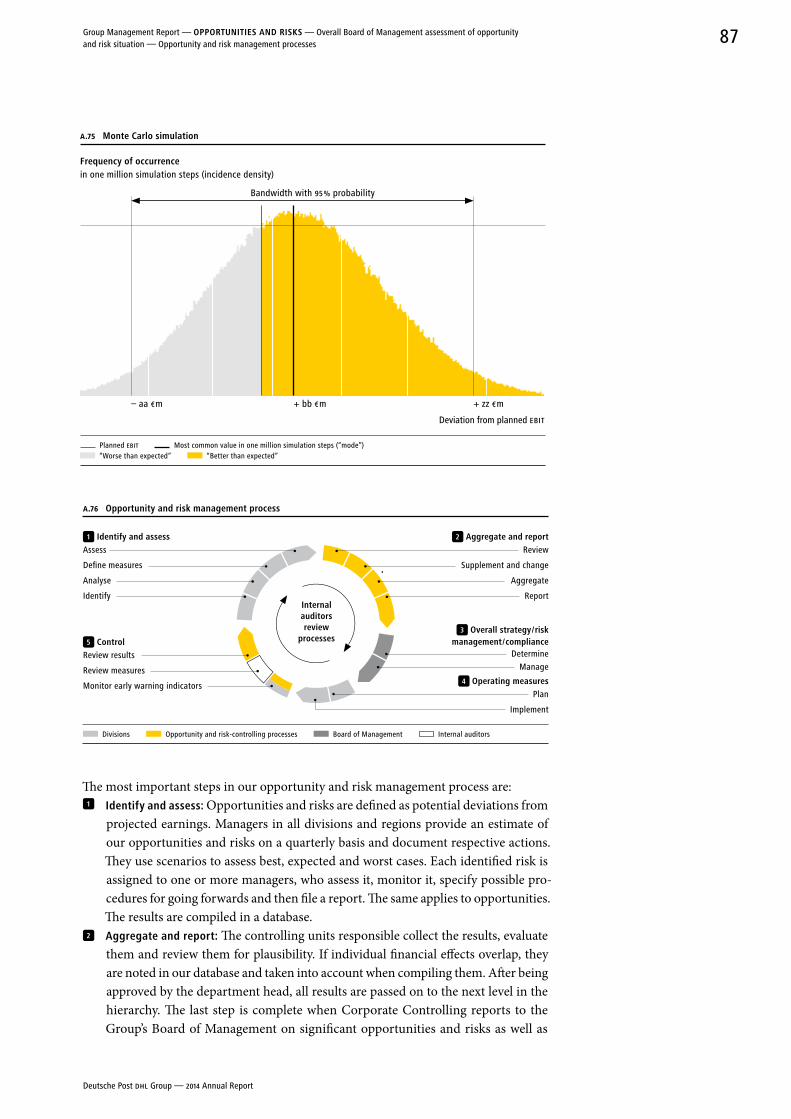
A.76 opportunity and risk management process
1 Identify and assessAssess
Define measures
Analyse
Identify
5 ControlReview results
Review measures
Monitor early warning indicators
Internal auditors review
processes
2 aggregate and reportReview
Supplement and change
Aggregate
Report
3 overall strategy / risk management / compliance
DetermineManage
4 operating measuresPlan
Implement
Divisions Opportunity and risk-controlling processes Board of Management Internal auditors
The most important steps in our opportunity and risk management process are:1 Identify and assess: Opportunities and risks are defined as potential deviations from
projected earnings. Managers in all divisions and regions provide an estimate of our opportunities and risks on a quarterly basis and document respective actions. They use scenarios to assess best, expected and worst cases. Each identified risk is assigned to one or more managers, who assess it, monitor it, specify possible pro-cedures for going forwards and then file a report. The same applies to opportunities. The results are compiled in a database.
2 aggregate and report: The controlling units responsible collect the results, evaluate them and review them for plausibility. If individual financial effects overlap, they are noted in our database and taken into account when compiling them. After being approved by the department head, all results are passed on to the next level in the hierarchy. The last step is complete when Corporate Controlling reports to the Group’s Board of Management on significant opportunities and risks as well as
A.75 Monte Carlo simulation
Frequency of occurrence in one million simulation steps (incidence density)
Bandwidth with 95 % probability
– aa € m + bb € m + zz € m
Deviation from planned EBIT
Planned EBIT Most common value in one million simulation steps (“mode”) “Worse than expected” “Better than expected”
Deutsche Post DHL Group — 2014 Annual Report
87Group Management Report — oPPorTunITIeS anD rISKS — Overall Board of Management assessment of opportunity and risk situation — Opportunity and risk management processes
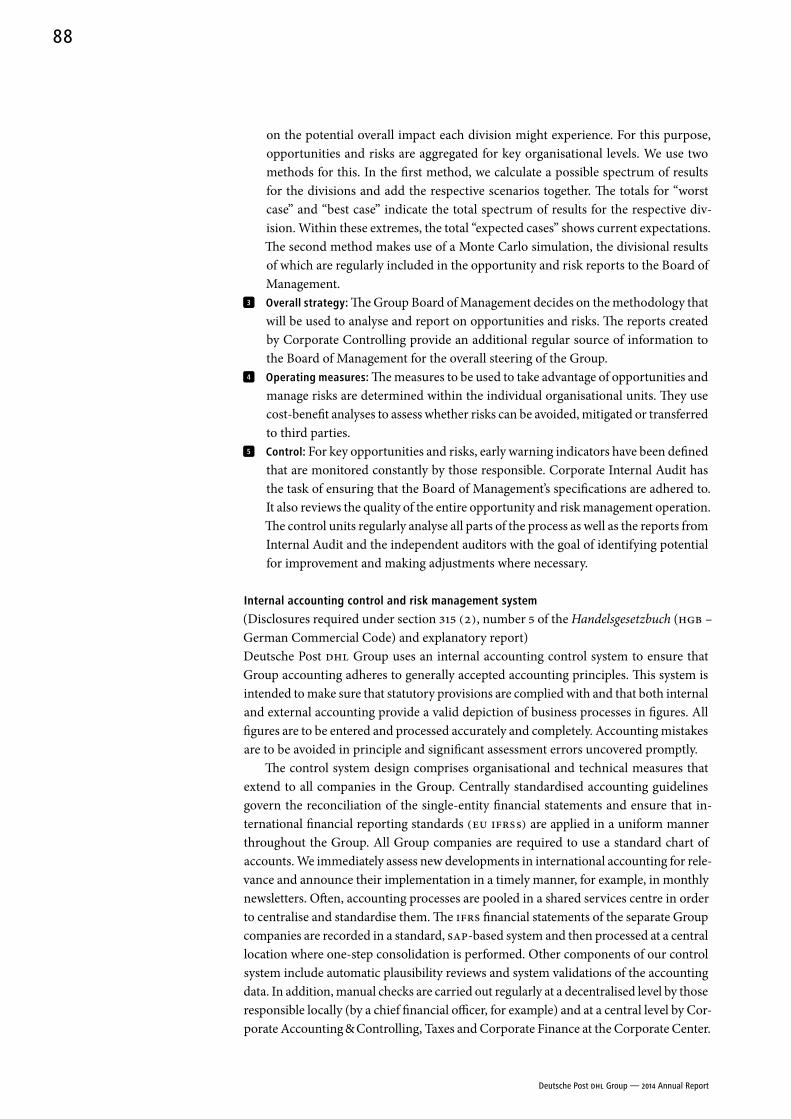
on the potential overall impact each division might experience. For this purpose, opportunities and risks are aggregated for key organisational levels. We use two methods for this. In the first method, we calculate a possible spectrum of results for the divisions and add the respective scenarios together. The totals for “worst case” and “best case” indicate the total spectrum of results for the respective div-ision. Within these extremes, the total “expected cases” shows current expectations. The second method makes use of a Monte Carlo simulation, the divisional results of which are regularly included in the opportunity and risk reports to the Board of Management.
3 overall strategy: The Group Board of Management decides on the methodology that will be used to analyse and report on opportunities and risks. The reports created by Corporate Controlling provide an additional regular source of information to the Board of Management for the overall steering of the Group.
4 operating measures: The measures to be used to take advantage of opportunities and manage risks are determined within the individual organisational units. They use cost-benefit analyses to assess whether risks can be avoided, mitigated or transferred to third parties.
5 Control: For key opportunities and risks, early warning indicators have been defined that are monitored constantly by those responsible. Corporate Internal Audit has the task of ensuring that the Board of Management’s specifications are adhered to. It also reviews the quality of the entire opportunity and risk management operation. The control units regularly analyse all parts of the process as well as the reports from Internal Audit and the independent auditors with the goal of identifying potential for improvement and making adjustments where necessary.
Internal accounting control and risk management system
(Disclosures required under section 315 (2), number 5 of the Handelsgesetzbuch (HGB – German Commercial Code) and explanatory report)Deutsche Post DHL Group uses an internal accounting control system to ensure that Group accounting adheres to generally accepted accounting principles. This system is intended to make sure that statutory provisions are complied with and that both internal and external accounting provide a valid depiction of business processes in figures. All figures are to be entered and processed accurately and completely. Accounting mistakes are to be avoided in principle and significant assessment errors uncovered promptly.
The control system design comprises organisational and technical measures that extend to all companies in the Group. Centrally standardised accounting guidelines govern the reconciliation of the single-entity financial statements and ensure that in-ternational financial reporting standards (EU IFRS s) are applied in a uniform manner throughout the Group. All Group companies are required to use a standard chart of accounts. We immediately assess new developments in international accounting for rele-vance and announce their implementation in a timely manner, for example, in monthly newsletters. Often, accounting processes are pooled in a shared services centre in order to centralise and standardise them. The IFRS financial statements of the separate Group companies are recorded in a standard, SAP-based system and then processed at a central location where one-step consolidation is performed. Other components of our control system include automatic plausibility reviews and system validations of the accounting data. In addition, manual checks are carried out regularly at a decentralised level by those responsible locally (by a chief financial officer, for example) and at a central level by Cor-porate Accounting & Controlling, Taxes and Corporate Finance at the Corporate Center.
Deutsche Post DHL Group — 2014 Annual Report
88
Over and above the aforementioned internal accounting control system and risk management structures, Corporate Internal Audit is an essential component of the Group’s controlling and monitoring system. Using risk-based auditing procedures, Corporate Internal Audit regularly examines the processes related to financial report-ing and reports its results to the Board of Management. Upstream and downstream checks and analyses of the reported data are performed under chronological aspects. If necessary, we call in outside experts, for instance in the case of pension provisions. Finally, the Group’s standardised process for preparing financial statements using a cen-trally administered financial statements calendar guarantees a structured and efficient accounting process.
reporting opportunities and risks
Identifying opportunities and risks – and swiftly capitalising upon or counteracting them – is a key objective for our Group. This is why we account for the anticipated impact of potential events and developments in our current business plan as well as in our revenue and earnings projection. In the following we primarily report those risks and opportunities which, from the current standpoint, could have an additional significant, potentially positive or negative, impact during the current forecast period.
We assess opportunities and risks based on their probability of occurrence and impact. Subsequently, we distinguish between opportunities and risks of low, medium and high relevance. We characterise opportunities and risks of medium and high rele-vance as significant.
The opportunities and risks described here are not necessarily the only ones the Group faces or is exposed to. Our business activities could also be influenced by add-itional factors of which we are currently unaware or which we do not yet consider to be material.
Opportunities and risks are identified and assessed decentrally at Deutsche Post DHL Group. Reporting on possible deviations from projections, including latent opportun-ities and risks, occurs primarily at the country or regional level. In view of the degree of detail provided in the internal reports, decentrally reported opportunities and risks are combined into categories below for the purposes of this report. It should be noted that the underlying individual reports – with the exception of those on the world economy and global economic output – usually exhibit a zero to minimal correlation. It is rather unlikely that a number of major opportunities or risks in a single category or across categories would occur systematically at the same time.
Unless otherwise specified, a low relevance is attached to individual opportunities and risks within the respective categories and in the forecast period under observation (2015). With respect to opportunities and risks arising from possible legal proceedings or those already underway, we generally refrain from making an assessment to avoid affecting our position in the proceedings. The opportunities and risks generally apply for all divisions, unless indicated otherwise.
Deutsche Post DHL Group — 2014 Annual Report
89Group Management Report — oPPorTunITIeS anD rISKS — Opportunity and risk management processes
Categories of opportunities and risks
opportunities and risks arising from political, regulatory or legal conditions
Some risks arise primarily from the fact that the Group provides some of its services in a regulated market. A large number of postal services rendered by Deutsche Post AG and its subsidiaries (particularly the Post - eCommerce - Parcel division) are subject to sector-specific regulation by the Bundesnetzagentur (German federal network agency) pur-suant to the Postgesetz (PostG – German Postal Act). The Bundesnetzagentur approves or reviews prices, formulates the terms of downstream access and has special supervisory powers to combat market abuse.
On 25 January 2012, the European Commission issued a ruling on the formal in-vestigation regarding state aid that it had initiated on 12 September 2007. In its review, the European Commission determined that Deutsche Post AG was not overcompen-sated for providing universal services between 1989 and 2007 using state resources. It also did not find fault with the state guarantees for legacy liabilities. By contrast, in its review of funding for civil servants’ pensions, the European Commission concluded that illegal state aid had, in part, been received. It said that the pension relief granted to Deutsche Post AG by the Bundesnetzagentur during the price approval process led to Deutsche Post AG receiving a benefit, which it must repay to the Federal Republic of Germany; in addition, it must also be ensured that no benefits are received in the future which could be considered illegal state aid. The Commission furthermore stated that the precise amount to be repaid was to be calculated by the Federal Republic. In a press release, the European Commission had referred to an amount of between €500 mil-lion and €1 billion. Deutsche Post AG is of the opinion that the Commission’s state aid decision of 25 January 2012 cannot withstand legal review and has filed an appeal with the European Court of Justice in Luxembourg. The Federal Republic of Germany has similarly appealed the decision.
To implement the state aid ruling, the federal government called upon Deutsche Post AG on 29 May 2012 to make a payment of €298 million, including interest. Deutsche Post AG paid this amount to a trustee on 1 June 2012 and appealed the recovery order to the Administrative Court. The appeal, however, has been suspended pending a ruling from the European Court. The company made additional payments of €19.4 mil-lion, €15.6 million and €20.2 million to the trustee on 2 January 2013, 2 January 2014 and 2 January 2015, respectively. The payments made were reported in the balance sheet under non- current assets; the earnings position remained unaffected. The European Commission has not expressed its final acceptance of the calculation of the state aid to be repaid. On 17 December 2013, it initiated proceedings against the Federal Republic of Germany with the European Court of Justice to effect a higher repayment amount.
If the appeals issued by Deutsche Post AG or the federal government against the state aid ruling are successful, the opportunity exists that the payment of €298 million and the payments of €19.4 million, €15.6 million and €20.2 million made in addition – as well as the additional annual payments of around €19 million to be made in the future – will be returned. A repayment would only affect the liquidity of Deutsche Post AG; the earnings position would remain unaffected.
Glossary, page 218
Glossary, page 218
Deutsche Post DHL Group — 2014 Annual Report
90
On the other hand, although Deutsche Post AG and the federal government are of the opinion that the state aid decision cannot withstand legal review, it cannot be ruled out that Deutsche Post AG will ultimately be required to make a potentially higher pay-ment, which could have an adverse effect on earnings. More information about the state aid investigation is provided in the Notes.
On 14 November 2013, the Bundesnetzagentur determined the conditions for regulating certain mail prices requiring approval under the price-cap procedure from January 2014 to December 2018. The general rate of inflation less the produc-tivity growth rate stipulated by the regulatory authority (X-factor) in the amount of 0.2 % p. a. constitutes the key factor applicable to the price trend for these products. This would necessitate price reductions if the inflation rate in the reference period is lower than the productivity growth rate specified and permit price increases if the inflation rate in the reference period is higher than the productivity growth rate specified. On 15 October 2014, the Bundesnetzagentur approved a 1.0 % increase in the average price of all price-capped products.
On 8 June 2013, the Bundesnetzagentur initiated market abuse proceedings against Deutsche Post InHaus Services GmbH, citing discriminatory access conditions for sorting and consolidation services following a complaint by one of the company’s competitors. The party filing the complaint accused the company in particular of offer-ing other postal services providers better conditions for posting and collection than it itself had been offered. Deutsche Post InHaus Services GmbH considers the accusations to be unfounded. On 18 November 2014, the Bundesnetzagentur suspended the market abuse proceedings. It is currently unknown whether the complainant will appeal the suspension of the proceedings.
Since 1 July 2010, as a result of the revision of the relevant tax exemption provisions, the VAT exemption has only applied to those specific universal services in Germany that are not subject to individually negotiated agreements or provided on special terms (discounts etc.). Deutsche Post AG does not believe that the legislative amendment fully complies with the applicable provisions of European Community law. Due to the legal uncertainty resulting from the new legislation, Deutsche Post AG is endeavouring to clarify certain key issues with the tax authorities. Although Deutsche Post AG is imple-menting the required measures to a large extent, the differing legal opinions on the part of Deutsche Post AG and the tax authorities will be judicially clarified.
In light of the announced legal proceedings, we have not undertaken a risk classification.
In addition to the opportunities and risks arising from sector-specific regulation pursuant to the Postgesetz (PostG – German Postal Act), the company is subject to additional opportunities and risks arising from legal conditions.
On 5 November 2012, the Bundeskartellamt (German federal cartel office) initi-ated proceedings against Deutsche Post based on suspicion of abusive behaviour with respect to agreements on mail transport with major customers. Based upon information from Deutsche Post AG’s competitors and customer surveys, the authorities suspect that the company had violated the provisions of German and European antitrust law. Deutsche Post AG does not share this opinion. However, should the authorities find their suspicions confirmed, they may require Deutsche Post AG to refrain from certain practices or impose fines. Due to the on-going legal proceedings, we are not providing a risk assessment at present.
Note 53
Glossary, page 218
Deutsche Post DHL Group — 2014 Annual Report
91Group Management Report — oPPorTunITIeS anD rISKS — Categories of opportunities and risks
On 30 June 2014, DHL Express France received a Statement of Objections from the French Competition Authority alleging anti-competitive conduct in the domestic express business; a business which we had divested in June 2010. We are currently co-operating with the French authorities regarding the issues raised in the Statement of Objections. Due to the on-going legal proceedings, we are not providing a risk assessment.
Macroeconomic and industry-specific opportunities and risks
Risks arising from macroeconomic and sector-specific conditions are a key factor in determining the success of our business. For this reason we pay close attention to eco-nomic trends in the individual regions. Despite the volatile economic climate, demand for logistics services rose in 2014, as did the related revenues.
A variety of external factors offer us numerous opportunities, indeed we believe that the global market will continue to grow. Advancing globalisation means that the logistics industry will continue to grow at least as fast as or faster than the world econ-omy as a whole. This is especially true for Asia, where trade flows to other regions and in particular within the continent will continue to increase. As the market leader, our DHL divisions can generate above-average benefits from this. This also applies to regions such as South America and the Middle East, which continue to see robust growth. We are similarly well positioned in the emerging economies of Brazil, Russia, India, China and Mexico (BRIC+M) and will take advantage of opportunities arising in these markets.
Whether and to what extent the logistics market will grow is dependent on a num-ber of factors. The trend towards outsourcing business processes continues. As a result, supply chains are becoming more complex and more international but are also more prone to disruption. For this reason, customers want stable, integrated logistics solutions, which is what we provide with our broad-based service portfolio. We continue to see growth opportunities in this area, in particular in the Supply Chain division and as a result of closer co-operation between all our divisions.
The booming online marketplace represents another opportunity for us in that it is creating demand for transporting documents and goods. The B2C market is experiencing double-digit growth, particularly due to the rapid rise in digital retail trade. This has created high growth potential for the national and international parcel business, which we intend to tap into by expanding our parcel network.
On the other hand, we are nonetheless unable to rule out the possibility of an eco-nomic downturn in specific regions and a stagnation or decrease in transport quantities. However, this would not reduce demand for our services in all business units. Indeed, the opposite effect could arise in the parcel business, for example, as a result of an in-crease in online purchasing amongst consumers. Companies might also be forced to out-source transport services in order to lower costs. Cyclical risks can affect our divisions differently with respect to magnitude as well as point in time, which may mitigate the total effect. Therefore, we consider these risks to be medium at best. Moreover, we have taken measures in recent years to make costs more flexible and to allow us to respond quickly to a change in market demand.
Glossary, page 218
Deutsche Post DHL Group — 2014 Annual Report
92
Deutsche Post and DHL are in competition with other providers. Such competition can significantly impact our customer base as well as the levels of prices and margins in our markets. In the mail and logistics business, the key factors for success are quality, customer confidence and competitive prices. Thanks to our high quality along with the cost savings we have generated in recent years, we believe that we shall be able to remain competitive and keep any negative effects at a low level.
Financial opportunities and risks
As a global operator, Deutsche Post DHL Group is inevitably exposed to financial op-portunities and risks. These are mainly opportunities or risks arising from fluctuating exchange rates, interest rates and commodity prices and the Group’s capital require-ments. Using operational and financial measures, we try to reduce the volatility of our financial performance due to financial risk.
Opportunities and risks with respect to currencies may result from scheduled or planned future foreign currency transactions. Significant currency risks from planned transactions are quantified as a net position over a rolling 24-month period. Highly cor-related currencies are consolidated in blocks. The identified risks are partly hedged using derivatives. The most important planned net surpluses at the Group level are in pound sterling, Japanese yen and Indian rupee, whilst the Czech crown is the only currency with a considerable net deficit. By offsetting the net deficit in US dollars with surpluses in other highly correlated currencies, the net risk in the “US dollar block” at the Group level is relatively balanced and thus not actively managed. The average hedging level for the year 2015 was approximately 55 % as at the reporting date.
A potential general devaluation of the euro presents an opportunity for the Group’s earnings position. Based on current macroeconomic estimates, we consider this oppor-tunity to be of low relevance.
The main risk to the Group’s earnings position would be a general appreciation of the euro. The significance of this is considered low when considering the individual risks arising from the performance of the respective currencies.
As a logistics group, our biggest commodity price risks result from changes in fuel prices (kerosene, diesel and marine diesel). In the DHL divisions, most of these risks are passed on to customers via operating measures (fuel surcharges). We only have noteworthy hedging instruments for the purchase of diesel in the Post - eCommerce - Parcel (PeP) division.
The key control parameters for liquidity management are the centrally available liquidity reserves. Deutsche Post DHL Group had central liquidity reserves of €3.8 bil-lion as at the reporting date, consisting of central finan cial investments amounting to €1.8 billion plus a syndicated credit line of €2 billion. Therefore, the Group’s liquidity is sound in the short and medium term. Moreover, the Group enjoys open access to the capital markets on account of its good ratings within the industry, and is well positioned to secure long-term capital requirements.
The Group’s net debt amounted to €1.5 billion at the end of 2014. Given our existing interest rate hedging instruments, the share of financial liabilities with short-term interest lock-ins in total financial liabilities in the amount of €5.2 billion is approxi-mately 35%. The fact that the European Central bank is likely to keep short-term interest rates at a low level during 2015 and beyond favourably impacts the risk assessment.
Deutsche Post DHL Group — 2014 Annual Report
93Group Management Report — oPPorTunITIeS anD rISKS — Categories of opportunities and risks
Further information on the financial position and finance strategy of the Group as well as on the management of financial risks is found in the report on the economic position and in the Notes.
opportunities and risks arising from environmental protection
Our Group-wide opportunity and risk management also considers environmental develop ments.
Our customers want to improve their carbon efficiency and be supplied with infor-mation on their CO2 emissions, which we regard as a positive trend. Such an increase in environmental awareness presents new business potential: with our mail, parcel and express products as well as air and ocean freight transport, we not only lead our industry in the areas of energy-efficient transport, transparent emissions reports and climate- neutral products, but we also offer customer-specific solutions to reduce carbon emissions.
opportunities and risks arising from corporate strategy
Over the past years, the Group has ensured that its business activities are well positioned in the world’s fastest growing regions and markets. We are also constantly working to create efficient structures in all areas to enable us to flexibly adapt capacities and costs to demand – a prerequisite for lasting, profitable business success. With respect to strategic orientation, we are focusing on our core competencies in the mail and logistics busi-nesses with an eye towards growing organically and simplifying our processes for the benefit of our customers. Our earnings projections regularly take account of develop-ment opportunities arising from our strategic orientation. In the specified period under consideration, risks arising from the current corporate strategy, which extends over a long-term period, are considered to have a low relevance for the Group. In addition, the divisions face the following special situations:
In the PeP division, we are responding to the challenges presented by the structural change from a physical to a digital business. We are counteracting the risk arising from changing demand by expanding our range of services. Due to the e-commerce boom, we expect our parcel business to continue growing robustly in the coming years and are therefore extending our parcel network. We are also expanding our range of electronic communications services, securing our standing as the quality leader and, where pos-sible, making our transport and delivery costs more flexible. We follow developments in the market very closely and take these into account in our earnings projections. For the specified forecast period, we do not see these developments as having a significant potential to result in a negative impact.
In the Express division, our future success depends above all on general factors such as trends in the competitive environment, costs and quantities transported. After having spent recent years successfully restructuring our business and substantially improv-ing cost structures, we are focusing on fostering growth in our international business. We expect a further increase in shipment volumes. Based on this assumption, we are investing in our network, our services, our employees and the DHL brand. Against the backdrop of the past trend and the overall outlook, we do not see any significant strate-gic opportunities or risks for the Express division beyond those reported in the section entitled “Opportunities and risks arising from macroeconomic and industry-specific conditions”.
Note 50
Deutsche Post DHL Group — 2014 Annual Report
94
In the Global Forwarding, Freight division we purchase transport services from airlines, shipping companies and freight carriers rather than providing them ourselves. Under favourable circumstances, we succeed in purchasing transport services on a cost-effective basis. We thus have the opportunity of generating higher margins. When circumstances are not favourable, we bear the risk of not being able to pass on all price increases to our customers. The extent of the opportunities and risks essentially depends on trends in the supply, demand and price of transport services as well as the duration of our contracts. Comprehensive knowledge in the area of brokering transport services helps us to capitalise on opportunities and minimise risk.
Our Supply Chain division provides customers in a variety of industries with solu-tions along the entire logistics chain. Our success is highly dependent on our customers’ business success. Since we offer customers a widely diversified range of products in different sectors all over the world, we can diversify our risk portfolio and thus counter-act the incumbent risks. Moreover, our future success also depends on our ability to continuously improve our existing business and to grow in our most important markets and customer segments. We do not see any significant strategic opportunities or risks for the Supply Chain division beyond those reported in the section entitled “Opportunities and risks arising from macroeconomic and industry-specific conditions”.
opportunities and risks arising from internal processes
For us to render our services, a number of internal processes need to be integrated. In addition to fundamental operating processes, these include supporting functions such as sales and purchasing as well as corresponding management. Should we succeed in aligning our internal processes to meet customer needs whilst simultaneously lowering costs, this could lead to positive deviations from current projections. We are steadily improving internal processes with the help of our First Choice initiatives. This improves customer satisfaction whilst reducing our costs. Our earnings projection already incor-porates expected cost savings.
Logistics services are generally provided in bulk and require a complex oper ational infrastructure with high quality standards. To consistently guarantee reliability and punctual delivery, processes must be organised so as to proceed smoothly with no technical or personnel-related glitches. Any weaknesses with regard to posting and collection, sorting, transport, warehousing or delivery could seriously compromise our competitive position. We therefore adapt all processes to current circumstances as needed. We also take preventive measures to guard against disruptions or malfunctions in our operational processes. Should disruptions nonetheless occur, contingency plans will come into effect to minimise the consequences. Some risks from business inter-ruptions are also partly protected by our insurance policies.
opportunities and risks arising from information technology
The security of our information systems is particularly important to us. The goal is to en-sure continuous IT system operation and prevent unauthorised access to our systems and databases. To fulfil this responsibility, the Information Security Committee, a sub-com-mittee of the IT Board, has defined guidelines and procedures based on ISO 27002, the international standard for information security management. In addition, Group Risk Management, IT Audit, Data Protection and Corporate Security monitor and assess IT risk on an on-going basis. For our processes to run smoothly at all times, the essential IT systems must be constantly available. We ensure this by designing our systems to
Deutsche Post DHL Group — 2014 Annual Report
95Group Management Report — oPPorTunITIeS anD rISKS — Categories of opportunities and risks
protect against complete system failures. In addition to third-party data centres, we operate central data centres in the Czech Republic, Malaysia and the United States. Our systems are thus geographically separate and can be replicated locally.
We limit access to our systems and data so employees can only access the data they need to do their jobs. All systems and data are backed up on a regular basis and critical data are replicated across data centres.
All of our software is updated regularly to address bugs, close potential gaps in security and increase functionality. We employ a patch management process – a defined procedure for managing software upgrades – to control risks that could arise from out-dated software or from software upgrades.
Based on the measures described above, we estimate the probability of experien cing a significant IT incident with serious consequences as very unlikely.
Our E-POST products – first and foremost E-Postbrief – come with our pledge of security and data protection. In 2014, the associated platform was re-certified by the German Federal Office for Information Security in accordance with its standards for IT-Grundschutz in a seamless continuation of the previous certification. In addition, the 2013 certification from TÜV Informationstechnik GmbH pursuant to the criteria for trusted site privacy is still valid. This confirms compliance with the legal standards and applicable data protection regulations.
opportunities and risks arising from human resources
As a mail and logistics services group, it is particularly important that we have qualified and motivated employees in order to achieve long-term success. However, demographic change could lead to a decrease in the pool of available talent in various markets. To minimise the risk of failing to acquire a sufficient number of qualified employees, we have implemented various measures designed to motivate, commit, develop and pro-mote our employees.
We use Strategic Resource Management to address the risks arising from an aging population and the capacity shortages that may result from changing age and social structures. The experience gained is used to continuously improve this analysis and planning instrument. The Generations Pact agreed with trade unions in Germany also contributes to taking advantage of the career experience of employees for as long as possible whilst at the same time offering young people a career perspective.
Possible increases in both chronic and acute disease pose another risk to sustain-ing business operations. For example, an infectious disease such as Ebola that initially strikes only locally can quickly have a global impact when spreading via networked trade routes and global traffic flows. We are responding to this risk with a systematic health
management programme and cross-divisional co-operation.
Employees, page 75
Employees, page 75
Health and safety, page 77
Deutsche Post DHL Group — 2014 Annual Report
96
EXPECTED DEVELOPMENTS
Overall Board of Management assessment of the future economic position
Consolidated EBIT of €3.05 billion to €3.20 billion expected
We expect the global economy to continue to experience regional variations in 2015 and to demonstrate only moderate growth on the whole. A similar development is anticipated for world trade. Our strong position as market leader in the German mail and parcel business and in nearly all of our international logistics activities is the best possible basis for further growth. Our strategic focus on business driven by e-commerceand emerging economies that exhibit strong structural growth are the main factors wesee as supporting the long-term performance of our business. The Board of Manage-ment expects consolidated EBIT to reach €3.05 billion to €3.20 billion in financial year 2015. The Post - eCommerce - Parcel division is likely to contribute at least €1.3 billion to this figure. Compared with the previous year, we expect an additional improvement in overall earnings to €2.1 billion to €2.25 billion in the DHL divisions. Within the DHL divisions we expect a further increase in earnings for Express, whilst the transformation in the Global Forwarding, Freight division and investments in the Supply Chain division will dampen those divisions’ earnings. The Corporate Center / Other result is projected to remain at around €–0.35 billion. Due in particular to the forecast increase in EBIT, we also expect EAC to grow in financial year 2015. Free cash flow is expected to at least cover the dividend payment for financial year 2014 projected to be paid in May 2015.
Forecast period
outlook generally refers to 2015
The information contained in the report on expected developments generally refers to financial year 2015. However, in some instances we have chosen to extend the scope.
Future organisation
no material changes to the organisational structure planned
No material changes to the Group’s organisational structure are planned for financial year 2015.
Deutsche Post DHL Group — 2014 Annual Report
97Group Management Report — oPPorTunITIeS anD rISKS — Categories of opportunities and risks — exPeCTeD DeVeLoPMenTS — Overall Board of Management assessment of the future economic position — Forecast period — Future organisation
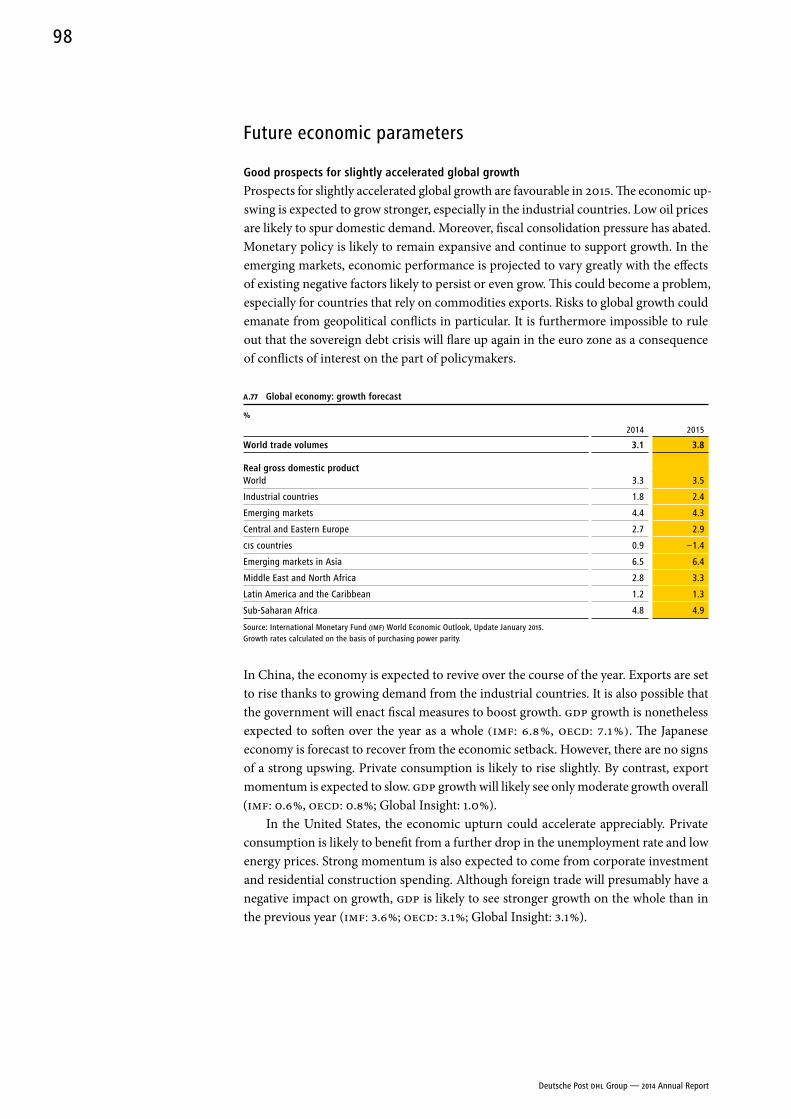
Future economic parameters
Good prospects for slightly accelerated global growth
Prospects for slightly accelerated global growth are favourable in 2015. The economic up-swing is expected to grow stronger, especially in the industrial countries. Low oil prices are likely to spur domestic demand. Moreover, fiscal consolidation pressure has abated. Monetary policy is likely to remain expansive and continue to support growth. In the emerging markets, economic performance is projected to vary greatly with the effects of existing negative factors likely to persist or even grow. This could become a problem, especially for countries that rely on commodities exports. Risks to global growth could emanate from geopolitical conflicts in particular. It is furthermore impossible to rule out that the sovereign debt crisis will flare up again in the euro zone as a consequence of conflicts of interest on the part of policymakers.
A.77 Global economy: growth forecast
%
2014 2015
World trade volumes 3.1 3.8
real gross domestic productWorld 3.3 3.5
Industrial countries 1.8 2.4
Emerging markets 4.4 4.3
Central and Eastern Europe 2.7 2.9
CIS countries 0.9 –1.4
Emerging markets in Asia 6.5 6.4
Middle East and North Africa 2.8 3.3
Latin America and the Caribbean 1.2 1.3
Sub-Saharan Africa 4.8 4.9
Source: International Monetary Fund (IMF) World Economic Outlook, Update January 2015. Growth rates calculated on the basis of purchasing power parity.
In China, the economy is expected to revive over the course of the year. Exports are set to rise thanks to growing demand from the industrial countries. It is also possible that the government will enact fiscal measures to boost growth. GDP growth is nonetheless expected to soften over the year as a whole (IMF: 6.8 %, OECD: 7.1 %). The Japanese economy is forecast to recover from the economic setback. However, there are no signs of a strong upswing. Private consumption is likely to rise slightly. By contrast, export momentum is expected to slow. GDP growth will likely see only moderate growth overall (IMF: 0.6 %, OECD: 0.8 %; Global Insight: 1.0 %).
In the United States, the economic upturn could accelerate appreciably. Private consumption is likely to benefit from a further drop in the unemployment rate and low energy prices. Strong momentum is also expected to come from corporate investment and residential construction spending. Although foreign trade will presumably have a negative impact on growth, GDP is likely to see stronger growth on the whole than in the previous year (IMF: 3.6 %; OECD: 3.1 %; Global Insight: 3.1 %).
Deutsche Post DHL Group — 2014 Annual Report
98
In the euro zone, the economy is forecast to recover gradually. Private consumption is likely to rise. Gross fixed capital formation is also expected to expand from its cur-rently very low level. Government spending, however, is projected to rise only slightly. No notable growth momentum is expected from foreign trade. All in all, GDP growth is projected to increase somewhat but still remain modest (IMF: 1.2 %; ECB: 1.0 %; Global Insight: 1.4 %).
Early indicators suggest that the German economy will revive gradually. Exports are expected to register strong growth and companies to gradually expand capital expend-iture. Private consumption could turn into the most important driver of growth. The number of employed people is likely to rise again on the annual average. Due to the weak starting position, however, it is nonetheless questionable whether GDP growth will be as strong as in the prior year (IMF: 1.3 %, Sachverständigenrat: 1.0 %; Global Insight: 1.6 %).
The expected revival of the global economy is likely to increase demand for crude oil. Since it is improbable that the supply will rise significantly in light of the low prices, it is more likely than not that prices will rise again in 2015.
The ECB will very probably maintain its key interest rate at the current level for some time and implement the decisions taken at the start of 2015. By contrast, the US Federal Reserve could raise its key interest rate slightly in 2015, which could lead to a moderate increase in capital market interest rates.
World trade grows, thanks especially to asia
The emerging markets in Asia are expected to play a significant role in the growth of global trade again in 2015. At 3.0 %, growth in global trade volumes (transported quan-tity in tonnes) is forecast to be overall slightly higher in 2015 compared with 2014 due to the slight improvement in the economic climate in the industrial countries.
The mail and parcel business in the digital age
The market for paper-based mail communication continues to decline in Germany, though more moderately than in other European countries. Mail volumes are decreasing, primarily because people are increasingly communicating digitally rather than physic-ally. With E-POST, we have developed a portfolio of digital products that are gaining traction in the German market. At the beginning of 2014, we increased postage for a standard domestic letter slightly in accordance with the price-cap procedure. Although prices were subject to a further slight increase at the beginning of 2015, they are still below the European average.
The German advertising market saw a nominal increase in revenues in 2014. Mod-erate growth is also expected in 2015. Similar to the mail business, advertising budgets are increasingly being shifted to digital media. The trend is towards personalised, cross- media campaigns. We intend to consolidate our position in the market for paper-based advertising. Furthermore, we want to tap into new fields by developing new technologies for online marketing and cross-media campaigns.
Glossary, page 218
Deutsche Post DHL Group — 2014 Annual Report
99Group Management Report — exPeCTeD DeVeLoPMenTS — Future economic parameters
The parcel market will continue to grow both in Germany and internationally. We shall drive this development with our high-quality shipping and delivery services as well as the associated infrastructure for new markets. By offering logistics services specifically for the e-commerce segment, we shall also further expand our international market position. This will also have a positive impact on the international mail business
– a market that is likely to see slight growth, particularly due to increasing merchandise shipping.
International express business to remain stable
Experience shows that growth in the international express market is highly dependent upon the economy. The volume trend and the growth in our international business market share suggest that the express market will continue to develop stably in 2015.
By implementing further initiatives to increase profitability and quality, we shall continue to improve our result. We are confident that we shall remain on course for growth and defend our leading market position. Our global DHL brand campaign and logistics partnerships will also contribute to this.
Market trends in freight forwarding business likely to continue
In 2015, we anticipate growth in the air freight market to follow a similar trend as in the reporting year.
Ocean freight capacities are expected to increase further as a result of new vessels being put into operation; however, ocean carriers will continue to limit capacities. At the same time, demand is likely to remain stable or rise slightly.
Should the moderate growth observed in the global and European economies in the reporting year continue in 2015, the European overland transport market is likely to see a positive trend similar to that of 2014.
outlook for Supply Chain market remains optimistic
The trend towards outsourcing warehouse and distribution services continues. For this reason, projections indicate that the market for contract logistics will continue to ex-perience continuous growth of more than 6 %. Many companies prefer to outsource their logistics due to market challenges such as high cost pressure and increasingly complex supply chains. Demand for supply chain services is expected to see particularly strong growth in emerging markets such as China, India, Brazil and Mexico, where we benefit from a strong market position. Although the economic environment remains uncertain, we are well positioned in the Supply Chain division to deliver consistent growth.
Revenue and earnings forecast
Consolidated EBIT of €3.05 billion to €3.20 billion expected
The world economy again registered below-average growth in the reporting year. We expect the global economy to continue to experience regional variations in 2015 and to grow only moderately on the whole. The global trading volumes relevant to our business are likely to perform similarly. Revenue performance is expected to reflect our strategic focus on business driven by e-commerce and emerging economies evidencing strong structural growth.
Brands, page 85
Deutsche Post DHL Group — 2014 Annual Report
100
Against this backdrop, we expect consolidated EBIT to reach €3.05 billion to €3.20 billion in financial year 2015. The Post - eCommerce - Parcel division is likely to contribute at least €1.3 billion to this figure. Compared with the previous year, we expect an additional improvement in overall earnings to €2.1 billion to €2.25 billion in the DHL divisions. Within the DHL divisions, Express is expected to show continued earn-ings growth, whereas transformation in Global Forwarding, Freight and investments in Supply Chain will dampen EBIT growth in the latter divisions. The Corporate Center /Other result is projected to remain at around €–0.35 billion.
In line with our Group strategy, we are targeting organic growth and anticipate only a few small acquisitions in 2015, as in the previous year.
We are reiterating the earnings forecast for 2016 that we presented in August 2014: consolidated EBIT is expected to reach between €3.4 billion and €3.7 billion in 2016. The PeP division is likely to account for more than €1.3 billion of this and the earnings contribution of the DHL divisions is forecast to range from €2.45 billion to €2.75 billion.
Our finance strategy calls for a payout of 40 % to 60 % of net profits as dividends as a general rule. At the Annual General Meeting on 27 May 2015, we intend to propose to the shareholders that a dividend per share of €0.85 be paid for financial year 2014 (previous year: €0.80).
Expected financial position
no change in the Group’s credit rating
In light of the earnings forecast for 2015, we expect the “FFO to debt” indicator to remain stable on the whole and do not expect the rating agencies to change our credit rating from the present level.
Liquidity to remain solid
We anticipate a deterioration in our liquidity in the first half of 2015 as a result of the annual pension prepayment due to Bundesanstalt für Post und Telekommunikation as well as the dividend payment for financial year 2014 in May 2015. However, our oper-ating liquidity situation will improve again significantly towards the end of the year due to the upturn in business that is normal in the second half.
Investments of around €2.0 billion expected
In 2015, we plan to increase capital expenditure to around €2.0 billion to support the goals of our Strategy 2020. The focus of investment will be upon technical equipment and machinery, aircraft, transport and operating equipment as well as IT.
In the Post - eCommerce - Parcel division, we shall further expand our domestic and international parcel network. Moreover, we plan to optimise our IT, particularly in the growth sector of eCommerce - Parcel and to expand delivery options, such as the parcel box or Packstation. In the Express division, we expect investment spending in 2015 to considerably exceed that of the previous year. We shall continue to invest in global and regional hubs and in continually renewing our aircraft fleet. In the Global Forwarding, Freight division, we envisage lower investments in 2015, although we shall expand our IT, in particular for the NFE project. In the Supply Chain division, capital expenditure
Deutsche Post DHL Group — 2014 Annual Report
101Group Management Report — exPeCTeD DeVeLoPMenTS — Future economic parameters — Revenue and earnings forecast — Expected financial position
in 2015 is expected to be slightly above that of the reporting year. New business projects will continue to be the main focus of investments. We shall also be investing in strategic initiatives and business expansion.
Cross-divisional investments in 2015 will be lower than in the reporting year.
Development of further indicators relevant for internal management
EAC increases slightly
As a result of the projected growth in EBIT, we expect that EAC will also grow in 2015. The divisions will be under the same impact with regard to EAC as laid out in the EBIT outlook. However, as our investing activities continue and the net base will increase as a result, the rise in EBIT after asset charge may fall slightly short of EBIT growth. Free cash flow is expected to at least cover the dividend payment for financial year 2014 projected to be made in May 2015.
employee opinion Survey results again positive
We intend to keep up the positive results that our Employee Opinion Survey achieved in the reporting year. For 2015, we expect to see an increase to 72 % in the approval rating for the key performance indicator Active Leadership.
Transparent presentation of greenhouse gas efficiency
We intend to increase transparency in our greenhouse gas efficiency because it is the target of our GoGreen environmental protection programme. It will be measured using a CO2 Efficiency Index (CEX), which is based upon division and business unit-specific emission intensity figures that show the ratio of the respective emissions to a matching performance indicator. Our goal therefore remains to consider CEX as a non-financial indicator relevant for internal management in the Group.
This Annual Report contains forward-looking statements that relate to the business, financial performance and results of oper-ations of Deutsche Post AG. Forward-looking statements are not historical facts and may be identified by words such as “believes”,
“ expects”, “predicts”, “intends”, “projects”, “plans”, “estimates”, “aims”, “foresees”, “anticipates”, “targets” and similar expressions. As these statements are based on current plans, estimates and projections, they are subject to risks and uncertainties that could cause actual results to be materially different from the future development, performance or results expressly or implicitly assumed in the forward-looking statements. Readers are cautioned not to place undue reliance on these forward-looking statements, which apply only as at the date of this presentation. Deutsche Post AG does not intend or assume any obligation to update these forward- looking statements to reflect events or circumstances after the date of this Annual Report.
Any internet sites referred to in the Group Management Report do not form part of the report.
Deutsche Post DHL Group — 2014 Annual Report
102
B COR
POR
ATE G
OV
ERN
AN
CE
103 — 130
CORPORATE GOVERNANCE
B
105 REPORT OF THE SUPERVISORY BOARD
109 SUPERVISORY BOARD 109 Members of the Supervisory Board 109 Committees of the Supervisory Board
110 MANDATES 110 Mandates held by the Board of Management 110 Mandates held by the Supervisory Board
111 CORPORATE GOVERNANCE REPORT 117 Remuneration report
CORPORATE GOVERNANCE
B
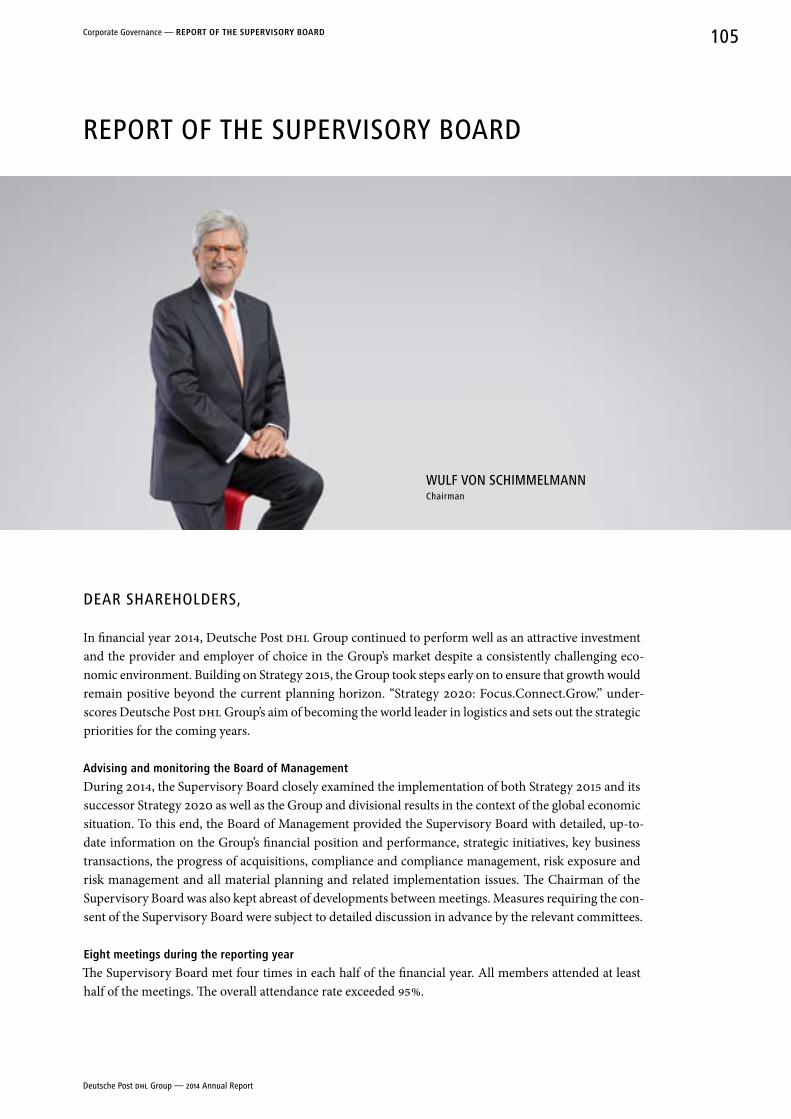
REPORT OF THE SUPERVISORY BOARD
DEAR SHAREHOLDERS,
In financial year 2014, Deutsche Post DHL Group continued to perform well as an attractive investment and the provider and employer of choice in the Group’s market despite a consistently challenging eco-nomic environment. Building on Strategy 2015, the Group took steps early on to ensure that growth would remain positive beyond the current planning horizon. “Strategy 2020: Focus.Connect.Grow.” under-scores Deutsche Post DHL Group’s aim of becoming the world leader in logistics and sets out the strategic priorities for the coming years.
advising and monitoring the Board of Management
During 2014, the Supervisory Board closely examined the implementation of both Strategy 2015 and its successor Strategy 2020 as well as the Group and divisional results in the context of the global economic situation. To this end, the Board of Management provided the Supervisory Board with detailed, up-to-date information on the Group’s financial position and performance, strategic initiatives, key business transactions, the progress of acquisitions, compliance and compliance management, risk exposure and risk management and all material planning and related implementation issues. The Chairman of the Supervisory Board was also kept abreast of developments between meetings. Measures requiring the con-sent of the Supervisory Board were subject to detailed discussion in advance by the relevant committees.
eight meetings during the reporting year
The Supervisory Board met four times in each half of the financial year. All members attended at least half of the meetings. The overall attendance rate exceeded 95 %.
WULF VON SCHIMMELMANNChairman
Deutsche Post DHL Group — 2014 Annual Report
105Corporate Governance — rePorT oF THe SuPerVISory BoarD
The annual and consolidated financial statements and the management reports for 2013 were dis-cussed in detail and approved at the financial statements meeting on 11 March 2014. The meeting was also attended by the auditors. After a thorough review, we endorsed the Board of Management’s proposal for the appropriation of the net retained profit for financial year 2013. We also approved a share capital increase in order to finance a share buy-back to settle share-based payments due to executives in 2014. The financial statements meeting approved the Supervisory Board’s proposed resolutions for the Annual General Meeting (AGM). The meeting also discussed variable remuneration components, with a particular emphasis on the performance targets achieved. In addition, we examined the findings of the efficiency review of the work of the Supervisory Board. The Supervisory Board noted and accepted Bruce Edwards’ resignation from the Board of Management. Mr Edwards’ successor, John Gilbert, was appointed to the Board of Management for a three-year term.
In an extraordinary meeting of the Supervisory Board on 26 March 2014, the Board of Manage-ment gave a detailed presentation setting out the principles of “Strategy 2020: Focus.Connect.Grow.”. Another extraordinary meeting was held immediately after the Deutsche Post AG AGM on 27 May 2014 to determine the composition of the Supervisory Board committees. Hero Brahms stepped down from the Supervisory Board at the end of the AGM as he had reached the upper age limit for Supervisory Board members. The members of the Supervisory Board elected Stefan Schulte as the new chair of the Finance and Audit Committee. Details of the current members of the Supervisory Board committees can be found on page 109.
At the Supervisory Board meeting on 27 June 2014, we discussed the Group’s IT strategy. We also con-sidered the impending mandate renewals and new appointments relevant to the Board of Management.
At the start of July, the Supervisory Board accepted Angela Titzrath’s resignation from the Board of Management using the written procedure. The Supervisory Board approved the renewal of Jürgen Gerdes’ mandate and contract for a further five years at an extraordinary meeting on 8 July 2014.
The Supervisory Board held one ordinary meeting and one closed meeting on 22 and 23 Septem-ber 2014. The main focus of the Supervisory Board meeting was the question of whether Board of Manage-ment remuneration was appropriate. The Supervisory Board decided to transfer responsibility for M & A activities from the Finance and Audit Committee to the Strategy Committee. During the closed meeting, presentations by external speakers describing the customers’ and investors’ point of view, as well as con-tributions from other speakers on social sustainability in logistics companies and management culture, formed the basis for lively debate in the plenary meeting. The discussions focused on implementing Strategy 2015 and integrating Strategy 2020 into Group and divisional activities. As part of the on-going training and support recommended for Supervisory Board members in the German Corporate Govern-ance Code (DCGK), the meeting was followed by a Directors’ Day, with presentations by selected speakers.
At the extraordinary Supervisory Board meeting on 31 October 2014, we appointed Melanie Kreis as member of the Board of Management and Labour Director.
On 10 December, at the last meeting of the Supervisory Board in 2014, we approved the 2015 busi-ness plan after extensive discussions and set the Board of Management’s performance targets for 2015. In addition, a share capital increase was resolved upon for the purpose of financing a share buy-back to settle share-based payments due to executives in 2015. We also reiterated our unqualified Declaration of Conformity with the German Corporate Governance Code.
Hard work by the committees
The Executive Committee met five times during the year under review. The main agenda items were matters regarding the Board of Management and preparations for the various Supervisory Board meetings.
The Personnel Committee met four times. The topics discussed included women in executive positions, personnel development measures, the Group-wide Certified programme which promotes employee commitment and changes in corporate culture, and the annual Employee Opinion Survey.
Deutsche Post DHL Group — 2014 Annual Report
106
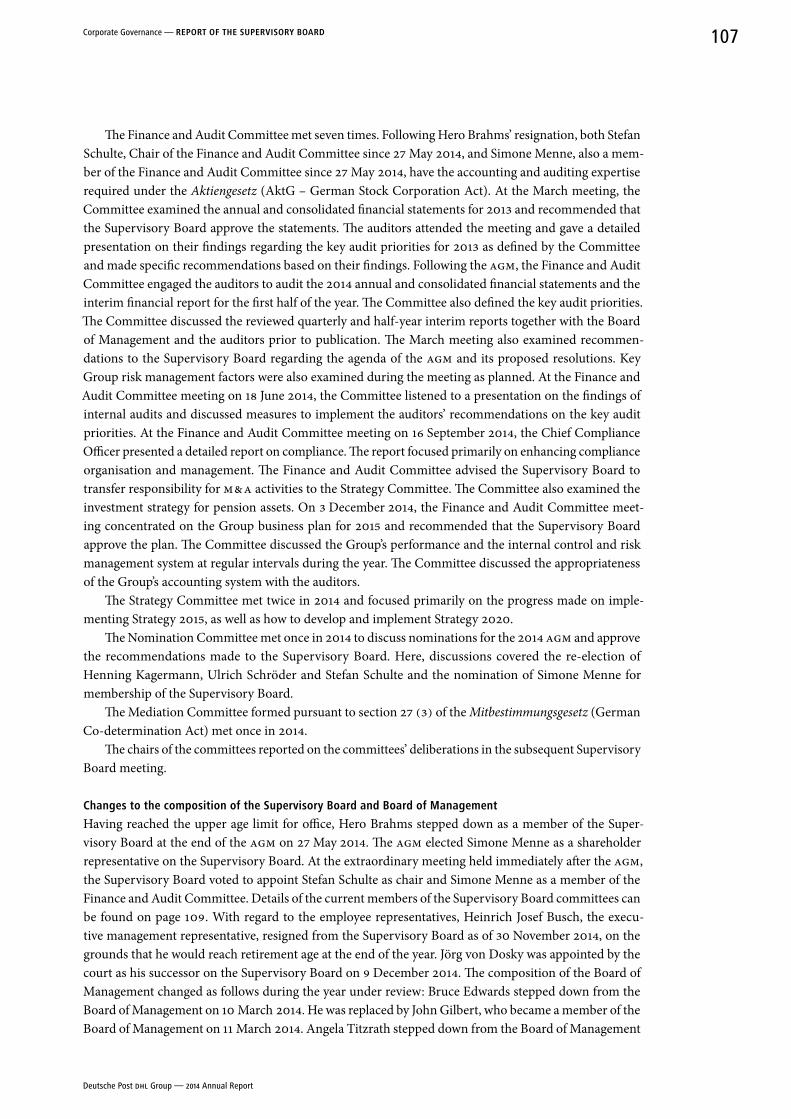
The Finance and Audit Committee met seven times. Following Hero Brahms’ resignation, both Stefan Schulte, Chair of the Finance and Audit Committee since 27 May 2014, and Simone Menne, also a mem-ber of the Finance and Audit Committee since 27 May 2014, have the accounting and auditing expertise required under the Aktiengesetz (AktG – German Stock Corporation Act). At the March meeting, the Committee examined the annual and consolidated financial statements for 2013 and recommended that the Supervisory Board approve the statements. The auditors attended the meeting and gave a detailed presentation on their findings regarding the key audit priorities for 2013 as defined by the Committee and made specific recommendations based on their findings. Following the AGM, the Finance and Audit Committee engaged the auditors to audit the 2014 annual and consolidated financial statements and the interim financial report for the first half of the year. The Committee also defined the key audit priorities. The Committee discussed the reviewed quarterly and half-year interim reports together with the Board of Management and the auditors prior to publication. The March meeting also examined recommen-dations to the Supervisory Board regarding the agenda of the AGM and its proposed resolutions. Key Group risk management factors were also examined during the meeting as planned. At the Finance and Audit Committee meeting on 18 June 2014, the Committee listened to a presentation on the findings of internal audits and discussed measures to implement the auditors’ recommendations on the key audit priorities. At the Finance and Audit Committee meeting on 16 September 2014, the Chief Compliance Officer presented a detailed report on compliance. The report focused primarily on enhancing com pliance organisation and management. The Finance and Audit Committee advised the Super visory Board to transfer responsibility for M & A activities to the Strategy Committee. The Committee also examined the investment strategy for pension assets. On 3 December 2014, the Finance and Audit Committee meet-ing concentrated on the Group business plan for 2015 and recommended that the Supervisory Board approve the plan. The Committee discussed the Group’s performance and the internal control and risk management system at regular inter vals during the year. The Committee discussed the appropriateness of the Group’s accounting system with the auditors.
The Strategy Committee met twice in 2014 and focused primarily on the progress made on imple-menting Strategy 2015, as well as how to develop and implement Strategy 2020.
The Nomination Committee met once in 2014 to discuss nominations for the 2014 AGM and approve the recommendations made to the Supervisory Board. Here, discussions covered the re-election of Henning Kagermann, Ulrich Schröder and Stefan Schulte and the nomination of Simone Menne for membership of the Supervisory Board.
The Mediation Committee formed pursuant to section 27 (3) of the Mitbestimmungsgesetz (German Co-determination Act) met once in 2014.
The chairs of the committees reported on the committees’ deliberations in the subsequent Supervisory Board meeting.
Changes to the composition of the Supervisory Board and Board of Management
Having reached the upper age limit for office, Hero Brahms stepped down as a member of the Super-visory Board at the end of the AGM on 27 May 2014. The AGM elected Simone Menne as a shareholder representative on the Supervisory Board. At the extraordinary meeting held immediately after the AGM, the Supervisory Board voted to appoint Stefan Schulte as chair and Simone Menne as a member of the Finance and Audit Committee. Details of the current members of the Supervisory Board committees can be found on page 109. With regard to the employee representatives, Heinrich Josef Busch, the execu -tive management representative, resigned from the Supervisory Board as of 30 November 2014, on the grounds that he would reach retirement age at the end of the year. Jörg von Dosky was appointed by the court as his successor on the Supervisory Board on 9 December 2014. The composition of the Board of Management changed as follows during the year under review: Bruce Edwards stepped down from the Board of Management on 10 March 2014. He was replaced by John Gilbert, who became a member of the Board of Management on 11 March 2014. Angela Titzrath stepped down from the Board of Management
Deutsche Post DHL Group — 2014 Annual Report
107Corporate Governance — rePorT oF THe SuPerVISory BoarD
as of 2 July 2014. Melanie Kreis was appointed as a member of the Board of Management and Labour Director on 31 October 2014. In the interim period, the Chief Executive Officer Frank Appel also took on responsibility for the Human Resources board department.
Managing conflicts of interest
None of the Supervisory Board members holds positions on the governing bodies of or provides consultancy services to the Group’s main competitors. The Supervisory Board has not been informed of any conflicts of interest affecting individual members during the year under review.
Full compliance with the recommendations of the German Corporate Governance Code
In December 2014, the Board of Management and the Supervisory Board issued an unqualified Declaration of Conformity pursuant to section 161 of the AktG, which was also published on the company’s website. The declarations from previous years are also available on the website. In financial year 2014, Deutsche Post AG complied with all recommendations of the Government Commission for the German Corporate Governance Code, as amended on 13 May 2013 and 24 June 2014. The company also intends to continue to comply with all recommendations contained in the Code as amended on 24 June 2014. The Corporate Governance Report (page 111 ff.) contains more information about corporate governance within the company and the remuneration report.
Annual and consolidated financial statements audited
The auditors appointed by the AGM, PricewaterhouseCoopers Aktiengesellschaft Wirtschaftsprüfungsgesellschaft (PwC), Düsseldorf, conducted an audit of the annual and consolidated financial statements for financial year 2014, including the respective management reports, and issued unqualified audit opinions. PwC also reviewed the quarterly financial reports and the interim report for the first half of the year.
Following a detailed preliminary assessment by the Finance and Audit Committee, the Supervisory Board reviewed the 2014 annual and consolidated financial statements and the management reports, including the appropriation of the net retained profit as proposed by the Board of Management, at the financial statements meeting held on 10 March 2015. The auditors’ reports were made available to all Supervisory Board members and were discussed in detail with the Board of Management in the presence of the auditors. The Supervisory Board concurred with the results of the audit and approved the annual and consolidated financial statements for financial year 2014, as recommended by the Finance and Audit Committee. No objections were raised on the basis of the final outcome of the examination by the Supervisory Board and the Finance and Audit Committee of the annual and consolidated financial statements, the management reports and the proposal for the appropriation of the net retained profit. The Supervisory Board endorses the Board of Management’s proposal for the appropriation of the net retained profit and the payment of a dividend of €0.85 per share.
We would like to thank the Board of Management and all employees for their genuine commitment and all their hard work in a challenging economic climate. You have all made an important contribution to the company’s success.
Bonn, 10 March 2015The Supervisory Board
Wulf von SchimmelmannChairman
Deutsche Post DHL Group — 2014 Annual Report
108
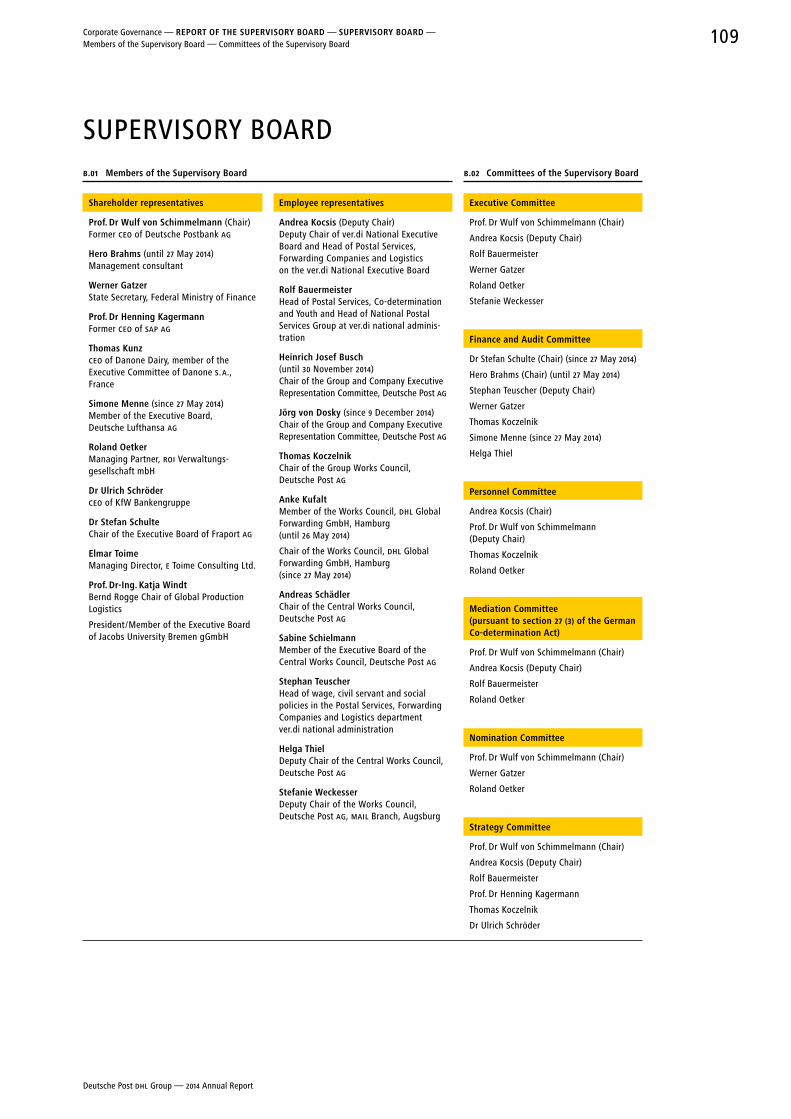
SUPERVISORY BOARDB.01 Members of the Supervisory Board B.02 Committees of the Supervisory Board
Shareholder representatives
Prof. Dr Wulf von Schimmelmann (Chair)Former CEO of Deutsche Postbank AG
Hero Brahms (until 27 May 2014)Management consultant
Werner GatzerState Secretary, Federal Ministry of Finance
Prof. Dr Henning KagermannFormer CEO of SAP AG
Thomas KunzCEO of Danone Dairy, member of the Executive Committee of Danone S. A., France
Simone Menne (since 27 May 2014)Member of the Executive Board, Deutsche Lufthansa AG
roland oetkerManaging Partner, ROI Verwaltungs-gesellschaft mbH
Dr ulrich SchröderCEO of KfW Bankengruppe
Dr Stefan SchulteChair of the Executive Board of Fraport AG
elmar ToimeManaging Director, E Toime Consulting Ltd.
Prof. Dr-Ing. Katja WindtBernd Rogge Chair of Global Production Logistics
President / Member of the Executive Board of Jacobs University Bremen gGmbH
employee representatives
andrea Kocsis (Deputy Chair)Deputy Chair of ver.di National Executive Board and Head of Postal Services, Forwarding Companies and Logistics on the ver.di National Executive Board
rolf BauermeisterHead of Postal Services, Co-determination and Youth and Head of National Postal Services Group at ver.di national adminis-tration
Heinrich Josef Busch (until 30 November 2014)Chair of the Group and Company Executive Representation Committee, Deutsche Post AG
Jörg von Dosky (since 9 December 2014)Chair of the Group and Company Executive Representation Committee, Deutsche Post AG
Thomas KoczelnikChair of the Group Works Council, Deutsche Post AG
anke KufaltMember of the Works Council, DHL Global Forwarding GmbH, Hamburg ( until 26 May 2014)
Chair of the Works Council, DHL Global Forwarding GmbH, Hamburg (since 27 May 2014)
andreas SchädlerChair of the Central Works Council, Deutsche Post AG
Sabine SchielmannMember of the Executive Board of the Central Works Council, Deutsche Post AG
Stephan TeuscherHead of wage, civil servant and social policies in the Postal Services, Forwarding Companies and Logistics department ver.di national administration
Helga ThielDeputy Chair of the Central Works Council, Deutsche Post AG
Stefanie WeckesserDeputy Chair of the Works Council, Deutsche Post AG, MAIL Branch, Augsburg
executive Committee
Prof. Dr Wulf von Schimmelmann (Chair)
Andrea Kocsis (Deputy Chair)
Rolf Bauermeister
Werner Gatzer
Roland Oetker
Stefanie Weckesser
Finance and audit Committee
Dr Stefan Schulte (Chair) (since 27 May 2014)
Hero Brahms (Chair) (until 27 May 2014)
Stephan Teuscher (Deputy Chair)
Werner Gatzer
Thomas Koczelnik
Simone Menne (since 27 May 2014)
Helga Thiel
Personnel Committee
Andrea Kocsis (Chair)
Prof. Dr Wulf von Schimmelmann (Deputy Chair)
Thomas Koczelnik
Roland Oetker
Mediation Committee (pursuant to section 27 (3) of the German Co-determination act)
Prof. Dr Wulf von Schimmelmann (Chair)
Andrea Kocsis (Deputy Chair)
Rolf Bauermeister
Roland Oetker
nomination Committee
Prof. Dr Wulf von Schimmelmann (Chair)
Werner Gatzer
Roland Oetker
Strategy Committee
Prof. Dr Wulf von Schimmelmann (Chair)
Andrea Kocsis (Deputy Chair)
Rolf Bauermeister
Prof. Dr Henning Kagermann
Thomas Koczelnik
Dr Ulrich Schröder
Deutsche Post DHL Group — 2014 Annual Report
109Corporate Governance — rePorT oF THe SuPerVISory BoarD — SuPerVISory BoarD — Members of the Supervisory Board — Committees of the Supervisory Board
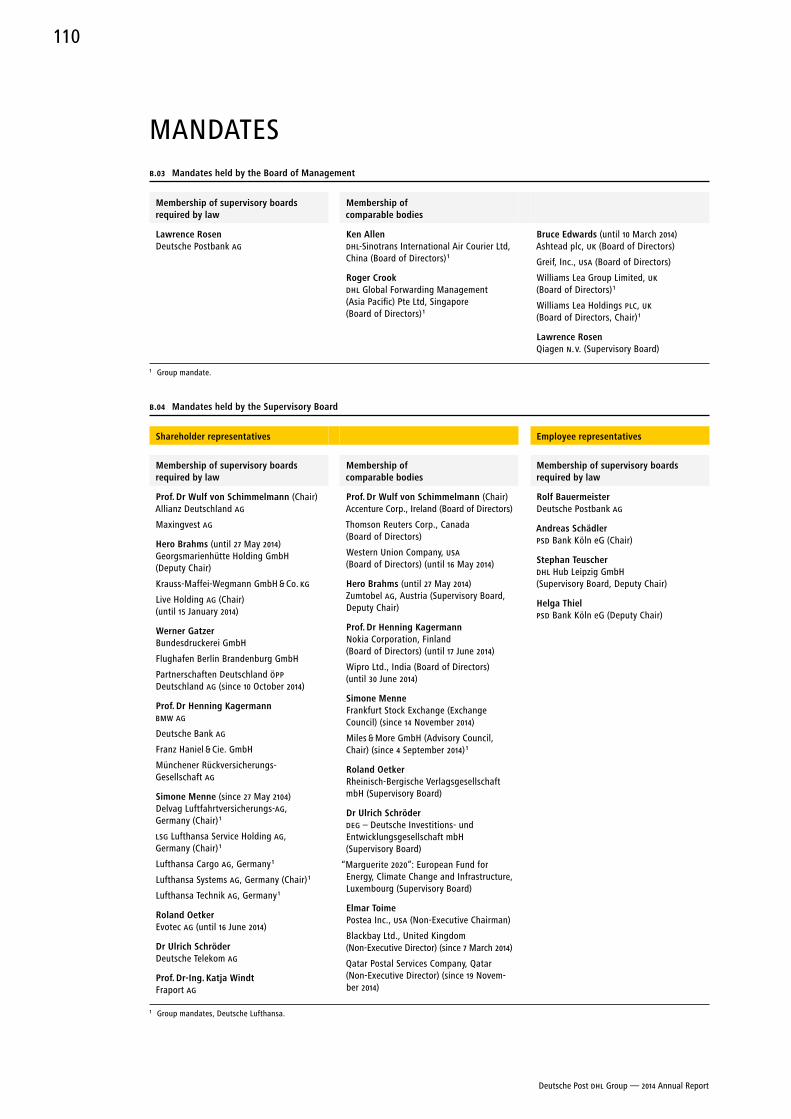
MANDATESB.03 Mandates held by the Board of Management
Membership of supervisory boards required by law
Lawrence rosenDeutsche Postbank AG
Membership of comparable bodies
Ken allenDHL-Sinotrans International Air Courier Ltd, China (Board of Directors) 1
roger CrookDHL Global Forwarding Management (Asia Pacific) Pte Ltd, Singapore (Board of Directors) 1
Bruce edwards (until 10 March 2014)Ashtead plc, UK (Board of Directors)
Greif, Inc., USA (Board of Directors)
Williams Lea Group Limited, UK (Board of Directors) 1
Williams Lea Holdings PLC, UK (Board of Directors, Chair) 1
Lawrence rosenQiagen n. V. (Supervisory Board)
1 Group mandate.
B.04 Mandates held by the Supervisory Board
Shareholder representatives
Membership of supervisory boards required by law
Prof. Dr Wulf von Schimmelmann (Chair)Allianz Deutschland AG
Maxingvest AG
Hero Brahms (until 27 May 2014)Georgsmarienhütte Holding GmbH (Deputy Chair)
Krauss-Maffei-Wegmann GmbH & Co. KG
Live Holding AG (Chair) (until 15 January 2014)
Werner GatzerBundesdruckerei GmbH
Flughafen Berlin Brandenburg GmbH
Partnerschaften Deutschland ÖPP Deutschland AG (since 10 October 2014)
Prof. Dr Henning KagermannBMW AG
Deutsche Bank AG
Franz Haniel & Cie. GmbH
Münchener Rückversicherungs- Gesellschaft AG
Simone Menne (since 27 May 2104)Delvag Luftfahrtversicherungs-AG, Germany (Chair) 1
LSG Lufthansa Service Holding AG, Germany (Chair) 1
Lufthansa Cargo AG, Germany 1
Lufthansa Systems AG, Germany (Chair) 1
Lufthansa Technik AG, Germany 1
roland oetkerEvotec AG (until 16 June 2014)
Dr ulrich SchröderDeutsche Telekom AG
Prof. Dr-Ing. Katja WindtFraport AG
Membership of comparable bodies
Prof. Dr Wulf von Schimmelmann (Chair)Accenture Corp., Ireland (Board of Directors)
Thomson Reuters Corp., Canada (Board of Directors)
Western Union Company, USA (Board of Directors) (until 16 May 2014)
Hero Brahms (until 27 May 2014)Zumtobel AG, Austria (Supervisory Board, Deputy Chair)
Prof. Dr Henning KagermannNokia Corporation, Finland (Board of Directors) (until 17 June 2014)
Wipro Ltd., India (Board of Directors) (until 30 June 2014)
Simone MenneFrankfurt Stock Exchange (Exchange Council) (since 14 November 2014)
Miles & More GmbH (Advisory Council, Chair) (since 4 September 2014) 1
roland oetkerRheinisch-Bergische Verlagsgesellschaft mbH (Supervisory Board)
Dr ulrich SchröderDEG – Deutsche Investitions- und Entwicklungsgesellschaft mbH ( Supervisory Board)
“Marguerite 2020”: European Fund for Energy, Climate Change and Infrastructure, Luxembourg (Supervisory Board)
elmar ToimePostea Inc., USA (Non-Executive Chairman)
Blackbay Ltd., United Kingdom (Non-Executive Director) (since 7 March 2014)
Qatar Postal Services Company, Qatar (Non-Executive Director) (since 19 Novem-ber 2014)
employee representatives
Membership of supervisory boards required by law
rolf BauermeisterDeutsche Postbank AG
andreas SchädlerPSD Bank Köln eG (Chair)
Stephan TeuscherDHL Hub Leipzig GmbH (Supervisory Board, Deputy Chair)
Helga ThielPSD Bank Köln eG (Deputy Chair)
1 Group mandates, Deutsche Lufthansa.
Deutsche Post DHL Group — 2014 Annual Report
110
CORPORATE GOVERNANCE REPORTannual Corporate Governance Statement pursuant to section 289a
of the Handelsgesetzbuch (HGB – German Commercial Code)
This Annual Corporate Governance Statement contains information about the main compo-nents of Deutsche Post DHL Group’s corporate governance structure. These include the Declaration of Conformity by the Board of Management and the Supervisory Board, rele-vant corporate governance practices that exceed legal requirements, the working methods of the Board of Management and the Supervisory Board, the composition and working methods of the committees, and the composition targets for the Supervisory Board.
Company in compliance with all recommendations of the German Corporate
Governance Code
In December 2014, the Board of Management and the Supervisory Board once again issued an unqualified Declaration of Conformity pursuant to section 161 of the AktG, which reads as follows:
“The Board of Management and the Supervisory Board of Deutsche Post AG declare that the recommendations of the Government Commission German Corpor-ate Governance Code in the version dated 13 May 2013 / 24 June 2014 have been com-plied with since issuance of the Declaration of Conformity in December 2013 and that it is intended to comply with all recommendations of the Code in the version dated 24 June 2014 in the future.”
We also intend to implement the suggestions made in the Code, with one exception: the Annual General Meeting will only be broadcast on the internet up to the end of the Chief Executive Officer’s address.
Specific corporate governance practices
Our guiding principle is “respect and results”: we expect our corporate governance to rise to the challenge of achieving first-class results every day whilst also considering the needs of our employees, customers and investors.
Accepting corporate responsibility is integral to our Group strategy. We put our knowledge and global presence to good use so as to make a positive contribution to the environment, society and our business. We systematically include our stakeholders’ expectations and needs in our strategic decisions, develop sustainable solutions for our customers and use our expertise in logistics to also address social issues. We concentrate these efforts on environmental protection, disaster management and improving educa-tional and employment opportunities. We also support voluntary activities under taken by our employees. Our annual Group-wide Employee Opinion Survey has again revealed high levels of continuing positive feedback. As in 2013, 77 % of our employees partici-pated in the survey.
Furthermore, the annual private customer survey conducted by the Kunden monitor Deutschland independent market study confirmed that customer satisfaction remains high at 95 %. We achieved excellent results in transit times for letters sent within Germany, thus exceeding the statutory requirement of 80 % for next-day letter deliveries by a wide margin. According to surveys conducted by the quality research institute Quotas, 94 % of the letters received during our daily opening hours and before final post box collections were delivered the next day.
dpdhl.com/en/investors
Employees, page 73
Deutsche Post DHL Group — 2014 Annual Report
111Corporate Governance — ManDaTeS — Mandates held by the Board of Management — Mandates held by the Supervisory Board — CorPoraTe GoVernanCe rePorT
Code of Conduct, diversity and compliance management
Our Code of Conduct remained unchanged in 2014. It has been a firm part of our cor-porate culture since 2006 and is applicable to all regions and divisions and the basis of guidelines within the Group. The Code of Conduct and these guidelines, together with regional guidelines and procedures, provide the framework for ethical and environ-mentally sound corporate conduct. The guidelines serve as a clear point of reference for all employees, informing them of our values and principles. The guidelines are based upon the principles set out in the Universal Declaration of Human Rights, the United Nations (UN) Global Compact, the ILO Declaration on Fundamental Principles and Rights at Work of 1998 and the OECD Guidelines for multinational enterprises. The Code is available in 21 languages. Employees can attend webinars to learn about the Code.
The Code of Conduct also sets out our commitment to the health of our employees, respect for human rights, the rejection of child and forced labour, and our position on diversity and inclusion. The Corporate Diversity & Inclusion Statement issued in 2013 reflects our belief that diversity represents both a key factor for success and a distinct competitive advantage. In the Statement we also undertake to promote an inclusive working environment and express our opposition to all forms of discrimination. The Diversity Council began work in February 2014, meeting on three occasions during the year under review. The participants discussed the strategic direction of diversity and exchanged views on the divisions’ various requirements of diversity management.
The Supervisory Board supports the Group’s diversity strategy, placing particular emphasis on the target for increasing the number of women on the Board of Manage-ment. The Supervisory Board sees efforts to increase diversity as part of long-term succession planning, for which the Supervisory Board and Board of Management are jointly responsible. In the opinion of the Supervisory Board, the targeted increase in the number of women in executive positions is necessary to ensure that, overall, more suitable female candidates are available for vacant positions on the Board of Manage-ment. As at 31 December 2014 the proportion of women in management around the world remained almost stable at 19.3 % (previous year: 19.6 %). The international compo-sition of the Board of Management already clearly reflects the company’s international activities.
In order to protect our employees from hazards and risks in the workplace, we have created a comprehensive regulatory framework that goes far beyond statutory occupa-tional safety requirements and minimum standards. In addition, preventive measures were defined in the course of occupational safety information events organised around Germany in the year under review. We seek to maintain and improve the health and wellbeing of our employees. All measures undertaken to promote health and safety at work are consistent with our Group-wide strategy for health, safety and wellbeing.
Within Deutsche Post DHL Group, the Chief Compliance Officer is responsible for the compliance management system and reports directly to the Chief Financial Officer. The Chief Compliance Officer is supported by the Global Compliance Office, which establishes Group-wide compliance management standards and supports the implementation of related activities within the divisions. Each of the four operating divisions has a Compliance Officer, who regularly presents a report to the Board of Management member for the respective division. These reports are incorporated into the Chief Compliance Officer’s report to the Board of Management and to the Finance and Audit Committee of the Supervisory Board.
Deutsche Post DHL Group — 2014 Annual Report
112
The main compliance management activities within Deutsche Post DHL Group include creating a system for identifying potential compliance risks, evaluating business partner compliance, and developing and organising compliance-related training and communications. Our compliance hotline is a key factor in reporting breaches of the law or our guidelines. The hotline is available in around 150 countries and assists employees in reporting potential breaches of the law or the Code of Conduct within the company. The hotline also provides a structure for addressing and resolving such breaches. The insights gained from reported cases are used to improve the compliance management system on an on-going basis. Group-wide communications on compliance ensure that all employees are aware of the relevance of compliance, and provide briefings on specific features of the Code of Conduct.
Working methods of the Board of Management and the Supervisory Board
As a German public limited company, Deutsche Post AG is required to use a dual manage-ment system. The Board of Management is responsible for managing the company. The Board of Management is appointed, overseen and advised by the Supervisory Board.
In addition to the board departments of the Chief Executive Officer (CEO), the Chief Financial Officer (CFO) and the Board Member for Human Resources, the Board of Management also includes four operating divisions: Post - eCommerce - Parcel, Express, Global Forwarding, Freight, and Supply Chain. Group management func-tions are centralised in the Corporate Center. The Group Strategy provides a framework for the whole Group. It follows the goal of remaining the postal service for Germany and becoming the logistics company for the world. The Board’s rules of procedure lay down objectives for the basic internal structure, management and co-operation within the Board of Management. Within this framework, each Board member manages their depart ment independently and informs the rest of the Board about key develop-ments at regular intervals. The Board of Management as a whole decides on matters of particular significance for the company or the Group, including all decisions that have to be presented to the Supervisory Board for approval, and on all tasks that cannot be delegated by law. The entire Board of Management also decides upon matters presented by one member of the Board of Management for decision by the Board of Management as a whole.
When making decisions, members of the Board of Management may not act in their own personal interest or exploit corporate business opportunities for their own benefit. The Supervisory Board must be informed of any conflicts of interest without delay.
The Supervisory Board advises and oversees the Board of Management and also appoints the members of the Board of Management. The Supervisory Board has estab-lished rules of procedure that include the basic internal structure, a catalogue of Board of Management transactions requiring Supervisory Board approval and rules for the Super-
visory Board committees. The Supervisory Board meets at least twice every six months in a calendar year. Extraordinary Supervisory Board meetings are held whenever particular developments or measures need to be discussed or approved promptly. In financial year 2014, the Supervisory Board met for eight plenary meetings, 20 committee meetings and one closed meeting, as described in the Report of the Supervisory Board. All members attended at least half of the meetings. The overall attendance rate remained high in the year under review, at over 95 %.
Members, page 16 f., Mandates, page 110
Objectives and strategies, page 30 f.
Members, page 109, Mandates, page 110
Page 109
Page 105 ff.
Deutsche Post DHL Group — 2014 Annual Report
113Corporate Governance — CorPoraTe GoVernanCe rePorT
The Board of Management and the Supervisory Board engage in regular dialogue regarding the Group’s financial position and performance, strategic initiatives, key busi-ness transactions, the progress of acquisitions, compliance and compliance management, risk exposure and risk management, and all material planning and related implemen-tation issues. The Board of Management informs the Supervisory Board promptly and in full about all issues of significance. The Chairman of the Supervisory Board and the CEO maintain close contact and discuss current issues. The Chairman of the Supervisory Board also has regular contact with other Board of Management members between Supervisory Board meetings.
The Supervisory Board carries out an annual efficiency review of the work of the Super visory Board, which includes assessing co-operation with the Board of Manage-ment. The efficiency review for financial year 2014 concluded that the Supervisory Board had performed its monitoring and advisory duties efficiently and effectively.
All Supervisory Board decisions, particularly those concerning transactions that require Supervisory Board approval, are discussed in detail in advance by the relevant committees. Each Supervisory Board plenary meeting includes a detailed report on the committees’ work and decisions taken.
None of the Supervisory Board members holds positions on the governing bodies of, or provides consultancy services to, the Group’s main competitors. The Supervisory Board has not been informed of any conflicts of interest affecting individual members during the year under review.
executive committees and Supervisory Board committees
Executive committees prepare the decisions to be made by the entire Board of Manage-ment and take decisions on matters delegated to them. The duties of the executive committees include preparing and/or approving investments and transactions in the various divisions. The Deutsche Post Executive Committee is responsible for the Post - eCommerce - Parcel division; the cross-divisional DHL Executive Committee is in charge of the Express, Global Forwarding, Freight, and Supply Chain divisions; the CC & GBS Executive Committee covers the Corporate Center (CC) and Global Business Services (GBS). The CEO, the CFO and the Board Member for Human Resources have permanent representation on the committees, whilst the Board members responsible for the divisions are represented on the committees in matters relating to their div-isions. First-tier executives from the level immediately below the Board of Management also attend executive committee meetings that cover topics relevant to their field. For example, Accounting & Controlling, Corporate Finance, Corporate Development and Legal Services will be invited to take part in discussions on acquisitions. The Deutsche Post Executive Committee and the DHL Executive Committee each meet at least once a month; the CC & GBS Executive Committee usually meets every quarter.
Business review meetings also take place once a quarter. These meetings are part of the strategic performance dialogue between the divisions, the CEO and the CFO. The business review meetings discuss strategic initiatives, operational matters and the budgetary situation of the divisions.
For details of the members of the Board of Management, see the sections on the Board of Management and Mandates held by the Board of Management.
The Supervisory Board has formed six committees to ensure the efficient discharge of its duties. In particular, these committees prepare the resolutions for the Supervisory Board plenary meetings. The Supervisory Board delegates the final decisions on certain topics to the individual committees.
Pages 16 f. and 110
Deutsche Post DHL Group — 2014 Annual Report
114
The Executive Committee’s duties include arranging the appointment of members of the Board of Management and determining the Board of Management remuneration for approval by the Supervisory Board plenary meeting. The members of the Executive Committee are Wulf von Schimmelmann (Chair), Andrea Kocsis (Deputy Chair), Rolf Bauermeister, Werner Gatzer, Roland Oetker and Stefanie Weckesser.
The Finance and Audit Committee oversees the accounting process, the effective-ness of the internal control system, the risk management and internal auditing systems, and the audit of the financial statements. It examines corporate compliance issues and discusses the half-yearly and quarterly financial reports with the Board of Management before publication. Based upon its own preliminary assessment, the Committee submits proposals for approval of the annual and consolidated financial statements by the Super-visory Board. The members of the Finance and Audit Committee are Stefan Schulte (Chair), Stephan Teuscher (Deputy Chair), Werner Gatzer, Thomas Koczelnik, Simone Menne and Helga Thiel. The Chair of the Finance and Audit Committee, Stefan Schulte, is a financial expert as defined in sections 100 (5) and 107 (4) of the AktG.
The Personnel Committee discusses human resources principles for the Group. The members of the Personnel Committee are Andrea Kocsis (Chair), Wulf von Schimmel-mann (Deputy Chair), Thomas Koczelnik and Roland Oetker.
The Mediation Committee carries out the duties assigned to it pursuant to the Mitbestimmungsgesetz (MitbestG – German Co-determination Act). The members of the Mediation Committee are Wulf von Schimmelmann (Chair), Andrea Kocsis ( Deputy Chair), Rolf Bauermeister and Roland Oetker.
The Nomination Committee presents the shareholder representatives of the Super-visory Board with recommendations for shareholder candidates for election to the Super visory Board at the AGM. The members of the Nomination Committee are Wulf von Schimmelmann (Chair), Werner Gatzer and Roland Oetker.
The Strategy Committee prepares material for strategy discussions in the Super visory Board and for resolutions on corporate acquisitions and disposals requiring approval by the plenary meeting of the Supervisory Board. The Committee also regularly discusses the competitive position of the company and the individual divisions. The members of the Strategy Committee are Wulf von Schimmelmann (Chair), Andrea Kocsis (Deputy Chair), Rolf Bauermeister, Henning Kagermann, Thomas Koczelnik and Ulrich Schröder.
Information about the work of the Supervisory Board and its committees in finan cial year 2014 is also contained in the Report of the Supervisory Board. Details of the members of the Supervisory Board and the composition of the Supervisory Board committees can be found in the sections on the Supervisory Board and Mandates held by the Supervisory Board.
Targets for the composition of the Supervisory Board
The Supervisory Board set specific targets for its composition in December 2010. In 2012, the Supervisory Board added a target for the number of independent Supervisory Board members. During the year under review, the Supervisory Board resolved to pur-sue the goal of 30 % of its members being women beyond 2015.1 The candidates proposed by the Supervisory Board to the AGM for election as Super-
visory Board members must be made purely in the interests of the company. Subject to this requirement, the Supervisory Board aims to ensure that the independent Supervisory Board members as defined in number 5.4.2 of the German Corporate Governance Code comprise at least 75 % of the Supervisory Board and that at least 30 % of the Supervisory Board members are women.
Page 105 ff.
Members, page 109, Mandates, page 110
Deutsche Post DHL Group — 2014 Annual Report
115Corporate Governance — CorPoraTe GoVernanCe rePorT
2 The company’s international activities are already adequately reflected in the com-position of the Supervisory Board. The Supervisory Board aims to maintain this and will therefore, in future proposals to the AGM, consider candidates whose origin, education or professional experience equip them with international knowledge and experience.
3 Conflicts of interest affecting Supervisory Board members are an obstacle to provid-ing independent and efficient advice to, and supervision of, the Board of Manage-ment. The Supervisory Board will decide how to deal with potential or actual con-flicts of interest on a case-by-case basis, in accordance with the law and giving due consideration to the German Corporate Governance Code.
4 In accordance with the age limit adopted by the Supervisory Board and laid down in the rules of procedure for the Supervisory Board, proposals for the election of Super visory Board members must ensure that the term of office ends no later than the close of the Annual General Meeting after the Supervisory Board member reaches the age of 72.
The current composition of the Supervisory Board meets all these targets. Simone Menne was elected as a member of the Supervisory Board by the 2014 AGM. She has worked for Lufthansa AG for many years, which has given her a great deal of busi-ness experience and an excellent understanding of the industry. Simone Menne will also be able to support the Supervisory Board as an additional financial expert. With regard to the employee representatives, Heinrich Josef Busch, the executive manage-ment representative, resigned from the Supervisory Board as of 30 November 2014, after many years of service. He was succeeded by Jörg von Dosky, who was appointed by the court as a Supervisory Board member on 9 December 2014. Having been a manager with the company for many years, Jörg von Dosky has a sound understanding of the management perspective. At present, 35 % of Supervisory Board members are female, which is above our target. The number of independent members of the Supervisory Board also currently exceeds the target. All members of the Supervisory Board are in-dependent members as defined by the German Corporate Governance Code. In view of the European Commission’s recommendation on independent non-executive directors, the wide-ranging protection against summary dismissal and the ban on discrimination contained in the Betriebsverfassungsgesetz (German Works Constitution Act) and Mit-bestimmungsgesetz (German Co-Determination Act), it must be assumed that being an employee is consistent with the requirement for independence as defined by the Code. The largest shareholder in the company, KfW Bankengruppe, currently holds approximately 21 % of shares in Deutsche Post AG. There are therefore no controlling shareholders as defined in the Code with whom relationships might exist that could call into question the Supervisory Board’s independence. The international nature of the company’s business is also appropriately reflected in the extensive international experience of many Supervisory Board members.
Deutsche Post DHL Group — 2014 Annual Report
116
Remuneration report
The remuneration report also forms part of the Group Management Report.
remuneration structure of the Group Board of Management in financial year 2014
The remuneration paid to individual Board of Management members for financial year 2014 was determined by the Supervisory Board, which held consultations to resolve on the total remuneration to be paid to the individual members of the Board of Manage-ment, including the main contractual elements. In so doing it obtained advice from an independent remuneration consultant.
The Board of Management remuneration reflects the size and global reach of the company, its economic and financial situation and the roles and achievements of the individual members. It is set to ensure competitiveness with comparable German and inter national companies, thus incentivising the Board of Management members to deliver maximum performance and achieve results.
The remuneration paid to the Board of Management for 2014 is in line with standard market practice, appropriate to the tasks involved and designed to reward performance; it comprises fixed (non-performance-related) elements and variable (performance- related) elements, which include short, medium and long-term incentives. The remu-neration as a whole as well as its variable components have been capped.
Non-performance-related components are the annual base salary (fixed annual remu neration), fringe benefits and pension commitments. The annual base salary is paid in twelve equal monthly instalments retroactively at the end of each month. Fringe benefits mainly comprise the use of company cars, supplements for insurance premiums and special allowances and benefits for assignments outside the home country.
The variable remuneration paid to the Board of Management is almost entirely medium and long-term based. More than half of the variable target remuneration con-sists of a long-term incentive plan (LTIP) with a four-year calculation period; the rest is made up of an annual bonus linked to the company’s yearly profits, with 50 % of the annual bonus flowing into a medium-term component with a three-year calculation period (deferral). Thus less than a quarter of the variable remuneration component is paid out on the basis of a one-year calculation. The amount of the annual bonus is set at the due discretion of the Supervisory Board on the basis of the company’s performance. The individual annual bonus amounts reflect the extent to which predefined targets are achieved, missed or exceeded. The maximum amount of the annual bonus may not exceed 100 % of the annual base salary.
In the reporting year, the same criteria were used to calculate the amount of the an-nual bonus as in the previous year. A key parameter for all Board of Management mem-bers is the Group’s EBIT after asset charge performance metric, including the asset charge on goodwill before goodwill impairment (EAC). For the Board of Management members in charge of the Post - eCommerce - Parcel, Express, Global Forwarding, Freight and Supply Chain divisions, the EAC of their respective division is also a key parameter. The Group’s reported free cash flow is one of the targets applicable to all members of the Board of Management. Furthermore, an employee-related target is agreed with all Board of Management members based upon the annual Employee Opinion Survey, as are additional targets.
Deutsche Post DHL Group — 2014 Annual Report
117Corporate Governance — CorPoraTe GoVernanCe rePorT — Remuneration report
Achievement of the upper targets for the financial year that have been agreed based upon demanding objectives is rewarded with the maximum annual bonus. If the tar-gets specified for the financial year are only partially reached or completely missed, the annual bonus will be paid on a pro-rata basis or not at all. The Supervisory Board may also elect to award an appropriate special bonus for extraordinary achievement.
The annual bonus is not paid in full in a single instalment on the basis of having reached the agreed targets. Instead, 50 % of the annual bonus flows into a medium-term component with a three-year calculation period (performance phase of one year, sus-tainability phase of two years). This medium-term component will be paid out after expiry of the sustainability phase subject to the condition that EAC, as an indicator of sustainability, is reached during the sustainability phase. Otherwise, payment of the medium-term component is forfeited without compensation. This demerit system puts greater emphasis on sustainable company development in determining management board remuneration and sets long-term incentives.
Stock appreciation rights (SAR s) are granted as a long-term remuneration com-ponent based upon the LTIP resolved by the Supervisory Board in 2006 (2006 LTIP).
Each SAR entitles the holder to receive a cash settlement equal to the difference between the average closing price of Deutsche Post shares for the five trading days preceding the exercise date and the exercise price of the SAR. In 2014, the members of the Board of Management each made a personal financial investment consisting of 10 % of their annual base salary. The waiting period for the stock appreciation rights is four years from the date on which they were granted. After expiration of the waiting period, and provided an absolute or relative performance target has been achieved, the SAR s can be exercised wholly or partially for a period of two years. Any SAR s not exercised during this two-year period will expire.
To determine how many, if any, of the SAR s granted can be exercised, the average share price or the average index value for the reference period is compared with that of the performance period. The reference period comprises the last 20 consecutive trading days prior to the issue date. The performance period is the last 60 trading days before the end of the waiting period. The average (closing) price is calculated as the average closing price of Deutsche Post shares in Deutsche Börse AG’s Xetra trading system.
A maximum of four out of every six SAR s can be earned via the absolute perfor-mance target, and a maximum of two via the relative performance target. If neither an absolute nor a relative performance target is met by the end of the waiting period, the SAR s attributable to the related tranche will expire without replacement or compensation.
One SAR is earned each time the closing price of Deutsche Post shares exceeds the issue price by at least 10, 15, 20 or 25 %. The relative performance target is tied to the performance of the shares in relation to the STOXX Europe 600 Index (SXXP, ISIN EU0009658202). It is met if the share price equals the index performance or if it outperforms the index by at least 10 %.
The proceeds from stock appreciation rights are limited to a maximum amount. The individual amount limits for the 2014 tranche can be seen in tables B.05 and B.06. The remuneration from stock appreciation rights may be limited by the Supervisory Board in the event of extraordinary circumstances.
Deutsche Post DHL Group — 2014 Annual Report
118
Provisions to cap severance payments pursuant to the Corporate Governance Code
recommendation, change-of-control provisions and post-contractual non-compete clauses
In accordance with the recommendation of the German Corporate Governance Code, Board of Management contracts contain a provision stipulating that in the event of pre-mature termination of a Board of Management member’s contract, the severance pay-ment may compensate no more than the remaining term of the contract. The severance payment is limited to a maximum amount of two years’ remuneration including fringe benefits (severance payment cap). The severance payment cap is calculated without any special remuneration or the value of rights allocated from LTIP s.
In the event of a change in control, any member of the Board of Management is entitled to resign their office for good cause within a period of six months following the change in control, after giving three months’ notice by the end of a given month, and to terminate their Board of Management contract (right to early termination).
The contractual provisions stipulate that a change of control exists if a shareholder has acquired control within the meaning of section 29 (2) of the Wertpapiererwerbs- und Übernahmegesetz (WpÜG – German Securities Acquisition and Takeover Act) via possession of at least 30 % of the voting rights, including the voting rights attribut able to such shareholder by virtue of acting in concert with other shareholders as set forth in section 30 of the WpÜG or if a control agreement has been concluded with the company as a dependent entity in accordance with section 291 of the AktG and such agreement has taken effect or if the company has merged with another legal entity outside of the Group pursuant to section 2 of the Umwandlungsgesetz (UmwG – German Reorganisa-tion and Transformation Act), unless the value of such other legal entity, as determined by the agreed conversion rate, is less than 50 % of the value of the company.
In the event that the right to early termination is exercised or a Board of Manage-ment contract is terminated by mutual consent within nine months of the change of control, the Board of Management member is entitled to payment to compensate the remaining term of their Board of Management contract. Such payment is limited to 150 % of the severance payment cap pursuant to the recommendation of the German Corporate Governance Code. The amount of the payment is reduced by 25 % if the Board of Manage ment member has not reached the age of 60 upon leaving the company. If the remaining term of the Board of Management contract is less than two years and the Board of Management member has not reached the age of 62 upon leaving the company, the payment will correspond to the severance payment cap. The same applies if a Board of Management contract expires prior to the Board of Management member’s reaching the age of 62 because less than nine months remained on the term of the contract at the time of the change of control and the contract was not renewed.
Board of Management members are also subject to a non-compete clause, taking effect on the cessation of their contracts. During the one-year non-compete period, former Board of Management members receive 100 % of their last contractually stipulated annual base salary on a pro-rata basis as compensation each month. Any other income earned during the non-compete period is subtracted from the compensation paid. The amount of the compensation payment itself is deducted from any severance payments or pension payments. Prior to, or concurrent with, cessation of the Board of Management contract, the company may declare its waiver of adherence to the non-compete clause. In such a case, the company will be released from the obligation to pay compensation due to a restraint on competition six months after receipt of such declaration.
Apart from the aforementioned arrangements, no member of the Board of Manage-ment has been promised any further benefits after leaving the company.
Deutsche Post DHL Group — 2014 Annual Report
119Corporate Governance — CorPoraTe GoVernanCe rePorT — Remuneration report
other provisions
Bruce Edwards went into retirement at the end of 30 September 2014. In the period between leaving his seat on the Board of Management on 10 March 2014 and going into retirement he was active in a consultative capacity for the company. Mr Edwards received total remuneration of €1,080,346 for that period.
Angela Titzrath left her position as member of the company’s Board of Management on 2 July 2014 and left the company at the expiry of 31 July 2014. She received a payment in the amount of €1,392,589 to settle the claims arising from her employment agreement.
amount of remuneration paid to members of the Group Board of Management
in financial year 2014
The remuneration paid to members of the Board of Management in financial year 2014 totalled €13.61 million (previous year: €13.21 million) in accordance with the applicable international accounting standards. This amount comprised €7.62 million in non- performance- related components (previous year: €7.84 million) and €5.99 mil-lion in the performance-related component paid out (previous year: €5.37 million). An additional €3.22 million of the performance-related component was transferred to the medium-term component and will be paid out in 2017 subject to the condition that the required EAC, as an indicator of sustainability, be reached.
The members of the Board of Management were granted a total of 1,591,332 SAR s in financial year 2014 for a total value of €7.30 million (previous year: €7.30 million) at the time of issue (1 September 2014). The total remuneration of the Board of Management members is presented individually in the tables below. In addition to the applicable accounting principles, the new recommendations of the German Corporate Governance Code were also taken into account.
In accordance with the recommendations, the “target remuneration” tables (B.05 and B.06, or “benefits granted” in the language of the German Corporate Governance Code) do not show any actual payments of performance-based remuneration. By con-trast with the statement of the payment amount, the target amount for the one-year variable remuneration and the portion of the one-year variable remuneration to be deferred (deferral) that was granted for financial year 2014 or for the previous year is stated (i. e., the amount when achieving 100 % of the target). In addition, the long-term remuneration (LTIP with a four-year waiting period) granted in the reporting year or in the previous year is reported at the fair value at the time granted. With respect to pension commitments, the pension expense, i. e., the service cost in accordance with IAS 19, is presented. The presentation is supplemented by the minimum and maximum values that can be achieved.
Deutsche Post DHL Group — 2014 Annual Report
120
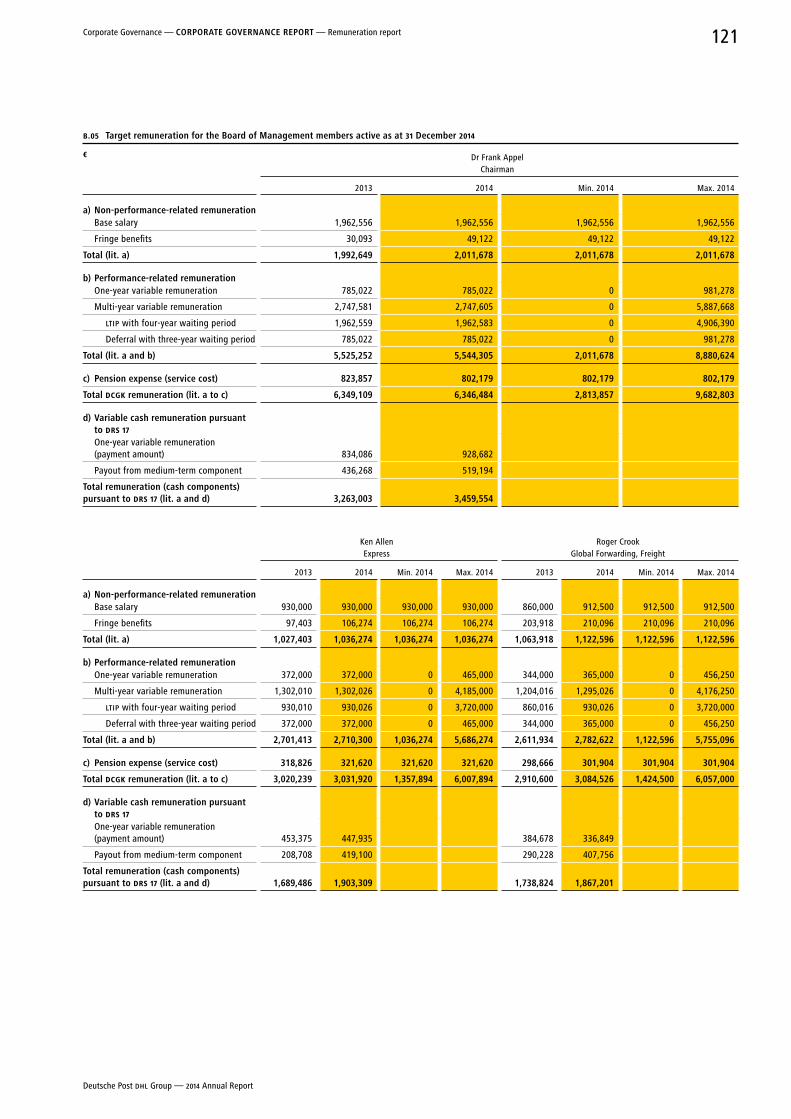
B.05 Target remuneration for the Board of Management members active as at 31 December 2014
€ Dr Frank Appel Chairman
2013 2014 Min. 2014 Max. 2014
a) non-performance-related remunerationBase salary 1,962,556 1,962,556 1,962,556 1,962,556
Fringe benefits 30,093 49,122 49,122 49,122
Total (lit. a) 1,992,649 2,011,678 2,011,678 2,011,678
b) Performance-related remunerationOne-year variable remuneration 785,022 785,022 0 981,278
Multi-year variable remuneration 2,747,581 2,747,605 0 5,887,668
LTIP with four-year waiting period 1,962,559 1,962,583 0 4,906,390
Deferral with three-year waiting period 785,022 785,022 0 981,278
Total (lit. a and b) 5,525,252 5,544,305 2,011,678 8,880,624
c) Pension expense (service cost) 823,857 802,179 802,179 802,179
Total DCGK remuneration (lit. a to c) 6,349,109 6,346,484 2,813,857 9,682,803
d) Variable cash remuneration pursuant to DRS 17One-year variable remuneration (payment amount) 834,086 928,682
Payout from medium-term component 436,268 519,194
Total remuneration (cash components) pursuant to DRS 17 (lit. a and d) 3,263,003 3,459,554
Ken Allen Express
Roger Crook Global Forwarding, Freight
2013 2014 Min. 2014 Max. 2014 2013 2014 Min. 2014 Max. 2014
a) non-performance-related remunerationBase salary 930,000 930,000 930,000 930,000 860,000 912,500 912,500 912,500
Fringe benefits 97,403 106,274 106,274 106,274 203,918 210,096 210,096 210,096
Total (lit. a) 1,027,403 1,036,274 1,036,274 1,036,274 1,063,918 1,122,596 1,122,596 1,122,596
b) Performance-related remunerationOne-year variable remuneration 372,000 372,000 0 465,000 344,000 365,000 0 456,250
Multi-year variable remuneration 1,302,010 1,302,026 0 4,185,000 1,204,016 1,295,026 0 4,176,250
LTIP with four-year waiting period 930,010 930,026 0 3,720,000 860,016 930,026 0 3,720,000
Deferral with three-year waiting period 372,000 372,000 0 465,000 344,000 365,000 0 456,250
Total (lit. a and b) 2,701,413 2,710,300 1,036,274 5,686,274 2,611,934 2,782,622 1,122,596 5,755,096
c) Pension expense (service cost) 318,826 321,620 321,620 321,620 298,666 301,904 301,904 301,904
Total DCGK remuneration (lit. a to c) 3,020,239 3,031,920 1,357,894 6,007,894 2,910,600 3,084,526 1,424,500 6,057,000
d) Variable cash remuneration pursuant to DRS 17One-year variable remuneration (payment amount) 453,375 447,935 384,678 336,849
Payout from medium-term component 208,708 419,100 290,228 407,756
Total remuneration (cash components) pursuant to DRS 17 (lit. a and d) 1,689,486 1,903,309 1,738,824 1,867,201
Deutsche Post DHL Group — 2014 Annual Report
121Corporate Governance — CorPoraTe GoVernanCe rePorT — Remuneration report
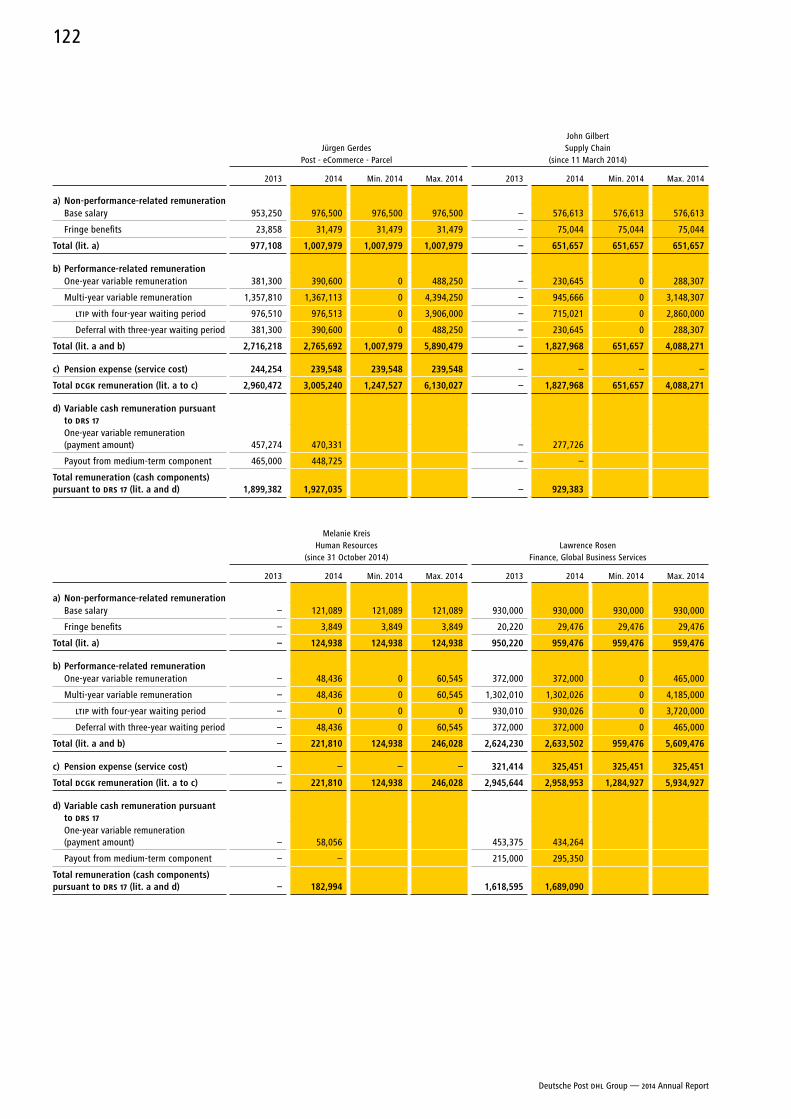
Jürgen Gerdes Post - eCommerce - Parcel
John Gilbert Supply Chain
(since 11 March 2014)
2013 2014 Min. 2014 Max. 2014 2013 2014 Min. 2014 Max. 2014
a) non-performance-related remunerationBase salary 953,250 976,500 976,500 976,500 – 576,613 576,613 576,613
Fringe benefits 23,858 31,479 31,479 31,479 – 75,044 75,044 75,044
Total (lit. a) 977,108 1,007,979 1,007,979 1,007,979 – 651,657 651,657 651,657
b) Performance-related remunerationOne-year variable remuneration 381,300 390,600 0 488,250 – 230,645 0 288,307
Multi-year variable remuneration 1,357,810 1,367,113 0 4,394,250 – 945,666 0 3,148,307
LTIP with four-year waiting period 976,510 976,513 0 3,906,000 – 715,021 0 2,860,000
Deferral with three-year waiting period 381,300 390,600 0 488,250 – 230,645 0 288,307
Total (lit. a and b) 2,716,218 2,765,692 1,007,979 5,890,479 – 1,827,968 651,657 4,088,271
c) Pension expense (service cost) 244,254 239,548 239,548 239,548 – – – –
Total DCGK remuneration (lit. a to c) 2,960,472 3,005,240 1,247,527 6,130,027 – 1,827,968 651,657 4,088,271
d) Variable cash remuneration pursuant to DRS 17One-year variable remuneration (payment amount) 457,274 470,331 – 277,726
Payout from medium-term component 465,000 448,725 – –
Total remuneration (cash components) pursuant to DRS 17 (lit. a and d) 1,899,382 1,927,035 – 929,383
Melanie Kreis Human Resources
(since 31 October 2014)Lawrence Rosen
Finance, Global Business Services
2013 2014 Min. 2014 Max. 2014 2013 2014 Min. 2014 Max. 2014
a) non-performance-related remunerationBase salary – 121,089 121,089 121,089 930,000 930,000 930,000 930,000
Fringe benefits – 3,849 3,849 3,849 20,220 29,476 29,476 29,476
Total (lit. a) – 124,938 124,938 124,938 950,220 959,476 959,476 959,476
b) Performance-related remunerationOne-year variable remuneration – 48,436 0 60,545 372,000 372,000 0 465,000
Multi-year variable remuneration – 48,436 0 60,545 1,302,010 1,302,026 0 4,185,000
LTIP with four-year waiting period – 0 0 0 930,010 930,026 0 3,720,000
Deferral with three-year waiting period – 48,436 0 60,545 372,000 372,000 0 465,000
Total (lit. a and b) – 221,810 124,938 246,028 2,624,230 2,633,502 959,476 5,609,476
c) Pension expense (service cost) – – – – 321,414 325,451 325,451 325,451
Total DCGK remuneration (lit. a to c) – 221,810 124,938 246,028 2,945,644 2,958,953 1,284,927 5,934,927
d) Variable cash remuneration pursuant to DRS 17One-year variable remuneration (payment amount) – 58,056 453,375 434,264
Payout from medium-term component – – 215,000 295,350
Total remuneration (cash components) pursuant to DRS 17 (lit. a and d) – 182,994 1,618,595 1,689,090
Deutsche Post DHL Group — 2014 Annual Report
122
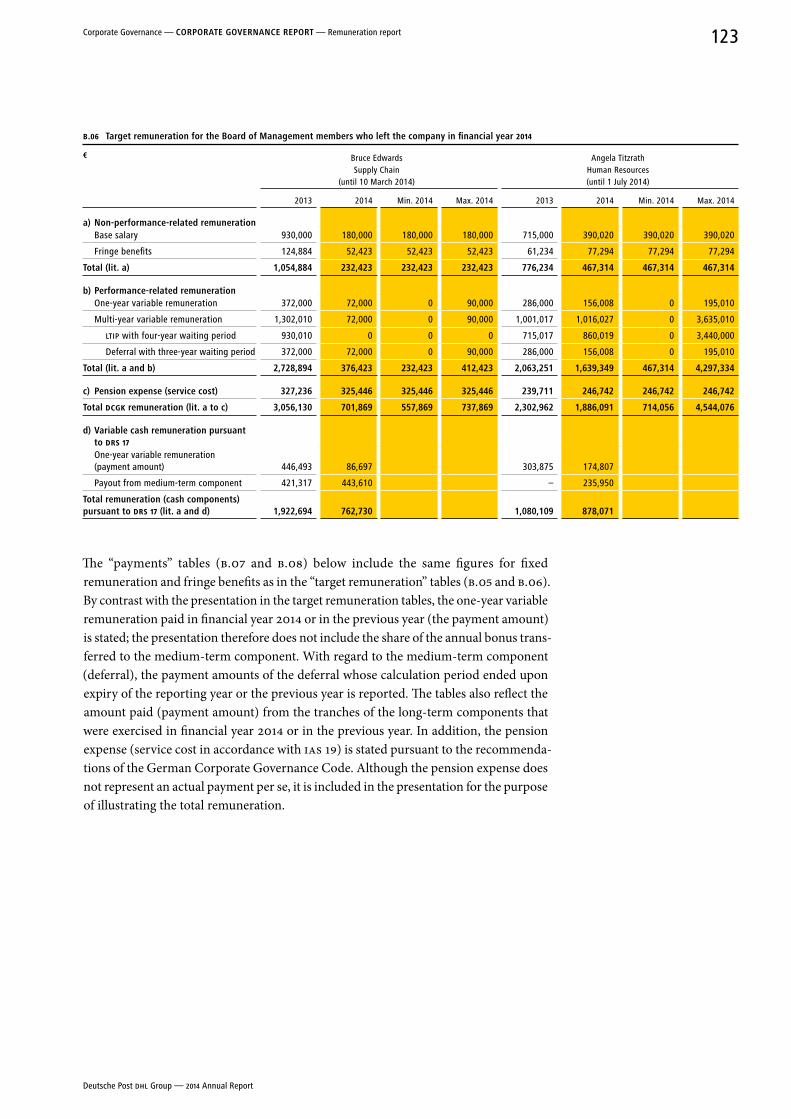
The “payments” tables (B.07 and B.08) below include the same figures for fixed remuneration and fringe benefits as in the “target remuneration” tables (B.05 and B.06). By contrast with the presentation in the target remuneration tables, the one-year variable remuneration paid in financial year 2014 or in the previous year (the payment amount) is stated; the presentation therefore does not include the share of the annual bonus trans-ferred to the medium-term component. With regard to the medium-term component (deferral), the payment amounts of the deferral whose calculation period ended upon expiry of the reporting year or the previous year is reported. The tables also reflect the amount paid (payment amount) from the tranches of the long-term components that were exercised in financial year 2014 or in the previous year. In addition, the pension expense ( service cost in accordance with IAS 19) is stated pursuant to the recommenda-tions of the German Corporate Governance Code. Although the pension expense does not represent an actual payment per se, it is included in the presentation for the purpose of illustrating the total remuneration.
B.06 Target remuneration for the Board of Management members who left the company in financial year 2014
€ Bruce Edwards Supply Chain
(until 10 March 2014)
Angela Titzrath Human Resources (until 1 July 2014)
2013 2014 Min. 2014 Max. 2014 2013 2014 Min. 2014 Max. 2014
a) non-performance-related remunerationBase salary 930,000 180,000 180,000 180,000 715,000 390,020 390,020 390,020
Fringe benefits 124,884 52,423 52,423 52,423 61,234 77,294 77,294 77,294
Total (lit. a) 1,054,884 232,423 232,423 232,423 776,234 467,314 467,314 467,314
b) Performance-related remunerationOne-year variable remuneration 372,000 72,000 0 90,000 286,000 156,008 0 195,010
Multi-year variable remuneration 1,302,010 72,000 0 90,000 1,001,017 1,016,027 0 3,635,010
LTIP with four-year waiting period 930,010 0 0 0 715,017 860,019 0 3,440,000
Deferral with three-year waiting period 372,000 72,000 0 90,000 286,000 156,008 0 195,010
Total (lit. a and b) 2,728,894 376,423 232,423 412,423 2,063,251 1,639,349 467,314 4,297,334
c) Pension expense (service cost) 327,236 325,446 325,446 325,446 239,711 246,742 246,742 246,742
Total DCGK remuneration (lit. a to c) 3,056,130 701,869 557,869 737,869 2,302,962 1,886,091 714,056 4,544,076
d) Variable cash remuneration pursuant to DRS 17One-year variable remuneration (payment amount) 446,493 86,697 303,875 174,807
Payout from medium-term component 421,317 443,610 – 235,950
Total remuneration (cash components) pursuant to DRS 17 (lit. a and d) 1,922,694 762,730 1,080,109 878,071
Deutsche Post DHL Group — 2014 Annual Report
123Corporate Governance — CorPoraTe GoVernanCe rePorT — Remuneration report
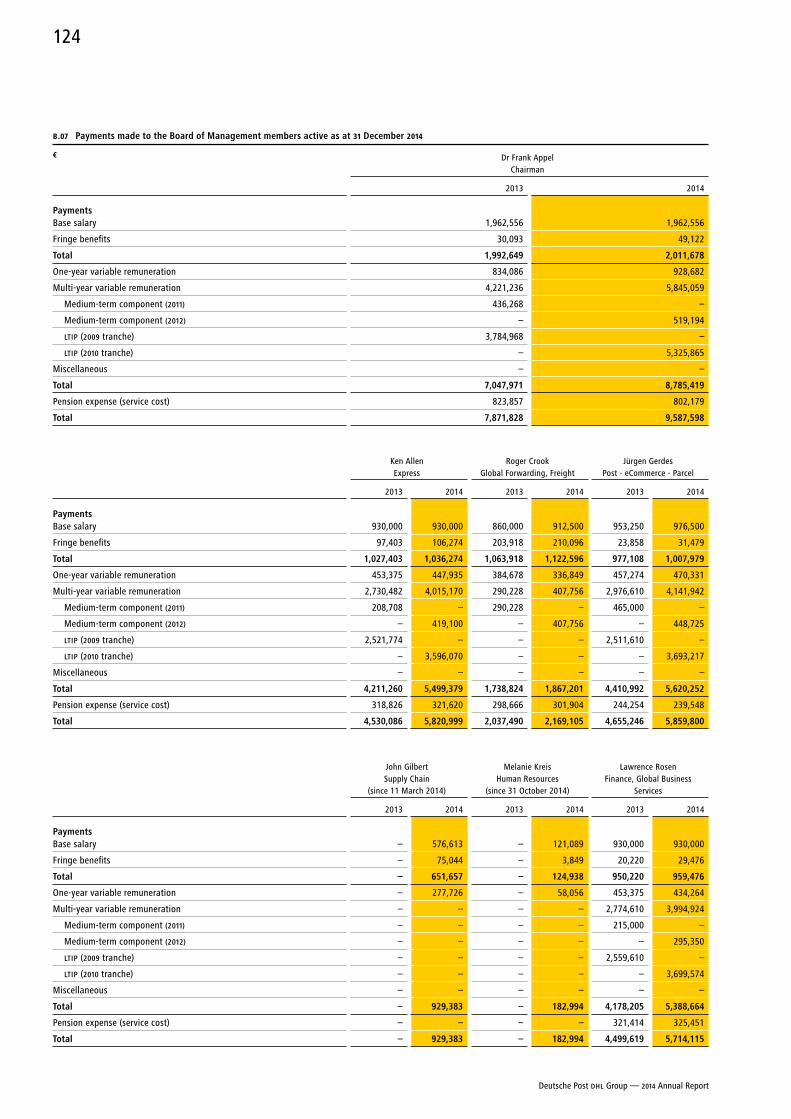
B.07 Payments made to the Board of Management members active as at 31 December 2014
€ Dr Frank Appel Chairman
2013 2014
PaymentsBase salary 1,962,556 1,962,556
Fringe benefits 30,093 49,122
Total 1,992,649 2,011,678
One-year variable remuneration 834,086 928,682
Multi-year variable remuneration 4,221,236 5,845,059
Medium-term component (2011) 436,268 –
Medium-term component (2012) – 519,194
LTIP (2009 tranche) 3,784,968 –
LTIP (2010 tranche) – 5,325,865
Miscellaneous – –
Total 7,047,971 8,785,419
Pension expense (service cost) 823,857 802,179
Total 7,871,828 9,587,598
Ken Allen Express
Roger Crook Global Forwarding, Freight
Jürgen Gerdes Post - eCommerce - Parcel
2013 2014 2013 2014 2013 2014
PaymentsBase salary 930,000 930,000 860,000 912,500 953,250 976,500
Fringe benefits 97,403 106,274 203,918 210,096 23,858 31,479
Total 1,027,403 1,036,274 1,063,918 1,122,596 977,108 1,007,979
One-year variable remuneration 453,375 447,935 384,678 336,849 457,274 470,331
Multi-year variable remuneration 2,730,482 4,015,170 290,228 407,756 2,976,610 4,141,942
Medium-term component (2011) 208,708 – 290,228 – 465,000 –
Medium-term component (2012) – 419,100 – 407,756 – 448,725
LTIP (2009 tranche) 2,521,774 – – – 2,511,610 –
LTIP (2010 tranche) – 3,596,070 – – – 3,693,217
Miscellaneous – – – – – –
Total 4,211,260 5,499,379 1,738,824 1,867,201 4,410,992 5,620,252
Pension expense (service cost) 318,826 321,620 298,666 301,904 244,254 239,548
Total 4,530,086 5,820,999 2,037,490 2,169,105 4,655,246 5,859,800
John Gilbert Supply Chain
(since 11 March 2014)
Melanie Kreis Human Resources
(since 31 October 2014)
Lawrence Rosen Finance, Global Business
Services
2013 2014 2013 2014 2013 2014
PaymentsBase salary – 576,613 – 121,089 930,000 930,000
Fringe benefits – 75,044 – 3,849 20,220 29,476
Total – 651,657 – 124,938 950,220 959,476
One-year variable remuneration – 277,726 – 58,056 453,375 434,264
Multi-year variable remuneration – – – – 2,774,610 3,994,924
Medium-term component (2011) – – – – 215,000 –
Medium-term component (2012) – – – – – 295,350
LTIP (2009 tranche) – – – – 2,559,610 –
LTIP (2010 tranche) – – – – – 3,699,574
Miscellaneous – – – – – –
Total – 929,383 – 182,994 4,178,205 5,388,664
Pension expense (service cost) – – – – 321,414 325,451
Total – 929,383 – 182,994 4,499,619 5,714,115
Deutsche Post DHL Group — 2014 Annual Report
124
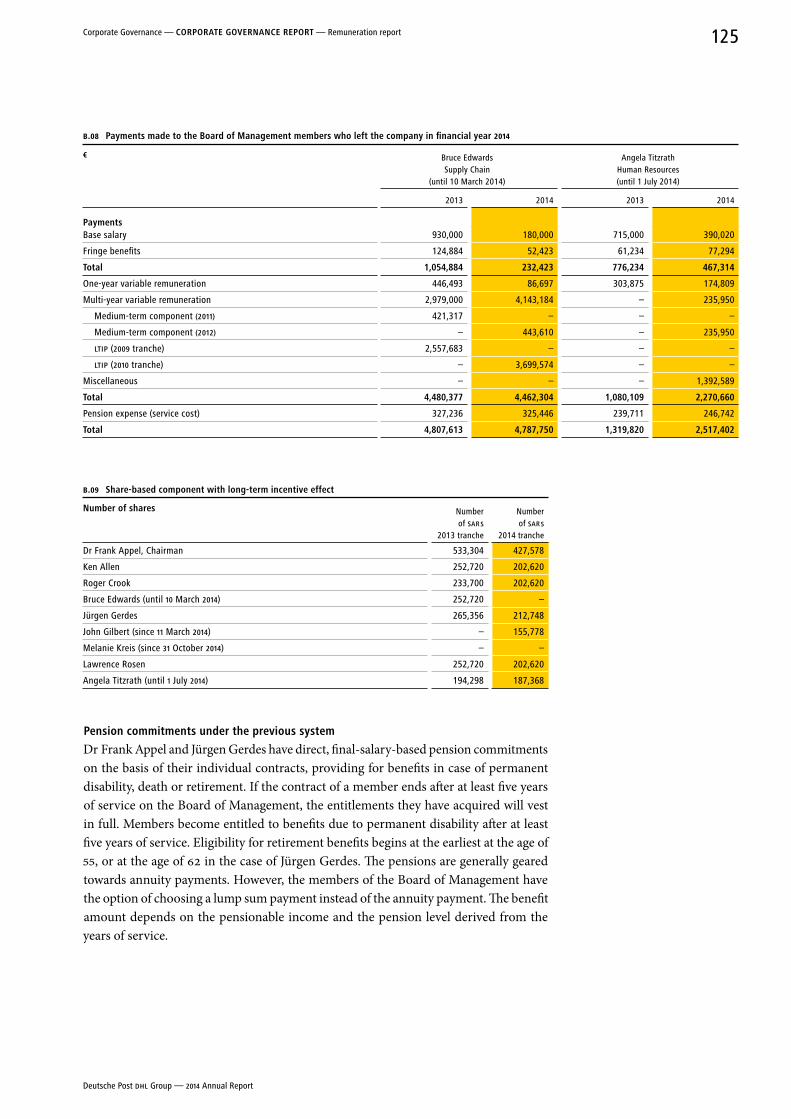
B.09 Share-based component with long-term incentive effect
number of shares Number of SAR s
2013 tranche
Number of SAR s
2014 tranche
Dr Frank Appel, Chairman 533,304 427,578
Ken Allen 252,720 202,620
Roger Crook 233,700 202,620
Bruce Edwards (until 10 March 2014) 252,720 –
Jürgen Gerdes 265,356 212,748
John Gilbert (since 11 March 2014) – 155,778
Melanie Kreis (since 31 October 2014) – –
Lawrence Rosen 252,720 202,620
Angela Titzrath (until 1 July 2014) 194,298 187,368
Pension commitments under the previous system
Dr Frank Appel and Jürgen Gerdes have direct, final-salary-based pension commitments on the basis of their individual contracts, providing for benefits in case of permanent disability, death or retirement. If the contract of a member ends after at least five years of service on the Board of Management, the entitlements they have acquired will vest in full. Members become entitled to benefits due to permanent disability after at least five years of service. Eligibility for retirement benefits begins at the earliest at the age of 55, or at the age of 62 in the case of Jürgen Gerdes. The pensions are generally geared towards annuity payments. However, the members of the Board of Management have the option of choosing a lump sum payment instead of the annuity payment. The benefit amount depends on the pensionable income and the pension level derived from the years of service.
B.08 Payments made to the Board of Management members who left the company in financial year 2014
€ Bruce Edwards Supply Chain
(until 10 March 2014)
Angela Titzrath Human Resources (until 1 July 2014)
2013 2014 2013 2014
PaymentsBase salary 930,000 180,000 715,000 390,020
Fringe benefits 124,884 52,423 61,234 77,294
Total 1,054,884 232,423 776,234 467,314
One-year variable remuneration 446,493 86,697 303,875 174,809
Multi-year variable remuneration 2,979,000 4,143,184 – 235,950
Medium-term component (2011) 421,317 – – –
Medium-term component (2012) – 443,610 – 235,950
LTIP (2009 tranche) 2,557,683 – – –
LTIP (2010 tranche) – 3,699,574 – –
Miscellaneous – – – 1,392,589
Total 4,480,377 4,462,304 1,080,109 2,270,660
Pension expense (service cost) 327,236 325,446 239,711 246,742
Total 4,807,613 4,787,750 1,319,820 2,517,402
Deutsche Post DHL Group — 2014 Annual Report
125Corporate Governance — CorPoraTe GoVernanCe rePorT — Remuneration report
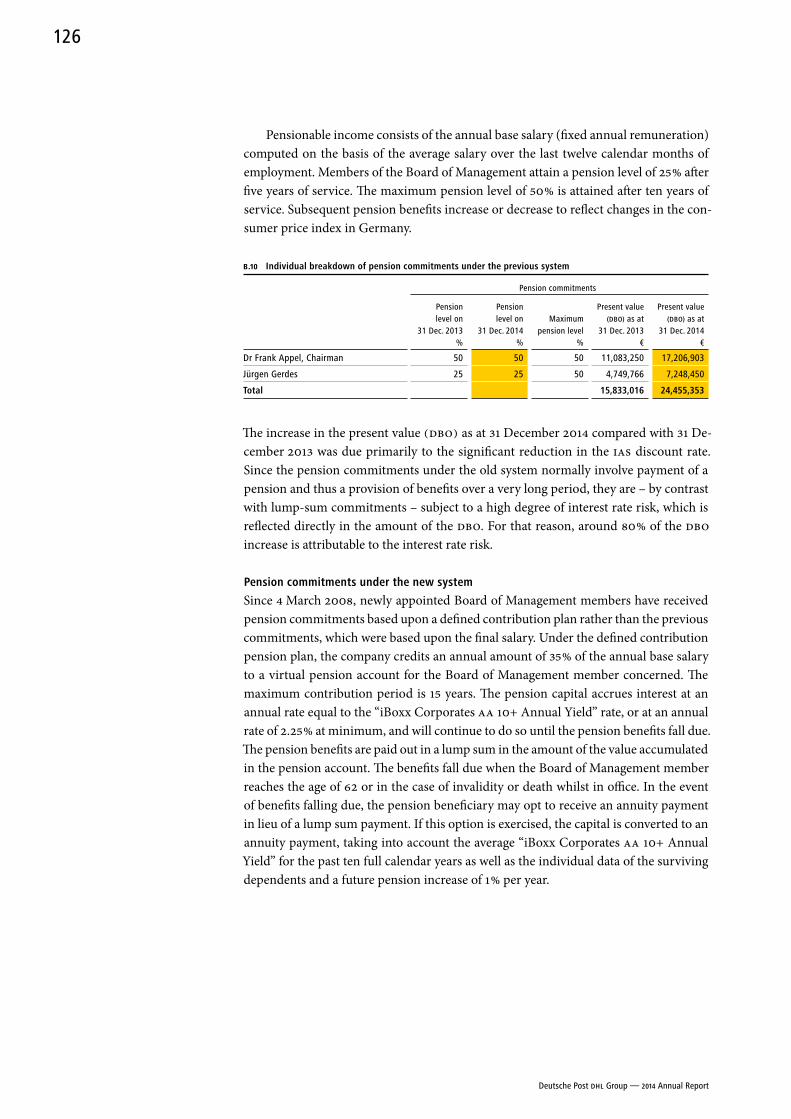
Pensionable income consists of the annual base salary (fixed annual remuneration) computed on the basis of the average salary over the last twelve calendar months of employment. Members of the Board of Management attain a pension level of 25 % after five years of service. The maximum pension level of 50 % is attained after ten years of service. Subsequent pension benefits increase or decrease to reflect changes in the con-sumer price index in Germany.
B.10 Individual breakdown of pension commitments under the previous system
Pension commitments
Pension level on
31 Dec. 2013 %
Pension level on
31 Dec. 2014 %
Maximum pension level
%
Present value (DBO) as at
31 Dec. 2013 €
Present value (DBO) as at
31 Dec. 2014 €
Dr Frank Appel, Chairman 50 50 50 11,083,250 17,206,903
Jürgen Gerdes 25 25 50 4,749,766 7,248,450
Total 15,833,016 24,455,353
The increase in the present value (DBO) as at 31 December 2014 compared with 31 De-cember 2013 was due primarily to the significant reduction in the IAS discount rate. Since the pension commitments under the old system normally involve payment of a pension and thus a provision of benefits over a very long period, they are – by contrast with lump-sum commitments – subject to a high degree of interest rate risk, which is reflected directly in the amount of the DBO. For that reason, around 80 % of the DBO increase is attributable to the interest rate risk.
Pension commitments under the new system
Since 4 March 2008, newly appointed Board of Management members have received pension commitments based upon a defined contribution plan rather than the previous commitments, which were based upon the final salary. Under the defined contribution pension plan, the company credits an annual amount of 35 % of the annual base salary to a virtual pension account for the Board of Management member concerned. The maximum contribution period is 15 years. The pension capital accrues interest at an annual rate equal to the “iBoxx Corporates AA 10+ Annual Yield” rate, or at an annual rate of 2.25 % at minimum, and will continue to do so until the pension benefits fall due. The pension benefits are paid out in a lump sum in the amount of the value accumulated in the pension account. The benefits fall due when the Board of Management member reaches the age of 62 or in the case of invalidity or death whilst in office. In the event of benefits falling due, the pension beneficiary may opt to receive an annuity payment in lieu of a lump sum payment. If this option is exercised, the capital is converted to an annuity payment, taking into account the average “iBoxx Corporates AA 10+ Annual Yield” for the past ten full calendar years as well as the individual data of the surviving dependents and a future pension increase of 1 % per year.
Deutsche Post DHL Group — 2014 Annual Report
126
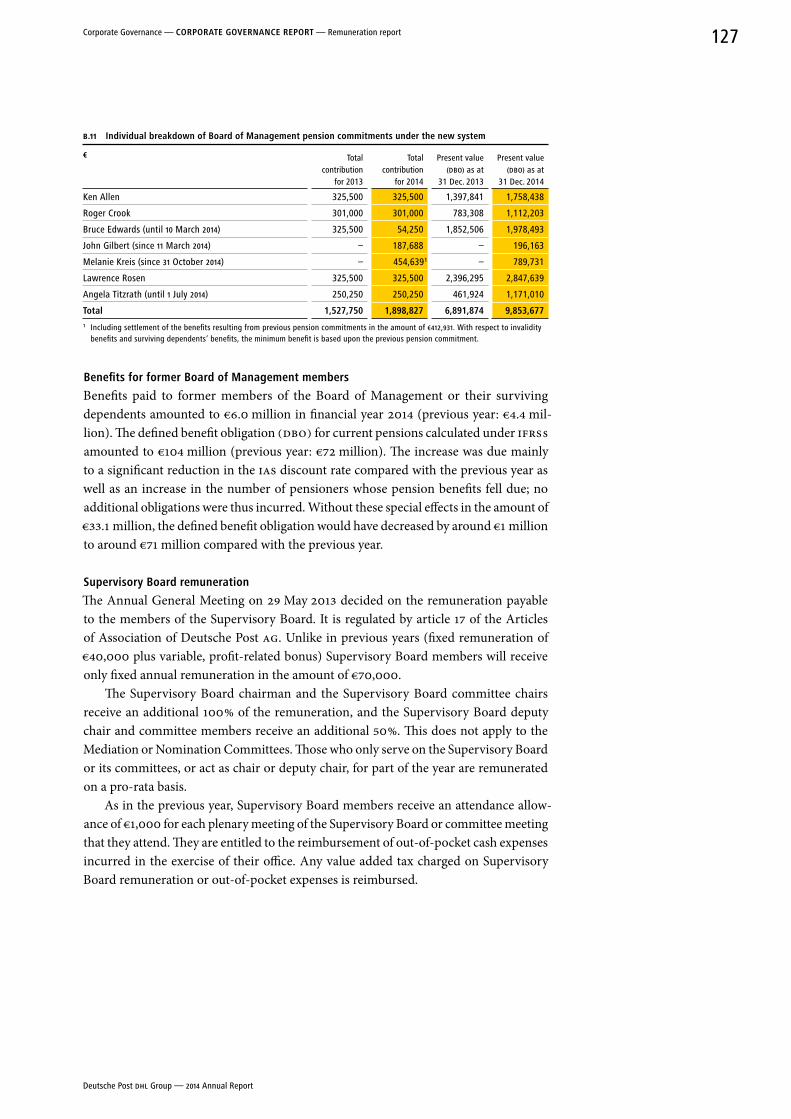
B.11 Individual breakdown of Board of Management pension commitments under the new system
€ Total contribution
for 2013
Total contribution
for 2014
Present value (DBO) as at
31 Dec. 2013
Present value (DBO) as at
31 Dec. 2014
Ken Allen 325,500 325,500 1,397,841 1,758,438
Roger Crook 301,000 301,000 783,308 1,112,203
Bruce Edwards (until 10 March 2014) 325,500 54,250 1,852,506 1,978,493
John Gilbert (since 11 March 2014) – 187,688 – 196,163
Melanie Kreis (since 31 October 2014) – 454,639 1 – 789,731
Lawrence Rosen 325,500 325,500 2,396,295 2,847,639
Angela Titzrath (until 1 July 2014) 250,250 250,250 461,924 1,171,010
Total 1,527,750 1,898,827 6,891,874 9,853,6771 Including settlement of the benefits resulting from previous pension commitments in the amount of €412,931. With respect to invalidity
benefits and surviving dependents’ benefits, the minimum benefit is based upon the previous pension commitment.
Benefits for former Board of Management members
Benefits paid to former members of the Board of Management or their surviving dependents amounted to €6.0 million in financial year 2014 (previous year: €4.4 mil-lion). The defined benefit obligation (DBO) for current pensions calculated under IFRS s amounted to €104 million (previous year: €72 million). The increase was due mainly to a significant reduction in the IAS discount rate compared with the previous year as well as an increase in the number of pensioners whose pension benefits fell due; no additional obligations were thus incurred. Without these special effects in the amount of €33.1 million, the defined benefit obligation would have decreased by around €1 million to around €71 million compared with the previous year.
Supervisory Board remuneration
The Annual General Meeting on 29 May 2013 decided on the remuneration payable to the members of the Supervisory Board. It is regulated by article 17 of the Articles of Association of Deutsche Post AG. Unlike in previous years (fixed remuneration of €40,000 plus variable, profit-related bonus) Supervisory Board members will receive only fixed annual remuneration in the amount of €70,000.
The Supervisory Board chairman and the Supervisory Board committee chairs receive an additional 100 % of the remuneration, and the Supervisory Board deputy chair and committee members receive an additional 50 %. This does not apply to the Mediation or Nomination Committees. Those who only serve on the Supervisory Board or its committees, or act as chair or deputy chair, for part of the year are remunerated on a pro-rata basis.
As in the previous year, Supervisory Board members receive an attendance allow-ance of €1,000 for each plenary meeting of the Supervisory Board or committee meeting that they attend. They are entitled to the reimbursement of out-of-pocket cash expenses incurred in the exercise of their office. Any value added tax charged on Supervisory Board remuneration or out-of-pocket expenses is reimbursed.
Deutsche Post DHL Group — 2014 Annual Report
127Corporate Governance — CorPoraTe GoVernanCe rePorT — Remuneration report
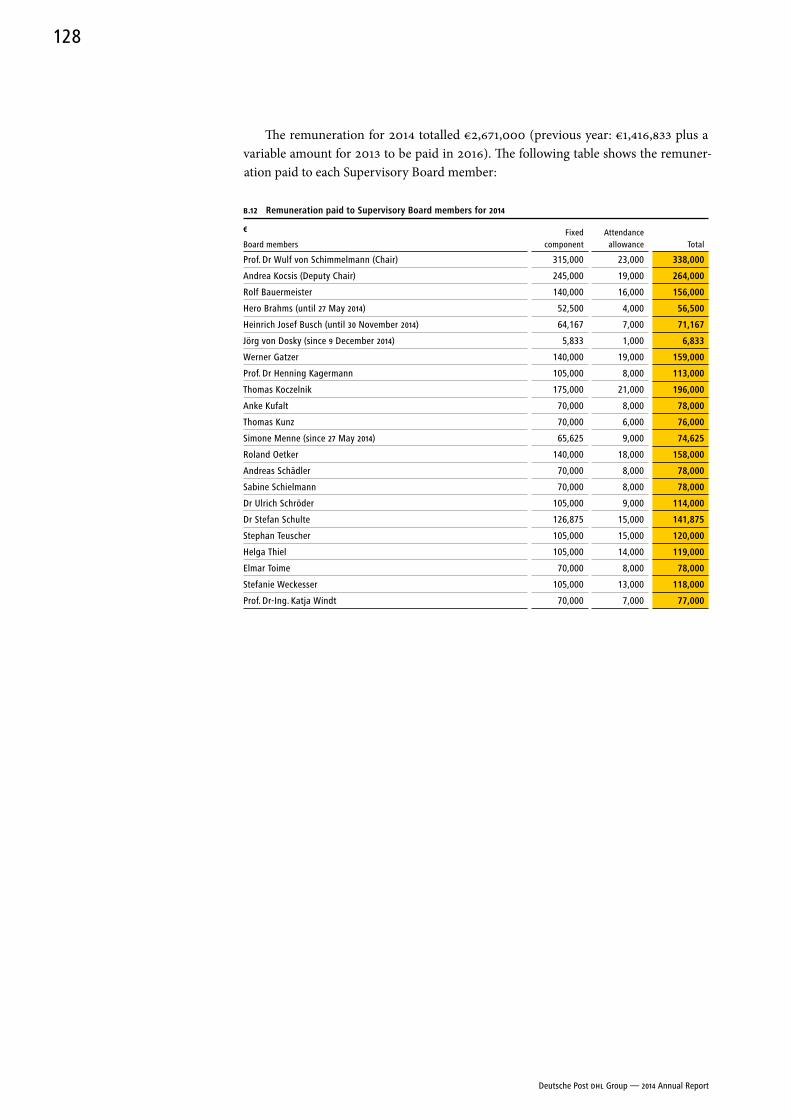
The remuneration for 2014 totalled €2,671,000 (previous year: €1,416,833 plus a vari able amount for 2013 to be paid in 2016). The following table shows the remuner-ation paid to each Supervisory Board member:
B.12 remuneration paid to Supervisory Board members for 2014
€ Fixed component
Attendance allowance TotalBoard members
Prof. Dr Wulf von Schimmelmann (Chair) 315,000 23,000 338,000
Andrea Kocsis (Deputy Chair) 245,000 19,000 264,000
Rolf Bauermeister 140,000 16,000 156,000
Hero Brahms (until 27 May 2014) 52,500 4,000 56,500
Heinrich Josef Busch (until 30 November 2014) 64,167 7,000 71,167
Jörg von Dosky (since 9 December 2014) 5,833 1,000 6,833
Werner Gatzer 140,000 19,000 159,000
Prof. Dr Henning Kagermann 105,000 8,000 113,000
Thomas Koczelnik 175,000 21,000 196,000
Anke Kufalt 70,000 8,000 78,000
Thomas Kunz 70,000 6,000 76,000
Simone Menne (since 27 May 2014) 65,625 9,000 74,625
Roland Oetker 140,000 18,000 158,000
Andreas Schädler 70,000 8,000 78,000
Sabine Schielmann 70,000 8,000 78,000
Dr Ulrich Schröder 105,000 9,000 114,000
Dr Stefan Schulte 126,875 15,000 141,875
Stephan Teuscher 105,000 15,000 120,000
Helga Thiel 105,000 14,000 119,000
Elmar Toime 70,000 8,000 78,000
Stefanie Weckesser 105,000 13,000 118,000
Prof. Dr-Ing. Katja Windt 70,000 7,000 77,000
Deutsche Post DHL Group — 2014 Annual Report
128
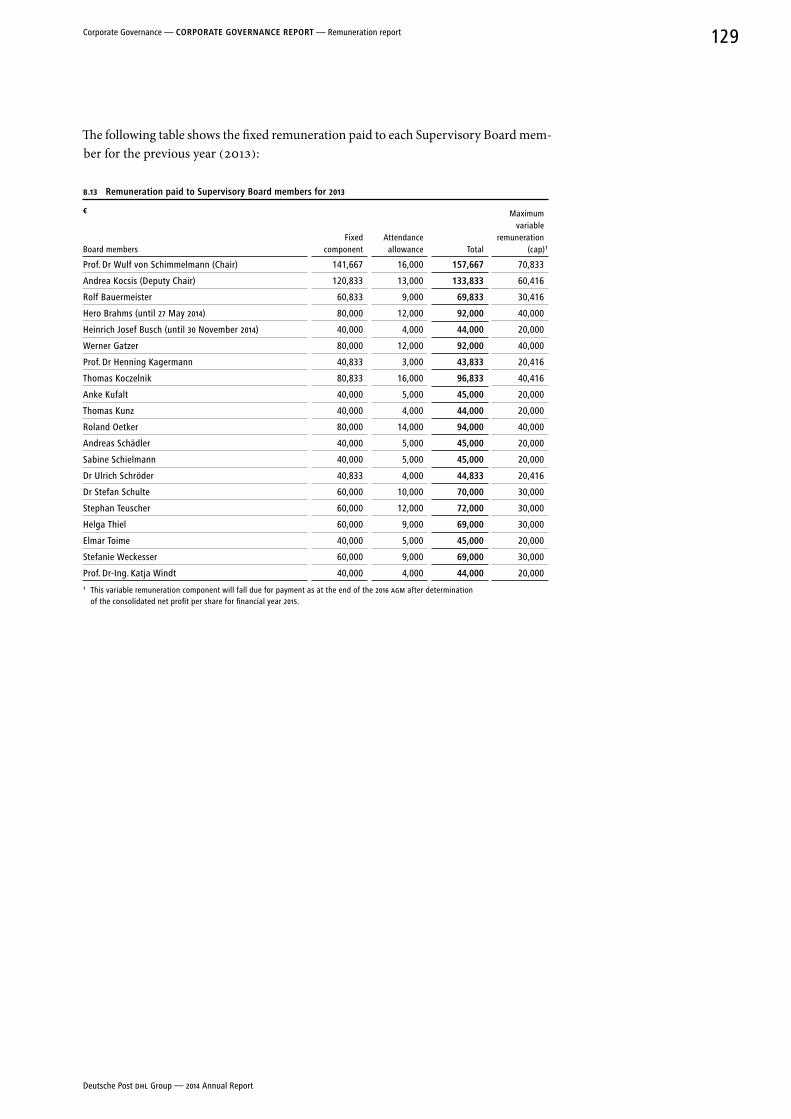
The following table shows the fixed remuneration paid to each Supervisory Board mem-ber for the previous year (2013):
B.13 remuneration paid to Supervisory Board members for 2013
€
Fixed component
Attendance allowance Total
Maximum variable
remuneration (cap) 1Board members
Prof. Dr Wulf von Schimmelmann (Chair) 141,667 16,000 157,667 70,833
Andrea Kocsis (Deputy Chair) 120,833 13,000 133,833 60,416
Rolf Bauermeister 60,833 9,000 69,833 30,416
Hero Brahms (until 27 May 2014) 80,000 12,000 92,000 40,000
Heinrich Josef Busch (until 30 November 2014) 40,000 4,000 44,000 20,000
Werner Gatzer 80,000 12,000 92,000 40,000
Prof. Dr Henning Kagermann 40,833 3,000 43,833 20,416
Thomas Koczelnik 80,833 16,000 96,833 40,416
Anke Kufalt 40,000 5,000 45,000 20,000
Thomas Kunz 40,000 4,000 44,000 20,000
Roland Oetker 80,000 14,000 94,000 40,000
Andreas Schädler 40,000 5,000 45,000 20,000
Sabine Schielmann 40,000 5,000 45,000 20,000
Dr Ulrich Schröder 40,833 4,000 44,833 20,416
Dr Stefan Schulte 60,000 10,000 70,000 30,000
Stephan Teuscher 60,000 12,000 72,000 30,000
Helga Thiel 60,000 9,000 69,000 30,000
Elmar Toime 40,000 5,000 45,000 20,000
Stefanie Weckesser 60,000 9,000 69,000 30,000
Prof. Dr-Ing. Katja Windt 40,000 4,000 44,000 20,0001 This variable remuneration component will fall due for payment as at the end of the 2016 AGM after determination
of the consolidated net profit per share for financial year 2015.
Deutsche Post DHL Group — 2014 Annual Report
129Corporate Governance — CorPoraTe GoVernanCe rePorT — Remuneration report
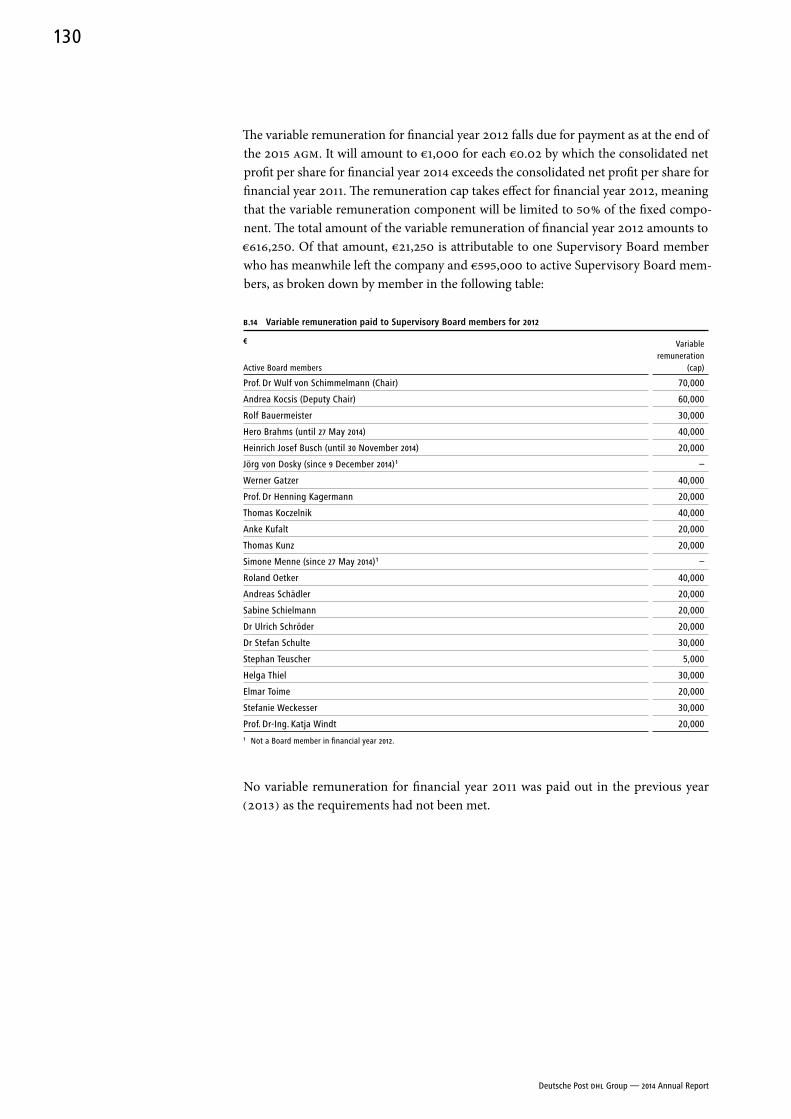
The variable remuneration for financial year 2012 falls due for payment as at the end of the 2015 AGM. It will amount to €1,000 for each €0.02 by which the consolidated net profit per share for financial year 2014 exceeds the consolidated net profit per share for financial year 2011. The remuneration cap takes effect for financial year 2012, meaning that the variable remuneration component will be limited to 50 % of the fixed compo-nent. The total amount of the variable remuneration of financial year 2012 amounts to €616,250. Of that amount, €21,250 is attributable to one Supervisory Board member who has meanwhile left the company and €595,000 to active Supervisory Board mem-bers, as broken down by member in the following table:
B.14 Variable remuneration paid to Supervisory Board members for 2012
€ Variable remuneration
(cap)Active Board members
Prof. Dr Wulf von Schimmelmann (Chair) 70,000
Andrea Kocsis (Deputy Chair) 60,000
Rolf Bauermeister 30,000
Hero Brahms (until 27 May 2014) 40,000
Heinrich Josef Busch (until 30 November 2014) 20,000
Jörg von Dosky (since 9 December 2014) 1 –
Werner Gatzer 40,000
Prof. Dr Henning Kagermann 20,000
Thomas Koczelnik 40,000
Anke Kufalt 20,000
Thomas Kunz 20,000
Simone Menne (since 27 May 2014) 1 –
Roland Oetker 40,000
Andreas Schädler 20,000
Sabine Schielmann 20,000
Dr Ulrich Schröder 20,000
Dr Stefan Schulte 30,000
Stephan Teuscher 5,000
Helga Thiel 30,000
Elmar Toime 20,000
Stefanie Weckesser 30,000
Prof. Dr-Ing. Katja Windt 20,0001 Not a Board member in financial year 2012.
No variable remuneration for financial year 2011 was paid out in the previous year (2013) as the requirements had not been met.
Deutsche Post DHL Group — 2014 Annual Report
130
C CON
SOLID
ATED
FINA
NCIA
L STATEM
ENTS
131 — 214
CONSOLIDATED FINANCIAL STATEMENTS
C
133 INCOME STATEMENT
134 STATEMENT OF COMPREHENSIVE INCOME
135 BALANCE SHEET
136 CASH FLOW STATEMENT
137 STATEMENT OF CHANGES IN EQUITY
138 NOTES TO THE CONSOLIDATED FINANCIAL STATEMENTS OF DEUTSCHE POST AG
138 BASIS OF PREPARATION
138 1 – Basis of accounting 138 2 – Consolidated group 142 3 – Significant transactions 142 4 – Adjustment of prior-period amounts 144 5 – New developments in international accounting under IFRS s 146 6 – Currency translation 147 7 – Accounting policies 154 8 – Exercise of judgement in applying the accounting policies 155 9 – Consolidation methods
156 SEGMENT REPORTING
156 10 – Segment reporting
159 INCOME STATEMENT DISCLOSURES
159 11 – Revenue 159 12 – Other operating income 159 13 – Materials expense 160 14 – Staff costs / employees 160 15 – Depreciation, amortisation and impairment losses 161 16 – Other operating expenses 161 17 – Net income from investments accounted for
using the equity method 161 18 – Net finance costs 161 19 – Income taxes 163 20 – Consolidated net profit for the period 163 21 – Non-controlling interests 163 22 – Earnings per share 163 23 – Dividend per share
CCONSOLIDATED FINANCIAL STATEMENTS
164 BALANCE SHEET DISCLOSURES
164 24 – Intangible assets 166 25 – Property, plant and equipment 167 26 – Investment property 168 27 – Investments accounted for using the equity method 169 28 – Non-current financial assets 169 29 – Other non-current assets 169 30 – Deferred taxes 170 31 – Inventories 170 32 – Current financial assets 170 33 – Trade receivables 170 34 – Other current assets 170 35 – Income tax assets and liabilities 171 36 – Cash and cash equivalents 171 37 – Assets held for sale and liabilities associated
with assets held for sale 172 38 – Issued capital and purchase of treasury shares 174 39 – Capital reserves 174 40 – Other reserves 176 41 – Retained earnings 176 42 – Equity attributable to Deutsche Post AG shareholders 176 43 – Non-controlling interests 178 44 – Provisions for pensions and similar obligations 186 45 – Other provisions 187 46 – Financial liabilities 189 47 – Other liabilities 190 48 – Trade payables
190 CASH FLOW DISCLOSURES
190 49 – Cash flow disclosures
192 OTHER DISCLOSURES
192 50 – Risks and financial instruments of the Group 205 51 – Contingent liabilities 205 52 – Other financial obligations 205 53 – Litigation 206 54 – Share-based payment 209 55 – Related party disclosures 212 56 – Auditor’s fees 212 57 – Exemptions under the HGB and local foreign legislation 213 58 – Declaration of Conformity with the German Corporate
Governance Code 213 59 – Significant events after the reporting date
213 RESPONSIBILITY STATEMENT
214 INDEPENDENT AUDITOR’S REPORT
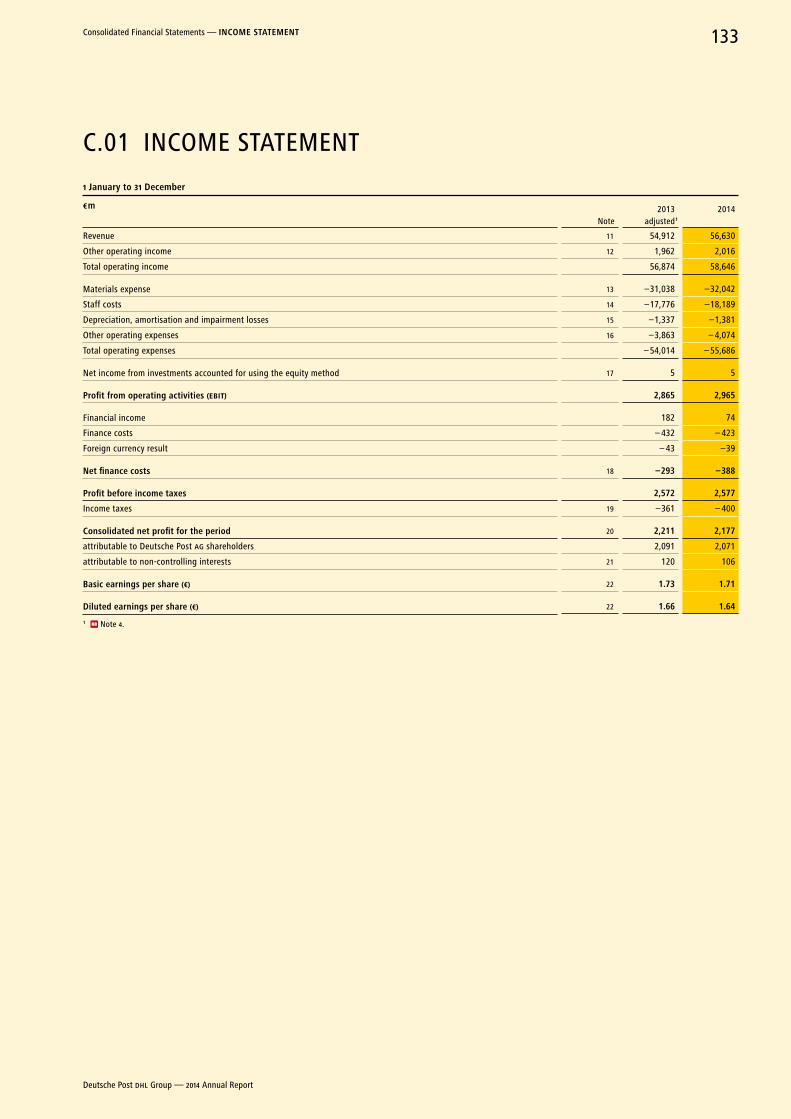
1 January to 31 December
€ m
Note2013
adjusted 1
2014
Revenue 11 54,912 56,630
Other operating income 12 1,962 2,016
Total operating income 56,874 58,646
Materials expense 13 –31,038 –32,042
Staff costs 14 –17,776 –18,189
Depreciation, amortisation and impairment losses 15 –1,337 –1,381
Other operating expenses 16 –3,863 – 4,074
Total operating expenses – 54,014 – 55,686
Net income from investments accounted for using the equity method 17 5 5
Profit from operating activities (EBIT) 2,865 2,965
Financial income 182 74
Finance costs – 432 – 423
Foreign currency result – 43 –39
net finance costs 18 –293 –388
Profit before income taxes 2,572 2,577
Income taxes 19 –361 – 400
Consolidated net profit for the period 20 2,211 2,177
attributable to Deutsche Post AG shareholders 2,091 2,071
attributable to non-controlling interests 21 120 106
Basic earnings per share (€) 22 1.73 1.71
Diluted earnings per share (€) 22 1.66 1.64
1 Note 4.
C.01 INCOME STATEMENT
Deutsche Post DHL Group — 2014 Annual Report
133Consolidated Financial Statements — InCoMe STaTeMenT
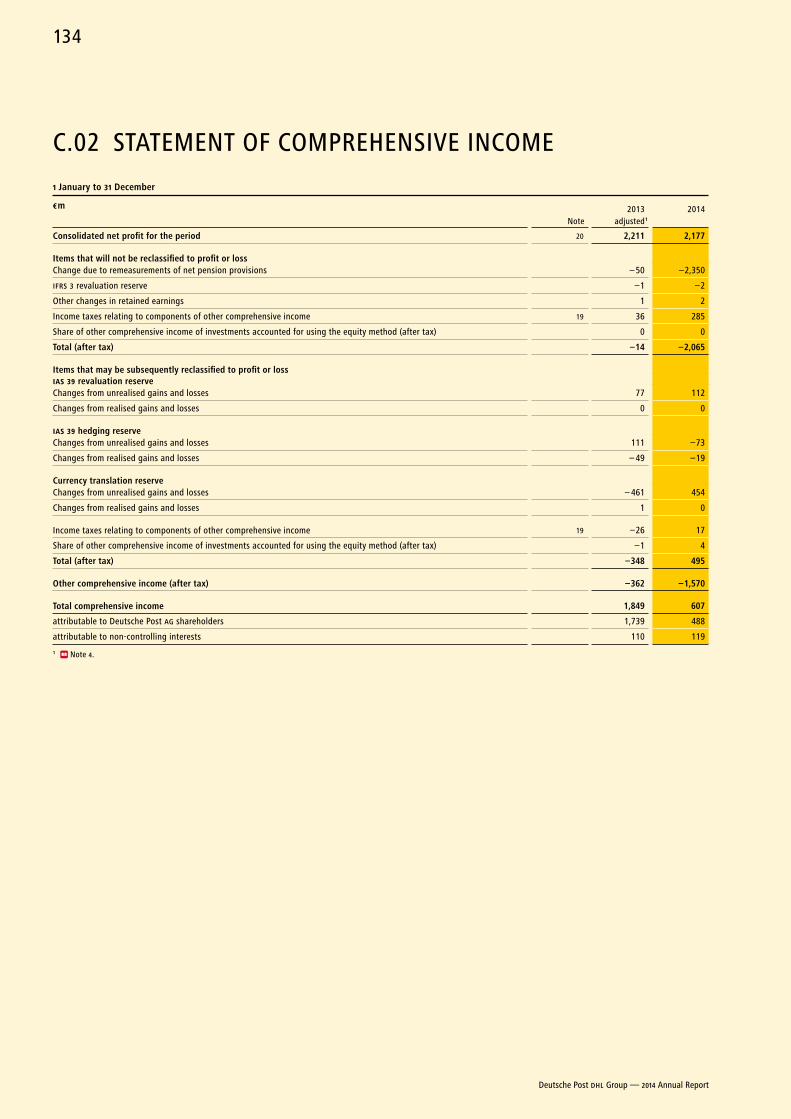
C.02 STATEMENT OF COMPREHENSIVE INCOME
1 January to 31 December
€ m
Note2013
adjusted 1
2014
Consolidated net profit for the period 20 2,211 2,177
Items that will not be reclassified to profit or lossChange due to remeasurements of net pension provisions – 50 –2,350
IFRS 3 revaluation reserve –1 –2
Other changes in retained earnings 1 2
Income taxes relating to components of other comprehensive income 19 36 285
Share of other comprehensive income of investments accounted for using the equity method (after tax) 0 0
Total (after tax) –14 –2,065
Items that may be subsequently reclassified to profit or lossIAS 39 revaluation reserveChanges from unrealised gains and losses 77 112
Changes from realised gains and losses 0 0
IAS 39 hedging reserveChanges from unrealised gains and losses 111 –73
Changes from realised gains and losses – 49 –19
Currency translation reserveChanges from unrealised gains and losses – 461 454
Changes from realised gains and losses 1 0
Income taxes relating to components of other comprehensive income 19 –26 17
Share of other comprehensive income of investments accounted for using the equity method (after tax) –1 4
Total (after tax) –348 495
other comprehensive income (after tax) –362 –1,570
Total comprehensive income 1,849 607
attributable to Deutsche Post AG shareholders 1,739 488
attributable to non-controlling interests 110 119
1 Note 4.
Deutsche Post DHL Group — 2014 Annual Report
134
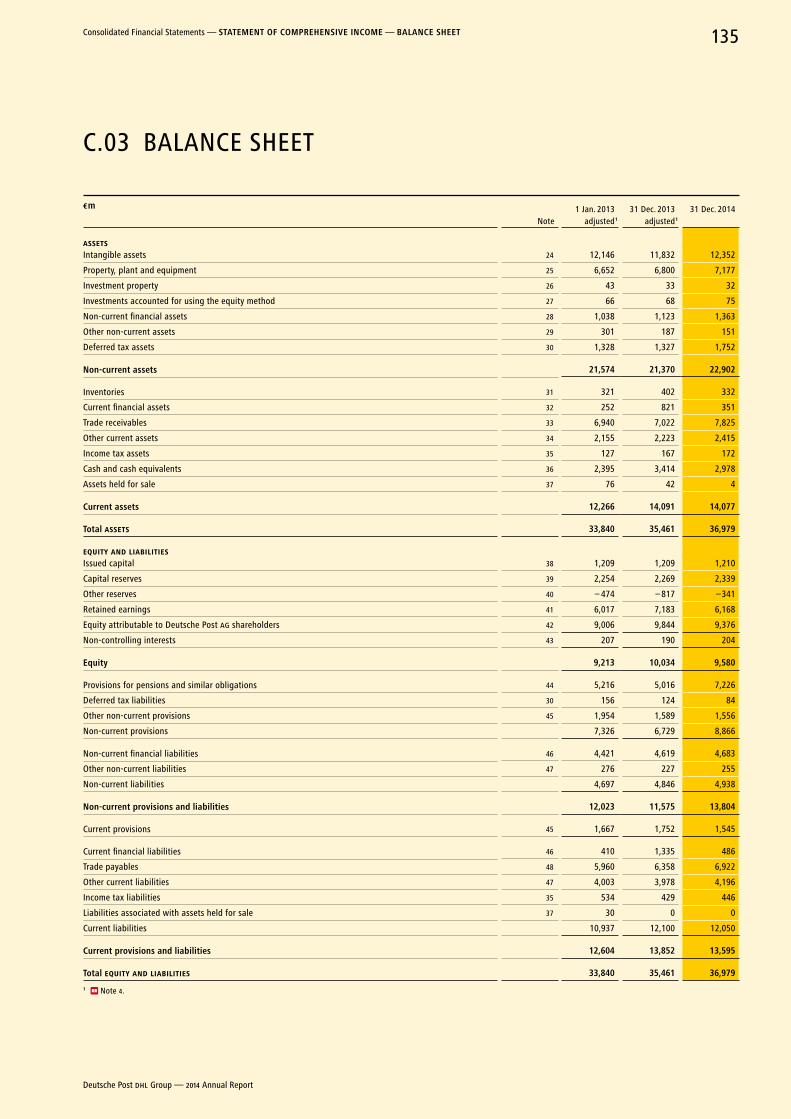
C.03 BALANCE SHEET
€ m
Note1 Jan. 2013
adjusted 1
31 Dec. 2013 adjusted 1
31 Dec. 2014
ASSETSIntangible assets 24 12,146 11,832 12,352
Property, plant and equipment 25 6,652 6,800 7,177
Investment property 26 43 33 32
Investments accounted for using the equity method 27 66 68 75
Non-current financial assets 28 1,038 1,123 1,363
Other non-current assets 29 301 187 151
Deferred tax assets 30 1,328 1,327 1,752
non-current assets 21,574 21,370 22,902
Inventories 31 321 402 332
Current financial assets 32 252 821 351
Trade receivables 33 6,940 7,022 7,825
Other current assets 34 2,155 2,223 2,415
Income tax assets 35 127 167 172
Cash and cash equivalents 36 2,395 3,414 2,978
Assets held for sale 37 76 42 4
Current assets 12,266 14,091 14,077
Total ASSETS 33,840 35,461 36,979
EQUITY AND LIABILITIESIssued capital 38 1,209 1,209 1,210
Capital reserves 39 2,254 2,269 2,339
Other reserves 40 – 474 – 817 –341
Retained earnings 41 6,017 7,183 6,168
Equity attributable to Deutsche Post AG shareholders 42 9,006 9,844 9,376
Non-controlling interests 43 207 190 204
equity 9,213 10,034 9,580
Provisions for pensions and similar obligations 44 5,216 5,016 7,226
Deferred tax liabilities 30 156 124 84
Other non-current provisions 45 1,954 1,589 1,556
Non-current provisions 7,326 6,729 8,866
Non-current financial liabilities 46 4,421 4,619 4,683
Other non-current liabilities 47 276 227 255
Non-current liabilities 4,697 4,846 4,938
non-current provisions and liabilities 12,023 11,575 13,804
Current provisions 45 1,667 1,752 1,545
Current financial liabilities 46 410 1,335 486
Trade payables 48 5,960 6,358 6,922
Other current liabilities 47 4,003 3,978 4,196
Income tax liabilities 35 534 429 446
Liabilities associated with assets held for sale 37 30 0 0
Current liabilities 10,937 12,100 12,050
Current provisions and liabilities 12,604 13,852 13,595
Total EQUITY AND LIABILITIES 33,840 35,461 36,979
1 Note 4.
Deutsche Post DHL Group — 2014 Annual Report
135Consolidated Financial Statements — STaTeMenT oF CoMPreHenSIVe InCoMe — BaLanCe SHeeT
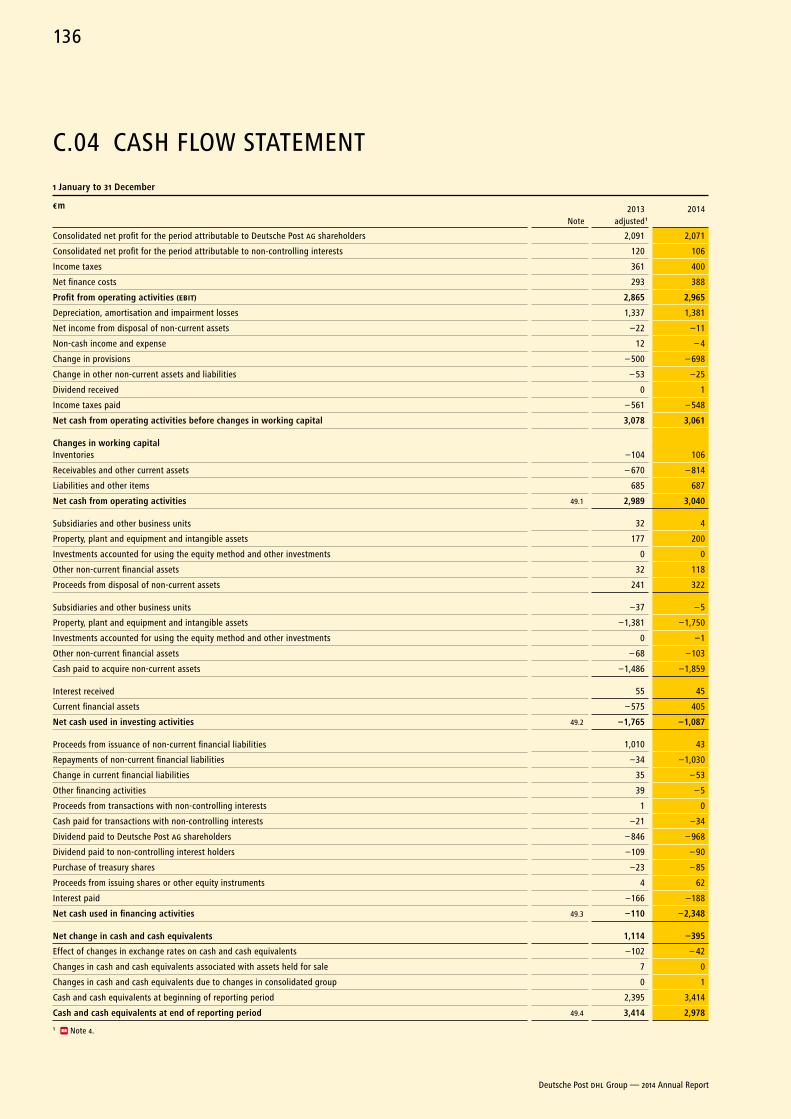
C.04 CASH FLOW STATEMENT
1 January to 31 December
€ m
Note2013
adjusted 1
2014
Consolidated net profit for the period attributable to Deutsche Post AG shareholders 2,091 2,071
Consolidated net profit for the period attributable to non-controlling interests 120 106
Income taxes 361 400
Net finance costs 293 388
Profit from operating activities (EBIT) 2,865 2,965
Depreciation, amortisation and impairment losses 1,337 1,381
Net income from disposal of non-current assets –22 –11
Non-cash income and expense 12 – 4
Change in provisions – 500 – 698
Change in other non-current assets and liabilities – 53 –25
Dividend received 0 1
Income taxes paid – 561 – 548
net cash from operating activities before changes in working capital 3,078 3,061
Changes in working capitalInventories –104 106
Receivables and other current assets – 670 – 814
Liabilities and other items 685 687
net cash from operating activities 49.1 2,989 3,040
Subsidiaries and other business units 32 4
Property, plant and equipment and intangible assets 177 200
Investments accounted for using the equity method and other investments 0 0
Other non-current financial assets 32 118
Proceeds from disposal of non-current assets 241 322
Subsidiaries and other business units –37 – 5
Property, plant and equipment and intangible assets –1,381 –1,750
Investments accounted for using the equity method and other investments 0 –1
Other non-current financial assets – 68 –103
Cash paid to acquire non-current assets –1,486 –1,859
Interest received 55 45
Current financial assets – 575 405
net cash used in investing activities 49.2 –1,765 –1,087
Proceeds from issuance of non-current financial liabilities 1,010 43
Repayments of non-current financial liabilities –34 –1,030
Change in current financial liabilities 35 – 53
Other financing activities 39 – 5
Proceeds from transactions with non-controlling interests 1 0
Cash paid for transactions with non-controlling interests –21 –34
Dividend paid to Deutsche Post AG shareholders – 846 – 968
Dividend paid to non-controlling interest holders –109 – 90
Purchase of treasury shares –23 – 85
Proceeds from issuing shares or other equity instruments 4 62
Interest paid –166 –188
net cash used in financing activities 49.3 –110 –2,348
net change in cash and cash equivalents 1,114 –395
Effect of changes in exchange rates on cash and cash equivalents –102 – 42
Changes in cash and cash equivalents associated with assets held for sale 7 0
Changes in cash and cash equivalents due to changes in consolidated group 0 1
Cash and cash equivalents at beginning of reporting period 2,395 3,414
Cash and cash equivalents at end of reporting period 49.4 3,414 2,978
1 Note 4.
Deutsche Post DHL Group — 2014 Annual Report
136
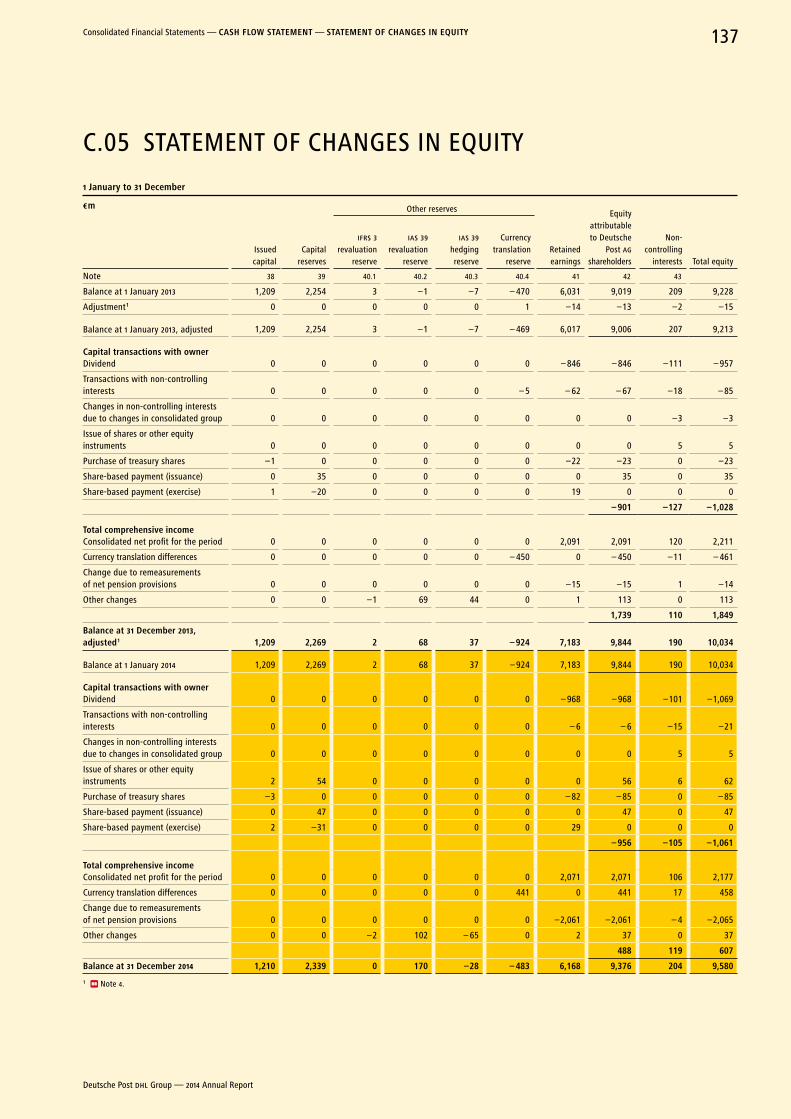
C.05 STATEMENT OF CHANGES IN EQUITY
1 January to 31 December
€ m
Issued capital
Other reserves
Retained earnings
Equity attributable to Deutsche
Post AG shareholders
Non- controlling
interests Total equity Capital
reserves
IFRS 3 revaluation
reserve
IAS 39 revaluation
reserve
IAS 39 hedging reserve
Currency translation
reserve
Note 38 39 40.1 40.2 40.3 40.4 41 42 43
Balance at 1 January 2013 1,209 2,254 3 –1 –7 – 470 6,031 9,019 209 9,228
Adjustment 1 0 0 0 0 0 1 –14 –13 –2 –15
Balance at 1 January 2013, adjusted 1,209 2,254 3 –1 –7 – 469 6,017 9,006 207 9,213
Capital transactions with owner Dividend 0 0 0 0 0 0 – 846 – 846 –111 – 957
Transactions with non-controlling interests 0 0 0 0 0 – 5 – 62 – 67 –18 – 85
Changes in non-controlling interests due to changes in consolidated group 0 0 0 0 0 0 0 0 –3 –3
Issue of shares or other equity instruments 0 0 0 0 0 0 0 0 5 5
Purchase of treasury shares –1 0 0 0 0 0 –22 –23 0 –23
Share-based payment (issuance) 0 35 0 0 0 0 0 35 0 35
Share-based payment (exercise) 1 –20 0 0 0 0 19 0 0 0
– 901 –127 –1,028
Total comprehensive incomeConsolidated net profit for the period 0 0 0 0 0 0 2,091 2,091 120 2,211
Currency translation differences 0 0 0 0 0 – 450 0 – 450 –11 – 461
Change due to remeasurements of net pension provisions 0 0 0 0 0 0 –15 –15 1 –14
Other changes 0 0 –1 69 44 0 1 113 0 113
1,739 110 1,849
Balance at 31 December 2013, adjusted 1 1,209 2,269 2 68 37 – 924 7,183 9,844 190 10,034
Balance at 1 January 2014 1,209 2,269 2 68 37 – 924 7,183 9,844 190 10,034
Capital transactions with owner Dividend 0 0 0 0 0 0 – 968 – 968 –101 –1,069
Transactions with non-controlling interests 0 0 0 0 0 0 – 6 – 6 –15 –21
Changes in non-controlling interests due to changes in consolidated group 0 0 0 0 0 0 0 0 5 5
Issue of shares or other equity instruments 2 54 0 0 0 0 0 56 6 62
Purchase of treasury shares –3 0 0 0 0 0 – 82 – 85 0 – 85
Share-based payment (issuance) 0 47 0 0 0 0 0 47 0 47
Share-based payment (exercise) 2 –31 0 0 0 0 29 0 0 0
– 956 –105 –1,061
Total comprehensive incomeConsolidated net profit for the period 0 0 0 0 0 0 2,071 2,071 106 2,177
Currency translation differences 0 0 0 0 0 441 0 441 17 458
Change due to remeasurements of net pension provisions 0 0 0 0 0 0 –2,061 –2,061 – 4 –2,065
Other changes 0 0 –2 102 – 65 0 2 37 0 37
488 119 607
Balance at 31 December 2014 1,210 2,339 0 170 –28 – 483 6,168 9,376 204 9,580
1 Note 4.
Deutsche Post DHL Group — 2014 Annual Report
137Consolidated Financial Statements — CaSH FLoW STaTeMenT — STaTeMenT oF CHanGeS In eQuITy
NOTES TO THE CONSOLIDATED FINANCIAL STATEMENTS OF DEUTSCHE POST AG
BASIS OF PREPARATION
Deutsche Post DHL Group is a global mail and logistics group. The Deutsche Post and DHL corporate brands represent a portfolio of logistics (DHL) and communication (Deutsche Post) services. The financial year of Deutsche Post AG and its consolidated subsidiaries is the calendar year. Deutsche Post AG, whose registered office is in Bonn, Germany, is entered in the commercial register of the Bonn Local Court.
1 Basis of accounting
As a listed company, Deutsche Post AG prepared its consolidated financial statements in accordance with the International Financial Reporting Standards (IFRS s), as adopted by the European Union (EU), and the provisions of commercial law to be additionally applied in accordance with section 315 a (1) of the Handelsgesetz-buch (HGB – German Commercial Code).
The requirements of the Standards applied have been satisfied in full, and the consolidated financial statements therefore provide a true and fair view of the Group’s net assets, financial position and results of operations.
The consolidated financial statements consist of the income statement and the statement of comprehensive income, the balance sheet, the cash flow statement, the statement of changes in equity and the Notes. In order to improve the clarity of presentation, vari-ous items in the balance sheet and in the income statement have been combined. These items are disclosed and explained separately in the Notes. The income statement has been classified in accord-ance with the nature of expense method.
The accounting policies, as well as the explanations and dis-closures in the Notes to the IFRS consolidated financial statements for financial year 2014, are generally based on the same accounting policies used in the 2013 consolidated financial statements. Excep-tions to this are the changes in international financial reporting under the IFRS s described in Note 5 that have been required to be applied by the Group since 1 January 2014. The accounting policies are explained in Note 7.
These consolidated financial statements were authorised for issue by a resolution of the Board of Management of Deutsche Post AG dated 20 February 2015.
The consolidated financial statements are prepared in euros (€). Unless otherwise stated, all amounts are given in millions of euros (€ million, € m).
2 Consolidated group
The consolidated group includes all companies controlled by Deutsche Post AG. Control exists if Deutsche Post AG has decision- making powers, is exposed to, and has rights to, variable returns, and is able to use its decision-making powers to affect the amount of the variable returns.
The Group companies are consolidated from the date on which Deutsche Post DHL Group is able to exer cise control.
When Deutsche Post DHL Group holds less than the majority of voting rights, other contractual arrangements may result in the Group controlling the investee.
DHL Sinotrans International Air Courier Ltd. (Sinotrans), China, is a significant company that has been consolidated despite Deutsche Post DHL Group not having a majority of voting rights. Sinotrans provides domestic and international express delivery and transport services and has been assigned to the Express seg-ment. The company is fully inte grated into the global DHL network and operates exclusively for Deutsche Post DHL Group. Due to the arrangements in the Network Agreement, DHL is able to prevail in decisions concerning Sinotrans’ relevant activities. Sinotrans has therefore been consolidated fully although Deutsche Post DHL Group holds no more than 50 % of the company’s share capital.
The complete list of the Group’s shareholdings in accordance with section 313 (2) nos. 1 to 4 and section 313 (3) of the HGB can be accessed online at www.dpdhl.com/en/investors.html.
Deutsche Post DHL Group — 2014 Annual Report
138
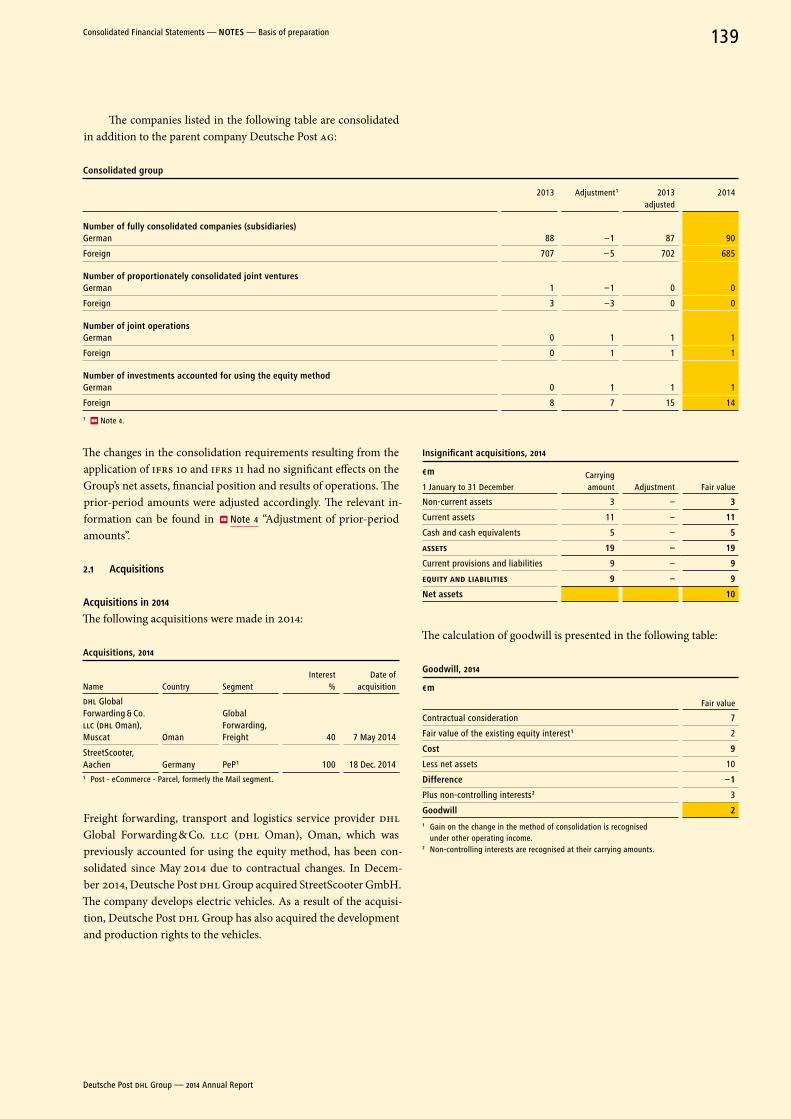
The companies listed in the following table are consolidated in addition to the parent company Deutsche Post AG:
Consolidated group
2013 Adjustment 1 2013 adjusted
2014
number of fully consolidated companies (subsidiaries)German 88 –1 87 90
Foreign 707 – 5 702 685
number of proportionately consolidated joint venturesGerman 1 –1 0 0
Foreign 3 –3 0 0
number of joint operationsGerman 0 1 1 1
Foreign 0 1 1 1
number of investments accounted for using the equity methodGerman 0 1 1 1
Foreign 8 7 15 14
1 Note 4.
The changes in the consolidation requirements resulting from the application of IFRS 10 and IFRS 11 had no significant effects on the Group’s net assets, financial position and results of operations. The prior-period amounts were adjusted accordingly. The relevant in-formation can be found in Note 4 “Adjustment of prior-period amounts”.
2.1 acquisitions
acquisitions in 2014
The following acquisitions were made in 2014:
acquisitions, 2014
Country SegmentInterest
%Date of
acquisitionName
DHL Global Forwarding & Co. LLC (DHL Oman), Muscat Oman
Global Forwarding, Freight 40 7 May 2014
StreetScooter, Aachen Germany PeP 1 100 18 Dec. 20141 Post - eCommerce - Parcel, formerly the Mail segment.
Freight forwarding, transport and logistics service provider DHL Global Forwarding & Co. LLC (DHL Oman), Oman, which was previously accounted for using the equity method, has been con-solidated since May 2014 due to contractual changes. In Decem-ber 2014, Deutsche Post DHL Group acquired StreetScooter GmbH. The company develops electric vehicles. As a result of the acquisi-tion, Deutsche Post DHL Group has also acquired the development and production rights to the vehicles.
Insignificant acquisitions, 2014
€ m Carrying amount Adjustment Fair value1 January to 31 December
Non-current assets 3 – 3
Current assets 11 – 11
Cash and cash equivalents 5 – 5
ASSETS 19 – 19
Current provisions and liabilities 9 – 9
EQUITY AND LIABILITIES 9 – 9
net assets 10
The calculation of goodwill is presented in the following table:
Goodwill, 2014
€ m
Fair value
Contractual consideration 7
Fair value of the existing equity interest 1 2
Cost 9
Less net assets 10
Difference –1
Plus non-controlling interests 2 3
Goodwill 2 1 Gain on the change in the method of consolidation is recognised
under other operating income.2 Non-controlling interests are recognised at their carrying amounts.
Deutsche Post DHL Group — 2014 Annual Report
139Consolidated Financial Statements — noTeS — Basis of preparation
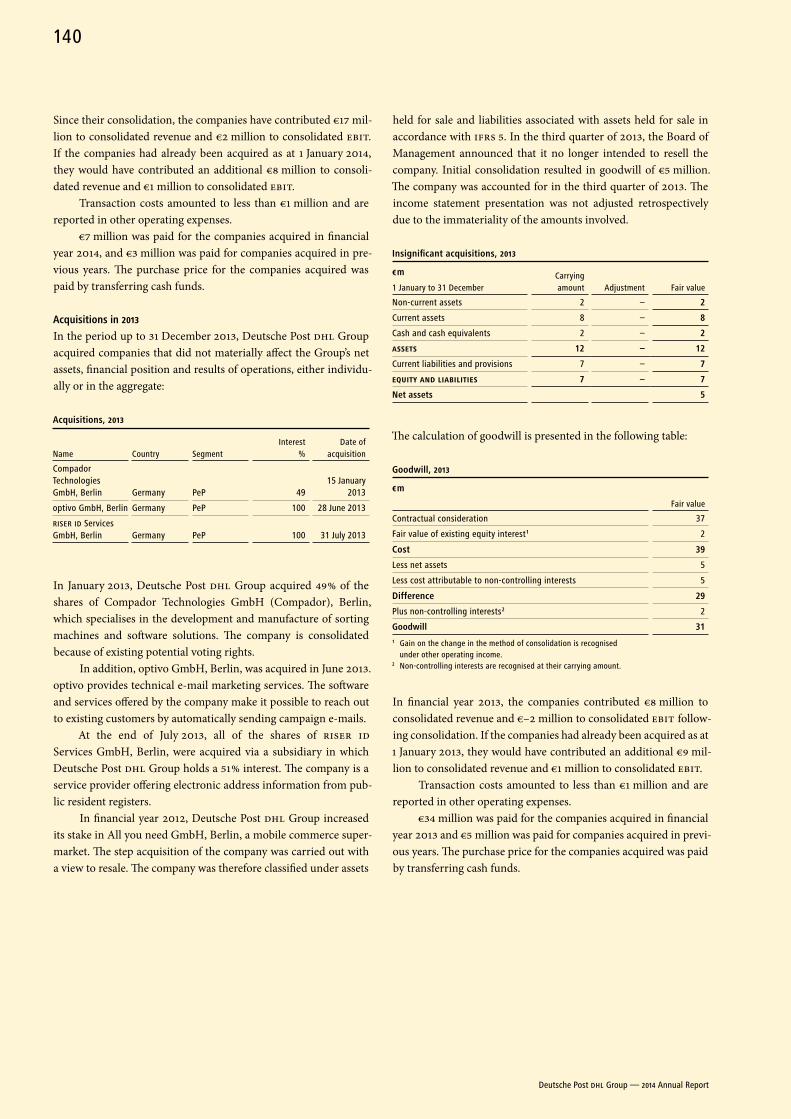
Since their consolidation, the companies have contributed €17 mil-lion to consolidated revenue and €2 million to consolidated EBIT. If the companies had already been acquired as at 1 January 2014, they would have contributed an additional €8 million to consoli-dated revenue and €1 million to consolidated EBIT.
Transaction costs amounted to less than €1 million and are reported in other operating expenses.
€7 million was paid for the companies acquired in financial year 2014, and €3 million was paid for companies acquired in pre-vious years. The purchase price for the companies acquired was paid by transferring cash funds.
acquisitions in 2013
In the period up to 31 December 2013, Deutsche Post DHL Group acquired companies that did not materially affect the Group’s net assets, financial position and results of operations, either individu-ally or in the aggregate:
acquisitions, 2013
Country SegmentInterest
%Date of
acquisitionName
Compador Technologies GmbH, Berlin Germany PeP 49
15 January 2013
optivo GmbH, Berlin Germany PeP 100 28 June 2013
RISER ID Services GmbH, Berlin Germany PeP 100 31 July 2013
In January 2013, Deutsche Post DHL Group acquired 49 % of the shares of Compador Technologies GmbH (Compador), Berlin, which specialises in the development and manufacture of sorting machines and software solutions. The company is consolidated because of existing potential voting rights.
In addition, optivo GmbH, Berlin, was acquired in June 2013. optivo provides technical e-mail marketing services. The software and services offered by the company make it possible to reach out to existing customers by automatically sending campaign e-mails.
At the end of July 2013, all of the shares of RISER ID Services GmbH, Berlin, were acquired via a subsidiary in which Deutsche Post DHL Group holds a 51 % interest. The company is a service provider offering electronic address information from pub-lic resident registers.
In financial year 2012, Deutsche Post DHL Group increased its stake in All you need GmbH, Berlin, a mobile commerce super-market. The step acquisition of the company was carried out with a view to resale. The company was therefore classified under assets
held for sale and liabilities associated with assets held for sale in accordance with IFRS 5. In the third quarter of 2013, the Board of Management announced that it no longer intended to resell the company. Initial consolidation resulted in goodwill of €5 million. The company was accounted for in the third quarter of 2013. The income statement presentation was not adjusted retrospectively due to the immateriality of the amounts involved.
Insignificant acquisitions, 2013
€ m Carrying amount Adjustment Fair value1 January to 31 December
Non-current assets 2 – 2
Current assets 8 – 8
Cash and cash equivalents 2 – 2
ASSETS 12 – 12
Current liabilities and provisions 7 – 7
EQUITY AND LIABILITIES 7 – 7
net assets 5
The calculation of goodwill is presented in the following table:
Goodwill, 2013
€ m
Fair value
Contractual consideration 37
Fair value of existing equity interest 1 2
Cost 39
Less net assets 5
Less cost attributable to non-controlling interests 5
Difference 29
Plus non-controlling interests 2 2
Goodwill 311 Gain on the change in the method of consolidation is recognised
under other operating income.2 Non-controlling interests are recognised at their carrying amount.
In financial year 2013, the companies contributed €8 million to consolidated revenue and €–2 million to consolidated EBIT follow-ing consolidation. If the companies had already been acquired as at 1 January 2013, they would have contributed an additional €9 mil-lion to consolidated revenue and €1 million to consolidated EBIT.
Transaction costs amounted to less than €1 million and are reported in other operating expenses.
€34 million was paid for the companies acquired in financial year 2013 and €5 million was paid for companies acquired in previ-ous years. The purchase price for the companies acquired was paid by transferring cash funds.
Deutsche Post DHL Group — 2014 Annual Report
140
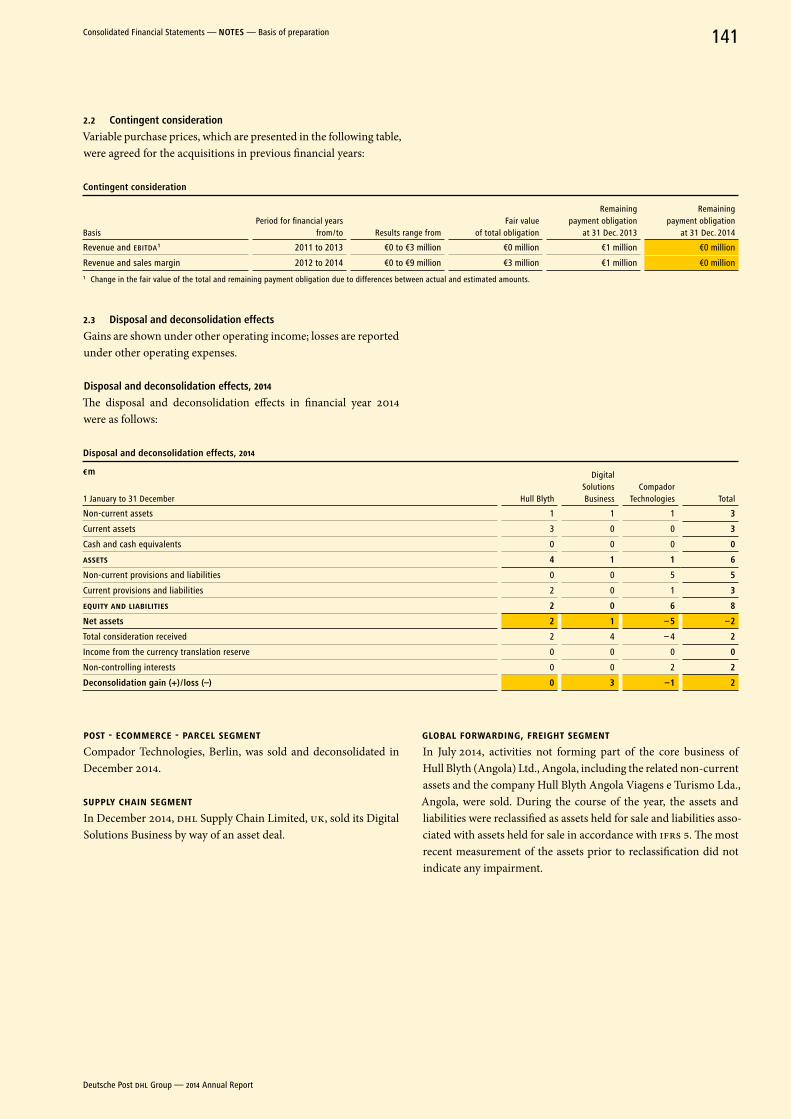
2.2 Contingent consideration
Variable purchase prices, which are presented in the following table, were agreed for the acquisitions in previous financial years:
Contingent consideration
Period for financial years from / to Results range from
Fair value of total obligation
Remaining payment obligation
at 31 Dec. 2013
Remaining payment obligation
at 31 Dec. 2014Basis
Revenue and EBITDA 1 2011 to 2013 €0 to €3 million €0 million €1 million €0 million
Revenue and sales margin 2012 to 2014 €0 to €9 million €3 million €1 million €0 million 1 Change in the fair value of the total and remaining payment obligation due to differences between actual and estimated amounts.
2.3 Disposal and deconsolidation effects
Gains are shown under other operating income; losses are reported under other operating expenses.
Disposal and deconsolidation effects, 2014
The disposal and deconsolidation effects in financial year 2014 were as follows:
Disposal and deconsolidation effects, 2014
€ m
Hull Blyth
Digital Solutions Business
Compador Technologies Total1 January to 31 December
Non-current assets 1 1 1 3
Current assets 3 0 0 3
Cash and cash equivalents 0 0 0 0
ASSETS 4 1 1 6
Non-current provisions and liabilities 0 0 5 5
Current provisions and liabilities 2 0 1 3
EQUITY AND LIABILITIES 2 0 6 8
net assets 2 1 – 5 –2
Total consideration received 2 4 – 4 2
Income from the currency translation reserve 0 0 0 0
Non-controlling interests 0 0 2 2
Deconsolidation gain (+) / loss (–) 0 3 –1 2
POST - ECOMMERCE - PARCEL SEGMENTCompador Technologies, Berlin, was sold and deconsolidated in December 2014.
SUPPLY CHAIN SEGMENTIn December 2014, DHL Supply Chain Limited, UK, sold its Digital Solutions Business by way of an asset deal.
GLOBAL FORWARDING, FREIGHT SEGMENTIn July 2014, activities not forming part of the core business of Hull Blyth (Angola) Ltd., Angola, including the related non- current assets and the company Hull Blyth Angola Viagens e Turismo Lda., Angola, were sold. During the course of the year, the assets and liabilities were reclassified as assets held for sale and liabilities asso-ciated with assets held for sale in accordance with IFRS 5. The most recent measurement of the assets prior to reclassification did not indicate any impairment.
Deutsche Post DHL Group — 2014 Annual Report
141Consolidated Financial Statements — noTeS — Basis of preparation
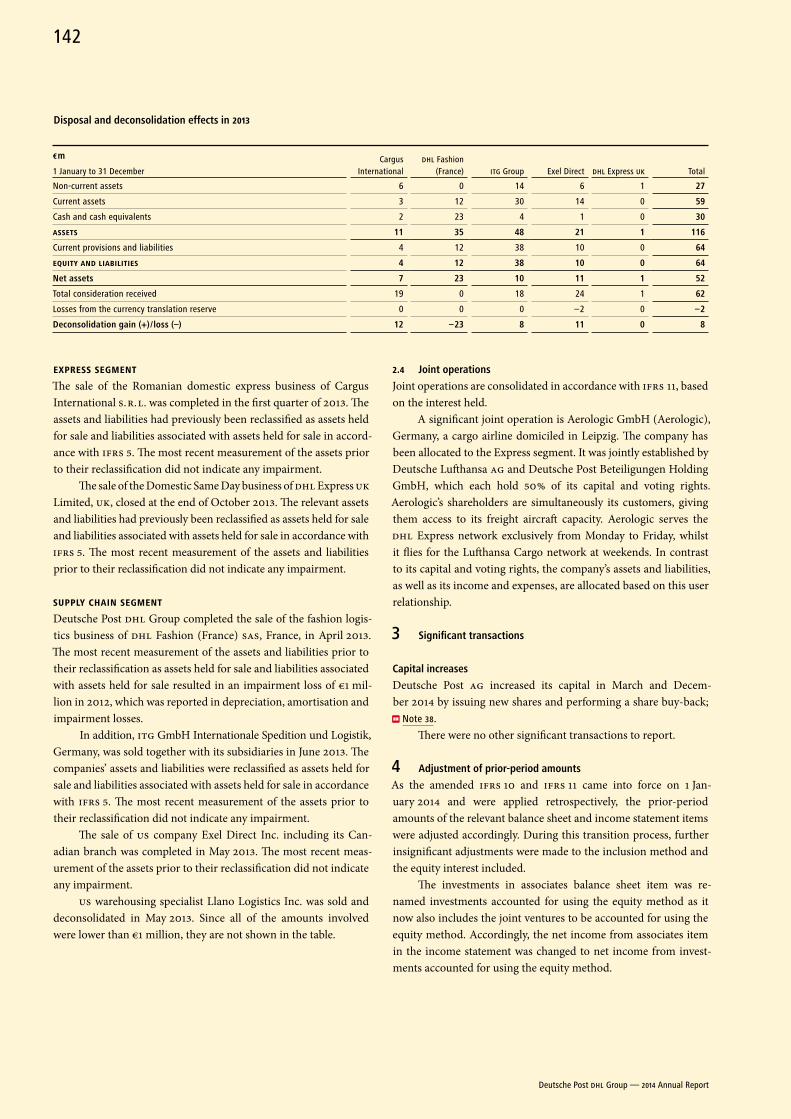
Disposal and deconsolidation effects in 2013
€ m Cargus International
DHL Fashion (France) ITG Group Exel Direct DHL Express UK Total1 January to 31 December
Non-current assets 6 0 14 6 1 27
Current assets 3 12 30 14 0 59
Cash and cash equivalents 2 23 4 1 0 30
ASSETS 11 35 48 21 1 116
Current provisions and liabilities 4 12 38 10 0 64
EQUITY AND LIABILITIES 4 12 38 10 0 64
net assets 7 23 10 11 1 52
Total consideration received 19 0 18 24 1 62
Losses from the currency translation reserve 0 0 0 –2 0 –2
Deconsolidation gain (+) / loss (–) 12 –23 8 11 0 8
EXPRESS SEGMENTThe sale of the Romanian domestic express business of Cargus Inter national S. R. L. was completed in the first quarter of 2013. The assets and liabilities had previously been reclassified as assets held for sale and liabilities associated with assets held for sale in accord-ance with IFRS 5. The most recent measurement of the assets prior to their reclassification did not indicate any impairment.
The sale of the Domestic Same Day business of DHL Express UK Limited, UK, closed at the end of October 2013. The relevant assets and liabilities had previously been reclassified as assets held for sale and liabilities associated with assets held for sale in accordance with IFRS 5. The most recent measurement of the assets and liabilities prior to their reclassification did not indicate any impairment.
SUPPLY CHAIN SEGMENTDeutsche Post DHL Group completed the sale of the fashion logis-tics business of DHL Fashion (France) SAS, France, in April 2013. The most recent measurement of the assets and liabilities prior to their reclassification as assets held for sale and liabilities associated with assets held for sale resulted in an impairment loss of €1 mil-lion in 2012, which was reported in depreciation, amortisation and impairment losses.
In addition, ITG GmbH Internationale Spedition und Logistik, Germany, was sold together with its subsidiaries in June 2013. The companies’ assets and liabilities were reclassified as assets held for sale and liabilities associated with assets held for sale in accordance with IFRS 5. The most recent measurement of the assets prior to their reclassification did not indicate any impairment.
The sale of US company Exel Direct Inc. including its Can-adian branch was completed in May 2013. The most recent meas-urement of the assets prior to their reclassification did not indicate any impairment.
US warehousing specialist Llano Logistics Inc. was sold and deconsolidated in May 2013. Since all of the amounts involved were lower than €1 million, they are not shown in the table.
2.4 Joint operations
Joint operations are consolidated in accordance with IFRS 11, based on the interest held.
A significant joint operation is Aerologic GmbH (Aerologic), Germany, a cargo airline domiciled in Leipzig. The company has been allocated to the Express segment. It was jointly established by Deutsche Lufthansa AG and Deutsche Post Beteiligungen Holding GmbH, which each hold 50 % of its capital and voting rights. Aerologic’s shareholders are simultaneously its customers, giving them access to its freight aircraft capacity. Aerologic serves the DHL Express network exclusively from Monday to Friday, whilst it flies for the Lufthansa Cargo network at weekends. In contrast to its capital and voting rights, the company’s assets and liabilities, as well as its income and expenses, are allocated based on this user relationship.
3 Significant transactions
Capital increases
Deutsche Post AG increased its capital in March and Decem-ber 2014 by issuing new shares and performing a share buy-back;
Note 38.There were no other significant transactions to report.
4 adjustment of prior-period amounts
As the amended IFRS 10 and IFRS 11 came into force on 1 Jan-uary 2014 and were applied retrospectively, the prior-period amounts of the relevant balance sheet and income statement items were adjusted accordingly. During this transition process, further insignificant adjustments were made to the inclusion method and the equity interest included.
The investments in associates balance sheet item was re-named investments accounted for using the equity method as it now also includes the joint ventures to be accounted for using the equity method. Accordingly, the net income from associates item in the income statement was changed to net income from invest-ments accounted for using the equity method.
Deutsche Post DHL Group — 2014 Annual Report
142
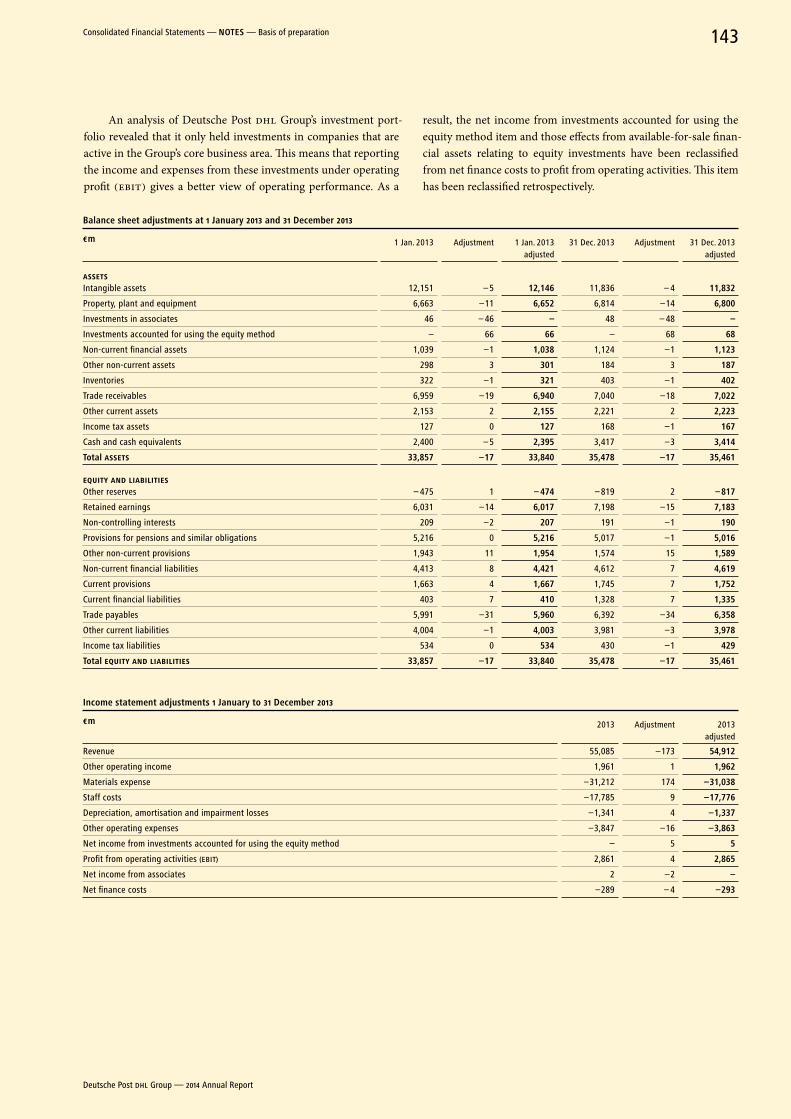
An analysis of Deutsche Post DHL Group’s investment port-folio revealed that it only held investments in companies that are active in the Group’s core business area. This means that reporting the income and expenses from these investments under operating profit (EBIT) gives a better view of operating performance. As a
result, the net income from investments accounted for using the equity method item and those effects from available-for-sale finan-cial assets relating to equity investments have been reclassified from net finance costs to profit from operating activities. This item has been reclassified retrospectively.
Balance sheet adjustments at 1 January 2013 and 31 December 2013
€ m 1 Jan. 2013 Adjustment 1 Jan. 2013 adjusted
31 Dec. 2013 Adjustment 31 Dec. 2013 adjusted
ASSETSIntangible assets 12,151 – 5 12,146 11,836 – 4 11,832
Property, plant and equipment 6,663 –11 6,652 6,814 –14 6,800
Investments in associates 46 – 46 – 48 – 48 –
Investments accounted for using the equity method – 66 66 – 68 68
Non-current financial assets 1,039 –1 1,038 1,124 –1 1,123
Other non-current assets 298 3 301 184 3 187
Inventories 322 –1 321 403 –1 402
Trade receivables 6,959 –19 6,940 7,040 –18 7,022
Other current assets 2,153 2 2,155 2,221 2 2,223
Income tax assets 127 0 127 168 –1 167
Cash and cash equivalents 2,400 – 5 2,395 3,417 –3 3,414
Total ASSETS 33,857 –17 33,840 35,478 –17 35,461
EQUITY AND LIABILITIESOther reserves – 475 1 – 474 – 819 2 – 817
Retained earnings 6,031 –14 6,017 7,198 –15 7,183
Non-controlling interests 209 –2 207 191 –1 190
Provisions for pensions and similar obligations 5,216 0 5,216 5,017 –1 5,016
Other non-current provisions 1,943 11 1,954 1,574 15 1,589
Non-current financial liabilities 4,413 8 4,421 4,612 7 4,619
Current provisions 1,663 4 1,667 1,745 7 1,752
Current financial liabilities 403 7 410 1,328 7 1,335
Trade payables 5,991 –31 5,960 6,392 –34 6,358
Other current liabilities 4,004 –1 4,003 3,981 –3 3,978
Income tax liabilities 534 0 534 430 –1 429
Total EQUITY AND LIABILITIES 33,857 –17 33,840 35,478 –17 35,461
Income statement adjustments 1 January to 31 December 2013
€ m 2013 Adjustment 2013 adjusted
Revenue 55,085 –173 54,912
Other operating income 1,961 1 1,962
Materials expense –31,212 174 –31,038
Staff costs –17,785 9 –17,776
Depreciation, amortisation and impairment losses –1,341 4 –1,337
Other operating expenses –3,847 –16 –3,863
Net income from investments accounted for using the equity method – 5 5
Profit from operating activities (EBIT) 2,861 4 2,865
Net income from associates 2 –2 –
Net finance costs –289 – 4 –293
Deutsche Post DHL Group — 2014 Annual Report
143Consolidated Financial Statements — noTeS — Basis of preparation
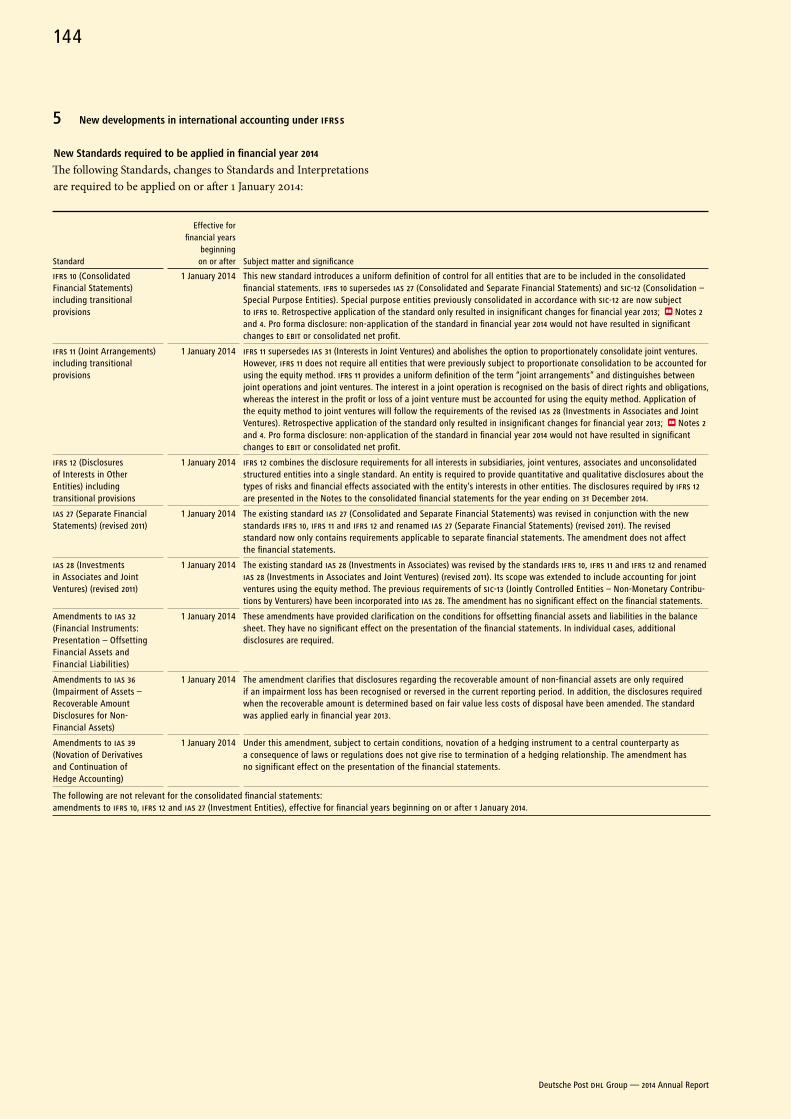
5 new developments in international accounting under IFRS s
new Standards required to be applied in financial year 2014
The following Standards, changes to Standards and Interpretations are required to be applied on or after 1 January 2014:
Effective for financial years
beginning on or after Subject matter and significanceStandard
IFRS 10 (Consolidated Financial Statements) including transitional provisions
1 January 2014
This new standard introduces a uniform definition of control for all entities that are to be included in the consolidated financial statements. IFRS 10 supersedes IAS 27 (Consolidated and Separate Financial Statements) and SIC-12 ( Consolidation – Special Purpose Entities). Special purpose entities previously consolidated in accordance with SIC-12 are now subject to IFRS 10. Retrospective application of the standard only resulted in insignificant changes for financial year 2013; Notes 2 and 4. Pro forma disclosure: non-application of the standard in financial year 2014 would not have resulted in significant changes to EBIT or consolidated net profit.
IFRS 11 (Joint Arrangements) including transitional provisions
1 January 2014
IFRS 11 supersedes IAS 31 (Interests in Joint Ventures) and abolishes the option to proportionately consolidate joint ventures. However, IFRS 11 does not require all entities that were previously subject to proportionate consolidation to be accounted for using the equity method. IFRS 11 provides a uniform definition of the term “joint arrangements” and distinguishes between joint operations and joint ventures. The interest in a joint operation is recognised on the basis of direct rights and obligations, whereas the interest in the profit or loss of a joint venture must be accounted for using the equity method. Application of the equity method to joint ventures will follow the requirements of the revised IAS 28 (Investments in Associates and Joint Ventures). Retrospective application of the standard only resulted in insignificant changes for financial year 2013; Notes 2 and 4. Pro forma disclosure: non-application of the standard in financial year 2014 would not have resulted in significant changes to EBIT or consolidated net profit.
IFRS 12 (Disclosures of Interests in Other Entities) including transitional provisions
1 January 2014
IFRS 12 combines the disclosure requirements for all interests in subsidiaries, joint ventures, associates and unconsolidated structured entities into a single standard. An entity is required to provide quantitative and qualitative disclosures about the types of risks and financial effects associated with the entity’s interests in other entities. The disclosures required by IFRS 12 are presented in the Notes to the consolidated financial statements for the year ending on 31 December 2014.
IAS 27 (Separate Financial Statements) (revised 2011)
1 January 2014
The existing standard IAS 27 (Consolidated and Separate Financial Statements) was revised in conjunction with the new standards IFRS 10, IFRS 11 and IFRS 12 and renamed IAS 27 (Separate Financial Statements) (revised 2011). The revised standard now only contains requirements applicable to separate financial statements. The amendment does not affect the financial statements.
IAS 28 (Investments in Associates and Joint Ventures) (revised 2011)
1 January 2014
The existing standard IAS 28 (Investments in Associates) was revised by the standards IFRS 10, IFRS 11 and IFRS 12 and renamed IAS 28 (Investments in Associates and Joint Ventures) (revised 2011). Its scope was extended to include accounting for joint ventures using the equity method. The previous requirements of SIC-13 (Jointly Controlled Entities – Non-Monetary Contribu-tions by Venturers) have been incorporated into IAS 28. The amendment has no significant effect on the financial statements.
Amendments to IAS 32 (Financial Instruments: Presentation – Offsetting Financial Assets and Financial Liabilities)
1 January 2014
These amendments have provided clarification on the conditions for offsetting financial assets and liabilities in the balance sheet. They have no significant effect on the presentation of the financial statements. In individual cases, additional disclosures are required.
Amendments to IAS 36 ( Impairment of Assets – Recoverable Amount Disclosures for Non- Financial Assets)
1 January 2014
The amendment clarifies that disclosures regarding the recoverable amount of non-financial assets are only required if an impairment loss has been recognised or reversed in the current reporting period. In addition, the disclosures required when the recoverable amount is determined based on fair value less costs of disposal have been amended. The standard was applied early in financial year 2013.
Amendments to IAS 39 (Novation of Derivatives and Continuation of Hedge Accounting)
1 January 2014
Under this amendment, subject to certain conditions, novation of a hedging instrument to a central counterparty as a consequence of laws or regulations does not give rise to termination of a hedging relationship. The amendment has no significant effect on the presentation of the financial statements.
The following are not relevant for the consolidated financial statements: amendments to IFRS 10, IFRS 12 and IAS 27 (Investment Entities), effective for financial years beginning on or after 1 January 2014.
Deutsche Post DHL Group — 2014 Annual Report
144
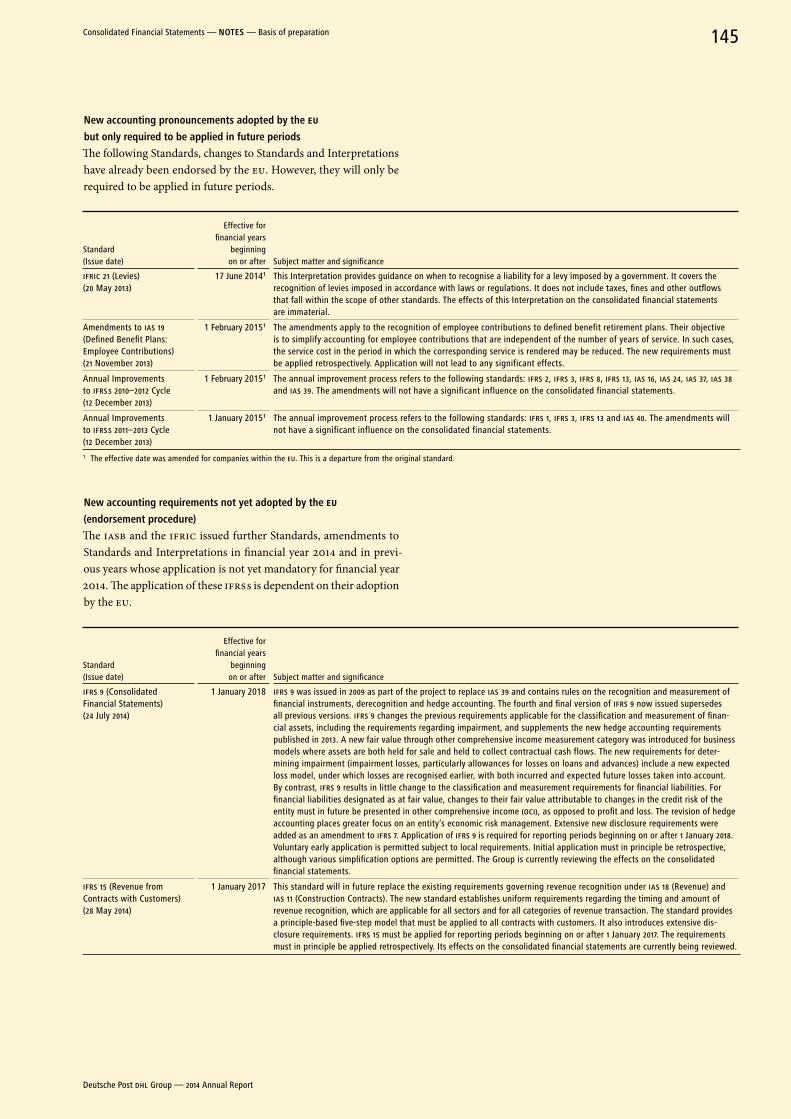
new accounting pronouncements adopted by the EU
but only required to be applied in future periods
The following Standards, changes to Standards and Interpretations have already been endorsed by the EU. However, they will only be required to be applied in future periods.
Effective for financial years
beginning on or after Subject matter and significance
Standard (Issue date)
IFRIC 21 (Levies) (20 May 2013)
17 June 2014 1
This Interpretation provides guidance on when to recognise a liability for a levy imposed by a government. It covers the recognition of levies imposed in accordance with laws or regulations. It does not include taxes, fines and other outflows that fall within the scope of other standards. The effects of this Interpretation on the consolidated financial statements are immaterial.
Amendments to IAS 19 ( Defined Benefit Plans: Employee Contributions) (21 November 2013)
1 February 2015 1
The amendments apply to the recognition of employee contributions to defined benefit retirement plans. Their objective is to simplify accounting for employee contributions that are independent of the number of years of service. In such cases, the service cost in the period in which the corresponding service is rendered may be reduced. The new requirements must be applied retrospectively. Application will not lead to any significant effects.
Annual Improvements to IFRS s 2010–2012 Cycle (12 December 2013)
1 February 2015 1
The annual improvement process refers to the following standards: IFRS 2, IFRS 3, IFRS 8, IFRS 13, IAS 16, IAS 24, IAS 37, IAS 38 and IAS 39. The amendments will not have a significant influence on the consolidated financial statements.
Annual Improvements to IFRS s 2011–2013 Cycle (12 December 2013)
1 January 2015 1 The annual improvement process refers to the following standards: IFRS 1, IFRS 3, IFRS 13 and IAS 40. The amendments will not have a significant influence on the consolidated financial statements.
1 The effective date was amended for companies within the EU. This is a departure from the original standard.
new accounting requirements not yet adopted by the EU
( endorsement procedure)
The IASB and the IFRIC issued further Standards, amendments to Standards and Interpretations in financial year 2014 and in previ-ous years whose application is not yet mandatory for financial year 2014. The application of these IFRS s is dependent on their adoption by the EU.
Effective for financial years
beginning on or after Subject matter and significance
Standard (Issue date)
IFRS 9 (Consolidated Financial Statements) (24 July 2014)
1 January 2018
IFRS 9 was issued in 2009 as part of the project to replace IAS 39 and contains rules on the recognition and measurement of financial instruments, derecognition and hedge accounting. The fourth and final version of IFRS 9 now issued supersedes all previous versions. IFRS 9 changes the previous requirements applicable for the classification and measurement of finan-cial assets, including the requirements regarding impairment, and supplements the new hedge accounting requirements published in 2013. A new fair value through other comprehensive income measurement category was introduced for business models where assets are both held for sale and held to collect contractual cash flows. The new requirements for deter-mining impairment (impairment losses, particularly allowances for losses on loans and advances) include a new expected loss model, under which losses are recognised earlier, with both incurred and expected future losses taken into account. By contrast, IFRS 9 results in little change to the classification and measurement requirements for financial liabilities. For financial liabilities designated as at fair value, changes to their fair value attributable to changes in the credit risk of the entity must in future be presented in other comprehensive income (OCI), as opposed to profit and loss. The revision of hedge accounting places greater focus on an entity’s economic risk management. Extensive new disclosure requirements were added as an amendment to IFRS 7. Application of IFRS 9 is required for reporting periods beginning on or after 1 January 2018. Voluntary early application is permitted subject to local requirements. Initial application must in principle be retrospective, although various simplification options are permitted. The Group is currently reviewing the effects on the consolidated financial statements.
IFRS 15 (Revenue from Contracts with Customers) (28 May 2014)
1 January 2017
This standard will in future replace the existing requirements governing revenue recognition under IAS 18 (Revenue) and IAS 11 (Construction Contracts). The new standard establishes uniform requirements regarding the timing and amount of revenue recognition, which are applicable for all sectors and for all categories of revenue transaction. The standard provides a principle-based five-step model that must be applied to all contracts with customers. It also introduces extensive dis-closure requirements. IFRS 15 must be applied for reporting periods beginning on or after 1 January 2017. The requirements must in principle be applied retrospectively. Its effects on the consolidated financial statements are currently being reviewed.
Deutsche Post DHL Group — 2014 Annual Report
145Consolidated Financial Statements — noTeS — Basis of preparation
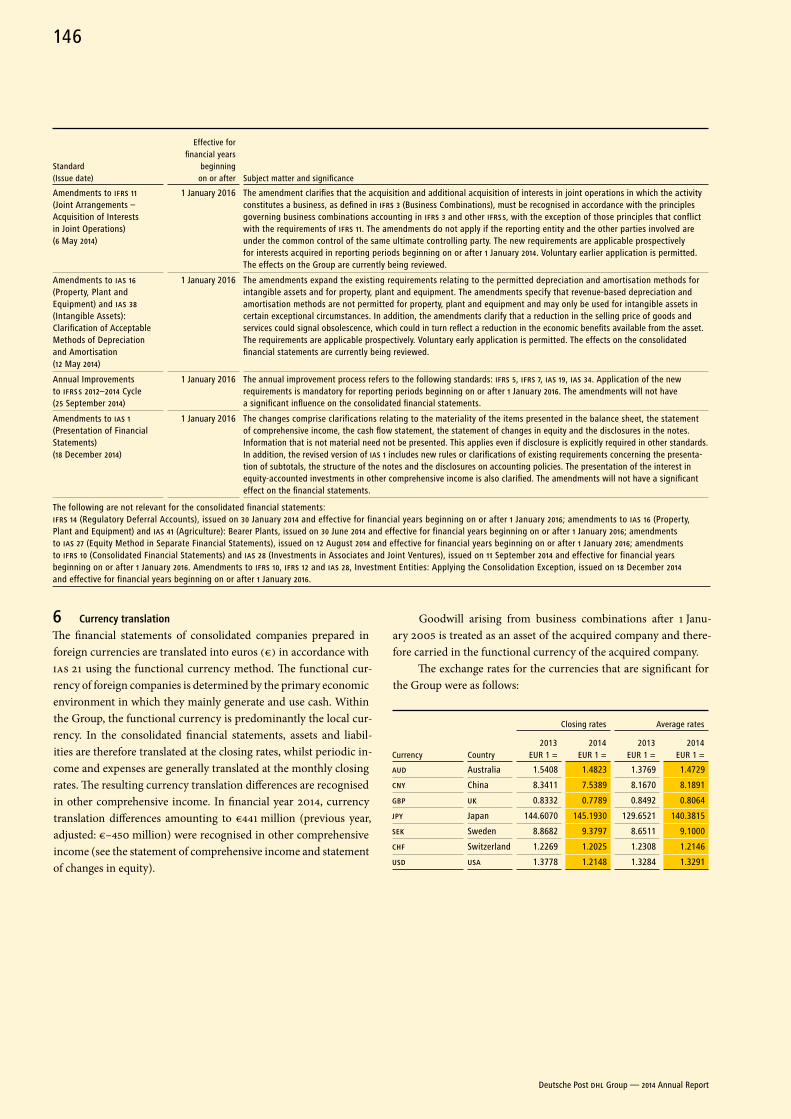
Effective for financial years
beginning on or after Subject matter and significance
Standard (Issue date)
Amendments to IFRS 11 (Joint Arrangements – Acquisition of Interests in Joint Operations) (6 May 2014)
1 January 2016
The amendment clarifies that the acquisition and additional acquisition of interests in joint operations in which the activity constitutes a business, as defined in IFRS 3 (Business Combinations), must be recognised in accordance with the principles governing business combinations accounting in IFRS 3 and other IFRS s, with the exception of those principles that conflict with the requirements of IFRS 11. The amendments do not apply if the reporting entity and the other parties involved are under the common control of the same ultimate controlling party. The new requirements are applicable prospectively for interests acquired in reporting periods beginning on or after 1 January 2014. Voluntary earlier application is permitted. The effects on the Group are currently being reviewed.
Amendments to IAS 16 (Property, Plant and Equipment) and IAS 38 ( Intangible Assets): Clarification of Acceptable Methods of Depreciation and Amortisation (12 May 2014)
1 January 2016
The amendments expand the existing requirements relating to the permitted depreciation and amortisation methods for intangible assets and for property, plant and equipment. The amendments specify that revenue-based depreciation and amortisation methods are not permitted for property, plant and equipment and may only be used for intangible assets in certain exceptional circumstances. In addition, the amendments clarify that a reduction in the selling price of goods and services could signal obsolescence, which could in turn reflect a reduction in the economic benefits available from the asset. The requirements are applicable prospectively. Voluntary early application is permitted. The effects on the consolidated financial statements are currently being reviewed.
Annual Improvements to IFRS s 2012–2014 Cycle (25 September 2014)
1 January 2016
The annual improvement process refers to the following standards: IFRS 5, IFRS 7, IAS 19, IAS 34. Application of the new requirements is mandatory for reporting periods beginning on or after 1 January 2016. The amendments will not have a significant influence on the consolidated financial statements.
Amendments to IAS 1 (Presentation of Financial Statements) (18 December 2014)
1 January 2016
The changes comprise clarifications relating to the materiality of the items presented in the balance sheet, the statement of comprehensive income, the cash flow statement, the statement of changes in equity and the disclosures in the notes. Information that is not material need not be presented. This applies even if disclosure is explicitly required in other standards. In addition, the revised version of IAS 1 includes new rules or clarifications of existing requirements concerning the presenta-tion of subtotals, the structure of the notes and the disclosures on accounting policies. The presentation of the interest in equity-accounted investments in other comprehensive income is also clarified. The amendments will not have a significant effect on the financial statements.
The following are not relevant for the consolidated financial statements: IFRS 14 (Regulatory Deferral Accounts), issued on 30 January 2014 and effective for financial years beginning on or after 1 January 2016; amendments to IAS 16 ( Property, Plant and Equipment) and IAS 41 (Agriculture): Bearer Plants, issued on 30 June 2014 and effective for financial years beginning on or after 1 January 2016; amendments to IAS 27 (Equity Method in Separate Financial Statements), issued on 12 August 2014 and effective for financial years beginning on or after 1 January 2016; amendments to IFRS 10 ( Consolidated Financial Statements) and IAS 28 (Investments in Associates and Joint Ventures), issued on 11 September 2014 and effective for financial years beginning on or after 1 January 2016. Amendments to IFRS 10, IFRS 12 and IAS 28, Investment Entities: Applying the Consolidation Exception, issued on 18 December 2014 and effective for financial years beginning on or after 1 January 2016.
6 Currency translation
The financial statements of consolidated companies prepared in foreign currencies are translated into euros (€) in accordance with IAS 21 using the functional currency method. The functional cur-rency of foreign companies is determined by the primary economic environment in which they mainly generate and use cash. Within the Group, the functional currency is predominantly the local cur-rency. In the consolidated financial statements, assets and liabil-ities are therefore translated at the closing rates, whilst periodic in-come and expenses are generally translated at the monthly closing rates. The resulting currency translation differences are recognised in other comprehensive income. In financial year 2014, currency translation differences amounting to €441 million (previous year, adjusted: €–450 million) were recognised in other comprehensive income (see the statement of comprehensive income and statement of changes in equity).
Goodwill arising from business combinations after 1 Janu-ary 2005 is treated as an asset of the acquired company and there-fore carried in the functional currency of the acquired company.
The exchange rates for the currencies that are significant for the Group were as follows:
Closing rates Average rates
Currency Country2013
EUR 1 =2014
EUR 1 =2013
EUR 1 =2014
EUR 1 =
AUD Australia 1.5408 1.4823 1.3769 1.4729
CnY China 8.3411 7.5389 8.1670 8.1891
GBP UK 0.8332 0.7789 0.8492 0.8064
JPY Japan 144.6070 145.1930 129.6521 140.3815
SEK Sweden 8.8682 9.3797 8.6511 9.1000
CHF Switzerland 1.2269 1.2025 1.2308 1.2146
USD USA 1.3778 1.2148 1.3284 1.3291
Deutsche Post DHL Group — 2014 Annual Report
146
The carrying amounts of non-monetary assets recognised at con-solidated companies operating in hyperinflationary economies are generally indexed in accordance with IAS 29 and thus reflect the current purchasing power at the balance sheet date.
In accordance with IAS 21, receivables and liabilities in the financial statements of consolidated companies that have been prepared in local currencies are translated at the closing rate as at the balance sheet date. Currency translation differences are recog-nised in other operating income and expenses in the income state-ment. In financial year 2014, income of €171 million (previous year, adjusted: €157 million) and expenses of €170 million ( previous year, adjusted: €157 million) resulted from currency translation differences. In contrast, currency translation differences relating to net investments in a foreign operation are recognised in other comprehensive income.
The company’s business in Venezuela is subject to exchange controls. The Venezuelan currency, the bolívar fuerte, is not freely convertible. In March 2014, a new exchange rate system known as SICAD II (Sistema Complementario de Administración de Divisas) was introduced and the state-set exchange rate adjusted. Deutsche Post DHL Group began using this system in the second quarter of 2014 and modified the conversion rate on this basis. Due to currency effects, the cash and cash equivalents of the com-panies affected decreased by €130 million and non-current assets by €27 million as at the date of the change. Other current assets declined by €56 million and current provisions and liabilities by €103 million. The corresponding contra entries are included in the currency translation reserve in equity. Cash and cash equivalents amounted to €23 million as at 31 December 2014.
7 accounting policies
Uniform accounting policies are applied to the annual financial statements of the entities that have been included in the consoli-dated financial statements. The consolidated financial statements are prepared under the historical cost convention, except where items are required to be recognised at their fair value.
revenue and expense recognition
Deutsche Post DHL Group’s normal business operations consist of the provision of logistics services. All income relating to nor-mal business operations is recognised as revenue in the income statement. All other income is reported as other operating income. Revenue and other operating income is generally recognised when services are rendered, the amount of revenue and income can be reliably measured and, in all probability, the economic benefits from the transactions will flow to the Group. Operating expenses are recognised in income when the service is utilised or when the expenses are incurred.
Intangible assets
Intangible assets are measured at amortised cost. Intangible assets comprise internally generated and purchased intangible assets and purchased goodwill.
Internally generated intangible assets are capitalised at cost if it is probable that their production will generate an inflow of future economic benefits and the costs can be reliably measured. In the Group, this concerns internally developed software. If the criteria for capitalisation are not met, the expenses are recognised immediately in income in the year in which they are incurred. In addition to direct costs, the production cost of internally devel-oped software includes an appropriate share of allocable produc-tion overhead costs. Any borrowing costs incurred for qualifying assets are included in the production cost. Value added tax arising in conjunction with the acquisition or production of intangible assets is included in the cost if it cannot be deducted as input tax. Capitalised software is amortised over its useful life.
Intangible assets are amortised using the straight-line method over their useful lives. Impairment losses are recognised in accordance with the principles described in the section headed Impairment. The useful lives of significant intangible assets are pre-sented in the table below.
useful lives
Years 1
Internally developed software up to 10
Purchased software up to 5
Licences term of agreement
Customer relationships up to 201 The useful lives indicated represent maximum amounts specified by the Group.
The actual useful lives may be shorter due to contractual arrangements or other specific factors such as time and location.
Intangible assets that are not affected by legal, economic, con-tractual, or other factors that might restrict their useful lives are considered to have indefinite useful lives. They are not amortised but are tested for impairment annually or whenever there are indi-cations of impairment. They generally include brand names from business combinations, for example. Impairment testing is carried out in accordance with the principles described in the section headed Impairment.
Deutsche Post DHL Group — 2014 Annual Report
147Consolidated Financial Statements — noTeS — Basis of preparation
Property, plant and equipment
Property, plant and equipment is carried at cost, reduced by accumu lated depreciation and valuation allowances. In addition to direct costs, production cost includes an appropriate share of allocable production overhead costs. Borrowing costs that can be allocated directly to the purchase, construction or manufacture of property, plant and equipment are capitalised. Value added tax arising in conjunction with the acquisition or production of items of property, plant or equipment is included in the cost if it can-not be deducted as input tax. Depreciation is charged using the straight-line method. The estimated useful lives applied to the major asset classes are presented in the table below:
useful lives
Years 1
Buildings 20 to 50
Technical equipment and machinery 10 to 20
Aircraft 15 to 20
IT systems 4 to 5
Transport equipment and vehicle fleet 4 to 18
Other operating and office equipment 8 to 101 The useful lives indicated represent maximum amounts specified by the Group.
The actual useful lives may be shorter due to contractual arrangements or other specific factors such as time and location.
Useful lives for letter sorting systems were extended from ten to 20 years and those for parcel sorting systems from 15 to 20 years in financial year 2014, based on an improved estimate. A stand-ard adjustment to 50 years was made for operational and admin-istrative buildings. The useful lives were adjusted prospectively as a change in accounting estimates; they have not been adjusted retrospectively for prior periods. Application of the adjusted use-ful lives caused depreciation to decrease by €42 million in finan-cial year 2014. It is expected that depreciation will be reduced by €68 million for finan cial year 2015 and by €66 million for financial year 2016.
If there are indications of impairment, an impairment test must be carried out; section headed Impairment.
Impairment
At each balance sheet date, the carrying amounts of intangible assets, property, plant and equipment and investment property are reviewed for indications of impairment. If there are any such indications, an impairment test must be carried out. This is done by determining the recoverable amount of the relevant asset and comparing it with the carrying amount.
In accordance with IAS 36, the recoverable amount is the asset’s fair value less costs to sell or its value in use, whichever is higher. The value in use is the present value of the pre-tax free cash flows expected to be derived from the asset in future. The discount rate used is a pre-tax rate of interest reflecting current market conditions. If the recoverable amount cannot be determined for an individual asset, the recoverable amount is determined for the smallest identifiable group of assets to which the asset in question can be allocated and which generates independent cash flows (cash generating unit – CGU). If the recoverable amount of an asset is
lower than its carrying amount, an impairment loss is recognised immediately in respect of the asset. If, after an impairment loss has been recognised, a higher recoverable amount is determined for the asset or the CGU at a later date, the impairment loss is reversed up to a carrying amount that does not exceed the recoverable amount. The increased carrying amount attributable to the rever-sal of the impairment loss is limited to the carrying amount that would have been determined (net of amortisation or depreciation) if no impairment loss had been recognised in the past. The rever-sal of the impairment loss is recognised in the income statement. Impairment losses recognised in respect of goodwill may not be reversed.
Since January 2005, goodwill has been accounted for using the impairment-only approach in accordance with IFRS 3. This stipulates that goodwill must be subsequently measured at cost, less any cumulative adjustments from impairment losses. Pur-chased goodwill is therefore no longer amortised and instead is tested for impairment annually in accordance with IAS 36, regard-less of whether any indication of possible impairment exists, as in the case of intangible assets with an indefinite useful life. In addi-tion, the obligation remains to conduct an impairment test if there is any indication of impairment. Goodwill resulting from company acquisitions is allocated to the identifiable groups of assets (CGU s or groups of CGU s) that are expected to benefit from the synergies of the acquisition. These groups represent the lowest reporting level at which the goodwill is monitored for internal management pur-poses. The carrying amount of a CGU to which goodwill has been allocated is tested for impairment annually and whenever there is an indication that the unit may be impaired. Where impairment losses are recognised in connection with a CGU to which goodwill has been allocated, the existing carrying amount of the goodwill is reduced first. If the amount of the impairment loss exceeds the carrying amount of the goodwill, the difference is allocated to the remaining non-current assets in the CGU.
Finance leases
A lease financing transaction is an agreement in which the lessor conveys to the lessee the right to use an asset for a specified period in return for a payment or a number of payments. In accordance with IAS 17, beneficial ownership of leased assets is attributed to the lessee if the lessee substantially bears all risks and rewards inci-dent to ownership of the leased asset. To the extent that beneficial ownership is attributable to the Group as the lessee, the asset is capitalised at the date on which use starts, either at fair value or at the present value of the minimum lease payments if this is less than the fair value. A lease liability in the same amount is recognised under non-current liabilities. The lease is subsequently measured at amortised cost using the effective interest method. The depre-ciation methods and estimated useful lives correspond to those of comparable purchased assets.
Deutsche Post DHL Group — 2014 Annual Report
148
operating leases
For operating leases, the Group reports the leased asset at amor-tised cost as an asset under property, plant and equipment where it is the lessor. The lease payments recognised in the period are shown under other operating income. Where the Group is the lessee, the lease payments made are recognised as lease expenses under materials expense. Lease expenses and income are recog-nised using the straight-line method.
Investments accounted for using the equity method
Investments accounted for using the equity method cover asso-ciates and joint ventures. These are recognised using the equity method in accordance with IAS 28 (Investments in Associates and Joint Ventures). Based on the cost of acquisition at the time of purchase of the investments, the carrying amount of the invest-ment is increased or reduced annually to reflect the share of earn-ings, dividends distributed and other changes in the equity of the associates and joint ventures attributable to the investments of Deutsche Post AG or its consolidated subsidiaries. The goodwill contained in the carrying amounts of the investments is accounted for in accordance with IFRS 3. Investments accounted for using the equity method are impaired if the recoverable amount falls below the carrying amount. Gains and losses from the disposal of invest-ments accounted for using the equity method, as well as impair-ment losses and their reversals, are recognised in other operating income or other operating expenses; Note 4.
Financial instruments
A financial instrument is any contract that gives rise to a financial asset of one entity and a financial liability or equity instrument of another entity. Financial assets include in particular cash and cash equivalents, trade receivables, originated loans and receivables, and derivative financial assets held for trading. Financial liabilities include contractual obligations to deliver cash or another financial asset to another entity. These mainly comprise trade payables, li-abilities to banks, liabilities arising from bonds and finance leases, and derivative financial liabilities.
Fair value option
Under the fair value option, financial assets or financial liabilities may be measured at fair value through profit or loss on initial rec-ognition if this eliminates or significantly reduces a measurement or recognition inconsistency (accounting mismatch). The Group makes use of the option in order to avoid accounting mismatches.
Financial assets
Financial assets are accounted for in accordance with the pro-visions of IAS 39, which distinguishes between four categories of finan cial instruments.
AvAILABLE-FOR-SALE FINANCIAL ASSETSThese financial instruments are non-derivative financial assets and are carried at their fair value, where this can be measured reli ably. If a fair value cannot be determined, they are carried at cost. Changes in fair value between reporting dates are generally recognised in other comprehensive income (revaluation reserve). The reserve is reversed to income either upon disposal or if the fair value falls below cost more than temporarily. If, at a subsequent balance sheet date, the fair value of a debt instrument has increased objectively as a result of events occurring after the impairment loss was recognised, the impairment loss is reversed in the appropriate amount. Impairment losses recognised in respect of equity instru-ments may not be reversed to income. If equity instruments are recognised at fair value, any reversals must be recognised in other comprehensive income. No reversals may be made in the case of equity instruments that were recognised at cost. Available-for-sale financial instruments are allocated to non-current assets unless the intention is to dispose of them within 12 months of the bal-ance sheet date. In particular, investments in unconsolidated sub-sidiaries, marketable securities and other equity investments are reported in this category.
HELD-TO-MATURITY FINANCIAL ASSETSFinancial instruments are assigned to this category if there is an intention to hold the instrument to maturity and the economic conditions for doing so are met. These financial instruments are non-derivative financial assets that are measured at amortised cost using the effective interest method.
LOANS AND RECEIvABLESThese are non-derivative financial assets with fixed or determin-able payments that are not quoted on an active market. Unless held for trading, they are recognised at cost or amortised cost at the balance sheet date. The carrying amounts of money market receiv ables correspond approximately to their fair values due to their short maturity. Loans and receivables are considered current assets if they mature not more than 12 months after the balance sheet date; otherwise, they are recognised as non-current assets. If the recoverability of receivables is in doubt, they are recognised at amortised cost, less appropriate specific or collective valuation allowances. A write-down on trade receivables is recognised if there are objective indications that the amount of the outstanding receivable cannot be collected in full. The write-down is recognised in the income statement via a valuation account.
Deutsche Post DHL Group — 2014 Annual Report
149Consolidated Financial Statements — noTeS — Basis of preparation
FINANCIAL ASSETS AT FAIR vALUE THROUGH PROFIT OR LOSSAll financial instruments held for trading and derivatives that do not satisfy the criteria for hedge accounting are assigned to this cat-egory. They are generally measured at fair value. All changes in fair value are recognised in income. All financial instruments in this category are accounted for at the trade date. Assets in this category are recognised as current assets if they are either held for trading or will likely be realised within 12 months of the balance sheet date.
To avoid variations in earnings resulting from changes in the fair value of derivative financial instruments, hedge accounting is applied where possible and economically useful. Gains and losses from the derivative and the related hedged item are recognised in income simultaneously. Depending on the hedged item and the risk to be hedged, the Group uses fair value hedges and cash flow hedges.
The carrying amounts of financial assets not carried at fair value through profit or loss are tested for impairment at each bal-ance sheet date and whenever there are indications of impairment. The amount of any impairment loss is determined by comparing the carrying amount and the fair value. If there are objective in-dications of impairment, an impairment loss is recognised in the income statement under other operating expenses or net financial income / net finance costs. Impairment losses are reversed if there are objective reasons arising after the balance sheet date indicat-ing that the reasons for impairment no longer exist. The increased carry ing amount resulting from the reversal of the impairment loss may not exceed the carrying amount that would have been deter-mined (net of amortisation or depreciation) if the impairment loss had not been recognised. Impairment losses are recognised within the Group if the debtor is experiencing significant financial diffi-culties, it is highly probable that the debtor will be the subject of bankruptcy proceedings, there are material changes in the issuer’s technological, economic, legal or market environment, or the fair value of a financial instrument falls below its amortised cost for a prolonged period.
A fair value hedge hedges the fair value of recognised assets and liabilities. Changes in the fair value of both the derivatives and the hedged item are recognised in income simultaneously.
A cash flow hedge hedges the fluctuations in future cash flows from recognised assets and liabilities (in the case of interest rate risks), highly probable forecast transactions as well as unrecog-nised firm commitments that entail a currency risk. The effective portion of a cash flow hedge is recognised in the hedging reserve in equity. Ineffective portions resulting from changes in the fair value of the hedging instrument are recognised directly in income. The gains and losses generated by the hedging transactions are initially recognised in equity and are then reclassified to profit or loss in the period in which the asset acquired or liability assumed affects profit or loss. If a hedge of a firm commitment subsequently results in the recognition of a non-financial asset, the gains and losses recognised directly in equity are included in the initial carrying amount of the asset (basis adjustment).
Net investment hedges in foreign entities are treated in the same way as cash flow hedges. The gain or loss from the effective portion of the hedge is recognised in other comprehensive income, whilst the gain or loss attributable to the ineffective portion is rec-ognised directly in income. The gains or losses recognised in other comprehensive income remain there until the disposal or partial disposal of the net investment. Detailed information on hedging transactions can be found in Note 50.2.
Regular way purchases and sales of financial assets are recog-nised at the settlement date, with the exception of held-for-trading instruments, particularly derivatives. A financial asset is derecog-nised if the rights to receive the cash flows from the asset have ex-pired. Upon transfer of a financial asset, a review is made under the requirements of IAS 39 governing disposal as to whether the asset should be derecognised. A disposal gain / loss arises upon disposal. The remeasurement gains / losses recognised in other comprehen-sive income in prior periods must be reversed as at the disposal date. Financial liabilities are derecognised if the payment obliga-tions arising from them have expired.
Investment property
In accordance with IAS 40, investment property is property held to earn rentals or for capital appreciation or both, rather than for use in the supply of services, for administrative purposes, or for sale in the normal course of the company’s business. It is meas-ured in accordance with the cost model. Depreciable investment property is depreciated over a period of between 20 and 50 years using the straight-line method. The fair value is determined on the basis of expert opinions. Impairment losses are recognised in accordance with the principles described under the section headed Impairment.
Deutsche Post DHL Group — 2014 Annual Report
150
Inventories
Inventories are assets that are held for sale in the ordinary course of business, are in the process of production, or are consumed in the production process or in the rendering of services. They are meas-ured at the lower of cost or net realisable value. Valuation allow-ances are charged for obsolete inventories and slow-moving goods.
Government grants
In accordance with IAS 20, government grants are recognised at their fair value only when there is reasonable assurance that the conditions attaching to them will be complied with and that the grants will be received. The grants are reported in the income statement and are generally recognised as income over the periods in which the costs they are intended to compensate are incurred. Where the grants relate to the purchase or production of assets, they are reported as deferred income and recognised in the income statement over the useful lives of the assets.
assets held for sale and liabilities associated with assets held for sale
Assets held for sale are assets available for sale in their present con-dition and whose sale is highly probable. The sale must be expected to qualify for recognition as a completed sale within one year of the date of classification. Assets held for sale may consist of individual non-current assets, groups of assets (disposal groups), components of an entity or a subsidiary acquired exclusively for resale (discon-tinued operations). Liabilities intended to be disposed of together with the assets in a single transaction form part of the disposal group or discontinued operation and are also reported separately as liabilities associated with assets held for sale. Assets held for sale are no longer depreciated or amortised, but are recognised at the lower of their fair value less costs to sell and the carrying amount. Gains and losses arising from the remeasurement of individual non-current assets or disposal groups classified as held for sale are reported in profit or loss from continuing operations until the final date of disposal. Gains and losses arising from the measurement at fair value less costs to sell of discontinued operations classified as held for sale are reported in profit or loss from discontinued oper-ations. This also applies to the profit or loss from operations and the gain or loss on disposal of these components of an entity.
Cash and cash equivalents
Cash and cash equivalents comprise cash, demand deposits and other short-term liquid financial assets with an original maturity of up to three months and are carried at their principal amount. Overdraft facilities used are recognised in the balance sheet as amounts due to banks.
non-controlling interests
Non-controlling interests are the proportionate minority interests in the equity of subsidiaries and are recognised at their carrying amount. If an interest is acquired from, or sold to, other share-holders without this impacting the existing control relationship, this is presented as an equity transaction. The difference between the proportionate net assets acquired from, or sold to, another shareholder / other shareholders and the purchase price is recog-nised in other comprehensive income. If non-controlling interests are increased by the proportionate net assets, no goodwill is allo-cated to the proportionate net assets.
Share-based payments to executives
Equity-settled share-based payment transactions are measured at fair value at the grant date. The fair value of the obligation is recognised in staff costs over the vesting period. The fair value of equity- settled share-based payment transactions is determined using inter nationally recognised valuation techniques.
Stock appreciation rights are measured on the basis of an option pricing model in accordance with IFRS 2. The stock appre-ciation rights are measured on each reporting date and on the settle-ment date. The amount determined for stock appre ciation rights that will probably be exercised is recognised pro rata in income under staff costs to reflect the services rendered as consideration during the vesting period (lock-up period). A provision is recog-nised for the same amount.
retirement plans
There are arrangements in many countries under which the Group grants post-employment benefits to its employees. These benefits include pensions, lump-sum payments on retirement and other post-employment benefits and are referred to as retirement bene-fits, pensions and similar benefits, or simply pensions, in these disclosures. A distinction must be made between defined benefit and defined contribution plans.
Deutsche Post DHL Group — 2014 Annual Report
151Consolidated Financial Statements — noTeS — Basis of preparation
THE GROUP’S DEFINED BENEFIT RETIREMENT PLANSDefined benefit obligations are measured using the projected unit credit method prescribed by IAS 19. This involves making certain actuarial assumptions. Most of the defined benefit retirement plans are at least partly funded via external plan assets. The remaining net obligations are funded by provisions for pensions and similar obligations; net assets are presented separately as pension assets. Where necessary, an asset ceiling must be applied when recognis-ing pension assets. With regard to the cost components, the service cost is recognised in staff costs, the net interest cost in net financial income /net finance costs and any remeasurement outside profit and loss in other comprehensive income.
DEFINED CONTRIBUTION RETIREMENT PLANS FOR CIvIL SERvANT EMPLOYEES IN GERMANYIn accordance with statutory provisions, Deutsche Post AG pays contributions to retirement plans in Germany which are defined contribution retirement plans for the company. These contribu-tions are recognised in staff costs.
Under the provisions of the Gesetz zum Personalrecht der Beschäftigten der früheren Deutschen Bundespost (PostPersRG – Former Deutsche Bundespost Employees Act), introduced as article 4 of the Gesetz zur Neuordnung des Postwesens und der Tele-kommunikation (PTNeuOG – German Posts and Telecommunica-tions Reorganisation Act), Deutsche Post AG provides benefit and assistance payments through the Bundes-Pensions-Service für Post und Telekommunikation e. V. (BPS-PT), a special pension fund for postal civil servants operated jointly, since early 2001, by the Deutsche Bundespost successor companies, to retired employees or their surviving dependants who are entitled to benefits on the basis of a civil service appointment. At the beginning of 2013, Bundes-anstalt für Post und Telekommunikation ( BAnstPT – Federal Posts and Telecommunications Agency) assumed the rights and obliga-tions of the BPS-PT. It has undertaken the tasks of the pension fund for postal civil servants since that time. The amount of Deutsche Post AG’s payment obligations is governed by section 16 of the Post-PersRG. Since 2000, this Act has obliged Deutsche Post AG to pay into the postal civil servant pension fund an annual contribution of 33 % of the gross compensation of its active civil servants and the notional gross compensation of civil servants on leave of absence who are eligible for a pension.
Under section 16 of the PostPersRG, the federal government makes good the difference between the current payment obliga-tions of the postal civil servant pension fund on the one hand, and the funding companies’ current contributions or other return on assets on the other, and guarantees that the postal civil ser vant pension fund is able at all times to meet the obligations it has assumed in respect of its funding companies. Insofar as the federal government makes payments to the postal civil servant pension fund under the terms of this guarantee, it cannot claim reimburse-ment from Deutsche Post AG.
DEFINED CONTRIBUTION RETIREMENT PLANS FOR THE GROUP’S HOURLY WORKERS AND SALARIED EMPLOYEESContributions to defined contribution retirement plans for the Group’s hourly workers and salaried employees are also reported under staff costs.
This also includes contributions to certain multi-employer plans which are basically defined benefit plans, especially in the USA and the Netherlands. However, the relevant institutions do not provide the participating companies with sufficient information to use defined benefit accounting. The plans are therefore accounted for as if they were defined contribution plans.
Regarding these multi-employer plans in the USA, contribu-tions are made based on collective bargaining agreements between the employer and the local union. There is no employer liability to any of the plans beyond the normal bargained contribution rates except in the event of a withdrawal meeting specified criteria or in the event of liability for other entities' obligations as governed by US federal law. The expected employer contributions to the funds for 2015 are €26 million (actual employer contributions in the reporting year: €25 million, in the previous year: €23 million). Some of the plans in which Deutsche Post DHL Group participates are underfunded according to information provided by the funds. There is no information from the plans that would indicate any change from the contribution rates set by current collective bar-gaining agreements. Currently, Deutsche Post DHL Group does not represent a significant level to any fund in terms of contributions, with the exception of one fund where the Group represents the largest employer in terms of contributions.
Regarding one multi-employer plan in the Netherlands, cost coverage-based contribution rates are set annually by the board of the pension fund with the involvement of the Central Bank of the Netherlands, and these rates are equal for all participating employers and employees. There is no liability for the employer towards the fund beyond the contributions set, even in the case of withdrawal or obligations not met by other entities. Any sub-sequent underfunding ultimately results in the rights of mem-bers being cut and /or no indexation of their rights. The expected employer contributions to the funds for 2015 are €21 million (actual employer contributions in the reporting year: €21 mil-lion, in the previous year: €21 million). Currently, the plan is not underfunded according to information provided by the fund. Deutsche Post DHL Group does not represent a significant portion of the fund in terms of contributions.
Deutsche Post DHL Group — 2014 Annual Report
152
other provisions
Other provisions are recognised for all legal or constructive obli-gations to third parties existing at the balance sheet date that have arisen as a result of past events, that are expected to result in an outflow of future economic benefits and whose amount can be measured reliably. They represent uncertain obligations that are carried at the best estimate of the expenditure required to settle the obligation. Provisions with more than one year to maturity are discounted at market rates of interest that reflect the region and time to settlement of the obligation. The discount rates used in the financial year were between 0 % and 12 % (previous year: 0.25 % and 11 %). The effects arising from changes in interest rates are recog-nised in net financial income / net finance cost.
Provisions for restructurings are only established in accord-ance with the aforementioned criteria for recognition if a detailed, formal restructuring plan has been drawn up and communicated to those affected.
The technical reserves (insurance) consist mainly of outstand-ing loss reserves and IBNR (incurred but not reported claims) re-serves. Outstanding loss reserves represent estimates of obligations in respect of actual claims or known incidents expected to give rise to claims, which have been reported to the company but which have yet to be finalised and presented for payment. Outstanding loss reserves are based on individual claim valuations carried out by the company or its ceding insurers. IBNR reserves represent estimates of obligations in respect of incidents taking place on or before the balance sheet date that have not been reported to the company. Such reserves also include provisions for potential errors in settling outstanding loss reserves. The company carries out its own assessment of ultimate loss liabilities using actuarial methods and also commissions an independent actuarial study of these each year in order to verify the reasonableness of its estimates.
Financial liabilities
On initial recognition, financial liabilities are carried at fair value less transaction costs. The price determined on a price-efficient and liquid market or a fair value determined using the treasury risk management system deployed within the Group is taken as the fair value. In subsequent periods the financial liabilities are measured at amortised cost. Any differences between the amount received and the amount repayable are recognised in income over the term of the loan using the effective interest method.
CONvERTIBLE BOND ON DEUTSCHE POST AG SHARESThe convertible bond on Deutsche Post AG shares is split into an equity and a debt component, in line with the contractual arrange-ments. The debt component, less the transaction costs, is reported under financial liabilities (bonds), with interest added up to the issue amount over the term of the bond using the effective inter-est method (unwinding of discount). The value of the call option, which allows Deutsche Post AG to redeem the bond early if a speci-fied share price is reached, is attributed to the debt component in accordance with IAS 32.31. The conversion right is classified as an equity derivative and is reported in capital reserves. The carry-ing amount is calculated by assigning to the conversion right the residual value that results from deducting the amount calculated separately for the debt component from the fair value of the in-strument as a whole. The transaction costs are deducted on a pro-portionate basis.
Liabilities
Trade payables and other liabilities are carried at amortised cost. The fair value of the liabilities corresponds more or less to their carrying amount.
Deferred taxes
In accordance with IAS 12, deferred taxes are recognised for tem-porary differences between the carrying amounts in the IFRS finan cial statements and the tax accounts of the individual entities. Deferred tax assets also include tax reduction claims which arise from the expected future utilisation of existing tax loss carry-forwards and which are likely to be realised. The recoverability of the tax reduction claims is assessed on the basis of each entity’s earnings projections which are derived from the Group projections and take any tax adjustments into account. The planning horizon is five years.
In compliance with IAS 12.24 (b) and IAS 12.15 (b), deferred tax assets or liabilities were only recognised for temporary differ-ences between the carrying amounts in the IFRS financial state-ments and in the tax accounts of Deutsche Post AG where the differences arose after 1 January 1995. No deferred tax assets or liabilities are recognised for temporary differences resulting from initial differences in the opening tax accounts of Deutsche Post AG as at 1 January 1995. Further details on deferred taxes from tax loss carryforwards can be found in Note 30.
In accordance with IAS 12, deferred tax assets and liabil-ities are calculated using the tax rates applicable in the individual countries at the balance sheet date or announced for the time when the deferred tax assets and liabilities are realised. The tax rate applied to German Group companies was raised by 0.4 % to 30.2 %, based on an improved estimate in the trade tax area. It comprises the corporation tax rate plus the solidarity surcharge, as well as a municipal trade tax rate that is calculated as the average of the different municipal trade tax rates. Foreign Group companies use their individual income tax rates to calculate deferred tax items. The income tax rates applied for foreign companies amount to up to 40 % (previous year: 38 %).
Deutsche Post DHL Group — 2014 Annual Report
153Consolidated Financial Statements — noTeS — Basis of preparation
Income taxes
Income tax assets and liabilities are measured at the amounts for which repayments from or payments to the tax authorities are expected to be received or made. Tax-related fines are recognised in income taxes if they are included in the calculation of income tax liabilities, due to their inclusion in the tax base and /or tax rate.
Contingent liabilities
Contingent liabilities represent possible obligations whose exist-ence will be confirmed only by the occurrence or non-occurrence of one or more uncertain future events not wholly within the con-trol of the enterprise. Contingent liabilities also include certain obligations that will probably not lead to an outflow of resources embodying economic benefits, or where the amount of the outflow of resources embodying economic benefits cannot be measured with sufficient reliability. In accordance with IAS 37, contingent li-abilities are not recognised as liabilities; Note 51.
8 exercise of judgement in applying the accounting policies
The preparation of IFRS-compliant consolidated financial state-ments requires the exercise of judgement by management. All esti-mates are reassessed on an ongoing basis and are based on histor-ical experience and expectations with regard to future events that appear reasonable under the given circumstances. For example, this applies to assets held for sale. In this case, it must be determined whether the assets are available for sale in their present condition and whether their sale is highly probable. If this is the case, the assets and the associated liabilities are reported and measured as assets held for sale and liabilities associated with assets held for sale.
estimates and assessments made by management
The preparation of the consolidated financial statements in accord-ance with IFRS s requires management to make certain assump-tions and estimates that may affect the amounts of the assets and liabilities included in the balance sheet, the amounts of income and expenses, and the disclosures relating to contingent liabilities. Examples of the main areas where assumptions, estimates and the exercise of management judgement occur are the recognition of provisions for pensions and similar obligations, the calculation of discounted cash flows for impairment testing and purchase price allocations, taxes and legal proceedings.
Disclosures regarding the assumptions made in connection with the Group’s defined benefit retirement plans can be found in
Note 44.
The Group has operating activities around the globe and is subject to local tax laws. Management can exercise judgement when calculating the amounts of current and deferred taxes in the relevant countries. Although management believes that it has made a reasonable estimate relating to tax matters that are inherently un-certain, there can be no guarantee that the actual outcome of these uncertain tax matters will correspond exactly to the original esti-mate made. Any difference between actual events and the estimate made could have an effect on tax liabilities and deferred taxes in the period in which the matter is finally decided. The amount rec-ognised for deferred tax assets could be reduced if the estimates of planned taxable income or the tax benefits achievable as a result of tax planning strategies are revised downwards, or in the event that changes to current tax laws restrict the extent to which future tax benefits can be realised.
Goodwill is regularly reported in the Group’s balance sheet as a consequence of business combinations. When an acquisition is initially recognised in the consolidated financial statements, all identifiable assets, liabilities and contingent liabilities are meas-ured at their fair values at the date of acquisition. One of the most important estimates this requires is the determination of the fair values of these assets and liabilities at the date of acquisition. Land, buildings and office equipment are generally valued by independ-ent experts, whilst securities for which there is an active market are recognised at the quoted exchange price. If intangible assets are identified in the course of an acquisition, their measurement can be based on the opinion of an independent external expert valuer, depending on the type of intangible asset and the complex-ity involved in determining its fair value. The independent expert determines the fair value using appropriate valuation techniques, normally based on expected future cash flows. In addition to the assumptions about the development of future cash flows, these valuations are also significantly affected by the discount rates used.
Impairment testing for goodwill is based on assumptions with respect to the future. The Group carries out these tests annually and also whenever there are indications that goodwill has become impaired. The recoverable amount of the CGU must then be calculated. This amount is the higher of fair value less costs to sell and value in use. Determining value in use requires adjust-ments and estimates to be made with respect to forecasted future cash flows and the discount rate applied. Although management believes that the assumptions made for the purpose of calculating the recoverable amount are appropriate, possible unforeseeable changes in these assumptions – e.g., a reduction in the EBIT mar-gin, an increase in the cost of capital or a decline in the long-term growth rate – could result in an impairment loss that could neg-atively affect the Group’s net assets, financial position and results of operations.
Deutsche Post DHL Group — 2014 Annual Report
154
Pending legal proceedings in which the Group is involved are disclosed in Note 53. The outcome of these proceedings could have a significant effect on the net assets, financial position and results of operations of the Group. Management regularly analyses the information currently available about these proceedings and recognises provisions for probable obligations including estimated legal costs. Internal and external legal advisers participate in mak-ing this assessment. In deciding on the necessity for a provision, management takes into account the probability of an unfavourable outcome and whether the amount of the obligation can be esti-mated with sufficient reliability. The fact that an action has been launched or a claim asserted against the Group, or that a legal dis-pute has been disclosed in the Notes, does not necessarily mean that a provision is recognised for the associated risk.
All assumptions and estimates are based on the circum-stances prevailing and assessments made at the balance sheet date. For the purpose of estimating the future development of the business, a realistic assessment was also made at that date of the economic environ ment likely to apply in the future to the different sectors and regions in which the Group operates. In the event of developments in this general environment that diverge from the assumptions made, the actual amounts may differ from the esti-mated amounts. In such cases, the assumptions made and, where necessary, the carrying amounts of the relevant assets and liabil-ities are adjusted accordingly.
At the date of preparation of the consolidated financial state-ments, there is no indication that any significant change in the assumptions and estimates made will be required, so that on the basis of the information currently available it is not expected that there will be significant adjustments in financial year 2015 to the carrying amounts of the assets and liabilities recognised in the finan cial statements.
9 Consolidation methods
The consolidated financial statements are based on the IFRS finan cial statements of Deutsche Post AG and the subsidiaries, joint operations and investments accounted for using the equity method included in the consolidated financial statements and prepared in accordance with uniform accounting policies as at 31 December 2014.
Acquisition accounting for subsidiaries included in the consolidated financial statements uses the purchase method of accounting. The cost of the acquisition corresponds to the fair value of the assets given up, the equity instruments issued and the liabilities assumed at the transaction date. Acquisition-related costs are recognised as expenses. Contingent consideration is rec-ognised at fair value at the date of initial consolidation.
The assets and liabilities, as well as income and expenses, of joint operations are included in the consolidated financial state-ments in proportion to the interest held in these operations, in accordance with IFRS 11. Accounting for the joint operators’ share of the assets and liabilities, as well as recognition and measurement of goodwill, use the same methods as applied to the consolidation of subsidiaries.
In accordance with IAS 28, joint ventures and companies on which the parent can exercise significant influence (associates) are accounted for in accordance with the equity method using the purchase method of accounting. Any goodwill is recognised under invest ments accounted for using the equity method.
In the case of step acquisitions, the equity portion previ-ously held is remeasured at the fair value applicable on the date of acquisition and the resulting gain or loss recognised in profit or loss.
Intra-group revenue, other operating income, and expenses as well as receivables, liabilities and provisions between companies that are consolidated fully or on a proportionate basis are elimin-ated. Intercompany profits or losses from intra-group deliveries and services not realised by sale to third parties are eliminated. Unrealised gains and losses from business transactions with invest-ments accounted for using the equity method are eliminated on a proportionate basis.
Deutsche Post DHL Group — 2014 Annual Report
155Consolidated Financial Statements — noTeS — Basis of preparation
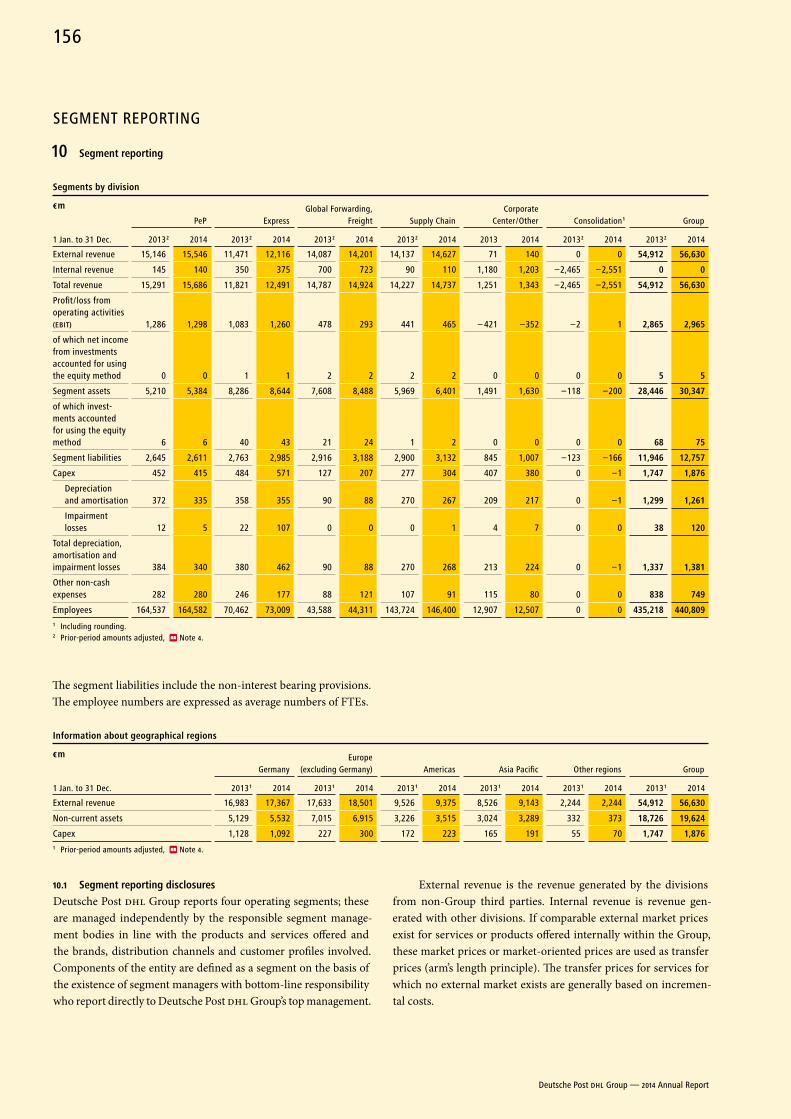
SEGMENT REPORTING
10 Segment reporting
Segments by division
€ m
PeP Express Global Forwarding,
Freight Supply ChainCorporate
Center / Other Consolidation 1 Group
1 Jan. to 31 Dec. 2013 2 2014 2013 2 2014 2013 2 2014 2013 2 2014 2013 2014 2013 2 2014 2013 2 2014
External revenue 15,146 15,546 11,471 12,116 14,087 14,201 14,137 14,627 71 140 0 0 54,912 56,630
Internal revenue 145 140 350 375 700 723 90 110 1,180 1,203 –2,465 –2,551 0 0
Total revenue 15,291 15,686 11,821 12,491 14,787 14,924 14,227 14,737 1,251 1,343 –2,465 –2,551 54,912 56,630
Profit / loss from operating activities (EBIT) 1,286 1,298 1,083 1,260 478 293 441 465 – 421 –352 –2 1 2,865 2,965
of which net income from investments accounted for using the equity method 0 0 1 1 2 2 2 2 0 0 0 0 5 5
Segment assets 5,210 5,384 8,286 8,644 7,608 8,488 5,969 6,401 1,491 1,630 –118 –200 28,446 30,347
of which invest-ments accounted for using the equity method 6 6 40 43 21 24 1 2 0 0 0 0 68 75
Segment liabilities 2,645 2,611 2,763 2,985 2,916 3,188 2,900 3,132 845 1,007 –123 –166 11,946 12,757
Capex 452 415 484 571 127 207 277 304 407 380 0 –1 1,747 1,876
Depreciation and amortisation 372 335 358 355 90 88 270 267 209 217 0 –1 1,299 1,261
Impairment losses 12 5 22 107 0 0 0 1 4 7 0 0 38 120
Total depreciation, amortisation and impairment losses 384 340 380 462 90 88 270 268 213 224 0 –1 1,337 1,381
Other non-cash expenses 282 280 246 177 88 121 107 91 115 80 0 0 838 749
Employees 164,537 164,582 70,462 73,009 43,588 44,311 143,724 146,400 12,907 12,507 0 0 435,218 440,8091 Including rounding. 2 Prior-period amounts adjusted, Note 4.
The segment liabilities include the non-interest bearing provisions. The employee numbers are expressed as average numbers of FTEs.
Information about geographical regions
€ m
GermanyEurope
(excluding Germany) Americas Asia Pacific Other regions Group
1 Jan. to 31 Dec. 2013 1 2014 2013 1 2014 2013 1 2014 2013 1 2014 2013 1 2014 2013 1 2014
External revenue 16,983 17,367 17,633 18,501 9,526 9,375 8,526 9,143 2,244 2,244 54,912 56,630
Non-current assets 5,129 5,532 7,015 6,915 3,226 3,515 3,024 3,289 332 373 18,726 19,624
Capex 1,128 1,092 227 300 172 223 165 191 55 70 1,747 1,8761 Prior-period amounts adjusted, Note 4.
10.1 Segment reporting disclosures
Deutsche Post DHL Group reports four operating segments; these are managed independently by the responsible segment manage-ment bodies in line with the products and services offered and the brands, distribution channels and customer profiles involved. Components of the entity are defined as a segment on the basis of the existence of segment managers with bottom-line responsibility who report directly to Deutsche Post DHL Group’s top management.
External revenue is the revenue generated by the divisions from non-Group third parties. Internal revenue is revenue gen-erated with other divisions. If comparable external market prices exist for services or products offered internally within the Group, these market prices or market-oriented prices are used as transfer prices (arm’s length principle). The transfer prices for services for which no external market exists are generally based on incremen-tal costs.
Deutsche Post DHL Group — 2014 Annual Report
156
The expenses for IT services provided in the IT service centres are allocated to the divisions by their origin. The additional costs resulting from Deutsche Post AG’s universal postal service obliga-tion (nationwide retail outlet network, delivery every working day), and from its obligation to assume the compensation structure as the legal successor to Deutsche Bundespost, are allocated to the PeP division.
As part of the central management of currency risk, fluctu-ations between projected and actual exchange rates are fully or partially absorbed centrally by Corporate Treasury on the basis of division-specific agreements.
In keeping with internal reporting, capital expenditure (capex) is disclosed. Additions to intangible assets net of goodwill and to property, plant and equipment are reported in the capex figure. Depreciation, amortisation and impairment losses relate to the segment assets allocated to the individual divisions. Other non-cash expenses relate primarily to expenses from the recognition of provisions.
The profitability of the Group’s operating areas is measured as profit from operating activities (EBIT).
ADjUSTMENT OF PRIOR-PERIOD AMOUNTSPrior-period amounts were adjusted due to the initial application of IFRS 10 and IFRS 11 ( Note 4) and the reallocation of companies between the segments in the first and second quarters of 2014. The domestic parcel business in Belgium, the Czech Republic, India, the Netherlands and Poland was consolidated in the PeP division effective 1 January 2014. This business was previously part of the Express and Global Forwarding, Freight divisions. In addition, the US company Sky Courier Inc. was reallocated from the Express div-ision to the Global Forwarding, Freight division. The prior-period amounts have been adjusted accordingly.
Reflecting the Group’s predominant organisational structure, the primary reporting format is based on the divisions. The Group distinguishes between the following divisions:
10.2 Segments by division
Post - eCommerce - Parcel
The Mail division was renamed Post - eCommerce - Parcel (PeP) as part of the Group’s ongoing strategic development. The Post - eCommerce - Parcel division handles both domestic and inter-national mail and is a specialist in dialogue marketing, nationwide press distribution services and all the electronic services associated with mail delivery. In addition to Germany, it also offers domes-tic parcel services in other markets. It is divided into two business units: Post, and eCommerce - Parcel.
EXPRESS
The Express division offers time-definite courier and express ser-vices to business and private customers. The division comprises the Express Europe, Express Americas, Express Asia Pacific and Express MEA (Middle East and Africa) business units.
GLOBAL FORWARDING, FREIGHT
The activities of the Global Forwarding, Freight division comprise the transportation of goods by rail, road, air and sea. The division’s business units are Global Forwarding and Freight.
SUPPLY CHAIN
The Supply Chain division delivers customised logistics solutions to its customers based on globally standardised modular compo-nents including warehousing, transport and value-added services. In addition, it offers specialised Business Process Outsourcing (BPO) and marketing communications solutions tailored to cus-tomers’ needs. The division’s business units are Supply Chain and Williams Lea.
In addition to the reportable segments given above, segment re-porting comprises the following categories:
Corporate Center / other
Corporate Center / Other comprises Global Business Services (GBS), the Corporate Center, non-operating activities and other busi-ness activities. The profit / loss generated by GBS is allocated to the operating segments, whilst its assets and liabilities remain with GBS (asymmetrical allocation).
Consolidation
The data for the divisions are presented following consolidation of interdivisional transactions. The transactions between the div-isions are eliminated in the Consolidation column.
10.3 Information about geographical regions
The main geographical regions in which the Group is active are Germany, Europe, the Americas, Asia Pacific and Other regions. External revenue, non-current assets and capex are disclosed for these regions. Revenue, assets and capex are allocated to the indi-vidual regions on the basis of the domicile of the reporting entity. Non-current assets primarily comprise intangible assets, property, plant and equipment and other non-current assets.
Deutsche Post DHL Group — 2014 Annual Report
157Consolidated Financial Statements — noTeS — Segment reporting
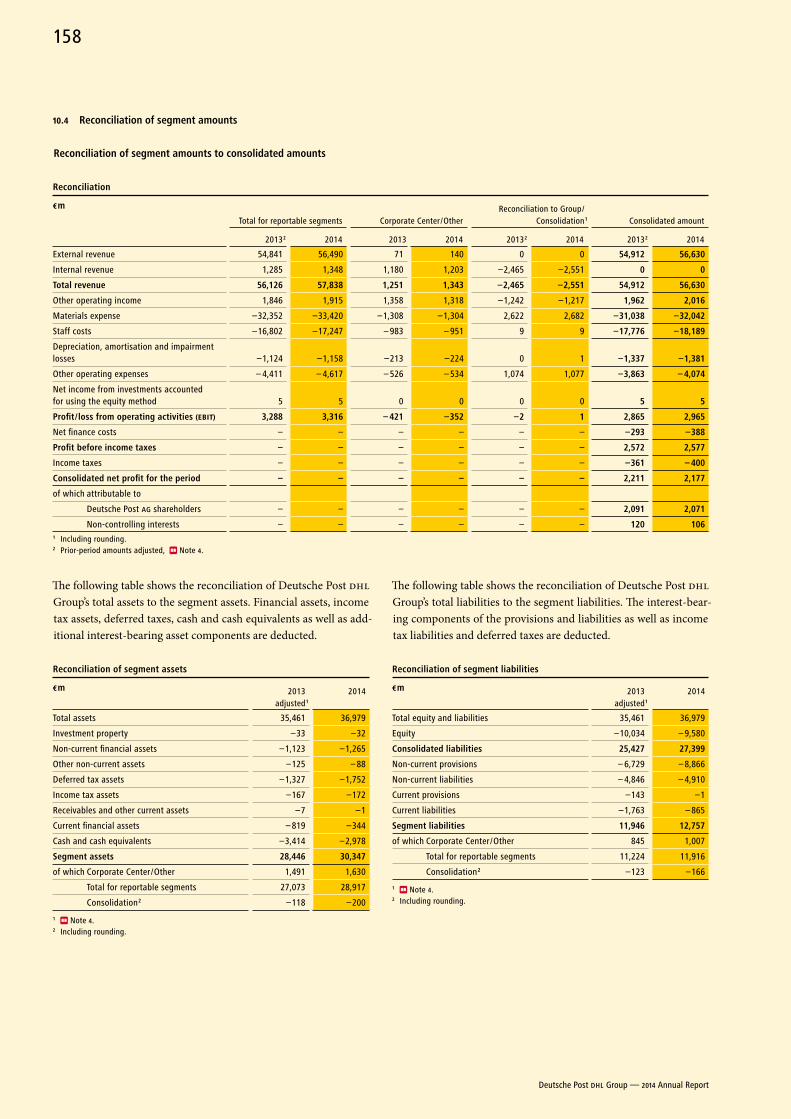
10.4 reconciliation of segment amounts
reconciliation of segment amounts to consolidated amounts
reconciliation
€ m
Total for reportable segments Corporate Center / OtherReconciliation to Group /
Consolidation 1 Consolidated amount
2013 2 2014 2013 2014 2013 2 2014 2013 2 2014
External revenue 54,841 56,490 71 140 0 0 54,912 56,630
Internal revenue 1,285 1,348 1,180 1,203 –2,465 –2,551 0 0
Total revenue 56,126 57,838 1,251 1,343 –2,465 –2,551 54,912 56,630
Other operating income 1,846 1,915 1,358 1,318 –1,242 –1,217 1,962 2,016
Materials expense –32,352 –33,420 –1,308 –1,304 2,622 2,682 –31,038 –32,042
Staff costs –16,802 –17,247 – 983 – 951 9 9 –17,776 –18,189
Depreciation, amortisation and impairment losses –1,124 –1,158 –213 –224 0 1 –1,337 –1,381
Other operating expenses – 4,411 – 4,617 – 526 – 534 1,074 1,077 –3,863 – 4,074
Net income from investments accounted for using the equity method 5 5 0 0 0 0 5 5
Profit / loss from operating activities (EBIT) 3,288 3,316 – 421 –352 –2 1 2,865 2,965
Net finance costs – – – – – – –293 –388
Profit before income taxes – – – – – – 2,572 2,577
Income taxes – – – – – – –361 – 400
Consolidated net profit for the period – – – – – – 2,211 2,177
of which attributable to
Deutsche Post AG shareholders – – – – – – 2,091 2,071
Non-controlling interests – – – – – – 120 1061 Including rounding.2 Prior-period amounts adjusted, Note 4.
The following table shows the reconciliation of Deutsche Post DHL Group’s total assets to the segment assets. Financial assets, income tax assets, deferred taxes, cash and cash equivalents as well as add-itional interest-bearing asset components are deducted.
reconciliation of segment assets
€ m 2013 adjusted 1
2014
Total assets 35,461 36,979
Investment property –33 –32
Non-current financial assets –1,123 –1,265
Other non-current assets –125 – 88
Deferred tax assets –1,327 –1,752
Income tax assets –167 –172
Receivables and other current assets –7 –1
Current financial assets – 819 –344
Cash and cash equivalents –3,414 –2,978
Segment assets 28,446 30,347
of which Corporate Center / Other 1,491 1,630
Total for reportable segments 27,073 28,917
Consolidation 2 –118 –200
1 Note 4.2 Including rounding.
The following table shows the reconciliation of Deutsche Post DHL Group’s total liabilities to the segment liabilities. The interest-bear-ing components of the provisions and liabilities as well as income tax liabilities and deferred taxes are deducted.
reconciliation of segment liabilities
€ m 2013 adjusted 1
2014
Total equity and liabilities 35,461 36,979
Equity –10,034 – 9,580
Consolidated liabilities 25,427 27,399
Non-current provisions – 6,729 – 8,866
Non-current liabilities – 4,846 – 4,910
Current provisions –143 –1
Current liabilities –1,763 – 865
Segment liabilities 11,946 12,757
of which Corporate Center / Other 845 1,007
Total for reportable segments 11,224 11,916
Consolidation 2 –123 –166
1 Note 4.2 Including rounding.
Deutsche Post DHL Group — 2014 Annual Report
158
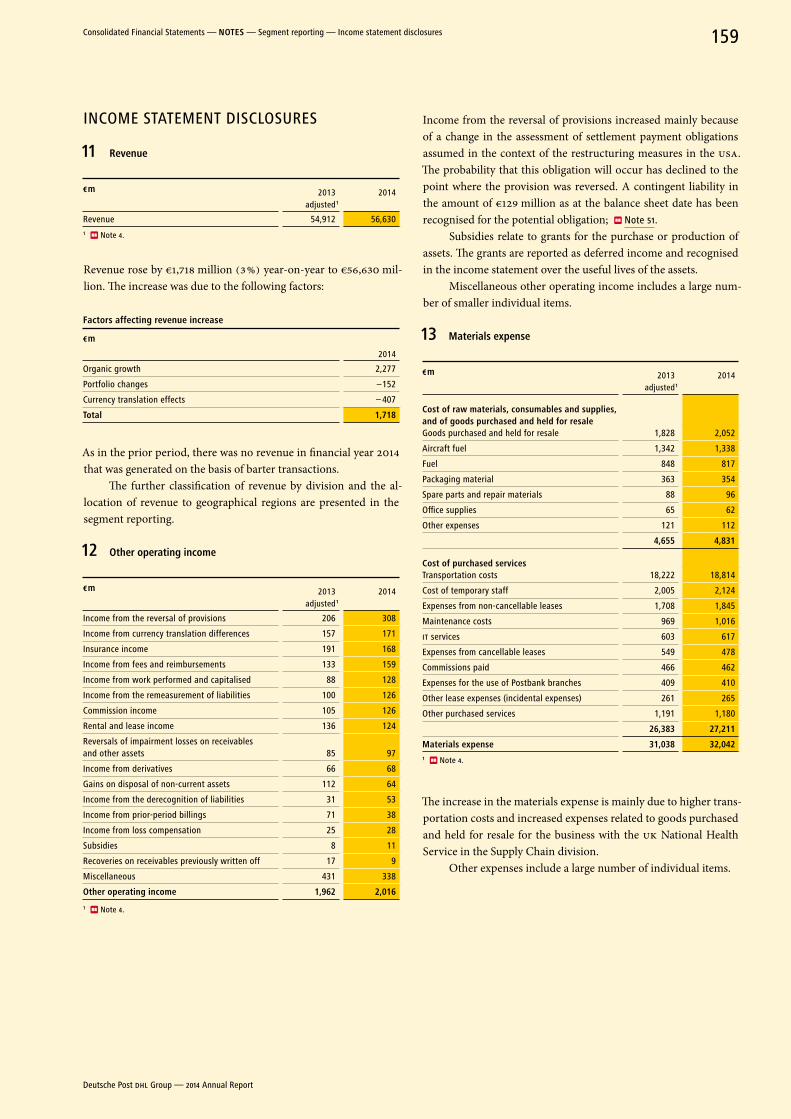
INCOME STATEMENT DISCLOSURES
11 revenue
€ m 2013 adjusted 1
2014
Revenue 54,912 56,6301 Note 4.
Revenue rose by €1,718 million (3 %) year-on-year to €56,630 mil-lion. The increase was due to the following factors:
Factors affecting revenue increase
€ m
2014
Organic growth 2,277
Portfolio changes –152
Currency translation effects – 407
Total 1,718
As in the prior period, there was no revenue in financial year 2014 that was generated on the basis of barter transactions.
The further classification of revenue by division and the al-location of revenue to geographical regions are presented in the segment reporting.
12 other operating income
€ m 2013 adjusted 1
2014
Income from the reversal of provisions 206 308
Income from currency translation differences 157 171
Insurance income 191 168
Income from fees and reimbursements 133 159
Income from work performed and capitalised 88 128
Income from the remeasurement of liabilities 100 126
Commission income 105 126
Rental and lease income 136 124
Reversals of impairment losses on receivables and other assets 85 97
Income from derivatives 66 68
Gains on disposal of non-current assets 112 64
Income from the derecognition of liabilities 31 53
Income from prior-period billings 71 38
Income from loss compensation 25 28
Subsidies 8 11
Recoveries on receivables previously written off 17 9
Miscellaneous 431 338
other operating income 1,962 2,016
1 Note 4.
Income from the reversal of provisions increased mainly because of a change in the assessment of settlement payment obligations assumed in the context of the restructuring measures in the USA. The probability that this obligation will occur has declined to the point where the provision was reversed. A contingent liability in the amount of €129 million as at the balance sheet date has been recognised for the potential obligation; Note 51.
Subsidies relate to grants for the purchase or production of assets. The grants are reported as deferred income and recognised in the income statement over the useful lives of the assets.
Miscellaneous other operating income includes a large num-ber of smaller individual items.
13 Materials expense
€ m 2013 adjusted 1
2014
Cost of raw materials, consumables and supplies, and of goods purchased and held for resaleGoods purchased and held for resale 1,828 2,052
Aircraft fuel 1,342 1,338
Fuel 848 817
Packaging material 363 354
Spare parts and repair materials 88 96
Office supplies 65 62
Other expenses 121 112
4,655 4,831
Cost of purchased servicesTransportation costs 18,222 18,814
Cost of temporary staff 2,005 2,124
Expenses from non-cancellable leases 1,708 1,845
Maintenance costs 969 1,016
IT services 603 617
Expenses from cancellable leases 549 478
Commissions paid 466 462
Expenses for the use of Postbank branches 409 410
Other lease expenses (incidental expenses) 261 265
Other purchased services 1,191 1,180
26,383 27,211
Materials expense 31,038 32,0421 Note 4.
The increase in the materials expense is mainly due to higher trans-portation costs and increased expenses related to goods purchased and held for resale for the business with the UK National Health Service in the Supply Chain division.
Other expenses include a large number of individual items.
Deutsche Post DHL Group — 2014 Annual Report
159Consolidated Financial Statements — noTeS — Segment reporting — Income statement disclosures
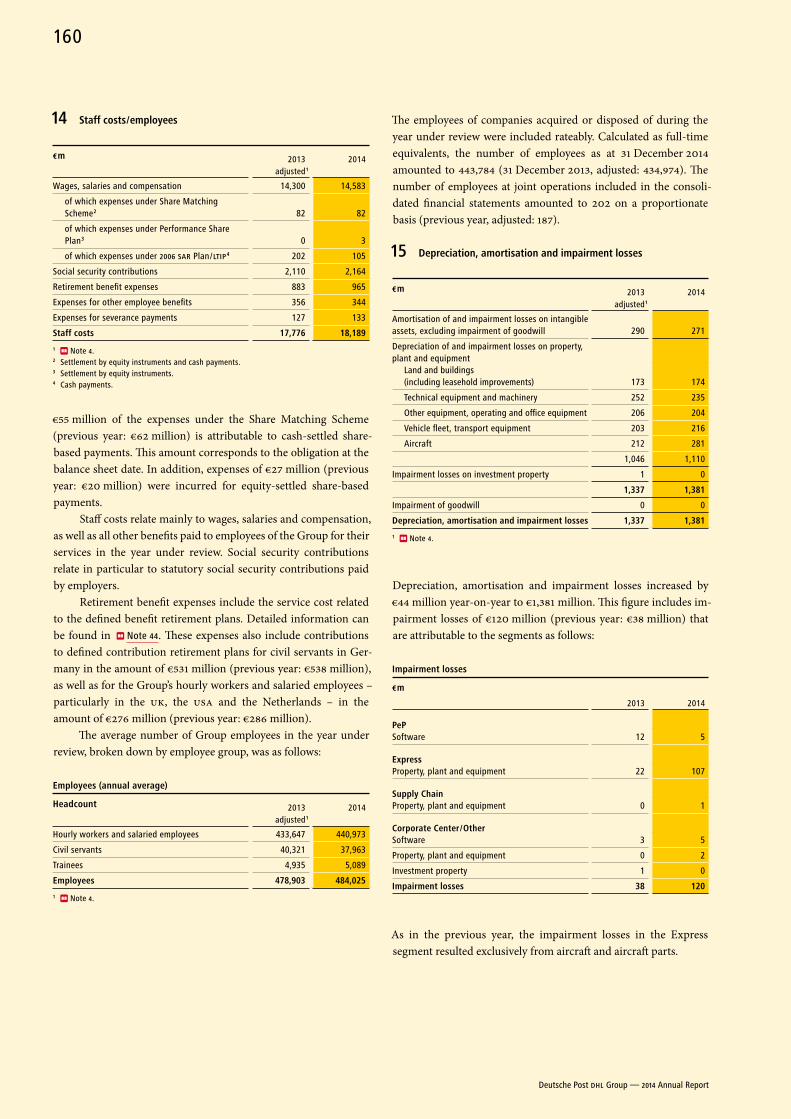
14 Staff costs / employees
€ m 2013 adjusted 1
2014
Wages, salaries and compensation 14,300 14,583
of which expenses under Share Matching Scheme 2 82 82
of which expenses under Performance Share Plan 3 0 3
of which expenses under 2006 SAR Plan / LTIP 4 202 105
Social security contributions 2,110 2,164
Retirement benefit expenses 883 965
Expenses for other employee benefits 356 344
Expenses for severance payments 127 133
Staff costs 17,776 18,189
1 Note 4. 2 Settlement by equity instruments and cash payments.3 Settlement by equity instruments.4 Cash payments.
€55 million of the expenses under the Share Matching Scheme (previous year: €62 million) is attributable to cash-settled share-based payments. This amount corresponds to the obligation at the balance sheet date. In addition, expenses of €27 million (previous year: €20 million) were incurred for equity-settled share-based payments.
Staff costs relate mainly to wages, salaries and compensation, as well as all other benefits paid to employees of the Group for their services in the year under review. Social security contributions relate in particular to statutory social security contributions paid by employers.
Retirement benefit expenses include the service cost related to the defined benefit retirement plans. Detailed information can be found in Note 44. These expenses also include contributions to defined contribution retirement plans for civil servants in Ger-many in the amount of €531 million (previous year: €538 million), as well as for the Group’s hourly workers and salaried employees – particularly in the UK, the USA and the Netherlands – in the amount of €276 million (previous year: €286 million).
The average number of Group employees in the year under review, broken down by employee group, was as follows:
employees (annual average)
Headcount 2013 adjusted 1
2014
Hourly workers and salaried employees 433,647 440,973
Civil servants 40,321 37,963
Trainees 4,935 5,089
employees 478,903 484,025
1 Note 4.
The employees of companies acquired or disposed of during the year under review were included rateably. Calculated as full-time equivalents, the number of employees as at 31 December 2014 amounted to 443,784 (31 December 2013, adjusted: 434,974). The number of employees at joint operations included in the consoli-dated financial statements amounted to 202 on a proportionate basis (previous year, adjusted: 187).
15 Depreciation, amortisation and impairment losses
€ m 2013 adjusted 1
2014
Amortisation of and impairment losses on intangible assets, excluding impairment of goodwill 290 271
Depreciation of and impairment losses on property, plant and equipment
Land and buildings (including leasehold improvements) 173 174
Technical equipment and machinery 252 235
Other equipment, operating and office equipment 206 204
Vehicle fleet, transport equipment 203 216
Aircraft 212 281
1,046 1,110
Impairment losses on investment property 1 0
1,337 1,381
Impairment of goodwill 0 0
Depreciation, amortisation and impairment losses 1,337 1,381
1 Note 4.
Depreciation, amortisation and impairment losses increased by €44 million year-on-year to €1,381 million. This figure includes im-pairment losses of €120 million (previous year: €38 million) that are attributable to the segments as follows:
Impairment losses
€ m
2013 2014
PePSoftware 12 5
expressProperty, plant and equipment 22 107
Supply ChainProperty, plant and equipment 0 1
Corporate Center / otherSoftware 3 5
Property, plant and equipment 0 2
Investment property 1 0
Impairment losses 38 120
As in the previous year, the impairment losses in the Express segment resulted exclusively from aircraft and aircraft parts.
Deutsche Post DHL Group — 2014 Annual Report
160
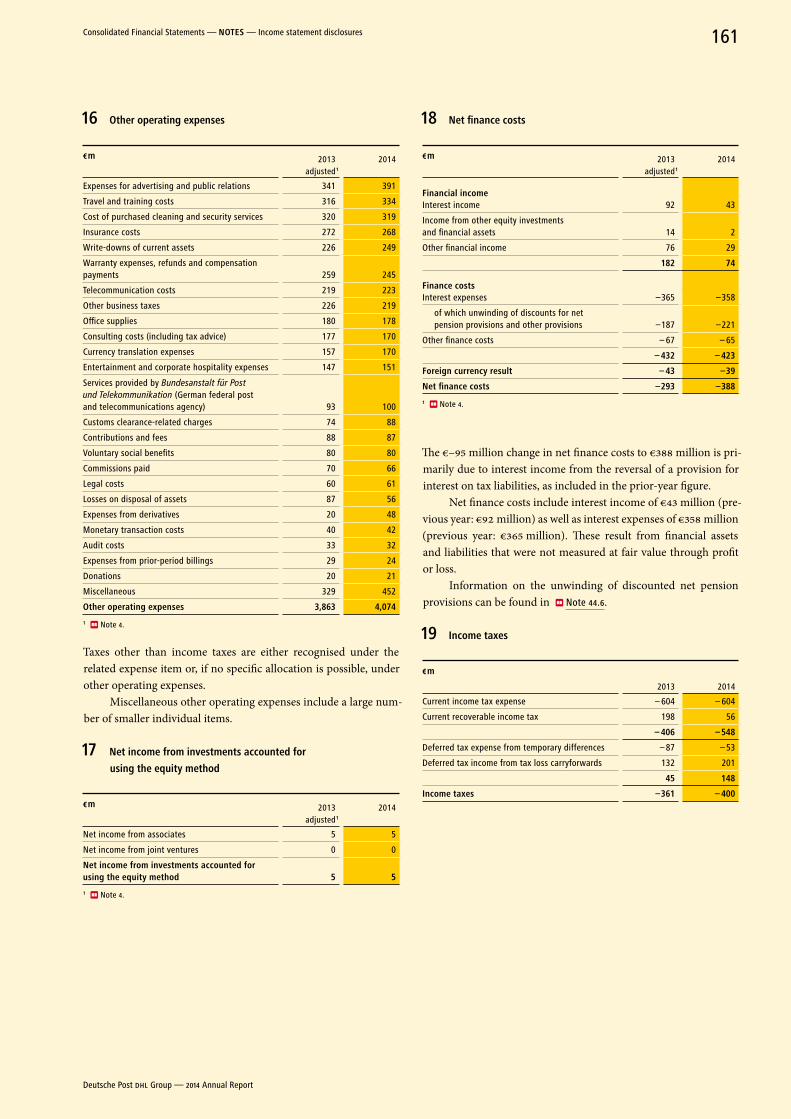
16 other operating expenses
€ m 2013 adjusted 1
2014
Expenses for advertising and public relations 341 391
Travel and training costs 316 334
Cost of purchased cleaning and security services 320 319
Insurance costs 272 268
Write-downs of current assets 226 249
Warranty expenses, refunds and compensation payments 259 245
Telecommunication costs 219 223
Other business taxes 226 219
Office supplies 180 178
Consulting costs (including tax advice) 177 170
Currency translation expenses 157 170
Entertainment and corporate hospitality expenses 147 151
Services provided by Bundesanstalt für Post und Telekommunikation (German federal post and telecommunications agency) 93 100
Customs clearance-related charges 74 88
Contributions and fees 88 87
Voluntary social benefits 80 80
Commissions paid 70 66
Legal costs 60 61
Losses on disposal of assets 87 56
Expenses from derivatives 20 48
Monetary transaction costs 40 42
Audit costs 33 32
Expenses from prior-period billings 29 24
Donations 20 21
Miscellaneous 329 452
other operating expenses 3,863 4,074
1 Note 4.
Taxes other than income taxes are either recognised under the related expense item or, if no specific allocation is possible, under other operating expenses.
Miscellaneous other operating expenses include a large num-ber of smaller individual items.
17 net income from investments accounted for
using the equity method
€ m 2013 adjusted 1
2014
Net income from associates 5 5
Net income from joint ventures 0 0
net income from investments accounted for using the equity method 5 5
1 Note 4.
18 net finance costs
€ m 2013 adjusted 1
2014
Financial incomeInterest income 92 43
Income from other equity investments and financial assets 14 2
Other financial income 76 29
182 74
Finance costsInterest expenses –365 –358
of which unwinding of discounts for net pension provisions and other provisions –187 –221
Other finance costs – 67 – 65
– 432 – 423
Foreign currency result – 43 –39
net finance costs –293 –388
1 Note 4.
The €–95 million change in net finance costs to €388 million is pri-marily due to interest income from the reversal of a provision for interest on tax liabilities, as included in the prior-year figure.
Net finance costs include interest income of €43 million (pre-vious year: €92 million) as well as interest expenses of €358 million (previous year: €365 million). These result from financial assets and liabilities that were not measured at fair value through profit or loss.
Information on the unwinding of discounted net pension provisions can be found in Note 44.6.
19 Income taxes
€ m
2013 2014
Current income tax expense – 604 – 604
Current recoverable income tax 198 56
– 406 – 548
Deferred tax expense from temporary differences – 87 – 53
Deferred tax income from tax loss carryforwards 132 201
45 148
Income taxes –361 – 400
Deutsche Post DHL Group — 2014 Annual Report
161Consolidated Financial Statements — noTeS — Income statement disclosures
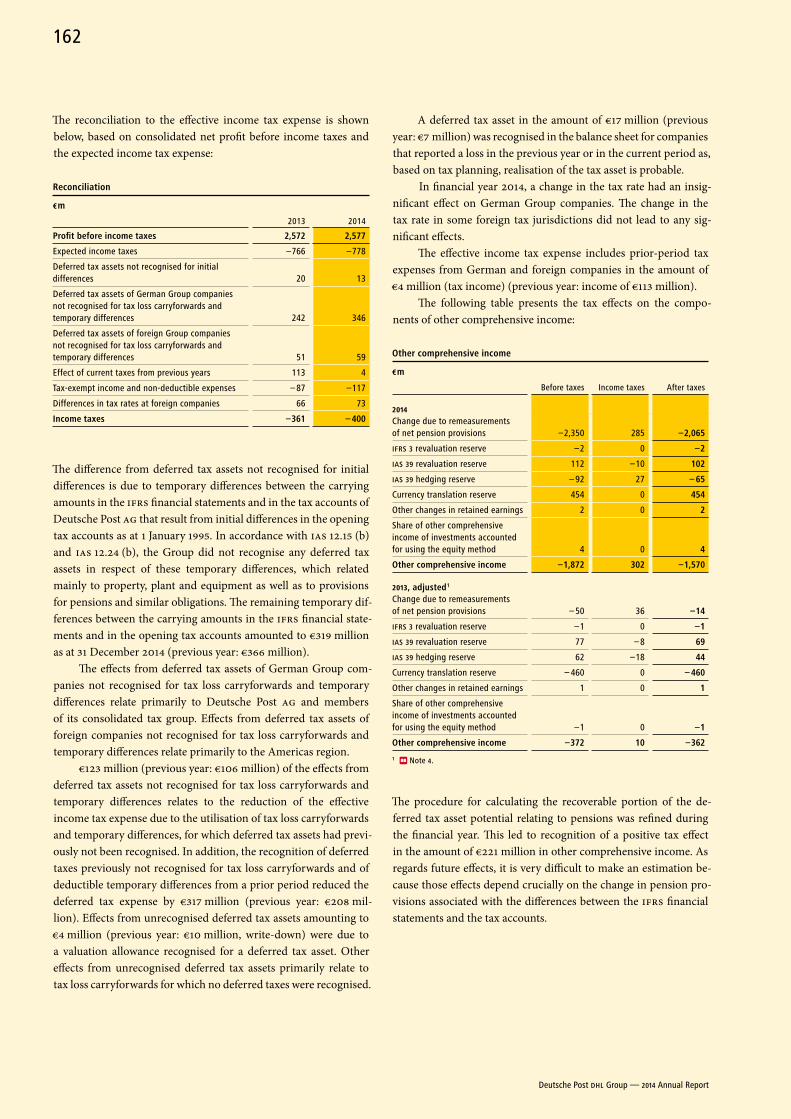
The reconciliation to the effective income tax expense is shown below, based on consolidated net profit before income taxes and the expected income tax expense:
reconciliation
€ m
2013 2014
Profit before income taxes 2,572 2,577
Expected income taxes –766 –778
Deferred tax assets not recognised for initial differences 20 13
Deferred tax assets of German Group companies not recognised for tax loss carryforwards and temporary differences 242 346
Deferred tax assets of foreign Group companies not recognised for tax loss carryforwards and temporary differences 51 59
Effect of current taxes from previous years 113 4
Tax-exempt income and non-deductible expenses – 87 –117
Differences in tax rates at foreign companies 66 73
Income taxes –361 – 400
The difference from deferred tax assets not recognised for initial differences is due to temporary differences between the carrying amounts in the IFRS financial statements and in the tax accounts of Deutsche Post AG that result from initial differences in the opening tax accounts as at 1 January 1995. In accordance with IAS 12.15 (b) and IAS 12.24 (b), the Group did not recognise any deferred tax assets in respect of these temporary differences, which related mainly to property, plant and equipment as well as to provisions for pensions and similar obligations. The remaining temporary dif-ferences between the carrying amounts in the IFRS financial state-ments and in the opening tax accounts amounted to €319 million as at 31 December 2014 (previous year: €366 million).
The effects from deferred tax assets of German Group com-panies not recognised for tax loss carryforwards and temporary differences relate primarily to Deutsche Post AG and members of its consolidated tax group. Effects from deferred tax assets of foreign companies not recognised for tax loss carryforwards and temporary differences relate primarily to the Americas region.
€123 million (previous year: €106 million) of the effects from deferred tax assets not recognised for tax loss carryforwards and temporary differences relates to the reduction of the effective income tax expense due to the utilisation of tax loss carryforwards and temporary differences, for which deferred tax assets had previ-ously not been recognised. In addition, the recognition of deferred taxes previously not recognised for tax loss carryforwards and of deductible temporary differences from a prior period reduced the deferred tax expense by €317 million (previous year: €208 mil-lion). Effects from unrecognised deferred tax assets amounting to €4 million (previous year: €10 million, write-down) were due to a valuation allowance recognised for a deferred tax asset. Other effects from unrecognised deferred tax assets primarily relate to tax loss carryforwards for which no deferred taxes were recognised.
A deferred tax asset in the amount of €17 million (previous year: €7 million) was recognised in the balance sheet for companies that reported a loss in the previous year or in the current period as, based on tax planning, realisation of the tax asset is probable.
In financial year 2014, a change in the tax rate had an insig-nificant effect on German Group companies. The change in the tax rate in some foreign tax jurisdictions did not lead to any sig-nificant effects.
The effective income tax expense includes prior-period tax expenses from German and foreign companies in the amount of €4 million (tax income) (previous year: income of €113 million).
The following table presents the tax effects on the compo-nents of other comprehensive income:
other comprehensive income
€ m
Before taxes Income taxes After taxes
2014Change due to remeasurements of net pension provisions –2,350 285 –2,065
IFRS 3 revaluation reserve –2 0 –2
IAS 39 revaluation reserve 112 –10 102
IAS 39 hedging reserve – 92 27 – 65
Currency translation reserve 454 0 454
Other changes in retained earnings 2 0 2
Share of other comprehensive income of investments accounted for using the equity method 4 0 4
other comprehensive income –1,872 302 –1,570
2013, adjusted 1
Change due to remeasurements of net pension provisions – 50 36 –14
IFRS 3 revaluation reserve –1 0 –1
IAS 39 revaluation reserve 77 – 8 69
IAS 39 hedging reserve 62 –18 44
Currency translation reserve – 460 0 – 460
Other changes in retained earnings 1 0 1
Share of other comprehensive income of investments accounted for using the equity method –1 0 –1
other comprehensive income –372 10 –362
1 Note 4.
The procedure for calculating the recoverable portion of the de-ferred tax asset potential relating to pensions was refined during the financial year. This led to recognition of a positive tax effect in the amount of €221 million in other comprehensive income. As regards future effects, it is very difficult to make an estimation be-cause those effects depend crucially on the change in pension pro-visions associated with the differences between the IFRS financial statements and the tax accounts.
Deutsche Post DHL Group — 2014 Annual Report
162
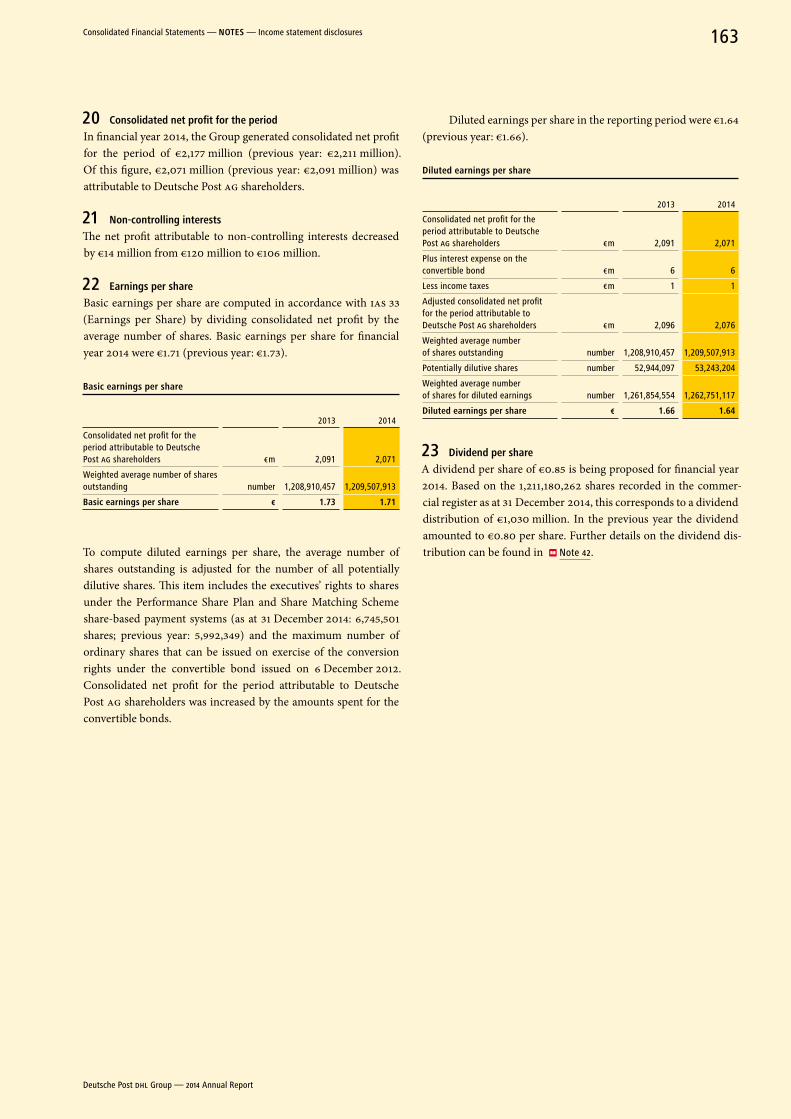
20 Consolidated net profit for the period
In financial year 2014, the Group generated consolidated net profit for the period of €2,177 million (previous year: €2,211 million). Of this figure, €2,071 million (previous year: €2,091 million) was attributable to Deutsche Post AG shareholders.
21 non-controlling interests
The net profit attributable to non-controlling interests decreased by €14 million from €120 million to €106 million.
22 earnings per share
Basic earnings per share are computed in accordance with IAS 33 (Earnings per Share) by dividing consolidated net profit by the average number of shares. Basic earnings per share for financial year 2014 were €1.71 (previous year: €1.73).
Basic earnings per share
2013 2014
Consolidated net profit for the period attributable to Deutsche Post AG shareholders € m 2,091 2,071
Weighted average number of shares outstanding number 1,208,910,457 1,209,507,913
Basic earnings per share € 1.73 1.71
To compute diluted earnings per share, the average number of shares outstanding is adjusted for the number of all potentially dilutive shares. This item includes the executives’ rights to shares under the Performance Share Plan and Share Matching Scheme share-based payment systems (as at 31 December 2014: 6,745,501 shares; previous year: 5,992,349) and the maximum number of ordinary shares that can be issued on exercise of the conversion rights under the convertible bond issued on 6 December 2012. Consolidated net profit for the period attributable to Deutsche Post AG shareholders was increased by the amounts spent for the convertible bonds.
Diluted earnings per share in the reporting period were €1.64 (previous year: €1.66).
Diluted earnings per share
2013 2014
Consolidated net profit for the period attributable to Deutsche Post AG shareholders € m 2,091 2,071
Plus interest expense on the convertible bond € m 6 6
Less income taxes € m 1 1
Adjusted consolidated net profit for the period attributable to Deutsche Post AG shareholders € m 2,096 2,076
Weighted average number of shares outstanding number 1,208,910,457 1,209,507,913
Potentially dilutive shares number 52,944,097 53,243,204
Weighted average number of shares for diluted earnings number 1,261,854,554 1,262,751,117
Diluted earnings per share € 1.66 1.64
23 Dividend per share
A dividend per share of €0.85 is being proposed for financial year 2014. Based on the 1,211,180,262 shares recorded in the commer-cial register as at 31 December 2014, this corresponds to a dividend distribution of €1,030 million. In the previous year the dividend amounted to €0.80 per share. Further details on the dividend dis-tribution can be found in Note 42.
Deutsche Post DHL Group — 2014 Annual Report
163Consolidated Financial Statements — noTeS — Income statement disclosures
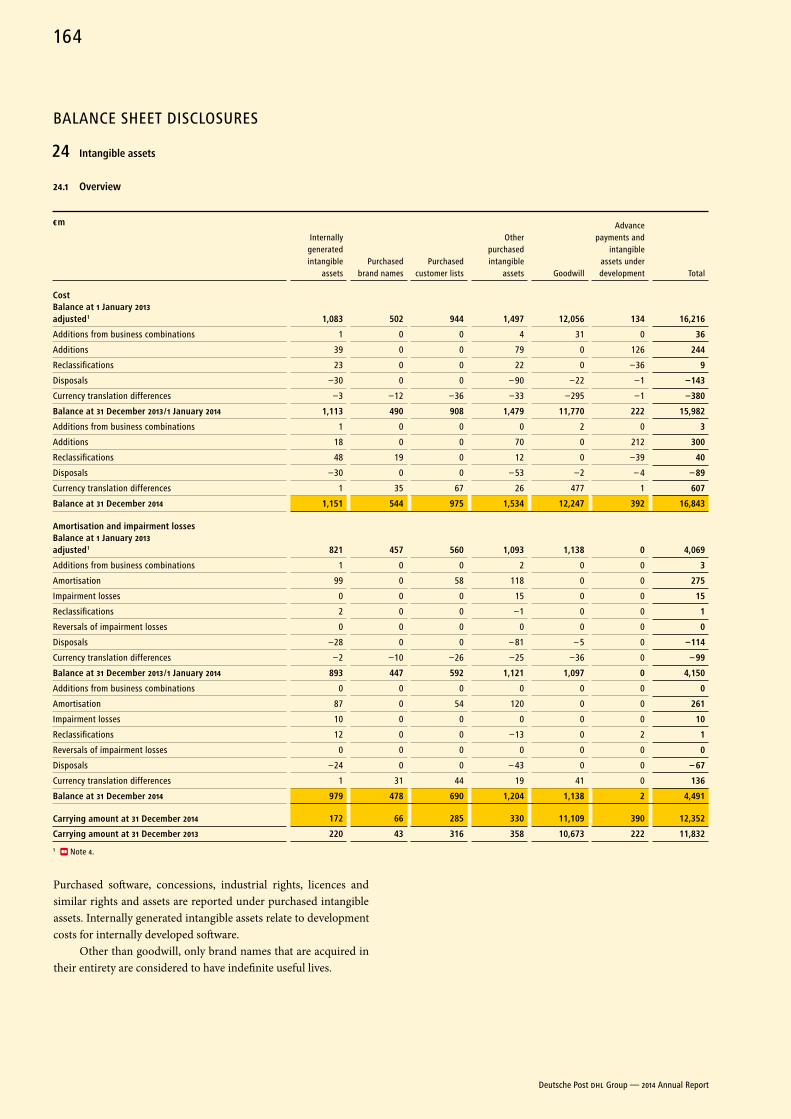
BALANCE SHEET DISCLOSURES
24 Intangible assets
24.1 overview
€ m
Internally generated intangible
assetsPurchased
brand namesPurchased
customer lists
Other purchased intangible
assets Goodwill
Advance payments and
intangible assets under development Total
CostBalance at 1 January 2013 adjusted 1 1,083 502 944 1,497 12,056 134 16,216
Additions from business combinations 1 0 0 4 31 0 36
Additions 39 0 0 79 0 126 244
Reclassifications 23 0 0 22 0 –36 9
Disposals –30 0 0 – 90 –22 –1 –143
Currency translation differences –3 –12 –36 –33 –295 –1 –380
Balance at 31 December 2013 / 1 January 2014 1,113 490 908 1,479 11,770 222 15,982
Additions from business combinations 1 0 0 0 2 0 3
Additions 18 0 0 70 0 212 300
Reclassifications 48 19 0 12 0 –39 40
Disposals –30 0 0 – 53 –2 – 4 – 89
Currency translation differences 1 35 67 26 477 1 607
Balance at 31 December 2014 1,151 544 975 1,534 12,247 392 16,843
amortisation and impairment lossesBalance at 1 January 2013 adjusted 1 821 457 560 1,093 1,138 0 4,069
Additions from business combinations 1 0 0 2 0 0 3
Amortisation 99 0 58 118 0 0 275
Impairment losses 0 0 0 15 0 0 15
Reclassifications 2 0 0 –1 0 0 1
Reversals of impairment losses 0 0 0 0 0 0 0
Disposals –28 0 0 – 81 – 5 0 –114
Currency translation differences –2 –10 –26 –25 –36 0 – 99
Balance at 31 December 2013 / 1 January 2014 893 447 592 1,121 1,097 0 4,150
Additions from business combinations 0 0 0 0 0 0 0
Amortisation 87 0 54 120 0 0 261
Impairment losses 10 0 0 0 0 0 10
Reclassifications 12 0 0 –13 0 2 1
Reversals of impairment losses 0 0 0 0 0 0 0
Disposals –24 0 0 – 43 0 0 – 67
Currency translation differences 1 31 44 19 41 0 136
Balance at 31 December 2014 979 478 690 1,204 1,138 2 4,491
Carrying amount at 31 December 2014 172 66 285 330 11,109 390 12,352
Carrying amount at 31 December 2013 220 43 316 358 10,673 222 11,832
1 Note 4.
Purchased software, concessions, industrial rights, licences and similar rights and assets are reported under purchased intangible assets. Internally generated intangible assets relate to development costs for internally developed software.
Other than goodwill, only brand names that are acquired in their entirety are considered to have indefinite useful lives.
Deutsche Post DHL Group — 2014 Annual Report
164
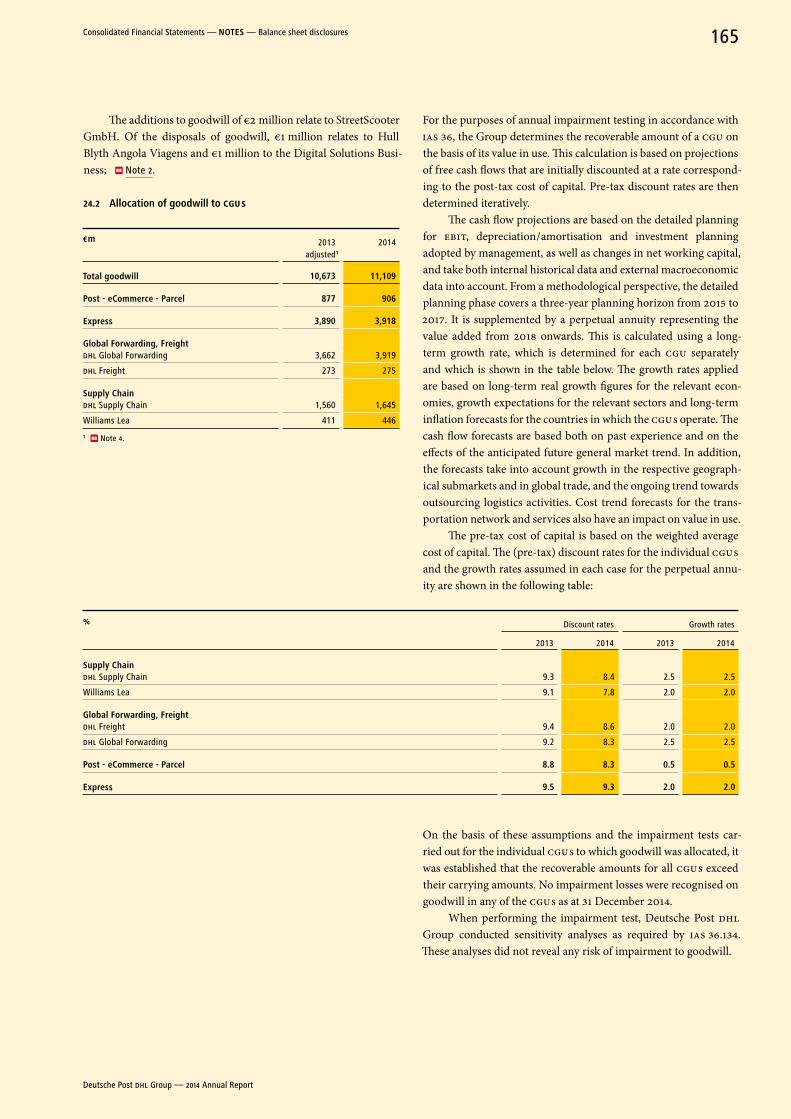
The additions to goodwill of €2 million relate to StreetScooter GmbH. Of the disposals of goodwill, €1 million relates to Hull Blyth Angola Viagens and €1 million to the Digital Solutions Busi-ness; Note 2.
24.2 allocation of goodwill to CGU s
€ m 2013 adjusted 1
2014
Total goodwill 10,673 11,109
Post - eCommerce - Parcel 877 906
express 3,890 3,918
Global Forwarding, FreightDHL Global Forwarding 3,662 3,919
DHL Freight 273 275
Supply ChainDHL Supply Chain 1,560 1,645
Williams Lea 411 446
1 Note 4.
For the purposes of annual impairment testing in accordance with IAS 36, the Group determines the recoverable amount of a CGU on the basis of its value in use. This calculation is based on projections of free cash flows that are initially discounted at a rate correspond-ing to the post-tax cost of capital. Pre-tax discount rates are then determined iteratively.
The cash flow projections are based on the detailed planning for EBIT, depreciation / amortisation and investment planning adopted by management, as well as changes in net working capital, and take both internal historical data and external macroeconomic data into account. From a methodological perspective, the detailed planning phase covers a three-year planning horizon from 2015 to 2017. It is supplemented by a perpetual annuity representing the value added from 2018 onwards. This is calculated using a long-term growth rate, which is determined for each CGU separately and which is shown in the table below. The growth rates applied are based on long-term real growth figures for the relevant econ-omies, growth expectations for the relevant sectors and long-term inflation forecasts for the countries in which the CGU s operate. The cash flow forecasts are based both on past experience and on the effects of the anticipated future general market trend. In addition, the forecasts take into account growth in the respective geograph-ical submarkets and in global trade, and the ongoing trend towards outsourcing logistics activities. Cost trend forecasts for the trans-portation network and services also have an impact on value in use.
The pre-tax cost of capital is based on the weighted average cost of capital. The (pre-tax) discount rates for the individual CGU s and the growth rates assumed in each case for the perpetual annu-ity are shown in the following table:
% Discount rates Growth rates
2013 2014 2013 2014
Supply ChainDHL Supply Chain 9.3 8.4 2.5 2.5
Williams Lea 9.1 7.8 2.0 2.0
Global Forwarding, FreightDHL Freight 9.4 8.6 2.0 2.0
DHL Global Forwarding 9.2 8.3 2.5 2.5
Post - eCommerce - Parcel 8.8 8.3 0.5 0.5
express 9.5 9.3 2.0 2.0
On the basis of these assumptions and the impairment tests car-ried out for the individual CGU s to which goodwill was allocated, it was established that the recoverable amounts for all CGU s exceed their carrying amounts. No impairment losses were recognised on goodwill in any of the CGU s as at 31 December 2014.
When performing the impairment test, Deutsche Post DHL Group conducted sensitivity analyses as required by IAS 36.134. These analyses did not reveal any risk of impairment to goodwill.
Deutsche Post DHL Group — 2014 Annual Report
165Consolidated Financial Statements — noTeS — Balance sheet disclosures
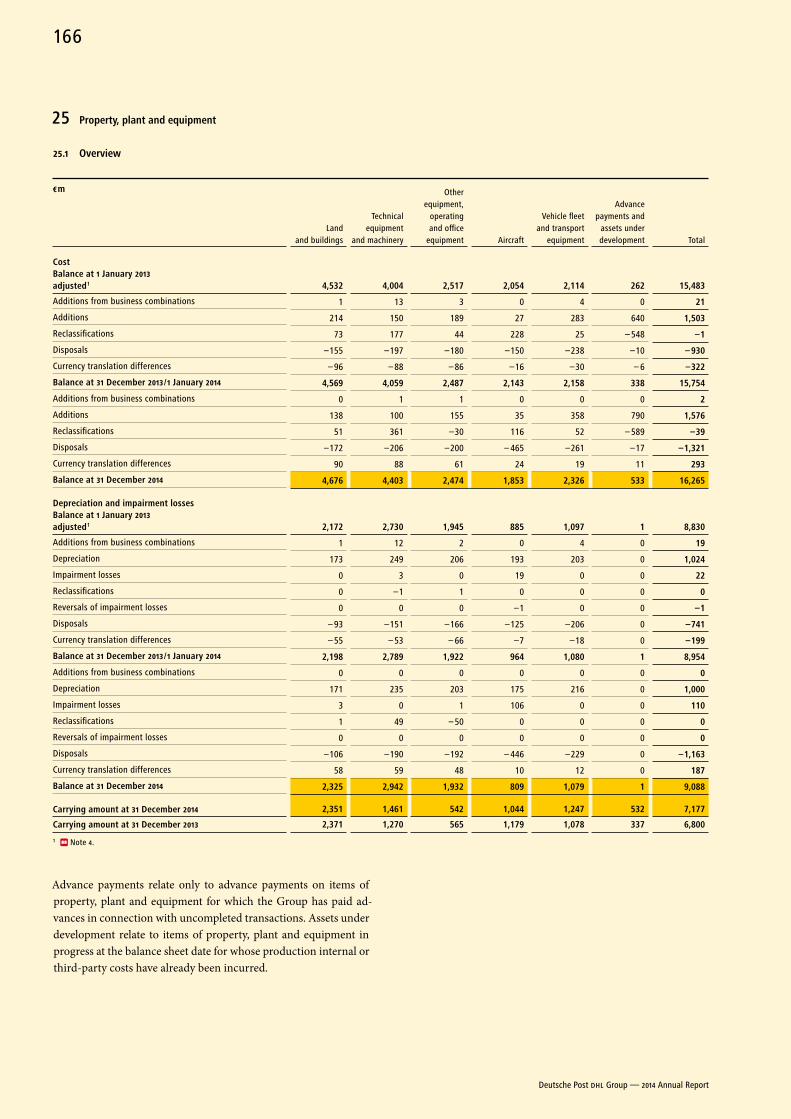
25 Property, plant and equipment
25.1 overview
€ m
Land and buildings
Technical equipment
and machinery
Other equipment,
operating and office
equipment Aircraft
Vehicle fleet and transport
equipment
Advance payments and
assets under development Total
CostBalance at 1 January 2013 adjusted 1 4,532 4,004 2,517 2,054 2,114 262 15,483
Additions from business combinations 1 13 3 0 4 0 21
Additions 214 150 189 27 283 640 1,503
Reclassifications 73 177 44 228 25 – 548 –1
Disposals –155 –197 –180 –150 –238 –10 – 930
Currency translation differences – 96 – 88 – 86 –16 –30 – 6 –322
Balance at 31 December 2013 / 1 January 2014 4,569 4,059 2,487 2,143 2,158 338 15,754
Additions from business combinations 0 1 1 0 0 0 2
Additions 138 100 155 35 358 790 1,576
Reclassifications 51 361 –30 116 52 – 589 –39
Disposals –172 –206 –200 – 465 –261 –17 –1,321
Currency translation differences 90 88 61 24 19 11 293
Balance at 31 December 2014 4,676 4,403 2,474 1,853 2,326 533 16,265
Depreciation and impairment lossesBalance at 1 January 2013 adjusted 1 2,172 2,730 1,945 885 1,097 1 8,830
Additions from business combinations 1 12 2 0 4 0 19
Depreciation 173 249 206 193 203 0 1,024
Impairment losses 0 3 0 19 0 0 22
Reclassifications 0 –1 1 0 0 0 0
Reversals of impairment losses 0 0 0 –1 0 0 –1
Disposals – 93 –151 –166 –125 –206 0 –741
Currency translation differences – 55 – 53 – 66 –7 –18 0 –199
Balance at 31 December 2013 / 1 January 2014 2,198 2,789 1,922 964 1,080 1 8,954
Additions from business combinations 0 0 0 0 0 0 0
Depreciation 171 235 203 175 216 0 1,000
Impairment losses 3 0 1 106 0 0 110
Reclassifications 1 49 – 50 0 0 0 0
Reversals of impairment losses 0 0 0 0 0 0 0
Disposals –106 –190 –192 – 446 –229 0 –1,163
Currency translation differences 58 59 48 10 12 0 187
Balance at 31 December 2014 2,325 2,942 1,932 809 1,079 1 9,088
Carrying amount at 31 December 2014 2,351 1,461 542 1,044 1,247 532 7,177
Carrying amount at 31 December 2013 2,371 1,270 565 1,179 1,078 337 6,800
1 Note 4.
Advance payments relate only to advance payments on items of property, plant and equipment for which the Group has paid ad-vances in connection with uncompleted transactions. Assets under development relate to items of property, plant and equipment in progress at the balance sheet date for whose production internal or third-party costs have already been incurred.
Deutsche Post DHL Group — 2014 Annual Report
166
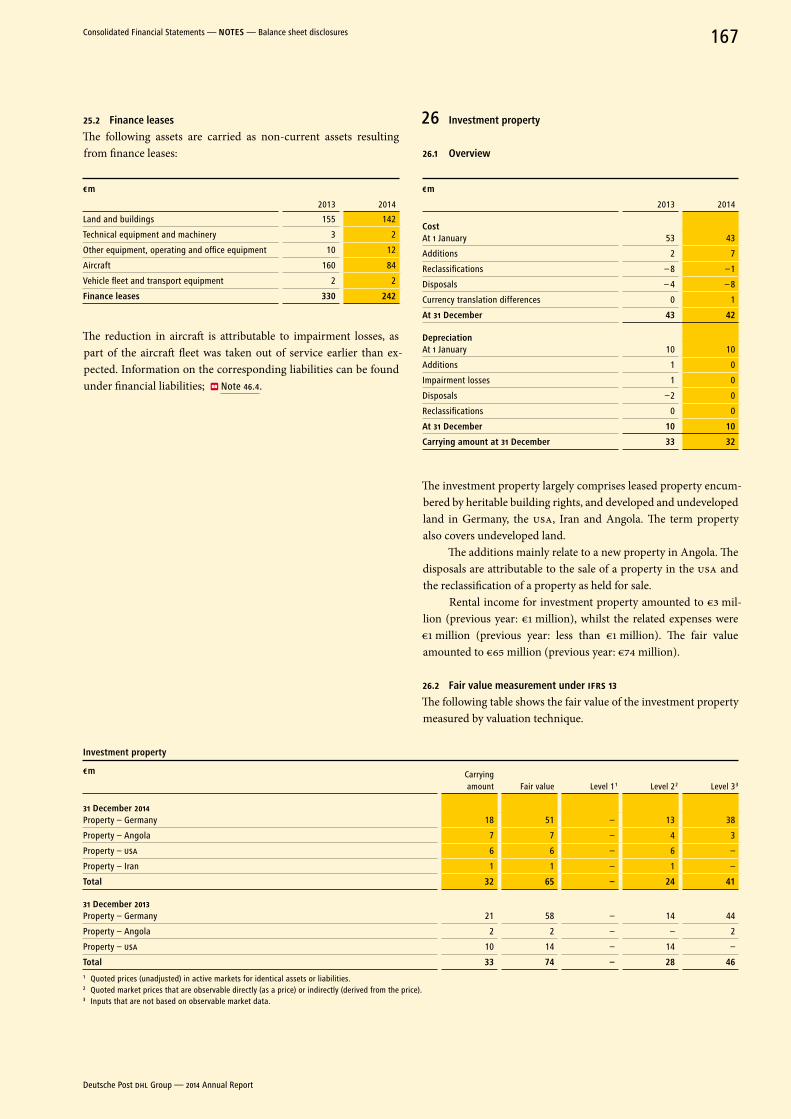
25.2 Finance leases
The following assets are carried as non-current assets resulting from finance leases:
€ m
2013 2014
Land and buildings 155 142
Technical equipment and machinery 3 2
Other equipment, operating and office equipment 10 12
Aircraft 160 84
Vehicle fleet and transport equipment 2 2
Finance leases 330 242
The reduction in aircraft is attributable to impairment losses, as part of the aircraft fleet was taken out of service earlier than ex-pected. Information on the corresponding liabilities can be found under financial liabilities; Note 46.4.
26 Investment property
26.1 overview
€ m
2013 2014
CostAt 1 January 53 43
Additions 2 7
Reclassifications – 8 –1
Disposals – 4 – 8
Currency translation differences 0 1
at 31 December 43 42
DepreciationAt 1 January 10 10
Additions 1 0
Impairment losses 1 0
Disposals –2 0
Reclassifications 0 0
at 31 December 10 10
Carrying amount at 31 December 33 32
The investment property largely comprises leased property encum-bered by heritable building rights, and developed and undeveloped land in Germany, the USA, Iran and Angola. The term property also covers undeveloped land.
The additions mainly relate to a new property in Angola. The disposals are attributable to the sale of a property in the USA and the reclassification of a property as held for sale.
Rental income for investment property amounted to €3 mil-lion (previous year: €1 million), whilst the related expenses were €1 million (previous year: less than €1 million). The fair value amounted to €65 million (previous year: €74 million).
26.2 Fair value measurement under IFRS 13
The following table shows the fair value of the investment property measured by valuation technique.
Investment property
€ m Carrying amount Fair value Level 1 1 Level 2 2 Level 3 3
31 December 2014Property – Germany 18 51 – 13 38
Property – Angola 7 7 – 4 3
Property – USA 6 6 – 6 –
Property – Iran 1 1 – 1 –
Total 32 65 – 24 41
31 December 2013Property – Germany 21 58 – 14 44
Property – Angola 2 2 – – 2
Property – USA 10 14 – 14 –
Total 33 74 – 28 461 Quoted prices (unadjusted) in active markets for identical assets or liabilities.2 Quoted market prices that are observable directly (as a price) or indirectly (derived from the price). 3 Inputs that are not based on observable market data.
Deutsche Post DHL Group — 2014 Annual Report
167Consolidated Financial Statements — noTeS — Balance sheet disclosures
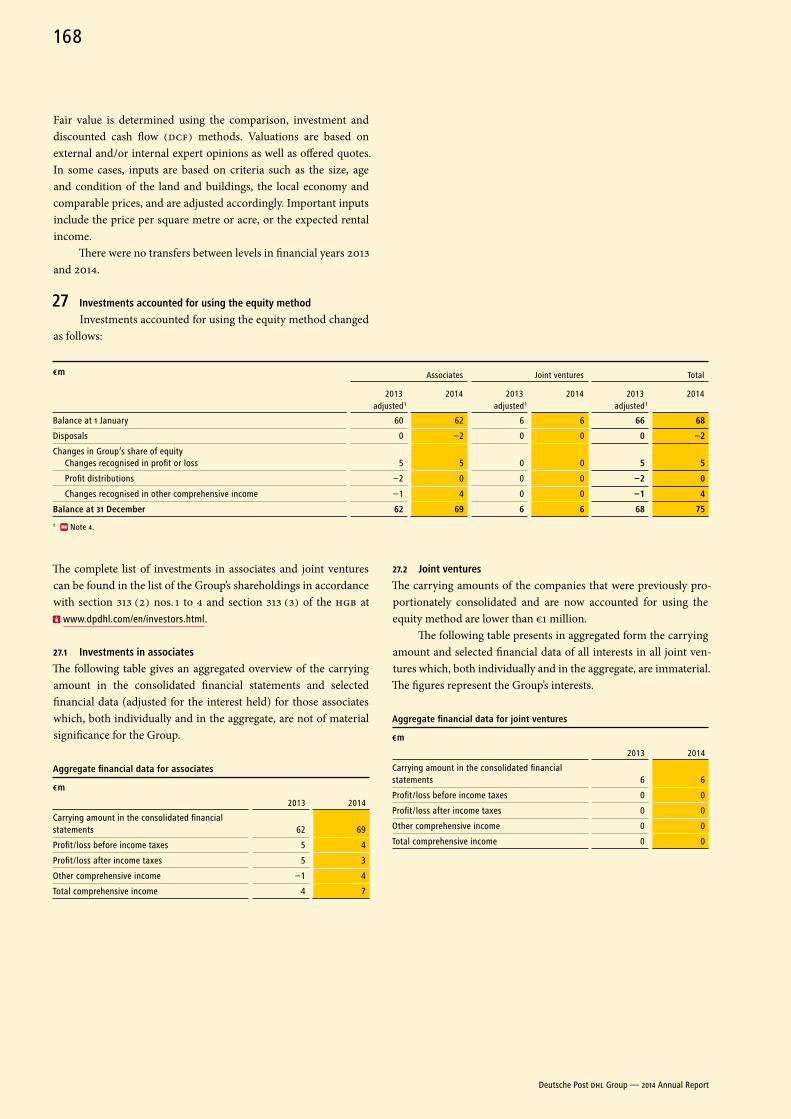
Fair value is determined using the comparison, investment and discounted cash flow (DCF) methods. Valuations are based on external and /or internal expert opinions as well as offered quotes. In some cases, inputs are based on criteria such as the size, age and condition of the land and buildings, the local economy and comparable prices, and are adjusted accordingly. Important inputs include the price per square metre or acre, or the expected rental income.
There were no transfers between levels in financial years 2013 and 2014.
27 Investments accounted for using the equity method
Investments accounted for using the equity method changed as follows:
€ m Associates Joint ventures Total
2013
adjusted 1
2014 2013 adjusted 1
2014 2013 adjusted 1
2014
Balance at 1 January 60 62 6 6 66 68
Disposals 0 –2 0 0 0 –2
Changes in Group’s share of equityChanges recognised in profit or loss 5 5 0 0 5 5
Profit distributions –2 0 0 0 –2 0
Changes recognised in other comprehensive income –1 4 0 0 –1 4
Balance at 31 December 62 69 6 6 68 75
1 Note 4.
The complete list of investments in associates and joint ventures can be found in the list of the Group’s shareholdings in accordance with section 313 (2) nos. 1 to 4 and section 313 (3) of the HGB at
www.dpdhl.com/en/investors.html.
27.1 Investments in associates
The following table gives an aggregated overview of the carrying amount in the consolidated financial statements and selected finan cial data (adjusted for the interest held) for those associates which, both individually and in the aggregate, are not of material significance for the Group.
aggregate financial data for associates
€ m
2013 2014
Carrying amount in the consolidated financial statements 62 69
Profit / loss before income taxes 5 4
Profit / loss after income taxes 5 3
Other comprehensive income –1 4
Total comprehensive income 4 7
27.2 Joint ventures
The carrying amounts of the companies that were previously pro-portionately consolidated and are now accounted for using the equity method are lower than €1 million.
The following table presents in aggregated form the carrying amount and selected financial data of all interests in all joint ven-tures which, both individually and in the aggregate, are immaterial. The figures represent the Group’s interests.
aggregate financial data for joint ventures
€ m
2013 2014
Carrying amount in the consolidated financial statements 6 6
Profit / loss before income taxes 0 0
Profit / loss after income taxes 0 0
Other comprehensive income 0 0
Total comprehensive income 0 0
Deutsche Post DHL Group — 2014 Annual Report
168
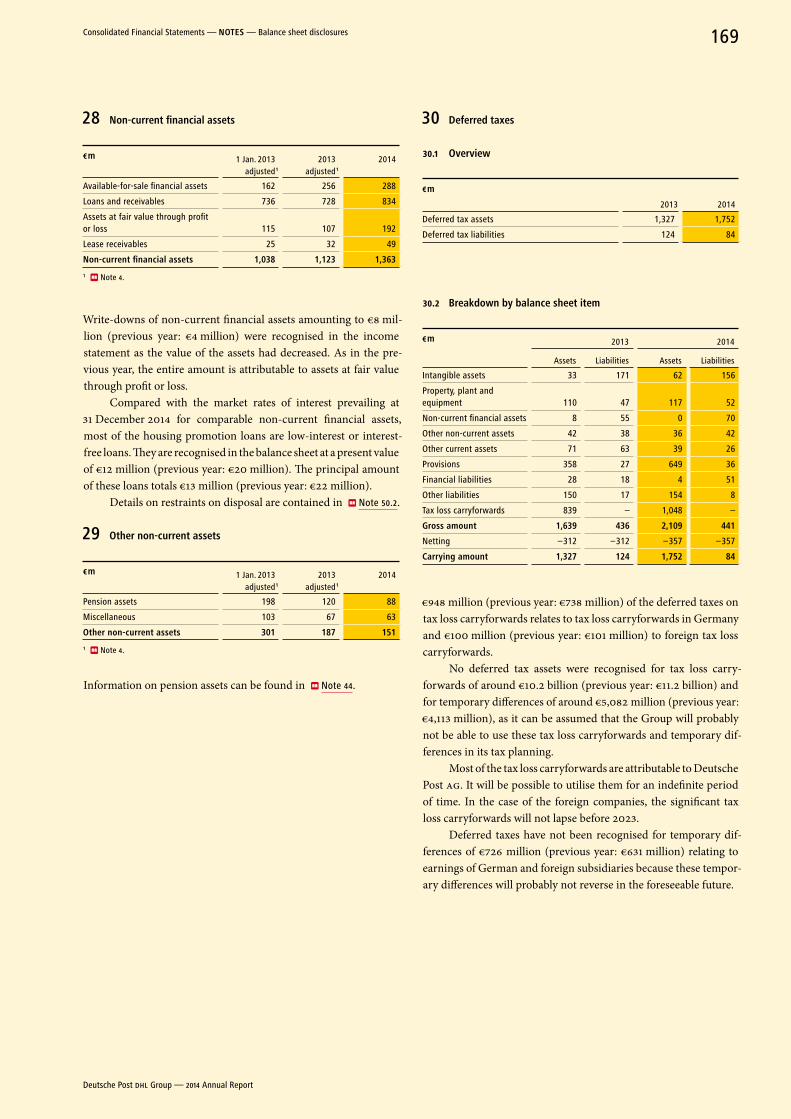
28 non-current financial assets
€ m 1 Jan. 2013 adjusted 1
2013 adjusted 1
2014
Available-for-sale financial assets 162 256 288
Loans and receivables 736 728 834
Assets at fair value through profit or loss 115 107 192
Lease receivables 25 32 49
non-current financial assets 1,038 1,123 1,363
1 Note 4.
Write-downs of non-current financial assets amounting to €8 mil-lion (previous year: €4 million) were recognised in the income statement as the value of the assets had decreased. As in the pre-vious year, the entire amount is attributable to assets at fair value through profit or loss.
Compared with the market rates of interest prevailing at 31 December 2014 for comparable non-current financial assets, most of the housing promotion loans are low-interest or interest- free loans. They are recognised in the balance sheet at a present value of €12 million (previous year: €20 million). The principal amount of these loans totals €13 million (previous year: €22 million).
Details on restraints on disposal are contained in Note 50.2.
29 other non-current assets
€ m 1 Jan. 2013 adjusted 1
2013 adjusted 1
2014
Pension assets 198 120 88
Miscellaneous 103 67 63
other non-current assets 301 187 151
1 Note 4.
Information on pension assets can be found in Note 44.
30 Deferred taxes
30.1 overview
€ m
2013 2014
Deferred tax assets 1,327 1,752
Deferred tax liabilities 124 84
30.2 Breakdown by balance sheet item
€ m 2013 2014
Assets Liabilities Assets Liabilities
Intangible assets 33 171 62 156
Property, plant and equipment 110 47 117 52
Non-current financial assets 8 55 0 70
Other non-current assets 42 38 36 42
Other current assets 71 63 39 26
Provisions 358 27 649 36
Financial liabilities 28 18 4 51
Other liabilities 150 17 154 8
Tax loss carryforwards 839 – 1,048 –
Gross amount 1,639 436 2,109 441
Netting –312 –312 –357 –357
Carrying amount 1,327 124 1,752 84
€948 million (previous year: €738 million) of the deferred taxes on tax loss carryforwards relates to tax loss carryforwards in Germany and €100 million (previous year: €101 million) to foreign tax loss carryforwards.
No deferred tax assets were recognised for tax loss carry-forwards of around €10.2 billion (previous year: €11.2 billion) and for temporary differences of around €5,082 million (previous year: €4,113 million), as it can be assumed that the Group will probably not be able to use these tax loss carryforwards and temporary dif-ferences in its tax planning.
Most of the tax loss carryforwards are attributable to Deutsche Post AG. It will be possible to utilise them for an indefinite period of time. In the case of the foreign companies, the significant tax loss carryforwards will not lapse before 2023.
Deferred taxes have not been recognised for temporary dif-ferences of €726 million (previous year: €631 million) relating to earnings of German and foreign subsidiaries because these tempor-ary differences will probably not reverse in the foreseeable future.
Deutsche Post DHL Group — 2014 Annual Report
169Consolidated Financial Statements — noTeS — Balance sheet disclosures
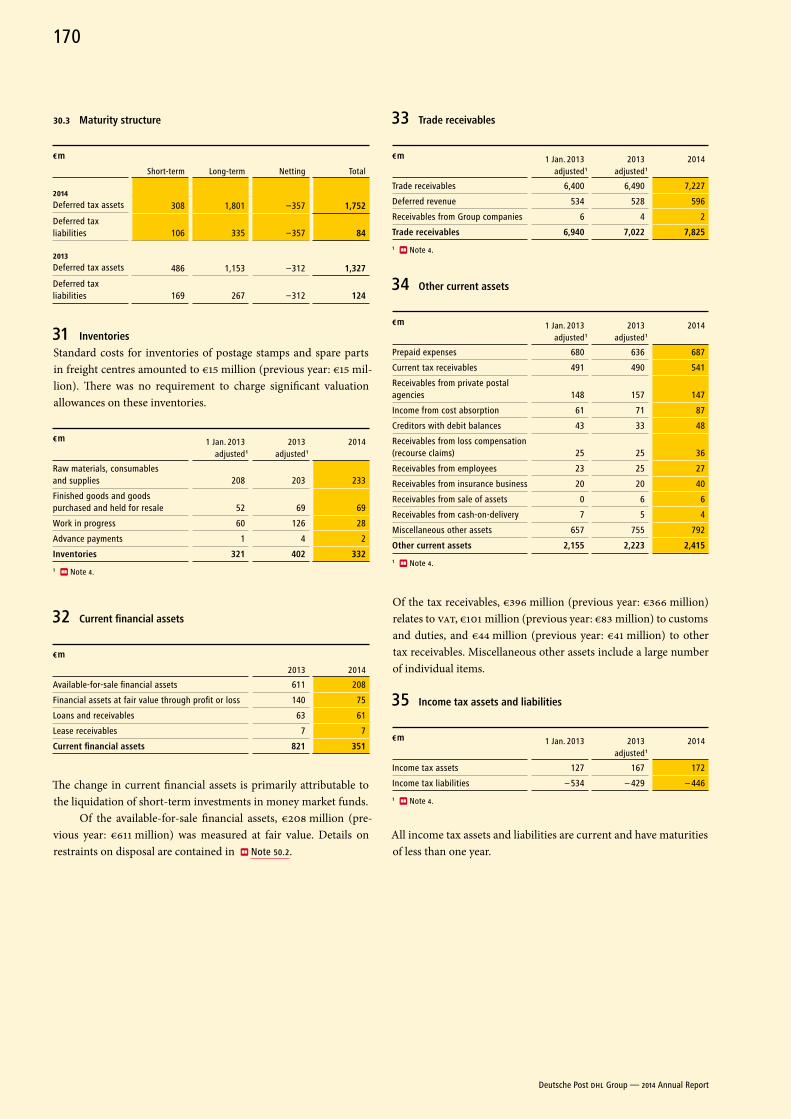
30.3 Maturity structure
€ m
Short-term Long-term Netting Total
2014Deferred tax assets 308 1,801 –357 1,752
Deferred tax liabilities 106 335 –357 84
2013Deferred tax assets 486 1,153 –312 1,327
Deferred tax liabilities 169 267 –312 124
31 Inventories
Standard costs for inventories of postage stamps and spare parts in freight centres amounted to €15 million (previous year: €15 mil-lion). There was no requirement to charge significant valuation allowances on these inventories.
€ m 1 Jan. 2013 adjusted 1
2013 adjusted 1
2014
Raw materials, consumables and supplies 208 203 233
Finished goods and goods purchased and held for resale 52 69 69
Work in progress 60 126 28
Advance payments 1 4 2
Inventories 321 402 332
1 Note 4.
32 Current financial assets
€ m
2013 2014
Available-for-sale financial assets 611 208
Financial assets at fair value through profit or loss 140 75
Loans and receivables 63 61
Lease receivables 7 7
Current financial assets 821 351
The change in current financial assets is primarily attributable to the liquidation of short-term investments in money market funds.
Of the available-for-sale financial assets, €208 million (pre-vious year: €611 million) was measured at fair value. Details on restraints on disposal are contained in Note 50.2.
33 Trade receivables
€ m 1 Jan. 2013 adjusted 1
2013 adjusted 1
2014
Trade receivables 6,400 6,490 7,227
Deferred revenue 534 528 596
Receivables from Group companies 6 4 2
Trade receivables 6,940 7,022 7,825
1 Note 4.
34 other current assets
€ m 1 Jan. 2013 adjusted 1
2013 adjusted 1
2014
Prepaid expenses 680 636 687
Current tax receivables 491 490 541
Receivables from private postal agencies 148 157 147
Income from cost absorption 61 71 87
Creditors with debit balances 43 33 48
Receivables from loss compensation (recourse claims) 25 25 36
Receivables from employees 23 25 27
Receivables from insurance business 20 20 40
Receivables from sale of assets 0 6 6
Receivables from cash-on-delivery 7 5 4
Miscellaneous other assets 657 755 792
other current assets 2,155 2,223 2,415
1 Note 4.
Of the tax receivables, €396 million (previous year: €366 million) relates to VAT, €101 million (previous year: €83 million) to customs and duties, and €44 million (previous year: €41 million) to other tax receivables. Miscellaneous other assets include a large number of individual items.
35 Income tax assets and liabilities
€ m 1 Jan. 2013 2013 adjusted 1
2014
Income tax assets 127 167 172
Income tax liabilities – 534 – 429 – 446
1 Note 4.
All income tax assets and liabilities are current and have maturities of less than one year.
Deutsche Post DHL Group — 2014 Annual Report
170
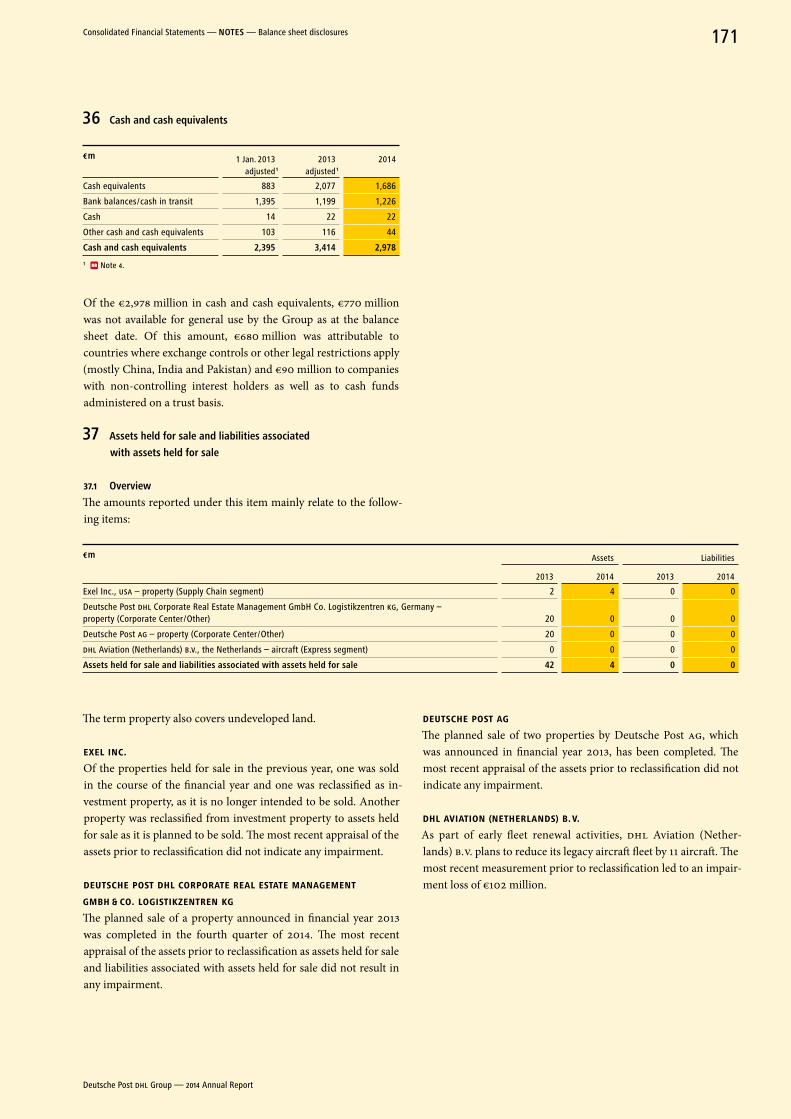
36 Cash and cash equivalents
€ m 1 Jan. 2013 adjusted 1
2013 adjusted 1
2014
Cash equivalents 883 2,077 1,686
Bank balances / cash in transit 1,395 1,199 1,226
Cash 14 22 22
Other cash and cash equivalents 103 116 44
Cash and cash equivalents 2,395 3,414 2,978
1 Note 4.
Of the €2,978 million in cash and cash equivalents, €770 million was not available for general use by the Group as at the balance sheet date. Of this amount, €680 million was attributable to countries where exchange controls or other legal restrictions apply (mostly China, India and Pakistan) and €90 million to companies with non-controlling interest holders as well as to cash funds administered on a trust basis.
37 assets held for sale and liabilities associated
with assets held for sale
37.1 overview
The amounts reported under this item mainly relate to the follow-ing items:
€ m Assets Liabilities
2013 2014 2013 2014
Exel Inc., USA – property (Supply Chain segment) 2 4 0 0
Deutsche Post DHL Corporate Real Estate Management GmbH Co. Logistikzentren KG, Germany – property (Corporate Center / Other) 20 0 0 0
Deutsche Post AG – property (Corporate Center / Other) 20 0 0 0
DHL Aviation (Netherlands) B.V., the Netherlands – aircraft (Express segment) 0 0 0 0
assets held for sale and liabilities associated with assets held for sale 42 4 0 0
The term property also covers undeveloped land.
EXEL INC.Of the properties held for sale in the previous year, one was sold in the course of the financial year and one was reclassified as in-vestment property, as it is no longer intended to be sold. Another property was reclassified from investment property to assets held for sale as it is planned to be sold. The most recent appraisal of the assets prior to reclassification did not indicate any impairment.
DEUTSCHE POST DHL CORPORATE REAL ESTATE MANAGEMENT GMBH & CO. LOGISTIKzENTREN KGThe planned sale of a property announced in financial year 2013 was completed in the fourth quarter of 2014. The most recent appraisal of the assets prior to reclassification as assets held for sale and liabilities associated with assets held for sale did not result in any impairment.
DEUTSCHE POST AGThe planned sale of two properties by Deutsche Post AG, which was announced in financial year 2013, has been completed. The most recent appraisal of the assets prior to reclassification did not indicate any impairment.
DHL AvIATION (NETHERLANDS) B. v.As part of early fleet renewal activities, DHL Aviation (Nether-lands) B.V. plans to reduce its legacy aircraft fleet by 11 aircraft. The most recent measurement prior to reclassification led to an impair-ment loss of €102 million.
Deutsche Post DHL Group — 2014 Annual Report
171Consolidated Financial Statements — noTeS — Balance sheet disclosures
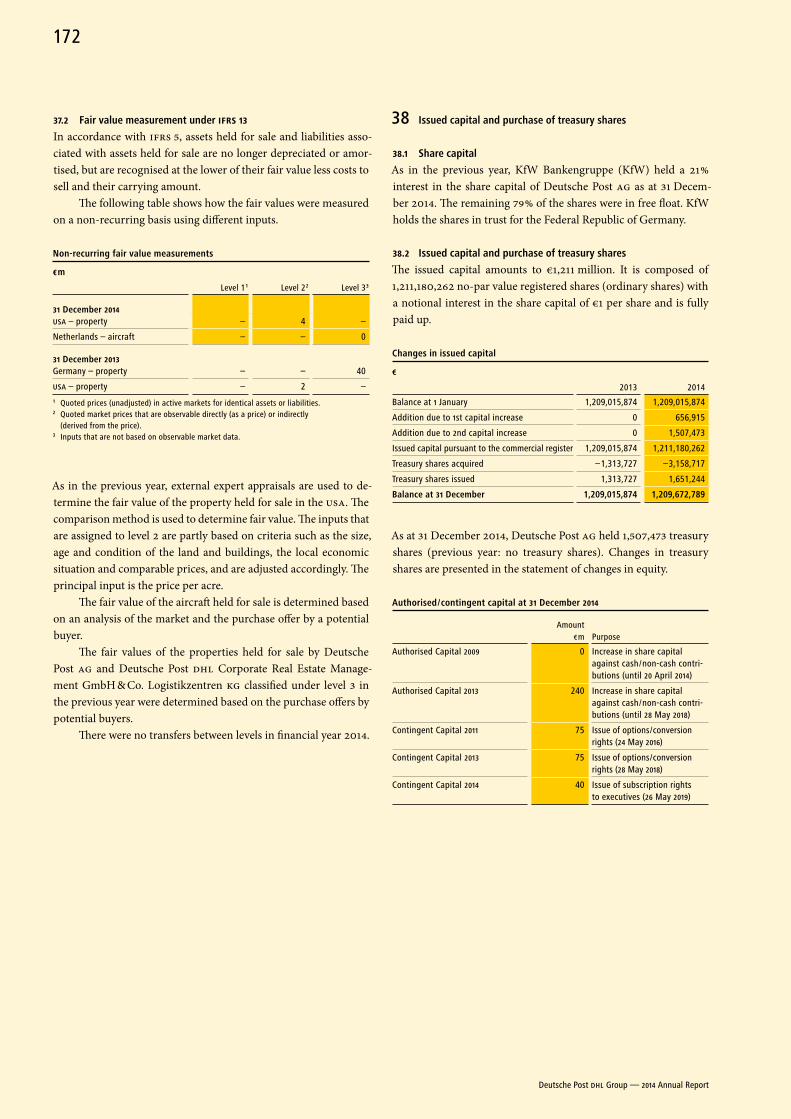
37.2 Fair value measurement under IFRS 13
In accordance with IFRS 5, assets held for sale and liabilities asso-ciated with assets held for sale are no longer depreciated or amor-tised, but are recognised at the lower of their fair value less costs to sell and their carrying amount.
The following table shows how the fair values were measured on a non-recurring basis using different inputs.
non-recurring fair value measurements
€ m
Level 1 1 Level 2 2 Level 3 3
31 December 2014USA – property – 4 –
Netherlands – aircraft – – 0
31 December 2013Germany – property – – 40
USA – property – 2 –1 Quoted prices (unadjusted) in active markets for identical assets or liabilities.2 Quoted market prices that are observable directly (as a price) or indirectly
(derived from the price). 3 Inputs that are not based on observable market data.
As in the previous year, external expert appraisals are used to de-termine the fair value of the property held for sale in the USA. The comparison method is used to determine fair value. The inputs that are assigned to level 2 are partly based on criteria such as the size, age and condition of the land and buildings, the local economic situation and comparable prices, and are adjusted accordingly. The principal input is the price per acre.
The fair value of the aircraft held for sale is determined based on an analysis of the market and the purchase offer by a potential buyer.
The fair values of the properties held for sale by Deutsche Post AG and Deutsche Post DHL Corporate Real Estate Manage-ment GmbH & Co. Logistikzentren KG classified under level 3 in the previous year were determined based on the purchase offers by potential buyers.
There were no transfers between levels in financial year 2014.
38 Issued capital and purchase of treasury shares
38.1 Share capital
As in the previous year, KfW Bankengruppe (KfW) held a 21 % interest in the share capital of Deutsche Post AG as at 31 Decem-ber 2014. The remaining 79 % of the shares were in free float. KfW holds the shares in trust for the Federal Republic of Germany.
38.2 Issued capital and purchase of treasury shares
The issued capital amounts to €1,211 million. It is composed of 1,211,180,262 no-par value registered shares (ordinary shares) with a notional interest in the share capital of €1 per share and is fully paid up.
Changes in issued capital
€
2013 2014
Balance at 1 January 1,209,015,874 1,209,015,874
Addition due to 1st capital increase 0 656,915
Addition due to 2nd capital increase 0 1,507,473
Issued capital pursuant to the commercial register 1,209,015,874 1,211,180,262
Treasury shares acquired –1,313,727 –3,158,717
Treasury shares issued 1,313,727 1,651,244
Balance at 31 December 1,209,015,874 1,209,672,789
As at 31 December 2014, Deutsche Post AG held 1,507,473 treasury shares (previous year: no treasury shares). Changes in treasury shares are presented in the statement of changes in equity.
authorised / contingent capital at 31 December 2014
Amount € m Purpose
Authorised Capital 2009
0
Increase in share capital against cash / non-cash contri-butions (until 20 April 2014)
Authorised Capital 2013
240
Increase in share capital against cash / non-cash contri-butions (until 28 May 2018)
Contingent Capital 2011 75 Issue of options / conversion rights (24 May 2016)
Contingent Capital 2013 75 Issue of options / conversion rights (28 May 2018)
Contingent Capital 2014 40 Issue of subscription rights to executives (26 May 2019)
Deutsche Post DHL Group — 2014 Annual Report
172
authorised Capital 2009
As resolved by the Annual General Meeting on 21 April 2009, the Board of Management was authorised, subject to the consent of the Supervisory Board, to issue up to 240 million new, no-par value registered shares until 20 April 2014 in exchange for cash and /or non-cash contributions and thereby increase the company’s share capital. Shareholders generally have subscription rights. The Board of Management has not made use of such authorisation. Since this authorisation lapsed on 20 April 2014, the Annual General Meet-ing on 29 May 2013 resolved to replace it with a new authorisation for the same amount (Authorised Capital 2013).
authorised Capital 2013
As resolved by the Annual General Meeting on 29 May 2013, the Board of Management is authorised, subject to the consent of the Supervisory Board, to issue up to 240 million new, no-par value registered shares until 28 May 2018 in exchange for cash and /or non-cash contributions and thereby increase the company’s share capital. Shareholders generally have subscription rights. However, subject to the approval of the Supervisory Board, the Board of Management may disapply the shareholders’ subscription rights to the shares covered by the authorisation.
Deutsche Post AG’s Board of Management resolved, with the consent of the Supervisory Board, to make partial use of the authorisation granted to it by the Annual General Meeting on 29 May 2013 in accordance with article 5 (2) of the Articles of Association of Deutsche Post AG (Authorised Capital 2013), to in-crease Deutsche Post AG’s share capital by €656,915.00 by issuing 656,915 new no-par value registered shares with a notional interest in the share capital of €1.00 per share in exchange for cash contri-butions. The capital increase was entered in the commercial regis-ter of the Bonn Local Court on 12 March 2014. The shares partici-pated in the consolidated net profit for 2013.
The Board of Management resolved, with the consent of the Supervisory Board, to make further partial use of the authorisa-tion granted to it by the Annual General Meeting on 29 May 2013 in accordance with article 5 (2) of the Articles of Association of Deutsche Post AG ( Authorised Capital 2013), to increase Deutsche Post AG’s share capital by €1,507,473.00 by issuing 1,507,473 new no-par value registered shares with a notional interest in the share capital of €1.00 per share in exchange for cash contributions. The capital increase was entered in the commercial register of the Bonn Local Court on 11 December 2014. The shares participate in the consolidated net profit for 2014.
Implementation of the capital increases entailed transaction costs of €0.7 million.
Contingent Capital 2011
In its resolution dated 25 May 2011, the Annual General Meeting authorised the Board of Management, subject to the consent of the Supervisory Board, to issue bonds with warrants, convertible bonds and /or income bonds as well as profit participation certifi-cates, or a combination thereof, in an aggregate principal amount of up to €1 billion, on one or more occasions until 24 May 2016, thereby granting options or conversion rights for up to 75 million shares with a proportionate interest in the share capital not to exceed €75 million.
Based on this authorisation, Deutsche Post AG issued a €1 bil-lion convertible bond on 6 December 2012, allowing holders to convert the bond into up to 48 million Deutsche Post AG shares. Full use was made of the authorisation by issuing the bond. The share capital is increased on a contingent basis by up to €75 million.
Contingent Capital 2013
In its resolution dated 29 May 2013, the Annual General Meeting authorised the Board of Management, subject to the consent of the Supervisory Board, to issue bonds with warrants, convertible bonds and /or income bonds as well as profit participation certifi-cates, or a combination thereof, in an aggregate principal amount of up to €1.5 billion, on one or more occasions until 28 May 2018, thereby granting options or conversion rights for up to 75 million shares with a proportionate interest in the share capital not to exceed €75 million. The share capital is increased on a contingent basis by up to €75 million. No use was made of the authorisation in the reporting year.
Contingent Capital 2014
On 27 May 2014, the Annual General Meeting of Deutsche Post AG resolved to authorise the Board of Management to contingently increase the share capital by up to €40 million through the issue of up to 40 million new no-par value registered shares. The contin-gent capital increase serves to grant subscription rights to selected Group executives. The subscription rights may only be issued based on the aforementioned Annual General Meeting resolution of 27 May 2014. The contingent capital increase will only be im-plemented to the extent that shares are issued based on the sub-scription rights granted and the company does not settle the sub-scription rights by cash payment or delivery of treasury shares. The new shares participate in profit from the beginning of the finan cial year in which they are issued. The share capital is increased on a contingent basis by up to €40 million.
Deutsche Post DHL Group — 2014 Annual Report
173Consolidated Financial Statements — noTeS — Balance sheet disclosures
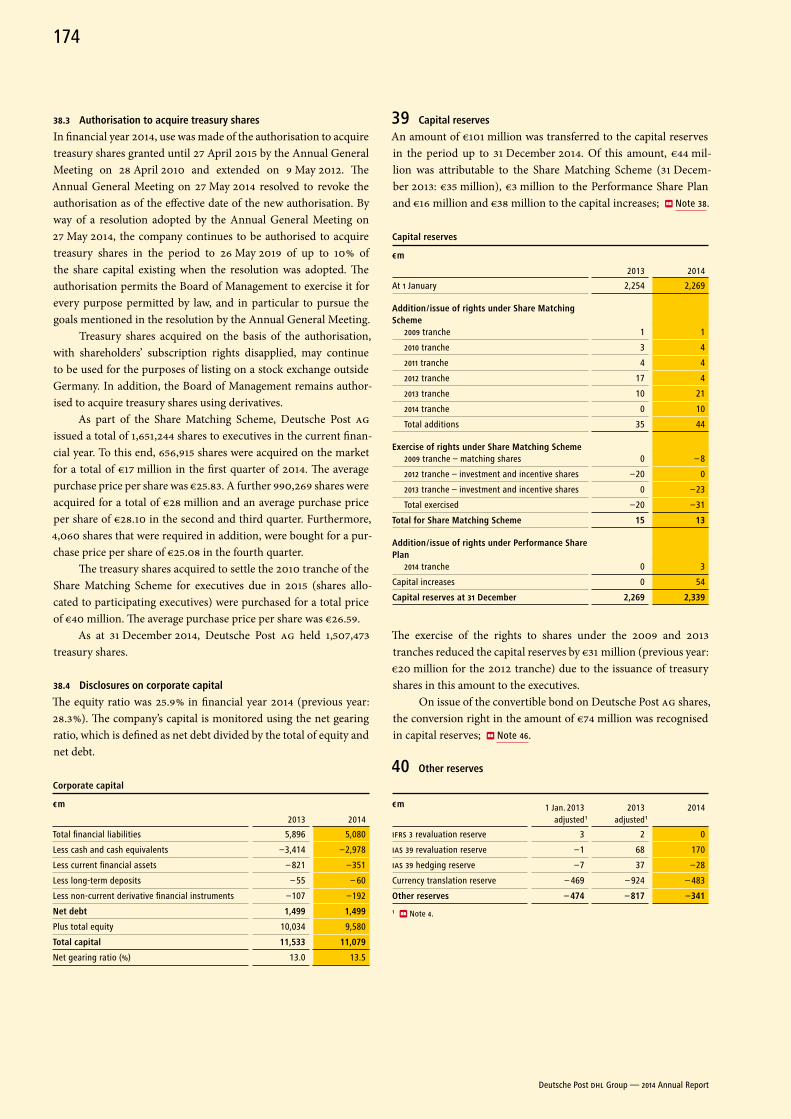
38.3 authorisation to acquire treasury shares
In financial year 2014, use was made of the authorisation to acquire treasury shares granted until 27 April 2015 by the Annual General Meeting on 28 April 2010 and extended on 9 May 2012. The Annual General Meeting on 27 May 2014 resolved to revoke the authorisation as of the effective date of the new authorisation. By way of a resolution adopted by the Annual General Meeting on 27 May 2014, the company continues to be authorised to acquire treasury shares in the period to 26 May 2019 of up to 10 % of the share capital existing when the resolution was adopted. The author isation permits the Board of Management to exercise it for every purpose permitted by law, and in particular to pursue the goals mentioned in the resolution by the Annual General Meeting.
Treasury shares acquired on the basis of the authorisation, with shareholders’ subscription rights disapplied, may continue to be used for the purposes of listing on a stock exchange outside Germany. In addition, the Board of Management remains author-ised to acquire treasury shares using derivatives.
As part of the Share Matching Scheme, Deutsche Post AG issued a total of 1,651,244 shares to executives in the current finan-cial year. To this end, 656,915 shares were acquired on the market for a total of €17 million in the first quarter of 2014. The average purchase price per share was €25.83. A further 990,269 shares were acquired for a total of €28 million and an average purchase price per share of €28.10 in the second and third quarter. Furthermore, 4,060 shares that were required in addition, were bought for a pur-chase price per share of €25.08 in the fourth quarter.
The treasury shares acquired to settle the 2010 tranche of the Share Matching Scheme for executives due in 2015 (shares allo-cated to participating executives) were purchased for a total price of €40 million. The average purchase price per share was €26.59.
As at 31 December 2014, Deutsche Post AG held 1,507,473 treasury shares.
38.4 Disclosures on corporate capital
The equity ratio was 25.9 % in financial year 2014 (previous year: 28.3 %). The company’s capital is monitored using the net gearing ratio, which is defined as net debt divided by the total of equity and net debt.
Corporate capital
€ m
2013 2014
Total financial liabilities 5,896 5,080
Less cash and cash equivalents –3,414 –2,978
Less current financial assets – 821 –351
Less long-term deposits – 55 – 60
Less non-current derivative financial instruments –107 –192
net debt 1,499 1,499
Plus total equity 10,034 9,580
Total capital 11,533 11,079
Net gearing ratio (%) 13.0 13.5
39 Capital reserves
An amount of €101 million was transferred to the capital reserves in the period up to 31 December 2014. Of this amount, €44 mil-lion was attributable to the Share Matching Scheme (31 Decem-ber 2013: €35 million), €3 million to the Performance Share Plan and €16 million and €38 million to the capital increases; Note 38.
Capital reserves
€ m
2013 2014
At 1 January 2,254 2,269
addition / issue of rights under Share Matching Scheme
2009 tranche 1 1
2010 tranche 3 4
2011 tranche 4 4
2012 tranche 17 4
2013 tranche 10 21
2014 tranche 0 10
Total additions 35 44
exercise of rights under Share Matching Scheme2009 tranche – matching shares 0 – 8
2012 tranche – investment and incentive shares –20 0
2013 tranche – investment and incentive shares 0 –23
Total exercised –20 –31
Total for Share Matching Scheme 15 13
addition / issue of rights under Performance Share Plan
2014 tranche 0 3
Capital increases 0 54
Capital reserves at 31 December 2,269 2,339
The exercise of the rights to shares under the 2009 and 2013 tranches reduced the capital reserves by €31 million (previous year: €20 million for the 2012 tranche) due to the issuance of treasury shares in this amount to the executives.
On issue of the convertible bond on Deutsche Post AG shares, the conversion right in the amount of €74 million was recognised in capital reserves; Note 46.
40 other reserves
€ m 1 Jan. 2013 adjusted 1
2013 adjusted 1
2014
IFRS 3 revaluation reserve 3 2 0
IAS 39 revaluation reserve –1 68 170
IAS 39 hedging reserve –7 37 –28
Currency translation reserve – 469 – 924 – 483
other reserves – 474 – 817 –341
1 Note 4.
Deutsche Post DHL Group — 2014 Annual Report
174
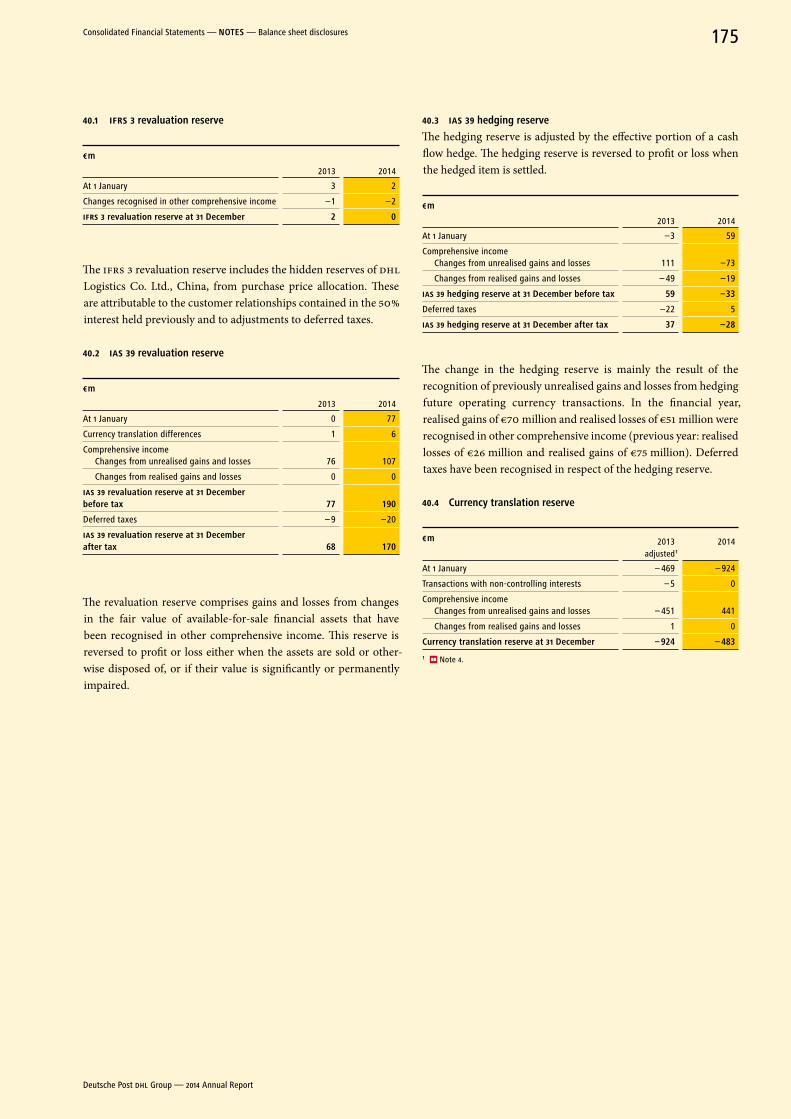
40.1 IFRS 3 revaluation reserve
€ m
2013 2014
At 1 January 3 2
Changes recognised in other comprehensive income –1 –2
IFRS 3 revaluation reserve at 31 December 2 0
The IFRS 3 revaluation reserve includes the hidden reserves of DHL Logistics Co. Ltd., China, from purchase price allocation. These are attributable to the customer relationships contained in the 50 % interest held previously and to adjustments to deferred taxes.
40.2 IAS 39 revaluation reserve
€ m
2013 2014
At 1 January 0 77
Currency translation differences 1 6
Comprehensive incomeChanges from unrealised gains and losses 76 107
Changes from realised gains and losses 0 0
IAS 39 revaluation reserve at 31 December before tax 77 190
Deferred taxes – 9 –20
IAS 39 revaluation reserve at 31 December after tax 68 170
The revaluation reserve comprises gains and losses from changes in the fair value of available-for-sale financial assets that have been recognised in other comprehensive income. This reserve is reversed to profit or loss either when the assets are sold or other-wise disposed of, or if their value is significantly or permanently impaired.
40.3 IAS 39 hedging reserve
The hedging reserve is adjusted by the effective portion of a cash flow hedge. The hedging reserve is reversed to profit or loss when the hedged item is settled.
€ m
2013 2014
At 1 January –3 59
Comprehensive incomeChanges from unrealised gains and losses 111 –73
Changes from realised gains and losses – 49 –19
IAS 39 hedging reserve at 31 December before tax 59 –33
Deferred taxes –22 5
IAS 39 hedging reserve at 31 December after tax 37 –28
The change in the hedging reserve is mainly the result of the recognition of previously unrealised gains and losses from hedging future operating currency transactions. In the financial year, realised gains of €70 million and realised losses of €51 million were recognised in other comprehensive income (previous year: realised losses of €26 million and realised gains of €75 million). Deferred taxes have been recognised in respect of the hedging reserve.
40.4 Currency translation reserve
€ m 2013 adjusted 1
2014
At 1 January – 469 – 924
Transactions with non-controlling interests – 5 0
Comprehensive incomeChanges from unrealised gains and losses – 451 441
Changes from realised gains and losses 1 0
Currency translation reserve at 31 December – 924 – 483
1 Note 4.
Deutsche Post DHL Group — 2014 Annual Report
175Consolidated Financial Statements — noTeS — Balance sheet disclosures
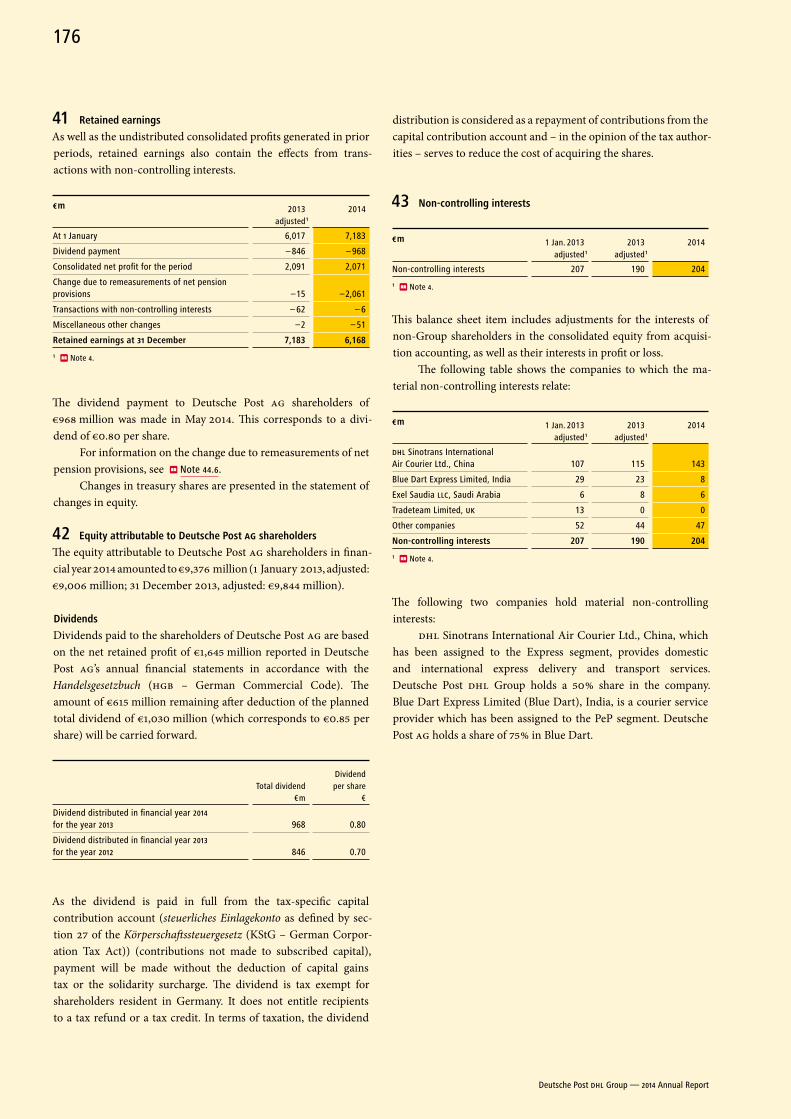
41 retained earnings
As well as the undistributed consolidated profits generated in prior periods, retained earnings also contain the effects from trans-actions with non-controlling interests.
€ m 2013 adjusted 1
2014
At 1 January 6,017 7,183
Dividend payment – 846 – 968
Consolidated net profit for the period 2,091 2,071
Change due to remeasurements of net pension provisions –15 –2,061
Transactions with non-controlling interests – 62 – 6
Miscellaneous other changes –2 – 51
retained earnings at 31 December 7,183 6,168
1 Note 4.
The dividend payment to Deutsche Post AG shareholders of €968 million was made in May 2014. This corresponds to a divi-dend of €0.80 per share.
For information on the change due to remeasurements of net pension provisions, see Note 44.6.
Changes in treasury shares are presented in the statement of changes in equity.
42 equity attributable to Deutsche Post AG shareholders
The equity attributable to Deutsche Post AG shareholders in finan-cial year 2014 amounted to €9,376 million (1 January 2013, adjusted: €9,006 million; 31 December 2013, adjusted: €9,844 million).
Dividends
Dividends paid to the shareholders of Deutsche Post AG are based on the net retained profit of €1,645 million reported in Deutsche Post AG’s annual financial statements in accordance with the Handels gesetzbuch (HGB – German Commercial Code). The amount of €615 million remaining after deduction of the planned total dividend of €1,030 million (which corresponds to €0.85 per share) will be carried forward.
Total dividend € m
Dividend per share
€
Dividend distributed in financial year 2014 for the year 2013 968 0.80
Dividend distributed in financial year 2013 for the year 2012 846 0.70
As the dividend is paid in full from the tax-specific capital contribution account (steuerliches Einlagekonto as defined by sec-tion 27 of the Körperschaftssteuergesetz (KStG – German Corpor-ation Tax Act)) (contributions not made to subscribed capital), payment will be made without the deduction of capital gains tax or the solidarity surcharge. The dividend is tax exempt for share holders resident in Germany. It does not entitle recipients to a tax refund or a tax credit. In terms of taxation, the dividend
distribution is considered as a repayment of contributions from the capital contribution account and – in the opinion of the tax author-ities – serves to reduce the cost of acquiring the shares.
43 non-controlling interests
€ m 1 Jan. 2013 adjusted 1
2013 adjusted 1
2014
Non-controlling interests 207 190 204
1 Note 4.
This balance sheet item includes adjustments for the interests of non-Group shareholders in the consolidated equity from acquisi-tion accounting, as well as their interests in profit or loss.
The following table shows the companies to which the ma-terial non-controlling interests relate:
€ m 1 Jan. 2013 adjusted 1
2013 adjusted 1
2014
DHL Sinotrans International Air Courier Ltd., China 107 115 143
Blue Dart Express Limited, India 29 23 8
Exel Saudia LLC, Saudi Arabia 6 8 6
Tradeteam Limited, UK 13 0 0
Other companies 52 44 47
non-controlling interests 207 190 204
1 Note 4.
The following two companies hold material non-controlling interests:
DHL Sinotrans International Air Courier Ltd., China, which has been assigned to the Express segment, provides domestic and international express delivery and transport services. Deutsche Post DHL Group holds a 50 % share in the company. Blue Dart Express Limited (Blue Dart), India, is a courier service provider which has been assigned to the PeP segment. Deutsche Post AG holds a share of 75 % in Blue Dart.
Deutsche Post DHL Group — 2014 Annual Report
176
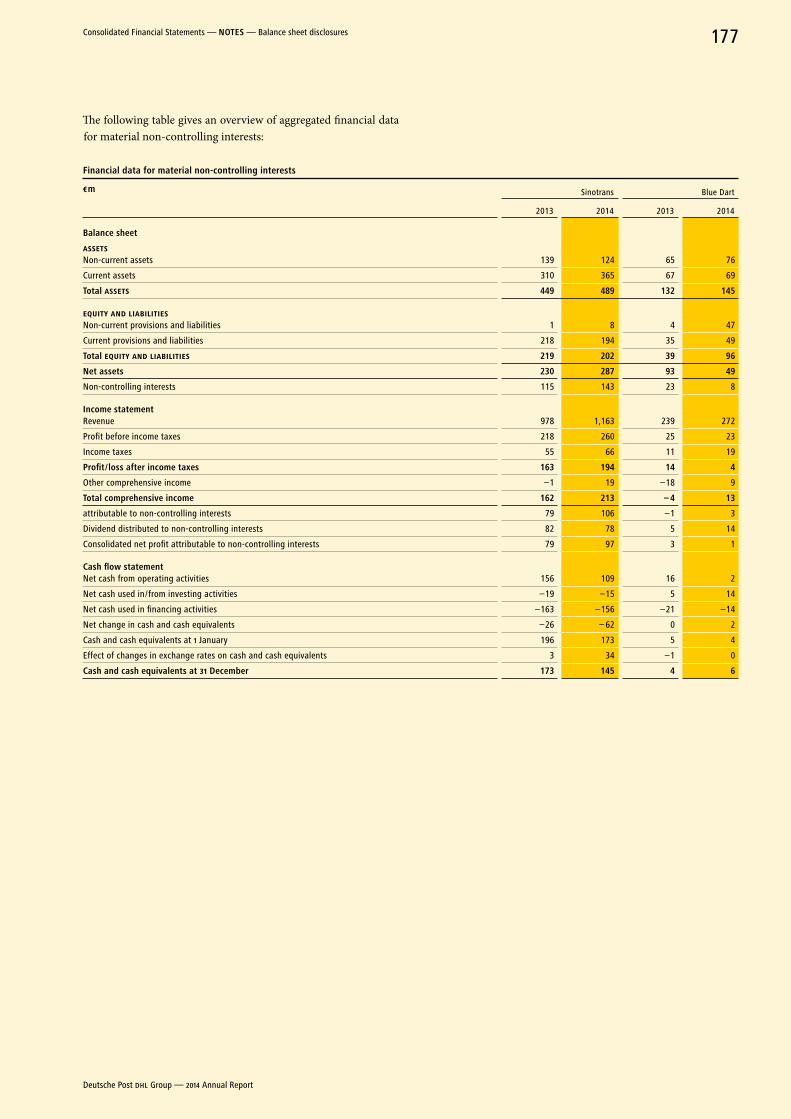
The following table gives an overview of aggregated financial data for material non-controlling interests:
Financial data for material non-controlling interests
€ m Sinotrans Blue Dart
2013 2014 2013 2014
Balance sheet
ASSETSNon-current assets 139 124 65 76
Current assets 310 365 67 69
Total ASSETS 449 489 132 145
EQUITY AND LIABILITIESNon-current provisions and liabilities 1 8 4 47
Current provisions and liabilities 218 194 35 49
Total EQUITY AND LIABILITIES 219 202 39 96
net assets 230 287 93 49
Non-controlling interests 115 143 23 8
Income statementRevenue 978 1,163 239 272
Profit before income taxes 218 260 25 23
Income taxes 55 66 11 19
Profit / loss after income taxes 163 194 14 4
Other comprehensive income –1 19 –18 9
Total comprehensive income 162 213 – 4 13
attributable to non-controlling interests 79 106 –1 3
Dividend distributed to non-controlling interests 82 78 5 14
Consolidated net profit attributable to non-controlling interests 79 97 3 1
Cash flow statementNet cash from operating activities 156 109 16 2
Net cash used in / from investing activities –19 –15 5 14
Net cash used in financing activities –163 –156 –21 –14
Net change in cash and cash equivalents –26 – 62 0 2
Cash and cash equivalents at 1 January 196 173 5 4
Effect of changes in exchange rates on cash and cash equivalents 3 34 –1 0
Cash and cash equivalents at 31 December 173 145 4 6
Deutsche Post DHL Group — 2014 Annual Report
177Consolidated Financial Statements — noTeS — Balance sheet disclosures
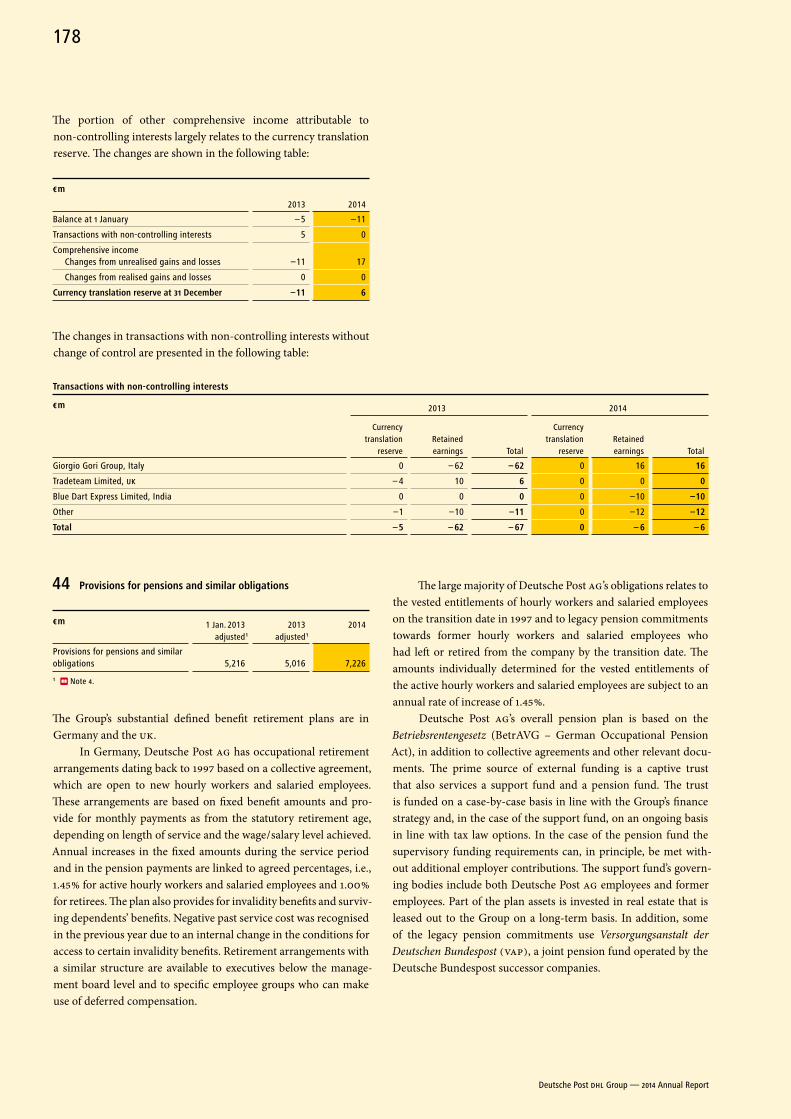
The portion of other comprehensive income attributable to non-controlling interests largely relates to the currency translation reserve. The changes are shown in the following table:
€ m
2013 2014
Balance at 1 January – 5 –11
Transactions with non-controlling interests 5 0
Comprehensive incomeChanges from unrealised gains and losses –11 17
Changes from realised gains and losses 0 0
Currency translation reserve at 31 December –11 6
The changes in transactions with non-controlling interests without change of control are presented in the following table:
Transactions with non-controlling interests
€ m 2013 2014
Currency translation
reserveRetained earnings Total
Currency translation
reserveRetained earnings Total
Giorgio Gori Group, Italy 0 – 62 – 62 0 16 16
Tradeteam Limited, UK – 4 10 6 0 0 0
Blue Dart Express Limited, India 0 0 0 0 –10 –10
Other –1 –10 –11 0 –12 –12
Total – 5 – 62 – 67 0 – 6 – 6
44 Provisions for pensions and similar obligations
€ m 1 Jan. 2013 adjusted 1
2013 adjusted 1
2014
Provisions for pensions and similar obligations 5,216 5,016 7,226
1 Note 4.
The Group’s substantial defined benefit retirement plans are in Germany and the UK.
In Germany, Deutsche Post AG has occupational retirement arrangements dating back to 1997 based on a collective agreement, which are open to new hourly workers and salaried employees. These arrangements are based on fixed benefit amounts and pro-vide for monthly payments as from the statutory retirement age, depending on length of service and the wage / salary level achieved. Annual increases in the fixed amounts during the service period and in the pension payments are linked to agreed percentages, i.e., 1.45 % for active hourly workers and salaried employees and 1.00 % for retirees. The plan also provides for invalidity benefits and surviv-ing dependents’ benefits. Negative past service cost was recognised in the previous year due to an internal change in the conditions for access to certain invalidity benefits. Retirement arrange ments with a similar structure are available to executives below the manage-ment board level and to specific employee groups who can make use of deferred compensation.
The large majority of Deutsche Post AG’s obligations relates to the vested entitlements of hourly workers and salaried employees on the transition date in 1997 and to legacy pension commitments towards former hourly workers and salaried employees who had left or retired from the company by the transition date. The amounts individually determined for the vested entitlements of the active hourly workers and salaried employees are subject to an annual rate of increase of 1.45 %.
Deutsche Post AG’s overall pension plan is based on the Betriebsrentengesetz (BetrAVG – German Occupational Pension Act), in addition to collective agreements and other relevant docu-ments. The prime source of external funding is a captive trust that also services a support fund and a pension fund. The trust is funded on a case-by-case basis in line with the Group’s finance strategy and, in the case of the support fund, on an ongoing basis in line with tax law options. In the case of the pension fund the super visory funding requirements can, in principle, be met with-out additional employer contributions. The support fund’s govern-ing bodies include both Deutsche Post AG employees and former employees. Part of the plan assets is invested in real estate that is leased out to the Group on a long-term basis. In addition, some of the legacy pension commitments use Versorgungsanstalt der Deutschen Bundespost (VAP), a joint pension fund operated by the Deutsche Bundespost successor companies.
Deutsche Post DHL Group — 2014 Annual Report
178
Individual subsidiaries in Germany have retirement plans that were acquired in the context of acquisitions and transfers of operations and that are closed to new entrants.
In the UK, the Group’s defined benefit pension arrangements have largely been closed to new entrants for a number of years. In addition, Deutsche Post DHL Group committed itself to a change in its pension strategy in the UK on 26 November 2013, and these arrange ments are now also largely closed for further service accrual, with effect from 1 April 2014. As a result, negative past service cost was recognised in the prior year (shown in the tables below before closure costs and transitional payments). Since 1 April 2014, the employees affected have been able to participate in a defined con-tribution arrangement.
Currently, one single defined benefit pension arrangement of the Group in the UK remains open to existing employees, who have not yet chosen to join, or to new employees as a result of a business transfer from the UK government. It provides for monthly payments from retirement, depending on length of service and final salary. In addition, a pension commencement lump sum is payable. Indexation of pension payments is linked to inflation. This arrangement also includes invalidity benefits and surviving dependents’ benefits.
The majority of the Group’s (defined benefit) arrangements in the UK have been consolidated into a group plan with different sections for the participating divisions. These are largely funded via a group trust. The amount of the employer contributions must be negotiated with the trustee in the course of funding valuations. The trustee’s directors are Group employees, former employees and non-Group third parties, all of whom are required to be independ-ent. Employee beneficiaries make their own funding contributions in the case of the remaining open defined benefit arrangement. The group plan is mainly governed by the corresponding trust deed and rules and the UK Pensions Acts.
A wide variety of other defined benefit retirement plans in the Group are to be found in the Netherlands, Switzerland, the USA and a large number of other countries.
In the Netherlands, collective agreements require that those employees who are not covered by a sector-specific plan participate in a dedicated defined benefit retirement plan. Following a change in the plan in the year under review, the benefit plan is no longer based on final salary, but exclusively provides for annual accruals from 1 January 2015. In addition, a new pensionable salary cap is applied in accordance with the relevant Dutch laws. Consequently, negative past service cost had to be recognised in the year under review. The dedicated defined benefit retirement plan provides for monthly benefit payments that increase in line with the agreed wage and salary increases on the one hand and the funds available for such increases on the other.
In Switzerland, employees receive an occupational pension in line with statutory requirements, depending on the contribu-tions paid, an interest rate that is fixed each year, certain annuity factors and any pension increases specified. On 9 December 2014, a change in the plan was resolved which will lead to a change, from 1 January 2015, in the annuity factors in particular. Consequently, negative past service cost was recognised in the year under review.
In the USA, the companies’ defined benefit plans have been closed to new entrants and accrued entitlements have been frozen.
The Group companies in these three countries primarily use joint funding institutions within the Group. In the Netherlands and in Switzerland, both employers and employees contribute to plan funding. In the USA no contributions are currently made to the companies’ defined benefit plans. In the year under review, there were no material amendments, curtailments or settlements affecting the Group’s defined benefit plans in the Other area, be-yond the two plan changes in the Netherlands and Switzerland mentioned above.
Various risks arise in the context of defined benefit plans. Of these risks, the interest rate risk and investment risk in particular are still deemed to be significant.
The information below on pension obligations is broken down into the following areas: Germany, UK and Other.
Deutsche Post DHL Group — 2014 Annual Report
179Consolidated Financial Statements — noTeS — Balance sheet disclosures
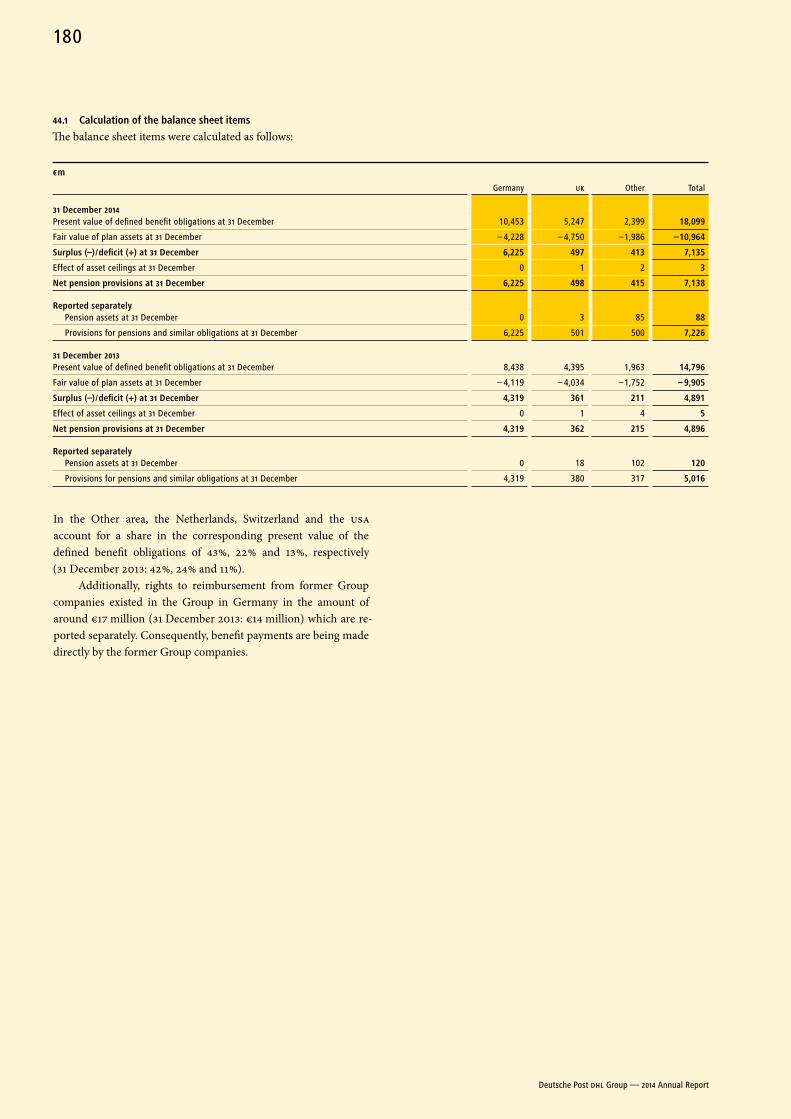
44.1 Calculation of the balance sheet items
The balance sheet items were calculated as follows:
€ m
Germany UK Other Total
31 December 2014Present value of defined benefit obligations at 31 December 10,453 5,247 2,399 18,099
Fair value of plan assets at 31 December – 4,228 – 4,750 –1,986 –10,964
Surplus (–) / deficit (+) at 31 December 6,225 497 413 7,135
Effect of asset ceilings at 31 December 0 1 2 3
net pension provisions at 31 December 6,225 498 415 7,138
reported separatelyPension assets at 31 December 0 3 85 88
Provisions for pensions and similar obligations at 31 December 6,225 501 500 7,226
31 December 2013Present value of defined benefit obligations at 31 December 8,438 4,395 1,963 14,796
Fair value of plan assets at 31 December – 4,119 – 4,034 –1,752 – 9,905
Surplus (–) / deficit (+) at 31 December 4,319 361 211 4,891
Effect of asset ceilings at 31 December 0 1 4 5
net pension provisions at 31 December 4,319 362 215 4,896
reported separatelyPension assets at 31 December 0 18 102 120
Provisions for pensions and similar obligations at 31 December 4,319 380 317 5,016
In the Other area, the Netherlands, Switzerland and the USA account for a share in the corresponding present value of the defined benefit obligations of 43 %, 22 % and 13 %, respectively (31 December 2013: 42 %, 24 % and 11 %).
Additionally, rights to reimbursement from former Group companies existed in the Group in Germany in the amount of around €17 million (31 December 2013: €14 million) which are re-ported separately. Consequently, benefit payments are being made directly by the former Group companies.
Deutsche Post DHL Group — 2014 Annual Report
180
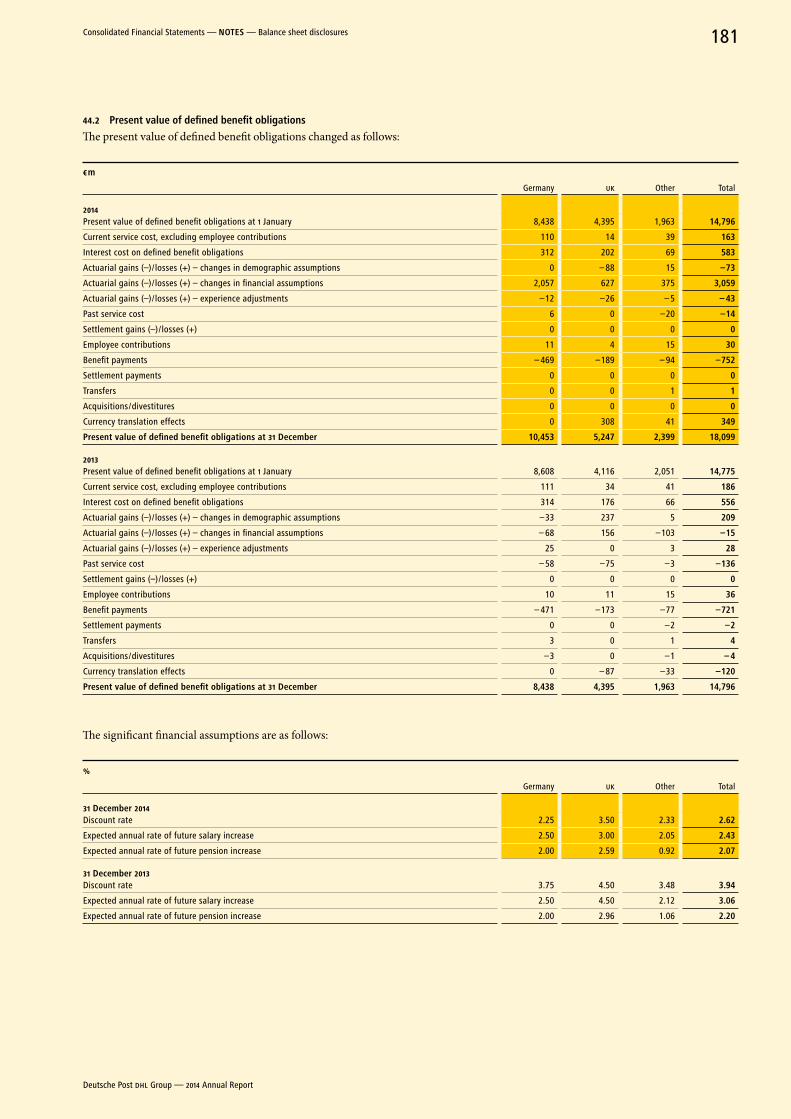
44.2 Present value of defined benefit obligations
The present value of defined benefit obligations changed as follows:
€ m
Germany UK Other Total
2014Present value of defined benefit obligations at 1 January 8,438 4,395 1,963 14,796
Current service cost, excluding employee contributions 110 14 39 163
Interest cost on defined benefit obligations 312 202 69 583
Actuarial gains (–) / losses (+) – changes in demographic assumptions 0 – 88 15 –73
Actuarial gains (–) / losses (+) – changes in financial assumptions 2,057 627 375 3,059
Actuarial gains (–) / losses (+) – experience adjustments –12 –26 – 5 – 43
Past service cost 6 0 –20 –14
Settlement gains (–) / losses (+) 0 0 0 0
Employee contributions 11 4 15 30
Benefit payments – 469 –189 – 94 –752
Settlement payments 0 0 0 0
Transfers 0 0 1 1
Acquisitions / divestitures 0 0 0 0
Currency translation effects 0 308 41 349
Present value of defined benefit obligations at 31 December 10,453 5,247 2,399 18,099
2013Present value of defined benefit obligations at 1 January 8,608 4,116 2,051 14,775
Current service cost, excluding employee contributions 111 34 41 186
Interest cost on defined benefit obligations 314 176 66 556
Actuarial gains (–) / losses (+) – changes in demographic assumptions –33 237 5 209
Actuarial gains (–) / losses (+) – changes in financial assumptions – 68 156 –103 –15
Actuarial gains (–) / losses (+) – experience adjustments 25 0 3 28
Past service cost – 58 –75 –3 –136
Settlement gains (–) / losses (+) 0 0 0 0
Employee contributions 10 11 15 36
Benefit payments – 471 –173 –77 –721
Settlement payments 0 0 –2 –2
Transfers 3 0 1 4
Acquisitions / divestitures –3 0 –1 – 4
Currency translation effects 0 – 87 –33 –120
Present value of defined benefit obligations at 31 December 8,438 4,395 1,963 14,796
The significant financial assumptions are as follows:
%
Germany UK Other Total
31 December 2014Discount rate 2.25 3.50 2.33 2.62
Expected annual rate of future salary increase 2.50 3.00 2.05 2.43
Expected annual rate of future pension increase 2.00 2.59 0.92 2.07
31 December 2013Discount rate 3.75 4.50 3.48 3.94
Expected annual rate of future salary increase 2.50 4.50 2.12 3.06
Expected annual rate of future pension increase 2.00 2.96 1.06 2.20
Deutsche Post DHL Group — 2014 Annual Report
181Consolidated Financial Statements — noTeS — Balance sheet disclosures
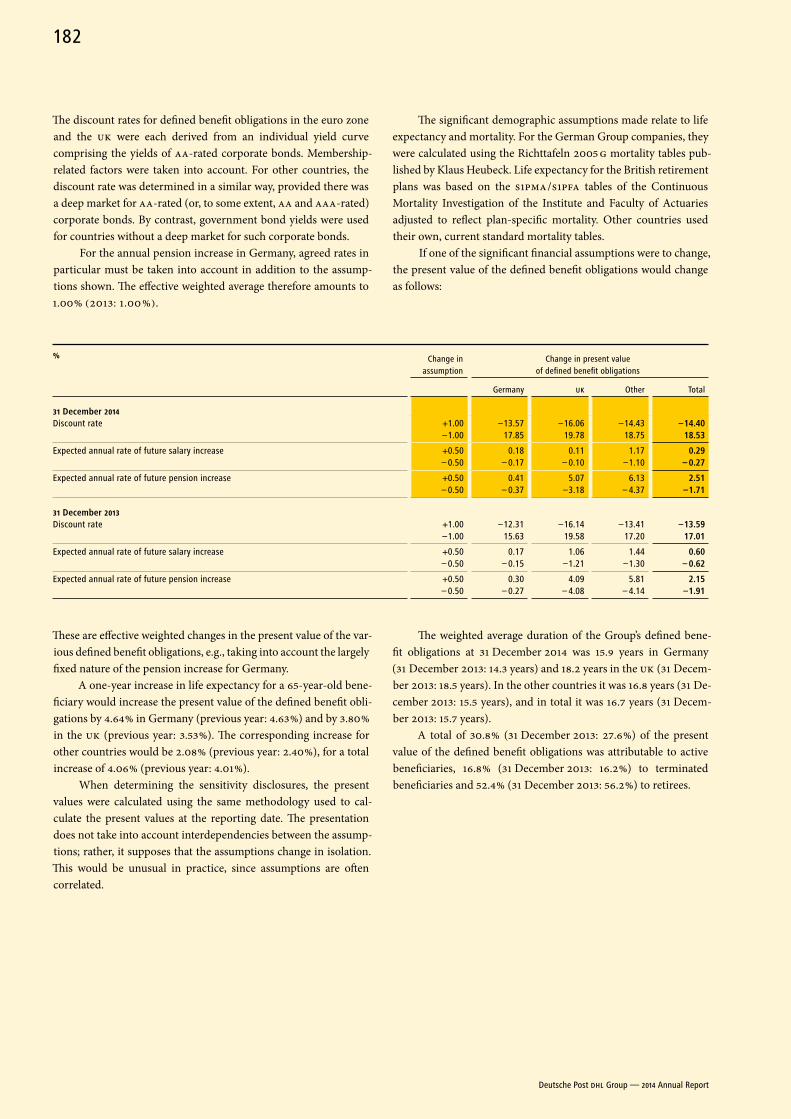
The discount rates for defined benefit obligations in the euro zone and the UK were each derived from an individual yield curve comprising the yields of AA-rated corporate bonds. Membership- related factors were taken into account. For other countries, the discount rate was determined in a similar way, provided there was a deep market for AA-rated (or, to some extent, AA and AAA-rated) corporate bonds. By contrast, government bond yields were used for countries without a deep market for such corporate bonds.
For the annual pension increase in Germany, agreed rates in particular must be taken into account in addition to the assump-tions shown. The effective weighted average therefore amounts to 1.00 % (2013: 1.00 %).
The significant demographic assumptions made relate to life expectancy and mortality. For the German Group companies, they were calculated using the Richttafeln 2005 G mortality tables pub-lished by Klaus Heubeck. Life expectancy for the British retirement plans was based on the S1PMA / S1PFA tables of the Continuous Mortality Investigation of the Institute and Faculty of Actuaries adjusted to reflect plan-specific mortality. Other countries used their own, current standard mortality tables.
If one of the significant financial assumptions were to change, the present value of the defined benefit obligations would change as follows:
% Change in assumption
Change in present value of defined benefit obligations
Germany UK Other Total
31 December 2014Discount rate +1.00
–1.00–13.57
17.85–16.06
19.78–14.43
18.75–14.40
18.53
Expected annual rate of future salary increase +0.50 – 0.50
0.18 – 0.17
0.11 – 0.10
1.17 –1.10
0.29 – 0.27
Expected annual rate of future pension increase +0.50 – 0.50
0.41 – 0.37
5.07 –3.18
6.13 – 4.37
2.51 –1.71
31 December 2013Discount rate +1.00
–1.00–12.31
15.63–16.14
19.58–13.41
17.20–13.59
17.01
Expected annual rate of future salary increase +0.50 – 0.50
0.17 – 0.15
1.06 –1.21
1.44 –1.30
0.60 – 0.62
Expected annual rate of future pension increase +0.50 – 0.50
0.30 – 0.27
4.09 – 4.08
5.81 – 4.14
2.15 –1.91
These are effective weighted changes in the present value of the var-ious defined benefit obligations, e.g., taking into account the largely fixed nature of the pension increase for Germany.
A one-year increase in life expectancy for a 65-year-old bene-ficiary would increase the present value of the defined benefit obli-gations by 4.64 % in Germany (previous year: 4.63 %) and by 3.80 % in the UK (previous year: 3.53 %). The corresponding increase for other countries would be 2.08 % (previous year: 2.40 %), for a total increase of 4.06 % (previous year: 4.01 %).
When determining the sensitivity disclosures, the present values were calculated using the same methodology used to cal-culate the present values at the reporting date. The presentation does not take into account interdependencies between the assump-tions; rather, it supposes that the assumptions change in isolation. This would be unusual in practice, since assumptions are often correlated.
The weighted average duration of the Group’s defined bene-fit obligations at 31 December 2014 was 15.9 years in Germany (31 December 2013: 14.3 years) and 18.2 years in the UK (31 Decem-ber 2013: 18.5 years). In the other countries it was 16.8 years (31 De-cember 2013: 15.5 years), and in total it was 16.7 years (31 Decem-ber 2013: 15.7 years).
A total of 30.8 % (31 December 2013: 27.6 %) of the present value of the defined benefit obligations was attributable to active beneficiaries, 16.8 % (31 December 2013: 16.2 %) to terminated bene ficiaries and 52.4 % (31 December 2013: 56.2 %) to retirees.
Deutsche Post DHL Group — 2014 Annual Report
182
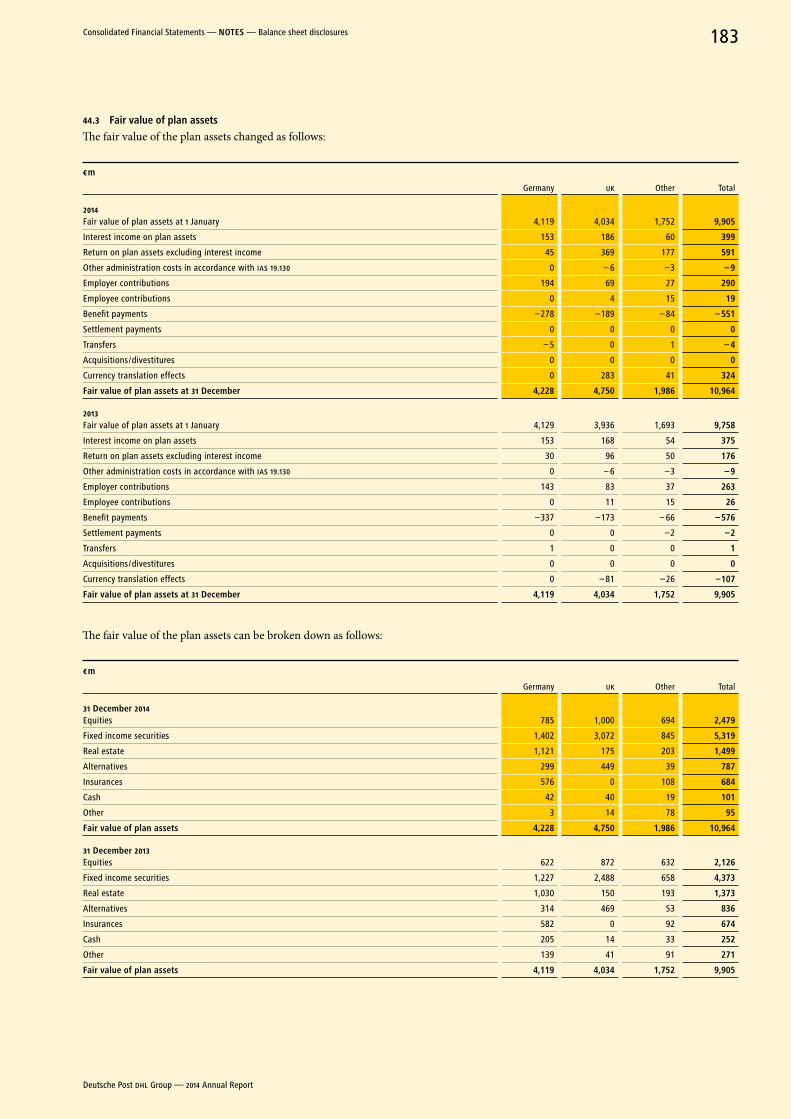
44.3 Fair value of plan assets
The fair value of the plan assets changed as follows:
€ m
Germany UK Other Total
2014Fair value of plan assets at 1 January 4,119 4,034 1,752 9,905
Interest income on plan assets 153 186 60 399
Return on plan assets excluding interest income 45 369 177 591
Other administration costs in accordance with IAS 19.130 0 – 6 –3 – 9
Employer contributions 194 69 27 290
Employee contributions 0 4 15 19
Benefit payments –278 –189 – 84 – 551
Settlement payments 0 0 0 0
Transfers – 5 0 1 – 4
Acquisitions / divestitures 0 0 0 0
Currency translation effects 0 283 41 324
Fair value of plan assets at 31 December 4,228 4,750 1,986 10,964
2013Fair value of plan assets at 1 January 4,129 3,936 1,693 9,758
Interest income on plan assets 153 168 54 375
Return on plan assets excluding interest income 30 96 50 176
Other administration costs in accordance with IAS 19.130 0 – 6 –3 – 9
Employer contributions 143 83 37 263
Employee contributions 0 11 15 26
Benefit payments –337 –173 – 66 – 576
Settlement payments 0 0 –2 –2
Transfers 1 0 0 1
Acquisitions / divestitures 0 0 0 0
Currency translation effects 0 – 81 –26 –107
Fair value of plan assets at 31 December 4,119 4,034 1,752 9,905
The fair value of the plan assets can be broken down as follows:
€ m
Germany UK Other Total
31 December 2014Equities 785 1,000 694 2,479
Fixed income securities 1,402 3,072 845 5,319
Real estate 1,121 175 203 1,499
Alternatives 299 449 39 787
Insurances 576 0 108 684
Cash 42 40 19 101
Other 3 14 78 95
Fair value of plan assets 4,228 4,750 1,986 10,964
31 December 2013Equities 622 872 632 2,126
Fixed income securities 1,227 2,488 658 4,373
Real estate 1,030 150 193 1,373
Alternatives 314 469 53 836
Insurances 582 0 92 674
Cash 205 14 33 252
Other 139 41 91 271
Fair value of plan assets 4,119 4,034 1,752 9,905
Deutsche Post DHL Group — 2014 Annual Report
183Consolidated Financial Statements — noTeS — Balance sheet disclosures
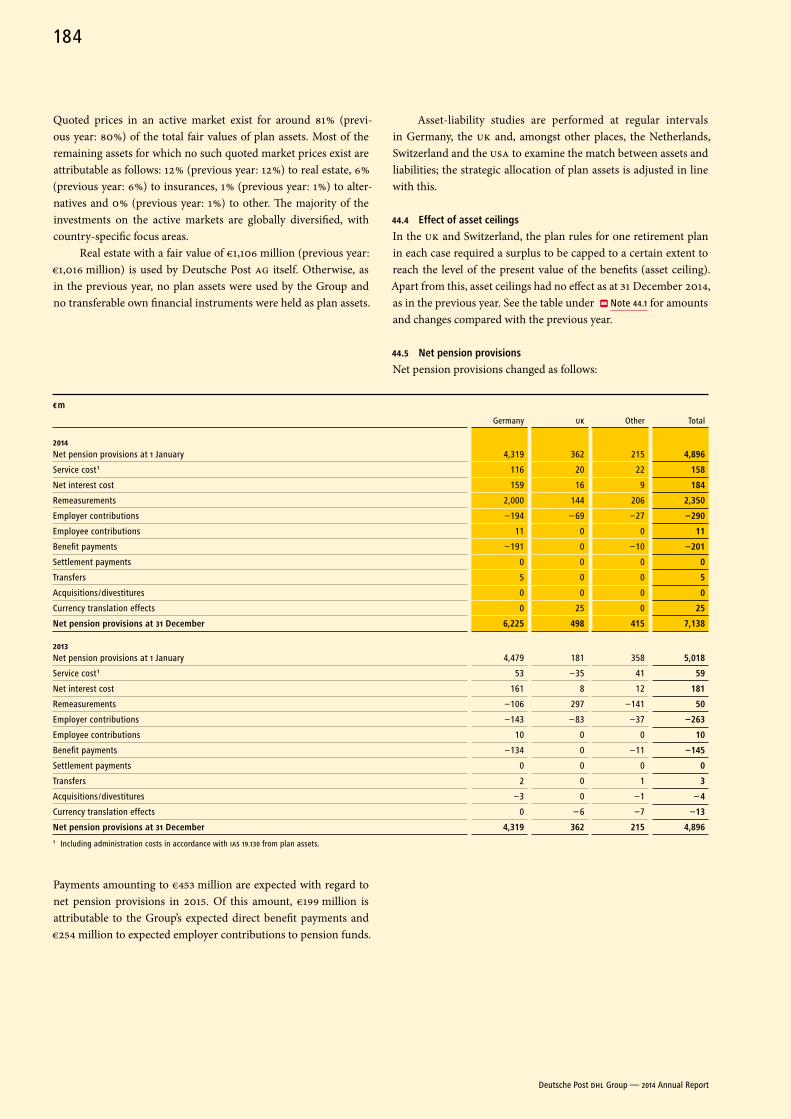
Quoted prices in an active market exist for around 81 % (previ-ous year: 80 %) of the total fair values of plan assets. Most of the remain ing assets for which no such quoted market prices exist are attributable as follows: 12 % (previous year: 12 %) to real estate, 6 % (previous year: 6 %) to insurances, 1 % (previous year: 1 %) to alter-natives and 0 % (previous year: 1 %) to other. The majority of the investments on the active markets are globally diversified, with country-specific focus areas.
Real estate with a fair value of €1,106 million (previous year: €1,016 million) is used by Deutsche Post AG itself. Otherwise, as in the previous year, no plan assets were used by the Group and no transferable own financial instruments were held as plan assets.
Asset-liability studies are performed at regular intervals in Germany, the UK and, amongst other places, the Netherlands, Switzer land and the USA to examine the match between assets and liabilities; the strategic allocation of plan assets is adjusted in line with this.
44.4 effect of asset ceilings
In the UK and Switzerland, the plan rules for one retirement plan in each case required a surplus to be capped to a certain extent to reach the level of the present value of the benefits (asset ceiling). Apart from this, asset ceilings had no effect as at 31 December 2014, as in the previous year. See the table under Note 44.1 for amounts and changes compared with the previous year.
44.5 net pension provisions
Net pension provisions changed as follows:
€ m
Germany UK Other Total
2014Net pension provisions at 1 January 4,319 362 215 4,896
Service cost 1 116 20 22 158
Net interest cost 159 16 9 184
Remeasurements 2,000 144 206 2,350
Employer contributions –194 – 69 –27 –290
Employee contributions 11 0 0 11
Benefit payments –191 0 –10 –201
Settlement payments 0 0 0 0
Transfers 5 0 0 5
Acquisitions / divestitures 0 0 0 0
Currency translation effects 0 25 0 25
net pension provisions at 31 December 6,225 498 415 7,138
2013Net pension provisions at 1 January 4,479 181 358 5,018
Service cost 1 53 –35 41 59
Net interest cost 161 8 12 181
Remeasurements –106 297 –141 50
Employer contributions –143 – 83 –37 –263
Employee contributions 10 0 0 10
Benefit payments –134 0 –11 –145
Settlement payments 0 0 0 0
Transfers 2 0 1 3
Acquisitions / divestitures –3 0 –1 – 4
Currency translation effects 0 – 6 –7 –13
net pension provisions at 31 December 4,319 362 215 4,8961 Including administration costs in accordance with IAS 19.130 from plan assets.
Payments amounting to €453 million are expected with regard to net pension provisions in 2015. Of this amount, €199 million is attributable to the Group’s expected direct benefit payments and €254 million to expected employer contributions to pension funds.
Deutsche Post DHL Group — 2014 Annual Report
184
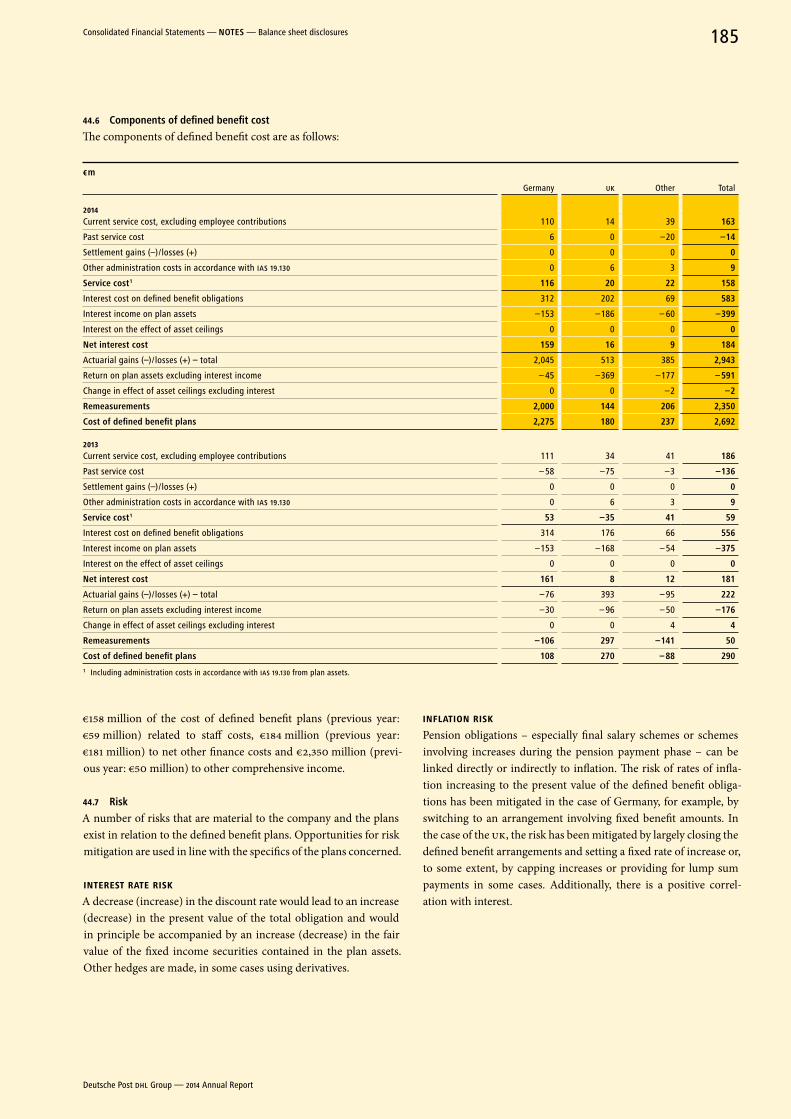
44.6 Components of defined benefit cost
The components of defined benefit cost are as follows:
€ m
Germany UK Other Total
2014Current service cost, excluding employee contributions 110 14 39 163
Past service cost 6 0 –20 –14
Settlement gains (–) / losses (+) 0 0 0 0
Other administration costs in accordance with IAS 19.130 0 6 3 9
Service cost 1 116 20 22 158
Interest cost on defined benefit obligations 312 202 69 583
Interest income on plan assets –153 –186 – 60 –399
Interest on the effect of asset ceilings 0 0 0 0
net interest cost 159 16 9 184
Actuarial gains (–) / losses (+) – total 2,045 513 385 2,943
Return on plan assets excluding interest income – 45 –369 –177 – 591
Change in effect of asset ceilings excluding interest 0 0 –2 –2
remeasurements 2,000 144 206 2,350
Cost of defined benefit plans 2,275 180 237 2,692
2013Current service cost, excluding employee contributions 111 34 41 186
Past service cost – 58 –75 –3 –136
Settlement gains (–) / losses (+) 0 0 0 0
Other administration costs in accordance with IAS 19.130 0 6 3 9
Service cost 1 53 –35 41 59
Interest cost on defined benefit obligations 314 176 66 556
Interest income on plan assets –153 –168 – 54 –375
Interest on the effect of asset ceilings 0 0 0 0
net interest cost 161 8 12 181
Actuarial gains (–) / losses (+) – total –76 393 – 95 222
Return on plan assets excluding interest income –30 – 96 – 50 –176
Change in effect of asset ceilings excluding interest 0 0 4 4
remeasurements –106 297 –141 50
Cost of defined benefit plans 108 270 – 88 2901 Including administration costs in accordance with IAS 19.130 from plan assets.
€158 million of the cost of defined benefit plans (previous year: €59 million) related to staff costs, €184 million (previous year: €181 million) to net other finance costs and €2,350 million (previ-ous year: €50 million) to other comprehensive income.
44.7 risk
A number of risks that are material to the company and the plans exist in relation to the defined benefit plans. Opportunities for risk mitigation are used in line with the specifics of the plans concerned.
INTEREST RATE RISKA decrease (increase) in the discount rate would lead to an increase (decrease) in the present value of the total obligation and would in principle be accompanied by an increase (decrease) in the fair value of the fixed income securities contained in the plan assets. Other hedges are made, in some cases using derivatives.
INFLATION RISKPension obligations – especially final salary schemes or schemes involving increases during the pension payment phase – can be linked directly or indirectly to inflation. The risk of rates of infla-tion increasing to the present value of the defined benefit obliga-tions has been mitigated in the case of Germany, for example, by switching to an arrangement involving fixed benefit amounts. In the case of the UK, the risk has been mitigated by largely closing the defined benefit arrangements and setting a fixed rate of increase or, to some extent, by capping increases or providing for lump sum payments in some cases. Additionally, there is a positive correl-ation with interest.
Deutsche Post DHL Group — 2014 Annual Report
185Consolidated Financial Statements — noTeS — Balance sheet disclosures
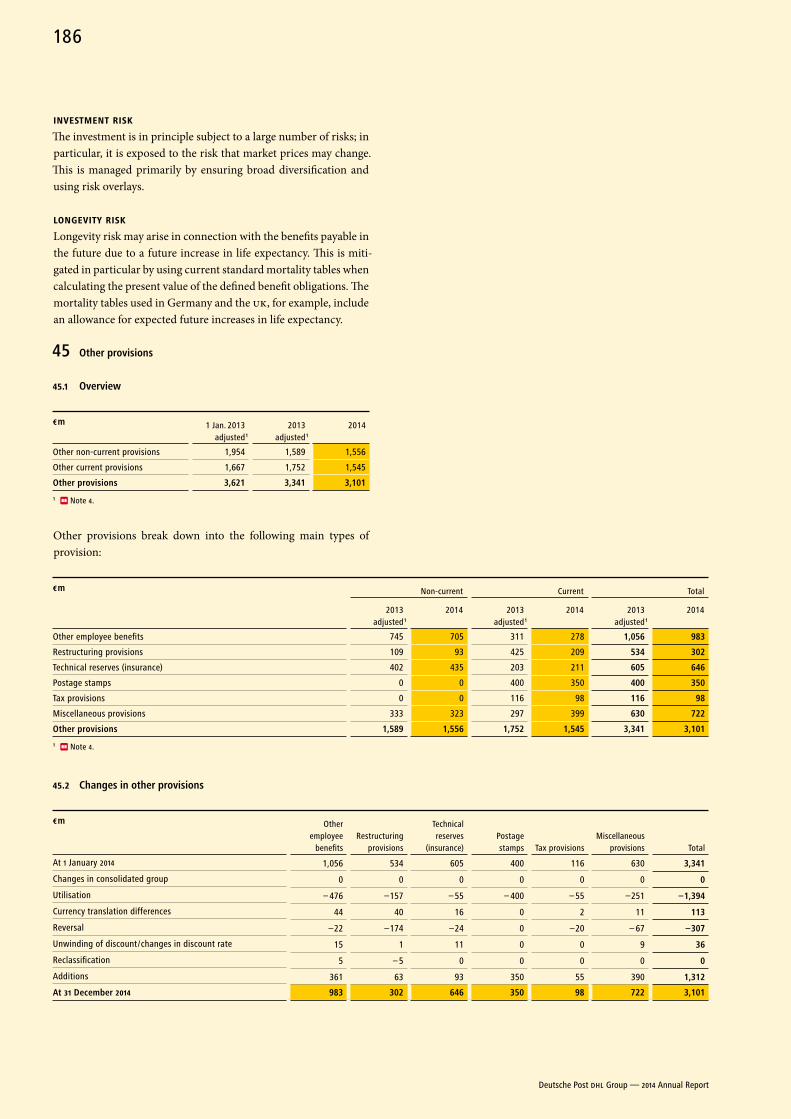
INvESTMENT RISKThe investment is in principle subject to a large number of risks; in particular, it is exposed to the risk that market prices may change. This is managed primarily by ensuring broad diversification and using risk overlays.
LONGEvITY RISKLongevity risk may arise in connection with the benefits payable in the future due to a future increase in life expectancy. This is miti-gated in particular by using current standard mortality tables when calculating the present value of the defined benefit obligations. The mortality tables used in Germany and the UK, for example, include an allowance for expected future increases in life expectancy.
45 other provisions
45.1 overview
€ m 1 Jan. 2013 adjusted 1
2013 adjusted 1
2014
Other non-current provisions 1,954 1,589 1,556
Other current provisions 1,667 1,752 1,545
other provisions 3,621 3,341 3,101
1 Note 4.
Other provisions break down into the following main types of provision:
€ m Non-current Current Total
2013
adjusted 1
2014 2013 adjusted 1
2014 2013 adjusted 1
2014
Other employee benefits 745 705 311 278 1,056 983
Restructuring provisions 109 93 425 209 534 302
Technical reserves (insurance) 402 435 203 211 605 646
Postage stamps 0 0 400 350 400 350
Tax provisions 0 0 116 98 116 98
Miscellaneous provisions 333 323 297 399 630 722
other provisions 1,589 1,556 1,752 1,545 3,341 3,101
1 Note 4.
45.2 Changes in other provisions
€ m Other employee
benefitsRestructuring
provisions
Technical reserves
(insurance)Postage stamps Tax provisions
Miscellaneous provisions Total
At 1 January 2014 1,056 534 605 400 116 630 3,341
Changes in consolidated group 0 0 0 0 0 0 0
Utilisation – 476 –157 – 55 – 400 – 55 –251 –1,394
Currency translation differences 44 40 16 0 2 11 113
Reversal –22 –174 –24 0 –20 – 67 –307
Unwinding of discount / changes in discount rate 15 1 11 0 0 9 36
Reclassification 5 – 5 0 0 0 0 0
Additions 361 63 93 350 55 390 1,312
at 31 December 2014 983 302 646 350 98 722 3,101
Deutsche Post DHL Group — 2014 Annual Report
186
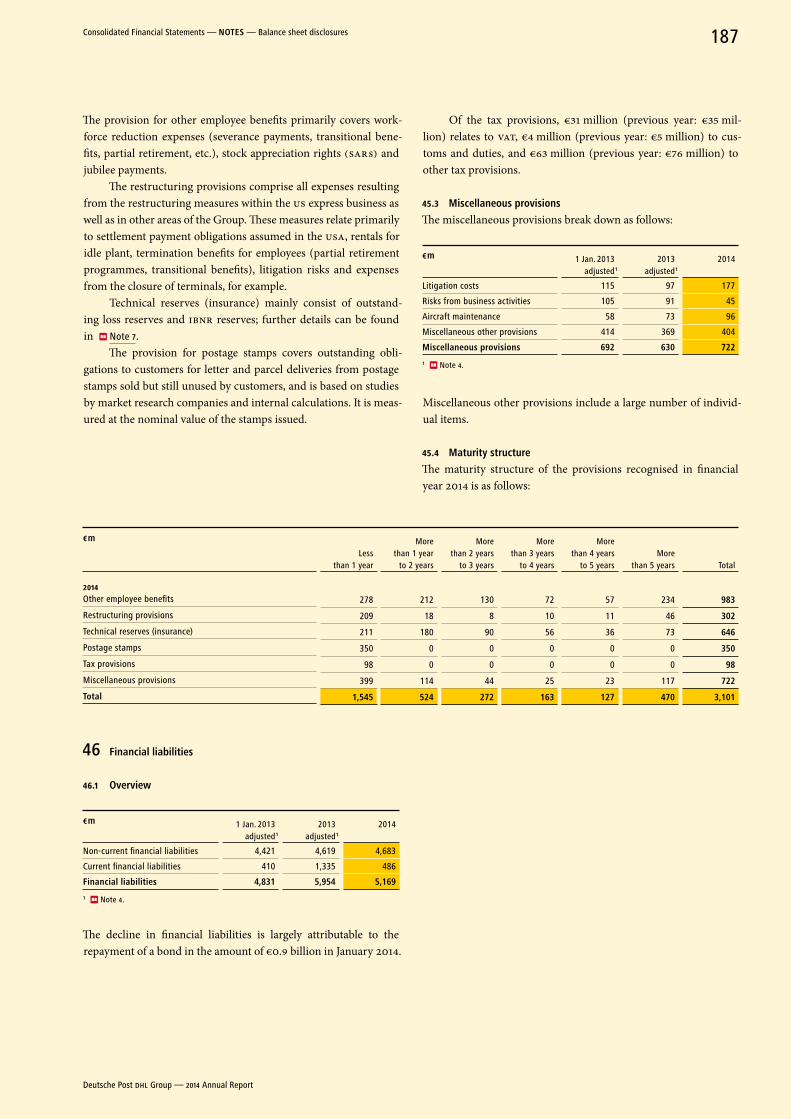
The provision for other employee benefits primarily covers work-force reduction expenses (severance payments, transitional bene-fits, partial retirement, etc.), stock appreciation rights (SAR s) and jubilee payments.
The restructuring provisions comprise all expenses resulting from the restructuring measures within the US express business as well as in other areas of the Group. These measures relate primarily to settlement payment obligations assumed in the USA, rentals for idle plant, termination benefits for employees (partial retirement programmes, transitional benefits), litigation risks and expenses from the closure of terminals, for example.
Technical reserves (insurance) mainly consist of outstand-ing loss reserves and IBNR reserves; further details can be found in Note 7.
The provision for postage stamps covers outstanding obli-gations to customers for letter and parcel deliveries from postage stamps sold but still unused by customers, and is based on studies by market research companies and internal calculations. It is meas-ured at the nominal value of the stamps issued.
Of the tax provisions, €31 million (previous year: €35 mil-lion) relates to VAT, €4 million (previous year: €5 million) to cus-toms and duties, and €63 million (previous year: €76 million) to other tax provisions.
45.3 Miscellaneous provisions
The miscellaneous provisions break down as follows:
€ m 1 Jan. 2013 adjusted 1
2013 adjusted 1
2014
Litigation costs 115 97 177
Risks from business activities 105 91 45
Aircraft maintenance 58 73 96
Miscellaneous other provisions 414 369 404
Miscellaneous provisions 692 630 722
1 Note 4.
Miscellaneous other provisions include a large number of individ-ual items.
45.4 Maturity structure
The maturity structure of the provisions recognised in financial year 2014 is as follows:
€ m
Less than 1 year
More than 1 year
to 2 years
More than 2 years
to 3 years
More than 3 years
to 4 years
More than 4 years
to 5 yearsMore
than 5 years Total
2014Other employee benefits 278 212 130 72 57 234 983
Restructuring provisions 209 18 8 10 11 46 302
Technical reserves (insurance) 211 180 90 56 36 73 646
Postage stamps 350 0 0 0 0 0 350
Tax provisions 98 0 0 0 0 0 98
Miscellaneous provisions 399 114 44 25 23 117 722
Total 1,545 524 272 163 127 470 3,101
46 Financial liabilities
46.1 overview
€ m 1 Jan. 2013 adjusted 1
2013 adjusted 1
2014
Non-current financial liabilities 4,421 4,619 4,683
Current financial liabilities 410 1,335 486
Financial liabilities 4,831 5,954 5,169
1 Note 4.
The decline in financial liabilities is largely attributable to the repay ment of a bond in the amount of €0.9 billion in January 2014.
Deutsche Post DHL Group — 2014 Annual Report
187Consolidated Financial Statements — noTeS — Balance sheet disclosures
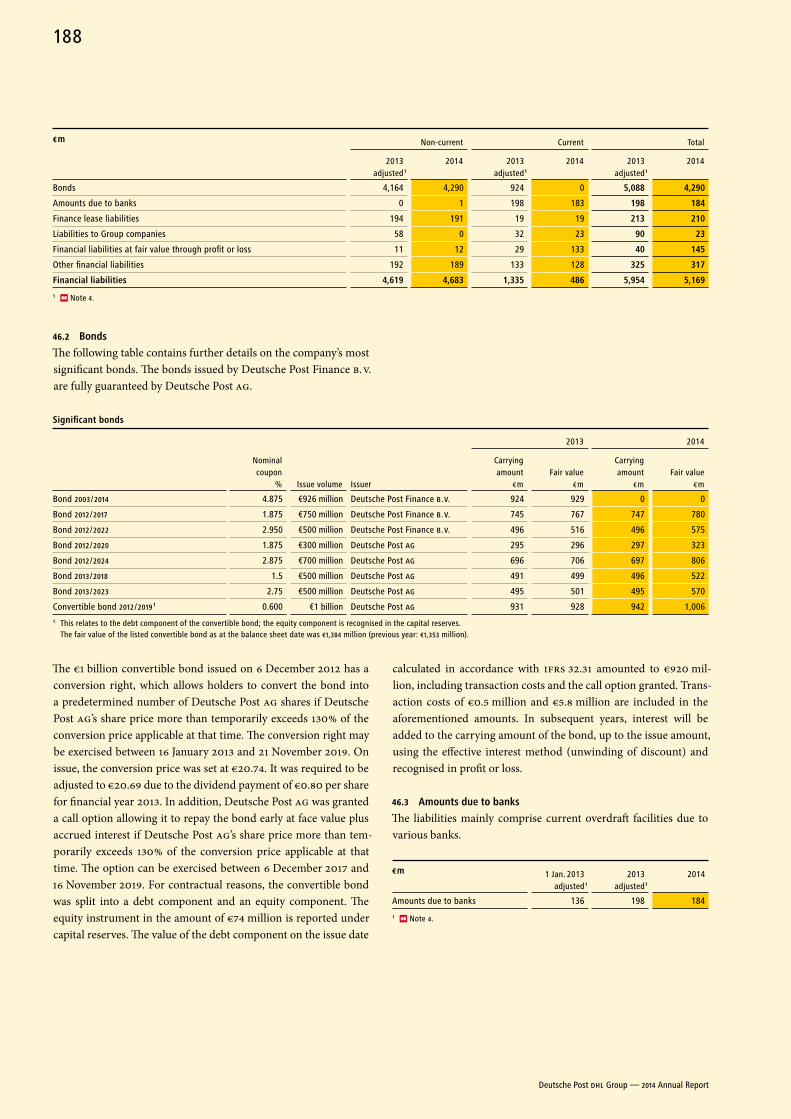
€ m Non-current Current Total
2013
adjusted 1
2014 2013 adjusted 1
2014 2013 adjusted 1
2014
Bonds 4,164 4,290 924 0 5,088 4,290
Amounts due to banks 0 1 198 183 198 184
Finance lease liabilities 194 191 19 19 213 210
Liabilities to Group companies 58 0 32 23 90 23
Financial liabilities at fair value through profit or loss 11 12 29 133 40 145
Other financial liabilities 192 189 133 128 325 317
Financial liabilities 4,619 4,683 1,335 486 5,954 5,169
1 Note 4.
46.2 Bonds
The following table contains further details on the company’s most significant bonds. The bonds issued by Deutsche Post Finance B. V. are fully guaranteed by Deutsche Post AG.
Significant bonds
2013 2014
Nominal coupon
% Issue volume Issuer
Carrying amount
€ mFair value
€ m
Carrying amount
€ mFair value
€ m
Bond 2003 / 2014 4.875 €926 million Deutsche Post Finance B. V. 924 929 0 0
Bond 2012 / 2017 1.875 €750 million Deutsche Post Finance B. V. 745 767 747 780
Bond 2012 / 2022 2.950 €500 million Deutsche Post Finance B. V. 496 516 496 575
Bond 2012 / 2020 1.875 €300 million Deutsche Post AG 295 296 297 323
Bond 2012 / 2024 2.875 €700 million Deutsche Post AG 696 706 697 806
Bond 2013 / 2018 1.5 €500 million Deutsche Post AG 491 499 496 522
Bond 2013 / 2023 2.75 €500 million Deutsche Post AG 495 501 495 570
Convertible bond 2012 / 2019 1 0.600 €1 billion Deutsche Post AG 931 928 942 1,0061 This relates to the debt component of the convertible bond; the equity component is recognised in the capital reserves.
The fair value of the listed convertible bond as at the balance sheet date was €1,384 million (previous year: €1,353 million).
The €1 billion convertible bond issued on 6 December 2012 has a conversion right, which allows holders to convert the bond into a predetermined number of Deutsche Post AG shares if Deutsche Post AG’s share price more than temporarily exceeds 130 % of the conversion price applicable at that time. The conversion right may be exercised between 16 January 2013 and 21 November 2019. On issue, the conversion price was set at €20.74. It was required to be adjusted to €20.69 due to the dividend payment of €0.80 per share for financial year 2013. In addition, Deutsche Post AG was granted a call option allowing it to repay the bond early at face value plus accrued interest if Deutsche Post AG’s share price more than tem-porarily exceeds 130 % of the conversion price applicable at that time. The option can be exercised between 6 December 2017 and 16 November 2019. For contractual reasons, the convertible bond was split into a debt component and an equity component. The equity instrument in the amount of €74 million is reported under capital reserves. The value of the debt component on the issue date
calculated in accordance with IFRS 32.31 amounted to €920 mil-lion, including transaction costs and the call option granted. Trans-action costs of €0.5 million and €5.8 million are included in the aforementioned amounts. In subsequent years, interest will be added to the carrying amount of the bond, up to the issue amount, using the effective interest method (unwinding of discount) and recognised in profit or loss.
46.3 amounts due to banks
The liabilities mainly comprise current overdraft facilities due to various banks.
€ m 1 Jan. 2013 adjusted 1
2013 adjusted 1
2014
Amounts due to banks 136 198 184
1 Note 4.
Deutsche Post DHL Group — 2014 Annual Report
188
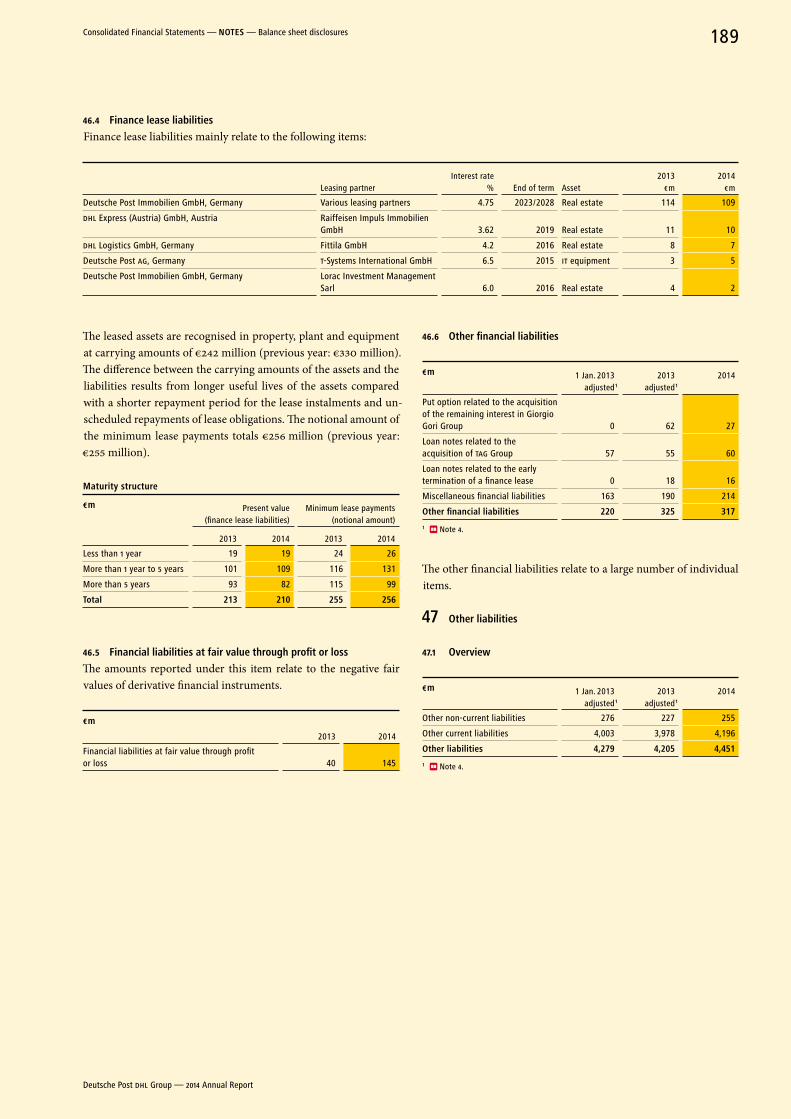
46.4 Finance lease liabilities
Finance lease liabilities mainly relate to the following items:
Leasing partnerInterest rate
% End of term Asset2013
€ m2014
€ m
Deutsche Post Immobilien GmbH, Germany Various leasing partners 4.75 2023 / 2028 Real estate 114 109
DHL Express (Austria) GmbH, Austria Raiffeisen Impuls Immobilien GmbH 3.62 2019 Real estate 11 10
DHL Logistics GmbH, Germany Fittila GmbH 4.2 2016 Real estate 8 7
Deutsche Post AG, Germany T-Systems International GmbH 6.5 2015 IT equipment 3 5
Deutsche Post Immobilien GmbH, Germany Lorac Investment Management Sarl 6.0 2016 Real estate 4 2
The leased assets are recognised in property, plant and equipment at carrying amounts of €242 million (previous year: €330 million). The difference between the carrying amounts of the assets and the liabilities results from longer useful lives of the assets compared with a shorter repayment period for the lease instalments and un-scheduled repayments of lease obligations. The notional amount of the minimum lease payments totals €256 million (previous year: €255 million).
Maturity structure
€ m Present value (finance lease liabilities)
Minimum lease payments (notional amount)
2013 2014 2013 2014
Less than 1 year 19 19 24 26
More than 1 year to 5 years 101 109 116 131
More than 5 years 93 82 115 99
Total 213 210 255 256
46.5 Financial liabilities at fair value through profit or loss
The amounts reported under this item relate to the negative fair values of derivative financial instruments.
€ m
2013 2014
Financial liabilities at fair value through profit or loss 40 145
46.6 other financial liabilities
€ m 1 Jan. 2013 adjusted 1
2013 adjusted 1
2014
Put option related to the acquisition of the remaining interest in Giorgio Gori Group 0 62 27
Loan notes related to the acquisition of TAG Group 57 55 60
Loan notes related to the early termination of a finance lease 0 18 16
Miscellaneous financial liabilities 163 190 214
other financial liabilities 220 325 317
1 Note 4.
The other financial liabilities relate to a large number of individual items.
47 other liabilities
47.1 overview
€ m 1 Jan. 2013 adjusted 1
2013 adjusted 1
2014
Other non-current liabilities 276 227 255
Other current liabilities 4,003 3,978 4,196
other liabilities 4,279 4,205 4,451
1 Note 4.
Deutsche Post DHL Group — 2014 Annual Report
189Consolidated Financial Statements — noTeS — Balance sheet disclosures
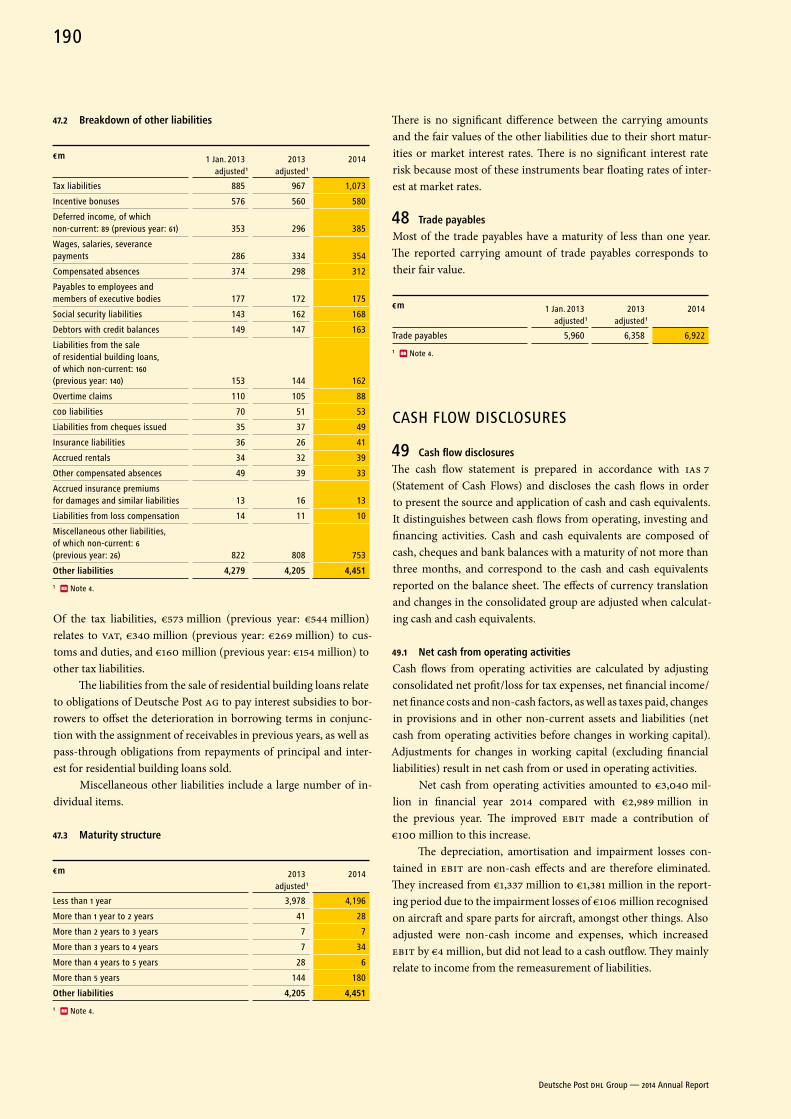
47.2 Breakdown of other liabilities
€ m 1 Jan. 2013 adjusted 1
2013 adjusted 1
2014
Tax liabilities 885 967 1,073
Incentive bonuses 576 560 580
Deferred income, of which non-current: 89 (previous year: 61) 353 296 385
Wages, salaries, severance payments 286 334 354
Compensated absences 374 298 312
Payables to employees and members of executive bodies 177 172 175
Social security liabilities 143 162 168
Debtors with credit balances 149 147 163
Liabilities from the sale of residential building loans, of which non-current: 160 (previous year: 140) 153 144 162
Overtime claims 110 105 88
COD liabilities 70 51 53
Liabilities from cheques issued 35 37 49
Insurance liabilities 36 26 41
Accrued rentals 34 32 39
Other compensated absences 49 39 33
Accrued insurance premiums for damages and similar liabilities 13 16 13
Liabilities from loss compensation 14 11 10
Miscellaneous other liabilities, of which non-current: 6 (previous year: 26) 822 808 753
other liabilities 4,279 4,205 4,451
1 Note 4.
Of the tax liabilities, €573 million (previous year: €544 million) relates to VAT, €340 million (previous year: €269 million) to cus-toms and duties, and €160 million (previous year: €154 million) to other tax liabilities.
The liabilities from the sale of residential building loans relate to obligations of Deutsche Post AG to pay interest subsidies to bor-rowers to offset the deterioration in borrowing terms in conjunc-tion with the assignment of receivables in previous years, as well as pass-through obligations from repayments of principal and inter-est for residential building loans sold.
Miscellaneous other liabilities include a large number of in-dividual items.
47.3 Maturity structure
€ m 2013 adjusted 1
2014
Less than 1 year 3,978 4,196
More than 1 year to 2 years 41 28
More than 2 years to 3 years 7 7
More than 3 years to 4 years 7 34
More than 4 years to 5 years 28 6
More than 5 years 144 180
other liabilities 4,205 4,451
1 Note 4.
There is no significant difference between the carrying amounts and the fair values of the other liabilities due to their short matur-ities or market interest rates. There is no significant interest rate risk because most of these instruments bear floating rates of inter-est at market rates.
48 Trade payables
Most of the trade payables have a maturity of less than one year. The reported carrying amount of trade payables corresponds to their fair value.
€ m 1 Jan. 2013 adjusted 1
2013 adjusted 1
2014
Trade payables 5,960 6,358 6,922
1 Note 4.
CASH FLOW DISCLOSURES
49 Cash flow disclosures
The cash flow statement is prepared in accordance with IAS 7 (Statement of Cash Flows) and discloses the cash flows in order to present the source and application of cash and cash equivalents. It distinguishes between cash flows from operating, investing and financing activities. Cash and cash equivalents are composed of cash, cheques and bank balances with a maturity of not more than three months, and correspond to the cash and cash equivalents reported on the balance sheet. The effects of currency translation and changes in the consolidated group are adjusted when calculat-ing cash and cash equivalents.
49.1 net cash from operating activities
Cash flows from operating activities are calculated by adjusting consolidated net profit / loss for tax expenses, net financial income / net finance costs and non-cash factors, as well as taxes paid, changes in provisions and in other non-current assets and liabilities (net cash from operating activities before changes in working capital). Adjustments for changes in working capital (excluding financial liabilities) result in net cash from or used in operating activities.
Net cash from operating activities amounted to €3,040 mil-lion in financial year 2014 compared with €2,989 million in the previous year. The improved EBIT made a contribution of €100 million to this increase.
The depreciation, amortisation and impairment losses con-tained in EBIT are non-cash effects and are therefore eliminated. They increased from €1,337 million to €1,381 million in the report-ing period due to the impairment losses of €106 million recognised on aircraft and spare parts for aircraft, amongst other things. Also adjusted were non-cash income and expenses, which increased EBIT by €4 million, but did not lead to a cash outflow. They mainly relate to income from the remeasurement of liabilities.
Deutsche Post DHL Group — 2014 Annual Report
190
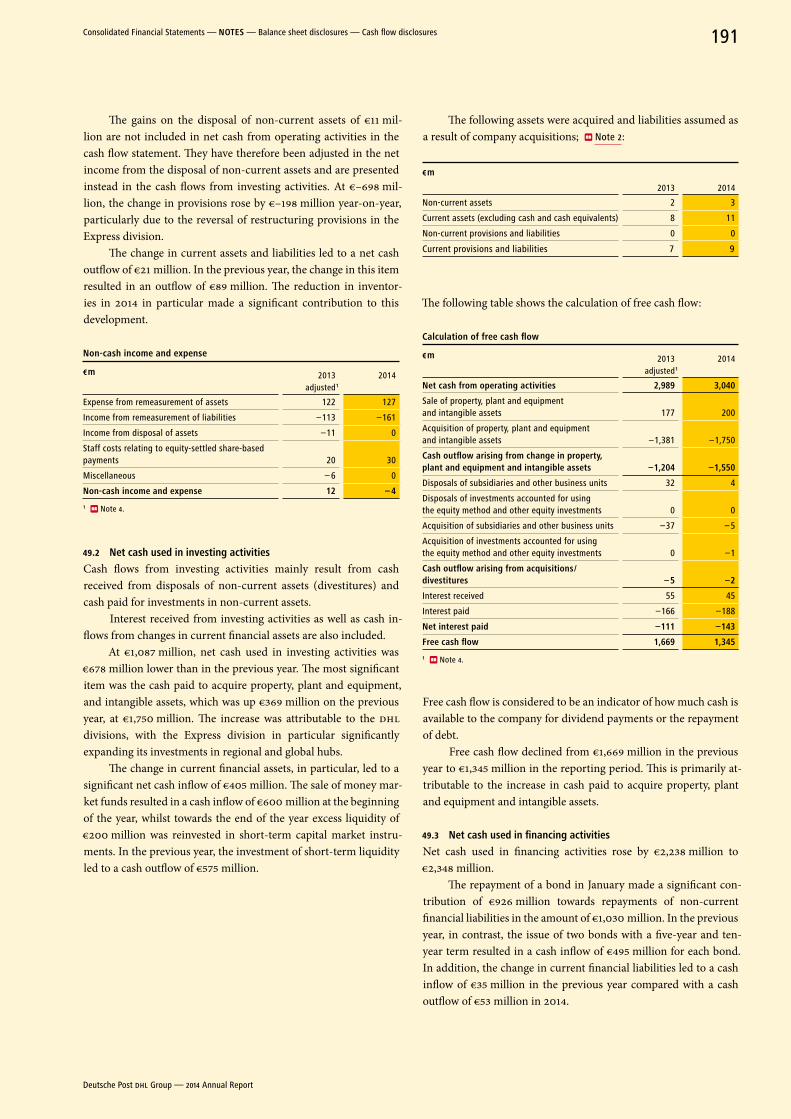
The gains on the disposal of non-current assets of €11 mil-lion are not included in net cash from operating activities in the cash flow statement. They have therefore been adjusted in the net income from the disposal of non-current assets and are presented instead in the cash flows from investing activities. At €–698 mil-lion, the change in provisions rose by €–198 million year-on-year, particularly due to the reversal of restructuring provisions in the Express division.
The change in current assets and liabilities led to a net cash outflow of €21 million. In the previous year, the change in this item resulted in an outflow of €89 million. The reduction in inventor-ies in 2014 in particular made a significant contribution to this development.
non-cash income and expense
€ m 2013 adjusted 1
2014
Expense from remeasurement of assets 122 127
Income from remeasurement of liabilities –113 –161
Income from disposal of assets –11 0
Staff costs relating to equity-settled share-based payments 20 30
Miscellaneous – 6 0
non-cash income and expense 12 – 4
1 Note 4.
49.2 net cash used in investing activities
Cash flows from investing activities mainly result from cash received from disposals of non-current assets (divestitures) and cash paid for investments in non-current assets.
Interest received from investing activities as well as cash in-flows from changes in current financial assets are also included.
At €1,087 million, net cash used in investing activities was €678 million lower than in the previous year. The most significant item was the cash paid to acquire property, plant and equipment, and intangible assets, which was up €369 million on the previous year, at €1,750 million. The increase was attributable to the DHL divisions, with the Express division in particular significantly expanding its investments in regional and global hubs.
The change in current financial assets, in particular, led to a significant net cash inflow of €405 million. The sale of money mar-ket funds resulted in a cash inflow of €600 million at the beginning of the year, whilst towards the end of the year excess liquidity of €200 million was reinvested in short-term capital market instru-ments. In the previous year, the investment of short-term liquidity led to a cash outflow of €575 million.
The following assets were acquired and liabilities assumed as a result of company acquisitions; Note 2:
€ m
2013 2014
Non-current assets 2 3
Current assets (excluding cash and cash equivalents) 8 11
Non-current provisions and liabilities 0 0
Current provisions and liabilities 7 9
The following table shows the calculation of free cash flow:
Calculation of free cash flow
€ m 2013 adjusted 1
2014
net cash from operating activities 2,989 3,040
Sale of property, plant and equipment and intangible assets 177 200
Acquisition of property, plant and equipment and intangible assets –1,381 –1,750
Cash outflow arising from change in property, plant and equipment and intangible assets –1,204 –1,550
Disposals of subsidiaries and other business units 32 4
Disposals of investments accounted for using the equity method and other equity investments 0 0
Acquisition of subsidiaries and other business units –37 – 5
Acquisition of investments accounted for using the equity method and other equity investments 0 –1
Cash outflow arising from acquisitions / divestitures – 5 –2
Interest received 55 45
Interest paid –166 –188
net interest paid –111 –143
Free cash flow 1,669 1,345
1 Note 4.
Free cash flow is considered to be an indicator of how much cash is available to the company for dividend payments or the repayment of debt.
Free cash flow declined from €1,669 million in the previous year to €1,345 million in the reporting period. This is primarily at-tributable to the increase in cash paid to acquire property, plant and equipment and intangible assets.
49.3 net cash used in financing activities
Net cash used in financing activities rose by €2,238 million to €2,348 million.
The repayment of a bond in January made a significant con-tribution of €926 million towards repayments of non-current finan cial liabilities in the amount of €1,030 million. In the previous year, in contrast, the issue of two bonds with a five-year and ten-year term resulted in a cash inflow of €495 million for each bond. In addition, the change in current financial liabilities led to a cash inflow of €35 million in the previous year compared with a cash outflow of €53 million in 2014.
Deutsche Post DHL Group — 2014 Annual Report
191Consolidated Financial Statements — noTeS — Balance sheet disclosures — Cash flow disclosures
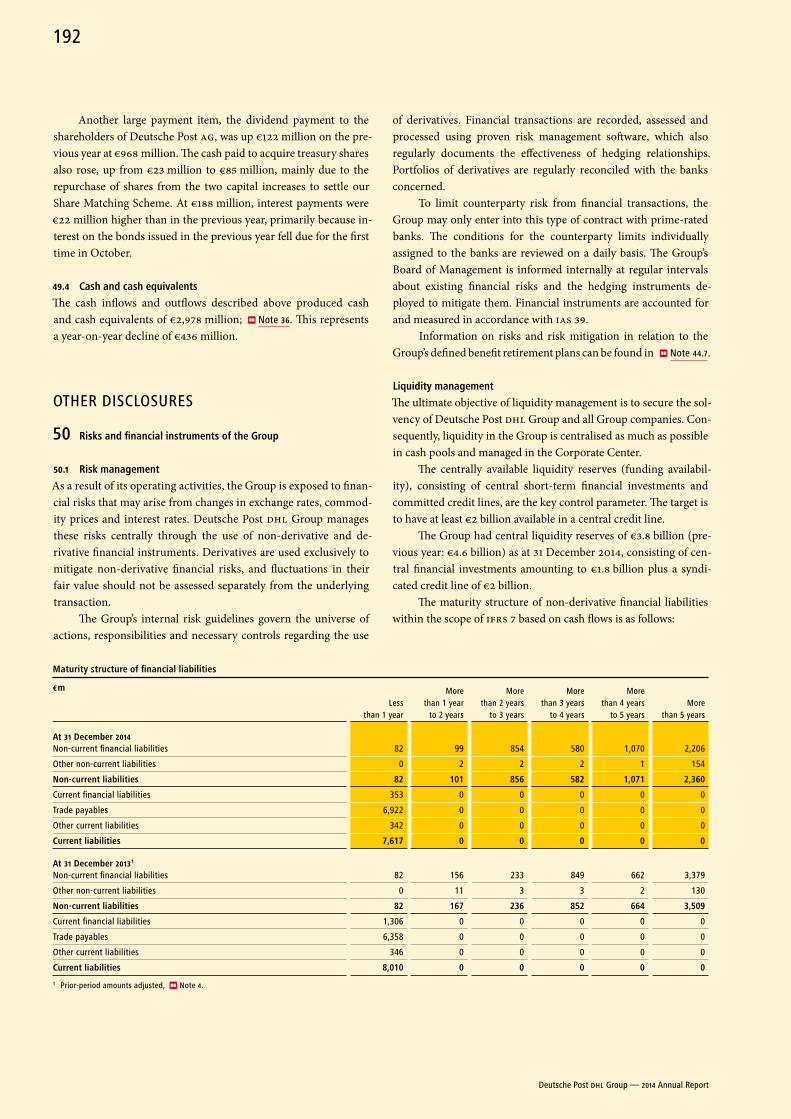
Another large payment item, the dividend payment to the shareholders of Deutsche Post AG, was up €122 million on the pre-vious year at €968 million. The cash paid to acquire treasury shares also rose, up from €23 million to €85 million, mainly due to the repurchase of shares from the two capital increases to settle our Share Matching Scheme. At €188 million, interest payments were €22 million higher than in the previous year, primarily because in-terest on the bonds issued in the previous year fell due for the first time in October.
49.4 Cash and cash equivalents
The cash inflows and outflows described above produced cash and cash equivalents of €2,978 million; Note 36. This represents a year-on-year decline of €436 million.
OTHER DISCLOSURES
50 risks and financial instruments of the Group
50.1 risk management
As a result of its operating activities, the Group is exposed to finan-cial risks that may arise from changes in exchange rates, commod-ity prices and interest rates. Deutsche Post DHL Group manages these risks centrally through the use of non-derivative and de-rivative finan cial instruments. Derivatives are used exclusively to mitigate non-derivative financial risks, and fluctuations in their fair value should not be assessed separately from the underlying transaction.
The Group’s internal risk guidelines govern the universe of actions, responsibilities and necessary controls regarding the use
of derivatives. Financial transactions are recorded, assessed and processed using proven risk management software, which also regularly documents the effectiveness of hedging relationships. Portfolios of derivatives are regularly reconciled with the banks concerned.
To limit counterparty risk from financial transactions, the Group may only enter into this type of contract with prime-rated banks. The conditions for the counterparty limits individually assigned to the banks are reviewed on a daily basis. The Group’s Board of Management is informed internally at regular intervals about existing financial risks and the hedging instruments de-ployed to mitigate them. Financial instruments are accounted for and measured in accordance with IAS 39.
Information on risks and risk mitigation in relation to the Group’s defined benefit retirement plans can be found in Note 44.7.
Liquidity management
The ultimate objective of liquidity management is to secure the sol-vency of Deutsche Post DHL Group and all Group companies. Con-sequently, liquidity in the Group is centralised as much as possible in cash pools and managed in the Corporate Center.
The centrally available liquidity reserves (funding availabil-ity), consisting of central short-term financial investments and committed credit lines, are the key control parameter. The target is to have at least €2 billion available in a central credit line.
The Group had central liquidity reserves of €3.8 billion (pre-vious year: €4.6 billion) as at 31 December 2014, consisting of cen-tral financial investments amounting to €1.8 billion plus a syndi-cated credit line of €2 billion.
The maturity structure of non-derivative financial liabilities within the scope of IFRS 7 based on cash flows is as follows:
Maturity structure of financial liabilities
€ m
Less than 1 year
More than 1 year
to 2 years
More than 2 years
to 3 years
More than 3 years
to 4 years
More than 4 years
to 5 yearsMore
than 5 years
at 31 December 2014Non-current financial liabilities 82 99 854 580 1,070 2,206
Other non-current liabilities 0 2 2 2 1 154
non-current liabilities 82 101 856 582 1,071 2,360
Current financial liabilities 353 0 0 0 0 0
Trade payables 6,922 0 0 0 0 0
Other current liabilities 342 0 0 0 0 0
Current liabilities 7,617 0 0 0 0 0
at 31 December 2013 1
Non-current financial liabilities 82 156 233 849 662 3,379
Other non-current liabilities 0 11 3 3 2 130
non-current liabilities 82 167 236 852 664 3,509
Current financial liabilities 1,306 0 0 0 0 0
Trade payables 6,358 0 0 0 0 0
Other current liabilities 346 0 0 0 0 0
Current liabilities 8,010 0 0 0 0 0
1 Prior-period amounts adjusted, Note 4.
Deutsche Post DHL Group — 2014 Annual Report
192
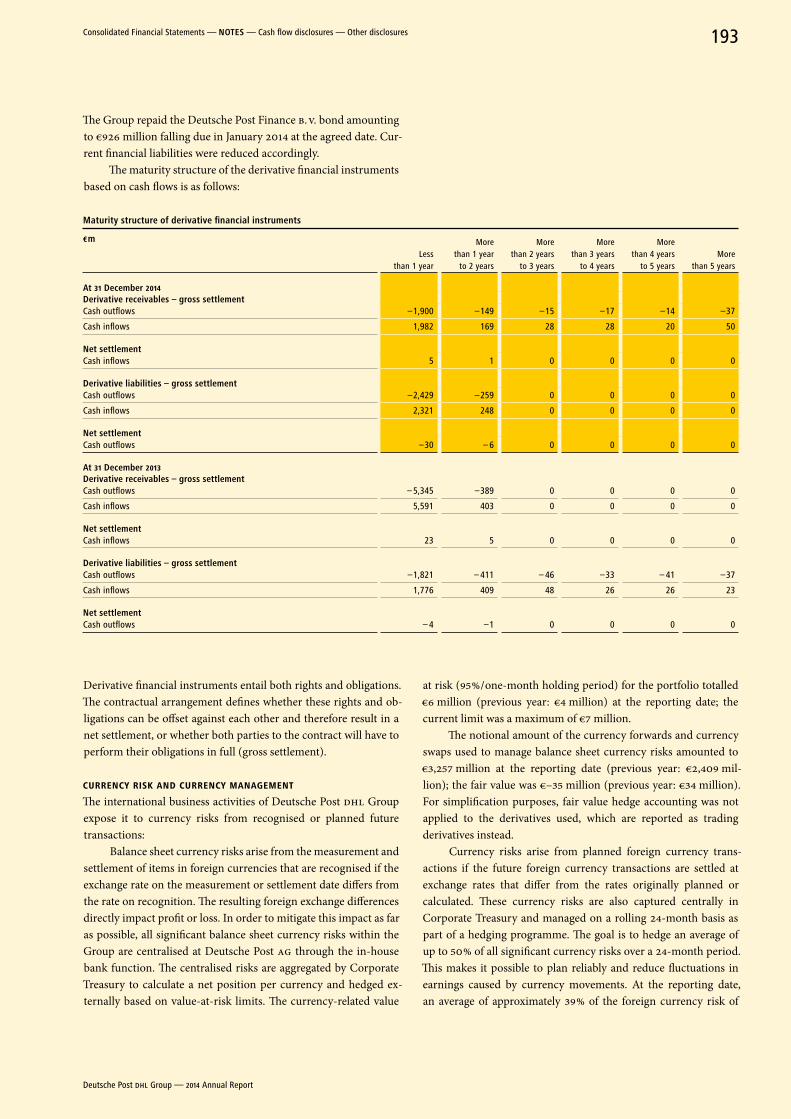
The Group repaid the Deutsche Post Finance B. V. bond amounting to €926 million falling due in January 2014 at the agreed date. Cur-rent financial liabilities were reduced accordingly.
The maturity structure of the derivative financial instruments based on cash flows is as follows:
Maturity structure of derivative financial instruments
€ m
Less than 1 year
More than 1 year
to 2 years
More than 2 years
to 3 years
More than 3 years
to 4 years
More than 4 years
to 5 yearsMore
than 5 years
at 31 December 2014Derivative receivables – gross settlementCash outflows –1,900 –149 –15 –17 –14 –37
Cash inflows 1,982 169 28 28 20 50
net settlementCash inflows 5 1 0 0 0 0
Derivative liabilities – gross settlementCash outflows –2,429 –259 0 0 0 0
Cash inflows 2,321 248 0 0 0 0
net settlementCash outflows –30 – 6 0 0 0 0
at 31 December 2013Derivative receivables – gross settlementCash outflows – 5,345 –389 0 0 0 0
Cash inflows 5,591 403 0 0 0 0
net settlementCash inflows 23 5 0 0 0 0
Derivative liabilities – gross settlementCash outflows –1,821 – 411 – 46 –33 – 41 –37
Cash inflows 1,776 409 48 26 26 23
net settlementCash outflows – 4 –1 0 0 0 0
Derivative financial instruments entail both rights and obligations. The contractual arrangement defines whether these rights and ob-ligations can be offset against each other and therefore result in a net settlement, or whether both parties to the contract will have to perform their obligations in full (gross settlement).
CURRENCY RISK AND CURRENCY MANAGEMENTThe international business activities of Deutsche Post DHL Group expose it to currency risks from recognised or planned future transactions:
Balance sheet currency risks arise from the measurement and settlement of items in foreign currencies that are recognised if the exchange rate on the measurement or settlement date differs from the rate on recognition. The resulting foreign exchange differences directly impact profit or loss. In order to mitigate this impact as far as possible, all significant balance sheet currency risks within the Group are centralised at Deutsche Post AG through the in-house bank function. The centralised risks are aggregated by Corporate Treasury to calculate a net position per currency and hedged ex-ternally based on value-at-risk limits. The currency- related value
at risk (95 % / one-month holding period) for the portfolio totalled €6 million (previous year: €4 million) at the reporting date; the current limit was a maximum of €7 million.
The notional amount of the currency forwards and currency swaps used to manage balance sheet currency risks amounted to €3,257 million at the reporting date (previous year: €2,409 mil-lion); the fair value was €–35 million (previous year: €34 million). For simplification purposes, fair value hedge accounting was not applied to the derivatives used, which are reported as trading derivatives instead.
Currency risks arise from planned foreign currency trans-actions if the future foreign currency transactions are settled at exchange rates that differ from the rates originally planned or calculated. These currency risks are also captured centrally in Corporate Treasury and managed on a rolling 24-month basis as part of a hedging programme. The goal is to hedge an average of up to 50 % of all significant currency risks over a 24-month period. This makes it possible to plan reliably and reduce fluctuations in earnings caused by currency movements. At the reporting date, an average of approximately 39 % of the foreign currency risk of
Deutsche Post DHL Group — 2014 Annual Report
193Consolidated Financial Statements — noTeS — Cash flow disclosures — Other disclosures
the currencies concerned was hedged for the next 24 months. The relevant hedging transactions are recognised using cash flow hedge accounting; Note 50.3, cash flow hedges.
In total, currency forwards and currency swaps with a notional amount of €5,119 million (previous year: €4,280 million) were outstanding at the balance sheet date. The corresponding fair value was €–53 million (previous year: €98 million). As at the reporting date, there were no currency options or cross-currency swaps. The cross-currency swaps still existing in the previous year (notional amount of €163 million and fair value of €14 million) expired as scheduled in financial year 2014.
Currency risks resulting from translating assets and liabilities of foreign operations into the Group’s currency (translation risk) were not hedged as at 31 December 2014.
Of the unrealised gains or losses from currency derivatives recognised in equity as at 31 December 2014 in accordance with IAS 39, €20 million (previous year: €69 million) is expected to be recognised in income in the course of 2015.
IFRS 7 requires the disclosure of quantitative risk data show-ing how profit or loss and equity are affected by changes in exchange rates at the reporting date. The impact of these changes in exchange rates on the portfolio of foreign currency financial instruments is assessed by means of a value-at-risk calculation (95 % confidence / one-month holding period). It is assumed that the portfolio as at the reporting date is representative for the full year. Effects of hypo-thetical changes in exchange rates on translation risk do not fall within the scope of IFRS 7. The following assumptions are used as a basis for the sensitivity analysis:
Primary financial instruments in foreign currencies used by Group companies were hedged by Deutsche Post AG’s in-house bank, with Deutsche Post AG setting and guaranteeing monthly exchange rates. Exchange rate-related changes therefore have no effect on the profit or loss and equity of the Group companies. Where, in individual cases, Group companies are not permitted to participate in in-house banking for legal reasons, their currency risks from primary financial instruments are fully hedged locally through the use of derivatives. They therefore have no impact on the Group’s risk position.
Hypothetical changes in exchange rates have an effect on the fair values of Deutsche Post AG’s external derivatives that is reported in profit or loss; they also affect the foreign currency gains and losses from remeasurement at the closing date of the in-house bank balances, balances from external bank accounts as well as internal and external loans extended by Deutsche Post AG. The foreign currency value at risk of the foreign currency items con-cerned was €6 million at the reporting date (previous year: €4 mil-lion). In addition, hypothetical changes in exchange rates affect equity and the fair values of those derivatives used to hedge unrec-ognised firm commitments and highly probable forecast currency transactions, which are designated as cash flow hedges. The foreign currency value at risk of this risk position was €57 million as at 31 December 2014 (previous year: €30 million). The total foreign currency value at risk was €56 million at the reporting date (previ-ous year: €29 million). The total amount is lower than the sum of the individual amounts given above, owing to interdependencies.
INTEREST RATE RISK AND INTEREST RATE MANAGEMENTThe fair value of interest rate hedging instruments was calcu-lated on the basis of discounted expected future cash flows using Corporate Treasury’s risk management system.
As at 31 December 2014, the Group had entered into interest rate swaps with a notional volume of €1,300 million (previous year: €1,126 million). The fair value of this interest rate swap position was €68 million (previous year: €6 million). As in the previous year, there were no interest rate options at the reporting date.
In January, the Group repaid the bond amounting to €926 million, which fell due for payment. Some of the original fixed-coupon bonds were swapped for variable short-term interest rates. As a result, there was an insignificant change in the share of instruments with short-term interest lock-ins compared with the previous year. Taking into account existing interest rate hedging instruments, the proportion of financial liabilities with short-term interest lock-ins, Note 46, amounts to around 35 % (previous year: 36 %) as at the reporting date. The effect of potential interest rate changes on the Group’s financial position remains insignificant.
The quantitative risk data relating to interest rate risk required by IFRS 7 is presented in the form of a sensitivity analysis. This method determines the effects of hypothetical changes in market interest rates on interest income, interest expense and equity as at the reporting date. The following assumptions are used as a basis for the sensitivity analysis:
Primary variable-rate financial instruments are subject to interest rate risk and must therefore be included in the sensitiv-ity analysis. Primary variable-rate financial instruments that were transformed into fixed-income financial instruments using cash flow hedges are not included. Changes in market interest rates for derivative financial instruments used as a cash flow hedge affect equity by changing fair values and must therefore be included in the sensitivity analysis. Fixed-income financial instruments meas-ured at amortised cost are not subject to interest rate risk.
Designated fair value hedges of interest rate risk are not in-cluded in the analysis because the interest-related changes in fair value of the hedged item and the hedging transaction almost fully offset each other in profit or loss for the period. Only the variable portion of the hedging instrument affects net financial income / net finance costs and must be included in the sensitivity analysis.
If the market interest rate level as at 31 December 2014 had been 100 basis points higher, net finance costs would have in-creased by €9 million (previous year: increased by €6 million). A market interest rate level 100 basis points lower would have had the opposite effect. A change in the market interest rate level by 100 basis points would affect the fair values of the interest rate derivatives recognised in equity. As in the previous year, a rise in interest rates in this financial year would not have increased equity, nor would a reduction have reduced equity.
Deutsche Post DHL Group — 2014 Annual Report
194
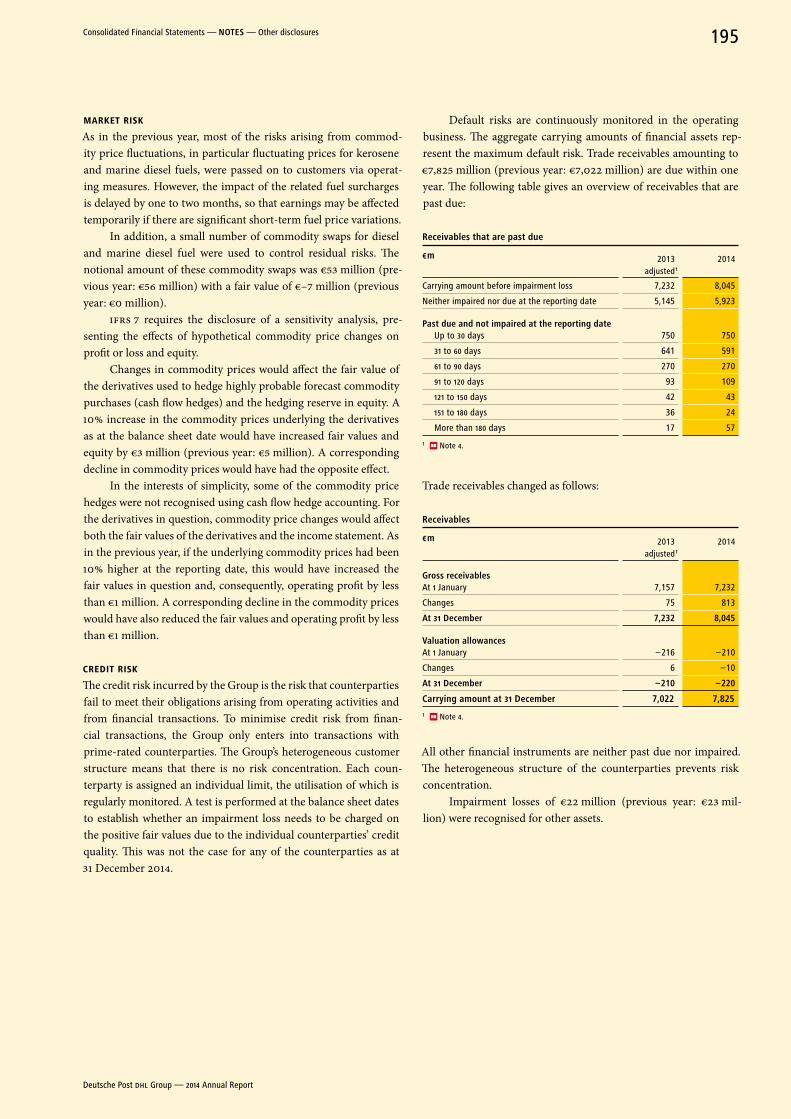
MARKET RISKAs in the previous year, most of the risks arising from commod-ity price fluctuations, in particular fluctuating prices for kerosene and marine diesel fuels, were passed on to customers via operat-ing measures. However, the impact of the related fuel surcharges is delayed by one to two months, so that earnings may be affected temporarily if there are significant short-term fuel price variations.
In addition, a small number of commodity swaps for diesel and marine diesel fuel were used to control residual risks. The notional amount of these commodity swaps was €53 million (pre-vious year: €56 million) with a fair value of €–7 million (previous year: €0 million).
IFRS 7 requires the disclosure of a sensitivity analysis, pre-senting the effects of hypothetical commodity price changes on profit or loss and equity.
Changes in commodity prices would affect the fair value of the derivatives used to hedge highly probable forecast commodity purchases (cash flow hedges) and the hedging reserve in equity. A 10 % increase in the commodity prices underlying the derivatives as at the balance sheet date would have increased fair values and equity by €3 million (previous year: €5 million). A corresponding decline in commodity prices would have had the opposite effect.
In the interests of simplicity, some of the commodity price hedges were not recognised using cash flow hedge accounting. For the derivatives in question, commodity price changes would affect both the fair values of the derivatives and the income statement. As in the previous year, if the underlying commodity prices had been 10 % higher at the reporting date, this would have increased the fair values in question and, consequently, operating profit by less than €1 million. A corresponding decline in the commodity prices would have also reduced the fair values and operating profit by less than €1 million.
CREDIT RISKThe credit risk incurred by the Group is the risk that counterparties fail to meet their obligations arising from operating activities and from financial transactions. To minimise credit risk from finan-cial transactions, the Group only enters into transactions with prime-rated counterparties. The Group’s heterogeneous customer structure means that there is no risk concentration. Each coun-terparty is assigned an individual limit, the utilisation of which is regularly monitored. A test is performed at the balance sheet dates to establish whether an impairment loss needs to be charged on the positive fair values due to the individual counterparties’ credit quality. This was not the case for any of the counterparties as at 31 December 2014.
Default risks are continuously monitored in the operating business. The aggregate carrying amounts of financial assets rep-resent the maximum default risk. Trade receivables amounting to €7,825 million (previous year: €7,022 million) are due within one year. The following table gives an overview of receivables that are past due:
receivables that are past due
€ m 2013 adjusted 1
2014
Carrying amount before impairment loss 7,232 8,045
Neither impaired nor due at the reporting date 5,145 5,923
Past due and not impaired at the reporting dateUp to 30 days 750 750
31 to 60 days 641 591
61 to 90 days 270 270
91 to 120 days 93 109
121 to 150 days 42 43
151 to 180 days 36 24
More than 180 days 17 57
1 Note 4.
Trade receivables changed as follows:
receivables
€ m 2013 adjusted 1
2014
Gross receivablesAt 1 January 7,157 7,232
Changes 75 813
at 31 December 7,232 8,045
Valuation allowancesAt 1 January –216 –210
Changes 6 –10
at 31 December –210 –220
Carrying amount at 31 December 7,022 7,825
1 Note 4.
All other financial instruments are neither past due nor impaired. The heterogeneous structure of the counterparties prevents risk concentration.
Impairment losses of €22 million (previous year: €23 mil-lion) were recognised for other assets.
Deutsche Post DHL Group — 2014 Annual Report
195Consolidated Financial Statements — noTeS — Other disclosures
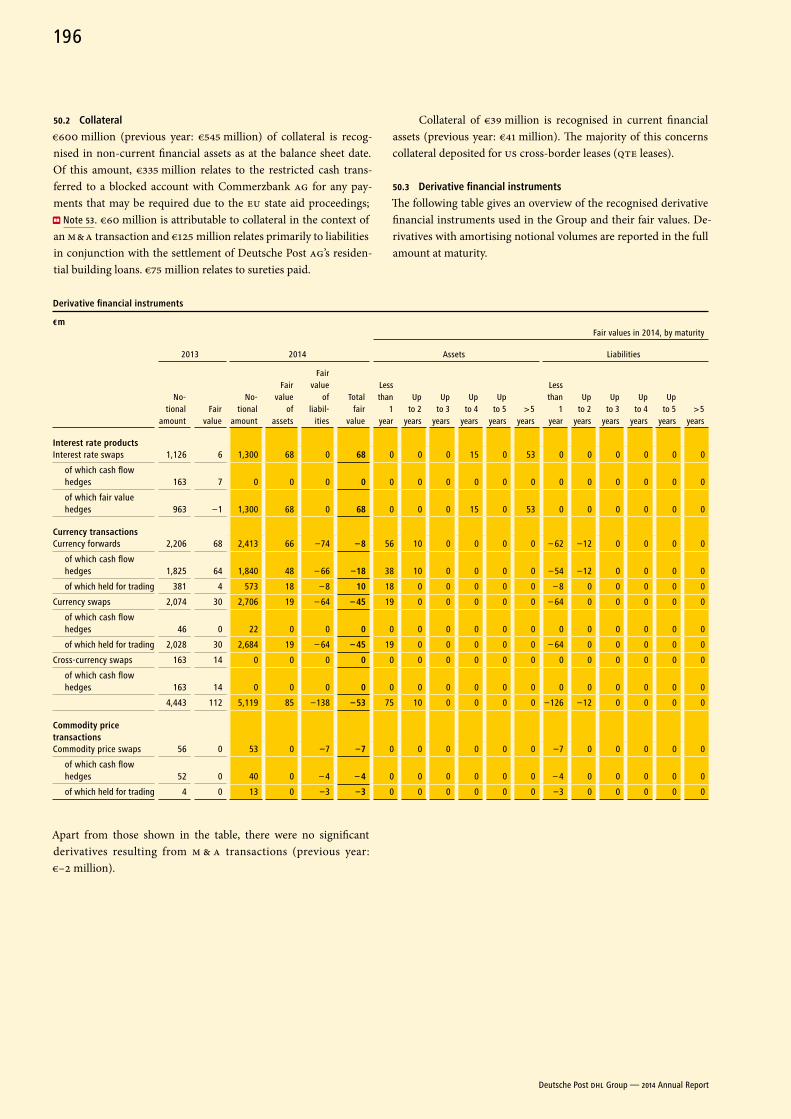
50.2 Collateral
€600 million (previous year: €545 million) of collateral is recog-nised in non-current financial assets as at the balance sheet date. Of this amount, €335 million relates to the restricted cash trans-ferred to a blocked account with Commerzbank AG for any pay-ments that may be required due to the EU state aid proceedings;
Note 53. €60 million is attributable to collateral in the context of an M & A transaction and €125 million relates primarily to liabilities in conjunction with the settlement of Deutsche Post AG’s residen-tial building loans. €75 million relates to sureties paid.
Collateral of €39 million is recognised in current financial assets (previous year: €41 million). The majority of this concerns collateral deposited for US cross-border leases (QTE leases).
50.3 Derivative financial instruments
The following table gives an overview of the recognised derivative financial instruments used in the Group and their fair values. De-rivatives with amortising notional volumes are reported in the full amount at maturity.
Derivative financial instruments
€ m
2013 2014
Fair values in 2014, by maturity
Assets Liabilities
No-tional
amountFair
value
No-tional
amount
Fair value
of assets
Fair value
of liabil-
ities
Total fair
value
Less than
1 year
Up to 2
years
Up to 3
years
Up to 4
years
Up to 5
years> 5
years
Less than
1 year
Up to 2
years
Up to 3
years
Up to 4
years
Up to 5
years> 5
years
Interest rate productsInterest rate swaps 1,126 6 1,300 68 0 68 0 0 0 15 0 53 0 0 0 0 0 0
of which cash flow hedges 163 7 0 0 0 0 0 0 0 0 0 0 0 0 0 0 0 0
of which fair value hedges 963 –1 1,300 68 0 68 0 0 0 15 0 53 0 0 0 0 0 0
Currency transactionsCurrency forwards 2,206 68 2,413 66 –74 – 8 56 10 0 0 0 0 – 62 –12 0 0 0 0
of which cash flow hedges 1,825 64 1,840 48 – 66 –18 38 10 0 0 0 0 – 54 –12 0 0 0 0
of which held for trading 381 4 573 18 – 8 10 18 0 0 0 0 0 – 8 0 0 0 0 0
Currency swaps 2,074 30 2,706 19 – 64 – 45 19 0 0 0 0 0 – 64 0 0 0 0 0
of which cash flow hedges 46 0 22 0 0 0 0 0 0 0 0 0 0 0 0 0 0 0
of which held for trading 2,028 30 2,684 19 – 64 – 45 19 0 0 0 0 0 – 64 0 0 0 0 0
Cross-currency swaps 163 14 0 0 0 0 0 0 0 0 0 0 0 0 0 0 0 0
of which cash flow hedges 163 14 0 0 0 0 0 0 0 0 0 0 0 0 0 0 0 0
4,443 112 5,119 85 –138 – 53 75 10 0 0 0 0 –126 –12 0 0 0 0
Commodity price transactionsCommodity price swaps 56 0 53 0 –7 –7 0 0 0 0 0 0 –7 0 0 0 0 0
of which cash flow hedges 52 0 40 0 – 4 – 4 0 0 0 0 0 0 – 4 0 0 0 0 0
of which held for trading 4 0 13 0 –3 –3 0 0 0 0 0 0 –3 0 0 0 0 0
Apart from those shown in the table, there were no significant derivatives resulting from M & A transactions (previous year: €–2 million).
Deutsche Post DHL Group — 2014 Annual Report
196
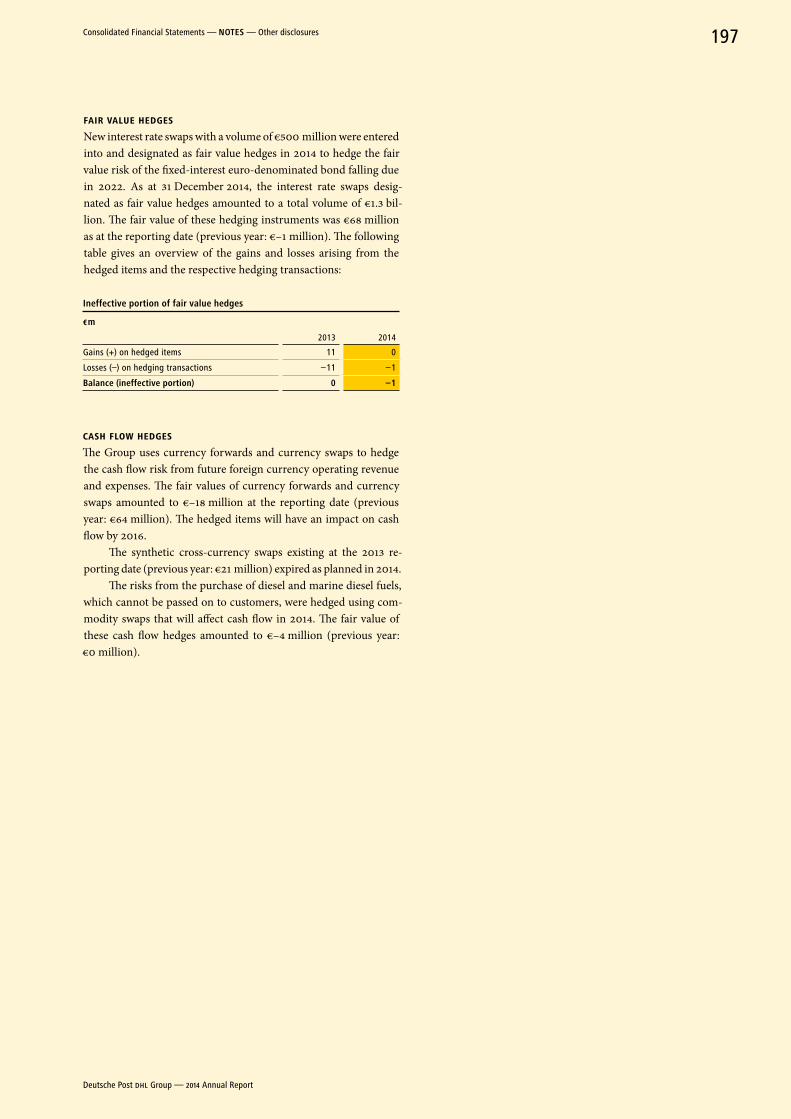
FAIR vALUE HEDGESNew interest rate swaps with a volume of €500 million were entered into and designated as fair value hedges in 2014 to hedge the fair value risk of the fixed-interest euro-denominated bond falling due in 2022. As at 31 December 2014, the interest rate swaps desig-nated as fair value hedges amounted to a total volume of €1.3 bil-lion. The fair value of these hedging instruments was €68 million as at the reporting date (previous year: €–1 million). The following table gives an overview of the gains and losses arising from the hedged items and the respective hedging transactions:
Ineffective portion of fair value hedges
€ m
2013 2014
Gains (+) on hedged items 11 0
Losses (–) on hedging transactions –11 –1
Balance (ineffective portion) 0 –1
CASH FLOW HEDGESThe Group uses currency forwards and currency swaps to hedge the cash flow risk from future foreign currency operating revenue and expenses. The fair values of currency forwards and currency swaps amounted to €–18 million at the reporting date (previous year: €64 million). The hedged items will have an impact on cash flow by 2016.
The synthetic cross-currency swaps existing at the 2013 re-porting date (previous year: €21 million) expired as planned in 2014.
The risks from the purchase of diesel and marine diesel fuels, which cannot be passed on to customers, were hedged using com-modity swaps that will affect cash flow in 2014. The fair value of these cash flow hedges amounted to €–4 million (previous year: €0 million).
Deutsche Post DHL Group — 2014 Annual Report
197Consolidated Financial Statements — noTeS — Other disclosures
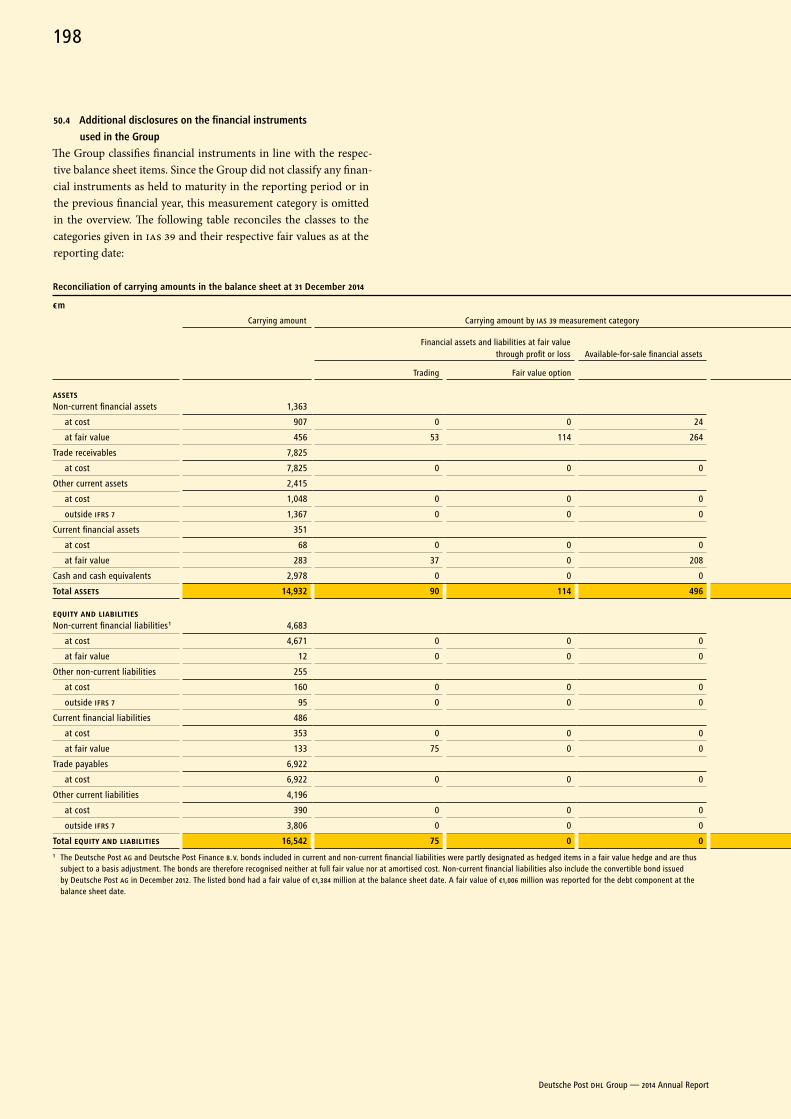
50.4 additional disclosures on the financial instruments
used in the Group
The Group classifies financial instruments in line with the respec-tive balance sheet items. Since the Group did not classify any finan-cial instruments as held to maturity in the reporting period or in the previous financial year, this measurement category is omitted in the overview. The following table reconciles the classes to the categories given in IAS 39 and their respective fair values as at the reporting date:
reconciliation of carrying amounts in the balance sheet at 31 December 2014
€ m
Carrying amount Carrying amount by IAS 39 measurement categoryOther financial instruments outside the scope of IAS 39
Fair value of financial instruments under IFRS 7
Financial assets and liabilities at fair value through profit or loss Available-for-sale financial assets
Loans and receivables / other financial liabilities
Derivatives designated as hedging instruments
Lease receivables / finance lease liabilities
Trading Fair value option
ASSETSNon-current financial assets 1,363
at cost 907 0 0 24 834 0 49 906
at fair value 456 53 114 264 0 25 0 456
Trade receivables 7,825
at cost 7,825 0 0 0 7,825 0 0 7,825
Other current assets 2,415
at cost 1,048 0 0 0 1,048 0 0 1,048
outside IFRS 7 1,367 0 0 0 0 0 0 0
Current financial assets 351
at cost 68 0 0 0 61 0 7 68
at fair value 283 37 0 208 0 38 0 283
Cash and cash equivalents 2,978 0 0 0 2,978 0 0 0
Total ASSETS 14,932 90 114 496 12,746 63 56 –
EQUITY AND LIABILITIESNon-current financial liabilities 1 4,683
at cost 4,671 0 0 0 4,480 0 191 5,461
at fair value 12 0 0 0 0 12 0 12
Other non-current liabilities 255
at cost 160 0 0 0 160 0 0 160
outside IFRS 7 95 0 0 0 0 0 0 0
Current financial liabilities 486
at cost 353 0 0 0 334 0 19 353
at fair value 133 75 0 0 0 58 0 133
Trade payables 6,922
at cost 6,922 0 0 0 6,922 0 0 6,922
Other current liabilities 4,196
at cost 390 0 0 0 390 0 0 390
outside IFRS 7 3,806 0 0 0 0 0 0 0
Total EQUITY AND LIABILITIES 16,542 75 0 0 12,286 70 210 –1 The Deutsche Post AG and Deutsche Post Finance B. V. bonds included in current and non-current financial liabilities were partly designated as hedged items in a fair value hedge and are thus
subject to a basis adjustment. The bonds are therefore recognised neither at full fair value nor at amortised cost. Non-current financial liabilities also include the convertible bond issued by Deutsche Post AG in December 2012. The listed bond had a fair value of €1,384 million at the balance sheet date. A fair value of €1,006 million was reported for the debt component at the balance sheet date.
Deutsche Post DHL Group — 2014 Annual Report
198
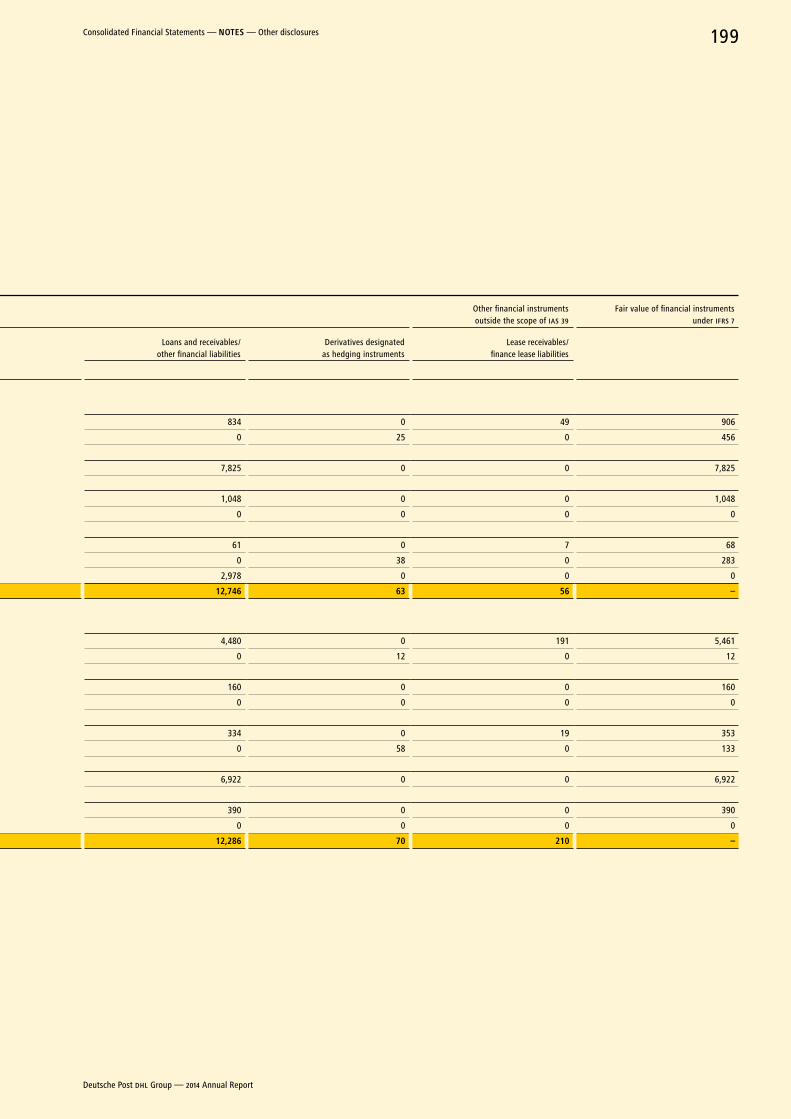
reconciliation of carrying amounts in the balance sheet at 31 December 2014
€ m
Carrying amount Carrying amount by IAS 39 measurement categoryOther financial instruments outside the scope of IAS 39
Fair value of financial instruments under IFRS 7
Financial assets and liabilities at fair value through profit or loss Available-for-sale financial assets
Loans and receivables / other financial liabilities
Derivatives designated as hedging instruments
Lease receivables / finance lease liabilities
Trading Fair value option
ASSETSNon-current financial assets 1,363
at cost 907 0 0 24 834 0 49 906
at fair value 456 53 114 264 0 25 0 456
Trade receivables 7,825
at cost 7,825 0 0 0 7,825 0 0 7,825
Other current assets 2,415
at cost 1,048 0 0 0 1,048 0 0 1,048
outside IFRS 7 1,367 0 0 0 0 0 0 0
Current financial assets 351
at cost 68 0 0 0 61 0 7 68
at fair value 283 37 0 208 0 38 0 283
Cash and cash equivalents 2,978 0 0 0 2,978 0 0 0
Total ASSETS 14,932 90 114 496 12,746 63 56 –
EQUITY AND LIABILITIESNon-current financial liabilities 1 4,683
at cost 4,671 0 0 0 4,480 0 191 5,461
at fair value 12 0 0 0 0 12 0 12
Other non-current liabilities 255
at cost 160 0 0 0 160 0 0 160
outside IFRS 7 95 0 0 0 0 0 0 0
Current financial liabilities 486
at cost 353 0 0 0 334 0 19 353
at fair value 133 75 0 0 0 58 0 133
Trade payables 6,922
at cost 6,922 0 0 0 6,922 0 0 6,922
Other current liabilities 4,196
at cost 390 0 0 0 390 0 0 390
outside IFRS 7 3,806 0 0 0 0 0 0 0
Total EQUITY AND LIABILITIES 16,542 75 0 0 12,286 70 210 –1 The Deutsche Post AG and Deutsche Post Finance B. V. bonds included in current and non-current financial liabilities were partly designated as hedged items in a fair value hedge and are thus
subject to a basis adjustment. The bonds are therefore recognised neither at full fair value nor at amortised cost. Non-current financial liabilities also include the convertible bond issued by Deutsche Post AG in December 2012. The listed bond had a fair value of €1,384 million at the balance sheet date. A fair value of €1,006 million was reported for the debt component at the balance sheet date.
Deutsche Post DHL Group — 2014 Annual Report
199Consolidated Financial Statements — noTeS — Other disclosures
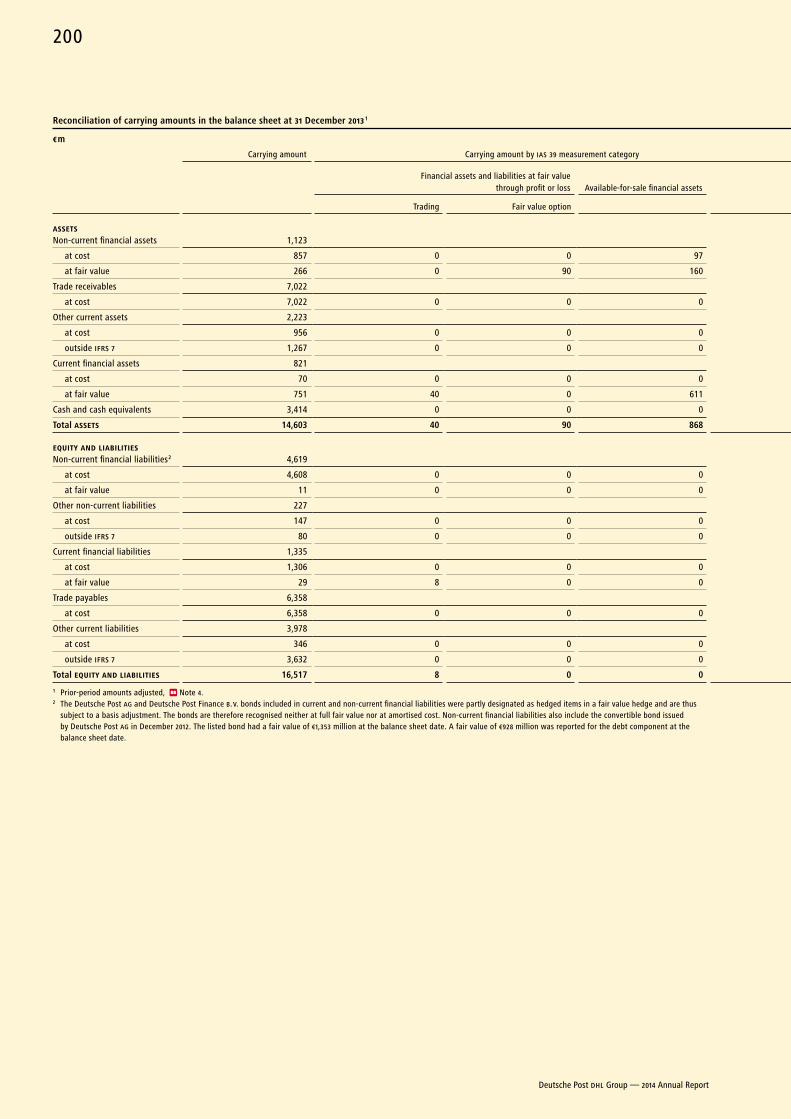
reconciliation of carrying amounts in the balance sheet at 31 December 2013 1
€ m
Carrying amount Carrying amount by IAS 39 measurement categoryOther financial instruments outside the scope of IAS 39
Fair value of financial instruments under IFRS 7
Financial assets and liabilities at fair value through profit or loss Available-for-sale financial assets
Loans and receivables / other financial liabilities
Derivatives designated as hedging instruments
Lease receivables / finance lease liabilities
Trading Fair value option
ASSETSNon-current financial assets 1,123
at cost 857 0 0 97 728 0 32 846
at fair value 266 0 90 160 0 16 0 266
Trade receivables 7,022
at cost 7,022 0 0 0 7,022 0 0 7,022
Other current assets 2,223
at cost 956 0 0 0 956 0 0 956
outside IFRS 7 1,267 0 0 0 0 0 0 0
Current financial assets 821
at cost 70 0 0 0 63 0 7 70
at fair value 751 40 0 611 0 100 0 751
Cash and cash equivalents 3,414 0 0 0 3,414 0 0 3,414
Total ASSETS 14,603 40 90 868 12,183 116 39 –
EQUITY AND LIABILITIESNon-current financial liabilities 2 4,619
at cost 4,608 0 0 0 4,414 0 194 4,664
at fair value 11 0 0 0 0 11 0 11
Other non-current liabilities 227
at cost 147 0 0 0 147 0 0 147
outside IFRS 7 80 0 0 0 0 0 0 0
Current financial liabilities 1,335
at cost 1,306 0 0 0 1,287 0 19 1,306
at fair value 29 8 0 0 0 21 0 29
Trade payables 6,358
at cost 6,358 0 0 0 6,358 0 0 6,358
Other current liabilities 3,978
at cost 346 0 0 0 346 0 0 346
outside IFRS 7 3,632 0 0 0 0 0 0 0
Total EQUITY AND LIABILITIES 16,517 8 0 0 12,552 32 213 –
1 Prior-period amounts adjusted, Note 4.2 The Deutsche Post AG and Deutsche Post Finance B. V. bonds included in current and non-current financial liabilities were partly designated as hedged items in a fair value hedge and are thus
subject to a basis adjustment. The bonds are therefore recognised neither at full fair value nor at amortised cost. Non-current financial liabilities also include the convertible bond issued by Deutsche Post AG in December 2012. The listed bond had a fair value of €1,353 million at the balance sheet date. A fair value of €928 million was reported for the debt component at the balance sheet date.
Deutsche Post DHL Group — 2014 Annual Report
200
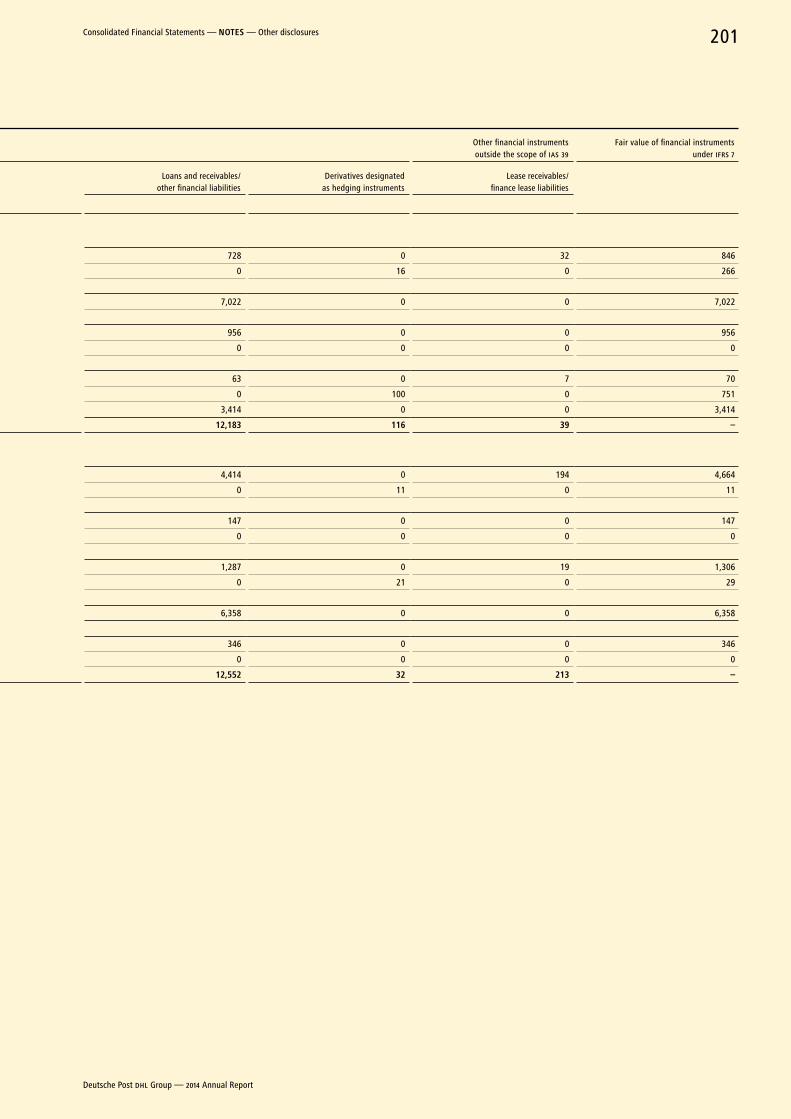
reconciliation of carrying amounts in the balance sheet at 31 December 2013 1
€ m
Carrying amount Carrying amount by IAS 39 measurement categoryOther financial instruments outside the scope of IAS 39
Fair value of financial instruments under IFRS 7
Financial assets and liabilities at fair value through profit or loss Available-for-sale financial assets
Loans and receivables / other financial liabilities
Derivatives designated as hedging instruments
Lease receivables / finance lease liabilities
Trading Fair value option
ASSETSNon-current financial assets 1,123
at cost 857 0 0 97 728 0 32 846
at fair value 266 0 90 160 0 16 0 266
Trade receivables 7,022
at cost 7,022 0 0 0 7,022 0 0 7,022
Other current assets 2,223
at cost 956 0 0 0 956 0 0 956
outside IFRS 7 1,267 0 0 0 0 0 0 0
Current financial assets 821
at cost 70 0 0 0 63 0 7 70
at fair value 751 40 0 611 0 100 0 751
Cash and cash equivalents 3,414 0 0 0 3,414 0 0 3,414
Total ASSETS 14,603 40 90 868 12,183 116 39 –
EQUITY AND LIABILITIESNon-current financial liabilities 2 4,619
at cost 4,608 0 0 0 4,414 0 194 4,664
at fair value 11 0 0 0 0 11 0 11
Other non-current liabilities 227
at cost 147 0 0 0 147 0 0 147
outside IFRS 7 80 0 0 0 0 0 0 0
Current financial liabilities 1,335
at cost 1,306 0 0 0 1,287 0 19 1,306
at fair value 29 8 0 0 0 21 0 29
Trade payables 6,358
at cost 6,358 0 0 0 6,358 0 0 6,358
Other current liabilities 3,978
at cost 346 0 0 0 346 0 0 346
outside IFRS 7 3,632 0 0 0 0 0 0 0
Total EQUITY AND LIABILITIES 16,517 8 0 0 12,552 32 213 –
1 Prior-period amounts adjusted, Note 4.2 The Deutsche Post AG and Deutsche Post Finance B. V. bonds included in current and non-current financial liabilities were partly designated as hedged items in a fair value hedge and are thus
subject to a basis adjustment. The bonds are therefore recognised neither at full fair value nor at amortised cost. Non-current financial liabilities also include the convertible bond issued by Deutsche Post AG in December 2012. The listed bond had a fair value of €1,353 million at the balance sheet date. A fair value of €928 million was reported for the debt component at the balance sheet date.
Deutsche Post DHL Group — 2014 Annual Report
201Consolidated Financial Statements — noTeS — Other disclosures
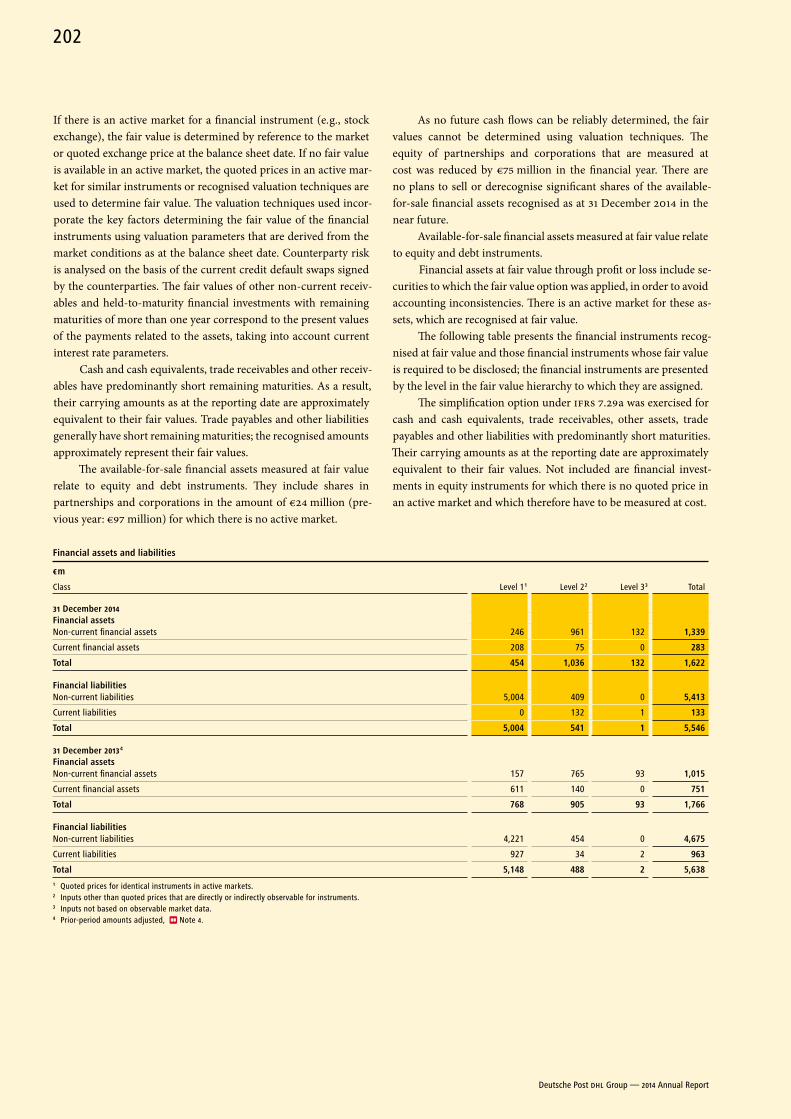
If there is an active market for a financial instrument (e. g., stock exchange), the fair value is determined by reference to the market or quoted exchange price at the balance sheet date. If no fair value is available in an active market, the quoted prices in an active mar-ket for similar instruments or recognised valuation techniques are used to determine fair value. The valuation techniques used incor-porate the key factors determining the fair value of the financial instruments using valuation parameters that are derived from the market conditions as at the balance sheet date. Counterparty risk is analysed on the basis of the current credit default swaps signed by the counterparties. The fair values of other non-current receiv-ables and held-to-maturity financial investments with remaining maturities of more than one year correspond to the present values of the payments related to the assets, taking into account current interest rate parameters.
Cash and cash equivalents, trade receivables and other receiv-ables have predominantly short remaining maturities. As a result, their carrying amounts as at the reporting date are approximately equivalent to their fair values. Trade payables and other liabilities generally have short remaining maturities; the recognised amounts approximately represent their fair values.
The available-for-sale financial assets measured at fair value relate to equity and debt instruments. They include shares in partner ships and corporations in the amount of €24 million (pre-vious year: €97 million) for which there is no active market.
As no future cash flows can be reliably determined, the fair values cannot be determined using valuation techniques. The equity of partnerships and corporations that are measured at cost was reduced by €75 million in the financial year. There are no plans to sell or derecognise significant shares of the available- for-sale financial assets recognised as at 31 December 2014 in the near future.
Available-for-sale financial assets measured at fair value relate to equity and debt instruments.
Financial assets at fair value through profit or loss include se-curities to which the fair value option was applied, in order to avoid accounting inconsistencies. There is an active market for these as-sets, which are recognised at fair value.
The following table presents the financial instruments recog-nised at fair value and those financial instruments whose fair value is required to be disclosed; the financial instruments are presented by the level in the fair value hierarchy to which they are assigned.
The simplification option under IFRS 7.29 a was exercised for cash and cash equivalents, trade receivables, other assets, trade payables and other liabilities with predominantly short maturities. Their carrying amounts as at the reporting date are approximately equivalent to their fair values. Not included are financial invest-ments in equity instruments for which there is no quoted price in an active market and which therefore have to be measured at cost.
Financial assets and liabilities
€ m
Level 1 1 Level 2 2 Level 3 3 TotalClass
31 December 2014Financial assetsNon-current financial assets 246 961 132 1,339
Current financial assets 208 75 0 283
Total 454 1,036 132 1,622
Financial liabilitiesNon-current liabilities 5,004 409 0 5,413
Current liabilities 0 132 1 133
Total 5,004 541 1 5,546
31 December 2013 4
Financial assetsNon-current financial assets 157 765 93 1,015
Current financial assets 611 140 0 751
Total 768 905 93 1,766
Financial liabilitiesNon-current liabilities 4,221 454 0 4,675
Current liabilities 927 34 2 963
Total 5,148 488 2 5,6381 Quoted prices for identical instruments in active markets.2 Inputs other than quoted prices that are directly or indirectly observable for instruments.3 Inputs not based on observable market data. 4 Prior-period amounts adjusted, Note 4.
Deutsche Post DHL Group — 2014 Annual Report
202
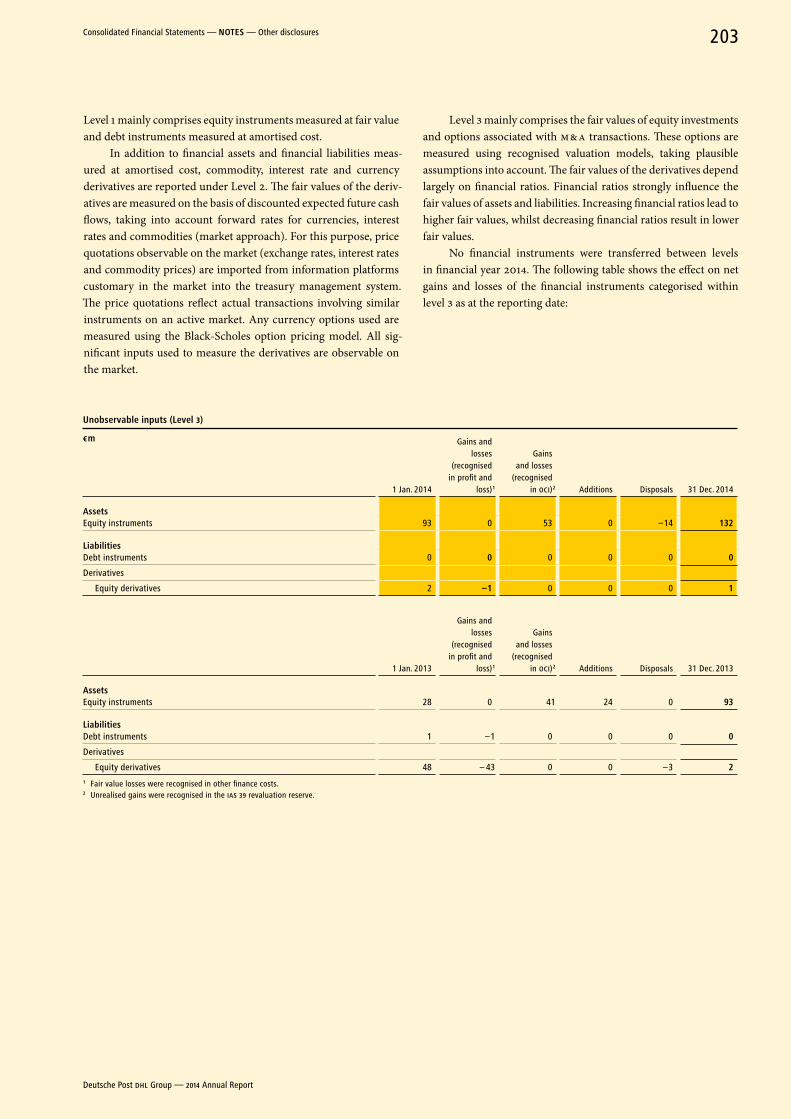
Level 1 mainly comprises equity instruments measured at fair value and debt instruments measured at amortised cost.
In addition to financial assets and financial liabilities meas-ured at amortised cost, commodity, interest rate and currency deriva tives are reported under Level 2. The fair values of the deriv-atives are measured on the basis of discounted expected future cash flows, taking into account forward rates for currencies, interest rates and commodities (market approach). For this purpose, price quotations observable on the market (exchange rates, interest rates and commodity prices) are imported from information platforms customary in the market into the treasury management system. The price quotations reflect actual transactions involving similar instruments on an active market. Any currency options used are measured using the Black-Scholes option pricing model. All sig-nificant inputs used to measure the derivatives are observable on the market.
Level 3 mainly comprises the fair values of equity investments and options associated with M & A transactions. These options are measured using recognised valuation models, taking plausible assumptions into account. The fair values of the derivatives depend largely on financial ratios. Financial ratios strongly influence the fair values of assets and liabilities. Increasing financial ratios lead to higher fair values, whilst decreasing financial ratios result in lower fair values.
No financial instruments were transferred between levels in financial year 2014. The following table shows the effect on net gains and losses of the financial instruments categorised within level 3 as at the reporting date:
Unobservable inputs (Level 3)
€ m
1 Jan. 2014
Gains and losses
( recognised in profit and
loss) 1
Gains and losses
(recognised in OCI) 2 Additions Disposals 31 Dec. 2014
AssetsEquity instruments 93 0 53 0 –14 132
LiabilitiesDebt instruments 0 0 0 0 0 0
Derivatives
Equity derivatives 2 –1 0 0 0 1
1 Jan. 2013
Gains and losses
( recognised in profit and
loss) 1
Gains and losses
(recognised in OCI) 2 Additions Disposals 31 Dec. 2013
AssetsEquity instruments 28 0 41 24 0 93
LiabilitiesDebt instruments 1 –1 0 0 0 0
Derivatives
Equity derivatives 48 – 43 0 0 –3 21 Fair value losses were recognised in other finance costs. 2 Unrealised gains were recognised in the IAS 39 revaluation reserve.
Deutsche Post DHL Group — 2014 Annual Report
203Consolidated Financial Statements — NOTES — Other disclosures
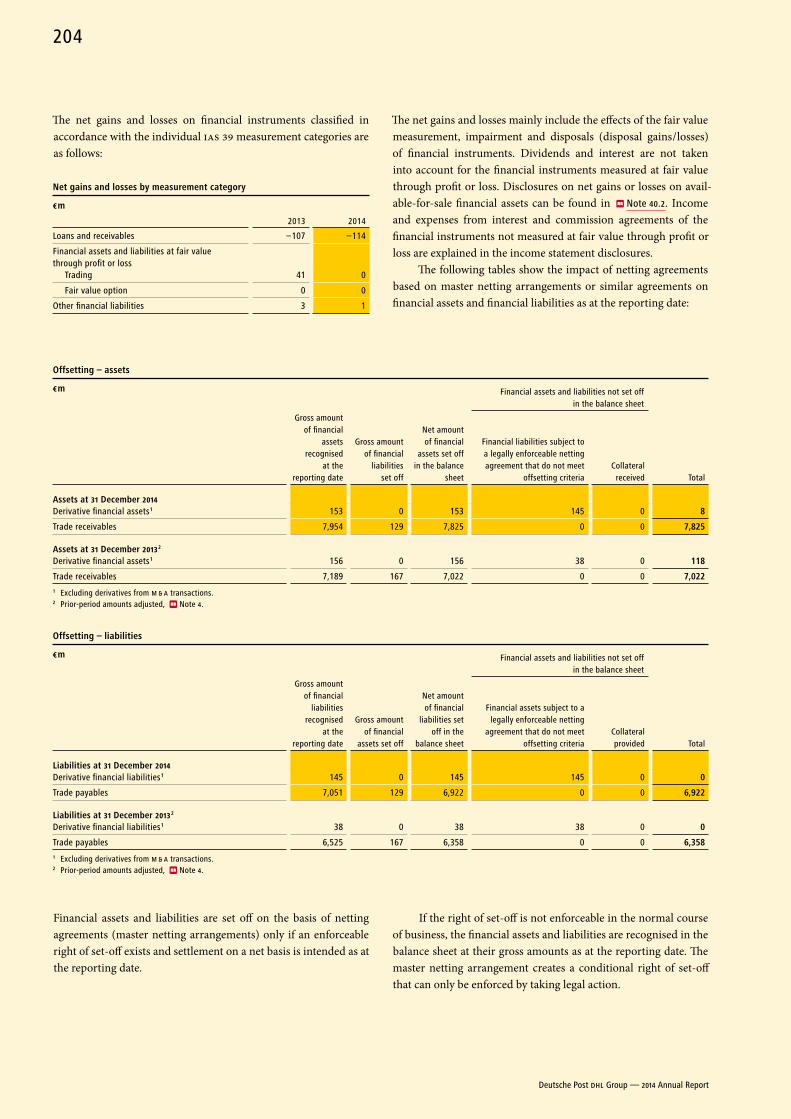
The net gains and losses on financial instruments classified in accordance with the individual IAS 39 measurement categories are as follows:
net gains and losses by measurement category
€ m
2013 2014
Loans and receivables –107 –114
Financial assets and liabilities at fair value through profit or loss
Trading 41 0
Fair value option 0 0
Other financial liabilities 3 1
The net gains and losses mainly include the effects of the fair value measurement, impairment and disposals (disposal gains / losses) of financial instruments. Dividends and interest are not taken into account for the financial instruments measured at fair value through profit or loss. Disclosures on net gains or losses on avail-able-for-sale financial assets can be found in Note 40.2. Income and expenses from interest and commission agreements of the finan cial instruments not measured at fair value through profit or loss are explained in the income statement disclosures.
The following tables show the impact of netting agreements based on master netting arrangements or similar agreements on financial assets and financial liabilities as at the reporting date:
offsetting – assets
€ m Financial assets and liabilities not set off in the balance sheet
Gross amount of financial
assets recognised
at the reporting date
Gross amount of financial
liabilities set off
Net amount of financial
assets set off in the balance
sheet
Financial liabilities subject to a legally enforceable netting agreement that do not meet
offsetting criteriaCollateral
received Total
assets at 31 December 2014Derivative financial assets 1 153 0 153 145 0 8
Trade receivables 7,954 129 7,825 0 0 7,825
assets at 31 December 2013 2
Derivative financial assets 1 156 0 156 38 0 118
Trade receivables 7,189 167 7,022 0 0 7,0221 Excluding derivatives from M & A transactions.2 Prior-period amounts adjusted, Note 4.
offsetting – liabilities
€ m Financial assets and liabilities not set off in the balance sheet
Gross amount of financial
liabilities recognised
at the reporting date
Gross amount of financial
assets set off
Net amount of financial
liabilities set off in the
balance sheet
Financial assets subject to a legally enforceable netting
agreement that do not meet offsetting criteria
Collateral provided Total
Liabilities at 31 December 2014Derivative financial liabilities 1 145 0 145 145 0 0
Trade payables 7,051 129 6,922 0 0 6,922
Liabilities at 31 December 2013 2
Derivative financial liabilities 1 38 0 38 38 0 0
Trade payables 6,525 167 6,358 0 0 6,3581 Excluding derivatives from M & A transactions.2 Prior-period amounts adjusted, Note 4.
Financial assets and liabilities are set off on the basis of netting agreements (master netting arrangements) only if an enforceable right of set-off exists and settlement on a net basis is intended as at the reporting date.
If the right of set-off is not enforceable in the normal course of business, the financial assets and liabilities are recognised in the balance sheet at their gross amounts as at the reporting date. The master netting arrangement creates a conditional right of set-off that can only be enforced by taking legal action.
Deutsche Post DHL Group — 2014 Annual Report
204
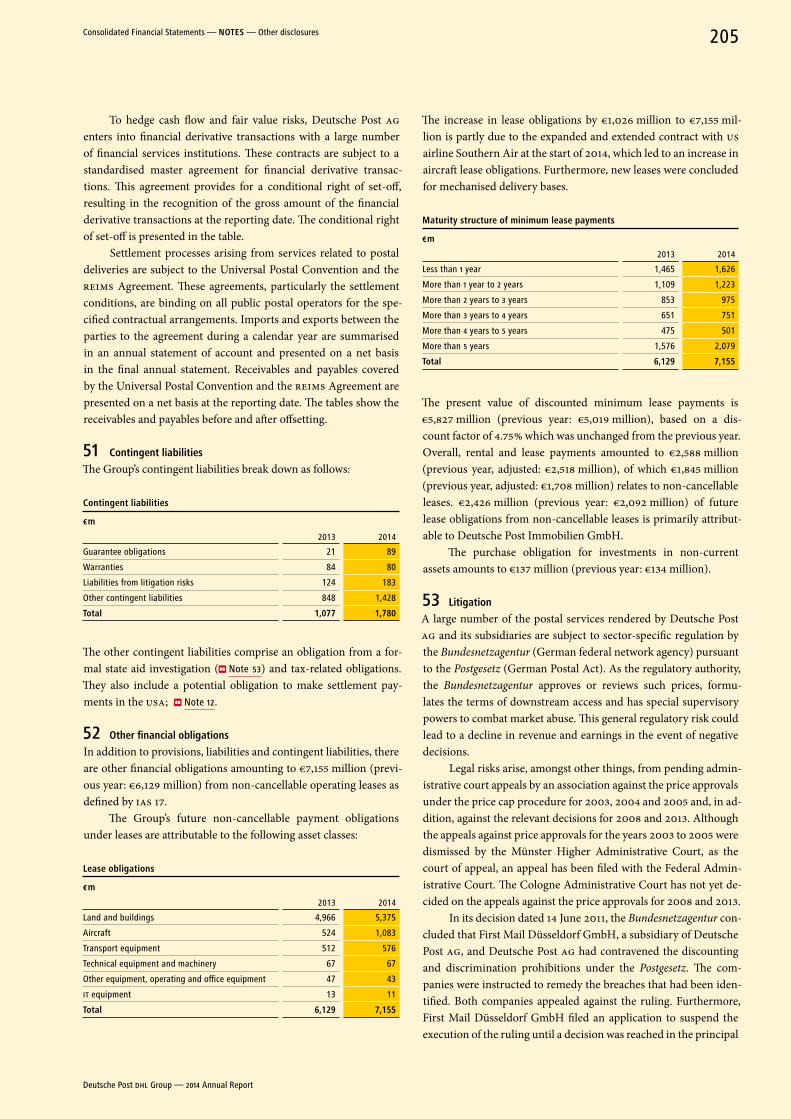
To hedge cash flow and fair value risks, Deutsche Post AG enters into financial derivative transactions with a large number of financial services institutions. These contracts are subject to a standardised master agreement for financial derivative transac-tions. This agreement provides for a conditional right of set-off, resulting in the recognition of the gross amount of the financial derivative transactions at the reporting date. The conditional right of set-off is presented in the table.
Settlement processes arising from services related to postal deliveries are subject to the Universal Postal Convention and the REIMS Agreement. These agreements, particularly the settlement conditions, are binding on all public postal operators for the spe-cified contractual arrangements. Imports and exports between the parties to the agreement during a calendar year are summarised in an annual statement of account and presented on a net basis in the final annual statement. Receivables and payables covered by the Universal Postal Convention and the REIMS Agreement are presented on a net basis at the reporting date. The tables show the receivables and payables before and after offsetting.
51 Contingent liabilities
The Group’s contingent liabilities break down as follows:
Contingent liabilities
€ m
2013 2014
Guarantee obligations 21 89
Warranties 84 80
Liabilities from litigation risks 124 183
Other contingent liabilities 848 1,428
Total 1,077 1,780
The other contingent liabilities comprise an obligation from a for-mal state aid investigation ( Note 53) and tax-related obligations. They also include a potential obligation to make settlement pay-ments in the USA; Note 12.
52 other financial obligations
In addition to provisions, liabilities and contingent liabilities, there are other financial obligations amounting to €7,155 million (previ-ous year: €6,129 million) from non-cancellable operating leases as defined by IAS 17.
The Group’s future non-cancellable payment obligations under leases are attributable to the following asset classes:
Lease obligations
€ m
2013 2014
Land and buildings 4,966 5,375
Aircraft 524 1,083
Transport equipment 512 576
Technical equipment and machinery 67 67
Other equipment, operating and office equipment 47 43
IT equipment 13 11
Total 6,129 7,155
The increase in lease obligations by €1,026 million to €7,155 mil-lion is partly due to the expanded and extended contract with US airline Southern Air at the start of 2014, which led to an increase in aircraft lease obligations. Furthermore, new leases were concluded for mechanised delivery bases.
Maturity structure of minimum lease payments
€ m
2013 2014
Less than 1 year 1,465 1,626
More than 1 year to 2 years 1,109 1,223
More than 2 years to 3 years 853 975
More than 3 years to 4 years 651 751
More than 4 years to 5 years 475 501
More than 5 years 1,576 2,079
Total 6,129 7,155
The present value of discounted minimum lease payments is €5,827 million (previous year: €5,019 million), based on a dis-count factor of 4.75 % which was unchanged from the previous year. Overall, rental and lease payments amounted to €2,588 million (previous year, adjusted: €2,518 million), of which €1,845 million (previous year, adjusted: €1,708 million) relates to non-cancellable leases. €2,426 million (previous year: €2,092 million) of future lease obligations from non-cancellable leases is primarily attribut-able to Deutsche Post Immobilien GmbH.
The purchase obligation for investments in non-current assets amounts to €137 million (previous year: €134 million).
53 Litigation
A large number of the postal services rendered by Deutsche Post AG and its subsidiaries are subject to sector-specific regulation by the Bundesnetzagentur (German federal network agency) pursuant to the Postgesetz (German Postal Act). As the regulatory authority, the Bundesnetzagentur approves or reviews such prices, formu-lates the terms of downstream access and has special supervisory powers to combat market abuse. This general regulatory risk could lead to a decline in revenue and earnings in the event of negative decisions.
Legal risks arise, amongst other things, from pending admin-istrative court appeals by an association against the price approvals under the price cap procedure for 2003, 2004 and 2005 and, in ad-dition, against the relevant decisions for 2008 and 2013. Although the appeals against price approvals for the years 2003 to 2005 were dismissed by the Münster Higher Administrative Court, as the court of appeal, an appeal has been filed with the Federal Admin-istrative Court. The Cologne Administrative Court has not yet de-cided on the appeals against the price approvals for 2008 and 2013.
In its decision dated 14 June 2011, the Bundesnetzagentur con-cluded that First Mail Düsseldorf GmbH, a subsidiary of Deutsche Post AG, and Deutsche Post AG had contravened the discounting and discrimination prohibitions under the Post gesetz. The com-panies were instructed to remedy the breaches that had been iden-tified. Both companies appealed against the ruling. Furthermore, First Mail Düsseldorf GmbH filed an application to suspend the execution of the ruling until a decision was reached in the principal
Deutsche Post DHL Group — 2014 Annual Report
205Consolidated Financial Statements — noTeS — Other disclosures
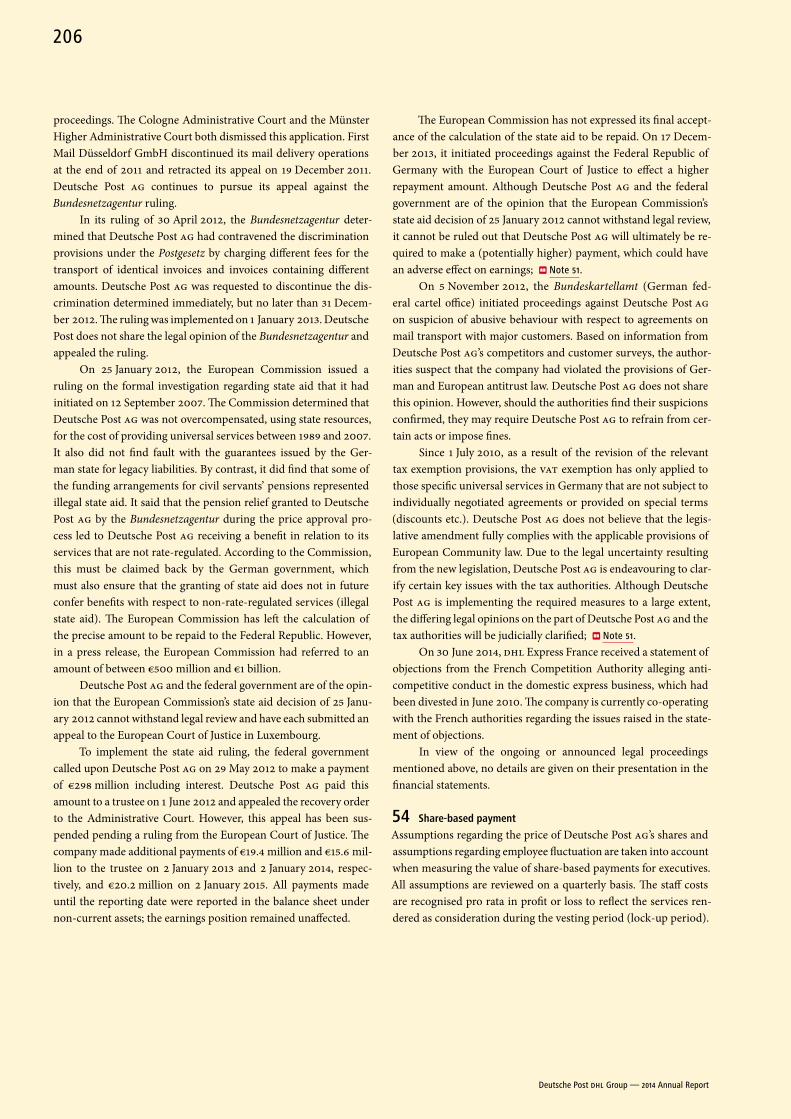
proceedings. The Cologne Administrative Court and the Münster Higher Administrative Court both dismissed this application. First Mail Düsseldorf GmbH discontinued its mail delivery operations at the end of 2011 and retracted its appeal on 19 December 2011. Deutsche Post AG continues to pursue its appeal against the Bundes netzagentur ruling.
In its ruling of 30 April 2012, the Bundesnetzagentur deter-mined that Deutsche Post AG had contravened the discrimination provisions under the Postgesetz by charging different fees for the transport of identical invoices and invoices containing different amounts. Deutsche Post AG was requested to discontinue the dis-crimination determined immediately, but no later than 31 Decem-ber 2012. The ruling was implemented on 1 January 2013. Deutsche Post does not share the legal opinion of the Bundesnetzagentur and appealed the ruling.
On 25 January 2012, the European Commission issued a ruling on the formal investigation regarding state aid that it had initiated on 12 September 2007. The Commission determined that Deutsche Post AG was not overcompensated, using state resources, for the cost of providing universal services between 1989 and 2007. It also did not find fault with the guarantees issued by the Ger-man state for legacy liabilities. By contrast, it did find that some of the funding arrangements for civil servants’ pensions represented illegal state aid. It said that the pension relief granted to Deutsche Post AG by the Bundesnetzagentur during the price approval pro-cess led to Deutsche Post AG receiving a benefit in relation to its services that are not rate-regulated. According to the Commission, this must be claimed back by the German government, which must also ensure that the granting of state aid does not in future confer benefits with respect to non-rate-regulated services (illegal state aid). The European Commission has left the calculation of the precise amount to be repaid to the Federal Republic. However, in a press release, the European Commission had referred to an amount of between €500 million and €1 billion.
Deutsche Post AG and the federal government are of the opin-ion that the European Commission’s state aid decision of 25 Janu-ary 2012 cannot withstand legal review and have each submitted an appeal to the European Court of Justice in Luxembourg.
To implement the state aid ruling, the federal government called upon Deutsche Post AG on 29 May 2012 to make a payment of €298 million including interest. Deutsche Post AG paid this amount to a trustee on 1 June 2012 and appealed the recovery order to the Administrative Court. However, this appeal has been sus-pended pending a ruling from the European Court of Justice. The company made additional payments of €19.4 million and €15.6 mil-lion to the trustee on 2 January 2013 and 2 January 2014, respec-tively, and €20.2 million on 2 January 2015. All payments made until the reporting date were reported in the balance sheet under non- current assets; the earnings position remained unaffected.
The European Commission has not expressed its final accept-ance of the calculation of the state aid to be repaid. On 17 Decem-ber 2013, it initiated proceedings against the Federal Republic of Germany with the European Court of Justice to effect a higher repayment amount. Although Deutsche Post AG and the federal government are of the opinion that the European Commission’s state aid decision of 25 January 2012 cannot withstand legal review, it cannot be ruled out that Deutsche Post AG will ultimately be re-quired to make a (potentially higher) payment, which could have an adverse effect on earnings; Note 51.
On 5 November 2012, the Bundeskartellamt (German fed-eral cartel office) initiated proceedings against Deutsche Post AG on suspicion of abusive behaviour with respect to agreements on mail transport with major customers. Based on information from Deutsche Post AG’s competitors and customer surveys, the author-ities suspect that the company had violated the provisions of Ger-man and European antitrust law. Deutsche Post AG does not share this opinion. However, should the authorities find their suspicions confirmed, they may require Deutsche Post AG to refrain from cer-tain acts or impose fines.
Since 1 July 2010, as a result of the revision of the relevant tax exemption provisions, the VAT exemption has only applied to those specific universal services in Germany that are not subject to individually negotiated agreements or provided on special terms (discounts etc.). Deutsche Post AG does not believe that the legis-lative amendment fully complies with the applicable provisions of European Community law. Due to the legal uncertainty resulting from the new legislation, Deutsche Post AG is endeavouring to clar-ify certain key issues with the tax authorities. Although Deutsche Post AG is implementing the required measures to a large extent, the differing legal opinions on the part of Deutsche Post AG and the tax authorities will be judicially clarified; Note 51.
On 30 June 2014, DHL Express France received a statement of objections from the French Competition Authority alleging anti-competitive conduct in the domestic express business, which had been divested in June 2010. The company is currently co-operating with the French authorities regarding the issues raised in the state-ment of objections.
In view of the ongoing or announced legal proceedings mentioned above, no details are given on their presentation in the finan cial statements.
54 Share-based payment
Assumptions regarding the price of Deutsche Post AG’s shares and assumptions regarding employee fluctuation are taken into account when measuring the value of share-based payments for executives. All assumptions are reviewed on a quarterly basis. The staff costs are recognised pro rata in profit or loss to reflect the services ren-dered as consideration during the vesting period (lock-up period).
Deutsche Post DHL Group — 2014 Annual Report
206
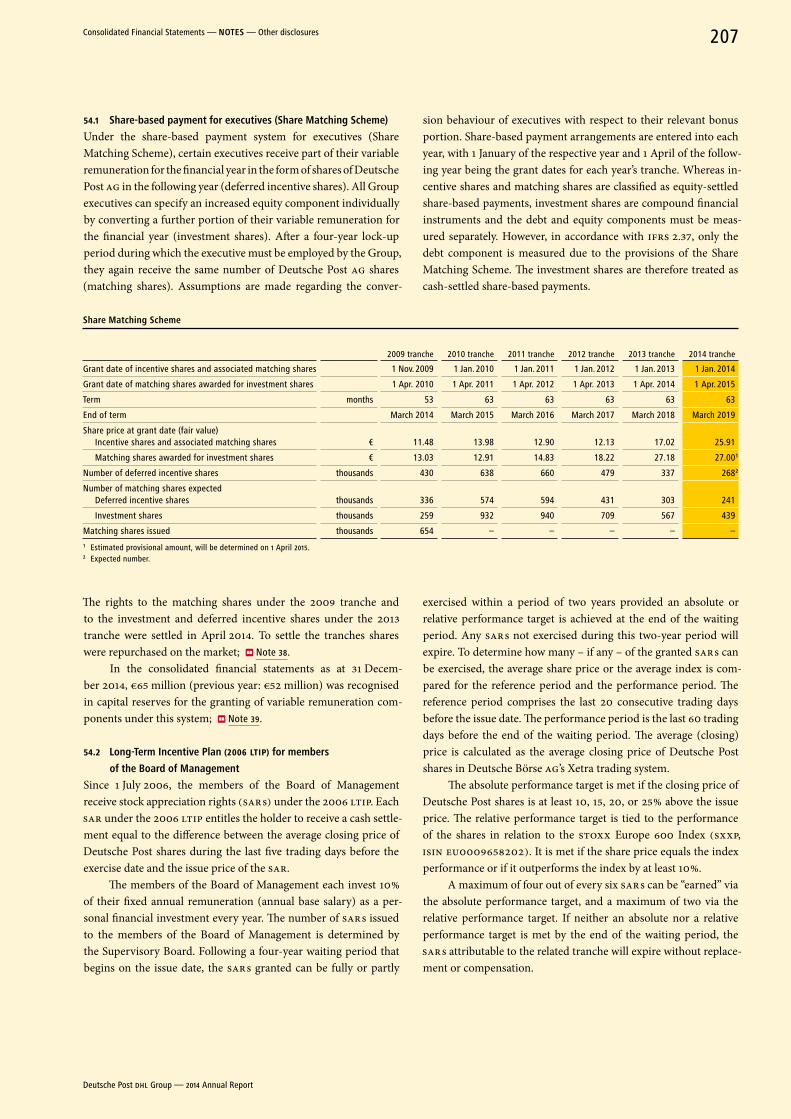
54.1 Share-based payment for executives (Share Matching Scheme)
Under the share-based payment system for executives (Share Matching Scheme), certain executives receive part of their variable remuneration for the financial year in the form of shares of Deutsche Post AG in the following year (deferred incentive shares). All Group executives can specify an increased equity component individually by converting a further portion of their variable remuneration for the financial year (investment shares). After a four-year lock-up period during which the executive must be employed by the Group, they again receive the same number of Deutsche Post AG shares (matching shares). Assumptions are made regarding the conver-
sion behaviour of executives with respect to their relevant bonus portion. Share-based payment arrangements are entered into each year, with 1 January of the respective year and 1 April of the follow-ing year being the grant dates for each year’s tranche. Whereas in-centive shares and matching shares are classified as equity-settled share-based payments, investment shares are compound financial instruments and the debt and equity components must be meas-ured separately. However, in accordance with IFRS 2.37, only the debt component is measured due to the provisions of the Share Matching Scheme. The investment shares are therefore treated as cash-settled share-based payments.
Share Matching Scheme
2009 tranche 2010 tranche 2011 tranche 2012 tranche 2013 tranche 2014 tranche
Grant date of incentive shares and associated matching shares 1 Nov. 2009 1 Jan. 2010 1 Jan. 2011 1 Jan. 2012 1 Jan. 2013 1 Jan. 2014
Grant date of matching shares awarded for investment shares 1 Apr. 2010 1 Apr. 2011 1 Apr. 2012 1 Apr. 2013 1 Apr. 2014 1 Apr. 2015
Term months 53 63 63 63 63 63
End of term March 2014 March 2015 March 2016 March 2017 March 2018 March 2019
Share price at grant date (fair value)Incentive shares and associated matching shares € 11.48 13.98 12.90 12.13 17.02 25.91
Matching shares awarded for investment shares € 13.03 12.91 14.83 18.22 27.18 27.00 1
Number of deferred incentive shares thousands 430 638 660 479 337 268 2
Number of matching shares expectedDeferred incentive shares thousands 336 574 594 431 303 241
Investment shares thousands 259 932 940 709 567 439
Matching shares issued thousands 654 – – – – –1 Estimated provisional amount, will be determined on 1 April 2015.2 Expected number.
The rights to the matching shares under the 2009 tranche and to the investment and deferred incentive shares under the 2013 tranche were settled in April 2014. To settle the tranches shares were repurchased on the market; Note 38.
In the consolidated financial statements as at 31 Decem-ber 2014, €65 million (previous year: €52 million) was recognised in capital reserves for the granting of variable remuneration com-ponents under this system; Note 39.
54.2 Long-Term Incentive Plan (2006 LTIP) for members
of the Board of Management
Since 1 July 2006, the members of the Board of Management receive stock appreciation rights (SAR s) under the 2006 LTIP. Each SAR under the 2006 LTIP entitles the holder to receive a cash settle-ment equal to the difference between the average closing price of Deutsche Post shares during the last five trading days before the exercise date and the issue price of the SAR.
The members of the Board of Management each invest 10 % of their fixed annual remuneration (annual base salary) as a per-sonal financial investment every year. The number of SAR s issued to the members of the Board of Management is determined by the Super visory Board. Following a four-year waiting period that begins on the issue date, the SAR s granted can be fully or partly
exercised within a period of two years provided an absolute or relative performance target is achieved at the end of the waiting period. Any SAR s not exercised during this two-year period will expire. To determine how many – if any – of the granted SAR s can be exercised, the average share price or the average index is com-pared for the reference period and the performance period. The reference period comprises the last 20 consecutive trading days before the issue date. The performance period is the last 60 trading days before the end of the waiting period. The average (closing) price is calculated as the average closing price of Deutsche Post shares in Deutsche Börse AG’s Xetra trading system.
The absolute performance target is met if the closing price of Deutsche Post shares is at least 10, 15, 20, or 25 % above the issue price. The relative performance target is tied to the performance of the shares in relation to the STOXX Europe 600 Index (SXXP, ISIN EU0009658202). It is met if the share price equals the index performance or if it outperforms the index by at least 10 %.
A maximum of four out of every six SAR s can be “earned” via the absolute performance target, and a maximum of two via the relative performance target. If neither an absolute nor a relative performance target is met by the end of the waiting period, the SAR s attributable to the related tranche will expire without replace-ment or compensation.
Deutsche Post DHL Group — 2014 Annual Report
207Consolidated Financial Statements — noTeS — Other disclosures
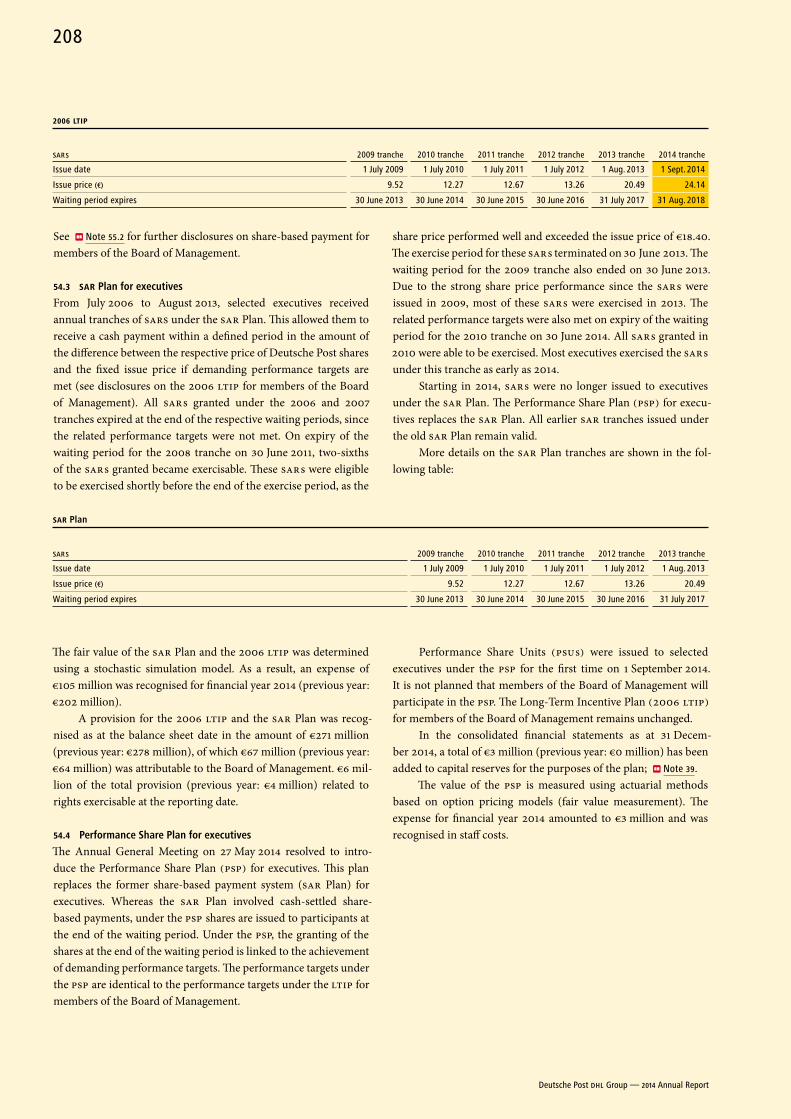
2006 LTIP
2009 tranche 2010 tranche 2011 tranche 2012 tranche 2013 tranche 2014 trancheSAR s
Issue date 1 July 2009 1 July 2010 1 July 2011 1 July 2012 1 Aug. 2013 1 Sept. 2014
Issue price (€) 9.52 12.27 12.67 13.26 20.49 24.14
Waiting period expires 30 June 2013 30 June 2014 30 June 2015 30 June 2016 31 July 2017 31 Aug. 2018
See Note 55.2 for further disclosures on share-based payment for members of the Board of Management.
54.3 SAR Plan for executives
From July 2006 to August 2013, selected executives received annual tranches of SARS under the SAR Plan. This allowed them to receive a cash payment within a defined period in the amount of the difference between the respective price of Deutsche Post shares and the fixed issue price if demanding performance targets are met (see disclosures on the 2006 LTIP for members of the Board of Management). All SAR s granted under the 2006 and 2007 tranches expired at the end of the respective waiting periods, since the related performance targets were not met. On expiry of the waiting period for the 2008 tranche on 30 June 2011, two-sixths of the SAR s granted became exercisable. These SAR s were eligible to be exercised shortly before the end of the exercise period, as the
share price performed well and exceeded the issue price of €18.40. The exercise period for these SAR s terminated on 30 June 2013. The waiting period for the 2009 tranche also ended on 30 June 2013. Due to the strong share price performance since the SAR s were issued in 2009, most of these SAR s were exercised in 2013. The related performance targets were also met on expiry of the waiting period for the 2010 tranche on 30 June 2014. All SAR s granted in 2010 were able to be exercised. Most executives exercised the SAR s under this tranche as early as 2014.
Starting in 2014, SAR s were no longer issued to executives under the SAR Plan. The Performance Share Plan (PSP) for execu-tives replaces the SAR Plan. All earlier SAR tranches issued under the old SAR Plan remain valid.
More details on the SAR Plan tranches are shown in the fol-lowing table:
SAR Plan
2009 tranche 2010 tranche 2011 tranche 2012 tranche 2013 trancheSAR s
Issue date 1 July 2009 1 July 2010 1 July 2011 1 July 2012 1 Aug. 2013
Issue price (€) 9.52 12.27 12.67 13.26 20.49
Waiting period expires 30 June 2013 30 June 2014 30 June 2015 30 June 2016 31 July 2017
The fair value of the SAR Plan and the 2006 LTIP was determined using a stochastic simulation model. As a result, an expense of €105 million was recognised for financial year 2014 (previous year: €202 million).
A provision for the 2006 LTIP and the SAR Plan was recog-nised as at the balance sheet date in the amount of €271 million (previous year: €278 million), of which €67 million (previous year: €64 million) was attributable to the Board of Management. €6 mil-lion of the total provision (previous year: €4 million) related to rights exercisable at the reporting date.
54.4 Performance Share Plan for executives
The Annual General Meeting on 27 May 2014 resolved to intro-duce the Performance Share Plan (PSP) for executives. This plan replaces the former share-based payment system (SAR Plan) for executives. Whereas the SAR Plan involved cash-settled share-based payments, under the PSP shares are issued to participants at the end of the waiting period. Under the PSP, the granting of the shares at the end of the waiting period is linked to the achievement of demanding performance targets. The performance targets under the PSP are identical to the performance targets under the LTIP for members of the Board of Management.
Performance Share Units (PSU s) were issued to selected executives under the PSP for the first time on 1 September 2014. It is not planned that members of the Board of Management will partici pate in the PSP. The Long-Term Incentive Plan (2006 LTIP) for members of the Board of Management remains unchanged.
In the consolidated financial statements as at 31 Decem-ber 2014, a total of €3 million (previous year: €0 million) has been added to capital reserves for the purposes of the plan; Note 39.
The value of the PSP is measured using actuarial methods based on option pricing models (fair value measurement). The expense for financial year 2014 amounted to €3 million and was recognised in staff costs.
Deutsche Post DHL Group — 2014 Annual Report
208
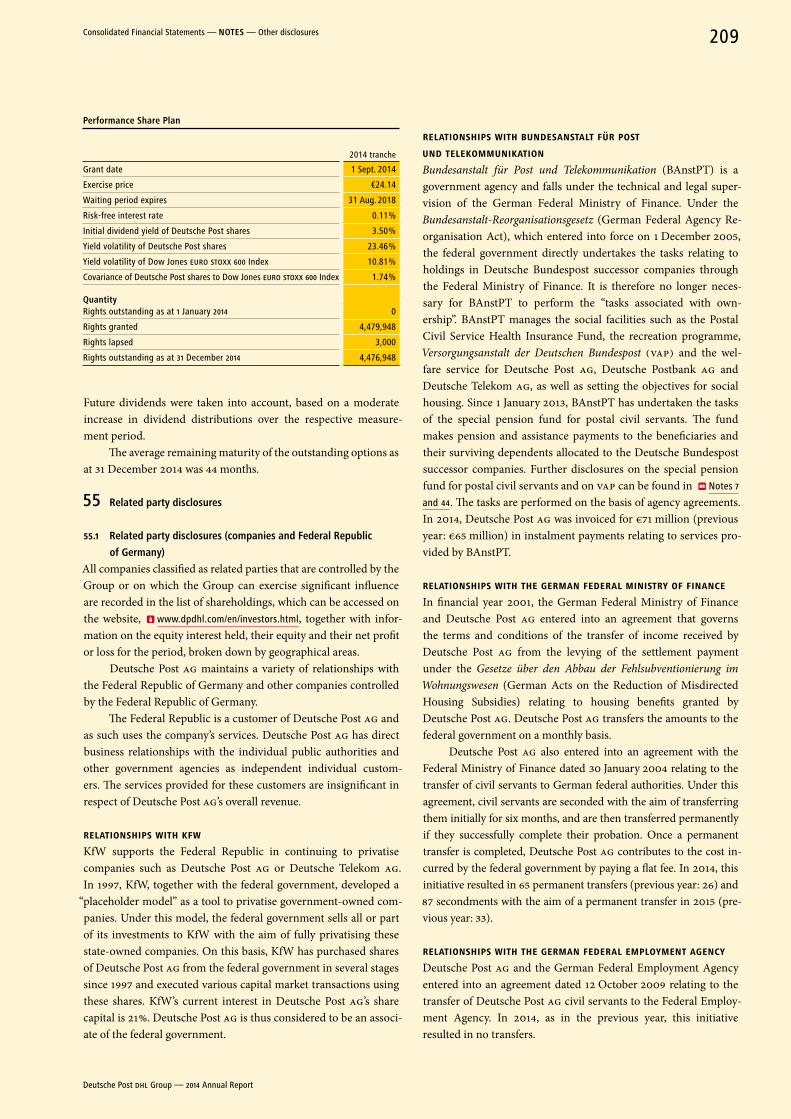
Performance Share Plan
2014 tranche
Grant date 1 Sept. 2014
Exercise price €24.14
Waiting period expires 31 Aug. 2018
Risk-free interest rate 0.11 %
Initial dividend yield of Deutsche Post shares 3.50 %
Yield volatility of Deutsche Post shares 23.46 %
Yield volatility of Dow Jones EURO STOXX 600 Index 10.81 %
Covariance of Deutsche Post shares to Dow Jones EURO STOXX 600 Index 1.74 %
QuantityRights outstanding as at 1 January 2014 0
Rights granted 4,479,948
Rights lapsed 3,000
Rights outstanding as at 31 December 2014 4,476,948
Future dividends were taken into account, based on a moderate increase in dividend distributions over the respective measure-ment period.
The average remaining maturity of the outstanding options as at 31 December 2014 was 44 months.
55 related party disclosures
55.1 related party disclosures (companies and Federal republic
of Germany)
All companies classified as related parties that are controlled by the Group or on which the Group can exercise significant influence are recorded in the list of shareholdings, which can be accessed on the website, www.dpdhl.com/en/investors.html, together with infor-mation on the equity interest held, their equity and their net profit or loss for the period, broken down by geographical areas.
Deutsche Post AG maintains a variety of relationships with the Federal Republic of Germany and other companies controlled by the Federal Republic of Germany.
The Federal Republic is a customer of Deutsche Post AG and as such uses the company’s services. Deutsche Post AG has direct business relationships with the individual public authorities and other government agencies as independent individual custom-ers. The services provided for these customers are insignificant in respect of Deutsche Post AG’s overall revenue.
RELATIONSHIPS WITH KFWKfW supports the Federal Republic in continuing to privatise companies such as Deutsche Post AG or Deutsche Telekom AG. In 1997, KfW, together with the federal government, developed a
“placeholder model” as a tool to privatise government-owned com-panies. Under this model, the federal government sells all or part of its investments to KfW with the aim of fully privatising these state-owned companies. On this basis, KfW has purchased shares of Deutsche Post AG from the federal government in several stages since 1997 and executed various capital market transactions using these shares. KfW’s current interest in Deutsche Post AG’s share capital is 21 %. Deutsche Post AG is thus considered to be an associ-ate of the federal government.
RELATIONSHIPS WITH BUNDESANSTALT FüR POST UND TELEKOMMUNIKATIONBundesanstalt für Post und Telekommunikation (BAnstPT) is a govern ment agency and falls under the technical and legal super-vision of the German Federal Ministry of Finance. Under the Bundes anstalt-Reorganisationsgesetz (German Federal Agency Re-organisation Act), which entered into force on 1 December 2005, the federal government directly undertakes the tasks relating to holdings in Deutsche Bundespost successor companies through the Federal Ministry of Finance. It is therefore no longer neces-sary for BAnstPT to perform the “tasks associated with own-ership”. BAnstPT manages the social facilities such as the Postal Civil Service Health Insurance Fund, the recreation programme, Versorgungsanstalt der Deutschen Bundespost (VAP) and the wel-fare service for Deutsche Post AG, Deutsche Postbank AG and Deutsche Telekom AG, as well as setting the objectives for social housing. Since 1 January 2013, BAnstPT has undertaken the tasks of the special pension fund for postal civil servants. The fund makes pension and assistance payments to the beneficiaries and their surviving dependents allocated to the Deutsche Bundespost successor companies. Further disclosures on the special pension fund for postal civil servants and on VAP can be found in Notes 7
and 44. The tasks are performed on the basis of agency agreements. In 2014, Deutsche Post AG was invoiced for €71 million (previous year: €65 million) in instalment payments relating to services pro-vided by BAnstPT.
RELATIONSHIPS WITH THE GERMAN FEDERAL MINISTRY OF FINANCEIn financial year 2001, the German Federal Ministry of Finance and Deutsche Post AG entered into an agreement that governs the terms and conditions of the transfer of income received by Deutsche Post AG from the levying of the settlement payment under the Gesetze über den Abbau der Fehlsubventionierung im Wohnungswesen (German Acts on the Reduction of Mis directed Housing Subsidies) relating to housing benefits granted by Deutsche Post AG. Deutsche Post AG transfers the amounts to the federal government on a monthly basis.
Deutsche Post AG also entered into an agreement with the Federal Ministry of Finance dated 30 January 2004 relating to the transfer of civil servants to German federal authorities. Under this agreement, civil servants are seconded with the aim of transferring them initially for six months, and are then transferred permanently if they successfully complete their probation. Once a permanent transfer is completed, Deutsche Post AG contributes to the cost in-curred by the federal government by paying a flat fee. In 2014, this initiative resulted in 65 permanent transfers (previous year: 26) and 87 secondments with the aim of a permanent transfer in 2015 (pre-vious year: 33).
RELATIONSHIPS WITH THE GERMAN FEDERAL EMPLOYMENT AGENCYDeutsche Post AG and the German Federal Employment Agency entered into an agreement dated 12 October 2009 relating to the transfer of Deutsche Post AG civil servants to the Federal Employ-ment Agency. In 2014, as in the previous year, this initiative resulted in no transfers.
Deutsche Post DHL Group — 2014 Annual Report
209Consolidated Financial Statements — noTeS — Other disclosures
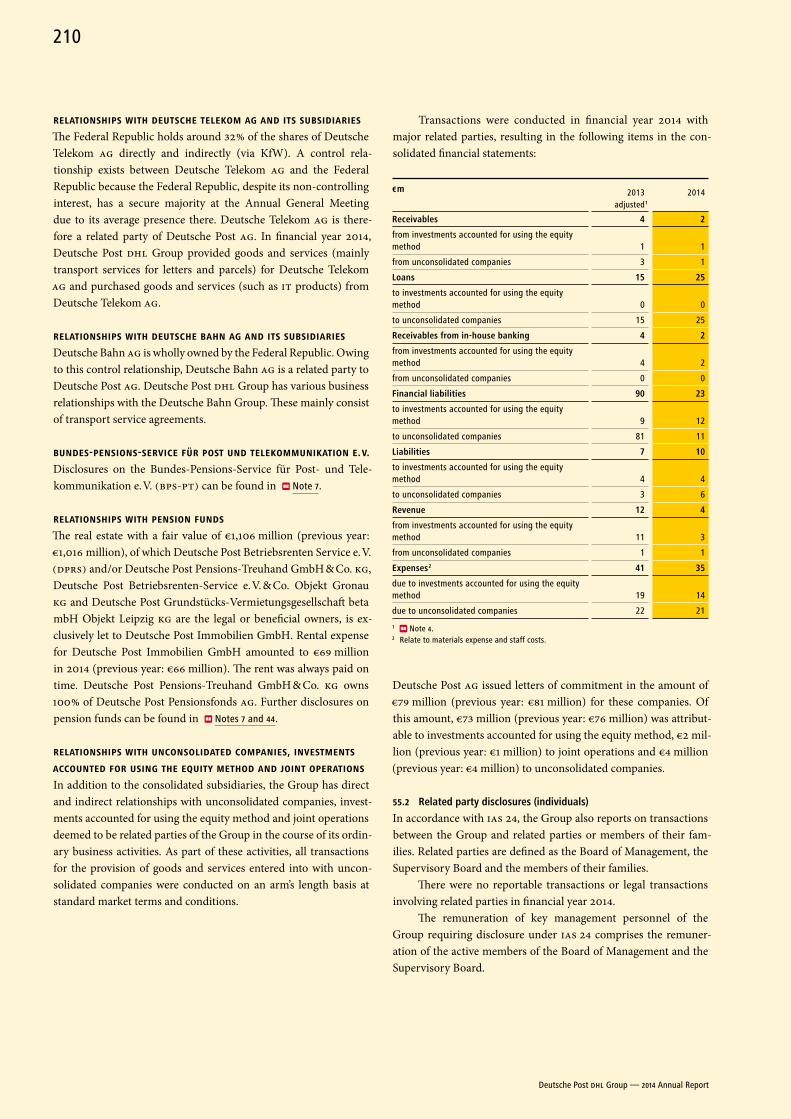
RELATIONSHIPS WITH DEUTSCHE TELEKOM AG AND ITS SUBSIDIARIESThe Federal Republic holds around 32 % of the shares of Deutsche Telekom AG directly and indirectly (via KfW). A control rela-tionship exists between Deutsche Telekom AG and the Federal Republic because the Federal Republic, despite its non-controlling interest, has a secure majority at the Annual General Meeting due to its average presence there. Deutsche Telekom AG is there-fore a related party of Deutsche Post AG. In financial year 2014, Deutsche Post DHL Group provided goods and services (mainly transport services for letters and parcels) for Deutsche Telekom AG and purchased goods and services (such as IT products) from Deutsche Telekom AG.
RELATIONSHIPS WITH DEUTSCHE BAHN AG AND ITS SUBSIDIARIESDeutsche Bahn AG is wholly owned by the Federal Republic. Owing to this control relationship, Deutsche Bahn AG is a related party to Deutsche Post AG. Deutsche Post DHL Group has various business relationships with the Deutsche Bahn Group. These mainly consist of transport service agreements.
BUNDES-PENSIONS-SERvICE FüR POST UND TELEKOMMUNIKATION E. v.Disclosures on the Bundes-Pensions-Service für Post- und Tele-kommunikation e. V. (BPS-PT) can be found in Note 7.
RELATIONSHIPS WITH PENSION FUNDSThe real estate with a fair value of €1,106 million (previous year: €1,016 million), of which Deutsche Post Betriebsrenten Service e. V. (DPRS) and /or Deutsche Post Pensions-Treuhand GmbH & Co. KG, Deutsche Post Betriebsrenten-Service e. V. & Co. Objekt Gronau KG and Deutsche Post Grundstücks-Vermietungsgesellschaft beta mbH Objekt Leipzig KG are the legal or beneficial owners, is ex-clusively let to Deutsche Post Immobilien GmbH. Rental expense for Deutsche Post Immobilien GmbH amounted to €69 million in 2014 (previous year: €66 million). The rent was always paid on time. Deutsche Post Pensions-Treuhand GmbH & Co. KG owns 100 % of Deutsche Post Pensionsfonds AG. Further disclosures on pension funds can be found in Notes 7 and 44.
RELATIONSHIPS WITH UNCONSOLIDATED COMPANIES, INvESTMENTS ACCOUNTED FOR USING THE EQUITY METHOD AND jOINT OPERATIONSIn addition to the consolidated subsidiaries, the Group has direct and indirect relationships with unconsolidated companies, invest-ments accounted for using the equity method and joint operations deemed to be related parties of the Group in the course of its ordin-ary business activities. As part of these activities, all transactions for the provision of goods and services entered into with uncon-solidated companies were conducted on an arm’s length basis at standard market terms and conditions.
Transactions were conducted in financial year 2014 with major related parties, resulting in the following items in the con-solidated financial statements:
€ m 2013 adjusted 1
2014
receivables 4 2
from investments accounted for using the equity method 1 1
from unconsolidated companies 3 1
Loans 15 25
to investments accounted for using the equity method 0 0
to unconsolidated companies 15 25
receivables from in-house banking 4 2
from investments accounted for using the equity method 4 2
from unconsolidated companies 0 0
Financial liabilities 90 23
to investments accounted for using the equity method 9 12
to unconsolidated companies 81 11
Liabilities 7 10
to investments accounted for using the equity method 4 4
to unconsolidated companies 3 6
revenue 12 4
from investments accounted for using the equity method 11 3
from unconsolidated companies 1 1
expenses 2 41 35
due to investments accounted for using the equity method 19 14
due to unconsolidated companies 22 21
1 Note 4.2 Relate to materials expense and staff costs.
Deutsche Post AG issued letters of commitment in the amount of €79 million (previous year: €81 million) for these companies. Of this amount, €73 million (previous year: €76 million) was attribut-able to investments accounted for using the equity method, €2 mil-lion (previous year: €1 million) to joint operations and €4 million (previous year: €4 million) to unconsolidated companies.
55.2 related party disclosures (individuals)
In accordance with IAS 24, the Group also reports on transactions between the Group and related parties or members of their fam-ilies. Related parties are defined as the Board of Management, the Supervisory Board and the members of their families.
There were no reportable transactions or legal transactions involving related parties in financial year 2014.
The remuneration of key management personnel of the Group requiring disclosure under IAS 24 comprises the remuner-ation of the active members of the Board of Management and the Supervisory Board.
Deutsche Post DHL Group — 2014 Annual Report
210
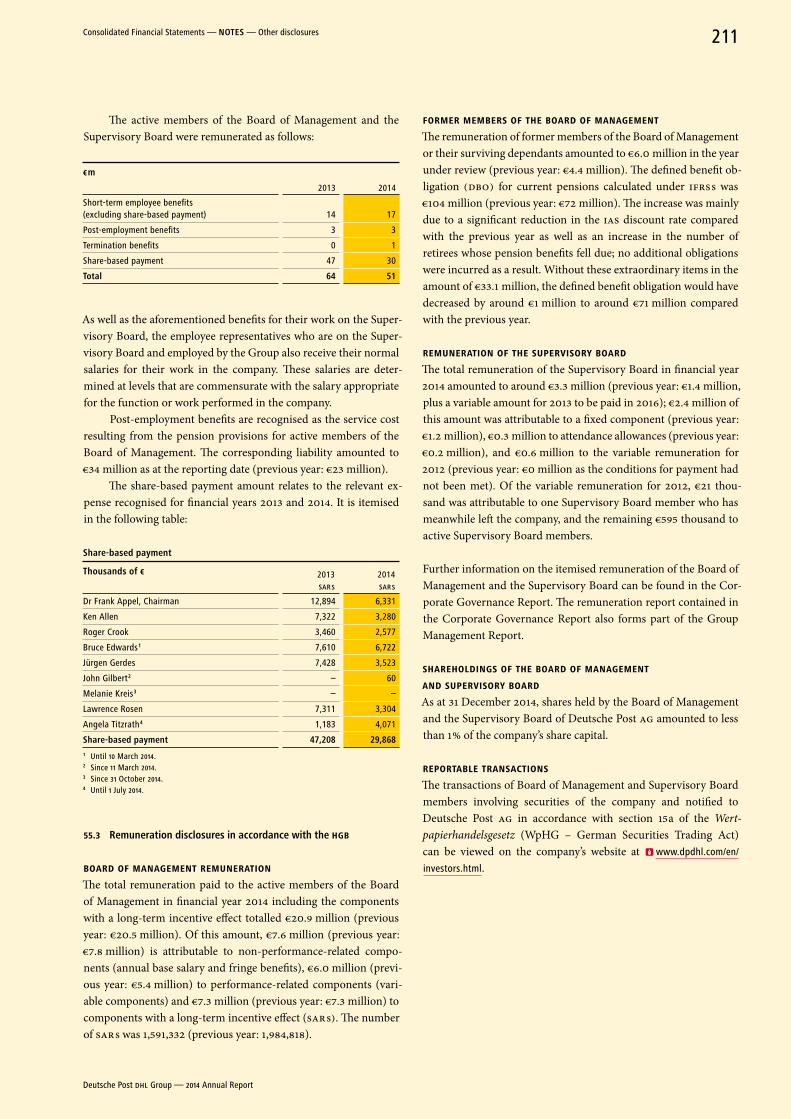
The active members of the Board of Management and the Super visory Board were remunerated as follows:
€ m
2013 2014
Short-term employee benefits (excluding share-based payment) 14 17
Post-employment benefits 3 3
Termination benefits 0 1
Share-based payment 47 30
Total 64 51
As well as the aforementioned benefits for their work on the Super-visory Board, the employee representatives who are on the Super-visory Board and employed by the Group also receive their normal salaries for their work in the company. These salaries are deter-mined at levels that are commensurate with the salary appropriate for the function or work performed in the company.
Post-employment benefits are recognised as the service cost resulting from the pension provisions for active members of the Board of Management. The corresponding liability amounted to €34 million as at the reporting date (previous year: €23 million).
The share-based payment amount relates to the relevant ex-pense recognised for financial years 2013 and 2014. It is itemised in the following table:
Share-based payment
Thousands of € 2013 SAR s
2014 SAR s
Dr Frank Appel, Chairman 12,894 6,331
Ken Allen 7,322 3,280
Roger Crook 3,460 2,577
Bruce Edwards 1 7,610 6,722
Jürgen Gerdes 7,428 3,523
John Gilbert 2 – 60
Melanie Kreis 3 – –
Lawrence Rosen 7,311 3,304
Angela Titzrath 4 1,183 4,071
Share-based payment 47,208 29,8681 Until 10 March 2014.2 Since 11 March 2014.3 Since 31 October 2014.4 Until 1 July 2014.
55.3 remuneration disclosures in accordance with the HGB
BOARD OF MANAGEMENT REMUNERATIONThe total remuneration paid to the active members of the Board of Management in financial year 2014 including the components with a long-term incentive effect totalled €20.9 million (previous year: €20.5 million). Of this amount, €7.6 million (previous year: €7.8 million) is attributable to non-performance-related compo-nents (annual base salary and fringe benefits), €6.0 million (previ-ous year: €5.4 million) to performance-related components (vari-able components) and €7.3 million (previous year: €7.3 million) to components with a long-term incentive effect (SAR s). The number of SAR s was 1,591,332 (previous year: 1,984,818).
FORMER MEMBERS OF THE BOARD OF MANAGEMENTThe remuneration of former members of the Board of Management or their surviving dependants amounted to €6.0 million in the year under review (previous year: €4.4 million). The defined benefit ob-ligation (DBO) for current pensions calculated under IFRS s was €104 million (previous year: €72 million). The increase was mainly due to a significant reduction in the IAS discount rate compared with the previous year as well as an increase in the number of retirees whose pension benefits fell due; no additional obligations were incurred as a result. Without these extraordinary items in the amount of €33.1 million, the defined benefit obligation would have decreased by around €1 million to around €71 million compared with the previous year.
REMUNERATION OF THE SUPERvISORY BOARDThe total remuneration of the Supervisory Board in financial year 2014 amounted to around €3.3 million (previous year: €1.4 million, plus a variable amount for 2013 to be paid in 2016); €2.4 million of this amount was attributable to a fixed component (previous year: €1.2 million), €0.3 million to attendance allowances (previous year: €0.2 million), and €0.6 million to the variable remuneration for 2012 (previous year: €0 million as the conditions for payment had not been met). Of the variable remuneration for 2012, €21 thou-sand was attributable to one Supervisory Board member who has meanwhile left the company, and the remaining €595 thousand to active Supervisory Board members.
Further information on the itemised remuneration of the Board of Management and the Supervisory Board can be found in the Cor-porate Governance Report. The remuneration report contained in the Corporate Governance Report also forms part of the Group Management Report.
SHAREHOLDINGS OF THE BOARD OF MANAGEMENT AND SUPERvISORY BOARDAs at 31 December 2014, shares held by the Board of Management and the Supervisory Board of Deutsche Post AG amounted to less than 1 % of the company’s share capital.
REPORTABLE TRANSACTIONSThe transactions of Board of Management and Supervisory Board members involving securities of the company and notified to Deutsche Post AG in accordance with section 15 a of the Wert-papierhandelsgesetz (WpHG – German Securities Trading Act) can be viewed on the company’s website at www.dpdhl.com/en/
investors.html.
Deutsche Post DHL Group — 2014 Annual Report
211Consolidated Financial Statements — noTeS — Other disclosures
56 auditor’s fees
The fee for the auditor of the consolidated financial statements, PricewaterhouseCoopers Aktiengesellschaft Wirtschaftsprüfungs-gesellschaft, amounted to €10 million in financial year 2014 and was recognised as an expense. Of this amount, €6 million was attribut able to the category covering audits of the financial state-ments which includes in particular the fees for auditing the con-solidated financial statements, as well as for auditing the annual financial statements prepared by Deutsche Post AG and its German subsidiaries. A further €3 million relates to the other advisory and valuation services category. It primarily includes the fees for review-ing the interim reports. In addition, it includes fees for voluntary audits extending beyond the statutory audit engagement, such as audits of the internal control system. The fee for other services amounts to €1 million and relates to fees which cannot be allocated to the aforementioned categories.
57 exemptions under the HGB and local foreign legislation
For financial year 2014, the following subsidiaries have exercised the simplification options under section 264 (3) of the HGB or sec-tion 264 b of the HGB:• Adcloud GmbH• Agheera GmbH• Albert Scheid GmbH• CSG GmbH• CSG.TS GmbH• Danzas Deutschland Holding GmbH• Danzas Grundstücksverwaltung Groß-Gerau GmbH• Deutsche Post Adress Beteiligungsgesellschaft mbH• Deutsche Post Assekuranz Vermittlungs GmbH• Deutsche Post Beteiligungen Holding GmbH• Deutsche Post Com GmbH• Deutsche Post Consult GmbH• Deutsche Post Customer Service Center GmbH• Deutsche Post DHL Beteiligungen GmbH• Deutsche Post DHL Corporate Real Estate Management GmbH• Deutsche Post DHL Corporate Real Estate Management
GmbH & Co. Logistikzentren KG• Deutsche Post DHL Inhouse Consulting GmbH• Deutsche Post DHL Research and Innovation GmbH• Deutsche Post Direkt GmbH• Deutsche Post E-Post Development GmbH • Deutsche Post E-POST Solutions GmbH • Deutsche Post Fleet GmbH• Deutsche Post Immobilien GmbH• Deutsche Post InHaus Services GmbH• Deutsche Post Investments GmbH
• Deutsche Post IT BRIEF GmbH• Deutsche Post IT Services GmbH• Deutsche Post Mobility GmbH• Deutsche Post Shop Essen GmbH• Deutsche Post Shop Hannover GmbH• Deutsche Post Shop München GmbH• Deutsche Post Signtrust und DMDA GmbH • DHL Airways GmbH• DHL Automotive GmbH• DHL Automotive Offenau GmbH• DHL Delivery GmbH• DHL Express Customer Service GmbH• DHL Express Germany GmbH• DHL Express Network Management GmbH• DHL Fashion Retail Operation GmbH• DHL Foodservices GmbH• DHL Freight Germany Holding GmbH• DHL Freight GmbH• DHL Global Forwarding GmbH• DHL Global Forwarding Management GmbH• DHL Global Management GmbH• DHL Home Delivery GmbH• DHL Hub Leipzig GmbH• DHL International GmbH• DHL Logistics GmbH• DHL Solutions Fashion GmbH• DHL Solutions GmbH• DHL Solutions Großgut GmbH• DHL Solutions Retail GmbH• DHL Sorting Center GmbH• DHL Supply Chain (Leipzig) GmbH • DHL Supply Chain Management GmbH• DHL Supply Chain VAS GmbH • DHL Trade Fairs & Events GmbH• DHL Vertriebs GmbH • DHL Verwaltungs GmbH• Erste End of Runway Development Leipzig GmbH• Erste Logistik Entwicklungsgesellschaft MG GmbH• European Air Transport Leipzig GmbH• FIRST MAIL Düsseldorf GmbH• Gerlach Zolldienste GmbH• interServ Gesellschaft für Personal- und Beraterdienst-
leistungen mbH• nugg.ad AG predictive behavioral targeting• Werbeagentur Janssen GmbH• Williams Lea & TAG GmbH• Zweite Logistik Entwicklungsgesellschaft MG GmbH
Deutsche Post DHL Group — 2014 Annual Report
212
The following companies make use of the audit exemption under section 479 A of the UK Companies Act:• DHL Exel Supply Chain Limited• DHL Freight & Contract Logistics (UK) Limited• Exel Investments Limited• Exel Overseas Limited• Freight Indemnity & Guarantee Company Limited• Joint Retail Logistics Limited• Ocean Group Investments Limited• Ocean Overseas Holdings Limited• Power Europe Development Limited• Power Europe Development No 3 Limited• Power Europe Operating Limited• Tibbett & Britten Applied Limited• Trucks and Child Safety Limited
58 Declaration of Conformity with the German Corporate
Governance Code
The Board of Management and the Supervisory Board of Deutsche Post AG jointly submitted the Declaration of Conformity with the German Corporate Governance Code for financial year 2014 required by section 161 of the AktG. This Declaration of Conformity can be accessed online at www.corporate-governance-code.de and at
www.dpdhl.com/en/investors.html.
59 Significant events after the reporting date
In order to secure the increased demand for labour as a result of continued sustainable growth in the parcel business, Deutsche Post DHL Group has founded numerous regional companies under the umbrella of DHL Delivery GmbH. The goal is to create up to 10,000 new positions by 2020. Staff working in the new companies shall be employed in line with the regionally applicable collective terms and conditions for the forwarding and logistics sector.
The requirements for classifying an asset as held for sale in accordance with IFRS 5 were met in the period between the balance sheet date and the preparation of the consolidated financial statements by the Board of Management, so that the shares held by the Supply Chain division in King’s Cross Central Property Trust, UK, and King’s Cross Central General Partner Ltd., UK, can be reduced as planned.
There were no other significant events after the reporting date.
RESPONSIBILITY STATEMENT
To the best of our knowledge, and in accordance with the applicable reporting principles, the consolidated financial statements give a true and fair view of the assets, liabilities, financial position and profit or loss of the Group, and the management report of the Group includes a fair review of the development and performance of the business and the position of the Group, together with a description of the principal opportunities and risks associated with the expected development of the Group.
Bonn, 20 February 2015
Deutsche Post AGThe Board of Management
Dr Frank Appel
Ken Allen Roger Crook
Jürgen Gerdes John Gilbert
Melanie Kreis Lawrence Rosen
Deutsche Post DHL Group — 2014 Annual Report
213Consolidated Financial Statements — NOTES — Other disclosures — RESPONSIBILITY STATEMENT
INDEPENDENT AUDITOR’S REPORT
To Deutsche Post AG
report on the Consolidated Financial Statements
We have audited the consolidated financial statements of Deutsche Post AG, Bonn, and its subsidiaries, which comprise the income statement and the statement of comprehensive income, the balance sheet, the cash flow statement, the statement of changes in equity, and the notes to the consolidated financial statements, for the busi-ness year from 1 January to 31 December 2014.
BOARD OF MANAGEMENT’S RESPONSIBILITY FOR CONSOLIDATED FINANCIAL STATEMENTS The Board of Management of Deutsche Post AG, Bonn, is respon-sible for the preparation of these consolidated financial statements. This responsibility includes that these consolidated financial state-ments are prepared in accordance with the International Financial Reporting Standards, as adopted by the EU, and the additional requirements of German commercial law pursuant to § (Article) 315 a Abs. (paragraph) 1 HGB (“Handelsgesetzbuch”: German Com-mercial Code) and that these consolidated financial statements give a true and fair view of the net assets, financial position and results of operations of the group in accordance with these require-ments. The Board of Management is also responsible for the inter-nal controls as the Board of Management determines are necessary to enable the preparation of consolidated financial statements that are free from material misstatement, whether due to fraud or error.
AUDITOR’S RESPONSIBILITY Our responsibility is to express an opinion on these consolidated financial statements based on our audit. We conducted our audit in accordance with § 317 HGB and German generally accepted standards for the audit of financial statements promulgated by the Institut der Wirtschaftsprüfer (Institute of Public Auditors in Ger-many) (IDW) and additionally observed the International Stand-ards on Auditing (ISA). Accordingly, we are required to comply with ethical requirements and plan and perform the audit to ob-tain reasonable assurance about whether the consolidated financial statements are free from material misstatement.
An audit involves performing audit procedures to obtain audit evidence about the amounts and disclosures in the consolidated finan cial statements. The selection of audit procedures depends on the auditor’s professional judgment. This includes the assess ment of the risks of material misstatement of the consolidated financial statements, whether due to fraud or error. In assessing those risks, the auditor considers the internal control system relevant to the entity’s preparation of consolidated financial statements that give a true and fair view. The aim of this is to plan and perform audit procedures that are appropriate in the given circumstances, but not for the purpose of expressing an opinion on the effectiveness of the group’s internal control system. An audit also includes evaluating the appropriateness of accounting policies used and the reason-
ableness of accounting estimates made by the Board of Management, as well as evaluating the overall presentation of the consolidated financial statements.
We believe that the audit evidence we have obtained is suffi-cient and appropriate to provide a basis for our audit opinion.
AUDIT OPINION According to § 322 Abs. 3 Satz (sentence) 1 HGB, we state that our audit of the consolidated financial statements has not led to any reservations.
In our opinion based on the findings of our audit, the con-solidated financial statements comply, in all material respects, with IFRS s, as adopted by the EU, and the additional requirements of German commercial law pursuant to § 315 a Abs. 1 HGB and give a true and fair view of the net assets and financial position of the Group as at 31 December 2014 as well as the results of oper-ations for the business year then ended, in accordance with these requirements.
report on the Group Management report
We have audited the group management report of Deutsche Post AG, Bonn, for the business year from 1 January to 31 Decem-ber 2014. The Board of Management of Deutsche Post AG, Bonn, is responsible for the preparation of the group management report in accordance with the requirements of German commercial law applicable pursuant to § 315 a Abs. 1 HGB. We conducted our audit in accordance with § 317 Abs. 2 HGB and German generally accepted standards for the audit of the group management report prom-ulgated by the Institut der Wirtschaftsprüfer (Institute of Public Auditors in Germany) (IDW). Accordingly, we are required to plan and perform the audit of the group management report to obtain reasonable assurance about whether the group management report is consistent with the consolidated financial statements and the audit findings, as a whole provides a suitable view of the Group’s position and suitably presents the opportunities and risks of future development.
According to § 322 Abs. 3 Satz 1 HGB we state, that our audit of the group management report has not led to any reservations.
In our opinion based on the findings of our audit of the consol-idated financial statements and group management report, the group management report is consistent with the consolidated financial statements, as a whole provides a suitable view of the Group’s position and suitably presents the opportunities and risks of future development.
Düsseldorf, 20 February 2015
PricewaterhouseCoopersAktiengesellschaftWirtschaftsprüfungsgesellschaft
Gerd Eggemann Dietmar PrümmWirtschaftsprüfer Wirtschaftsprüfer(German Public Auditor) (German Public Auditor)
Deutsche Post DHL Group — 2014 Annual Report
214
D FU
RTH
ER INFO
RM
ATIO
N
215 — 224
FURTHER INFORMATION
D
217 INDEX
218 GLOSSARY
219 GRAPHS AND TABLES
220 LOCATIONS
222 MULTI-YEAR REVIEW
224 CONTACTS
224 PUBLICATION SERVICE
224 FINANCIAL CALENDAR
DFURTHER INFORMATION
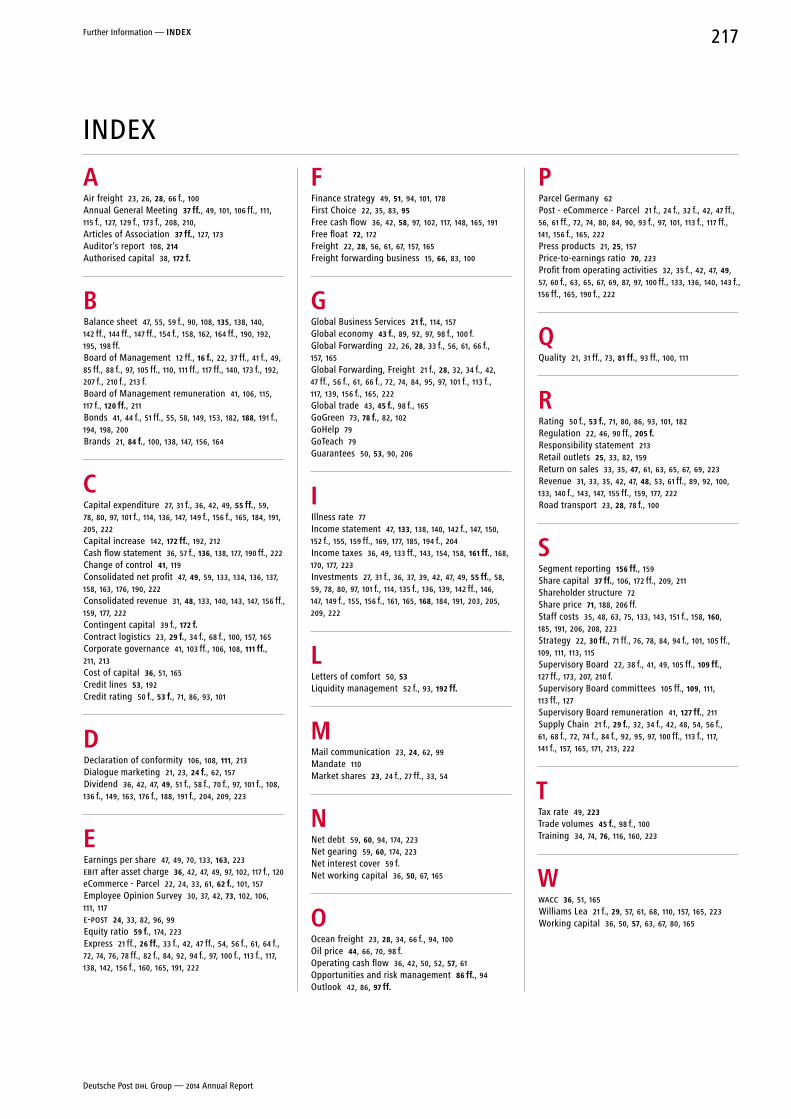
INDEX
aAir freight 23, 26, 28, 66 f., 100Annual General Meeting 37 ff., 49, 101, 106 ff., 111, 115 f., 127, 129 f., 173 f., 208, 210, Articles of Association 37 ff., 127, 173Auditor’s report 108, 214Authorised capital 38, 172 f.
BBalance sheet 47, 55, 59 f., 90, 108, 135, 138, 140, 142 ff., 144 ff., 147 ff., 154 f., 158, 162, 164 ff., 190, 192, 195, 198 ff.Board of Management 12 ff., 16 f., 22, 37 ff., 41 f., 49, 85 ff., 88 f., 97, 105 ff., 110, 111 ff., 117 ff., 140, 173 f., 192, 207 f., 210 f., 213 f.Board of Management remuneration 41, 106, 115, 117 f., 120 ff., 211Bonds 41, 44 f., 51 ff., 55, 58, 149, 153, 182, 188, 191 f., 194, 198, 200Brands 21, 84 f., 100, 138, 147, 156, 164
CCapital expenditure 27, 31 f., 36, 42, 49, 55 ff., 59, 78, 80, 97, 101 f., 114, 136, 147, 149 f., 156 f., 165, 184, 191, 205, 222Capital increase 142, 172 ff., 192, 212Cash flow statement 36, 57 f., 136, 138, 177, 190 ff., 222Change of control 41, 119Consolidated net profit 47, 49, 59, 133, 134, 136, 137, 158, 163, 176, 190, 222Consolidated revenue 31, 48, 133, 140, 143, 147, 156 ff., 159, 177, 222Contingent capital 39 f., 172 f.Contract logistics 23, 29 f., 34 f., 68 f., 100, 157, 165Corporate governance 41, 103 ff., 106, 108, 111 ff., 211, 213Cost of capital 36, 51, 165Credit lines 53, 192Credit rating 50 f., 53 f., 71, 86, 93, 101
DDeclaration of conformity 106, 108, 111, 213Dialogue marketing 21, 23, 24 f., 62, 157Dividend 36, 42, 47, 49, 51 f., 58 f., 70 f., 97, 101 f., 108, 136 f., 149, 163, 176 f., 188, 191 f., 204, 209, 223
eEarnings per share 47, 49, 70, 133, 163, 223EBIT after asset charge 36, 42, 47, 49, 97, 102, 117 f., 120eCommerce - Parcel 22, 24, 33, 61, 62 f., 101, 157Employee Opinion Survey 30, 37, 42, 73, 102, 106, 111, 117E-POST 24, 33, 82, 96, 99Equity ratio 59 f., 174, 223Express 21 ff., 26 ff., 33 f., 42, 47 ff., 54, 56 f., 61, 64 f., 72, 74, 76, 78 ff., 82 f., 84, 92, 94 f., 97, 100 f., 113 f., 117, 138, 142, 156 f., 160, 165, 191, 222
FFinance strategy 49, 51, 94, 101, 178First Choice 22, 35, 83, 95Free cash flow 36, 42, 58, 97, 102, 117, 148, 165, 191Free float 72, 172Freight 22, 28, 56, 61, 67, 157, 165Freight forwarding business 15, 66, 83, 100
GGlobal Business Services 21 f., 114, 157Global economy 43 f., 89, 92, 97, 98 f., 100 f.Global Forwarding 22, 26, 28, 33 f., 56, 61, 66 f., 157, 165Global Forwarding, Freight 21 f., 28, 32, 34 f., 42, 47 ff., 56 f., 61, 66 f., 72, 74, 84, 95, 97, 101 f., 113 f., 117, 139, 156 f., 165, 222Global trade 43, 45 f., 98 f., 165GoGreen 73, 78 f., 82, 102GoHelp 79GoTeach 79Guarantees 50, 53, 90, 206
IIllness rate 77Income statement 47, 133, 138, 140, 142 f., 147, 150, 152 f., 155, 159 ff., 169, 177, 185, 194 f., 204Income taxes 36, 49, 133 ff., 143, 154, 158, 161 ff., 168, 170, 177, 223Investments 27, 31 f., 36, 37, 39, 42, 47, 49, 55 ff., 58, 59, 78, 80, 97, 101 f., 114, 135 f., 136, 139, 142 ff., 146, 147, 149 f., 155, 156 f., 161, 165, 168, 184, 191, 203, 205, 209, 222
LLetters of comfort 50, 53Liquidity management 52 f., 93, 192 ff.
MMail communication 23, 24, 62, 99Mandate 110Market shares 23, 24 f., 27 ff., 33, 54
nNet debt 59, 60, 94, 174, 223Net gearing 59, 60, 174, 223Net interest cover 59 f.Net working capital 36, 50, 67, 165
oOcean freight 23, 28, 34, 66 f., 94, 100Oil price 44, 66, 70, 98 f.Operating cash flow 36, 42, 50, 52, 57, 61Opportunities and risk management 86 ff., 94Outlook 42, 86, 97 ff.
PParcel Germany 62Post - eCommerce - Parcel 21 f., 24 f., 32 f., 42, 47 ff., 56, 61 ff., 72, 74, 80, 84, 90, 93 f., 97, 101, 113 f., 117 ff., 141, 156 f., 165, 222Press products 21, 25, 157Price-to-earnings ratio 70, 223Profit from operating activities 32, 35 f., 42, 47, 49, 57, 60 f., 63, 65, 67, 69, 87, 97, 100 ff., 133, 136, 140, 143 f., 156 ff., 165, 190 f., 222
QQuality 21, 31 ff., 73, 81 ff., 93 ff., 100, 111
rRating 50 f., 53 f., 71, 80, 86, 93, 101, 182Regulation 22, 46, 90 ff., 205 f.Responsibility statement 213Retail outlets 25, 33, 82, 159Return on sales 33, 35, 47, 61, 63, 65, 67, 69, 223Revenue 31, 33, 35, 42, 47, 48, 53, 61 ff., 89, 92, 100, 133, 140 f., 143, 147, 155 ff., 159, 177, 222Road transport 23, 28, 78 f., 100
SSegment reporting 156 ff., 159Share capital 37 ff., 106, 172 ff., 209, 211Shareholder structure 72Share price 71, 188, 206 ff.Staff costs 35, 48, 63, 75, 133, 143, 151 f., 158, 160, 185, 191, 206, 208, 223Strategy 22, 30 ff., 71 ff., 76, 78, 84, 94 f., 101, 105 ff., 109, 111, 113, 115Supervisory Board 22, 38 f., 41, 49, 105 ff., 109 ff., 127 ff., 173, 207, 210 f.Supervisory Board committees 105 ff., 109, 111, 113 ff., 127Supervisory Board remuneration 41, 127 ff., 211Supply Chain 21 f., 29 f., 32, 34 f., 42, 48, 54, 56 f., 61, 68 f., 72, 74 f., 84 f., 92, 95, 97, 100 ff., 113 f., 117, 141 f., 157, 165, 171, 213, 222
TTax rate 49, 223Trade volumes 45 f., 98 f., 100Training 34, 74, 76, 116, 160, 223
WWACC 36, 51, 165Williams Lea 21 f., 29, 57, 61, 68, 110, 157, 165, 223Working capital 36, 50, 57, 63, 67, 80, 165
Deutsche Post DHL Group — 2014 Annual Report
217Further Information — InDex
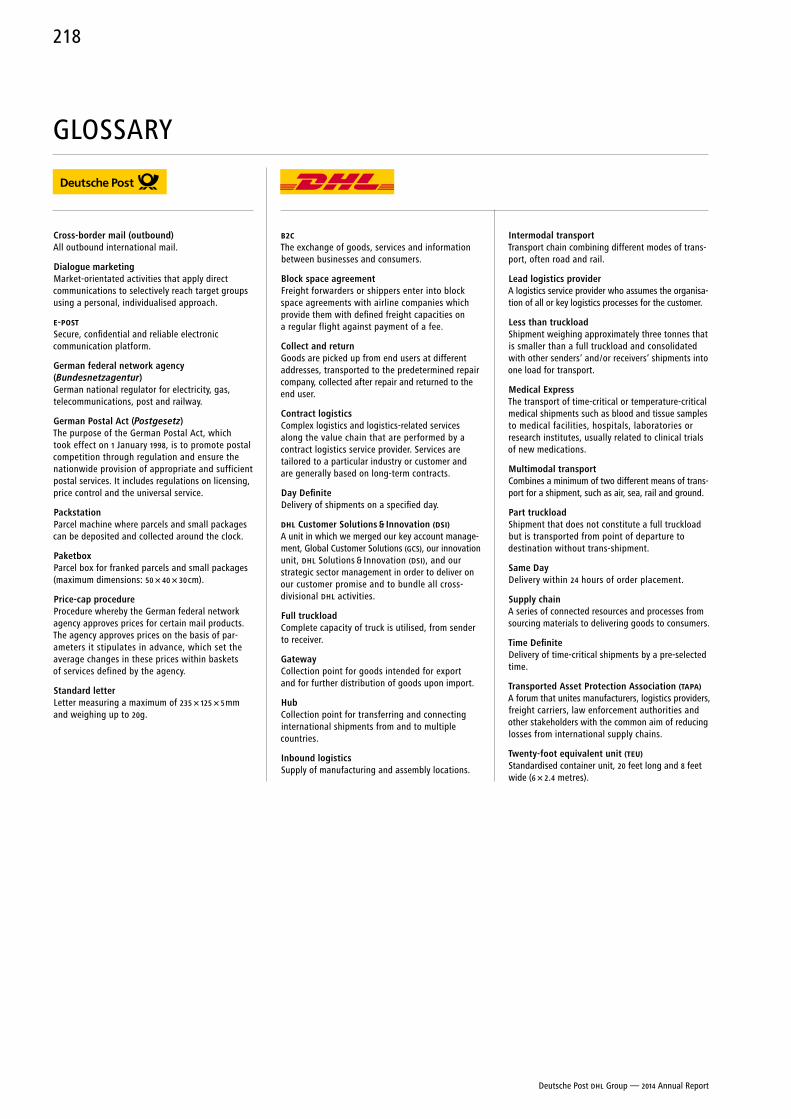
GLOSSARY
Cross-border mail (outbound)All outbound international mail.
Dialogue marketingMarket-orientated activities that apply direct communications to selectively reach target groups using a personal, individualised approach.
E-POSTSecure, confidential and reliable electronic communication platform.
German federal network agency (Bundesnetzagentur)German national regulator for electricity, gas, telecommunications, post and railway.
German Postal act (Postgesetz)The purpose of the German Postal Act, which took effect on 1 January 1998, is to promote postal competition through regulation and ensure the nationwide provision of appropriate and sufficient postal services. It includes regulations on licensing, price control and the universal service.
PackstationParcel machine where parcels and small packages can be deposited and collected around the clock.
PaketboxParcel box for franked parcels and small packages (maximum dimensions: 50 × 40 × 30 cm).
Price-cap procedureProcedure whereby the German federal network agency approves prices for certain mail products. The agency approves prices on the basis of par-ameters it stipulates in advance, which set the average changes in these prices within baskets of services defined by the agency.
Standard letterLetter measuring a maximum of 235 × 125 × 5 mm and weighing up to 20g.
B2CThe exchange of goods, services and information between businesses and consumers.
Block space agreementFreight forwarders or shippers enter into block space agreements with airline companies which provide them with defined freight capacities on a regular flight against payment of a fee.
Collect and returnGoods are picked up from end users at different addresses, transported to the predetermined repair company, collected after repair and returned to the end user.
Contract logisticsComplex logistics and logistics-related services along the value chain that are performed by a contract logistics service provider. Services are tailored to a particular industry or customer and are generally based on long-term contracts.
Day DefiniteDelivery of shipments on a specified day.
DHL Customer Solutions & Innovation (DSI) A unit in which we merged our key account manage -ment, Global Customer Solutions (GCS), our innovation unit, DHL Solutions & Innovation (DSI), and our strategic sector management in order to deliver on our customer promise and to bundle all cross- divisional DHL activities.
Full truckloadComplete capacity of truck is utilised, from sender to receiver.
GatewayCollection point for goods intended for export and for further distribution of goods upon import.
HubCollection point for transferring and connecting international shipments from and to multiple countries.
Inbound logisticsSupply of manufacturing and assembly locations.
Intermodal transportTransport chain combining different modes of trans-port, often road and rail.
Lead logistics providerA logistics service provider who assumes the organisa-tion of all or key logistics processes for the customer.
Less than truckloadShipment weighing approximately three tonnes that is smaller than a full truckload and consolidated with other senders’ and / or receivers’ shipments into one load for transport.
Medical expressThe transport of time-critical or temperature-critical medical shipments such as blood and tissue samples to medical facilities, hospitals, laboratories or research institutes, usually related to clinical trials of new medications.
Multimodal transportCombines a minimum of two different means of trans-port for a shipment, such as air, sea, rail and ground.
Part truckloadShipment that does not constitute a full truckload but is transported from point of departure to destination without trans-shipment.
Same DayDelivery within 24 hours of order placement.
Supply chainA series of connected resources and processes from sourcing materials to delivering goods to consumers.
Time DefiniteDelivery of time-critical shipments by a pre-selected time.
Transported asset Protection association (TAPA)A forum that unites manufacturers, logistics providers, freight carriers, law enforcement authorities and other stakeholders with the common aim of reducing losses from international supply chains.
Twenty-foot equivalent unit (TEU)Standardised container unit, 20 feet long and 8 feet wide (6 × 2.4 metres).
Deutsche Post DHL Group — 2014 Annual Report
218
GRAPHS AND TABLES
01 Selected Key Figures 18
A GROUP MANAGEMENT REPORT
General Information
A.01 Organisational structure of Deutsche Post DHL Group 22
A.02 Market volumes 23
A.03 Domestic mail communication market, business customers, 2014 24
A.04 Domestic dialogue marketing market, 2014 24
A.05 International mail market (outbound), 2014 25
A.06 Domestic parcel market, 2014 25
A.07 European international express market, 2013: top 4 27
A.08 Americas international express market, 2013: top 4 27
A.09 Asia Pacific international express market, 2013: top 4 27
A.10 Air freight market, 2013: top 4 28
A.11 Ocean freight market, 2013: top 4 28
A.12 European road transport market, 2013: top 5 28
A.13 Logistics and value-added services along the entire supply chain 29
A.14 Contract logistics market, 2013: top 10 29
A.15 Strategic priorities by division 32
A.16 EBIT calculation 35
A.17 EAC calculation 36
A.18 Net asset base calculation 36
A.19 Calculation of free cash flow 36
Report on Economic Position
A.20 Forecast /actual comparison 42
A.21 Global economy: growth indicators in 2014 43
A.22 Brent Crude spot price and euro / US dollar exchange rate in 2014 44
A.23 Trade volumes: compound annual growth rate 2013 to 2014 45
A.24 Major trade flows: 2014 volumes 46
A.25 Selected indicators for results of operations 47
A.26 Consolidated revenue 48
A.27 Development of revenue, other operating income and operating expenses 48
A.28 Consolidated EBIT 49
A.29 Total dividend and dividend per no-par value share 49
A.30 EBIT after asset charge (EAC) 49
A.31 Net asset base (non-consolidated) 50
A.32 Selected cash flow indicators 50
A.33 Finance strategy 51
A.34 FFO to debt 52
A.35 Agency ratings 54
A.36 Financial liabilities 55
A.37 Operating lease liabilities by asset class 55
A.38 Capex by region 55
A.39 Capex and depreciation, amortisation and impairment losses, full year 56
A.40 Capex and depreciation, amortisation and impairment losses, Q 4 56
A.41 Capex by segment 56
A.42 Operating cash flow by division, 2014 57
A.43 Calculation of free cash flow 58
A.44 Selected indicators for net assets 59
A.45 Net debt 60
A.46 Key figures by operating division 61
A.47 Post: volumes 62
A.48 Parcel Germany: volumes 63
A.49 EXPRESS: revenue by product 64
A.50 EXPRESS: volumes by product 64
A.51 Global Forwarding: revenue 67
A.52 Global Forwarding: volumes 67
A.53 SUPPLY CHAIN: revenue by sector, 2014 68
A.54 SUPPLY CHAIN: revenue by region, 2014 68
Deutsche Post Shares
A.55 Deutsche Post shares: multi-year review 70
A.56 Peer group comparison: closing prices 71
A.57 Share price performance 71
A.58 Shareholder structure 72
A.59 Shareholder structure by region 72
Non-financial Figures
A.60 Selected results from the Employee Opinion Survey 73
A.61 Number of employees 74
A.62 Employees by region 74
A.63 Staff costs and social security benefits 75
A.64 Group apprenticeship schemes Deutsche Post DHL Group, worldwide 76
A.65 Gender distribution in management, 2014 76
A.66 Work-family balance 76
A.67 Employees with disabilities 77
A.68 Illness rate 77
A.69 Occupational safety 77
A.70 CO2e emissions, 2014 78
A.71 Fuel and energy consumption 79
A.72 Procurement expenses, 2014 80
A.73 Brand architecture 84
A.74 Marketing expenditures, 2014 84
Opportunities and Risks
A.75 Monte Carlo simulation 87
A.76 Opportunity and risk management process 87
Expected Developments
A.77 Global economy: growth forecast 98
B CORPORATE GOVERNANCEB.01 Members of the Supervisory Board 109
B.02 Committees of the Supervisory Board 109
B.03 Mandates held by the Board of Management 110
B.04 Mandates held by the Supervisory Board 110
B.05 Target remuneration for the Board of Management members active as at 31 December 2014 121
B.06 Target remuneration for the Board of Management members who left the company in financial year 2014 123
B.07 Payments made to the Board of Management members active as at 31 December 2014 124
B.08 Payments made to the Board of Management members who left the company in financial year 2014 125
B.09 Share-based component with long-term incentive effect 125
B.10 Individual breakdown of pension commitments under the previous system 126
B.11 Individual breakdown of Board of Management pension commitments under the new system 127
B.12 Remuneration paid to Supervisory Board members for 2014 128
B.13 Remuneration paid to Supervisory Board members for 2013 129
B.14 Variable remuneration paid to Supervisory Board members for 2012 130
C CONSOLIDATED FINANCIAL STATEMENTSC.01 Income Statement 133
C.02 Statement of Comprehensive Income 134
C.03 Balance Sheet 135
C.04 Cash Flow Statement 136
C.05 Statement of Changes in Equity 137
D FURTHER INFORMATIOND.01 Deutsche Post DHL Group
around the world 220
D.02 Key figures 2007 to 2014 222
Deutsche Post DHL Group — 2014 Annual Report
219Further Information — GLOSSARY — GRAPhS AND TAbLES
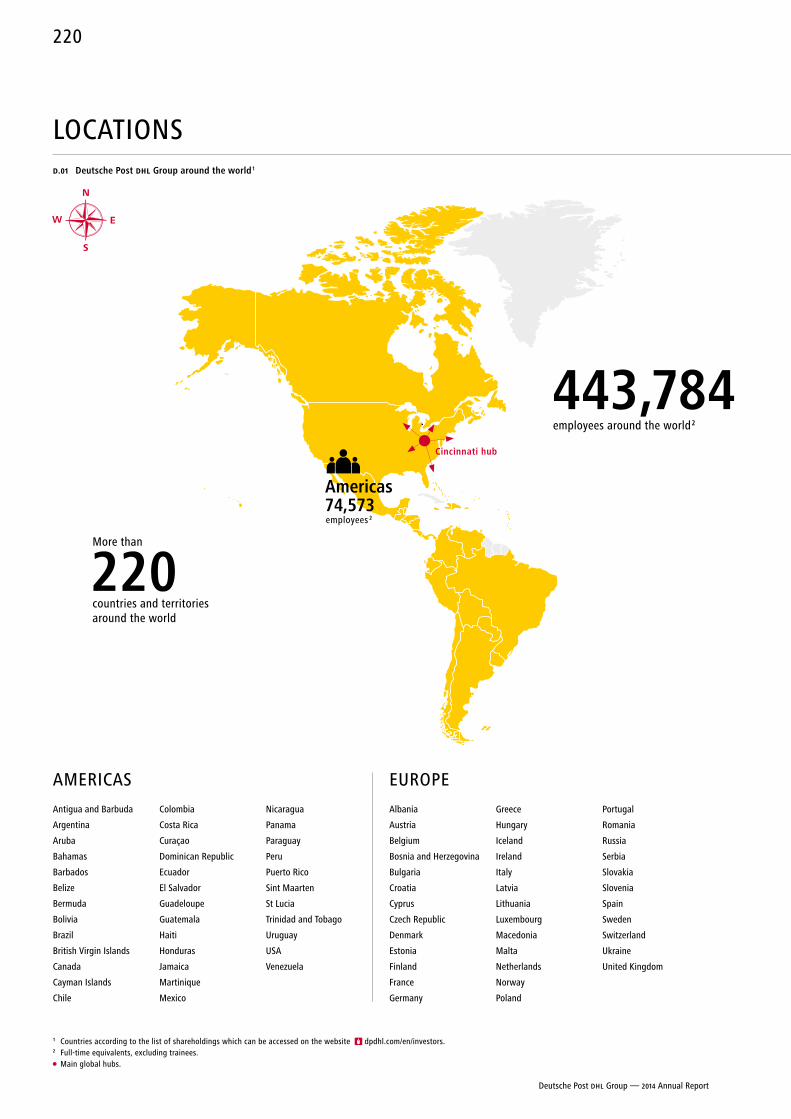
LOCATIONSD.01 Deutsche Post DHL Group around the world 1
1 Countries according to the list of shareholdings which can be accessed on the website dpdhl.com/en/investors.2 Full-time equivalents, excluding trainees. Main global hubs.
AMERICAS EUROPE
Antigua and Barbuda
Argentina
Aruba
Bahamas
Barbados
Belize
Bermuda
Bolivia
Brazil
British Virgin Islands
Canada
Cayman Islands
Chile
Colombia
Costa Rica
Curaçao
Dominican Republic
Ecuador
El Salvador
Guadeloupe
Guatemala
Haiti
Honduras
Jamaica
Martinique
Mexico
Nicaragua
Panama
Paraguay
Peru
Puerto Rico
Sint Maarten
St Lucia
Trinidad and Tobago
Uruguay
USA
Venezuela
Albania
Austria
Belgium
Bosnia and Herzegovina
Bulgaria
Croatia
Cyprus
Czech Republic
Denmark
Estonia
Finland
France
Germany
Greece
Hungary
Iceland
Ireland
Italy
Latvia
Lithuania
Luxembourg
Macedonia
Malta
Netherlands
Norway
Poland
Portugal
Romania
Russia
Serbia
Slovakia
Slovenia
Spain
Sweden
Switzerland
Ukraine
United Kingdom
N
EW
S
443,784 employees around the world 2
Cincinnati hub
americas 74,573 employees 2
More than
220 countries and territories around the world
Deutsche Post DHL Group — 2014 Annual Report
220
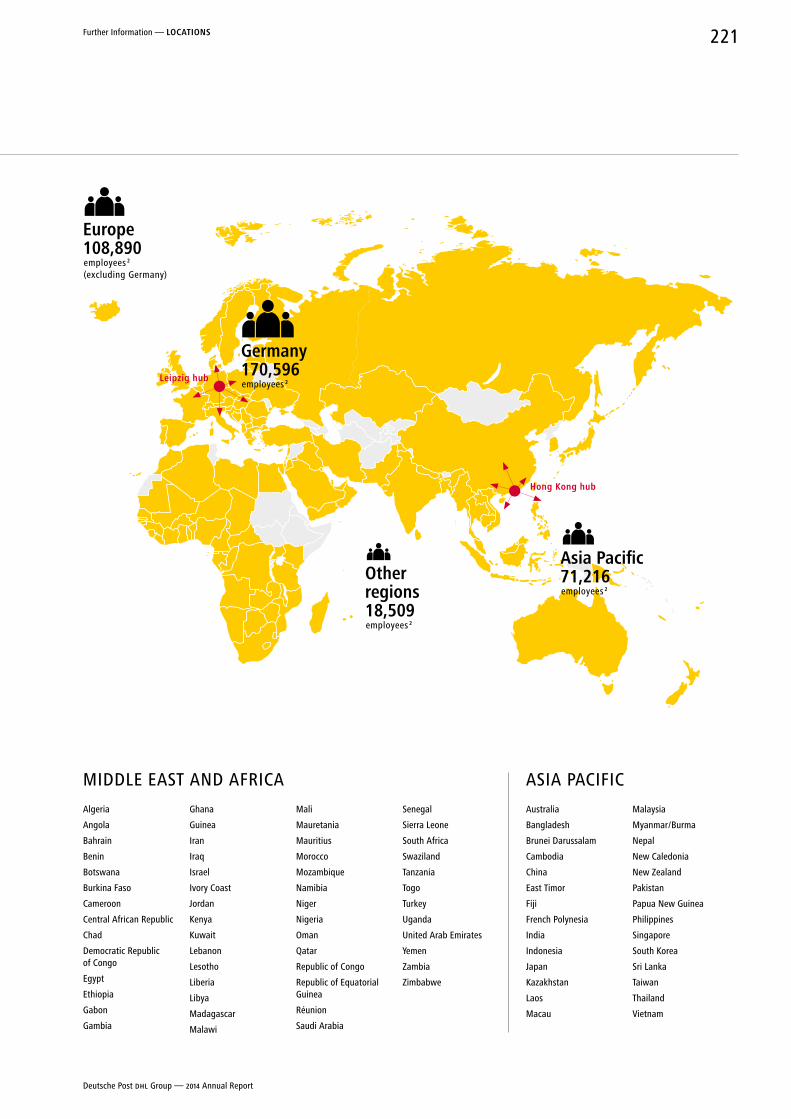
LOCATIONSD.01 Deutsche Post DHL Group around the world 1
MIDDLE EAST AND AFRICA ASIA PACIFIC
Algeria
Angola
Bahrain
Benin
Botswana
Burkina Faso
Cameroon
Central African Republic
Chad
Democratic Republic of Congo
Egypt
Ethiopia
Gabon
Gambia
Ghana
Guinea
Iran
Iraq
Israel
Ivory Coast
Jordan
Kenya
Kuwait
Lebanon
Lesotho
Liberia
Libya
Madagascar
Malawi
Mali
Mauretania
Mauritius
Morocco
Mozambique
Namibia
Niger
Nigeria
Oman
Qatar
Republic of Congo
Republic of Equatorial Guinea
Réunion
Saudi Arabia
Senegal
Sierra Leone
South Africa
Swaziland
Tanzania
Togo
Turkey
Uganda
United Arab Emirates
Yemen
Zambia
Zimbabwe
Australia
Bangladesh
Brunei Darussalam
Cambodia
China
East Timor
Fiji
French Polynesia
India
Indonesia
Japan
Kazakhstan
Laos
Macau
Malaysia
Myanmar / Burma
Nepal
New Caledonia
New Zealand
Pakistan
Papua New Guinea
Philippines
Singapore
South Korea
Sri Lanka
Taiwan
Thailand
Vietnam
Leipzig hub
europe 108,890 employees 2 (excluding Germany)
Germany 170,596 employees 2
other regions 18,509 employees 2
Hong Kong hub
asia Pacific 71,216 employees 2
Deutsche Post DHL Group — 2014 Annual Report
221Further Information — LoCaTIonS
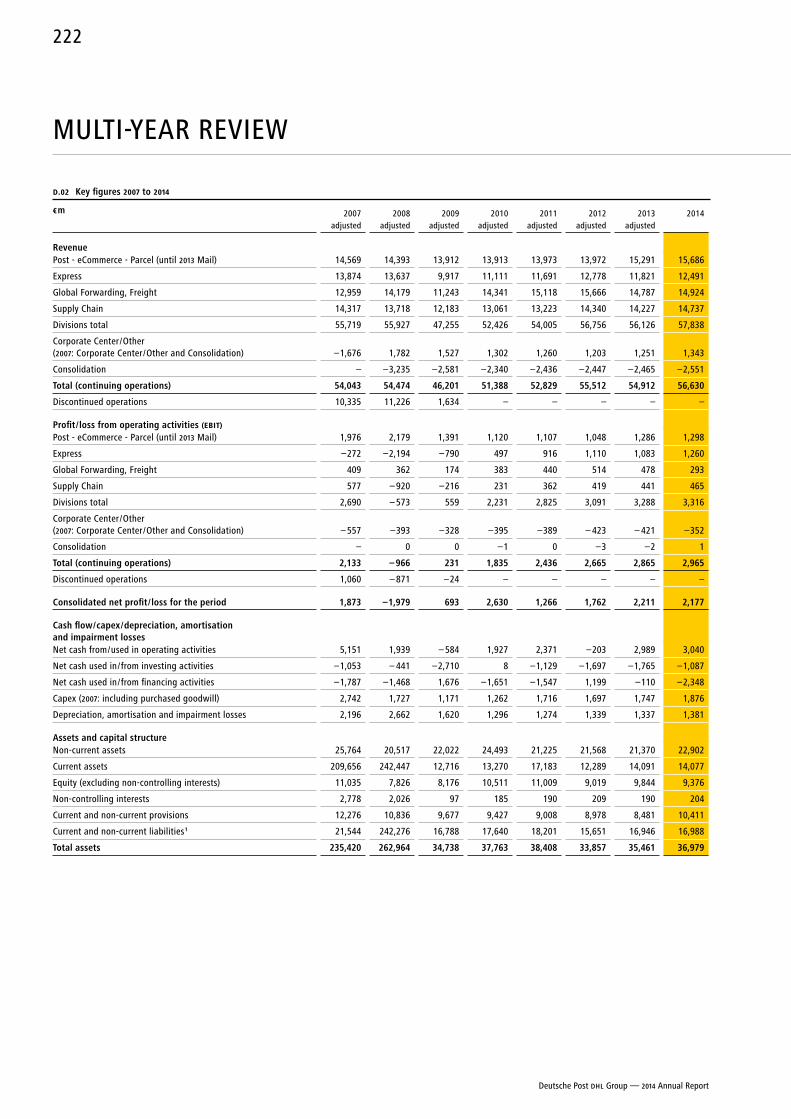
MULTI-YEAR REVIEW
D.02 Key figures 2007 to 2014
€ m 2007 adjusted
2008 adjusted
2009 adjusted
2010 adjusted
2011 adjusted
2012 adjusted
2013 adjusted
2014
revenuePost - eCommerce - Parcel (until 2013 Mail) 14,569 14,393 13,912 13,913 13,973 13,972 15,291 15,686
Express 13,874 13,637 9,917 11,111 11,691 12,778 11,821 12,491
Global Forwarding, Freight 12,959 14,179 11,243 14,341 15,118 15,666 14,787 14,924
Supply Chain 14,317 13,718 12,183 13,061 13,223 14,340 14,227 14,737
Divisions total 55,719 55,927 47,255 52,426 54,005 56,756 56,126 57,838
Corporate Center / Other (2007: Corporate Center / Other and Consolidation) –1,676 1,782 1,527 1,302 1,260 1,203 1,251 1,343
Consolidation – –3,235 –2,581 –2,340 –2,436 –2,447 –2,465 –2,551
Total (continuing operations) 54,043 54,474 46,201 51,388 52,829 55,512 54,912 56,630
Discontinued operations 10,335 11,226 1,634 – – – – –
Profit / loss from operating activities (EBIT)Post - eCommerce - Parcel (until 2013 Mail) 1,976 2,179 1,391 1,120 1,107 1,048 1,286 1,298
Express –272 –2,194 –790 497 916 1,110 1,083 1,260
Global Forwarding, Freight 409 362 174 383 440 514 478 293
Supply Chain 577 – 920 –216 231 362 419 441 465
Divisions total 2,690 – 573 559 2,231 2,825 3,091 3,288 3,316
Corporate Center / Other (2007: Corporate Center / Other and Consolidation) – 557 –393 –328 –395 –389 – 423 – 421 –352
Consolidation – 0 0 –1 0 –3 –2 1
Total (continuing operations) 2,133 – 966 231 1,835 2,436 2,665 2,865 2,965
Discontinued operations 1,060 – 871 –24 – – – – –
Consolidated net profit / loss for the period 1,873 –1,979 693 2,630 1,266 1,762 2,211 2,177
Cash flow / capex / depreciation, amortisation and impairment lossesNet cash from / used in operating activities 5,151 1,939 – 584 1,927 2,371 –203 2,989 3,040
Net cash used in / from investing activities –1,053 – 441 –2,710 8 –1,129 –1,697 –1,765 –1,087
Net cash used in / from financing activities –1,787 –1,468 1,676 –1,651 –1,547 1,199 –110 –2,348
Capex (2007: including purchased goodwill) 2,742 1,727 1,171 1,262 1,716 1,697 1,747 1,876
Depreciation, amortisation and impairment losses 2,196 2,662 1,620 1,296 1,274 1,339 1,337 1,381
assets and capital structureNon-current assets 25,764 20,517 22,022 24,493 21,225 21,568 21,370 22,902
Current assets 209,656 242,447 12,716 13,270 17,183 12,289 14,091 14,077
Equity (excluding non-controlling interests) 11,035 7,826 8,176 10,511 11,009 9,019 9,844 9,376
Non-controlling interests 2,778 2,026 97 185 190 209 190 204
Current and non-current provisions 12,276 10,836 9,677 9,427 9,008 8,978 8,481 10,411
Current and non-current liabilities 1 21,544 242,276 16,788 17,640 18,201 15,651 16,946 16,988
Total assets 235,420 262,964 34,738 37,763 38,408 33,857 35,461 36,979
Deutsche Post DHL Group — 2014 Annual Report
222
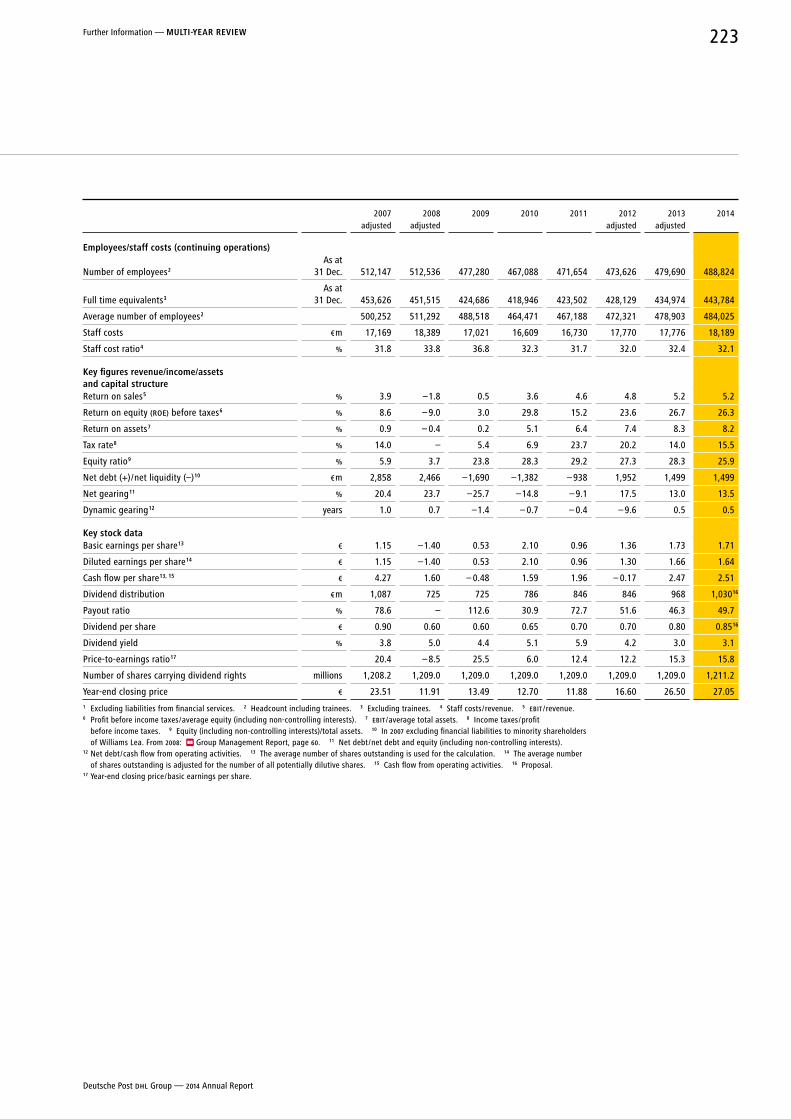
MULTI-YEAR REVIEW
2007
adjusted2008
adjusted2009 2010 2011 2012
adjusted2013
adjusted2014
employees/staff costs (continuing operations)
Number of employees 2
As at 31 Dec. 512,147 512,536 477,280 467,088 471,654 473,626 479,690 488,824
Full time equivalents 3
As at 31 Dec. 453,626 451,515 424,686 418,946 423,502 428,129 434,974 443,784
Average number of employees 2 500,252 511,292 488,518 464,471 467,188 472,321 478,903 484,025
Staff costs € m 17,169 18,389 17,021 16,609 16,730 17,770 17,776 18,189
Staff cost ratio 4 % 31.8 33.8 36.8 32.3 31.7 32.0 32.4 32.1
Key figures revenue/income/assets and capital structureReturn on sales 5 % 3.9 –1.8 0.5 3.6 4.6 4.8 5.2 5.2
Return on equity (ROE) before taxes 6 % 8.6 – 9.0 3.0 29.8 15.2 23.6 26.7 26.3
Return on assets 7 % 0.9 – 0.4 0.2 5.1 6.4 7.4 8.3 8.2
Tax rate 8 % 14.0 – 5.4 6.9 23.7 20.2 14.0 15.5
Equity ratio 9 % 5.9 3.7 23.8 28.3 29.2 27.3 28.3 25.9
Net debt (+) / net liquidity (–) 10 € m 2,858 2,466 –1,690 –1,382 – 938 1,952 1,499 1,499
Net gearing 11 % 20.4 23.7 –25.7 –14.8 – 9.1 17.5 13.0 13.5
Dynamic gearing 12 years 1.0 0.7 –1.4 – 0.7 – 0.4 – 9.6 0.5 0.5
Key stock dataBasic earnings per share 13 € 1.15 –1.40 0.53 2.10 0.96 1.36 1.73 1.71
Diluted earnings per share 14 € 1.15 –1.40 0.53 2.10 0.96 1.30 1.66 1.64
Cash flow per share 13, 15 € 4.27 1.60 – 0.48 1.59 1.96 – 0.17 2.47 2.51
Dividend distribution € m 1,087 725 725 786 846 846 968 1,030 16
Payout ratio % 78.6 – 112.6 30.9 72.7 51.6 46.3 49.7
Dividend per share € 0.90 0.60 0.60 0.65 0.70 0.70 0.80 0.85 16
Dividend yield % 3.8 5.0 4.4 5.1 5.9 4.2 3.0 3.1
Price-to-earnings ratio 17 20.4 – 8.5 25.5 6.0 12.4 12.2 15.3 15.8
Number of shares carrying dividend rights millions 1,208.2 1,209.0 1,209.0 1,209.0 1,209.0 1,209.0 1,209.0 1,211.2
Year-end closing price € 23.51 11.91 13.49 12.70 11.88 16.60 26.50 27.051 Excluding liabilities from financial services. 2 Headcount including trainees. 3 Excluding trainees. 4 Staff costs / revenue. 5 EBIT / revenue. 6 Profit before income taxes / average equity (including non-controlling interests). 7 EBIT / average total assets. 8 Income taxes / profit
before income taxes. 9 Equity (including non-controlling interests)/total assets. 10 In 2007 excluding financial liabilities to minority shareholders of Williams Lea. From 2008: Group Management Report, page 60. 11 Net debt / net debt and equity (including non-controlling interests).
12 Net debt / cash flow from operating activities. 13 The average number of shares outstanding is used for the calculation. 14 The average number of shares outstanding is adjusted for the number of all potentially dilutive shares. 15 Cash flow from operating activities. 16 Proposal.
17 Year-end closing price / basic earnings per share.
Deutsche Post DHL Group — 2014 Annual Report
223Further Information — MuLTI-year reVIeW

CONTACTS PUBLICATION SERVICE
CONTACTSInvestor RelationsTel.: + 49 (0) 228 182-6 36 36Fax: + 49 (0) 228 182-6 31 99E-mail: ir @ dpdhl.com
Press OfficeTel.: + 49 (0) 228 182-99 44Fax: + 49 (0) 228 182-98 80E-mail: pressestelle @ dpdhl.com
Published on 11 March 2015.
The English version of the 2014 Annual Report of Deutsche Post DHL Group constitutes a translation of the original German version. Only the German version is legally binding, insofar as this does not conflict with legal provisions in other countries.Deutsche Post Corporate Language Services et al.
ORDERINGExternalE-mail: ir @ dpdhl.com
dpdhl.com/en/investors
InternalGeT and DHL WebshopMat. no. 675-602-361
ONLINE VERSIONAn online extract and a complete PDF file are available on the internet.
annualreport2014.dpdhl.com
DEUTSCHE POST DHL IR APPWith the Deutsche Post DHL IR app you can receive investor relations and financial media news directly on your iPad.
FINANCIAL CALENDAR
201512 MAY 2015 Interim Report January to March 2015
27 MAY 2015 2015 Annual General Meeting(Frankfurt am Main)
28 MAY 2015Dividend payment
5 AUGUST 2015Interim Report January to June 2015
11 NOVEMBER 2015Interim Report January to September 2015
20169 MARCH 2016 2015 Annual Report
11 MAY 2016Interim Report January to March 2016
18 MAY 20162016 Annual General Meeting(Frankfurt am Main)
19 MAY 2016Dividend payment
3 AUGUST 2016Interim Report January to June 2016
8 NOVEMBER 2016Interim Report January to September 2016
Deutsche Post DHL Group — 2014 Annual Report
224


2014 annual report
2014 Annual Report
Deutsche Post AGHeadquartersInvestor relations53250 BonnGermany
dpdhl.com
WHEN YOU THINK OF LOGISTICS