Embed Size (px)
Citation preview
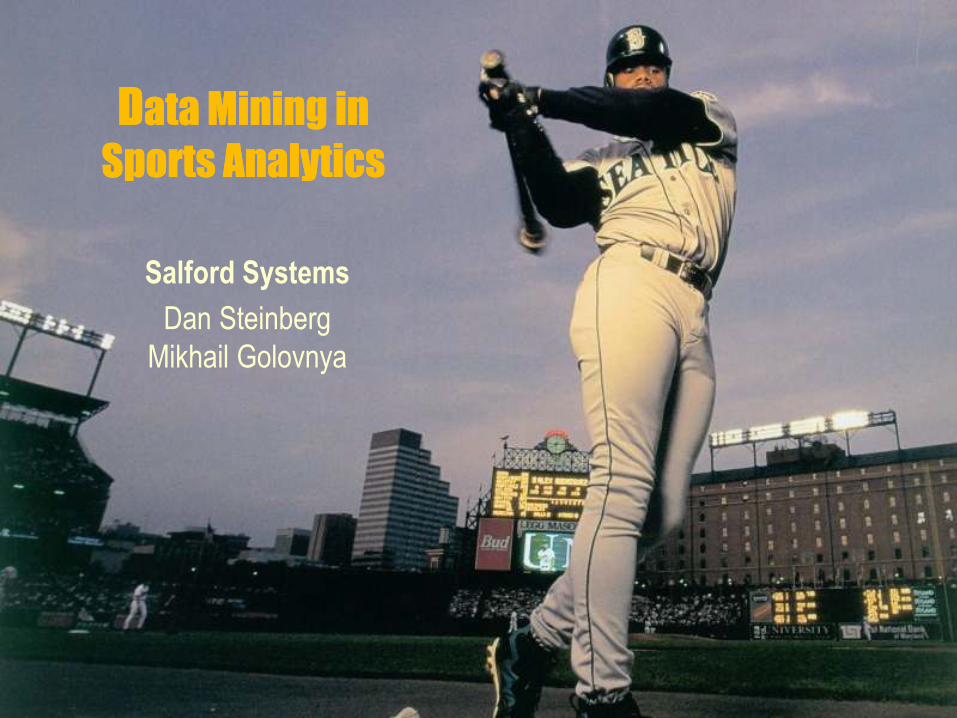
Data Mining in
Sports Analytics
Data Mining in
Sports Analytics
Salford Systems
Dan Steinberg
Mikhail Golovnya

2 © Salford Systems, 2012
Data Mining Defined Data Mining Defined
áData mining is the search for patterns
in data using modern highly automated,
computer intensive methods
Data mining may be best defined as the use of a
specific class of tools (data mining methods) in the
analysis of data
Vjg"vgto"ÐsearchÑ"ku"mg{"vq"vjku"fghkpkvkqp."cu"ku"ÐautomatedÑ
áThe literature often refers to finding hidden
information in data
3 © Salford Systems, 2012
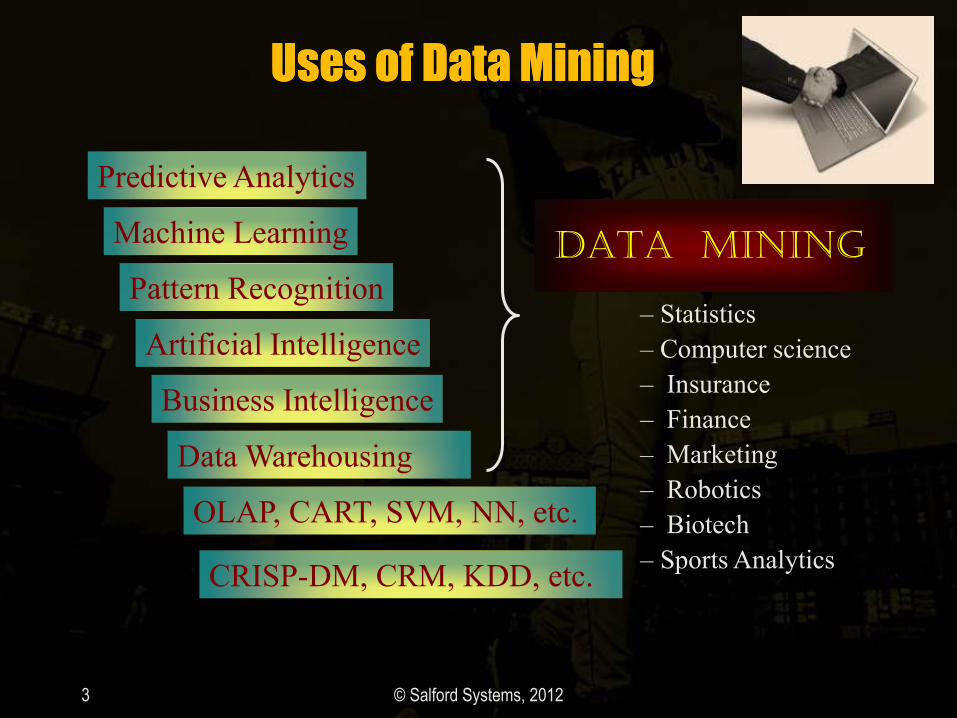
Uses of Data Mining Uses of Data Mining
DATA MINING
ÎÎÎÎÎÎÎÎ
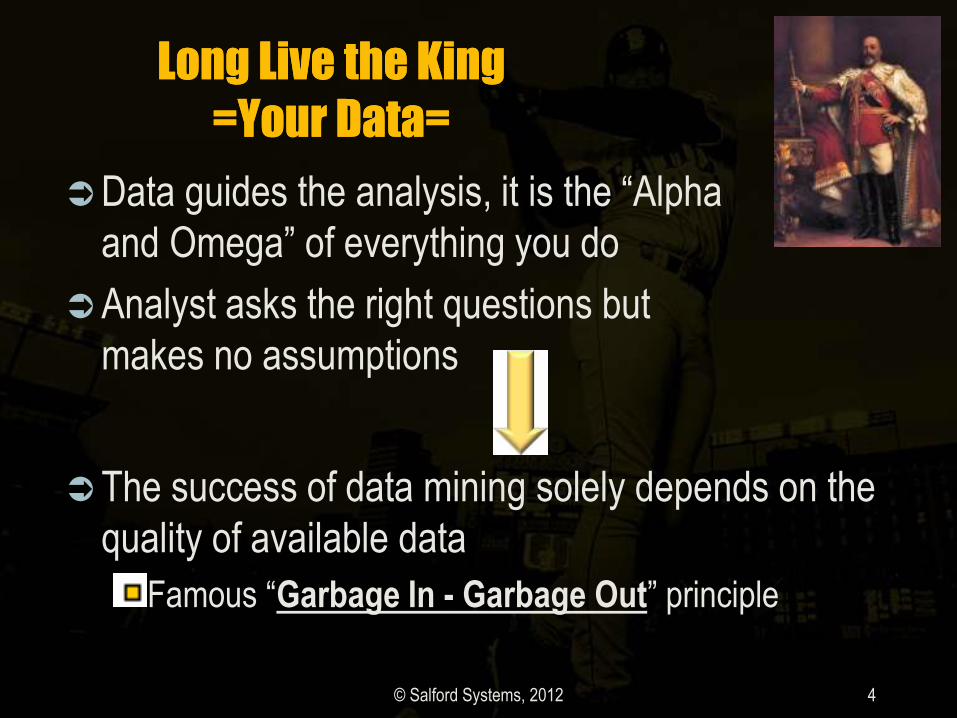
Long Live the King
=Your Data=
Long Live the King
=Your Data=
áFcvc"iwkfgu"vjg"cpcn{uku."kv"ku"vjg"ÐCnrjc"cpf"QogicÑ"qh"gxgt{vjkpi"{qw"fq
áAnalyst asks the right questions but
makes no assumptions
© Salford Systems, 2012 4
áThe success of data mining solely depends on the
quality of available data
Hcoqwu"ÐGarbage In - Garbage OutÑ"rtkpekrng

The Essence of Machine Learning The Essence of Machine Learning
á In a nutshell: Use historical data to gain insights
and/or make predictions on the new data
5 © Salford Systems, 2012

Data in Sports Analytics Data in Sports Analytics
áAny game is the ultimate and
unambiguous source of the quality data
This is very different from the data availability and
quality in other areas of research
áHowever, there is no universal agreement on the
best way of organizing and summarizing the
results in a numeric form
Large number or various game statistics available
Common sense and game rules are at the core
Heated debates on which stats best describe the
potential for a future win © Salford Systems, 2012 6
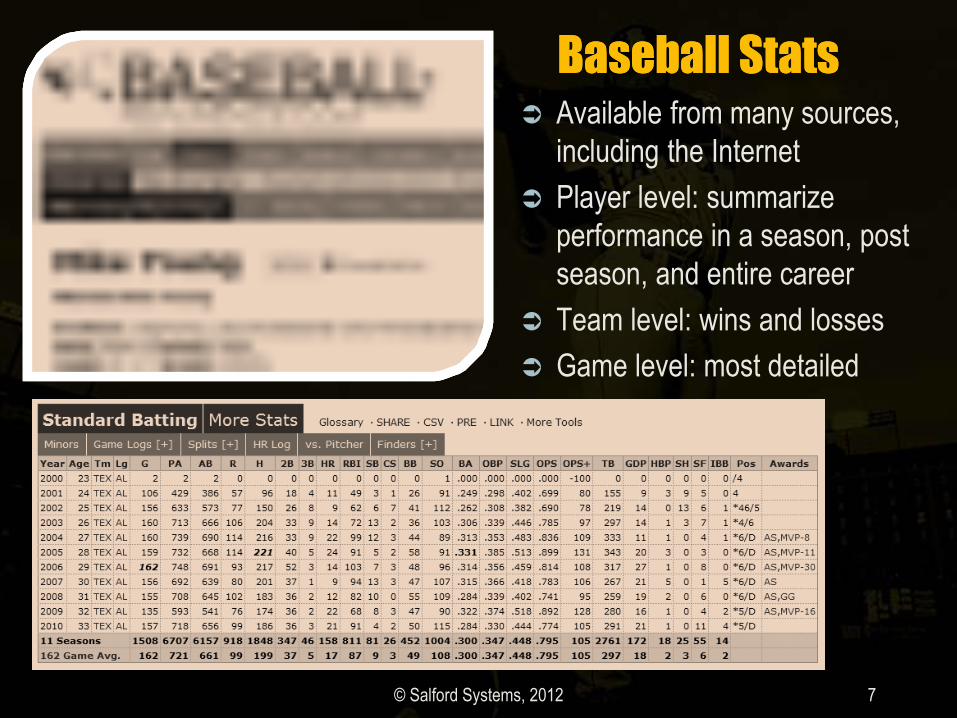
Baseball Stats Baseball Stats á Available from many sources,
including the Internet
á Player level: summarize
performance in a season, post
season, and entire career
á Team level: wins and losses
á Game level: most detailed
© Salford Systems, 2012 7

Baseball Databases Baseball Databases
á Widely
known public
database
á Gathers
baseball
stats all the
way back to
1871
á Will use
parts of it to
illustrate the
potential of
data mining
© Salford Systems, 2012 8
Typical DM Problem Typical DM Problem
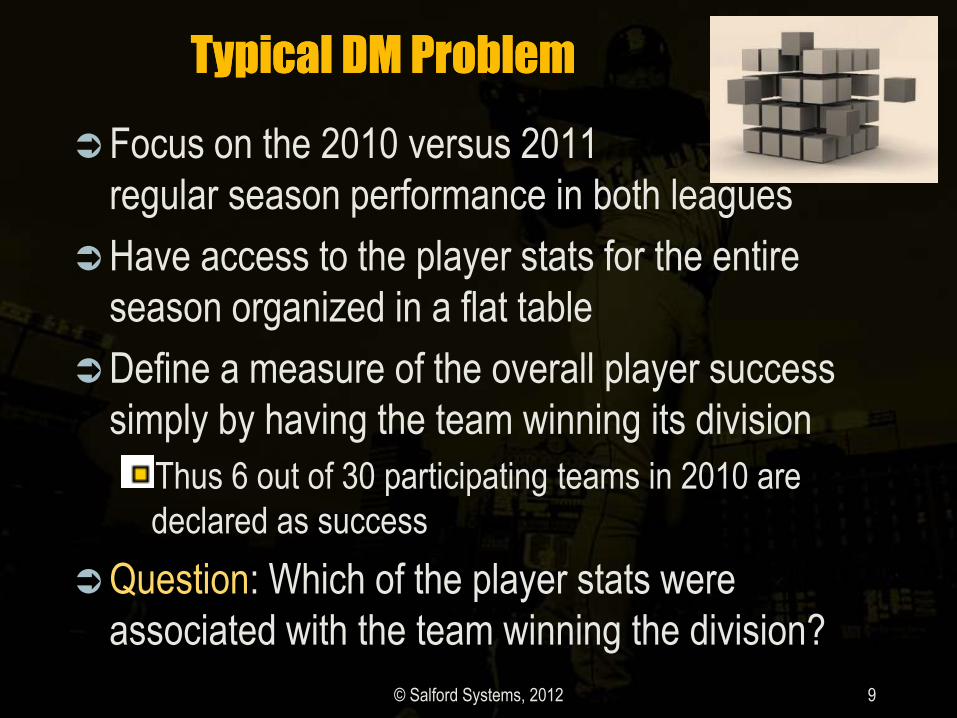
áFocus on the 2010 versus 2011
regular season performance in both leagues
áHave access to the player stats for the entire
season organized in a flat table
áDefine a measure of the overall player success
simply by having the team winning its division
Thus 6 out of 30 participating teams in 2010 are
declared as success
áQuestion: Which of the player stats were
associated with the team winning the division?
© Salford Systems, 2012 9

Batting Stats Batting Stats Name Description
AB At Bats
R Runs
H Hits
2B Doubles
3B Triples
HR Home Runs
RBI Runs Batted In
SB Stolen Bases
CS Caught Stealing
BB Base on Balls
SO Strikeouts
SF Sacrifice Flies
HBP Hit by pitch
© Salford Systems, 2012 10
Core Stats
Name Description
AVG Batting Average
H/AB
TB Total Bases
B1 + 2x2B + 3x3B + 4xHR
SLG Slugging
TB/AB
OBP On Base Percentage
(H+BB+HBP)/(AB+BB+SF+HBP)
OPS On Base Plus Slugging
OBP + SLG
È Many more exist
Derived Stats
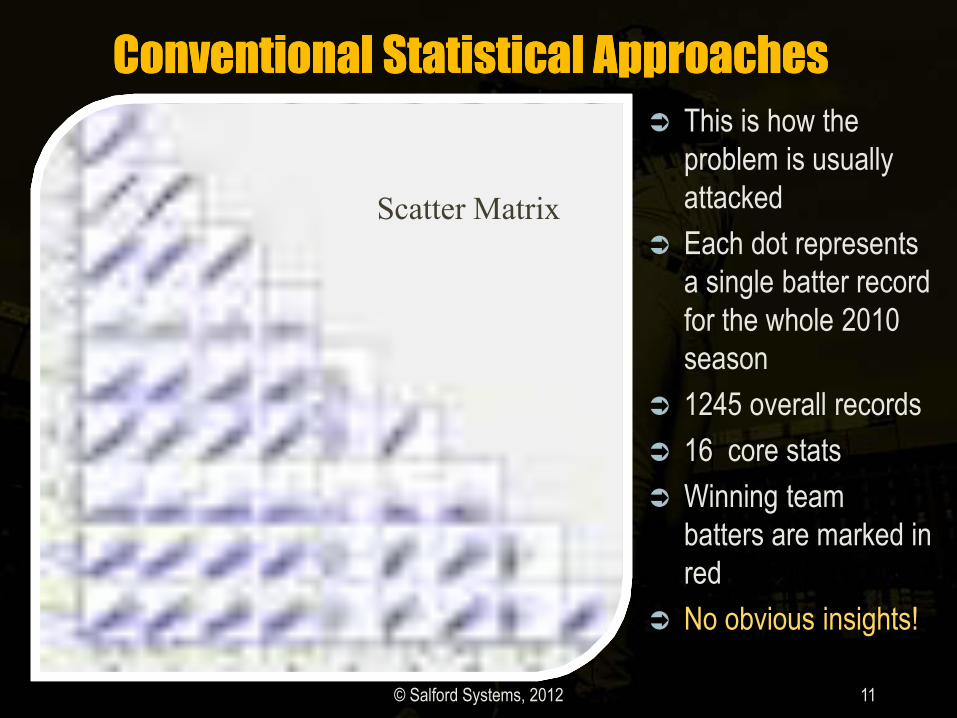
Conventional Statistical Approaches Conventional Statistical Approaches
á This is how the
problem is usually
attacked
á Each dot represents
a single batter record
for the whole 2010
season
á 1245 overall records
á 16 core stats
á Winning team
batters are marked in
red
á No obvious insights!
© Salford Systems, 2012 11

Unique Personalities Ï
vjg"ÑHqwpfkpi"HcvjgtuÒ"qh"Vtggu
Unique Personalities Ï
vjg"ÑHqwpfkpi"HcvjgtuÒ"qh"Vtggu
12 © Salford Systems, 2012
á Starting with CART in 1984,
laid the foundation for tree-
based modeling techniques
á Conduct deep look into all
available data
á Point out most relevant
variables and features
á Automatically identify optimal
transformations
á Capable of extracting complex
patterns going way beyond the
vtcfkvkqpcn"Ðukping"rgthqtocpeg"cv"c"vkogÑ"crrtqcej
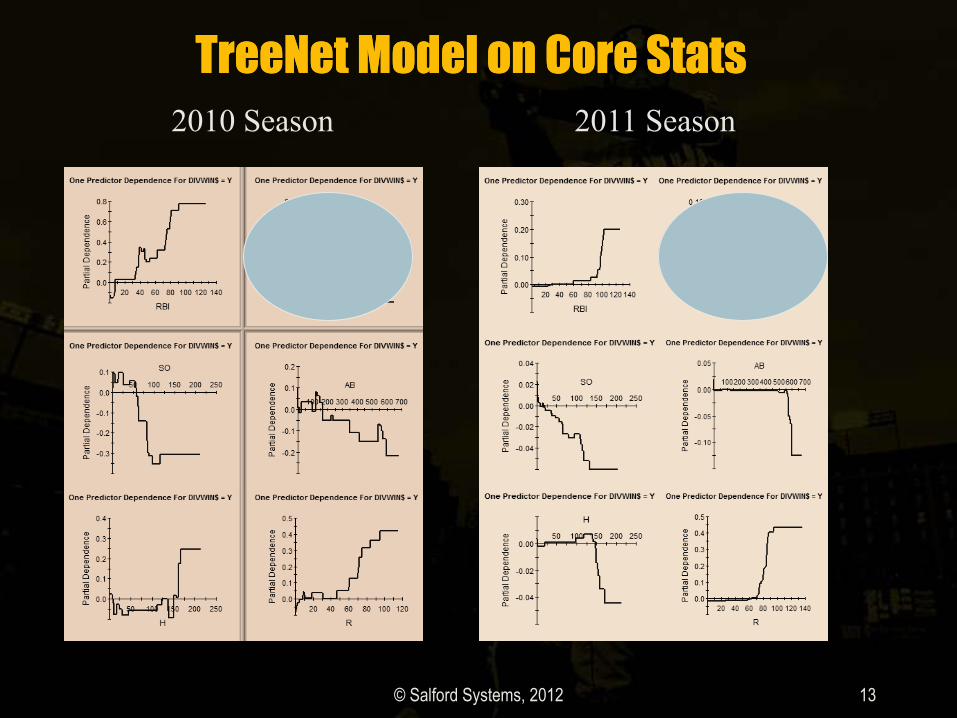
TreeNet Model on Core Stats TreeNet Model on Core Stats
© Salford Systems, 2012 13

Key Findings Key Findings
á 6 core batter stats were identified as most predictive
á 15-20% of total variation can be directly associated with the batter
stats
á The single plots show non-linear nature of many of the relationships
Fine plot irregularities should be ignored
á Striking result: In 2010 season HR above 30 is associated with
loosing the division!
á 2011 season looks fine
á Proceed by digging into pair-wise contribution plots
© Salford Systems, 2012 14
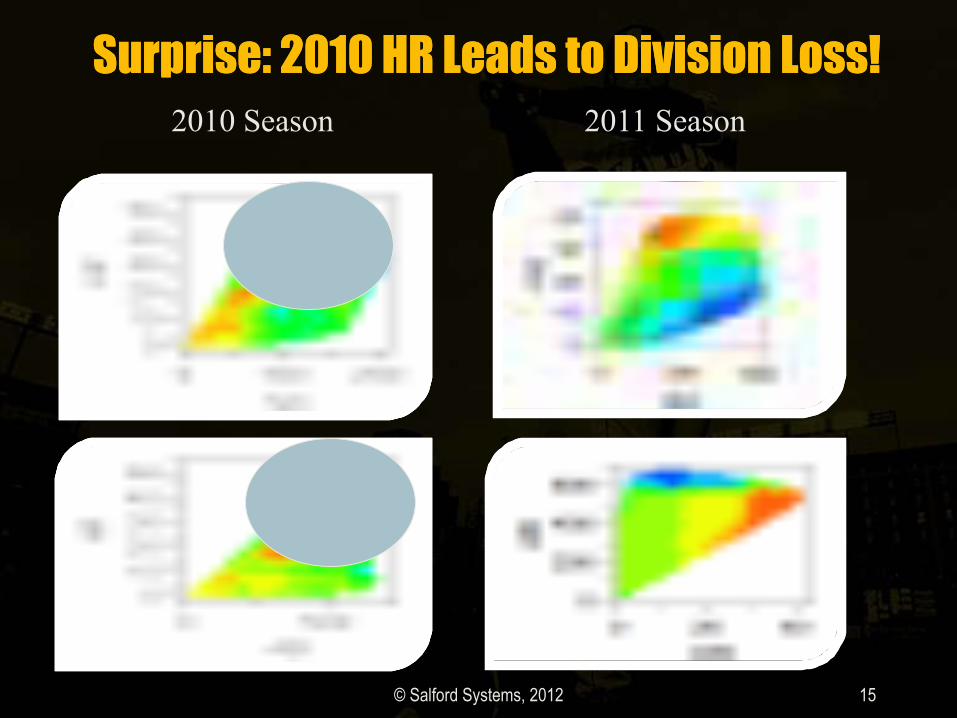
Surprise: 2010 HR Leads to Division Loss! Surprise: 2010 HR Leads to Division Loss!
© Salford Systems, 2012 15

Comments on Batting Comments on Batting
á3D dependency plots further highlight the rather
unusual HR finding for the 2010 season
á It is a well-known fact that batters aiming at a
home run have higher number of strike-outs
This is supported by both graphs
áHowever, in 2010 regular season the HR-centered
approach lead to a defeat!
© Salford Systems, 2012 16

Compare with Conventional Plot Compare with Conventional Plot
á This plot represents
two performance
stats plotted against
gcej"qvjgt"vcmgp"Ðcu"kuÑ"htqo"vjg"qtkikpcn"data table
á Note the difficulty at
discerning the
identified HR x SO
pattern visually
dgecwug"qh"ÐujcfqyÑ"projections
© Salford Systems, 2012 17

Pitching Stats Pitching Stats
á Similar to batting stats
á Large number of derived stats
exists
© Salford Systems, 2012 18
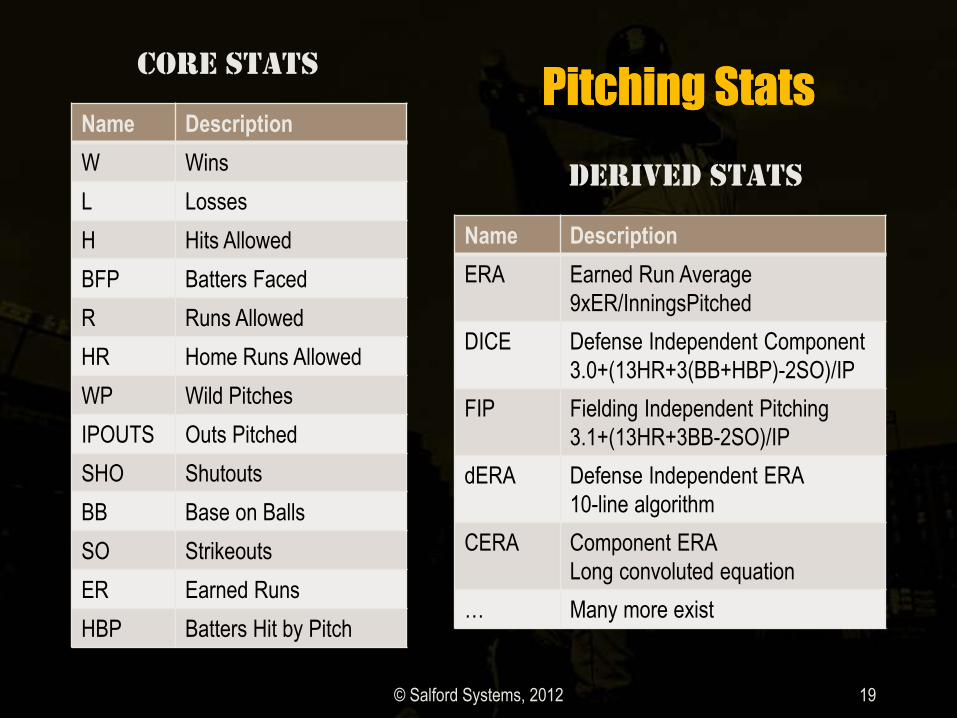
Pitching Stats Pitching Stats Name Description
W Wins
L Losses
H Hits Allowed
BFP Batters Faced
R Runs Allowed
HR Home Runs Allowed
WP Wild Pitches
IPOUTS Outs Pitched
SHO Shutouts
BB Base on Balls
SO Strikeouts
ER Earned Runs
HBP Batters Hit by Pitch
© Salford Systems, 2012 19
Core Stats
Name Description
ERA Earned Run Average
9xER/InningsPitched
DICE Defense Independent Component
3.0+(13HR+3(BB+HBP)-2SO)/IP
FIP Fielding Independent Pitching
3.1+(13HR+3BB-2SO)/IP
dERA Defense Independent ERA
10-line algorithm
CERA Component ERA
Long convoluted equation
È Many more exist
Derived Stats

Modeling Steps Modeling Steps
á Started by feeding a
complete set of
available 26 pitching
stats for 2010 season
performance
á Using top variable
elimination followed by
bottom variable
elimination technique,
reduced the list to only
7 important stats
© Salford Systems, 2012 20

One-Variable Contributions One-Variable Contributions
© Salford Systems, 2012 21
á 2011 season
agrees with what
is normally
expected
á 2010 season
surprises with
higher HR values
working in favor of
pitchers!
á This is further
supported by the
SO dependency

One-Variable Contributions One-Variable Contributions
© Salford Systems, 2012 22
á BB and R stats
agree with
expectations in
both seasons
á 2010 season
surprises with
higher WP values
working in favor of
pitchers!
á This could be
related to previous
findings

Two-Variable Contributions Two-Variable Contributions
© Salford Systems, 2012 23
á 2010 surprise: Keep the strikeouts high and the base on balls low
to win the division!

Two-Variable Contributions Two-Variable Contributions
© Salford Systems, 2012 24
á 2010 surprise: More wild pitches, more home runs allowed, more
strikeouts => the division is won!

Compare with Conventional Plot Compare with Conventional Plot
á Conventional plot for 2010
season IGNORES other
dimensions which effectively
project on top of each other
á As a result, there is a lot of
confusion on the plot making
it difficult to see any pattern
á In contrast, TN dependence
plot shows the given pair
contribution AFTER the
influence of other dimensions
has been eliminated
© Salford Systems, 2012 25
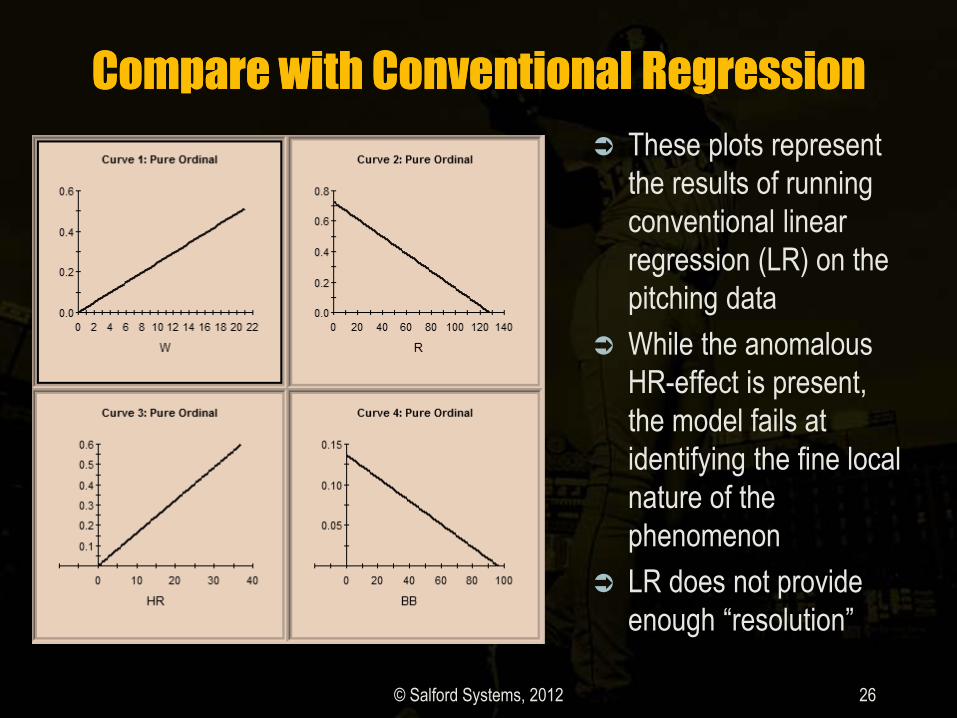
Compare with Conventional Regression Compare with Conventional Regression
á These plots represent
the results of running
conventional linear
regression (LR) on the
pitching data
á While the anomalous
HR-effect is present,
the model fails at
identifying the fine local
nature of the
phenomenon
á LR does not provide
gpqwij"ÐtguqnwvkqpÑ
© Salford Systems, 2012 26

What Have We Learnt What Have We Learnt
á It appears that in the 2010 regular season
Home Run driven strategy did not work!
á At least, this is what the data tells us, further
understanding will require experts in the field
á Core stats have good explaining potential once
put into true multivariate modeling framework
á Conventional statistics approaches do not have
gpqwij"ÐtguqnwvkqpÑ"vq"ugg"vjg"tgcn"fgvcknu
á Modern Data Mining helps identifying realized
patterns and allows quick and efficient check of
the usefulness of various performance measures
available to a manager or researcher © Salford Systems, 2012 27
28 © Salford Systems, 2012
Data Mining Mythology Data Mining Mythology
á NEVER FALL FOR THESE
á Absolute Powers Î data mining will finally
find and explain everything
á Gold Rush Î with the right tool one can rip
the stock-market or predict World-Series
winner to become obscenely rich
á Quest for the Holy Grail Î search for an
algorithm that will always produce 100%
accurate models
á Magic Wand Î getting a complete solution
from start to finish with a single button push

The End The End
© Salford Systems, 2012 29