Embed Size (px)
Citation preview
Comprehensive Annual Financial Report A Component Unit of the State of Ohio
Year Ending December 31, 2010
Daniel K. Weiss, CPA, JD Executive Director/Chief Investment Officer
6161 Busch Boulevard, Suite 119
Columbus, Ohio 43229-2553
Table of Contents
INTRODUCTORY SECTION Page Certificate of Achievement ............................................................................................................................................................ 4 Board of Trustees and Senior Staff ................................................................................................................................................ 5 Organizational Chart...................................................................................................................................................................... 6 Consultants and Investment Managers........................................................................................................................................... 7 Legislative Summary ..................................................................................................................................................................... 8 Letter of Transmittal ...................................................................................................................................................................... 9 FINANCIAL SECTION Independent Auditors’ Report...................................................................................................................................................... 13 Management’s Discussion and Analysis...................................................................................................................................... 15 Basic Financial Statements Combining Statement of Plan Net Assets ............................................................................................................................... 19 Combining Statement of Changes in Plan Net Assets............................................................................................................. 20 Notes to the Financial Statements ........................................................................................................................................... 21 Required Supplementary Schedules Schedule of Employer Contributions - Pension ...................................................................................................................... 36 Schedule of Employer Contributions and Other Contributing Entities - OPEB...................................................................... 36 Schedule of Funding Progress - Pension................................................................................................................................. 36 Schedule of Funding Progress - OPEB ................................................................................................................................... 36 Notes to the Trend Data .......................................................................................................................................................... 37 Notes to Required Supplementary Schedules ......................................................................................................................... 37 Supplementary Information Schedule of Administrative Expenses..................................................................................................................................... 38 Schedule of Investment Expenses........................................................................................................................................... 39 Payments to Consultants ......................................................................................................................................................... 39 Independent Auditors’ Report on Internal Control and Compliance............................................................................................ 40 INVESTMENT SECTION Investment Summary ................................................................................................................................................................... 42 Asset Allocation........................................................................................................................................................................... 42 Ten-Year Investment Comparison ............................................................................................................................................... 42 Report on Investment Activity..................................................................................................................................................... 43 Schedule of Investment Results ................................................................................................................................................... 45 Total Fund and Benchmark Returns ............................................................................................................................................ 45 Investment Portfolio .................................................................................................................................................................... 46 Summary Schedule of Investment Manager Fees ........................................................................................................................ 49 Summary Schedule of Broker Fees.............................................................................................................................................. 50 Investment Objectives, Policies, and Guidelines ......................................................................................................................... 51 ACTUARIAL SECTION Actuary’s Letter ........................................................................................................................................................................... 58 Statement of Actuarial Assumptions and Methods ...................................................................................................................... 60 Short-Term Solvency Test ........................................................................................................................................................... 62 Active Member Valuation Data ................................................................................................................................................... 62 Retiree and Beneficiary Added to and Removed from Rolls ....................................................................................................... 63 Analysis of Financial Experience ................................................................................................................................................ 63 Summary of Plan Provisions........................................................................................................................................................ 64 STATISTICAL SECTION Introduction ................................................................................................................................................................................. 69 Changes in Net Assets, 2001-2010 .............................................................................................................................................. 70 Benefit Deductions from Net Assets by Type, 2001-2010........................................................................................................... 71 Principal Participating Employer, 2010 & 2001 .......................................................................................................................... 71 Retired Members by Type of Benefit, December 31, 2010.......................................................................................................... 72 Average Benefit Payments, 2001-2010........................................................................................................................................ 73 Map................................................................................................................................................................................................... 74

IInnttrroodduuccttoorryy SSeeccttiioonn
Introductory Section
Awards
Highway Patrol Retirement System 4

Introductory Section
Board of Trustees and Senior Staff
Highway Patrol Retirement System 5
Col. John T. Born
Statutory Trustee/Chair
Cpt. Cory D. Davies Employee Trustee/
Vice-Chair
Cpt. Carl Roark
Employee Trustee
S/Lt. Anthony C. Bradshaw
Employee Trustee
Lt. Rudolph L. Zupanc
Employee Trustee
Sgt. Heidi A. Marshall
Employee Trustee
Lt. (ret.) Larry A. Davis
Retiree Trustee
Maj. (ret.) Darryl L. Anderson
Retiree Trustee
Joseph H. Thomas
General Assembly’s Investment Expert
Kenneth C. Boyer
Treasurer of State’s Investment Designee
Keith McCarthy
Assistant Attorney General, Legal Advisor
Keith O’Korn
Assistant Attorney General, Legal Advisor
Daniel K. Weiss, CPA, JD
Executive Director/ Chief Investment Officer
Charles C. Redifer, CPA Chief Financial Officer
Introductory Section
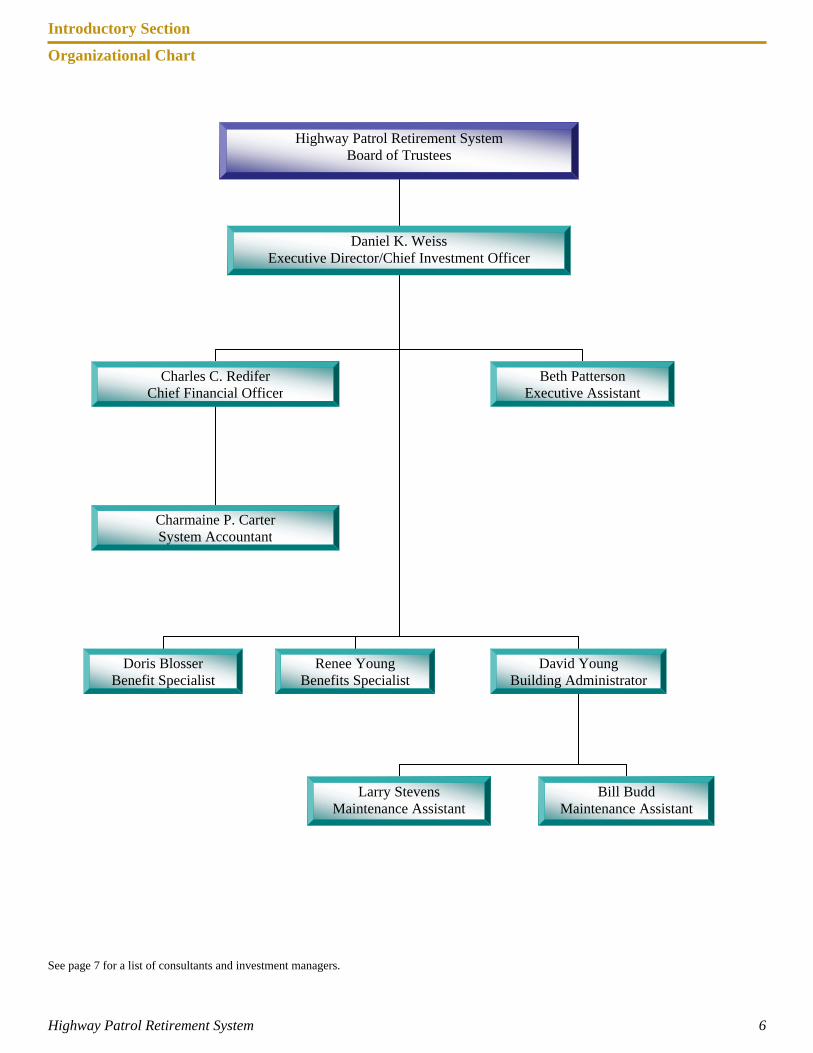
Organizational Chart
Highway Patrol Retirement System 6
See page 7 for a list of consultants and investment managers.
Highway Patrol Retirement System Board of Trustees
Daniel K. Weiss Executive Director/Chief Investment Officer
Charles C. Redifer Chief Financial Officer
Doris Blosser Benefit Specialist
Charmaine P. Carter System Accountant
Renee Young Benefits Specialist
Beth Patterson Executive Assistant
David Young Building Administrator
Larry Stevens Maintenance Assistant
Bill Budd Maintenance Assistant

Introductory Section
Highway Patrol Retirement System 7
Consultants
Medical Advisor Earl N. Metz, M.D.
Columbus, Ohio
Independent Auditor Kennedy, Cottrell, Richards
Columbus, Ohio
Actuary Gabriel, Roeder, Smith &
Company Southfield, Michigan
Investment Consultant Hartland & Co. Cleveland, Ohio
Investment Managers
Ancora Advisors Beachwood, Ohio Micro Cap Equity
Artio Global Investors New York, New York International Equity
Brandywine Global Investment
Management Philadelphia, Pennsylvania
Small/Mid Cap Value Equity
Credit Suisse Alternative Investments New York, New York
Private Equity
DePrince, Race & Zollo Winter Park, Florida
Large Cap Value Equity
Dimensional Fund Advisors Austin, Texas
Small Cap Blend Equity & International Equity
Driehaus Capital Management
Providence, Rhode Island International Small Cap Growth Equity
Evanston Capital Management
Evanston, Illinois Fund of Hedge Funds
Feingold O’Keeffe Capital
Boston, Massachusetts Distressed Debt
Fred Alger Management Jersey City, New Jersey
Small Cap Growth Equity
GAM Fund Management Ltd. New York, New York Fund of Hedge Funds
Henderson Global Investors Hartford, CT Real Estate
James Investment Research
Alpha, Ohio Micro Cap Equity
Johnson Institutional Management
Cincinnati, Ohio Core/Short-Term Fixed Income
J.P.Morgan Asset Management
New York, New York Intermediate-Term Fixed Income
Kayne Anderson Capital Advisors
Los Angeles, California Energy/Mezzanine Private Equity
Western Asset Management
New York, New York High Yield Fixed Income
Loomis, Sayles & Company
Boston, Massachusetts Small/Mid Cap Core Equity
LSV Asset Management
Chicago, Illinois Large Cap Value Equity
Manning & Napier Fund
Dublin, Ohio International Equity
NB Alternative Investment
Management New York, New York Fund of Hedge Funds
Oaktree Capital Management
New York, New York Real Estate Private Equity
Pantheon Ventures
San Francisco, California Private Equity
Protégé Partners New York, New York Fund of Hedge Funds
Pyramis Global Advisors
Springfield, RI Real Estate
Sankaty Advisors
Boston, Massachusetts Distressed Debt
Seix Investment Advisors
Upper Saddle River, New Jersey Distressed Debt
State Street Global Advisors
Boston, Massachusetts Large Cap Blend Indexed
T. Rowe Price
Baltimore, Maryland Large Cap Blend Indexed
Timbervest
Atlanta, Georgia Real Estate
The Vanguard Group
Wayne, PA Money Market
Wellington Management Boston, Massachusetts
Large Cap Growth Equity
Wells Capital Management Los Angeles, California
Intermediate-Term Fixed Income
Westfield Capital Management Boston, Massachusetts
Small/Mid Cap Growth Equity
World Asset Management Birmingham, Michigan
Small Cap Value Indexed, Mid Cap Blend Indexed, & International Equity
See the Investment Section, pages 49-50, for payments to investment managers and brokers.

Introductory Section
Legislative Summary
Highway Patrol Retirement System 8
Since mid-2009, the Highway Patrol Retirement System and the other Ohio public plans have been proposing plan design changes to improve long-term solvency. In 2010, an election year, political uncertainty seemed to derail any significant discussion of potentially controversial pension legislation. The year ticked away with no action by the legislature. The fall elections brought significant change to both the Ohio House and the Senate, along with a new governor. The stage appeared to be set for responsive action to the pending pension solvency plans. Instead, the legislative priority shifted to limiting collective bargaining, which resulted in the passage of Senate Bill 5. With an expected referendum on the November ballot to undo the law, once again, pension legislation is on hold. Investment values have risen dramatically from the market lows, but it is unlikely that long-term solvency can be achieved without some relatively minor plan design changes.
6161 Busch Boulevard • Suite 119 • Columbus, OH 43229-2553 T 614.431.0781 • F 614.431.9204 • www.ohprs.org
June 23, 2011
Letter of Transmittal Members of the Board of Trustees: It is our privilege to submit to you the Comprehensive Annual Financial Report for the Highway Patrol Retirement System (HPRS) for the fiscal year ending December 31, 2010. Responsibility rests with the management of the system for both the accuracy of the data and the completeness and fairness of the presentation. We believe this report reflects a careful stewardship of the system's assets and dedicated service to our members and our retirees. The Ohio General Assembly established the Highway Patrol Retirement System in 1941 with membership limited to uniformed and communications personnel employed by the State Highway Patrol. Previously, SHP personnel were members of the Public Employees Retirement System of Ohio. Today, membership in the Highway Patrol Retirement System is limited to troopers with arrest authority, trooper cadets in training while at the Highway Patrol Training Academy, and members of the radio division who were hired prior to November 2, 1989. Plan benefits include age and service pensions, disability retirement, survivor and death benefits, and health care coverage for benefit recipients and eligible dependents. A more detailed benefits description is provided in the Plan Summary in the Actuarial Section. Major Initiatives and Changes Enacted At the end of 2008, based on the severe downturn of the investment markets, HPRS fell out of compliance with the Ohio Revised Code’s requirement of an amortization period for unfunded pension liabilities of thirty years or less. The HPRS Board responded by developing a comprehensive solvency plan that will require legislative action for implementation. It appears unlikely that any action will be taken in 2011. In 2010, Hewitt EnnisKnupp performed a fiduciary audit of HPRS as required by the Ohio Revised Code. Although the final audit report has not been released, we consider this to be a “clean” audit that emphasizes our commitment to our members and the state of Ohio. Late in 2010, HPRS made significant strides in migrating from an overly complex and outdated accounting and pension system. Work continues in 2011 to simplify our accounting and record keeping procedures. The anticipated results are increased automation in standard procedures and calculations and additional user-friendly features for members and staff. We plan to have these new systems completely implemented by the end of 2011.
6161 Busch Boulevard • Suite 119 • Columbus, OH 43229-2553 T 614.431.0781 • F 614.431.9204 • www.ohprs.org
Investments The HPRS investment policy objective is to provide eligible members with scheduled pension benefits. Accordingly, the funds of the system are invested in order to balance long-term appreciation and risk. Investment returns for the Highway Patrol Retirement System in 2010 were 13.8%. Three-year annualized returns were flat (0.0%) and five-year annualized returns were 4.3%. Because of the continued momentum in the financial markets that started in 2009, the total investment portfolio increased to $755.0 million (including cash) at December 31, 2010, representing an 8.8% increase from the prior year. For a detailed analysis of financial operations, please refer to Management’s Discussion and Analysis on pages 15 through 18. Internal Controls The management of HPRS has implemented and is responsible for a system of internal accounting controls, designed to provide reasonable assurance of the safeguarding of assets and the reliability of financial records. An internal control system can provide only reasonable, not absolute, assurance that the objectives of the control system are met. Designing an internal control system requires acknowledging that there are resource constraints and the benefits of controls must outweigh the costs to implement them. Because of the inherent limitations in all control systems, no evaluation of controls can provide absolute assurance that instances of fraud, if any, have been detected or prevented. Evaluation of the effectiveness of controls in future periods is subject to the risk that the controls may have become inadequate because of changes in the business. The internal accounting controls in place are adequate to meet the purpose for which they were intended and are reviewed annually by an external auditor. The financial statements, supporting schedules, and statistical tables are presented fairly in all material respects. Funding The goal of the Board has been to limit the period of unfunded pension liabilities to no more than thirty years, as required by Ohio law. At December 31, 2009, unfunded actuarially accrued pension liabilities could not be amortized over a finite period. Pension assets, as a percentage of pension liabilities, decreased to 66.0% as compared to 66.7% and 80.9% in 2009 and 2008, respectively. Awards The Government Finance Officers Association of the United States and Canada (GFOA) awarded a Certificate of Achievement for Excellence in Financial Reporting to the Highway Patrol Retirement System for its comprehensive annual financial report for the fiscal year ended December 31, 2009. In order to be awarded a Certificate of Achievement, a government must publish an easily readable and efficiently organized comprehensive annual financial report. This report must satisfy both generally accepted accounting principles and applicable legal requirements. A Certificate of Achievement is valid for a period of one year only. We believe that our current comprehensive annual financial report continues to meet the Certificate of Achievement program’s requirements and we are submitting it to the GFOA to determine its eligibility for another certificate.
6161 Busch Boulevard • Suite 119 • Columbus, OH 43229-2553 T 614.431.0781 • F 614.431.9204 • www.ohprs.org
HPRS received the Making Your Tax Dollars Count award from the Ohio Auditor of State for the year ending December 31, 2009. Fewer than five percent of all Ohio government entities are eligible for this award. To receive this award, entities must submit a comprehensive annual financial report and receive an audit with no findings or issues. Professional Services To aid in efficient and effective management, professional services are provided to the Highway Patrol Retirement System by consultants appointed by the Board. Gabriel, Roeder, Smith & Company of Southfield, Michigan provides actuarial services. The investment advisor to the Board is Hartland & Co. of Cleveland, Ohio. Under contract with the Auditor of the State of Ohio, Kennedy, Cottrell, Richards, Certified Public Accountants of Columbus, Ohio, audited the financial records of the system. Acknowledgments In June 2010, Valerie Nesbitt retired as Benefits Director of HPRS after over thirty years of service. In January 2011, Marty Hudson retired as Trading Analyst with over seventeen years of service. For their long-time diligence on behalf of active members, retirees, and other benefit recipients, we thank Valerie and Marty for their dedicated service. The preparation of this report reflects the combined efforts of the system's staff under the direction of the Board of Trustees. It is intended to provide complete and reliable information as a basis for making management decisions, a means for determining compliance with legal provisions, and a means for determining responsible stewardship over the assets contributed by the members and their employer, the State of Ohio. Upon publication of this report at www.ohprs.org, HPRS will notify interested parties of its availability, including all State Highway Patrol facilities, professional consultants, investment managers, and the Ohio Retirement Study Council. Respectfully Submitted,
Daniel K. Weiss, CPA, JD Charles C. Redifer, CPA Executive Director/Chief Investment Officer Chief Financial Office

FFiinnaanncciiaall SSeeccttiioonn
INDEPENDENT ACCOUNTANTS’ REPORT Ohio State Highway Patrol Retirement System 6161 Busch Boulevard, Suite 119 Columbus, Ohio 43229-2553
To the Board of Trustees:
We have audited the accompanying basic financial statements of the Ohio State Highway Patrol Retirement System (HPRS), a component unit of the State of Ohio, as of and for the year ended December 31, 2010, as listed in the table of contents. These financial statements are the responsibility of the HPRS’ management. Our responsibility is to express an opinion on these financial statements based on our audit.
We conducted our audit in accordance with auditing standards generally accepted in the United States of America and the standards applicable to financial audits contained in the Comptroller General of the United States’ Government Auditing Standards. Those standards require that we plan and perform the audit to reasonably assure whether the financial statements are free of material misstatement. An audit includes examining, on a test basis, evidence supporting the amounts and disclosures in the financial statements. An audit also includes assessing the accounting principles used and significant estimates made by management, as well as evaluating the overall financial statement presentation. We believe our audit provides a reasonable basis for our opinion.
In our opinion, the financial statements referred to above present fairly, in all material respects, the plan net assets of Ohio State Highway Patrol Retirement System, as of December 31, 2010, and the changes in plan net assets for the year then ended in conformity with accounting principles generally accepted in the United States of America.
In accordance with Government Auditing Standards, we have also issued our report dated June 17, 2011, on our consideration of the HPRS’ internal control over financial reporting and our tests of its compliance with certain provisions of laws, regulations, contracts and grant agreements and other matters. While we did not opine on the internal control over financial reporting or on compliance, that report describes the scope of our testing of internal control over financial reporting and compliance and the results of that testing. That report is an integral part of an audit performed in accordance with Government Auditing Standards. You should read it in conjunction with this report in assessing the results of our audit.
Accounting principles generally accepted in the United States of America require this presentation to include the Management’s discussion and analysis and Required Supplementary Schedules, as listed in the table of contents, to supplement the basic financial statements. Although this information is not part of the basic financial statements, the Governmental Accounting Standards Board considers it essential for placing the basic financial statements in an appropriate operational, economic, or historical context. We have applied certain limited procedures to the required supplementary information in accordance with auditing standards generally accepted in the United States of America, which consisted of inquiries of management about the methods of preparing the information and comparing the information for consistency with management’s responses to our inquiries, the basic financial statements, and other knowledge we obtained during our audit of the basic financial statements. We do not express an opinion or provide any assurance on the information because the limited procedures do not provide us with sufficient evidence to express an opinion or provide any other assurance.
Ohio State Highway Patrol Retirement System Independent Accountants’ Report Page 2
We conducted our audit to opine on the financial statements that collectively comprise the HPRS’ basic financial statements taken as a whole. The introductory section, supplementary information, investment section, and actuarial section, as listed in the table of contents, provide additional analysis and are not a required part of the basic financial statements. The supplementary information is management’s responsibility, and was derived from and relates directly to the underlying accounting and other records used to prepare the basic financial statements. These schedules were subject to the auditing procedures we applied to the basic financial statements. We also applied certain additional procedures, including comparing and reconciling this information directly to the underlying accounting and other records used to prepare the basic financial statements or to the basic financial statements themselves, in accordance with auditing standards generally accepted in the United States of America. In our opinion, this information is fairly stated in all material respects in relation to the basic financial statements taken as a whole. We did not subject the introductory section, investment section, and actuarial section to the auditing procedures applied in the audit of the basic financial statements and, accordingly, we express no opinion or any other assurance on them.
Kennedy Cottrell Richards LLC June 17, 2011
Financial Section
Management’s Discussion and Analysis
Highway Patrol Retirement System 15
Financial Highlights At December 31, 2010, the assets of HPRS exceeded liabilities by $734,282,707. All of the
net assets are held in trust for pension and health care benefits and are available to meet HPRS’s ongoing obligations to plan participants and their beneficiaries.
During 2010, HPRS’s total net assets increased by $58,609,505, or 8.7%, with 153.4% of this increase attributable to investment activity.
HPRS’s funding objective is to meet long-term benefit obligations through contributions and investment income. At December 31, 2009, the date of the most recent actuarial valuation, HPRS assets equaled 66.0% of the present value of pension obligations.
Revenues (additions to plan net assets) for the year were $124,343,637, which includes member and employer contributions of $32,735,731 and investment income of $89,895,586.
Expenses (deductions from plan net assets) increased 5.9% over the prior year. Of this amount, pension benefits increased by 5.2%, health care expenses increased by 16.8%, and administrative expenses decreased by 15.6%.
Overview of the Financial Statements The financial statements consist of the following components:
1. Combining Statement of Plan Net Assets 2. Combining Statement of Changes in Plan Net Assets 3. Notes to the Financial Statements
This report also contains other supplementary information in addition to the basic financial statements themselves. The Combining Statement of Plan Net Assets provides a snapshot of account balances at year-end, indicating the assets available for future payments to benefit recipients, less any current liabilities of the system. The Combining Statement of Changes in Plan Net Assets provides a summary of current year additions and deductions to the plan. At December 31, 2009, the date of the latest actuarial valuation, the current funding ratio was 66.0%. This means that HPRS had approximately $0.66 available for each $1.00 of projected pension liabilities. The Combining Statement of Plan Net Assets and the Combining Statement of Changes in Plan Net Assets report information about HPRS’s activities and financial position. These statements reflect the full accrual basis of accounting, which is similar to the accounting method used by most private sector companies. All of the current year’s revenues and expenses are taken into account regardless of when cash is received or paid. All investment gains and losses are shown at trade date rather than settlement date. Investments are shown at fair value, reflecting both realized and unrealized gains and losses. Each capital asset is depreciated over its expected useful life.
Financial Section
Management’s Discussion and Analysis
Highway Patrol Retirement System 16
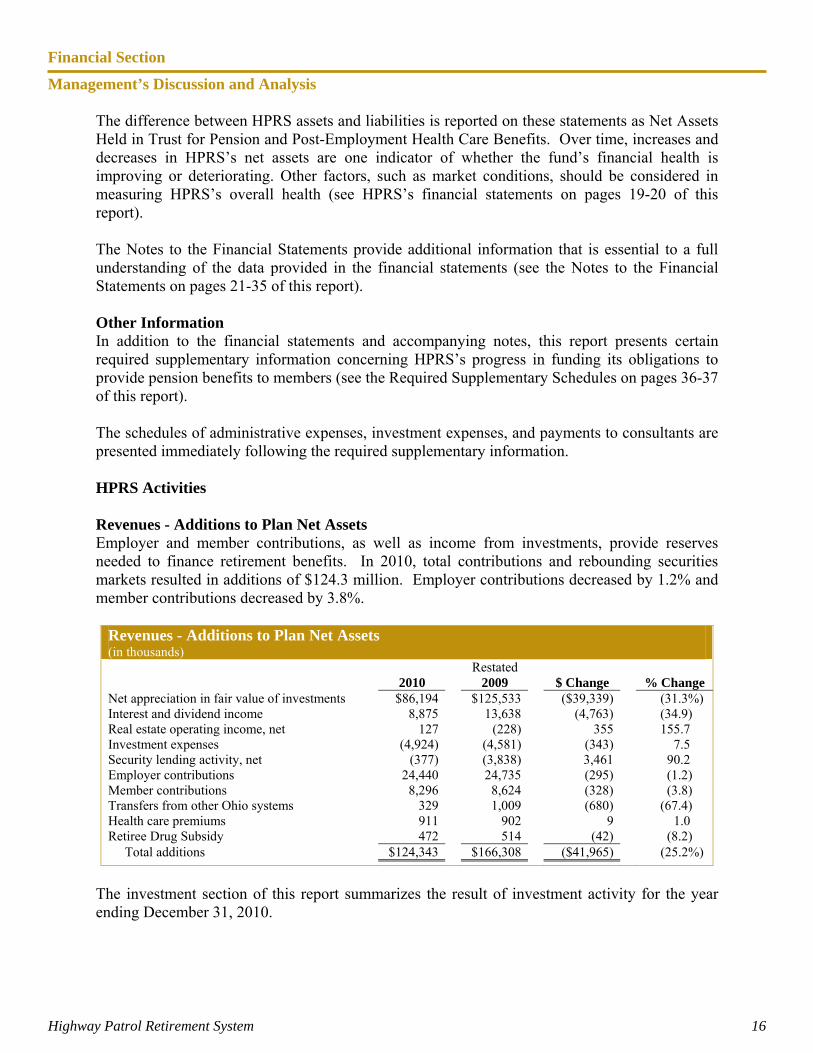
The difference between HPRS assets and liabilities is reported on these statements as Net Assets Held in Trust for Pension and Post-Employment Health Care Benefits. Over time, increases and decreases in HPRS’s net assets are one indicator of whether the fund’s financial health is improving or deteriorating. Other factors, such as market conditions, should be considered in measuring HPRS’s overall health (see HPRS’s financial statements on pages 19-20 of this report). The Notes to the Financial Statements provide additional information that is essential to a full understanding of the data provided in the financial statements (see the Notes to the Financial Statements on pages 21-35 of this report). Other Information In addition to the financial statements and accompanying notes, this report presents certain required supplementary information concerning HPRS’s progress in funding its obligations to provide pension benefits to members (see the Required Supplementary Schedules on pages 36-37 of this report). The schedules of administrative expenses, investment expenses, and payments to consultants are presented immediately following the required supplementary information. HPRS Activities Revenues - Additions to Plan Net Assets Employer and member contributions, as well as income from investments, provide reserves needed to finance retirement benefits. In 2010, total contributions and rebounding securities markets resulted in additions of $124.3 million. Employer contributions decreased by 1.2% and member contributions decreased by 3.8%.
Revenues - Additions to Plan Net Assets (in thousands)
Restated 2010 2009 $ Change % Change
Net appreciation in fair value of investments $86,194 $125,533 ($39,339) (31.3%) Interest and dividend income 8,875 13,638 (4,763) (34.9) Real estate operating income, net 127 (228) 355 155.7 Investment expenses (4,924) (4,581) (343) 7.5 Security lending activity, net (377) (3,838) 3,461 90.2 Employer contributions 24,440 24,735 (295) (1.2) Member contributions 8,296 8,624 (328) (3.8) Transfers from other Ohio systems 329 1,009 (680) (67.4) Health care premiums 911 902 9 1.0 Retiree Drug Subsidy 472 514 (42) (8.2) Total additions $124,343 $166,308 ($41,965) (25.2%)
The investment section of this report summarizes the result of investment activity for the year ending December 31, 2010.
Financial Section
Management’s Discussion and Analysis
Highway Patrol Retirement System 17
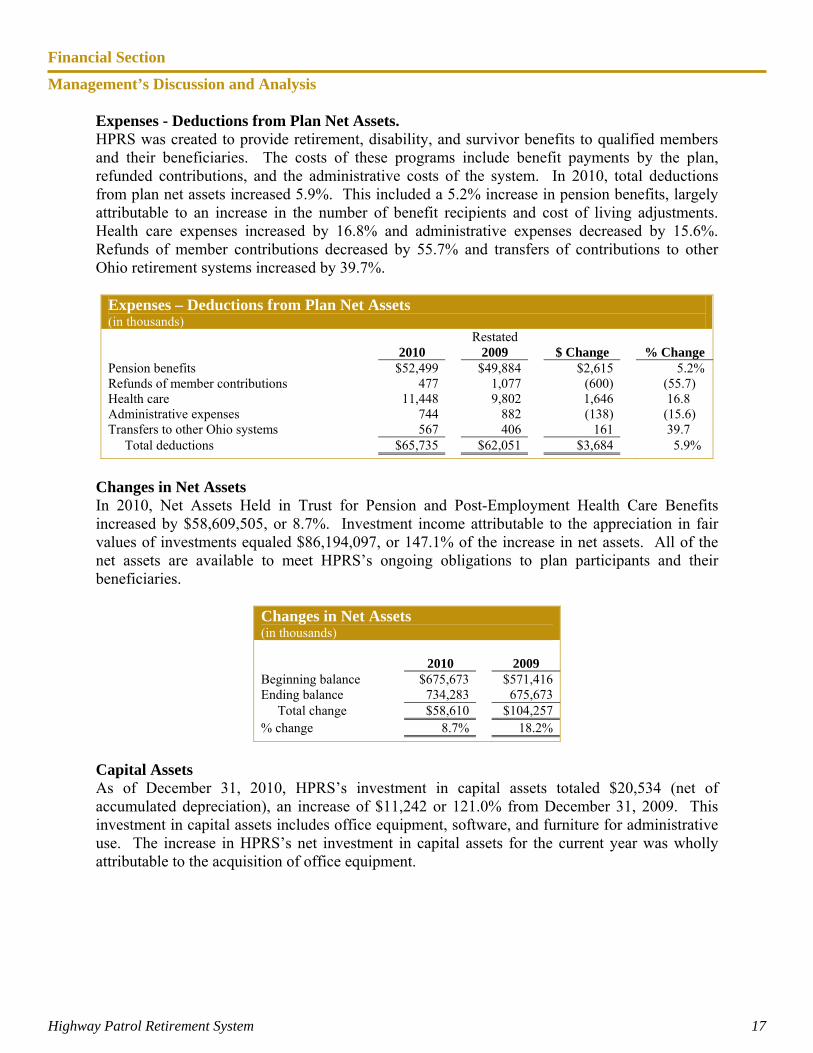
Expenses - Deductions from Plan Net Assets. HPRS was created to provide retirement, disability, and survivor benefits to qualified members and their beneficiaries. The costs of these programs include benefit payments by the plan, refunded contributions, and the administrative costs of the system. In 2010, total deductions from plan net assets increased 5.9%. This included a 5.2% increase in pension benefits, largely attributable to an increase in the number of benefit recipients and cost of living adjustments. Health care expenses increased by 16.8% and administrative expenses decreased by 15.6%. Refunds of member contributions decreased by 55.7% and transfers of contributions to other Ohio retirement systems increased by 39.7%.
Expenses – Deductions from Plan Net Assets (in thousands)
Restated 2010 2009 $ Change % Change
Pension benefits $52,499 $49,884 $2,615 5.2% Refunds of member contributions 477 1,077 (600) (55.7) Health care 11,448 9,802 1,646 16.8 Administrative expenses 744 882 (138) (15.6) Transfers to other Ohio systems 567 406 161 39.7 Total deductions $65,735 $62,051 $3,684 5.9%
Changes in Net Assets In 2010, Net Assets Held in Trust for Pension and Post-Employment Health Care Benefits increased by $58,609,505, or 8.7%. Investment income attributable to the appreciation in fair values of investments equaled $86,194,097, or 147.1% of the increase in net assets. All of the net assets are available to meet HPRS’s ongoing obligations to plan participants and their beneficiaries.
Changes in Net Assets (in thousands)
2010 2009
Beginning balance $675,673 $571,416 Ending balance 734,283 675,673 Total change $58,610 $104,257 % change 8.7% 18.2%
Capital Assets As of December 31, 2010, HPRS’s investment in capital assets totaled $20,534 (net of accumulated depreciation), an increase of $11,242 or 121.0% from December 31, 2009. This investment in capital assets includes office equipment, software, and furniture for administrative use. The increase in HPRS’s net investment in capital assets for the current year was wholly attributable to the acquisition of office equipment.
Financial Section
Management’s Discussion and Analysis
Highway Patrol Retirement System 18
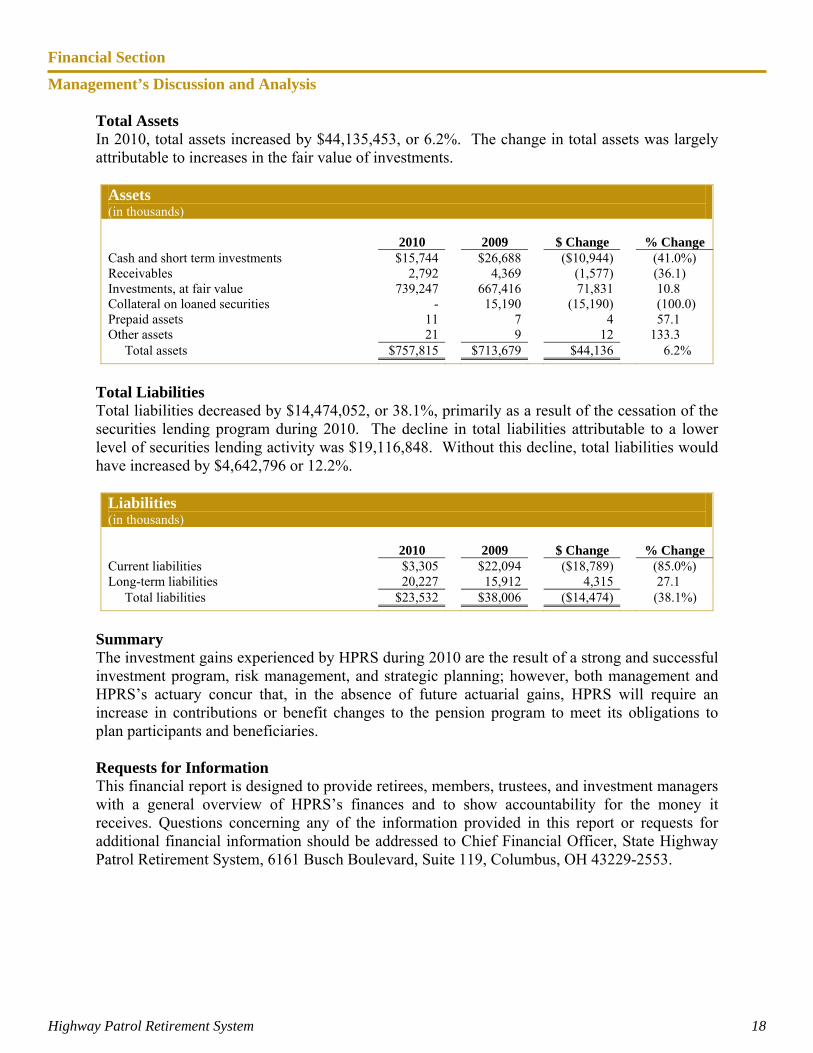
Total Assets In 2010, total assets increased by $44,135,453, or 6.2%. The change in total assets was largely attributable to increases in the fair value of investments.
Assets (in thousands)
2010 2009 $ Change % Change
Cash and short term investments $15,744 $26,688 ($10,944) (41.0%) Receivables 2,792 4,369 (1,577) (36.1) Investments, at fair value 739,247 667,416 71,831 10.8 Collateral on loaned securities - 15,190 (15,190) (100.0) Prepaid assets 11 7 4 57.1 Other assets 21 9 12 133.3 Total assets $757,815 $713,679 $44,136 6.2%
Total Liabilities Total liabilities decreased by $14,474,052, or 38.1%, primarily as a result of the cessation of the securities lending program during 2010. The decline in total liabilities attributable to a lower level of securities lending activity was $19,116,848. Without this decline, total liabilities would have increased by $4,642,796 or 12.2%.
Liabilities (in thousands) 2010 2009 $ Change % Change Current liabilities $3,305 $22,094 ($18,789) (85.0%) Long-term liabilities 20,227 15,912 4,315 27.1 Total liabilities $23,532 $38,006 ($14,474) (38.1%)
Summary The investment gains experienced by HPRS during 2010 are the result of a strong and successful investment program, risk management, and strategic planning; however, both management and HPRS’s actuary concur that, in the absence of future actuarial gains, HPRS will require an increase in contributions or benefit changes to the pension program to meet its obligations to plan participants and beneficiaries. Requests for Information This financial report is designed to provide retirees, members, trustees, and investment managers with a general overview of HPRS’s finances and to show accountability for the money it receives. Questions concerning any of the information provided in this report or requests for additional financial information should be addressed to Chief Financial Officer, State Highway Patrol Retirement System, 6161 Busch Boulevard, Suite 119, Columbus, OH 43229-2553.
Financial Section
Highway Patrol Retirement System 19
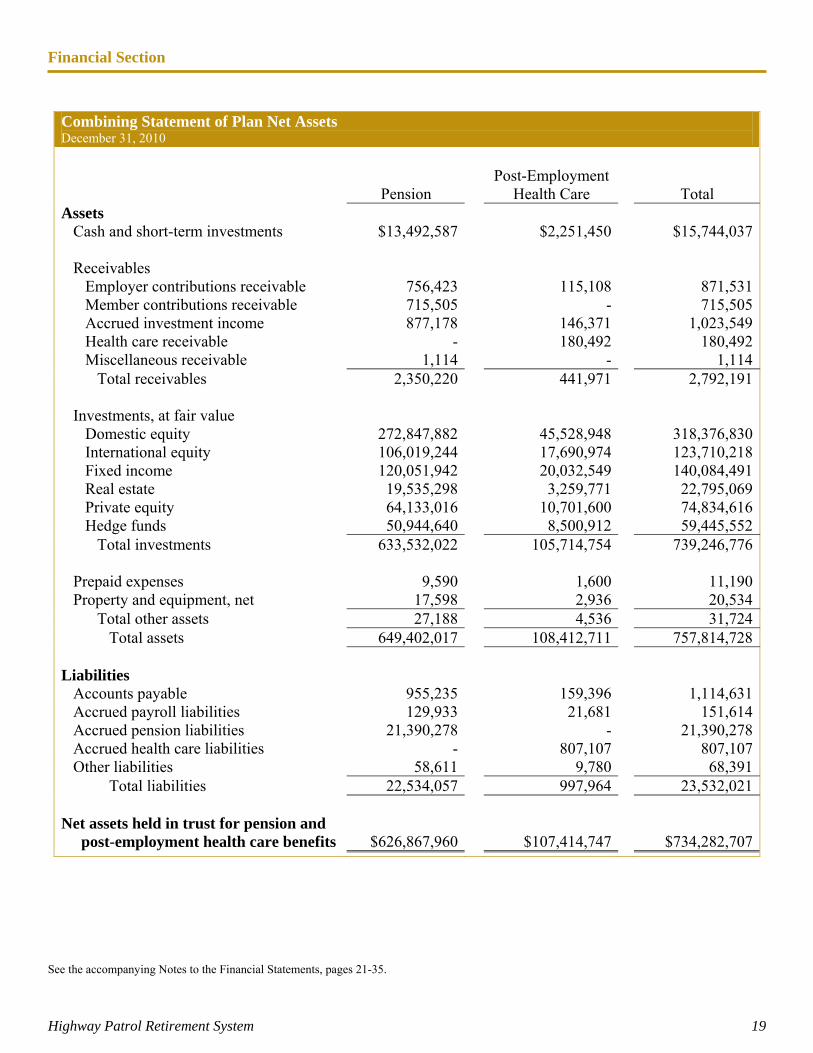
Combining Statement of Plan Net Assets December 31, 2010 Post-Employment Pension Health Care Total Assets Cash and short-term investments $13,492,587 $2,251,450 $15,744,037 Receivables Employer contributions receivable 756,423 115,108 871,531 Member contributions receivable 715,505 - 715,505 Accrued investment income 877,178 146,371 1,023,549 Health care receivable - 180,492 180,492 Miscellaneous receivable 1,114 - 1,114 Total receivables 2,350,220 441,971 2,792,191 Investments, at fair value Domestic equity 272,847,882 45,528,948 318,376,830 International equity 106,019,244 17,690,974 123,710,218 Fixed income 120,051,942 20,032,549 140,084,491 Real estate 19,535,298 3,259,771 22,795,069 Private equity 64,133,016 10,701,600 74,834,616 Hedge funds 50,944,640 8,500,912 59,445,552 Total investments 633,532,022 105,714,754 739,246,776 Prepaid expenses 9,590 1,600 11,190 Property and equipment, net 17,598 2,936 20,534 Total other assets 27,188 4,536 31,724 Total assets 649,402,017 108,412,711 757,814,728 Liabilities Accounts payable 955,235 159,396 1,114,631 Accrued payroll liabilities 129,933 21,681 151,614 Accrued pension liabilities 21,390,278 - 21,390,278 Accrued health care liabilities - 807,107 807,107 Other liabilities 58,611 9,780 68,391 Total liabilities 22,534,057 997,964 23,532,021 Net assets held in trust for pension and post-employment health care benefits $626,867,960 $107,414,747 $734,282,707
See the accompanying Notes to the Financial Statements, pages 21-35.
Financial Section
Highway Patrol Retirement System 20
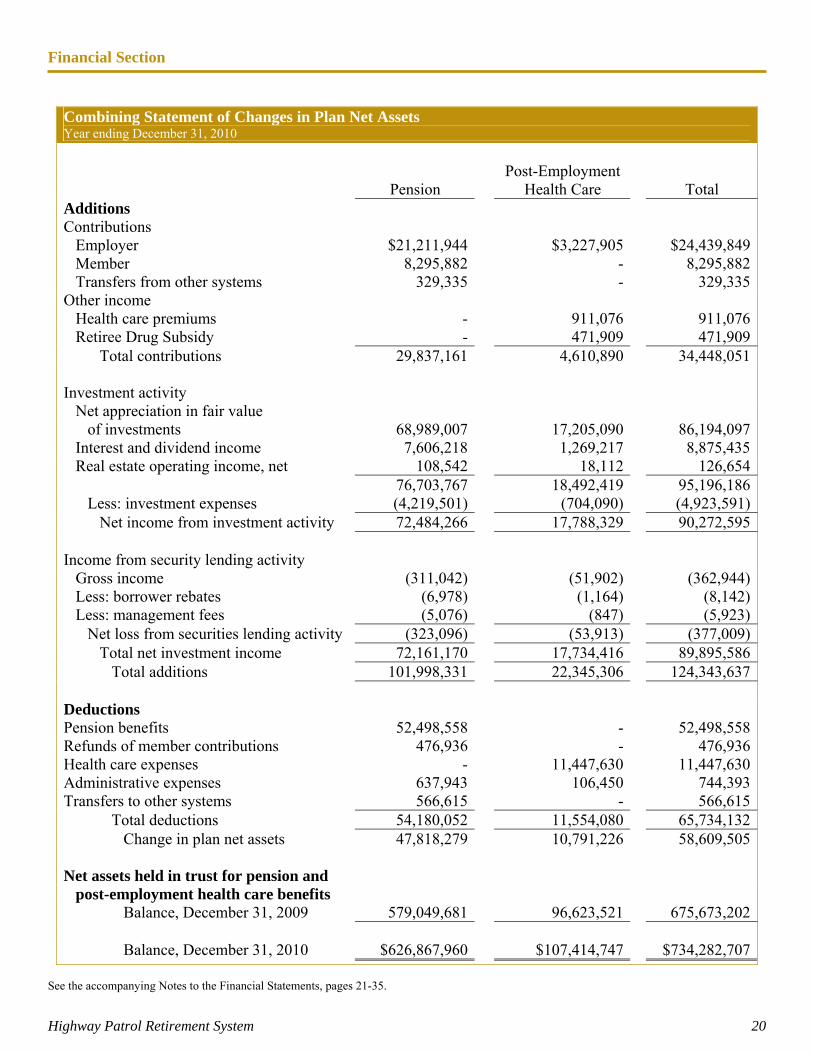
Combining Statement of Changes in Plan Net Assets Year ending December 31, 2010
Post-Employment Pension Health Care Total Additions Contributions Employer $21,211,944 $3,227,905 $24,439,849 Member 8,295,882 - 8,295,882 Transfers from other systems 329,335 - 329,335Other income Health care premiums - 911,076 911,076 Retiree Drug Subsidy - 471,909 471,909 Total contributions 29,837,161 4,610,890 34,448,051 Investment activity Net appreciation in fair value of investments 68,989,007 17,205,090 86,194,097 Interest and dividend income 7,606,218 1,269,217 8,875,435 Real estate operating income, net 108,542 18,112 126,654 76,703,767 18,492,419 95,196,186 Less: investment expenses (4,219,501) (704,090) (4,923,591) Net income from investment activity 72,484,266 17,788,329 90,272,595 Income from security lending activity Gross income (311,042) (51,902) (362,944) Less: borrower rebates (6,978) (1,164) (8,142) Less: management fees (5,076) (847) (5,923) Net loss from securities lending activity (323,096) (53,913) (377,009) Total net investment income 72,161,170 17,734,416 89,895,586 Total additions 101,998,331 22,345,306 124,343,637 Deductions Pension benefits 52,498,558 - 52,498,558Refunds of member contributions 476,936 - 476,936Health care expenses - 11,447,630 11,447,630Administrative expenses 637,943 106,450 744,393Transfers to other systems 566,615 - 566,615 Total deductions 54,180,052 11,554,080 65,734,132 Change in plan net assets 47,818,279 10,791,226 58,609,505 Net assets held in trust for pension and post-employment health care benefits Balance, December 31, 2009 579,049,681 96,623,521 675,673,202 Balance, December 31, 2010 $626,867,960 $107,414,747 $734,282,707
See the accompanying Notes to the Financial Statements, pages 21-35.
Financial Section
Notes to the Financial Statements
Highway Patrol Retirement System 21
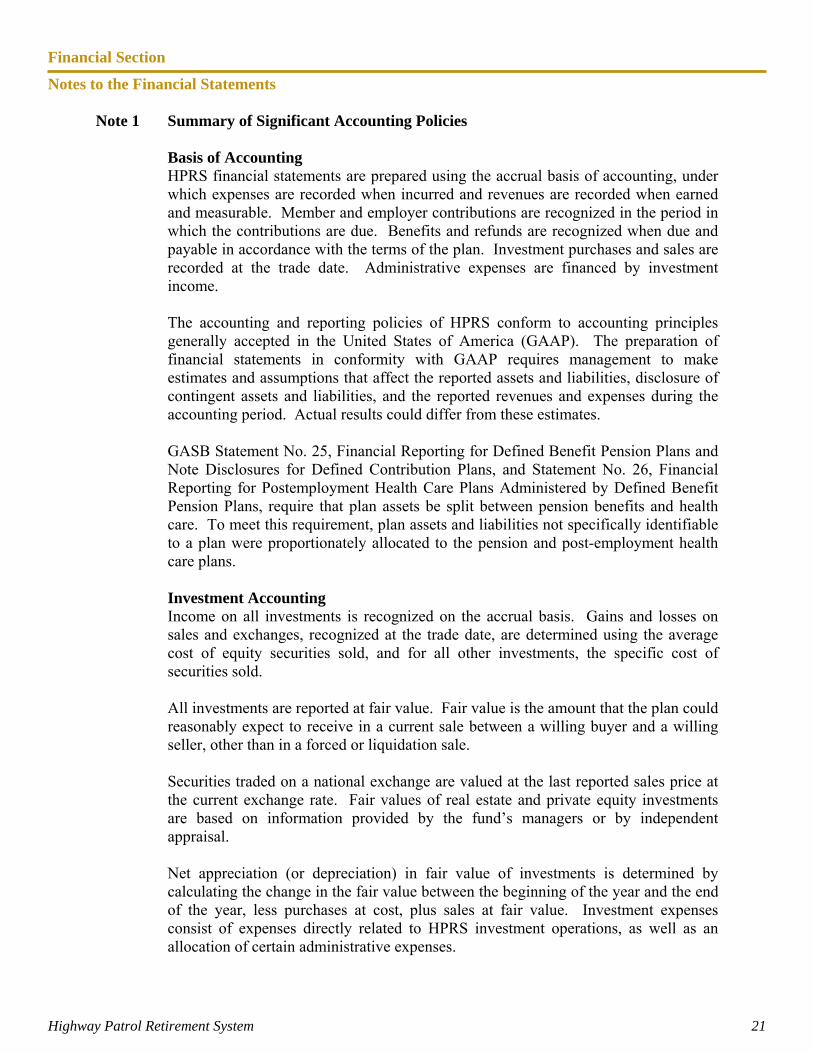
Note 1 Summary of Significant Accounting Policies
Basis of Accounting HPRS financial statements are prepared using the accrual basis of accounting, under which expenses are recorded when incurred and revenues are recorded when earned and measurable. Member and employer contributions are recognized in the period in which the contributions are due. Benefits and refunds are recognized when due and payable in accordance with the terms of the plan. Investment purchases and sales are recorded at the trade date. Administrative expenses are financed by investment income.
The accounting and reporting policies of HPRS conform to accounting principles generally accepted in the United States of America (GAAP). The preparation of financial statements in conformity with GAAP requires management to make estimates and assumptions that affect the reported assets and liabilities, disclosure of contingent assets and liabilities, and the reported revenues and expenses during the accounting period. Actual results could differ from these estimates.
GASB Statement No. 25, Financial Reporting for Defined Benefit Pension Plans and Note Disclosures for Defined Contribution Plans, and Statement No. 26, Financial Reporting for Postemployment Health Care Plans Administered by Defined Benefit Pension Plans, require that plan assets be split between pension benefits and health care. To meet this requirement, plan assets and liabilities not specifically identifiable to a plan were proportionately allocated to the pension and post-employment health care plans.
Investment Accounting Income on all investments is recognized on the accrual basis. Gains and losses on sales and exchanges, recognized at the trade date, are determined using the average cost of equity securities sold, and for all other investments, the specific cost of securities sold. All investments are reported at fair value. Fair value is the amount that the plan could reasonably expect to receive in a current sale between a willing buyer and a willing seller, other than in a forced or liquidation sale. Securities traded on a national exchange are valued at the last reported sales price at the current exchange rate. Fair values of real estate and private equity investments are based on information provided by the fund’s managers or by independent appraisal. Net appreciation (or depreciation) in fair value of investments is determined by calculating the change in the fair value between the beginning of the year and the end of the year, less purchases at cost, plus sales at fair value. Investment expenses consist of expenses directly related to HPRS investment operations, as well as an allocation of certain administrative expenses.
Financial Section
Notes to the Financial Statements
Highway Patrol Retirement System 22
Use of Estimates In preparing financial statements in conformity with governmental accounting principles generally accepted in the United States of America, the management of HPRS makes estimates and assumptions that affect (1) the reported amounts of assets and liabilities, (2) disclosures of contingent assets and liabilities, and (3) the amount of revenues and expenses during the reporting period. Actual results could differ from those estimates and assumptions. Certain investment assets, including private equity and real estate, use estimates in reporting fair value in the financial statements. These estimates are subject to uncertainty in the near term, which could result in changes in the values reported for those assets in the Combining Statement of Plan Net Assets. Capital Assets When acquired, an item of property or equipment in excess of $5,000 is capitalized at cost. An improvement in excess of $5,000 that extends the useful life of an asset is capitalized. An expenditure for maintenance or repair of an asset is expensed as incurred. Depreciation is computed using the straight-line method over the useful life of each asset (typically, between three and ten years).
Accrued Health Care Liabilities Accrued health care liabilities are based upon estimates furnished by the claims administrators. These estimates have been developed from prior claims experience. In general, costs of member health care benefits are recognized as claims are incurred and premiums are paid. Health care benefit expenses of $11,447,630 for 2010 are shown on the accompanying Combining Statement of Changes in Plan Net Assets. Contributions and Benefits Based on statutory or contractual requirements, employer and employee contributions are recognized when due. In accordance with the terms of the plan, benefits and refunds are recognized when due and payable. Federal Income Tax Status HPRS is a qualified entity under Section 501(a) of the Internal Revenue Code and is, therefore, exempt from federal income taxes. Recently Issued Accounting Pronouncements Governmental Accounting Standards Board (GASB) issued Statement No. 54, Fund Balance Reporting and Governmental Fund Type Definitions. This statement is effective for the year ending December 31, 2011. It enhances the usefulness of fund balance information by providing clearer fund balance classifications that can be more consistently applied, and it clarifies the existing governmental fund type definitions.
Financial Section
Notes to the Financial Statements
Highway Patrol Retirement System 23
GASB issued Statement No. 59, Financial Instruments Omnibus. This statement is effective for the year ending December 31, 2011 with earlier application encouraged. The objective of this pronouncement is to update and improve existing standards of financial reporting and disclosure requirements of certain financial instruments and external investment pools. It requires more complete information be disclosed, improves on the consistency of measurements, and provides clarification of existing standards. GASB issued Statement No. 61, The Financial Reporting Entity: Omnibus—an amendment of GASB Statements No. 14 and No. 34. This statement is effective for the year ending December 31, 2013 with earlier application encouraged. The objective of this pronouncement is to improve financial reporting for a governmental financial reporting entity by requiring the inclusion of financial reports of other entities for which elected officials are financially accountable or that are determined by the government to be misleading to exclude. GASB issued Statement No. 62, Codification of Accounting and Financial Reporting Guidance Contained in Pre-November 30, 1989 FASB and AICPA. This statement is effective for the year ending December 31, 2012 with earlier application encouraged. The purpose of this statement is to codify all sources of generally accepted accounting principles for state and local governments so that they derive from a single source. Management does not anticipate that the implementation of the above pronouncements will have a significant impact on the financial statements.
Note 2 Plan Description
Organization The State Highway Patrol Retirement System (HPRS) is a single-employer retirement system for employees of the Ohio State Highway Patrol, including officers with arrest authority, cadets in training at the Highway Patrol Training Academy, and members of the radio division who were hired prior to November 2, 1989. HPRS was created by Ohio Revised Code Chapter 5505 and is administered by a Board of Trustees consisting of five active members, two retired members, three appointed members, and one ex-officio member. The Board appoints an executive director, actuary, investment consultant, medical advisor, and independent auditor. HPRS administers both a defined benefit pension plan and a post-employment health care plan, which is considered to be an “other post-employment benefit,” or OPEB. Financial information for pensions and OPEB are presented separately in the combining financial statements. HPRS, a separate financial reporting entity in accordance with criteria established by GASB Statement No. 39 (an amendment to No. 14), is a component unit of the State of Ohio. HPRS does not have financial accountability over any entities.
Financial Section
Notes to the Financial Statements
Highway Patrol Retirement System 24
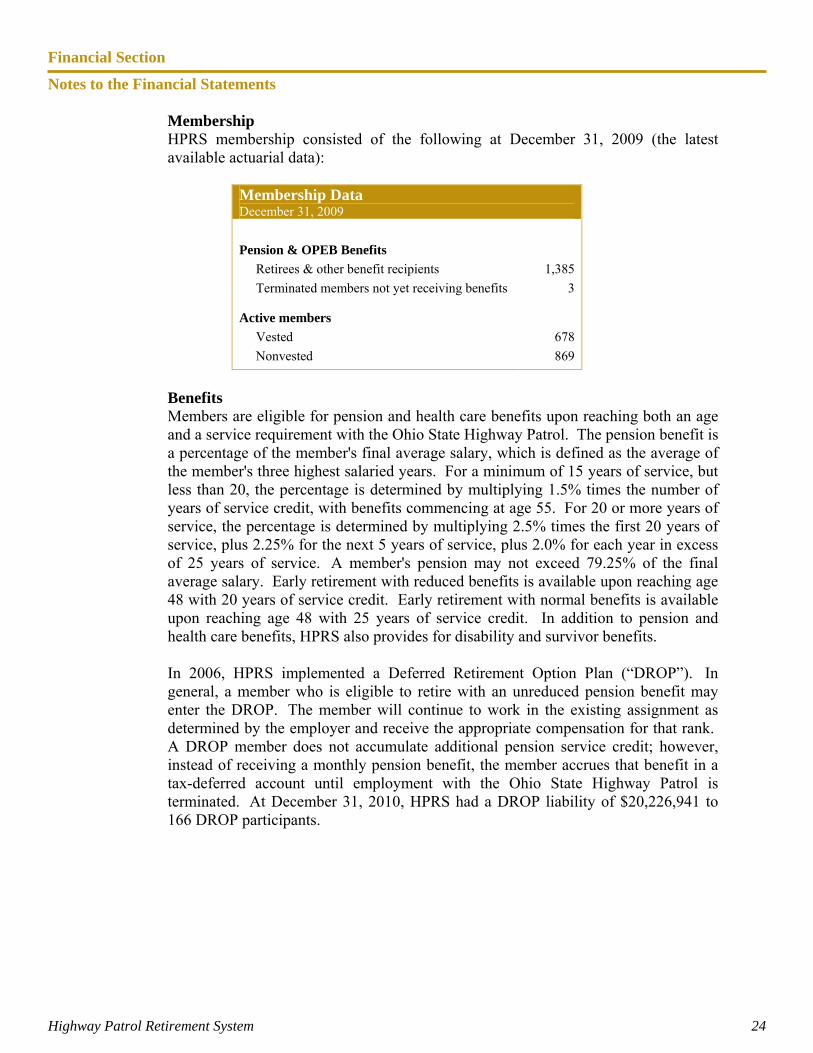
Membership HPRS membership consisted of the following at December 31, 2009 (the latest available actuarial data):
Membership Data December 31, 2009
Pension & OPEB Benefits
Retirees & other benefit recipients 1,385
Terminated members not yet receiving benefits 3
Active members
Vested 678
Nonvested 869
Benefits Members are eligible for pension and health care benefits upon reaching both an age and a service requirement with the Ohio State Highway Patrol. The pension benefit is a percentage of the member's final average salary, which is defined as the average of the member's three highest salaried years. For a minimum of 15 years of service, but less than 20, the percentage is determined by multiplying 1.5% times the number of years of service credit, with benefits commencing at age 55. For 20 or more years of service, the percentage is determined by multiplying 2.5% times the first 20 years of service, plus 2.25% for the next 5 years of service, plus 2.0% for each year in excess of 25 years of service. A member's pension may not exceed 79.25% of the final average salary. Early retirement with reduced benefits is available upon reaching age 48 with 20 years of service credit. Early retirement with normal benefits is available upon reaching age 48 with 25 years of service credit. In addition to pension and health care benefits, HPRS also provides for disability and survivor benefits. In 2006, HPRS implemented a Deferred Retirement Option Plan (“DROP”). In general, a member who is eligible to retire with an unreduced pension benefit may enter the DROP. The member will continue to work in the existing assignment as determined by the employer and receive the appropriate compensation for that rank. A DROP member does not accumulate additional pension service credit; however, instead of receiving a monthly pension benefit, the member accrues that benefit in a tax-deferred account until employment with the Ohio State Highway Patrol is terminated. At December 31, 2010, HPRS had a DROP liability of $20,226,941 to 166 DROP participants.
Financial Section
Notes to the Financial Statements
Highway Patrol Retirement System 25
Contributions The Ohio Revised Code requires contributions by both active members and the Ohio State Highway Patrol. Both the member and employer contribution rates are established by the Ohio General Assembly, and any change in the rates requires legislative action. The employer contribution rate may not be lower than nine percent of the total salaries paid to contributing members and may not exceed three times the member contribution rate. In 2010, the member contribution rate was 10.0% of payroll and the employer contribution rate was 26.5%. Based on the December 31, 2008 actuarial valuation, the Board allocated the employer contribution rate to pension benefits and OPEB as follows:
Pension OPEB Total
22.00% 4.50% 26.50% Based on the December 31, 2009 actuarial valuation, the Board allocated the employer contribution rate to pension benefits and OPEB as follows:
Pension OPEB Total
23.00% 3.50% 26.50% Because losses that occurred in 2008 are not yet fully recognized, the HPRS actuary was unable to amortize unfunded actuarially accrued pension liabilities over a finite period. Without plan design changes, the system is unlikely to be able to pay off future liabilities. Upon request of a member who terminates employment with the Ohio State Highway Patrol, member contributions are refunded. If a member dies while active in the service of the Ohio State Highway Patrol, member contributions are refunded to the member's beneficiary, provided that no survivor benefits are payable. A member with credited service in Ohio Public Employees Retirement System (OPERS), School Employees Retirement System (SERS), State Teachers Retirement System (STRS), Ohio Police & Fire Pension Fund (OP&F), or Cincinnati Retirement System (CRS) may transfer that service credit to HPRS. Similarly, a member with credited service in HPRS may transfer that service to OPERS, SERS, STRS, OP&F, or CRS.
Financial Section
Notes to the Financial Statements
Highway Patrol Retirement System 26
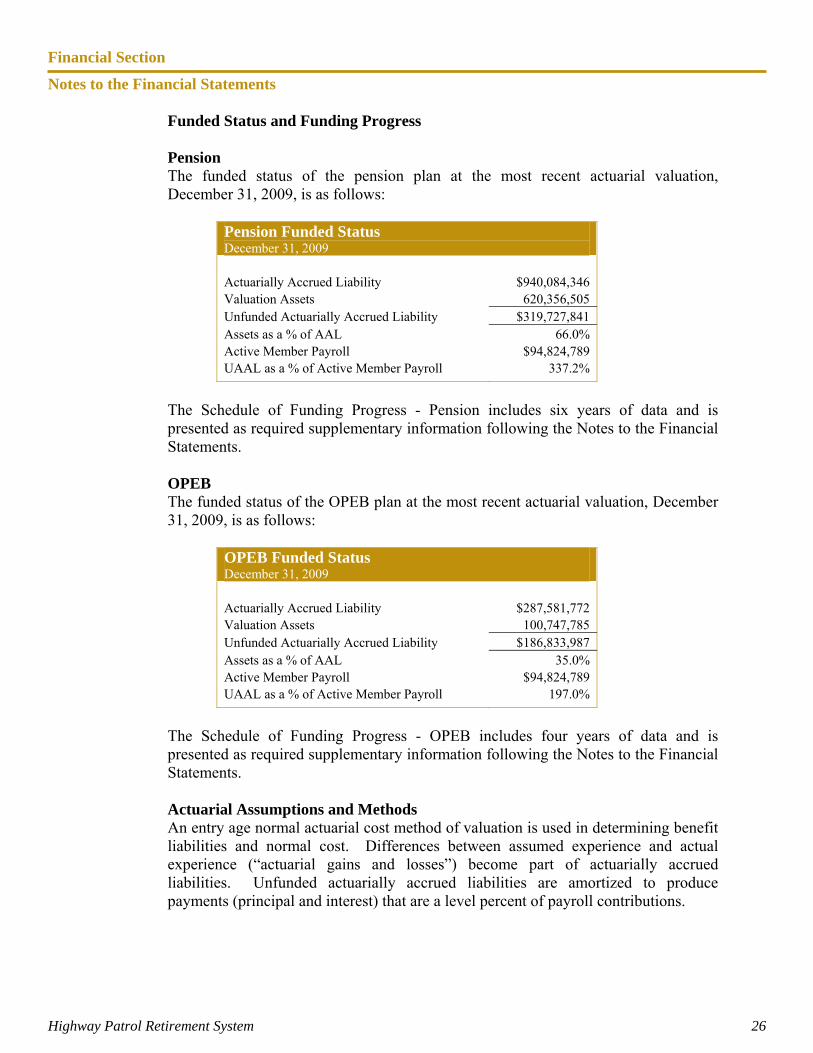
Funded Status and Funding Progress Pension The funded status of the pension plan at the most recent actuarial valuation, December 31, 2009, is as follows:
Pension Funded Status December 31, 2009 Actuarially Accrued Liability $940,084,346 Valuation Assets 620,356,505 Unfunded Actuarially Accrued Liability $319,727,841 Assets as a % of AAL 66.0% Active Member Payroll $94,824,789 UAAL as a % of Active Member Payroll 337.2%
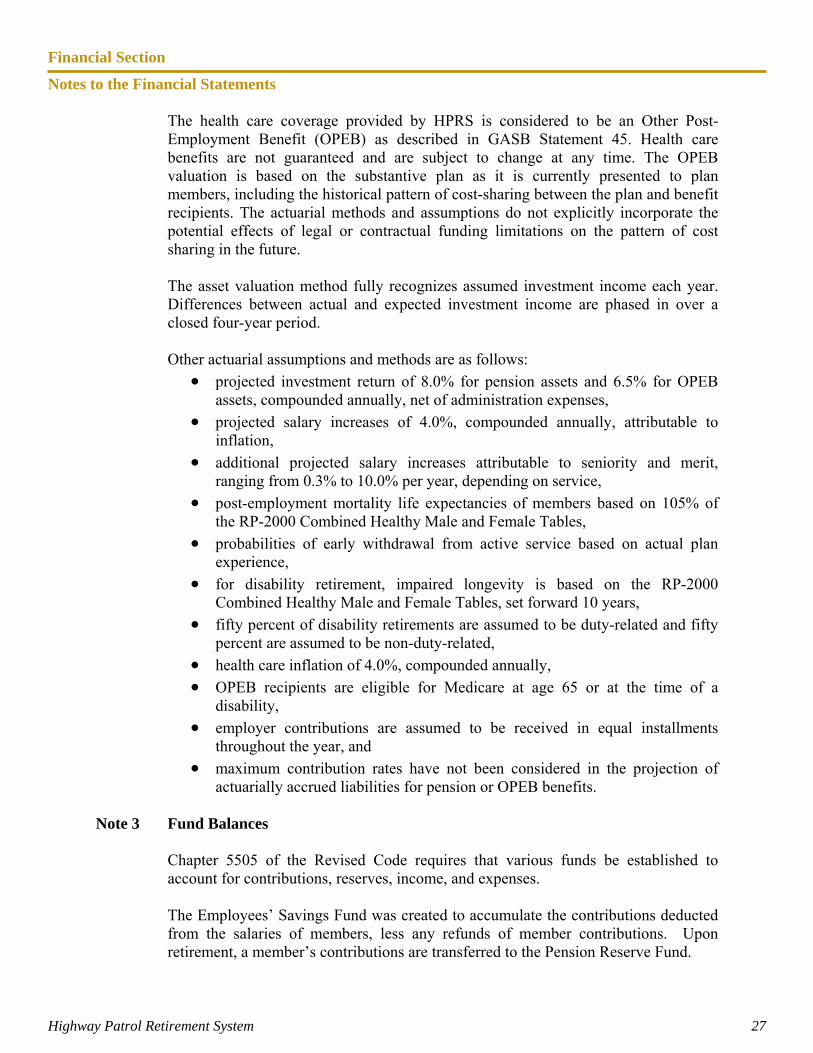
The Schedule of Funding Progress - Pension includes six years of data and is presented as required supplementary information following the Notes to the Financial Statements. OPEB The funded status of the OPEB plan at the most recent actuarial valuation, December 31, 2009, is as follows:
OPEB Funded Status December 31, 2009 Actuarially Accrued Liability $287,581,772 Valuation Assets 100,747,785 Unfunded Actuarially Accrued Liability $186,833,987 Assets as a % of AAL 35.0% Active Member Payroll $94,824,789 UAAL as a % of Active Member Payroll 197.0%
The Schedule of Funding Progress - OPEB includes four years of data and is presented as required supplementary information following the Notes to the Financial Statements. Actuarial Assumptions and Methods An entry age normal actuarial cost method of valuation is used in determining benefit liabilities and normal cost. Differences between assumed experience and actual experience (“actuarial gains and losses”) become part of actuarially accrued liabilities. Unfunded actuarially accrued liabilities are amortized to produce payments (principal and interest) that are a level percent of payroll contributions.
Financial Section
Notes to the Financial Statements
Highway Patrol Retirement System 27
The health care coverage provided by HPRS is considered to be an Other Post-Employment Benefit (OPEB) as described in GASB Statement 45. Health care benefits are not guaranteed and are subject to change at any time. The OPEB valuation is based on the substantive plan as it is currently presented to plan members, including the historical pattern of cost-sharing between the plan and benefit recipients. The actuarial methods and assumptions do not explicitly incorporate the potential effects of legal or contractual funding limitations on the pattern of cost sharing in the future. The asset valuation method fully recognizes assumed investment income each year. Differences between actual and expected investment income are phased in over a closed four-year period. Other actuarial assumptions and methods are as follows:
projected investment return of 8.0% for pension assets and 6.5% for OPEB assets, compounded annually, net of administration expenses,
projected salary increases of 4.0%, compounded annually, attributable to inflation,
additional projected salary increases attributable to seniority and merit, ranging from 0.3% to 10.0% per year, depending on service,
post-employment mortality life expectancies of members based on 105% of the RP-2000 Combined Healthy Male and Female Tables,
probabilities of early withdrawal from active service based on actual plan experience,
for disability retirement, impaired longevity is based on the RP-2000 Combined Healthy Male and Female Tables, set forward 10 years,
fifty percent of disability retirements are assumed to be duty-related and fifty percent are assumed to be non-duty-related,
health care inflation of 4.0%, compounded annually,
OPEB recipients are eligible for Medicare at age 65 or at the time of a disability,
employer contributions are assumed to be received in equal installments throughout the year, and
maximum contribution rates have not been considered in the projection of actuarially accrued liabilities for pension or OPEB benefits.
Note 3 Fund Balances
Chapter 5505 of the Revised Code requires that various funds be established to account for contributions, reserves, income, and expenses. The Employees’ Savings Fund was created to accumulate the contributions deducted from the salaries of members, less any refunds of member contributions. Upon retirement, a member’s contributions are transferred to the Pension Reserve Fund.
Financial Section
Notes to the Financial Statements
Highway Patrol Retirement System 28
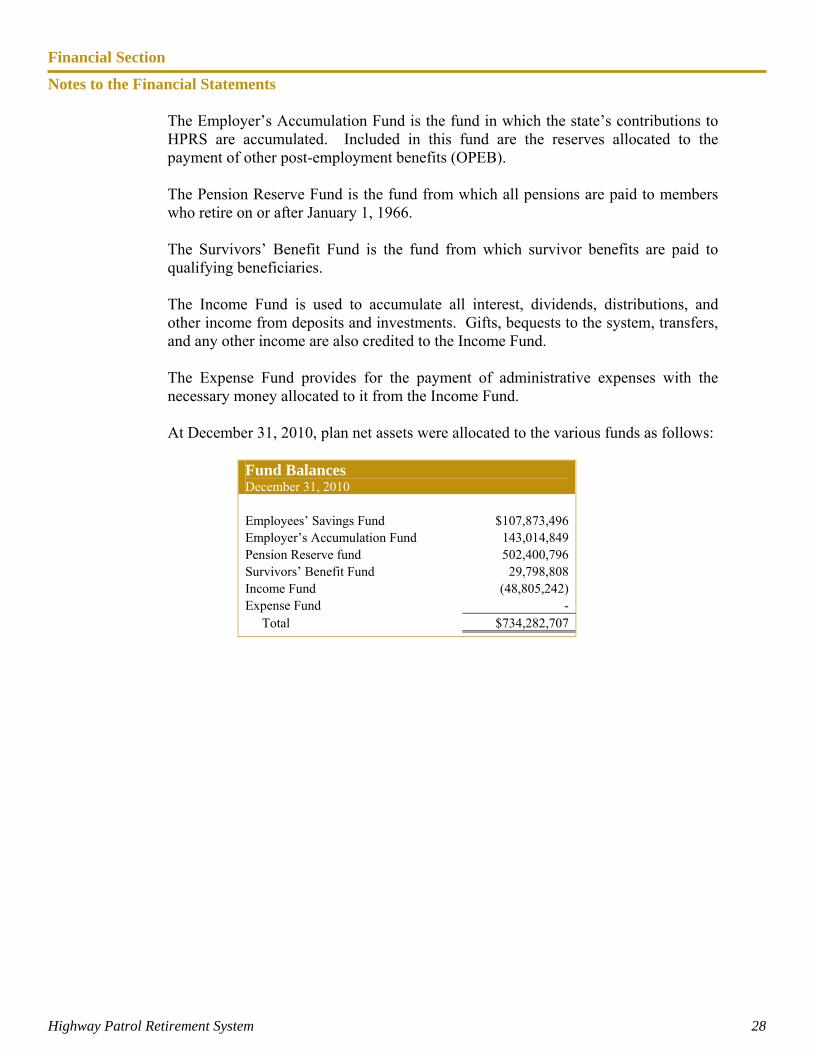
The Employer’s Accumulation Fund is the fund in which the state’s contributions to HPRS are accumulated. Included in this fund are the reserves allocated to the payment of other post-employment benefits (OPEB). The Pension Reserve Fund is the fund from which all pensions are paid to members who retire on or after January 1, 1966. The Survivors’ Benefit Fund is the fund from which survivor benefits are paid to qualifying beneficiaries. The Income Fund is used to accumulate all interest, dividends, distributions, and other income from deposits and investments. Gifts, bequests to the system, transfers, and any other income are also credited to the Income Fund. The Expense Fund provides for the payment of administrative expenses with the necessary money allocated to it from the Income Fund. At December 31, 2010, plan net assets were allocated to the various funds as follows:
Fund Balances December 31, 2010
Employees’ Savings Fund $107,873,496 Employer’s Accumulation Fund 143,014,849 Pension Reserve fund 502,400,796 Survivors’ Benefit Fund 29,798,808 Income Fund (48,805,242) Expense Fund - Total $734,282,707
Financial Section
Notes to the Financial Statements
Highway Patrol Retirement System 29
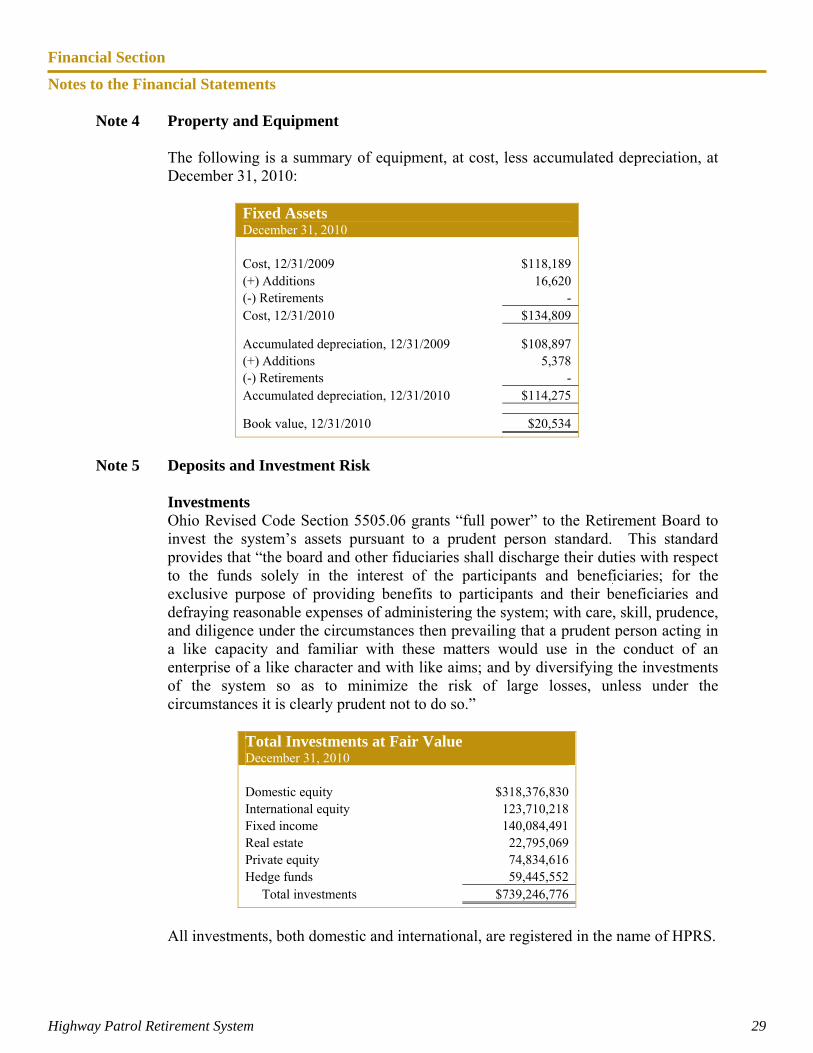
Note 4 Property and Equipment The following is a summary of equipment, at cost, less accumulated depreciation, at December 31, 2010:
Fixed Assets December 31, 2010
Cost, 12/31/2009 $118,189 (+) Additions 16,620 (-) Retirements - Cost, 12/31/2010 $134,809
Accumulated depreciation, 12/31/2009 $108,897 (+) Additions 5,378 (-) Retirements - Accumulated depreciation, 12/31/2010 $114,275
Book value, 12/31/2010 $20,534
Note 5 Deposits and Investment Risk
Investments Ohio Revised Code Section 5505.06 grants “full power” to the Retirement Board to invest the system’s assets pursuant to a prudent person standard. This standard provides that “the board and other fiduciaries shall discharge their duties with respect to the funds solely in the interest of the participants and beneficiaries; for the exclusive purpose of providing benefits to participants and their beneficiaries and defraying reasonable expenses of administering the system; with care, skill, prudence, and diligence under the circumstances then prevailing that a prudent person acting in a like capacity and familiar with these matters would use in the conduct of an enterprise of a like character and with like aims; and by diversifying the investments of the system so as to minimize the risk of large losses, unless under the circumstances it is clearly prudent not to do so.”
Total Investments at Fair Value December 31, 2010
Domestic equity $318,376,830 International equity 123,710,218 Fixed income 140,084,491 Real estate 22,795,069 Private equity 74,834,616 Hedge funds 59,445,552 Total investments $739,246,776
All investments, both domestic and international, are registered in the name of HPRS.
Financial Section
Notes to the Financial Statements
Highway Patrol Retirement System 30
Deposits HPRS cash balances consist of an operating cash account held at PNC Bank, cash on deposit with the State Highway Patrol Federal Credit Union, and excess investment cash held by the custodian, PNC Bank. Cash balances are either interest-bearing or invested in highly-liquid debt instruments with an original maturity of three months or less. At December 31, 2010, the carrying value of all deposits was $15,744,037 (including money market funds of $12,830,403), as compared to bank balances of $2,764,538. The difference in the carrying amount and the bank balances is caused by outstanding warrants and deposits in transit.
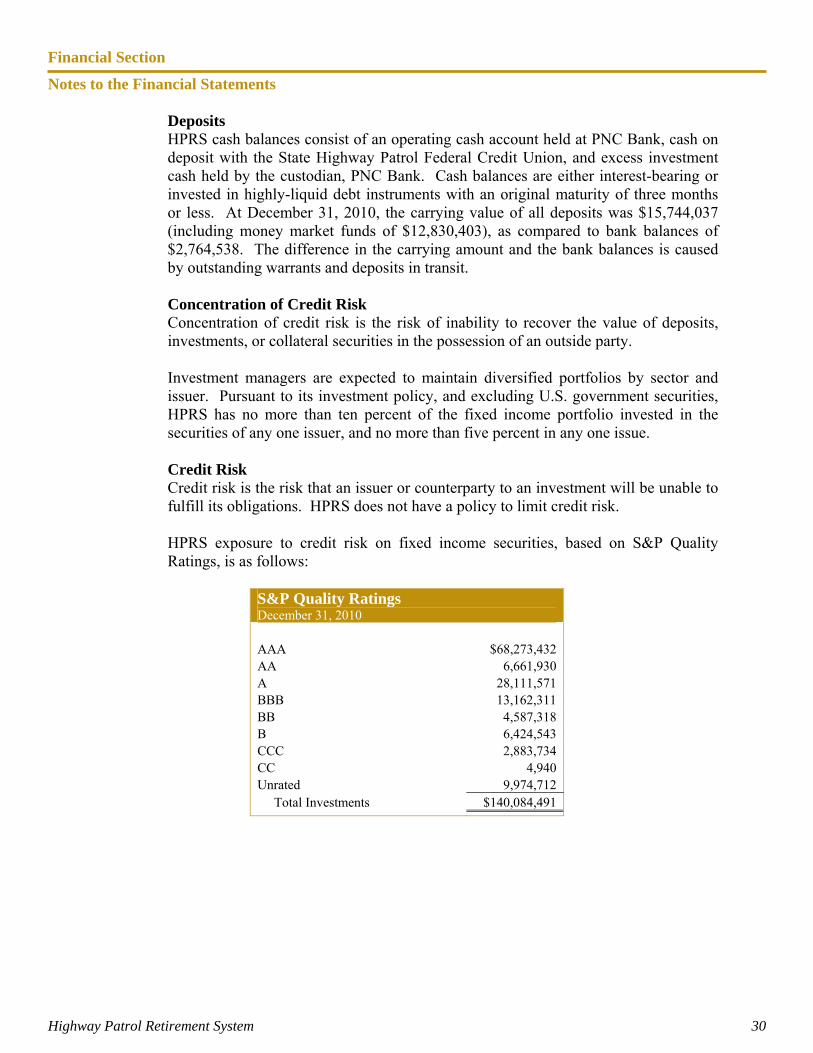
Concentration of Credit Risk Concentration of credit risk is the risk of inability to recover the value of deposits, investments, or collateral securities in the possession of an outside party. Investment managers are expected to maintain diversified portfolios by sector and issuer. Pursuant to its investment policy, and excluding U.S. government securities, HPRS has no more than ten percent of the fixed income portfolio invested in the securities of any one issuer, and no more than five percent in any one issue. Credit Risk Credit risk is the risk that an issuer or counterparty to an investment will be unable to fulfill its obligations. HPRS does not have a policy to limit credit risk.
HPRS exposure to credit risk on fixed income securities, based on S&P Quality Ratings, is as follows:
S&P Quality Ratings December 31, 2010
AAA $68,273,432 AA 6,661,930 A 28,111,571 BBB 13,162,311 BB 4,587,318 B 6,424,543 CCC 2,883,734 CC 4,940 Unrated 9,974,712 Total Investments $140,084,491
Financial Section
Notes to the Financial Statements
Highway Patrol Retirement System 31
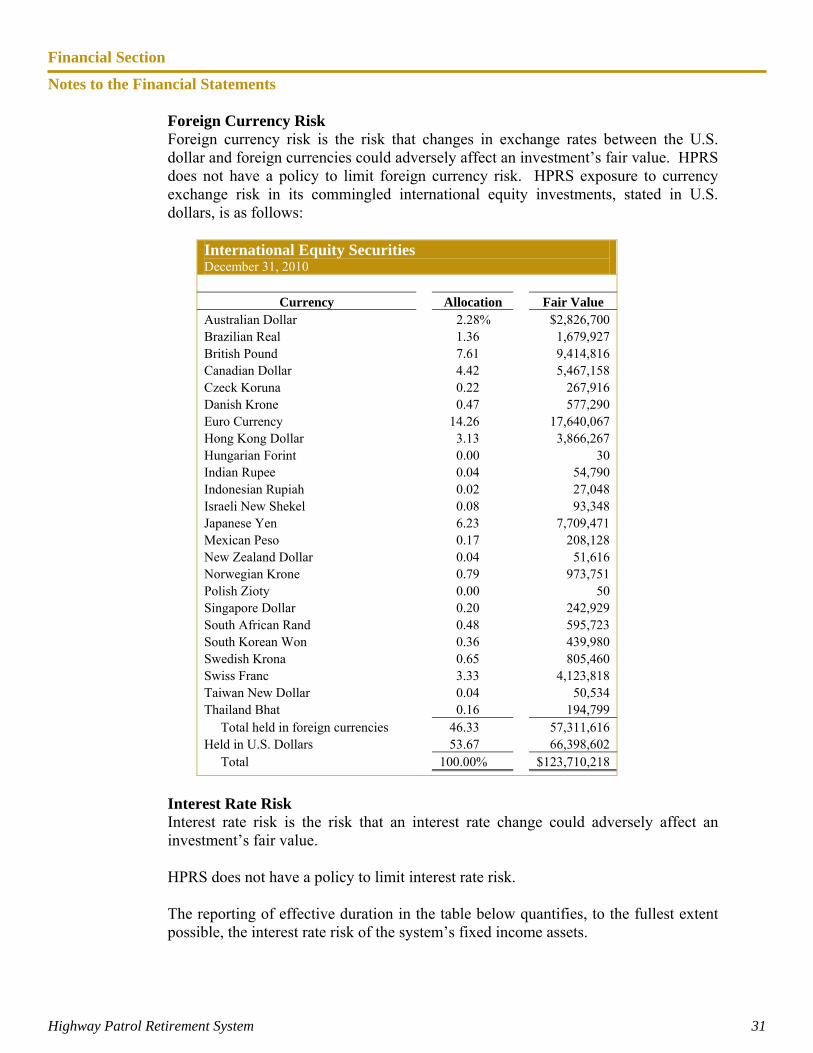
Foreign Currency Risk Foreign currency risk is the risk that changes in exchange rates between the U.S. dollar and foreign currencies could adversely affect an investment’s fair value. HPRS does not have a policy to limit foreign currency risk. HPRS exposure to currency exchange risk in its commingled international equity investments, stated in U.S. dollars, is as follows:
International Equity Securities December 31, 2010
Currency Allocation Fair Value Australian Dollar 2.28% $2,826,700 Brazilian Real 1.36 1,679,927 British Pound 7.61 9,414,816 Canadian Dollar 4.42 5,467,158 Czeck Koruna 0.22 267,916 Danish Krone 0.47 577,290 Euro Currency 14.26 17,640,067 Hong Kong Dollar 3.13 3,866,267 Hungarian Forint 0.00 30 Indian Rupee 0.04 54,790 Indonesian Rupiah 0.02 27,048 Israeli New Shekel 0.08 93,348 Japanese Yen 6.23 7,709,471 Mexican Peso 0.17 208,128 New Zealand Dollar 0.04 51,616 Norwegian Krone 0.79 973,751 Polish Zioty 0.00 50 Singapore Dollar 0.20 242,929 South African Rand 0.48 595,723 South Korean Won 0.36 439,980 Swedish Krona 0.65 805,460 Swiss Franc 3.33 4,123,818 Taiwan New Dollar 0.04 50,534 Thailand Bhat 0.16 194,799 Total held in foreign currencies 46.33 57,311,616 Held in U.S. Dollars 53.67 66,398,602 Total 100.00% $123,710,218
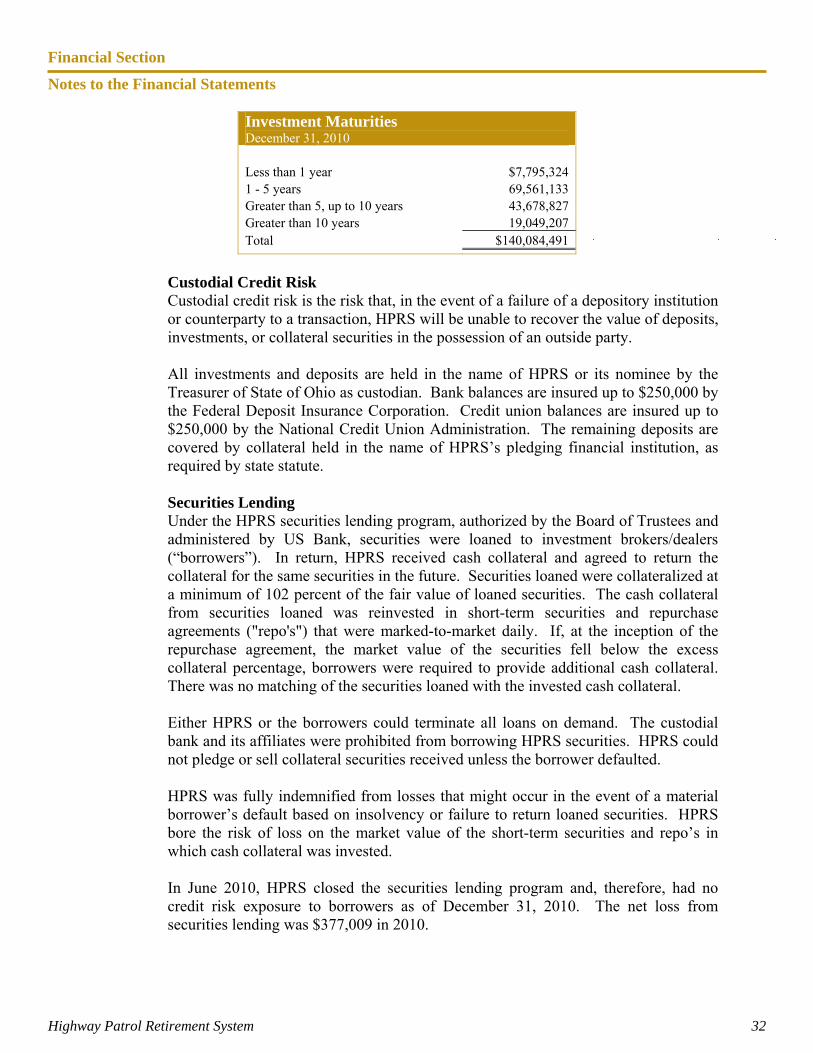
Interest Rate Risk Interest rate risk is the risk that an interest rate change could adversely affect an investment’s fair value. HPRS does not have a policy to limit interest rate risk. The reporting of effective duration in the table below quantifies, to the fullest extent possible, the interest rate risk of the system’s fixed income assets.
Financial Section
Notes to the Financial Statements
Highway Patrol Retirement System 32
Investment Maturities December 31, 2010
Less than 1 year $7,795,324 1 - 5 years 69,561,133 Greater than 5, up to 10 years 43,678,827 Greater than 10 years 19,049,207 Total $140,084,491
Custodial Credit Risk Custodial credit risk is the risk that, in the event of a failure of a depository institution or counterparty to a transaction, HPRS will be unable to recover the value of deposits, investments, or collateral securities in the possession of an outside party. All investments and deposits are held in the name of HPRS or its nominee by the Treasurer of State of Ohio as custodian. Bank balances are insured up to $250,000 by the Federal Deposit Insurance Corporation. Credit union balances are insured up to $250,000 by the National Credit Union Administration. The remaining deposits are covered by collateral held in the name of HPRS’s pledging financial institution, as required by state statute.
Securities Lending Under the HPRS securities lending program, authorized by the Board of Trustees and administered by US Bank, securities were loaned to investment brokers/dealers (“borrowers”). In return, HPRS received cash collateral and agreed to return the collateral for the same securities in the future. Securities loaned were collateralized at a minimum of 102 percent of the fair value of loaned securities. The cash collateral from securities loaned was reinvested in short-term securities and repurchase agreements ("repo's") that were marked-to-market daily. If, at the inception of the repurchase agreement, the market value of the securities fell below the excess collateral percentage, borrowers were required to provide additional cash collateral. There was no matching of the securities loaned with the invested cash collateral. Either HPRS or the borrowers could terminate all loans on demand. The custodial bank and its affiliates were prohibited from borrowing HPRS securities. HPRS could not pledge or sell collateral securities received unless the borrower defaulted. HPRS was fully indemnified from losses that might occur in the event of a material borrower’s default based on insolvency or failure to return loaned securities. HPRS bore the risk of loss on the market value of the short-term securities and repo’s in which cash collateral was invested. In June 2010, HPRS closed the securities lending program and, therefore, had no credit risk exposure to borrowers as of December 31, 2010. The net loss from securities lending was $377,009 in 2010.
Financial Section
Notes to the Financial Statements
Highway Patrol Retirement System 33
Note 6 Derivatives During the year ending December 31, 2010, HPRS adopted GASB Statement No. 53, Accounting and Financial Reporting for Derivative Instruments. GASB 53 was issued to address the recognition, measurement, and disclosure of information regarding derivative instruments entered into by state and local governments. A derivative is an investment vehicle that derives its value from another instrument or index. Derivatives are primarily used to maximize yields and offset volatility caused by interest rate and currency fluctuations. These instruments leave investors exposed to various credit, market, and legal risks. At December 31, 2010, HPRS did not have any direct investments in derivatives; however, it held shares in commingled funds that had incidental exposure to derivatives.
Note 7 Pension and OPEB Benefits for Employees
Pension The employees of HPRS are members of the Ohio Public Employee Retirement System (OPERS), which administers three separate pension plans as described below:
1. The Traditional Pension Plan - a cost sharing, multiple-employer defined benefit pension plan.
2. The Member-Directed Plan - a defined contribution plan in which the
member invests both member and employer contributions (employer contributions vest over five years at 20% per year). Under the Member-Directed Plan, members accumulate retirement assets equal to the value of member and (vested) employer contributions, plus any investment earnings.
3. The Combined Plan - a cost sharing, multiple-employer defined benefit
pension plan. Under the Combined Plan, employer contributions are invested by OPERS to provide a formula retirement benefit similar in nature to the Traditional Pension Plan benefit. Member contributions, the investment of which are self-directed by the members, accumulate retirement assets in a manner similar to the Member-Directed Plan.
OPERS provides retirement, disability, survivor and death benefits and annual cost-of-living adjustments to members of the Traditional Pension and Combined Plans. Members of the Member-Directed Plan do not qualify for ancillary benefits. Authority to establish and amend benefits is provided in Chapter 145 of the Ohio Revised Code.
Financial Section
Notes to the Financial Statements
Highway Patrol Retirement System 34
The Ohio Revised Code provides statutory authority for member and employer contributions. For 2010, member and employer contribution rates were consistent across all three plans. The 2010 member contribution rate was 10.0% of covered payroll. The 2010 employer contribution rate was 14.0% of covered payroll. HPRS employer contributions to OPERS for the years ending December 31, 2010, 2009, and 2008, were $83,141, $99,963, and $94,660, respectively, which were equal to the required contributions for each year.
OPEB As described above, OPERS administers three separate pension plans — the Traditional Pension Plan, the Member-Directed Plan, and the Combined Plan. OPERS maintains a cost-sharing multiple employer defined benefit post-employment health care plan, which includes a medical plan, prescription drug program, and Medicare Part B premium reimbursement to qualifying members of both the Traditional Pension and the Combined Plans. Members of the Member-Directed Plan do not qualify for ancillary benefits, including post-employment health care coverage. In order to qualify for post-employment health care coverage, age and service retirees under the Traditional Pension and Combined Plans must have ten or more years of qualifying Ohio service credit. Health care coverage for disability benefit recipients and qualified survivor benefit recipients is available. The health care coverage provided by OPERS meets the definition of an “other post-employment benefit” as described in GASB Statement 45. The Ohio Revised Code permits, but does not mandate, OPERS to provide OPEB benefits to its eligible members and beneficiaries. Authority to establish and amend benefits is provided in Chapter 145 of the Ohio Revised Code. OPERS issues a stand-alone financial report. Interested parties may obtain a copy by writing OPERS, 277 East Town Street, Columbus OH 43215-4642, or by calling 614-222-5601 or 800-222-7377.
Funding Policy The Ohio Revised Code provides the statutory authority for public employers to fund post-employment health care through contributions to OPERS. A portion of each employer’s contribution to OPERS is set aside for the funding of post-employment health care benefits. Employer contribution rates are expressed as a percentage of the covered payroll of active members. In 2010, state and local employers contributed at a rate of 14.0% of covered payroll. The Ohio Revised Code currently limits the employer contribution to a rate not to exceed 14.0% of covered payroll for state employer units. Active members do not make contributions to the OPEB Plan.
Financial Section
Notes to the Financial Statements
Highway Patrol Retirement System 35
OPERS’s post-employment health care plan was established under, and is administrated in accordance with, Internal Revenue Code 401(h). Each year, the OPERS Board of Trustees determines the portion of the employer contribution rate that will be set aside for funding of post-employment health care benefits. The portion of employer contributions allocated to health care was 5.5% from January 1 through February, 2010 and 5.0% from March 1 through December 31, 2010. The OPERS Board of Trustees is also authorized to establish rules for the payment of a portion of health care coverage by retirees and surviving beneficiaries. Payment amounts vary depending on the number of covered dependents and the coverage selected. Annual OPEB Cost The rates stated above are the contractually required contribution rates for OPERS. HPRS employer contributions to OPERS for OPEB benefits for the year ending December 31, 2010, was $41,571, which was equal to the required contributions for the year. Health Care Preservation Plan The Health Care Preservation Plan (“HCPP”), adopted by the OPERS Board of Trustees on September 9, 2004, was effective January 1, 2007. Member and employer contribution rates for state and local employers increased on January 1 of each year from 2006 to 2008. These rate increases allowed additional funds to be allocated to the health care plan.
Note 8 Risk Management
HPRS purchases insurance coverage for general liability, property damage, employee, and public official liability with varying policy limits. In the past three years, no settlements have exceeded insurance coverage, and coverage has not been significantly reduced.
Note 9 Contingent Liabilities
HPRS is a party to various litigation actions. While the final outcome of any action can not be determined, management does not expect that the liability, if any, for these legal actions will have a material adverse effect on the financial position of HPRS.
Financial Section
Required Supplementary Schedules
Highway Patrol Retirement System 36
Schedule of Employer Contributions - Pension Years ending December 31, 2005 - 2010
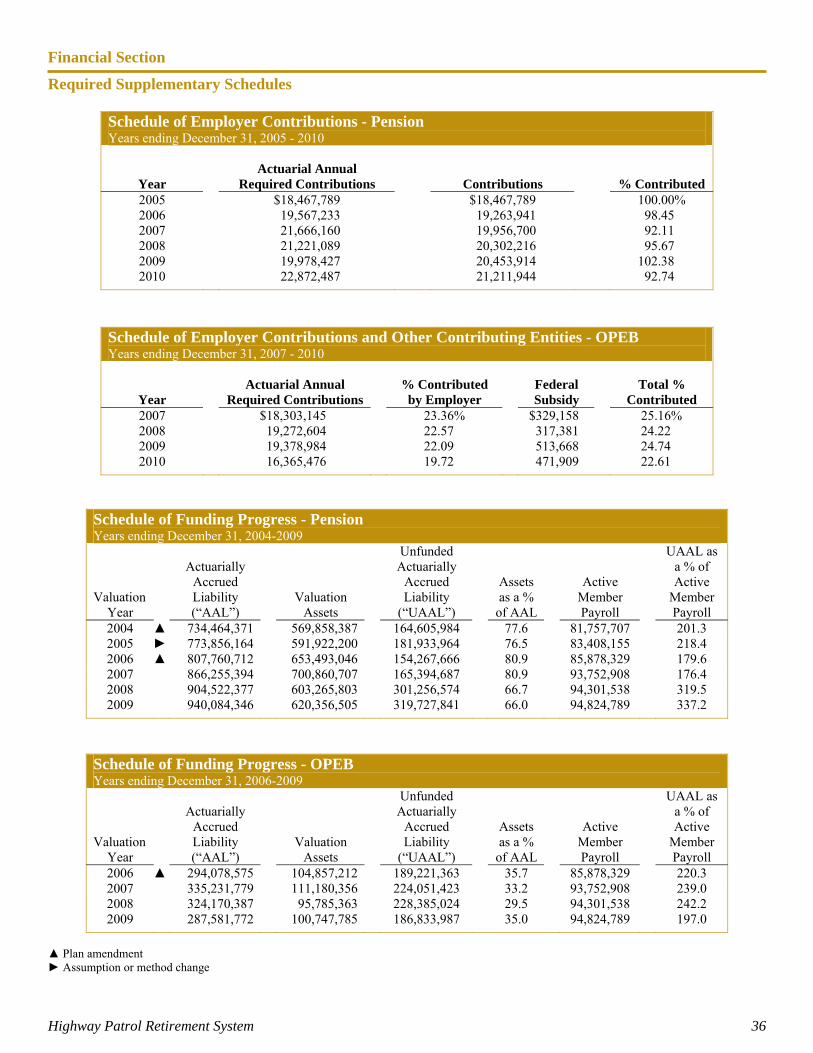
Actuarial Annual Year Required Contributions Contributions % Contributed 2005 $18,467,789 $18,467,789 100.00% 2006 19,567,233 19,263,941 98.45 2007 21,666,160 19,956,700 92.11 2008 21,221,089 20,302,216 95.67 2009 19,978,427 20,453,914 102.38 2010 22,872,487 21,211,944 92.74
Schedule of Employer Contributions and Other Contributing Entities - OPEB Years ending December 31, 2007 - 2010
Actuarial Annual % Contributed Federal Total %
Year Required Contributions by Employer Subsidy Contributed 2007 $18,303,145 23.36% $329,158 25.16% 2008 19,272,604 22.57 317,381 24.22 2009 19,378,984 22.09 513,668 24.74 2010 16,365,476 19.72 471,909 22.61
▲ Plan amendment ► Assumption or method change
Schedule of Funding Progress - Pension Years ending December 31, 2004-2009
Valuation Year
Actuarially
Accrued Liability (“AAL”)
Valuation Assets
Unfunded Actuarially
Accrued Liability
(“UAAL”)
Assets as a %
of AAL
Active Member Payroll
UAAL as a % of Active
Member Payroll
2004 ▲ 734,464,371 569,858,387 164,605,984 77.6 81,757,707 201.3 2005 ► 773,856,164 591,922,200 181,933,964 76.5 83,408,155 218.4 2006 ▲ 807,760,712 653,493,046 154,267,666 80.9 85,878,329 179.6 2007 866,255,394 700,860,707 165,394,687 80.9 93,752,908 176.4 2008 904,522,377 603,265,803 301,256,574 66.7 94,301,538 319.5 2009 940,084,346 620,356,505 319,727,841 66.0 94,824,789 337.2
Schedule of Funding Progress - OPEB Years ending December 31, 2006-2009
Valuation Year
Actuarially
Accrued Liability (“AAL”)
Valuation Assets
Unfunded Actuarially
Accrued Liability
(“UAAL”)
Assets as a %
of AAL
Active Member Payroll
UAAL as a % of Active
Member Payroll
2006 ▲ 294,078,575 104,857,212 189,221,363 35.7 85,878,329 220.3 2007 335,231,779 111,180,356 224,051,423 33.2 93,752,908 239.0 2008 324,170,387 95,785,363 228,385,024 29.5 94,301,538 242.2 2009 287,581,772 100,747,785 186,833,987 35.0 94,824,789 197.0
Financial Section
Required Supplementary Schedules
Highway Patrol Retirement System 37
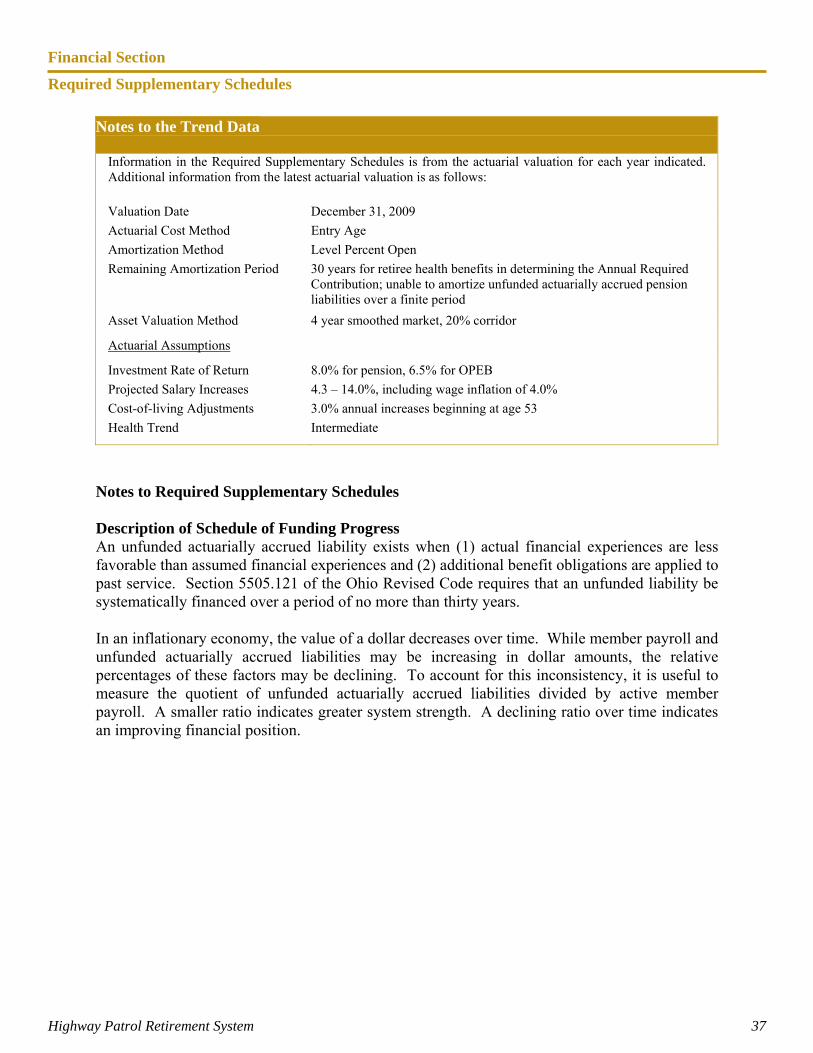
Notes to Required Supplementary Schedules Description of Schedule of Funding Progress An unfunded actuarially accrued liability exists when (1) actual financial experiences are less favorable than assumed financial experiences and (2) additional benefit obligations are applied to past service. Section 5505.121 of the Ohio Revised Code requires that an unfunded liability be systematically financed over a period of no more than thirty years. In an inflationary economy, the value of a dollar decreases over time. While member payroll and unfunded actuarially accrued liabilities may be increasing in dollar amounts, the relative percentages of these factors may be declining. To account for this inconsistency, it is useful to measure the quotient of unfunded actuarially accrued liabilities divided by active member payroll. A smaller ratio indicates greater system strength. A declining ratio over time indicates an improving financial position.
Notes to the Trend Data
Information in the Required Supplementary Schedules is from the actuarial valuation for each year indicated. Additional information from the latest actuarial valuation is as follows:
Valuation Date December 31, 2009
Actuarial Cost Method Entry Age
Amortization Method Level Percent Open
Remaining Amortization Period 30 years for retiree health benefits in determining the Annual Required Contribution; unable to amortize unfunded actuarially accrued pension liabilities over a finite period
Asset Valuation Method 4 year smoothed market, 20% corridor
Actuarial Assumptions
Investment Rate of Return 8.0% for pension, 6.5% for OPEB
Projected Salary Increases 4.3 – 14.0%, including wage inflation of 4.0%
Cost-of-living Adjustments 3.0% annual increases beginning at age 53
Health Trend Intermediate
Financial Section
Supplementary Information
Highway Patrol Retirement System 38
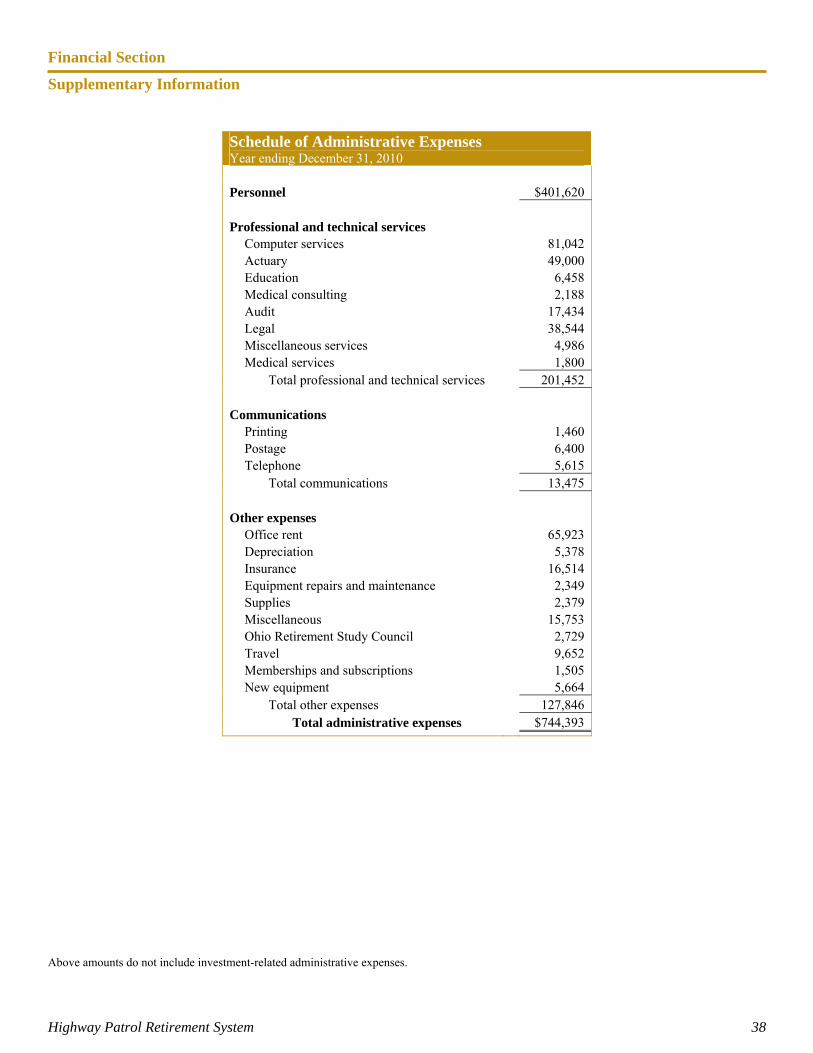
Above amounts do not include investment-related administrative expenses.
Schedule of Administrative Expenses Year ending December 31, 2010 Personnel $401,620 Professional and technical services
Computer services 81,042 Actuary 49,000 Education 6,458 Medical consulting 2,188 Audit 17,434 Legal 38,544 Miscellaneous services 4,986 Medical services 1,800
Total professional and technical services 201,452 Communications
Printing 1,460 Postage 6,400 Telephone 5,615
Total communications 13,475 Other expenses
Office rent 65,923 Depreciation 5,378 Insurance 16,514 Equipment repairs and maintenance 2,349 Supplies 2,379 Miscellaneous 15,753 Ohio Retirement Study Council 2,729 Travel 9,652 Memberships and subscriptions 1,505 New equipment 5,664
Total other expenses 127,846 Total administrative expenses $744,393
Financial Section
Supplementary Information
Highway Patrol Retirement System 39
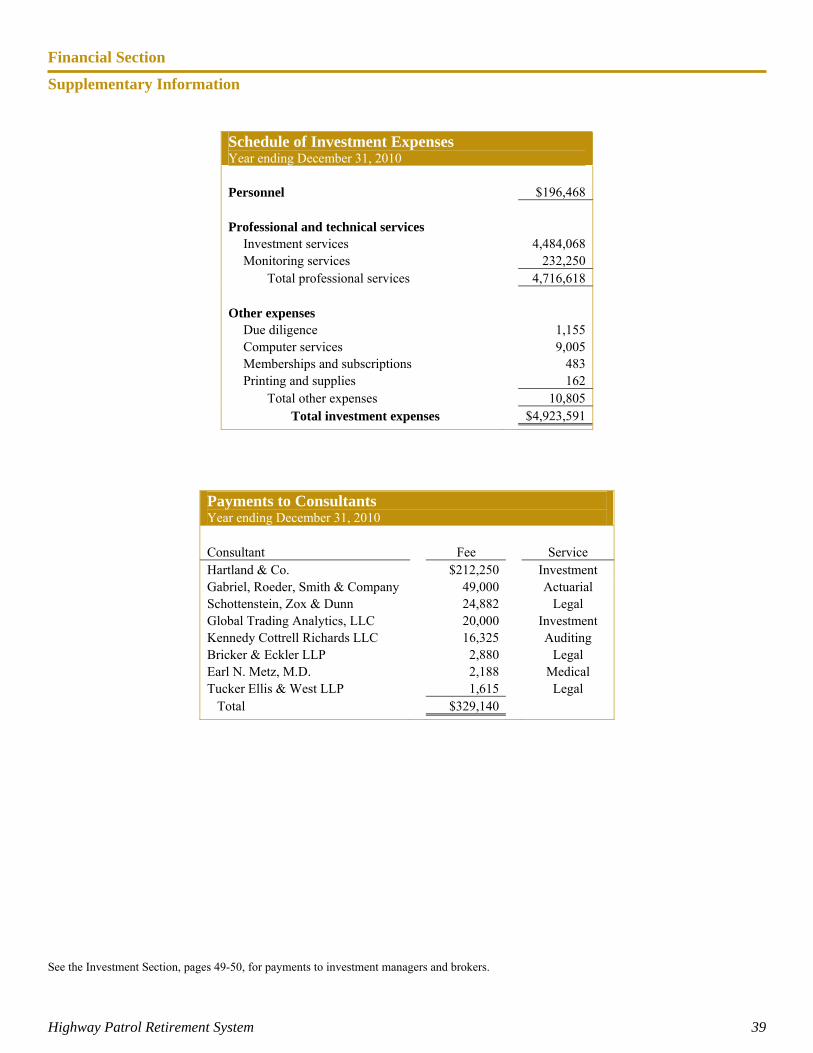
See the Investment Section, pages 49-50, for payments to investment managers and brokers.
Schedule of Investment Expenses Year ending December 31, 2010 Personnel $196,468 Professional and technical services
Investment services 4,484,068 Monitoring services 232,250
Total professional services 4,716,618 Other expenses
Due diligence 1,155 Computer services 9,005 Memberships and subscriptions 483 Printing and supplies 162
Total other expenses 10,805 Total investment expenses $4,923,591
Payments to Consultants Year ending December 31, 2010 Consultant Fee Service Hartland & Co. $212,250 Investment Gabriel, Roeder, Smith & Company 49,000 Actuarial Schottenstein, Zox & Dunn 24,882 Legal Global Trading Analytics, LLC 20,000 Investment Kennedy Cottrell Richards LLC 16,325 Auditing Bricker & Eckler LLP 2,880 Legal Earl N. Metz, M.D. 2,188 Medical Tucker Ellis & West LLP 1,615 Legal Total $329,140
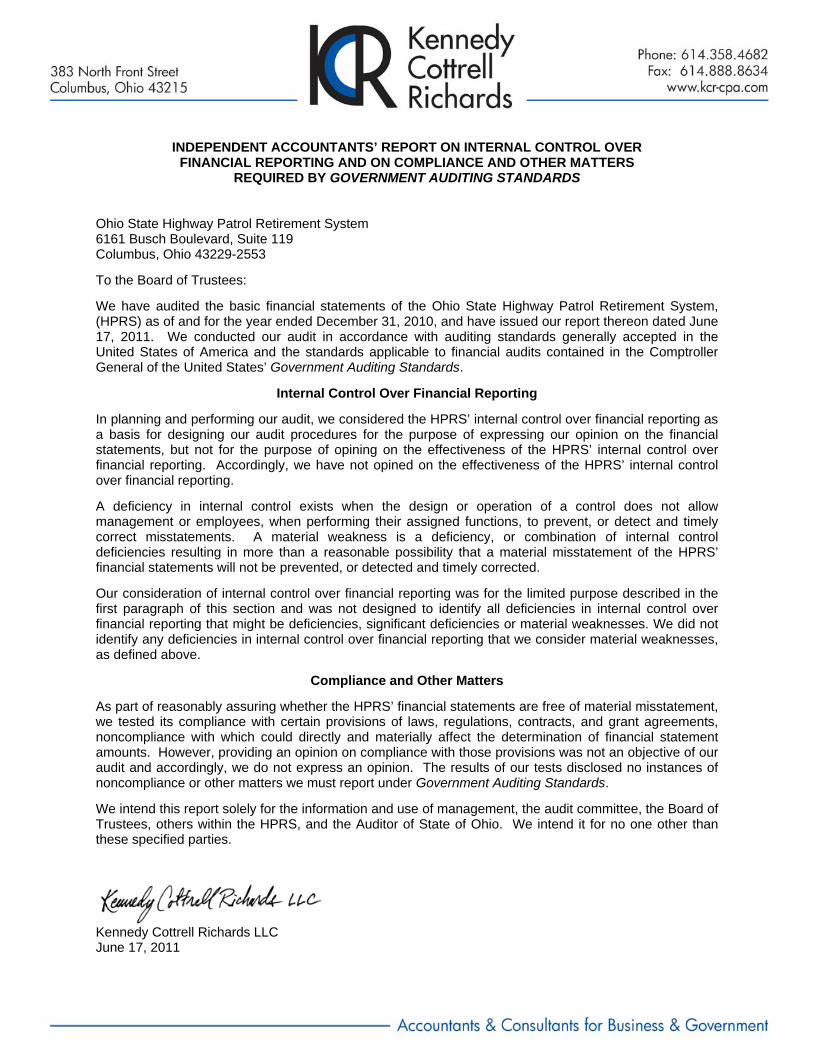
INDEPENDENT ACCOUNTANTS’ REPORT ON INTERNAL CONTROL OVER FINANCIAL REPORTING AND ON COMPLIANCE AND OTHER MATTERS
REQUIRED BY GOVERNMENT AUDITING STANDARDS Ohio State Highway Patrol Retirement System 6161 Busch Boulevard, Suite 119 Columbus, Ohio 43229-2553
To the Board of Trustees:
We have audited the basic financial statements of the Ohio State Highway Patrol Retirement System, (HPRS) as of and for the year ended December 31, 2010, and have issued our report thereon dated June 17, 2011. We conducted our audit in accordance with auditing standards generally accepted in the United States of America and the standards applicable to financial audits contained in the Comptroller General of the United States’ Government Auditing Standards.
Internal Control Over Financial Reporting
In planning and performing our audit, we considered the HPRS’ internal control over financial reporting as a basis for designing our audit procedures for the purpose of expressing our opinion on the financial statements, but not for the purpose of opining on the effectiveness of the HPRS’ internal control over financial reporting. Accordingly, we have not opined on the effectiveness of the HPRS’ internal control over financial reporting.
A deficiency in internal control exists when the design or operation of a control does not allow management or employees, when performing their assigned functions, to prevent, or detect and timely correct misstatements. A material weakness is a deficiency, or combination of internal control deficiencies resulting in more than a reasonable possibility that a material misstatement of the HPRS’ financial statements will not be prevented, or detected and timely corrected.
Our consideration of internal control over financial reporting was for the limited purpose described in the first paragraph of this section and was not designed to identify all deficiencies in internal control over financial reporting that might be deficiencies, significant deficiencies or material weaknesses. We did not identify any deficiencies in internal control over financial reporting that we consider material weaknesses, as defined above.
Compliance and Other Matters
As part of reasonably assuring whether the HPRS’ financial statements are free of material misstatement, we tested its compliance with certain provisions of laws, regulations, contracts, and grant agreements, noncompliance with which could directly and materially affect the determination of financial statement amounts. However, providing an opinion on compliance with those provisions was not an objective of our audit and accordingly, we do not express an opinion. The results of our tests disclosed no instances of noncompliance or other matters we must report under Government Auditing Standards.
We intend this report solely for the information and use of management, the audit committee, the Board of Trustees, others within the HPRS, and the Auditor of State of Ohio. We intend it for no one other than these specified parties.
Kennedy Cottrell Richards LLC June 17, 2011

IInnvveessttmmeenntt SSeeccttiioonn
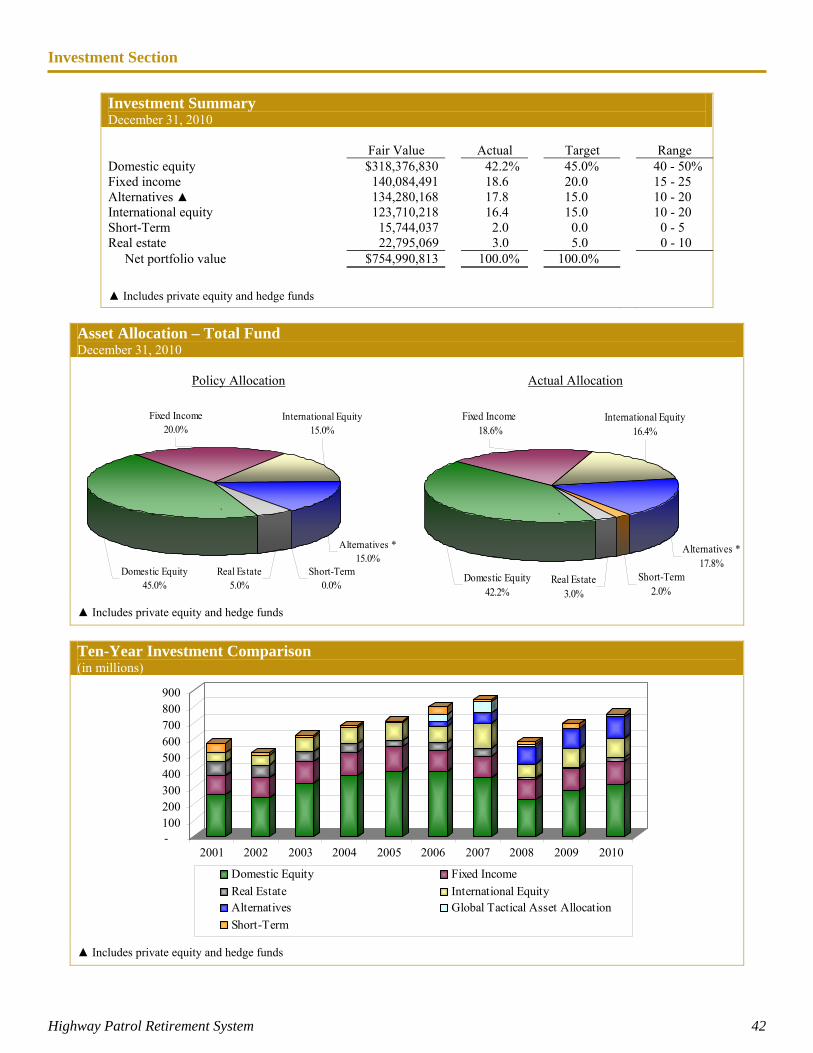
Investment Section
Highway Patrol Retirement System 42
Investment Summary December 31, 2010
Fair Value Actual Target Range
Domestic equity $318,376,830 42.2% 45.0% 40 - 50% Fixed income 140,084,491 18.6 20.0 15 - 25 Alternatives ▲ 134,280,168 17.8 15.0 10 - 20 International equity 123,710,218 16.4 15.0 10 - 20 Short-Term 15,744,037 2.0 0.0 0 - 5 Real estate 22,795,069 3.0 5.0 0 - 10 Net portfolio value $754,990,813 100.0% 100.0%
▲ Includes private equity and hedge funds
Asset Allocation – Total Fund December 31, 2010
Policy Allocation
Fixed Income20.0%
Domestic Equity45.0%
Real Estate5.0%
Short-Term0.0%
International Equity15.0%
Alternatives *15.0%
`
Actual Allocation
Alternatives *17.8%
International Equity16.4%
Short-Term2.0%
Real Estate3.0%
Domestic Equity42.2%
Fixed Income 18.6%
`
▲ Includes private equity and hedge funds
Ten-Year Investment Comparison (in millions)
-100200300400500600700800900
2001 2002 2003 2004 2005 2006 2007 2008 2009 2010
Domestic Equity Fixed Income
Real Estate International EquityAlternatives Global Tactical Asset Allocation
Short-Term
▲ Includes private equity and hedge funds
Investment Section
Report on Investment Activity
Highway Patrol Retirement System 43
General Market & Economic Conditions The capital markets continued through on the positive movements that started in March of 2009 to post strong gains across just about every investment category in 2010. This is not to say that the year was a smooth ride to prosperity. After posting a gain of 26% in 2009, the markets took a breather in January and contracted slightly. The strong positive read for Q4-09 GDP of 5.6% was well received by the markets in February and March to end the first quarter up about 5.4% for the S&P 500. Also contributing to the positive sentiment in the markets for the first quarter was the commentary from the Fed that they see rates staying “exceptionally low” for an “extended period of time.” The markets took this as a signal to load up on risk-assets. GDP continued to be positive for all four quarters of 2010. The expanding economy was evidence enough for the National Bureau of Economic Research to declare that the recession that began in December 2007 had officially ended in June 2009 – though it took them until September 2010 to make that determination. Despite improvements in the economic output, there was still a large number of jobless as the unemployment number was above 9.0% for all of 2010. Having stabilized the banking industry and the auto industry in 2008 - 2009, Washington focused its attention on housing in 2010. The home buyer tax credit that started in 2009 was extended through June 2010. As was the case with Cash for Clunkers, the incentive successfully accelerated sales activity and provided a lift in prices while it lasted. And when it went away it left a lack of buyers and falling prices. Home prices dropped in every month after June 2010 to levels below those prior to the tax credits. Speaking of the banking and auto industries, the taxpayers got a bit of repayment in 2010 as $234 billion of the $389 billion TARP distributions were repaid by year end. In November, GM was able to reward the taxpayer investment through its $23 billion IPO, the largest IPO in history. Washington was also busy with marquee legislation as the “Health Care Reform Act” was signed into law in March and the “Dodd Frank Wall Street Reform and Consumer Protection Act” was approved in July. By the time the ink was dry on the new legislation, the mood of the electorate had shifted and Democrats suffered a net loss of 63 House seats – enough to cost them their majority. Given the new power dynamic, the soon-to-expire tax cuts were extended two more years in December, which caused a boost in the markets. On the one hand, certain market forces were indicating a need for stimulative action in the form of entitlements, tax cuts and transfer payments as a means of helping the economy transition from recession to expansion. On the other hand, there were those who pointed out that only through the adoption of austerity measures can a country meet its current and future obligations. Nowhere was this conflict more pronounced than in the PIIGS (Portugal, Italy, Ireland, Greece and Spain), where the countries’ sovereign debts were being sold over a fear of default. This situation posed a fear of contagion as most of the sovereign debt of these countries was owned by other members of the European Union.
Investment Section
Report on Investment Activity
Highway Patrol Retirement System 44
Newspaper ink was spilled by the barrel on the subject of whether one of the PIIGS would default and whether the euro, the common currency of the eurozone, would survive. While this was unfolding, equity markets around the world were contracting as fear of double-dip recession was looking more probable every day. The impact on the U.S. was a peak-to-trough decline on the S&P 500 from March to June of 15%, which many consider to be a signal of a recession. While this was playing out, leaders from the PIIGS countries were introducing their own austerity programs that called for such measures as later retirement dates, longer work weeks, and higher fees paid by students. These proposals were met with such violent opposition that not only was there significant property damage across many European capitals, but there were also a number of fatalities. By the end of June, the IMF and Germany had structured a $145 billion bailout that would stabilize the sovereign debt concerns and signal a vote of confidence in the euro and eurozone alliance. The markets responded favorably to this and bid up much of what had been sold off. Back on our shores, so to speak, was a major oil spill in the Gulf after the April explosion of the BP Deepwater Horizon drilling platform. Much of Q2 and Q3 was spent trying to determine how much oil was spilled, how to cap the pipe, and how to clean the affected areas. This was a major hit to parties involved like BP, Haliburton, and Transocean, but also had impact on many oil servicers. By the time the summer ended, drilling had all but ceased throughout the Gulf region. With a bit less supply on the world market, oil prices increased 15% in 2010. That was a modest increase compared to the rise in other commodities like gold (+31%) and corn (+39%). As if there were not enough challenges facing the markets, the “Flash-Crash” in May had everyone’s head spinning. Though never really explained, the 1,000 point drop in the Dow Jones Industrial Average was eerily reminiscent of the downward moves of September 2008. In August, Fed Chairman Ben Bernanke laid out the details for the next round of quantitative easing (QE2) designed to boost asset values. The $700 billion of purchases prompted investors to bid up everything they could, resulting in the best September for the S&P 500 since 1939 (8.9%). By the end of December, all domestic equity styles were up 15-30% for the year. Expectations of the impact of QE2 on treasuries caused their prices to rise and rates to fall. Interest rates had dropped to 2.5% for the 10-Year U.S. Treasury. Corporations took advantage of high investor demand and low interest rates by issuing large amounts of debt. The bonds of certain companies were trading at lower rates than treasuries -- a negative spread -- indicating that investors were more comfortable holding corporate bonds than U.S. government bonds.
Source: Hartland & Co.
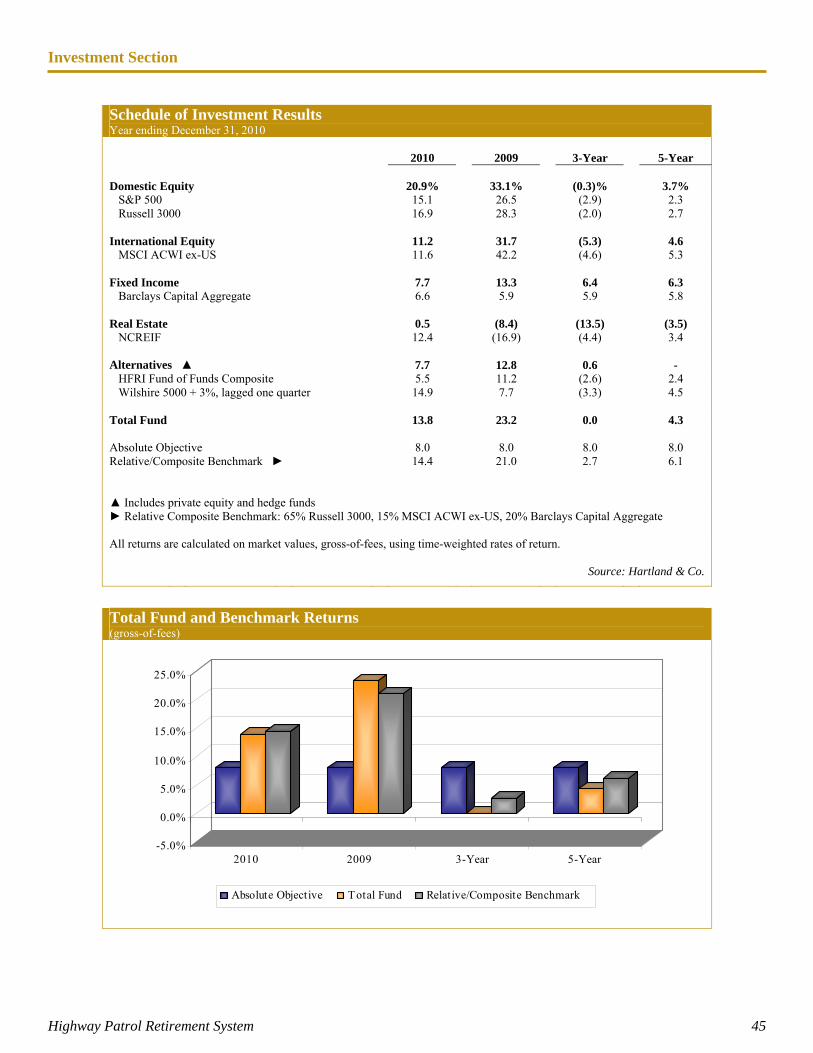
Investment Section
Highway Patrol Retirement System 45
Schedule of Investment Results Year ending December 31, 2010
2010
2009
3-Year
5-Year
Domestic Equity 20.9% 33.1% (0.3)% 3.7% S&P 500 15.1 26.5 (2.9) 2.3 Russell 3000 16.9 28.3 (2.0) 2.7 International Equity 11.2 31.7 (5.3) 4.6 MSCI ACWI ex-US 11.6 42.2 (4.6) 5.3 Fixed Income 7.7 13.3 6.4 6.3 Barclays Capital Aggregate 6.6 5.9 5.9 5.8 Real Estate 0.5 (8.4) (13.5) (3.5) NCREIF 12.4 (16.9) (4.4) 3.4 Alternatives ▲ 7.7 12.8 0.6 - HFRI Fund of Funds Composite 5.5 11.2 (2.6) 2.4 Wilshire 5000 + 3%, lagged one quarter 14.9 7.7 (3.3) 4.5 Total Fund 13.8 23.2 0.0 4.3 Absolute Objective 8.0 8.0 8.0 8.0 Relative/Composite Benchmark ► 14.4 21.0 2.7 6.1 ▲ Includes private equity and hedge funds ► Relative Composite Benchmark: 65% Russell 3000, 15% MSCI ACWI ex-US, 20% Barclays Capital Aggregate All returns are calculated on market values, gross-of-fees, using time-weighted rates of return. Source: Hartland & Co.
Total Fund and Benchmark Returns (gross-of-fees) Schedule of Investment Results
-5.0%
0.0%
5.0%
10.0%
15.0%
20.0%
25.0%
2010 2009 3-Year 5-Year
Absolute Objective Total Fund Relative/Composite Benchmark
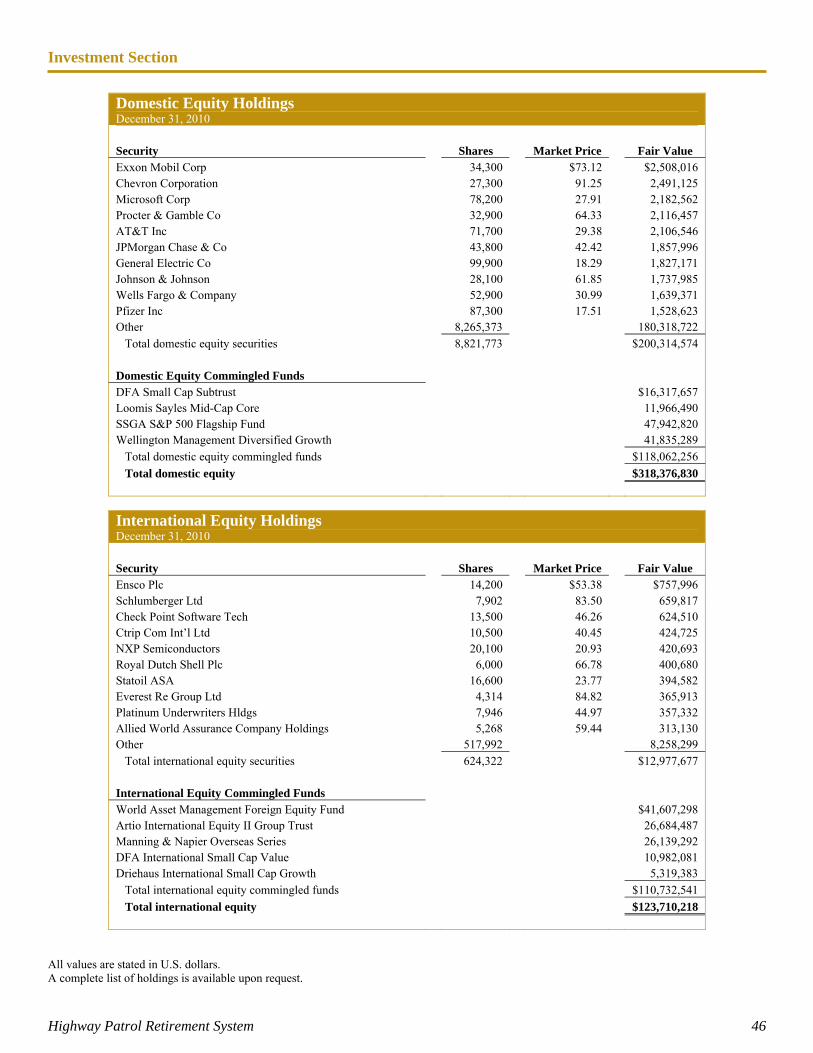
Investment Section
Highway Patrol Retirement System 46
Domestic Equity Holdings December 31, 2010 Security Shares Market Price Fair Value Exxon Mobil Corp 34,300 $73.12 $2,508,016 Chevron Corporation 27,300 91.25 2,491,125 Microsoft Corp 78,200 27.91 2,182,562 Procter & Gamble Co 32,900 64.33 2,116,457 AT&T Inc 71,700 29.38 2,106,546 JPMorgan Chase & Co 43,800 42.42 1,857,996 General Electric Co 99,900 18.29 1,827,171 Johnson & Johnson 28,100 61.85 1,737,985 Wells Fargo & Company 52,900 30.99 1,639,371 Pfizer Inc 87,300 17.51 1,528,623 Other 8,265,373 180,318,722
Total domestic equity securities 8,821,773 $200,314,574 Domestic Equity Commingled Funds
DFA Small Cap Subtrust $16,317,657 Loomis Sayles Mid-Cap Core 11,966,490 SSGA S&P 500 Flagship Fund 47,942,820 Wellington Management Diversified Growth 41,835,289
Total domestic equity commingled funds $118,062,256
Total domestic equity $318,376,830
International Equity Holdings December 31, 2010 Security Shares Market Price Fair Value Ensco Plc 14,200 $53.38 $757,996 Schlumberger Ltd 7,902 83.50 659,817 Check Point Software Tech 13,500 46.26 624,510 Ctrip Com Int’l Ltd 10,500 40.45 424,725 NXP Semiconductors 20,100 20.93 420,693 Royal Dutch Shell Plc 6,000 66.78 400,680 Statoil ASA 16,600 23.77 394,582 Everest Re Group Ltd 4,314 84.82 365,913 Platinum Underwriters Hldgs 7,946 44.97 357,332 Allied World Assurance Company Holdings 5,268 59.44 313,130 Other 517,992 8,258,299
Total international equity securities 624,322 $12,977,677 International Equity Commingled Funds
World Asset Management Foreign Equity Fund $41,607,298 Artio International Equity II Group Trust 26,684,487 Manning & Napier Overseas Series 26,139,292 DFA International Small Cap Value 10,982,081 Driehaus International Small Cap Growth 5,319,383
Total international equity commingled funds $110,732,541
Total international equity $123,710,218
All values are stated in U.S. dollars. A complete list of holdings is available upon request.
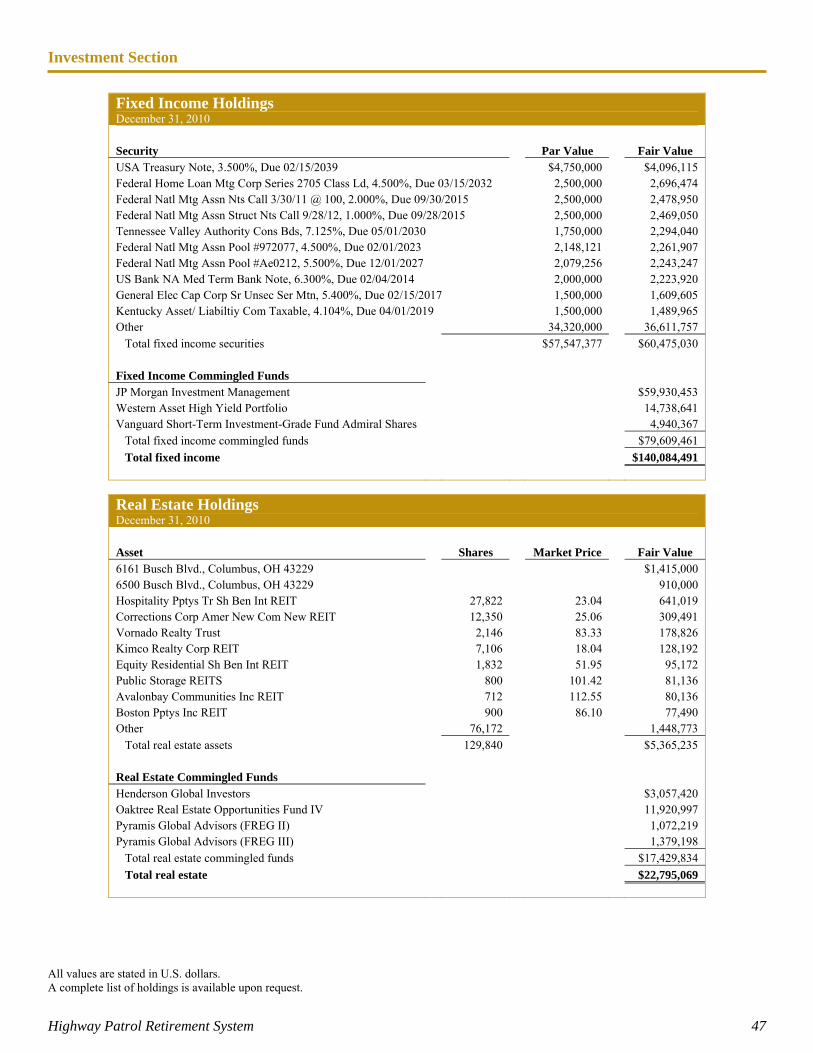
Investment Section
Highway Patrol Retirement System 47
Fixed Income Holdings December 31, 2010 Security Par Value Fair Value USA Treasury Note, 3.500%, Due 02/15/2039 $4,750,000 $4,096,115 Federal Home Loan Mtg Corp Series 2705 Class Ld, 4.500%, Due 03/15/2032 2,500,000 2,696,474 Federal Natl Mtg Assn Nts Call 3/30/11 @ 100, 2.000%, Due 09/30/2015 2,500,000 2,478,950 Federal Natl Mtg Assn Struct Nts Call 9/28/12, 1.000%, Due 09/28/2015 2,500,000 2,469,050 Tennessee Valley Authority Cons Bds, 7.125%, Due 05/01/2030 1,750,000 2,294,040 Federal Natl Mtg Assn Pool #972077, 4.500%, Due 02/01/2023 2,148,121 2,261,907 Federal Natl Mtg Assn Pool #Ae0212, 5.500%, Due 12/01/2027 2,079,256 2,243,247 US Bank NA Med Term Bank Note, 6.300%, Due 02/04/2014 2,000,000 2,223,920 General Elec Cap Corp Sr Unsec Ser Mtn, 5.400%, Due 02/15/2017 1,500,000 1,609,605 Kentucky Asset/ Liabiltiy Com Taxable, 4.104%, Due 04/01/2019 1,500,000 1,489,965 Other 34,320,000 36,611,757
Total fixed income securities $57,547,377 $60,475,030 Fixed Income Commingled Funds
JP Morgan Investment Management $59,930,453 Western Asset High Yield Portfolio 14,738,641 Vanguard Short-Term Investment-Grade Fund Admiral Shares 4,940,367
Total fixed income commingled funds $79,609,461
Total fixed income $140,084,491
Real Estate Holdings December 31, 2010 Asset Shares Market Price Fair Value 6161 Busch Blvd., Columbus, OH 43229 $1,415,000 6500 Busch Blvd., Columbus, OH 43229 910,000 Hospitality Pptys Tr Sh Ben Int REIT 27,822 23.04 641,019 Corrections Corp Amer New Com New REIT 12,350 25.06 309,491 Vornado Realty Trust 2,146 83.33 178,826 Kimco Realty Corp REIT 7,106 18.04 128,192 Equity Residential Sh Ben Int REIT 1,832 51.95 95,172 Public Storage REITS 800 101.42 81,136 Avalonbay Communities Inc REIT 712 112.55 80,136 Boston Pptys Inc REIT 900 86.10 77,490 Other 76,172 1,448,773
Total real estate assets 129,840 $5,365,235 Real Estate Commingled Funds
Henderson Global Investors $3,057,420 Oaktree Real Estate Opportunities Fund IV 11,920,997 Pyramis Global Advisors (FREG II) 1,072,219 Pyramis Global Advisors (FREG III) 1,379,198
Total real estate commingled funds $17,429,834
Total real estate $22,795,069
All values are stated in U.S. dollars. A complete list of holdings is available upon request.
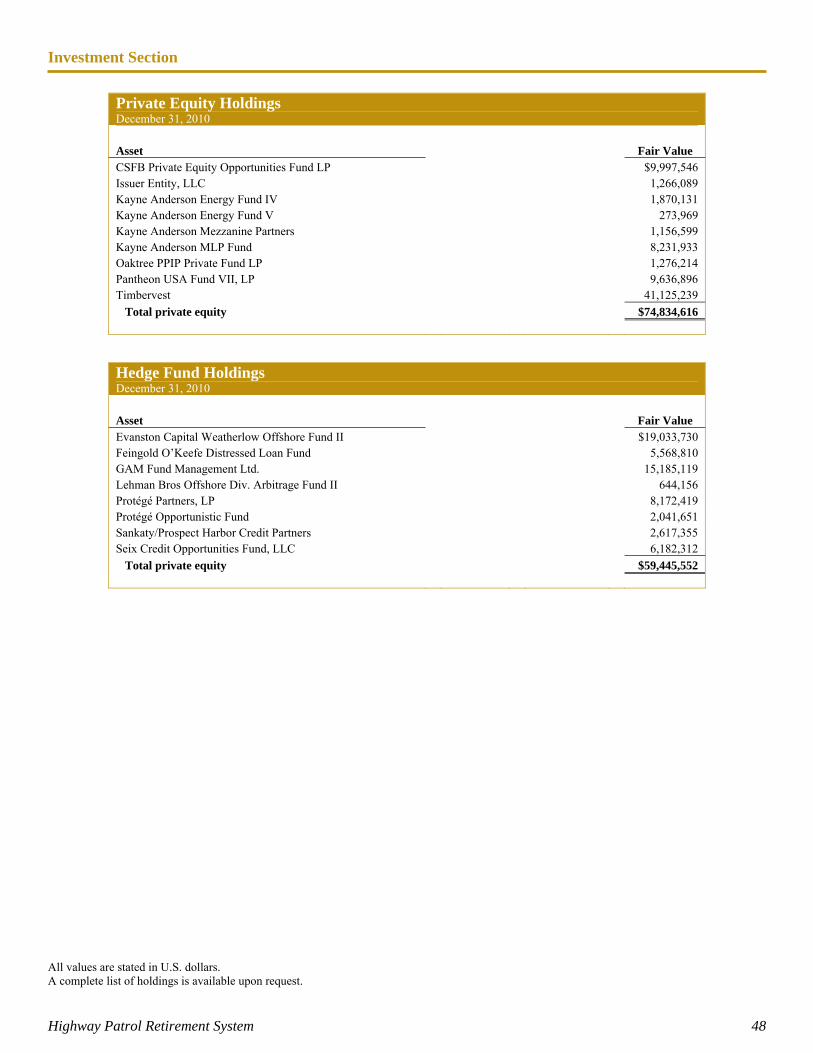
Investment Section
Highway Patrol Retirement System 48
Private Equity Holdings December 31, 2010 Asset Fair Value CSFB Private Equity Opportunities Fund LP $9,997,546 Issuer Entity, LLC 1,266,089 Kayne Anderson Energy Fund IV 1,870,131 Kayne Anderson Energy Fund V 273,969 Kayne Anderson Mezzanine Partners 1,156,599 Kayne Anderson MLP Fund 8,231,933 Oaktree PPIP Private Fund LP 1,276,214 Pantheon USA Fund VII, LP 9,636,896 Timbervest 41,125,239
Total private equity $74,834,616
Hedge Fund Holdings December 31, 2010 Asset Fair Value Evanston Capital Weatherlow Offshore Fund II $19,033,730 Feingold O’Keefe Distressed Loan Fund 5,568,810 GAM Fund Management Ltd. 15,185,119 Lehman Bros Offshore Div. Arbitrage Fund II 644,156 Protégé Partners, LP 8,172,419 Protégé Opportunistic Fund 2,041,651 Sankaty/Prospect Harbor Credit Partners 2,617,355 Seix Credit Opportunities Fund, LLC 6,182,312
Total private equity $59,445,552
All values are stated in U.S. dollars. A complete list of holdings is available upon request.
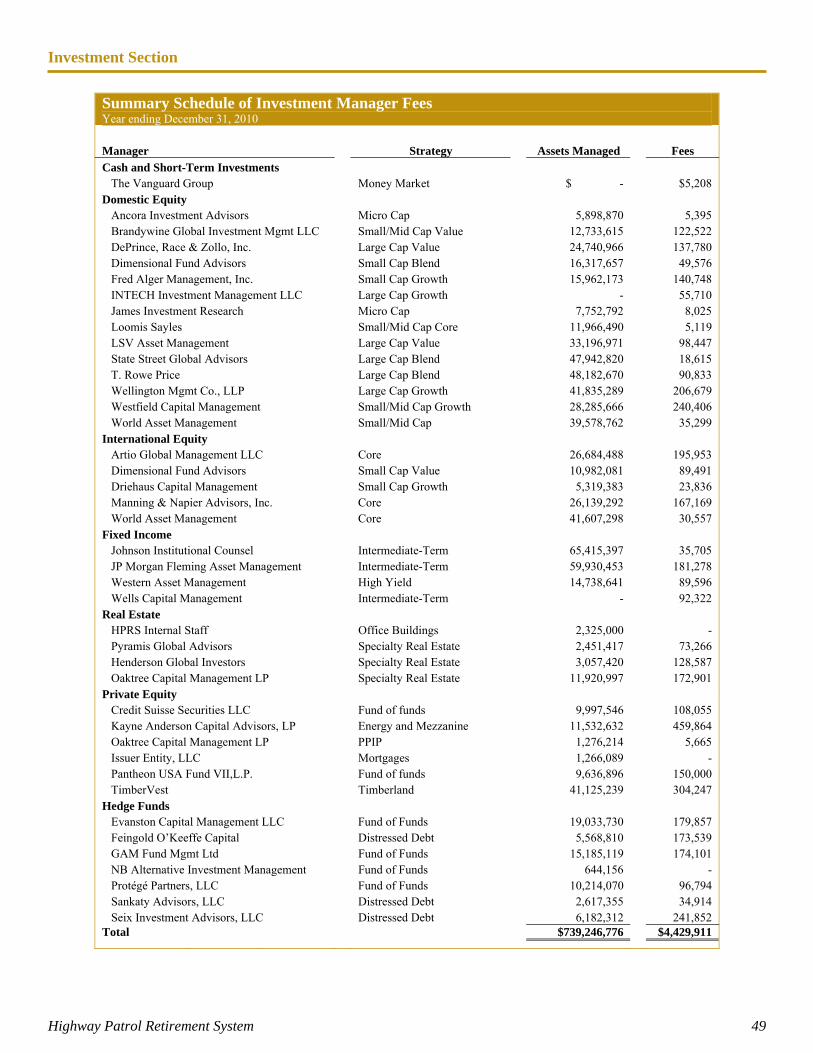
Investment Section
Highway Patrol Retirement System 49
Summary Schedule of Investment Manager Fees Year ending December 31, 2010 Manager Strategy Assets Managed Fees
Cash and Short-Term Investments The Vanguard Group Money Market $ - $5,208 Domestic Equity Ancora Investment Advisors Micro Cap 5,898,870 5,395 Brandywine Global Investment Mgmt LLC Small/Mid Cap Value 12,733,615 122,522 DePrince, Race & Zollo, Inc. Large Cap Value 24,740,966 137,780 Dimensional Fund Advisors Small Cap Blend 16,317,657 49,576 Fred Alger Management, Inc. Small Cap Growth 15,962,173 140,748 INTECH Investment Management LLC Large Cap Growth - 55,710 James Investment Research Micro Cap 7,752,792 8,025 Loomis Sayles Small/Mid Cap Core 11,966,490 5,119 LSV Asset Management Large Cap Value 33,196,971 98,447 State Street Global Advisors Large Cap Blend 47,942,820 18,615 T. Rowe Price Large Cap Blend 48,182,670 90,833 Wellington Mgmt Co., LLP Large Cap Growth 41,835,289 206,679 Westfield Capital Management Small/Mid Cap Growth 28,285,666 240,406 World Asset Management Small/Mid Cap 39,578,762 35,299 International Equity Artio Global Management LLC Core 26,684,488 195,953 Dimensional Fund Advisors Small Cap Value 10,982,081 89,491 Driehaus Capital Management Small Cap Growth 5,319,383 23,836 Manning & Napier Advisors, Inc. Core 26,139,292 167,169 World Asset Management Core 41,607,298 30,557 Fixed Income Johnson Institutional Counsel Intermediate-Term 65,415,397 35,705 JP Morgan Fleming Asset Management Intermediate-Term 59,930,453 181,278 Western Asset Management High Yield 14,738,641 89,596 Wells Capital Management Intermediate-Term - 92,322 Real Estate HPRS Internal Staff Office Buildings 2,325,000 - Pyramis Global Advisors Specialty Real Estate 2,451,417 73,266 Henderson Global Investors Specialty Real Estate 3,057,420 128,587 Oaktree Capital Management LP Specialty Real Estate 11,920,997 172,901 Private Equity Credit Suisse Securities LLC Fund of funds 9,997,546 108,055 Kayne Anderson Capital Advisors, LP Energy and Mezzanine 11,532,632 459,864 Oaktree Capital Management LP PPIP 1,276,214 5,665 Issuer Entity, LLC Mortgages 1,266,089 - Pantheon USA Fund VII,L.P. Fund of funds 9,636,896 150,000 TimberVest Timberland 41,125,239 304,247 Hedge Funds Evanston Capital Management LLC Fund of Funds 19,033,730 179,857 Feingold O’Keeffe Capital Distressed Debt 5,568,810 173,539 GAM Fund Mgmt Ltd Fund of Funds 15,185,119 174,101 NB Alternative Investment Management Fund of Funds 644,156 - Protégé Partners, LLC Fund of Funds 10,214,070 96,794 Sankaty Advisors, LLC Distressed Debt 2,617,355 34,914 Seix Investment Advisors, LLC Distressed Debt 6,182,312 241,852 Total $739,246,776 $4,429,911
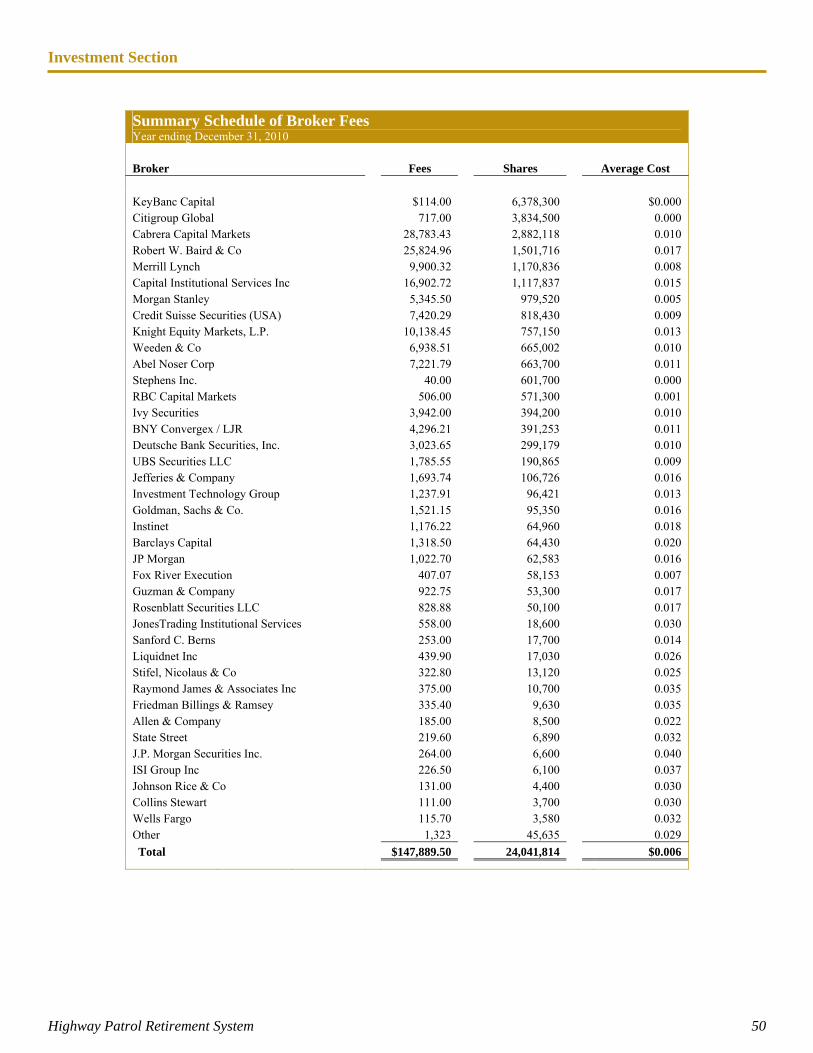
Investment Section
Highway Patrol Retirement System 50
Summary Schedule of Broker Fees Year ending December 31, 2010 Broker Fees Shares Average Cost
KeyBanc Capital $114.00 6,378,300 $0.000 Citigroup Global 717.00 3,834,500 0.000 Cabrera Capital Markets 28,783.43 2,882,118 0.010 Robert W. Baird & Co 25,824.96 1,501,716 0.017 Merrill Lynch 9,900.32 1,170,836 0.008 Capital Institutional Services Inc 16,902.72 1,117,837 0.015 Morgan Stanley 5,345.50 979,520 0.005 Credit Suisse Securities (USA) 7,420.29 818,430 0.009 Knight Equity Markets, L.P. 10,138.45 757,150 0.013 Weeden & Co 6,938.51 665,002 0.010 Abel Noser Corp 7,221.79 663,700 0.011 Stephens Inc. 40.00 601,700 0.000 RBC Capital Markets 506.00 571,300 0.001 Ivy Securities 3,942.00 394,200 0.010 BNY Convergex / LJR 4,296.21 391,253 0.011 Deutsche Bank Securities, Inc. 3,023.65 299,179 0.010 UBS Securities LLC 1,785.55 190,865 0.009 Jefferies & Company 1,693.74 106,726 0.016 Investment Technology Group 1,237.91 96,421 0.013 Goldman, Sachs & Co. 1,521.15 95,350 0.016 Instinet 1,176.22 64,960 0.018 Barclays Capital 1,318.50 64,430 0.020 JP Morgan 1,022.70 62,583 0.016 Fox River Execution 407.07 58,153 0.007 Guzman & Company 922.75 53,300 0.017 Rosenblatt Securities LLC 828.88 50,100 0.017 JonesTrading Institutional Services 558.00 18,600 0.030 Sanford C. Berns 253.00 17,700 0.014 Liquidnet Inc 439.90 17,030 0.026 Stifel, Nicolaus & Co 322.80 13,120 0.025 Raymond James & Associates Inc 375.00 10,700 0.035 Friedman Billings & Ramsey 335.40 9,630 0.035 Allen & Company 185.00 8,500 0.022 State Street 219.60 6,890 0.032 J.P. Morgan Securities Inc. 264.00 6,600 0.040 ISI Group Inc 226.50 6,100 0.037 Johnson Rice & Co 131.00 4,400 0.030 Collins Stewart 111.00 3,700 0.030 Wells Fargo 115.70 3,580 0.032 Other 1,323 45,635 0.029
Total $147,889.50 24,041,814 $0.006
Investment Section
Investment Objectives, Policies, and Guidelines
Highway Patrol Retirement System 51
Objectives 1. The purpose of this Investment Policy Statement is to comply with the directive of Ohio
Revised Code Section 5505.06, wherein the Board of Trustees is to adopt public "policies, objectives or criteria for the operation of the investment program." As such, this statement is intended to provide general guidelines within which the Board may take full advantage of its investment authority pursuant to ORC Section 5505.06, while complying with its fiduciary responsibility. This statement is not intended to restrict the Board from consideration of all lawful and legal investment opportunities.
2. The primary objective of the Highway Patrol Retirement System is to provide eligible
members with scheduled pension benefits. Although the fund is not governed by the Employees Retirement Income Security Act of 1974 (ERISA), the basic provisions contained in that Act are recognized and will serve as guidance to the management of this fund. In particular, the prudent person guidelines are to be followed with regard to the investment management of the fund. These guidelines require that the Board and other system fiduciaries exercise the care, skill, prudence, and diligence – under the circumstances then prevailing – that a prudent person acting in a like capacity and familiar with such matters would use in the conduct of an enterprise of a like character with like aims.
3. A secondary objective of the fund is to maintain a sufficient degree of liquidity in order to
meet unanticipated demands and changing environments. 4. Consistent with prudent standards for preservation of capital and maintenance of liquidity,
the goal of the fund is to earn the highest possible rate of return consistent with the fund's tolerance for risk as determined periodically by the Board in its role as a fiduciary. This objective should ensure adequate funds to meet scheduled benefits while maintaining level contributions.
5. In meeting these objectives, the Board will give consideration to investments that enhance
the welfare of the State of Ohio, and Ohio citizens, where such investments offer safety and quality of return comparable to other investments currently available. Equal consideration will be given to investments otherwise qualifying under this section that involve minority-owned and controlled firms, or firms owned and controlled by women, either alone or in joint venture with other firms.
Policies 1. Diversification of assets will ensure that adverse or unexpected results from a security class
will not have a detrimental impact on the entire portfolio. Diversification is interpreted to include diversification by asset type, performance and risk characteristic, number of investments, and by investment style of management organizations.
These guidelines may be implemented through specific directions or instructions to investment managers, and those directions or instructions may contain other more specific restrictions on diversification of assets by percentage holdings, by quality, or other factors.
Investment Section
Investment Objectives, Policies, and Guidelines
Highway Patrol Retirement System 52
2. Asset classes and ranges considered appropriate for investment of fund assets are to be determined by the Board in accordance with these investment guidelines.
3. Assignment of responsibilities for each asset category (components of each asset category)
may be assigned to one or more management firms that may be "specialty" managers (i.e., managing only one type of asset class).
4. The Board shall, at least annually, establish a policy with the goal to increase utilization of
Ohio-qualified investment managers, when an Ohio-qualified investment manager offers quality, services, and safety comparable to other investment managers otherwise available.
5. The Board shall, at least annually, establish a policy with the goal to increase utilization of
Ohio-qualified agents for the execution of domestic equity and fixed income trades on behalf of the retirement system, when an Ohio-qualified agent offers quality, services, and safety comparable to other agents otherwise available.
Investment Guidelines for Specific Asset Classes In order to achieve the return objectives, the fund will employ the following investment strategies:
1. U.S. equities will represent from 40 to 50 percent of the market value of total fund assets with a targeted average of 45 percent. The term "equities" includes common stock, convertible bonds, and convertible stock.
2. Non-U.S. equities will represent from 10 to 20 percent of the market value of total fund
assets with a targeted average of 15 percent.
3. Real estate may represent 0 to 10 percent of total fund assets with a targeted average of 5 percent.
4. U.S. fixed income obligations, including cash, will represent from 15 to 25 percent of the
market value of total fund assets with a targeted average of 20 percent. Intermediate-term bonds may include contractual payments, preferred stocks, and bonds with a maturity date greater than one year and less than or equal to ten years. Long-term bonds have a maturity date greater than ten years.
5. Investments in alternatives will represent from 10 to 20 percent of the market value of
total fund assets with a targeted average of 15 percent. The term “alternatives” includes hedge funds, private equity, and Global Tactical Asset Allocation.
Short-Term Cash equivalent investments may include the following:
Short-Term Maturity Securities U.S. Treasury Bills U.S. Government Repurchase Agreements Money Market Funds
Investment Section
Investment Objectives, Policies, and Guidelines
Highway Patrol Retirement System 53
Commercial Paper Commingled Investment Funds
Fixed Income A core bond allocation will be diversified as to type of security, issuer, coupon, and maturity. Qualifying bonds, at the time of purchase, will be rated as investment-grade by at least two nationally-recognized bond rating services. Generally, the average maturity of a fixed income allocation will be ten years or less, although individual securities may be longer. An alternative bond allocation may invest in (1) high-yield or other non-investment-grade bonds, (2) non-United States bonds, and (3) bonds issued by emerging countries. No more than ten percent of a fixed income allocation will be invested in the securities of any one issuer, and no more than five percent in any one issue, with the exception of U.S. government securities. Diversification of the bond portfolio will be accomplished by investing in a combination of U.S. government bonds, U.S. agency bonds, and domestic corporate bonds. Managers are prohibited from using derivative instruments. Equities Qualifying equities will be listed on an established stock market and be readily marketable. They may be held in separate or commingled accounts. At least 67% of the value of a large cap domestic mandate will be invested in securities with a market capitalization of more than $5 billion. At least 67% of the value of a small/mid cap domestic mandate will be invested in securities with a market capitalization of more than $500 million. At least 50% of the value of an international mandate (excluding small cap) will be invested in securities with a market capitalization of more than $1 billion. Each equity manager will diversify the portfolio in an attempt to minimize the impact of substantial losses in any specific industry or issuer. An equity manager may not --
hold more than 10% of the account value in a single issuer where a sector is greater than 10% of the benchmark, allow that sector to exceed the
lesser of 40% or 1.5 times the sector weighting of the relative benchmark where a sector is 10% or less of the benchmark, allow that sector to exceed the greater of
20% or 2.5 times the sector weighting of the relative benchmark invest in international-domiciled securities exceeding 10% of portfolio value in a
domestic mandate allow one country to be more than 15% above the country weighting of the relative
benchmark in an international mandate invest in emerging markets exceeding 25% of portfolio value in an international mandate.
Investment Section
Investment Objectives, Policies, and Guidelines
Highway Patrol Retirement System 54
Equity managers are prohibited from investing in the following:
Private placements Unregistered or restricted stock Derivatives Margin Trading/Short Sales Commodities Real Estate Property (excluding REITs) Guaranteed Insurance Contracts Securities issued by Highway Patrol Retirement System or its affiliates.
Real Estate The fund may invest in improved or unimproved real property, mortgage collective investment funds (Real Estate Investment Trusts or Real Estate Funds), notes secured by real property, mortgage-backed bonds, and pass-through securities backed by mortgages. The real estate portfolio will be constructed and managed to –
provide sufficient diversity to protect against adverse conditions in any single market sector,
provide diversity among geographical locations, property types, and property sizes, provide relatively stable returns consistent with the overall U.S. commercial real estate
market, provide a strong current income stream with the potential for long-term principal growth, primarily contain fully developed, fully leased properties, and minimize the use of debt financing.
Alternatives The fund may invest in alternatives with individual fund managers or with fund of funds managers. Performance Comparative performance measurement of the total fund and its components will be conducted at least quarterly. Each large cap equity manager is expected to exceed benchmark performance by 100 bps annually over rolling three and five year periods, net-of-fees, and rank in the upper 40 percentile relative to peers. Each small/mid cap equity and international manager is expected to exceed benchmark performance by 150 bps annually over rolling three and five year periods, net-of-fees, and rank in the upper 40 percentile relative to peers. All other managers are expected to exceed benchmark performance over rolling three and five year periods, net-of-fees, and rank in the upper 40 percentile relative to peers. The broad benchmarks for each type of manager, subject to revision, are as follows:
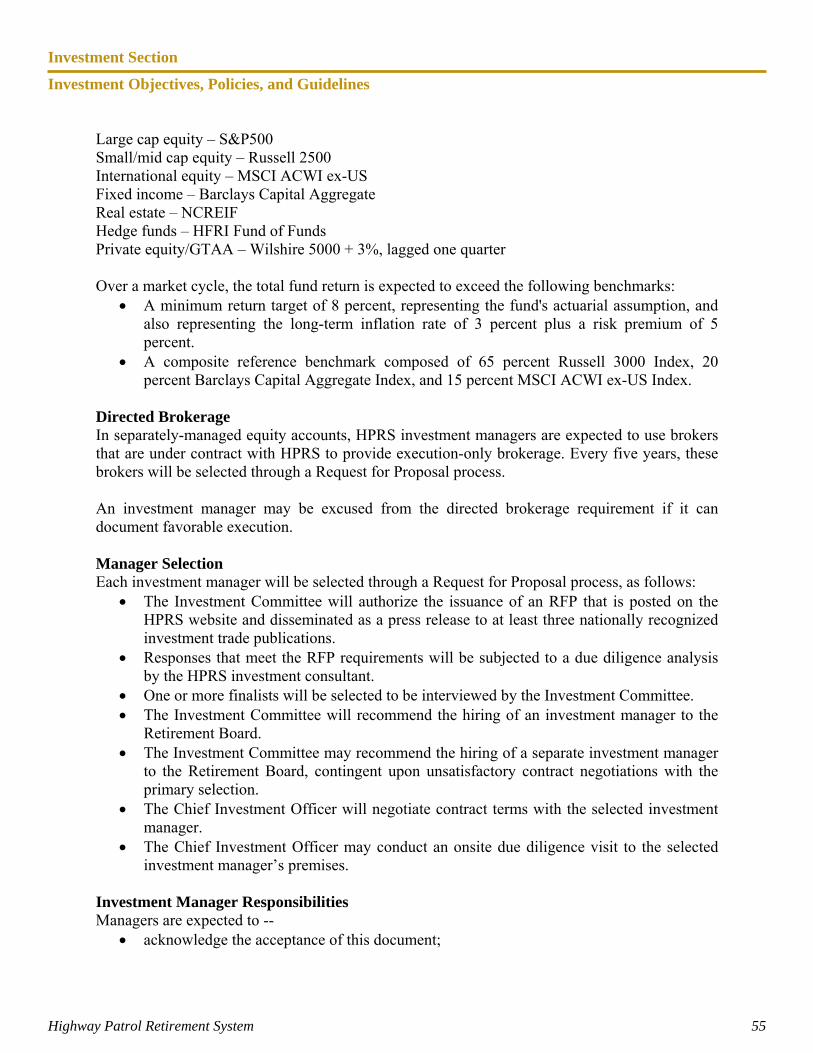
Investment Section
Investment Objectives, Policies, and Guidelines
Highway Patrol Retirement System 55
Large cap equity – S&P500 Small/mid cap equity – Russell 2500 International equity – MSCI ACWI ex-US Fixed income – Barclays Capital Aggregate Real estate – NCREIF Hedge funds – HFRI Fund of Funds Private equity/GTAA – Wilshire 5000 + 3%, lagged one quarter Over a market cycle, the total fund return is expected to exceed the following benchmarks:
A minimum return target of 8 percent, representing the fund's actuarial assumption, and also representing the long-term inflation rate of 3 percent plus a risk premium of 5 percent.
A composite reference benchmark composed of 65 percent Russell 3000 Index, 20 percent Barclays Capital Aggregate Index, and 15 percent MSCI ACWI ex-US Index.
Directed Brokerage In separately-managed equity accounts, HPRS investment managers are expected to use brokers that are under contract with HPRS to provide execution-only brokerage. Every five years, these brokers will be selected through a Request for Proposal process. An investment manager may be excused from the directed brokerage requirement if it can document favorable execution. Manager Selection Each investment manager will be selected through a Request for Proposal process, as follows:
The Investment Committee will authorize the issuance of an RFP that is posted on the HPRS website and disseminated as a press release to at least three nationally recognized investment trade publications.
Responses that meet the RFP requirements will be subjected to a due diligence analysis by the HPRS investment consultant.
One or more finalists will be selected to be interviewed by the Investment Committee. The Investment Committee will recommend the hiring of an investment manager to the
Retirement Board. The Investment Committee may recommend the hiring of a separate investment manager
to the Retirement Board, contingent upon unsatisfactory contract negotiations with the primary selection.
The Chief Investment Officer will negotiate contract terms with the selected investment manager.
The Chief Investment Officer may conduct an onsite due diligence visit to the selected investment manager’s premises.
Investment Manager Responsibilities Managers are expected to --
acknowledge the acceptance of this document;
Investment Section
Investment Objectives, Policies, and Guidelines
Highway Patrol Retirement System 56
hold and maintain errors and omissions insurance and provide proof of this insurance annually
meet with the Board, when requested, to review investment activity and results provide performance measurement data, explanation, and other communication as
required by the investment consultant provide frequent communication with HPRS and the investment consultant on all
significant matters pertaining to the investment of assets promptly notify HPRS and the investment consultant of any significant changes in the
manager’s investment strategy, organizational structure, financial condition, or personnel assigned to manage HPRS assets.
Board Responsibilities The role of the Board is supervisory, and discretion is delegated to investment managers who must adhere to the general guidelines established by the Board. The primary role of the Board is to –
establish performance goals, identify and review appropriate investment policy and guidelines, retain outside investment and actuarial counsel, and review the results of the fund on a regular basis and implement necessary changes in the
investment policies, objectives, asset allocation, and investment managers as needed.
Annual Review In light of rapid changes in the capital markets and in investment management techniques, these guidelines will be reviewed by the Board on an annual basis. Changes and exceptions to these guidelines may be made at any time with the approval of the Board. Revised, August 26, 2010 Revised, April 22, 2010 Revised, February 25, 2010 Revised, April 23, 2009 Revised, October 25, 2007 Revised, June 16, 2005 Revised, June 26, 2003 Revised, November 15, 2001 Revised, June 22, 1999 Revised, March 13, 1997 Adopted and approved, September 7, 1994 Revised, June 29, 1994 Revised, September 5, 1990 Revised, June 1, 1988 Adopted and approved, June 11, 1986

AAccttuuaarriiaall SSeeccttiioonn
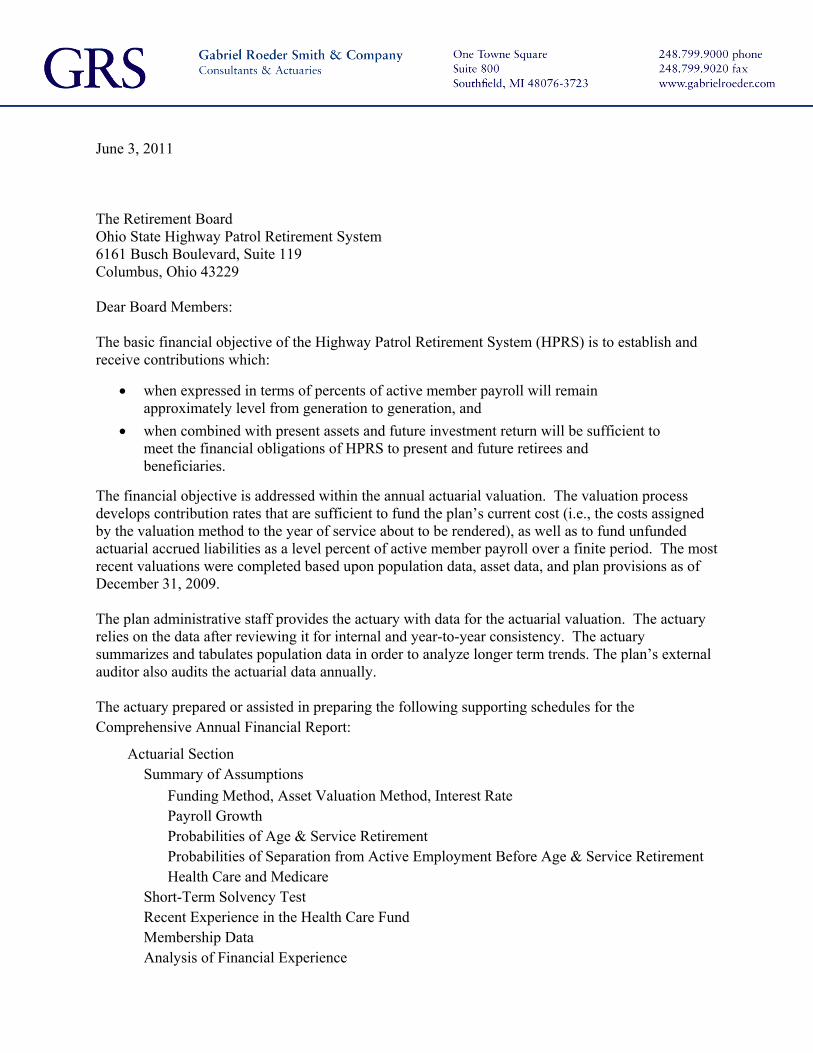
June 3, 2011 The Retirement Board Ohio State Highway Patrol Retirement System 6161 Busch Boulevard, Suite 119 Columbus, Ohio 43229 Dear Board Members: The basic financial objective of the Highway Patrol Retirement System (HPRS) is to establish and receive contributions which:
when expressed in terms of percents of active member payroll will remain approximately level from generation to generation, and
when combined with present assets and future investment return will be sufficient to meet the financial obligations of HPRS to present and future retirees and beneficiaries.
The financial objective is addressed within the annual actuarial valuation. The valuation process develops contribution rates that are sufficient to fund the plan’s current cost (i.e., the costs assigned by the valuation method to the year of service about to be rendered), as well as to fund unfunded actuarial accrued liabilities as a level percent of active member payroll over a finite period. The most recent valuations were completed based upon population data, asset data, and plan provisions as of December 31, 2009. The plan administrative staff provides the actuary with data for the actuarial valuation. The actuary relies on the data after reviewing it for internal and year-to-year consistency. The actuary summarizes and tabulates population data in order to analyze longer term trends. The plan’s external auditor also audits the actuarial data annually. The actuary prepared or assisted in preparing the following supporting schedules for the Comprehensive Annual Financial Report:
Actuarial Section Summary of Assumptions
Funding Method, Asset Valuation Method, Interest Rate Payroll Growth Probabilities of Age & Service Retirement Probabilities of Separation from Active Employment Before Age & Service Retirement Health Care and Medicare Short-Term Solvency Test Recent Experience in the Health Care Fund Membership Data Analysis of Financial Experience
The Retirement Board June 3, 2011 Page 3
Supplementary Schedules Schedule of Funding Progress Schedule of Employer Contributions
Notes to Trend Data Assets are valued on a market related basis that recognizes each year’s difference between actual and assumed investment return over a closed four-year period, subject to an 80% to 120% corridor on market value. The actuarial value of assets is 104% of the market value of assets as of December 31, 2009. Actuarial valuations are based upon assumptions regarding future activity in specific risk areas including the rates of investment return and payroll growth, eligibility for the various classes of benefits, and longevity among retired lives. These assumptions are adopted by the Board after considering the advice of the actuary and other professionals. The assumptions and the methods comply with the requirements of Statements No. 25 and No. 43 of the Governmental Accounting Standards Board. Each actuarial valuation takes into account all prior differences between actual and assumed experience in each risk area and adjusts the contribution rates as needed. The assumptions used in the December 31, 2009 valuation were based upon a study of experience during the years 2000 through 2004. Investment return on a market value basis during 2009 was greater than assumed, which helped to partially offset the losses experienced during calendar year 2008. Given the present contribution rate allocation between the pension program and the retiree health plan, the pension program unfunded actuarial accrued liability cannot be amortized. In addition, the retiree health plan continues to be cause for concern. Based upon the present contribution rate allocation, the plan is expected to remain solvent until 2026. Available resources need to be brought in line with projected benefit payouts before that time if the plan is to continue to provide benefits similar to those currently provided. Based upon the results of the December 31, 2009 valuations, we recommend that the Board continue to investigate ways of restoring financial balance to the pension program. Continued cost containment efforts can have a positive effect on the retiree health plan, but we believe that additional contribution income is needed. Respectfully submitted, Brian B. Murphy, FSA, MAAA Mita D. Drazilov, ASA, MAAA BBM:MDD:mdd
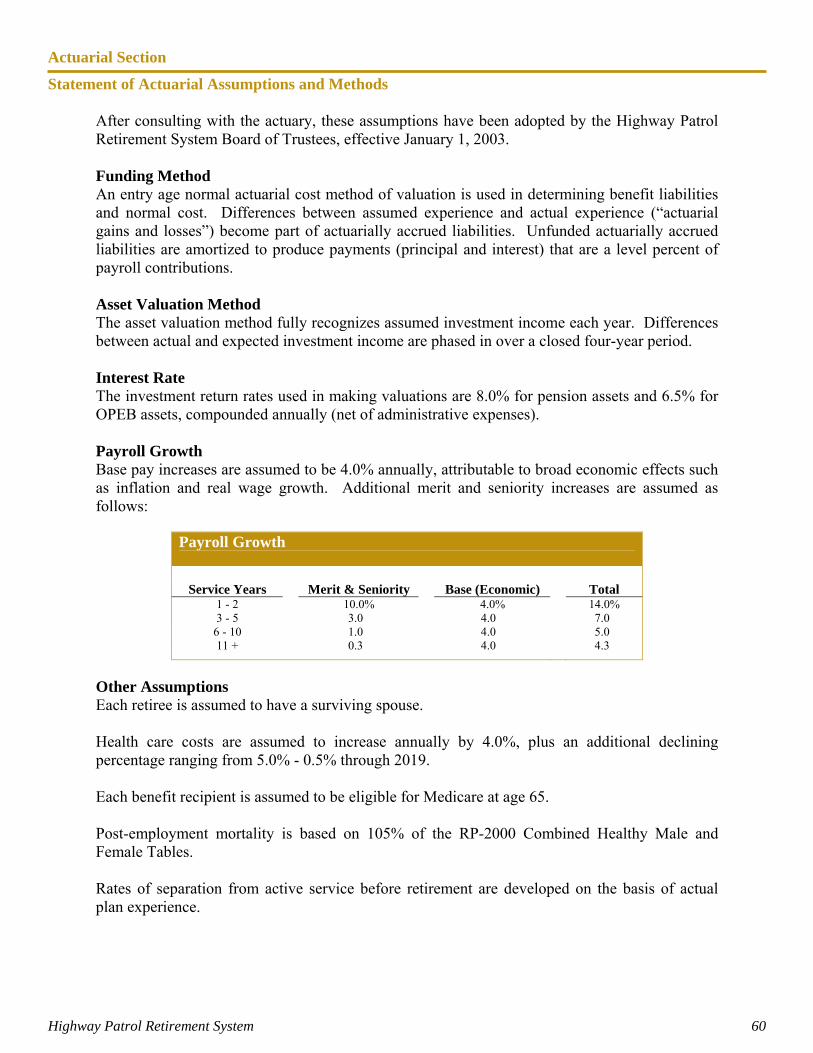
Actuarial Section
Statement of Actuarial Assumptions and Methods
Highway Patrol Retirement System 60
After consulting with the actuary, these assumptions have been adopted by the Highway Patrol Retirement System Board of Trustees, effective January 1, 2003. Funding Method An entry age normal actuarial cost method of valuation is used in determining benefit liabilities and normal cost. Differences between assumed experience and actual experience (“actuarial gains and losses”) become part of actuarially accrued liabilities. Unfunded actuarially accrued liabilities are amortized to produce payments (principal and interest) that are a level percent of payroll contributions. Asset Valuation Method The asset valuation method fully recognizes assumed investment income each year. Differences between actual and expected investment income are phased in over a closed four-year period. Interest Rate The investment return rates used in making valuations are 8.0% for pension assets and 6.5% for OPEB assets, compounded annually (net of administrative expenses). Payroll Growth Base pay increases are assumed to be 4.0% annually, attributable to broad economic effects such as inflation and real wage growth. Additional merit and seniority increases are assumed as follows:
Payroll Growth
Service Years Merit & Seniority Base (Economic) Total
1 - 2 10.0% 4.0% 14.0% 3 - 5 3.0 4.0 7.0
6 - 10 1.0 4.0 5.0 11 + 0.3 4.0 4.3
Other Assumptions Each retiree is assumed to have a surviving spouse. Health care costs are assumed to increase annually by 4.0%, plus an additional declining percentage ranging from 5.0% - 0.5% through 2019. Each benefit recipient is assumed to be eligible for Medicare at age 65. Post-employment mortality is based on 105% of the RP-2000 Combined Healthy Male and Female Tables. Rates of separation from active service before retirement are developed on the basis of actual plan experience.
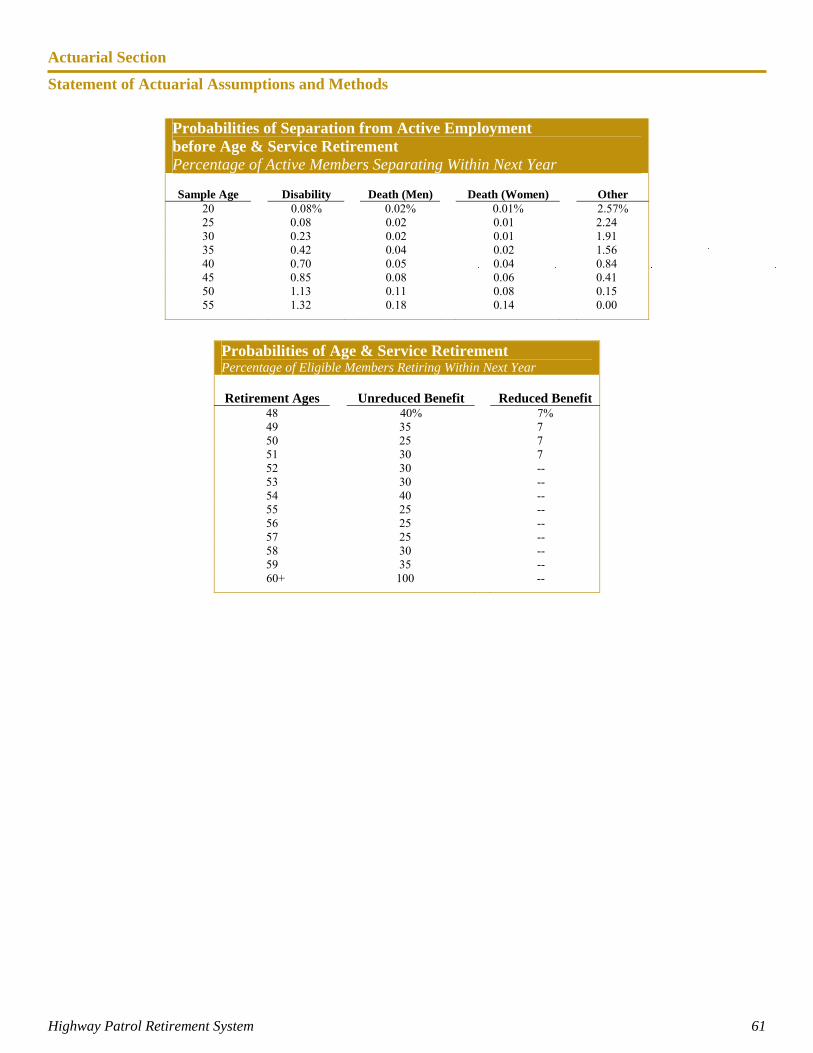
Actuarial Section
Statement of Actuarial Assumptions and Methods
Highway Patrol Retirement System 61
Probabilities of Age & Service Retirement Percentage of Eligible Members Retiring Within Next Year
Retirement Ages Unreduced Benefit Reduced Benefit
48 40% 7% 49 35 7 50 25 7 51 30 7 52 30 -- 53 30 -- 54 40 -- 55 25 -- 56 25 -- 57 25 -- 58 30 -- 59 35 --
60+ 100 --
Probabilities of Separation from Active Employment before Age & Service Retirement Percentage of Active Members Separating Within Next Year
Sample Age
Disability
Death (Men)
Death (Women)
Other
20 0.08% 0.02% 0.01% 2.57% 25 0.08 0.02 0.01 2.24 30 0.23 0.02 0.01 1.91 35 0.42 0.04 0.02 1.56 40 0.70 0.05 0.04 0.84 45 0.85 0.08 0.06 0.41 50 1.13 0.11 0.08 0.15 55 1.32 0.18 0.14 0.00
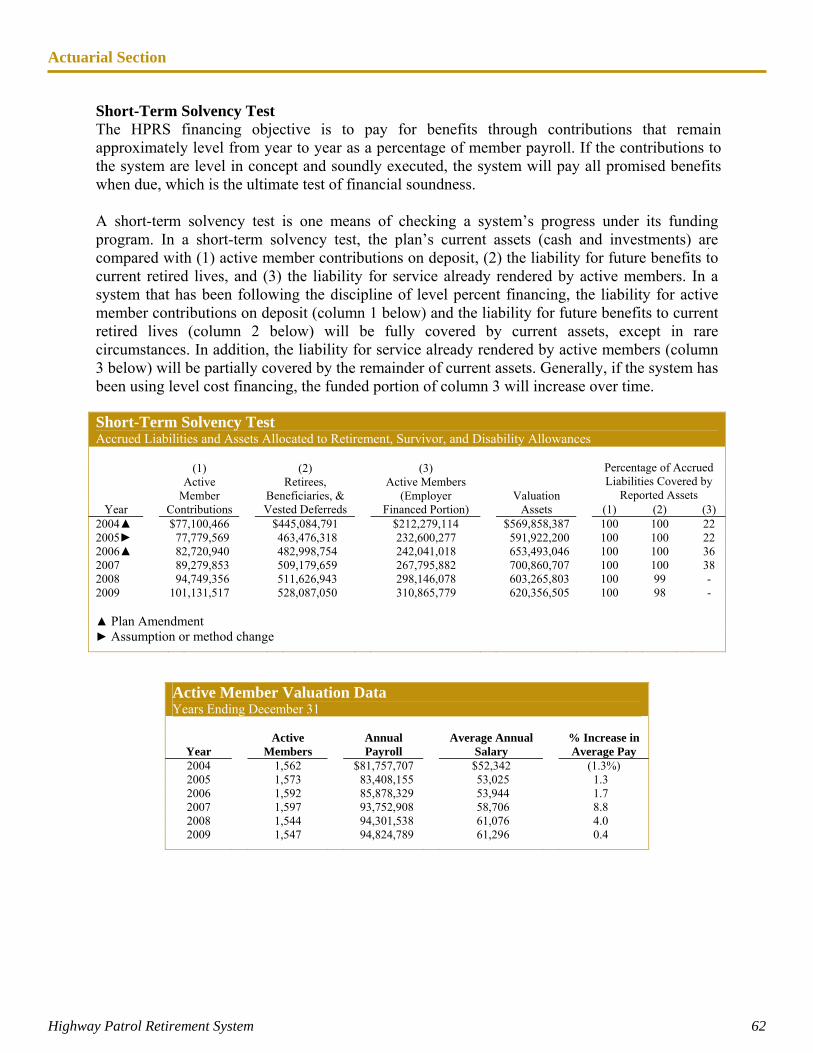
Actuarial Section
Highway Patrol Retirement System 62
Short-Term Solvency Test The HPRS financing objective is to pay for benefits through contributions that remain approximately level from year to year as a percentage of member payroll. If the contributions to the system are level in concept and soundly executed, the system will pay all promised benefits when due, which is the ultimate test of financial soundness. A short-term solvency test is one means of checking a system’s progress under its funding program. In a short-term solvency test, the plan’s current assets (cash and investments) are compared with (1) active member contributions on deposit, (2) the liability for future benefits to current retired lives, and (3) the liability for service already rendered by active members. In a system that has been following the discipline of level percent financing, the liability for active member contributions on deposit (column 1 below) and the liability for future benefits to current retired lives (column 2 below) will be fully covered by current assets, except in rare circumstances. In addition, the liability for service already rendered by active members (column 3 below) will be partially covered by the remainder of current assets. Generally, if the system has been using level cost financing, the funded portion of column 3 will increase over time. Short-Term Solvency Test Accrued Liabilities and Assets Allocated to Retirement, Survivor, and Disability Allowances
Percentage of Accrued Liabilities Covered by
Reported Assets Year
(1) Active
Member Contributions
(2) Retirees,
Beneficiaries, & Vested Deferreds
(3) Active Members
(Employer Financed Portion)
Valuation Assets (1) (2) (3)
2004▲ $77,100,466 $445,084,791 $212,279,114 $569,858,387 100 100 22 2005► 77,779,569 463,476,318 232,600,277 591,922,200 100 100 22 2006▲ 82,720,940 482,998,754 242,041,018 653,493,046 100 100 36 2007 89,279,853 509,179,659 267,795,882 700,860,707 100 100 38 2008 94,749,356 511,626,943 298,146,078 603,265,803 100 99 - 2009 101,131,517 528,087,050 310,865,779 620,356,505 100 98 - ▲ Plan Amendment ► Assumption or method change
Active Member Valuation Data Years Ending December 31
Year Active
Members Annual Payroll
Average Annual Salary
% Increase in Average Pay
2004 1,562 $81,757,707 $52,342 (1.3%) 2005 1,573 83,408,155 53,025 1.3 2006 1,592 85,878,329 53,944 1.7 2007 1,597 93,752,908 58,706 8.8 2008 1,544 94,301,538 61,076 4.0 2009 1,547 94,824,789 61,296 0.4
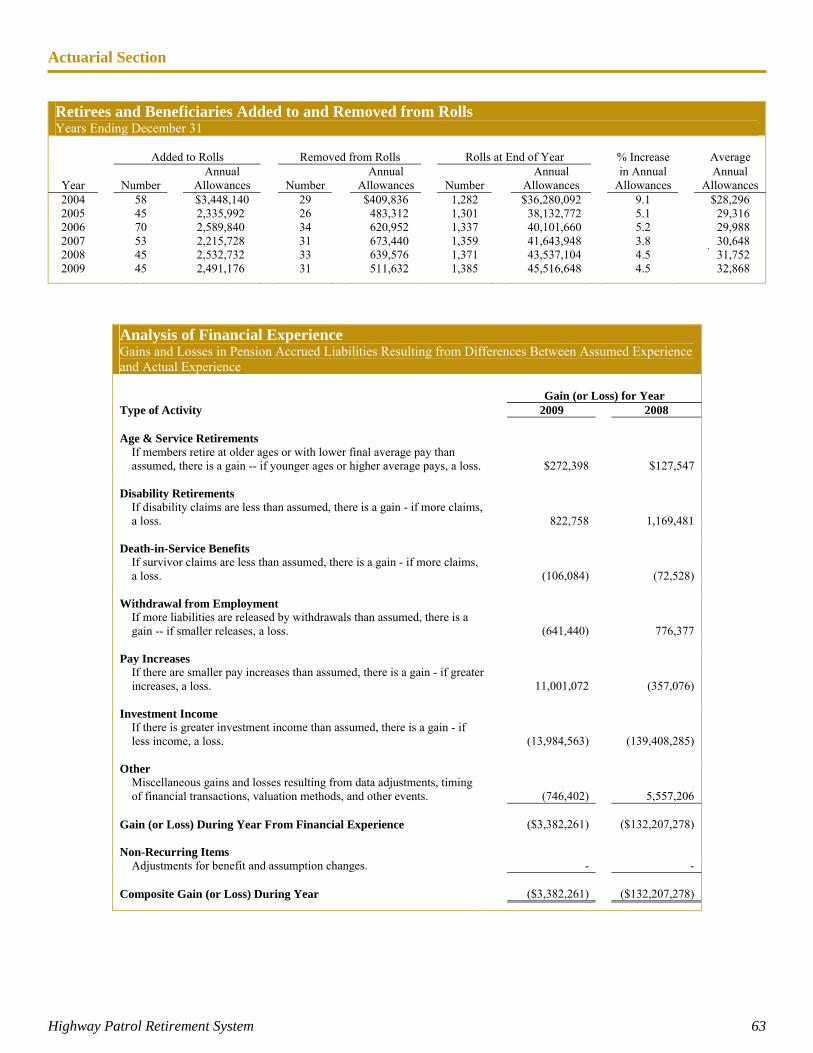
Actuarial Section
Highway Patrol Retirement System 63
Retirees and Beneficiaries Added to and Removed from Rolls Years Ending December 31
Added to Rolls Removed from Rolls Rolls at End of Year % Increase Average
Year Number Annual
Allowances Number Annual
Allowances Number Annual
Allowances in Annual
Allowances Annual
Allowances 2004 58 $3,448,140 29 $409,836 1,282 $36,280,092 9.1 $28,296 2005 45 2,335,992 26 483,312 1,301 38,132,772 5.1 29,316 2006 70 2,589,840 34 620,952 1,337 40,101,660 5.2 29,988 2007 53 2,215,728 31 673,440 1,359 41,643,948 3.8 30,648 2008 45 2,532,732 33 639,576 1,371 43,537,104 4.5 31,752 2009 45 2,491,176 31 511,632 1,385 45,516,648 4.5 32,868
Analysis of Financial Experience Gains and Losses in Pension Accrued Liabilities Resulting from Differences Between Assumed Experience and Actual Experience
Gain (or Loss) for Year
Type of Activity 2009 2008 Age & Service Retirements
If members retire at older ages or with lower final average pay than assumed, there is a gain -- if younger ages or higher average pays, a loss. $272,398 $127,547
Disability Retirements
If disability claims are less than assumed, there is a gain - if more claims, a loss. 822,758 1,169,481
Death-in-Service Benefits
If survivor claims are less than assumed, there is a gain - if more claims, a loss. (106,084) (72,528)
Withdrawal from Employment
If more liabilities are released by withdrawals than assumed, there is a gain -- if smaller releases, a loss. (641,440) 776,377
Pay Increases
If there are smaller pay increases than assumed, there is a gain - if greater increases, a loss. 11,001,072 (357,076)
Investment Income
If there is greater investment income than assumed, there is a gain - if less income, a loss. (13,984,563) (139,408,285)
Other
Miscellaneous gains and losses resulting from data adjustments, timing of financial transactions, valuation methods, and other events. (746,402) 5,557,206
Gain (or Loss) During Year From Financial Experience ($3,382,261) ($132,207,278) Non-Recurring Items
Adjustments for benefit and assumption changes. - - Composite Gain (or Loss) During Year ($3,382,261) ($132,207,278)
Actuarial Section
Summary of Plan Provisions
Highway Patrol Retirement System 64
Purpose In 1941, the Highway Patrol Retirement System (HPRS) was created by the Ohio General Assembly to provide for retirement and survivor benefits for members and dependents. Administration The general administration and management of HPRS are vested in the Highway Patrol Retirement System Board of Trustees under Ohio Revised Code Chapter 5505. The eleven-member Board consists of the Superintendent of the State Highway Patrol, three appointed members, five elected active members, and two elected retired members. The appointed members are investment experts designated by the Governor, the Treasurer of State, and the General Assembly. The active members are elected to four-year terms by members of the plan. Any contributing member is eligible to become an active member candidate, and each contributing member is eligible to vote in the active member election process. Any retiree who is an Ohio resident and who has not served as a statutory or active member of the Board during the past three years is eligible to become a retired member candidate. Each retiree is eligible to vote in the retired member election. The Superintendent of the State Highway Patrol serves by virtue of the office held. The Attorney General of the State of Ohio is the legal advisor to the Board. A chairperson and vice-chairperson are elected by the Board annually. All regular Board meetings are considered to be public meetings. While the Board members serve without compensation, they are not expected to suffer any loss because of absence from regular employment while engaged in official Board duties. In addition, the members of the Board are reimbursed for actual and necessary expenses. Employer Contributions Ohio law requires that the Board certify the employer contribution rate to the Office of Budget and Management in even-numbered years. The employer rate may not be lower than the member rate, nor may it exceed three times the member rate. Member Contributions Each member of HPRS, through payroll deduction, must contribute the legally-established contribution rate as a percentage of salary. Individual member accounts are maintained by HPRS and, upon termination of employment, the amount contributed is refundable in lieu of the payment of a pension benefit. Service Credit Prior to retirement, the following types of additional service credit may be purchased: (1) military service pursuant to the Ohio Revised Code, (2) prior refunded full-time service as a contributing member of the State Highway Patrol Retirement System, the Ohio Police & Fire Pension Fund, the State Teachers Retirement System of Ohio, the School Employees Retirement System of Ohio, the Ohio Public Employees Retirement System, and the Cincinnati Retirement System. Military service and prior refunded full-time service in HPRS and the Ohio Police & Fire Pension Fund may be used to meet the minimum service requirement in order to qualify for unreduced pension
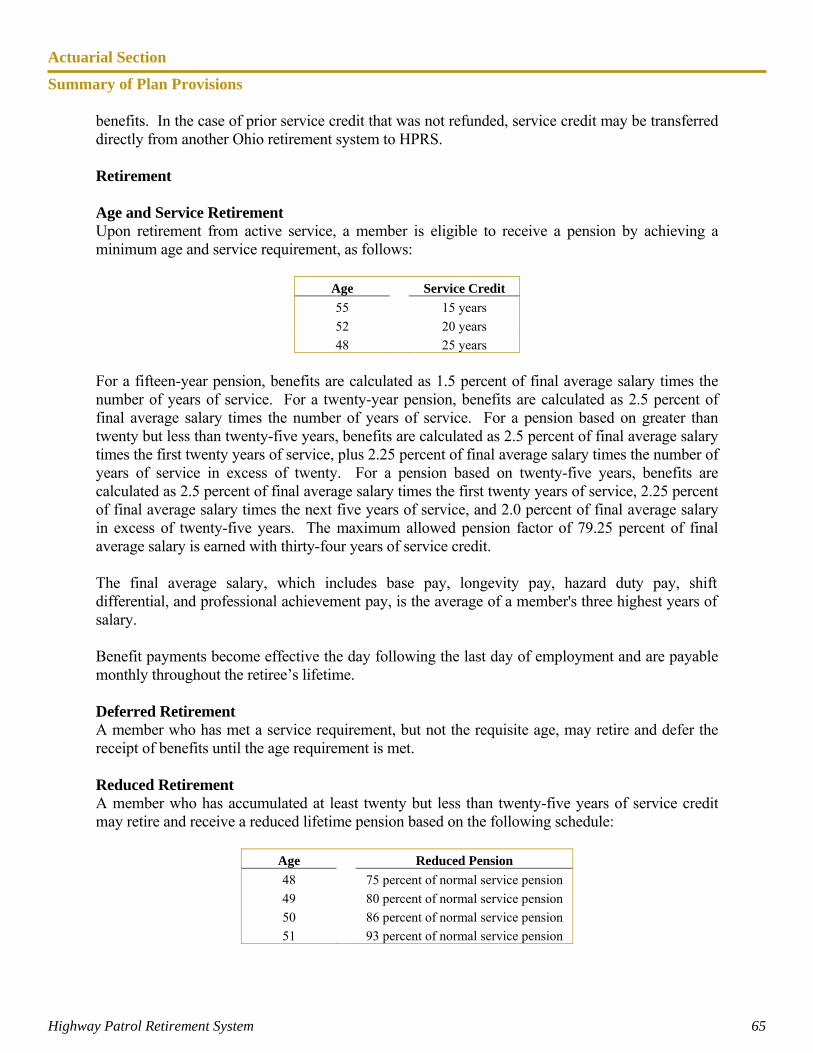
Actuarial Section
Summary of Plan Provisions
Highway Patrol Retirement System 65
benefits. In the case of prior service credit that was not refunded, service credit may be transferred directly from another Ohio retirement system to HPRS. Retirement Age and Service Retirement Upon retirement from active service, a member is eligible to receive a pension by achieving a minimum age and service requirement, as follows:
Age Service Credit
55 15 years
52 20 years
48 25 years For a fifteen-year pension, benefits are calculated as 1.5 percent of final average salary times the number of years of service. For a twenty-year pension, benefits are calculated as 2.5 percent of final average salary times the number of years of service. For a pension based on greater than twenty but less than twenty-five years, benefits are calculated as 2.5 percent of final average salary times the first twenty years of service, plus 2.25 percent of final average salary times the number of years of service in excess of twenty. For a pension based on twenty-five years, benefits are calculated as 2.5 percent of final average salary times the first twenty years of service, 2.25 percent of final average salary times the next five years of service, and 2.0 percent of final average salary in excess of twenty-five years. The maximum allowed pension factor of 79.25 percent of final average salary is earned with thirty-four years of service credit. The final average salary, which includes base pay, longevity pay, hazard duty pay, shift differential, and professional achievement pay, is the average of a member's three highest years of salary. Benefit payments become effective the day following the last day of employment and are payable monthly throughout the retiree’s lifetime. Deferred Retirement A member who has met a service requirement, but not the requisite age, may retire and defer the receipt of benefits until the age requirement is met. Reduced Retirement A member who has accumulated at least twenty but less than twenty-five years of service credit may retire and receive a reduced lifetime pension based on the following schedule:
Age Reduced Pension
48 75 percent of normal service pension
49 80 percent of normal service pension
50 86 percent of normal service pension
51 93 percent of normal service pension
Actuarial Section
Summary of Plan Provisions
Highway Patrol Retirement System 66
The election to receive a reduced pension may not be changed once a retiree has received a benefit payment. Resignation or Discharge With less than twenty years of service credit, a member may not collect a pension if “dishonesty, cowardice, intemperate habits, or conviction of a felony” was the basis for discharge or resignation from the Ohio State Highway Patrol. Disability Retirement A member who retires as the result of a disability that was incurred in the line of duty receives a pension of 61.25 percent of final average salary. A member who retires as the result of a disability that was not incurred in the line of duty receives a pension of 50 percent of final average salary. Deferred Retirement Option Plan (DROP) A member who is eligible to retire with an unreduced pension benefit may enter the DROP. The member will continue to work in the existing assignment as determined by the employer and receive the appropriate compensation for that rank. A DROP member is considered retired; however, instead of receiving a monthly pension benefit, the member begins to accumulate funds in a tax-deferred account. The DROP account is funded by both the monthly pension benefit and the member’s continuing active contributions, as well as interest that accrues on these amounts. A member may participate in DROP until age 60, but for no more than eight years. The minimum participation period is two years for members who enter the DROP at age 52 or more and three years for members who enter the DROP before age 52. A member who terminates employment earlier than the minimum participation period will forfeit any accrued interest. When a DROP member terminates employment with the Ohio State Highway Patrol, the member will begin to receive the monthly pension benefit that had previously been funding the DROP account. In addition, after the minimum participation period, the proceeds of the DROP account will be rolled over into a qualified plan or paid to the member in a lump sum, an annuity, or a combination of these distribution types. Payment Plans Each retirement applicant must select a benefit payment plan. Regardless of the plan selected, a survivor benefit is paid to an eligible survivor of a deceased active member or retiree. The plan options are as follows: Plan 1 - Single Life Annuity This plan pays the highest monthly benefit, calculated as a percentage of final average salary, and is limited to the lifetime of the retiree. A member who receives a disability retirement may only receive a single life annuity. Plan 2 - Joint and Survivor Annuity This plan pays a reduced monthly benefit for a member’s lifetime and provides for a monthly benefit to a surviving beneficiary.
Actuarial Section
Summary of Plan Provisions
Highway Patrol Retirement System 67
Plan 3 - Life Annuity Certain and Continuous This plan is an annuity, payable for a guaranteed minimum period. If a retiree dies before the end of the period, the pension benefit is paid to the designated beneficiary for the remainder of the period. Partial Lump Sum (PLUS) Distribution In addition to selecting one of the three retirement payment plans, a retiree may elect to receive a lump sum cash payment, either as a taxable distribution, or as a rollover to a tax-qualified plan. Following this payment, a retiree will receive a reduced monthly benefit for life. To be eligible for a PLUS distribution, a retiree must have attained age 51 with at least 25 years of total service, or age 52 with at least 20 years of total service. The lump sum amount may not be less than six times the monthly single life pension and not more than sixty times the monthly single life pension. Survivor Benefits A surviving spouse of a deceased retiree, or of an active member who was eligible to receive a retirement pension at the time of death, receives a monthly benefit equal to one-half the deceased member’s monthly pension benefit (minimum, $900). A surviving spouse of an active member who was not eligible for a retirement benefit at the time of death receives a monthly survivor benefit of $900. Each surviving dependent child receives $150 monthly until age 18. If the child is a full-time student, this benefit continues until age 23. Health Care A comprehensive Preferred Provider medical health care plan is currently offered to all benefit recipients and dependents. Benefit recipients may elect to cover spouses and dependent children by authorizing the appropriate premium deduction. Dental and vision coverage is also available to benefit recipients and dependents. The Board, which has the authority to implement changes, annually evaluates the premiums and plan design. Medicare Benefit recipients who submit proof of Medicare Part B coverage are reimbursed for the basic Part B premium, up to a maximum of $96.40 monthly. Cost of Living At age 53 and thereafter, each retiree receives an annual cost of living adjustment (COLA) equal to 3.0%. Each survivor benefit recipient is eligible for a COLA increase after receiving benefits for twelve months. Each disability benefit recipient is eligible for a COLA increase after receiving benefits for sixty months, or at age 53, whichever occurs first. Death After Retirement Upon the death of a retiree, a lump sum payment of $5,000 is paid to the surviving spouse, or to the retiree’s estate if there is no surviving spouse.

SSttaattiissttiiccaall SSeeccttiioonn
Statistical Section
Introduction
Highway Patrol Retirement System 69
The objectives of the statistical section are to provide financial statement users with additional historical perspective, context, and relevant details that will assist in using information in the financial statements, notes to the financial statements, and required supplementary information in order to better understand and assess HPRS’s overall financial condition. The schedules beginning on page 70 show financial trend information that will assist users in understanding and assessing how HPRS’s financial condition has changed over the past ten years. The financial trend schedules presented are --
Changes in Net Assets Benefit Deductions from Net Assets by Type
The schedules beginning on page 71 show demographic and economic information. This information is designed to assist in understanding the environment in which HPRS operates. The demographic and economic information and the operating information presented include --
Principal Participating Employer Retired Members by Type of Benefit Average Benefit Payments
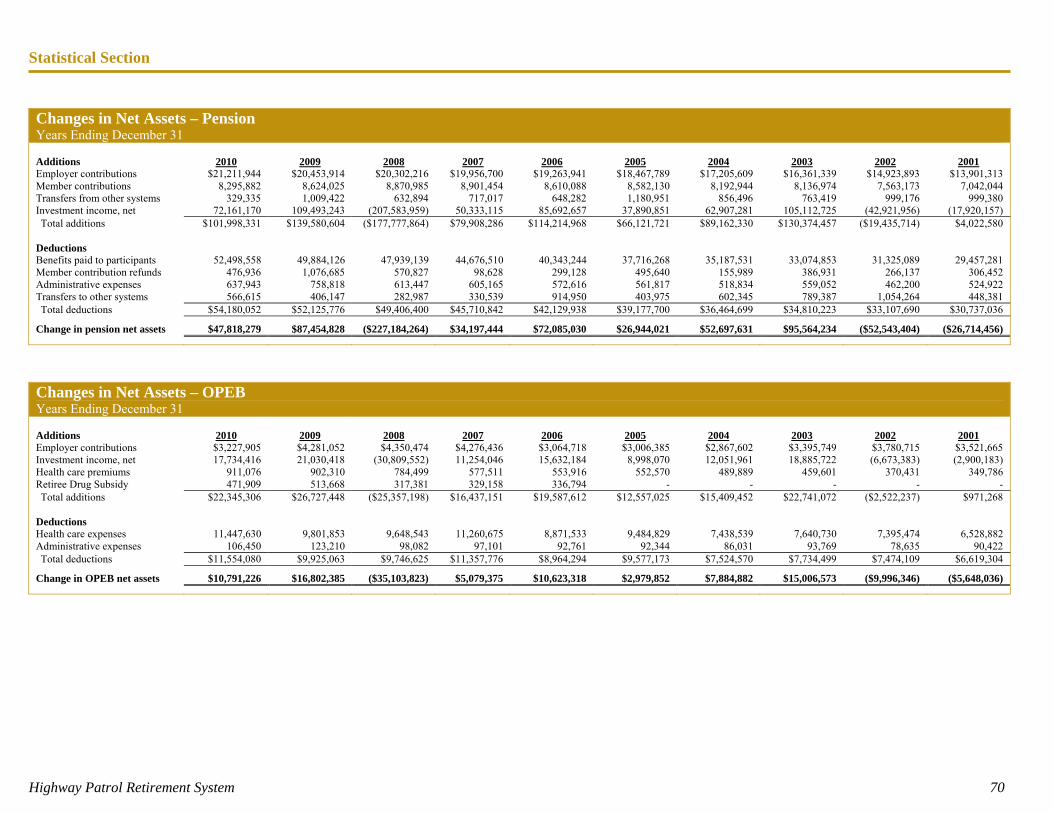
Statistical Section
Highway Patrol Retirement System 70
Changes in Net Assets – Pension Years Ending December 31 Additions 2010 2009 2008 2007 2006 2005 2004 2003 2002 2001 Employer contributions $21,211,944 $20,453,914 $20,302,216 $19,956,700 $19,263,941 $18,467,789 $17,205,609 $16,361,339 $14,923,893 $13,901,313 Member contributions 8,295,882 8,624,025 8,870,985 8,901,454 8,610,088 8,582,130 8,192,944 8,136,974 7,563,173 7,042,044 Transfers from other systems 329,335 1,009,422 632,894 717,017 648,282 1,180,951 856,496 763,419 999,176 999,380 Investment income, net 72,161,170 109,493,243 (207,583,959) 50,333,115 85,692,657 37,890,851 62,907,281 105,112,725 (42,921,956) (17,920,157) Total additions $101,998,331 $139,580,604 ($177,777,864) $79,908,286 $114,214,968 $66,121,721 $89,162,330 $130,374,457 ($19,435,714) $4,022,580
Deductions Benefits paid to participants 52,498,558 49,884,126 47,939,139 44,676,510 40,343,244 37,716,268 35,187,531 33,074,853 31,325,089 29,457,281 Member contribution refunds 476,936 1,076,685 570,827 98,628 299,128 495,640 155,989 386,931 266,137 306,452 Administrative expenses 637,943 758,818 613,447 605,165 572,616 561,817 518,834 559,052 462,200 524,922 Transfers to other systems 566,615 406,147 282,987 330,539 914,950 403,975 602,345 789,387 1,054,264 448,381 Total deductions $54,180,052 $52,125,776 $49,406,400 $45,710,842 $42,129,938 $39,177,700 $36,464,699 $34,810,223 $33,107,690 $30,737,036
Change in pension net assets $47,818,279 $87,454,828 ($227,184,264) $34,197,444 $72,085,030 $26,944,021 $52,697,631 $95,564,234 ($52,543,404) ($26,714,456)
Changes in Net Assets – OPEB Years Ending December 31 Additions 2010 2009 2008 2007 2006 2005 2004 2003 2002 2001 Employer contributions $3,227,905 $4,281,052 $4,350,474 $4,276,436 $3,064,718 $3,006,385 $2,867,602 $3,395,749 $3,780,715 $3,521,665 Investment income, net 17,734,416 21,030,418 (30,809,552) 11,254,046 15,632,184 8,998,070 12,051,961 18,885,722 (6,673,383) (2,900,183) Health care premiums 911,076 902,310 784,499 577,511 553,916 552,570 489,889 459,601 370,431 349,786 Retiree Drug Subsidy 471,909 513,668 317,381 329,158 336,794 - - - - - Total additions $22,345,306 $26,727,448 ($25,357,198) $16,437,151 $19,587,612 $12,557,025 $15,409,452 $22,741,072 ($2,522,237) $971,268
Deductions Health care expenses 11,447,630 9,801,853 9,648,543 11,260,675 8,871,533 9,484,829 7,438,539 7,640,730 7,395,474 6,528,882 Administrative expenses 106,450 123,210 98,082 97,101 92,761 92,344 86,031 93,769 78,635 90,422 Total deductions $11,554,080 $9,925,063 $9,746,625 $11,357,776 $8,964,294 $9,577,173 $7,524,570 $7,734,499 $7,474,109 $6,619,304
Change in OPEB net assets $10,791,226 $16,802,385 ($35,103,823) $5,079,375 $10,623,318 $2,979,852 $7,884,882 $15,006,573 ($9,996,346) ($5,648,036)
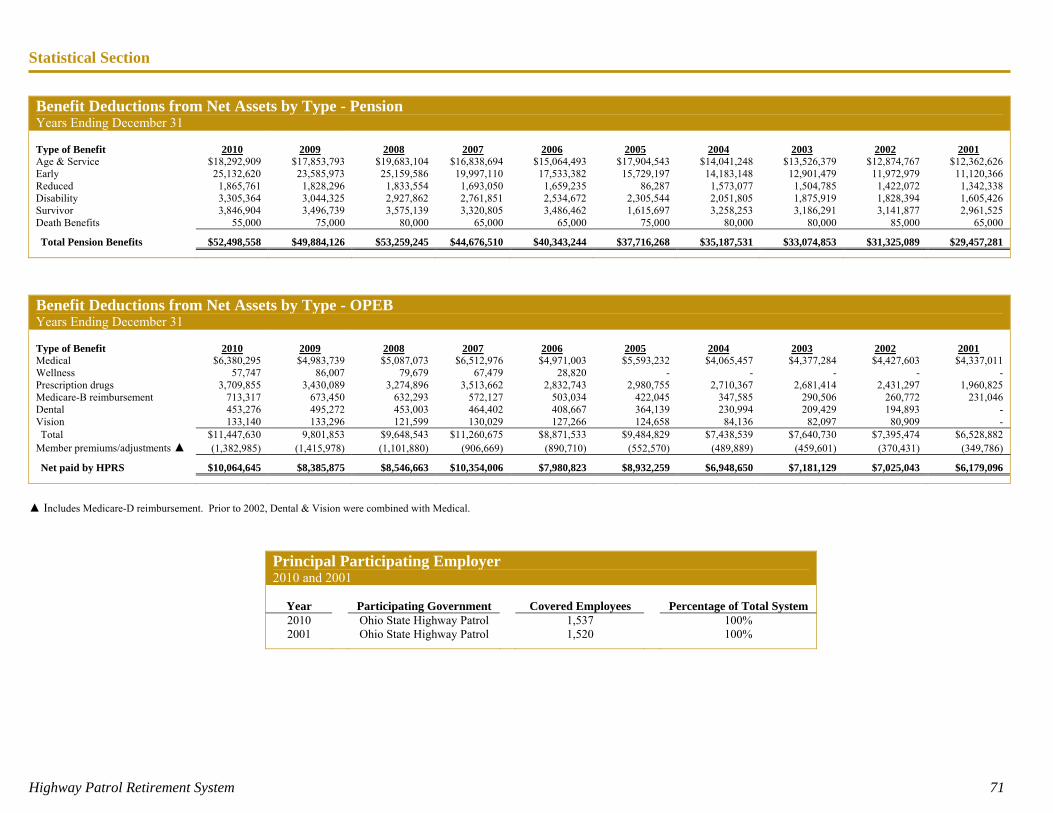
Statistical Section
Highway Patrol Retirement System 71
Benefit Deductions from Net Assets by Type - Pension Years Ending December 31 Type of Benefit 2010 2009 2008 2007 2006 2005 2004 2003 2002 2001 Age & Service $18,292,909 $17,853,793 $19,683,104 $16,838,694 $15,064,493 $17,904,543 $14,041,248 $13,526,379 $12,874,767 $12,362,626 Early 25,132,620 23,585,973 25,159,586 19,997,110 17,533,382 15,729,197 14,183,148 12,901,479 11,972,979 11,120,366 Reduced 1,865,761 1,828,296 1,833,554 1,693,050 1,659,235 86,287 1,573,077 1,504,785 1,422,072 1,342,338 Disability 3,305,364 3,044,325 2,927,862 2,761,851 2,534,672 2,305,544 2,051,805 1,875,919 1,828,394 1,605,426 Survivor 3,846,904 3,496,739 3,575,139 3,320,805 3,486,462 1,615,697 3,258,253 3,186,291 3,141,877 2,961,525 Death Benefits 55,000 75,000 80,000 65,000 65,000 75,000 80,000 80,000 85,000 65,000
Total Pension Benefits $52,498,558 $49,884,126 $53,259,245 $44,676,510 $40,343,244 $37,716,268 $35,187,531 $33,074,853 $31,325,089 $29,457,281
Benefit Deductions from Net Assets by Type - OPEB Years Ending December 31 Type of Benefit 2010 2009 2008 2007 2006 2005 2004 2003 2002 2001 Medical $6,380,295 $4,983,739 $5,087,073 $6,512,976 $4,971,003 $5,593,232 $4,065,457 $4,377,284 $4,427,603 $4,337,011 Wellness 57,747 86,007 79,679 67,479 28,820 - - - - - Prescription drugs 3,709,855 3,430,089 3,274,896 3,513,662 2,832,743 2,980,755 2,710,367 2,681,414 2,431,297 1,960,825 Medicare-B reimbursement 713,317 673,450 632,293 572,127 503,034 422,045 347,585 290,506 260,772 231,046 Dental 453,276 495,272 453,003 464,402 408,667 364,139 230,994 209,429 194,893 - Vision 133,140 133,296 121,599 130,029 127,266 124,658 84,136 82,097 80,909 - Total $11,447,630 9,801,853 $9,648,543 $11,260,675 $8,871,533 $9,484,829 $7,438,539 $7,640,730 $7,395,474 $6,528,882
Member premiums/adjustments ▲ (1,382,985) (1,415,978) (1,101,880) (906,669) (890,710) (552,570) (489,889) (459,601) (370,431) (349,786)
Net paid by HPRS $10,064,645 $8,385,875 $8,546,663 $10,354,006 $7,980,823 $8,932,259 $6,948,650 $7,181,129 $7,025,043 $6,179,096
▲ Includes Medicare-D reimbursement. Prior to 2002, Dental & Vision were combined with Medical.
Principal Participating Employer 2010 and 2001
Year Participating Government Covered Employees Percentage of Total System 2010 Ohio State Highway Patrol 1,537 100% 2001 Ohio State Highway Patrol 1,520 100%
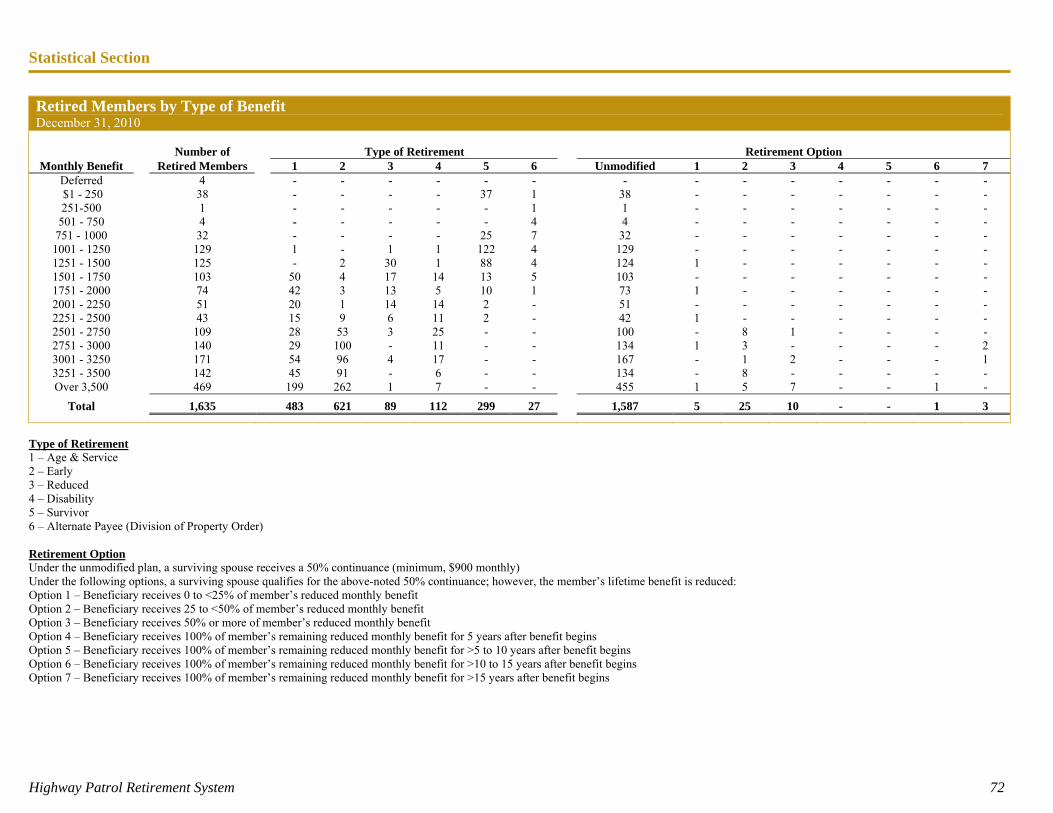
Statistical Section
Highway Patrol Retirement System 72
Retired Members by Type of Benefit December 31, 2010 Number of Type of Retirement Retirement Option Monthly Benefit Retired Members 1 2 3 4 5 6 Unmodified 1 2 3 4 5 6 7
Deferred 4 - - - - - - - - - - - - - - $1 - 250 38 - - - - 37 1 38 - - - - - - - 251-500 1 - - - - - 1 1 - - - - - - -
501 - 750 4 - - - - - 4 4 - - - - - - - 751 - 1000 32 - - - - 25 7 32 - - - - - - - 1001 - 1250 129 1 - 1 1 122 4 129 - - - - - - - 1251 - 1500 125 - 2 30 1 88 4 124 1 - - - - - - 1501 - 1750 103 50 4 17 14 13 5 103 - - - - - - - 1751 - 2000 74 42 3 13 5 10 1 73 1 - - - - - - 2001 - 2250 51 20 1 14 14 2 - 51 - - - - - - - 2251 - 2500 43 15 9 6 11 2 - 42 1 - - - - - - 2501 - 2750 109 28 53 3 25 - - 100 - 8 1 - - - - 2751 - 3000 140 29 100 - 11 - - 134 1 3 - - - - 2 3001 - 3250 171 54 96 4 17 - - 167 - 1 2 - - - 1 3251 - 3500 142 45 91 - 6 - - 134 - 8 - - - - - Over 3,500 469 199 262 1 7 - - 455 1 5 7 - - 1 -
Total 1,635 483 621 89 112 299 27 1,587 5 25 10 - - 1 3
Type of Retirement 1 – Age & Service 2 – Early 3 – Reduced 4 – Disability 5 – Survivor 6 – Alternate Payee (Division of Property Order) Retirement Option Under the unmodified plan, a surviving spouse receives a 50% continuance (minimum, $900 monthly) Under the following options, a surviving spouse qualifies for the above-noted 50% continuance; however, the member’s lifetime benefit is reduced: Option 1 – Beneficiary receives 0 to <25% of member’s reduced monthly benefit Option 2 – Beneficiary receives 25 to <50% of member’s reduced monthly benefit Option 3 – Beneficiary receives 50% or more of member’s reduced monthly benefit Option 4 – Beneficiary receives 100% of member’s remaining reduced monthly benefit for 5 years after benefit begins Option 5 – Beneficiary receives 100% of member’s remaining reduced monthly benefit for >5 to 10 years after benefit begins Option 6 – Beneficiary receives 100% of member’s remaining reduced monthly benefit for >10 to 15 years after benefit begins Option 7 – Beneficiary receives 100% of member’s remaining reduced monthly benefit for >15 years after benefit begins
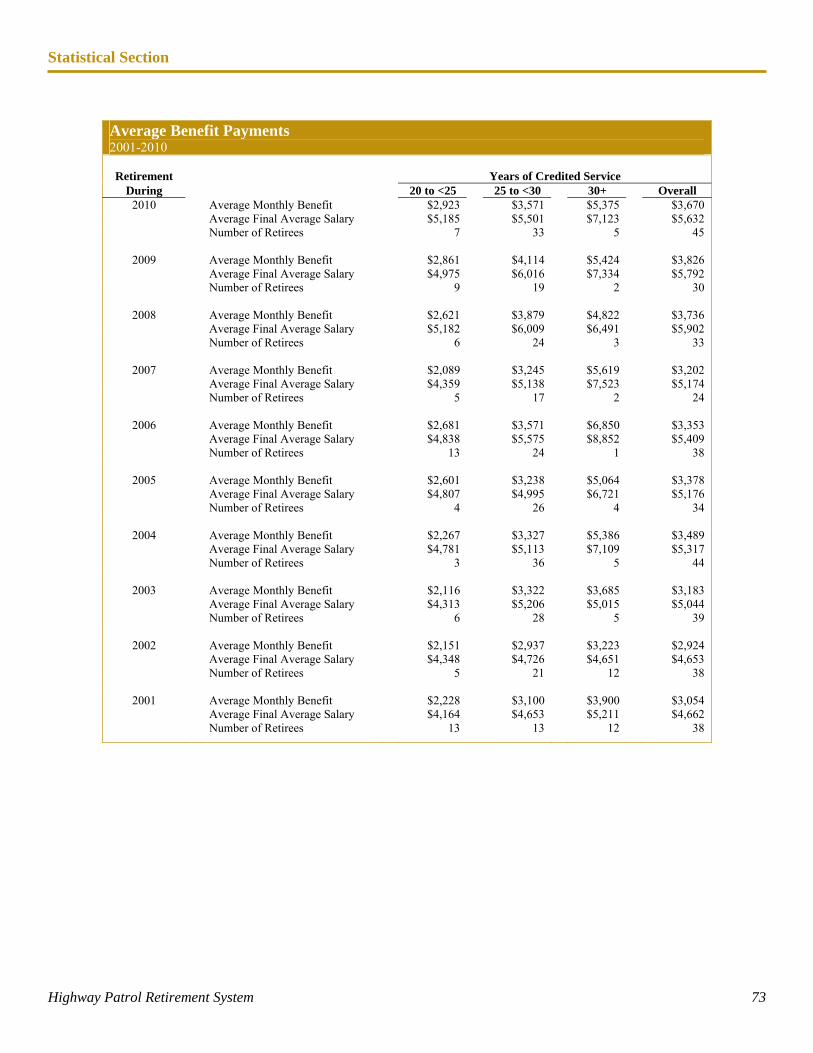
Statistical Section
Highway Patrol Retirement System 73
Average Benefit Payments 2001-2010
Retirement Years of Credited Service
During 20 to <25 25 to <30 30+ Overall 2010 Average Monthly Benefit $2,923 $3,571 $5,375 $3,670
Average Final Average Salary $5,185 $5,501 $7,123 $5,632 Number of Retirees 7 33 5 45
2009 Average Monthly Benefit $2,861 $4,114 $5,424 $3,826 Average Final Average Salary $4,975 $6,016 $7,334 $5,792 Number of Retirees 9 19 2 30
2008 Average Monthly Benefit $2,621 $3,879 $4,822 $3,736 Average Final Average Salary $5,182 $6,009 $6,491 $5,902 Number of Retirees 6 24 3 33
2007 Average Monthly Benefit $2,089 $3,245 $5,619 $3,202 Average Final Average Salary $4,359 $5,138 $7,523 $5,174 Number of Retirees 5 17 2 24
2006 Average Monthly Benefit $2,681 $3,571 $6,850 $3,353 Average Final Average Salary $4,838 $5,575 $8,852 $5,409 Number of Retirees 13 24 1 38
2005 Average Monthly Benefit $2,601 $3,238 $5,064 $3,378 Average Final Average Salary $4,807 $4,995 $6,721 $5,176 Number of Retirees 4 26 4 34
2004 Average Monthly Benefit $2,267 $3,327 $5,386 $3,489 Average Final Average Salary $4,781 $5,113 $7,109 $5,317 Number of Retirees 3 36 5 44
2003 Average Monthly Benefit $2,116 $3,322 $3,685 $3,183 Average Final Average Salary $4,313 $5,206 $5,015 $5,044 Number of Retirees 6 28 5 39
2002 Average Monthly Benefit $2,151 $2,937 $3,223 $2,924 Average Final Average Salary $4,348 $4,726 $4,651 $4,653 Number of Retirees 5 21 12 38
2001 Average Monthly Benefit $2,228 $3,100 $3,900 $3,054 Average Final Average Salary $4,164 $4,653 $5,211 $4,662 Number of Retirees 13 13 12 38

Highway Patrol Retirement System 74
Highway Patrol Retirement System 6161 Busch Boulevard, Suite 119
Columbus, Ohio 43229-2553 Telephone (614) 431-0781
Fax (614) 431-9204 e-mail [email protected]
www.ohprs.org
Office Hours: 8:00 am to 4:30 pm
One block west of Interstate 71 on State Route 161, drive north on Busch Boulevard. Turn left at the first traffic light, Shapter Avenue. Turn right into the entrance.