Embed Size (px)
Citation preview
Comprehensive AnnualComprehensive AnnualComprehensive AnnualComprehensive AnnualComprehensive AnnualComprehensive AnnualComprehensive AnnualComprehensive AnnualComprehensive AnnualComprehensive AnnualComprehensive AnnualComprehensive AnnualComprehensive AnnualComprehensive AnnualComprehensive AnnualComprehensive AnnualComprehensive AnnualComprehensive AnnualComprehensive AnnualComprehensive AnnualComprehensive AnnualComprehensive AnnualComprehensive AnnualComprehensive AnnualComprehensive AnnualComprehensive AnnualComprehensive AnnualComprehensive AnnualComprehensive AnnualComprehensive AnnualComprehensive AnnualComprehensive AnnualComprehensive AnnualComprehensive AnnualComprehensive AnnualComprehensive AnnualComprehensive AnnualComprehensive AnnualComprehensive AnnualComprehensive AnnualComprehensive AnnualComprehensive AnnualComprehensive AnnualComprehensive AnnualComprehensive AnnualComprehensive AnnualComprehensive AnnualComprehensive AnnualFinancial ReportFinancial ReportFinancial ReportFinancial ReportFinancial ReportFinancial ReportFinancial ReportFinancial ReportFinancial Report
Comprehensive AnnualFinancial Report
Comprehensive AnnualComprehensive AnnualComprehensive AnnualFinancial Report
Comprehensive AnnualFinancial Report
Comprehensive AnnualFinancial Report
Comprehensive AnnualComprehensive AnnualComprehensive AnnualFinancial Report
Comprehensive AnnualComprehensive AnnualFinancial Report
Comprehensive AnnualComprehensive AnnualComprehensive AnnualFinancial Report
Comprehensive AnnualFinancial Report
Comprehensive AnnualFinancial Report
Comprehensive AnnualComprehensive AnnualComprehensive AnnualFinancial Report
Comprehensive AnnualComprehensive AnnualFinancial Report
Comprehensive AnnualComprehensive AnnualComprehensive AnnualFinancial Report
Comprehensive AnnualFinancial Report
Comprehensive AnnualFinancial Report
Comprehensive AnnualComprehensive AnnualComprehensive AnnualFinancial Report
Comprehensive Annual
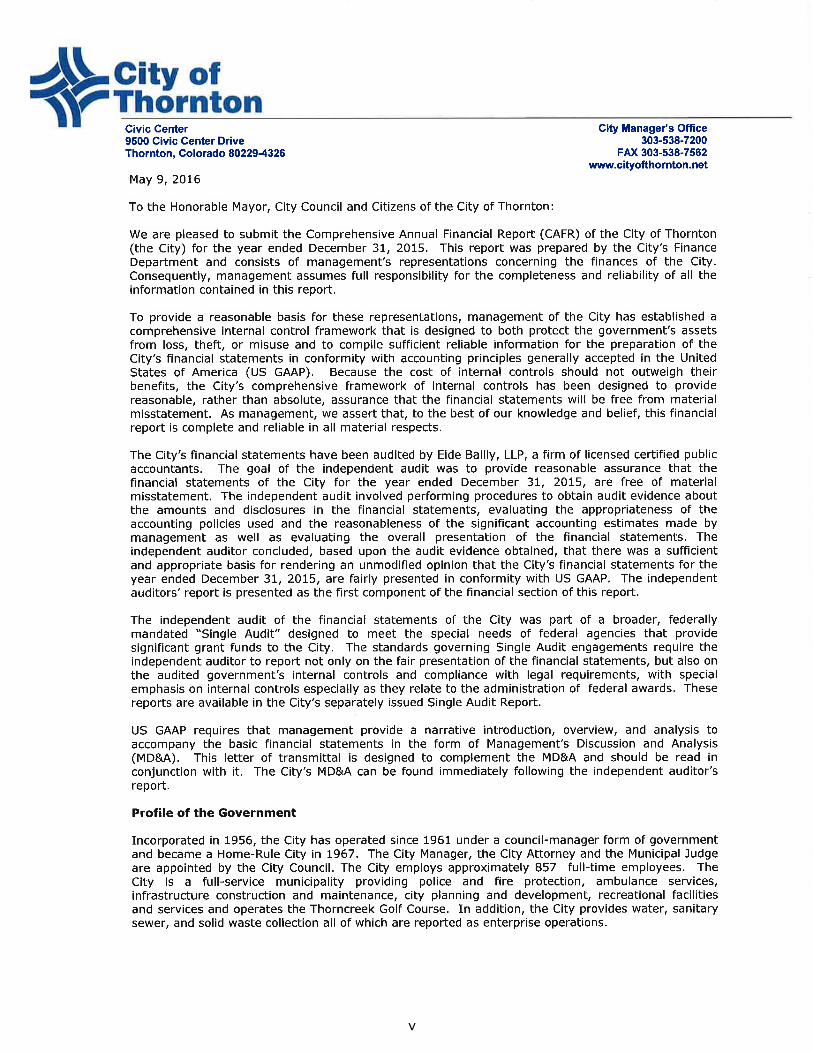
For the Year Ended December 31, 2015
City of Thornton, Colorado Comprehensive Annual Financial Report
For the fiscal year ended December 31, 2015
Prepared by the Finance Department:
Maria Ostrom, Finance Director Kim Newhart, Controller
JoAnn Koenig, Accounting Supervisor Rachel Walsh, Project Accountant
Jamie Miller, Accountant Dawn Cartier, Accountant Erika Senna, Accountant Kim Tucker, Accountant
Carla Montoya, Accounting Technician Mindy Gallo, Accounting Specialist
Vanessa Bernal, Accounting Specialist
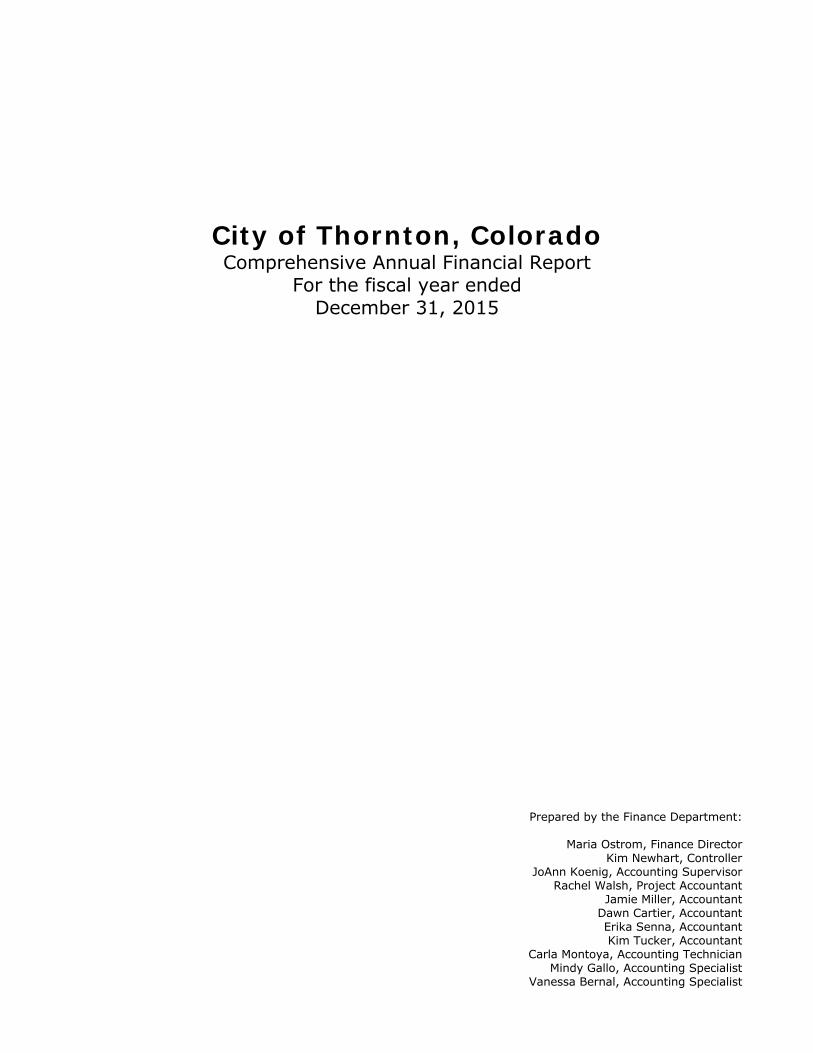
City of Thornton, Colorado Table of Contents
Introductory Section Page
Letter of Transmittal v
City Officials x
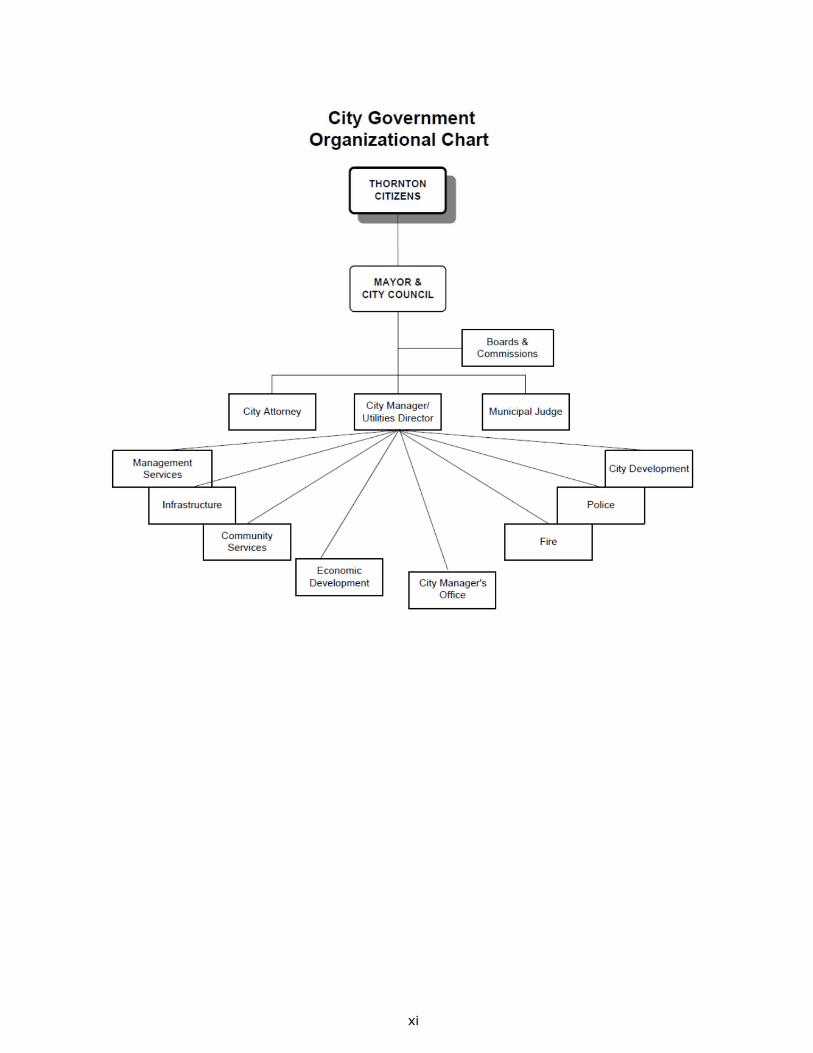
Organizational Chart xi
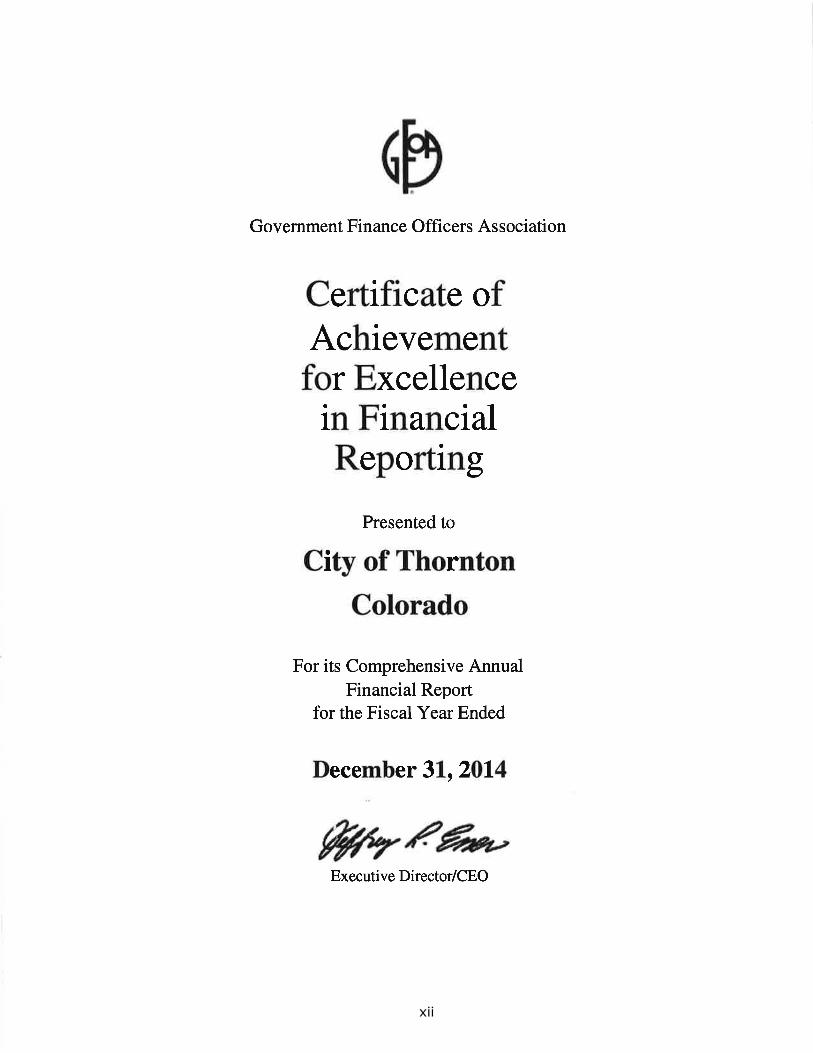
Certificate of Achievement for Excellence in Financial Reporting xii
Financial Section
Report of Independent Certified Public Accountants 1
Management’s Discussion & Analysis 5
Basic Financial Statements
Government-wide Financial Statements
Statement of Net Position 14
Statement of Activities 15
Fund Financial Statements
Balance Sheet - Governmental Funds 18
Reconciliation of the Balance Sheet of Governmental Funds to the Statement of Net Position 19
Statement of Revenues, Expenditures, and Changes in Fund Balances – Governmental Funds 20
Reconciliation of the Statement of Revenues, Expenditures, and Changes in Fund Balances of Governmental Funds to the Statement of Activities 21
Statement of Net Position – Proprietary Funds 22
Statement of Revenues, Expenses, and Changes in Net Position – Proprietary Funds 24
Statement of Cash Flows – Proprietary Funds 26
Notes to Financial Statements 28
Required Supplementary Information
Schedule of Revenues, Expenditures, and Changes in Fund Balance – Budget and Actual – General Fund – Non US GAAP Basis 58
Schedule of Revenues, Expenditures, and Changes in Fund Balance – Budget and Actual – Parks and Open Space Fund 59
Schedule of Proportionate Share of the Net Pension Liability Cost-Sharing Plan 60
Schedule of Pension Contributions Cost-Sharing Plan 61
Schedule of Proportionate Share of Net Pension Liability Old Hire Plan (Thornton Fire) 62
Schedule of Pension Contributions Old Hire Plan (Thornton Fire) 63
Schedule of Funding Progress for the City Retiree Health Care Plan 64
Combining Statements and Budgetary Schedules
Fund Descriptions – Non-Major Governmental Funds 66
Combining Balance Sheet – Non-Major Governmental Funds 68
i
City of Thornton, Colorado Table of Contents (Continued)
Financial Section (Continued) Page
Combining Statements and Budgetary Schedules (Continued)
Combining Statement of Revenues, Expenditures, and Changes in Fund Balances – Non-Major Governmental Funds 72
Thornton Arts, Sciences, and Humanities Council Fund (TASHCO) Schedule of Revenues, Expenditures, and Changes in Fund Balance – Budget and Actual 75
Cash in Lieu Fund Schedule of Revenues, Expenditures, and Changes in Fund Balance – Budget and Actual 76
Conservation Trust Fund Schedule of Revenues, Expenditures, and Changes in Fund Balance – Budget and Actual 77
Parks Fund Schedule of Revenues, Expenditures, and Changes in Fund Balance – Budget and Actual 78
Open Space Fund Schedule of Revenues, Expenditures, and Changes in Fund Balance – Budget and Actual 79
Adams County Open Space Sales Tax Fund Schedule of Revenues, Expenditures, and Changes in Fund Balance – Budget and Actual 80
Adams County Road & Bridge Sales Tax Fund Schedule of Revenues, Expenditures, and Changes in Fund Balance – Budget and Actual 81
136th Avenue General Improvement District Tax Fund Schedule of Revenues, Expenditures, and Changes in Fund Balance – Budget and Actual 82
E911 Authority Fund Schedule of Revenues, Expenditures, and Changes in Fund Balance – Budget and Actual 83
Debt Service Fund Schedule of Revenues, Expenditures, and Changes in Fund Balance – Budget and Actual 84
Governmental Capital Fund Schedule of Revenues, Expenditures, and Changes in Fund Balance – Budget and Actual 85
Thornton Development Authority South Capital Fund Schedule of Revenues, Expenditures, and Changes in Fund Balance – Budget and Actual 86
Thornton Development Authority North Capital Fund Schedule of Revenues, Expenditures, and Changes in Fund Balance – Budget and Actual 87
Thornton Development Authority 144th Capital Fund Schedule of Revenues, Expenditures, and Changes in Fund Balance – Budget and Actual
– Non US GAAP Basis 88
Fund Descriptions – Major Enterprise Funds 90
Water Fund Schedule of Revenues, Expenses, and Changes in Net Position – Budget and Actual
– Non US GAAP Basis 91 Sewer Fund
Schedule of Revenues, Expenses, and Changes in Net Position – Budget and Actual – Non US GAAP Basis 92
Fund Descriptions – Non-Major Enterprise Funds 93
Combining Statement of Net Position – Non-Major Enterprise Funds 94
Combining Statement of Revenues, Expenses, and Changes in Net Position - Non-Major Enterprise Funds 95
Sanitation Fund Schedule of Revenues, Expenses, and Changes in Net Position – Budget and Actual
– Non US GAAP Basis 96
ii
City of Thornton, Colorado
Table of Contents (Continued)
Financial Section (Continued) Page
Combining Statements and Budgetary Schedules (Continued)
Fund Descriptions – Internal Service Funds 97
Combining Statement of Net Position – Internal Service Funds 98
Combining Statement of Revenues, Expenses, and Changes in Net Position – Internal Service Funds 99
Combining Statement of Cash Flows – Internal Service Funds 100
Risk Management Fund Schedule of Revenues, Expenses, and Changes in Net Position – Budget and Actual
– Non US GAAP Basis 102
Information Technology Fund Schedule of Revenues, Expenses, and Changes in Net Position – Budget and Actual
– Non US GAAP Basis 103
Reprographics Fund Schedule of Revenues, Expenses, and Changes in Net Position – Budget and Actual
– Non US GAAP Basis 104 Consolidated Service Center Fund
Schedule of Revenues, Expenses, and Changes in Net Position – Budget and Actual 105
Maintenance Services Fund Schedule of Revenues, Expenses, and Changes in Net Position – Budget and Actual
– Non US GAAP Basis 106 Other Schedules
Schedule of Investments 109
Local Highway Finance Report 110
Statistical Section (Un-audited)
Schedule 1 – Net Position by Component 115
Schedule 2 – Changes in Net Position 116
Schedule 3 – Fund Balances of Governmental Funds 118
Schedule 4 - Changes in Fund Balances of Governmental Funds 119
Schedule 5 – General Government Tax and Assessment Revenues by Source 120
Schedule 6 – Sales Tax Revenue by Type of Industry 122
Schedule 7 – Direct and Overlapping Sales Tax Rates 124
Schedule 8 – Principal Sales Taxpayers 125
Schedule 9 – Ratios of Outstanding Debt by Type 126
Schedule 10 – Ratios of General Bonded Debt Outstanding 128
Schedule 11 – Direct and Overlapping Governmental Activities Debt 129
Schedule 12 – Legal Debt Margin Information 130
Schedule 13 – Pledged-Revenue Coverage 131
Schedule 14 – Demographic and Economic Statistics 132
Schedule 15 – Principal Employers 133
Schedule 16 – Full-time Equivalent City Government Employees by Function 134
Schedule 17 – Operating Indicators by Function 135
Schedule 18 – Capital Asset Statistics by Function 136
iii

This Page Left Intentionally Blank
iv
v
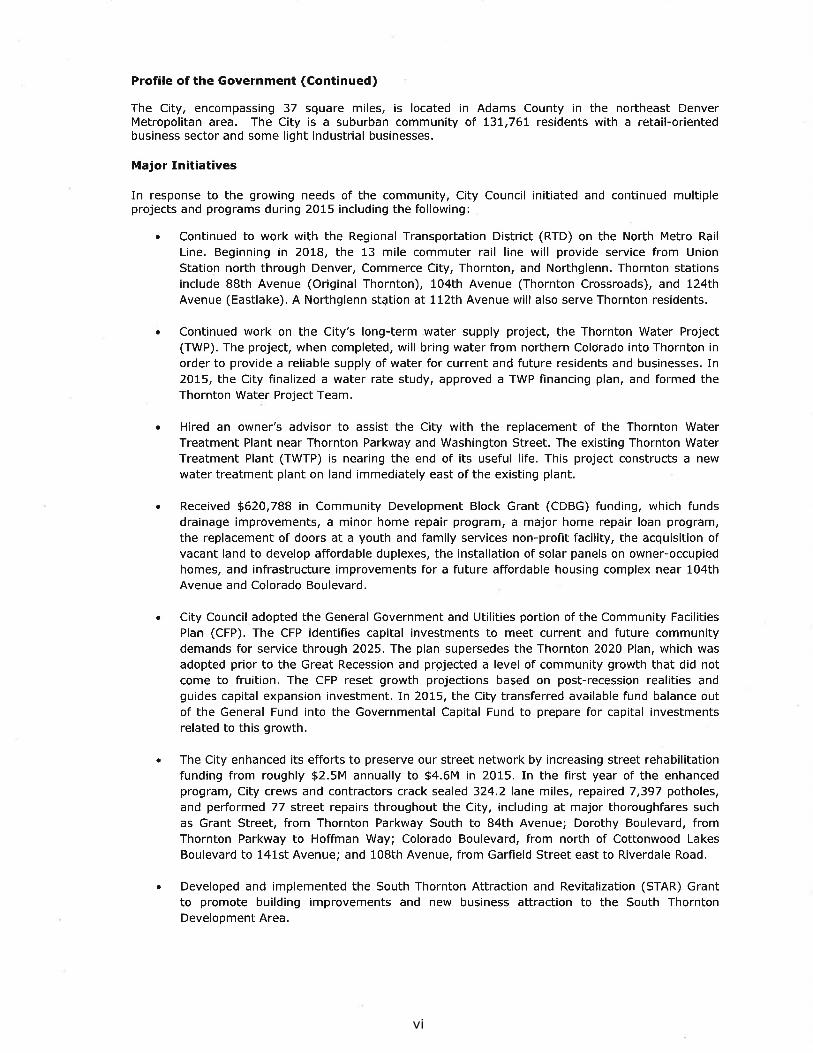
x
vi
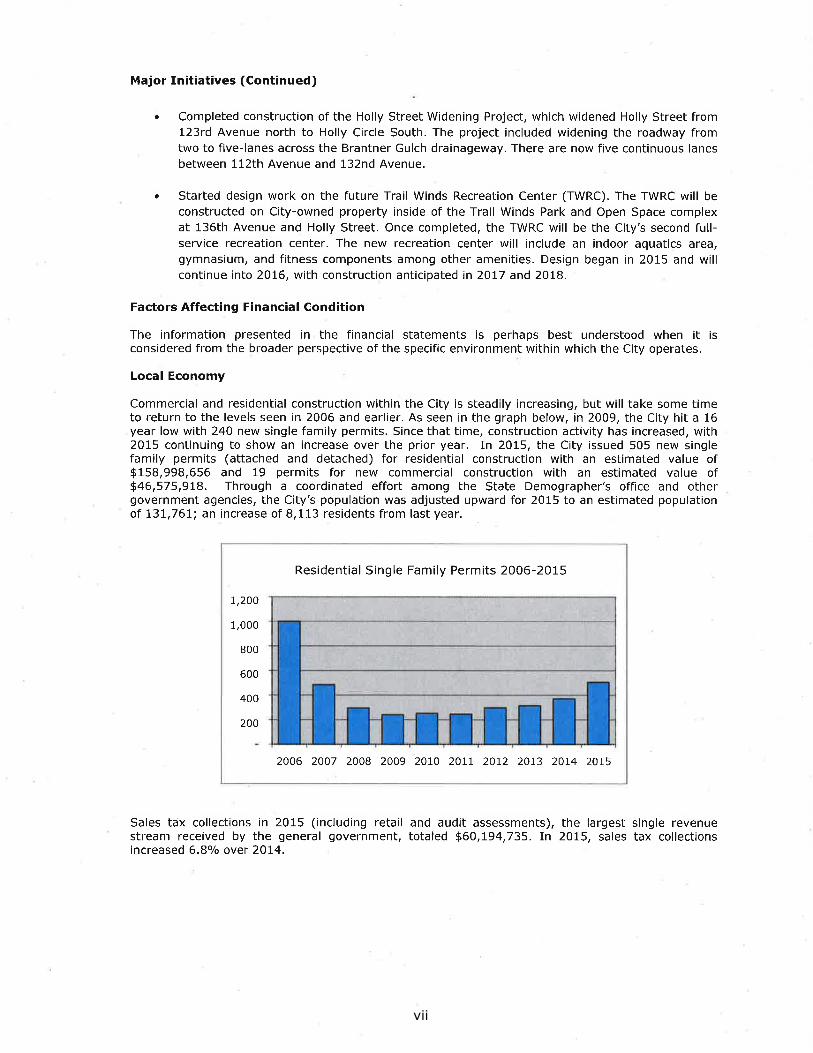
vii
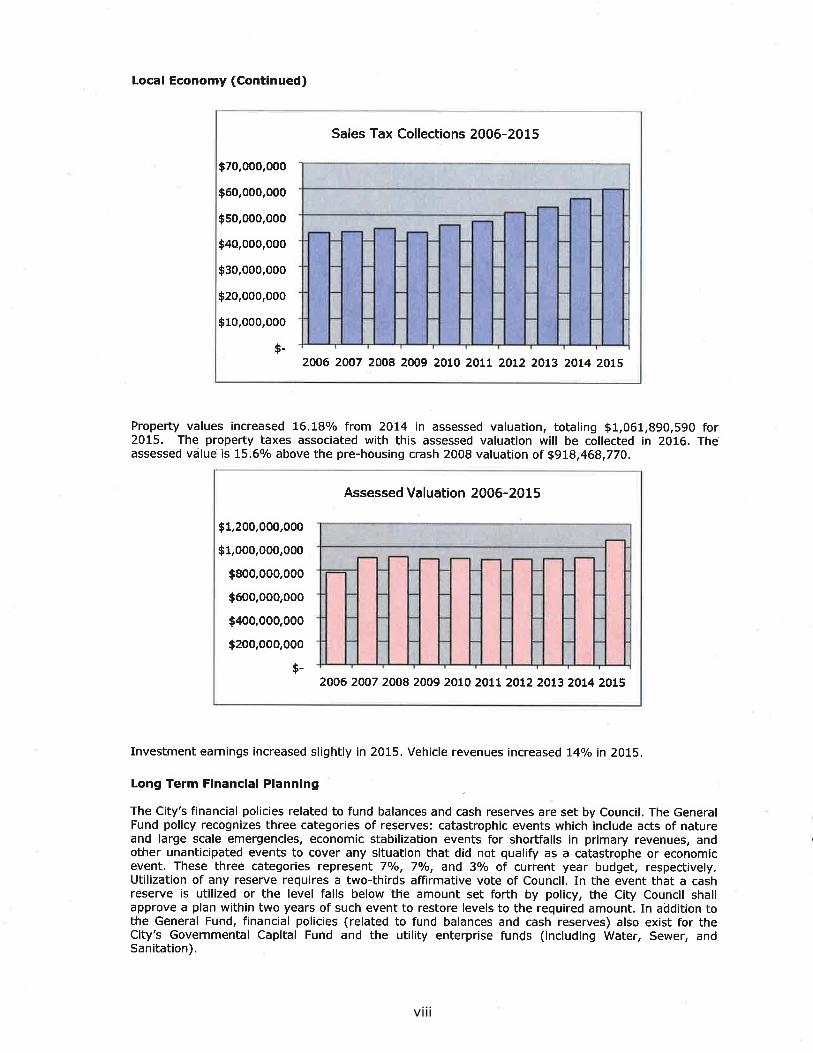
viii
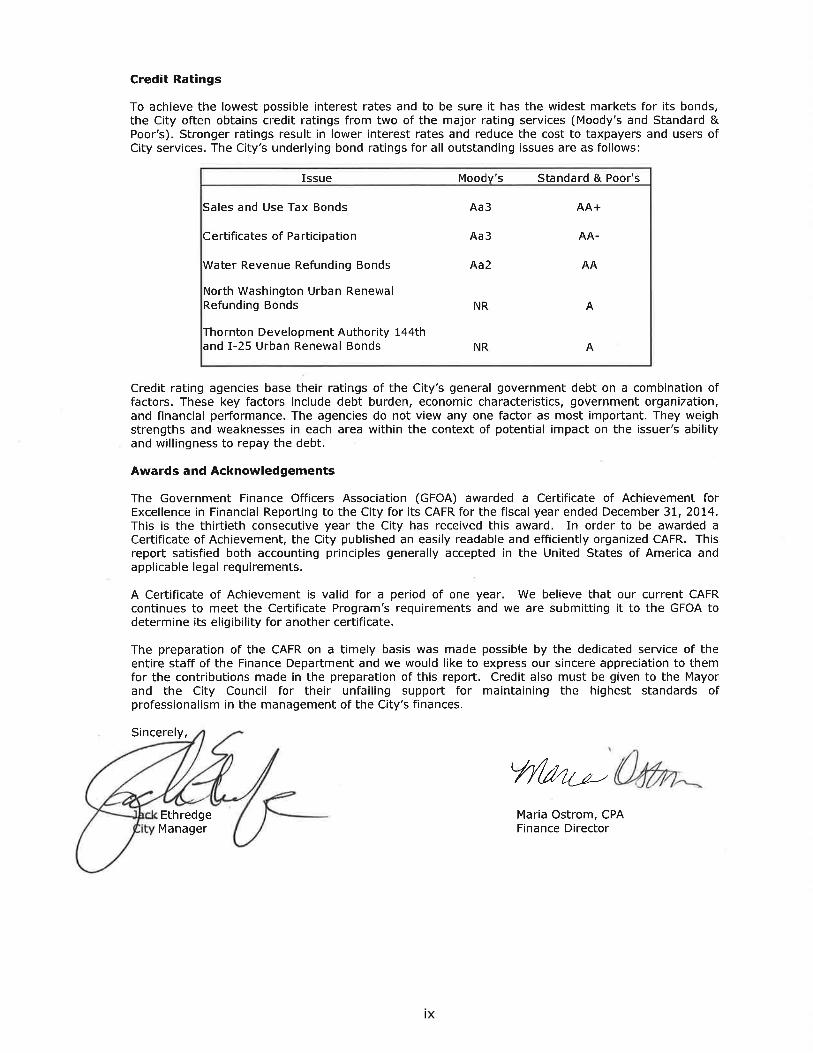
ix
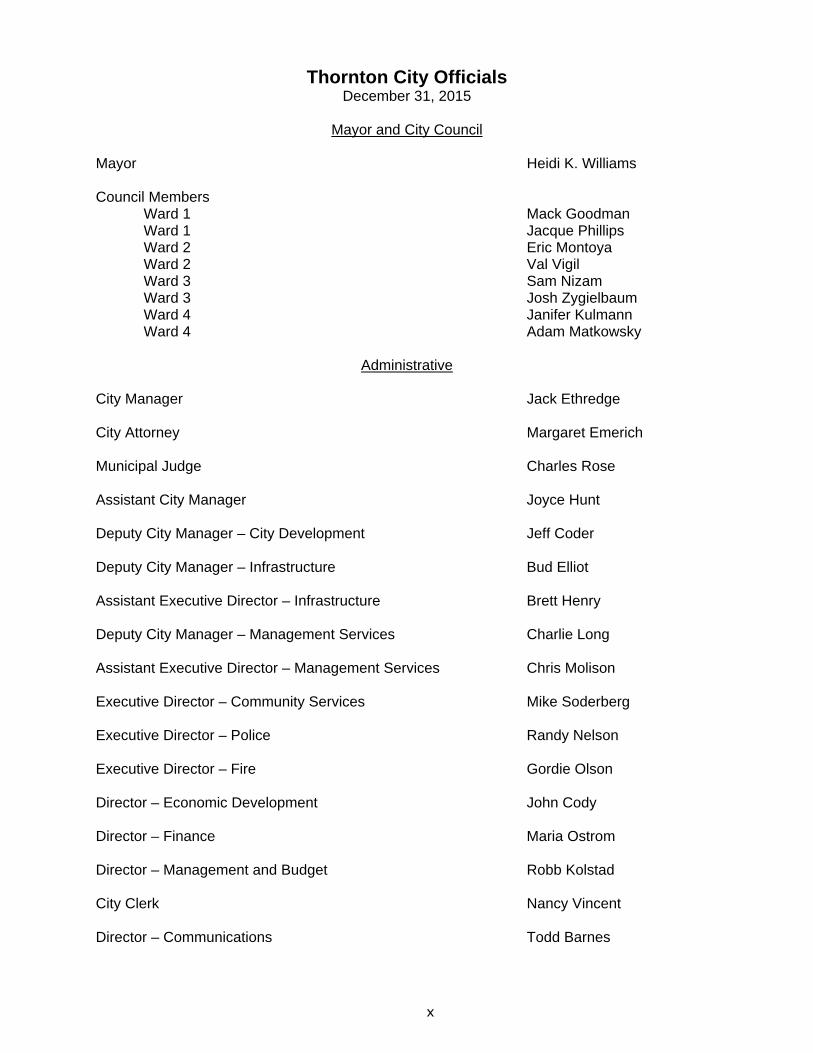
Thornton City Officials December 31, 2015
Mayor and City Council
Mayor Heidi K. Williams
Council Members Ward 1 Mack Goodman Ward 1 Jacque Phillips Ward 2 Eric Montoya Ward 2 Val Vigil Ward 3 Sam Nizam Ward 3 Josh Zygielbaum Ward 4 Janifer Kulmann Ward 4 Adam Matkowsky
Administrative
City Manager Jack Ethredge
City Attorney Margaret Emerich
Municipal Judge Charles Rose
Assistant City Manager Joyce Hunt
Deputy City Manager – City Development Jeff Coder
Deputy City Manager – Infrastructure Bud Elliot
Assistant Executive Director – Infrastructure Brett Henry
Deputy City Manager – Management Services Charlie Long
Assistant Executive Director – Management Services Chris Molison
Executive Director – Community Services Mike Soderberg
Executive Director – Police Randy Nelson
Executive Director – Fire Gordie Olson
Director – Economic Development John Cody
Director – Finance Maria Ostrom
Director – Management and Budget Robb Kolstad
City Clerk Nancy Vincent
Director – Communications Todd Barnes
x
xi
xii
www.eidebai l ly.com
440 Indiana St., Ste. 200 | Golden, CO 80401-5021 | TF 877.882.7929 | T 303.986.2454 | F 303.980.5029 | EOE
1
Independent Auditor’s Report
To the Mayor and City Council City of Thornton, Colorado
Report on the Financial Statements We have audited the accompanying financial statements of the governmental activities, the business-type activities, each major fund, and the aggregate remaining fund information of the City of Thornton, Colorado, as of and for the year ended December 31, 2015, and the related notes to the financial statements, which collectively comprise the City’s basic financial statements as listed in the table of contents.
Management’s Responsibility for the Financial Statements Management is responsible for the preparation and fair presentation of these financial statements in accordance with accounting principles generally accepted in the United States of America; this includes the design, implementation, and maintenance of internal control relevant to the preparation and fair presentation of financial statements that are free from material misstatement, whether due to fraud or error.
Auditor’s Responsibility Our responsibility is to express opinions on these financial statements based on our audit. We conducted our audit in accordance with auditing standards generally accepted in the United States of America and the standards applicable to financial audits contained in Government Auditing Standards, issued by the Comptroller General of the United States. Those standards require that we plan and perform the audit to obtain reasonable assurance about whether the financial statements are free from material misstatement.
An audit involves performing procedures to obtain audit evidence about the amounts and disclosures in the financial statements. The procedures selected depend on the auditor’s judgment, including the assessment of the risks of material misstatement of the financial statements, whether due to fraud or error. In making those risk assessments, the auditor considers internal control relevant to the entity’s preparation and fair presentation of the financial statements in order to design audit procedures that are appropriate in the circumstances, but not for the purpose of expressing an opinion on the effectiveness of the entity’s internal control. Accordingly, we express no such opinion. An audit also includes evaluating the appropriateness of accounting policies used and the reasonableness of significant accounting estimates made by management, as well as evaluating the overall presentation of the financial statements.
We believe that the audit evidence we have obtained is sufficient and appropriate to provide a basis for our audit opinions.
Opinions In our opinion, the financial statements referred to above present fairly, in all material respects, the respective financial position of the governmental activities, the business-type activities, each major fund, and the aggregate remaining fund information of the City of Thornton, Colorado, as of December 31, 2015, and the respective changes in financial position and, where applicable, cash flows thereof for the year then ended in accordance with accounting principles generally accepted in the United States of America.
2
Adoption of New Accounting Standard As described in Note A to the financial statements, the City of Thornton has adopted the provisions of GASB Statement No. 68, Accounting and Financial Reporting for Pensions and GASB Statement No. 71, Pension Transition for Contributions Made Subsequent to the Measurement Date, which has resulted in a restatement of the net position as of January 1, 2015. Our opinions are not modified with respect to this matter.
Other Matters
Required Supplementary Information Accounting principles generally accepted in the United States of America require that management’s discussion and analysis, budgetary comparisons and pension information on pages 5 through 12, 58 through 59, and 60 through 64, be presented to supplement the basic financial statements. Such information, although not a part of the basic financial statements, is required by the Governmental Accounting Standards Board, who considers it to be an essential part of financial reporting for placing the basic financial statements in an appropriate operational, economic, or historical context. We have applied certain limited procedures to the required supplementary information in accordance with auditing standards generally accepted in the United States of America, which consisted of inquiries of management about the methods of preparing the information and comparing the information for consistency with management’s responses to our inquiries, the basic financial statements, and other knowledge we obtained during our audit of the basic financial statements. We do not express an opinion or provide any assurance on the information because the limited procedures do not provide us with sufficient evidence to express an opinion or provide any assurance.
Other Information Our audit was conducted for the purpose of forming opinions on the financial statements that collectively comprise the City of Thornton, Colorado’s financial statements. The introductory section, combining nonmajor fund financial statements, individual budget schedules, schedule of investments, Local Highway Finance Report, and statistical tables are presented for purposes of additional analysis and are not a required part of the basic financial statements.
The combining nonmajor fund financial statements, budget schedules, schedule of investments and Local Highway Finance Report on pages 68 through 111 were derived from and relate directly to the underlying accounting and other records used to prepare the basic financial statements. Such information has been subjected to the auditing procedures applied in the audit of the financial statements and certain additional procedures, including comparing and reconciling such information directly to the underlying accounting and other records used to prepare the financial statements or to the financial statements themselves, and other additional procedures in accordance with auditing standards generally accepted in the United States of America. In our opinion, this information is fairly stated in all material respects in relation to the financial statements as a whole.
The introductory and statistical sections have not been subjected to the auditing procedures applied in the audit of the basic financial statements and, accordingly, we do not express an opinion or provide any assurance on them.
3
Other Reporting Required by Government Auditing Standards In accordance with Government Auditing Standards, we have also issued our report dated May 2, 2016 on our consideration of the City of Thornton, Colorado’s internal control over financial reporting and on our tests of its compliance with certain provisions of laws, regulations, contracts, grant agreements and other matters. The purpose of that report is to describe the scope of our testing of internal control over financial reporting and compliance and the results of that testing, and not to provide an opinion on the internal control over financial reporting or on compliance. That report is an integral part of an audit performed in accordance with Government Auditing Standards in considering the City of Thornton’s internal control over financial reporting and compliance.
Golden, Colorado May 2, 2016

This Page Left Intentionally Blank
4
City of Thornton, Colorado Management’s Discussion and Analysis
December 31, 2015
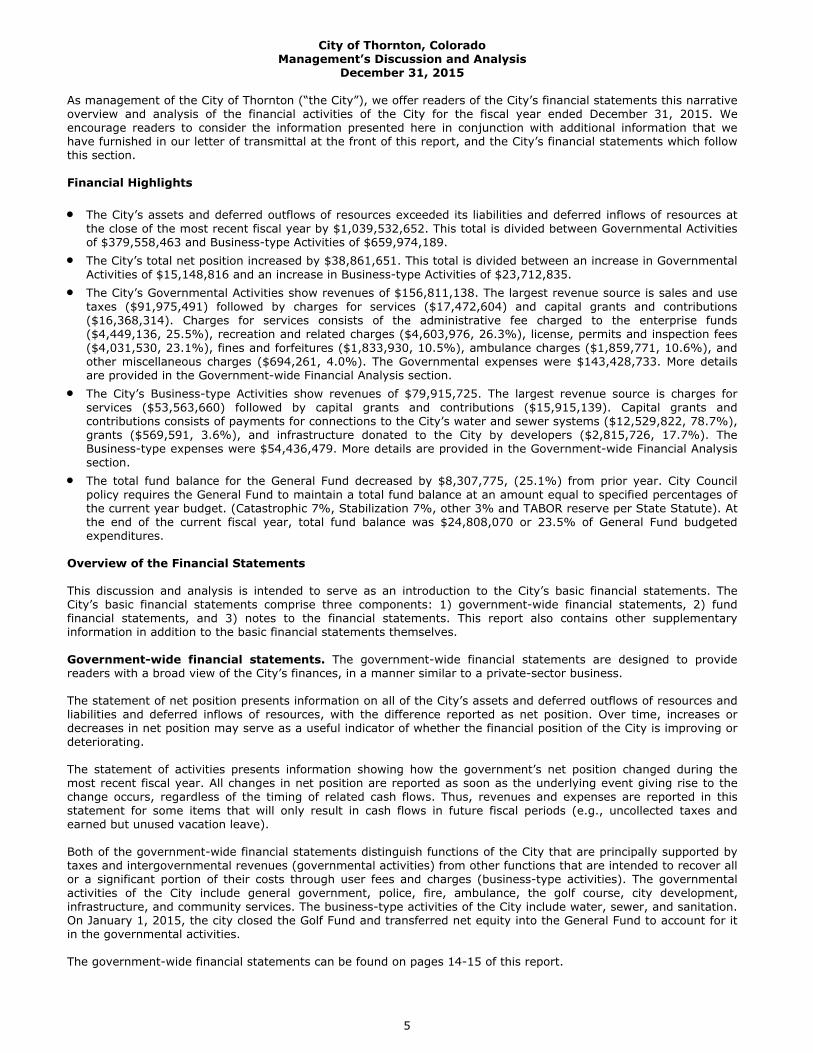
As management of the City of Thornton (“the City”), we offer readers of the City’s financial statements this narrative overview and analysis of the financial activities of the City for the fiscal year ended December 31, 2015. We encourage readers to consider the information presented here in conjunction with additional information that we have furnished in our letter of transmittal at the front of this report, and the City’s financial statements which follow this section.
Financial Highlights
The City’s assets and deferred outflows of resources exceeded its liabilities and deferred inflows of resources atthe close of the most recent fiscal year by $1,039,532,652. This total is divided between Governmental Activitiesof $379,558,463 and Business-type Activities of $659,974,189.
The City’s total net position increased by $38,861,651. This total is divided between an increase in GovernmentalActivities of $15,148,816 and an increase in Business-type Activities of $23,712,835.
The City’s Governmental Activities show revenues of $156,811,138. The largest revenue source is sales and usetaxes ($91,975,491) followed by charges for services ($17,472,604) and capital grants and contributions($16,368,314). Charges for services consists of the administrative fee charged to the enterprise funds($4,449,136, 25.5%), recreation and related charges ($4,603,976, 26.3%), license, permits and inspection fees($4,031,530, 23.1%), fines and forfeitures ($1,833,930, 10.5%), ambulance charges ($1,859,771, 10.6%), andother miscellaneous charges ($694,261, 4.0%). The Governmental expenses were $143,428,733. More detailsare provided in the Government-wide Financial Analysis section.
The City’s Business-type Activities show revenues of $79,915,725. The largest revenue source is charges forservices ($53,563,660) followed by capital grants and contributions ($15,915,139). Capital grants andcontributions consists of payments for connections to the City’s water and sewer systems ($12,529,822, 78.7%),grants ($569,591, 3.6%), and infrastructure donated to the City by developers ($2,815,726, 17.7%). TheBusiness-type expenses were $54,436,479. More details are provided in the Government-wide Financial Analysissection.
The total fund balance for the General Fund decreased by $8,307,775, (25.1%) from prior year. City Councilpolicy requires the General Fund to maintain a total fund balance at an amount equal to specified percentages ofthe current year budget. (Catastrophic 7%, Stabilization 7%, other 3% and TABOR reserve per State Statute). Atthe end of the current fiscal year, total fund balance was $24,808,070 or 23.5% of General Fund budgetedexpenditures.
Overview of the Financial Statements
This discussion and analysis is intended to serve as an introduction to the City’s basic financial statements. The City’s basic financial statements comprise three components: 1) government-wide financial statements, 2) fund financial statements, and 3) notes to the financial statements. This report also contains other supplementary information in addition to the basic financial statements themselves.
Government-wide financial statements. The government-wide financial statements are designed to provide readers with a broad view of the City’s finances, in a manner similar to a private-sector business.
The statement of net position presents information on all of the City’s assets and deferred outflows of resources and liabilities and deferred inflows of resources, with the difference reported as net position. Over time, increases or decreases in net position may serve as a useful indicator of whether the financial position of the City is improving or deteriorating.
The statement of activities presents information showing how the government’s net position changed during the most recent fiscal year. All changes in net position are reported as soon as the underlying event giving rise to the change occurs, regardless of the timing of related cash flows. Thus, revenues and expenses are reported in this statement for some items that will only result in cash flows in future fiscal periods (e.g., uncollected taxes and earned but unused vacation leave).
Both of the government-wide financial statements distinguish functions of the City that are principally supported by taxes and intergovernmental revenues (governmental activities) from other functions that are intended to recover all or a significant portion of their costs through user fees and charges (business-type activities). The governmental activities of the City include general government, police, fire, ambulance, the golf course, city development, infrastructure, and community services. The business-type activities of the City include water, sewer, and sanitation. On January 1, 2015, the city closed the Golf Fund and transferred net equity into the General Fund to account for it in the governmental activities.
The government-wide financial statements can be found on pages 14-15 of this report.
5
City of Thornton, Colorado Management’s Discussion and Analysis
December 31, 2015
Fund financial statements. A fund is a grouping of related accounts that is used to maintain control over resources that have been segregated for specific activities or objectives. The City, like other state and local governments, uses fund accounting to ensure and demonstrate compliance with finance-related legal requirements. All of the funds of the City can be divided into two categories: governmental funds and proprietary funds.
Governmental funds. Governmental funds are used to account for essentially the same functions reported as governmental activities in the government-wide financial statements. However, unlike the government-wide financial statements, governmental fund financial statements focus on near-term inflows and outflows of spendable resources, as well as on balances of spendable resources available at the end of the fiscal year. Such information may be useful in evaluating a government’s near-term financing requirements.
Because the focus of governmental funds is narrower than that of the government-wide financial statements, it is useful to compare the information presented for governmental funds with similar information presented for governmental activities in the government-wide financial statements. By doing so, readers may better understand the long-term impact of the government’s near-term financing decisions. Both the governmental fund balance sheet and the governmental fund statement of revenues, expenditures, and changes in fund balances provide a reconciliation to facilitate this comparison between governmental funds and governmental activities.
The City maintains 16 individual governmental funds. Information is presented separately in the governmental fund balance sheet and in the governmental fund statement of revenues, expenditures, and changes in fund balances for the General Fund, the Governmental Capital Fund, Parks and Open Space Fund and the Thornton Development Authority North Capital Fund which are considered to be major funds. Data from the other 12 governmental funds are combined into a single, aggregated presentation. Individual fund data for each of these non-major governmental funds is provided in the form of combining statements elsewhere in this report.
The City adopts an annual appropriated budget for its General Fund. A budgetary comparison statement has been provided for the General Fund to demonstrate compliance with this budget, which can be found on page 58 of this report.
The basic governmental fund financial statements can be found on pages 18-21 of this report.
Proprietary funds. The City maintains two different types of proprietary funds; enterprise and internal service. Enterprise funds are used to report the same functions presented as business-type activities in the government-wide financial statements. The City uses enterprise funds to account for water, sewer, and sanitation. Internal service funds are an accounting device used to accumulate and allocate costs internally among the City’s various functions. The City uses five internal service funds: Risk Management to account for the costs related to a comprehensive program to manage the City’s property, liability, work related injury risk, dental and vision; Information Technology to account for computer support and maintenance; Reprographics to account for copying and mailing; the Consolidated Service Center to account for fuel purchased and utilized by Adams County School District 12; and Maintenance Services to account for custodial and building maintenance service costs. Because these services predominately benefit governmental rather than business-type functions, they have been included within governmental activities in the government-wide financial statements.
Proprietary funds provide the same type of information as the government-wide financial statements, only in more detail. The proprietary fund financial statements provide separate information for the Water, Sewer, and Sanitation Funds. Only the Water and Sewer Funds are considered to be major funds of the City. Individual fund data for the internal service funds is provided in the form of combining statements elsewhere in this report.
The basic proprietary fund financial statements can be found on pages 22-27 of this report.
Notes to the financial statements. The notes provide additional information that is essential to a full understanding of the data provided in the government-wide and fund financial statements. The notes to the financial statements can be found on pages 28-56 of this report.
Other information. In addition to the basic financial statements and accompanying notes, this report also presents certain supplementary information. The combining statements referred to earlier in connection with non-major governmental funds and proprietary funds are presented immediately following the basic financial statements. Combining statements and budgetary schedules can be found on pages 68-106 of this report. The Schedule of Investments and Local Highway Finance Report can be found on pages 110-111 of this report.
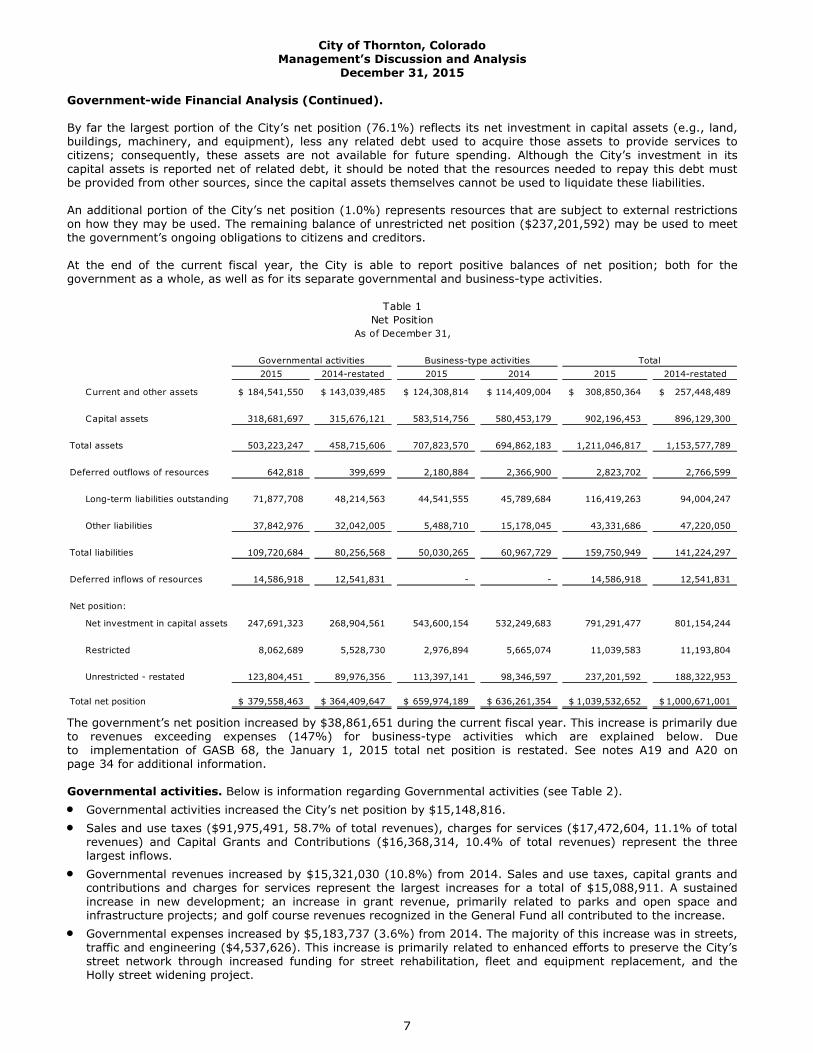
Government-wide Financial Analysis
As noted earlier, net position may serve over time as a useful indicator of a government’s financial position. Assets exceeded liabilities by $1,039,532,652 at the close of the most recent fiscal year (see Table 1).
6
City of Thornton, Colorado Management’s Discussion and Analysis
December 31, 2015
Government-wide Financial Analysis (Continued).
By far the largest portion of the City’s net position (76.1%) reflects its net investment in capital assets (e.g., land, buildings, machinery, and equipment), less any related debt used to acquire those assets to provide services to citizens; consequently, these assets are not available for future spending. Although the City’s investment in its capital assets is reported net of related debt, it should be noted that the resources needed to repay this debt must be provided from other sources, since the capital assets themselves cannot be used to liquidate these liabilities.
An additional portion of the City’s net position (1.0%) represents resources that are subject to external restrictions on how they may be used. The remaining balance of unrestricted net position ($237,201,592) may be used to meet the government’s ongoing obligations to citizens and creditors.
At the end of the current fiscal year, the City is able to report positive balances of net position; both for the government as a whole, as well as for its separate governmental and business-type activities.
Governmental activities Business-type activities Total2015 2014-restated 2015 2014 2015 2014-restated
Current and other assets 184,541,550$ 143,039,485$ 124,308,814$ 114,409,004$ 308,850,364$ 257,448,489$
Capital assets 318,681,697 315,676,121 583,514,756 580,453,179 902,196,453 896,129,300
Total assets 503,223,247 458,715,606 707,823,570 694,862,183 1,211,046,817 1,153,577,789
Deferred outflows of resources 642,818 399,699 2,180,884 2,366,900 2,823,702 2,766,599
Long-term liabilities outstanding 71,877,708 48,214,563 44,541,555 45,789,684 116,419,263 94,004,247
Other liabilities 37,842,976 32,042,005 5,488,710 15,178,045 43,331,686 47,220,050
Total liabilities 109,720,684 80,256,568 50,030,265 60,967,729 159,750,949 141,224,297
Deferred inflows of resources 14,586,918 12,541,831 - - 14,586,918 12,541,831
Net position:
Net investment in capital assets 247,691,323 268,904,561 543,600,154 532,249,683 791,291,477 801,154,244
Restricted 8,062,689 5,528,730 2,976,894 5,665,074 11,039,583 11,193,804
Unrestricted - restated 123,804,451 89,976,356 113,397,141 98,346,597 237,201,592 188,322,953
Total net position 379,558,463$ 364,409,647$ 659,974,189$ 636,261,354$ 1,039,532,652$ 1,000,671,001$
Table 1Net Position
As of December 31,
The government’s net position increased by $38,861,651 during the current fiscal year. This increase is primarily due to revenues exceeding expenses (147%) for business-type activities which are explained below. Due to implementation of GASB 68, the January 1, 2015 total net position is restated. See notes A19 and A20 on page 34 for additional information.
Governmental activities. Below is information regarding Governmental activities (see Table 2). Governmental activities increased the City’s net position by $15,148,816. Sales and use taxes ($91,975,491, 58.7% of total revenues), charges for services ($17,472,604, 11.1% of total
revenues) and Capital Grants and Contributions ($16,368,314, 10.4% of total revenues) represent the threelargest inflows.
Governmental revenues increased by $15,321,030 (10.8%) from 2014. Sales and use taxes, capital grants andcontributions and charges for services represent the largest increases for a total of $15,088,911. A sustainedincrease in new development; an increase in grant revenue, primarily related to parks and open space andinfrastructure projects; and golf course revenues recognized in the General Fund all contributed to the increase.
Governmental expenses increased by $5,183,737 (3.6%) from 2014. The majority of this increase was in streets,traffic and engineering ($4,537,626). This increase is primarily related to enhanced efforts to preserve the City’sstreet network through increased funding for street rehabilitation, fleet and equipment replacement, and theHolly street widening project.
7

City of Thornton, Colorado Management’s Discussion and Analysis
December 31, 2015
Table 2Changes in Net Position
For Years Ended December 31,
Governmental activities Business-type activities Total2015 2014-restated 2015 2014 2015 2014-restated
Revenues:Program revenues:
Charges for services 17,472,604$ 14,736,802$ 53,563,660$ 48,366,411$ 71,036,264$ 63,103,213$
Operating grants and contributions 5,958,882 6,461,838 - - 5,958,882 6,461,838
Capital grants and contributions 16,368,314 11,965,768 15,915,139 10,855,812 32,283,453 22,821,580
General revenues:
Sales and use taxes 91,975,491 84,024,928 - - 91,975,491 84,024,928
Property taxes 12,571,291 12,046,479 - - 12,571,291 12,046,479
Franchise taxes 5,308,812 5,521,208 - - 5,308,812 5,521,208
E911 taxes 1,038,442 1,053,074 - - 1,038,442 1,053,074
Other taxes 2,264,872 2,118,978 - - 2,264,872 2,118,978
Earnings on investments 1,513,417 1,591,320 1,553,374 2,012,676 3,066,791 3,603,996
Gain on sale of assets 152,381 206,932 5,038,541 942,423 5,190,922 1,149,355
Miscellaneous 2,186,632 1,762,781 3,845,011 7,387,156 6,031,643 9,149,937
Total revenues 156,811,138 141,490,108 79,915,725 69,564,478 236,726,863 211,054,586
Expenses: General government 18,362,528 17,743,216 - - 18,362,528 17,743,216
Police 30,700,874 29,873,901 - - 30,700,874 29,873,901
Fire 14,323,859 16,496,326 - - 14,323,859 16,496,326
C ity development 15,937,319 15,709,881 - - 15,937,319 15,709,881
Streets, traffic, and engineering 33,558,931 29,021,305 - - 33,558,931 29,021,305
Community services 27,788,576 26,714,095 - - 27,788,576 26,714,095
Interest on long-term debt 2,756,646 2,686,272 - - 2,756,646 2,686,272
Water - - 35,912,922 33,600,763 35,912,922 33,600,763
Sewer - - 13,721,652 13,380,812 13,721,652 13,380,812
Sanitation - - 4,801,905 4,525,051 4,801,905 4,525,051
Golf - - - 1,653,285 - 1,653,285
Total expenses 143,428,733 138,244,996 54,436,479 53,159,911 197,865,212 191,404,907
Increase (decrease) in net position before transfers 13,382,405 3,245,112 25,479,246 16,404,567 38,861,651 19,649,679
Transfers 1,766,411 (411,253) (1,766,411) 411,253 - -
Increase (decrease) in net position 15,148,816 2,833,859 23,712,835 16,815,820 38,861,651 19,649,679
Net position, Jan 1 - restated 364,409,647 361,575,788 636,261,354 619,445,534 1,000,671,001 981,021,322
Net position, Dec 31 379,558,463$ 364,409,647$ 659,974,189$ 636,261,354$ 1,039,532,652$ 1,000,671,001$
8
City of Thornton, Colorado Management’s Discussion and Analysis
December 31, 2015
Business-type activities. Below is information regarding Business-type activities (see Table 2). Business-type activities increased the City’s net position by $23,712,835, accounting for 61.0% of the total
growth in the government’s net position. Charges for services ($53,563,660, 67.0% of total revenues), gain on sale of capital assets ($5,038,541, 6.3% of
total revenues) and tap fees, which are included in grants and contributions, ($12,529,822, 15.7% of total revenues) represent the three largest inflows to business-type activities.
Revenues increased by $10,351,247 (14.9%) in 2015 compared to 2014. The two largest increases in revenuewere in charges for services ($5,197,249) and in grants and contributions ($5,059,327).
Expenses increased $1,276,568 (2.4%) from 2014. The single largest increase ($2,312,159) was in the WaterFund, primarily due to additional spending on reservoir repairs, pipeline rehab and valve replacements. The Water Fund increase in expenses was offset by the decrease in the Golf Fund ($1,653,285) which was closed on January 1, 2015, and is now accounted for in the General fund.
Financial Analysis of the Government’s Funds
As noted earlier, the City uses fund accounting to ensure and demonstrate compliance with finance-related legal requirements. The following details are contained in the fund financial statements.
Governmental funds. The focus of the City’s governmental funds is to provide information on near-term inflows, outflows, and balances of spendable resources. Such information is useful in assessing the City’s financing requirements. In particular, unreserved fund balance may serve as a useful measure of a government’s net resources available for spending at the end of the fiscal year.
As of the end of the current fiscal year, the City governmental funds reported combined ending fund balances of $141,643,971, an increase of $36,893,144 in comparison with the prior year as a result of revenues exceeding expenses. The reasons for increases in revenues and decreases in expenses are outlined above under the Governmental Activities section. Approximately 78.1% of year end fund balance ($110,609,810) is available for spending at the government’s discretion.
The remainder of fund balance ($31,034,161) is nonspendable, restricted or committed to indicate that it is not available for new spending. The largest component is commitments made by Council ($20,138,386, 64.9%).
The General Fund is the chief operating fund of the City. At the end of the current fiscal year, unassigned fund balance of the General Fund was 2.1% ($519,210) of total fund balance ($24,808,070). As a measure of the General Fund’s liquidity, it may be useful to compare both unassigned fund balance and total fund balance to total fund expenditures. Unassigned fund balance represents less than 1% of total actual General Fund expenditures, while total fund balance represents 23.8% of that same amount. The General fund unassigned fund balance decreased substantially from 2014 ($9,670,972) as a result of the transfer of available monies ($10,190,182) to the Governmental Capital Fund to prepare for the financing of the Council adopted Community Facilities Plan (CFP). The CFP will provide capital investments to meet current and future community demands for services.
In addition to this one time transfer in 2015, the Governmental Capital Projects Fund is funded primarily with sales and use taxes and provides for the repair, replacement and planned growth of infrastructure and other capital assets of the City government. At the end of the current fiscal year, assigned fund balance was 98.0% ($50,069,809) of total fund balance ($51,069,832).
Proprietary funds. The City’s proprietary funds provide the same type of information found in the government-wide financial statements, but in more detail.
Unrestricted net position of the Water, Sewer, and Sanitation Funds at the end of the year amounted to $88,537,708, $18,190,683, $6,668,750 respectively. The change in net position for the funds was an increase in Water of $22,190,293, an increase in Sewer of $2,953,603, and an increase in Sanitation of $335,350. The Golf Fund was closed on January 1, 2015, assets and equity totaling $1,766,411 were transferred out of this fund and activities related to the operation of the golf course are now accounted for in the General Fund.
General Fund Budgetary Highlights
Combined revenues (General Fund and Governmental Capital Fund) were greater than budgetary estimates and General Fund expenditures were less than appropriations. Governmental sales and use taxes were up 9.5% in 2015 compared to 2014. The majority of governmental sales and use tax, approximately 80.4% ($73,925,956) is available for general fund operations and governmental capital projects. In 2015, the City utilized sales and use tax revenue
9
City of Thornton, Colorado Management’s Discussion and Analysis
December 31, 2015
General Fund Budgetary Highlights (Continued).
as needed in the general fund. The remainder of the available sales and use tax revenue was accumulated in the governmental capital fund to prepare for planned improvements and expansion of infrastructure and community facilities in order to keep pace with the current and projected growth in the City.
General Fund expenditures were under budget by $1,083,663 in 2015. Lower than projected fuel prices ($348,018), decreased consumption in utilities ($484,245), and lower than budgeted internal service charges ($582,533) represent the majority of the budgetary savings in 2015. These savings were offset by higher than expected spending for snow & ice supplies ($304,254).
Capital Asset and Debt Administration
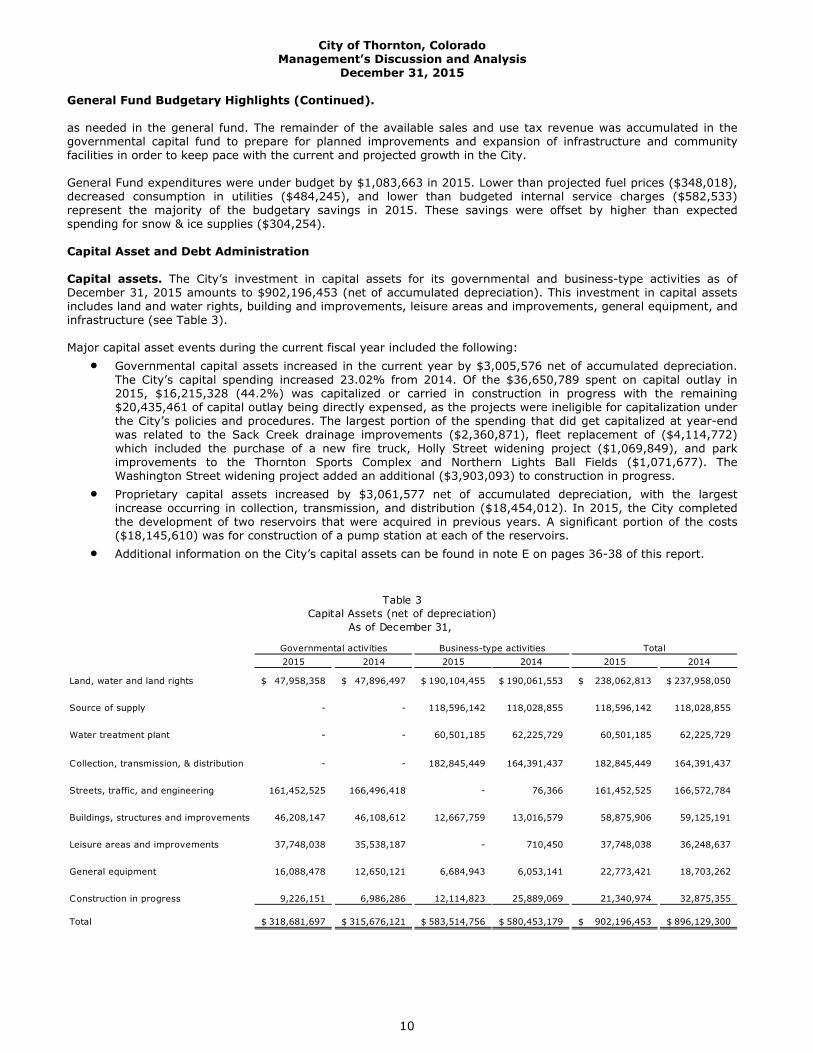
Capital assets. The City’s investment in capital assets for its governmental and business-type activities as of December 31, 2015 amounts to $902,196,453 (net of accumulated depreciation). This investment in capital assets includes land and water rights, building and improvements, leisure areas and improvements, general equipment, and infrastructure (see Table 3).
Major capital asset events during the current fiscal year included the following: Governmental capital assets increased in the current year by $3,005,576 net of accumulated depreciation.
The City’s capital spending increased 23.02% from 2014. Of the $36,650,789 spent on capital outlay in 2015, $16,215,328 (44.2%) was capitalized or carried in construction in progress with the remaining $20,435,461 of capital outlay being directly expensed, as the projects were ineligible for capitalization under the City’s policies and procedures. The largest portion of the spending that did get capitalized at year-end was related to the Sack Creek drainage improvements ($2,360,871), fleet replacement of ($4,114,772) which included the purchase of a new fire truck, Holly Street widening project ($1,069,849), and park improvements to the Thornton Sports Complex and Northern Lights Ball Fields ($1,071,677). The Washington Street widening project added an additional ($3,903,093) to construction in progress.
Proprietary capital assets increased by $3,061,577 net of accumulated depreciation, with the largestincrease occurring in collection, transmission, and distribution ($18,454,012). In 2015, the City completed the development of two reservoirs that were acquired in previous years. A significant portion of the costs ($18,145,610) was for construction of a pump station at each of the reservoirs.
Additional information on the City’s capital assets can be found in note E on pages 36-38 of this report.
Table 3Capital Assets (net of depreciation)
As of December 31,
Governmental activities Business-type activities Total2015 2014 2015 2014 2015 2014
Land, water and land rights 47,958,358$ 47,896,497$ 190,104,455$ 190,061,553$ 238,062,813$ 237,958,050$
Source of supply - - 118,596,142 118,028,855 118,596,142 118,028,855
Water treatment plant - - 60,501,185 62,225,729 60,501,185 62,225,729
Collection, transmission, & distribution - - 182,845,449 164,391,437 182,845,449 164,391,437
Streets, traffic, and engineering 161,452,525 166,496,418 - 76,366 161,452,525 166,572,784
Buildings, structures and improvements 46,208,147 46,108,612 12,667,759 13,016,579 58,875,906 59,125,191
Leisure areas and improvements 37,748,038 35,538,187 - 710,450 37,748,038 36,248,637
General equipment 16,088,478 12,650,121 6,684,943 6,053,141 22,773,421 18,703,262
Construction in progress 9,226,151 6,986,286 12,114,823 25,889,069 21,340,974 32,875,355
Total 318,681,697$ 315,676,121$ 583,514,756$ 580,453,179$ 902,196,453$ 896,129,300$
10
City of Thornton, Colorado Management’s Discussion and Analysis
December 31, 2015
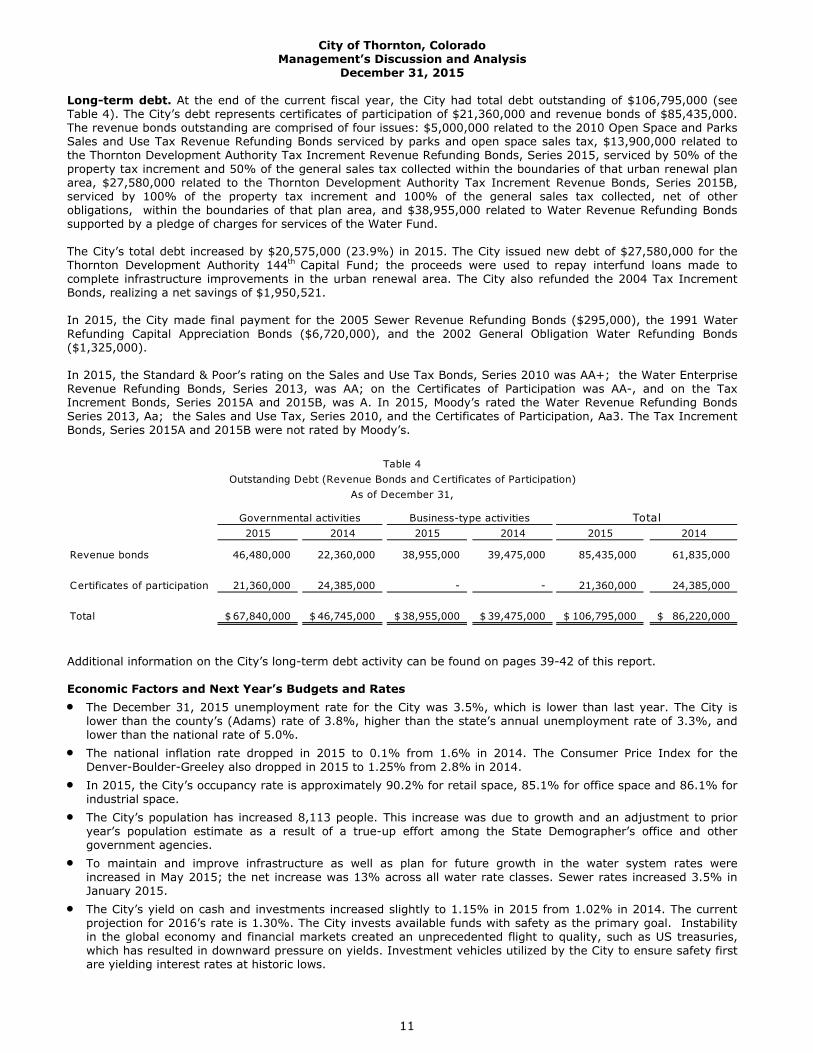
Long-term debt. At the end of the current fiscal year, the City had total debt outstanding of $106,795,000 (see Table 4). The City’s debt represents certificates of participation of $21,360,000 and revenue bonds of $85,435,000. The revenue bonds outstanding are comprised of four issues: $5,000,000 related to the 2010 Open Space and Parks Sales and Use Tax Revenue Refunding Bonds serviced by parks and open space sales tax, $13,900,000 related to the Thornton Development Authority Tax Increment Revenue Refunding Bonds, Series 2015, serviced by 50% of the property tax increment and 50% of the general sales tax collected within the boundaries of that urban renewal plan area, $27,580,000 related to the Thornton Development Authority Tax Increment Revenue Bonds, Series 2015B, serviced by 100% of the property tax increment and 100% of the general sales tax collected, net of other obligations, within the boundaries of that plan area, and $38,955,000 related to Water Revenue Refunding Bonds supported by a pledge of charges for services of the Water Fund.
The City’s total debt increased by $20,575,000 (23.9%) in 2015. The City issued new debt of $27,580,000 for the Thornton Development Authority 144th Capital Fund; the proceeds were used to repay interfund loans made to complete infrastructure improvements in the urban renewal area. The City also refunded the 2004 Tax Increment Bonds, realizing a net savings of $1,950,521.
In 2015, the City made final payment for the 2005 Sewer Revenue Refunding Bonds ($295,000), the 1991 Water Refunding Capital Appreciation Bonds ($6,720,000), and the 2002 General Obligation Water Refunding Bonds ($1,325,000).
In 2015, the Standard & Poor’s rating on the Sales and Use Tax Bonds, Series 2010 was AA+; the Water Enterprise Revenue Refunding Bonds, Series 2013, was AA; on the Certificates of Participation was AA-, and on the Tax Increment Bonds, Series 2015A and 2015B, was A. In 2015, Moody’s rated the Water Revenue Refunding Bonds Series 2013, Aa; the Sales and Use Tax, Series 2010, and the Certificates of Participation, Aa3. The Tax Increment Bonds, Series 2015A and 2015B were not rated by Moody’s.
Table 4Outstanding Debt (Revenue Bonds and Certificates of Participation)
As of December 31,
Governmental activities Business-type activities Total2015 2014 2015 2014 2015 2014
Revenue bonds 46,480,000 22,360,000 38,955,000 39,475,000 85,435,000 61,835,000
Certificates of participation 21,360,000 24,385,000 - - 21,360,000 24,385,000
Total 67,840,000$ 46,745,000$ 38,955,000$ 39,475,000$ 106,795,000$ 86,220,000$
Additional information on the City’s long-term debt activity can be found on pages 39-42 of this report.
Economic Factors and Next Year’s Budgets and Rates The December 31, 2015 unemployment rate for the City was 3.5%, which is lower than last year. The City is
lower than the county’s (Adams) rate of 3.8%, higher than the state’s annual unemployment rate of 3.3%, and lower than the national rate of 5.0%.
The national inflation rate dropped in 2015 to 0.1% from 1.6% in 2014. The Consumer Price Index for theDenver-Boulder-Greeley also dropped in 2015 to 1.25% from 2.8% in 2014.
In 2015, the City’s occupancy rate is approximately 90.2% for retail space, 85.1% for office space and 86.1% forindustrial space.
The City’s population has increased 8,113 people. This increase was due to growth and an adjustment to prioryear’s population estimate as a result of a true-up effort among the State Demographer’s office and other government agencies.
To maintain and improve infrastructure as well as plan for future growth in the water system rates wereincreased in May 2015; the net increase was 13% across all water rate classes. Sewer rates increased 3.5% in January 2015.
The City’s yield on cash and investments increased slightly to 1.15% in 2015 from 1.02% in 2014. The currentprojection for 2016’s rate is 1.30%. The City invests available funds with safety as the primary goal. Instability in the global economy and financial markets created an unprecedented flight to quality, such as US treasuries, which has resulted in downward pressure on yields. Investment vehicles utilized by the City to ensure safety first are yielding interest rates at historic lows.
11
City of Thornton, Colorado Management’s Discussion and Analysis
December 31, 2015
All of these factors were considered in preparing the City’s budget for the 2016 fiscal year.
Ending unassigned fund balance in the General Fund was $519,210. Anticipated revenues and the use of this fund balance are expected to be adequate to fund necessary governmental operations and to keep the fund balance in harmony with the City Council’s fund balance policy.
Requests for Information
This financial report is designed to provide a general overview of the City’s finances for all those with an interest in the government’s finances. Questions concerning any of the information provided in this report or requests for additional financial information should be addressed to the City Treasurer, City of Thornton, 9500 Civic Center Drive, Thornton, CO 80229 or visit the City’s website at www.cityofthornton.net.
12

BASIC FINANCIAL STATEMENTS
13
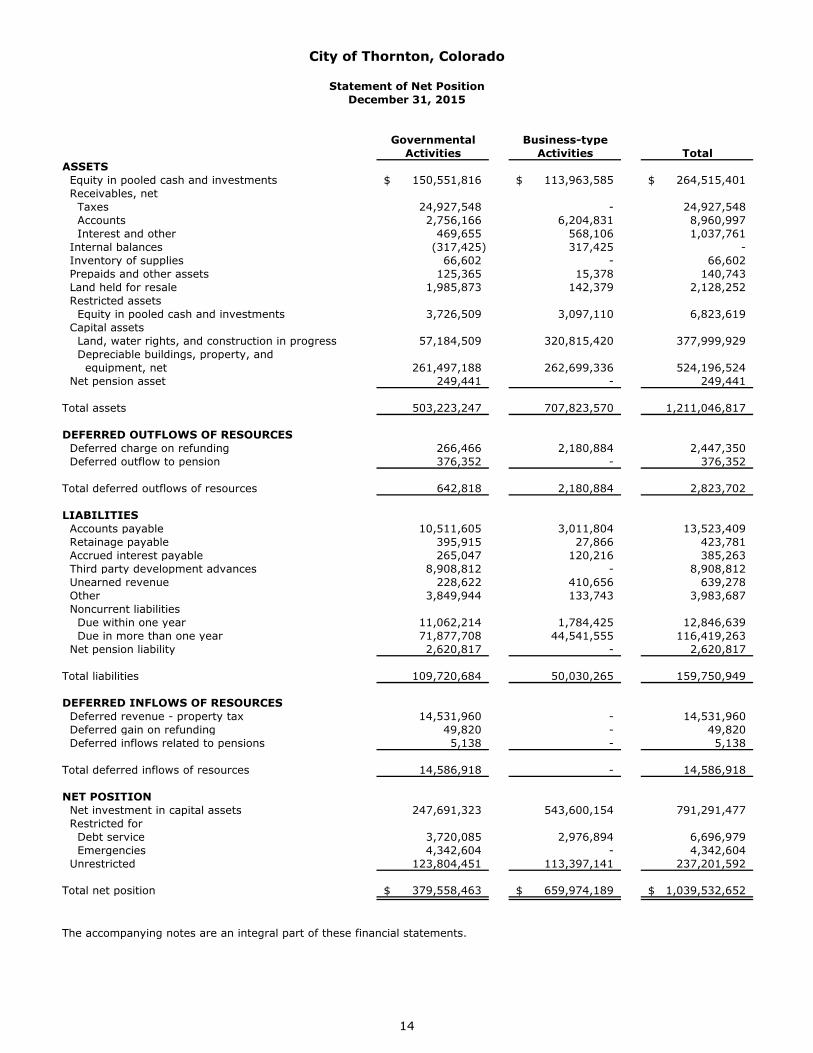
Governmental Business-typeActivities Activities Total
ASSETS Equity in pooled cash and investments 150,551,816$ 113,963,585$ 264,515,401$ Receivables, net Taxes 24,927,548 - 24,927,548 Accounts 2,756,166 6,204,831 8,960,997 Interest and other 469,655 568,106 1,037,761 Internal balances (317,425) 317,425 - Inventory of supplies 66,602 - 66,602 Prepaids and other assets 125,365 15,378 140,743 Land held for resale 1,985,873 142,379 2,128,252 Restricted assets Equity in pooled cash and investments 3,726,509 3,097,110 6,823,619 Capital assets Land, water rights, and construction in progress 57,184,509 320,815,420 377,999,929 Depreciable buildings, property, and equipment, net 261,497,188 262,699,336 524,196,524 Net pension asset 249,441 - 249,441
Total assets 503,223,247 707,823,570 1,211,046,817
DEFERRED OUTFLOWS OF RESOURCES Deferred charge on refunding 266,466 2,180,884 2,447,350 Deferred outflow to pension 376,352 - 376,352
Total deferred outflows of resources 642,818 2,180,884 2,823,702
LIABILITIES Accounts payable 10,511,605 3,011,804 13,523,409 Retainage payable 395,915 27,866 423,781 Accrued interest payable 265,047 120,216 385,263 Third party development advances 8,908,812 - 8,908,812 Unearned revenue 228,622 410,656 639,278 Other 3,849,944 133,743 3,983,687 Noncurrent liabilities Due within one year 11,062,214 1,784,425 12,846,639 Due in more than one year 71,877,708 44,541,555 116,419,263 Net pension liability 2,620,817 - 2,620,817
Total liabilities 109,720,684 50,030,265 159,750,949
DEFERRED INFLOWS OF RESOURCES Deferred revenue - property tax 14,531,960 - 14,531,960 Deferred gain on refunding 49,820 - 49,820 Deferred inflows related to pensions 5,138 - 5,138
Total deferred inflows of resources 14,586,918 - 14,586,918
NET POSITION Net investment in capital assets 247,691,323 543,600,154 791,291,477 Restricted for Debt service 3,720,085 2,976,894 6,696,979 Emergencies 4,342,604 - 4,342,604 Unrestricted 123,804,451 113,397,141 237,201,592
Total net position 379,558,463$ 659,974,189$ 1,039,532,652$
The accompanying notes are an integral part of these financial statements.
City of Thornton, Colorado
Statement of Net PositionDecember 31, 2015
14
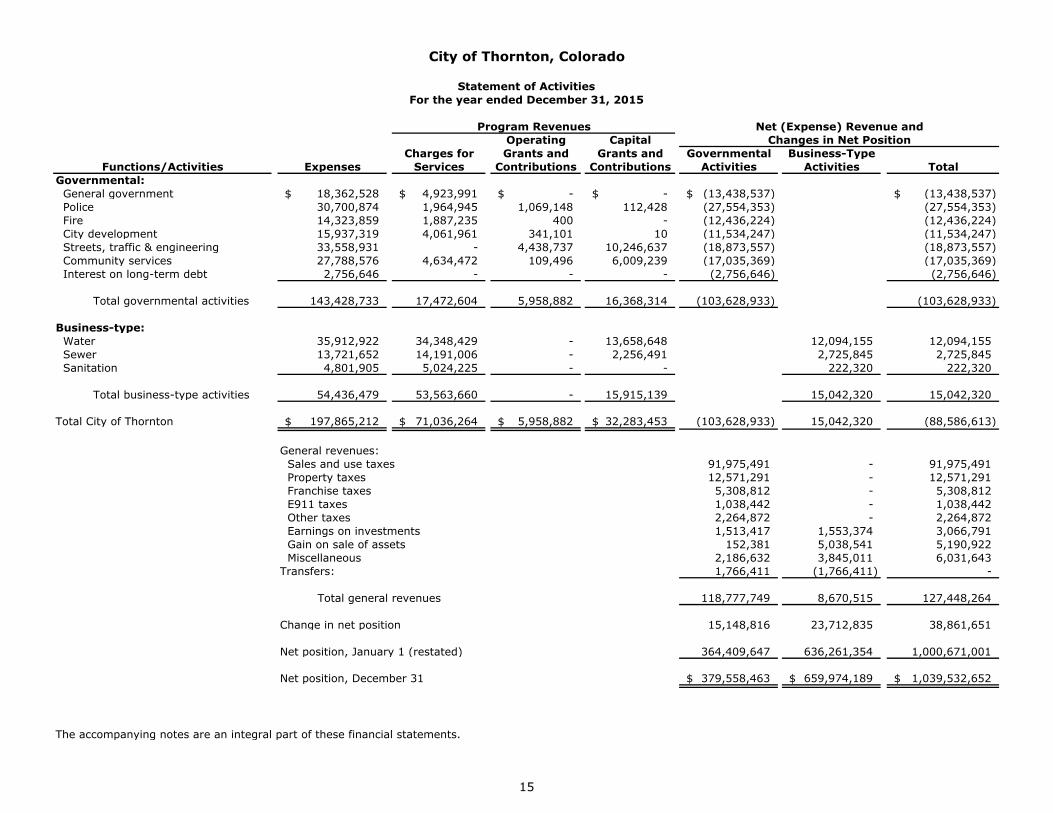
Operating CapitalCharges for Grants and Grants and Governmental Business-Type
Functions/Activities Expenses Services Contributions Contributions Activities Activities TotalGovernmental: General government 18,362,528$ 4,923,991$ -$ -$ (13,438,537)$ (13,438,537)$ Police 30,700,874 1,964,945 1,069,148 112,428 (27,554,353) (27,554,353) Fire 14,323,859 1,887,235 400 - (12,436,224) (12,436,224) City development 15,937,319 4,061,961 341,101 10 (11,534,247) (11,534,247) Streets, traffic & engineering 33,558,931 - 4,438,737 10,246,637 (18,873,557) (18,873,557) Community services 27,788,576 4,634,472 109,496 6,009,239 (17,035,369) (17,035,369) Interest on long-term debt 2,756,646 - - - (2,756,646) (2,756,646)
Total governmental activities 143,428,733 17,472,604 5,958,882 16,368,314 (103,628,933) (103,628,933)
Business-type: Water 35,912,922 34,348,429 - 13,658,648 12,094,155 12,094,155 Sewer 13,721,652 14,191,006 - 2,256,491 2,725,845 2,725,845 Sanitation 4,801,905 5,024,225 - - 222,320 222,320
Total business-type activities 54,436,479 53,563,660 - 15,915,139 15,042,320 15,042,320
Total City of Thornton 197,865,212$ 71,036,264$ 5,958,882$ 32,283,453$ (103,628,933) 15,042,320 (88,586,613)
General revenues: Sales and use taxes 91,975,491 - 91,975,491 Property taxes 12,571,291 - 12,571,291 Franchise taxes 5,308,812 - 5,308,812 E911 taxes 1,038,442 - 1,038,442 Other taxes 2,264,872 - 2,264,872 Earnings on investments 1,513,417 1,553,374 3,066,791 Gain on sale of assets 152,381 5,038,541 5,190,922 Miscellaneous 2,186,632 3,845,011 6,031,643 Transfers: 1,766,411 (1,766,411) -
Total general revenues 118,777,749 8,670,515 127,448,264
Change in net position 15,148,816 23,712,835 38,861,651
Net position, January 1 (restated) 364,409,647 636,261,354 1,000,671,001
Net position, December 31 379,558,463$ 659,974,189$ 1,039,532,652$
The accompanying notes are an integral part of these financial statements.
Changes in Net Position
City of Thornton, Colorado
Statement of ActivitiesFor the year ended December 31, 2015
Program Revenues Net (Expense) Revenue and
15

This Page Left Intentionally Blank
16

FUND FINANCIAL STATEMENTS
17
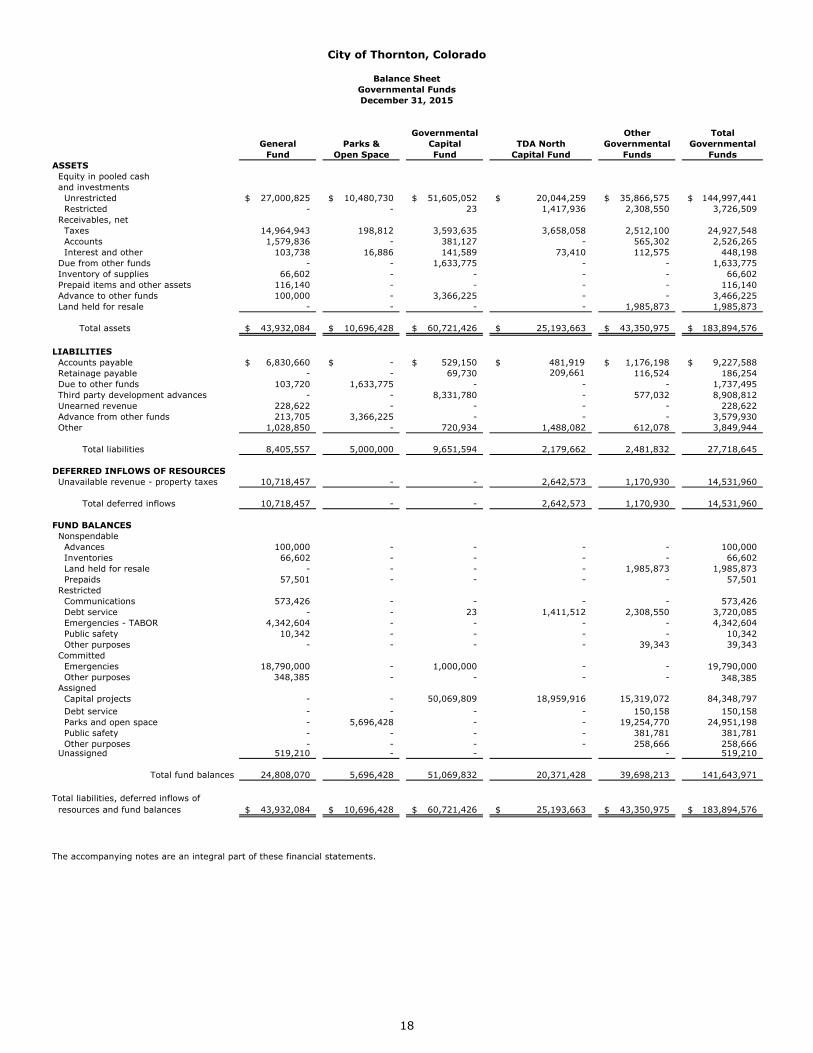
City of Thornton, Colorado
Balance SheetGovernmental FundsDecember 31, 2015
Governmental Other TotalGeneral Parks & Capital TDA North Governmental Governmental
Fund Open Space Fund Capital Fund Funds FundsASSETS Equity in pooled cash and investments Unrestricted 27,000,825$ 10,480,730$ 51,605,052$ 20,044,259$ 35,866,575$ 144,997,441$ Restricted - - 23 1,417,936 2,308,550 3,726,509 Receivables, net Taxes 14,964,943 198,812 3,593,635 3,658,058 2,512,100 24,927,548 Accounts 1,579,836 - 381,127 - 565,302 2,526,265 Interest and other 103,738 16,886 141,589 73,410 112,575 448,198 Due from other funds - - 1,633,775 - - 1,633,775 Inventory of supplies 66,602 - - - - 66,602 Prepaid items and other assets 116,140 - - - - 116,140 Advance to other funds 100,000 - 3,366,225 - - 3,466,225 Land held for resale - - - - 1,985,873 1,985,873
Total assets 43,932,084$ 10,696,428$ 60,721,426$ 25,193,663$ 43,350,975$ 183,894,576$
LIABILITIES Accounts payable 6,830,660$ -$ 529,150$ 481,919$ 1,176,198$ 9,227,588$ Retainage payable - - 69,730 209,661 116,524 186,254 Due to other funds 103,720 1,633,775 - - - 1,737,495 Third party development advances - - 8,331,780 - 577,032 8,908,812 Unearned revenue 228,622 - - - - 228,622 Advance from other funds 213,705 3,366,225 - - - 3,579,930 Other 1,028,850 - 720,934 1,488,082 612,078 3,849,944
Total liabilities 8,405,557 5,000,000 9,651,594 2,179,662 2,481,832 27,718,645
DEFERRED INFLOWS OF RESOURCES Unavailable revenue - property taxes 10,718,457 - - 2,642,573 1,170,930 14,531,960
Total deferred inflows 10,718,457 - - 2,642,573 1,170,930 14,531,960
FUND BALANCES Nonspendable Advances 100,000 - - - - 100,000 Inventories 66,602 - - - - 66,602 Land held for resale - - - - 1,985,873 1,985,873 Prepaids 57,501 - - - - 57,501 Restricted Communications 573,426 - - - - 573,426 Debt service - - 23 1,411,512 2,308,550 3,720,085 Emergencies - TABOR 4,342,604 - - - - 4,342,604 Public safety 10,342 - - - - 10,342 Other purposes - - - - 39,343 39,343 Committed Emergencies 18,790,000 - 1,000,000 - - 19,790,000 Other purposes 348,385 - - - - 348,385 Assigned Capital projects - - 50,069,809 18,959,916 15,319,072 84,348,797 Debt service - - - - 150,158 150,158 Parks and open space - 5,696,428 - - 19,254,770 24,951,198 Public safety - - - - 381,781 381,781 Other purposes - - - - 258,666 258,666 Unassigned 519,210 - - - 519,210
Total fund balances 24,808,070 5,696,428 51,069,832 20,371,428 39,698,213 141,643,971
Total liabilities, deferred inflows of resources and fund balances 43,932,084$ 10,696,428$ 60,721,426$ 25,193,663$ 43,350,975$ 183,894,576$
The accompanying notes are an integral part of these financial statements.
18
City of Thornton, Colorado
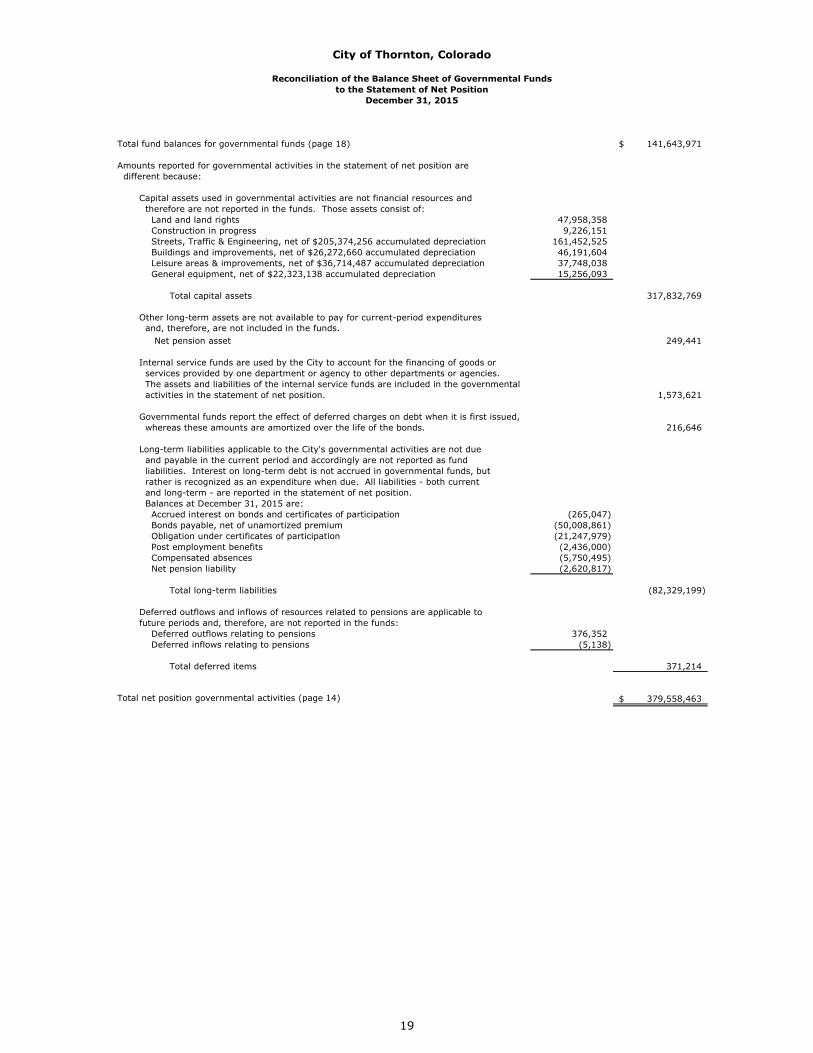
Reconciliation of the Balance Sheet of Governmental Fundsto the Statement of Net Position
December 31, 2015
Total fund balances for governmental funds (page 18) 141,643,971$
Amounts reported for governmental activities in the statement of net position are different because:
Capital assets used in governmental activities are not financial resources and therefore are not reported in the funds. Those assets consist of: Land and land rights 47,958,358 Construction in progress 9,226,151 Streets, Traffic & Engineering, net of $205,374,256 accumulated depreciation 161,452,525 Buildings and improvements, net of $26,272,660 accumulated depreciation 46,191,604 Leisure areas & improvements, net of $36,714,487 accumulated depreciation 37,748,038 General equipment, net of $22,323,138 accumulated depreciation 15,256,093
Total capital assets 317,832,769
Other long-term assets are not available to pay for current-period expenditures and, therefore, are not included in the funds. Net pension asset 249,441
Internal service funds are used by the City to account for the financing of goods or services provided by one department or agency to other departments or agencies. The assets and liabilities of the internal service funds are included in the governmental activities in the statement of net position. 1,573,621
Governmental funds report the effect of deferred charges on debt when it is first issued, whereas these amounts are amortized over the life of the bonds. 216,646
Long-term liabilities applicable to the City's governmental activities are not due and payable in the current period and accordingly are not reported as fund liabilities. Interest on long-term debt is not accrued in governmental funds, but rather is recognized as an expenditure when due. All liabilities - both current and long-term - are reported in the statement of net position. Balances at December 31, 2015 are: Accrued interest on bonds and certificates of participation (265,047) Bonds payable, net of unamortized premium (50,008,861) Obligation under certificates of participation (21,247,979) Post employment benefits (2,436,000) Compensated absences (5,750,495) Net pension liability (2,620,817)
Total long-term liabilities (82,329,199)
Deferred outflows and inflows of resources related to pensions are applicable to future periods and, therefore, are not reported in the funds: Deferred outflows relating to pensions 376,352 Deferred inflows relating to pensions (5,138)
Total deferred items 371,214
Total net position governmental activities (page 14) 379,558,463$
19
City of Thornton, Colorado
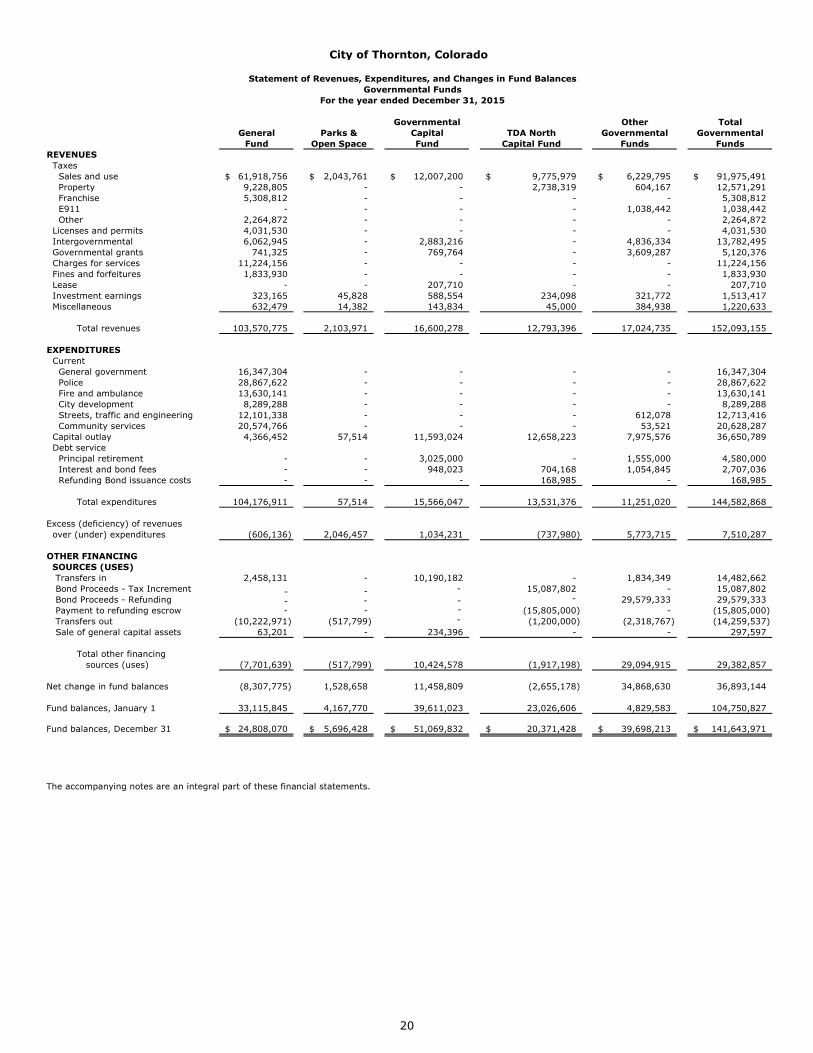
Statement of Revenues, Expenditures, and Changes in Fund BalancesGovernmental Funds
For the year ended December 31, 2015
Governmental Other TotalGeneral Parks & Capital TDA North Governmental Governmental
Fund Open Space Fund Capital Fund Funds FundsREVENUES Taxes Sales and use 61,918,756$ 2,043,761$ 12,007,200$ 9,775,979$ 6,229,795$ 91,975,491$ Property 9,228,805 - - 2,738,319 604,167 12,571,291 Franchise 5,308,812 - - - - 5,308,812 E911 - - - - 1,038,442 1,038,442 Other 2,264,872 - - - - 2,264,872 Licenses and permits 4,031,530 - - - - 4,031,530 Intergovernmental 6,062,945 - 2,883,216 - 4,836,334 13,782,495 Governmental grants 741,325 - 769,764 - 3,609,287 5,120,376 Charges for services 11,224,156 - - - - 11,224,156 Fines and forfeitures 1,833,930 - - - - 1,833,930 Lease - - 207,710 - - 207,710 Investment earnings 323,165 45,828 588,554 234,098 321,772 1,513,417 Miscellaneous 632,479 14,382 143,834 45,000 384,938 1,220,633
Total revenues 103,570,775 2,103,971 16,600,278 12,793,396 17,024,735 152,093,155
EXPENDITURES Current General government 16,347,304 - - - - 16,347,304 Police 28,867,622 - - - - 28,867,622 Fire and ambulance 13,630,141 - - - - 13,630,141 City development 8,289,288 - - - - 8,289,288 Streets, traffic and engineering 12,101,338 - - - 612,078 12,713,416 Community services 20,574,766 - - - 53,521 20,628,287 Capital outlay 4,366,452 57,514 11,593,024 12,658,223 7,975,576 36,650,789 Debt service Principal retirement - - 3,025,000 - 1,555,000 4,580,000 Interest and bond fees - - 948,023 704,168 1,054,845 2,707,036 Refunding Bond issuance costs - - - 168,985 - 168,985
Total expenditures 104,176,911 57,514 15,566,047 13,531,376 11,251,020 144,582,868
Excess (deficiency) of revenues over (under) expenditures (606,136) 2,046,457 1,034,231 (737,980) 5,773,715 7,510,287
OTHER FINANCING SOURCES (USES) Transfers in 2,458,131 - 10,190,182 - 1,834,349 14,482,662 Bond Proceeds - Tax Increment - 15,087,802 - 15,087,802 Bond Proceeds - Refunding 29,579,333 29,579,333 Payment to refunding escrow - - - (15,805,000) - (15,805,000) Transfers out (10,222,971) (517,799) - (1,200,000) (2,318,767) (14,259,537) Sale of general capital assets 63,201 - 234,396 - - 297,597
Total other financingsources (uses) (7,701,639) (517,799) 10,424,578 (1,917,198) 29,094,915 29,382,857
Net change in fund balances (8,307,775) 1,528,658 11,458,809 (2,655,178) 34,868,630 36,893,144
Fund balances, January 1 33,115,845 4,167,770 39,611,023 23,026,606 4,829,583 104,750,827
Fund balances, December 31 24,808,070$ 5,696,428$ 51,069,832$ 20,371,428$ 39,698,213$ 141,643,971$
The accompanying notes are an integral part of these financial statements.
20
- - -
- -
-
Reconciliation of the Statement of Revenues, Expenditures, and Changes inFund Balances of Governmental Funds to the Statement of Activities
For the year ended December 31, 2015
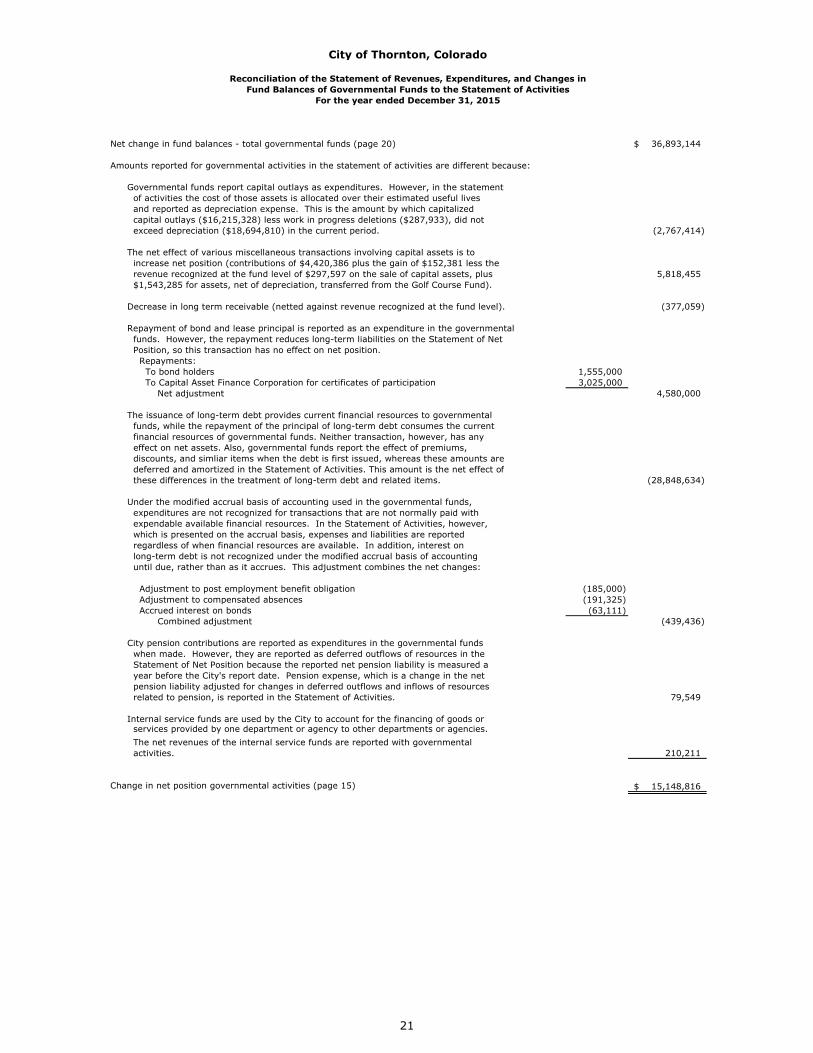
Net change in fund balances - total governmental funds (page 20) 36,893,144$
Amounts reported for governmental activities in the statement of activities are different because:
Governmental funds report capital outlays as expenditures. However, in the statement of activities the cost of those assets is allocated over their estimated useful lives and reported as depreciation expense. This is the amount by which capitalized capital outlays ($16,215,328) less work in progress deletions ($287,933), did not exceed depreciation ($18,694,810) in the current period. (2,767,414)
The net effect of various miscellaneous transactions involving capital assets is to increase net position (contributions of $4,420,386 plus the gain of $152,381 less the revenue recognized at the fund level of $297,597 on the sale of capital assets, plus 5,818,455 $1,543,285 for assets, net of depreciation, transferred from the Golf Course Fund).
Decrease in long term receivable (netted against revenue recognized at the fund level). (377,059)
Repayment of bond and lease principal is reported as an expenditure in the governmental funds. However, the repayment reduces long-term liabilities on the Statement of Net Position, so this transaction has no effect on net position. Repayments: To bond holders 1,555,000 To Capital Asset Finance Corporation for certificates of participation 3,025,000 Net adjustment 4,580,000
The issuance of long-term debt provides current financial resources to governmental funds, while the repayment of the principal of long-term debt consumes the current financial resources of governmental funds. Neither transaction, however, has any effect on net assets. Also, governmental funds report the effect of premiums, discounts, and simliar items when the debt is first issued, whereas these amounts are deferred and amortized in the Statement of Activities. This amount is the net effect of these differences in the treatment of long-term debt and related items. (28,848,634)
Under the modified accrual basis of accounting used in the governmental funds, expenditures are not recognized for transactions that are not normally paid with expendable available financial resources. In the Statement of Activities, however, which is presented on the accrual basis, expenses and liabilities are reported regardless of when financial resources are available. In addition, interest on long-term debt is not recognized under the modified accrual basis of accounting until due, rather than as it accrues. This adjustment combines the net changes:
Adjustment to post employment benefit obligation (185,000) Adjustment to compensated absences (191,325) Accrued interest on bonds (63,111) Combined adjustment (439,436)
City pension contributions are reported as expenditures in the governmental funds when made. However, they are reported as deferred outflows of resources in the Statement of Net Position because the reported net pension liability is measured a year before the City's report date. Pension expense, which is a change in the net pension liability adjusted for changes in deferred outflows and inflows of resources related to pension, is reported in the Statement of Activities. 79,549
Internal service funds are used by the City to account for the financing of goods or services provided by one department or agency to other departments or agencies. The net revenues of the internal service funds are reported with governmental activities. 210,211
Change in net position governmental activities (page 15) 15,148,816$
City of Thornton, Colorado
21
City of Thornton, Colorado
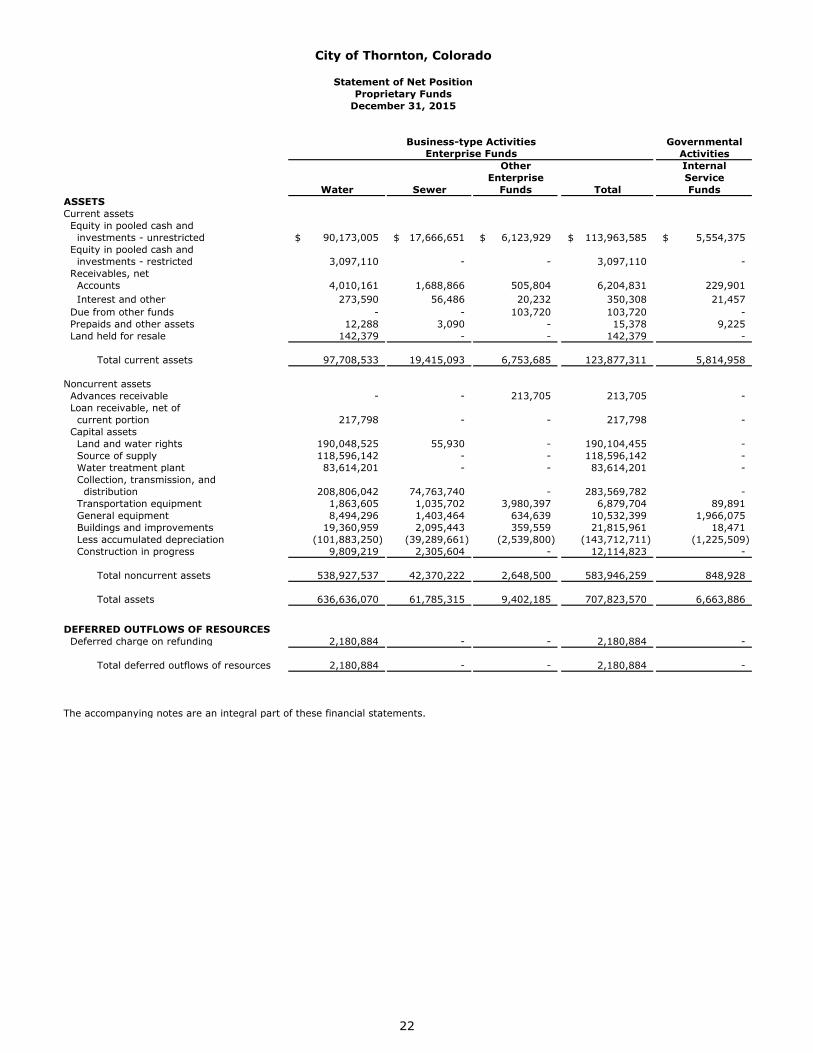
Statement of Net PositionProprietary Funds
December 31, 2015
Business-type Activities GovernmentalActivities
Other InternalEnterprise Service
Water Sewer Funds Total FundsASSETSCurrent assets Equity in pooled cash and investments - unrestricted 90,173,005$ 17,666,651$ 6,123,929$ 113,963,585$ 5,554,375$ Equity in pooled cash and investments - restricted 3,097,110 - - 3,097,110 - Receivables, net Accounts 4,010,161 1,688,866 505,804 6,204,831 229,901 Interest and other 273,590 56,486 20,232 350,308 21,457 Due from other funds - - 103,720 103,720 - Prepaids and other assets 12,288 3,090 - 15,378 9,225 Land held for resale 142,379 - - 142,379 -
Total current assets 97,708,533 19,415,093 6,753,685 123,877,311 5,814,958
Noncurrent assets Advances receivable - - 213,705 213,705 - Loan receivable, net of current portion 217,798 - - 217,798 - Capital assets Land and water rights 190,048,525 55,930 - 190,104,455 - Source of supply 118,596,142 - - 118,596,142 - Water treatment plant 83,614,201 - - 83,614,201 - Collection, transmission, and distribution 208,806,042 74,763,740 - 283,569,782 - Transportation equipment 1,863,605 1,035,702 3,980,397 6,879,704 89,891 General equipment 8,494,296 1,403,464 634,639 10,532,399 1,966,075 Buildings and improvements 19,360,959 2,095,443 359,559 21,815,961 18,471 Less accumulated depreciation (101,883,250) (39,289,661) (2,539,800) (143,712,711) (1,225,509) Construction in progress 9,809,219 2,305,604 - 12,114,823 -
Total noncurrent assets 538,927,537 42,370,222 2,648,500 583,946,259 848,928
Total assets 636,636,070 61,785,315 9,402,185 707,823,570 6,663,886
DEFERRED OUTFLOWS OF RESOURCES Deferred charge on refunding 2,180,884 - - 2,180,884 -
Total deferred outflows of resources 2,180,884 - - 2,180,884 -
The accompanying notes are an integral part of these financial statements.
Enterprise Funds
22
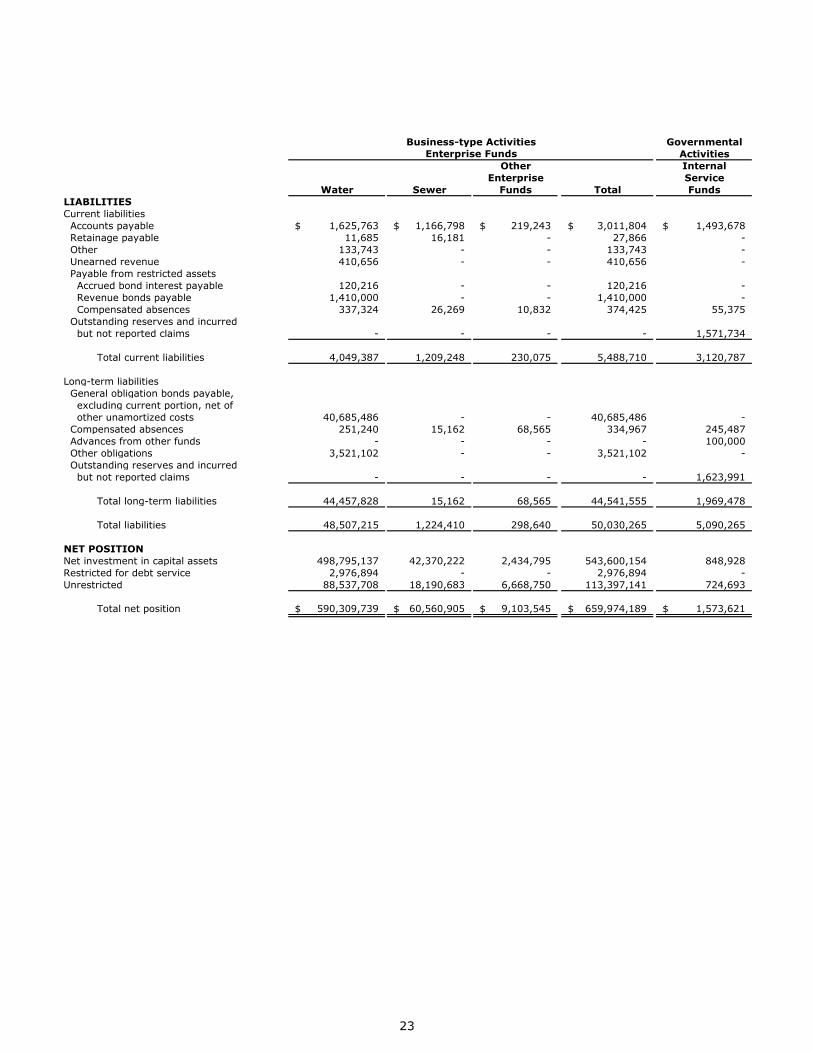
Business-type Activities GovernmentalActivities
Other InternalEnterprise Service
Water Sewer Funds Total FundsLIABILITIESCurrent liabilities Accounts payable 1,625,763$ 1,166,798$ 219,243$ 3,011,804$ 1,493,678$ Retainage payable 11,685 16,181 - 27,866 - Other 133,743 - - 133,743 - Unearned revenue 410,656 - - 410,656 - Payable from restricted assets Accrued bond interest payable 120,216 - - 120,216 - Revenue bonds payable 1,410,000 - - 1,410,000 - Compensated absences 337,324 26,269 10,832 374,425 55,375 Outstanding reserves and incurred but not reported claims - - - - 1,571,734
Total current liabilities 4,049,387 1,209,248 230,075 5,488,710 3,120,787
Long-term liabilities General obligation bonds payable, excluding current portion, net of other unamortized costs 40,685,486 - - 40,685,486 - Compensated absences 251,240 15,162 68,565 334,967 245,487 Advances from other funds - - - - 100,000 Other obligations 3,521,102 - - 3,521,102 - Outstanding reserves and incurred but not reported claims - - - - 1,623,991
Total long-term liabilities 44,457,828 15,162 68,565 44,541,555 1,969,478
Total liabilities 48,507,215 1,224,410 298,640 50,030,265 5,090,265
NET POSITIONNet investment in capital assets 498,795,137 42,370,222 2,434,795 543,600,154 848,928 Restricted for debt service 2,976,894 - - 2,976,894 - Unrestricted 88,537,708 18,190,683 6,668,750 113,397,141 724,693
Total net position 590,309,739$ 60,560,905$ 9,103,545$ 659,974,189$ 1,573,621$
Enterprise Funds
23
City of Thornton, Colorado
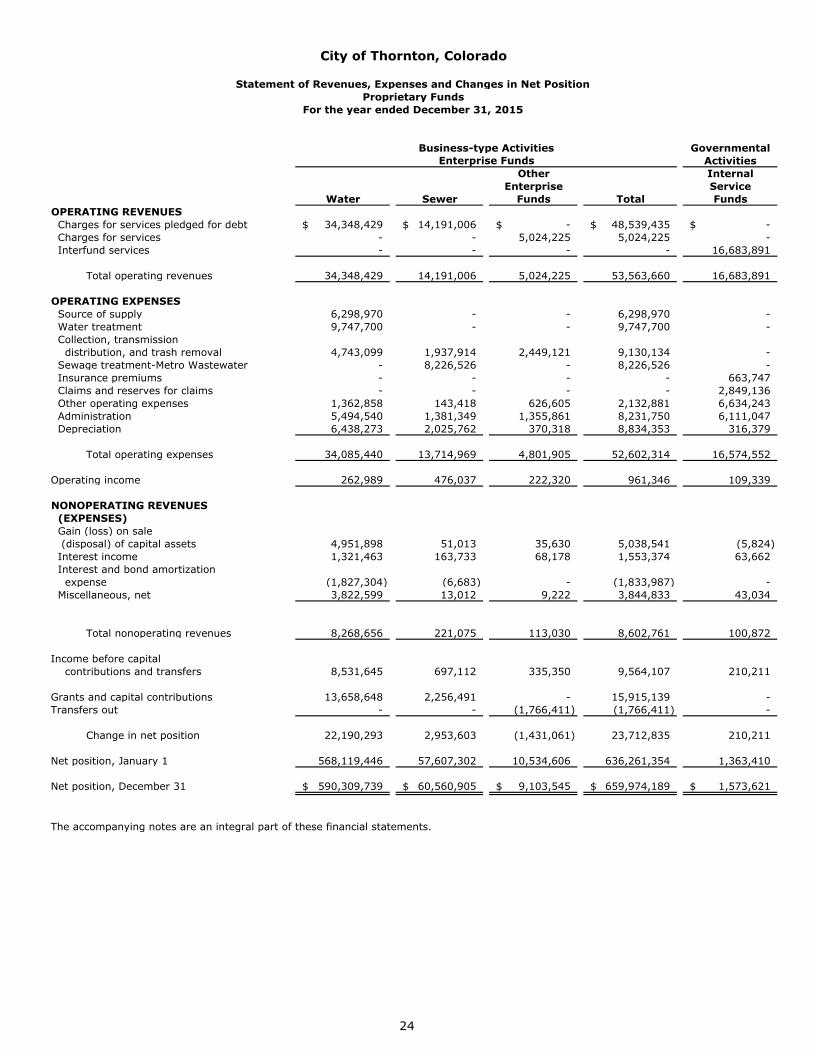
Statement of Revenues, Expenses and Changes in Net PositionProprietary Funds
For the year ended December 31, 2015
Business-type Activities GovernmentalActivities
Other InternalEnterprise Service
Water Sewer Funds Total FundsOPERATING REVENUES Charges for services pledged for debt 34,348,429$ 14,191,006$ -$ 48,539,435$ -$ Charges for services - - 5,024,225 5,024,225 - Interfund services - - - - 16,683,891
Total operating revenues 34,348,429 14,191,006 5,024,225 53,563,660 16,683,891
OPERATING EXPENSES Source of supply 6,298,970 - - 6,298,970 - Water treatment 9,747,700 - - 9,747,700 - Collection, transmission distribution, and trash removal 4,743,099 1,937,914 2,449,121 9,130,134 - Sewage treatment-Metro Wastewater - 8,226,526 - 8,226,526 - Insurance premiums - - - - 663,747 Claims and reserves for claims - - - - 2,849,136 Other operating expenses 1,362,858 143,418 626,605 2,132,881 6,634,243 Administration 5,494,540 1,381,349 1,355,861 8,231,750 6,111,047 Depreciation 6,438,273 2,025,762 370,318 8,834,353 316,379
Total operating expenses 34,085,440 13,714,969 4,801,905 52,602,314 16,574,552
Operating income 262,989 476,037 222,320 961,346 109,339
NONOPERATING REVENUES (EXPENSES) Gain (loss) on sale (disposal) of capital assets 4,951,898 51,013 35,630 5,038,541 (5,824) Interest income 1,321,463 163,733 68,178 1,553,374 63,662 Interest and bond amortization expense (1,827,304) (6,683) - (1,833,987) - Miscellaneous, net 3,822,599 13,012 9,222 3,844,833 43,034
Total nonoperating revenues 8,268,656 221,075 113,030 8,602,761 100,872
Income before capital contributions and transfers 8,531,645 697,112 335,350 9,564,107 210,211
Grants and capital contributions 13,658,648 2,256,491 - 15,915,139 - Transfers out - - (1,766,411) (1,766,411) -
Change in net position 22,190,293 2,953,603 (1,431,061) 23,712,835 210,211
Net position, January 1 568,119,446 57,607,302 10,534,606 636,261,354 1,363,410
Net position, December 31 590,309,739$ 60,560,905$ 9,103,545$ 659,974,189$ 1,573,621$
The accompanying notes are an integral part of these financial statements.
Enterprise Funds
24

This Page Left Intentionally Blank
25
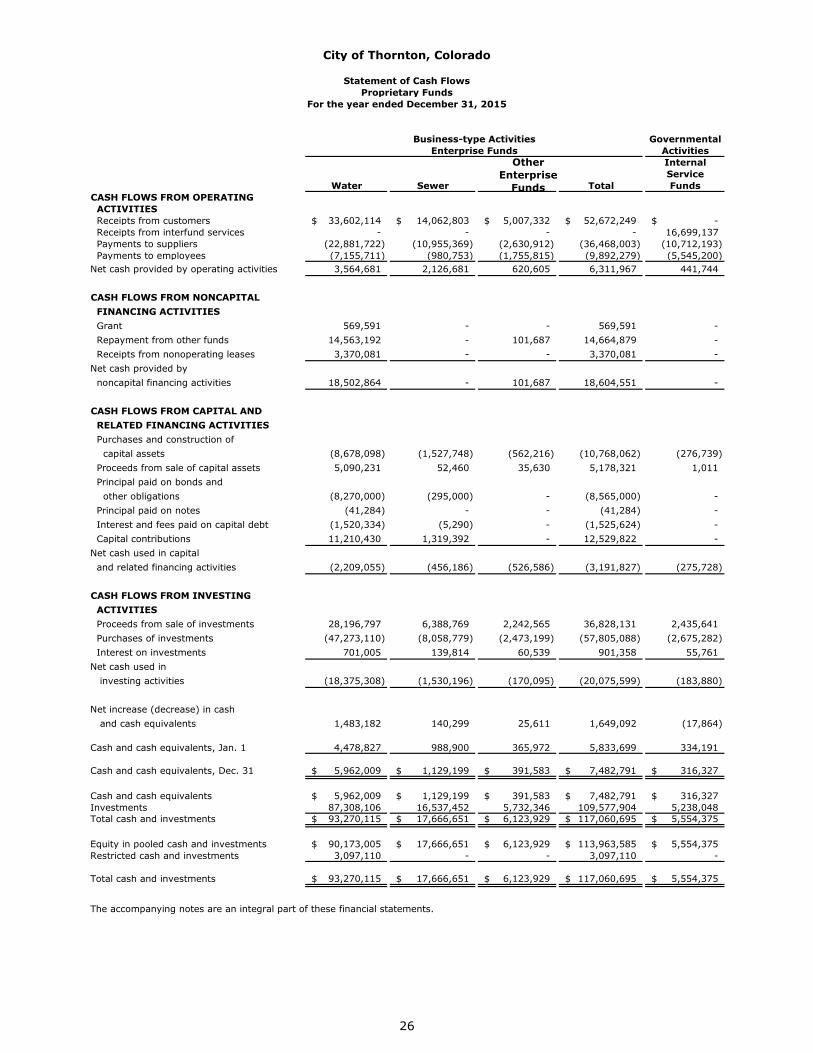
City of Thornton, Colorado
Statement of Cash FlowsProprietary Funds
For the year ended December 31, 2015
Business-type Activities GovernmentalActivitiesInternalService
Water Sewer Total FundsCASH FLOWS FROM OPERATING ACTIVITIES Receipts from customers 33,602,114$ 14,062,803$ 5,007,332$ 52,672,249$ -$ Receipts from interfund services - - - - 16,699,137 Payments to suppliers (22,881,722) (10,955,369) (2,630,912) (36,468,003) (10,712,193) Payments to employees (7,155,711) (980,753) (1,755,815) (9,892,279) (5,545,200) Net cash provided by operating activities 3,564,681 2,126,681 620,605 6,311,967 441,744
CASH FLOWS FROM NONCAPITAL FINANCING ACTIVITIES Grant 569,591 - - 569,591 - Repayment from other funds 14,563,192 - 101,687 14,664,879 - Receipts from nonoperating leases 3,370,081 - - 3,370,081 -Net cash provided by noncapital financing activities 18,502,864 - 101,687 18,604,551 -
CASH FLOWS FROM CAPITAL AND RELATED FINANCING ACTIVITIES Purchases and construction of capital assets (8,678,098) (1,527,748) (562,216) (10,768,062) (276,739) Proceeds from sale of capital assets 5,090,231 52,460 35,630 5,178,321 1,011 Principal paid on bonds and other obligations (8,270,000) (295,000) - (8,565,000) - Principal paid on notes (41,284) - - (41,284) - Interest and fees paid on capital debt (1,520,334) (5,290) - (1,525,624) - Capital contributions 11,210,430 1,319,392 - 12,529,822 -Net cash used in capital and related financing activities (2,209,055) (456,186) (526,586) (3,191,827) (275,728)
CASH FLOWS FROM INVESTING ACTIVITIES Proceeds from sale of investments 28,196,797 6,388,769 2,242,565 36,828,131 2,435,641 Purchases of investments (47,273,110) (8,058,779) (2,473,199) (57,805,088) (2,675,282) Interest on investments 701,005 139,814 60,539 901,358 55,761 Net cash used in investing activities (18,375,308) (1,530,196) (170,095) (20,075,599) (183,880)
Net increase (decrease) in cash and cash equivalents 1,483,182 140,299 25,611 1,649,092 (17,864)
Cash and cash equivalents, Jan. 1 4,478,827 988,900 365,972 5,833,699 334,191
Cash and cash equivalents, Dec. 31 5,962,009$ 1,129,199$ 391,583$ 7,482,791$ 316,327$
Cash and cash equivalents 5,962,009$ 1,129,199$ 391,583$ 7,482,791$ 316,327$ Investments 87,308,106 16,537,452 5,732,346 109,577,904 5,238,048 Total cash and investments 93,270,115$ 17,666,651$ 6,123,929$ 117,060,695$ 5,554,375$
Equity in pooled cash and investments 90,173,005$ 17,666,651$ 6,123,929$ 113,963,585$ 5,554,375$ Restricted cash and investments 3,097,110 - - 3,097,110 -
Total cash and investments 93,270,115$ 17,666,651$ 6,123,929$ 117,060,695$ 5,554,375$
The accompanying notes are an integral part of these financial statements.
Enterprise Funds
26
OtherEnterprise
Funds
Business-type Activities GovernmentalActivitiesInternalService
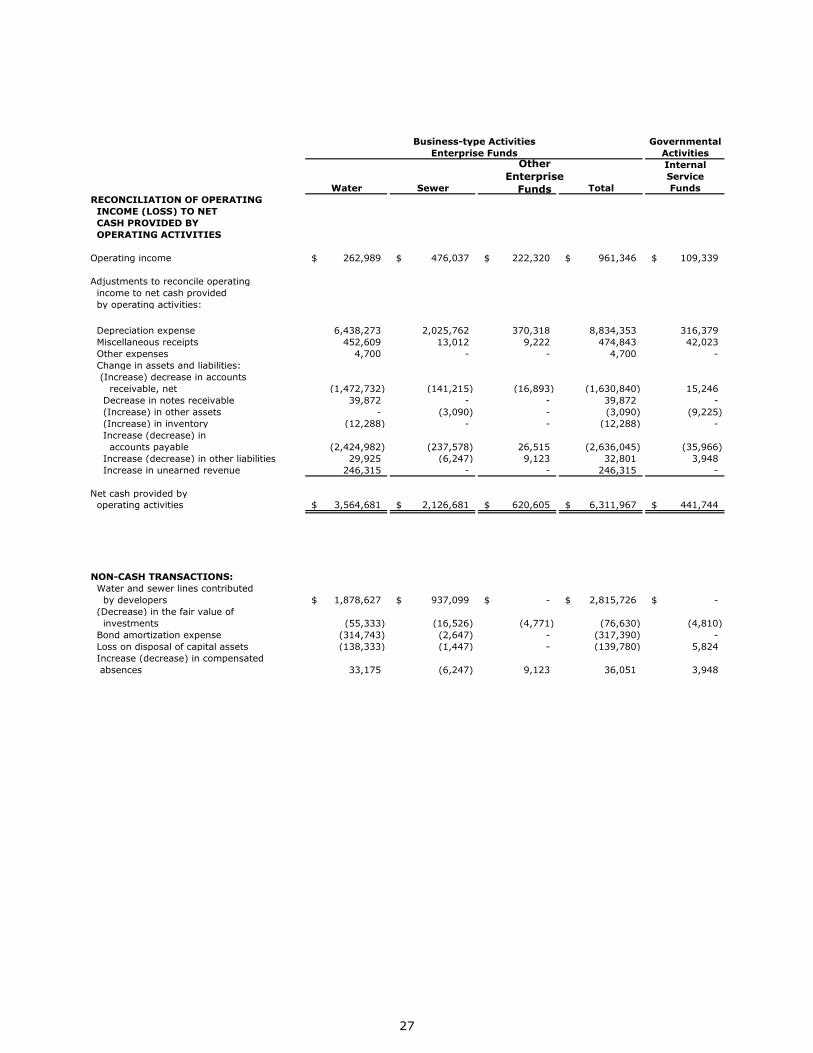
Water Sewer Total FundsRECONCILIATION OF OPERATING INCOME (LOSS) TO NET CASH PROVIDED BY OPERATING ACTIVITIES
Operating income 262,989$ 476,037$ 222,320$ 961,346$ 109,339$
Adjustments to reconcile operating income to net cash provided by operating activities:
Depreciation expense 6,438,273 2,025,762 370,318 8,834,353 316,379 Miscellaneous receipts 452,609 13,012 9,222 474,843 42,023 Other expenses 4,700 - - 4,700 - Change in assets and liabilities: (Increase) decrease in accounts receivable, net (1,472,732) (141,215) (16,893) (1,630,840) 15,246 Decrease in notes receivable 39,872 - - 39,872 - (Increase) in other assets - (3,090) - (3,090) (9,225) (Increase) in inventory (12,288) - - (12,288) - Increase (decrease) in accounts payable (2,424,982) (237,578) 26,515 (2,636,045) (35,966) Increase (decrease) in other liabilities 29,925 (6,247) 9,123 32,801 3,948 Increase in unearned revenue 246,315 - - 246,315 -
Net cash provided by operating activities 3,564,681$ 2,126,681$ 620,605$ 6,311,967$ 441,744$
NON-CASH TRANSACTIONS: Water and sewer lines contributed by developers 1,878,627$ 937,099$ -$ 2,815,726$ -$ (Decrease) in the fair value of investments (55,333) (16,526) (4,771) (76,630) (4,810) Bond amortization expense (314,743) (2,647) - (317,390) - Loss on disposal of capital assets (138,333) (1,447) - (139,780) 5,824 Increase (decrease) in compensated absences 33,175 (6,247) 9,123 36,051 3,948
Enterprise Funds
27
OtherEnterprise
Funds
City of Thornton, Colorado
NOTES TO FINANCIAL STATEMENTS December 31, 2015
NOTE A - SUMMARY OF SIGNIFICANT ACCOUNTING POLICIES
The City of Thornton, Colorado (“the City”) was incorporated May 26, 1956. The citizenry voted to become a home rule city in 1967 under the provisions of Article XX of the Constitution of the State of Colorado. The City operates under a Council-Manager form of government and provides the following services, as authorized by its charter: public safety (police, fire, and ambulance), highways and streets, public improvements, water, sewer, and sanitation, culture and recreation, debt service and general administrative services, including financial, planning and zoning, and municipal court services.
The accounting policies of the City conform to accounting principles generally accepted in the United States of America as applicable to governments in accordance with those promulgated by the Governmental Accounting Standards Board (GASB). The following is a summary of the more significant policies:
1. Reporting Entity
The accompanying financial statements present the activities of the City and its four component units;organizations for which the City is financially accountable. These component units are so intertwined with the Citythat they are, in substance, the same as the City and, therefore, are blended and reported as if they were part ofthe City. None of the component units listed below report their financial statements independent from the City.
The management of the City has operational responsibility for each of the following component units, andtherefore, they are included within the reporting entity (in blended presentation):
Thornton Development Authority (TDA) - The TDA, an Urban Renewal Authority organized pursuant to Part 1,Article 25, Title 31 of the Colorado Revised Statutes, was established to finance the design and construction of theThornton Parkway highway interchange, as well as various other improvements within the TDA's boundaries. TheCity Council is the TDA's governing board. The debt of the TDA is disclosed as tax increment bonds, but is neithera general nor a limited obligation of the City. There are three urban renewal areas within the City, the SouthCapital Fund, the North Capital Fund, and the 144th Capital Fund. For ease of financial management, separatefunds were established for the improvements in each geographical area.
Thornton Arts, Sciences, and Humanities Council, Inc. (TASHCO) - TASHCO, a legally separate, nonprofitcorporation, was established to expand the Cultural Arts and Scientific program offerings within the City ofThornton. TASHCO is funded by a local grant, donations, ticket sales, and contribution from the General Fund. In2007, the City Council appointed an advisory board consisting of citizens to serve as liaison for the City Council tothe community at large to ensure programming services are meeting the needs and desires of the public. The CityCouncil is the governing board of the TASHCO and approves the annual budget, making all substantive decisionsregarding the operations of the TASHCO.
136th Avenue General Improvement District (GID) – 136th Avenue GID was established to account for thecollection of assessment revenues to be used exclusively for the purpose of constructing an interchange at 136th
Avenue and Interstate 25. The City Council is the GID’s governing board.
E911 Authority Fund – This fund was established to account for E911 surcharges received fromtelecommunications companies doing business within the City to pay for a portion of the costs authorized by Statestatute for the City to provide emergency telephone service. The City Council is the E911’s governing board.
2. Basis of Presentation
Government-wide Statements: The statement of net position and the statement of activities display informationabout the primary government (the City). These statements include the financial activities of the overallgovernment. Eliminations have been made to minimize the double-counting of internal activities. Thesestatements distinguish between the governmental and business-type activities of the City. Governmentalactivities generally are financed through taxes, intergovernmental revenues, and other nonexchange transactions.Business-type activities are financed in whole or in part by fees charged to external parties.
The statement of activities presents comparisons between direct expenses and program revenues for the differentbusiness-type activities of the City and for each function of the City’s governmental activities. Direct expenses arethose that are specifically associated with a program or function and, therefore, are clearly identifiable to aparticular function. Indirect expense allocations that have been made in the funds have been reversed for thestatement of activities. Program revenues include (a) charges to customers who purchase, use, or directly benefitfrom goods, services, or privileges provided by a given program and (b) grants and contributions that arerestricted to meeting the operational or capital requirements of a particular program. Revenues that are notclassified as program revenues, including all taxes, are presented as general revenues.
28
City of Thornton, Colorado NOTES TO FINANCIAL STATEMENTS
December 31, 2015
NOTE A – SUMMARY OF SIGNIFICANT ACCOUNTING POLICIES (CONTINUED) 2. Basis of Presentation (Continued) Fund Financial Statements: The fund financial statements provide information about the City’s funds, including its
blended component units. Separate statements are provided for governmental and proprietary funds. The emphasis of fund financial statements is on major governmental and enterprise funds, each displayed in a separate column. All remaining governmental and enterprise funds are aggregated and reported as non-major funds.
The City reports the following major governmental funds:
General Fund. This is the City’s primary operating fund. It accounts for all financial resources of the general government, except those required to be accounted for in another fund. Governmental Capital Fund. This fund accounts for capital improvement projects financed by current resources (investment income, sales and use tax), as well as by restricted grant and intergovernmental revenues, developer contributions, and bond proceeds. Parks and Open Space Fund. This fund accounts for one-third of the .25% open space tax to be used exclusively for the purchase and development of parks and open space in the City, based on the recommendations of the Parks and Open Space Advisory Committee (POSAC). TDA North Capital Fund. This fund accounts for debt service and capital improvement projects within the Authority boundaries financed by current resources (property tax, sales tax, investment income) and by bond proceeds.
The City reports the following major enterprise funds:
Water Utility Fund. This fund accounts for the provision of water services to residents of the City and some residents of unincorporated Adams County. Sewer Utility Fund. This fund accounts for the provision of sewer services to residents of the City and some residents of unincorporated Adams County.
Fund types that do not meet the criteria of major funds have been summarized and presented as other governmental funds and other enterprise funds within the fund financial statements as appropriate. Additionally, the City reports the following fund type:
Internal Service Funds. These funds account for the costs related to providing the departments of the City with a comprehensive program to manage its property, liability, and work-related injury risk; computer support of all information technology; copying and mailing; fuel purchased and utilized by Adams County School District 12; and building maintenance, repairs and custodial services; all on a cost-reimbursement basis.
3. Measurement Focus, Basis of Accounting Government-wide and Proprietary Fund Financial Statements. The government-wide and proprietary fund
financial statements are reported using the economic resources measurement focus and the accrual basis of accounting. Revenues are recorded when earned and expenses are recorded at the time liabilities are incurred, regardless of when the related cash flows take place. Nonexchange transactions, in which the City gives (or receives) value without directly receiving (or giving) equal value in exchange, include property taxes and grants. Property taxes are recognized as revenues in the year for which they are levied. Grants and similar items are recognized as revenue as soon as all eligibility requirements imposed by the provider have been satisfied.
Amounts reported as program revenues include 1) charges to customers for goods, services, or privileges
provided, 2) operating grants and contributions, and 3) capital grants and contributions, including special assessments. Internally dedicated resources are reported as general revenues rather than as program revenues. Likewise, general revenues include all taxes.
Governmental Fund Financial Statements. Governmental funds are reported using the current financial resources
measurement focus and the modified accrual basis of accounting. Under this method, revenues are recognized when measurable and available. The City considers all revenues reported in the governmental funds to be
29
City of Thornton, Colorado
NOTES TO FINANCIAL STATEMENTS December 31, 2015
NOTE A – SUMMARY OF SIGNIFICANT ACCOUNTING POLICIES (CONTINUED)
3. Measurement Focus, Basis of Accounting (Continued)
available if the revenues are collected within ninety days after year end, with the exception of sales tax, for whichrevenues collected and held by vendors at year end on behalf of the City is recognized as revenue if collectedwithin thirty days after year end, and property taxes, for which revenues collected within thirty days after yearend are recognized.
Those revenues susceptible to accrual are property, franchise, cigarette, sales and some use taxes, interestrevenue, and charges for services. Fines and forfeitures, licenses and permits, and building use tax revenues arenot susceptible to accrual because generally they are not measurable until received in cash. Expenditure-drivengrants are recognized as revenue when the qualifying expenditures have been incurred and all other grantrequirements have been met. All other revenue items are considered to be measurable and available only whencash is received by the City.
Expenditures are recorded when the related fund liability is incurred. Principal and interest on long-term debt arerecorded as fund liabilities when due or when amounts have been accumulated in the debt service fund forpayments to be made early in the following year. Capital asset acquisitions are reported as expenditures ingovernmental funds. Proceeds of long-term debt and acquisitions under capital leases are reported as otherfinancing sources.
When both restricted and unrestricted resources are available for use, it is the City’s policy to use restrictedresources first, then unrestricted resources as they are needed.
Proprietary funds distinguish operating revenues and expenses from non-operating items. Operating revenues andexpenses generally result from providing services and producing and delivering goods in connection with aproprietary fund’s principal ongoing operations. The principal operating revenues of the enterprise funds andinternal service funds are charges to customers for sales or services. Operating expenses for enterprise funds andinternal service funds include the cost of sales and services, administrative expenses, and depreciation on capitalassets. All revenues and expenses not meeting this definition are reported as non-operating revenues andexpenses.
As a general rule, the effect of interfund activity has been eliminated from the government-wide financialstatements. Exceptions to this rule are the charges between the City’s utility functions and various otherfunctions, as well as an administrative fee charged by the General government activity to the other activities.Elimination of these charges would distort the costs and program revenues reported for the various functions.
4. Budgets and Budgetary Accounting
The City Council follows these procedures in establishing the budgetary data reflected in the financial statements:
a. The City Manager submits to the Mayor and the City Council a proposed budget for the fiscal yearcommencing the following January 1. The budget includes proposed expenditures of all funds and the meansof financing them.
b. A public hearing is conducted to obtain taxpayer comments.
c. Prior to the end of the fiscal year, the budget for the next fiscal year is legally adopted through passage of aresolution. An appropriation ordinance, based on the adopted budget, is enacted on or before the last day ofDecember.
d. The City Manager is authorized to transfer budgeted amounts between departments within any fund;however, any revisions that alter the total appropriations of any fund must be approved by the City Council.
e. The level on which expenditures may not legally exceed appropriations is the legally adopted annualoperating budget for each fund in total. All appropriations for operating budgets lapse at year end.
f. Budgets for governmental funds are adopted on a basis consistent with accounting principles generallyaccepted in the United States of America. Annual budgets are legally adopted for most governmental funds.In any given year, an individual fund may not be budgeted if expenditures for the year are not anticipated. In2015, all governmental funds had legally adopted annual budgets. Notes 4g. and 4h. explain funds withbudgets that are on a non-GAAP basis. Note 4i. explains budgetary practices for capital projectfunds/accounts.
30
City of Thornton, Colorado
NOTES TO FINANCIAL STATEMENTS December 31, 2015
NOTE A – SUMMARY OF SIGNIFICANT ACCOUNTING POLICIES (CONTINUED)
4. Budgets and Budgetary Accounting (Continued)
g. Budgets for governmental capital projects funds are adopted on a basis consistent with accounting principlesgenerally accepted in the United States of America, except that the City includes the capital outlay costs forpurchases of land intended for resale and excludes subsequent gains or losses on the resale of the land. Inaddition, any balances transferred due to closure of a fund and miscellaneous non-cash adjustments are notbudgeted.
h. Budgets for proprietary funds are adopted on a basis consistent with accounting principles generally acceptedin the United States of America, except that the City excludes depreciation, amortization, gain or loss ondisposal of fixed assets, and incurred but not reported claims and includes debt service principal and interestpayments and capital outlay. In addition, any balances transferred due to closure of a fund andmiscellaneous non-cash adjustments are not budgeted. Budget to Actual schedules for each proprietary fundcan be found in the Combining & Individual Statements & Schedules section.
i. Prior to 2007, all capital projects were budgeted annually, and unspent appropriations expired at the end ofthe fiscal year. If the project was incomplete, funds had to be re-appropriated in the annual fiscal budgetprocess for the following year. Effective with the 2007 budget, the City has adopted a multi-yearappropriation for certain capital projects, identified as long term in nature, where unexpended funds will notautomatically lapse at year end, but remain appropriated until project completion. Unspent andunencumbered appropriations for those projects that remain short term in nature (annual) will continue tolapse at year end.
j. The City Council may legally amend the budget by ordinance or resolution once it has been approved.Budgeted amounts, including all amendments, are shown as adopted by the City Council.
In 2015, six budget amendments were approved by ordinance or resolution. The effect of theseamendments was an overall increase in appropriations of $91,058,697 broken down by fund type as follows:
5. Investments
Investments in securities are carried at fair value. Unrealized gains resulting from increases in fair value betweenJanuary 1 and December 31 are recognized as a component of interest income; unrealized losses resulting fromdecreases in fair value reduce interest income. Realized gains or losses on securities included in the investmentportfolio are recognized only when the related security is sold prior to the stated maturity. Certain investmentsare restricted for debt service, capital and pledge commitments.
6. Receivables and Payables
Activity between funds that are representative of lending/borrowing arrangements outstanding at the end of thefiscal year are referred to as either “due to/from other funds” (i.e., the current portion of interfund loans) or“advances to/from other funds” (i.e., the non-current portion of interfund loans). All other outstanding balancesbetween funds are reported as “due to/from other funds.” Any residual balances outstanding between thegovernmental activities and business-type activities are reported in the government-wide financial statements as“internal balances.”
7. Inventories
Inventories are valued at weighted average cost. Inventory in the General Fund consists of fuel held forconsumption. In the General Fund cost of inventory is recorded as expenditures when consumed, rather thanwhen purchased. The General Fund reserve for inventory, included in nonspendable inventories, is equal to theamount of inventory on hand to indicate that a portion of the General Fund fund balance is not available for futureexpenditures.
General Fund 10,559,618$ Special Revenue Funds 15,372,796Capital Pojects Funds 64,373,245Enterprise Funds 753,038Internal Service Funds -
91,058,697$
31
City of Thornton, Colorado NOTES TO FINANCIAL STATEMENTS
December 31, 2015
NOTE A – SUMMARY OF SIGNIFICANT ACCOUNTING POLICIES (CONTINUED) 8. Construction Advances Third party development advances for construction represent the non-refundable deposits made by developers for
specific improvements to be made by the City. The deposits will be recognized as revenue as costs are incurred on the improvements.
9. Capital Assets Capital assets, which include property, plant, equipment, water rights, and infrastructure assets (e.g. roads,
bridges, and similar items) are reported in the applicable governmental or business-type activities columns in the government-wide financial statements. The government defines capital assets as assets with an initial, individual cost of more than $5,000 and an estimated useful life in excess of one year. Property, plant and equipment purchased or acquired is carried at historical cost or estimated historical cost. Donated or contributed capital assets are recorded at their estimated fair value on the date received. General infrastructure assets are valued based on estimated original cost. The cost of normal maintenance and repairs that do not add to the value of the asset or materially extend assets’ lives are not capitalized.
GASB 51 Accounting and Financial Reporting for Intangible Assets requires that all intangible assets be classified as capital assets and recognized in the statement of net position. The term depreciation includes amortization of intangible assets.
Land, water rights, source of supply assets related to tributary water rights and permanent easements are capitalized and not depreciated. Temporary easements are capitalized and depreciated over the appropriate period. All other capital assets are depreciated using the straight-line method over the following estimated useful lives:
10. Compensated Absences
Eligible City employees earn vacation leave at a variable rate, dependent on years of service, and sick leave at the rate of 8 hours per month. Vacation and sick leave accumulate on a monthly basis and are fully vested when earned. Accumulated vacation leave cannot exceed 240 hours at the end of the year and any excess cannot be carried forward to the next year unless pre-authorized by the City Manager. For employees hired before January 1, 1995, 50% of unused sick leave over 384 hours plus accumulated vacation leave are paid upon termination, retirement or death. After 20 years of service or at age 62 and 10 years of service, 100% of the unused sick leave over 384 hours plus accumulated vacation leave are paid upon termination, retirement or death. Although sick leave hours earned after 2002 accrue, they are not compensable upon termination, retirement, or death. The liability for compensated absences reported in the government-wide and proprietary fund statements consists of unpaid, accumulated vacation and sick leave balances, as described above. Compensated absences are liquidated by the respective fund where the liability was originally accrued.
11. Long-Term Obligations In the government-wide financial statements and the proprietary fund financial statements, long-term debt and
other long-term obligations are reported as liabilities in the applicable governmental activities, business-type activities, or proprietary fund type statement of net position. Bond premiums and discounts are deferred and amortized over the life of the bonds using the effective interest or straight line method. Bonds payable are reported net of the applicable bond premium or discount.
In the governmental fund financial statements, funds recognize bond premiums and discounts during the current period. The face amount of debt issued is reported as other financing sources. Premiums received on debt issuances are reported as other financing sources while discounts on debt issuances are reported as other financing uses.
Estimated Asset Class useful lives
Infrastructure 20-75 yearsBuildings, structures and improvements 7-50 yearsLeisure areas and improvements 5-50 yearsCollection, transmission, and distribution 10-50 yearsEquipment 2-20 years
32
City of Thornton, Colorado NOTES TO FINANCIAL STATEMENTS
December 31, 2015
NOTE A – SUMMARY OF SIGNIFICANT ACCOUNTING POLICIES (CONTINUED) 11. Long-Term Obligations (Continued) GASB 49 addresses accounting and financial reporting for pollution remediation obligations. The Thornton
Development Authority, a component unit of the City, owns property which falls under voluntary remediation and had a plan with the State to actively treat subsurface contamination. The total amount spent as of year end 2010 on remediation was $1,437,056. In 2010, the City received approval from the State to stop remediation and move to monitoring only. The City has spent a total of $212,809 as of year-end 2015 for monitoring.
12. Fund Equity In the fund financial statements, fund equity of the City’s governmental funds are classified as nonspendable,
restricted, committed, assigned, or unassigned. A governmental fund may not have all five components of fund balance. The five classifications describe the relative strength of the spending constraints:
Nonspendable fund balances indicate amounts that cannot be spent either due to form (for example inventories or
prepaids) or due to legal or contractual requirements. Restricted fund balances indicate amounts constrained for a specific purpose by external parties, constitutional
provision or enabling legislation. Committed fund balances indicate amounts constrained for a specific purpose by a government using its highest
level of decision-making authority. It would require an ordinance by the City Council to remove or change the constraints placed on the resources.
Assigned fund balances indicate amounts that can be spent for specific purposes authorized by the City Manager.
For the general fund, this authority is also designated to the Finance Director and Budget Director. Unassigned fund balances indicate amounts in the general fund that are not classified as nonspendable, restricted,
committed, or assigned. The general fund is the only fund that would report a positive amount in unassigned fund balance.
When expenditures are incurred for purposes for which both restricted and unrestricted amounts are available,
restricted amounts are deemed to be used first. When expenditures are incurred for purposes for which amounts in any of the unrestricted fund balance classifications could be used, committed amounts are considered to be reduced first, followed by assigned amounts and then by unassigned amounts.
City Council establishes (and modifies or rescinds) fund balance commitments by passage of an ordinance.
Assigned fund balance is established by City Council through adoption or amendment of the budget as intended for specific purpose (such as the purchase of capital assets, construction, debt service, etc.).
13. Interfund Transactions Interfund services provided and used are accounted for as revenues, expenditures or expenses. Transactions that
constitute reimbursements to a fund for expenditures/expenses initially made from it that are properly applicable to another fund, are recorded as expenditures/expenses in the reimbursing fund and as reductions of expenditures/expenses in the fund that is reimbursed. All other interfund transactions are reported as transfers.
14. Statement of Cash Flows For purposes of the statement of cash flows, the City considers all highly liquid investments (including restricted
assets) with a maturity of three months or less when purchased to be cash equivalents. 15. Contraband Forfeitures In accordance with the Colorado Contraband Forfeiture Act (C.R.S. 16-13-501 to 511) and the Controlled
Substances Act (21 USC 881(e)(3)), forfeitures from the seizure of contraband are used for the specific purpose of law enforcement activities. These funds are included in the City's General Fund.
16. Use of Estimates The preparation of financial statements in conformity with accounting principles generally accepted in the United
States of America requires management to make estimates and assumptions that affect the reported amounts of assets and liabilities and disclosure of contingent assets and liabilities at the date of the financial statements and the reported amounts of revenues and expenditures during the reporting period. Actual results could differ from those estimates.
33
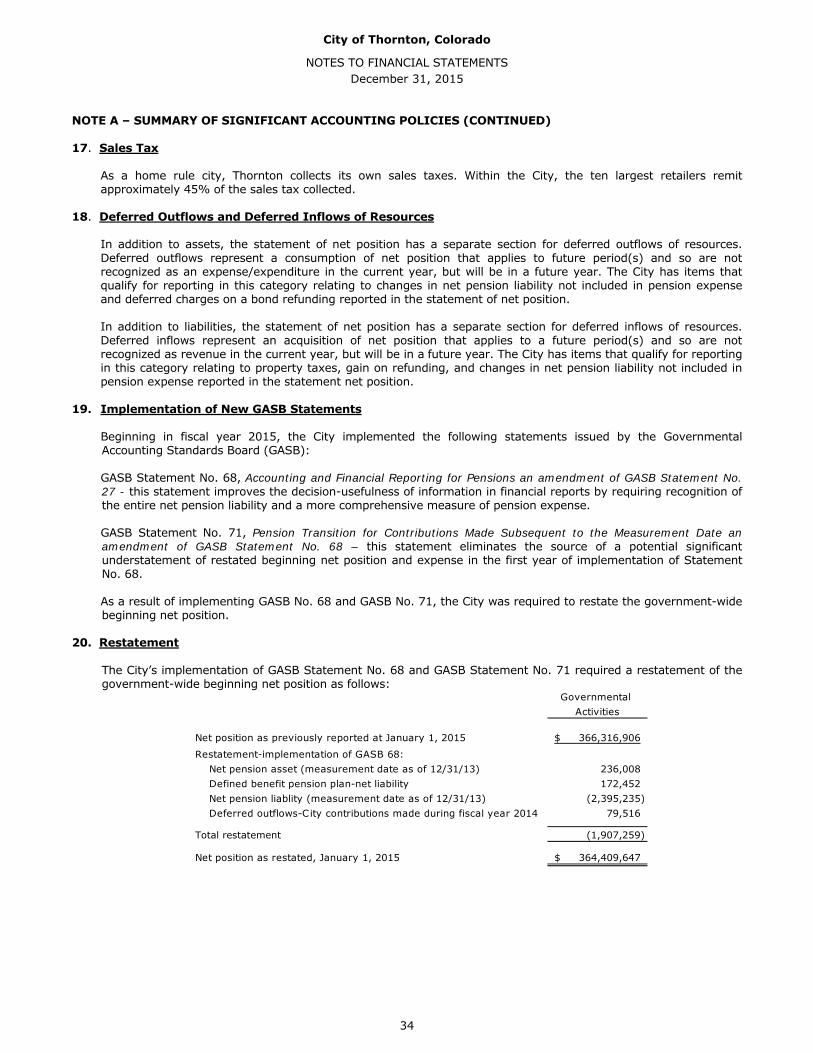
City of Thornton, Colorado
NOTES TO FINANCIAL STATEMENTS December 31, 2015
NOTE A – SUMMARY OF SIGNIFICANT ACCOUNTING POLICIES (CONTINUED)
17. Sales Tax
As a home rule city, Thornton collects its own sales taxes. Within the City, the ten largest retailers remitapproximately 45% of the sales tax collected.
18. Deferred Outflows and Deferred Inflows of Resources
In addition to assets, the statement of net position has a separate section for deferred outflows of resources.Deferred outflows represent a consumption of net position that applies to future period(s) and so are notrecognized as an expense/expenditure in the current year, but will be in a future year. The City has items thatqualify for reporting in this category relating to changes in net pension liability not included in pension expenseand deferred charges on a bond refunding reported in the statement of net position.
In addition to liabilities, the statement of net position has a separate section for deferred inflows of resources.Deferred inflows represent an acquisition of net position that applies to a future period(s) and so are notrecognized as revenue in the current year, but will be in a future year. The City has items that qualify for reportingin this category relating to property taxes, gain on refunding, and changes in net pension liability not included inpension expense reported in the statement net position.
19. Implementation of New GASB Statements
Beginning in fiscal year 2015, the City implemented the following statements issued by the GovernmentalAccounting Standards Board (GASB):
GASB Statement No. 68, Accounting and Financial Reporting for Pensions an amendment of GASB Statement No.27 - this statement improves the decision-usefulness of information in financial reports by requiring recognition ofthe entire net pension liability and a more comprehensive measure of pension expense.
GASB Statement No. 71, Pension Transition for Contributions Made Subsequent to the Measurement Date anamendment of GASB Statement No. 68 – this statement eliminates the source of a potential significantunderstatement of restated beginning net position and expense in the first year of implementation of StatementNo. 68.
As a result of implementing GASB No. 68 and GASB No. 71, the City was required to restate the government-widebeginning net position.
20. Restatement
The City’s implementation of GASB Statement No. 68 and GASB Statement No. 71 required a restatement of thegovernment-wide beginning net position as follows:
Governmental Activities
Net position as previously reported at January 1, 2015 366,316,906$
Restatement-implementation of GASB 68: Net pension asset (measurement date as of 12/31/13) 236,008 Defined benefit pension plan-net liability 172,452 Net pension liablity (measurement date as of 12/31/13) (2,395,235)
Deferred outflows-City contributions made during fiscal year 2014 79,516
Total restatement (1,907,259)
Net position as restated, January 1, 2015 364,409,647$
34
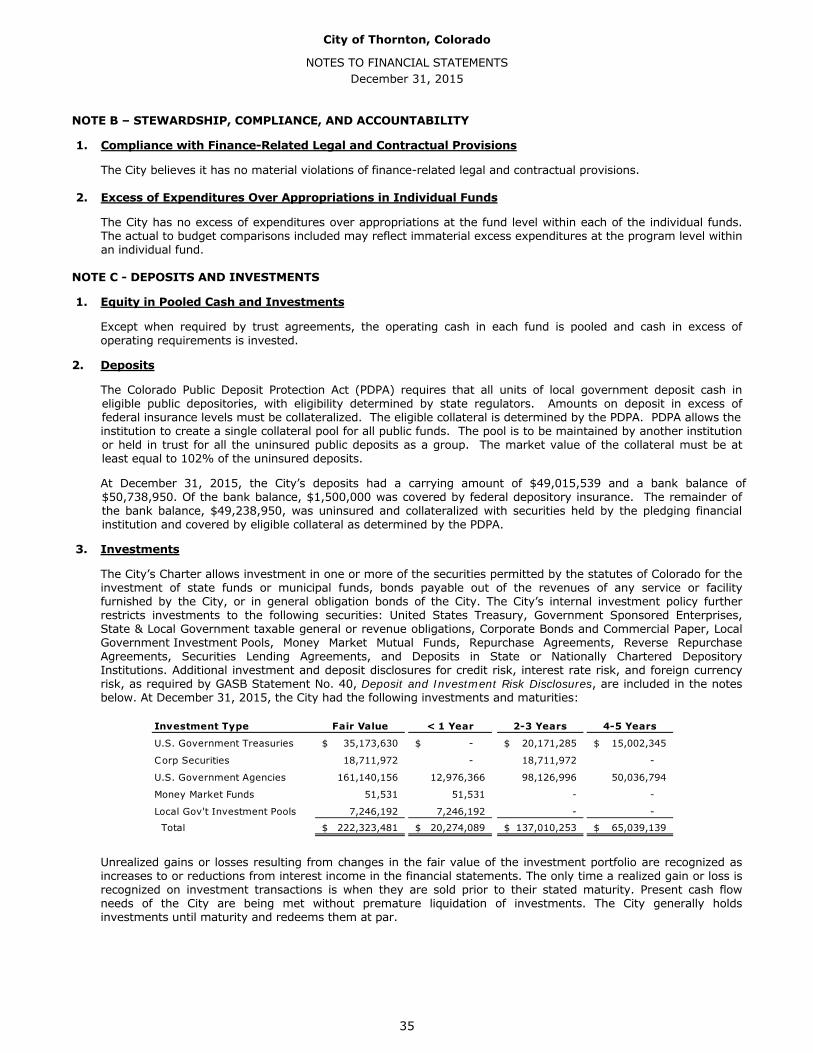
City of Thornton, Colorado
NOTES TO FINANCIAL STATEMENTS December 31, 2015
NOTE B – STEWARDSHIP, COMPLIANCE, AND ACCOUNTABILITY
1. Compliance with Finance-Related Legal and Contractual Provisions
The City believes it has no material violations of finance-related legal and contractual provisions.
2. Excess of Expenditures Over Appropriations in Individual Funds
The City has no excess of expenditures over appropriations at the fund level within each of the individual funds.The actual to budget comparisons included may reflect immaterial excess expenditures at the program level withinan individual fund.
NOTE C - DEPOSITS AND INVESTMENTS
1. Equity in Pooled Cash and Investments
Except when required by trust agreements, the operating cash in each fund is pooled and cash in excess ofoperating requirements is invested.
2. Deposits
The Colorado Public Deposit Protection Act (PDPA) requires that all units of local government deposit cash ineligible public depositories, with eligibility determined by state regulators. Amounts on deposit in excess offederal insurance levels must be collateralized. The eligible collateral is determined by the PDPA. PDPA allows theinstitution to create a single collateral pool for all public funds. The pool is to be maintained by another institutionor held in trust for all the uninsured public deposits as a group. The market value of the collateral must be atleast equal to 102% of the uninsured deposits.
At December 31, 2015, the City’s deposits had a carrying amount of $49,015,539 and a bank balance of$50,738,950. Of the bank balance, $1,500,000 was covered by federal depository insurance. The remainder of the bank balance, $49,238,950, was uninsured and collateralized with securities held by the pledging financial institution and covered by eligible collateral as determined by the PDPA.
3. Investments
The City’s Charter allows investment in one or more of the securities permitted by the statutes of Colorado for theinvestment of state funds or municipal funds, bonds payable out of the revenues of any service or facilityfurnished by the City, or in general obligation bonds of the City. The City’s internal investment policy furtherrestricts investments to the following securities: United States Treasury, Government Sponsored Enterprises,State & Local Government taxable general or revenue obligations, Corporate Bonds and Commercial Paper, LocalGovernment Investment Pools, Money Market Mutual Funds, Repurchase Agreements, Reverse RepurchaseAgreements, Securities Lending Agreements, and Deposits in State or Nationally Chartered DepositoryInstitutions. Additional investment and deposit disclosures for credit risk, interest rate risk, and foreign currencyrisk, as required by GASB Statement No. 40, Deposit and Investment Risk Disclosures, are included in the notesbelow. At December 31, 2015, the City had the following investments and maturities:
Unrealized gains or losses resulting from changes in the fair value of the investment portfolio are recognized as increases to or reductions from interest income in the financial statements. The only time a realized gain or loss is recognized on investment transactions is when they are sold prior to their stated maturity. Present cash flow needs of the City are being met without premature liquidation of investments. The City generally holds investments until maturity and redeems them at par.
Investment Type Fair Value < 1 Year 2-3 Years 4-5 Years
U.S. Government Treasuries 35,173,630$ -$ 20,171,285$ 15,002,345$
Corp Securities 18,711,972 - 18,711,972 -
U.S. Government Agencies 161,140,156 12,976,366 98,126,996 50,036,794
Money Market Funds 51,531 51,531 - -
Local Gov't Investment Pools 7,246,192 7,246,192 - -
Total 222,323,481$ 20,274,089$ 137,010,253$ 65,039,139$
35
City of Thornton, Colorado
NOTES TO FINANCIAL STATEMENTS December 31, 2015
NOTE C - DEPOSITS AND INVESTMENTS (CONTINUED)
3. Investments (Continued)
Interest Rate Risk – The City’s internal investment policy is designed to reduce interest rate risk. The maximumduration of the portfolio is limited to 4.0 years. At December 31, 2015, the weighted-average maturity of theCity’s portfolio was 28.7 months.
Credit Risk – The City minimizes credit risk, the risk of loss due to the failure of the security issuers or banker, bydiversifying the investment portfolio so that potential losses on individual securities are minimized and by limitinginvestments to specified credit ratings. No security may be purchased unless the security is rated AA-/Aa3 orbetter by Standard & Poor’s and Moody’s respectively. As of December 31, 2015, the City’s investment in U.S.Treasuries, FHLB, FFCB, FNMA, FHLMC, and Corporates were all rated AA- or better by Standard & Poor’s and Aa3or better by Moody’s.
Custodial Credit Risk – At December 31, 2015, no investment securities were held by a counterparty, and allinvestment securities were registered in the City’s name.
Concentration of Credit Risk – The City’s internal investment policy limits the amount the City may invest in oneissuer except for U.S. Treasuries. Allowed investment in U.S. Treasuries is unlimited because they are backed bythe full faith and credit of the U.S. Government. As of December 31, 2015, the City’s investment in U.S.Treasuries was 15.8%, FHLB was 21.0%, FFCB was 24.6%, FNMA was 17.3%, FHLMC was 7.2%, TVA was 2.4%,Corporate Securities was 8.4%, Local Government Investment Pools were 3.3%.
Local Government Investment Pools – As of December 31, 2015, the City had $7,100,499 invested in the ColoradoLocal Government Liquid Asset Trust (Colotrust) and $145,693 invested in the Colorado Surplus Asset Fund Trust(CSAFE). These investment vehicles were established for local government entities in Colorado to pool surplusresources; it is overseen by the Colorado Securities Commissioner and governed by CRS 24-75-701. A designatedcustodial bank provides safekeeping and depository services. The custodian’s internal records identify theinvestments owned by the participating governments. Both pools operate similarly to a money market fund andeach share is equal to $1.00 in value. Colotrust and CSAFE are rated AAAm by Standard & Poor’s.
NOTE D - PROPERTY TAXES AND RECEIVABLES
Property taxes are collected on behalf of the City by Adams County and then remitted to the City. The property tax is levied and certified in December of the year prior to the year the taxes are collected on all taxable property in the City. Property taxes become an enforceable lien on January 1 of each year. Secured property taxes are due in two equal installments, on February 28 and June 15, and are delinquent after these dates, respectively. The entire balance may be paid on April 30 without penalty. Property taxes levied are recorded as deferred inflows in the year levied, as they are not due until the following year. Property tax revenue is recognized in the subsequent tax year.
For governmental receivables, available means when due or past due and receivable within the current period, and collected within the current period or expected to be collected soon thereafter to be used to pay liabilities of the current period, generally within thirty days.
Receivables and revenues of the Ambulance division are reported net of contractual allowances and uncollectible amounts. As of December 31, 2015, total accounts receivable were $1,032,926 with an allowance for bad debt of $189,607. Total contractual allowances and uncollectible amounts related to ambulance billings of the current period are $3,491,319.
NOTE E - CAPITAL ASSETS
During 2015, several assets were reclassified in the governmental activities, including general equipment to leisure areas and improvements and leisure areas and improvements to buildings and improvements. The beginning balances for general equipment has been decreased for the transfer out of assets valued at $155,785 and accumulated depreciation of $122,741, and leisure areas and improvements increased respectively. The beginning balances of leisure areas and improvements has been decreased for the transfer out of assets valued at $1,618,353 and accumulated depreciation of $159,183, and buildings and improvements increased respectively. Governmental activities additions and transfers includes the transfer of golf course assets from the business-type activities in the following categories: land valued at $80,644; streets, traffic and engineering valued at $80,571 with accumulated depreciation of $4,205; leisure areas and improvements valued at $5,715,292 with accumulated depreciation of $5,004,842; and general equipment valued at $759,738 with accumulated depreciation of $83,910. Business-type activities also had asset reclassifications from source of supply to land and water rights. The beginning balances for land and water rights increased for the transfer of assets valued at $6,302,935, and source of supply decreased respectively.
36
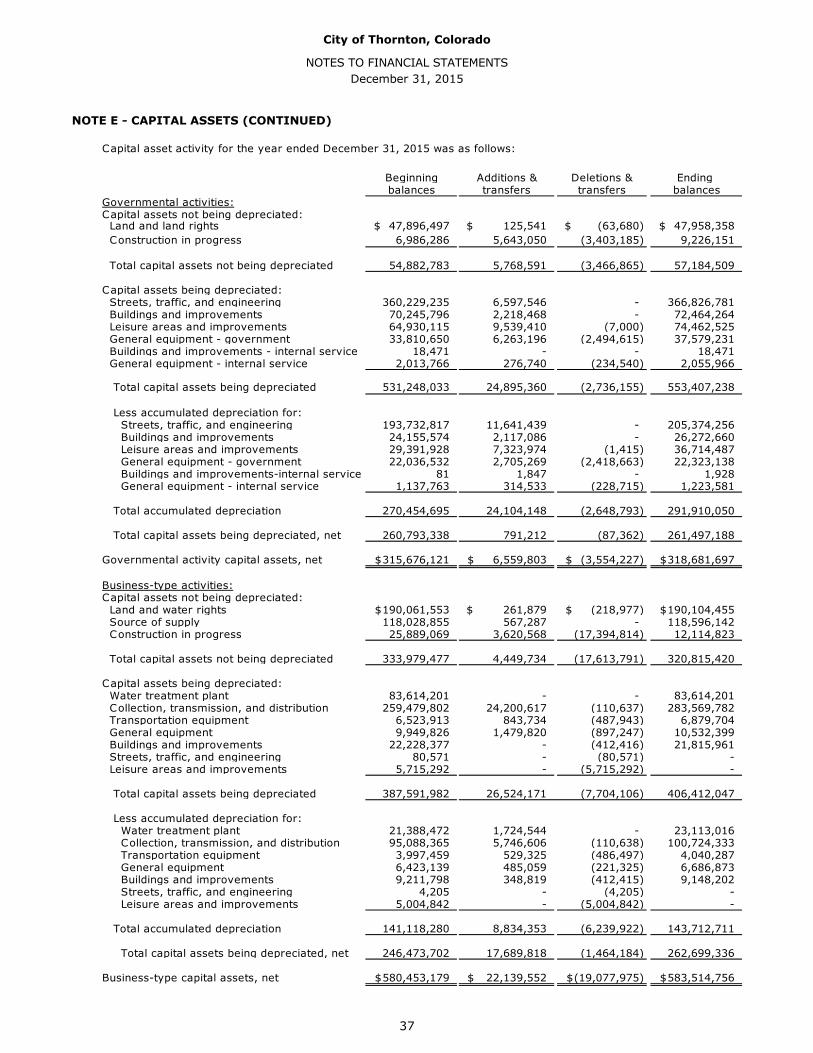
City of Thornton, Colorado NOTES TO FINANCIAL STATEMENTS
December 31, 2015
NOTE E - CAPITAL ASSETS (CONTINUED)
Capital asset activity for the year ended December 31, 2015 was as follows:
Beginning Additions & Deletions & Ending balances transfers transfers balances
Governmental activities:Capital assets not being depreciated: Land and land rights 47,896,497$ 125,541$ (63,680)$ 47,958,358$ Construction in progress 6,986,286 5,643,050 (3,403,185) 9,226,151
Total capital assets not being depreciated 54,882,783 5,768,591 (3,466,865) 57,184,509
Capital assets being depreciated: Streets, traffic, and engineering 360,229,235 6,597,546 - 366,826,781 Buildings and improvements 70,245,796 2,218,468 - 72,464,264 Leisure areas and improvements 64,930,115 9,539,410 (7,000) 74,462,525 General equipment - government 33,810,650 6,263,196 (2,494,615) 37,579,231 Buildings and improvements - internal service 18,471 - - 18,471 General equipment - internal service 2,013,766 276,740 (234,540) 2,055,966
Total capital assets being depreciated 531,248,033 24,895,360 (2,736,155) 553,407,238
Less accumulated depreciation for: Streets, traffic, and engineering 193,732,817 11,641,439 - 205,374,256 Buildings and improvements 24,155,574 2,117,086 - 26,272,660 Leisure areas and improvements 29,391,928 7,323,974 (1,415) 36,714,487 General equipment - government 22,036,532 2,705,269 (2,418,663) 22,323,138 Buildings and improvements-internal service 81 1,847 - 1,928 General equipment - internal service 1,137,763 314,533 (228,715) 1,223,581
Total accumulated depreciation 270,454,695 24,104,148 (2,648,793) 291,910,050 Total capital assets being depreciated, net 260,793,338 791,212 (87,362) 261,497,188
Governmental activity capital assets, net 315,676,121$ 6,559,803$ (3,554,227)$ 318,681,697$
Business-type activities:Capital assets not being depreciated: Land and water rights 190,061,553$ 261,879$ (218,977)$ 190,104,455$ Source of supply 118,028,855 567,287 - 118,596,142 Construction in progress 25,889,069 3,620,568 (17,394,814) 12,114,823
Total capital assets not being depreciated 333,979,477 4,449,734 (17,613,791) 320,815,420
Capital assets being depreciated: Water treatment plant 83,614,201 - - 83,614,201 Collection, transmission, and distribution 259,479,802 24,200,617 (110,637) 283,569,782 Transportation equipment 6,523,913 843,734 (487,943) 6,879,704 General equipment 9,949,826 1,479,820 (897,247) 10,532,399 Buildings and improvements 22,228,377 - (412,416) 21,815,961 Streets, traffic, and engineering 80,571 - (80,571) - Leisure areas and improvements 5,715,292 - (5,715,292) -
Total capital assets being depreciated 387,591,982 26,524,171 (7,704,106) 406,412,047
Less accumulated depreciation for: Water treatment plant 21,388,472 1,724,544 - 23,113,016 Collection, transmission, and distribution 95,088,365 5,746,606 (110,638) 100,724,333 Transportation equipment 3,997,459 529,325 (486,497) 4,040,287 General equipment 6,423,139 485,059 (221,325) 6,686,873 Buildings and improvements 9,211,798 348,819 (412,415) 9,148,202 Streets, traffic, and engineering 4,205 - (4,205) - Leisure areas and improvements 5,004,842 - (5,004,842) -
Total accumulated depreciation 141,118,280 8,834,353 (6,239,922) 143,712,711
Total capital assets being depreciated, net 246,473,702 17,689,818 (1,464,184) 262,699,336
Business-type capital assets, net 580,453,179$ 22,139,552$ (19,077,975)$ 583,514,756$
37
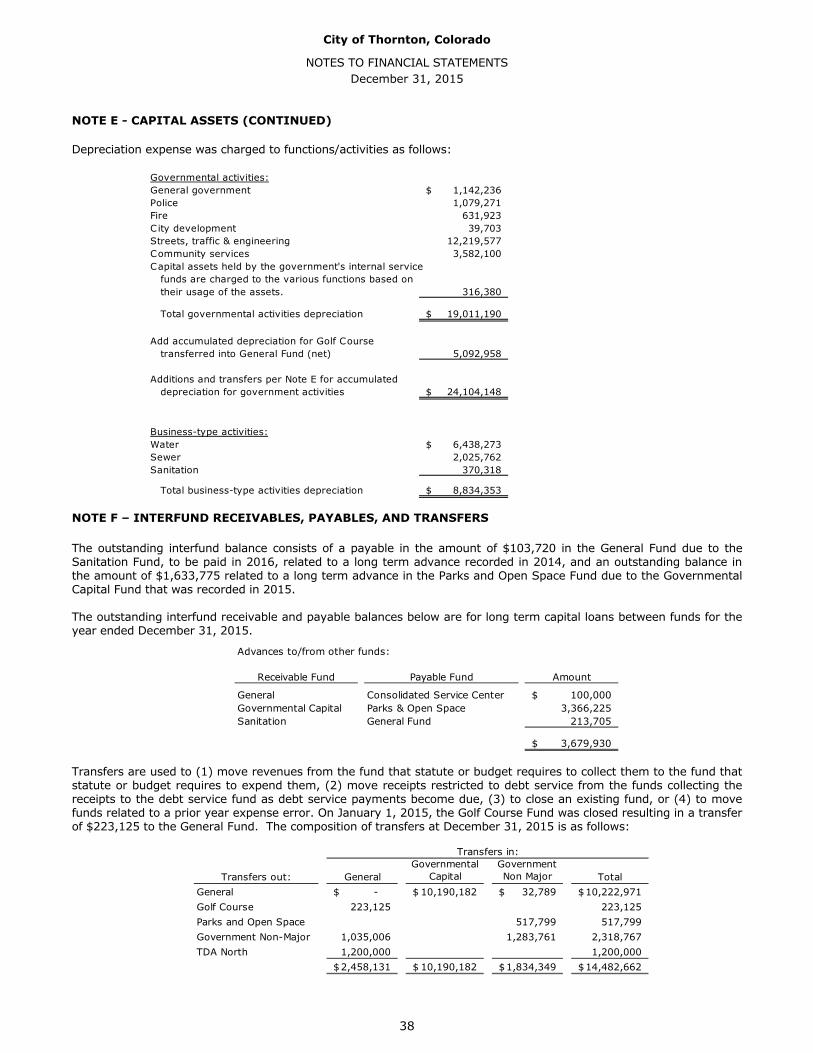
City of Thornton, Colorado
NOTES TO FINANCIAL STATEMENTS December 31, 2015
NOTE E - CAPITAL ASSETS (CONTINUED)
Depreciation expense was charged to functions/activities as follows:
NOTE F – INTERFUND RECEIVABLES, PAYABLES, AND TRANSFERS
The outstanding interfund balance consists of a payable in the amount of $103,720 in the General Fund due to the Sanitation Fund, to be paid in 2016, related to a long term advance recorded in 2014, and an outstanding balance in the amount of $1,633,775 related to a long term advance in the Parks and Open Space Fund due to the Governmental Capital Fund that was recorded in 2015.
The outstanding interfund receivable and payable balances below are for long term capital loans between funds for the year ended December 31, 2015.
Transfers are used to (1) move revenues from the fund that statute or budget requires to collect them to the fund that statute or budget requires to expend them, (2) move receipts restricted to debt service from the funds collecting the receipts to the debt service fund as debt service payments become due, (3) to close an existing fund, or (4) to move funds related to a prior year expense error. On January 1, 2015, the Golf Course Fund was closed resulting in a transfer of $223,125 to the General Fund. The composition of transfers at December 31, 2015 is as follows:
Governmental activities:General government 1,142,236$ Police 1,079,271 Fire 631,923 C ity development 39,703 Streets, traffic & engineering 12,219,577 Community services 3,582,100 Capital assets held by the government's internal service funds are charged to the various functions based on their usage of the assets. 316,380
Total governmental activities depreciation 19,011,190$
Add accumulated depreciation for Golf Course transferred into General Fund (net) 5,092,958
Additions and transfers per Note E for accumulated depreciation for government activities 24,104,148$
Business-type activities:Water 6,438,273$ Sewer 2,025,762 Sanitation 370,318
Total business-type activities depreciation 8,834,353$
Advances to/from other funds:
Receivable Fund Payable Fund Amount
General Consolidated Service Center 100,000$ Governmental Capital Parks & Open Space 3,366,225 Sanitation General Fund 213,705
3,679,930$
Transfers out: GeneralGovernmental
CapitalGovernment Non Major Total
General -$ 10,190,182$ 32,789$ 10,222,971$ Golf Course 223,125 223,125 Parks and Open Space 517,799 517,799 Government Non-Major 1,035,006 1,283,761 2,318,767 TDA North 1,200,000 1,200,000
2,458,131$ 10,190,182$ 1,834,349$ 14,482,662$
Transfers in:
38
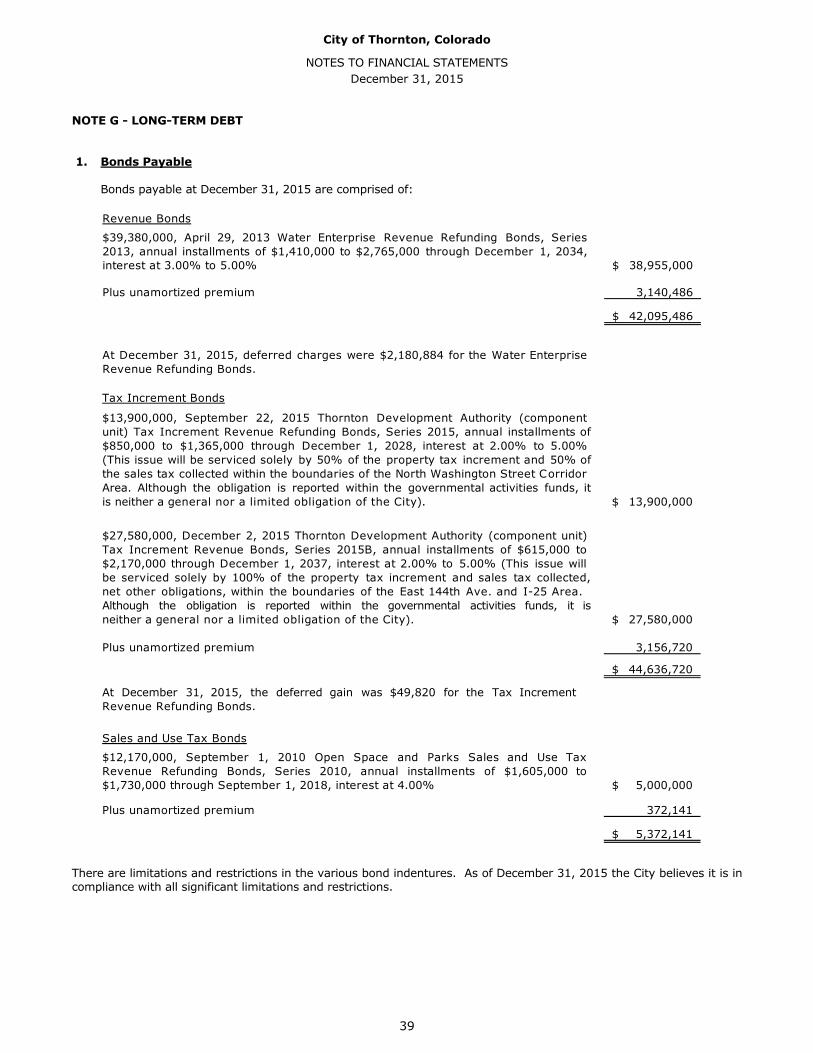
City of Thornton, Colorado
NOTES TO FINANCIAL STATEMENTS December 31, 2015
NOTE G - LONG-TERM DEBT
1. Bonds Payable
Bonds payable at December 31, 2015 are comprised of:
There are limitations and restrictions in the various bond indentures. As of December 31, 2015 the City believes it is in compliance with all significant limitations and restrictions.
Revenue Bonds
38,955,000$
Plus unamortized premium 3,140,486
42,095,486$
$39,380,000, April 29, 2013 Water Enterprise Revenue Refunding Bonds, Series2013, annual installments of $1,410,000 to $2,765,000 through December 1, 2034,interest at 3.00% to 5.00%
At December 31, 2015, deferred charges were $2,180,884 for the Water EnterpriseRevenue Refunding Bonds.
Tax Increment Bonds
13,900,000$
27,580,000$
Plus unamortized premium 3,156,720
44,636,720$
Sales and Use Tax Bonds
5,000,000$
Plus unamortized premium 372,141
5,372,141$
$12,170,000, September 1, 2010 Open Space and Parks Sales and Use TaxRevenue Refunding Bonds, Series 2010, annual installments of $1,605,000 to$1,730,000 through September 1, 2018, interest at 4.00%
$13,900,000, September 22, 2015 Thornton Development Authority (component unit) Tax Increment Revenue Refunding Bonds, Series 2015, annual installments of$850,000 to $1,365,000 through December 1, 2028, interest at 2.00% to 5.00%(This issue will be serviced solely by 50% of the property tax increment and 50% of the sales tax collected within the boundaries of the North Washington Street Corridor Area. Although the obligation is reported within the governmental activities funds, it is neither a general nor a limited obligation of the City).
$27,580,000, December 2, 2015 Thornton Development Authority (component unit) Tax Increment Revenue Bonds, Series 2015B, annual installments of $615,000 to$2,170,000 through December 1, 2037, interest at 2.00% to 5.00% (This issue will be serviced solely by 100% of the property tax increment and sales tax collected, net other obligations, within the boundaries of the East 144th Ave. and I-25 Area. Although the obligation is reported within the governmental activities funds, it is neither a general nor a limited obligation of the City).
At December 31, 2015, the deferred gain was $49,820 for the Tax Increment Revenue Refunding Bonds.
39
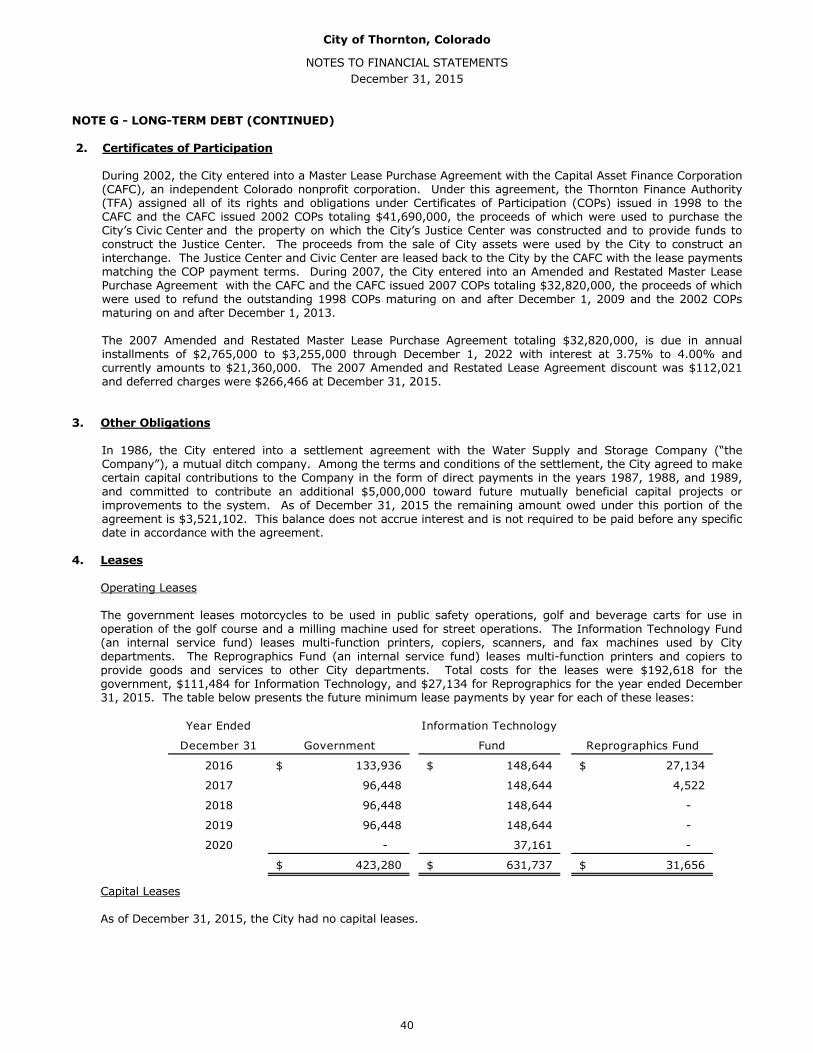
City of Thornton, Colorado
NOTES TO FINANCIAL STATEMENTS December 31, 2015
NOTE G - LONG-TERM DEBT (CONTINUED)
2. Certificates of Participation
During 2002, the City entered into a Master Lease Purchase Agreement with the Capital Asset Finance Corporation(CAFC), an independent Colorado nonprofit corporation. Under this agreement, the Thornton Finance Authority(TFA) assigned all of its rights and obligations under Certificates of Participation (COPs) issued in 1998 to theCAFC and the CAFC issued 2002 COPs totaling $41,690,000, the proceeds of which were used to purchase theCity’s Civic Center and the property on which the City’s Justice Center was constructed and to provide funds toconstruct the Justice Center. The proceeds from the sale of City assets were used by the City to construct aninterchange. The Justice Center and Civic Center are leased back to the City by the CAFC with the lease paymentsmatching the COP payment terms. During 2007, the City entered into an Amended and Restated Master LeasePurchase Agreement with the CAFC and the CAFC issued 2007 COPs totaling $32,820,000, the proceeds of whichwere used to refund the outstanding 1998 COPs maturing on and after December 1, 2009 and the 2002 COPsmaturing on and after December 1, 2013.
The 2007 Amended and Restated Master Lease Purchase Agreement totaling $32,820,000, is due in annualinstallments of $2,765,000 to $3,255,000 through December 1, 2022 with interest at 3.75% to 4.00% andcurrently amounts to $21,360,000. The 2007 Amended and Restated Lease Agreement discount was $112,021and deferred charges were $266,466 at December 31, 2015.
3. Other Obligations
In 1986, the City entered into a settlement agreement with the Water Supply and Storage Company (“theCompany”), a mutual ditch company. Among the terms and conditions of the settlement, the City agreed to makecertain capital contributions to the Company in the form of direct payments in the years 1987, 1988, and 1989,and committed to contribute an additional $5,000,000 toward future mutually beneficial capital projects orimprovements to the system. As of December 31, 2015 the remaining amount owed under this portion of theagreement is $3,521,102. This balance does not accrue interest and is not required to be paid before any specificdate in accordance with the agreement.
4. Leases
Operating Leases
The government leases motorcycles to be used in public safety operations, golf and beverage carts for use inoperation of the golf course and a milling machine used for street operations. The Information Technology Fund(an internal service fund) leases multi-function printers, copiers, scanners, and fax machines used by Citydepartments. The Reprographics Fund (an internal service fund) leases multi-function printers and copiers toprovide goods and services to other City departments. Total costs for the leases were $192,618 for thegovernment, $111,484 for Information Technology, and $27,134 for Reprographics for the year ended December31, 2015. The table below presents the future minimum lease payments by year for each of these leases:
Capital Leases
As of December 31, 2015, the City had no capital leases.
Year Ended Information Technology
December 31 Government Fund Reprographics Fund
2016 133,936$ 148,644$ 27,134$
2017 96,448 148,644 4,522
2018 96,448 148,644 -
2019 96,448 148,644 -
2020 - 37,161 -
423,280$ 631,737$ 31,656$
40
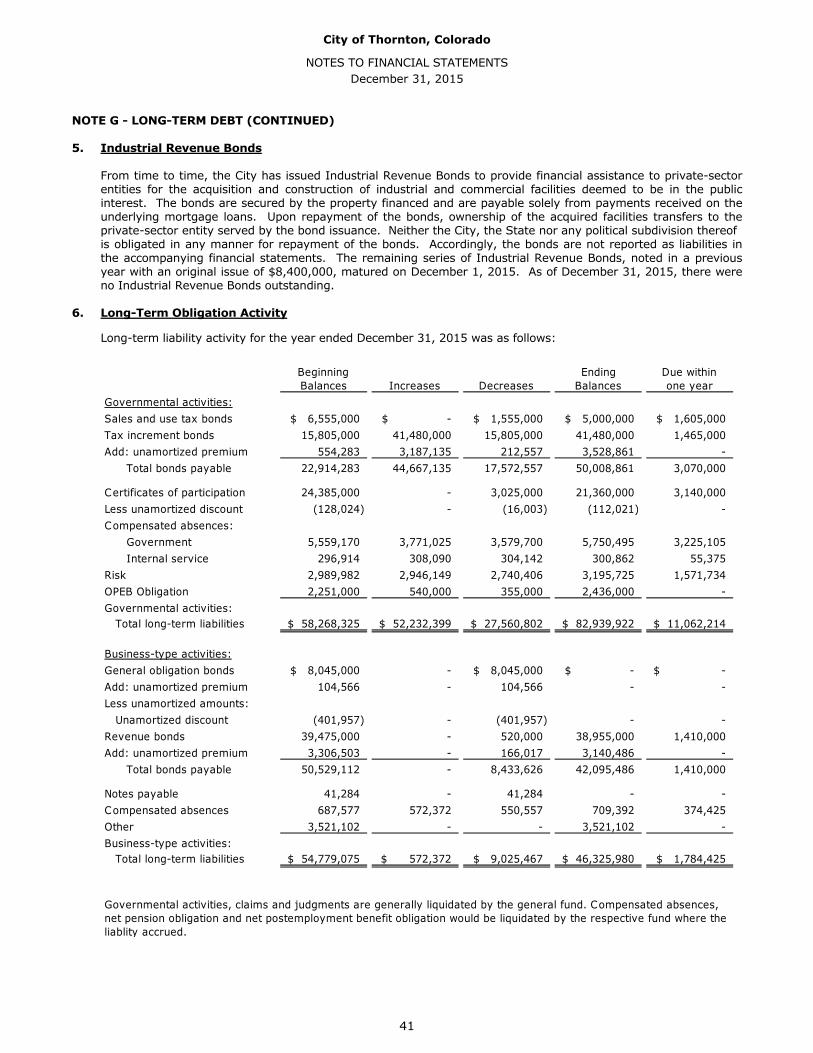
City of Thornton, Colorado
NOTES TO FINANCIAL STATEMENTS December 31, 2015
NOTE G - LONG-TERM DEBT (CONTINUED)
5. Industrial Revenue Bonds
From time to time, the City has issued Industrial Revenue Bonds to provide financial assistance to private-sectorentities for the acquisition and construction of industrial and commercial facilities deemed to be in the publicinterest. The bonds are secured by the property financed and are payable solely from payments received on theunderlying mortgage loans. Upon repayment of the bonds, ownership of the acquired facilities transfers to theprivate-sector entity served by the bond issuance. Neither the City, the State nor any political subdivision thereofis obligated in any manner for repayment of the bonds. Accordingly, the bonds are not reported as liabilities inthe accompanying financial statements. The remaining series of Industrial Revenue Bonds, noted in a previousyear with an original issue of $8,400,000, matured on December 1, 2015. As of December 31, 2015, there wereno Industrial Revenue Bonds outstanding.
6. Long-Term Obligation Activity
Long-term liability activity for the year ended December 31, 2015 was as follows:
Beginning Balances Increases Decreases
Ending Balances
Due within one year
Governmental activities:Sales and use tax bonds 6,555,000$ -$ 1,555,000$ 5,000,000$ 1,605,000$ Tax increment bonds 15,805,000 41,480,000 15,805,000 41,480,000 1,465,000 Add: unamortized premium 554,283 3,187,135 212,557 3,528,861 - Total bonds payable 22,914,283 44,667,135 17,572,557 50,008,861 3,070,000
Certificates of participation 24,385,000 - 3,025,000 21,360,000 3,140,000 Less unamortized discount (128,024) - (16,003) (112,021) - Compensated absences: Government 5,559,170 3,771,025 3,579,700 5,750,495 3,225,105 Internal service 296,914 308,090 304,142 300,862 55,375 Risk 2,989,982 2,946,149 2,740,406 3,195,725 1,571,734 OPEB Obligation 2,251,000 540,000 355,000 2,436,000 - Governmental activities: Total long-term liabilities 58,268,325$ 52,232,399$ 27,560,802$ 82,939,922$ 11,062,214$
Business-type activities:General obligation bonds 8,045,000$ - 8,045,000$ -$ -$ Add: unamortized premium 104,566 - 104,566 - - Less unamortized amounts: Unamortized discount (401,957) - (401,957) - - Revenue bonds 39,475,000 - 520,000 38,955,000 1,410,000 Add: unamortized premium 3,306,503 - 166,017 3,140,486 - Total bonds payable 50,529,112 - 8,433,626 42,095,486 1,410,000
Notes payable 41,284 - 41,284 - - Compensated absences 687,577 572,372 550,557 709,392 374,425 Other 3,521,102 - - 3,521,102 - Business-type activities: Total long-term liabilities 54,779,075$ 572,372$ 9,025,467$ 46,325,980$ 1,784,425$
Governmental activities, claims and judgments are generally liquidated by the general fund. Compensated absences, net pension obligation and net postemployment benefit obligation would be liquidated by the respective fund where the liablity accrued.
41
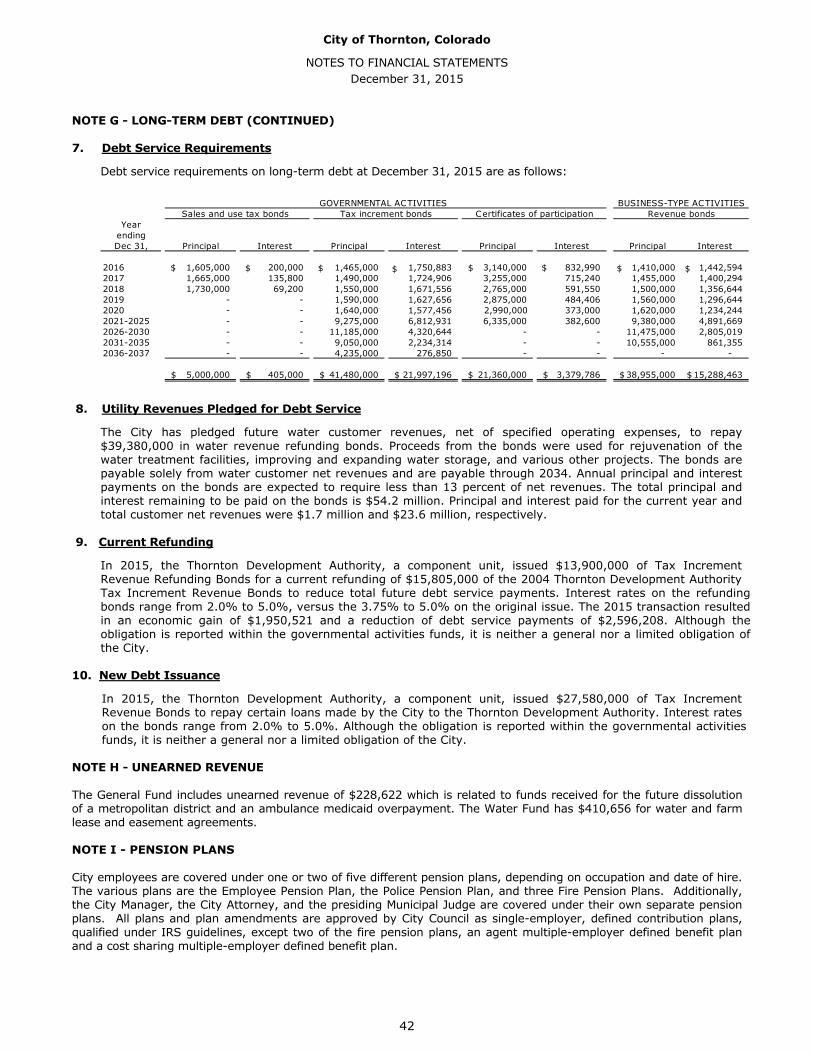
City of Thornton, Colorado
NOTES TO FINANCIAL STATEMENTS December 31, 2015
NOTE G - LONG-TERM DEBT (CONTINUED)
7. Debt Service Requirements
Debt service requirements on long-term debt at December 31, 2015 are as follows:
8. Utility Revenues Pledged for Debt Service
The City has pledged future water customer revenues, net of specified operating expenses, to repay$39,380,000 in water revenue refunding bonds. Proceeds from the bonds were used for rejuvenation of thewater treatment facilities, improving and expanding water storage, and various other projects. The bonds arepayable solely from water customer net revenues and are payable through 2034. Annual principal and interestpayments on the bonds are expected to require less than 13 percent of net revenues. The total principal andinterest remaining to be paid on the bonds is $54.2 million. Principal and interest paid for the current year andtotal customer net revenues were $1.7 million and $23.6 million, respectively.
9. Current Refunding
In 2015, the Thornton Development Authority, a component unit, issued $13,900,000 of Tax IncrementRevenue Refunding Bonds for a current refunding of $15,805,000 of the 2004 Thornton Development AuthorityTax Increment Revenue Bonds to reduce total future debt service payments. Interest rates on the refundingbonds range from 2.0% to 5.0%, versus the 3.75% to 5.0% on the original issue. The 2015 transaction resultedin an economic gain of $1,950,521 and a reduction of debt service payments of $2,596,208. Although theobligation is reported within the governmental activities funds, it is neither a general nor a limited obligation ofthe City.
10. New Debt Issuance
In 2015, the Thornton Development Authority, a component unit, issued $27,580,000 of Tax IncrementRevenue Bonds to repay certain loans made by the City to the Thornton Development Authority. Interest rateson the bonds range from 2.0% to 5.0%. Although the obligation is reported within the governmental activitiesfunds, it is neither a general nor a limited obligation of the City.
NOTE H - UNEARNED REVENUE
The General Fund includes unearned revenue of $228,622 which is related to funds received for the future dissolution of a metropolitan district and an ambulance medicaid overpayment. The Water Fund has $410,656 for water and farm lease and easement agreements.
NOTE I - PENSION PLANS
City employees are covered under one or two of five different pension plans, depending on occupation and date of hire. The various plans are the Employee Pension Plan, the Police Pension Plan, and three Fire Pension Plans. Additionally, the City Manager, the City Attorney, and the presiding Municipal Judge are covered under their own separate pension plans. All plans and plan amendments are approved by City Council as single-employer, defined contribution plans, qualified under IRS guidelines, except two of the fire pension plans, an agent multiple-employer defined benefit plan and a cost sharing multiple-employer defined benefit plan.
GOVERNMENTAL ACTIVITIES BUSINESS-TYPE ACTIVITIESSales and use tax bonds Tax increment bonds Certificates of participation Revenue bonds
YearendingDec 31, Principal Interest Principal Interest Principal Interest Principal Interest
2016 1,605,000 200,000 1,465,000 1,750,883 3,140,000 832,990 1,410,000 1,442,594 2017 1,665,000 135,800 1,490,000 1,724,906 3,255,000 715,240 1,455,000 1,400,294 2018 1,730,000 69,200 1,550,000 1,671,556 2,765,000 591,550 1,500,000 1,356,644 2019 - - 1,590,000 1,627,656 2,875,000 484,406 1,560,000 1,296,644 2020 - - 1,640,000 1,577,456 2,990,000 373,000 1,620,000 1,234,244 2021-2025 - - 9,275,000 6,812,931 6,335,000 382,600 9,380,000 4,891,669 2026-2030 - - 11,185,000 4,320,644 - - 11,475,000 2,805,019 2031-2035 - - 9,050,000 2,234,314 - - 10,555,000 861,355 2036-2037 - - 4,235,000 276,850 - - - -
5,000,000$ 405,000$ 41,480,000$ 21,997,196$ 21,360,000$ 3,379,786$ 38,955,000$ 15,288,463$
42
$ $ $ $$ $ $ $
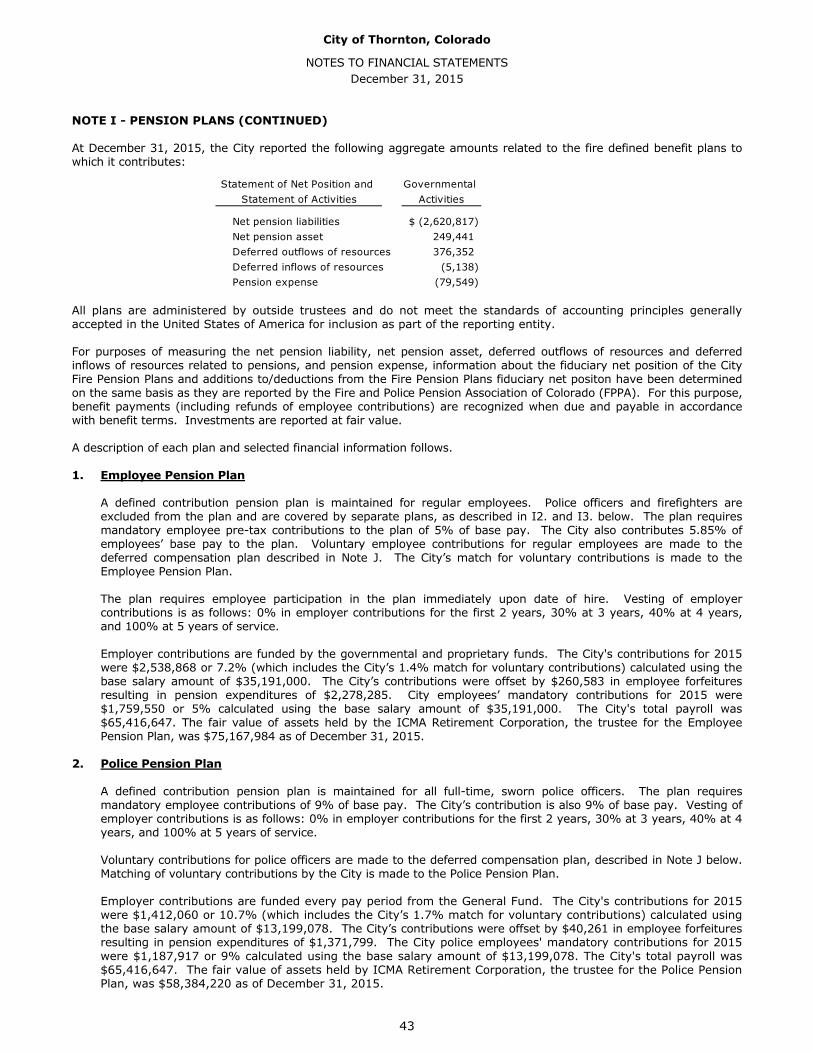
City of Thornton, Colorado
NOTES TO FINANCIAL STATEMENTS December 31, 2015
NOTE I - PENSION PLANS (CONTINUED)
At December 31, 2015, the City reported the following aggregate amounts related to the fire defined benefit plans to which it contributes:
All plans are administered by outside trustees and do not meet the standards of accounting principles generally accepted in the United States of America for inclusion as part of the reporting entity.
For purposes of measuring the net pension liability, net pension asset, deferred outflows of resources and deferred inflows of resources related to pensions, and pension expense, information about the fiduciary net position of the City Fire Pension Plans and additions to/deductions from the Fire Pension Plans fiduciary net positon have been determined on the same basis as they are reported by the Fire and Police Pension Association of Colorado (FPPA). For this purpose, benefit payments (including refunds of employee contributions) are recognized when due and payable in accordance with benefit terms. Investments are reported at fair value.
A description of each plan and selected financial information follows.
1. Employee Pension Plan
A defined contribution pension plan is maintained for regular employees. Police officers and firefighters areexcluded from the plan and are covered by separate plans, as described in I2. and I3. below. The plan requiresmandatory employee pre-tax contributions to the plan of 5% of base pay. The City also contributes 5.85% ofemployees’ base pay to the plan. Voluntary employee contributions for regular employees are made to thedeferred compensation plan described in Note J. The City’s match for voluntary contributions is made to theEmployee Pension Plan.
The plan requires employee participation in the plan immediately upon date of hire. Vesting of employercontributions is as follows: 0% in employer contributions for the first 2 years, 30% at 3 years, 40% at 4 years,and 100% at 5 years of service.
Employer contributions are funded by the governmental and proprietary funds. The City's contributions for 2015were $2,538,868 or 7.2% (which includes the City’s 1.4% match for voluntary contributions) calculated using thebase salary amount of $35,191,000. The City’s contributions were offset by $260,583 in employee forfeituresresulting in pension expenditures of $2,278,285. City employees’ mandatory contributions for 2015 were$1,759,550 or 5% calculated using the base salary amount of $35,191,000. The City's total payroll was$65,416,647. The fair value of assets held by the ICMA Retirement Corporation, the trustee for the EmployeePension Plan, was $75,167,984 as of December 31, 2015.
2. Police Pension Plan
A defined contribution pension plan is maintained for all full-time, sworn police officers. The plan requiresmandatory employee contributions of 9% of base pay. The City’s contribution is also 9% of base pay. Vesting ofemployer contributions is as follows: 0% in employer contributions for the first 2 years, 30% at 3 years, 40% at 4years, and 100% at 5 years of service.
Voluntary contributions for police officers are made to the deferred compensation plan, described in Note J below.Matching of voluntary contributions by the City is made to the Police Pension Plan.
Employer contributions are funded every pay period from the General Fund. The City's contributions for 2015were $1,412,060 or 10.7% (which includes the City’s 1.7% match for voluntary contributions) calculated usingthe base salary amount of $13,199,078. The City’s contributions were offset by $40,261 in employee forfeituresresulting in pension expenditures of $1,371,799. The City police employees' mandatory contributions for 2015were $1,187,917 or 9% calculated using the base salary amount of $13,199,078. The City's total payroll was$65,416,647. The fair value of assets held by ICMA Retirement Corporation, the trustee for the Police PensionPlan, was $58,384,220 as of December 31, 2015.
Statement of Net Position and Governmental Statement of Activities Activities
Net pension liabilities (2,620,817)$ Net pension asset 249,441 Deferred outflows of resources 376,352 Deferred inflows of resources (5,138) Pension expense (79,549)
43
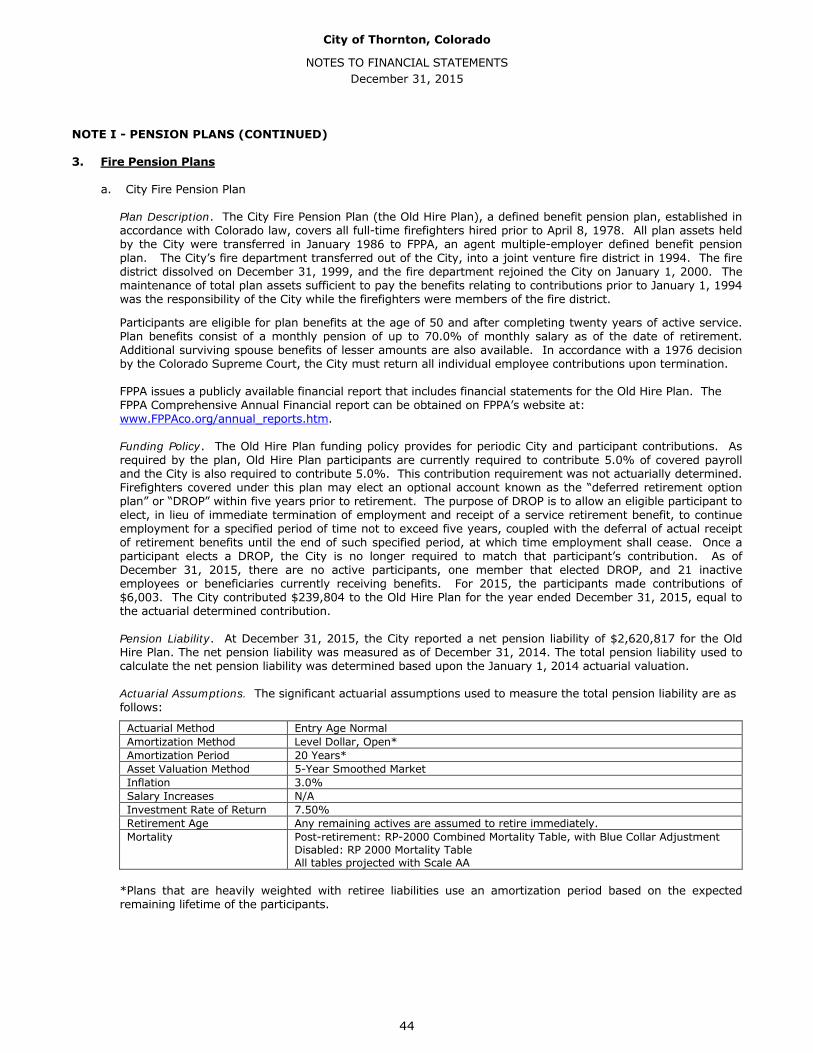
City of Thornton, Colorado
NOTES TO FINANCIAL STATEMENTS December 31, 2015
NOTE I - PENSION PLANS (CONTINUED)
3. Fire Pension Plans
a. City Fire Pension Plan
Plan Description. The City Fire Pension Plan (the Old Hire Plan), a defined benefit pension plan, established in accordance with Colorado law, covers all full-time firefighters hired prior to April 8, 1978. All plan assets held by the City were transferred in January 1986 to FPPA, an agent multiple-employer defined benefit pension plan. The City’s fire department transferred out of the City, into a joint venture fire district in 1994. The fire district dissolved on December 31, 1999, and the fire department rejoined the City on January 1, 2000. The maintenance of total plan assets sufficient to pay the benefits relating to contributions prior to January 1, 1994 was the responsibility of the City while the firefighters were members of the fire district.
Participants are eligible for plan benefits at the age of 50 and after completing twenty years of active service. Plan benefits consist of a monthly pension of up to 70.0% of monthly salary as of the date of retirement. Additional surviving spouse benefits of lesser amounts are also available. In accordance with a 1976 decision by the Colorado Supreme Court, the City must return all individual employee contributions upon termination.
FPPA issues a publicly available financial report that includes financial statements for the Old Hire Plan. The FPPA Comprehensive Annual Financial report can be obtained on FPPA’s website at: www.FPPAco.org/annual_reports.htm.
Funding Policy. The Old Hire Plan funding policy provides for periodic City and participant contributions. As required by the plan, Old Hire Plan participants are currently required to contribute 5.0% of covered payroll and the City is also required to contribute 5.0%. This contribution requirement was not actuarially determined. Firefighters covered under this plan may elect an optional account known as the “deferred retirement option plan” or “DROP” within five years prior to retirement. The purpose of DROP is to allow an eligible participant to elect, in lieu of immediate termination of employment and receipt of a service retirement benefit, to continue employment for a specified period of time not to exceed five years, coupled with the deferral of actual receipt of retirement benefits until the end of such specified period, at which time employment shall cease. Once a participant elects a DROP, the City is no longer required to match that participant’s contribution. As of December 31, 2015, there are no active participants, one member that elected DROP, and 21 inactive employees or beneficiaries currently receiving benefits. For 2015, the participants made contributions of $6,003. The City contributed $239,804 to the Old Hire Plan for the year ended December 31, 2015, equal to the actuarial determined contribution.
Pension Liability. At December 31, 2015, the City reported a net pension liability of $2,620,817 for the Old Hire Plan. The net pension liability was measured as of December 31, 2014. The total pension liability used to calculate the net pension liability was determined based upon the January 1, 2014 actuarial valuation.
Actuarial Assumptions. The significant actuarial assumptions used to measure the total pension liability are as follows:
Actuarial Method Entry Age Normal Amortization Method Level Dollar, Open* Amortization Period 20 Years* Asset Valuation Method 5-Year Smoothed Market Inflation 3.0%Salary Increases N/A Investment Rate of Return 7.50% Retirement Age Any remaining actives are assumed to retire immediately. Mortality Post-retirement: RP-2000 Combined Mortality Table, with Blue Collar Adjustment
Disabled: RP 2000 Mortality Table All tables projected with Scale AA
*Plans that are heavily weighted with retiree liabilities use an amortization period based on the expectedremaining lifetime of the participants.
44
City of Thornton, Colorado
NOTES TO FINANCIAL STATEMENTS December 31, 2015
NOTE I - PENSION PLANS (CONTINUED)
3. Fire Pension Plans (Continued)
a. City Fire Pension Plan (Continued)
Actuarial determined contribution rates are calculated as of January 1 of even numbered years. The contribution rates have a one-year lag, so the actuarial valuation as of January 1, 2012, determines the contribution amounts for 2013 and 2014.
The long-term expected rate of return on pension plan investments was determined using a building-block method in which best-estimate ranges of expected future real rates of return (expected returns, net of pension plan investment expense and inflation) are developed for each major asset class. These ranges are combined to produce the long-term expected rate of return by weighing the expected future real rates of return by the target asset allocation percentage and by adding expected inflation. Best estimates of arithmetic real rates of return for each major asset class included in the Fund's target asset allocation as of December 31, 2014 are summarized in the following table:
Discount Rate. Projected benefit payments are required to be discounted to their actuarial present values using a Single Discount Rate that reflects (1) a long-term expected rate of return on pension plan investments (to the extent that the plan's fiduciary net position is projected to be sufficient to pay benefits) and (2) tax-exempt municipal bond rate based on an index of 20-year general obligation bonds with an average AA credit rating as of the measurement date (to the extent that the plan's projected fiduciary net position is not sufficient to pay benefits).
For the purpose of this valuation, the long-term expected rate of return on pension plan investments is 7.50%; the municipal bond rate is 3.65% (based on the weekly rate closest to but not later than the measurement date of the "state & local bonds" rate from Federal Reserve statistical release (H.15); and the resulting Single Discount Rate is 7.50%.
Projected cash flows used in determining the Single Discount Rate are available from FPPA upon request.
Changes in the Net Pension Liability.
Long-termTarget Expected
Asset C lass Allocation Rate of ReturnGlobal Equity 40.0% 8.9%Equity Long/Short 10.0% 7.5%Illiquid Alternatives 18.0% 10.5%Fixed Income 15.0% 4.6%Absolute Return 12.0% 6.5%Managed Futures 4.0% 5.5%Cash 1.0% 2.5%Total 100.0%
Increase (Decrease)Total Plan Net
Pension Fiduciary PensionLiability Net Position Liability
(a) (b) (a) - (b)
Balances at December 31, 2013 7,955,511$ 5,560,276$ 2,395,235$ Changes for the year: Service cost - - - Interest 566,974 - 566,974 Differences between expected and actual experience - - - Contributions - employer - - - Contributions - employee - - - Net investment income - 352,452 (352,452) Benefit payments, including refunds of employee
contributions (806,304) (806,304) - Administrative expense - (11,060) 11,060 Other changes - - - Net changes (239,330) (464,912) 225,582
Balance at December 31, 2014 7,716,181$ 5,095,364$ 2,620,817$
45
City of Thornton, Colorado
NOTES TO FINANCIAL STATEMENTS December 31, 2015
NOTE I - PENSION PLANS (CONTINUED)
3. Fire Pension Plans (Continued)
a. City Fire Pension Plan (Continued)
Regarding the sensitivity of the net pension liability/(asset) to changes in the Single Discount Rate, the following presents the plan's net pension liability/(asset), calculated using a Single Discount Rate of 7.50%, as well as what the plan's net pension liability/(asset) would be if it were calculated using a Single Discount Rate that is one percent lower or one percent higher:
Pension Plan Fiduciary Net Position. Detailed information about the pension plan’s fiduciary net position is available in the separately issued FPPA financial reports.
Pension Expense. For the year ended December 31, 2015, the City recognized a credit of $41,800 for the Old Hire Plan pension expense.
Pension Deferred Outflows/Inflows of Resources. At December 31, 2015, the City reported deferred outflows of resources and deferred inflows of resources related to pensions from the following sources:
The $239,804 reported as deferred outflows of resources related to Old Hire plan resulting from City contributions subsequent to the measurement date will be recognized as a reduction of the net pension liability in the year ended December 31, 2016. Other amounts reported as deferred outflows of resources and deferred inflows of resources related to the Old Hire plan will be recognized in pension expense as follows:
b. Fire and Police Pension Association Statewide Defined Benefit Plan
Plan Description. The Fire and Police Pension Association Statewide Defined Benefit Plan (the New Hire Plan), a cost sharing multiple-employer public employee retirement system administered by the Fire and Police Pension Association of Colorado (FPPA), covers all full-time firefighters of the City who were hired on or after April 8, 1978, and before January 1, 1994. Death and disability coverage is provided for members through the Statewide Death and Disability Plan, which is also administered by FPPA. Firefighters hired before April 8, 1978 may voluntarily associate with the New Hire Plan under certain circumstances, while those hired on or after April 8, 1978, and before January 1, 1994 are automatically associated with it. The New Hire Plan provides retirement and death benefits to its members. FPPA issues a publicly available comprehensive annual financial report that can be obtained on FPPA's website at http://www.fppaco.org.
1% Single Discount Rate 1%Decrease Assumption Increase
6.5% 7.5% 8.5%City's net pension liability 3,231,344$ 2,620,817$ 2,088,695$
Deferred Deferred Outflows of Inflows ofResources Resources
Difference between expected and actual experience -$ -$ Changes of assumptions - - Difference between projected and actual investment earnings 27,578 - C ity contributions subsequent to the measurement date 239,804 - Total 267,382$ -$
Year ending December 31
2016 6,894$ 2017 6,894 2018 6,894 2019 6,896 2020 -
Thereafter - Total 27,578$
46
City of Thornton, Colorado
NOTES TO FINANCIAL STATEMENTS December 31, 2015
NOTE I - PENSION PLANS (CONTINUED)
3. Fire Pension Plans (Continued)
b. Fire and Police Pension Association Statewide Defined Benefit Plan (Continued)
The City’s fire department transferred out of the City, into a joint venture fire district in 1994. The fire district dissolved on December 31, 1999, and the fire department rejoined the City on January 1, 2000. The New Hire Plan was not the responsibility of the City while the firefighters were members of the fire district.
A member is eligible for a normal retirement pension once the member has completed twenty-five years of credited service and has attained the age of 55.
The annual normal retirement benefit is 2 percent of the average of the member's highest three years' base salary for each year of credited service up to ten years, plus 2.5 percent for each year of service thereafter. The benefit earned prior to January 1, 2007 for members of affiliated Social Security employers will be reduced by the amount of Social Security income payable to the member annually. Effective January 1, 2007, members currently covered under Social Security will receive half the benefit when compared to the Statewide Defined Benefit Plan. Benefits paid to retired members are evaluated and may be re-determined every October 1. The amount of any increase is based on the Board's discretion and can range from 0% to the higher of 3% or the Consumer Price Index.
A member is eligible for an early retirement at age 50 or after 30 years of service. The early retirement benefit equals the normal retirement benefit reduced on an actuarially equivalent basis. Upon termination, an employee may elect to have member contributions, along with 5 percent as interest, returned as a lump sum distribution. Alternatively, a member with at least five years of accredited service may leave contributions with the Plan and remain eligible for a retirement pension at age 55 equal to 2 percent of the member's average highest three years' base salary for each year of credited service up to ten years, plus 2.5 percent for each year of service thereafter.
Funding Policy. The Statewide Defined Benefit Plan (SWDB) sets contribution rates at a level that enables all benefits to be fully funded at the retirement date of all members. Contribution rates for the SWDB plan are set by state statute. Employer contribution rates can only be amended by state statute. Member contribution rates can be amended by state statute or election of the membership. The current contribution rate for members of the SWDB is 8.5% of base salary. Member contribution rates will increase 0.5 percent annually through 2022 to a total of 12 percent of base salary. Employer contributions will remain at 8 percent resulting in a combined contribution rate of 20 percent in 2022. Firefighters covered under this plan may elect an optional account known as the “deferred retirement option plan” or “DROP” within five years prior to retirement. The purpose of DROP is to allow an eligible participant to elect, in lieu of immediate termination of employment and receipt of a service retirement benefit, to continue employment for a specified period of time not to exceed five years, coupled with the deferral of actual receipt of retirement benefits until the end of such specified period, at which time employment shall cease. Once a participant elects a DROP, the City is no longer required to match that participant’s contribution. As of December 31, 2015, three out of eight participants in this plan had elected a DROP.
The City’s contributions to the New Hire Plan for the years ending December 31, 2015, 2014, and 2013 were $54,522, $79,516, and $91,710 respectively, equal to the required contribution for each year.
Pension Liability. At December 31, 2015, the City reported an asset of $249,441 for its proportionate share of the SWDB net pension asset. The net pension asset was measured as of December 31, 2014. The total pension liability used to calculate the net pension liability was determined based upon the January 1, 2015 actuarial valuation.
The City’s reported asset at December 31, 2015, increased to $249,441 from the City’s prior year asset of $236,008 because of changes in the SWDB net pension asset and the City’s proportionate share of that asset. The SWDB publicly available financial report provides details on the change in the net pension asset.
The City’s proportion of the net pension asset was based on contributions received and processed by employers that were members of the SWDB plan within the year ended December 31, 2014. The City’s proportion measured as of December 31, 2014, was 0.221023%, which was a decrease of 0.042913% from its proportion measured as of December 31, 2013.
47
City of Thornton, Colorado
NOTES TO FINANCIAL STATEMENTS December 31, 2015
NOTE I - PENSION PLANS (CONTINUED)
3. Fire Pension Plans (Continued)
b. Fire and Police Pension Association Statewide Defined Benefit Plan (Continued)
Pension Expense and Deferred Outflows/Inflows of Resources. For the year ended December 31, 2015, the City recognized a reduction in pension expense for the SWDB plan of $37,749. At December 31, 2015, the City reported deferred outflows of resources and deferred inflows of resources related to pensions from the following sources:
The $54,522 reported as deferred outflows of resources related to SWDB plan resulting from City contributions subsequent to the measurement date will be recognized as a reduction of the net pension asset in the year ended December 31, 2016. Other amounts reported as deferred outflows of resources and deferred inflows of resources related to SWDB plan will be recognized in pension expense as follows:
Actuarial Assumptions. The significant actuarial assumptions used to measure the total pension liability are as follows:
Actuarial Method Entry Age Normal Amortization Method Level % of Payroll, Open Amortization Period 30 Years Asset Valuation Method 5-Year Smoothed Fair Value Long-term Investment Rate of Return* 7.5% Projected Salary Increases 4.0% - 14.0% Cost of Living Adjustments (COLA) 0.0% *Includes Inflation at 3.0%
The RP-2000 Combined Mortality Table with Blue Collar Adjustment, projected with Scale AA, 40 percent multiplier for off-duty mortality is used in the valuation for off-duty mortality of active members. On-duty related mortality is assumed to be 0.00020 per year for all members. The RP-2000 Combined Mortality Table with Blue Collar Adjustment, projected with Scale AA is used in the projection of post-retirement benefits.
At least every five years the Fire & Police Pension Association's Board of Directors, in accordance with best practices, reviews its economic and demographic actuarial assumptions. At its July 2011 meeting, the Board of Directors reviewed and approved recommended changes to the actuarial assumptions. The recommendations
Deferred Deferred
Outflows of Inflows of
Resources Resources
Difference between expected and actual experience -$ 5,138$
Changes of assumptions - -
Difference between projected and actual
investment earnings 19,667 -
Changes in proportion and differences between City
contributions and proportionate share of contributions 34,781 -
City contributions subsequent to the measurement date 54,522 -
Total 108,970$ 5,138$
Year ending
December 31
2016 8,022
2017 8,022
2018 8,022 2019 8,022
2020 3,105
Thereafter 14,117
Total 49,310$
48
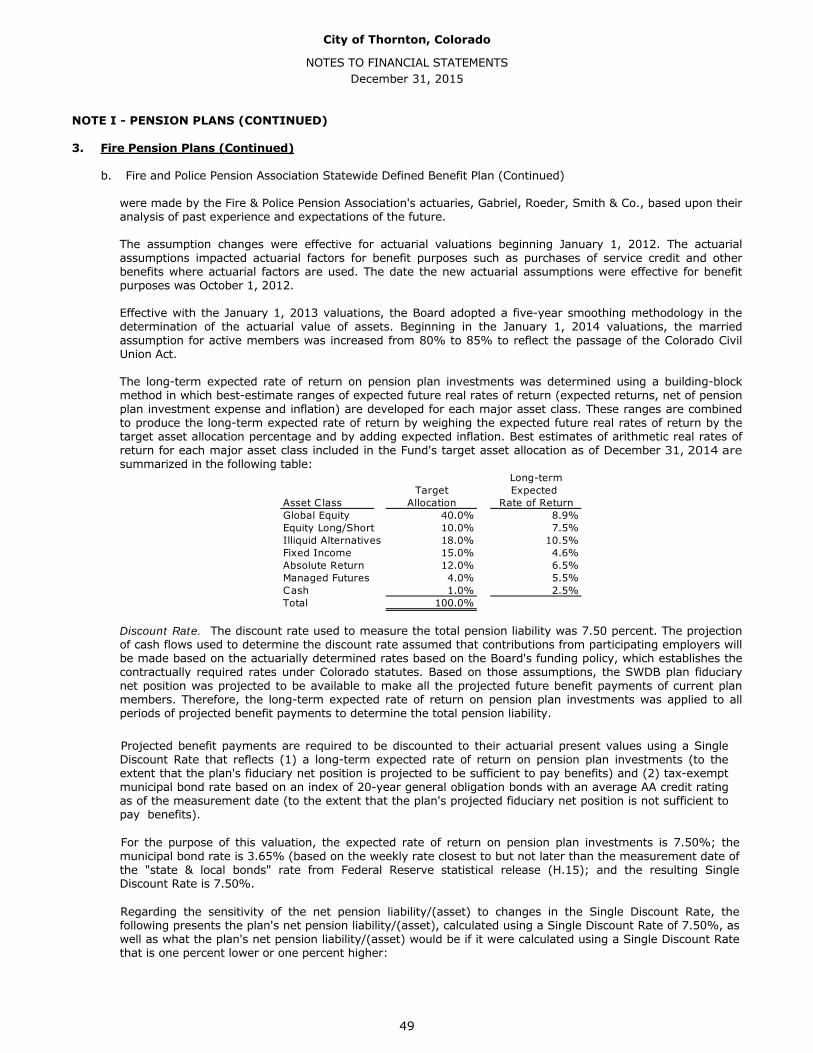
City of Thornton, Colorado
NOTES TO FINANCIAL STATEMENTS December 31, 2015
NOTE I - PENSION PLANS (CONTINUED)
3. Fire Pension Plans (Continued)
b. Fire and Police Pension Association Statewide Defined Benefit Plan (Continued)
were made by the Fire & Police Pension Association's actuaries, Gabriel, Roeder, Smith & Co., based upon their analysis of past experience and expectations of the future.
The assumption changes were effective for actuarial valuations beginning January 1, 2012. The actuarial assumptions impacted actuarial factors for benefit purposes such as purchases of service credit and other benefits where actuarial factors are used. The date the new actuarial assumptions were effective for benefit purposes was October 1, 2012.
Effective with the January 1, 2013 valuations, the Board adopted a five-year smoothing methodology in the determination of the actuarial value of assets. Beginning in the January 1, 2014 valuations, the married assumption for active members was increased from 80% to 85% to reflect the passage of the Colorado Civil Union Act.
The long-term expected rate of return on pension plan investments was determined using a building-block method in which best-estimate ranges of expected future real rates of return (expected returns, net of pension plan investment expense and inflation) are developed for each major asset class. These ranges are combined to produce the long-term expected rate of return by weighing the expected future real rates of return by the target asset allocation percentage and by adding expected inflation. Best estimates of arithmetic real rates of return for each major asset class included in the Fund's target asset allocation as of December 31, 2014 are summarized in the following table:
Discount Rate. The discount rate used to measure the total pension liability was 7.50 percent. The projection of cash flows used to determine the discount rate assumed that contributions from participating employers will be made based on the actuarially determined rates based on the Board's funding policy, which establishes the contractually required rates under Colorado statutes. Based on those assumptions, the SWDB plan fiduciary net position was projected to be available to make all the projected future benefit payments of current plan members. Therefore, the long-term expected rate of return on pension plan investments was applied to all periods of projected benefit payments to determine the total pension liability.
Projected benefit payments are required to be discounted to their actuarial present values using a Single Discount Rate that reflects (1) a long-term expected rate of return on pension plan investments (to the extent that the plan's fiduciary net position is projected to be sufficient to pay benefits) and (2) tax-exempt municipal bond rate based on an index of 20-year general obligation bonds with an average AA credit rating as of the measurement date (to the extent that the plan's projected fiduciary net position is not sufficient to pay benefits).
For the purpose of this valuation, the expected rate of return on pension plan investments is 7.50%; the municipal bond rate is 3.65% (based on the weekly rate closest to but not later than the measurement date of the "state & local bonds" rate from Federal Reserve statistical release (H.15); and the resulting Single Discount Rate is 7.50%.
Regarding the sensitivity of the net pension liability/(asset) to changes in the Single Discount Rate, the following presents the plan's net pension liability/(asset), calculated using a Single Discount Rate of 7.50%, as well as what the plan's net pension liability/(asset) would be if it were calculated using a Single Discount Rate that is one percent lower or one percent higher:
Long-termTarget Expected
Asset Class Allocation Rate of ReturnGlobal Equity 40.0% 8.9%Equity Long/Short 10.0% 7.5%Illiquid Alternatives 18.0% 10.5%Fixed Income 15.0% 4.6%Absolute Return 12.0% 6.5%Managed Futures 4.0% 5.5%Cash 1.0% 2.5%Total 100.0%
49
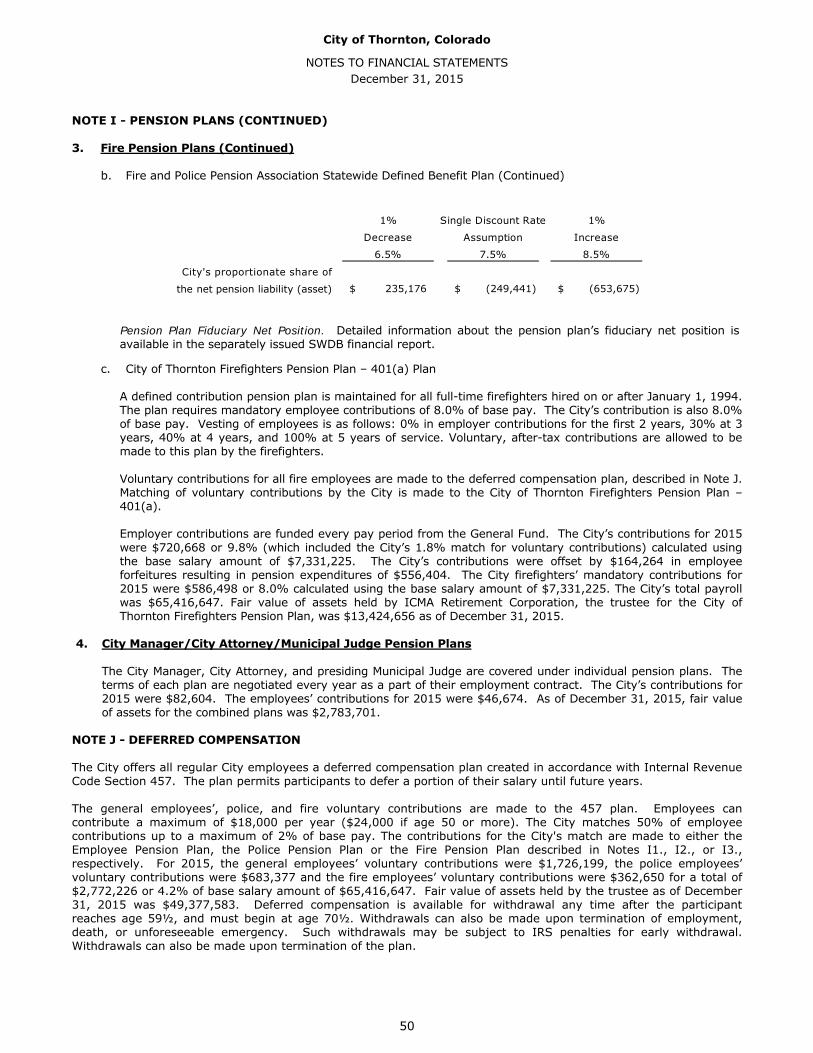
City of Thornton, Colorado
NOTES TO FINANCIAL STATEMENTS December 31, 2015
NOTE I - PENSION PLANS (CONTINUED)
3. Fire Pension Plans (Continued)
b. Fire and Police Pension Association Statewide Defined Benefit Plan (Continued)
Pension Plan Fiduciary Net Position. Detailed information about the pension plan’s fiduciary net position is available in the separately issued SWDB financial report.
c. City of Thornton Firefighters Pension Plan – 401(a) Plan
A defined contribution pension plan is maintained for all full-time firefighters hired on or after January 1, 1994. The plan requires mandatory employee contributions of 8.0% of base pay. The City’s contribution is also 8.0% of base pay. Vesting of employees is as follows: 0% in employer contributions for the first 2 years, 30% at 3 years, 40% at 4 years, and 100% at 5 years of service. Voluntary, after-tax contributions are allowed to be made to this plan by the firefighters.
Voluntary contributions for all fire employees are made to the deferred compensation plan, described in Note J. Matching of voluntary contributions by the City is made to the City of Thornton Firefighters Pension Plan – 401(a).
Employer contributions are funded every pay period from the General Fund. The City’s contributions for 2015 were $720,668 or 9.8% (which included the City’s 1.8% match for voluntary contributions) calculated using the base salary amount of $7,331,225. The City’s contributions were offset by $164,264 in employee forfeitures resulting in pension expenditures of $556,404. The City firefighters’ mandatory contributions for 2015 were $586,498 or 8.0% calculated using the base salary amount of $7,331,225. The City’s total payroll was $65,416,647. Fair value of assets held by ICMA Retirement Corporation, the trustee for the City of Thornton Firefighters Pension Plan, was $13,424,656 as of December 31, 2015.
4. City Manager/City Attorney/Municipal Judge Pension Plans
The City Manager, City Attorney, and presiding Municipal Judge are covered under individual pension plans. Theterms of each plan are negotiated every year as a part of their employment contract. The City’s contributions for2015 were $82,604. The employees’ contributions for 2015 were $46,674. As of December 31, 2015, fair valueof assets for the combined plans was $2,783,701.
NOTE J - DEFERRED COMPENSATION
The City offers all regular City employees a deferred compensation plan created in accordance with Internal Revenue Code Section 457. The plan permits participants to defer a portion of their salary until future years.
The general employees’, police, and fire voluntary contributions are made to the 457 plan. Employees can contribute a maximum of $18,000 per year ($24,000 if age 50 or more). The City matches 50% of employee contributions up to a maximum of 2% of base pay. The contributions for the City's match are made to either the Employee Pension Plan, the Police Pension Plan or the Fire Pension Plan described in Notes I1., I2., or I3., respectively. For 2015, the general employees’ voluntary contributions were $1,726,199, the police employees’ voluntary contributions were $683,377 and the fire employees’ voluntary contributions were $362,650 for a total of $2,772,226 or 4.2% of base salary amount of $65,416,647. Fair value of assets held by the trustee as of December 31, 2015 was $49,377,583. Deferred compensation is available for withdrawal any time after the participant reaches age 59½, and must begin at age 70½. Withdrawals can also be made upon termination of employment, death, or unforeseeable emergency. Such withdrawals may be subject to IRS penalties for early withdrawal. Withdrawals can also be made upon termination of the plan.
1% Single Discount Rate 1%
Decrease Assumption Increase
6.5% 7.5% 8.5%
City's proportionate share of
the net pension liability (asset) 235,176$ (249,441)$ (653,675)$
50
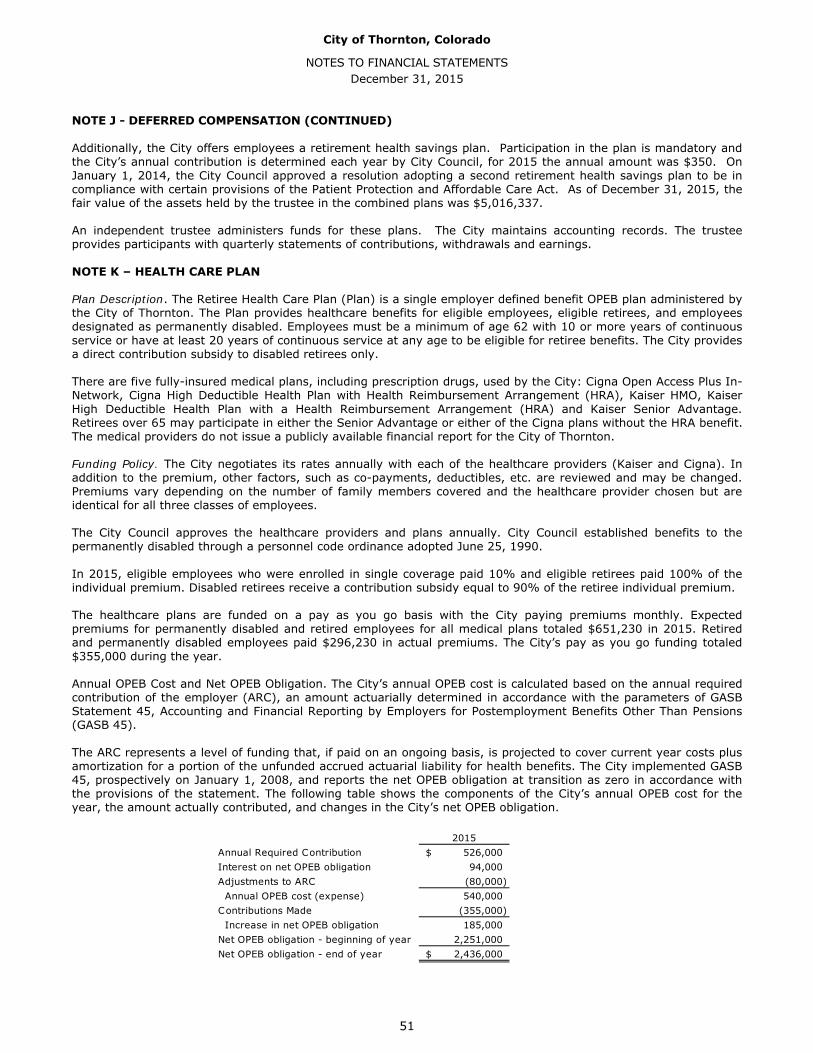
City of Thornton, Colorado
NOTES TO FINANCIAL STATEMENTS December 31, 2015
NOTE J - DEFERRED COMPENSATION (CONTINUED)
Additionally, the City offers employees a retirement health savings plan. Participation in the plan is mandatory and the City’s annual contribution is determined each year by City Council, for 2015 the annual amount was $350. On January 1, 2014, the City Council approved a resolution adopting a second retirement health savings plan to be in compliance with certain provisions of the Patient Protection and Affordable Care Act. As of December 31, 2015, the fair value of the assets held by the trustee in the combined plans was $5,016,337.
An independent trustee administers funds for these plans. The City maintains accounting records. The trustee provides participants with quarterly statements of contributions, withdrawals and earnings.
NOTE K – HEALTH CARE PLAN
Plan Description. The Retiree Health Care Plan (Plan) is a single employer defined benefit OPEB plan administered by the City of Thornton. The Plan provides healthcare benefits for eligible employees, eligible retirees, and employees designated as permanently disabled. Employees must be a minimum of age 62 with 10 or more years of continuous service or have at least 20 years of continuous service at any age to be eligible for retiree benefits. The City provides a direct contribution subsidy to disabled retirees only.
There are five fully-insured medical plans, including prescription drugs, used by the City: Cigna Open Access Plus In- Network, Cigna High Deductible Health Plan with Health Reimbursement Arrangement (HRA), Kaiser HMO, Kaiser High Deductible Health Plan with a Health Reimbursement Arrangement (HRA) and Kaiser Senior Advantage. Retirees over 65 may participate in either the Senior Advantage or either of the Cigna plans without the HRA benefit. The medical providers do not issue a publicly available financial report for the City of Thornton.
Funding Policy. The City negotiates its rates annually with each of the healthcare providers (Kaiser and Cigna). In addition to the premium, other factors, such as co-payments, deductibles, etc. are reviewed and may be changed. Premiums vary depending on the number of family members covered and the healthcare provider chosen but are identical for all three classes of employees.
The City Council approves the healthcare providers and plans annually. City Council established benefits to the permanently disabled through a personnel code ordinance adopted June 25, 1990.
In 2015, eligible employees who were enrolled in single coverage paid 10% and eligible retirees paid 100% of the individual premium. Disabled retirees receive a contribution subsidy equal to 90% of the retiree individual premium.
The healthcare plans are funded on a pay as you go basis with the City paying premiums monthly. Expected premiums for permanently disabled and retired employees for all medical plans totaled $651,230 in 2015. Retired and permanently disabled employees paid $296,230 in actual premiums. The City’s pay as you go funding totaled $355,000 during the year.
Annual OPEB Cost and Net OPEB Obligation. The City’s annual OPEB cost is calculated based on the annual required contribution of the employer (ARC), an amount actuarially determined in accordance with the parameters of GASB Statement 45, Accounting and Financial Reporting by Employers for Postemployment Benefits Other Than Pensions (GASB 45).
The ARC represents a level of funding that, if paid on an ongoing basis, is projected to cover current year costs plus amortization for a portion of the unfunded accrued actuarial liability for health benefits. The City implemented GASB 45, prospectively on January 1, 2008, and reports the net OPEB obligation at transition as zero in accordance with the provisions of the statement. The following table shows the components of the City’s annual OPEB cost for the year, the amount actually contributed, and changes in the City’s net OPEB obligation.
2015Annual Required Contribution 526,000$ Interest on net OPEB obligation 94,000 Adjustments to ARC (80,000) Annual OPEB cost (expense) 540,000 Contributions Made (355,000) Increase in net OPEB obligation 185,000 Net OPEB obligation - beginning of year 2,251,000 Net OPEB obligation - end of year 2,436,000$
51
City of Thornton, Colorado
NOTES TO FINANCIAL STATEMENTS December 31, 2015
NOTE K – HEALTH CARE PLAN (CONTINUED)
The city’s annual OPEB cost, the percentage of annual OPEB cost contributed, and the net OPEB obligation for 2015 and the two preceding years were as follows:
Funded Status and Funding Progress. As of January 1, 2014, the most recent actuarial valuation date, the Plan was not funded. The unfunded actuarial accrued liability (UAAL) was $5,610,000. The covered payroll in 2015 (annual payroll of eligible employees covered by the Plan) was $63,010,727. The ratio of the UAAL to covered payroll was 8.9 percent.
Actuarial valuations involve estimates of the value of reported amounts and assumptions about the probability of occurrence of events far into the future, such as future employment, mortality, and the healthcare cost trend. Amounts determined regarding the funded status of the Plan and the annual required contributions of the City are subject to continual revision as actual results are compared with past expectations and new estimates are made about the future. The schedule of funding progress, presented as required supplementary information following the notes to the financial statements, presents information about the actuarial accrued liability or benefits relative to the covered payroll of employees covered by the Plan.
Actuarial Methods and Assumptions. Projections of benefits for financial reporting purposes are based on the substantive plan (the plan as understood by the City and the plan members) and include the types of benefits provided at the time of each valuation and the historical pattern of sharing of benefits costs between the City and plan members to that point. The actuarial methods and assumptions used include techniques that are designed to reduce the effects of short-term volatility in actuarial accrued liabilities, consistent with the long term perspective of the calculations.
In the January 1, 2014, actuarial valuation, the projected unit credit attribution method was used. The actuarial assumptions included a 4.5 percent discount rate to calculate the ARC on a pay-as-you-go basis. The Unfunded Actuarial Accrued Liability is amortized over the maximum acceptable period of 30 years. The health CPI is assumed to increase at a rate of 3% each year. It is calculated assuming a level percentage of projected payroll on an open basis. Payroll is assumed to increase 3.5% per year. The annual trend rates for health care costs applied on a select and ultimate basis are 9% and 5%, respectively. Select trends are reduced 0.5% each year until reaching the ultimate trend.
NOTE L - RISK MANAGEMENT
1. General Liability Insurance Pool
The City is exposed to various risks of loss related to torts; theft of, damage to, and destruction of assets; errorsand omissions; and natural disasters for which the government carries insurance with the ColoradoIntergovernmental Risk Sharing Agency (CIRSA). CIRSA is a separate and independent governmental and legalentity. The purposes of CIRSA are to provide members defined liability, property and workers' compensationcoverages through joint self-insurance, insurance, reinsurance, or any combination thereof, and to assist membersto prevent and reduce losses and injuries to municipal property and to persons or property which might result inclaims being made against members of CIRSA, or their employees or officers.
All operating funds of the City participate in the program and make payments to the Risk Management Fund based on actuarial estimates of the amounts needed to pay current-year claims and to establish a reserve for catastrophe losses. The City pays claims up to the self-insured retention. In 2015, the self-insured retention (deductible amount) set by the City was $250,000 per claim. The City purchases commercial insurance for claims in excess of $250,000. Every third year the City hires an independent actuary to calculate incurred but not reported claims (IBNR). The City reserves a liability for property/casualty claims of $1,394,841. There has been no significant reduction in insurance coverage from the prior year. Settlements in the past three years have not exceeded coverage.
Fiscal Percentage of Net Year Annual Annual OPEB OPEBEnded OPEB Cost Cost Contribution Obligation
12/31/2015 540,000$ 65.74% 2,436,000$ 12/31/2014 452,000 65.71% 2,251,000 12/31/2013 800,000 28.88% 2,096,000
52
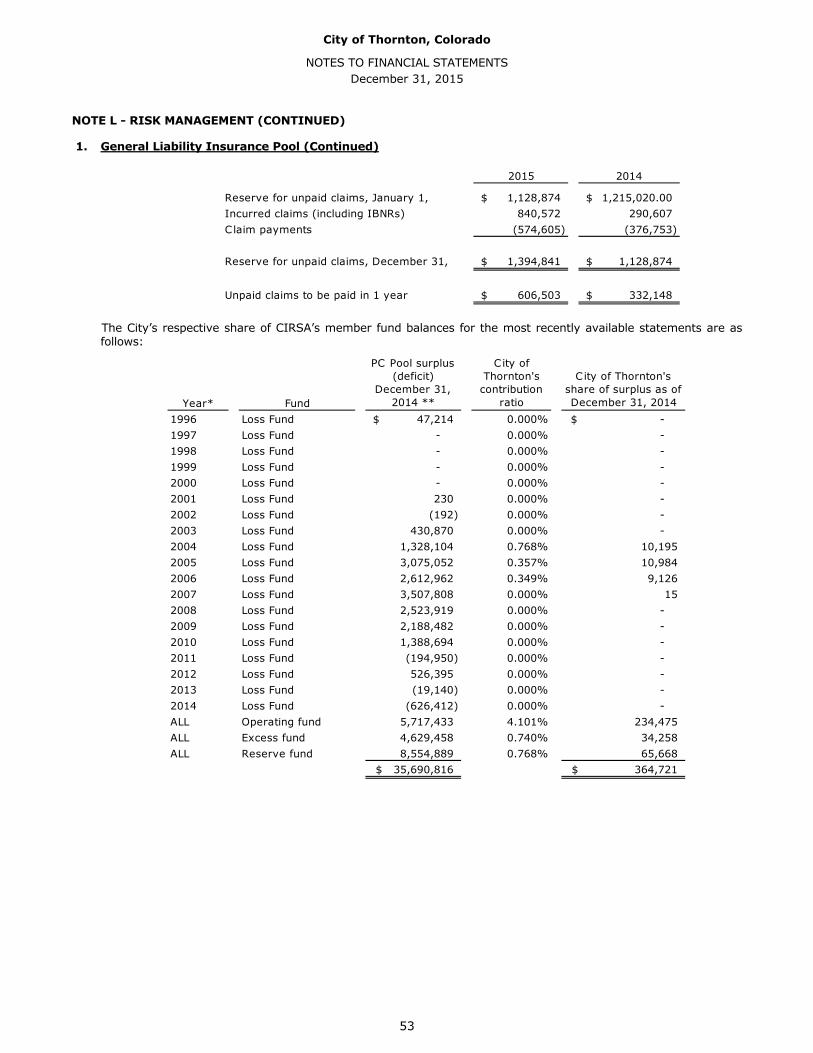
City of Thornton, Colorado
NOTES TO FINANCIAL STATEMENTS December 31, 2015
NOTE L - RISK MANAGEMENT (CONTINUED)
1. General Liability Insurance Pool (Continued)
The City’s respective share of CIRSA’s member fund balances for the most recently available statements are as follows:
2015 2014
Reserve for unpaid claims, January 1, 1,128,874$ 1,215,020.00$ Incurred claims (including IBNRs) 840,572 290,607 C laim payments (574,605) (376,753)
Reserve for unpaid claims, December 31, 1,394,841$ 1,128,874$
Unpaid claims to be paid in 1 year 606,503$ 332,148$
Year* Fund
PC Pool surplus (deficit)
December 31, 2014 **
City of Thornton's
contribution ratio
City of Thornton's share of surplus as of December 31, 2014
1996 Loss Fund 47,214$ 0.000% -$ 1997 Loss Fund - 0.000% - 1998 Loss Fund - 0.000% - 1999 Loss Fund - 0.000% - 2000 Loss Fund - 0.000% - 2001 Loss Fund 230 0.000% - 2002 Loss Fund (192) 0.000% - 2003 Loss Fund 430,870 0.000% - 2004 Loss Fund 1,328,104 0.768% 10,195 2005 Loss Fund 3,075,052 0.357% 10,984 2006 Loss Fund 2,612,962 0.349% 9,126 2007 Loss Fund 3,507,808 0.000% 15 2008 Loss Fund 2,523,919 0.000% - 2009 Loss Fund 2,188,482 0.000% - 2010 Loss Fund 1,388,694 0.000% - 2011 Loss Fund (194,950) 0.000% - 2012 Loss Fund 526,395 0.000% - 2013 Loss Fund (19,140) 0.000% - 2014 Loss Fund (626,412) 0.000% - ALL Operating fund 5,717,433 4.101% 234,475 ALL Excess fund 4,629,458 0.740% 34,258 ALL Reserve fund 8,554,889 0.768% 65,668
35,690,816$ 364,721$
53
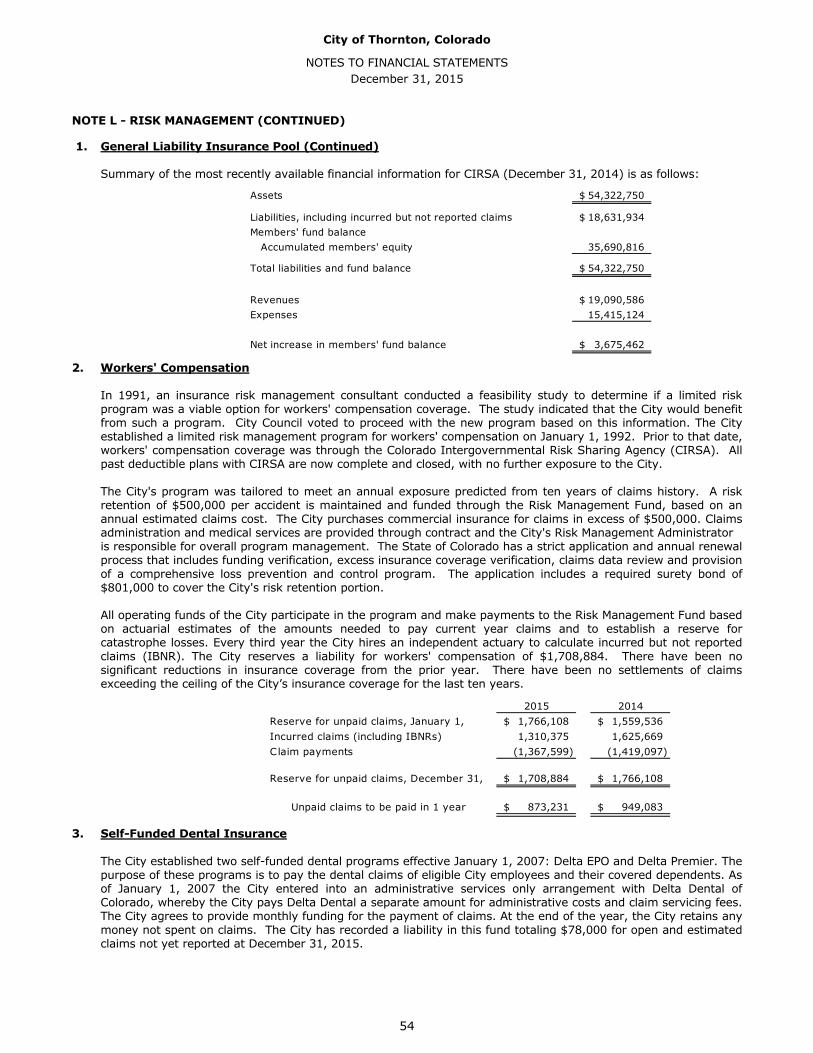
City of Thornton, Colorado
NOTES TO FINANCIAL STATEMENTS December 31, 2015
NOTE L - RISK MANAGEMENT (CONTINUED)
1. General Liability Insurance Pool (Continued)
Summary of the most recently available financial information for CIRSA (December 31, 2014) is as follows:
2. Workers' Compensation
In 1991, an insurance risk management consultant conducted a feasibility study to determine if a limited riskprogram was a viable option for workers' compensation coverage. The study indicated that the City would benefitfrom such a program. City Council voted to proceed with the new program based on this information. The Cityestablished a limited risk management program for workers' compensation on January 1, 1992. Prior to that date,workers' compensation coverage was through the Colorado Intergovernmental Risk Sharing Agency (CIRSA). Allpast deductible plans with CIRSA are now complete and closed, with no further exposure to the City.
The City's program was tailored to meet an annual exposure predicted from ten years of claims history. A riskretention of $500,000 per accident is maintained and funded through the Risk Management Fund, based on anannual estimated claims cost. The City purchases commercial insurance for claims in excess of $500,000. Claimsadministration and medical services are provided through contract and the City's Risk Management Administratoris responsible for overall program management. The State of Colorado has a strict application and annual renewalprocess that includes funding verification, excess insurance coverage verification, claims data review and provisionof a comprehensive loss prevention and control program. The application includes a required surety bond of$801,000 to cover the City's risk retention portion.
All operating funds of the City participate in the program and make payments to the Risk Management Fund basedon actuarial estimates of the amounts needed to pay current year claims and to establish a reserve forcatastrophe losses. Every third year the City hires an independent actuary to calculate incurred but not reportedclaims (IBNR). The City reserves a liability for workers' compensation of $1,708,884. There have been nosignificant reductions in insurance coverage from the prior year. There have been no settlements of claimsexceeding the ceiling of the City’s insurance coverage for the last ten years.
3. Self-Funded Dental Insurance
The City established two self-funded dental programs effective January 1, 2007: Delta EPO and Delta Premier. Thepurpose of these programs is to pay the dental claims of eligible City employees and their covered dependents. Asof January 1, 2007 the City entered into an administrative services only arrangement with Delta Dental ofColorado, whereby the City pays Delta Dental a separate amount for administrative costs and claim servicing fees.The City agrees to provide monthly funding for the payment of claims. At the end of the year, the City retains anymoney not spent on claims. The City has recorded a liability in this fund totaling $78,000 for open and estimatedclaims not yet reported at December 31, 2015.
Assets 54,322,750$
Liabilities, including incurred but not reported claims 18,631,934$ Members' fund balance Accumulated members' equity 35,690,816
Total liabilities and fund balance 54,322,750$
Revenues 19,090,586$ Expenses 15,415,124
Net increase in members' fund balance 3,675,462$
2015 2014Reserve for unpaid claims, January 1, 1,766,108$ 1,559,536$ Incurred claims (including IBNRs) 1,310,375 1,625,669 C laim payments (1,367,599) (1,419,097)
Reserve for unpaid claims, December 31, 1,708,884$ 1,766,108$
Unpaid claims to be paid in 1 year 873,231$ 949,083$
54
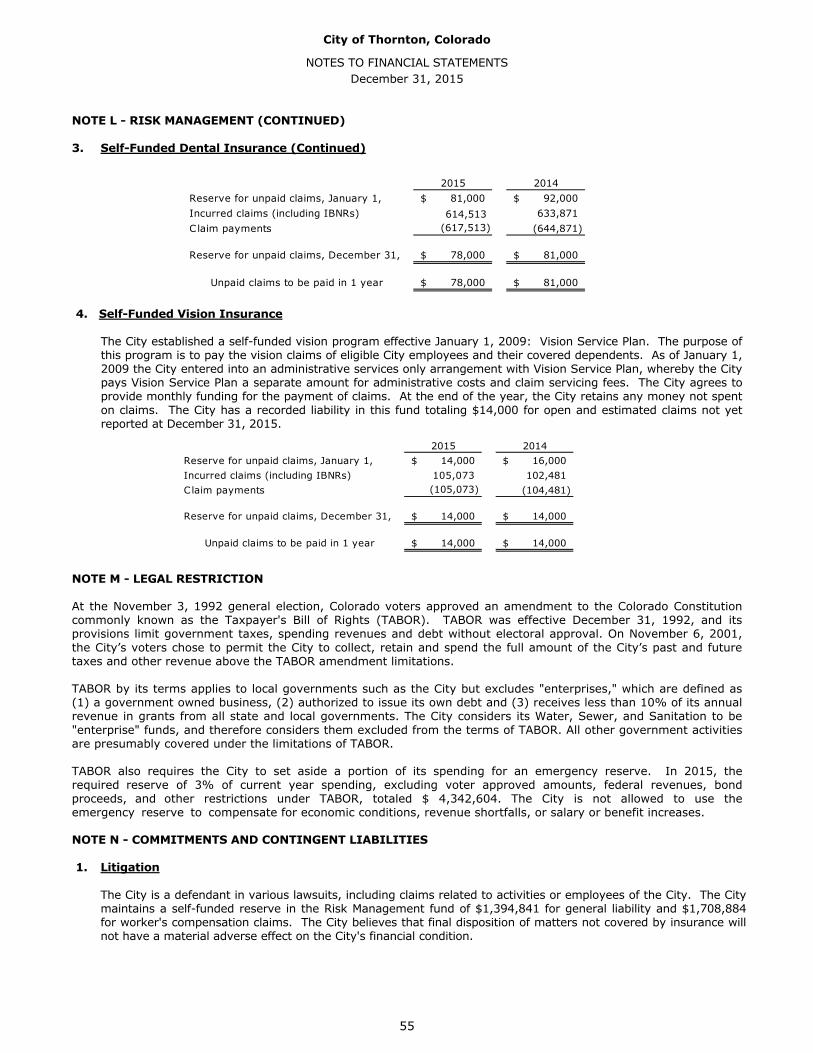
City of Thornton, Colorado
NOTES TO FINANCIAL STATEMENTS December 31, 2015
NOTE L - RISK MANAGEMENT (CONTINUED)
3. Self-Funded Dental Insurance (Continued)
4. Self-Funded Vision Insurance
The City established a self-funded vision program effective January 1, 2009: Vision Service Plan. The purpose ofthis program is to pay the vision claims of eligible City employees and their covered dependents. As of January 1,2009 the City entered into an administrative services only arrangement with Vision Service Plan, whereby the Citypays Vision Service Plan a separate amount for administrative costs and claim servicing fees. The City agrees toprovide monthly funding for the payment of claims. At the end of the year, the City retains any money not spenton claims. The City has a recorded liability in this fund totaling $14,000 for open and estimated claims not yetreported at December 31, 2015.
NOTE M - LEGAL RESTRICTION
At the November 3, 1992 general election, Colorado voters approved an amendment to the Colorado Constitution commonly known as the Taxpayer's Bill of Rights (TABOR). TABOR was effective December 31, 1992, and its provisions limit government taxes, spending revenues and debt without electoral approval. On November 6, 2001, the City’s voters chose to permit the City to collect, retain and spend the full amount of the City’s past and future taxes and other revenue above the TABOR amendment limitations.
TABOR by its terms applies to local governments such as the City but excludes "enterprises," which are defined as (1) a government owned business, (2) authorized to issue its own debt and (3) receives less than 10% of its annual revenue in grants from all state and local governments. The City considers its Water, Sewer, and Sanitation to be "enterprise" funds, and therefore considers them excluded from the terms of TABOR. All other government activities are presumably covered under the limitations of TABOR.
TABOR also requires the City to set aside a portion of its spending for an emergency reserve. In 2015, the required reserve of 3% of current year spending, excluding voter approved amounts, federal revenues, bond proceeds, and other restrictions under TABOR, totaled $ 4,342,604. The City is not allowed to use the emergency reserve to compensate for economic conditions, revenue shortfalls, or salary or benefit increases.
NOTE N - COMMITMENTS AND CONTINGENT LIABILITIES
1. Litigation
The City is a defendant in various lawsuits, including claims related to activities or employees of the City. The Citymaintains a self-funded reserve in the Risk Management fund of $1,394,841 for general liability and $1,708,884for worker's compensation claims. The City believes that final disposition of matters not covered by insurance willnot have a material adverse effect on the City's financial condition.
2015 2014Reserve for unpaid claims, January 1, 81,000$ 92,000$ Incurred claims (including IBNRs) 614,513 633,871 Claim payments (617,513) (644,871)
Reserve for unpaid claims, December 31, 78,000$ 81,000$
Unpaid claims to be paid in 1 year 78,000$ 81,000$
2015 2014Reserve for unpaid claims, January 1, 14,000$ 16,000$ Incurred claims (including IBNRs) 105,073 102,481 Claim payments (105,073) (104,481)
Reserve for unpaid claims, December 31, 14,000$ 14,000$
Unpaid claims to be paid in 1 year 14,000$ 14,000$
55
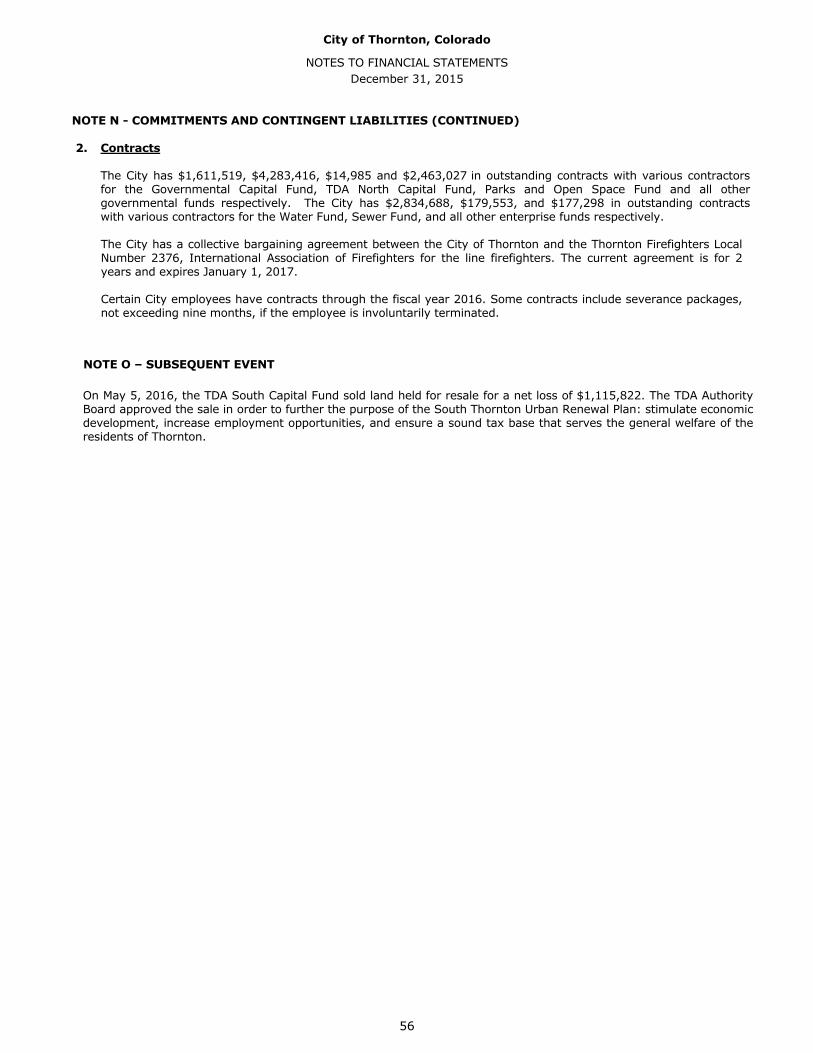
City of Thornton, Colorado
NOTES TO FINANCIAL STATEMENTS December 31, 2015
NOTE N - COMMITMENTS AND CONTINGENT LIABILITIES (CONTINUED)
2. Contracts
The City has $1,611,519, $4,283,416, $14,985 and $2,463,027 in outstanding contracts with various contractorsfor the Governmental Capital Fund, TDA North Capital Fund, Parks and Open Space Fund and all othergovernmental funds respectively. The City has $2,834,688, $179,553, and $177,298 in outstanding contractswith various contractors for the Water Fund, Sewer Fund, and all other enterprise funds respectively.
The City has a collective bargaining agreement between the City of Thornton and the Thornton Firefighters LocalNumber 2376, International Association of Firefighters for the line firefighters. The current agreement is for 2years and expires January 1, 2017.
Certain City employees have contracts through the fiscal year 2016. Some contracts include severance packages,not exceeding nine months, if the employee is involuntarily terminated.
56
NOTE O – SUBSEQUENT EVENT
On May 5, 2016, the TDA South Capital Fund sold land held for resale for a net loss of $1,115,822. The TDA Authority Board approved the sale in order to further the purpose of the South Thornton Urban Renewal Plan: stimulate economic development, increase employment opportunities, and ensure a sound tax base that serves the general welfare of the residents of Thornton.
REQUIRED SUPPLEMENTARY INFORMATION
57
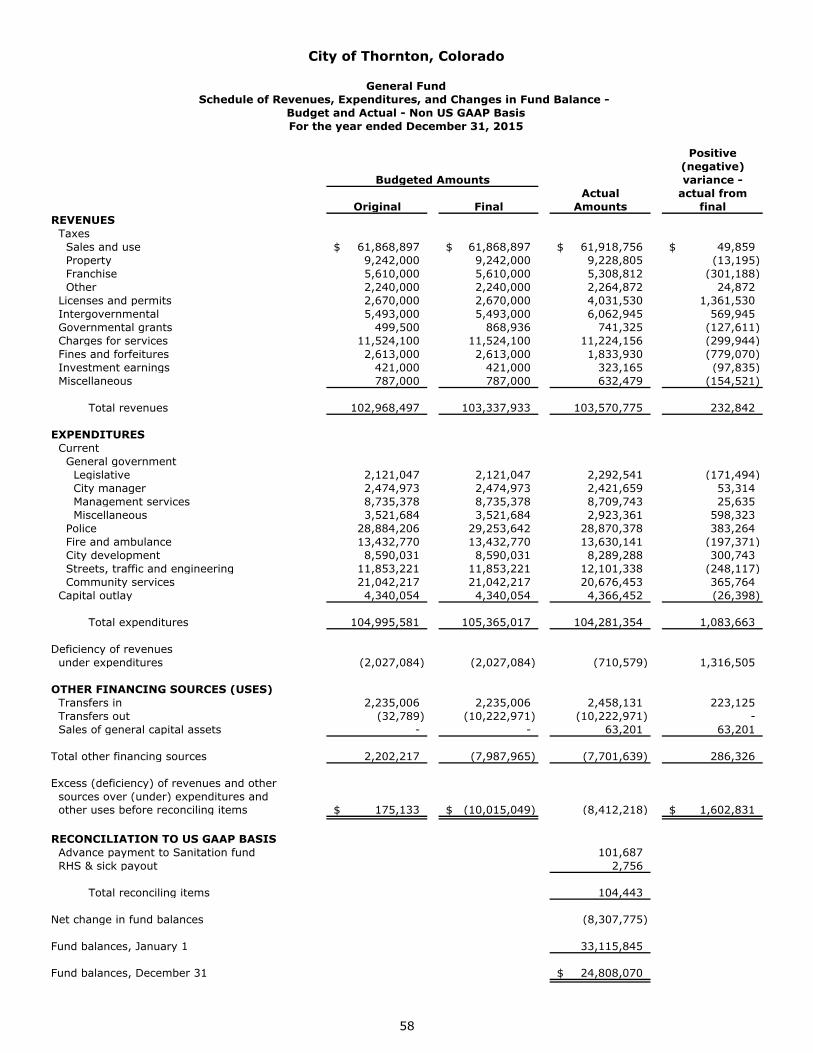
Positive(negative)
Budgeted Amounts variance -Actual actual from
Original Final Amounts finalREVENUES Taxes Sales and use 61,868,897$ 61,868,897$ 61,918,756$ 49,859$ Property 9,242,000 9,242,000 9,228,805 (13,195) Franchise 5,610,000 5,610,000 5,308,812 (301,188) Other 2,240,000 2,240,000 2,264,872 24,872 Licenses and permits 2,670,000 2,670,000 4,031,530 1,361,530 Intergovernmental 5,493,000 5,493,000 6,062,945 569,945 Governmental grants 499,500 868,936 741,325 (127,611) Charges for services 11,524,100 11,524,100 11,224,156 (299,944) Fines and forfeitures 2,613,000 2,613,000 1,833,930 (779,070) Investment earnings 421,000 421,000 323,165 (97,835) Miscellaneous 787,000 787,000 632,479 (154,521)
Total revenues 102,968,497 103,337,933 103,570,775 232,842
EXPENDITURES Current General government Legislative 2,121,047 2,121,047 2,292,541 (171,494) City manager 2,474,973 2,474,973 2,421,659 53,314 Management services 8,735,378 8,735,378 8,709,743 25,635 Miscellaneous 3,521,684 3,521,684 2,923,361 598,323 Police 28,884,206 29,253,642 28,870,378 383,264 Fire and ambulance 13,432,770 13,432,770 13,630,141 (197,371) City development 8,590,031 8,590,031 8,289,288 300,743 Streets, traffic and engineering 11,853,221 11,853,221 12,101,338 (248,117) Community services 21,042,217 21,042,217 20,676,453 365,764 Capital outlay 4,340,054 4,340,054 4,366,452 (26,398)
Total expenditures 104,995,581 105,365,017 104,281,354 1,083,663
Deficiency of revenues under expenditures (2,027,084) (2,027,084) (710,579) 1,316,505
OTHER FINANCING SOURCES (USES) Transfers in 2,235,006 2,235,006 2,458,131 223,125 Transfers out (32,789) (10,222,971) (10,222,971) - Sales of general capital assets - - 63,201 63,201
Total other financing sources 2,202,217 (7,987,965) (7,701,639) 286,326
Excess (deficiency) of revenues and other sources over (under) expenditures and other uses before reconciling items 175,133$ (10,015,049)$ (8,412,218) 1,602,831$
RECONCILIATION TO US GAAP BASIS Advance payment to Sanitation fund 101,687 RHS & sick payout 2,756
Total reconciling items 104,443
Net change in fund balances (8,307,775)
Fund balances, January 1 33,115,845
Fund balances, December 31 24,808,070$
City of Thornton, Colorado
General Fund
For the year ended December 31, 2015
Schedule of Revenues, Expenditures, and Changes in Fund Balance - Budget and Actual - Non US GAAP Basis
58
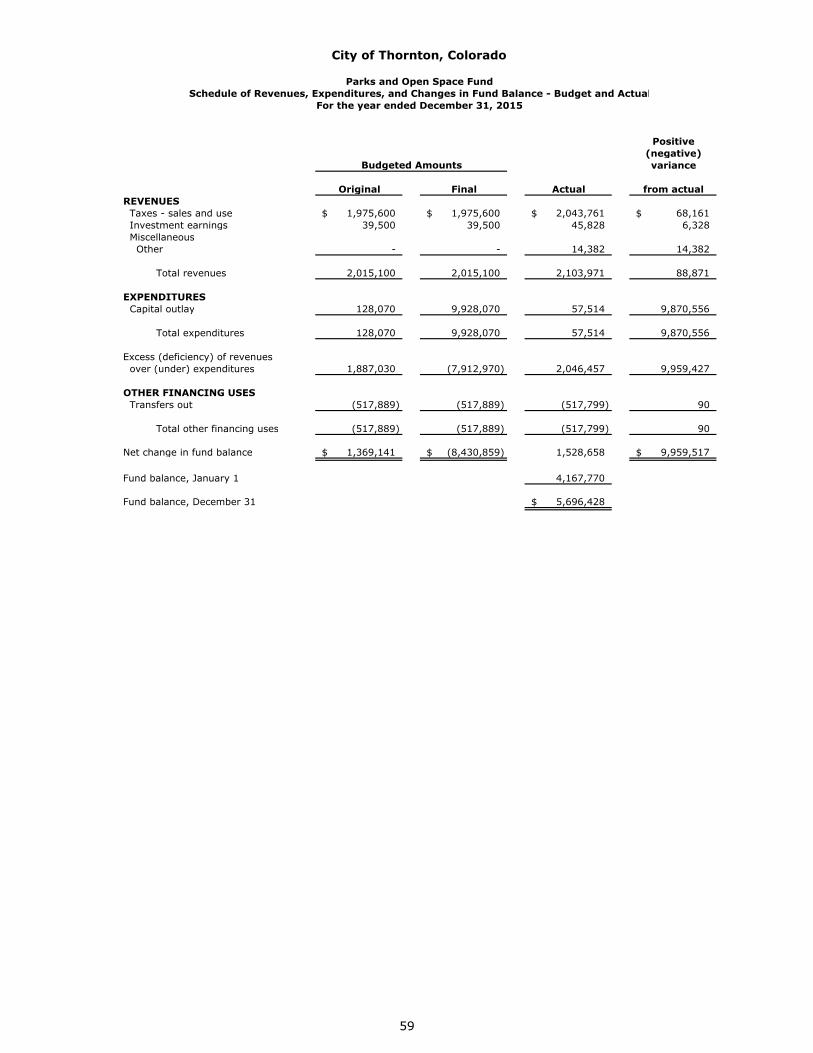
City of Thornton, Colorado
Parks and Open Space FundSchedule of Revenues, Expenditures, and Changes in Fund Balance - Budget and Actual
For the year ended December 31, 2015
Positive(negative)variance
Original Final Actual from actualREVENUES Taxes - sales and use 1,975,600$ 1,975,600$ 2,043,761$ 68,161$ Investment earnings 39,500 39,500 45,828 6,328 Miscellaneous Other - - 14,382 14,382
Total revenues 2,015,100 2,015,100 2,103,971 88,871
EXPENDITURES Capital outlay 128,070 9,928,070 57,514 9,870,556
Total expenditures 128,070 9,928,070 57,514 9,870,556
Excess (deficiency) of revenues over (under) expenditures 1,887,030 (7,912,970) 2,046,457 9,959,427
OTHER FINANCING USES Transfers out (517,889) (517,889) (517,799) 90
Total other financing uses (517,889) (517,889) (517,799) 90
Net change in fund balance 1,369,141$ (8,430,859)$ 1,528,658 9,959,517$
Fund balance, January 1 4,167,770
Fund balance, December 31 5,696,428$
Budgeted Amounts
59
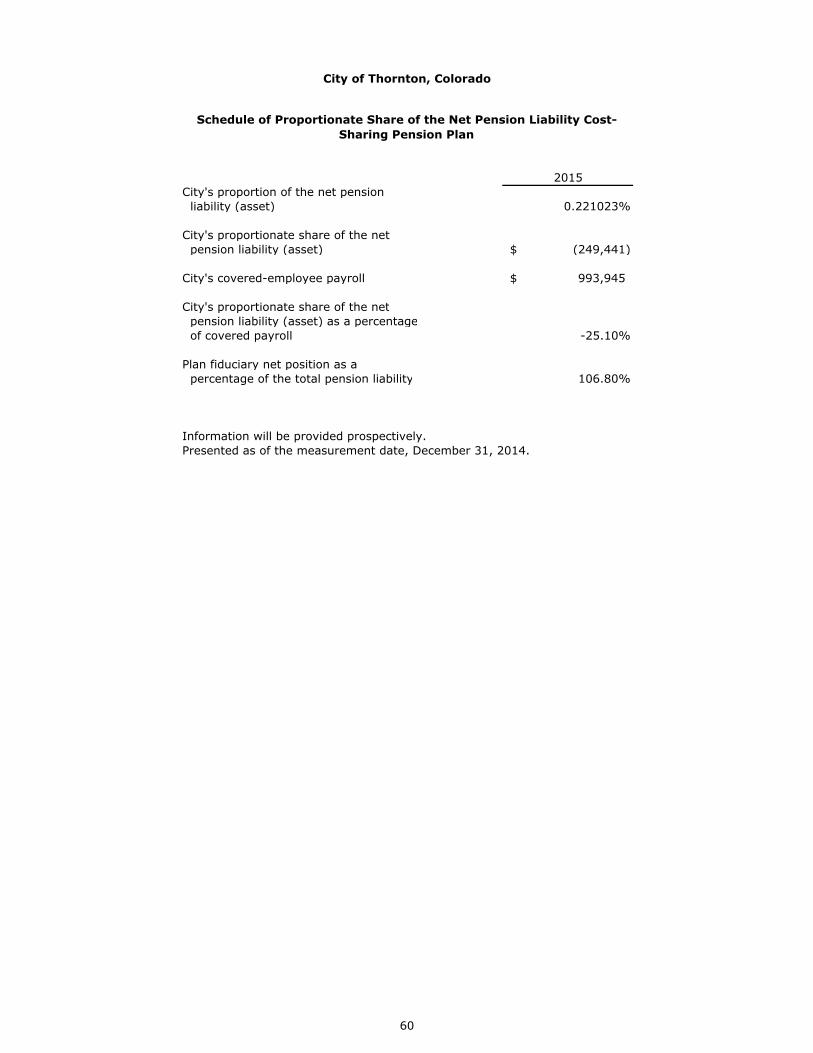
2015City's proportion of the net pension liability (asset) 0.221023%
City's proportionate share of the net pension liability (asset) (249,441)$
City's covered-employee payroll 993,945$
City's proportionate share of the net pension liability (asset) as a percentage of covered payroll -25.10%
Plan fiduciary net position as a percentage of the total pension liability 106.80%
Information will be provided prospectively.Presented as of the measurement date, December 31, 2014.
City of Thornton, Colorado
Schedule of Proportionate Share of the Net Pension Liability Cost-Sharing Pension Plan
60
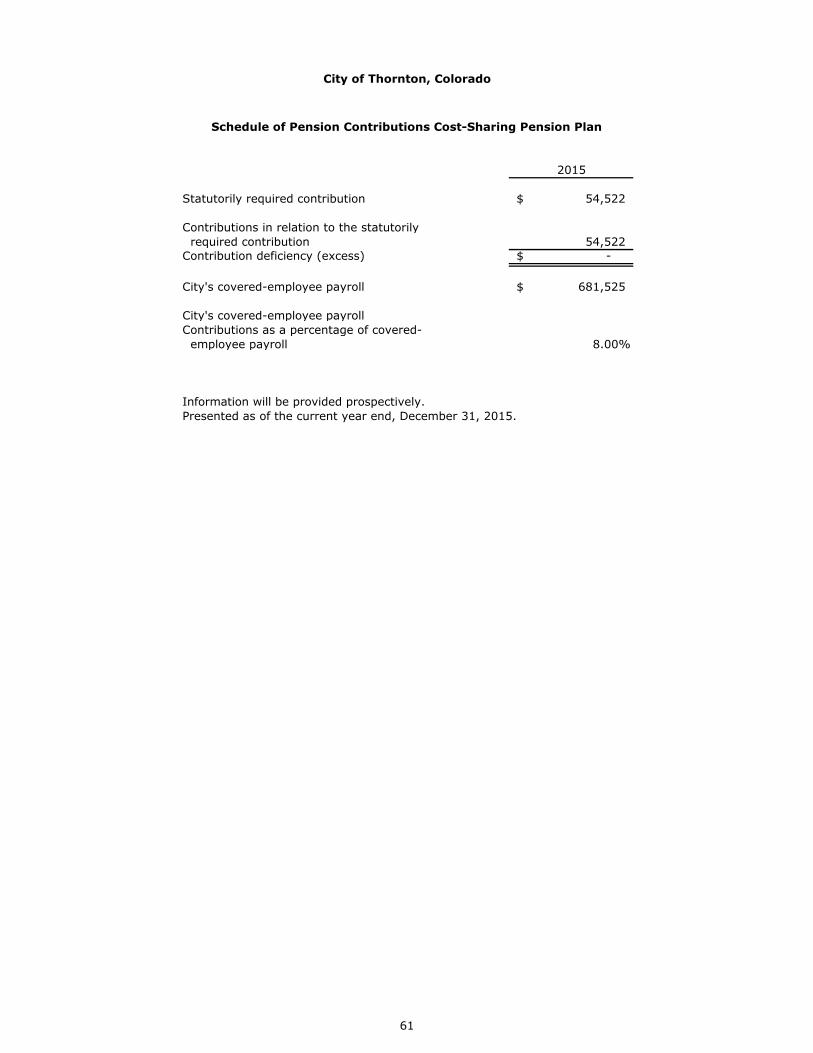
2015
Statutorily required contribution 54,522$
Contributions in relation to the statutorily required contribution 54,522 Contribution deficiency (excess) -$
City's covered-employee payroll 681,525$
City's covered-employee payrollContributions as a percentage of covered- employee payroll 8.00%
Information will be provided prospectively.Presented as of the current year end, December 31, 2015.
City of Thornton, Colorado
Schedule of Pension Contributions Cost-Sharing Pension Plan
61
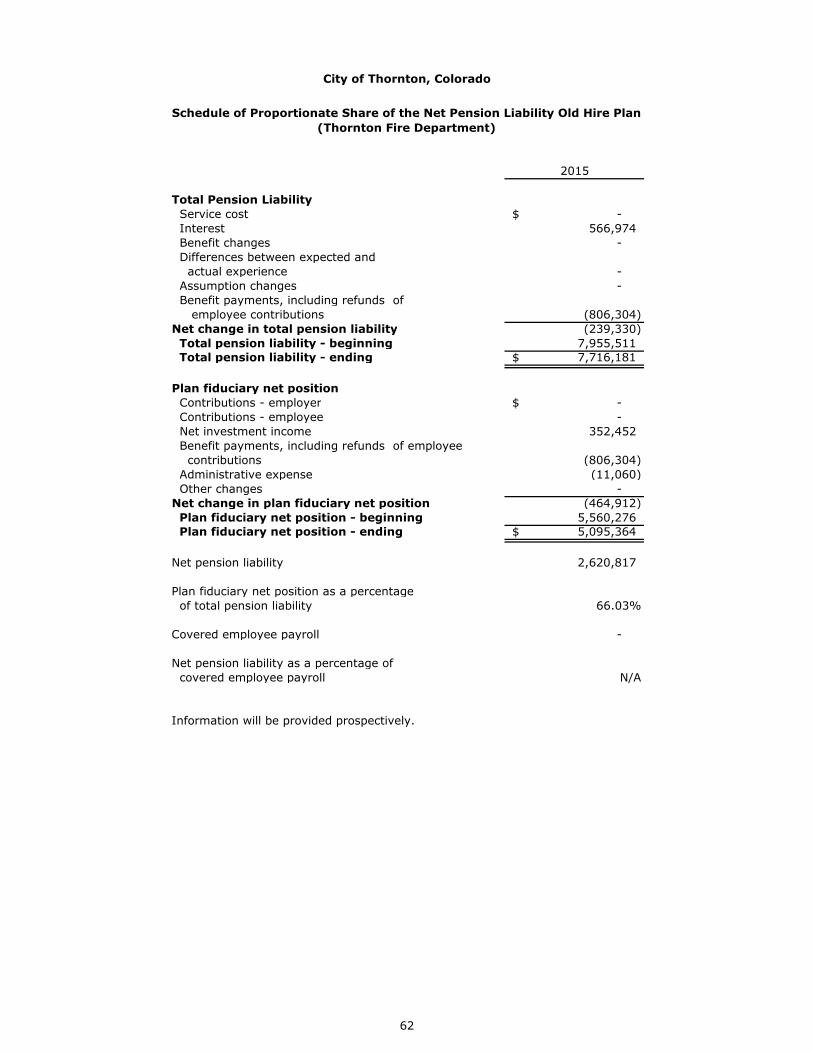
2015
Total Pension Liability Service cost -$ Interest 566,974 Benefit changes - Differences between expected and actual experience - Assumption changes - Benefit payments, including refunds of employee contributions (806,304) Net change in total pension liability (239,330) Total pension liability - beginning 7,955,511 Total pension liability - ending 7,716,181$
Plan fiduciary net position Contributions - employer -$ Contributions - employee - Net investment income 352,452 Benefit payments, including refunds of employee contributions (806,304) Administrative expense (11,060) Other changes - Net change in plan fiduciary net position (464,912) Plan fiduciary net position - beginning 5,560,276 Plan fiduciary net position - ending 5,095,364$
Net pension liability 2,620,817
Plan fiduciary net position as a percentage of total pension liability 66.03%
Covered employee payroll -
Net pension liability as a percentage of covered employee payroll N/A
Information will be provided prospectively.
City of Thornton, Colorado
Schedule of Proportionate Share of the Net Pension Liability Old Hire Plan (Thornton Fire Department)
62
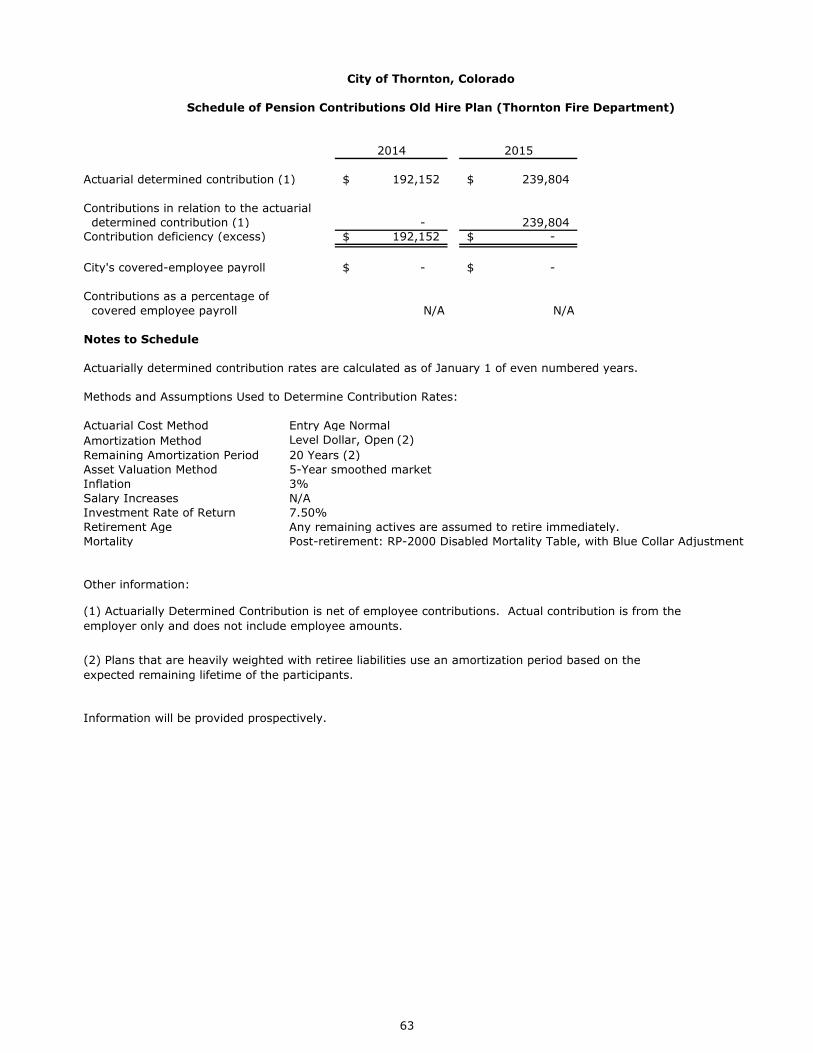
2014 2015
Actuarial determined contribution (1) 192,152$ 239,804$
Contributions in relation to the actuarial determined contribution (1) - 239,804 Contribution deficiency (excess) 192,152$ -$
City's covered-employee payroll -$ -$
Contributions as a percentage of covered employee payroll N/A N/A
Notes to Schedule
Actuarially determined contribution rates are calculated as of January 1 of even numbered years.
Methods and Assumptions Used to Determine Contribution Rates:
Actuarial Cost Method Entry Age NormalAmortization Method Level Dollar, Open (2)Remaining Amortization Period 20 Years (2)Asset Valuation Method 5-Year smoothed marketInflation 3%Salary Increases N/AInvestment Rate of Return 7.50%Retirement Age Any remaining actives are assumed to retire immediately.Mortality Post-retirement: RP-2000 Disabled Mortality Table, with Blue Collar Adjustment
Other information:
Information will be provided prospectively.
Schedule of Pension Contributions Old Hire Plan (Thornton Fire Department)
City of Thornton, Colorado
(1) Actuarially Determined Contribution is net of employee contributions. Actual contribution is from the employer only and does not include employee amounts.
(2) Plans that are heavily weighted with retiree liabilities use an amortization period based on the expected remaining lifetime of the participants.
63
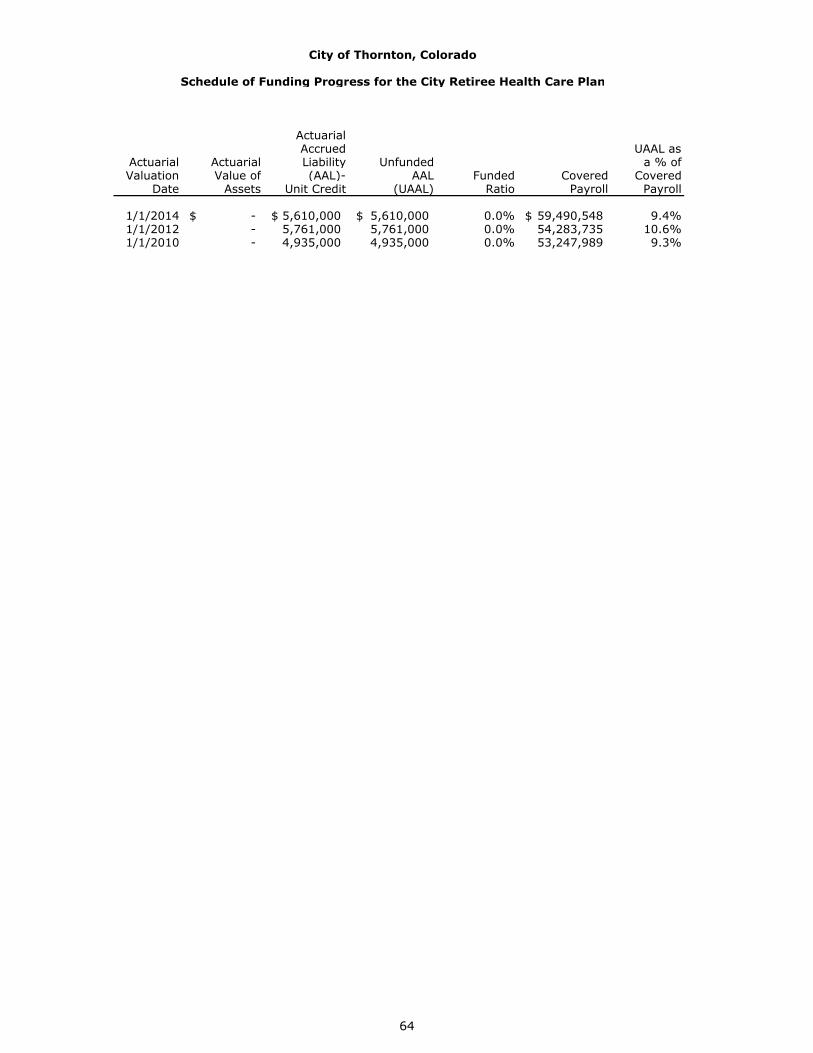
City of Thornton, Colorado
Schedule of Funding Progress for the City Retiree Health Care Plan
ActuarialAccrued UAAL as
Actuarial Actuarial Liability Unfunded a % ofValuation Value of (AAL)- AAL Funded Covered Covered
Date Assets Unit Credit (UAAL) Ratio Payroll Payroll
1/1/2014 -$ 5,610,000$ 5,610,000$ 0.0% 59,490,548$ 9.4%1/1/2012 - 5,761,000 5,761,000 0.0% 54,283,735 10.6%1/1/2010 - 4,935,000 4,935,000 0.0% 53,247,989 9.3%
64
COMBINING STATEMENTS AND BUDGETARY SCHEDULES
65
City of Thornton, Colorado
Combining Statements and Budgetary SchedulesFund Descriptions
Non-Major Governmental Funds
Special Revenue Funds
Special Revenue funds are used to account for specific revenues that are legally restricted to expend for particular purposes.
Thornton Arts, Sciences and Humanities Council (TASHCO) Fund (Component Unit) – to account for monies received from grants and program revenues for purposes of cultural enhancements.
Cash in Lieu Fund – to account for monies contributed by land developers in lieu of providing an improvement such as parks or drainage.
Conservation Trust Fund – to account for monies received from the State government for purposes of developing new parks and park improvements.
Parks Fund – to account for one-third of the .25% open space tax to be used exclusively for the purchase and development of parks in the City.
Open Space Fund – to account for one-third of the .25% open space tax to be used exclusively for the purchase and development of open space in the City.
Adams County Open Space Sales Tax Fund – to account for open space monies from Adams county to be used exclusively for the purchase and development of open space in the City.
Adams County Road and Bridge Sales Tax Fund – to account for road and bridge monies from Adams County to be used exclusively for transportation related projects in the City.
136th Avenue GID Fund (Component Unit) – to account for the collection of assessment revenues to be used exclusively for payment of the construction of the interchange at 136th Avenue and Interstate 25.
E911 Authority Fund (Component Unit) – to account for E911 surcharges received from telecommunication companies doing business within the City. The Authority was established by City Council in 2004, and funds collected are used to pay for a portion of costs authorized by State statute for the City to provide emergency telephone services.
Debt Service Funds
Debt Service funds are used to account for the accumulation of resources and payment of debt principal and interest from governmental resources and special assessment bond principal and interest from special assessment levies when the City is obligated in some manner for the payment.
Debt Service Fund – to accumulate monies for payment of the following bond issues:
$12,170,000 Open Space and Parks Sales and Use Tax Revenue Refunding Bonds, Series 2010 – financed solely by the 0.25% open space sales and use tax. The bonds are due in annual payments until maturity in 2018.
Capital Projects Funds
Capital Projects Funds are used to account for the acquisition and construction of major capital facilities other than those financed by proprietary funds.
Thornton Development Authority South Capital Fund (Component Unit) – to account for capital improvement projects within the Authority boundaries financed by existing and current resources (property tax and investment income).
Thornton Development Authority 144th (TDA 144th) (Component Unit) – to account for debt services and capital improvement projects within the Authority boundaries financed by current resources (property tax, sales tax, investment income) and by bond proceeds. The debt services payments are for the following bond issue:
$27,580,000 Thornton Development Authority Tax Increment Revenue Bonds (East 144th Avenue and I-25 Project), Series 2015B – financed by sales tax and property tax incremental increases within the boundaries of the 144th Urban Renewal Area. The bonds are due in semi-annual payments until maturity in 2037.
66

This Page Left Intentionally Blank
67
City of Thornton, Colorado
Combining Balance SheetNon-Major Governmental Funds
December 31, 2015
Cash in Conservation OpenTASHCO Lieu Trust Parks Space
ASSETS Equity in pooled cash and investments Unrestricted 316,430$ 900,628$ 3,331,062$ 4,899,236$ 7,894,520$ Restricted - - - - - Receivables, net Taxes - - - 198,812 198,812 Accounts - - - - - Interest 987 3,219 10,256 15,265 23,037 Land held for resale - - - - -
Total assets 317,417$ 903,847$ 3,341,318$ 5,113,313$ 8,116,369$
LIABILITIES Accounts payable 3,364$ -$ 229,831$ 9,826$ 82,081$ Retainage payable - - 13,446 16,254 8,156 Third party advances - 563,532 - - - Other - - - - -
Total liabilities 3,364 563,532 243,277 26,080 90,237
DEFERRED INFLOWS Unavailable revenue - property taxes - - - - -
Total deferred inflows of resources - - - - -
FUND BALANCES Nonspendable Land held for resale - - - - - Restricted Debt service - - - - - Other purposes 39,343 - - - - Assigned Capital projects 16,044 - - - - Debt service - - - - - Parks and open space - 340,315 3,098,041 5,087,233 8,026,132 Public safety - - - - - Other purposes 258,666 - - - -
Total fund balances 314,053 340,315 3,098,041 5,087,233 8,026,132
Total liabilities, deferred inflows of resources and fund balances 317,417$ 903,847$ 3,341,318$ 5,113,313$ 8,116,369$
Special Revenue Funds
68
Adams County Adams County TotalOpen Space Road & Bridge 136th SpecialSales Tax Sales Tax Avenue GID E911 Revenue
2,289,026$ 5,702,494$ 2,065$ 283,206$ 25,618,667$ - - - - -
- 505,635 5,135 96,932 1,005,326 565,302 - - - 565,302
6,809 18,054 8 1,643 79,278 - - - - -
2,861,137$ 6,226,183$ 7,208$ 381,781$ 27,268,573$
142,496$ 708,600$ -$ -$ 1,176,198$ 15,592 63,076 - - 116,524
- - - - 563,532 - - - - -
158,088 771,676 - - 1,856,254
- - 5,135 - 5,135
- - 5,135 - 5,135
- - - - -
- - - - - - - - - 39,343
- 5,454,507 2,073 - 5,472,624 - - - - -
2,703,049 - - - 19,254,770 - - - 381,781 381,781 - - - - 258,666
2,703,049 5,454,507 2,073 381,781 25,407,184
2,861,137$ 6,226,183$ 7,208$ 381,781$ 27,268,573$
Special Revenue Funds
69
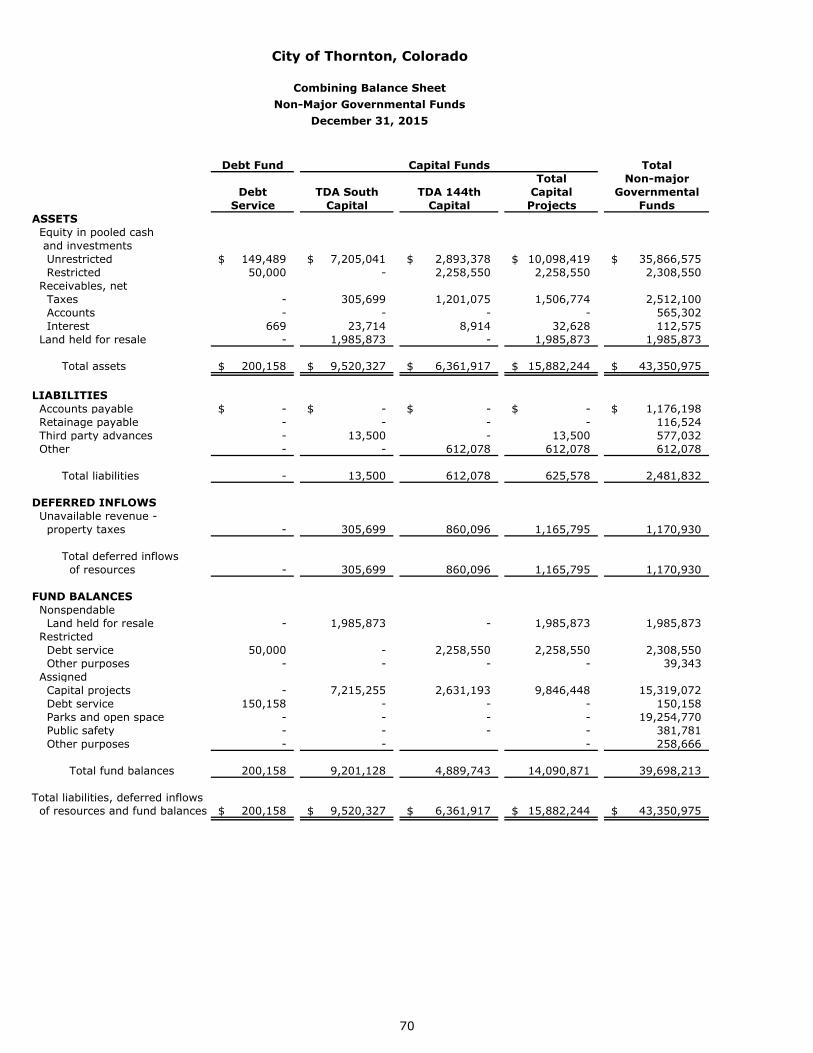
City of Thornton, Colorado
Combining Balance SheetNon-Major Governmental Funds
December 31, 2015
Debt Fund Capital Funds TotalTotal Non-major
Debt TDA South TDA 144th Capital GovernmentalService Capital Capital Projects Funds
ASSETS Equity in pooled cash and investments Unrestricted 149,489$ 7,205,041$ 2,893,378$ 10,098,419$ 35,866,575$ Restricted 50,000 - 2,258,550 2,258,550 2,308,550 Receivables, net Taxes - 305,699 1,201,075 1,506,774 2,512,100 Accounts - - - - 565,302 Interest 669 23,714 8,914 32,628 112,575 Land held for resale - 1,985,873 - 1,985,873 1,985,873
Total assets 200,158$ 9,520,327$ 6,361,917$ 15,882,244$ 43,350,975$
LIABILITIES Accounts payable -$ -$ -$ -$ 1,176,198$ Retainage payable - - - - 116,524 Third party advances - 13,500 - 13,500 577,032 Other - - 612,078 612,078 612,078
Total liabilities - 13,500 612,078 625,578 2,481,832
DEFERRED INFLOWS Unavailable revenue - property taxes - 305,699 860,096 1,165,795 1,170,930
Total deferred inflows of resources - 305,699 860,096 1,165,795 1,170,930
FUND BALANCES Nonspendable Land held for resale - 1,985,873 - 1,985,873 1,985,873 Restricted Debt service 50,000 - 2,258,550 2,258,550 2,308,550 Other purposes - - - - 39,343 Assigned Capital projects - 7,215,255 2,631,193 9,846,448 15,319,072 Debt service 150,158 - - - 150,158 Parks and open space - - - - 19,254,770 Public safety - - - - 381,781 Other purposes - - - 258,666
Total fund balances 200,158 9,201,128 4,889,743 14,090,871 39,698,213
Total liabilities, deferred inflows of resources and fund balances 200,158$ 9,520,327$ 6,361,917$ 15,882,244$ 43,350,975$
70

This Page Left Intentionally Blank
71
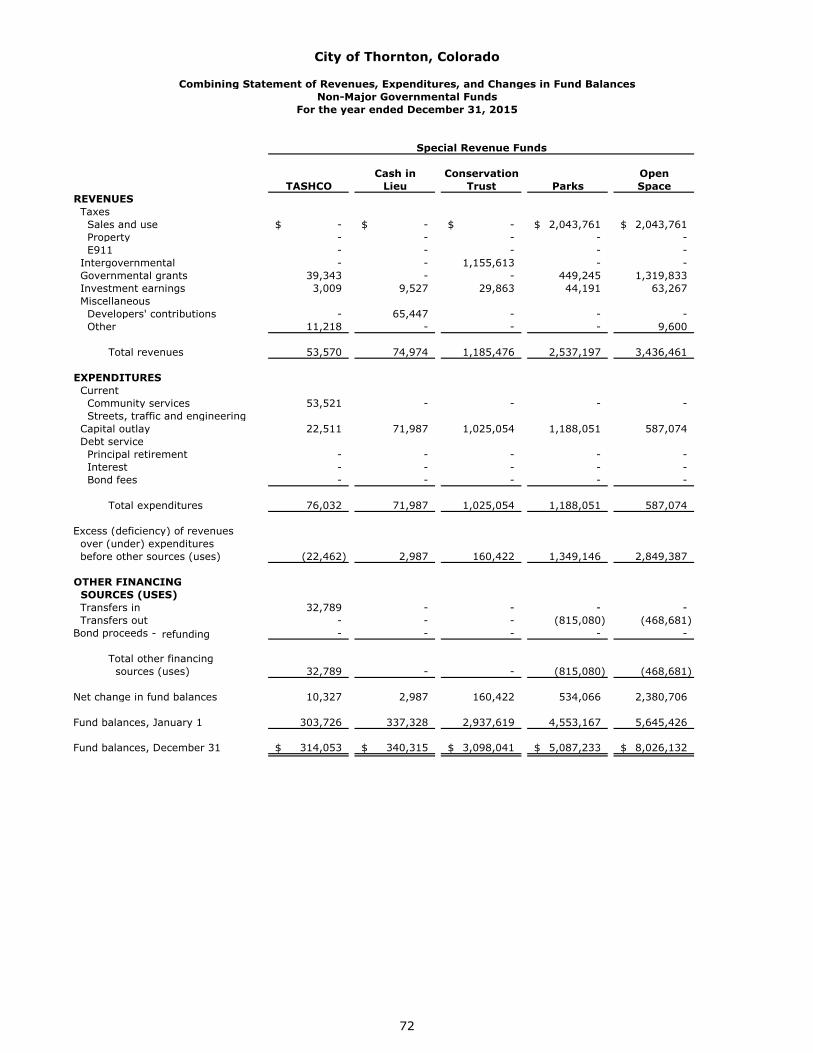
City of Thornton, Colorado
Combining Statement of Revenues, Expenditures, and Changes in Fund BalancesNon-Major Governmental Funds
For the year ended December 31, 2015
Special Revenue Funds
Cash in Conservation OpenTASHCO Lieu Trust Parks Space
REVENUES Taxes Sales and use -$ -$ -$ 2,043,761$ 2,043,761$ Property - - - - - E911 - - - - - Intergovernmental - - 1,155,613 - - Governmental grants 39,343 - - 449,245 1,319,833 Investment earnings 3,009 9,527 29,863 44,191 63,267 Miscellaneous Developers' contributions - 65,447 - - - Other 11,218 - - - 9,600
Total revenues 53,570 74,974 1,185,476 2,537,197 3,436,461
EXPENDITURES Current Community services 53,521 - - - - Streets, traffic and engineering Capital outlay 22,511 71,987 1,025,054 1,188,051 587,074 Debt service Principal retirement - - - - - Interest - - - - - Bond fees - - - - -
Total expenditures 76,032 71,987 1,025,054 1,188,051 587,074
Excess (deficiency) of revenues over (under) expenditures before other sources (uses) (22,462) 2,987 160,422 1,349,146 2,849,387
OTHER FINANCING
32,789 - - - - - - - (815,080) (468,681)
SOURCES (USES) Transfers in Transfers out Bond proceeds - - - - - -
Total other financingsources (uses) 32,789 - - (815,080) (468,681)
Net change in fund balances 10,327 2,987 160,422 534,066 2,380,706
Fund balances, January 1 303,726 337,328 2,937,619 4,553,167 5,645,426
Fund balances, December 31 314,053$ 340,315$ 3,098,041$ 5,087,233$ 8,026,132$
72
refunding
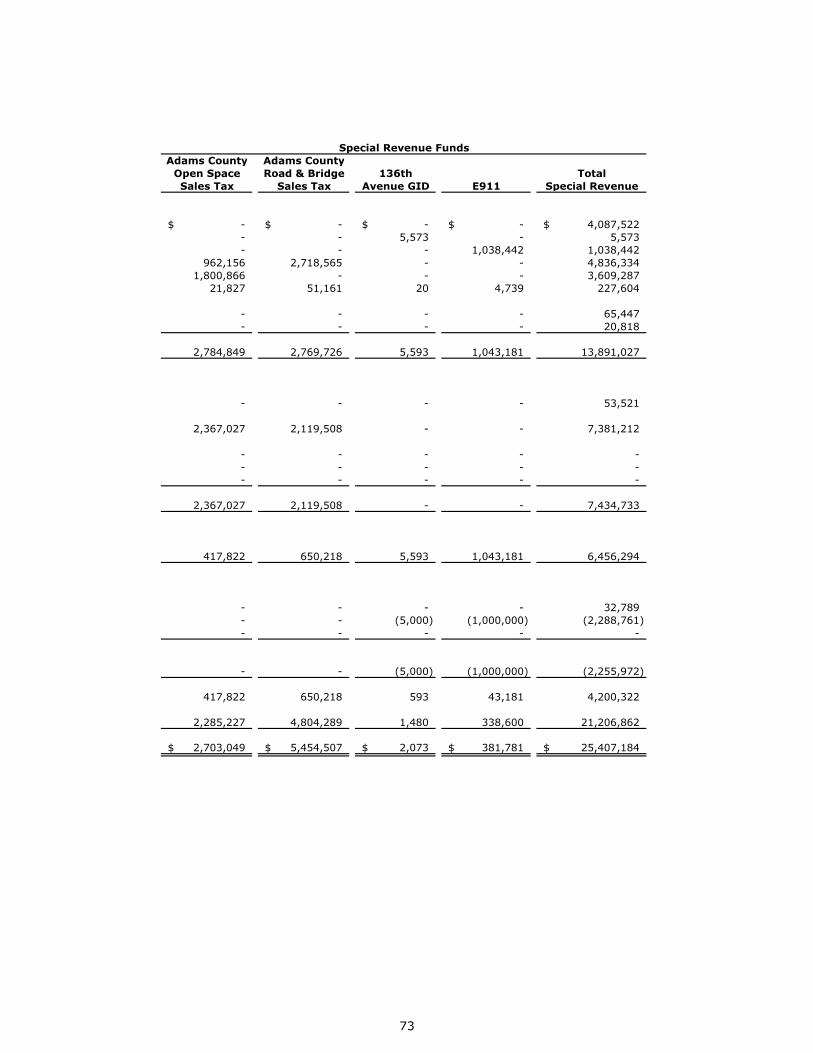
Special Revenue FundsAdams County Adams County
Open Space Road & Bridge 136th TotalSales Tax Sales Tax Avenue GID E911 Special Revenue
-$ -$ -$ -$ 4,087,522$ - - 5,573 - 5,573 - - - 1,038,442 1,038,442
962,156 2,718,565 - - 4,836,334 1,800,866 - - - 3,609,287
21,827 51,161 20 4,739 227,604
- - - - 65,447 - - - - 20,818
2,784,849 2,769,726 5,593 1,043,181 13,891,027
- - - - 53,521
2,367,027 2,119,508 - - 7,381,212
- - - - - - - - - - - - - - -
2,367,027 2,119,508 - - 7,434,733
417,822 650,218 5,593 1,043,181 6,456,294
- - - - 32,789 - - (5,000) (1,000,000) (2,288,761) - - - - -
- - (5,000) (1,000,000) (2,255,972)
417,822 650,218 593 43,181 4,200,322
2,285,227 4,804,289 1,480 338,600 21,206,862
2,703,049$ 5,454,507$ 2,073$ 381,781$ 25,407,184$
73
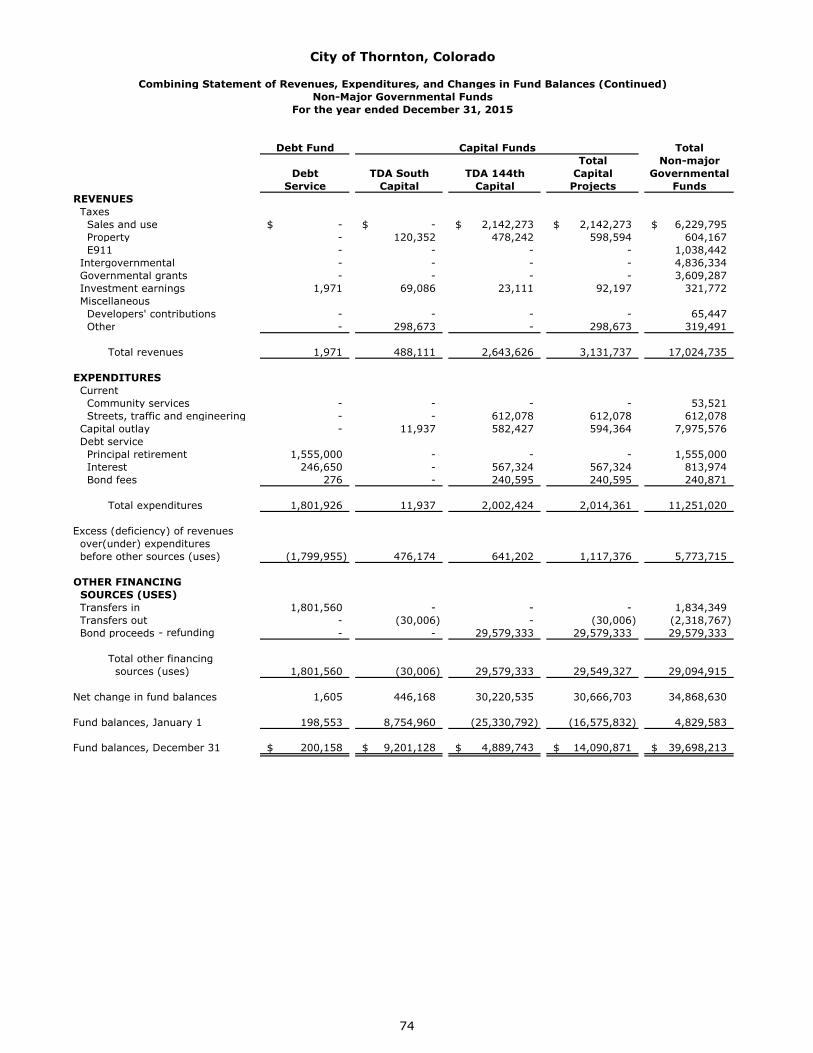
City of Thornton, Colorado
Combining Statement of Revenues, Expenditures, and Changes in Fund Balances (Continued)Non-Major Governmental Funds
For the year ended December 31, 2015
Debt Fund Capital Funds TotalTotal Non-major
Debt TDA South TDA 144th Capital GovernmentalService Capital Capital Projects Funds
REVENUES Taxes Sales and use -$ -$ 2,142,273$ 2,142,273$ 6,229,795$ Property - 120,352 478,242 598,594 604,167 E911 - - - - 1,038,442 Intergovernmental - - - - 4,836,334 Governmental grants - - - - 3,609,287 Investment earnings 1,971 69,086 23,111 92,197 321,772 Miscellaneous Developers' contributions - - - - 65,447 Other - 298,673 - 298,673 319,491
Total revenues 1,971 488,111 2,643,626 3,131,737 17,024,735
EXPENDITURES Current Community services - - - - 53,521 Streets, traffic and engineering - - 612,078 612,078 612,078 Capital outlay - 11,937 582,427 594,364 7,975,576 Debt service Principal retirement 1,555,000 - - - 1,555,000 Interest 246,650 - 567,324 567,324 813,974 Bond fees 276 - 240,595 240,595 240,871
Total expenditures 1,801,926 11,937 2,002,424 2,014,361 11,251,020
Excess (deficiency) of revenues over(under) expenditures before other sources (uses) (1,799,955) 476,174 641,202 1,117,376 5,773,715
OTHER FINANCING SOURCES (USES) Transfers in 1,801,560 - - - 1,834,349 Transfers out - (30,006) - (30,006) (2,318,767) Bond proceeds - - 29,579,333 29,579,333 29,579,333
Total other financingsources (uses) 1,801,560 (30,006) 29,579,333 29,549,327 29,094,915
Net change in fund balances 1,605 446,168 30,220,535 30,666,703 34,868,630
Fund balances, January 1 198,553 8,754,960 (25,330,792) (16,575,832) 4,829,583
Fund balances, December 31 200,158$ 9,201,128$ 4,889,743$ 14,090,871$ 39,698,213$
74
- refunding
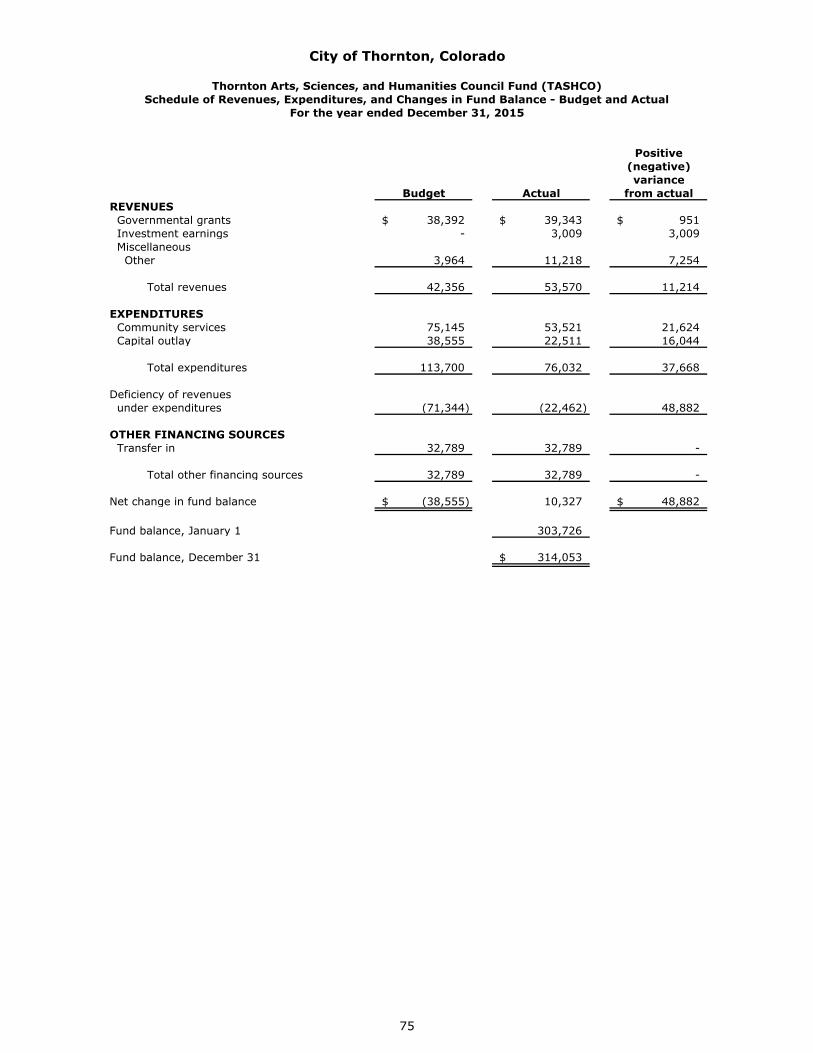
City of Thornton, Colorado
Thornton Arts, Sciences, and Humanities Council Fund (TASHCO)Schedule of Revenues, Expenditures, and Changes in Fund Balance - Budget and Actual
For the year ended December 31, 2015
Positive(negative)variance
Budget Actual from actualREVENUES Governmental grants 38,392$ 39,343$ 951$ Investment earnings - 3,009 3,009 Miscellaneous Other 3,964 11,218 7,254
Total revenues 42,356 53,570 11,214
EXPENDITURES Community services 75,145 53,521 21,624 Capital outlay 38,555 22,511 16,044
Total expenditures 113,700 76,032 37,668
Deficiency of revenues under expenditures (71,344) (22,462) 48,882
OTHER FINANCING SOURCES Transfer in 32,789 32,789 -
Total other financing sources 32,789 32,789 -
Net change in fund balance (38,555)$ 10,327 48,882$
Fund balance, January 1 303,726
Fund balance, December 31 314,053$
75
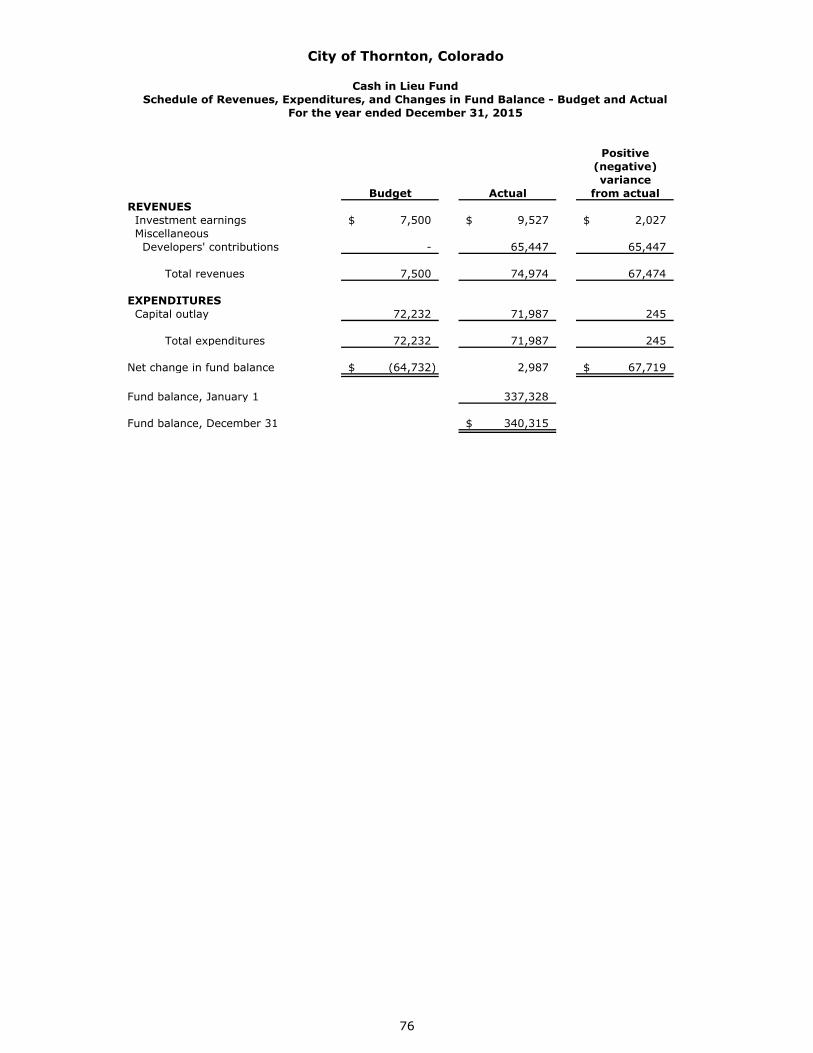
City of Thornton, Colorado
Cash in Lieu FundSchedule of Revenues, Expenditures, and Changes in Fund Balance - Budget and Actual
For the year ended December 31, 2015
Positive(negative)variance
Budget Actual from actualREVENUES Investment earnings 7,500$ 9,527$ 2,027$ Miscellaneous Developers' contributions - 65,447 65,447
Total revenues 7,500 74,974 67,474
EXPENDITURES Capital outlay 72,232 71,987 245
Total expenditures 72,232 71,987 245
Net change in fund balance (64,732)$ 2,987 67,719$
Fund balance, January 1 337,328
Fund balance, December 31 340,315$
76
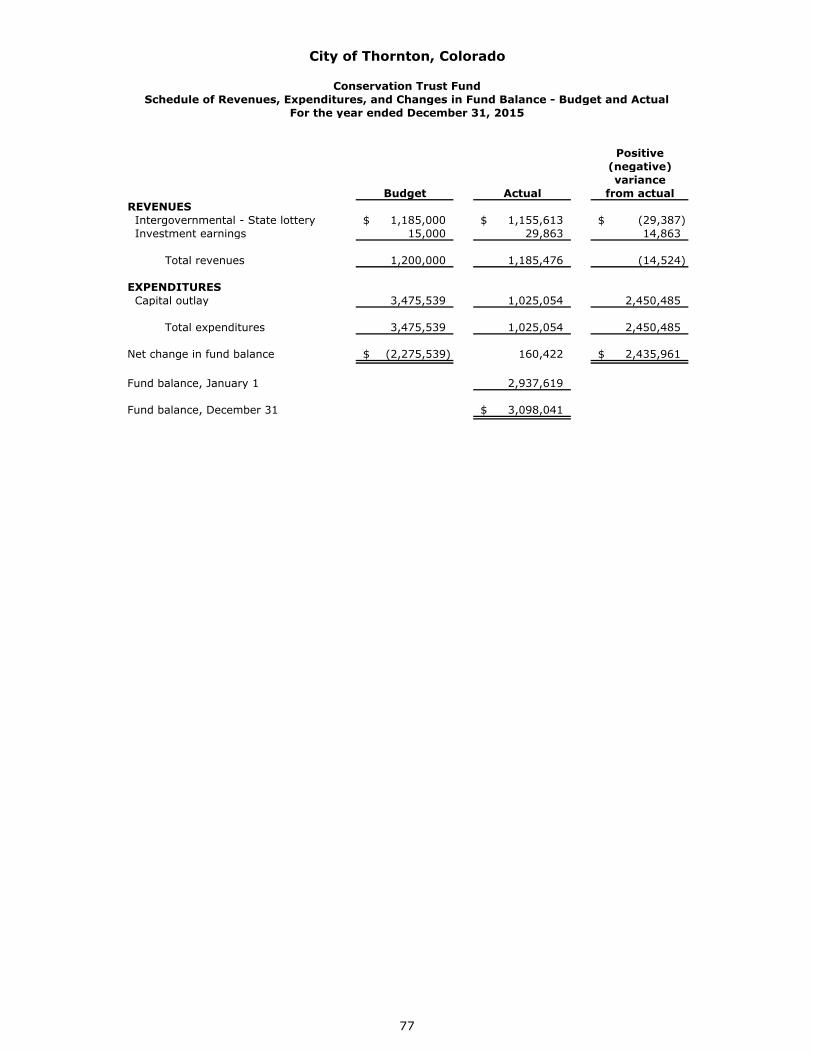
City of Thornton, Colorado
Conservation Trust FundSchedule of Revenues, Expenditures, and Changes in Fund Balance - Budget and Actual
For the year ended December 31, 2015
Positive(negative)variance
Budget Actual from actualREVENUES Intergovernmental - State lottery 1,185,000$ 1,155,613$ (29,387)$ Investment earnings 15,000 29,863 14,863
Total revenues 1,200,000 1,185,476 (14,524)
EXPENDITURES Capital outlay 3,475,539 1,025,054 2,450,485
Total expenditures 3,475,539 1,025,054 2,450,485
Net change in fund balance (2,275,539)$ 160,422 2,435,961$
Fund balance, January 1 2,937,619
Fund balance, December 31 3,098,041$
77
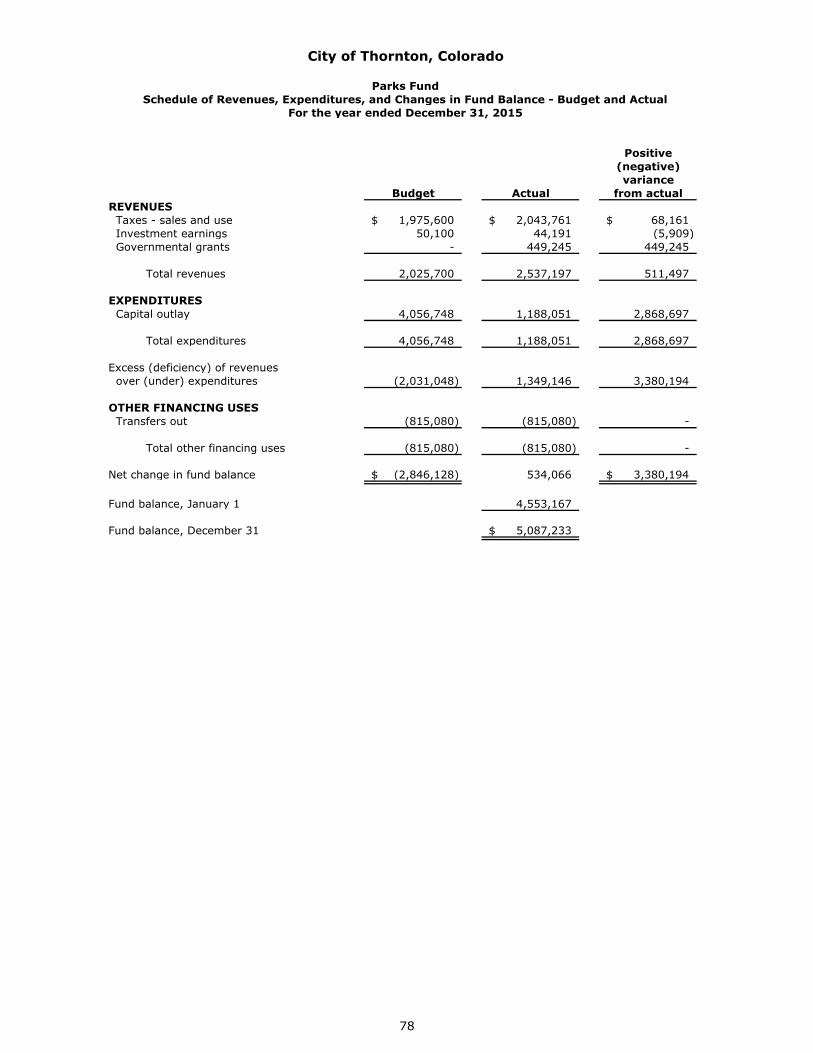
City of Thornton, Colorado
Parks FundSchedule of Revenues, Expenditures, and Changes in Fund Balance - Budget and Actual
For the year ended December 31, 2015
Positive(negative)variance
Budget Actual from actualREVENUES Taxes - sales and use 1,975,600$ 2,043,761$ 68,161$ Investment earnings 50,100 44,191 (5,909) Governmental grants - 449,245 449,245 Total revenues 2,025,700 2,537,197 511,497
EXPENDITURES Capital outlay 4,056,748 1,188,051 2,868,697
Total expenditures 4,056,748 1,188,051 2,868,697
Excess (deficiency) of revenues over (under) expenditures (2,031,048) 1,349,146 3,380,194
OTHER FINANCING USES Transfers out (815,080) (815,080) -
Total other financing uses (815,080) (815,080) -
Net change in fund balance (2,846,128)$ 534,066 3,380,194$
Fund balance, January 1 4,553,167
Fund balance, December 31 5,087,233$
78
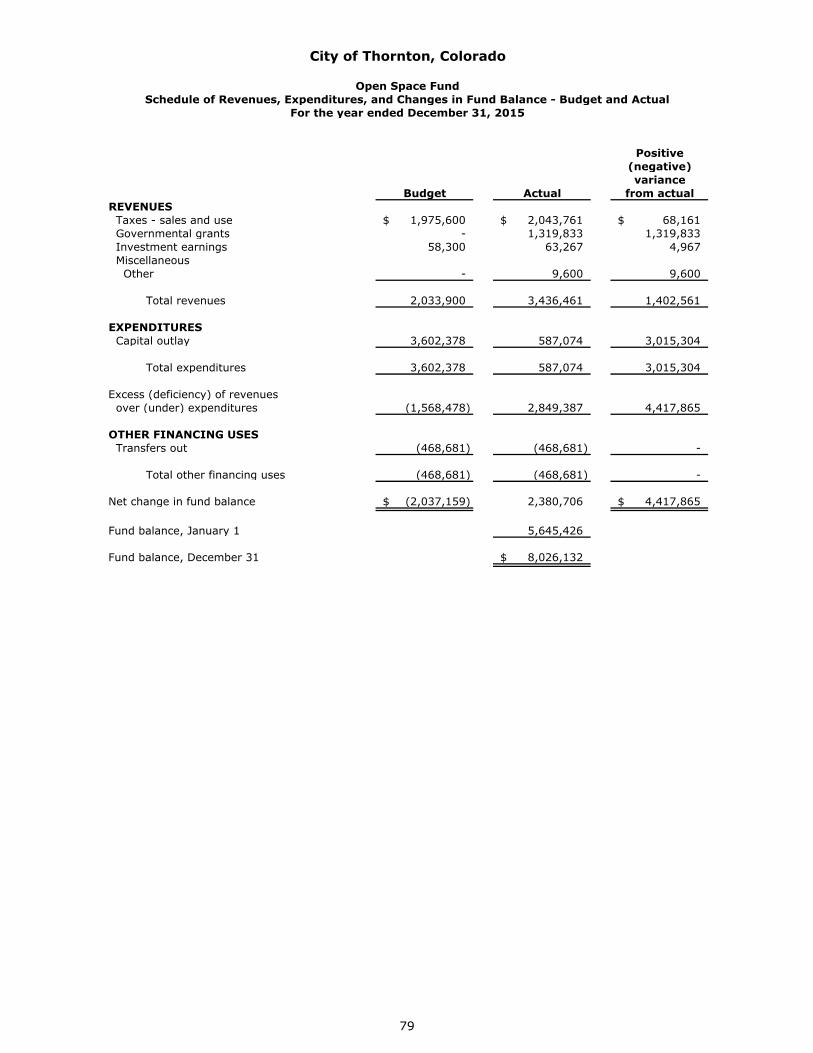
City of Thornton, Colorado
Open Space FundSchedule of Revenues, Expenditures, and Changes in Fund Balance - Budget and Actual
For the year ended December 31, 2015
Positive(negative)variance
Budget Actual from actualREVENUES Taxes - sales and use 1,975,600$ 2,043,761$ 68,161$ Governmental grants - 1,319,833 1,319,833 Investment earnings 58,300 63,267 4,967 Miscellaneous Other - 9,600 9,600
Total revenues 2,033,900 3,436,461 1,402,561
EXPENDITURES Capital outlay 3,602,378 587,074 3,015,304
Total expenditures 3,602,378 587,074 3,015,304
Excess (deficiency) of revenues over (under) expenditures (1,568,478) 2,849,387 4,417,865
OTHER FINANCING USES Transfers out (468,681) (468,681) -
Total other financing uses (468,681) (468,681) -
Net change in fund balance (2,037,159)$ 2,380,706 4,417,865$
Fund balance, January 1 5,645,426
Fund balance, December 31 8,026,132$
79
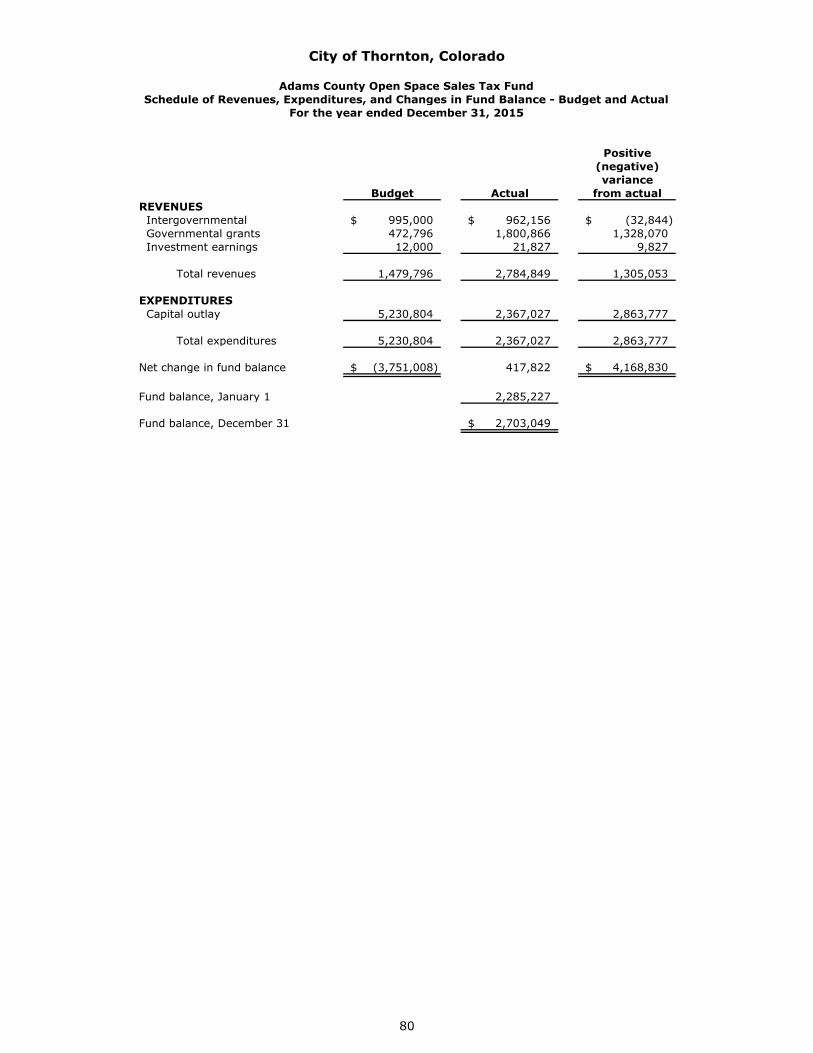
City of Thornton, Colorado
Adams County Open Space Sales Tax FundSchedule of Revenues, Expenditures, and Changes in Fund Balance - Budget and Actual
For the year ended December 31, 2015
Positive(negative)variance
Budget Actual from actualREVENUES Intergovernmental 995,000$ 962,156$ (32,844)$ Governmental grants 472,796 1,800,866 1,328,070 Investment earnings 12,000 21,827 9,827
Total revenues 1,479,796 2,784,849 1,305,053
EXPENDITURES Capital outlay 5,230,804 2,367,027 2,863,777
Total expenditures 5,230,804 2,367,027 2,863,777
Net change in fund balance (3,751,008)$ 417,822 4,168,830$
Fund balance, January 1 2,285,227
Fund balance, December 31 2,703,049$
80
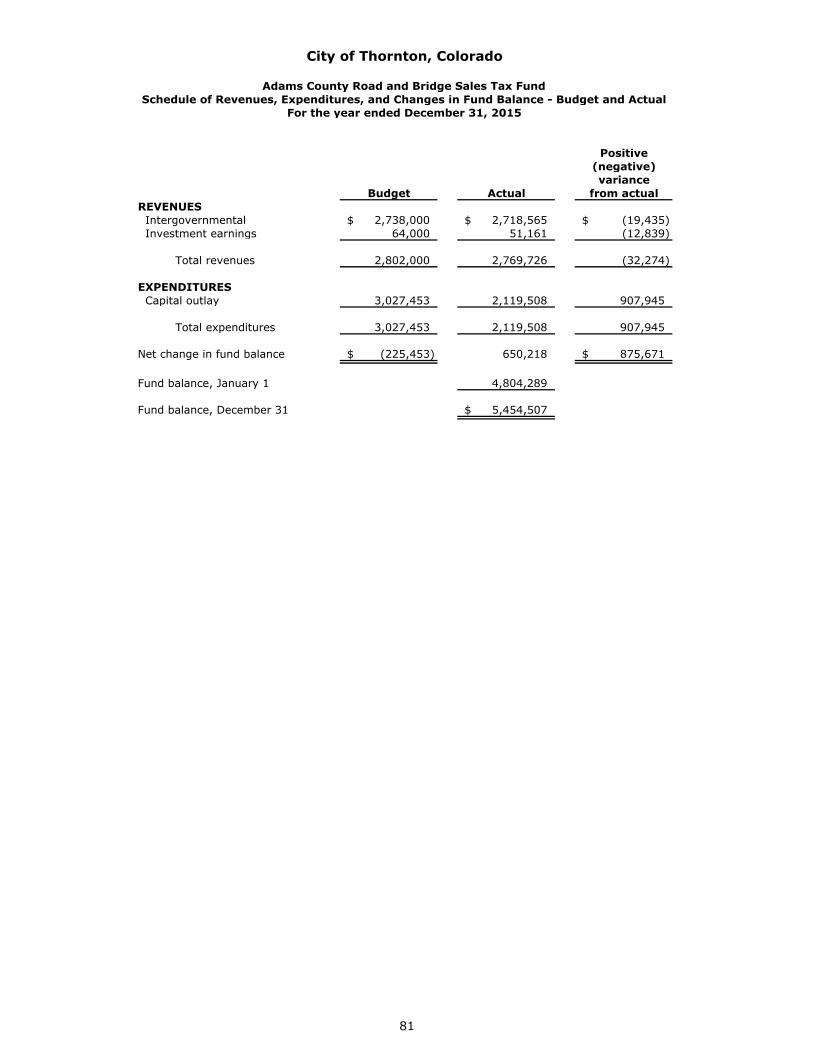
City of Thornton, Colorado
Adams County Road and Bridge Sales Tax FundSchedule of Revenues, Expenditures, and Changes in Fund Balance - Budget and Actual
For the year ended December 31, 2015
Positive(negative)variance
Budget Actual from actualREVENUES Intergovernmental 2,738,000$ 2,718,565$ (19,435)$ Investment earnings 64,000 51,161 (12,839)
Total revenues 2,802,000 2,769,726 (32,274)
EXPENDITURES Capital outlay 3,027,453 2,119,508 907,945
Total expenditures 3,027,453 2,119,508 907,945
Net change in fund balance (225,453)$ 650,218 875,671$
Fund balance, January 1 4,804,289
Fund balance, December 31 5,454,507$
81
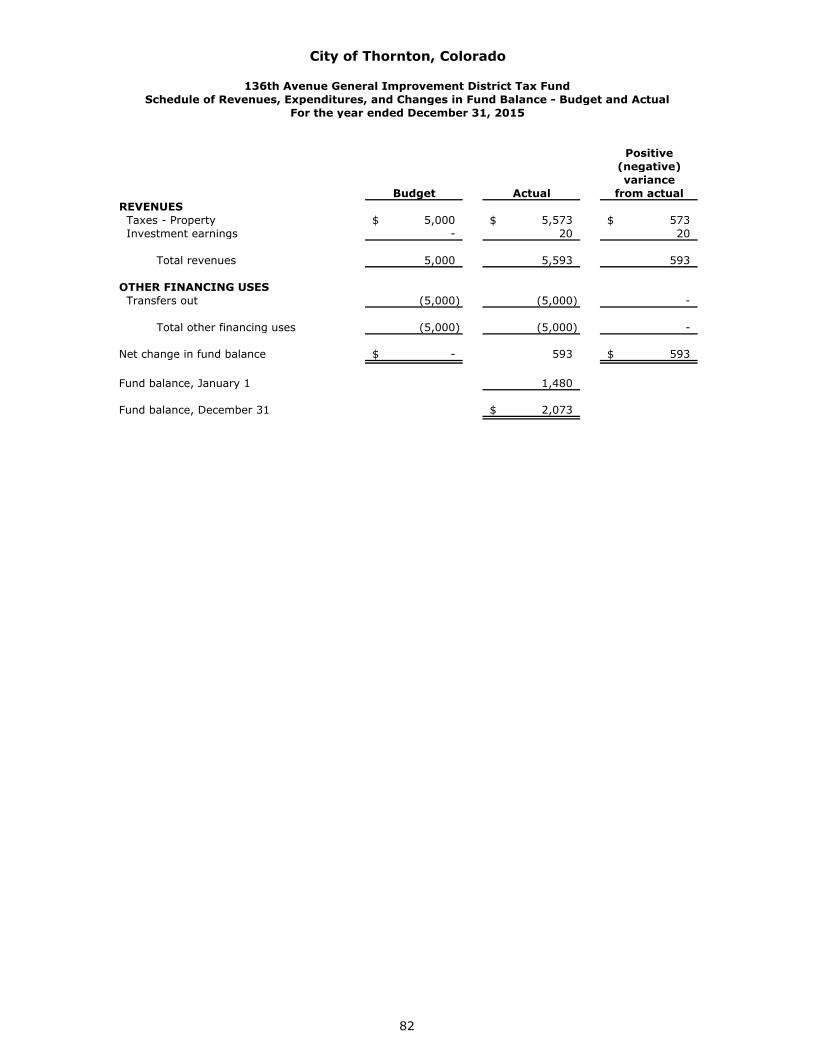
City of Thornton, Colorado
136th Avenue General Improvement District Tax FundSchedule of Revenues, Expenditures, and Changes in Fund Balance - Budget and Actual
For the year ended December 31, 2015
Positive(negative)variance
Budget Actual from actualREVENUES Taxes - Property 5,000$ 5,573$ 573$ Investment earnings - 20 20
Total revenues 5,000 5,593 593
OTHER FINANCING USES Transfers out (5,000) (5,000) -
Total other financing uses (5,000) (5,000) -
Net change in fund balance -$ 593 593$
Fund balance, January 1 1,480
Fund balance, December 31 2,073$
82
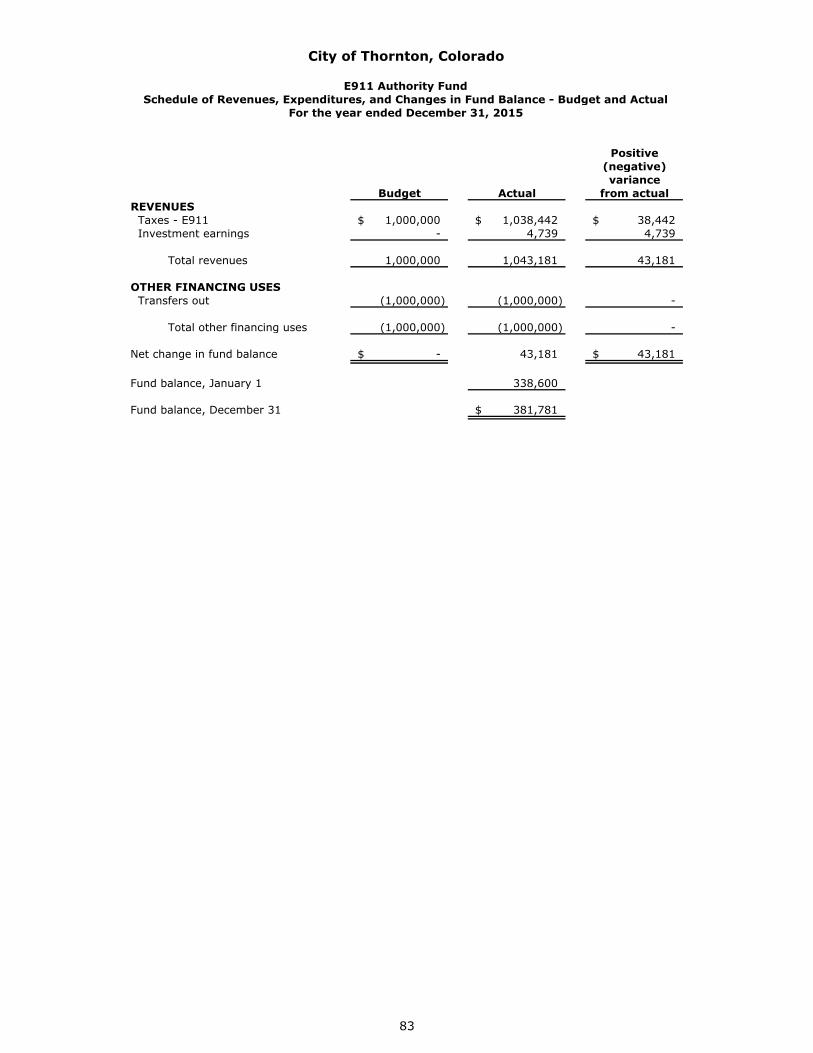
City of Thornton, Colorado
E911 Authority FundSchedule of Revenues, Expenditures, and Changes in Fund Balance - Budget and Actual
For the year ended December 31, 2015
Positive(negative)variance
Budget Actual from actualREVENUES Taxes - E911 1,000,000$ 1,038,442$ 38,442$ Investment earnings - 4,739 4,739
Total revenues 1,000,000 1,043,181 43,181
OTHER FINANCING USES Transfers out (1,000,000) (1,000,000) -
Total other financing uses (1,000,000) (1,000,000) -
Net change in fund balance -$ 43,181 43,181$
Fund balance, January 1 338,600
Fund balance, December 31 381,781$
83
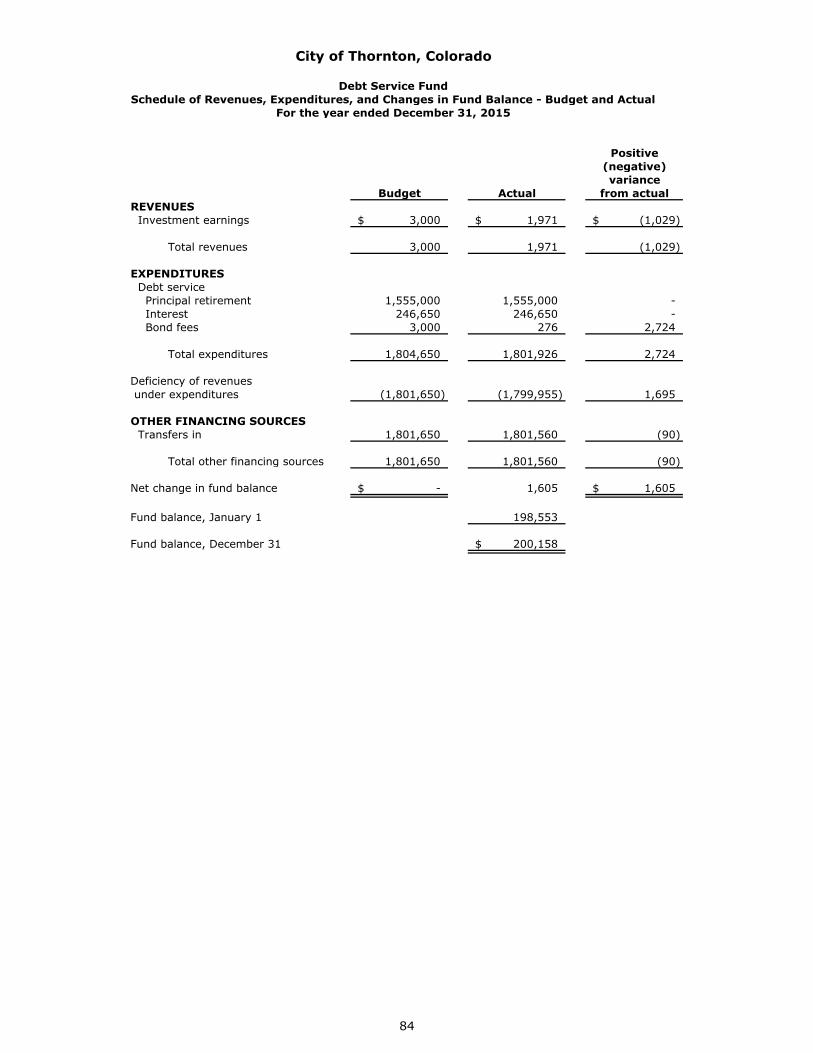
City of Thornton, Colorado
Debt Service FundSchedule of Revenues, Expenditures, and Changes in Fund Balance - Budget and Actual
For the year ended December 31, 2015
Positive(negative)variance
Budget Actual from actualREVENUES Investment earnings 3,000$ 1,971$ (1,029)$
Total revenues 3,000 1,971 (1,029)
EXPENDITURES Debt service Principal retirement 1,555,000 1,555,000 - Interest 246,650 246,650 - Bond fees 3,000 276 2,724
Total expenditures 1,804,650 1,801,926 2,724
Deficiency of revenues under expenditures (1,801,650) (1,799,955) 1,695
OTHER FINANCING SOURCES Transfers in 1,801,650 1,801,560 (90)
Total other financing sources 1,801,650 1,801,560 (90)
Net change in fund balance -$ 1,605 1,605$
Fund balance, January 1 198,553
Fund balance, December 31 200,158$
84
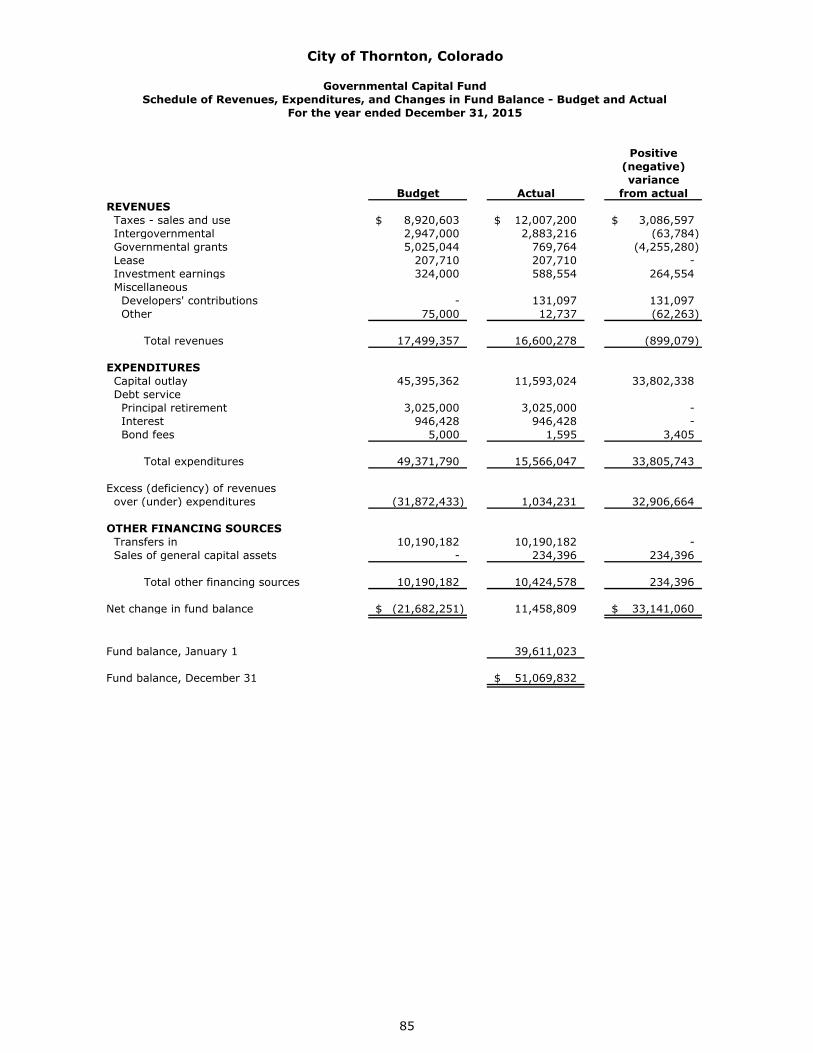
City of Thornton, Colorado
Governmental Capital FundSchedule of Revenues, Expenditures, and Changes in Fund Balance - Budget and Actual
For the year ended December 31, 2015
Positive(negative)variance
Budget Actual from actualREVENUES Taxes - sales and use 8,920,603$ 12,007,200$ 3,086,597$ Intergovernmental 2,947,000 2,883,216 (63,784) Governmental grants 5,025,044 769,764 (4,255,280) Lease 207,710 207,710 - Investment earnings 324,000 588,554 264,554 Miscellaneous Developers' contributions - 131,097 131,097 Other 75,000 12,737 (62,263)
Total revenues 17,499,357 16,600,278 (899,079)
EXPENDITURES Capital outlay 45,395,362 11,593,024 33,802,338 Debt service Principal retirement 3,025,000 3,025,000 - Interest 946,428 946,428 - Bond fees 5,000 1,595 3,405
Total expenditures 49,371,790 15,566,047 33,805,743
Excess (deficiency) of revenues over (under) expenditures (31,872,433) 1,034,231 32,906,664
OTHER FINANCING SOURCES Transfers in 10,190,182 10,190,182 - Sales of general capital assets - 234,396 234,396
Total other financing sources 10,190,182 10,424,578 234,396
Net change in fund balance (21,682,251)$ 11,458,809 33,141,060$
Fund balance, January 1 39,611,023
Fund balance, December 31 51,069,832$
85
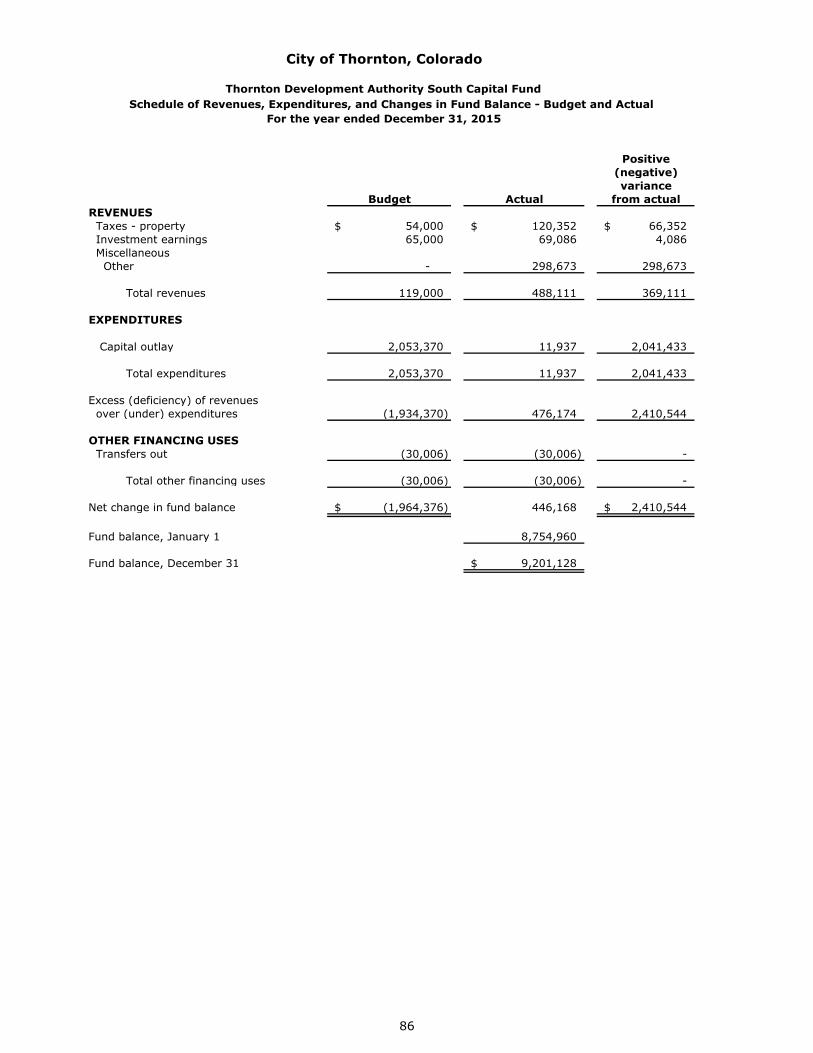
City of Thornton, Colorado
Thornton Development Authority South Capital FundSchedule of Revenues, Expenditures, and Changes in Fund Balance - Budget and Actual
For the year ended December 31, 2015
Positive(negative)variance
Budget Actual from actualREVENUES Taxes - property 54,000$ 120,352$ 66,352$ Investment earnings 65,000 69,086 4,086 Miscellaneous Other - 298,673 298,673
Total revenues 119,000 488,111 369,111
EXPENDITURES
Capital outlay 2,053,370 11,937 2,041,433
Total expenditures 2,053,370 11,937 2,041,433
Excess (deficiency) of revenues over (under) expenditures (1,934,370) 476,174 2,410,544
OTHER FINANCING USES Transfers out (30,006) (30,006) -
Total other financing uses (30,006) (30,006) -
Net change in fund balance (1,964,376)$ 446,168 2,410,544$
Fund balance, January 1 8,754,960
Fund balance, December 31 9,201,128$
86
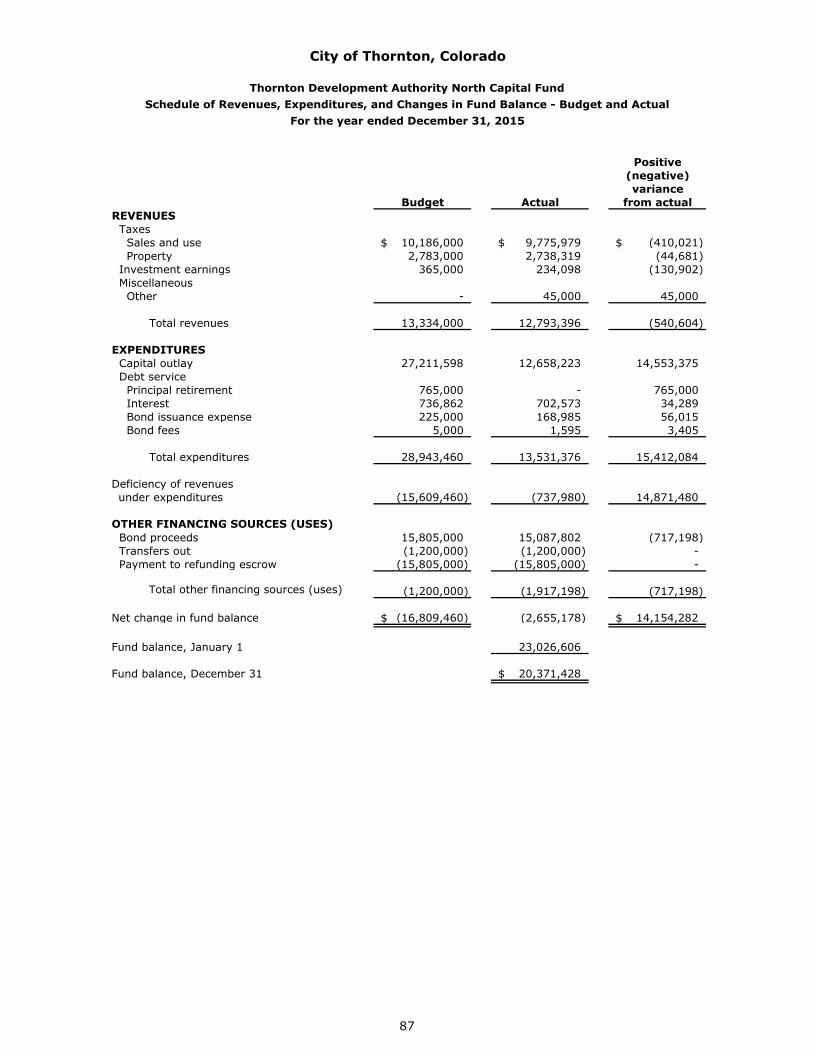
City of Thornton, Colorado
Thornton Development Authority North Capital FundSchedule of Revenues, Expenditures, and Changes in Fund Balance - Budget and Actual
For the year ended December 31, 2015
Positive(negative)variance
Budget Actual from actualREVENUES Taxes Sales and use 10,186,000$ 9,775,979$ (410,021)$ Property 2,783,000 2,738,319 (44,681) Investment earnings 365,000 234,098 (130,902) Miscellaneous Other - 45,000 45,000
Total revenues 13,334,000 12,793,396 (540,604)
EXPENDITURES Capital outlay 27,211,598 12,658,223 14,553,375 Debt service Principal retirement 765,000 - 765,000 Interest 736,862 702,573 34,289 Bond issuance expense 225,000 168,985 56,015 Bond fees 5,000 1,595 3,405
Total expenditures 28,943,460 13,531,376 15,412,084
Deficiency of revenues under expenditures (15,609,460) (737,980) 14,871,480
OTHER FINANCING SOURCES (USES) Bond proceeds 15,805,000 15,087,802 (717,198) Transfers out (1,200,000) (1,200,000) - Payment to refunding escrow (15,805,000) (15,805,000) -
Total other financing sources (uses) (1,200,000) (1,917,198) (717,198)
Net change in fund balance (16,809,460)$ (2,655,178) 14,154,282$
Fund balance, January 1 23,026,606
Fund balance, December 31 20,371,428$
87
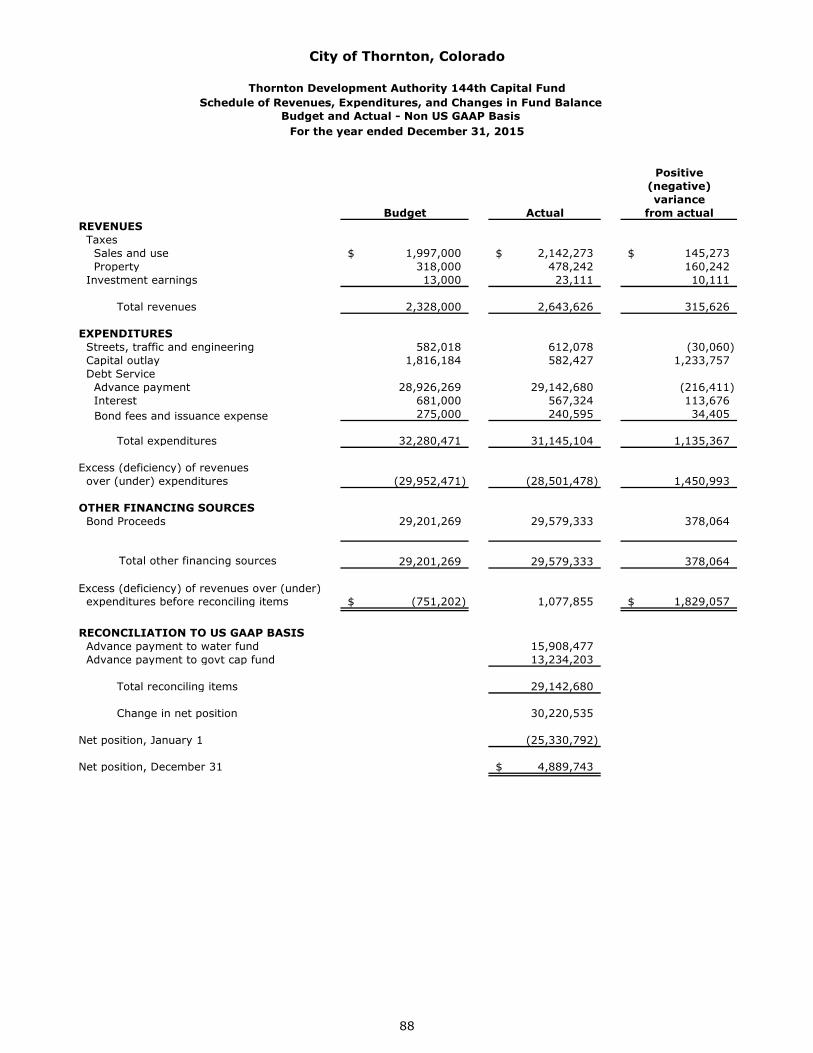
City of Thornton, Colorado
Thornton Development Authority 144th Capital FundSchedule of Revenues, Expenditures, and Changes in Fund Balance
Budget and Actual - Non US GAAP BasisFor the year ended December 31, 2015
Positive(negative)variance
Budget Actual from actualREVENUES Taxes Sales and use 1,997,000$ 2,142,273$ 145,273$ Property 318,000 478,242 160,242 Investment earnings 13,000 23,111 10,111
Total revenues 2,328,000 2,643,626 315,626
EXPENDITURES Streets, traffic and engineering 582,018 612,078 (30,060) Capital outlay 1,816,184 582,427 1,233,757 Debt Service
28,926,269 29,142,680 (216,411) 681,000 567,324 113,676
Advance payment Interest
275,000 240,595 34,405
Total expenditures 32,280,471 31,145,104 1,135,367
Excess (deficiency) of revenues over (under) expenditures (29,952,471) (28,501,478) 1,450,993
OTHER FINANCING SOURCES Bond Proceeds 29,201,269 29,579,333 378,064
Total other financing sources 29,201,269 29,579,333 378,064
Excess (deficiency) of revenues over (under) expenditures before reconciling items (751,202)$ 1,077,855 1,829,057$
RECONCILIATION TO US GAAP BASIS Advance payment to water fund 15,908,477 Advance payment to govt cap fund 13,234,203
Total reconciling items 29,142,680
Change in net position 30,220,535
Net position, January 1 (25,330,792)
Net position, December 31 4,889,743$
Bond fees and issuance expense
88

This Page Left Intentionally Blank
89
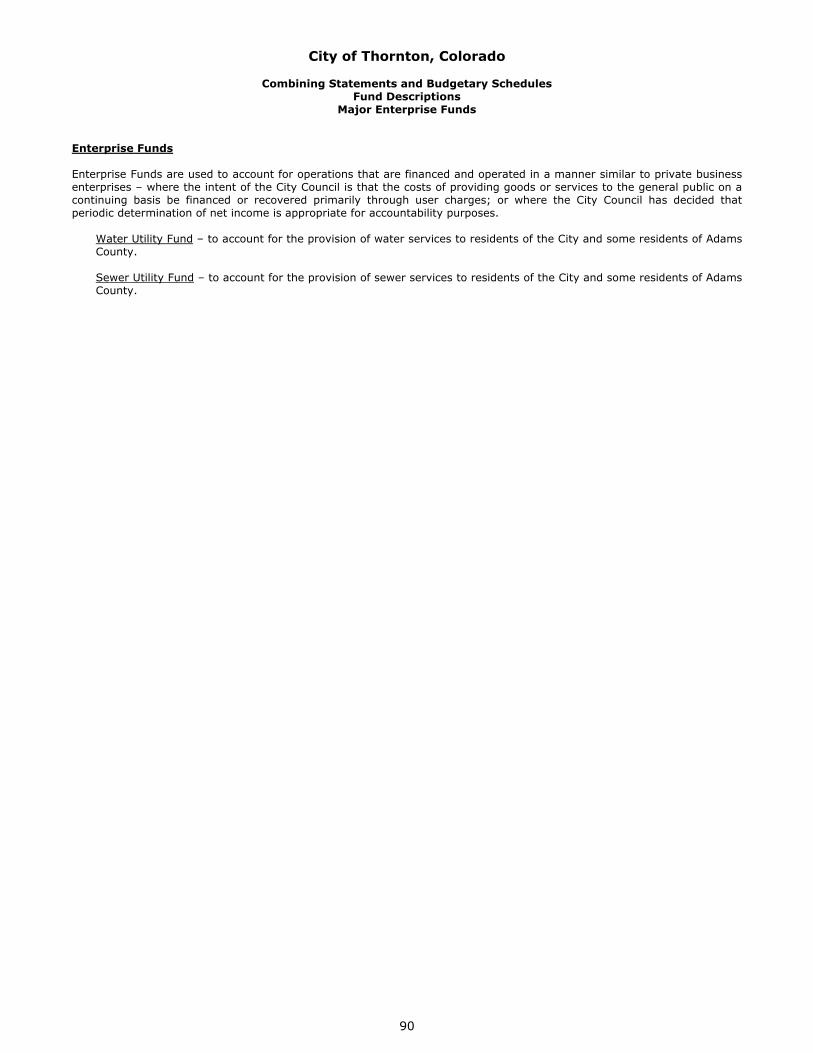
City of Thornton, Colorado
Combining Statements and Budgetary SchedulesFund Descriptions
Major Enterprise Funds
Enterprise Funds
Enterprise Funds are used to account for operations that are financed and operated in a manner similar to private business enterprises – where the intent of the City Council is that the costs of providing goods or services to the general public on a continuing basis be financed or recovered primarily through user charges; or where the City Council has decided that periodic determination of net income is appropriate for accountability purposes.
Water Utility Fund – to account for the provision of water services to residents of the City and some residents of Adams County.
Sewer Utility Fund – to account for the provision of sewer services to residents of the City and some residents of Adams County.
90
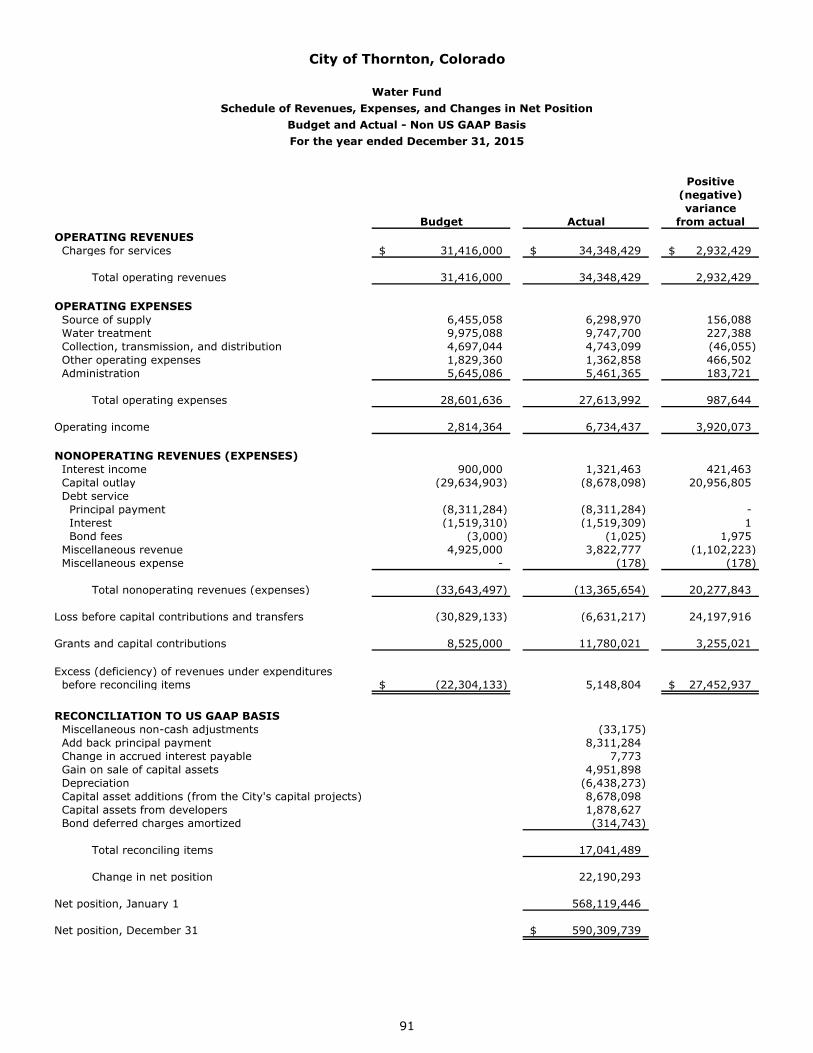
City of Thornton, Colorado
Water FundSchedule of Revenues, Expenses, and Changes in Net Position
Budget and Actual - Non US GAAP BasisFor the year ended December 31, 2015
Positive(negative)variance
Budget Actual from actualOPERATING REVENUES Charges for services 31,416,000$ 34,348,429$ 2,932,429$
Total operating revenues 31,416,000 34,348,429 2,932,429
OPERATING EXPENSES Source of supply 6,455,058 6,298,970 156,088 Water treatment 9,975,088 9,747,700 227,388 Collection, transmission, and distribution 4,697,044 4,743,099 (46,055) Other operating expenses 1,829,360 1,362,858 466,502 Administration 5,645,086 5,461,365 183,721
Total operating expenses 28,601,636 27,613,992 987,644
Operating income 2,814,364 6,734,437 3,920,073
NONOPERATING REVENUES (EXPENSES) Interest income 900,000 1,321,463 421,463 Capital outlay (29,634,903) (8,678,098) 20,956,805 Debt service Principal payment (8,311,284) (8,311,284) - Interest (1,519,310) (1,519,309) 1 Bond fees (3,000) (1,025) 1,975 Miscellaneous revenue 4,925,000 3,822,777 (1,102,223) Miscellaneous expense - (178) (178)
Total nonoperating revenues (expenses) (33,643,497) (13,365,654) 20,277,843
Loss before capital contributions and transfers (30,829,133) (6,631,217) 24,197,916
Grants and capital contributions 8,525,000 11,780,021 3,255,021
Excess (deficiency) of revenues under expenditures before reconciling items (22,304,133)$ 5,148,804 27,452,937$
RECONCILIATION TO US GAAP BASIS Miscellaneous non-cash adjustments (33,175) Add back principal payment 8,311,284 Change in accrued interest payable 7,773 Gain on sale of capital assets 4,951,898 Depreciation (6,438,273) Capital asset additions (from the City's capital projects) 8,678,098 Capital assets from developers 1,878,627 Bond deferred charges amortized (314,743)
Total reconciling items 17,041,489
Change in net position 22,190,293
Net position, January 1 568,119,446
Net position, December 31 590,309,739$
91
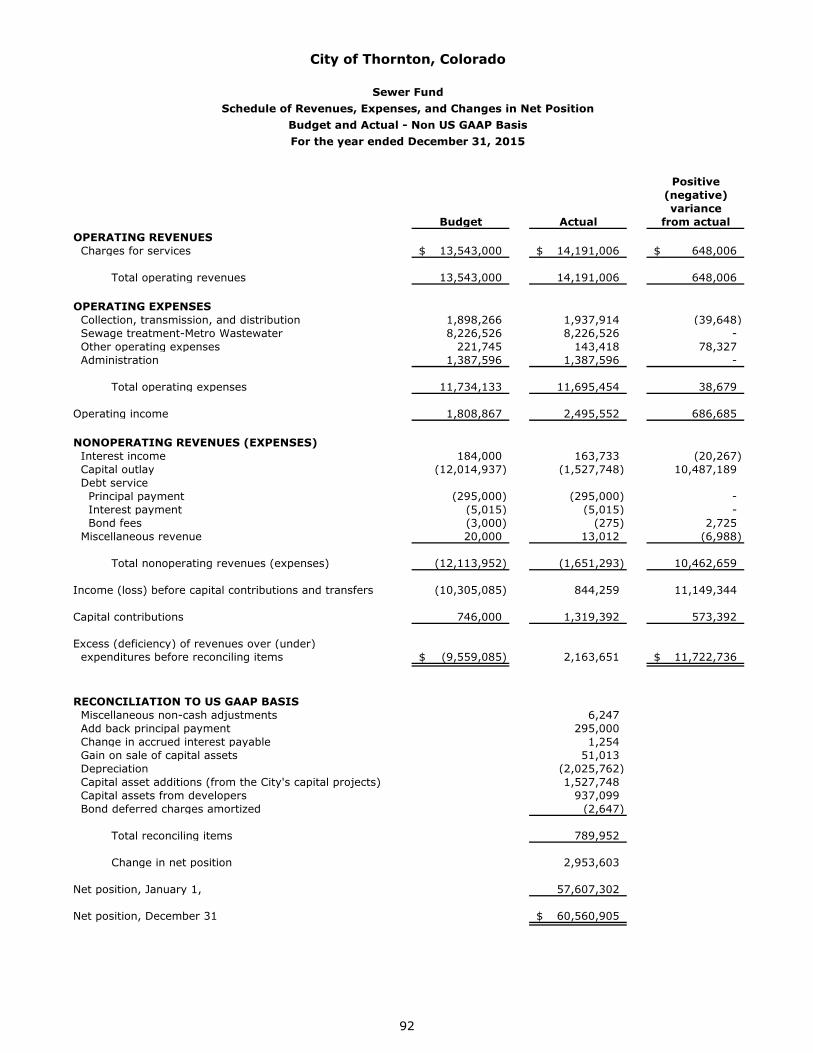
City of Thornton, Colorado
Sewer FundSchedule of Revenues, Expenses, and Changes in Net Position
Budget and Actual - Non US GAAP BasisFor the year ended December 31, 2015
Positive(negative)variance
Budget Actual from actualOPERATING REVENUES Charges for services 13,543,000$ 14,191,006$ 648,006$
Total operating revenues 13,543,000 14,191,006 648,006
OPERATING EXPENSES Collection, transmission, and distribution 1,898,266 1,937,914 (39,648) Sewage treatment-Metro Wastewater 8,226,526 8,226,526 - Other operating expenses 221,745 143,418 78,327 Administration 1,387,596 1,387,596 -
Total operating expenses 11,734,133 11,695,454 38,679
Operating income 1,808,867 2,495,552 686,685
NONOPERATING REVENUES (EXPENSES) Interest income 184,000 163,733 (20,267) Capital outlay (12,014,937) (1,527,748) 10,487,189 Debt service Principal payment (295,000) (295,000) - Interest payment (5,015) (5,015) - Bond fees (3,000) (275) 2,725 Miscellaneous revenue 20,000 13,012 (6,988)
Total nonoperating revenues (expenses) (12,113,952) (1,651,293) 10,462,659
Income (loss) before capital contributions and transfers (10,305,085) 844,259 11,149,344
Capital contributions 746,000 1,319,392 573,392
Excess (deficiency) of revenues over (under) expenditures before reconciling items (9,559,085)$ 2,163,651 11,722,736$
RECONCILIATION TO US GAAP BASIS Miscellaneous non-cash adjustments 6,247 Add back principal payment 295,000 Change in accrued interest payable 1,254 Gain on sale of capital assets 51,013 Depreciation (2,025,762) Capital asset additions (from the City's capital projects) 1,527,748 Capital assets from developers 937,099 Bond deferred charges amortized (2,647)
Total reconciling items 789,952
Change in net position 2,953,603
Net position, January 1, 57,607,302
Net position, December 31 60,560,905$
92
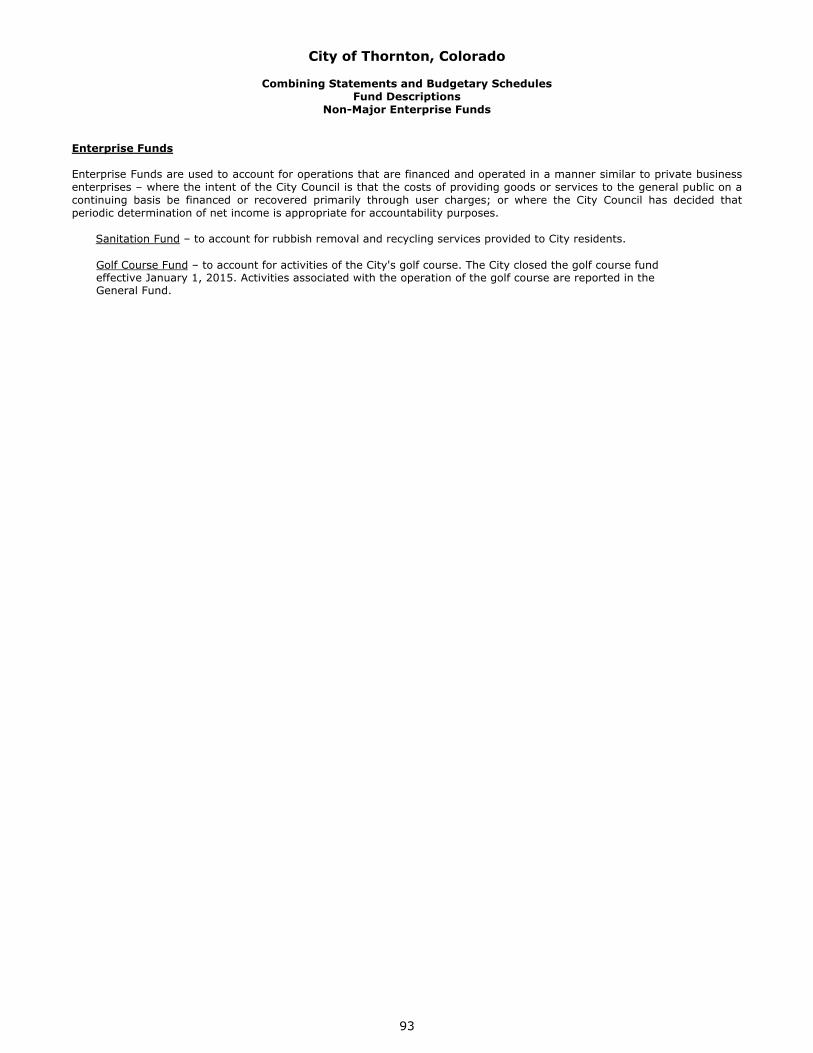
City of Thornton, Colorado
Combining Statements and Budgetary SchedulesFund Descriptions
Non-Major Enterprise Funds
Enterprise Funds
Enterprise Funds are used to account for operations that are financed and operated in a manner similar to private business enterprises – where the intent of the City Council is that the costs of providing goods or services to the general public on a continuing basis be financed or recovered primarily through user charges; or where the City Council has decided that periodic determination of net income is appropriate for accountability purposes.
Sanitation Fund – to account for rubbish removal and recycling services provided to City residents.
Golf Course Fund – to account for activities of the City's golf course. The City closed the golf course fund effective January 1, 2015. Activities associated with the operation of the golf course are reported in the General Fund.
93
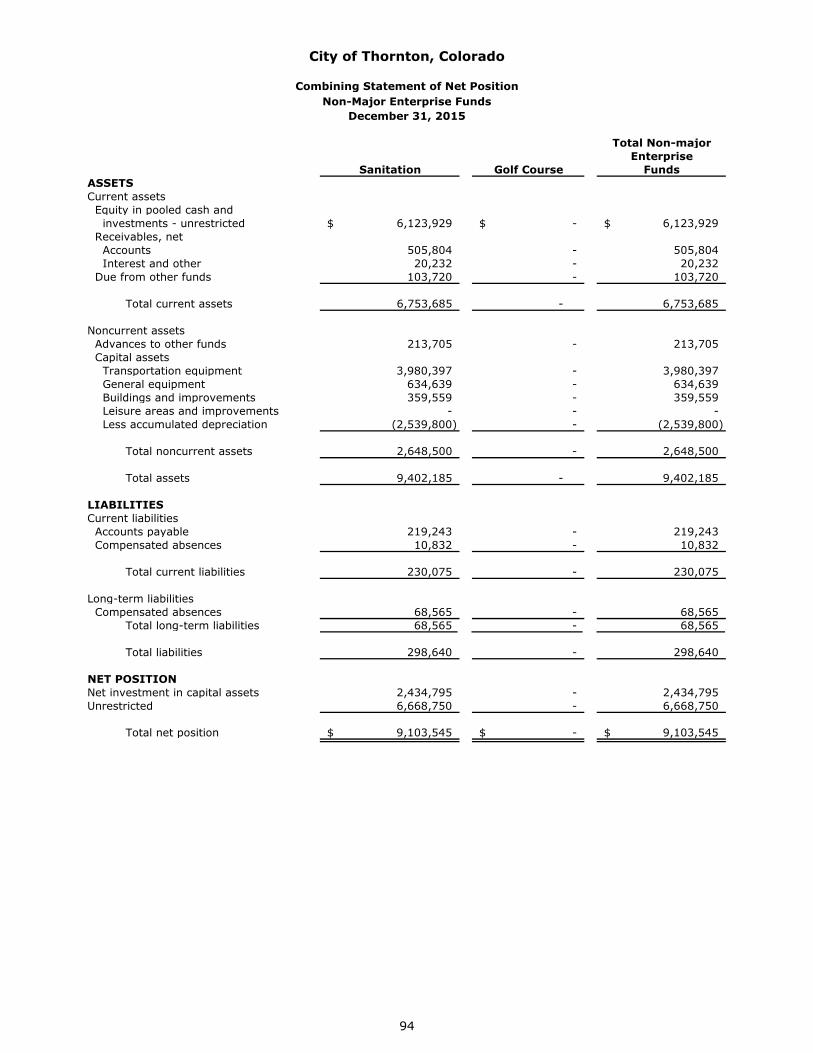
City of Thornton, Colorado
Combining Statement of Net PositionNon-Major Enterprise Funds
December 31, 2015
Total Non-majorEnterprise
Sanitation Golf Course FundsASSETSCurrent assets Equity in pooled cash and investments - unrestricted 6,123,929$ -$ 6,123,929$ Receivables, net Accounts 505,804 - 505,804 Interest and other 20,232 - 20,232 Due from other funds 103,720 - 103,720
Total current assets 6,753,685 - 6,753,685
Noncurrent assets Advances to other funds 213,705 - 213,705 Capital assets Transportation equipment 3,980,397 - 3,980,397 General equipment 634,639 - 634,639 Buildings and improvements 359,559 - 359,559 Leisure areas and improvements - - - Less accumulated depreciation (2,539,800) - (2,539,800)
Total noncurrent assets 2,648,500 - 2,648,500
Total assets 9,402,185 - 9,402,185
LIABILITIESCurrent liabilities Accounts payable 219,243 - 219,243 Compensated absences 10,832 - 10,832
Total current liabilities 230,075 - 230,075
Long-term liabilities Compensated absences 68,565 - 68,565 Total long-term liabilities 68,565 - 68,565
Total liabilities 298,640 - 298,640
NET POSITIONNet investment in capital assets 2,434,795 - 2,434,795 Unrestricted 6,668,750 - 6,668,750
Total net position 9,103,545$ -$ 9,103,545$
94
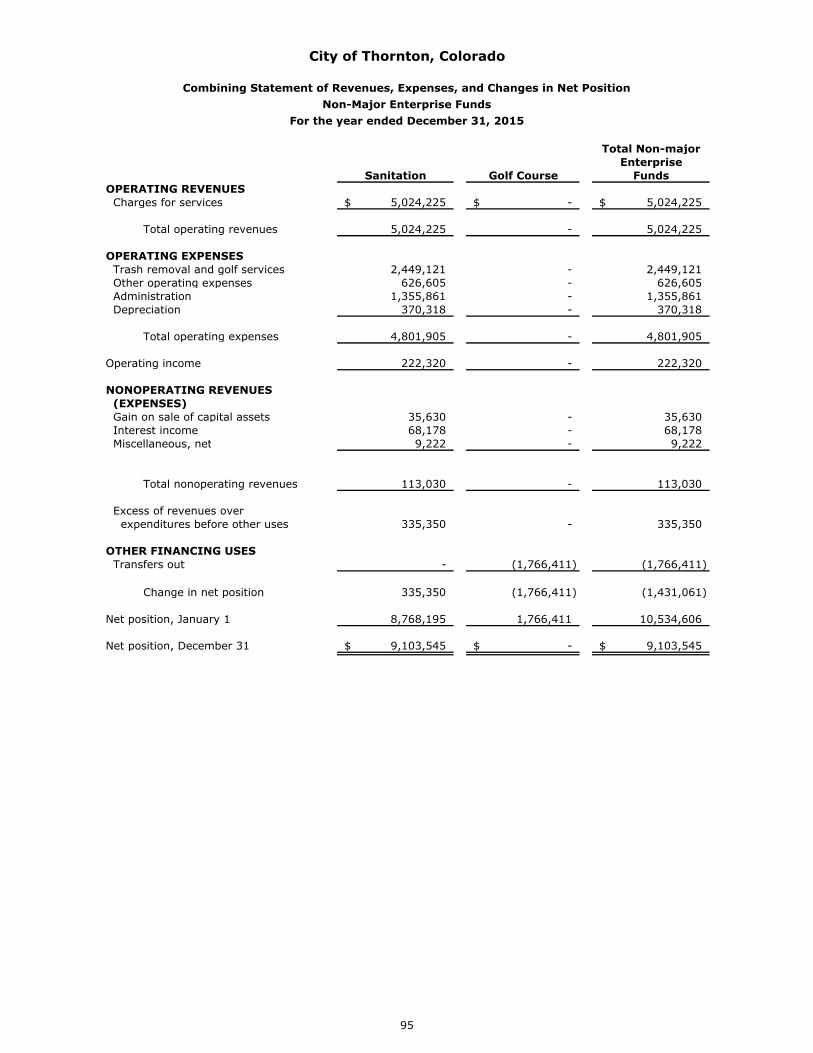
Total Non-majorEnterprise
Sanitation Golf Course FundsOPERATING REVENUES Charges for services 5,024,225$ -$ 5,024,225$
Total operating revenues 5,024,225 - 5,024,225
OPERATING EXPENSES Trash removal and golf services 2,449,121 - 2,449,121 Other operating expenses 626,605 - 626,605 Administration 1,355,861 - 1,355,861 Depreciation 370,318 - 370,318
Total operating expenses 4,801,905 - 4,801,905
Operating income 222,320 - 222,320
NONOPERATING REVENUES (EXPENSES) Gain on sale of capital assets 35,630 - 35,630 Interest income 68,178 - 68,178 Miscellaneous, net 9,222 - 9,222
Total nonoperating revenues 113,030 - 113,030
Excess of revenues over expenditures before other uses 335,350 - 335,350
OTHER FINANCING USES Transfers out - (1,766,411) (1,766,411)
Change in net position 335,350 (1,766,411) (1,431,061)
Net position, January 1 8,768,195 1,766,411 10,534,606
Net position, December 31 9,103,545$ -$ 9,103,545$
City of Thornton, Colorado
Combining Statement of Revenues, Expenses, and Changes in Net PositionNon-Major Enterprise Funds
For the year ended December 31, 2015
95
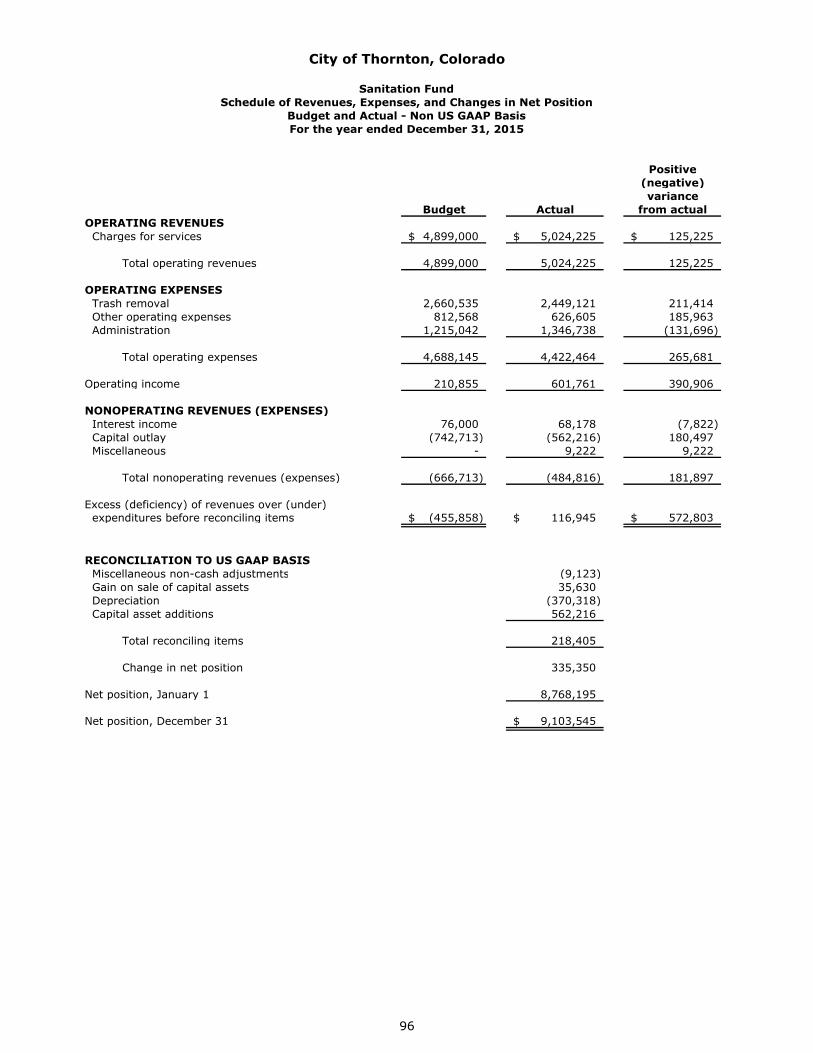
Positive(negative)variance
Budget Actual from actualOPERATING REVENUES Charges for services 4,899,000$ 5,024,225$ 125,225$
Total operating revenues 4,899,000 5,024,225 125,225
OPERATING EXPENSES Trash removal 2,660,535 2,449,121 211,414 Other operating expenses 812,568 626,605 185,963 Administration 1,215,042 1,346,738 (131,696)
Total operating expenses 4,688,145 4,422,464 265,681
Operating income 210,855 601,761 390,906
NONOPERATING REVENUES (EXPENSES) Interest income 76,000 68,178 (7,822) Capital outlay (742,713) (562,216) 180,497 Miscellaneous - 9,222 9,222
Total nonoperating revenues (expenses) (666,713) (484,816) 181,897
Excess (deficiency) of revenues over (under) expenditures before reconciling items (455,858)$ 116,945$ 572,803$
RECONCILIATION TO US GAAP BASIS Miscellaneous non-cash adjustments (9,123) Gain on sale of capital assets 35,630 Depreciation (370,318) Capital asset additions 562,216
Total reconciling items 218,405
Change in net position 335,350
Net position, January 1 8,768,195
Net position, December 31 9,103,545$
For the year ended December 31, 2015
City of Thornton, Colorado
Sanitation FundSchedule of Revenues, Expenses, and Changes in Net Position
Budget and Actual - Non US GAAP Basis
96
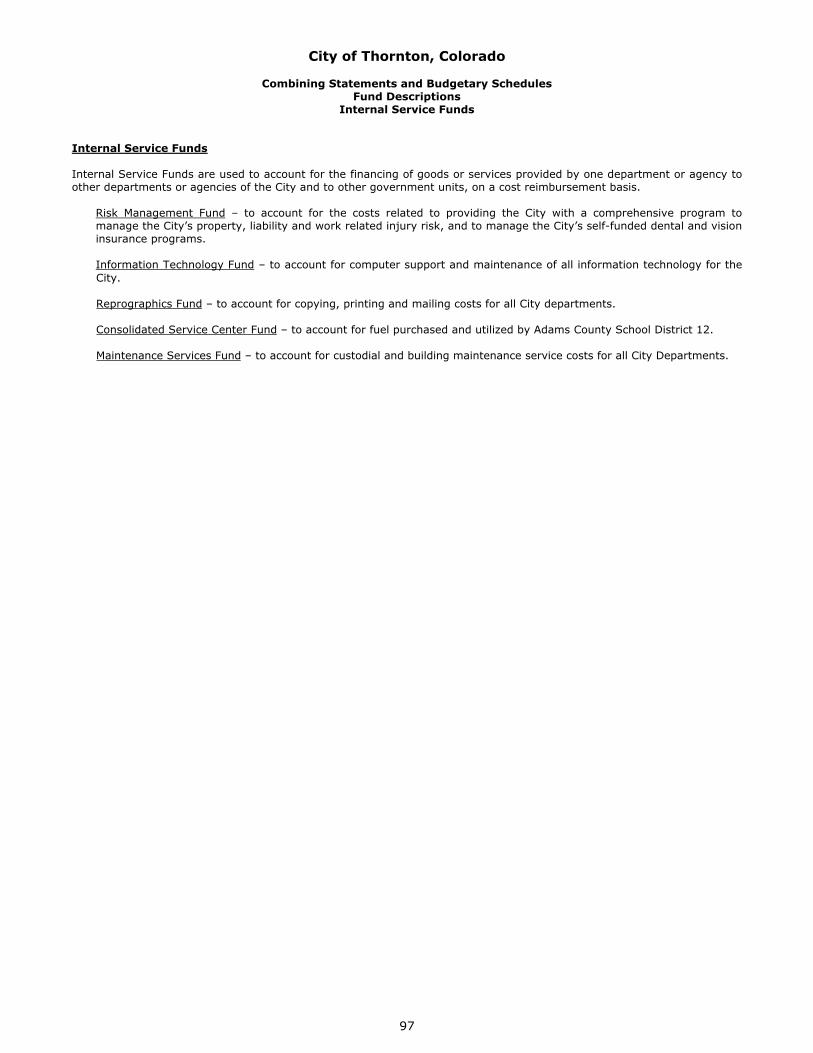
City of Thornton, Colorado
Combining Statements and Budgetary SchedulesFund Descriptions
Internal Service Funds
Internal Service Funds
Internal Service Funds are used to account for the financing of goods or services provided by one department or agency to other departments or agencies of the City and to other government units, on a cost reimbursement basis.
Risk Management Fund – to account for the costs related to providing the City with a comprehensive program to manage the City’s property, liability and work related injury risk, and to manage the City’s self-funded dental and vision insurance programs.
Information Technology Fund – to account for computer support and maintenance of all information technology for the City.
Reprographics Fund – to account for copying, printing and mailing costs for all City departments.
Consolidated Service Center Fund – to account for fuel purchased and utilized by Adams County School District 12.
Maintenance Services Fund – to account for custodial and building maintenance service costs for all City Departments.
97
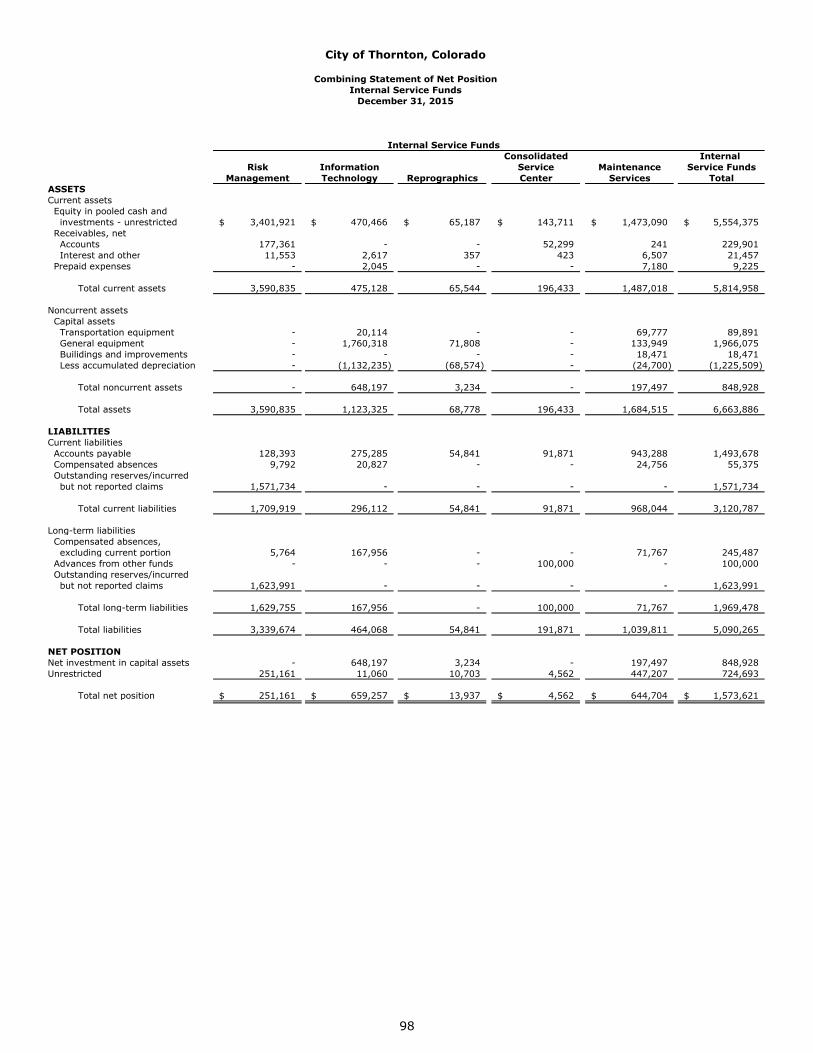
Consolidated Internal Risk Information Service Maintenance Service Funds
Management Technology Reprographics Center Services TotalASSETSCurrent assets Equity in pooled cash and investments - unrestricted 3,401,921$ 470,466$ 65,187$ 143,711$ 1,473,090$ 5,554,375$ Receivables, net Accounts 177,361 - - 52,299 241 229,901 Interest and other 11,553 2,617 357 423 6,507 21,457 Prepaid expenses - 2,045 - - 7,180 9,225
Total current assets 3,590,835 475,128 65,544 196,433 1,487,018 5,814,958
Noncurrent assets Capital assets Transportation equipment - 20,114 - - 69,777 89,891 General equipment - 1,760,318 71,808 - 133,949 1,966,075 Builidings and improvements - - - - 18,471 18,471 Less accumulated depreciation - (1,132,235) (68,574) - (24,700) (1,225,509)
Total noncurrent assets - 648,197 3,234 - 197,497 848,928
Total assets 3,590,835 1,123,325 68,778 196,433 1,684,515 6,663,886
LIABILITIESCurrent liabilities Accounts payable 128,393 275,285 54,841 91,871 943,288 1,493,678 Compensated absences 9,792 20,827 - - 24,756 55,375 Outstanding reserves/incurred but not reported claims 1,571,734 - - - - 1,571,734
Total current liabilities 1,709,919 296,112 54,841 91,871 968,044 3,120,787
Long-term liabilities Compensated absences, excluding current portion 5,764 167,956 - - 71,767 245,487 Advances from other funds - - - 100,000 - 100,000 Outstanding reserves/incurred but not reported claims 1,623,991 - - - - 1,623,991
Total long-term liabilities 1,629,755 167,956 - 100,000 71,767 1,969,478
Total liabilities 3,339,674 464,068 54,841 191,871 1,039,811 5,090,265
NET POSITIONNet investment in capital assets - 648,197 3,234 - 197,497 848,928 Unrestricted 251,161 11,060 10,703 4,562 447,207 724,693
Total net position 251,161$ 659,257$ 13,937$ 4,562$ 644,704$ 1,573,621$
Internal Service Funds
City of Thornton, Colorado
Combining Statement of Net PositionInternal Service Funds
December 31, 2015
98
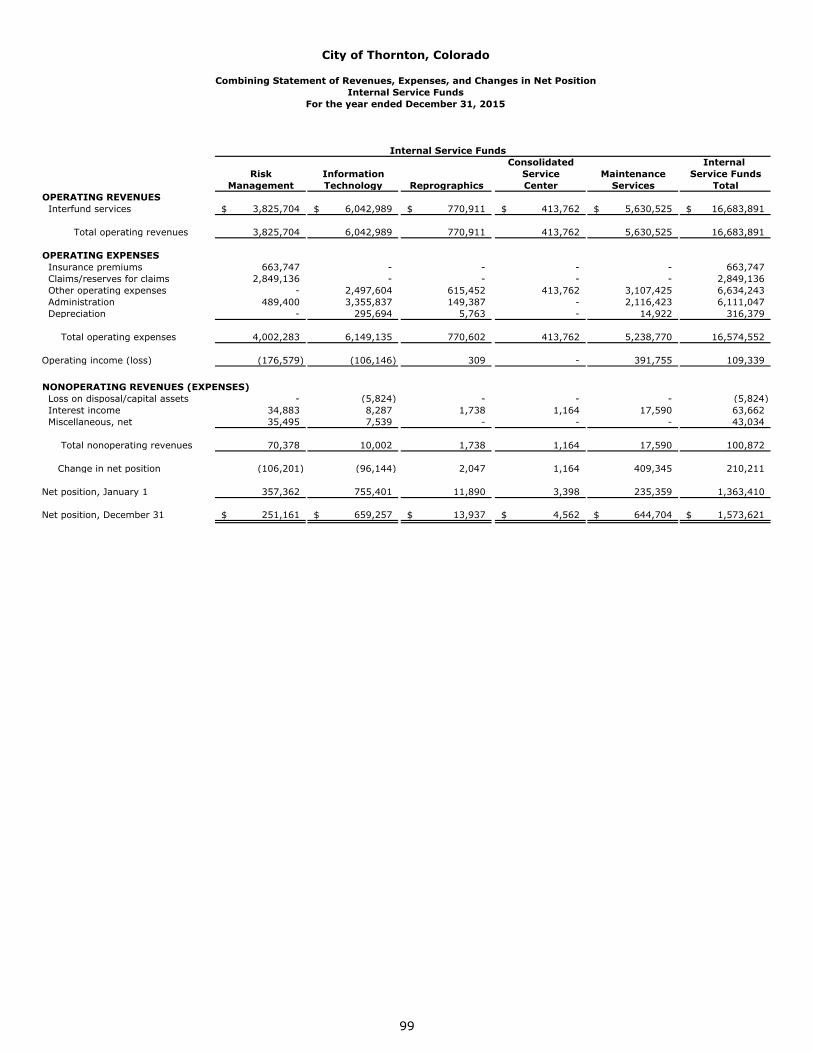
Consolidated Internal Risk Information Service Maintenance Service Funds
Management Technology Reprographics Center Services TotalOPERATING REVENUES Interfund services 3,825,704$ 6,042,989$ 770,911$ 413,762$ 5,630,525$ 16,683,891$
Total operating revenues 3,825,704 6,042,989 770,911 413,762 5,630,525 16,683,891
OPERATING EXPENSES Insurance premiums 663,747 - - - - 663,747 Claims/reserves for claims 2,849,136 - - - - 2,849,136 Other operating expenses - 2,497,604 615,452 413,762 3,107,425 6,634,243 Administration 489,400 3,355,837 149,387 - 2,116,423 6,111,047 Depreciation - 295,694 5,763 - 14,922 316,379
Total operating expenses 4,002,283 6,149,135 770,602 413,762 5,238,770 16,574,552
Operating income (loss) (176,579) (106,146) 309 - 391,755 109,339
NONOPERATING REVENUES (EXPENSES) Loss on disposal/capital assets - (5,824) - - - (5,824) Interest income 34,883 8,287 1,738 1,164 17,590 63,662 Miscellaneous, net 35,495 7,539 - - - 43,034
Total nonoperating revenues 70,378 10,002 1,738 1,164 17,590 100,872
Change in net position (106,201) (96,144) 2,047 1,164 409,345 210,211
Net position, January 1 357,362 755,401 11,890 3,398 235,359 1,363,410
Net position, December 31 251,161$ 659,257$ 13,937$ 4,562$ 644,704$ 1,573,621$
Internal Service Funds
City of Thornton, Colorado
Combining Statement of Revenues, Expenses, and Changes in Net PositionInternal Service Funds
For the year ended December 31, 2015
99
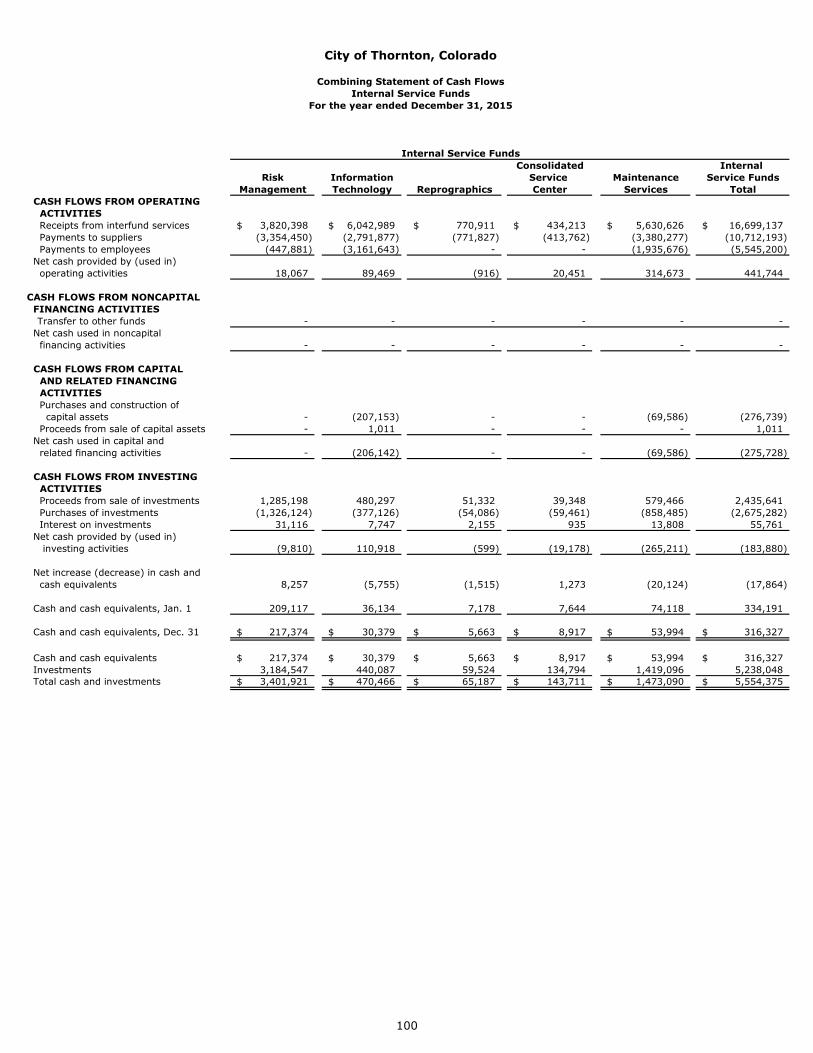
Consolidated Internal Risk Information Service Maintenance Service Funds
Management Technology Reprographics Center Services TotalCASH FLOWS FROM OPERATING ACTIVITIES Receipts from interfund services 3,820,398$ 6,042,989$ 770,911$ 434,213$ 5,630,626$ 16,699,137$ Payments to suppliers (3,354,450) (2,791,877) (771,827) (413,762) (3,380,277) (10,712,193) Payments to employees (447,881) (3,161,643) - - (1,935,676) (5,545,200) Net cash provided by (used in) operating activities 18,067 89,469 (916) 20,451 314,673 441,744
CASH FLOWS FROM NONCAPITAL FINANCING ACTIVITIES Transfer to other funds - - - - - - Net cash used in noncapital financing activities - - - - - -
CASH FLOWS FROM CAPITAL AND RELATED FINANCING ACTIVITIES Purchases and construction of capital assets - (207,153) - - (69,586) (276,739)
Proceeds from sale of capital assets - 1,011 - - - 1,011 Net cash used in capital and related financing activities - (206,142) - - (69,586) (275,728)
CASH FLOWS FROM INVESTING ACTIVITIES Proceeds from sale of investments 1,285,198 480,297 51,332 39,348 579,466 2,435,641 Purchases of investments (1,326,124) (377,126) (54,086) (59,461) (858,485) (2,675,282) Interest on investments 31,116 7,747 2,155 935 13,808 55,761 Net cash provided by (used in) investing activities (9,810) 110,918 (599) (19,178) (265,211) (183,880)
Net increase (decrease) in cash and cash equivalents 8,257 (5,755) (1,515) 1,273 (20,124) (17,864)
Cash and cash equivalents, Jan. 1 209,117 36,134 7,178 7,644 74,118 334,191
Cash and cash equivalents, Dec. 31 217,374$ 30,379$ 5,663$ 8,917$ 53,994$ 316,327$
Cash and cash equivalents 217,374$ 30,379$ 5,663$ 8,917$ 53,994$ 316,327$ Investments 3,184,547 440,087 59,524 134,794 1,419,096 5,238,048 Total cash and investments 3,401,921$ 470,466$ 65,187$ 143,711$ 1,473,090$ 5,554,375$
Internal Service Funds
City of Thornton, Colorado
Combining Statement of Cash FlowsInternal Service Funds
For the year ended December 31, 2015
100
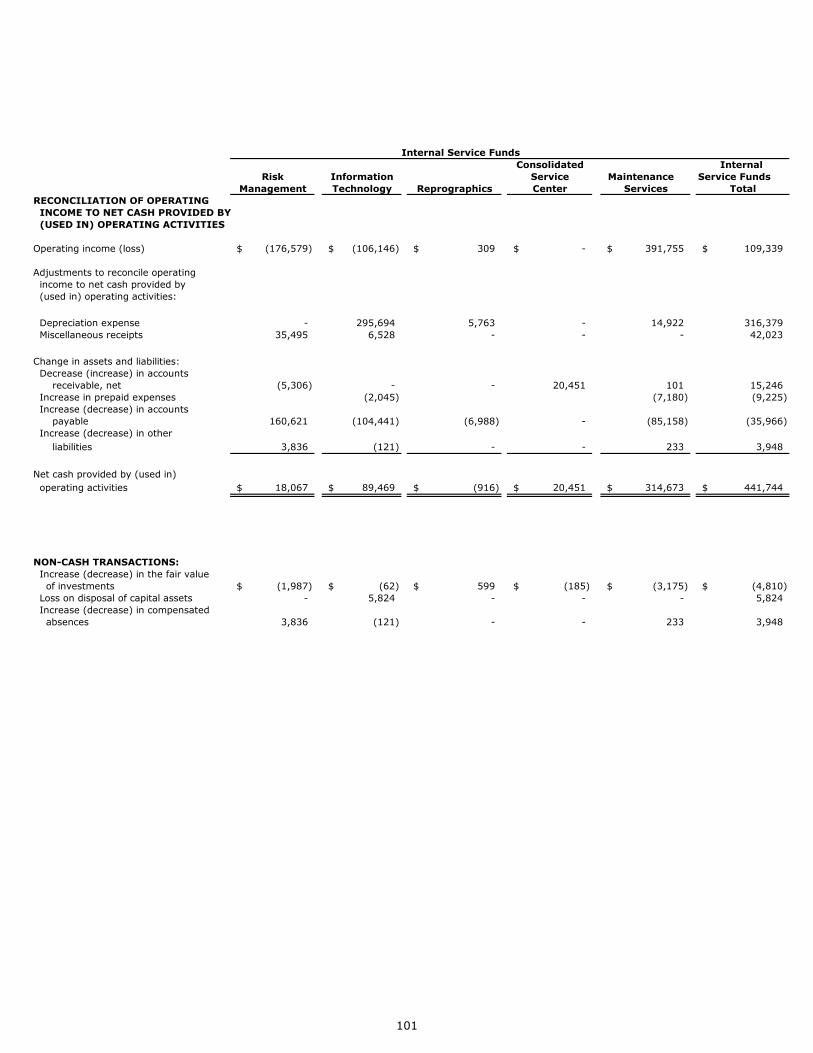
Consolidated Internal Risk Information Service Maintenance Service Funds
Management Technology Reprographics Center Services TotalRECONCILIATION OF OPERATING INCOME TO NET CASH PROVIDED BY (USED IN) OPERATING ACTIVITIES
Operating income (loss) (176,579)$ (106,146)$ 309$ -$ 391,755$ 109,339$
Adjustments to reconcile operating income to net cash provided by (used in) operating activities:
Depreciation expense - 295,694 5,763 - 14,922 316,379 Miscellaneous receipts 35,495 6,528 - - - 42,023
Change in assets and liabilities: Decrease (increase) in accounts receivable, net (5,306) - - 20,451 101 15,246 Increase in prepaid expenses (2,045) (7,180) (9,225) Increase (decrease) in accounts payable 160,621 (104,441) (6,988) - (85,158) (35,966) Increase (decrease) in other liabilities 3,836 (121) - - 233 3,948
Net cash provided by (used in) operating activities 18,067$ 89,469$ (916)$ 20,451$ 314,673$ 441,744$
NON-CASH TRANSACTIONS: Increase (decrease) in the fair value of investments (1,987)$ (62)$ 599$ (185)$ (3,175)$ (4,810)$ Loss on disposal of capital assets - 5,824 - - - 5,824 Increase (decrease) in compensated absences 3,836 (121) - - 233 3,948
Internal Service Funds
101
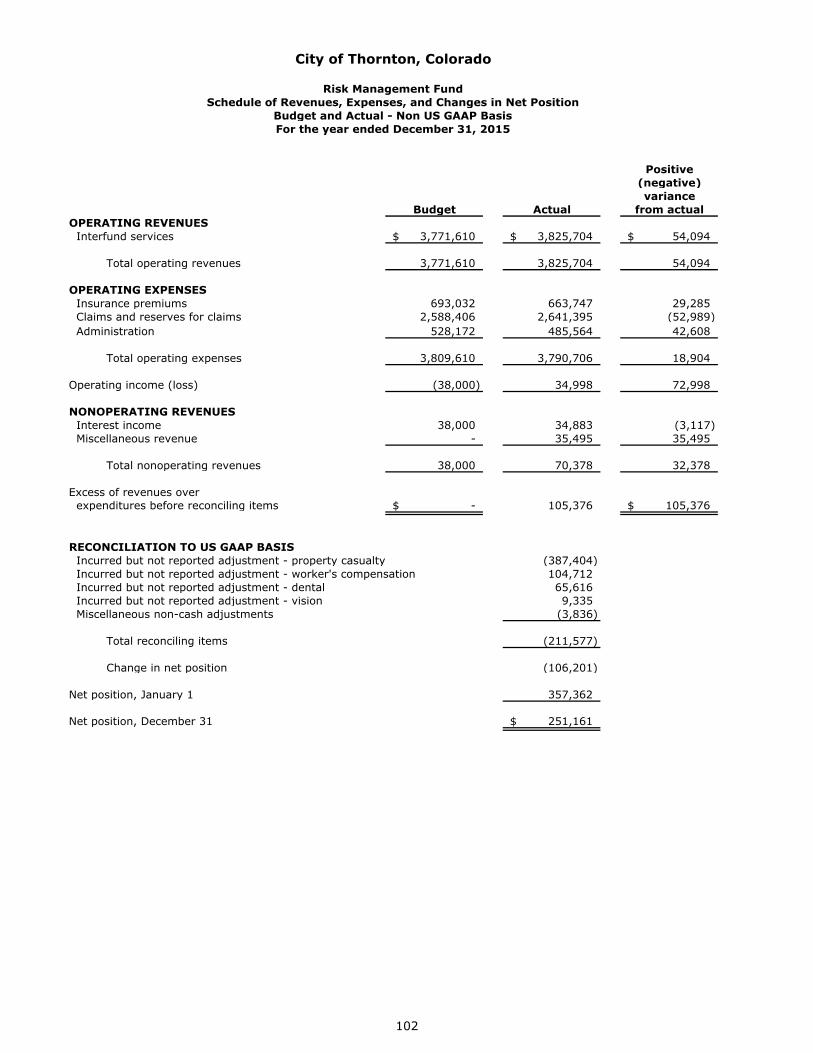
City of Thornton, Colorado
Risk Management FundSchedule of Revenues, Expenses, and Changes in Net Position
Budget and Actual - Non US GAAP BasisFor the year ended December 31, 2015
Positive(negative)variance
Budget Actual from actualOPERATING REVENUES Interfund services 3,771,610$ 3,825,704$ 54,094$ Total operating revenues 3,771,610 3,825,704 54,094
OPERATING EXPENSES Insurance premiums 693,032 663,747 29,285 Claims and reserves for claims 2,588,406 2,641,395 (52,989) Administration 528,172 485,564 42,608
Total operating expenses 3,809,610 3,790,706 18,904
Operating income (loss) (38,000) 34,998 72,998
NONOPERATING REVENUES Interest income 38,000 34,883 (3,117) Miscellaneous revenue - 35,495 35,495
Total nonoperating revenues 38,000 70,378 32,378
Excess of revenues over expenditures before reconciling items -$ 105,376 105,376$
RECONCILIATION TO US GAAP BASIS Incurred but not reported adjustment - property casualty (387,404) Incurred but not reported adjustment - worker's compensation 104,712 Incurred but not reported adjustment - dental 65,616 Incurred but not reported adjustment - vision 9,335 Miscellaneous non-cash adjustments (3,836)
Total reconciling items (211,577)
Change in net position (106,201)
Net position, January 1 357,362
Net position, December 31 251,161$
102
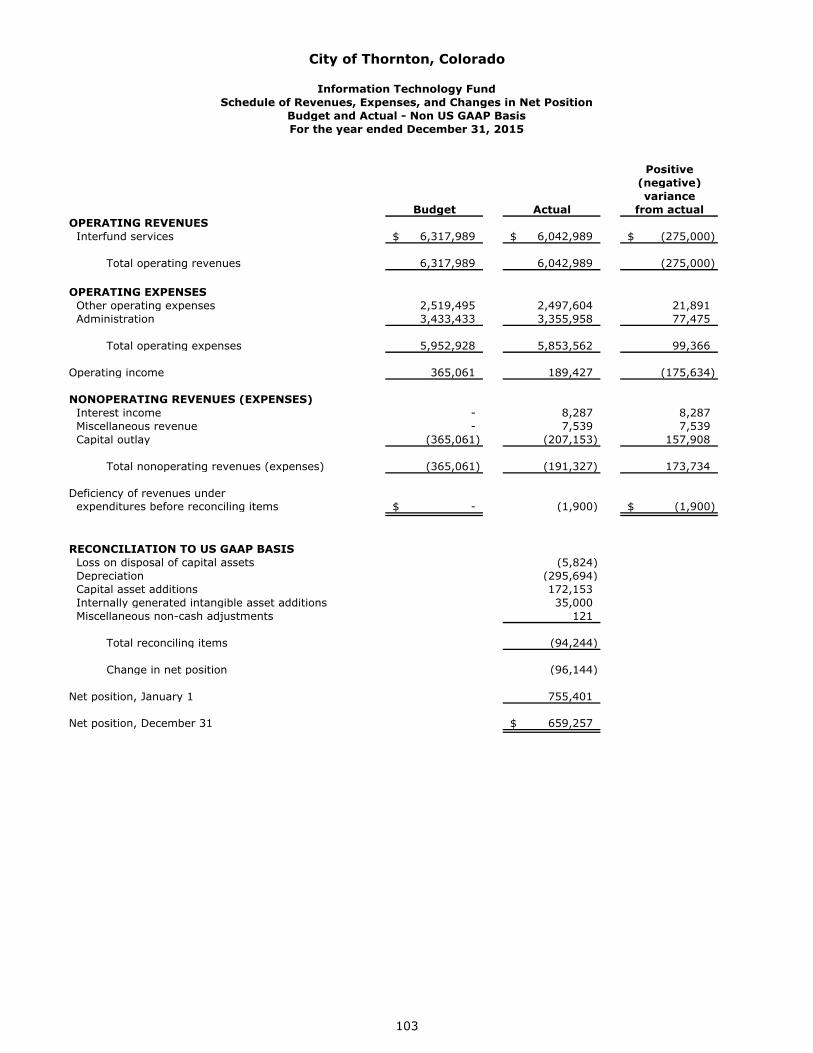
City of Thornton, Colorado
Information Technology FundSchedule of Revenues, Expenses, and Changes in Net Position
Budget and Actual - Non US GAAP BasisFor the year ended December 31, 2015
Positive(negative)variance
Budget Actual from actualOPERATING REVENUES Interfund services 6,317,989$ 6,042,989$ (275,000)$
Total operating revenues 6,317,989 6,042,989 (275,000)
OPERATING EXPENSES Other operating expenses 2,519,495 2,497,604 21,891 Administration 3,433,433 3,355,958 77,475
Total operating expenses 5,952,928 5,853,562 99,366
Operating income 365,061 189,427 (175,634)
NONOPERATING REVENUES (EXPENSES) Interest income - 8,287 8,287 Miscellaneous revenue - 7,539 7,539 Capital outlay (365,061) (207,153) 157,908
Total nonoperating revenues (expenses) (365,061) (191,327) 173,734
Deficiency of revenues under expenditures before reconciling items -$ (1,900) (1,900)$
RECONCILIATION TO US GAAP BASIS Loss on disposal of capital assets (5,824) Depreciation (295,694) Capital asset additions 172,153 Internally generated intangible asset additions 35,000 Miscellaneous non-cash adjustments 121
Total reconciling items (94,244)
Change in net position (96,144)
Net position, January 1 755,401
Net position, December 31 659,257$
103
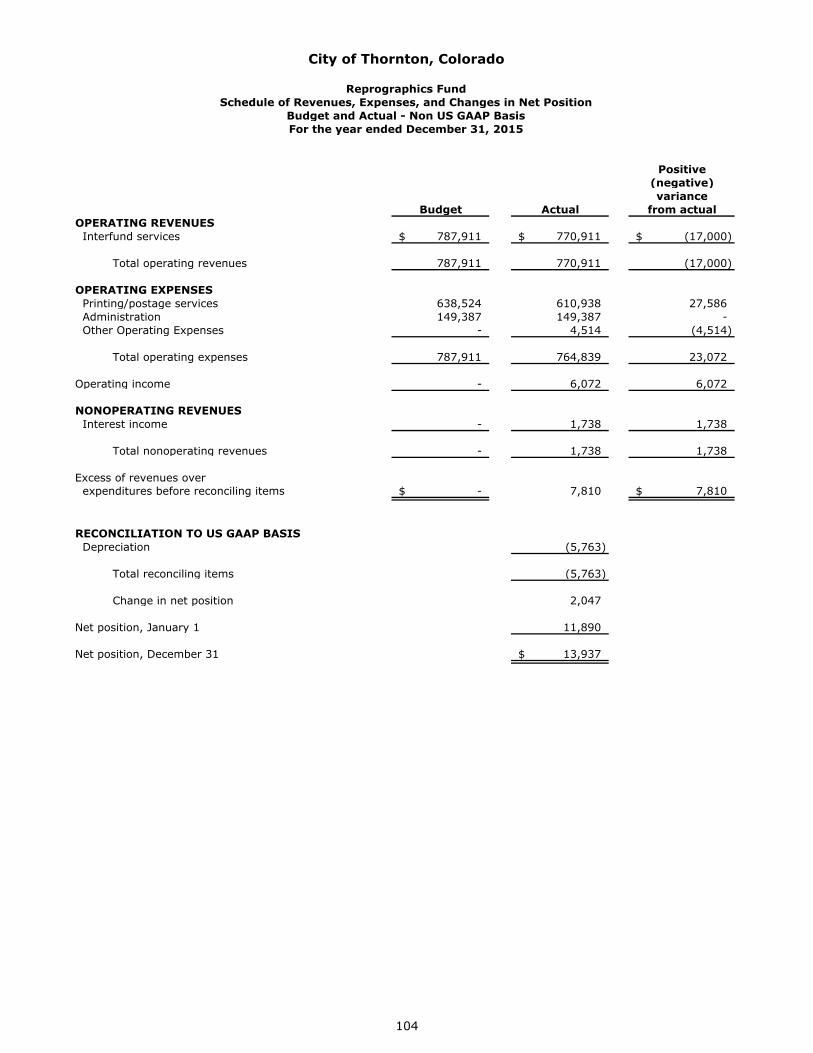
City of Thornton, Colorado
Reprographics FundSchedule of Revenues, Expenses, and Changes in Net Position
Budget and Actual - Non US GAAP BasisFor the year ended December 31, 2015
Positive(negative)variance
Budget Actual from actualOPERATING REVENUES Interfund services 787,911$ 770,911$ (17,000)$
Total operating revenues 787,911 770,911 (17,000)
OPERATING EXPENSES Printing/postage services 638,524 610,938 27,586 Administration 149,387 149,387 - Other Operating Expenses - 4,514 (4,514)
Total operating expenses 787,911 764,839 23,072
Operating income - 6,072 6,072
NONOPERATING REVENUES Interest income - 1,738 1,738
Total nonoperating revenues - 1,738 1,738
Excess of revenues over expenditures before reconciling items -$ 7,810 7,810$
RECONCILIATION TO US GAAP BASIS Depreciation (5,763)
Total reconciling items (5,763)
Change in net position 2,047
Net position, January 1 11,890
Net position, December 31 13,937$
104
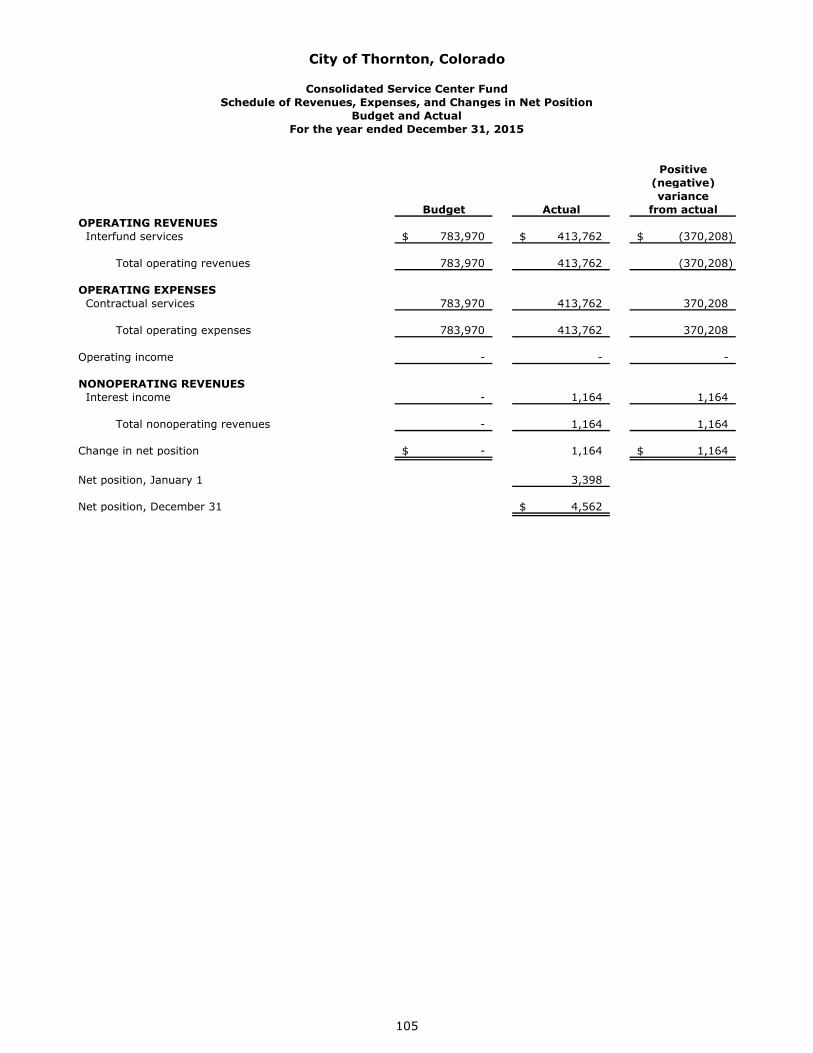
City of Thornton, Colorado
Consolidated Service Center FundSchedule of Revenues, Expenses, and Changes in Net Position
Budget and ActualFor the year ended December 31, 2015
Positive(negative)variance
Budget Actual from actualOPERATING REVENUES Interfund services 783,970$ 413,762$ (370,208)$
Total operating revenues 783,970 413,762 (370,208) OPERATING EXPENSES Contractual services 783,970 413,762 370,208
Total operating expenses 783,970 413,762 370,208
Operating income - - -
NONOPERATING REVENUES Interest income - 1,164 1,164
Total nonoperating revenues - 1,164 1,164
Change in net position -$ 1,164 1,164$
Net position, January 1 3,398
Net position, December 31 4,562$
105
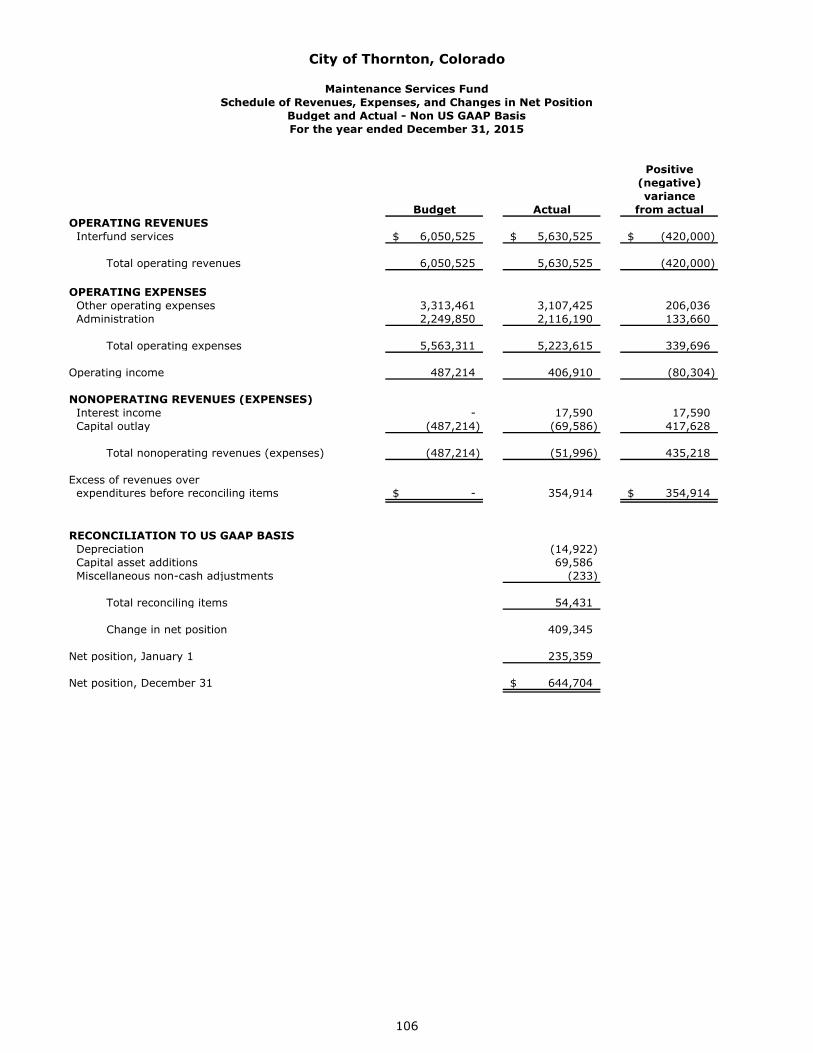
City of Thornton, Colorado
Maintenance Services FundSchedule of Revenues, Expenses, and Changes in Net Position
Budget and Actual - Non US GAAP BasisFor the year ended December 31, 2015
Positive(negative)variance
Budget Actual from actualOPERATING REVENUES Interfund services 6,050,525$ 5,630,525$ (420,000)$
Total operating revenues 6,050,525 5,630,525 (420,000)
OPERATING EXPENSES Other operating expenses 3,313,461 3,107,425 206,036 Administration 2,249,850 2,116,190 133,660
Total operating expenses 5,563,311 5,223,615 339,696
Operating income 487,214 406,910 (80,304)
NONOPERATING REVENUES (EXPENSES) Interest income - 17,590 17,590 Capital outlay (487,214) (69,586) 417,628
Total nonoperating revenues (expenses) (487,214) (51,996) 435,218
Excess of revenues over expenditures before reconciling items -$ 354,914 354,914$
RECONCILIATION TO US GAAP BASIS Depreciation (14,922) Capital asset additions 69,586 Miscellaneous non-cash adjustments (233)
Total reconciling items 54,431
Change in net position 409,345
Net position, January 1 235,359
Net position, December 31 644,704$
106

OTHER SCHEDULES
107

This Page Left Intentionally Blank
108
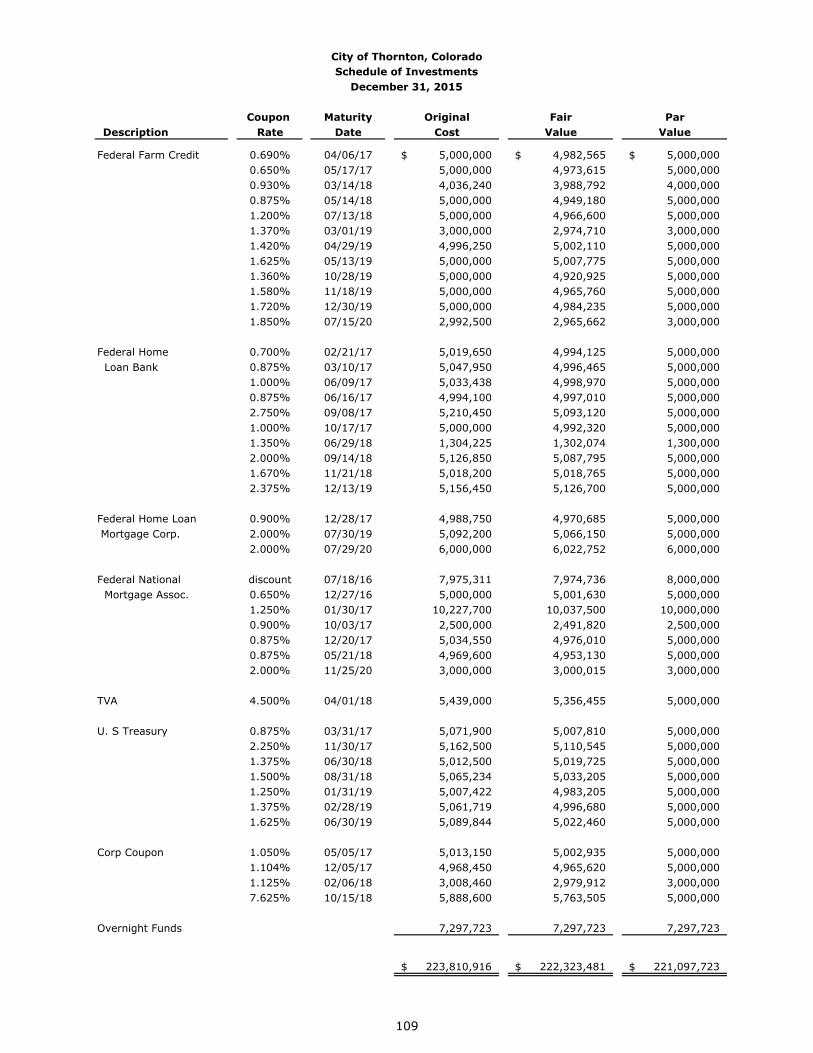
City of Thornton, ColoradoSchedule of Investments
December 31, 2015
Coupon Maturity Original Fair ParDescription Rate Date Cost Value Value
Federal Farm Credit 0.690% 04/06/17 5,000,000$ 4,982,565$ 5,000,000$ 0.650% 05/17/17 5,000,000 4,973,615 5,000,000 0.930% 03/14/18 4,036,240 3,988,792 4,000,000 0.875% 05/14/18 5,000,000 4,949,180 5,000,000 1.200% 07/13/18 5,000,000 4,966,600 5,000,000 1.370% 03/01/19 3,000,000 2,974,710 3,000,000 1.420% 04/29/19 4,996,250 5,002,110 5,000,000 1.625% 05/13/19 5,000,000 5,007,775 5,000,000 1.360% 10/28/19 5,000,000 4,920,925 5,000,000 1.580% 11/18/19 5,000,000 4,965,760 5,000,000 1.720% 12/30/19 5,000,000 4,984,235 5,000,000 1.850% 07/15/20 2,992,500 2,965,662 3,000,000
Federal Home 0.700% 02/21/17 5,019,650 4,994,125 5,000,000 Loan Bank 0.875% 03/10/17 5,047,950 4,996,465 5,000,000
1.000% 06/09/17 5,033,438 4,998,970 5,000,000 0.875% 06/16/17 4,994,100 4,997,010 5,000,000 2.750% 09/08/17 5,210,450 5,093,120 5,000,000 1.000% 10/17/17 5,000,000 4,992,320 5,000,000 1.350% 06/29/18 1,304,225 1,302,074 1,300,000 2.000% 09/14/18 5,126,850 5,087,795 5,000,000 1.670% 11/21/18 5,018,200 5,018,765 5,000,000 2.375% 12/13/19 5,156,450 5,126,700 5,000,000
Federal Home Loan 0.900% 12/28/17 4,988,750 4,970,685 5,000,000 Mortgage Corp. 2.000% 07/30/19 5,092,200 5,066,150 5,000,000
2.000% 07/29/20 6,000,000 6,022,752 6,000,000
Federal National discount 07/18/16 7,975,311 7,974,736 8,000,000 Mortgage Assoc. 0.650% 12/27/16 5,000,000 5,001,630 5,000,000
1.250% 01/30/17 10,227,700 10,037,500 10,000,000 0.900% 10/03/17 2,500,000 2,491,820 2,500,000 0.875% 12/20/17 5,034,550 4,976,010 5,000,000 0.875% 05/21/18 4,969,600 4,953,130 5,000,000 2.000% 11/25/20 3,000,000 3,000,015 3,000,000
TVA 4.500% 04/01/18 5,439,000 5,356,455 5,000,000
U. S Treasury 0.875% 03/31/17 5,071,900 5,007,810 5,000,000 2.250% 11/30/17 5,162,500 5,110,545 5,000,000 1.375% 06/30/18 5,012,500 5,019,725 5,000,000 1.500% 08/31/18 5,065,234 5,033,205 5,000,000 1.250% 01/31/19 5,007,422 4,983,205 5,000,000 1.375% 02/28/19 5,061,719 4,996,680 5,000,000 1.625% 06/30/19 5,089,844 5,022,460 5,000,000
Corp Coupon 1.050% 05/05/17 5,013,150 5,002,935 5,000,000 1.104% 12/05/17 4,968,450 4,965,620 5,000,000 1.125% 02/06/18 3,008,460 2,979,912 3,000,000 7.625% 10/15/18 5,888,600 5,763,505 5,000,000
Overnight Funds 7,297,723 7,297,723 7,297,723
223,810,916$ 222,323,481$ 221,097,723$
109
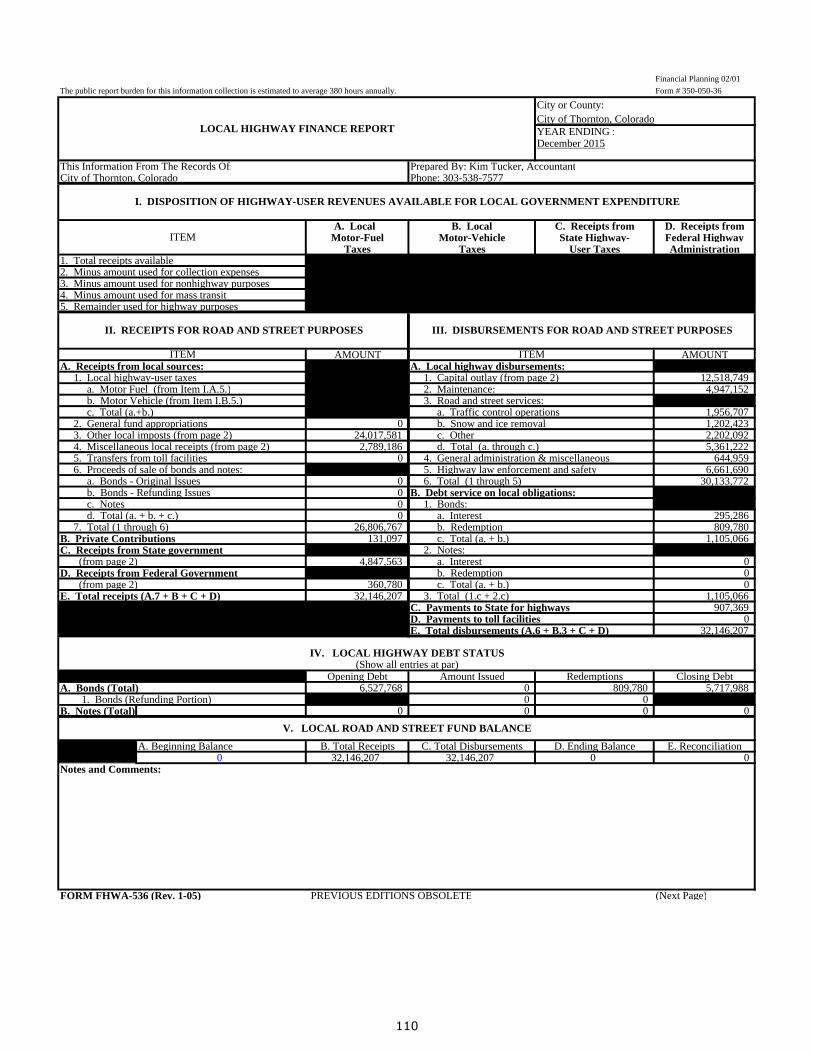
Financial Planning 02/01
The public report burden for this information collection is estimated to average 380 hours annually. Form # 350-050-36
City or County:City of Thornton, ColoradoYEAR ENDING :December 2015
This Information From The Records Of: Prepared By: Kim Tucker, AccountantCity of Thornton, Colorado Phone: 303-538-7577
A. Local B. Local C. Receipts from D. Receipts fromMotor-Fuel Motor-Vehicle State Highway- Federal Highway
Taxes Taxes User Taxes Administration1. Total receipts available2. Minus amount used for collection expenses3. Minus amount used for nonhighway purposes4. Minus amount used for mass transit5. Remainder used for highway purposes
AMOUNT AMOUNTA. Receipts from local sources: A. Local highway disbursements:
1. Local highway-user taxes 1. Capital outlay (from page 2) 12,518,749a. Motor Fuel (from Item I.A.5.) 2. Maintenance: 4,947,152b. Motor Vehicle (from Item I.B.5.) 3. Road and street services:c. Total (a.+b.) a. Traffic control operations 1,956,707
2. General fund appropriations 0 b. Snow and ice removal 1,202,4233. Other local imposts (from page 2) 24,017,581 c. Other 2,202,0924. Miscellaneous local receipts (from page 2) 2,789,186 d. Total (a. through c.) 5,361,2225. Transfers from toll facilities 0 4. General administration & miscellaneous 644,9596. Proceeds of sale of bonds and notes: 5. Highway law enforcement and safety 6,661,690
a. Bonds - Original Issues 0 6. Total (1 through 5) 30,133,772b. Bonds - Refunding Issues 0 B. Debt service on local obligations:c. Notes 0 1. Bonds:d. Total (a. + b. + c.) 0 a. Interest 295,286
7. Total (1 through 6) 26,806,767 b. Redemption 809,780B. Private Contributions 131,097 c. Total (a. + b.) 1,105,066C. Receipts from State government 2. Notes: (from page 2) 4,847,563 a. Interest 0D. Receipts from Federal Government b. Redemption 0 (from page 2) 360,780 c. Total (a. + b.) 0E. Total receipts (A.7 + B + C + D) 32,146,207 3. Total (1.c + 2.c) 1,105,066
C. Payments to State for highways 907,369D. Payments to toll facilities 0E. Total disbursements (A.6 + B.3 + C + D) 32,146,207
Opening Debt Amount Issued Redemptions Closing DebtA. Bonds (Total) 6,527,768 0 809,780 5,717,988
1. Bonds (Refunding Portion) 0 0B. Notes (Total) 0 0 0 0
A. Beginning Balance B. Total Receipts C. Total Disbursements D. Ending Balance E. Reconciliation0 32,146,207 32,146,207 0 0
Notes and Comments:
FORM FHWA-536 (Rev. 1-05) PREVIOUS EDITIONS OBSOLETE (Next Page)
LOCAL HIGHWAY FINANCE REPORT
I. DISPOSITION OF HIGHWAY-USER REVENUES AVAILABLE FOR LOCAL GOVERNMENT EXPENDITURE
ITEM
II. RECEIPTS FOR ROAD AND STREET PURPOSES III. DISBURSEMENTS FOR ROAD AND STREET PURPOSES
IV. LOCAL HIGHWAY DEBT STATUS
ITEM ITEM
V. LOCAL ROAD AND STREET FUND BALANCE
(Show all entries at par)
110
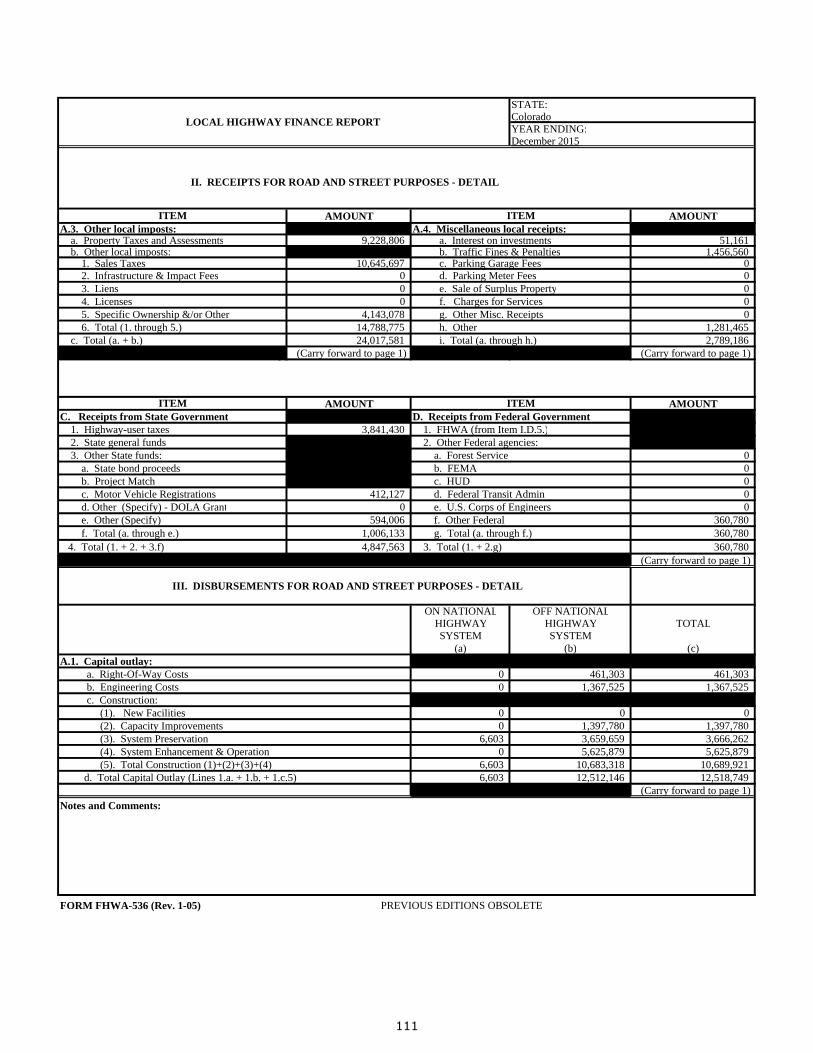
STATE:ColoradoYEAR ENDING:December 2015
AMOUNT AMOUNTA.3. Other local imposts: A.4. Miscellaneous local receipts:
a. Property Taxes and Assessments 9,228,806 a. Interest on investments 51,161b. Other local imposts: b. Traffic Fines & Penalties 1,456,560
1. Sales Taxes 10,645,697 c. Parking Garage Fees 02. Infrastructure & Impact Fees 0 d. Parking Meter Fees 03. Liens 0 e. Sale of Surplus Property 04. Licenses 0 f. Charges for Services 05. Specific Ownership &/or Other 4,143,078 g. Other Misc. Receipts 06. Total (1. through 5.) 14,788,775 h. Other 1,281,465
c. Total (a. + b.) 24,017,581 i. Total (a. through h.) 2,789,186(Carry forward to page 1) (Carry forward to page 1)
AMOUNT AMOUNTC. Receipts from State Government D. Receipts from Federal Government
1. Highway-user taxes 3,841,430 1. FHWA (from Item I.D.5.) 02. State general funds 2. Other Federal agencies:3. Other State funds: a. Forest Service 0
a. State bond proceeds b. FEMA 0b. Project Match c. HUD 0c. Motor Vehicle Registrations 412,127 d. Federal Transit Admin 0d. Other (Specify) - DOLA Grant 0 e. U.S. Corps of Engineers 0e. Other (Specify) 594,006 f. Other Federal 360,780f. Total (a. through e.) 1,006,133 g. Total (a. through f.) 360,780
4. Total (1. + 2. + 3.f) 4,847,563 3. Total (1. + 2.g) 360,780(Carry forward to page 1)
III. DISBURSEMENTS FOR ROAD AND STREET PURPOSES - DETAIL
ON NATIONAL OFF NATIONALHIGHWAY HIGHWAY TOTALSYSTEM SYSTEM
(a) (b) (c)A.1. Capital outlay:
a. Right-Of-Way Costs 0 461,303 461,303b. Engineering Costs 0 1,367,525 1,367,525c. Construction:
(1). New Facilities 0 0 0 (2). Capacity Improvements 0 1,397,780 1,397,780 (3). System Preservation 6,603 3,659,659 3,666,262 (4). System Enhancement & Operation 0 5,625,879 5,625,879 (5). Total Construction (1)+(2)+(3)+(4) 6,603 10,683,318 10,689,921
d. Total Capital Outlay (Lines 1.a. + 1.b. + 1.c.5) 6,603 12,512,146 12,518,749(Carry forward to page 1)
Notes and Comments:
FORM FHWA-536 (Rev. 1-05) PREVIOUS EDITIONS OBSOLETE
LOCAL HIGHWAY FINANCE REPORT
II. RECEIPTS FOR ROAD AND STREET PURPOSES - DETAIL
ITEM ITEM
ITEM ITEM
111

This Page Left Intentionally Blank
112
STATISTICAL SECTION
This part of the City of Thornton’s comprehensive annual financial report presents detailed information as a context for understanding what the information in the financial statements, note disclosures, and required supplementary information says about the government’s overall financial health.
Contents Page
Financial Trends 115
These schedules contain trend information to help the reader understand how the government’s financial performance and well-being have changed over time.
Revenue Capacity 120
These schedules contain information to help the reader assess the government’s most significant local revenue source, the sales tax.
Debt Capacity 126
These schedules present information to help the reader assess the affordability of the government’s current levels of outstanding debt and the government’s ability to issue additional debt in the future.
Demographic and Economic Information 132
These schedules offer demographic and economic indicators to help the reader understand the environment within which the government’s financial activities take place.
Schedule of Principal Employers 133
The number of employees per business is confidential therefore the City is providing employee totals by sector.
Operating Information 134
These schedules contain service and infrastructure data to help the reader understand how the information in the government’s financial report relates to the services the government provides and the activities it performs.
113

This Page Left Intentionally Blank
114
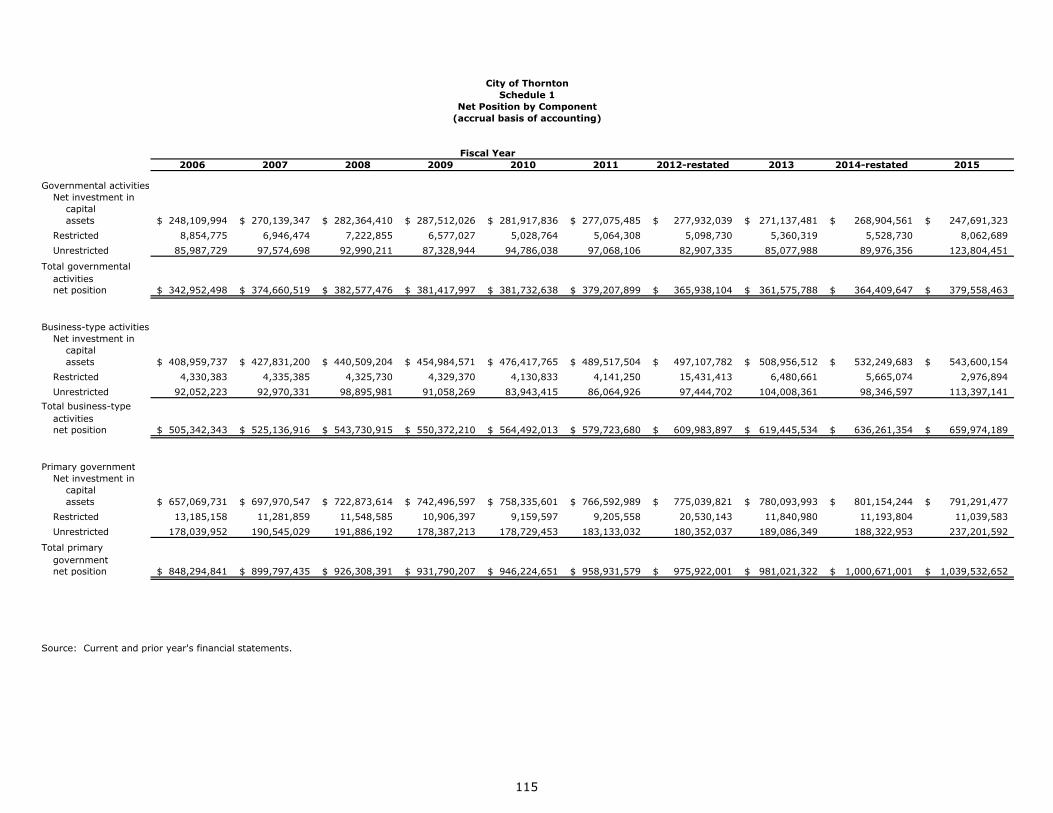
2006 2007 2008 2009 2010 2011 2012-restated 2013 2014-restated 2015
Governmental activitiesNet investment in capital assets 248,109,994$ 270,139,347$ 282,364,410$ 287,512,026$ 281,917,836$ 277,075,485$ 277,932,039$ 271,137,481$ 268,904,561$ 247,691,323$ Restricted 8,854,775 6,946,474 7,222,855 6,577,027 5,028,764 5,064,308 5,098,730 5,360,319 5,528,730 8,062,689 Unrestricted 85,987,729 97,574,698 92,990,211 87,328,944 94,786,038 97,068,106 82,907,335 85,077,988 89,976,356 123,804,451
Total governmentalactivitiesnet position 342,952,498$ 374,660,519$ 382,577,476$ 381,417,997$ 381,732,638$ 379,207,899$ 365,938,104$ 361,575,788$ 364,409,647$ 379,558,463$
Business-type activitiesNet investment in capital assets 408,959,737$ 427,831,200$ 440,509,204$ 454,984,571$ 476,417,765$ 489,517,504$ 497,107,782$ 508,956,512$ 532,249,683$ 543,600,154$ Restricted 4,330,383 4,335,385 4,325,730 4,329,370 4,130,833 4,141,250 15,431,413 6,480,661 5,665,074 2,976,894 Unrestricted 92,052,223 92,970,331 98,895,981 91,058,269 83,943,415 86,064,926 97,444,702 104,008,361 98,346,597 113,397,141
Total business-typeactivitiesnet position 505,342,343$ 525,136,916$ 543,730,915$ 550,372,210$ 564,492,013$ 579,723,680$ 609,983,897$ 619,445,534$ 636,261,354$ 659,974,189$
Primary governmentNet investment in capital assets 657,069,731$ 697,970,547$ 722,873,614$ 742,496,597$ 758,335,601$ 766,592,989$ 775,039,821$ 780,093,993$ 801,154,244$ 791,291,477$ Restricted 13,185,158 11,281,859 11,548,585 10,906,397 9,159,597 9,205,558 20,530,143 11,840,980 11,193,804 11,039,583 Unrestricted 178,039,952 190,545,029 191,886,192 178,387,213 178,729,453 183,133,032 180,352,037 189,086,349 188,322,953 237,201,592
Total primarygovernmentnet position 848,294,841$ 899,797,435$ 926,308,391$ 931,790,207$ 946,224,651$ 958,931,579$ 975,922,001$ 981,021,322$ 1,000,671,001$ 1,039,532,652$
Source: Current and prior year's financial statements.
Fiscal Year
City of ThorntonSchedule 1
Net Position by Component(accrual basis of accounting)
115
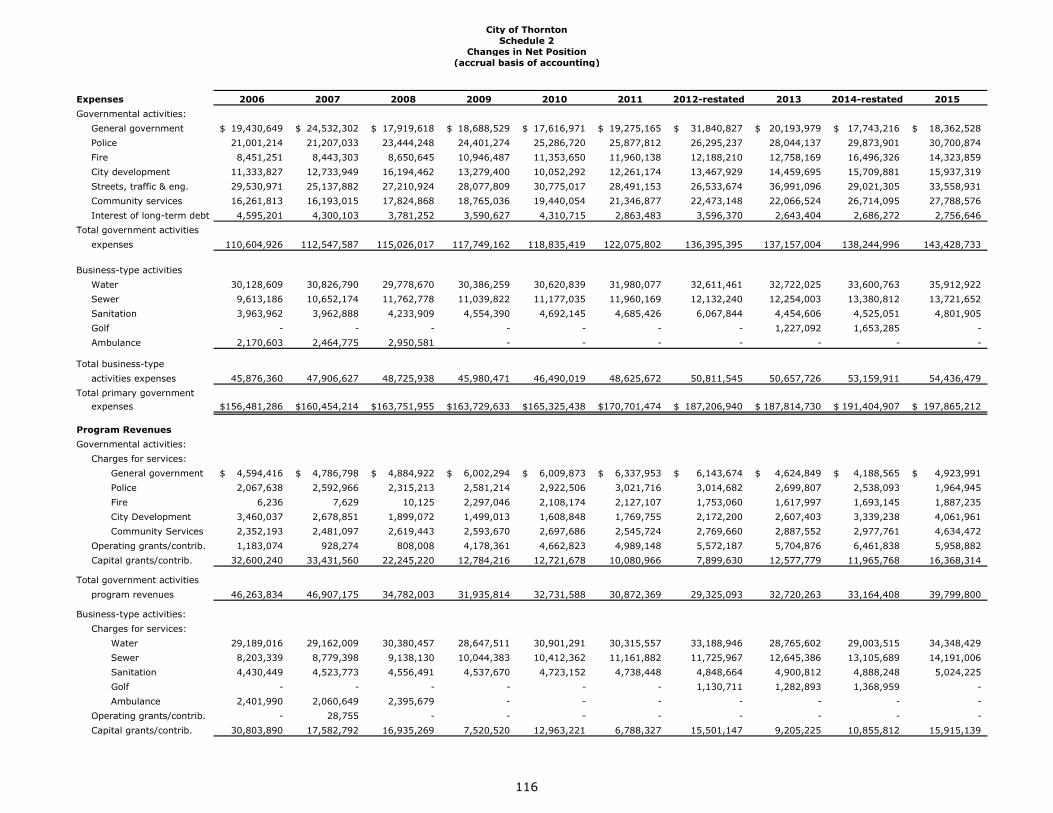
Expenses 2006 2007 2008 2009 2010 2011 2012-restated 2013 2014-restated 2015Governmental activities:
General government 19,430,649$ 24,532,302$ 17,919,618$ 18,688,529$ 17,616,971$ 19,275,165$ 31,840,827$ 20,193,979$ 17,743,216$ 18,362,528$ Police 21,001,214 21,207,033 23,444,248 24,401,274 25,286,720 25,877,812 26,295,237 28,044,137 29,873,901 30,700,874 Fire 8,451,251 8,443,303 8,650,645 10,946,487 11,353,650 11,960,138 12,188,210 12,758,169 16,496,326 14,323,859 City development 11,333,827 12,733,949 16,194,462 13,279,400 10,052,292 12,261,174 13,467,929 14,459,695 15,709,881 15,937,319 Streets, traffic & eng. 29,530,971 25,137,882 27,210,924 28,077,809 30,775,017 28,491,153 26,533,674 36,991,096 29,021,305 33,558,931 Community services 16,261,813 16,193,015 17,824,868 18,765,036 19,440,054 21,346,877 22,473,148 22,066,524 26,714,095 27,788,576 Interest of long-term debt 4,595,201 4,300,103 3,781,252 3,590,627 4,310,715 2,863,483 3,596,370 2,643,404 2,686,272 2,756,646
Total government activitiesexpenses 110,604,926 112,547,587 115,026,017 117,749,162 118,835,419 122,075,802 136,395,395 137,157,004 138,244,996 143,428,733
Business-type activitiesWater 30,128,609 30,826,790 29,778,670 30,386,259 30,620,839 31,980,077 32,611,461 32,722,025 33,600,763 35,912,922 Sewer 9,613,186 10,652,174 11,762,778 11,039,822 11,177,035 11,960,169 12,132,240 12,254,003 13,380,812 13,721,652 Sanitation 3,963,962 3,962,888 4,233,909 4,554,390 4,692,145 4,685,426 6,067,844 4,454,606 4,525,051 4,801,905 Golf - - - - - - - 1,227,092 1,653,285 - Ambulance 2,170,603 2,464,775 2,950,581 - - - - - - -
Total business-typeactivities expenses 45,876,360 47,906,627 48,725,938 45,980,471 46,490,019 48,625,672 50,811,545 50,657,726 53,159,911 54,436,479
Total primary governmentexpenses 156,481,286$ 160,454,214$ 163,751,955$ 163,729,633$ 165,325,438$ 170,701,474$ 187,206,940$ 187,814,730$ 191,404,907$ 197,865,212$
Program RevenuesGovernmental activities:
Charges for services:General government 4,594,416$ 4,786,798$ 4,884,922$ 6,002,294$ 6,009,873$ 6,337,953$ 6,143,674$ 4,624,849$ 4,188,565$ 4,923,991$ Police 2,067,638 2,592,966 2,315,213 2,581,214 2,922,506 3,021,716 3,014,682 2,699,807 2,538,093 1,964,945 Fire 6,236 7,629 10,125 2,297,046 2,108,174 2,127,107 1,753,060 1,617,997 1,693,145 1,887,235 City Development 3,460,037 2,678,851 1,899,072 1,499,013 1,608,848 1,769,755 2,172,200 2,607,403 3,339,238 4,061,961 Community Services 2,352,193 2,481,097 2,619,443 2,593,670 2,697,686 2,545,724 2,769,660 2,887,552 2,977,761 4,634,472
Operating grants/contrib. 1,183,074 928,274 808,008 4,178,361 4,662,823 4,989,148 5,572,187 5,704,876 6,461,838 5,958,882 Capital grants/contrib. 32,600,240 33,431,560 22,245,220 12,784,216 12,721,678 10,080,966 7,899,630 12,577,779 11,965,768 16,368,314
Total government activitiesprogram revenues 46,263,834 46,907,175 34,782,003 31,935,814 32,731,588 30,872,369 29,325,093 32,720,263 33,164,408 39,799,800
Business-type activities:Charges for services:
Water 29,189,016 29,162,009 30,380,457 28,647,511 30,901,291 30,315,557 33,188,946 28,765,602 29,003,515 34,348,429 Sewer 8,203,339 8,779,398 9,138,130 10,044,383 10,412,362 11,161,882 11,725,967 12,645,386 13,105,689 14,191,006 Sanitation 4,430,449 4,523,773 4,556,491 4,537,670 4,723,152 4,738,448 4,848,664 4,900,812 4,888,248 5,024,225 Golf - - - - - - 1,130,711 1,282,893 1,368,959 - Ambulance 2,401,990 2,060,649 2,395,679 - - - - - - -
Operating grants/contrib. - 28,755 - - - - - - - - Capital grants/contrib. 30,803,890 17,582,792 16,935,269 7,520,520 12,963,221 6,788,327 15,501,147 9,205,225 10,855,812 15,915,139
City of ThorntonSchedule 2
Changes in Net Position(accrual basis of accounting)
116
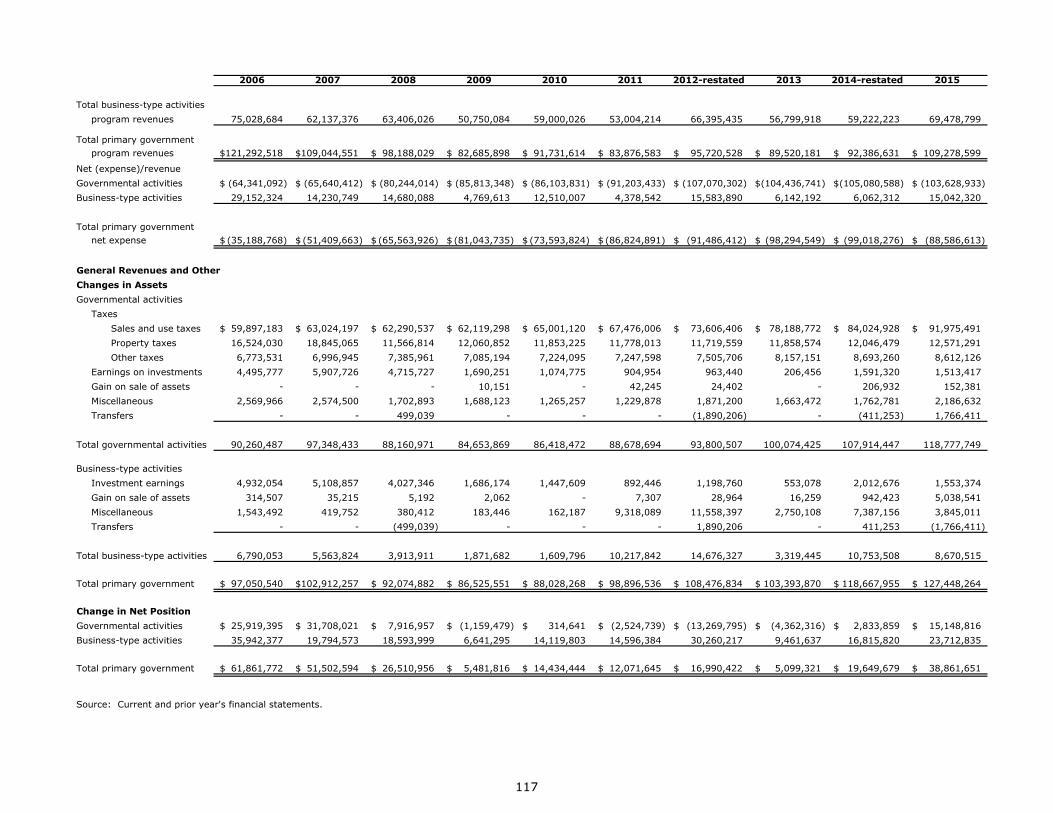
2006 2007 2008 2009 2010 2011 2012-restated 2013 2014-restated 2015
Total business-type activitiesprogram revenues 75,028,684 62,137,376 63,406,026 50,750,084 59,000,026 53,004,214 66,395,435 56,799,918 59,222,223 69,478,799
Total primary governmentprogram revenues 121,292,518$ 109,044,551$ 98,188,029$ 82,685,898$ 91,731,614$ 83,876,583$ 95,720,528$ 89,520,181$ 92,386,631$ 109,278,599$
Net (expense)/revenueGovernmental activities (64,341,092)$ (65,640,412)$ (80,244,014)$ (85,813,348)$ (86,103,831)$ (91,203,433)$ (107,070,302)$ (104,436,741)$ (105,080,588)$ (103,628,933)$ Business-type activities 29,152,324 14,230,749 14,680,088 4,769,613 12,510,007 4,378,542 15,583,890 6,142,192 6,062,312 15,042,320
Total primary governmentnet expense (35,188,768)$ (51,409,663)$ (65,563,926)$ (81,043,735)$ (73,593,824)$ (86,824,891)$ (91,486,412)$ (98,294,549)$ (99,018,276)$ (88,586,613)$
General Revenues and OtherChanges in AssetsGovernmental activities
TaxesSales and use taxes 59,897,183$ 63,024,197$ 62,290,537$ 62,119,298$ 65,001,120$ 67,476,006$ 73,606,406$ 78,188,772$ 84,024,928$ 91,975,491$ Property taxes 16,524,030 18,845,065 11,566,814 12,060,852 11,853,225 11,778,013 11,719,559 11,858,574 12,046,479 12,571,291 Other taxes 6,773,531 6,996,945 7,385,961 7,085,194 7,224,095 7,247,598 7,505,706 8,157,151 8,693,260 8,612,126
Earnings on investments 4,495,777 5,907,726 4,715,727 1,690,251 1,074,775 904,954 963,440 206,456 1,591,320 1,513,417 Gain on sale of assets - - - 10,151 - 42,245 24,402 - 206,932 152,381 Miscellaneous 2,569,966 2,574,500 1,702,893 1,688,123 1,265,257 1,229,878 1,871,200 1,663,472 1,762,781 2,186,632 Transfers - - 499,039 - - - (1,890,206) - (411,253) 1,766,411
Total governmental activities 90,260,487 97,348,433 88,160,971 84,653,869 86,418,472 88,678,694 93,800,507 100,074,425 107,914,447 118,777,749
Business-type activitiesInvestment earnings 4,932,054 5,108,857 4,027,346 1,686,174 1,447,609 892,446 1,198,760 553,078 2,012,676 1,553,374 Gain on sale of assets 314,507 35,215 5,192 2,062 - 7,307 28,964 16,259 942,423 5,038,541 Miscellaneous 1,543,492 419,752 380,412 183,446 162,187 9,318,089 11,558,397 2,750,108 7,387,156 3,845,011 Transfers - - (499,039) - - - 1,890,206 - 411,253 (1,766,411)
Total business-type activities 6,790,053 5,563,824 3,913,911 1,871,682 1,609,796 10,217,842 14,676,327 3,319,445 10,753,508 8,670,515
Total primary government 97,050,540$ 102,912,257$ 92,074,882$ 86,525,551$ 88,028,268$ 98,896,536$ 108,476,834$ 103,393,870$ 118,667,955$ 127,448,264$
Change in Net PositionGovernmental activities 25,919,395$ 31,708,021$ 7,916,957$ (1,159,479)$ 314,641$ (2,524,739)$ (13,269,795)$ (4,362,316)$ 2,833,859$ 15,148,816$ Business-type activities 35,942,377 19,794,573 18,593,999 6,641,295 14,119,803 14,596,384 30,260,217 9,461,637 16,815,820 23,712,835
Total primary government 61,861,772$ 51,502,594$ 26,510,956$ 5,481,816$ 14,434,444$ 12,071,645$ 16,990,422$ 5,099,321$ 19,649,679$ 38,861,651$
Source: Current and prior year's financial statements.
117
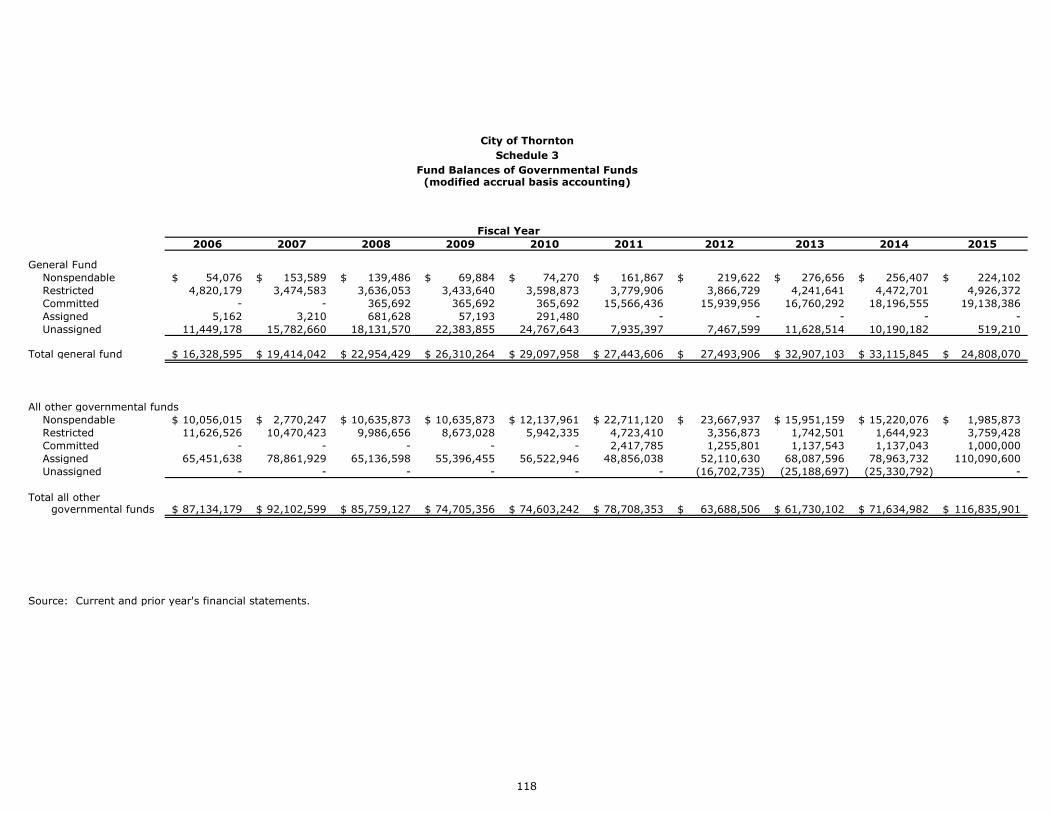
2006 2007 2008 2009 2010 2011 2012 2013 2014 2015
General FundNonspendable 54,076$ 153,589$ 139,486$ 69,884$ 74,270$ 161,867$ 219,622$ 276,656$ 256,407$ 224,102$ Restricted 4,820,179 3,474,583 3,636,053 3,433,640 3,598,873 3,779,906 3,866,729 4,241,641 4,472,701 4,926,372 Committed - - 365,692 365,692 365,692 15,566,436 15,939,956 16,760,292 18,196,555 19,138,386 Assigned 5,162 3,210 681,628 57,193 291,480 - - - - - Unassigned 11,449,178 15,782,660 18,131,570 22,383,855 24,767,643 7,935,397 7,467,599 11,628,514 10,190,182 519,210
Total general fund 16,328,595$ 19,414,042$ 22,954,429$ 26,310,264$ 29,097,958$ 27,443,606$ 27,493,906$ 32,907,103$ 33,115,845$ 24,808,070$
All other governmental fundsNonspendable 10,056,015$ 2,770,247$ 10,635,873$ 10,635,873$ 12,137,961$ 22,711,120$ 23,667,937$ 15,951,159$ 15,220,076$ 1,985,873$ Restricted 11,626,526 10,470,423 9,986,656 8,673,028 5,942,335 4,723,410 3,356,873 1,742,501 1,644,923 3,759,428 Committed - - - - - 2,417,785 1,255,801 1,137,543 1,137,043 1,000,000 Assigned 65,451,638 78,861,929 65,136,598 55,396,455 56,522,946 48,856,038 52,110,630 68,087,596 78,963,732 110,090,600 Unassigned - - - - - - (16,702,735) (25,188,697) (25,330,792) -
Total all other governmental funds 87,134,179$ 92,102,599$ 85,759,127$ 74,705,356$ 74,603,242$ 78,708,353$ 63,688,506$ 61,730,102$ 71,634,982$ 116,835,901$
Source: Current and prior year's financial statements.
Fiscal Year
City of ThorntonSchedule 3
Fund Balances of Governmental Funds(modified accrual basis accounting)
118
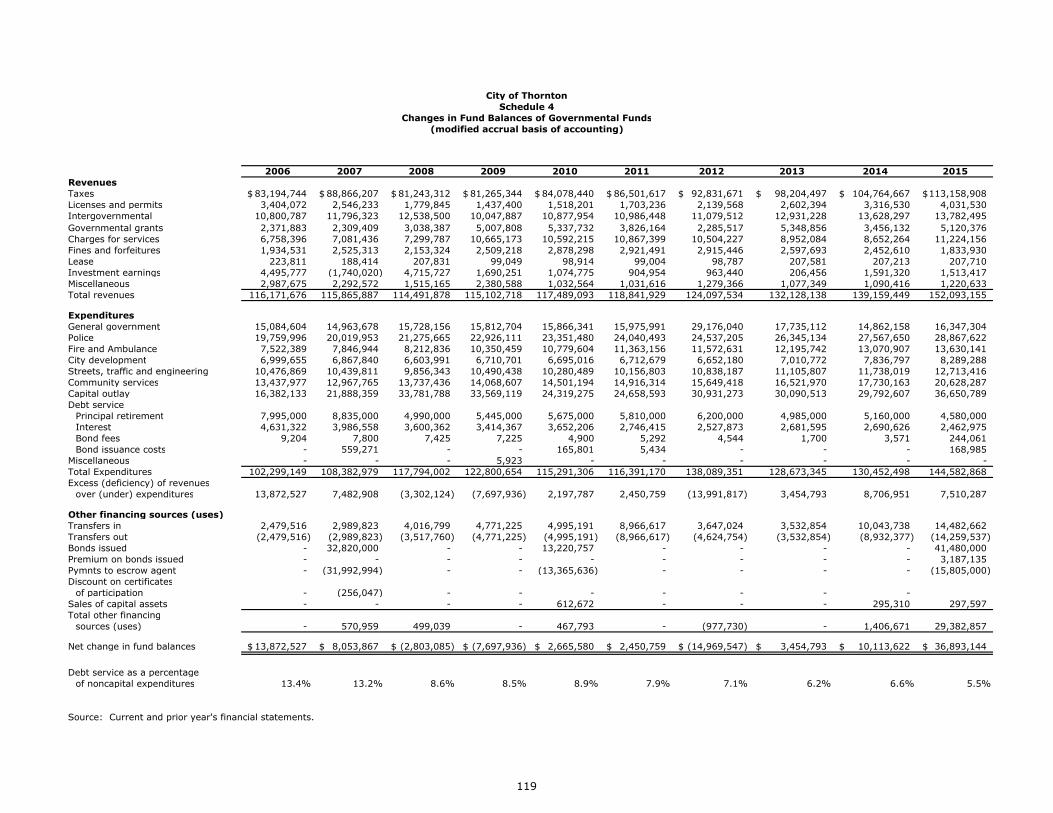
2006 2007 2008 2009 2010 2011 2012 2013 2014 2015RevenuesTaxes 83,194,744$ 88,866,207$ 81,243,312$ 81,265,344$ 84,078,440$ 86,501,617$ 92,831,671$ 98,204,497$ 104,764,667$ 113,158,908$ Licenses and permits 3,404,072 2,546,233 1,779,845 1,437,400 1,518,201 1,703,236 2,139,568 2,602,394 3,316,530 4,031,530 Intergovernmental 10,800,787 11,796,323 12,538,500 10,047,887 10,877,954 10,986,448 11,079,512 12,931,228 13,628,297 13,782,495 Governmental grants 2,371,883 2,309,409 3,038,387 5,007,808 5,337,732 3,826,164 2,285,517 5,348,856 3,456,132 5,120,376 Charges for services 6,758,396 7,081,436 7,299,787 10,665,173 10,592,215 10,867,399 10,504,227 8,952,084 8,652,264 11,224,156 Fines and forfeitures 1,934,531 2,525,313 2,153,324 2,509,218 2,878,298 2,921,491 2,915,446 2,597,693 2,452,610 1,833,930 Lease 223,811 188,414 207,831 99,049 98,914 99,004 98,787 207,581 207,213 207,710 Investment earnings 4,495,777 (1,740,020) 4,715,727 1,690,251 1,074,775 904,954 963,440 206,456 1,591,320 1,513,417 Miscellaneous 2,987,675 2,292,572 1,515,165 2,380,588 1,032,564 1,031,616 1,279,366 1,077,349 1,090,416 1,220,633 Total revenues 116,171,676 115,865,887 114,491,878 115,102,718 117,489,093 118,841,929 124,097,534 132,128,138 139,159,449 152,093,155
ExpendituresGeneral government 15,084,604 14,963,678 15,728,156 15,812,704 15,866,341 15,975,991 29,176,040 17,735,112 14,862,158 16,347,304 Police 19,759,996 20,019,953 21,275,665 22,926,111 23,351,480 24,040,493 24,537,205 26,345,134 27,567,650 28,867,622 Fire and Ambulance 7,522,389 7,846,944 8,212,836 10,350,459 10,779,604 11,363,156 11,572,631 12,195,742 13,070,907 13,630,141 City development 6,999,655 6,867,840 6,603,991 6,710,701 6,695,016 6,712,679 6,652,180 7,010,772 7,836,797 8,289,288 Streets, traffic and engineering 10,476,869 10,439,811 9,856,343 10,490,438 10,280,489 10,156,803 10,838,187 11,105,807 11,738,019 12,713,416 Community services 13,437,977 12,967,765 13,737,436 14,068,607 14,501,194 14,916,314 15,649,418 16,521,970 17,730,163 20,628,287 Capital outlay 16,382,133 21,888,359 33,781,788 33,569,119 24,319,275 24,658,593 30,931,273 30,090,513 29,792,607 36,650,789 Debt service
Principal retirement 7,995,000 8,835,000 4,990,000 5,445,000 5,675,000 5,810,000 6,200,000 4,985,000 5,160,000 4,580,000 Interest 4,631,322 3,986,558 3,600,362 3,414,367 3,652,206 2,746,415 2,527,873 2,681,595 2,690,626 2,462,975 Bond fees 9,204 7,800 7,425 7,225 4,900 5,292 4,544 1,700 3,571 244,061 Bond issuance costs - 559,271 - - 165,801 5,434 - - - 168,985
Miscellaneous - - - 5,923 - - - - - - Total Expenditures 102,299,149 108,382,979 117,794,002 122,800,654 115,291,306 116,391,170 138,089,351 128,673,345 130,452,498 144,582,868 Excess (deficiency) of revenues
over (under) expenditures 13,872,527 7,482,908 (3,302,124) (7,697,936) 2,197,787 2,450,759 (13,991,817) 3,454,793 8,706,951 7,510,287
Other financing sources (uses)Transfers in 2,479,516 2,989,823 4,016,799 4,771,225 4,995,191 8,966,617 3,647,024 3,532,854 10,043,738 14,482,662 Transfers out (2,479,516) (2,989,823) (3,517,760) (4,771,225) (4,995,191) (8,966,617) (4,624,754) (3,532,854) (8,932,377) (14,259,537) Bonds issued - 32,820,000 - - 13,220,757 - - - - 41,480,000 Premium on bonds issued - - - - - - - - - 3,187,135 Pymnts to escrow agent - (31,992,994) - - (13,365,636) - - - - (15,805,000) Discount on certificates
of participation - (256,047) - - - - - - - Sales of capital assets - - - - 612,672 - - - 295,310 297,597 Total other financing
sources (uses) - 570,959 499,039 - 467,793 - (977,730) - 1,406,671 29,382,857
Net change in fund balances 13,872,527$ 8,053,867$ (2,803,085)$ (7,697,936)$ 2,665,580$ 2,450,759$ (14,969,547)$ 3,454,793$ 10,113,622$ 36,893,144$
Debt service as a percentageof noncapital expenditures 13.4% 13.2% 8.6% 8.5% 8.9% 7.9% 7.1% 6.2% 6.6% 5.5%
Source: Current and prior year's financial statements.
City of ThorntonSchedule 4
Changes in Fund Balances of Governmental Funds(modified accrual basis of accounting)
119
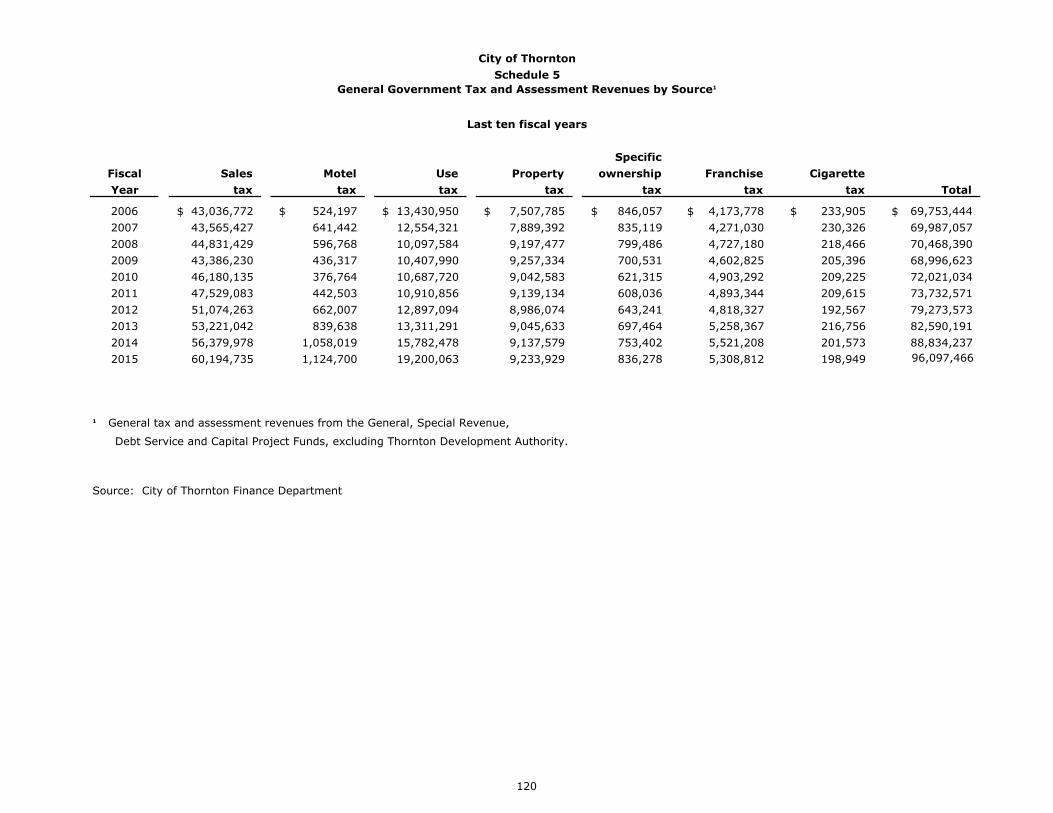
City of ThorntonSchedule 5
General Government Tax and Assessment Revenues by Source¹
Last ten fiscal years
SpecificFiscal Sales Motel Use Property ownership Franchise CigaretteYear tax tax tax tax tax tax tax Total
2006 43,036,772$ 524,197$ 13,430,950$ 7,507,785$ 846,057$ 4,173,778$ 233,905$ 69,753,444$ 2007 43,565,427 641,442 12,554,321 7,889,392 835,119 4,271,030 230,326 69,987,057 2008 44,831,429 596,768 10,097,584 9,197,477 799,486 4,727,180 218,466 70,468,390 2009 43,386,230 436,317 10,407,990 9,257,334 700,531 4,602,825 205,396 68,996,623 2010 46,180,135 376,764 10,687,720 9,042,583 621,315 4,903,292 209,225 72,021,034 2011 47,529,083 442,503 10,910,856 9,139,134 608,036 4,893,344 209,615 73,732,571 2012 51,074,263 662,007 12,897,094 8,986,074 643,241 4,818,327 192,567 79,273,573 2013 53,221,042 839,638 13,311,291 9,045,633 697,464 5,258,367 216,756 82,590,191 2014 56,379,978 1,058,019 15,782,478 9,137,579 753,402 5,521,208 201,573 88,834,237 2015 60,194,735 1,124,700 19,200,063 9,233,929 836,278 5,308,812 198,949 96,097,466
¹ General tax and assessment revenues from the General, Special Revenue,
Debt Service and Capital Project Funds, excluding Thornton Development Authority.
Source: City of Thornton Finance Department
120

This Page Left Intentionally Blank
121
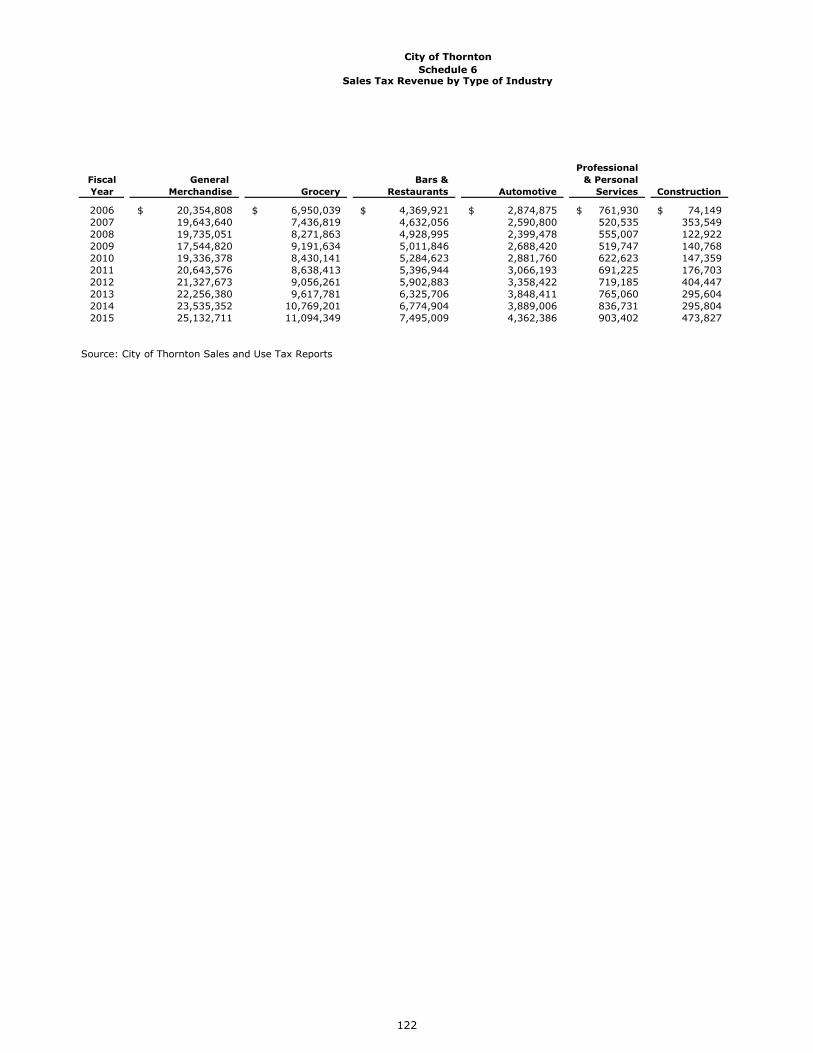
ProfessionalFiscal General Bars & & PersonalYear Merchandise Grocery Restaurants Automotive Services Construction
2006 20,354,808$ 6,950,039$ 4,369,921$ 2,874,875$ 761,930$ 74,149$ 2007 19,643,640 7,436,819 4,632,056 2,590,800 520,535 353,549 2008 19,735,051 8,271,863 4,928,995 2,399,478 555,007 122,922 2009 17,544,820 9,191,634 5,011,846 2,688,420 519,747 140,768 2010 19,336,378 8,430,141 5,284,623 2,881,760 622,623 147,359 2011 20,643,576 8,638,413 5,396,944 3,066,193 691,225 176,703 2012 21,327,673 9,056,261 5,902,883 3,358,422 719,185 404,447 2013 22,256,380 9,617,781 6,325,706 3,848,411 765,060 295,604 2014 23,535,352 10,769,201 6,774,904 3,889,006 836,731 295,804 2015 25,132,711 11,094,349 7,495,009 4,362,386 903,402 473,827
Source: City of Thornton Sales and Use Tax Reports
City of ThorntonSchedule 6
Sales Tax Revenue by Type of Industry
122
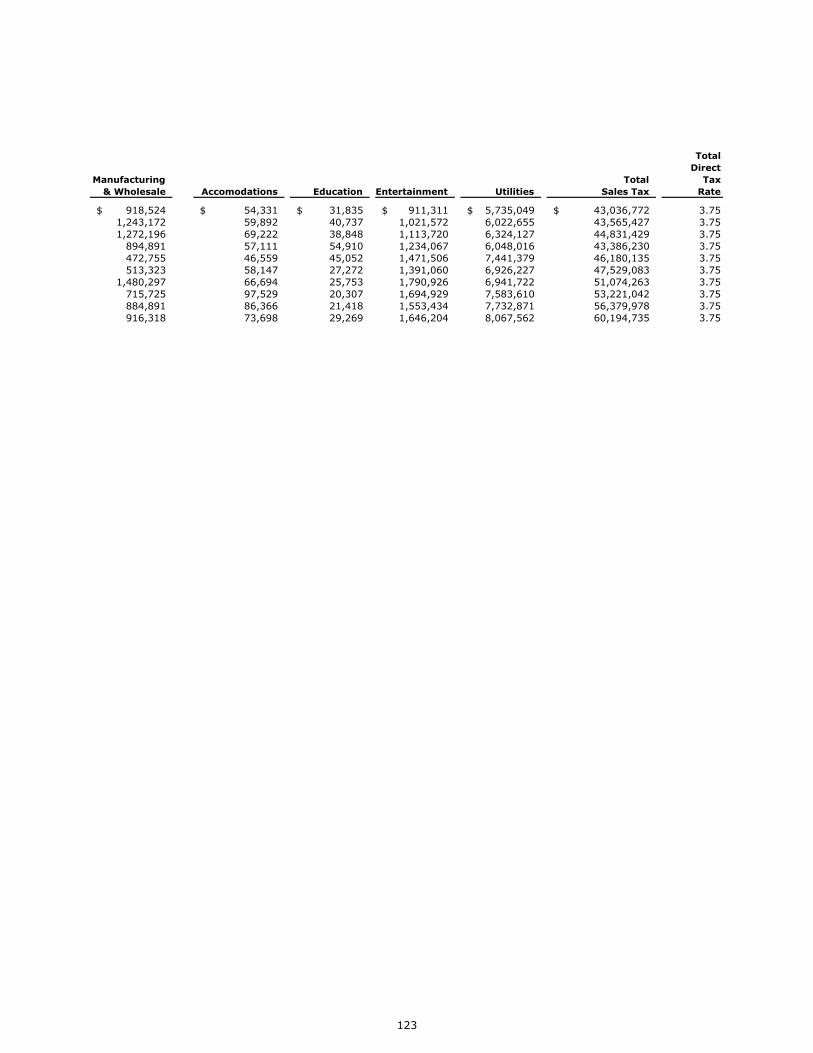
TotalDirect
Manufacturing Total Tax& Wholesale Accomodations Education Entertainment Utilities Sales Tax Rate
918,524$ 54,331$ 31,835$ 911,311$ 5,735,049$ 43,036,772$ 3.751,243,172 59,892 40,737 1,021,572 6,022,655 43,565,427 3.751,272,196 69,222 38,848 1,113,720 6,324,127 44,831,429 3.75
894,891 57,111 54,910 1,234,067 6,048,016 43,386,230 3.75472,755 46,559 45,052 1,471,506 7,441,379 46,180,135 3.75513,323 58,147 27,272 1,391,060 6,926,227 47,529,083 3.75
1,480,297 66,694 25,753 1,790,926 6,941,722 51,074,263 3.75715,725 97,529 20,307 1,694,929 7,583,610 53,221,042 3.75884,891 86,366 21,418 1,553,434 7,732,871 56,379,978 3.75916,318 73,698 29,269 1,646,204 8,067,562 60,194,735 3.75
123
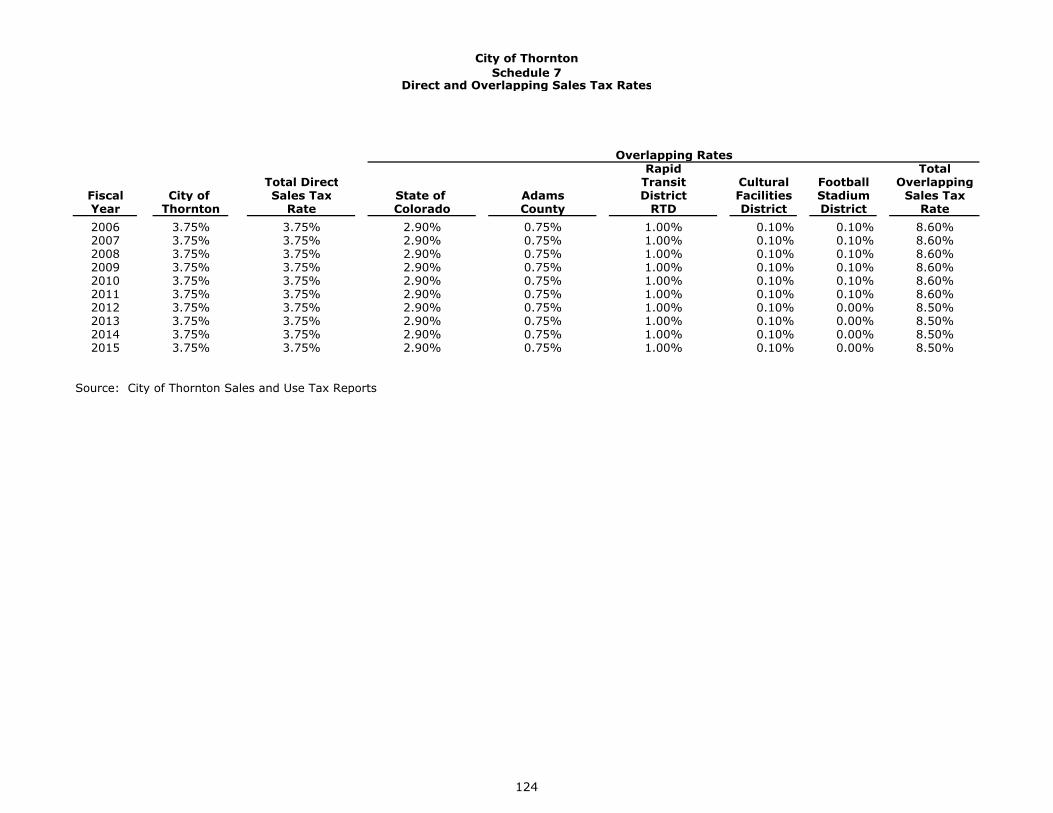
City of ThorntonSchedule 7
Direct and Overlapping Sales Tax Rates
Rapid TotalTotal Direct Transit Cultural Football Overlapping
Fiscal City of Sales Tax State of Adams District Facilities Stadium Sales TaxYear Thornton Rate Colorado County RTD District District Rate2006 3.75% 3.75% 2.90% 0.75% 1.00% 0.10% 0.10% 8.60%2007 3.75% 3.75% 2.90% 0.75% 1.00% 0.10% 0.10% 8.60%2008 3.75% 3.75% 2.90% 0.75% 1.00% 0.10% 0.10% 8.60%2009 3.75% 3.75% 2.90% 0.75% 1.00% 0.10% 0.10% 8.60%2010 3.75% 3.75% 2.90% 0.75% 1.00% 0.10% 0.10% 8.60%2011 3.75% 3.75% 2.90% 0.75% 1.00% 0.10% 0.10% 8.60%2012 3.75% 3.75% 2.90% 0.75% 1.00% 0.10% 0.00% 8.50%2013 3.75% 3.75% 2.90% 0.75% 1.00% 0.10% 0.00% 8.50%2014 3.75% 3.75% 2.90% 0.75% 1.00% 0.10% 0.00% 8.50%2015 3.75% 3.75% 2.90% 0.75% 1.00% 0.10% 0.00% 8.50%
Source: City of Thornton Sales and Use Tax Reports
Overlapping Rates
124
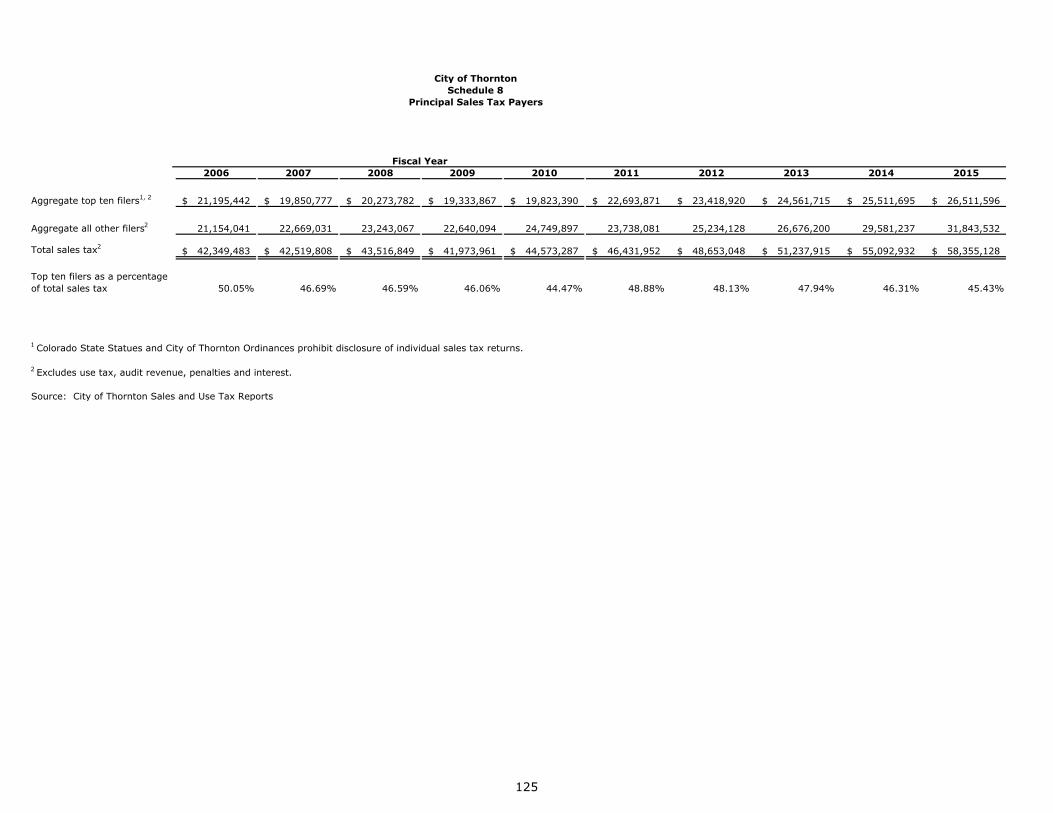
2006 2007 2008 2009 2010 2011 2012 2013 2014 2015
Aggregate top ten filers1, 2 21,195,442$ 19,850,777$ 20,273,782$ 19,333,867$ 19,823,390$ 22,693,871$ 23,418,920$ 24,561,715$ 25,511,695$ 26,511,596$
Aggregate all other filers2 21,154,041 22,669,031 23,243,067 22,640,094 24,749,897 23,738,081 25,234,128 26,676,200 29,581,237 31,843,532
Total sales tax2 42,349,483$ 42,519,808$ 43,516,849$ 41,973,961$ 44,573,287$ 46,431,952$ 48,653,048$ 51,237,915$ 55,092,932$ 58,355,128$
50.05% 46.69% 46.59% 46.06% 44.47% 48.88% 48.13% 47.94% 46.31% 45.43%
1 Colorado State Statues and City of Thornton Ordinances prohibit disclosure of individual sales tax returns.
2 Excludes use tax, audit revenue, penalties and interest.
Source: City of Thornton Sales and Use Tax Reports
Fiscal Year
City of ThorntonSchedule 8
Principal Sales Tax Payers
Top ten filers as a percentage of total sales tax
125
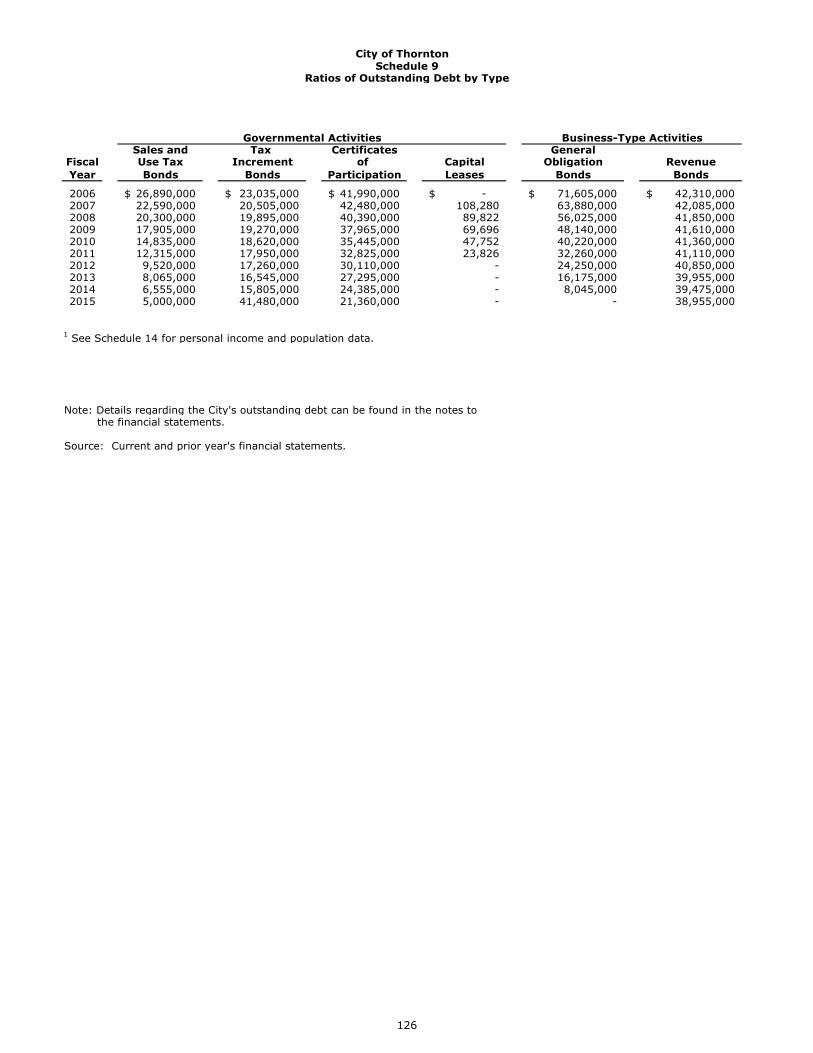
Schedule 9Ratios of Outstanding Debt by Type
Governmental Activities Business-Type ActivitiesSales and Tax Certificates General
Fiscal Use Tax Increment of Capital Obligation RevenueYear Bonds Bonds Participation Leases Bonds Bonds
2006 26,890,000$ 23,035,000$ 41,990,000$ -$ 71,605,000$ 42,310,000$ 2007 22,590,000 20,505,000 42,480,000 108,280 63,880,000 42,085,000 2008 20,300,000 19,895,000 40,390,000 89,822 56,025,000 41,850,000 2009 17,905,000 19,270,000 37,965,000 69,696 48,140,000 41,610,000 2010 14,835,000 18,620,000 35,445,000 47,752 40,220,000 41,360,000 2011 12,315,000 17,950,000 32,825,000 23,826 32,260,000 41,110,000 2012 9,520,000 17,260,000 30,110,000 - 24,250,000 40,850,000 2013 8,065,000 16,545,000 27,295,000 - 16,175,000 39,955,000 2014 6,555,000 15,805,000 24,385,000 - 8,045,000 39,475,000 2015 5,000,000 41,480,000 21,360,000 - - 38,955,000
1 See Schedule 14 for personal income and population data.
Note: Details regarding the City's outstanding debt can be found in the notes to the financial statements.
Source: Current and prior year's financial statements.
City of Thornton
126
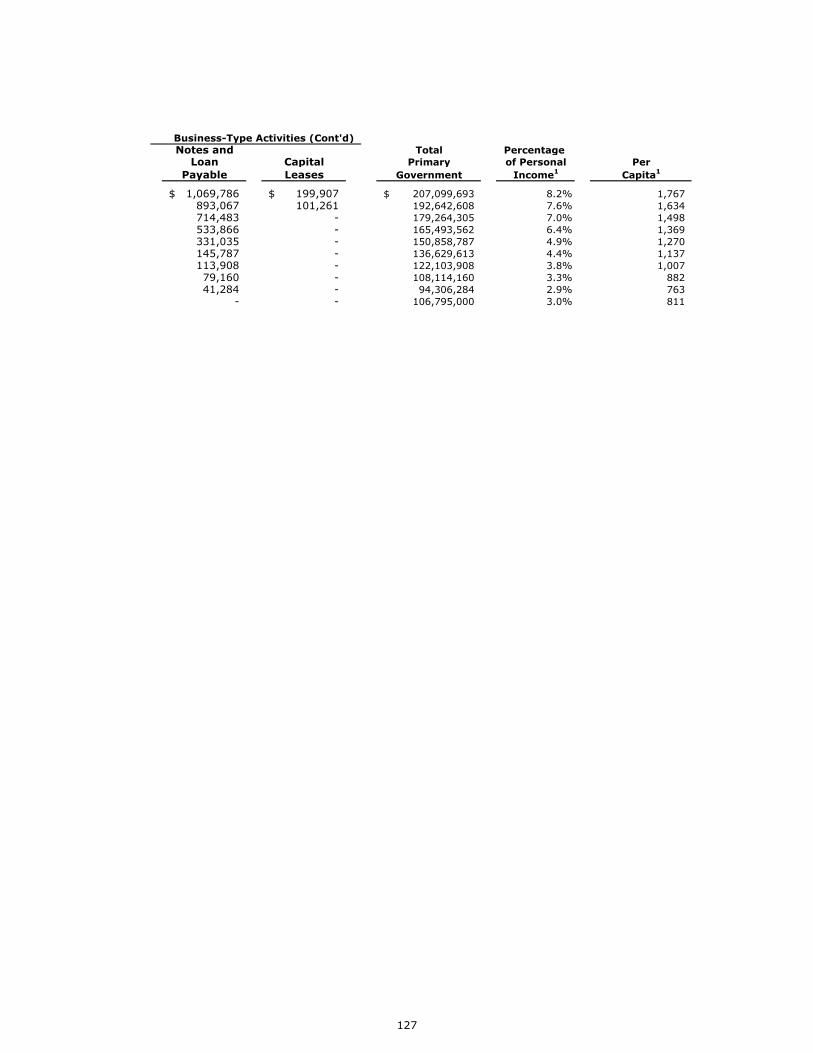
Business-Type Activities (Cont'd)Notes and Total Percentage
Loan Capital Primary of Personal PerPayable Leases Government Income1 Capita1
1,069,786$ 199,907$ 207,099,693$ 8.2% 1,767 893,067 101,261 192,642,608 7.6% 1,634 714,483 - 179,264,305 7.0% 1,498 533,866 - 165,493,562 6.4% 1,369 331,035 - 150,858,787 4.9% 1,270 145,787 - 136,629,613 4.4% 1,137 113,908 - 122,103,908 3.8% 1,007 79,160 - 108,114,160 3.3% 882 41,284 - 94,306,284 2.9% 763
- - 106,795,000 3.0% 811
127
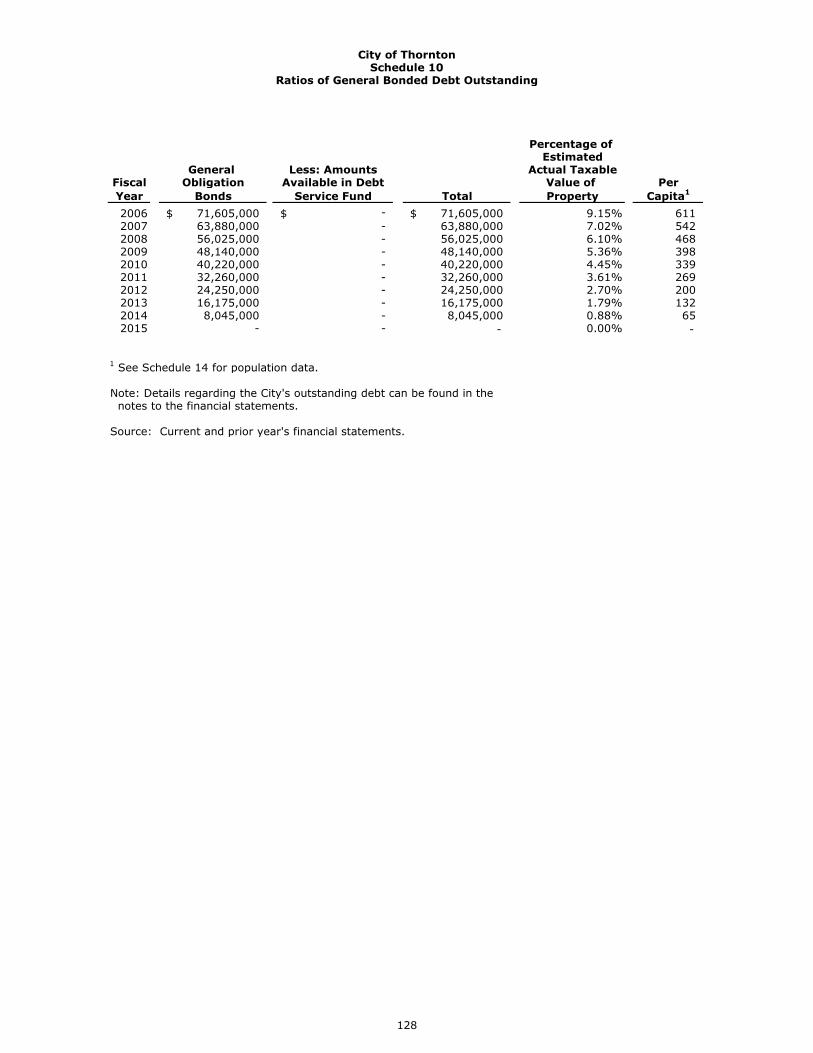
City of ThorntonSchedule 10
Ratios of General Bonded Debt Outstanding
Percentage of Estimated
General Less: Amounts Actual TaxableFiscal Obligation Available in Debt Value of PerYear Bonds Service Fund Total Property Capita1
2006 71,605,000$ -$ 71,605,000$ 9.15% 611 2007 63,880,000 - 63,880,000 7.02% 542 2008 56,025,000 - 56,025,000 6.10% 468 2009 48,140,000 - 48,140,000 5.36% 398 2010 40,220,000 - 40,220,000 4.45% 339 2011 32,260,000 - 32,260,000 3.61% 269 2012 24,250,000 - 24,250,000 2.70% 200 2013 16,175,000 - 16,175,000 1.79% 132 2014 8,045,000 - 8,045,000 0.88% 65 2015 - - - 0.00% -
1 See Schedule 14 for population data.
Note: Details regarding the City's outstanding debt can be found in the notes to the financial statements.
Source: Current and prior year's financial statements.
128
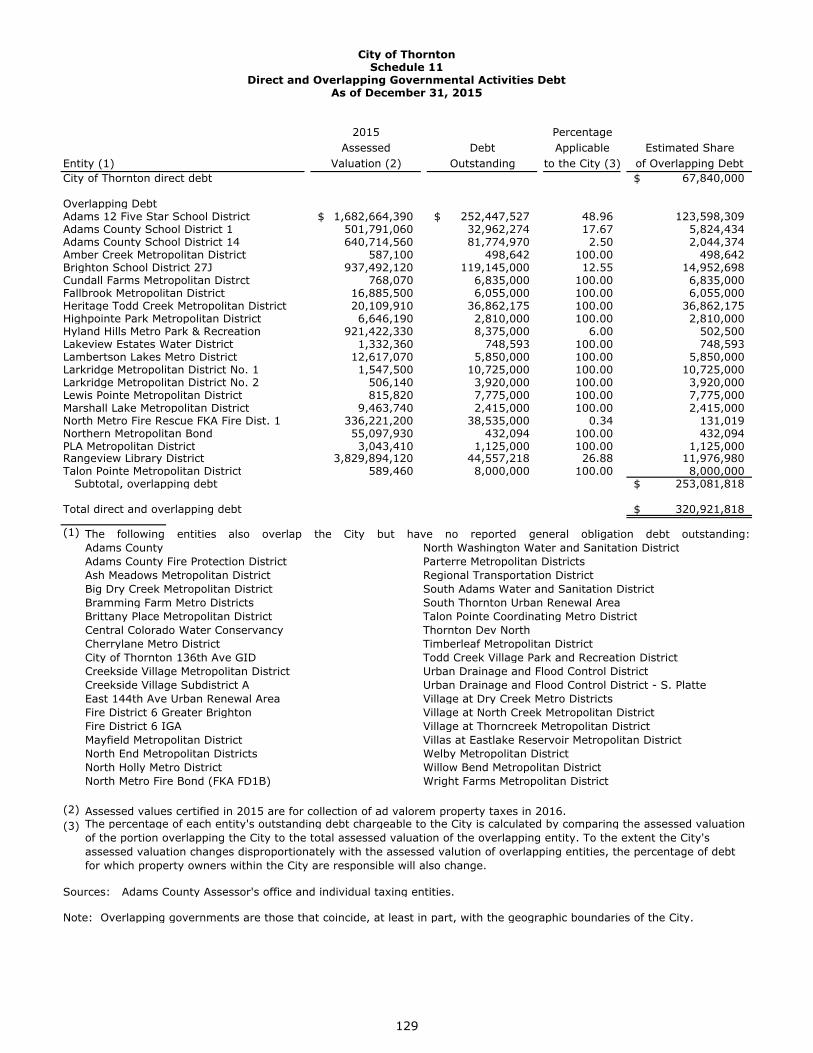
2015 PercentageAssessed Debt Applicable Estimated Share
Entity (1) Valuation (2) Outstanding to the City (3) of Overlapping DebtCity of Thornton direct debt 67,840,000$
Overlapping DebtAdams 12 Five Star School District 1,682,664,390$ 252,447,527$ 48.96 123,598,309 Adams County School District 1 501,791,060 32,962,274 17.67 5,824,434 Adams County School District 14 640,714,560 81,774,970 2.50 2,044,374 Amber Creek Metropolitan District 587,100 498,642 100.00 498,642 Brighton School District 27J 937,492,120 119,145,000 12.55 14,952,698 Cundall Farms Metropolitan Distrct 768,070 6,835,000 100.00 6,835,000 Fallbrook Metropolitan District 16,885,500 6,055,000 100.00 6,055,000 Heritage Todd Creek Metropolitan District 20,109,910 36,862,175 100.00 36,862,175 Highpointe Park Metropolitan District 6,646,190 2,810,000 100.00 2,810,000 Hyland Hills Metro Park & Recreation 921,422,330 8,375,000 6.00 502,500 Lakeview Estates Water District 1,332,360 748,593 100.00 748,593 Lambertson Lakes Metro District 12,617,070 5,850,000 100.00 5,850,000 Larkridge Metropolitan District No. 1 1,547,500 10,725,000 100.00 10,725,000 Larkridge Metropolitan District No. 2 506,140 3,920,000 100.00 3,920,000 Lewis Pointe Metropolitan District 815,820 7,775,000 100.00 7,775,000 Marshall Lake Metropolitan District 9,463,740 2,415,000 100.00 2,415,000 North Metro Fire Rescue FKA Fire Dist. 1 336,221,200 38,535,000 0.34 131,019 Northern Metropolitan Bond 55,097,930 432,094 100.00 432,094 PLA Metropolitan District 3,043,410 1,125,000 100.00 1,125,000 Rangeview Library District 3,829,894,120 44,557,218 26.88 11,976,980Talon Pointe Metropolitan District 589,460 8,000,000 100.00 8,000,000 Subtotal, overlapping debt 253,081,818$
Total direct and overlapping debt 320,921,818$
(1)Adams County North Washington Water and Sanitation DistrictAdams County Fire Protection District Parterre Metropolitan DistrictsAsh Meadows Metropolitan District Regional Transportation DistrictBig Dry Creek Metropolitan District South Adams Water and Sanitation DistrictBramming Farm Metro Districts South Thornton Urban Renewal AreaBrittany Place Metropolitan District Talon Pointe Coordinating Metro DistrictCentral Colorado Water Conservancy Thornton Dev NorthCherrylane Metro District Timberleaf Metropolitan DistrictCity of Thornton 136th Ave GID Todd Creek Village Park and Recreation DistrictCreekside Village Metropolitan District Urban Drainage and Flood Control DistrictCreekside Village Subdistrict A Urban Drainage and Flood Control District - S. PlatteEast 144th Ave Urban Renewal Area Village at Dry Creek Metro DistrictsFire District 6 Greater Brighton Village at North Creek Metropolitan DistrictFire District 6 IGA Village at Thorncreek Metropolitan DistrictMayfield Metropolitan District Villas at Eastlake Reservoir Metropolitan DistrictNorth End Metropolitan Districts Welby Metropolitan DistrictNorth Holly Metro District Willow Bend Metropolitan DistrictNorth Metro Fire Bond (FKA FD1B) Wright Farms Metropolitan District
(2)(3)
Note: Overlapping governments are those that coincide, at least in part, with the geographic boundaries of the City.
Sources: Adams County Assessor's office and individual taxing entities.
The following entities also overlap the City but have no reported general obligation debt outstanding:
Assessed values certified in 2015 are for collection of ad valorem property taxes in 2016.
City of ThorntonSchedule 11
Direct and Overlapping Governmental Activities DebtAs of December 31, 2015
The percentage of each entity's outstanding debt chargeable to the City is calculated by comparing the assessed valuation of the portion overlapping the City to the total assessed valuation of the overlapping entity. To the extent the City's assessed valuation changes disproportionately with the assessed valution of overlapping entities, the percentage of debt for which property owners within the City are responsible will also change.
129
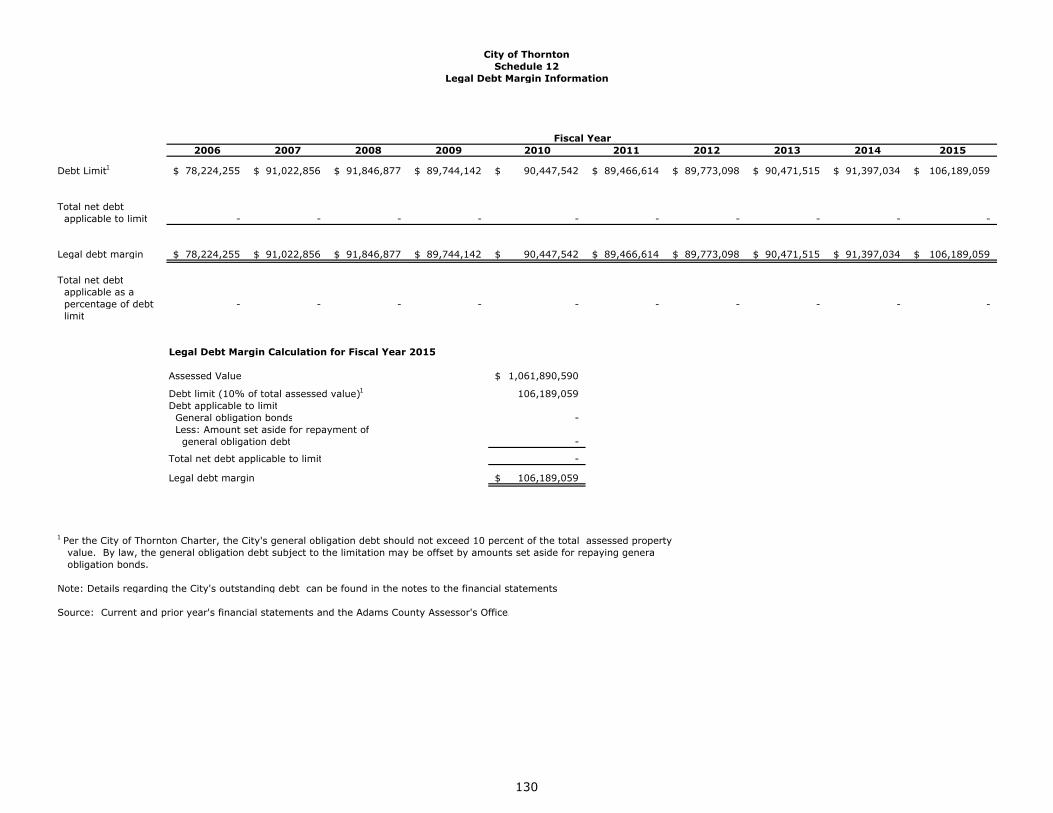
2006 2007 2008 2009 2010 2011 2012 2013 2014 2015
Debt Limit1 78,224,255$ 91,022,856$ 91,846,877$ 89,744,142$ 90,447,542$ 89,466,614$ 89,773,098$ 90,471,515$ 91,397,034$ 106,189,059$
Total net debt applicable to limit - - - - - - - - - -
Legal debt margin 78,224,255$ 91,022,856$ 91,846,877$ 89,744,142$ 90,447,542$ 89,466,614$ 89,773,098$ 90,471,515$ 91,397,034$ 106,189,059$
Total net debt applicable as a percentage of debt - - - - - - - - - - limit
Legal Debt Margin Calculation for Fiscal Year 2015
Assessed Value 1,061,890,590$
Debt limit (10% of total assessed value)1 106,189,059 Debt applicable to limit General obligation bonds - Less: Amount set aside for repayment of general obligation debt -
Total net debt applicable to limit -
Legal debt margin 106,189,059$
1 Per the City of Thornton Charter, the City's general obligation debt should not exceed 10 percent of the total assessed property value. By law, the general obligation debt subject to the limitation may be offset by amounts set aside for repaying genera obligation bonds.
Note: Details regarding the City's outstanding debt can be found in the notes to the financial statements
Source: Current and prior year's financial statements and the Adams County Assessor's Office.
City of ThorntonSchedule 12
Legal Debt Margin Information
Fiscal Year
130
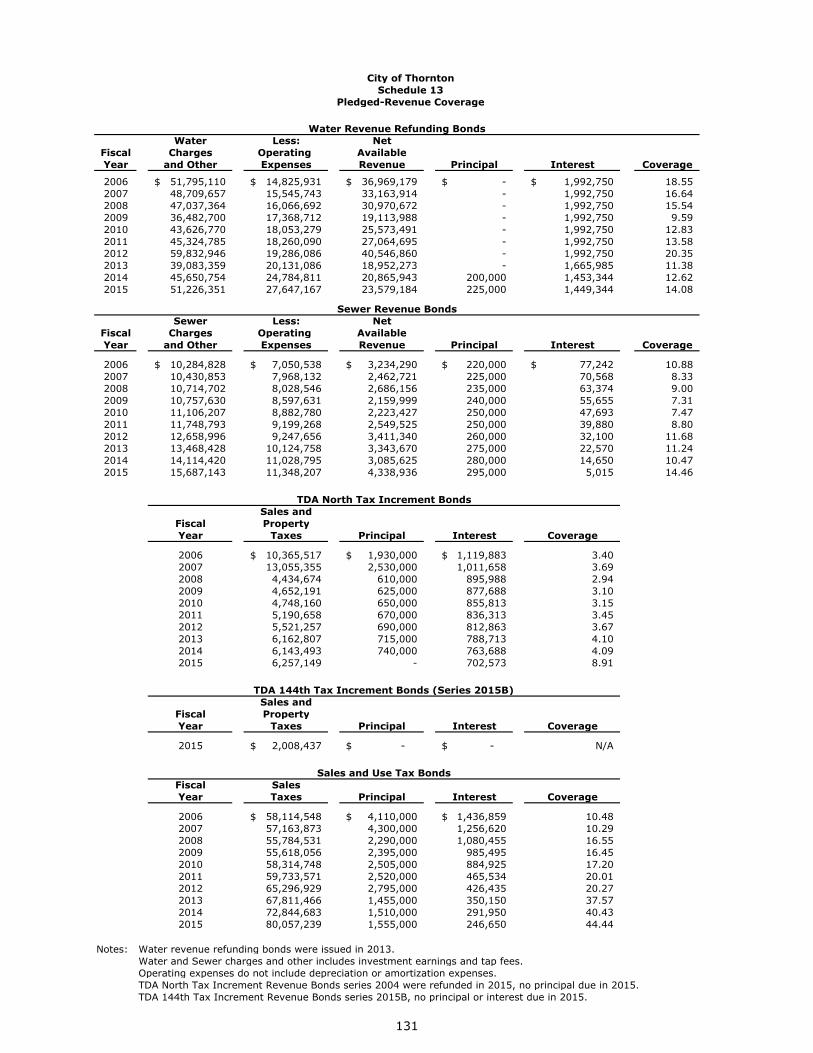
City of ThorntonSchedule 13
Pledged-Revenue Coverage
Water Revenue Refunding BondsWater Less: Net
Fiscal Charges Operating AvailableYear and Other Expenses Revenue Principal Interest Coverage
2006 51,795,110$ 14,825,931$ 36,969,179$ -$ 1,992,750$ 18.55 2007 48,709,657 15,545,743 33,163,914 - 1,992,750 16.64 2008 47,037,364 16,066,692 30,970,672 - 1,992,750 15.54 2009 36,482,700 17,368,712 19,113,988 - 1,992,750 9.59 2010 43,626,770 18,053,279 25,573,491 - 1,992,750 12.83 2011 45,324,785 18,260,090 27,064,695 - 1,992,750 13.58 2012 59,832,946 19,286,086 40,546,860 - 1,992,750 20.35 2013 39,083,359 20,131,086 18,952,273 - 1,665,985 11.38 2014 45,650,754 24,784,811 20,865,943 200,000 1,453,344 12.62 2015 51,226,351 27,647,167 23,579,184 225,000 1,449,344 14.08
Sewer Revenue BondsSewer Less: Net
Fiscal Charges Operating AvailableYear and Other Expenses Revenue Principal Interest Coverage
2006 10,284,828$ 7,050,538$ 3,234,290$ 220,000$ 77,242$ 10.88 2007 10,430,853 7,968,132 2,462,721 225,000 70,568 8.33 2008 10,714,702 8,028,546 2,686,156 235,000 63,374 9.00 2009 10,757,630 8,597,631 2,159,999 240,000 55,655 7.31 2010 11,106,207 8,882,780 2,223,427 250,000 47,693 7.47 2011 11,748,793 9,199,268 2,549,525 250,000 39,880 8.80 2012 12,658,996 9,247,656 3,411,340 260,000 32,100 11.68 2013 13,468,428 10,124,758 3,343,670 275,000 22,570 11.24 2014 14,114,420 11,028,795 3,085,625 280,000 14,650 10.47 2015 15,687,143 11,348,207 4,338,936 295,000 5,015 14.46
TDA North Tax Increment BondsSales and
Fiscal PropertyYear Taxes Principal Interest Coverage
2006 10,365,517$ 1,930,000$ 1,119,883$ 3.40 2007 13,055,355 2,530,000 1,011,658 3.69 2008 4,434,674 610,000 895,988 2.94 2009 4,652,191 625,000 877,688 3.10 2010 4,748,160 650,000 855,813 3.15 2011 5,190,658 670,000 836,313 3.45 2012 5,521,257 690,000 812,863 3.67 2013 6,162,807 715,000 788,713 4.10 2014 6,143,493 740,000 763,688 4.09 2015 6,257,149 - 702,573 8.91
TDA 144th Tax Increment Bonds (Series 2015B)Sales and
Fiscal PropertyYear Taxes Principal Interest Coverage
2015 2,008,437$ -$ -$ N/A
Sales and Use Tax BondsFiscal SalesYear Taxes Principal Interest Coverage
2006 58,114,548$ 4,110,000$ 1,436,859$ 10.48 2007 57,163,873 4,300,000 1,256,620 10.29 2008 55,784,531 2,290,000 1,080,455 16.55 2009 55,618,056 2,395,000 985,495 16.45 2010 58,314,748 2,505,000 884,925 17.20 2011 59,733,571 2,520,000 465,534 20.01 2012 65,296,929 2,795,000 426,435 20.27 2013 67,811,466 1,455,000 350,150 37.57 2014 72,844,683 1,510,000 291,950 40.43 2015 80,057,239 1,555,000 246,650 44.44
Notes: Water revenue refunding bonds were issued in 2013.Water and Sewer charges and other includes investment earnings and tap fees.Operating expenses do not include depreciation or amortization expenses.TDA North Tax Increment Revenue Bonds series 2004 were refunded in 2015, no principal due in 2015.TDA 144th Tax Increment Revenue Bonds series 2015B, no principal or interest due in 2015.
131
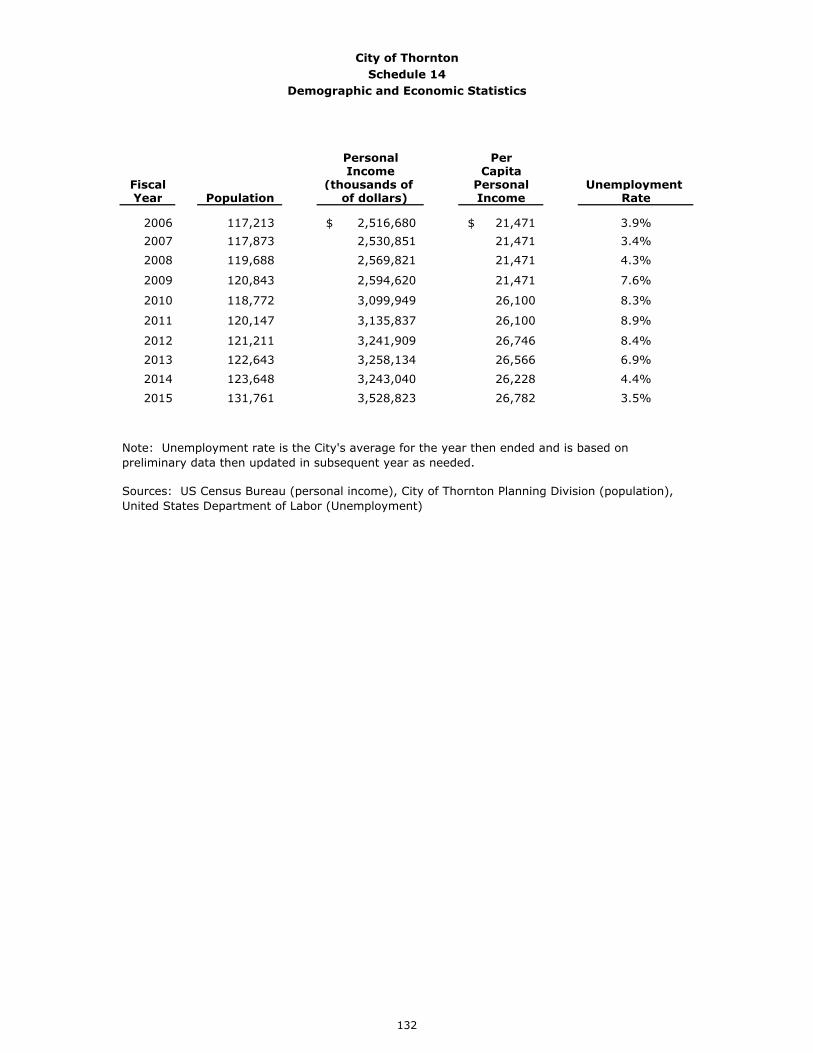
City of ThorntonSchedule 14
Demographic and Economic Statistics
Personal PerIncome Capita
Fiscal (thousands of Personal Unemployment Year Population of dollars) Income Rate
2006 117,213 2,516,680$ 21,471$ 3.9%2007 117,873 2,530,851 21,471 3.4%2008 119,688 2,569,821 21,471 4.3%
2009 120,843 2,594,620 21,471 7.6%
2010 118,772 3,099,949 26,100 8.3%
2011 120,147 3,135,837 26,100 8.9%
2012 121,211 3,241,909 26,746 8.4%2013 122,643 3,258,134 26,566 6.9%2014 123,648 3,243,040 26,228 4.4%2015 131,761 3,528,823 26,782 3.5%
Note: Unemployment rate is the City's average for the year then ended and is based on preliminary data then updated in subsequent year as needed.
Sources: US Census Bureau (personal income), City of Thornton Planning Division (population), United States Department of Labor (Unemployment)
132
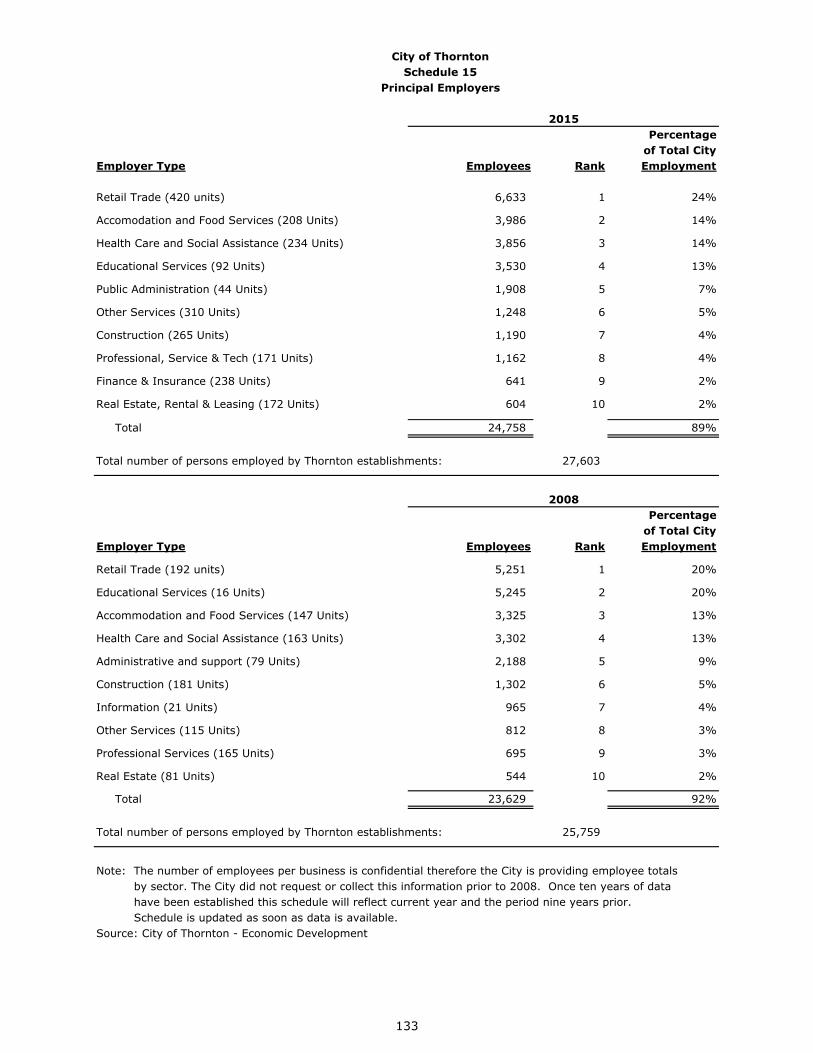
City of ThorntonSchedule 15
Principal Employers
Percentageof Total City
Employer Type Employees Rank Employment
Retail Trade (420 units) 6,633 1 24%
Accomodation and Food Services (208 Units) 3,986 2 14%
Health Care and Social Assistance (234 Units) 3,856 3 14%
Educational Services (92 Units) 3,530 4 13%
Public Administration (44 Units) 1,908 5 7%
Other Services (310 Units) 1,248 6 5%
Construction (265 Units) 1,190 7 4%
Professional, Service & Tech (171 Units) 1,162 8 4%
Finance & Insurance (238 Units) 641 9 2%
Real Estate, Rental & Leasing (172 Units) 604 10 2%
Total 24,758 89%
Total number of persons employed by Thornton establishments: 27,603
Percentageof Total City
Employer Type Employees Rank Employment
Retail Trade (192 units) 5,251 1 20%
Educational Services (16 Units) 5,245 2 20%
Accommodation and Food Services (147 Units) 3,325 3 13%
Health Care and Social Assistance (163 Units) 3,302 4 13%
Administrative and support (79 Units) 2,188 5 9%
Construction (181 Units) 1,302 6 5%
Information (21 Units) 965 7 4%
Other Services (115 Units) 812 8 3%
Professional Services (165 Units) 695 9 3%
Real Estate (81 Units) 544 10 2%
Total 23,629 92%
Total number of persons employed by Thornton establishments: 25,759
Note: The number of employees per business is confidential therefore the City is providing employee totals by sector. The City did not request or collect this information prior to 2008. Once ten years of data have been established this schedule will reflect current year and the period nine years prior. Schedule is updated as soon as data is available.Source: City of Thornton - Economic Development
2008
2015
133
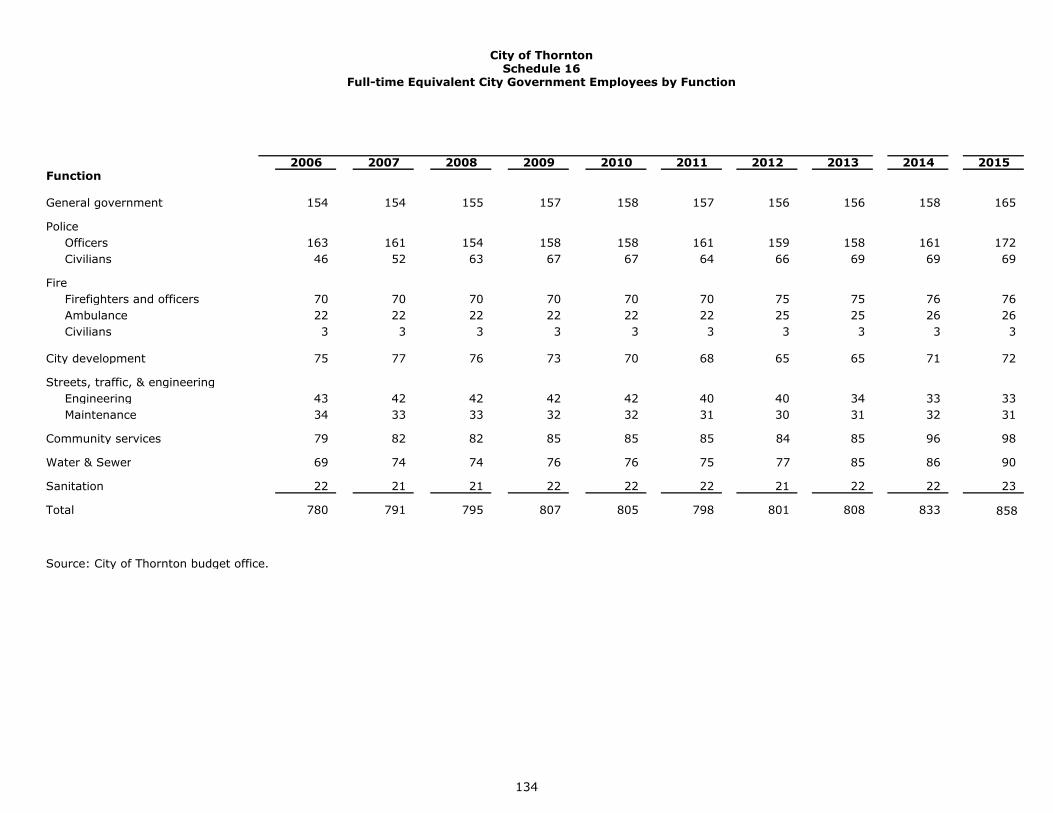
City of ThorntonSchedule 16
Full-time Equivalent City Government Employees by Function
2006 2007 2008 2009 2010 2011 2012 2013 2014 2015Function
General government 154 154 155 157 158 157 156 156 158 165
PoliceOfficers 163 161 154 158 158 161 159 158 161 172 Civilians 46 52 63 67 67 64 66 69 69 69
FireFirefighters and officers 70 70 70 70 70 70 75 75 76 76 Ambulance 22 22 22 22 22 22 25 25 26 26 Civilians 3 3 3 3 3 3 3 3 3 3
City development 75 77 76 73 70 68 65 65 71 72
Streets, traffic, & engineeringEngineering 43 42 42 42 42 40 40 34 33 33 Maintenance 34 33 33 32 32 31 30 31 32 31
Community services 79 82 82 85 85 85 84 85 96 98
Water & Sewer 69 74 74 76 76 75 77 85 86 90
Sanitation 22 21 21 22 22 22 21 22 22 23
Total 780 791 795 807 805 798 801 808 833
858
Source: City of Thornton budget office.
134
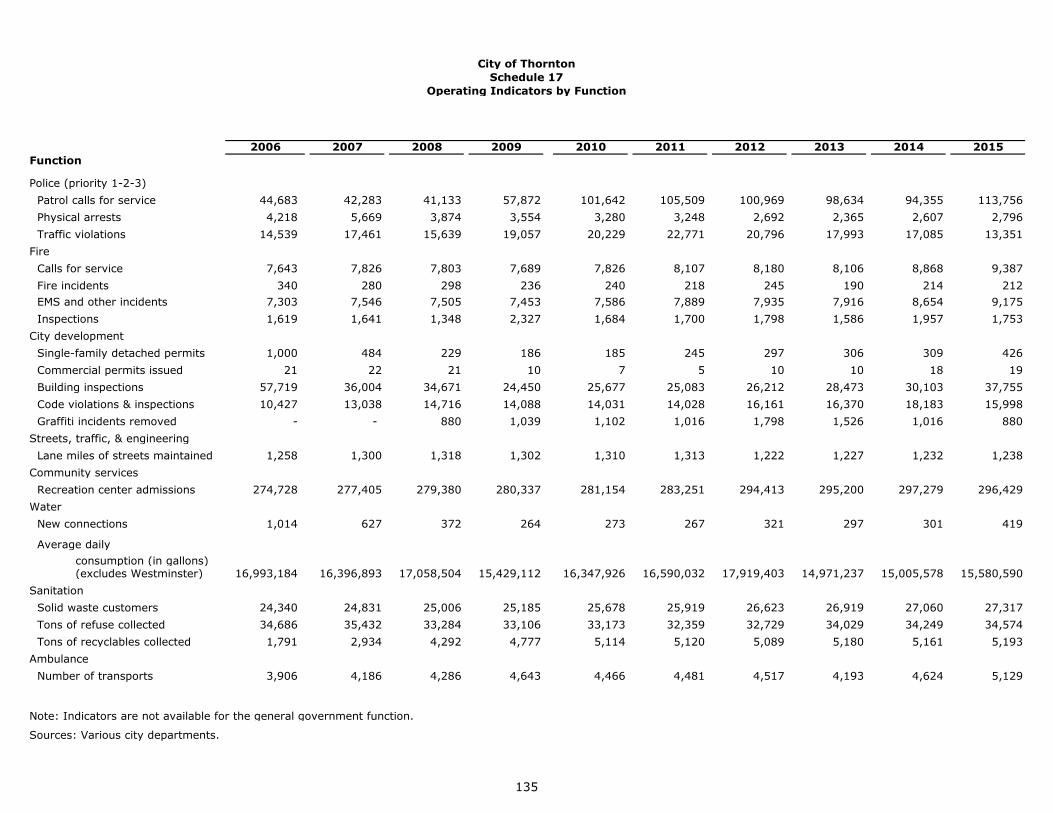
2006 2007 2008 2009 2010 2011 2012 2013 2014 2015Function
Police (priority 1-2-3)Patrol calls for service 44,683 42,283 41,133 57,872 101,642 105,509 100,969 98,634 94,355 113,756Physical arrests 4,218 5,669 3,874 3,554 3,280 3,248 2,692 2,365 2,607 2,796Traffic violations 14,539 17,461 15,639 19,057 20,229 22,771 20,796 17,993 17,085 13,351
FireCalls for service 7,643 7,826 7,803 7,689 7,826 8,107 8,180 8,106 8,868 9,387Fire incidents 340 280 298 236 240 218 245 190 214 212EMS and other incidents 7,303 7,546 7,505 7,453 7,586 7,889 7,935 7,916 8,654 9,175Inspections 1,619 1,641 1,348 2,327 1,684 1,700 1,798 1,586 1,957 1,753
City developmentSingle-family detached permits 1,000 484 229 186 185 245 297 306 309 426Commercial permits issued 21 22 21 10 7 5 10 10 18 19Building inspections 57,719 36,004 34,671 24,450 25,677 25,083 26,212 28,473 30,103 37,755Code violations & inspections 10,427 13,038 14,716 14,088 14,031 14,028 16,161 16,370 18,183 15,998Graffiti incidents removed - - 880 1,039 1,102 1,016 1,798 1,526 1,016 880
Streets, traffic, & engineeringLane miles of streets maintained 1,258 1,300 1,318 1,302 1,310 1,313 1,222 1,227 1,232 1,238
Community servicesRecreation center admissions 274,728 277,405 279,380 280,337 281,154 283,251 294,413 295,200 297,279 296,429
WaterNew connections 1,014 627 372 264 273 267 321 297 301 419
Average dailyconsumption (in gallons)(excludes Westminster) 16,993,184 16,396,893 17,058,504 15,429,112 16,347,926 16,590,032 17,919,403 14,971,237 15,005,578 15,580,590
SanitationSolid waste customers 24,340 24,831 25,006 25,185 25,678 25,919 26,623 26,919 27,060 27,317Tons of refuse collected 34,686 35,432 33,284 33,106 33,173 32,359 32,729 34,029 34,249 34,574Tons of recyclables collected 1,791 2,934 4,292 4,777 5,114 5,120 5,089 5,180 5,161 5,193
AmbulanceNumber of transports 3,906 4,186 4,286 4,643 4,466 4,481 4,517 4,193 4,624 5,129
Note: Indicators are not available for the general government function.
Sources: Various city departments.
Operating Indicators by FunctionSchedule 17
City of Thornton
135
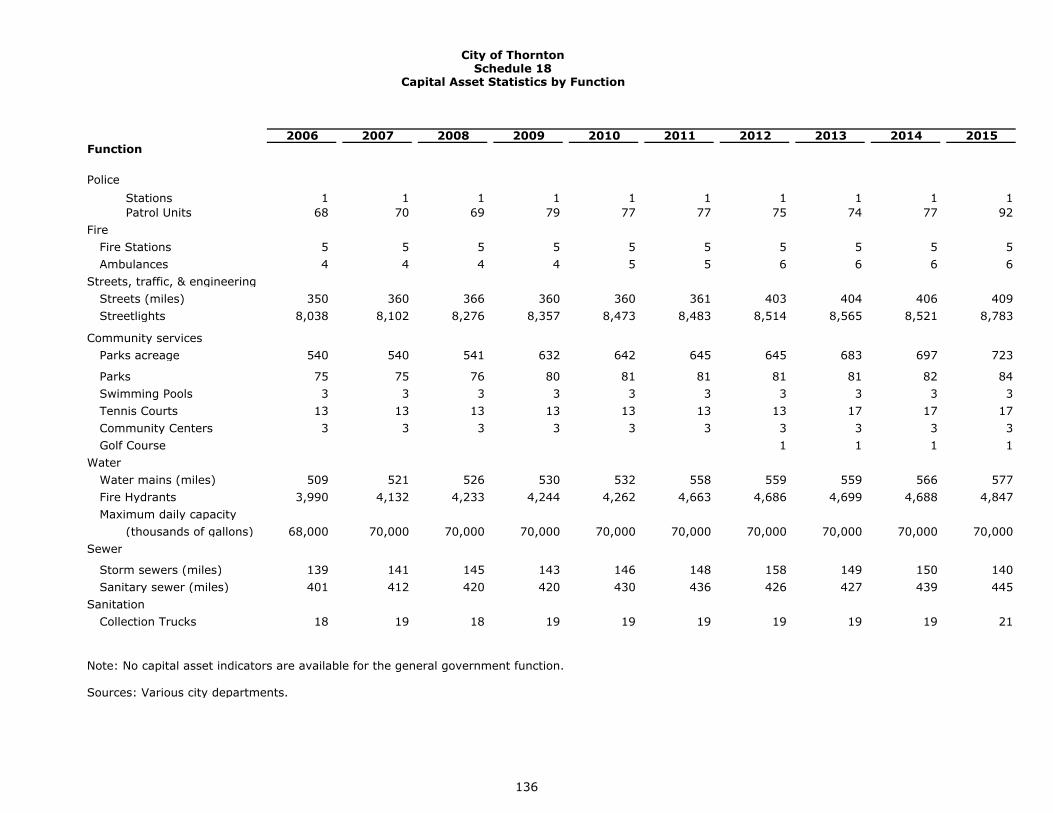
2006 2007 2008 2009 2010 2011 2012 2013 2014 2015Function
PoliceStations 1 1 1 1 1 1 1 1 1 1Patrol Units 68 70 69 79 77 77 75 74 77 92
FireFire Stations 5 5 5 5 5 5 5 5 5 5Ambulances 4 4 4 4 5 5 6 6 6 6
Streets, traffic, & engineeringStreets (miles) 350 360 366 360 360 361 403 404 406 409Streetlights 8,038 8,102 8,276 8,357 8,473 8,483 8,514 8,565 8,521 8,783
Community servicesParks acreage 540 540 541 632 642 645 645 683 697 723
Parks 75 75 76 80 81 81 81 81 82 84Swimming Pools 3 3 3 3 3 3 3 3 3 3Tennis Courts 13 13 13 13 13 13 13 17 17 17Community Centers 3 3 3 3 3 3 3 3 3 3Golf Course 1 1 1 1
WaterWater mains (miles) 509 521 526 530 532 558 559 559 566 577Fire Hydrants 3,990 4,132 4,233 4,244 4,262 4,663 4,686 4,699 4,688 4,847Maximum daily capacity
(thousands of gallons) 68,000 70,000 70,000 70,000 70,000 70,000 70,000 70,000 70,000 70,000Sewer
Storm sewers (miles) 139 141 145 143 146 148 158 149 150 140Sanitary sewer (miles) 401 412 420 420 430 436 426 427 439 445
SanitationCollection Trucks 18 19 18 19 19 19 19 19 19 21
Note: No capital asset indicators are available for the general government function.
Sources: Various city departments.
City of ThorntonSchedule 18
Capital Asset Statistics by Function
136