Embed Size (px)
Citation preview

Fiscal Year Ended June 30, 2015
COMPREHENSIVE ANNUAL
FINANCIAL REPORT
A COMPONENT UNIT OF THE STATE OF GEORGIA

Fiscal Year Ended June 30, 2015
Prepared by the Financial Services Division of the Teachers Retirement System of Georgia
A COMPONENT UNIT OF THE STATE OF GEORGIA
COMPREHENSIVE ANNUAL
FINANCIAL REPORT
Jeffrey L. EzellExecutive Director
2
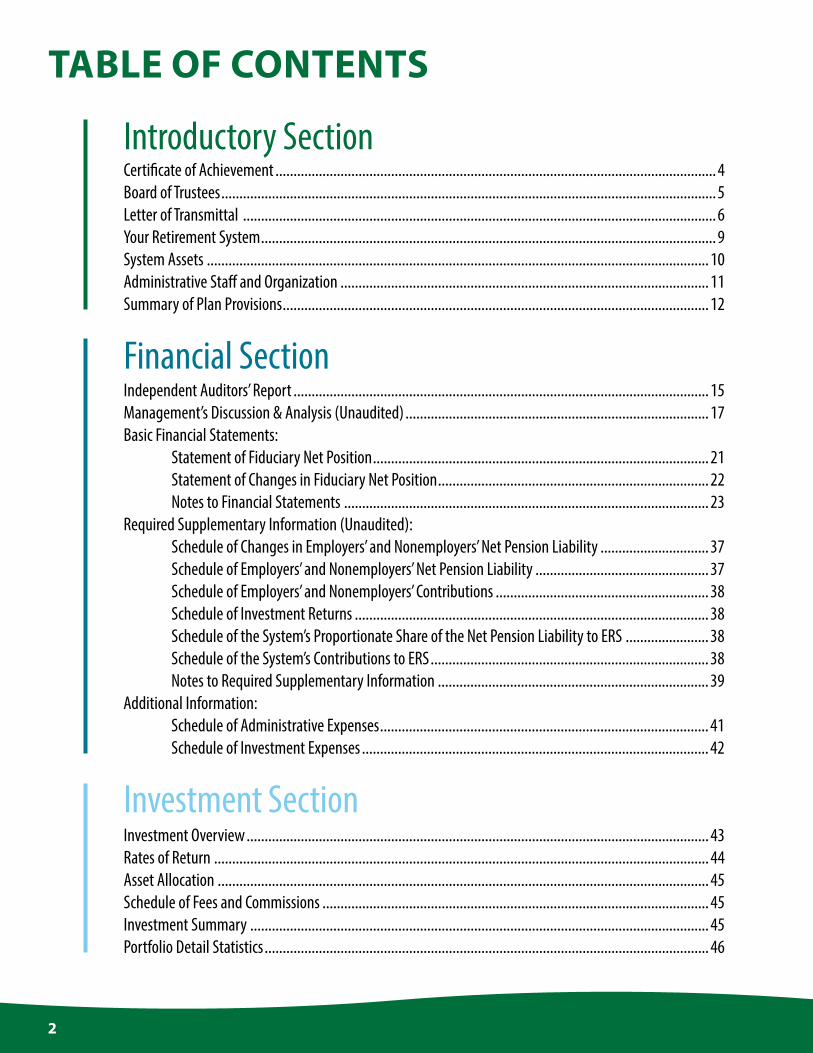
TABLE OF CONTENTS
Introductory SectionCertificate of Achievement .......................................................................................................................... 4Board of Trustees ......................................................................................................................................... 5Letter of Transmittal ................................................................................................................................... 6Your Retirement System .............................................................................................................................. 9System Assets ........................................................................................................................................... 10Administrative Staff and Organization ...................................................................................................... 11Summary of Plan Provisions ...................................................................................................................... 12
Investment SectionInvestment Overview ................................................................................................................................ 43Rates of Return ......................................................................................................................................... 44Asset Allocation ........................................................................................................................................ 45Schedule of Fees and Commissions ........................................................................................................... 45Investment Summary ............................................................................................................................... 45Portfolio Detail Statistics ........................................................................................................................... 46
Financial SectionIndependent Auditors’ Report ................................................................................................................... 15Management’s Discussion & Analysis (Unaudited) .................................................................................... 17Basic Financial Statements: Statement of Fiduciary Net Position ............................................................................................. 21 Statement of Changes in Fiduciary Net Position ........................................................................... 22 Notes to Financial Statements ..................................................................................................... 23Required Supplementary Information (Unaudited): Schedule of Changes in Employers’ and Nonemployers’ Net Pension Liability .............................. 37 Schedule of Employers’ and Nonemployers’ Net Pension Liability ................................................ 37 Schedule of Employers’ and Nonemployers’ Contributions ........................................................... 38 Schedule of Investment Returns .................................................................................................. 38 Schedule of the System’s Proportionate Share of the Net Pension Liability to ERS ....................... 38 Schedule of the System’s Contributions to ERS ............................................................................. 38 Notes to Required Supplementary Information ........................................................................... 39Additional Information: Schedule of Administrative Expenses ........................................................................................... 41 Schedule of Investment Expenses ................................................................................................ 42
3
TABLE OF CONTENTS
Actuarial Section
Statistical Section
Actuary’s Certification Letter ..................................................................................................................... 47Summary of Actuarial Assumptions and Methods: ................................................................................... 49 Service Retirement ...................................................................................................................... 51 Separation Before Service Retirement ......................................................................................... 51Actuarial Valuation Data: .......................................................................................................................... 52 Active Members ........................................................................................................................... 52 Retirees and Beneficiaries ............................................................................................................ 52 Solvency Test ............................................................................................................................... 53 Member & Employer Contribution Rates ...................................................................................... 53 Schedule of Funding Progress ...................................................................................................... 54 Analysis of Financial Experience ................................................................................................... 55
Statistical Section Overview ...................................................................................................................... 56Financial Trends: ....................................................................................................................................... 56 Additions by Source ..................................................................................................................... 56 Deductions by Type ...................................................................................................................... 57 Changes in Fiduciary Net Position ................................................................................................ 57Operating Information: ............................................................................................................................. 58 Benefit Payment Statistics ........................................................................................................... 58 Member Withdrawal Statistics .................................................................................................... 59 Average Monthly Benefit Payments for New Retirees .................................................................. 60 Retired Members by Type of Benefit ............................................................................................ 61 Retirement Payments by County of Residence ............................................................................. 62 Principal Participating Employers ................................................................................................ 64 Reporting Entities ........................................................................................................................ 65

4 Introductory Section
CERTIFICATE OF ACHIEVEMENT
Certificate of
Presented to
Teachers Retirement System
For its Comprehensive Annual
June 30, 2013
Executive Director/CEO
Financial Reportfor the Fiscal Year Ended
Reportingin Financial
for ExcellenceAchievement
Text38: of Georgia
Government Finance Officers Association
June 30, 2014

5Introductory Section
as of December 1, 2015BOARD OF TRUSTEES
* Investment Committee Member
Ms. Jennifer W. FrischClassroom Teacher
Appointed by the GovernorTerm Expires 6/30/17
Mr. Steven N. McCoy*State Treasurer
Ex-Officio
Mr. Greg S. Griffin*State Auditor
Ex-Officio
Mr. Thomas W. Norwood*VICE-CHAIR
Investment ProfessionalElected by the Board of Trustees
Term Expires 6/30/17
Mr. J. Alvin Wilbanks*CHAIR
School AdministratorAppointed by the Governor
Term Expires 6/30/16
Ms. Marion R. FedrickTRS Member
Appointed by the Board of Regents
Term Expires 6/30/18
Ms. Deborah K. Simonds*Retired Teacher
Elected by the Board of TrusteesTerm Expires 6/30/18
Dr. Wanda G. Creel*TRS Member
Appointed by the GovernorTerm Expires 6/30/18
Dr. William G. Sloan, Jr.Member-at-Large
Appointed by the GovernorTerm Expires 6/30/17
Mr. Christopher M. SwansonClassroom Teacher
Appointed by the GovernorTerm Expires 3/31/18
6 Introductory Section
LETTER OF TRANSMITTAL
Teachers Retirement System of Georgia
Jeffrey L. EzellExecutive Director
I am pleased to present the Comprehensive Annual Financial Report of the Teachers Retirement System of Georgia (the System) for the fiscal year ended June 30, 2015. Responsibility for both the accuracy of the data, and completeness and fairness of the presentation, including all disclosures, rests with the management of the System. To the best of our knowledge and belief, the enclosed data is accurate in all material respects and is reported in a manner designed to present fairly the financial position and results of operations of the System. I trust that you will find this report helpful in understanding your retirement system.
Certificate of Achievement
The Government Finance Officers Association of the United States and Canada (GFOA) awarded a Certificate of Achievement for Excellence in Financial Reporting to the Teachers Retirement System of Georgia for its Comprehensive Annual Financial Report for the fiscal year ended June 30, 2014. This was the 27th consecutive year that the System has achieved this prestigious award. In order to be awarded a Certificate of Achievement, a government unit must publish an easily readable and
efficiently organized Comprehensive Annual Financial Report. This report must satisfy both generally accepted accounting principles and applicable legal requirements. A Certificate of Achievement is valid for a period of one year only. We believe our current Comprehensive Annual Financial Report continues to meet the Certificate of Achievement Program’s requirements, and we are submitting it to the GFOA to determine its eligibility for another certificate.
History and Overview
The System was created in 1943, by an act of the Georgia General Assembly to provide retirement security to those individuals who choose to dedicate their lives to educating the children of the State of Georgia, and began operations in 1945. A summary of the System’s provisions is provided on pages 12-14 of this report. The System is governed by a ten-member Board of Trustees which appoints the Executive Director who is responsible for the administration and operations of the System, which serves more than 420,000 active and retired members, and 300 employers.
December 11, 2015Board of TrusteesTeachers Retirement System of GeorgiaAtlanta, Georgia
7Introductory Section
continuedLETTER OF TRANSMITTAL
Financial Information
The management of the System is charged with the responsibility of maintaining a sound system of internal accounting controls. The objectives of such a system are to provide management with reasonable assurance that assets are safeguarded against loss from unauthorized use or disposition, that transactions are executed in accordance with management’s authorizations, and that they are recorded properly to permit the preparation of financial statements in accordance with generally accepted accounting principles. Even though there are inherent limitations in any system of internal control, the management of the System makes every effort to ensure that through systematic reporting and internal reviews, errors or fraud would be quickly detected and corrected. Please refer to Management’s Discussion and Analysis starting on page 17 of this report for an overview of the financial status of the System, including a summary of the System’s Fiduciary Net Position, Changes in Fiduciary Net Position, and Asset Allocations.
INVESTMENTS — The System has continued to invest in a mix of high quality bonds and stocks as it historically has done. These types of investments have allowed the System to participate in rising markets, while moderating the risks on the downside. New funds continue to be invested in high quality securities. A high quality balanced fund has proven to be a successful strategy in a variety of markets over a long period of time. As in previous years, maintaining quality was a primary goal and was successfully met. “Conservation of Capital” and “Conservatism” continues to be the principal guides in investment decisions. The System continued to use a diversified portfolio to accomplish these objectives.
FUNDING — The System’s funding policy provides for employee and employer contributions at rates, expressed as a percentage of annual covered payroll, that are sufficient to provide resources to pay benefits when due. A useful indicator of the funded status of a retirement
system is the relationship between the actuarial value of assets and the actuarial accrued liabilities. The System continues to remain strong as evidenced by the ratio of the actuarial value of assets to the actuarial accrued liabilities. This ratio was 81.9% for the fiscal year ended June 30, 2014. The ultimate test of the financial soundness of a retirement system is its ability to pay all promised benefits when due. I am proud to say that through the continued wisdom and the support of Governor Nathan Deal and the Georgia General Assembly, the System has been and will continue to be funded on an actuarially sound basis, thus providing the membership the comfort and security they expect from their retirement system.
Initiatives We continuously look for ways to improve our customer service and maintain a secure and stable System for our customers. Throughout the year, we solicit feedback from our members and take those suggestions and comments into consideration when making our processes, technology and services offered more effective and efficient. To enhance the online retirement application process, we implemented the electronic reporting of the Retirement Certification Report, Sick Leave Certification, and Return to Work Agreement forms. All of these forms are now automated and immediately populate in the employers online account upon completion. The refund process was also automated and will ensure that members receive their payments in a timely manner. To engage and keep our members informed, we individually counseled over 7,400 members and retirees at our office and around the State. Through our 321 outreach events, including meetings, benefit fairs, and workshops, we reached over 26,000 members and retirees. We conducted 6 half-day seminars for over 770 members, with speakers from the System, the Social Security Administration, the Department of Community Health, and financial/estate planning experts. We also presented 7 employer training
8 Introductory Section
LETTER OF TRANSMITTALseminars to 230 human resources personnel from 141 reporting employers. The Executive Director and Controller continued their participation in the State’s Governmental Accounting Standards Board (GASB) implementation teams to monitor, review, and implement the new GASB statements on pension accounting and financial reporting standards for public pension plans to determine the effects on the State of Georgia. GASB statement numbers 67 and 68 were both implemented without any major issues affecting audit deadlines. Also, detailed information including journal entries was prepared for every employer to assist them in their implementation of GASB 68.
Other Information
INDEPENDENT AUDIT — The Board of Trustees requires an annual audit of the financial statements of the System by independent, certified public accountants. The accounting firm of KPMG LLP was selected by the Board. The independent auditors’ report on the statements of plan fiduciary net position and the related statements of changes in plan fiduciary net position is included in the Financial Section of this report.
ACKNOWLEDGMENTS — The compilation of this report reflects the combined effort of the staff under the leadership of the Board of Trustees. It is intended to provide complete and reliable information as a basis for making management decisions, as a means of determining compliance with legal provisions, and as a means for determining responsible stewardship of the assets contributed by the System’s members, their employers, and the State of Georgia. Copies of this report can be obtained by contacting the System, or may be downloaded from the System’s website. I would like to take this opportunity to express my gratitude to Governor Nathan Deal, members of the Georgia General Assembly, the staff, the advisors, and to the many people who have worked so diligently to ensure the successful operation of the System.
Sincerely,
Jeffrey L. EzellExecutive Director
continued

9Introductory Section
YOUR RETIREMENT SYSTEM
Statistical Highlights2.07.84.61.5
+_ + +
Financial Highlights
June 30,
Member Contributions Employer and Nonemployer Contributions Interest and Dividend Income Benefits Paid to Retired Members Member Withdrawals Interest Credited to Member Contributions
Active Membership Members Leaving the System Retired Members Average Monthly Benefit
3.4
10.7
7.7
6.2
8.0
4.2
209,8558,687
108,100$ 2,902
640,120,000
1,270,963,000
1,347,317,000
3,764,452,000
87,095,000
294,707,000
$
$
$
$
$
$
661,835,000
1,406,706,000
1,450,750,000
3,996,879,000
80,085,000
307,113,000
214,0158,011
113,066$ 2,946
$
$
$
$
$
$
++++_
+
% Change2015 2014
10 Introductory Section
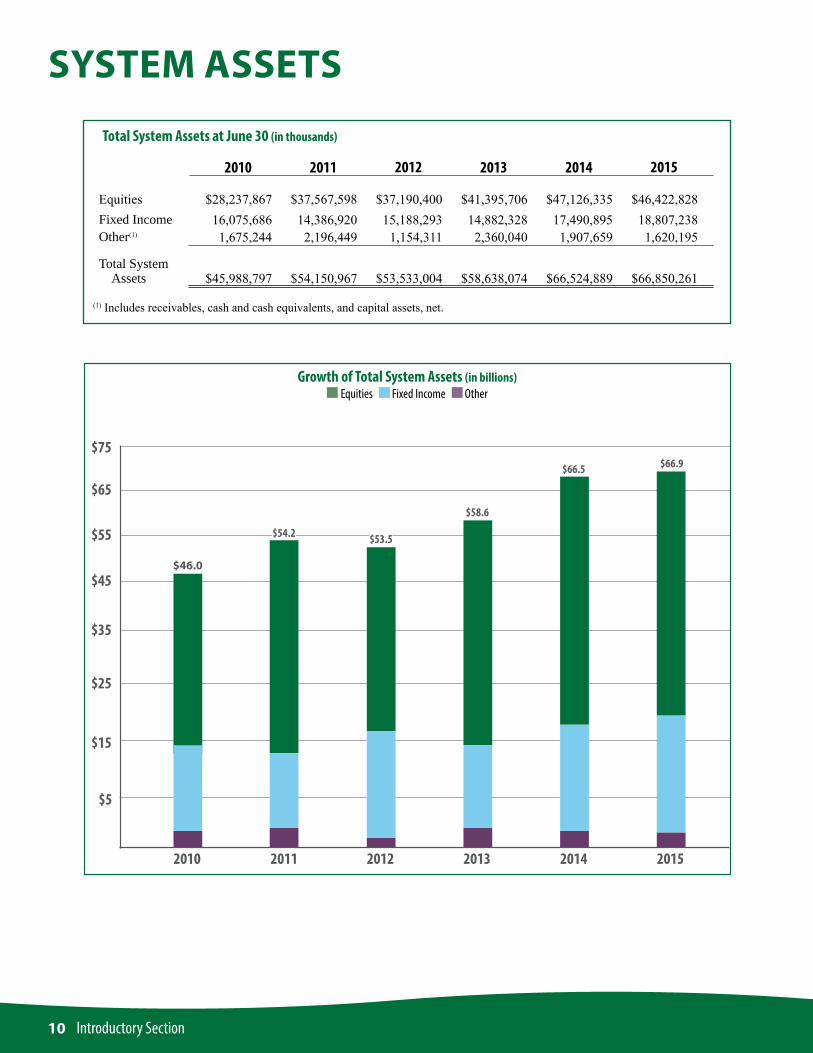
SYSTEM ASSETS
2014 20152010 2011 2012
$47,126,33517,490,8951,907,659
$66,524,889
$46,422,82818,807,2381,620,195
$66,850,261
$28,237,86716,075,6861,675,244
$45,988,797
$37,567,59814,386,9202,196,449
$54,150,967
Total System Assets at June 30 (in thousands)
2013
$41,395,70614,882,3282,360,040
$58,638,074
Equities Fixed Income Other(1)
Total System Assets
(1) Includes receivables, cash and cash equivalents, and capital assets, net.
$37,190,40015,188,293
1,154,311
$53,533,004
Growth of Total System Assets (in billions) Equities Fixed Income Other
$5
$15
$25
20152010 2011 2012 2013
$35
$45
$55
$65
2014
$66.9
$58.6
$46.0
$54.2 $53.5
$66.5
$75

11Introductory Section
ADMINISTRATIVE STAFF & ORGANIZATION
Jeffrey L. EzellExecutive Director
Stephen J. BoyersChief Financial Officer
Dina N. JonesDirector
Member Services
Laura L. LanierController
Financial Services
Lisa M. HajjDirector
Communications
R. Cory BuiceDirector
Retirement Services
Charles W. Cary, Jr.Chief Investment Officer
Investment Services
J. Gregory McQueenDirector
Information Technology
Tonia T. MorrisDirector
Human Resources
K. Paige DonaldsonDirector
Employer Services andContact Management
Investment Advisors*Albritton Capital ManagementBaillie Gifford Overseas LimitedBarrow, Hanley, Mewhinney & StraussCooke & BielerDenver Investment AdvisorsFisher Investments Mondrian Investment Partners LimitedSands Capital Management
* See page 45 in the Investment Section for a summary of fees paid to Investment Advisors.
Consulting ServicesActuaryCavanaugh Macdonald Consulting, LLC
AuditorKPMG LLP
Medical AdvisorsGordon J. Azar, M.D. Atlanta, GeorgiaWilliam Biggers, M.D. Atlanta, GeorgiaMarvin Bittinger, M.D. Gainesville, GeorgiaPedro Garcia, M.D. Atlanta, GeorgiaHarold Sours, M.D. Atlanta, GeorgiaJoseph W. Stubbs, M.D. Albany, Georgia
12 Introductory Section
SUMMARY OF PLAN PROVISIONSPurpose
The Teachers Retirement System of Georgia (the System) was established in 1943, by an act of the Georgia General Assembly for the purpose of providing retirement allowances and other benefits for teachers of this state, and began operations in 1945. The System has the power and privileges of a corporation, and the right to bring and defend actions.
The major objectives of the System are (1) to pay monthly benefits due to retirees accurately and in a timely manner, (2) to soundly invest retirement funds to insure adequate financing for future benefits due and for other obligations of the System, (3) to accurately account for the status and contributions of all active and inactive members, (4) to provide statewide educational and counseling services for System members, and (5) to process refunds due terminated members.
Administration
State statutes provide that the administration of the System be vested in a ten-member Board of Trustees comprised as follows:Ex-officio members:
• the State Auditor• the State Treasurer
Governor’s appointees:• two active members of the System who are classroom
teachers and not employees of the Board of Regents• one active member of the System who is a public school
administrator• one active member of the System who is not an employee
of the Board of Regents• one member-at-large
Board of Regents appointee:• one active member of the System who is an employee
of the Board of RegentsTrustee appointees:
• one member who has retired under the System • one individual who is a citizen of the state, not a member
of the System and experienced in the investment of money
A complete listing of the current Board of Trustees is included on page 5 of this report.
Management of the System is the responsibility of the Executive Director who is appointed by the Board and serves at its pleasure. On behalf of the Board, the Executive
Director is responsible for the proper operation of the System, engaging such actuarial and other services as shall be necessary to transact business, and paying expenses necessary for operations. A listing of the administrative staff is included on page 11 of this report.
Membership
All personnel employed in a permanent status position, and not less than one-half time, with local boards of education, charter schools, universities and colleges, technical colleges, Board of Regents, county and regional libraries, RESA’s, and certain State of Georgia agencies are required to be members as a condition of employment. Exceptions to TRS membership include employees required to participate in another Georgia retirement plan or employees who may elect the Board of Regents Optional Retirement Plan in lieu of TRS membership.
Eligibility
Service RetirementActive members may retire and elect to receive monthly
retirement benefits after one of the following conditions: 1) completion of 10 years of creditable service and attainment of age 60, or 2) completion of 25 years of creditable service.
Disability RetirementMembers are eligible to apply for monthly retirement
benefits under the disability provision of the law if they are an active member, have at least 10 years of creditable service, and are permanently disabled.
13Introductory Section
continuedSUMMARY OF PLAN PROVISIONS
The Formula
Normal RetirementAny member who has at least 30 years of creditable
service or who has at least 10 years of creditable service and has attained age 60 will receive a benefit calculated by using the percentage of salary formula. Simply stated, two percent (2%) is multiplied by the member’s years of creditable service established with the System, including partial years (not to exceed 40 years). The product is then multiplied by the average monthly salary for the two highest consecutive membership years of service. The resulting product is the monthly retirement benefit under the maximum plan of retirement.
Early RetirementAny member who has not reached the age of 60 and has
between 25 and 30 years of creditable service will receive a reduced benefit. The benefit will be calculated using the percentage of salary formula explained above. It will then be reduced by the lesser of 1/12 of 7% for each month the member is below age 60, or 7% for each year or fraction thereof the member has less than 30 years of creditable service. The resulting product is the monthly retirement benefit under the maximum plan of retirement.
Disability RetirementDisability retirement benefits are also calculated using the
percentage of salary formula explained above. The resulting product is the monthly disability retirement benefit under the maximum plan. You must have at least 10 years of creditable service to qualify, however, there is no age requirement for disability retirement.
Plan A - Maximum Plan of Retirement
This plan produces the largest possible monthly benefit payable to the member only during his or her lifetime. There are no survivorship benefits under this plan.
Plan B - Optional Plans of Retirement
Upon retirement, a member of the System may elect one of six optional plans that provide survivorship benefits. The election of an optional form of payment is made upon application for retirement and it becomes irrevocable upon distribution of the first benefit check. The six options are as follows:
Option 1The retiring member accepts a relatively small reduction
from the maximum monthly benefit in order to guarantee to the estate, beneficiary or beneficiaries named on the retirement application, a lump-sum refund of any remaining portion of member contributions and interest.
Option 2This plan offers the retiring member a reduced monthly
benefit, based on the ages of the member and the beneficiary, payable for life. It further provides a guarantee to the surviving named beneficiary that, at the death of the retired member, the beneficiary will receive the same basic monthly retirement allowance the member received at the date of retirement plus any cost-of-living increases the member received up to the time of death.
Option 2 Pop-UpAny member may elect a reduced retirement allowance
to be designated “Option 2 Pop-Up” with the provision that if the beneficiary dies prior to the retiree that the basic benefit payable to the retiree shall increase to an amount the retiree would have received under Plan A - Maximum Plan.
Option 3This plan of retirement offers a reduced monthly benefit
that is based on the ages of the member and the beneficiary. The resulting benefit is paid to the retired member for life, with the guarantee to the surviving named beneficiary that at the time of the retired member’s death, the beneficiary will receive a payment for life of one-half of the initial monthly benefit received by the member at the time of retirement plus one-half of any cost-of-living increases the member received up to the time of death.
Option 3 Pop-UpAny member may elect a reduced retirement allowance
to be designated “Option 3 Pop-Up” with the provision that if the beneficiary dies prior to the retiree, the basic benefit payable to the retiree shall increase to the amount the retiree would have received under Plan A - Maximum Plan.
14 Introductory Section
SUMMARY OF PLAN PROVISIONSOption 4
This option offers a reduced monthly lifetime benefit in exchange for the flexibility to designate a specific dollar amount or percentage of your monthly benefit to be paid to your beneficiary after your death. The beneficiary benefits you specify under this plan cannot cause your monthly benefit to be reduced below 50% of the maximum benefit available to you. If multiple beneficiaries predecease you, the dollar amounts for the percentages are not adjusted. Beneficiaries also receive a prorated share of any cost-of-living increases you received up to the date of death.
Partial Lump-Sum Option Plan
TRS offers a Partial Lump-Sum Option Plan (PLOP) at retirement. In exchange for a permanently reduced lifetime benefit, a member may elect to receive a lump-sum distribution in addition to a monthly retirement benefit. The age of the member and plan of retirement are used to determine the reduction in the benefit.
A member is eligible to participate in the Partial Lump-Sum Option Plan if he or she meets the following criteria. A member must:
• have 30 years of creditable service or 10 years of creditable service and attain age 60 (not early retirement).
• not retire with disability benefits.
At retirement, a member may elect a lump-sum distribution in an amount between 1 and 36 months of his or her normal monthly retirement benefit. This amount will be calculated under Plan A - Maximum Plan of Retirement and will be rounded up or down to be a multiple of $1,000. If a PLOP distribution is elected, the monthly benefit is actuarially reduced to reflect the value of the PLOP distribution. The combination of both the PLOP distribution and the reduced benefit are the same actuarial value as the unreduced normal benefit alone.
Financing the System
The funds to finance the System come from member contributions, 6.00% of annual salary; employer contributions, 13.15% of annual salary; and investment income.
continued
INDEPENDENT AUDITORS’ REPORT
15Financial Section
KPMG LLPSuite 2000, 303 Peachtree Street, NEAtlanta, GA 30308www.kpmg.com
Report on the Financial Statements
We have audited the accompanying financial statements of the Teachers Retirement System of Georgia (the System), a component unit of the State of Georgia, as of and for the year ended June 30, 2015, and the related notes to the financial statements, which collectively comprise the System’s basic financial statements as listed in the table of contents.
Management’s Responsibility for the Financial Statements Management is responsible for the preparation and fair presentation of these financial statements in accordance with U.S. generally accepted accounting principles; this includes the design, implementation, and maintenance of internal control relevant to the preparation and fair presentation of financial statements that are free from material misstatement, whether due to fraud or error.
Auditors’ Responsibility Our responsibility is to express an opinion on these financial statements based on our audit. We conducted our audit in accordance with auditing standards generally accepted in the United States of America and the standards applicable to financial audits contained in Government Auditing Standards, issued by the Comptroller General of the United States. Those standards require that we plan and perform the audit to obtain reasonable assurance about whether the financial statements are free from material misstatement.
An audit involves performing procedures to obtain audit evidence about the amounts and disclosures in the financial statements. The procedures selected depend on the auditors’ judgment, including the assessment of the risks of material misstatement of the financial statements, whether due to fraud or error. In making those risk assessments, the auditor considers internal control relevant to the entity’s preparation and fair presentation of the financial statements in order to design audit procedures that are appropriate in the circumstances, but not for the purpose of expressing an opinion on the effectiveness of the entity’s internal control. Accordingly, we express no such opinion.
An audit also includes evaluating the appropriateness of accounting policies used and the reasonableness of significant accounting estimates made by management, as well as evaluating the overall presentation of the financial statements.
We believe that the audit evidence we have obtained is sufficient and appropriate to provide a basis for our audit opinion.
Opinion In our opinion, the financial statements referred to above present fairly, in all material respects, the fiduciary net position of the System as of June 30, 2015, and the changes in fiduciary net position for the year then ended in accordance with U.S. generally accepted accounting principles.
Emphasis of Matter As discussed in note 2 to the basic financial statements, the System adopted, in 2015, Governmental Accounting Standards Board Statement No. 68, Accounting and Financial Reporting for Pensions, an amendment of GASB Statement No. 27 and Governmental Accounting Standards Board Statement No. 71, Pension Transition for Contributions made Subsequent to the Measurement Date. Our opinion is not modified with respect to this matter.
Other MattersRequired Supplementary Information U.S. generally accepted accounting principles require that the management’s discussion and analysis, schedule of changes in employers’ and nonemployers’ net pension liability, schedule of employers’ and nonemployers’ net pension liability, schedule of employer’s and nonemployer’s contributions, schedule of investment returns, schedule of the System’s proportionate share of the net pension liability to ERS, and schedule of the System’s contributions to ERS on pages 17-20 and 37-38 be presented to supplement the basic financial statements. Such information, although not a part of the basic financial statements, is required by the Governmental Accounting Standards Board who considers
16 Financial Section
INDEPENDENT AUDITORS’ REPORTit to be an essential part of financial reporting for placing the basic financial statements in an appropriate operational, economic, or historical context. We have applied certain limited procedures to the required supplementary information in accordance with auditing standards generally accepted in the United States of America, which consisted of inquiries of management about the methods of preparing the information and comparing the information for consistency with management’s responses to our inquiries, the basic financial statements, and other knowledge we obtained during our audit of the basic financial statements. We do not express an opinion or provide any assurance on the information because the limited procedures do not provide us with sufficient evidence to express an opinion or provide any assurance.
Supplementary and Other Information Our audit was conducted for the purpose of forming an opinion on the financial statements that collectively comprise the System’s basic financial statements. The schedules of administrative expenses and investment expenses, and introductory, investment, actuarial, and statistical sections are presented for purposes of additional analysis and are not a required part of the basic financial statements.
The schedules of administrative expenses and investment expenses are the responsibility of management and were derived from and relate directly to the underlying accounting and other records used to prepare the basic financial statements. Such information has been subjected to the auditing procedures applied in the audit of the basic financial statements and certain additional procedures, including comparing and reconciling such information directly to the underlying accounting and other records used to prepare the basic financial statements or to the basic financial statements themselves, and other additional procedures in accordance with auditing standards generally accepted in the United States of America. In our opinion, the schedules of administrative expenses and investment expenses are fairly stated in all material respects in relation to the basic financial statements as a whole.
The introductory, investment, actuarial, and statistical sections have not been subjected to the auditing procedures applied in the audit of the basic financial statements, and accordingly, we do not express an opinion or provide an assurance on them.
Other Reporting Required by Government Auditing Standards In accordance with Government Auditing Standards, we have also issued our report dated September 29, 2015 on our consideration of the System’s internal control over financial reporting and on our tests of its compliance with certain provisions of laws, regulations, contracts, and grant agreements and other matters. The purpose of that report is to describe the scope of our testing of internal control over financial reporting and compliance and the results of that testing, and not to provide an opinion on internal control over financial reporting or on compliance. That report is an integral part of an audit performed in accordance with Government Auditing Standards in considering the System’s internal control over financial reporting and compliance.
December 11, 2015
continued
17Financial Section
(Unaudited)MANAGEMENT’S DISCUSSION & ANALYSIS
This section provides a discussion and analysis of the financial performance of the Teachers Retirement System of Georgia (the System) for the year ended June 30, 2015. The discussion and analysis of the System’s financial performance is within the context of the accompanying financial statements and disclosures following this section.Financial Highlights The following highlights are discussed in more detail later in this analysis:
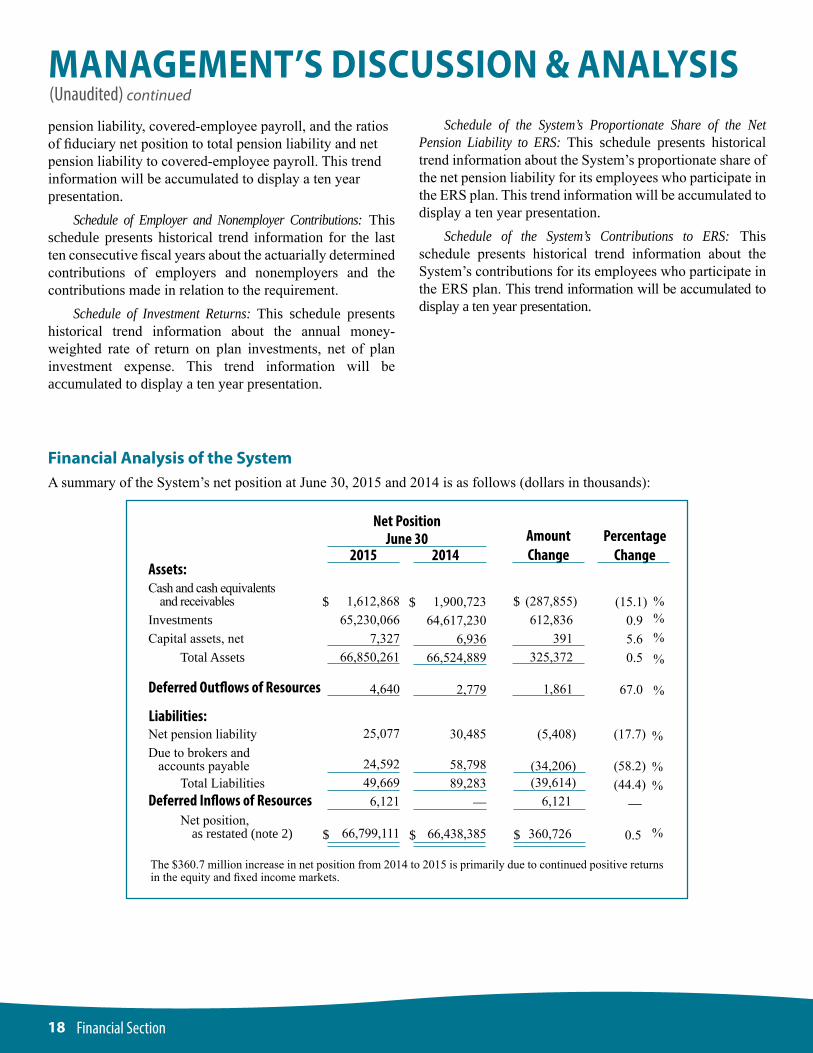
• At June 30, 2015, the System’s assets exceeded its liabilities by $66.8 billion (reported as net position) as compared to the net position of $66.4 billion (as restated) at June 30, 2014, representing an increase of $360.7 million.
• Contributions from members increased by $21.7 million or 3.4% from $640.1 million in 2014 to $661.8 million in 2015. Contributions by employers increased by $135 million or 10.7% from $1.26 billion in 2014 to $1.40 billion in 2015. The change in member contributions is due to an increase in the membership base, while the increase in employer contributions reflects increases in both the membership base and the employer contribution rate.
• Pension benefits paid to retirees and beneficiaries for the years ended June 30, 2015 and 2014 were $4.0 billion and $3.8 billion, representing an increase of 6.2%. This is due to an increase in the number of retirees and beneficiaries receiving benefit payments and postretirement benefit adjustments.
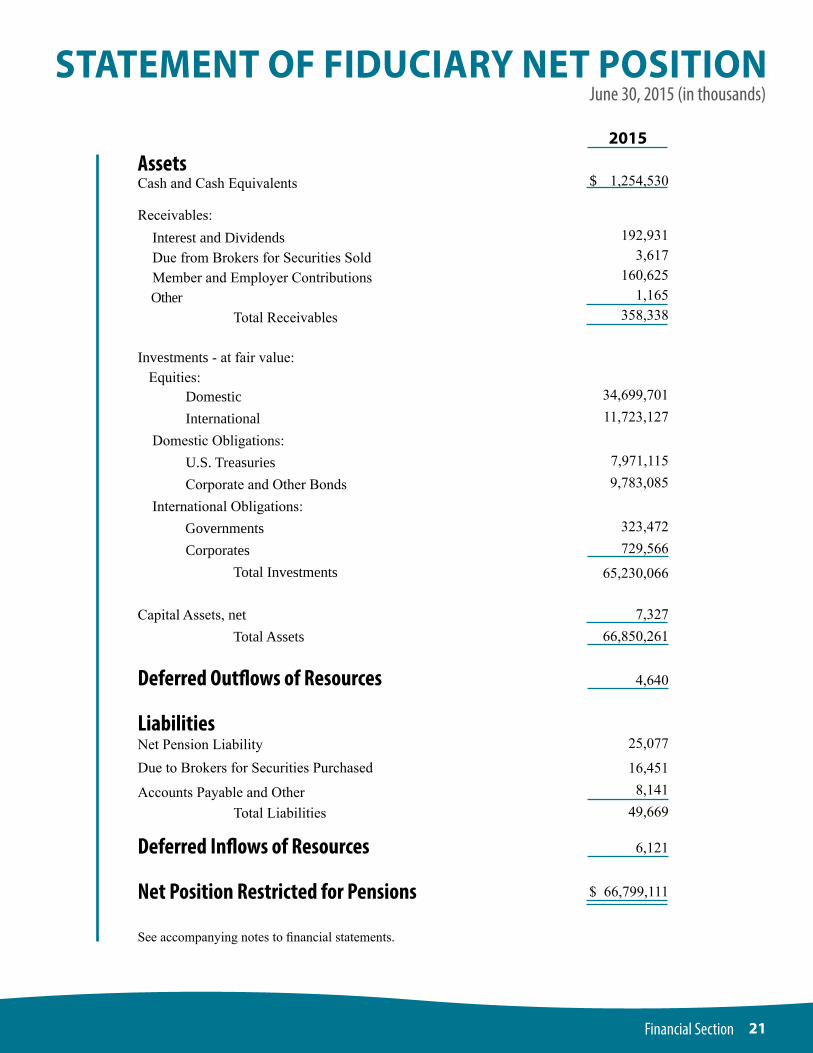
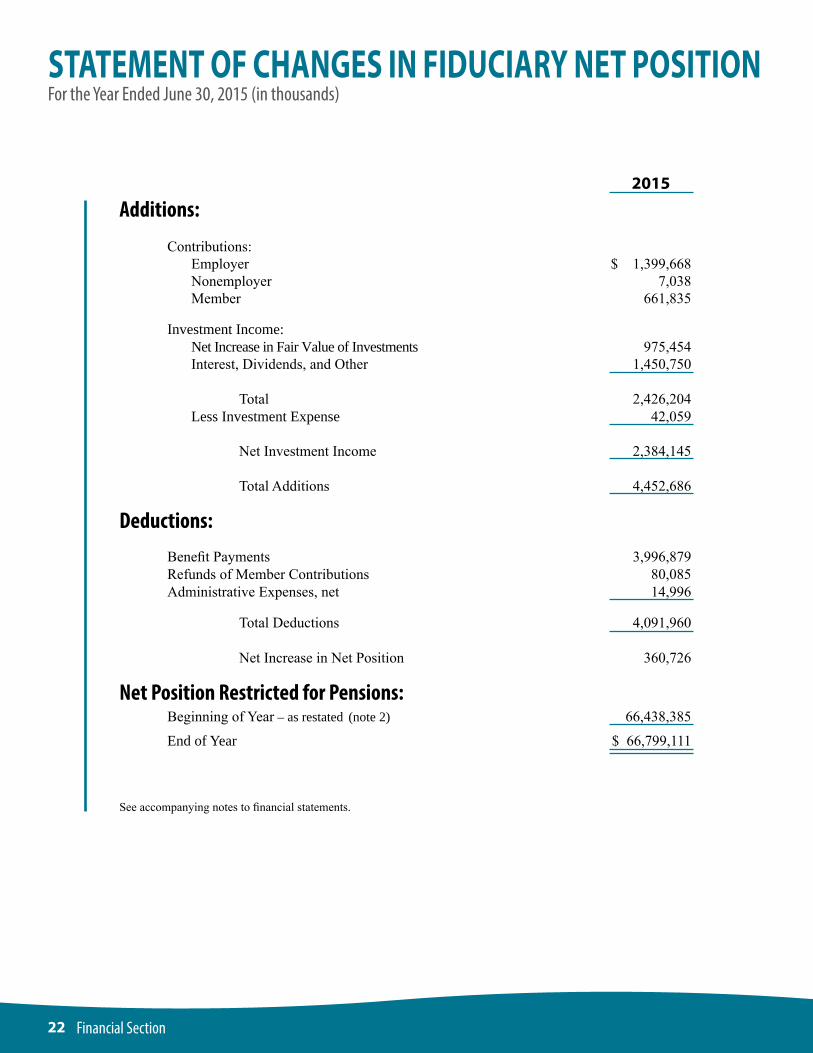
Overview of the Financial Statements The basic financial statements include (1) the statement of fiduciary net position, (2) the statement of changes in fiduciary net position, and (3) notes to the financial statements. The System also includes in this report additional information to supplement the financial statements. The System prepares its financial statements on an accrual basis in accordance with U.S. generally accepted accounting principles promulgated by the Governmental Accounting Standards Board (GASB). These statements provide information about the System’s overall financial status. In addition, the System presents six required supplementary information schedules which provide historical trend information about the plan. Four of these schedules are presented from the perspective of the System reporting as the plan and include (1) a schedule of changes in employers’ and nonemployers’ net pension liability; (2)
a schedule of employers’ and nonemployers’ net pension liability; (3) a schedule of employer and nonemployer contributions; and (4) a schedule of investment returns. Two schedules are presented from the perspective of the System reporting as the employer for its employees who are participants in the Employees’ Retirement System of Georgia (ERS) and include (1) a schedule of the System’s proportionate share of the net pension liability to ERS; and (2) a schedule of the System’s contributions to ERS.The Statement of Fiduciary Net Position The Statement of Fiduciary Net Position presents information that includes all of the System’s assets and liabilities, with the balance reported as and representing the Net Position Restricted for Pensions. The investments of the System in this statement are presented at fair value. This statement is presented on page 21.The Statement of Changes in Fiduciary Net Position The Statement of Changes in Fiduciary Net Position reports how the System’s net position changed during the fiscal year. The additions and the deductions to net position are summarized in this statement. The additions include contributions and investment income, which includes the net increase (decrease) in the fair value of investments. The deductions include benefit payments, refunds of member contributions, and administrative expenses. This statement is presented on page 22.Notes to the Financial Statements The accompanying notes to the financial statements provide information essential to a full understanding of the System’s financial statements. The notes to the financial statements begin on page 23 of this report.Required Supplementary Information A brief explanation of the six required schedules found beginning on page 37 of this report follows: Schedule of Changes in Employers’ and Nonemployers’ Net Pension Liability: This schedule presents historical trend information about the changes in the net pension liability and includes the beginning and ending balances of the total pension liability and the plan’s fiduciary net position, the net pension liability, and the effects of certain changes on those items. This trend information will be accumulated to display a ten year presentation. Schedule of Employers’ and Nonemployers’ Net Pension Liability: This schedule presents historical trend information about the net pension liability and includes total pension liability, the plan’s fiduciary net position, net
18 Financial Section
MANAGEMENT’S DISCUSSION & ANALYSIS(Unaudited) continued
Financial Analysis of the SystemA summary of the System’s net position at June 30, 2015 and 2014 is as follows (dollars in thousands):
pension liability, covered-employee payroll, and the ratios of fiduciary net position to total pension liability and net pension liability to covered-employee payroll. This trend information will be accumulated to display a ten year presentation. Schedule of Employer and Nonemployer Contributions: This schedule presents historical trend information for the last ten consecutive fiscal years about the actuarially determined contributions of employers and nonemployers and the contributions made in relation to the requirement. Schedule of Investment Returns: This schedule presents historical trend information about the annual money-weighted rate of return on plan investments, net of plan investment expense. This trend information will be accumulated to display a ten year presentation.
Schedule of the System’s Proportionate Share of the Net Pension Liability to ERS: This schedule presents historical trend information about the System’s proportionate share of the net pension liability for its employees who participate in the ERS plan. This trend information will be accumulated to display a ten year presentation. Schedule of the System’s Contributions to ERS: This schedule presents historical trend information about the System’s contributions for its employees who participate in the ERS plan. This trend information will be accumulated to display a ten year presentation.
The $360.7 million increase in net position from 2014 to 2015 is primarily due to continued positive returns in the equity and fixed income markets.
Net Position June 30
Assets:
Liabilities:Net pension liabilityDue to brokers and accounts payable
Net position, as restated (note 2)
Cash and cash equivalents and receivables InvestmentsCapital assets, net
Total Assets
1,612,86865,230,066
7,32766,850,261
4,640
$ %%%%
%
$
(287,855) 612,836 391 325,372
1,861
25,077
24,59249,6696,121
66,799,111
Deferred Outflows of Resources
Total LiabilitiesDeferred Inflows of Resources
1,900,72364,617,230
6,93666,524,889
2,779
$
$
30,485
58,79889,283
—
66,438,385
2015 2014AmountChange
PercentageChange
(5,408)
(34,206) (39,614) 6,121
360,726
(15.1) 0.9 5.6 0.5
67.0
(17.7)
(58.2) (44.4)
—
0.5
%
%%
%
$
$
19Financial Section
(Unaudited) continuedMANAGEMENT’S DISCUSSION & ANALYSIS
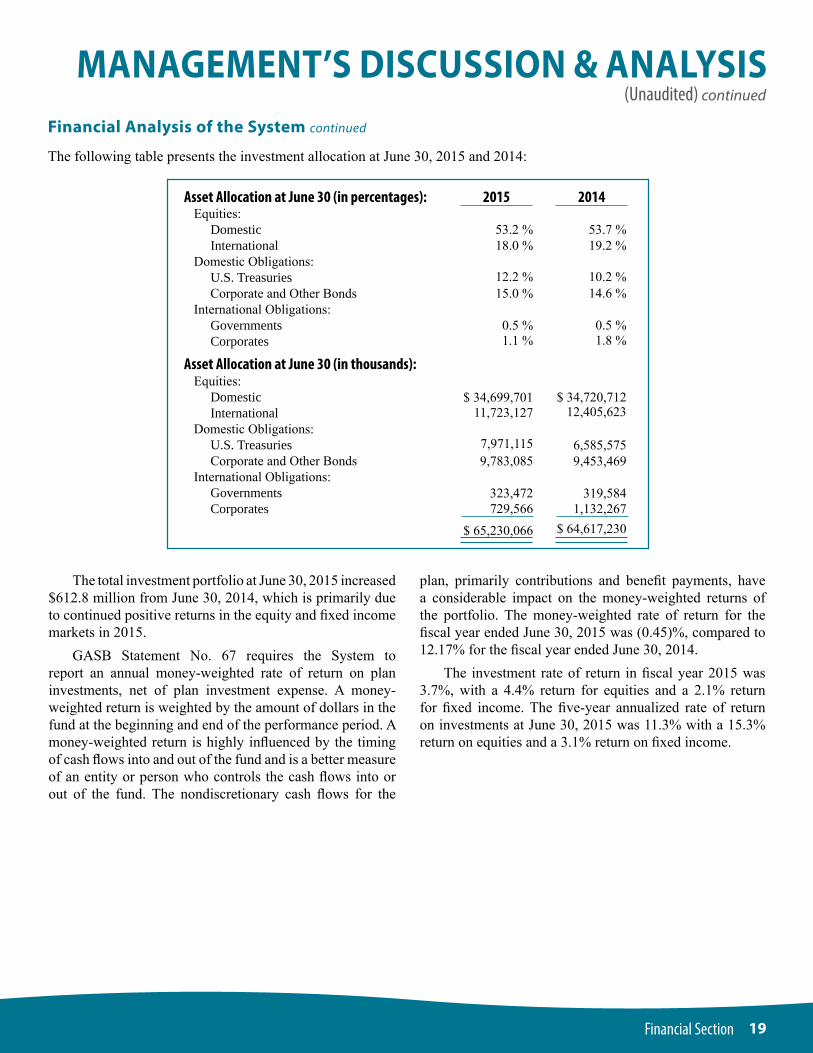
The following table presents the investment allocation at June 30, 2015 and 2014:
The total investment portfolio at June 30, 2015 increased $612.8 million from June 30, 2014, which is primarily due to continued positive returns in the equity and fixed income markets in 2015. GASB Statement No. 67 requires the System to report an annual money-weighted rate of return on plan investments, net of plan investment expense. A money-weighted return is weighted by the amount of dollars in the fund at the beginning and end of the performance period. A money-weighted return is highly influenced by the timing of cash flows into and out of the fund and is a better measure of an entity or person who controls the cash flows into or out of the fund. The nondiscretionary cash flows for the
plan, primarily contributions and benefit payments, have a considerable impact on the money-weighted returns of the portfolio. The money-weighted rate of return for the fiscal year ended June 30, 2015 was (0.45)%, compared to 12.17% for the fiscal year ended June 30, 2014. The investment rate of return in fiscal year 2015 was 3.7%, with a 4.4% return for equities and a 2.1% return for fixed income. The five-year annualized rate of return on investments at June 30, 2015 was 11.3% with a 15.3% return on equities and a 3.1% return on fixed income.
Financial Analysis of the System continued
53.2 %18.0 %
12.2 %15.0 %
0.5 %1.1 %
$ 34,699,701 11,723,127
7,971,1159,783,085
323,472729,566
$ 65,230,066
2015Equities: Domestic InternationalDomestic Obligations: U.S. Treasuries Corporate and Other BondsInternational Obligations: Governments Corporates
Equities: Domestic InternationalDomestic Obligations: U.S. Treasuries Corporate and Other BondsInternational Obligations: Governments Corporates
Asset Allocation at June 30 (in percentages):
Asset Allocation at June 30 (in thousands):
2014
53.7 %19.2 %
10.2 %14.6 %
0.5 %1.8 %
$ 34,720,712 12,405,623
6,585,5759,453,469
319,5841,132,267
$ 64,617,230
20 Financial Section
MANAGEMENT’S DISCUSSION & ANALYSIS(Unaudited) continued
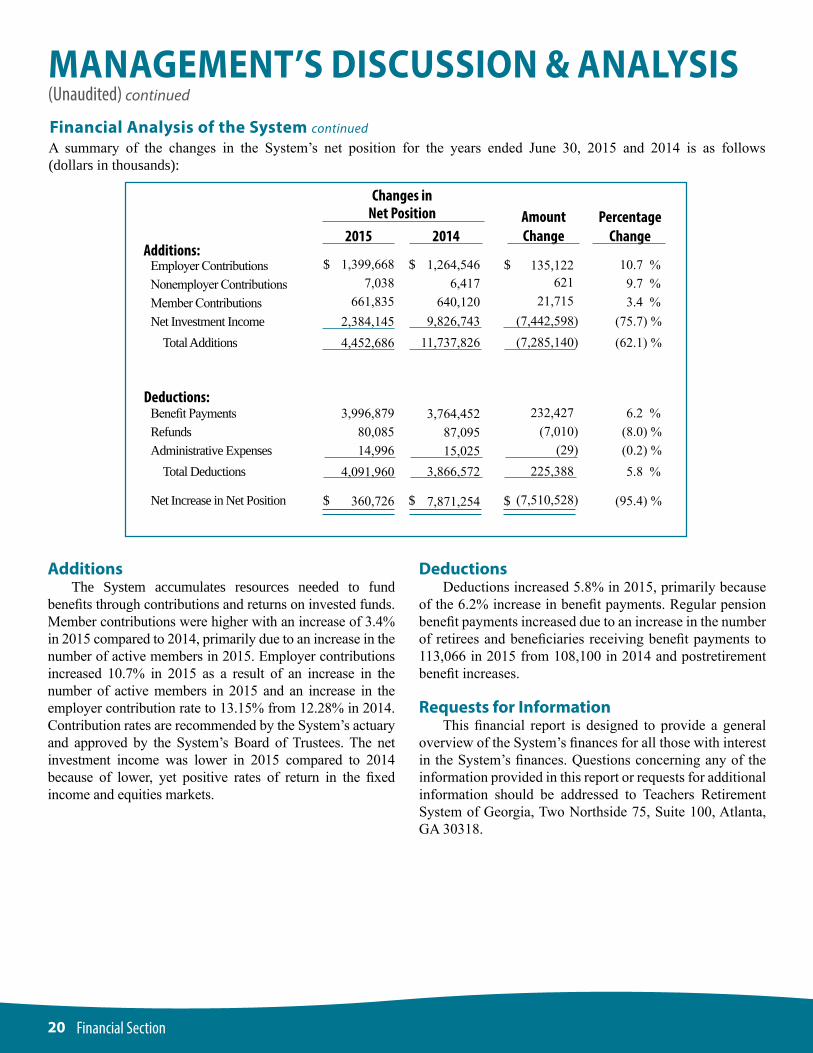
Additions The System accumulates resources needed to fund benefits through contributions and returns on invested funds. Member contributions were higher with an increase of 3.4% in 2015 compared to 2014, primarily due to an increase in the number of active members in 2015. Employer contributions increased 10.7% in 2015 as a result of an increase in the number of active members in 2015 and an increase in the employer contribution rate to 13.15% from 12.28% in 2014. Contribution rates are recommended by the System’s actuary and approved by the System’s Board of Trustees. The net investment income was lower in 2015 compared to 2014 because of lower, yet positive rates of return in the fixed income and equities markets.
Deductions Deductions increased 5.8% in 2015, primarily because of the 6.2% increase in benefit payments. Regular pension benefit payments increased due to an increase in the number of retirees and beneficiaries receiving benefit payments to 113,066 in 2015 from 108,100 in 2014 and postretirement benefit increases.
Requests for Information This financial report is designed to provide a general overview of the System’s finances for all those with interest in the System’s finances. Questions concerning any of the information provided in this report or requests for additional information should be addressed to Teachers Retirement System of Georgia, Two Northside 75, Suite 100, Atlanta, GA 30318.
A summary of the changes in the System’s net position for the years ended June 30, 2015 and 2014 is as follows (dollars in thousands):
Financial Analysis of the System continued
Changes in Net Position
Additions:
Deductions:
Employer ContributionsNonemployer ContributionsMember ContributionsNet Investment Income
2015 2014AmountChange
PercentageChange
Total Additions
Benefit PaymentsRefundsAdministrative Expenses
Total Deductions
Net Increase in Net Position
1,399,6687,038
661,8352,384,1454,452,686
3,996,87980,08514,996
4,091,960
360,726
1,264,5466,417
640,1209,826,743
11,737,826
3,764,45287,09515,025
3,866,572
7,871,254
$
$
$
$
135,122 621 21,715 (7,442,598) (7,285,140)
232,427 (7,010) (29) 225,388
(7,510,528)
$
$
10.7 % 9.7 % 3.4 % (75.7) % (62.1) %
6.2 % (8.0) % (0.2) % 5.8 %
(95.4) %
21Financial Section
June 30, 2015 (in thousands)STATEMENT OF FIDUCIARY NET POSITION
AssetsCash and Cash Equivalents
Receivables:
Interest and Dividends Due from Brokers for Securities Sold Member and Employer Contributions Other Total Receivables
Investments - at fair value: Equities: Domestic International Domestic Obligations: U.S. Treasuries Corporate and Other Bonds International Obligations: Governments Corporates Total Investments
Capital Assets, net Total Assets
Deferred Outflows of Resources
LiabilitiesNet Pension LiabilityDue to Brokers for Securities Purchased
Accounts Payable and Other Total Liabilities
Deferred Inflows of Resources
Net Position Restricted for Pensions
See accompanying notes to financial statements.
2015
$ 1,254,530
192,9313,617
160,6251,165
358,338
34,699,70111,723,127
7,971,1159,783,085
323,472729,566
65,230,066
7,32766,850,261
4,640
25,077
16,4518,141
49,669
6,121
$ 66,799,111
22 Financial Section
STATEMENT OF CHANGES IN FIDUCIARY NET POSITIONFor the Year Ended June 30, 2015 (in thousands)
Additions: Contributions: Employer $ 1,399,668 Nonemployer 7,038 Member 661,835
Investment Income: Net Increase in Fair Value of Investments 975,454 Interest, Dividends, and Other 1,450,750
Total 2,426,204 Less Investment Expense 42,059
Net Investment Income 2,384,145
Total Additions 4,452,686
Deductions: Benefit Payments 3,996,879 Refunds of Member Contributions 80,085 Administrative Expenses, net 14,996
Total Deductions 4,091,960
Net Increase in Net Position 360,726
Net Position Restricted for Pensions: Beginning of Year – as restated (note 2) 66,438,385
End of Year $ 66,799,111
See accompanying notes to financial statements.
2015
23Financial Section
June 30, 2015NOTES TO FINANCIAL STATEMENTS
1. Plan Description Teachers Retirement System of Georgia (the System) was created in 1943 by an act of the Georgia Legislature (the Act) to provide retirement benefits for teachers who qualify under the Act. The System administers a cost-sharing, multiple-employer defined benefit pension plan as defined in Governmental Accounting Standards Board (GASB) Statement No. 67, Financial Reporting for Pension Plans. A Board of Trustees comprised of two appointees by the Board, two ex-officio state employees, five appointees by the Governor, and one appointee of the Board of Regents is ultimately responsible for the administration of the System.
Eligibility and Membership
All teachers in the state public schools, the University System of Georgia (except those professors and principal administrators electing to participate in an optional retirement plan), and certain other designated employees in educational related work are eligible for membership. There were 300 employers and 1 nonemployer contributing entity participating in the plan at June 30, 2015.
Retirement Benefits
The System provides service retirement, disability retirement, and survivor’s benefits. Title 47 of the Official Code of Georgia Annotated (O.C.G.A.) assigns the authority to establish and amend the provisions of the System to the State Legislature. A member is eligible for normal service retirement after 30 years of creditable service, regardless of age, or after 10 years of service and attainment of age 60. A member is eligible for early retirement after 25 years of creditable service. Normal retirement (pension) benefits paid to members are equal to 2% of the average of the member’s two highest paid consecutive years of service, multiplied by the number of years of creditable service up to 40 years. Early retirement benefits are reduced by the lesser of one-twelfth of 7% for each month the member is below age 60, or by 7% for each year or fraction thereof by which the member has less than 30 years of service. It is also assumed that certain cost-of-living adjustments, based on the Consumer Price Index, may be made in future years. Retirement benefits are payable monthly for life. A member may elect to receive a partial lump sum distribution in addition to a reduced monthly retirement benefit. Options are available for distribution of the member’s monthly pension, at a reduced rate, to a designated beneficiary on the member’s death.
Death and Disability Benefits
Retirement benefits also include death and disability benefits, whereby the disabled member or surviving spouse is entitled to receive annually an amount equal to the member’s service retirement benefit or disability retirement, whichever is greater. The benefit is based on the member’s creditable service (minimum of ten years of service) and compensation up to the time of disability. The death benefit is the amount that would be payable to the member’s beneficiary had the member retired on the date of death on either a service retirement allowance or a disability retirement allowance, whichever is larger. The benefit is based on the member’s creditable service (minimum of ten years of service) and compensation up to the date of death.
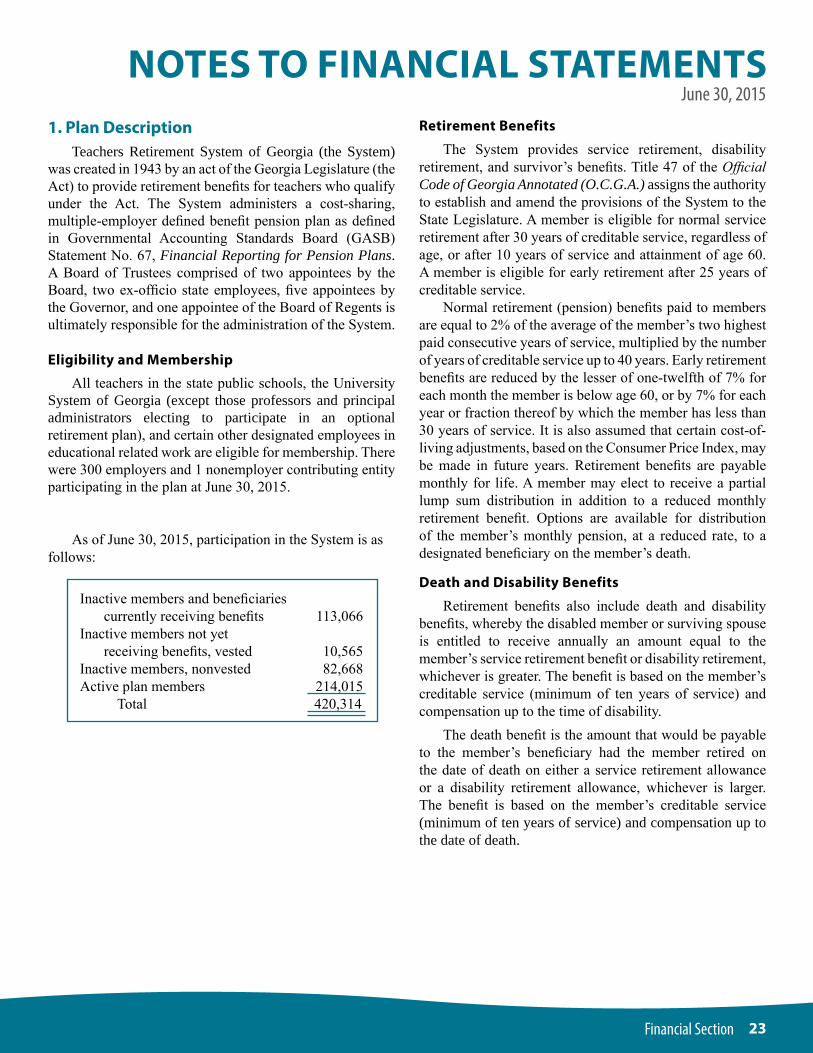
As of June 30, 2015, participation in the System is as follows:
Inactive members and beneficiaries currently receiving benefits 113,066Inactive members not yet receiving benefits, vested 10,565Inactive members, nonvested 82,668Active plan members 214,015 Total 420,314
24 Financial Section
NOTES TO FINANCIAL STATEMENTSJune 30, 2015, continued
1. Plan Description continued
Members become fully vested after ten years of service. If a member terminates with less than ten years of service, no vesting of employer contributions occurs, but the member’s contributions may be refunded with interest. Member contributions with accumulated interest are reported as net position restricted for pensions.
Contributions
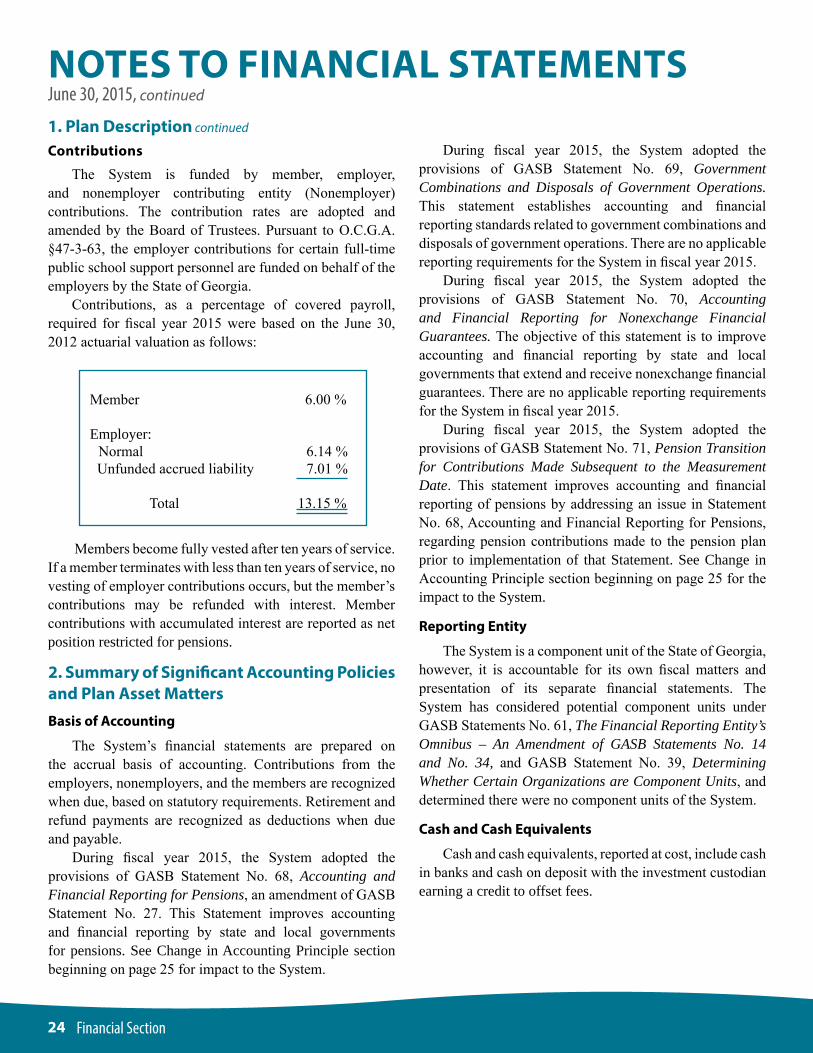
The System is funded by member, employer, and nonemployer contributing entity (Nonemployer) contributions. The contribution rates are adopted and amended by the Board of Trustees. Pursuant to O.C.G.A. §47-3-63, the employer contributions for certain full-time public school support personnel are funded on behalf of the employers by the State of Georgia. Contributions, as a percentage of covered payroll, required for fiscal year 2015 were based on the June 30, 2012 actuarial valuation as follows:
2. Summary of Significant Accounting Policies and Plan Asset MattersBasis of Accounting
The System’s financial statements are prepared on the accrual basis of accounting. Contributions from the employers, nonemployers, and the members are recognized when due, based on statutory requirements. Retirement and refund payments are recognized as deductions when due and payable. During fiscal year 2015, the System adopted the provisions of GASB Statement No. 68, Accounting and Financial Reporting for Pensions, an amendment of GASB Statement No. 27. This Statement improves accounting and financial reporting by state and local governments for pensions. See Change in Accounting Principle section beginning on page 25 for impact to the System.
During fiscal year 2015, the System adopted the provisions of GASB Statement No. 69, Government Combinations and Disposals of Government Operations. This statement establishes accounting and financial reporting standards related to government combinations and disposals of government operations. There are no applicable reporting requirements for the System in fiscal year 2015. During fiscal year 2015, the System adopted the provisions of GASB Statement No. 70, Accounting and Financial Reporting for Nonexchange Financial Guarantees. The objective of this statement is to improve accounting and financial reporting by state and local governments that extend and receive nonexchange financial guarantees. There are no applicable reporting requirements for the System in fiscal year 2015. During fiscal year 2015, the System adopted the provisions of GASB Statement No. 71, Pension Transition for Contributions Made Subsequent to the Measurement Date. This statement improves accounting and financial reporting of pensions by addressing an issue in Statement No. 68, Accounting and Financial Reporting for Pensions, regarding pension contributions made to the pension plan prior to implementation of that Statement. See Change in Accounting Principle section beginning on page 25 for the impact to the System.
Reporting Entity
The System is a component unit of the State of Georgia, however, it is accountable for its own fiscal matters and presentation of its separate financial statements. The System has considered potential component units under GASB Statements No. 61, The Financial Reporting Entity’s Omnibus – An Amendment of GASB Statements No. 14 and No. 34, and GASB Statement No. 39, Determining Whether Certain Organizations are Component Units, and determined there were no component units of the System.
Cash and Cash Equivalents
Cash and cash equivalents, reported at cost, include cash in banks and cash on deposit with the investment custodian earning a credit to offset fees.
Member 6.00 % Employer: Normal 6.14 % Unfunded accrued liability 7.01 % Total 13.15 %
25Financial Section
June 30, 2015, continuedNOTES TO FINANCIAL STATEMENTS
Investments
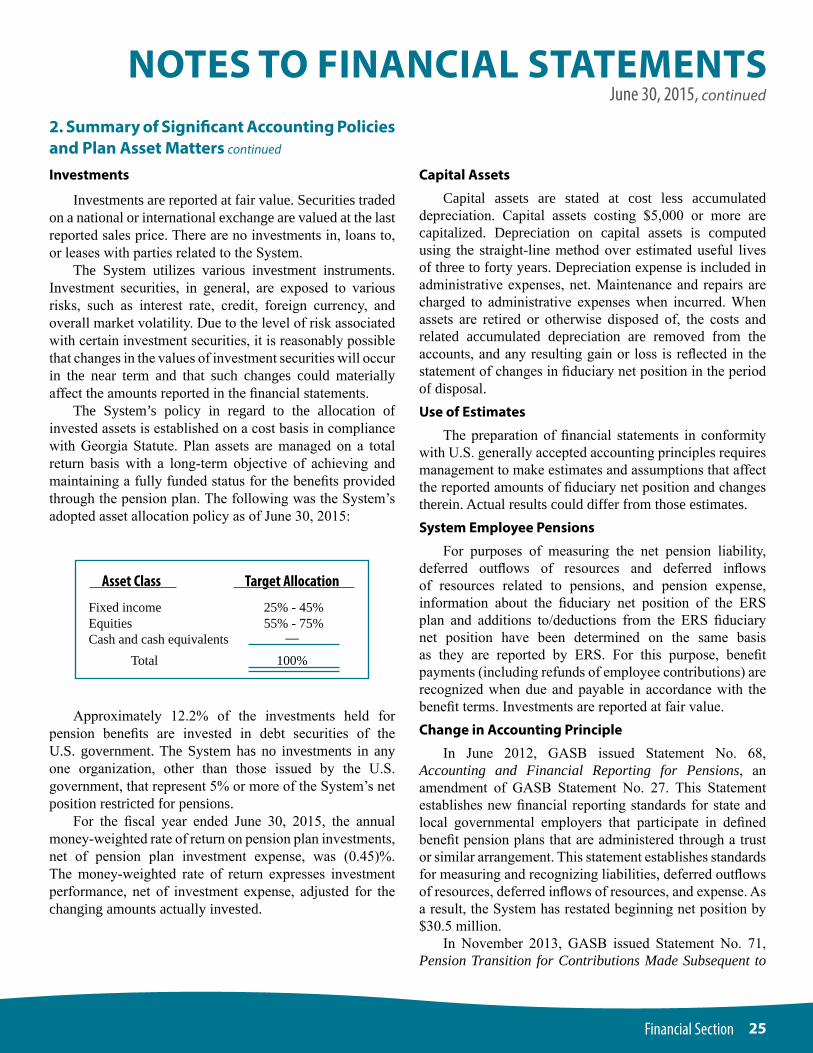
Investments are reported at fair value. Securities traded on a national or international exchange are valued at the last reported sales price. There are no investments in, loans to, or leases with parties related to the System. The System utilizes various investment instruments. Investment securities, in general, are exposed to various risks, such as interest rate, credit, foreign currency, and overall market volatility. Due to the level of risk associated with certain investment securities, it is reasonably possible that changes in the values of investment securities will occur in the near term and that such changes could materially affect the amounts reported in the financial statements. The System’s policy in regard to the allocation of invested assets is established on a cost basis in compliance with Georgia Statute. Plan assets are managed on a total return basis with a long-term objective of achieving and maintaining a fully funded status for the benefits provided through the pension plan. The following was the System’s adopted asset allocation policy as of June 30, 2015:
Capital Assets
Capital assets are stated at cost less accumulated depreciation. Capital assets costing $5,000 or more are capitalized. Depreciation on capital assets is computed using the straight-line method over estimated useful lives of three to forty years. Depreciation expense is included in administrative expenses, net. Maintenance and repairs are charged to administrative expenses when incurred. When assets are retired or otherwise disposed of, the costs and related accumulated depreciation are removed from the accounts, and any resulting gain or loss is reflected in the statement of changes in fiduciary net position in the period of disposal.Use of Estimates
The preparation of financial statements in conformity with U.S. generally accepted accounting principles requires management to make estimates and assumptions that affect the reported amounts of fiduciary net position and changes therein. Actual results could differ from those estimates.System Employee Pensions
For purposes of measuring the net pension liability, deferred outflows of resources and deferred inflows of resources related to pensions, and pension expense, information about the fiduciary net position of the ERS plan and additions to/deductions from the ERS fiduciary net position have been determined on the same basis as they are reported by ERS. For this purpose, benefit payments (including refunds of employee contributions) are recognized when due and payable in accordance with the benefit terms. Investments are reported at fair value.Change in Accounting Principle
In June 2012, GASB issued Statement No. 68, Accounting and Financial Reporting for Pensions, an amendment of GASB Statement No. 27. This Statement establishes new financial reporting standards for state and local governmental employers that participate in defined benefit pension plans that are administered through a trust or similar arrangement. This statement establishes standards for measuring and recognizing liabilities, deferred outflows of resources, deferred inflows of resources, and expense. As a result, the System has restated beginning net position by $30.5 million. In November 2013, GASB issued Statement No. 71, Pension Transition for Contributions Made Subsequent to
2. Summary of Significant Accounting Policies and Plan Asset Matters continued
Approximately 12.2% of the investments held for pension benefits are invested in debt securities of the U.S. government. The System has no investments in any one organization, other than those issued by the U.S. government, that represent 5% or more of the System’s net position restricted for pensions. For the fiscal year ended June 30, 2015, the annual money-weighted rate of return on pension plan investments, net of pension plan investment expense, was (0.45)%. The money-weighted rate of return expresses investment performance, net of investment expense, adjusted for the changing amounts actually invested.
Asset Class Target Allocation
Fixed income 25% - 45%Equities 55% - 75%Cash and cash equivalents —
Total 100%
26 Financial Section
NOTES TO FINANCIAL STATEMENTSJune 30, 2015, continued
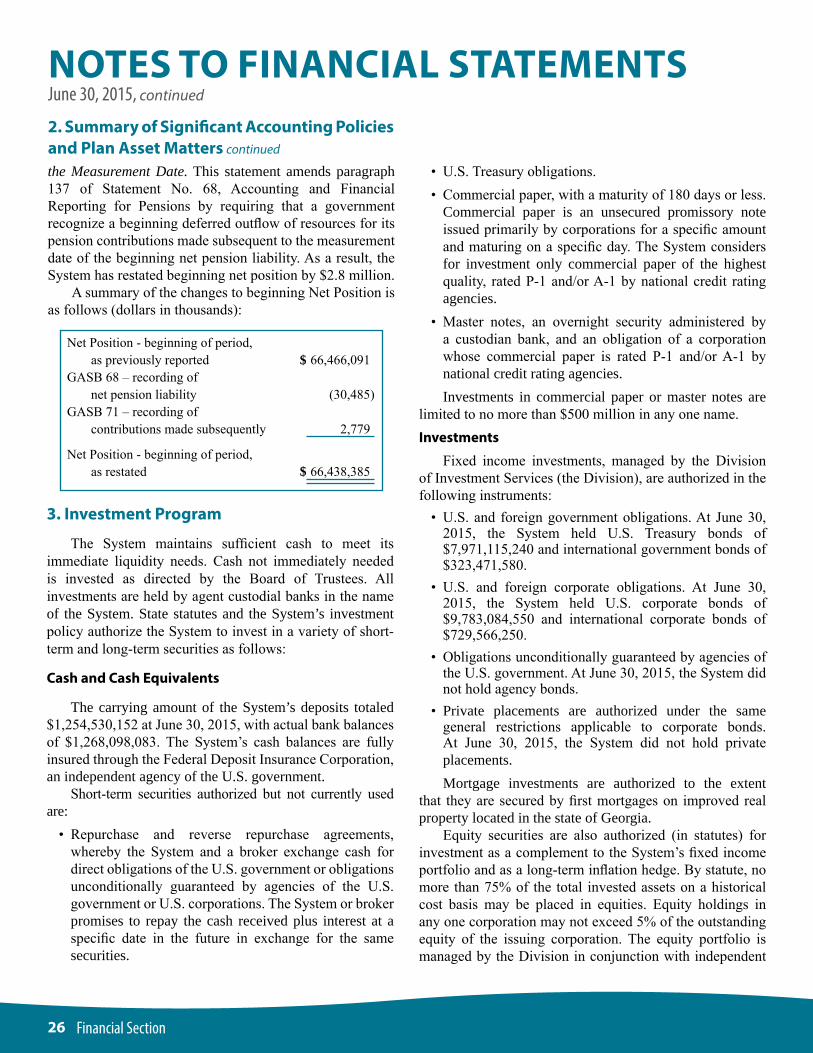
the Measurement Date. This statement amends paragraph 137 of Statement No. 68, Accounting and Financial Reporting for Pensions by requiring that a government recognize a beginning deferred outflow of resources for its pension contributions made subsequent to the measurement date of the beginning net pension liability. As a result, the System has restated beginning net position by $2.8 million. A summary of the changes to beginning Net Position is as follows (dollars in thousands):
• U.S. Treasury obligations.• Commercial paper, with a maturity of 180 days or less.
Commercial paper is an unsecured promissory note issued primarily by corporations for a specific amount and maturing on a specific day. The System considers for investment only commercial paper of the highest quality, rated P-1 and/or A-1 by national credit rating agencies.
• Master notes, an overnight security administered by a custodian bank, and an obligation of a corporation whose commercial paper is rated P-1 and/or A-1 by national credit rating agencies.
Investments in commercial paper or master notes are limited to no more than $500 million in any one name.Investments
Fixed income investments, managed by the Division of Investment Services (the Division), are authorized in the following instruments:
• U.S. and foreign government obligations. At June 30, 2015, the System held U.S. Treasury bonds of $7,971,115,240 and international government bonds of $323,471,580.
• U.S. and foreign corporate obligations. At June 30, 2015, the System held U.S. corporate bonds of $9,783,084,550 and international corporate bonds of $729,566,250.
• Obligations unconditionally guaranteed by agencies of the U.S. government. At June 30, 2015, the System did not hold agency bonds.
• Private placements are authorized under the same general restrictions applicable to corporate bonds. At June 30, 2015, the System did not hold private placements.
Mortgage investments are authorized to the extent that they are secured by first mortgages on improved real property located in the state of Georgia. Equity securities are also authorized (in statutes) for investment as a complement to the System’s fixed income portfolio and as a long-term inflation hedge. By statute, no more than 75% of the total invested assets on a historical cost basis may be placed in equities. Equity holdings in any one corporation may not exceed 5% of the outstanding equity of the issuing corporation. The equity portfolio is managed by the Division in conjunction with independent
2. Summary of Significant Accounting Policies and Plan Asset Matters continued
3. Investment Program
The System maintains sufficient cash to meet its immediate liquidity needs. Cash not immediately needed is invested as directed by the Board of Trustees. All investments are held by agent custodial banks in the name of the System. State statutes and the System’s investment policy authorize the System to invest in a variety of short-term and long-term securities as follows:
Cash and Cash Equivalents
The carrying amount of the System’s deposits totaled $1,254,530,152 at June 30, 2015, with actual bank balances of $1,268,098,083. The System’s cash balances are fully insured through the Federal Deposit Insurance Corporation, an independent agency of the U.S. government. Short-term securities authorized but not currently used are:
• Repurchase and reverse repurchase agreements, whereby the System and a broker exchange cash for direct obligations of the U.S. government or obligations unconditionally guaranteed by agencies of the U.S. government or U.S. corporations. The System or broker promises to repay the cash received plus interest at a specific date in the future in exchange for the same securities.
Net Position - beginning of period, as previously reported 66,466,091GASB 68 – recording of net pension liability (30,485)GASB 71 – recording of contributions made subsequently 2,779
Net Position - beginning of period, as restated 66,438,385
$
$
27Financial Section
June 30, 2015, continuedNOTES TO FINANCIAL STATEMENTS
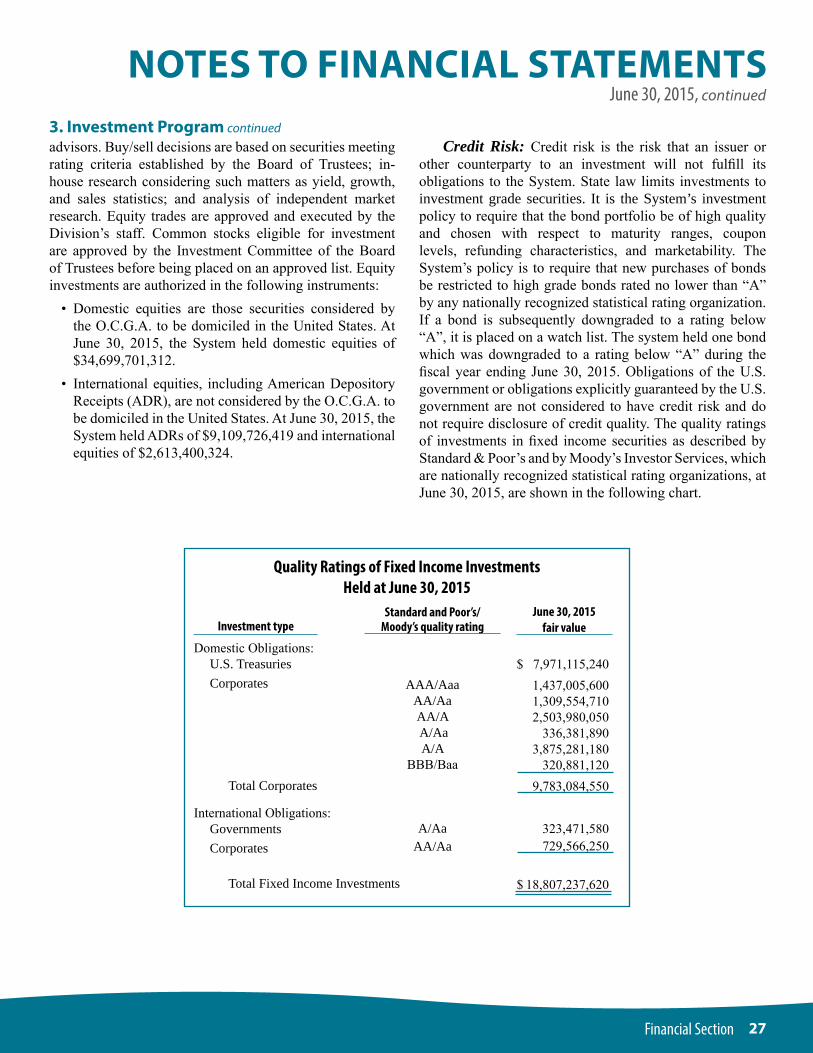
3. Investment Program continued
Quality Ratings of Fixed Income InvestmentsHeld at June 30, 2015
Investment typeStandard and Poor’s/
Moody’s quality ratingJune 30, 2015
fair value
Domestic Obligations: U.S. Treasuries Corporates
Total Corporates International Obligations: Governments Corporates
Total Fixed Income Investments
AAA/AaaAA/AaAA/A A/AaA/A
BBB/Baa
A/AaAA/Aa
$ 7,971,115,240 1,437,005,6001,309,554,7102,503,980,050
336,381,8903,875,281,180
320,881,1209,783,084,550
323,471,580729,566,250
$ 18,807,237,620
advisors. Buy/sell decisions are based on securities meeting rating criteria established by the Board of Trustees; in-house research considering such matters as yield, growth, and sales statistics; and analysis of independent market research. Equity trades are approved and executed by the Division’s staff. Common stocks eligible for investment are approved by the Investment Committee of the Board of Trustees before being placed on an approved list. Equity investments are authorized in the following instruments:
• Domestic equities are those securities considered by the O.C.G.A. to be domiciled in the United States. At June 30, 2015, the System held domestic equities of $34,699,701,312.
• International equities, including American Depository Receipts (ADR), are not considered by the O.C.G.A. to be domiciled in the United States. At June 30, 2015, the System held ADRs of $9,109,726,419 and international equities of $2,613,400,324.
Credit Risk: Credit risk is the risk that an issuer or other counterparty to an investment will not fulfill its obligations to the System. State law limits investments to investment grade securities. It is the System’s investment policy to require that the bond portfolio be of high quality and chosen with respect to maturity ranges, coupon levels, refunding characteristics, and marketability. The System’s policy is to require that new purchases of bonds be restricted to high grade bonds rated no lower than “A” by any nationally recognized statistical rating organization. If a bond is subsequently downgraded to a rating below “A”, it is placed on a watch list. The system held one bond which was downgraded to a rating below “A” during the fiscal year ending June 30, 2015. Obligations of the U.S. government or obligations explicitly guaranteed by the U.S. government are not considered to have credit risk and do not require disclosure of credit quality. The quality ratings of investments in fixed income securities as described by Standard & Poor’s and by Moody’s Investor Services, which are nationally recognized statistical rating organizations, at June 30, 2015, are shown in the following chart.
28 Financial Section
NOTES TO FINANCIAL STATEMENTSJune 30, 2015, continued
3. Investment Program continued
Concentration of Credit Risk: Concentration of credit risk is the risk of loss that may be attributed to the magnitude of a government’s investment in a single issue. At June 30, 2015, the System did not have debt or equity investments in any one organization, other than those issued or guaranteed by the U.S. government or its agencies, which represented greater than 5% of plan net position.
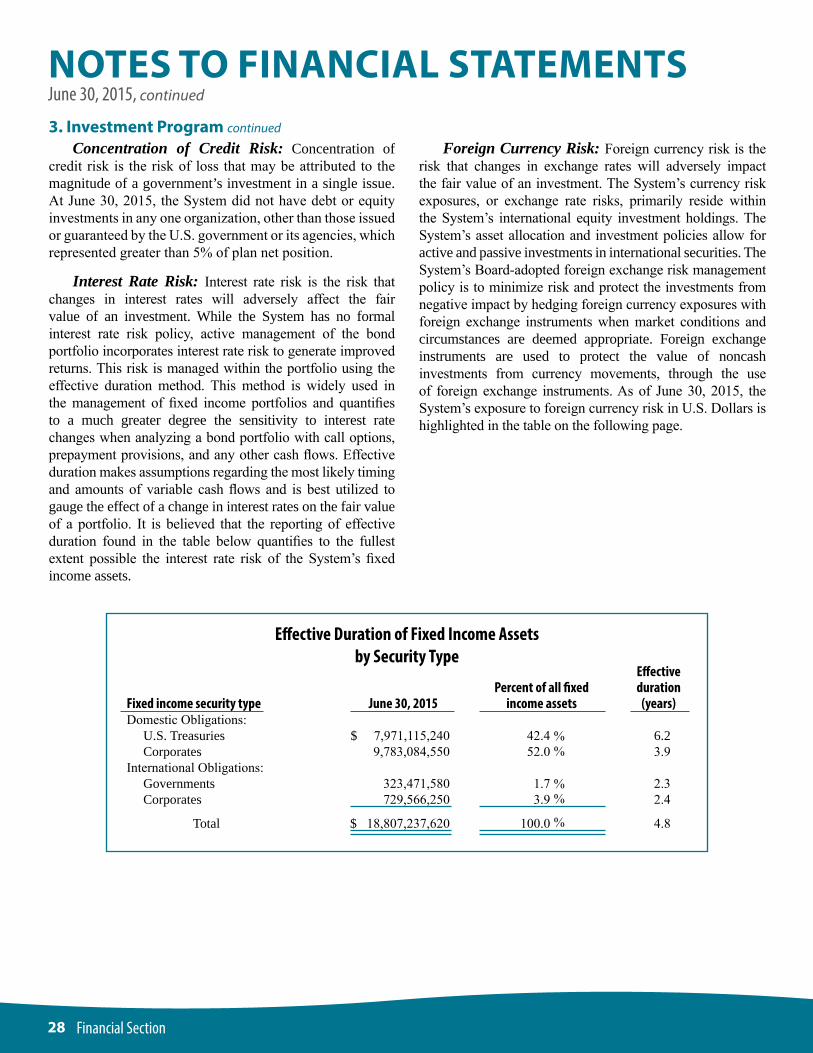
Interest Rate Risk: Interest rate risk is the risk that changes in interest rates will adversely affect the fair value of an investment. While the System has no formal interest rate risk policy, active management of the bond portfolio incorporates interest rate risk to generate improved returns. This risk is managed within the portfolio using the effective duration method. This method is widely used in the management of fixed income portfolios and quantifies to a much greater degree the sensitivity to interest rate changes when analyzing a bond portfolio with call options, prepayment provisions, and any other cash flows. Effective duration makes assumptions regarding the most likely timing and amounts of variable cash flows and is best utilized to gauge the effect of a change in interest rates on the fair value of a portfolio. It is believed that the reporting of effective duration found in the table below quantifies to the fullest extent possible the interest rate risk of the System’s fixed income assets.
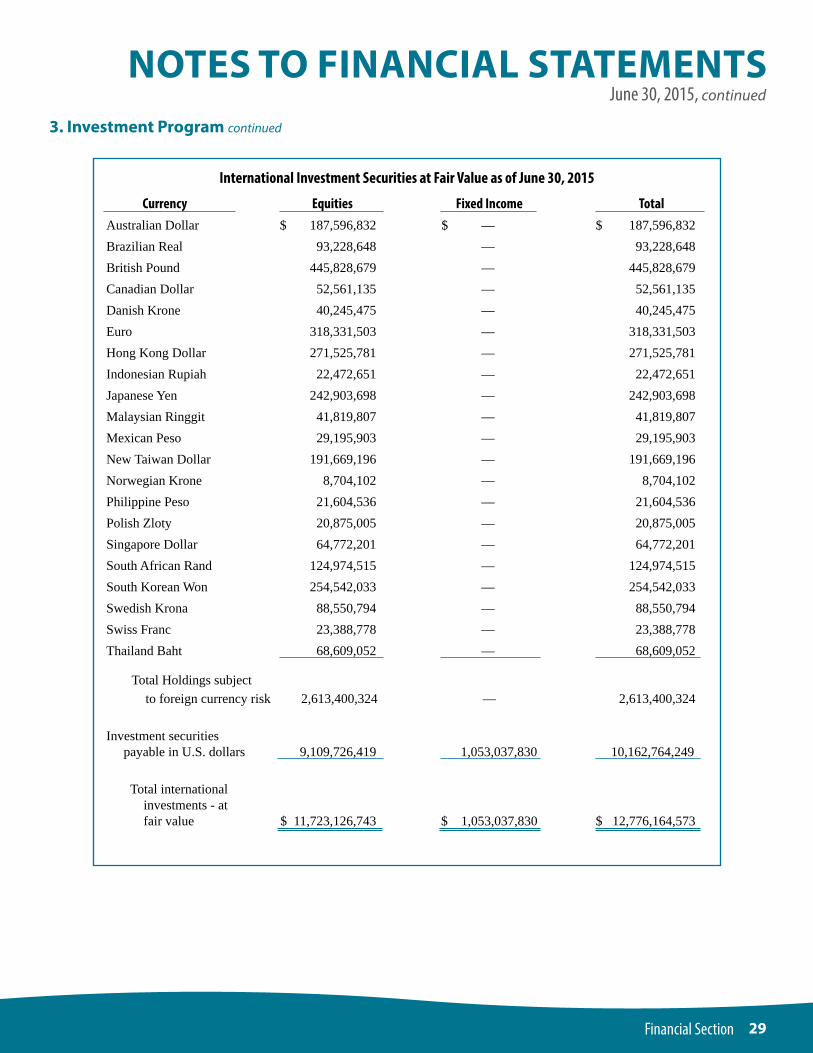
Foreign Currency Risk: Foreign currency risk is the risk that changes in exchange rates will adversely impact the fair value of an investment. The System’s currency risk exposures, or exchange rate risks, primarily reside within the System’s international equity investment holdings. The System’s asset allocation and investment policies allow for active and passive investments in international securities. The System’s Board-adopted foreign exchange risk management policy is to minimize risk and protect the investments from negative impact by hedging foreign currency exposures with foreign exchange instruments when market conditions and circumstances are deemed appropriate. Foreign exchange instruments are used to protect the value of noncash investments from currency movements, through the use of foreign exchange instruments. As of June 30, 2015, the System’s exposure to foreign currency risk in U.S. Dollars is highlighted in the table on the following page.
Effective Duration of Fixed Income Assets by Security Type
Effective Percent of all fixed durationFixed income security type June 30, 2015 income assets (years)Domestic Obligations: U.S. Treasuries $ 7,971,115,240 42.4 6.2 Corporates 9,783,084,550 52.0 3.9International Obligations: Governments 323,471,580 1.7 2.3 Corporates 729,566,250 3.9 2.4
Total $ 18,807,237,620 100.0 4.8
%
%
%
%
%
29Financial Section
NOTES TO FINANCIAL STATEMENTSJune 30, 2015, continued
International Investment Securities at Fair Value as of June 30, 2015
Currency Equities Fixed Income TotalAustralian Dollar $ 187,596,832 $ — $ 187,596,832Brazilian Real 93,228,648 — 93,228,648British Pound 445,828,679 — 445,828,679Canadian Dollar 52,561,135 — 52,561,135Danish Krone 40,245,475 — 40,245,475Euro 318,331,503 — 318,331,503Hong Kong Dollar 271,525,781 — 271,525,781Indonesian Rupiah 22,472,651 — 22,472,651Japanese Yen 242,903,698 — 242,903,698Malaysian Ringgit 41,819,807 — 41,819,807Mexican Peso 29,195,903 — 29,195,903New Taiwan Dollar 191,669,196 — 191,669,196Norwegian Krone 8,704,102 — 8,704,102Philippine Peso 21,604,536 — 21,604,536Polish Zloty 20,875,005 — 20,875,005Singapore Dollar 64,772,201 — 64,772,201South African Rand 124,974,515 — 124,974,515South Korean Won 254,542,033 — 254,542,033Swedish Krona 88,550,794 — 88,550,794Swiss Franc 23,388,778 — 23,388,778Thailand Baht 68,609,052 — 68,609,052
Total Holdings subject to foreign currency risk 2,613,400,324 — 2,613,400,324
Investment securities payable in U.S. dollars 9,109,726,419 1,053,037,830 10,162,764,249
Total international investments - at fair value $ 11,723,126,743 $ 1,053,037,830 $ 12,776,164,573
3. Investment Program continued

30 Financial Section
NOTES TO FINANCIAL STATEMENTSJune 30, 2015, continued
4. Securities Lending Program State statutes and Board of Trustees’ policies permit the System to lend its securities to broker/dealers with a simultaneous agreement to return the collateral for the same securities in the future. The System is presently involved in a securities lending program with major brokerage firms. The System lends equity and fixed income securities for varying terms and receives a fee based on the loaned securities’ value. During a loan, the System continues to receive dividends and interest as the owner of the loaned securities. The brokerage firms pledge collateral securities consisting of U.S. government and agency securities, mortgage-backed securities issued by a U.S. government agency, corporate bonds, and equities. The collateral value must be equal to at least 102% to 109% of the loaned securities’ value, depending on the type of collateral security. Securities loaned totaled $16,437,648,400 at June 30, 2015. The collateral value was equal to 104.4% of the loaned securities’ value at June 30, 2015. The System’s lending collateral was held in the System’s name by the tri-party custodian.
Loaned securities are included in the accompanying statement of fiduciary net position since the System maintains ownership. The related collateral securities are not recorded as assets on the System’s statement of fiduciary net position, and a corresponding liability is not recorded, since the System is deemed not to have the ability to pledge or trade the collateral securities. In accordance with the criteria set forth in GASB Statement No. 28, Accounting and Financial Reporting for Securities Lending Transactions, the System is deemed not to have the ability to pledge or sell collateral securities, since the System’s lending contracts do not address whether the lender can pledge or sell the collateral securities without a borrower default, the System has not previously demonstrated that ability, and there are no indications of the System’s ability to pledge or sell the collateral securities.
31Financial Section
NOTES TO FINANCIAL STATEMENTSJune 30, 2015, continued
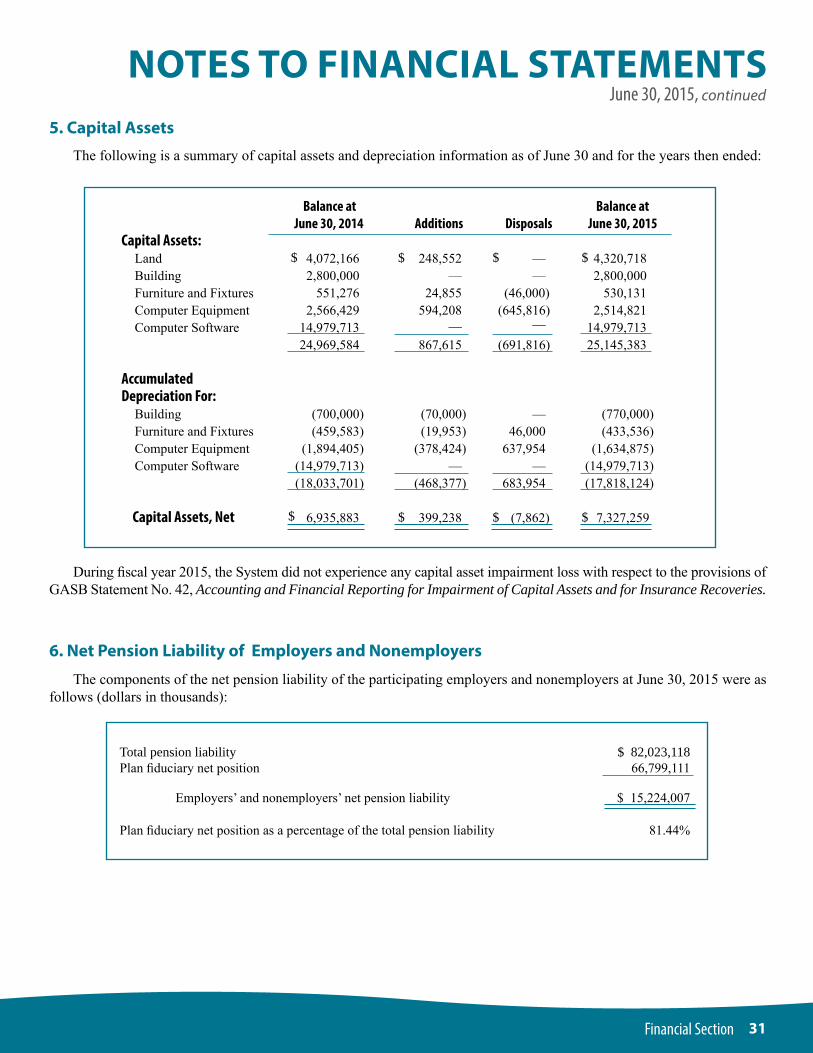
5. Capital Assets
The following is a summary of capital assets and depreciation information as of June 30 and for the years then ended:
Balance at Balance at June 30, 2014 Additions Disposals June 30, 2015 Capital Assets:
Land 4,072,166 248,552 — 4,320,718 Building 2,800,000 — — 2,800,000Furniture and Fixtures 551,276 24,855 (46,000) 530,131
Computer Equipment 2,566,429 594,208 (645,816) 2,514,821 Computer Software 14,979,713 — __ 14,979,713 24,969,584 867,615 (691,816) 25,145,383
AccumulatedDepreciation For:
Building (700,000) (70,000) — (770,000)Furniture and Fixtures (459,583) (19,953) 46,000 (433,536)Computer Equipment (1,894,405) (378,424) 637,954 (1,634,875)Computer Software (14,979,713) — — (14,979,713) (18,033,701) (468,377) 683,954 (17,818,124)
Capital Assets, Net 6,935,883 399,238 (7,862) 7,327,259
$
$ $
$$
$
$
$
6. Net Pension Liability of Employers and Nonemployers
During fiscal year 2015, the System did not experience any capital asset impairment loss with respect to the provisions of GASB Statement No. 42, Accounting and Financial Reporting for Impairment of Capital Assets and for Insurance Recoveries.
The components of the net pension liability of the participating employers and nonemployers at June 30, 2015 were as follows (dollars in thousands):
Total pension liability $ 82,023,118Plan fiduciary net position 66,799,111
Employers’ and nonemployers’ net pension liability $ 15,224,007
Plan fiduciary net position as a percentage of the total pension liability 81.44%
32 Financial Section
NOTES TO FINANCIAL STATEMENTSJune 30, 2015, continued
6. Net Pension Liability of Employers and Nonemployers continued
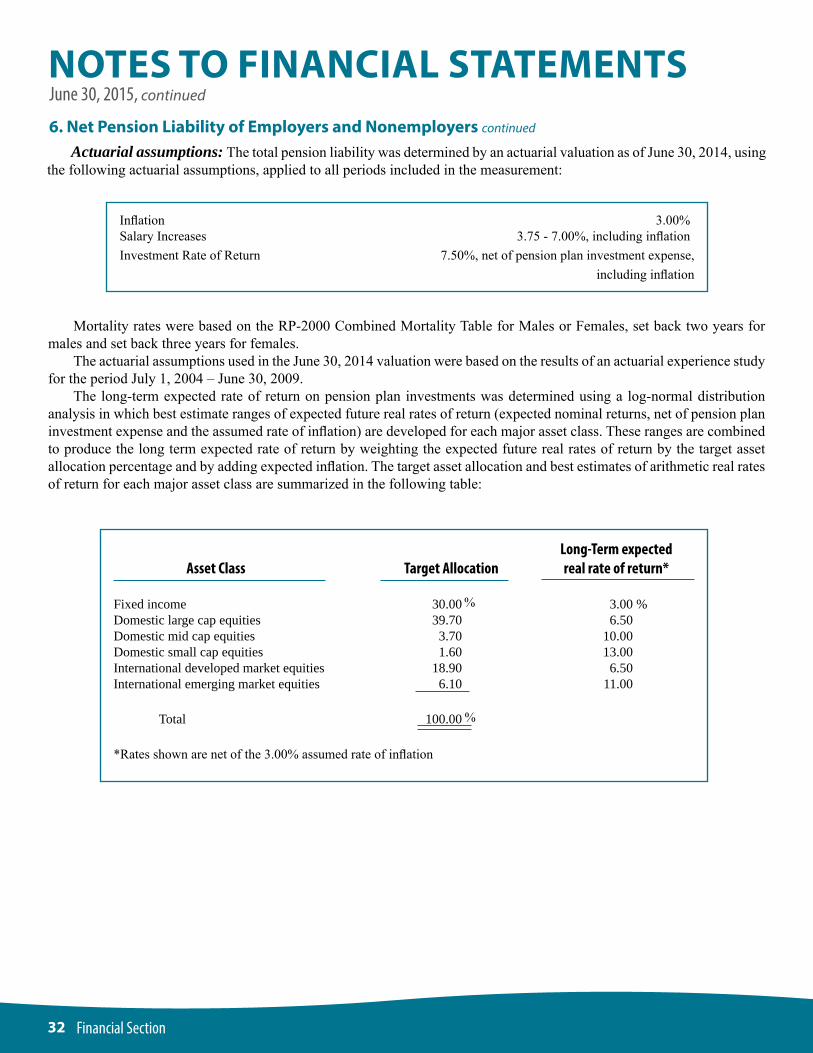
Actuarial assumptions: The total pension liability was determined by an actuarial valuation as of June 30, 2014, using the following actuarial assumptions, applied to all periods included in the measurement:
Inflation 3.00%SalaryIncreases 3.75-7.00%,includinginflationInvestmentRateofReturn 7.50%,netofpensionplaninvestmentexpense,
includinginflation
Mortality rates were based on the RP-2000 Combined Mortality Table for Males or Females, set back two years for males and set back three years for females. The actuarial assumptions used in the June 30, 2014 valuation were based on the results of an actuarial experience study for the period July 1, 2004 – June 30, 2009. The long-term expected rate of return on pension plan investments was determined using a log-normal distribution analysis in which best estimate ranges of expected future real rates of return (expected nominal returns, net of pension plan investment expense and the assumed rate of inflation) are developed for each major asset class. These ranges are combined to produce the long term expected rate of return by weighting the expected future real rates of return by the target asset allocation percentage and by adding expected inflation. The target asset allocation and best estimates of arithmetic real rates of return for each major asset class are summarized in the following table:
Long-Term expected Asset Class Target Allocation real rate of return*
Fixed income 30.00 3.00 %Domestic large cap equities 39.70 6.50Domestic mid cap equities 3.70 10.00Domestic small cap equities 1.60 13.00International developed market equities 18.90 6.50International emerging market equities 6.10 11.00
Total 100.00
*Rates shown are net of the 3.00% assumed rate of inflation
%
%
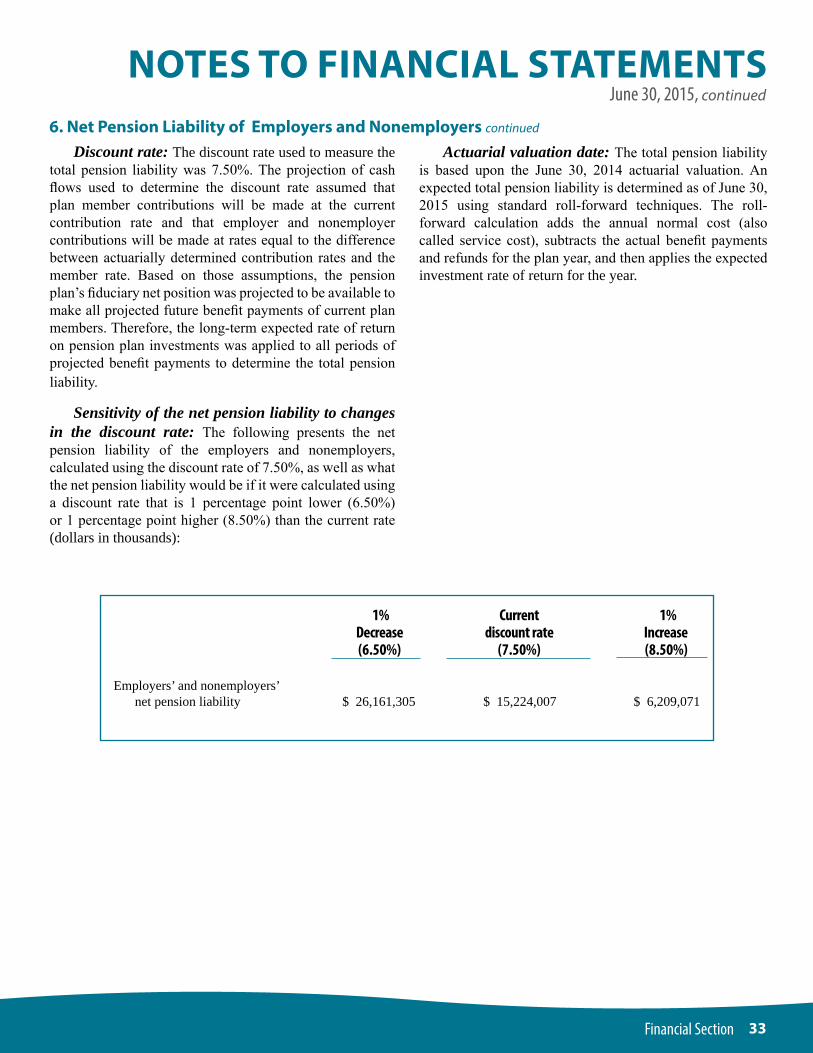
33Financial Section
NOTES TO FINANCIAL STATEMENTSJune 30, 2015, continued
Discount rate: The discount rate used to measure the total pension liability was 7.50%. The projection of cash flows used to determine the discount rate assumed that plan member contributions will be made at the current contribution rate and that employer and nonemployer contributions will be made at rates equal to the difference between actuarially determined contribution rates and the member rate. Based on those assumptions, the pension plan’s fiduciary net position was projected to be available to make all projected future benefit payments of current plan members. Therefore, the long-term expected rate of return on pension plan investments was applied to all periods of projected benefit payments to determine the total pension liability.
Sensitivity of the net pension liability to changes in the discount rate: The following presents the net pension liability of the employers and nonemployers, calculated using the discount rate of 7.50%, as well as what the net pension liability would be if it were calculated using a discount rate that is 1 percentage point lower (6.50%) or 1 percentage point higher (8.50%) than the current rate (dollars in thousands):
6. Net Pension Liability of Employers and Nonemployers continued
Actuarial valuation date: The total pension liability is based upon the June 30, 2014 actuarial valuation. An expected total pension liability is determined as of June 30, 2015 using standard roll-forward techniques. The roll-forward calculation adds the annual normal cost (also called service cost), subtracts the actual benefit payments and refunds for the plan year, and then applies the expected investment rate of return for the year.
1% Current 1% Decrease discount rate Increase (6.50%) (7.50%) (8.50%)
Employers’ and nonemployers’ net pension liability $ 26,161,305 $ 15,224,007 $ 6,209,071
34 Financial Section
The System’s employees are members of the ERS plan. The notes to the financial statements that follow and required supplementary information on page 38 are presented from the perspective of the System as an employer.
General Information about the Employees’ Retirement System of Georgia
Plan description: ERS is a cost-sharing multiple-employer defined benefit pension plan established by the Georgia General Assembly during the 1949 Legislative Session for the purpose of providing retirement allowances for employees of the State of Georgia and its political subdivisions. ERS is directed by a Board of Trustees. Title 47 of the O.C.G.A. assigns the authority to establish and amend the benefit provisions to the State Legislature. ERS issues a publicly available financial report that can be obtained at www.ers.ga.gov/formspubs/formspubs.
Benefits provided: The ERS Plan supports three benefit tiers: Old Plan, New Plan, and Georgia State Employees’ Pension and Savings Plan (GSEPS). Employees under the Old Plan started membership prior to July 1, 1982 and are subject to plan provisions in effect prior to July 1, 1982. Members hired on or after July 1, 1982 but prior to January 1, 2009 are New Plan members subject to modified plan provisions. Effective January 1, 2009, new state employees and rehired state employees who did not retain membership rights under the Old or New Plans are members of GSEPS. ERS members hired prior to January 1, 2009 also have the option to irrevocably change their membership to GSEPS. Under the Old Plan, the New Plan, and GSEPS, a member may retire and receive normal retirement benefits after completion of 10 years of creditable service and attainment of age 60 or 30 years of creditable service regardless of age. Additionally, there are some provisions allowing for early retirement after 25 years of creditable service for members under age 60. Retirement benefits paid to members are based upon the monthly average of the member’s highest 24 consecutive calendar months, multiplied by the number of years of creditable service, multiplied by the applicable benefit factor. Annually, postretirement cost-of-living adjustments may also be made to members’ benefits, provided the members were hired prior to July 1, 2009. The normal retirement
7. System Employees’ Retirement Benefitspension is payable monthly for life; however, options are available for distribution of the member’s monthly pension, at reduced rates, to a designated beneficiary upon the member’s death. Death and disability benefits are also available through ERS.
Contributions: Member contributions under the Old Plan are 4% of annual compensation, up to $4,200, plus 6% of annual compensation in excess of $4,200. Under the Old Plan, the state pays member contributions in excess of 1.25% of annual compensation. Under the Old Plan, these state contributions are included in the members’ accounts for refund purposes and are used in the computation of the members’ earnable compensation for the purpose of computing retirement benefits. Member contributions under the New Plan and GSEPS are 1.25% of annual compensation. The System’s contractually required contribution rate, actuarially determined annually, for the year ended June 30, 2015 was 21.96% of annual covered payroll for Old and New Plan members and 18.87% for GSEPS members. The System’s contributions to ERS for funding purposes totaled $3.4 million for the year ended June 30, 2015. Contributions are expected to finance the costs of benefits earned by employees during the year, with an additional amount to finance any unfunded accrued liability.
Pension Liabilities, Pension Expense, and Deferred Outflows of Resources and Deferred Inflows of Resources Related to Pensions
At June 30, 2015, the System reported a liability for its proportionate share of the net pension liability for the ERS plan. The net pension liability was measured as of June 30, 2014. The total pension liability used to calculate the net pension liability was based on an actuarial valuation as of June 30, 2013. An expected total pension liability as of June 30, 2014 was determined using standard roll-forward techniques. The System’s proportion of the net pension liability was based on contributions to ERS during the fiscal year ended June 30, 2014. At June 30, 2014, the System’s proportion was 0.668620%, which is based on contributions, and an increase of 0.040403% from its proportion measured as of June 30, 2013.
NOTES TO FINANCIAL STATEMENTSJune 30, 2015, continued
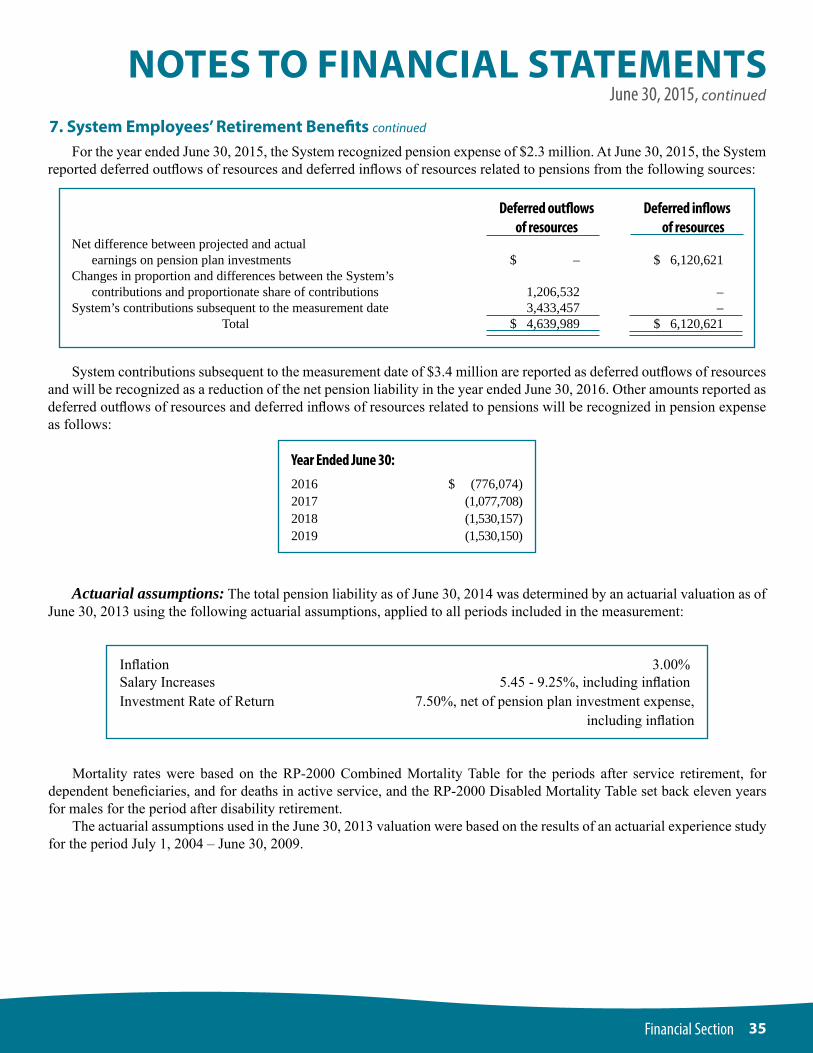
35Financial Section
Deferred outflows Deferred inflows of resources of resourcesNet difference between projected and actual earnings on pension plan investments $ – $ 6,120,621Changes in proportion and differences between the System’s contributions and proportionate share of contributions 1,206,532 –System’s contributions subsequent to the measurement date 3,433,457 – Total $ 4,639,989 $ 6,120,621
System contributions subsequent to the measurement date of $3.4 million are reported as deferred outflows of resources and will be recognized as a reduction of the net pension liability in the year ended June 30, 2016. Other amounts reported as deferred outflows of resources and deferred inflows of resources related to pensions will be recognized in pension expense as follows:
Inflation 3.00%SalaryIncreases 5.45-9.25%,includinginflationInvestmentRateofReturn 7.50%,netofpensionplaninvestmentexpense,
includinginflation
Actuarial assumptions: The total pension liability as of June 30, 2014 was determined by an actuarial valuation as of June 30, 2013 using the following actuarial assumptions, applied to all periods included in the measurement:
Year Ended June 30:2016 $ (776,074)2017 (1,077,708)2018 (1,530,157)2019 (1,530,150)
Mortality rates were based on the RP-2000 Combined Mortality Table for the periods after service retirement, for dependent beneficiaries, and for deaths in active service, and the RP-2000 Disabled Mortality Table set back eleven years for males for the period after disability retirement. The actuarial assumptions used in the June 30, 2013 valuation were based on the results of an actuarial experience study for the period July 1, 2004 – June 30, 2009.
7. System Employees’ Retirement Benefits continued
NOTES TO FINANCIAL STATEMENTSJune 30, 2015, continued
For the year ended June 30, 2015, the System recognized pension expense of $2.3 million. At June 30, 2015, the System reported deferred outflows of resources and deferred inflows of resources related to pensions from the following sources:
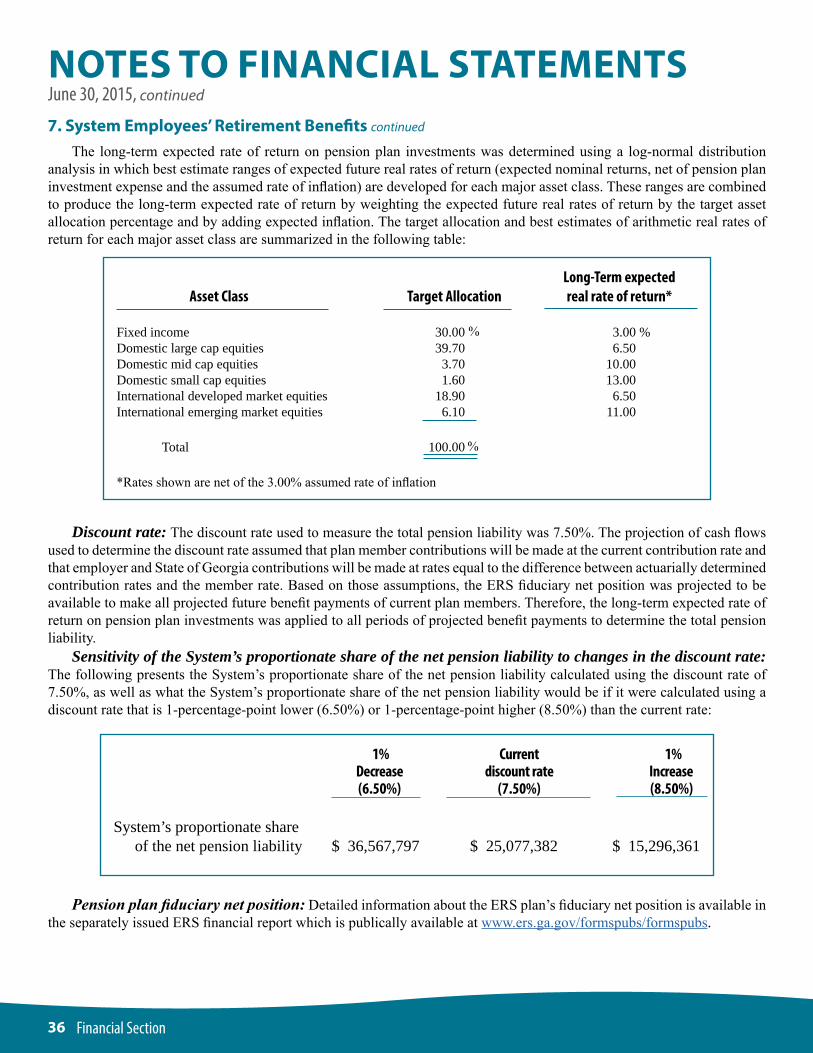
36 Financial Section
The long-term expected rate of return on pension plan investments was determined using a log-normal distribution analysis in which best estimate ranges of expected future real rates of return (expected nominal returns, net of pension plan investment expense and the assumed rate of inflation) are developed for each major asset class. These ranges are combined to produce the long-term expected rate of return by weighting the expected future real rates of return by the target asset allocation percentage and by adding expected inflation. The target allocation and best estimates of arithmetic real rates of return for each major asset class are summarized in the following table:
Long-Term expected Asset Class Target Allocation real rate of return*
Fixed income 30.00 3.00 %Domestic large cap equities 39.70 6.50Domestic mid cap equities 3.70 10.00Domestic small cap equities 1.60 13.00International developed market equities 18.90 6.50International emerging market equities 6.10 11.00
Total 100.00
*Rates shown are net of the 3.00% assumed rate of inflation
%
%
Discount rate: The discount rate used to measure the total pension liability was 7.50%. The projection of cash flows used to determine the discount rate assumed that plan member contributions will be made at the current contribution rate and that employer and State of Georgia contributions will be made at rates equal to the difference between actuarially determined contribution rates and the member rate. Based on those assumptions, the ERS fiduciary net position was projected to be available to make all projected future benefit payments of current plan members. Therefore, the long-term expected rate of return on pension plan investments was applied to all periods of projected benefit payments to determine the total pension liability. Sensitivity of the System’s proportionate share of the net pension liability to changes in the discount rate: The following presents the System’s proportionate share of the net pension liability calculated using the discount rate of 7.50%, as well as what the System’s proportionate share of the net pension liability would be if it were calculated using a discount rate that is 1-percentage-point lower (6.50%) or 1-percentage-point higher (8.50%) than the current rate:
1% Current 1% Decrease discount rate Increase (6.50%) (7.50%) (8.50%)
System’s proportionate share of the net pension liability $ 36,567,797 $ 25,077,382 $ 15,296,361
Pension plan fiduciary net position: Detailed information about the ERS plan’s fiduciary net position is available in the separately issued ERS financial report which is publically available at www.ers.ga.gov/formspubs/formspubs.
7. System Employees’ Retirement Benefits continued
NOTES TO FINANCIAL STATEMENTSJune 30, 2015, continued
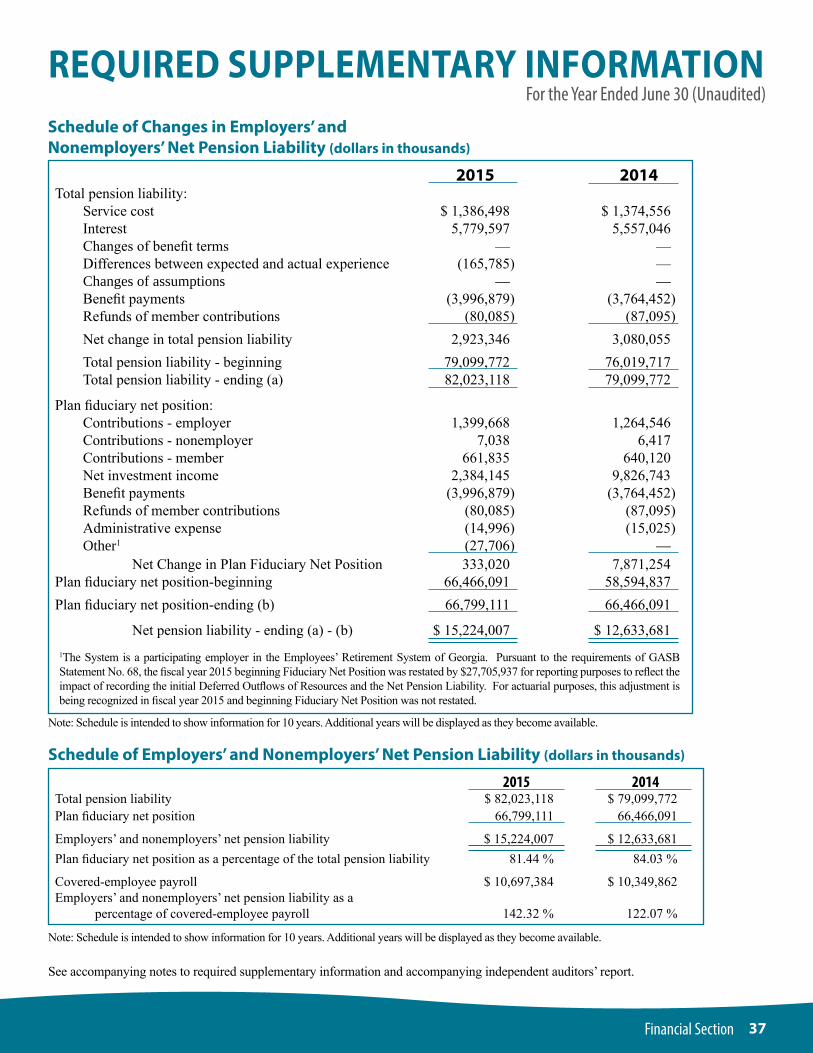
37Financial Section
REQUIRED SUPPLEMENTARY INFORMATIONFor the Year Ended June 30 (Unaudited)
Schedule of Changes in Employers’ and Nonemployers’ Net Pension Liability (dollars in thousands)
See accompanying notes to required supplementary information and accompanying independent auditors’ report.
2015 2014Total pension liability: Service cost $ 1,386,498 $ 1,374,556 Interest 5,779,597 5,557,046 Changes of benefit terms — — Differences between expected and actual experience (165,785) — Changes of assumptions — — Benefit payments (3,996,879) (3,764,452) Refunds of member contributions (80,085) (87,095) Net change in total pension liability 2,923,346 3,080,055 Total pension liability - beginning 79,099,772 76,019,717 Total pension liability - ending (a) 82,023,118 79,099,772
Plan fiduciary net position: Contributions - employer 1,399,668 1,264,546 Contributions - nonemployer 7,038 6,417 Contributions - member 661,835 640,120 Net investment income 2,384,145 9,826,743 Benefit payments (3,996,879) (3,764,452) Refunds of member contributions (80,085) (87,095) Administrative expense (14,996) (15,025) Other1 (27,706) — Net Change in Plan Fiduciary Net Position 333,020 7,871,254Plan fiduciary net position-beginning 66,466,091 58,594,837Plan fiduciary net position-ending (b) 66,799,111 66,466,091
Net pension liability - ending (a) - (b) $ 15,224,007 $ 12,633,6811The System is a participating employer in the Employees’ Retirement System of Georgia. Pursuant to the requirements of GASB Statement No. 68, the fiscal year 2015 beginning Fiduciary Net Position was restated by $27,705,937 for reporting purposes to reflect the impact of recording the initial Deferred Outflows of Resources and the Net Pension Liability. For actuarial purposes, this adjustment is being recognized in fiscal year 2015 and beginning Fiduciary Net Position was not restated.
Note: Schedule is intended to show information for 10 years. Additional years will be displayed as they become available.
Schedule of Employers’ and Nonemployers’ Net Pension Liability (dollars in thousands)
Note: Schedule is intended to show information for 10 years. Additional years will be displayed as they become available.
2015 2014Total pension liability $ 82,023,118 $ 79,099,772Plan fiduciary net position 66,799,111 66,466,091
Employers’ and nonemployers’ net pension liability $ 15,224,007 $ 12,633,681Plan fiduciary net position as a percentage of the total pension liability 81.44 % 84.03 %
Covered-employee payroll $ 10,697,384 $ 10,349,862Employers’ and nonemployers’ net pension liability as a percentage of covered-employee payroll 142.32 % 122.07 %
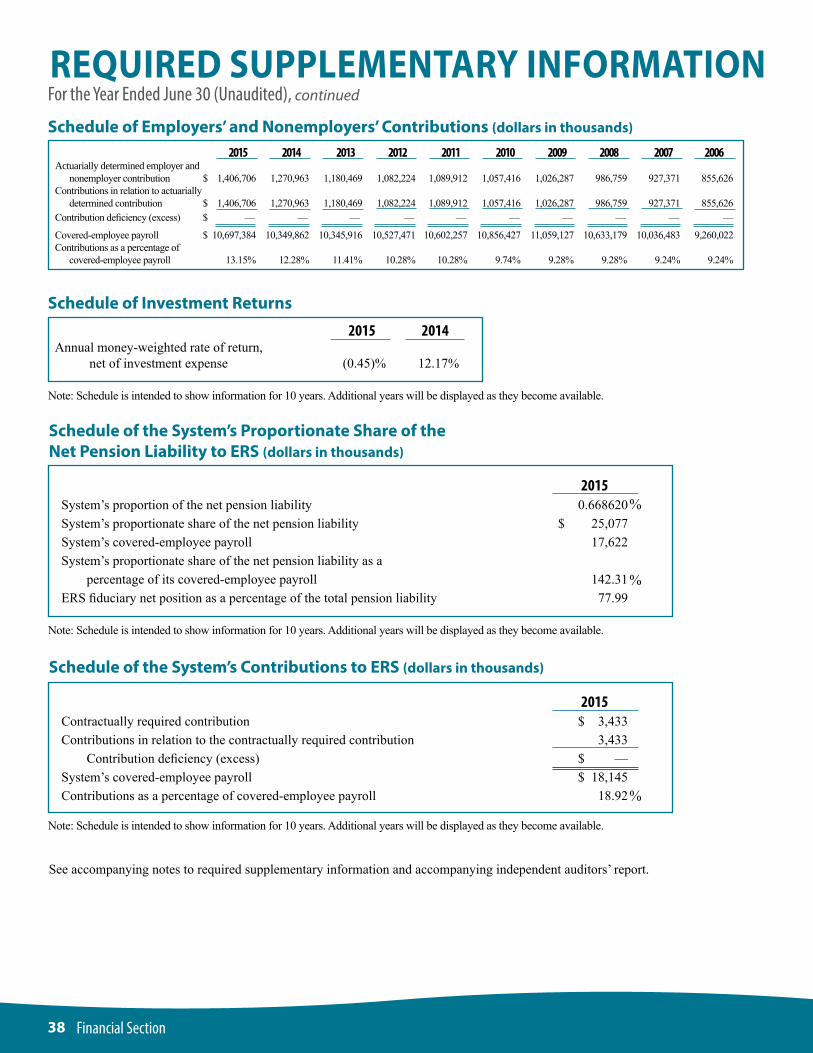
38 Financial Section
For the Year Ended June 30 (Unaudited), continuedREQUIRED SUPPLEMENTARY INFORMATIONSchedule of Employers’ and Nonemployers’ Contributions (dollars in thousands)
2015 2014 2013 2012 2011 2010 2009 2008 2007 2006 Actuarially determined employer and nonemployer contribution $ 1,406,706 1,270,963 1,180,469 1,082,224 1,089,912 1,057,416 1,026,287 986,759 927,371 855,626Contributions in relation to actuarially determined contribution $ 1,406,706 1,270,963 1,180,469 1,082,224 1,089,912 1,057,416 1,026,287 986,759 927,371 855,626Contribution deficiency (excess) $ — — — — — — — — — —
Covered-employee payroll $ 10,697,384 10,349,862 10,345,916 10,527,471 10,602,257 10,856,427 11,059,127 10,633,179 10,036,483 9,260,022 Contributions as a percentage of covered-employee payroll 13.15% 12.28% 11.41% 10.28% 10.28% 9.74% 9.28% 9.28% 9.24% 9.24%
Schedule of Investment Returns
Note: Schedule is intended to show information for 10 years. Additional years will be displayed as they become available.
See accompanying notes to required supplementary information and accompanying independent auditors’ report.
2015 2014Annual money-weighted rate of return, net of investment expense (0.45)% 12.17%
Schedule of the System’s Proportionate Share of the Net Pension Liability to ERS (dollars in thousands)
%
%
2015System’s proportion of the net pension liability 0.668620System’s proportionate share of the net pension liability $ 25,077System’s covered-employee payroll 17,622System’s proportionate share of the net pension liability as a percentage of its covered-employee payroll 142.31ERS fiduciary net position as a percentage of the total pension liability 77.99
Note: Schedule is intended to show information for 10 years. Additional years will be displayed as they become available.
Schedule of the System’s Contributions to ERS (dollars in thousands)
%
2015Contractually required contribution $ 3,433Contributions in relation to the contractually required contribution 3,433 Contribution deficiency (excess) $ —System’s covered-employee payroll $ 18,145Contributions as a percentage of covered-employee payroll 18.92
Note: Schedule is intended to show information for 10 years. Additional years will be displayed as they become available.
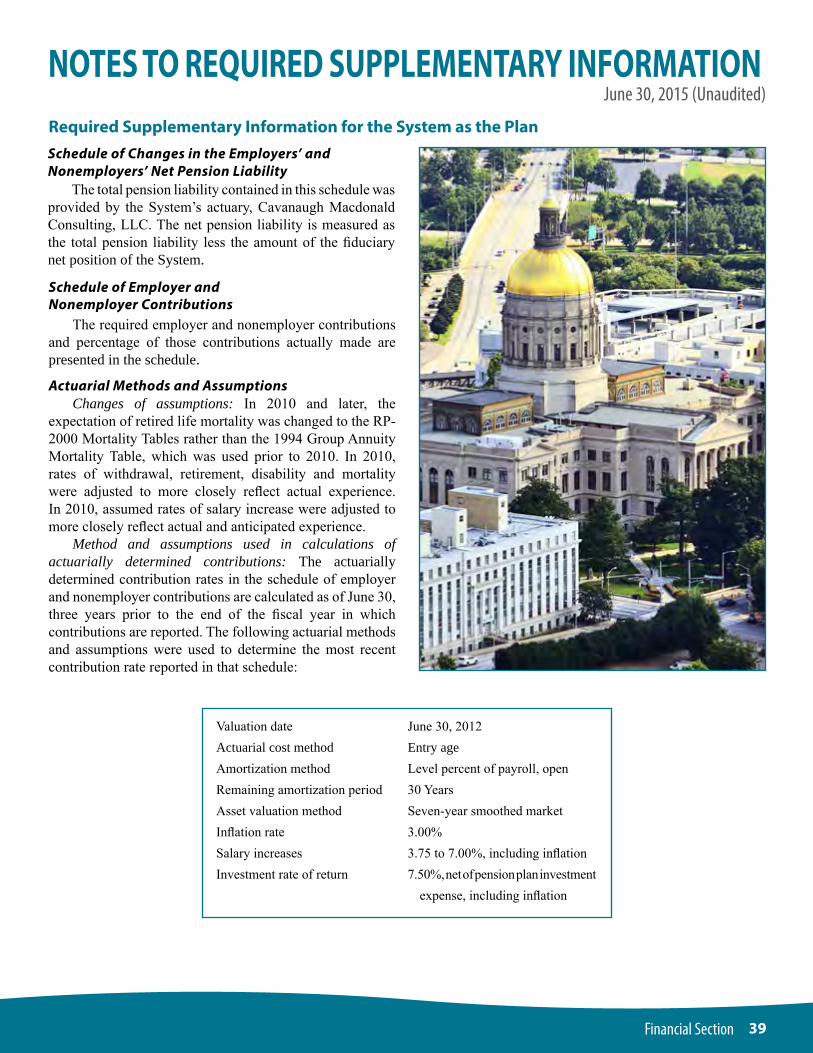
39Financial Section
NOTES TO REQUIRED SUPPLEMENTARY INFORMATIONJune 30, 2015 (Unaudited)
Valuation date June 30, 2012 Actuarial cost method Entry age Amortization method Level percent of payroll, openRemaining amortization period 30 Years Asset valuation method Seven-year smoothed marketInflation rate 3.00%Salary increases 3.75 to 7.00%, including inflationInvestment rate of return 7.50%, net of pension plan investment expense, including inflation
The total pension liability contained in this schedule was provided by the System’s actuary, Cavanaugh Macdonald Consulting, LLC. The net pension liability is measured as the total pension liability less the amount of the fiduciary net position of the System.
Schedule of Changes in the Employers’ and Nonemployers’ Net Pension Liability
Schedule of Employer and Nonemployer Contributions The required employer and nonemployer contributions and percentage of those contributions actually made are presented in the schedule.
Actuarial Methods and Assumptions Changes of assumptions: In 2010 and later, the expectation of retired life mortality was changed to the RP-2000 Mortality Tables rather than the 1994 Group Annuity Mortality Table, which was used prior to 2010. In 2010, rates of withdrawal, retirement, disability and mortality were adjusted to more closely reflect actual experience. In 2010, assumed rates of salary increase were adjusted to more closely reflect actual and anticipated experience. Method and assumptions used in calculations of actuarially determined contributions: The actuarially determined contribution rates in the schedule of employer and nonemployer contributions are calculated as of June 30, three years prior to the end of the fiscal year in which contributions are reported. The following actuarial methods and assumptions were used to determine the most recent contribution rate reported in that schedule:
Required Supplementary Information for the System as the Plan
40 Financial Section
NOTES TO REQUIRED SUPPLEMENTARY INFORMATION
Schedule of the System’s Proportionate Share of the Net Pension Liability to ERS
This schedule presents historical trend information about the System’s proportionate share of the net pension liability for its employees who participate in the ERS plan. GASB Statement No. 68 was implemented in 2015. Information related to previous years is not available, therefore, trend information will be accumulated going forward to display a ten year presentation.
Schedule of the System’s Contributions to ERS
This schedule presents historical trend information about the System’s contributions for its employees who participate in the ERS plan. GASB Statement No. 68 was implemented in 2015. Information related to previous years is not available, therefore, trend information will be accumulated going forward to display a ten year presentation.
Actuarial Methods and Assumptions
Changes of assumptions: There were no changes in assumptions or benefits that affect the measurement of the total pension liability since the prior measurement date. Method and assumptions used in calculations of actuarially determined contributions: The actuarially determined contribution rates in the schedule of contributions are calculated as of June 30, three years prior to the end of the fiscal year in which contributions are reported. The following actuarial methods and assumptions were used to determine the contractually required contributions for the year ended June 30, 2015 reported in that schedule:
Required Supplementary Information for the System as a Participating Employer in ERS
June 30, 2015 (Unaudited)
Valuation date June 30, 2012
Actuarial cost method Entry age
Amortization method Level percent of payroll, open
Remaining amortization period 30 years
Asset valuation method Seven-year smoothed market
Inflation rate 3.00%
Salary increases 2.725% to 4.625% for FY 2012 - FY 2013
5.45% to 9.25% for FY14 +
Investment rate of return 7.50%, net of pension plan investment expense, including inflation
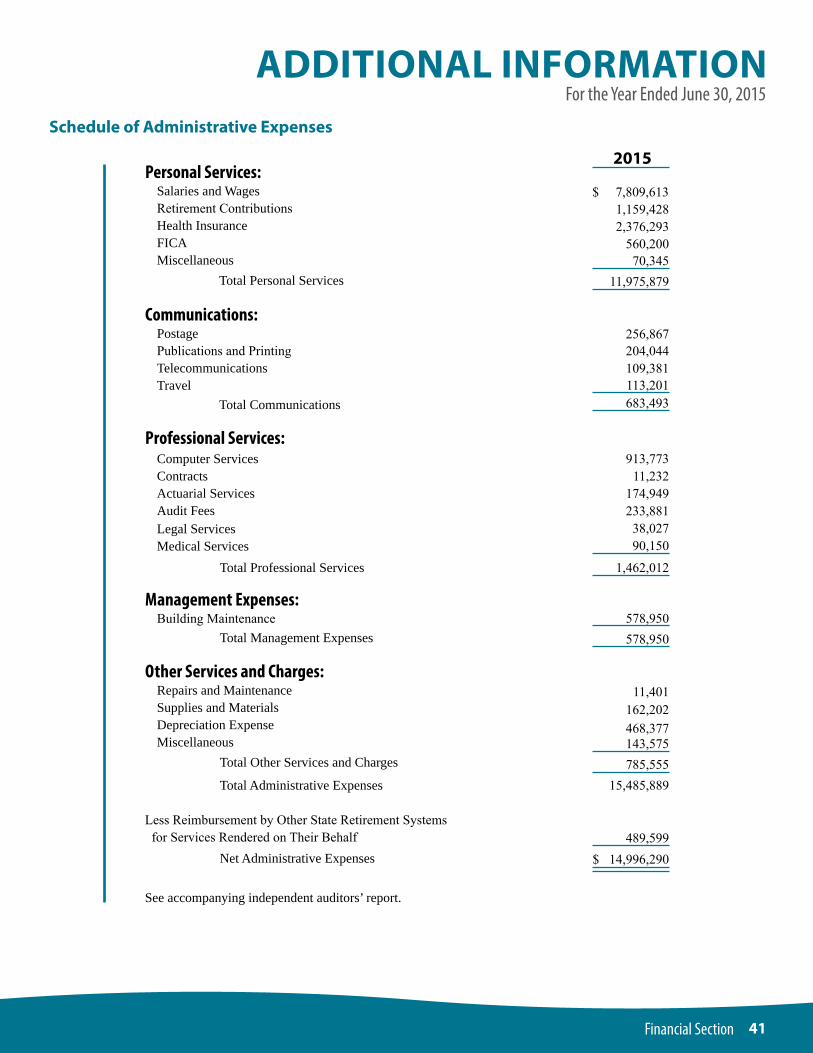
41Financial Section
For the Year Ended June 30, 2015ADDITIONAL INFORMATION
Schedule of Administrative Expenses
Personal Services:Salaries and WagesRetirement Contributions Health Insurance FICA Miscellaneous
Total Personal Services
Communications:Postage Publications and Printing Telecommunications Travel
Total Communications
Professional Services:Computer Services Contracts Actuarial Services Audit Fees Legal Services Medical Services
Total Professional Services
Management Expenses:Building Maintenance
Total Management Expenses
Other Services and Charges:Repairs and Maintenance Supplies and Materials Depreciation Expense Miscellaneous Total Other Services and Charges
Total Administrative Expenses
Less Reimbursement by Other State Retirement Systems for Services Rendered on Their Behalf Net Administrative Expenses
See accompanying independent auditors’ report.
2015
$ 7,809,613 1,159,428
2,376,293 560,200
70,34511,975,879
256,867 204,044 109,381
113,201683,493
913,77311,232
174,949 233,881 38,027
90,150
1,462,012
578,950578,950
11,401 162,202
468,377143,575785,555
15,485,889
489,599
$ 14,996,290
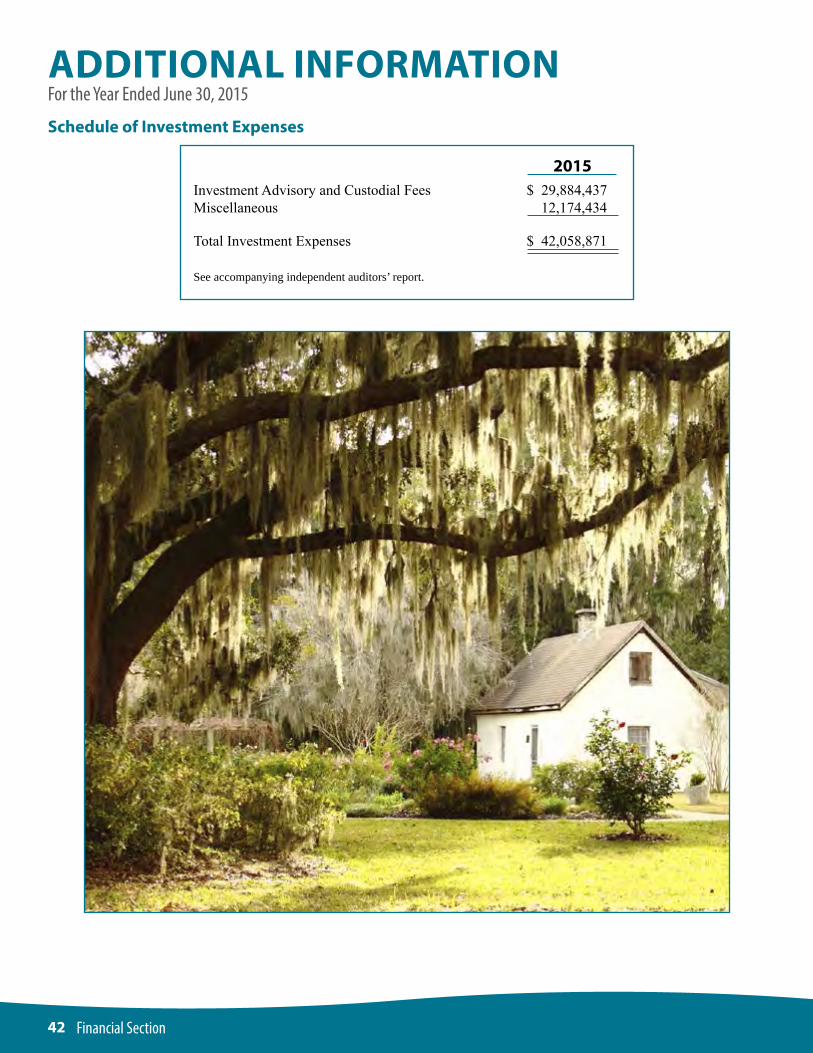
42 Financial Section
ADDITIONAL INFORMATIONFor the Year Ended June 30, 2015
2015Investment Advisory and Custodial Fees $ 29,884,437Miscellaneous 12,174,434
Total Investment Expenses $ 42,058,871
See accompanying independent auditors’ report.
Schedule of Investment Expenses
43Investment Section
INVESTMENT OVERVIEWOn the macro front, the concerns are largely the same
as the prior year with the addition of the effect of low oil prices on energy related companies. The economy is growing at a pedestrian rate of just above 2% per year and Europe’s recovery remains relatively weak. A slowdown in China’s rate of growth is having a negative affect on commodity and emerging markets. The Middle East and the Ukraine remain in the headlines. Offsetting these concerns to some extent has been a decent housing market and a good jobs market. Unlike the robust returns of last year, the markets took a bit of a breather. The U.S. stock market returned 7.3% for the fiscal year.
It is difficult not to get caught up in the headlines, but as a pension plan it is more important to stay focused on the long-term. The System continues to invest in a mix of liquid, high quality bonds and stocks. These types of investments allow the System to participate in rising markets while moderating the risks on the downside. A high quality balanced fund has proven to be a successful strategy in a variety of markets over long periods of time.
As in previous years, the bias to quality was a primary goal and was successfully met. “Conservation of Capital” and “Conservatism” remain the guiding principles for investment decisions. The Board of Trustees continues to use a diversified portfolio to accomplish these objectives.
The domestic economy continued to grow for the fiscal year. Industrial production, personal income and housing all improved last year, while the employment data has been strong. There continues to be general weakness in most foreign economies. A combination of stimulative policies by central bankers and improving developed economies helped those financial markets relative to emerging markets.
Studies undertaken to evaluate the investment returns of pension funds over very long time horizons indicate that the asset allocation decision has the largest impact on the fund’s returns. Although the returns for the various asset categories vary from year to year, over the long term equities usually outperform fixed income and cash by a very wide margin. For that reason, the System has generally maintained a significant equity exposure with the remainder of the fund invested in fixed income securities designed to generate income and preserve capital.
Returns for one, three, five, ten and twenty-year periods are presented in this section. Longer time periods, such as the twenty-year period, allow for more
valid evaluation of returns, both in absolute terms and relative to an asset class index, by reducing emphasis on the short-term volatility of markets. The Daily Valuation Method was used to calculate time-weighted rates of return.
The return for the S&P 500 was 7.4%. U.S. large cap stocks outperformed small cap and mid cap stocks last year. The S&P MidCap 400 and the S&P SmallCap 600 indexes had returns of 6.4% and 6.7%, respectively. The Healthcare and Consumer Discretionary sectors had the best performance, while Energy and Utilities lagged.
International markets on the other hand had negative returns. The MSCI EAFE Index had a (4.2)% return and the MSCI Emerging Market Index had a return of (5.1)%. The returns were much stronger in local currency terms with only Canada suffering a negative return in its own currency. The strength of the dollar reduced those returns, in some cases by over 20%.
The longer the maturity of the bond the better the performance. In contrast to the previous year, the spread on corporate bonds widened, which lowered their returns. The total return on the 10 year Treasury Note was 3.8% and the 30 year Treasury Bond had a 6.9% return. The return on short-term Treasury bills was negligible again due to the Federal Reserve’s policies to stimulate the economy.
We look at two fixed income indexes to measure the bond market’s performance. The Barclays Government / Credit Index had a return of 1.7%. It is a broad index containing corporate and government sponsored bonds as well as Treasuries. The Citigroup Treasury / Sponsored / AAA/AA had a return of 2.2% and is a broad index containing higher rated corporate bonds as well as Treasuries and Government securities. Higher quality bonds outperformed lower quality bonds as evidenced by the 2.0% return for AA rated bonds versus 0.3% for BBB rated bonds.
In summary, the investment status of the System is excellent. The high quality of the System’s investments is in keeping with the continued policy of “Conservatism” and “Conservation of Capital.”
Prepared by the Division of Investment Services
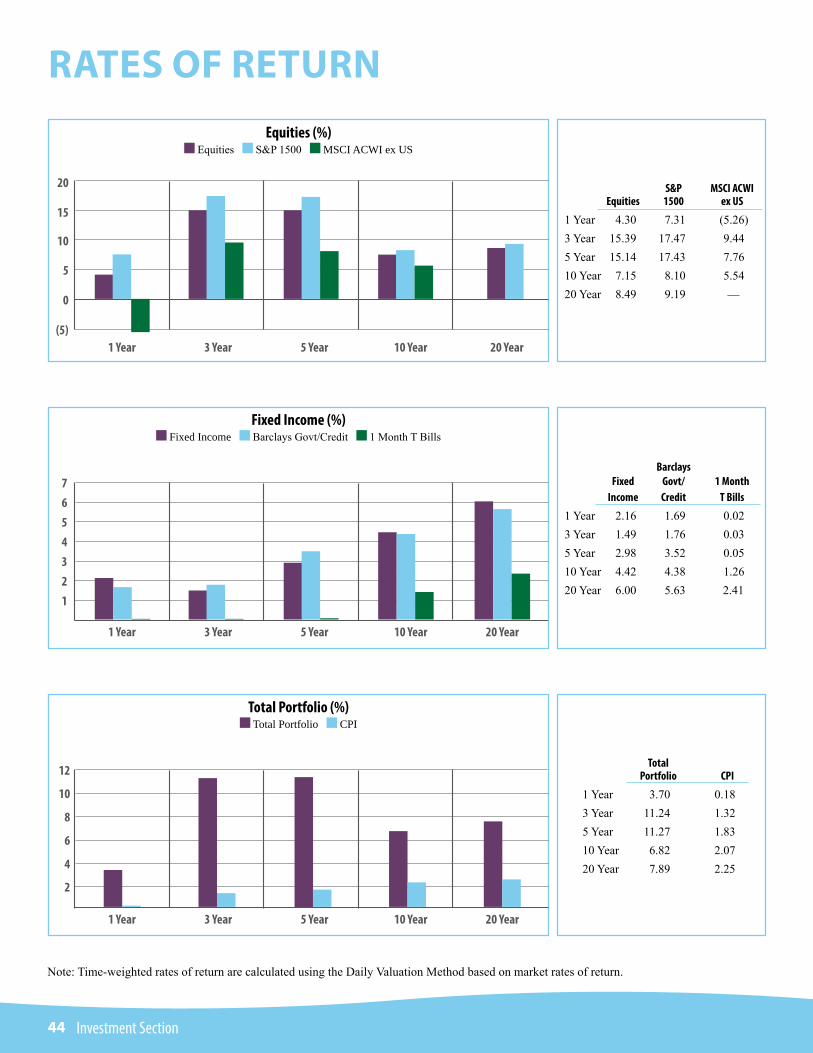
44 Investment Section
RATES OF RETURN
Note: Time-weighted rates of return are calculated using the Daily Valuation Method based on market rates of return.
Fixed Income (%) Fixed Income Barclays Govt/Credit 1 Month T Bills
Barclays Fixed Govt/ 1 Month Income Credit T Bills
1 Year 2.16 1.69 0.023 Year 1.49 1.76 0.035 Year 2.98 3.52 0.0510 Year 4.42 4.38 1.2620 Year 6.00 5.63 2.41
12345
1 Year 3 Year 5 Year 10 Year 20 Year
67
Total Portfolio (%) Total Portfolio CPI
Total Portfolio CPI
1 Year 3.70 0.183 Year 11.24 1.325 Year 11.27 1.8310 Year 6.82 2.0720 Year 7.89 2.25
2
4
1 Year 3 Year 5 Year 10 Year 20 Year
6
8
10
12
Equities (%) Equities S&P 1500 MSCI ACWI ex US
S&P MSCI ACWI Equities 1500 ex US
1 Year 4.30 7.31 (5.26)3 Year 15.39 17.47 9.445 Year 15.14 17.43 7.7610 Year 7.15 8.10 5.5420 Year 8.49 9.19 —
1 Year 3 Year 5 Year 10 Year 20 Year
5
10
15
20
(5)
0
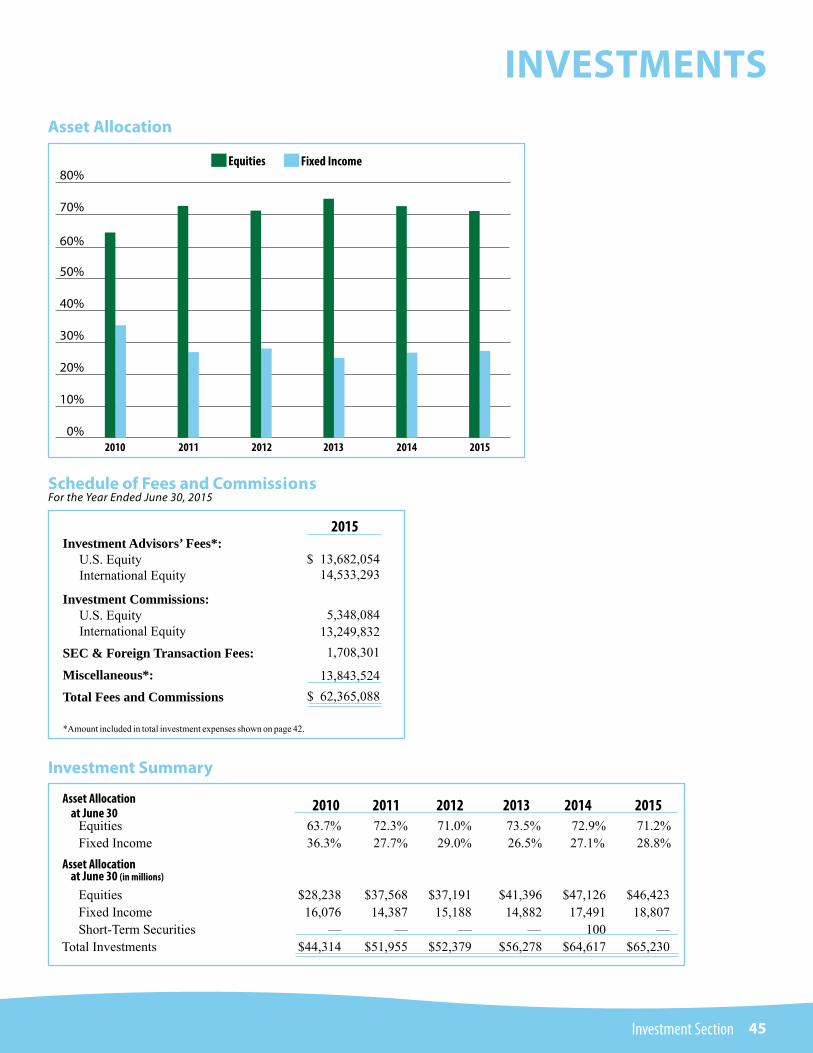
45Investment Section
INVESTMENTS
Schedule of Fees and CommissionsFor the Year Ended June 30, 2015
Investment Advisors’ Fees*: U.S. Equity International Equity
Investment Commissions: U.S. Equity International Equity
SEC & Foreign Transaction Fees:Miscellaneous*:Total Fees and Commissions
$ 13,682,05414,533,293
5,348,084 13,249,832 1,708,301
13,843,524 $ 62,365,088
2015
*Amount included in total investment expenses shown on page 42.
Asset Allocation
Investment Summary
2010 2011 2012 2013 2014 2015 Equities 63.7% 72.3% 71.0% 73.5% 72.9% 71.2% Fixed Income 36.3% 27.7% 29.0% 26.5% 27.1% 28.8%
Equities $28,238 $37,568 $37,191 $41,396 $47,126 $46,423 Fixed Income 16,076 14,387 15,188 14,882 17,491 18,807 Short-Term Securities — — — — 100 —Total Investments $44,314 $51,955 $52,379 $56,278 $64,617 $65,230
Asset Allocation at June 30
Asset Allocation at June 30 (in millions)
Equities Fixed Income80%
70%
60%
50%
40%
30%
20%
10%
0%2010 2011 2012 2013 2014 2015
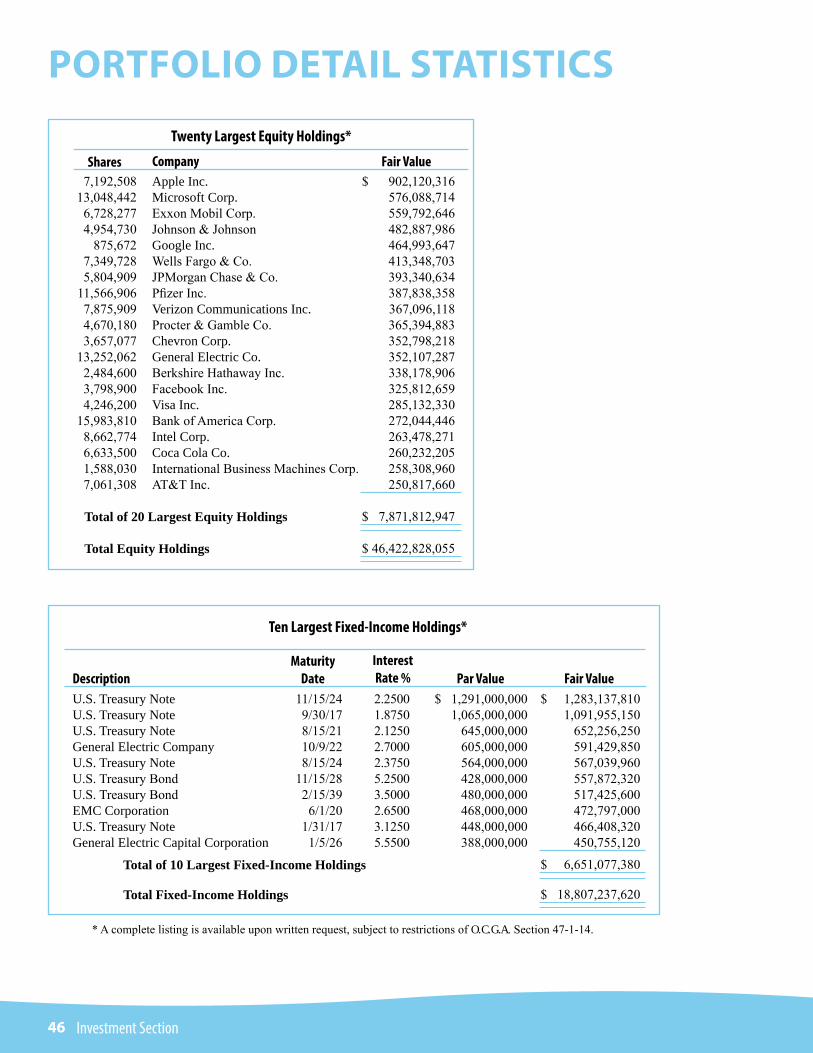
PORTFOLIO DETAIL STATISTICS
46 Investment Section
7,192,508 13,048,442 6,728,277 4,954,730
875,672 7,349,728 5,804,909
11,566,906 7,875,909 4,670,180 3,657,07713,252,062 2,484,600 3,798,900 4,246,200
15,983,810 8,662,774 6,633,500 1,588,030 7,061,308
Apple Inc.Microsoft Corp.Exxon Mobil Corp.Johnson & JohnsonGoogle Inc.Wells Fargo & Co.JPMorgan Chase & Co.Pfizer Inc.Verizon Communications Inc.Procter & Gamble Co.Chevron Corp.General Electric Co.Berkshire Hathaway Inc.Facebook Inc.Visa Inc.Bank of America Corp.Intel Corp.Coca Cola Co.International Business Machines Corp.AT&T Inc.
$ 902,120,316576,088,714559,792,646482,887,986464,993,647413,348,703393,340,634387,838,358367,096,118365,394,883352,798,218352,107,287338,178,906325,812,659285,132,330272,044,446263,478,271260,232,205258,308,960250,817,660
$ 7,871,812,947
$ 46,422,828,055
Total of 20 Largest Equity Holdings
Total Equity Holdings
Company Fair Value
Twenty Largest Equity Holdings*
Shares
* A complete listing is available upon written request, subject to restrictions of O. C. G. A. Section 47-1-14.
U.S. Treasury NoteU.S. Treasury NoteU.S. Treasury NoteGeneral Electric CompanyU.S. Treasury NoteU.S. Treasury BondU.S. Treasury Bond EMC CorporationU.S. Treasury NoteGeneral Electric Capital Corporation
11/15/249/30/178/15/2110/9/228/15/24
11/15/282/15/396/1/20
1/31/171/5/26
2.25001.87502.12502.70002.37505.25003.50002.65003.12505.5500
$ 1,291,000,0001,065,000,000
645,000,000605,000,000564,000,000428,000,000480,000,000468,000,000448,000,000388,000,000
$ 1,283,137,8101,091,955,150
652,256,250591,429,850567,039,960557,872,320517,425,600472,797,000466,408,320450,755,120
$ 6,651,077,380
$ 18,807,237,620
Maturity DateDescription
Ten Largest Fixed-Income Holdings*
Fair ValueInterest Rate % Par Value
Total of 10 Largest Fixed-Income Holdings
Total Fixed-Income Holdings
47Actuarial Section
ACTUARY’S CERTIFICATION LETTER
May 1, 2015
Board of TrusteesTeachers Retirement System of GeorgiaSuite 100, Two Northside 75Atlanta, GA 30318
Members of the Board:
Section 47-3-23 of the law governing the operation of the Teachers Retirement System of Georgia provides that the actuary shall make annual valuations of the contingent assets and liabilities of the Retirement System on the basis of regular interest and the tables last adopted by the Board of Trustees. We have submitted the report giving the results of the actuarial valuation of the System prepared as of June 30, 2014. The report indicates that annual employer contributions at the rate of 14.27% of compensation for the fiscal year ending June 30, 2017 are sufficient to support the benefits of the System. Our firm, as actuary, is responsible for all of the actuarial trend data in the financial section of the annual report and the supporting schedules in the actuarial section of the annual report. In our opinion, the valuation is complete and accurate, and the methodology and assumptions are reasonable as a basis for the valuation. The valuation takes into account the effect of all amendments to the System enacted through the 2014 Session of the General Assembly. In preparing the valuation, the actuary relied on data provided by the System. While not verifying data at the source, the actuary performed tests for consistency and reasonableness.
The System is funded on an actuarial reserve basis. The actuarial assumptions recommended by the actuary and adopted by the Board are both individually and in the aggregate reasonably related to the experience under the System and to reasonable expectations of anticipated experience under the System. The assumptions and methods used for funding purposes meet the parameters set for the disclosures presented in the financial section by Governmental Accounting Standards Board (GASB) Statement No. 27 and those outlined in the Board’s funding policy. The funding objective of the plan is that contribution rates over time will remain level as a percent of payroll. The valuation method used is the entry age normal cost method. The normal contribution rate to cover current cost has been determined as a level percent of payroll. Gains and losses are reflected in the unfunded accrued liability, which is amortized as a level percent of payroll in accordance with the funding policy adopted by the Board.
The necessary GASB Statement No. 67 disclosure information has been provided in a separate supplemental report.
The System is being funded in conformity with the minimum funding standard set forth in Code Section 47-20-10 of the Public Retirement Systems Standards Law. In our opinion the System is operating on an actuarially sound basis. Assuming that contributions to the System are made by the employer from year to year in the future at the rates recommended on the basis of the successive actuarial valuations, the continued sufficiency of the retirement fund to provide the benefits called for under the System may be safely anticipated.
Future actuarial results may differ significantly from the current results presented in this report due to such factors as the following: plan experience differing from that anticipated by the economic or demographic assumptions;
48 Actuarial Section
ACTUARY’S CERTIFICATION LETTERchanges in economic or demographic assumptions; increases or decreases expected as part of the natural operation of the methodology used for these measurements (such as the end of an amortization period or additional cost or contribution requirements based on the plan’s funded status); and changes in plan provisions or applicable law. Since the potential impact of such factors is outside the scope of a normal annual actuarial valuation, an analysis of the range of results is not presented herein.
This is to certify that the independent consulting actuary is a member of the American Academy of Actuaries and has experience in performing valuations for public retirement systems, that the valuation was prepared in accordance with principles of practice prescribed by the Actuarial Standards Board, and that the actuarial calculations were performed by qualified actuaries in accordance with accepted actuarial procedures, based on the current provisions of the retirement system and on actuarial assumptions that are internally consistent and reasonably based on the actual experience of the System.
Sincerely yours,
Edward A. Macdonald, ASA, FCA, MAAA President
Cathy TurcotPrincipal and Managing Director
John J. Garrett, ASA, FCA, MAAAPrincipal and Consulting Actuary
continued
49Actuarial Section
SUMMARY OF ACTUARIAL ASSUMPTIONS & METHODS The laws governing the Teachers Retirement System of Georgia (the “System”) provide that an actuary perform an annual valuation of the contingent assets and liabilities of the System and perform at least once every five years an actuarial investigation of the mortality, service, and compensation experience of the members and beneficiaries of the System. The latest actuarial valuation of the System prepared as of June 30, 2014, was made on the basis of the funding policy adopted by the Board on November 20, 2013 and the 5-year experience study adopted by the Board on November 17, 2010. The Board is responsible for maintaining this funding policy. A summary of plan provisions can be found in the Introductory Section beginning on page 12, and a plan description can be found in the Financial Section beginning on page 15.
The more pertinent facts and significant assumptions underlying the computations included in the June 30, 2014 valuation are as follows:
a) Actuarial Method Used. The actuarial cost method used for funding purposes is the Entry Age Normal method, which is the same cost method used for financial reporting purposes. The Entry Age Normal method is the most commonly used funding method among public retirement plans. This cost method allocates the cost of benefits over each member’s expected career as a level percentage of their expected salary and demonstrates the highest degree of stability in the calculation of a plan’s normal cost over time. Gains and losses are reflected in the unfunded accrued liability. Adopted November 20, 2013.
b) Ultimate Investment Return. 7.50% compounded annually, which consists of a 4.50% assumed real rate of return and a 3.00% assumed annual rate of inflation. This long-term expected rate of return is used to determine the total pension liability for financial reporting purposes. Adopted November 20, 2013.
c) Salary Increases. Salaries are expected to increase 3.75% to 7.00% annually depending upon the members’ years of creditable service. The salary increase includes a 0.75% assumed real rate of wage inflation and a 3.00% assumed annual rate of inflation. Adopted November 17, 2010.
d) Death, Disability and Withdrawal Rates. Death, disability and withdrawal rates for active employees and service retirement tables are based upon the System’s historical experience. The death-after-retirement rates are based on the RP-2000 Combined Mortality Table (set back two years for males and three years for females). The death-after-disability retirement rates are based on the RP-2000 Disabled Mortality Table (set back two years for males). Adopted November 17, 2010.
e) Asset Valuation Method. In accordance with the funding policy, the actuarial value of the assets was set equal to the market value of assets on June 30, 2014. Five-year smoothing of investment gains and losses will commence in subsequent years. The actuarial value of assets recognizes a portion of the difference between the market value of the assets and the expected value of assets, based on the assumed valuation rate of return. The amount recognized in subsequent years will be one-fifth of the difference between market value and actuarial expected value. Adopted November 20, 2013. The actuarial value of assets is limited to a range between 75% and 125% of market value. Adopted July 27, 2011.
f) Service Retirement Benefit. The service benefit (pension) paid to members is an annuity that is owed to them at retirement that will provide a total annual pension equal to 2% of the member’s average compensation over the two consecutive years of membership service producing the highest such average, multiplied by the number of years of creditable service up to 40 years. It is also assumed that certain cost-of-living adjustments will be made in future years.
g) Actuarially Determined Unfunded Accrued Liability. The present value of the unfunded accrued liability, based on unaudited data provided the actuary by the System, was approximately $13.7 billion at June 30, 2014.
50 Actuarial Section
SUMMARY OF ACTUARIAL ASSUMPTIONS & METHODSh) Valuation Interest Rate Smoothing. The valuation
liabilities are calculated using a smoothed interest rate method. The interest rate assumed during the look-forward period (currently 23 years from the valuation date) is the investment rate of return expected to be earned during the look-forward period based on the actual rate of return earned during the look-back period (currently 7 years) such that the average assumed rate of return over the combined 30-year period is equivalent to the assumed ultimate investment rate of return (currently 7.50%). The interest rate after the 23-year look-forward period is the ultimate investment rate of return of 7.50%. Adopted November 20, 2013. The smoothed interest rate used during the 23-year look-forward period is subject to a corridor around the annual expected rate of return to limit the extent that the calculated smoothed rate can vary from the long-term investment rate of return. Adopted November 20, 2013.
(1) Member 6.00%
(2) Employer: Normal 6.56% Unfunded Accrued Liability 7.71% Total 14.27%
continued
i) Required Contributions (% of compensation). Contributions required by the annual actuarial valua-tion as of June 30, 2014, to be made for the year ended June 30, 2017.
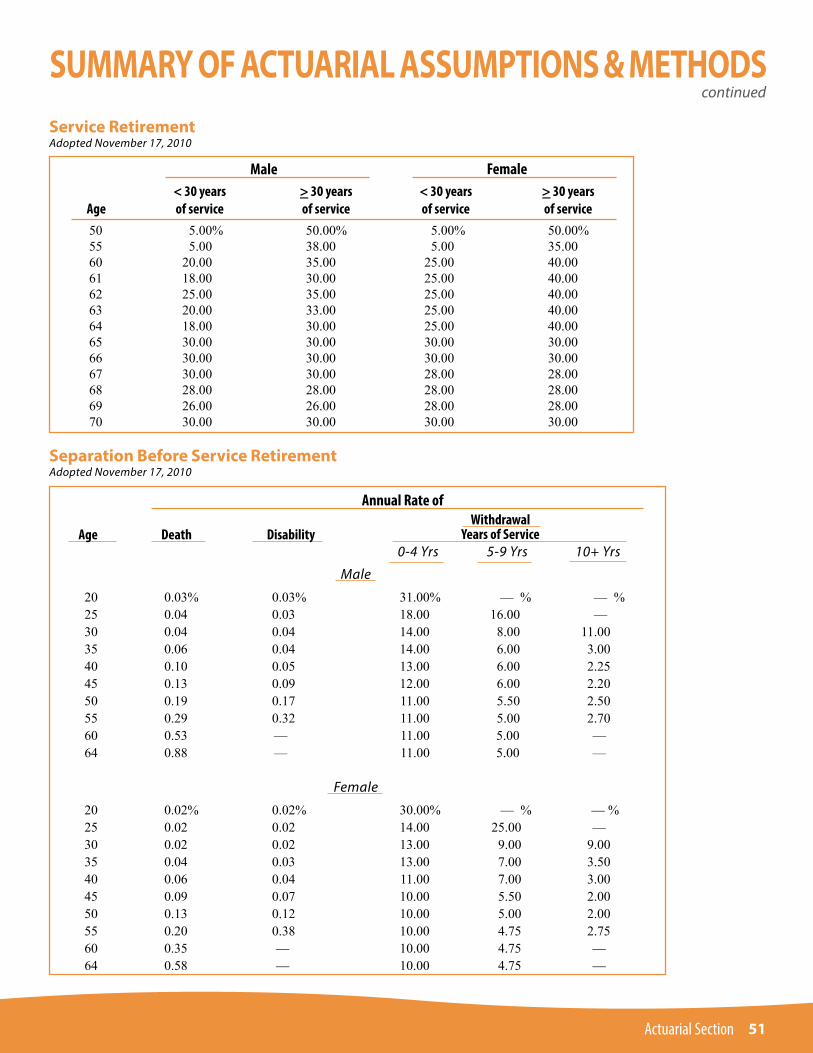
51Actuarial Section
continuedSUMMARY OF ACTUARIAL ASSUMPTIONS & METHODSService RetirementAdopted November 17, 2010
Separation Before Service RetirementAdopted November 17, 2010
0-4 Yrs 5-9 Yrs 10+ Yrs
Male
20 0.03% 0.03% 31.00% — % — % 25 0.04 0.03 18.00 16.00 — 30 0.04 0.04 14.00 8.00 11.00 35 0.06 0.04 14.00 6.00 3.00 40 0.10 0.05 13.00 6.00 2.25 45 0.13 0.09 12.00 6.00 2.20 50 0.19 0.17 11.00 5.50 2.50 55 0.29 0.32 11.00 5.00 2.70 60 0.53 — 11.00 5.00 — 64 0.88 — 11.00 5.00 —
Female
20 0.02% 0.02% 30.00% — % — % 25 0.02 0.02 14.00 25.00 — 30 0.02 0.02 13.00 9.00 9.00 35 0.04 0.03 13.00 7.00 3.50 40 0.06 0.04 11.00 7.00 3.00 45 0.09 0.07 10.00 5.50 2.00 50 0.13 0.12 10.00 5.00 2.00 55 0.20 0.38 10.00 4.75 2.75 60 0.35 — 10.00 4.75 — 64 0.58 — 10.00 4.75 —
Annual Rate ofWithdrawal
Years of Service Age Death Disability
< 30 years > 30 years < 30 years > 30 years Age of service of service of service of service
Male Female
50 5.00% 50.00% 5.00% 50.00% 55 5.00 38.00 5.00 35.00 60 20.00 35.00 25.00 40.00 61 18.00 30.00 25.00 40.00 62 25.00 35.00 25.00 40.00 63 20.00 33.00 25.00 40.00 64 18.00 30.00 25.00 40.00 65 30.00 30.00 30.00 30.00 66 30.00 30.00 30.00 30.00 67 30.00 30.00 28.00 28.00 68 28.00 28.00 28.00 28.00 69 26.00 26.00 28.00 28.00 70 30.00 30.00 30.00 30.00
– –
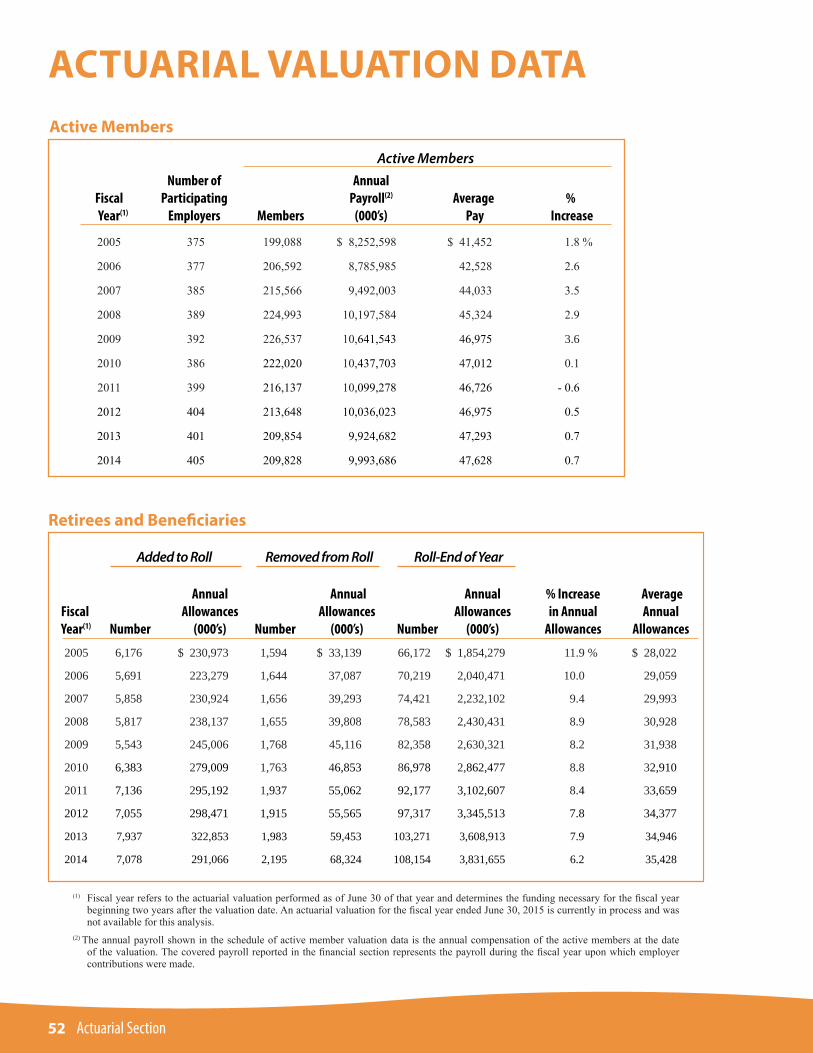
52 Actuarial Section
ACTUARIAL VALUATION DATAActive Members
Retirees and Beneficiaries
Active Members Number of Annual Fiscal Participating Payroll(2) Average % Year(1) Employers Members (000’s) Pay Increase
2005 375 199,088 $ 8,252,598 $ 41,452 1.8 %
2006 377 206,592 8,785,985 42,528 2.6
2007 385 215,566 9,492,003 44,033 3.5
2008 389 224,993 10,197,584 45,324 2.9
2009 392 226,537 10,641,543 46,975 3.6
2010 386 222,020 10,437,703 47,012 0.1
2011 399 216,137 10,099,278 46,726 - 0.6
2012 404 213,648 10,036,023 46,975 0.5
2013 401 209,854 9,924,682 47,293 0.7
2014 405 209,828 9,993,686 47,628 0.7
Added to Roll Removed from Roll Roll-End of Year
Annual Annual Annual % Increase AverageFiscal Allowances Allowances Allowances in Annual AnnualYear(1) Number (000’s) Number (000’s) Number (000’s) Allowances Allowances
2005 6,176 $ 230,973 1,594 $ 33,139 66,172 $ 1,854,279 11.9 % $ 28,022
2006 5,691 223,279 1,644 37,087 70,219 2,040,471 10.0 29,059
2007 5,858 230,924 1,656 39,293 74,421 2,232,102 9.4 29,993
2008 5,817 238,137 1,655 39,808 78,583 2,430,431 8.9 30,928
2009 5,543 245,006 1,768 45,116 82,358 2,630,321 8.2 31,938
2010 6,383 279,009 1,763 46,853 86,978 2,862,477 8.8 32,910
2011 7,136 295,192 1,937 55,062 92,177 3,102,607 8.4 33,659
2012 7,055 298,471 1,915 55,565 97,317 3,345,513 7.8 34,377
2013 7,937 322,853 1,983 59,453 103,271 3,608,913 7.9 34,946
2014 7,078 291,066 2,195 68,324 108,154 3,831,655 6.2 35,428
(1) Fiscal year refers to the actuarial valuation performed as of June 30 of that year and determines the funding necessary for the fiscal year beginning two years after the valuation date. An actuarial valuation for the fiscal year ended June 30, 2015 is currently in process and was not available for this analysis.
(2) The annual payroll shown in the schedule of active member valuation data is the annual compensation of the active members at the date of the valuation. The covered payroll reported in the financial section represents the payroll during the fiscal year upon which employer contributions were made.
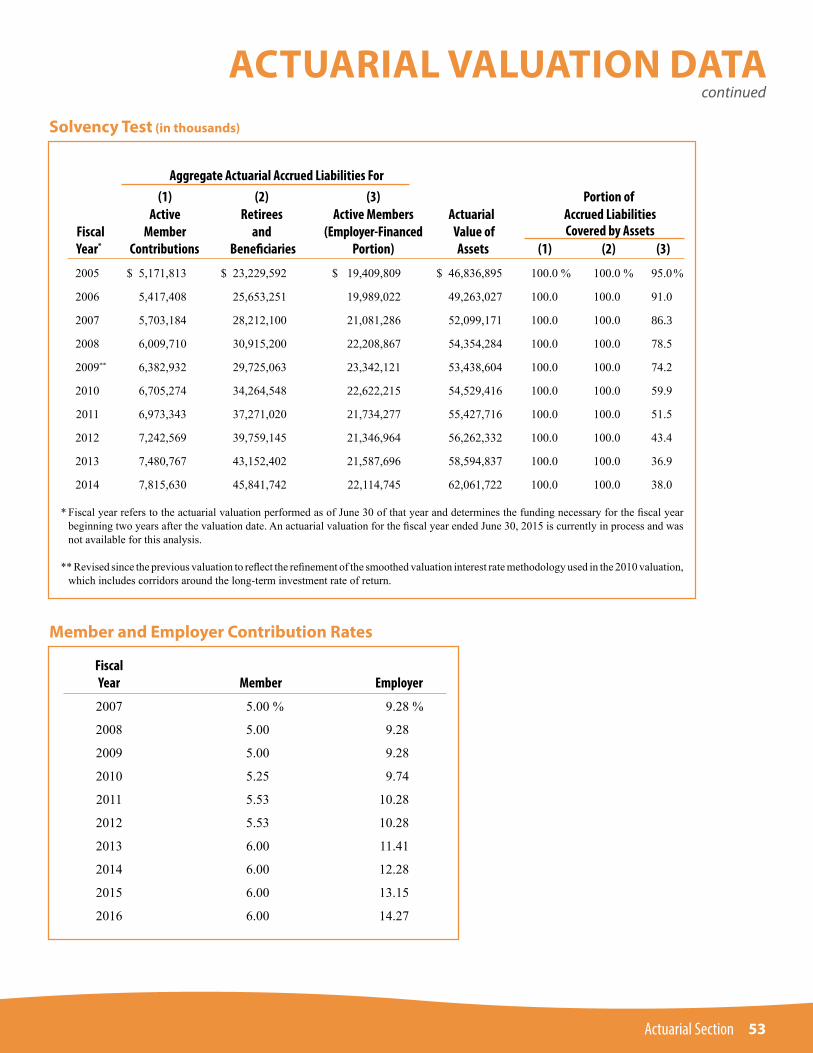
53Actuarial Section
continuedACTUARIAL VALUATION DATA
Solvency Test (in thousands)
Aggregate Actuarial Accrued Liabilities For (1) (2) (3) Portion of Active Retirees Active Members Actuarial Accrued Liabilities Fiscal Member and (Employer-Financed Value of Covered by Assets Year* Contributions Beneficiaries Portion) Assets (1) (2) (3)
2005 $ 5,171,813 $ 23,229,592 $ 19,409,809 $ 46,836,895 100.0 % 100.0 % 95.0 %
2006 5,417,408 25,653,251 19,989,022 49,263,027 100.0 100.0 91.0
2007 5,703,184 28,212,100 21,081,286 52,099,171 100.0 100.0 86.3
2008 6,009,710 30,915,200 22,208,867 54,354,284 100.0 100.0 78.5
2009** 6,382,932 29,725,063 23,342,121 53,438,604 100.0 100.0 74.2
2010 6,705,274 34,264,548 22,622,215 54,529,416 100.0 100.0 59.9
2011 6,973,343 37,271,020 21,734,277 55,427,716 100.0 100.0 51.5
2012 7,242,569 39,759,145 21,346,964 56,262,332 100.0 100.0 43.4
2013 7,480,767 43,152,402 21,587,696 58,594,837 100.0 100.0 36.9
2014 7,815,630 45,841,742 22,114,745 62,061,722 100.0 100.0 38.0
* Fiscal year refers to the actuarial valuation performed as of June 30 of that year and determines the funding necessary for the fiscal year beginning two years after the valuation date. An actuarial valuation for the fiscal year ended June 30, 2015 is currently in process and was not available for this analysis.
** Revised since the previous valuation to reflect the refinement of the smoothed valuation interest rate methodology used in the 2010 valuation, which includes corridors around the long-term investment rate of return.
Member and Employer Contribution Rates
Fiscal Year Member Employer
2007 5.00 % 9.28 %
2008 5.00 9.28
2009 5.00 9.28
2010 5.25 9.74
2011 5.53 10.28
2012 5.53 10.28
2013 6.00 11.41
2014 6.00 12.28
2015 6.00 13.15
2016 6.00 14.27
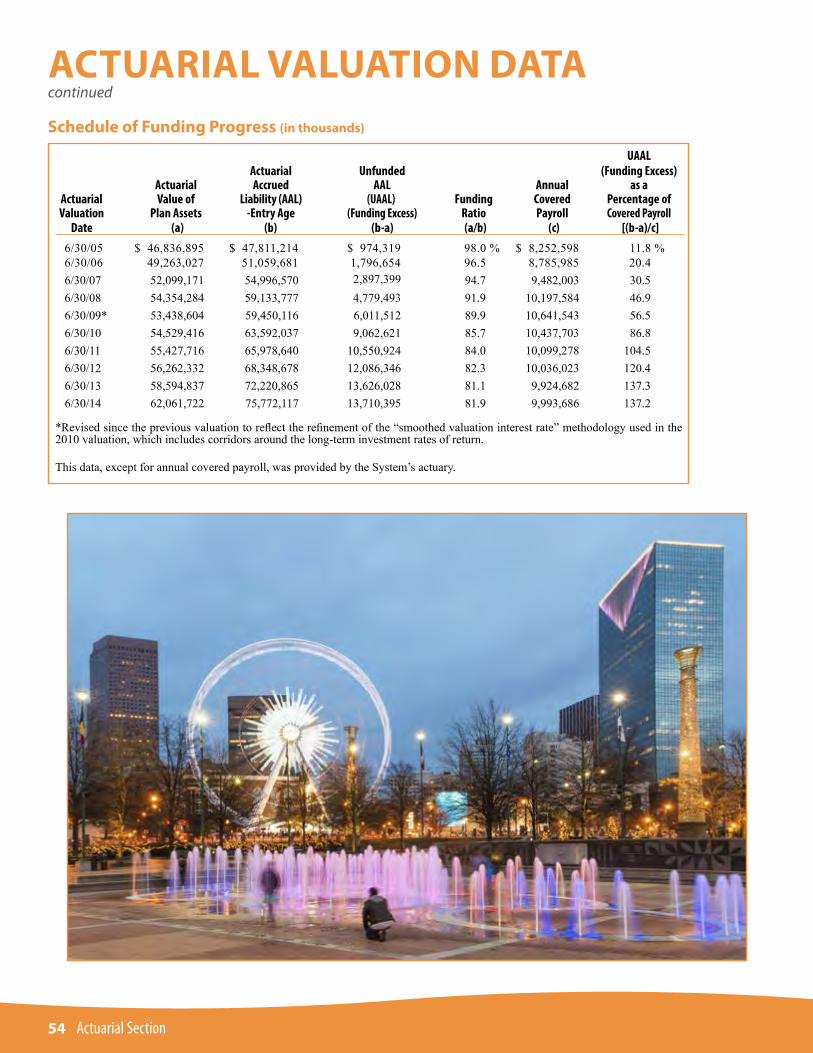
54 Actuarial Section
ACTUARIAL VALUATION DATASchedule of Funding Progress (in thousands)
UAAL Actuarial Unfunded (Funding Excess) Actuarial Accrued AAL Annual as a Actuarial Value of Liability (AAL) (UAAL) Funding Covered Percentage of Valuation Plan Assets -Entry Age (Funding Excess) Ratio Payroll Covered Payroll Date (a) (b) (b-a) (a/b) (c) [(b-a)/c] 6/30/05 $ 46,836,895 $ 47,811,214 $ 974,319 98.0 % $ 8,252,598 11.8 % 6/30/06 49,263,027 51,059,681 1,796,654 96.5 8,785,985 20.4 6/30/07 52,099,171 54,996,570 2,897,399 94.7 9,482,003 30.5 6/30/08 54,354,284 59,133,777 4,779,493 91.9 10,197,584 46.9 6/30/09* 53,438,604 59,450,116 6,011,512 89.9 10,641,543 56.5 6/30/10 54,529,416 63,592,037 9,062,621 85.7 10,437,703 86.8 6/30/11 55,427,716 65,978,640 10,550,924 84.0 10,099,278 104.5 6/30/12 56,262,332 68,348,678 12,086,346 82.3 10,036,023 120.4 6/30/13 58,594,837 72,220,865 13,626,028 81.1 9,924,682 137.3 6/30/14 62,061,722 75,772,117 13,710,395 81.9 9,993,686 137.2
*Revised since the previous valuation to reflect the refinement of the “smoothed valuation interest rate” methodology used in the 2010 valuation, which includes corridors around the long-term investment rates of return.
This data, except for annual covered payroll, was provided by the System’s actuary.
continued
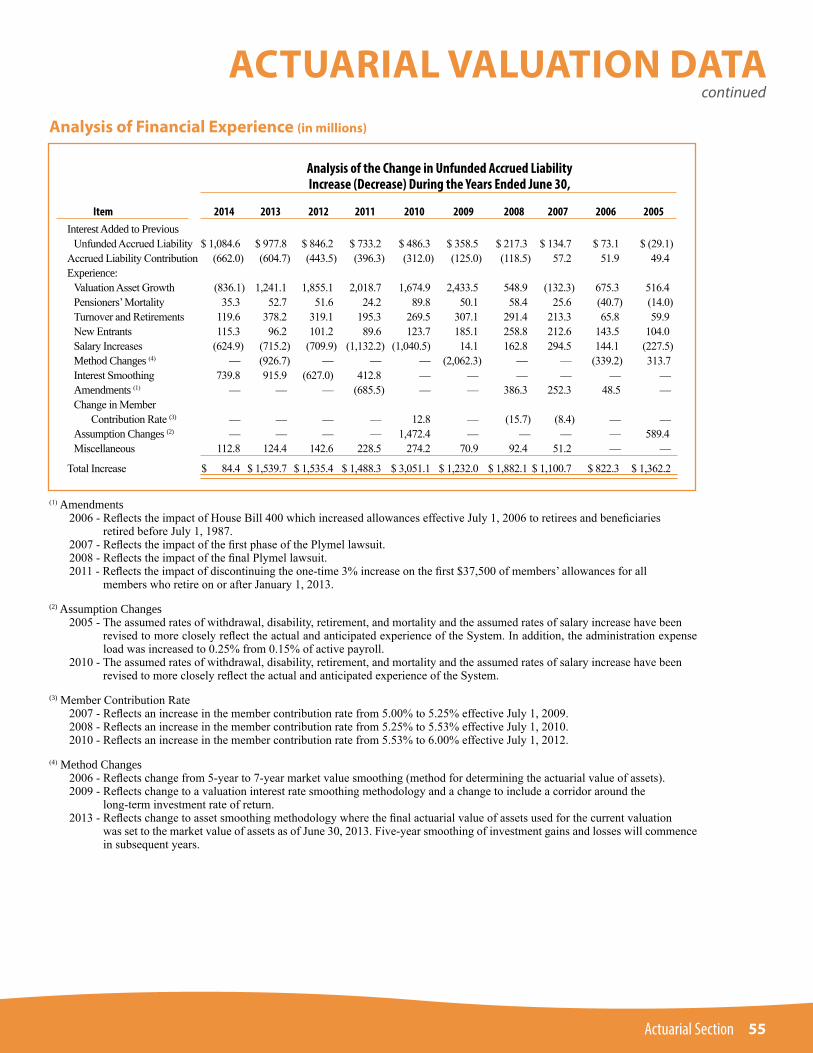
55Actuarial Section
ACTUARIAL VALUATION DATAcontinued
(1) Amendments 2006 - Reflects the impact of House Bill 400 which increased allowances effective July 1, 2006 to retirees and beneficiaries
retired before July 1, 1987. 2007 - Reflects the impact of the first phase of the Plymel lawsuit. 2008 - Reflects the impact of the final Plymel lawsuit. 2011 - Reflects the impact of discontinuing the one-time 3% increase on the first $37,500 of members’ allowances for all
members who retire on or after January 1, 2013.
(2) Assumption Changes 2005 - The assumed rates of withdrawal, disability, retirement, and mortality and the assumed rates of salary increase have been
revised to more closely reflect the actual and anticipated experience of the System. In addition, the administration expense load was increased to 0.25% from 0.15% of active payroll.
2010 - The assumed rates of withdrawal, disability, retirement, and mortality and the assumed rates of salary increase have been revised to more closely reflect the actual and anticipated experience of the System.
(3) Member Contribution Rate 2007 - Reflects an increase in the member contribution rate from 5.00% to 5.25% effective July 1, 2009. 2008 - Reflects an increase in the member contribution rate from 5.25% to 5.53% effective July 1, 2010. 2010 - Reflects an increase in the member contribution rate from 5.53% to 6.00% effective July 1, 2012.
(4) Method Changes 2006 - Reflects change from 5-year to 7-year market value smoothing (method for determining the actuarial value of assets). 2009 - Reflects change to a valuation interest rate smoothing methodology and a change to include a corridor around the
long-term investment rate of return. 2013 - Reflects change to asset smoothing methodology where the final actuarial value of assets used for the current valuation
was set to the market value of assets as of June 30, 2013. Five-year smoothing of investment gains and losses will commence in subsequent years.
Analysis of Financial Experience (in millions)
Analysis of the Change in Unfunded Accrued Liability Increase (Decrease) During the Years Ended June 30,
Item 2014 2013 2012 2011 2010 2009 2008 2007 2006 2005Interest Added to Previous Unfunded Accrued Liability $ 1,084.6 $ 977.8 $ 846.2 $ 733.2 $ 486.3 $ 358.5 $ 217.3 $ 134.7 $ 73.1 $ (29.1)Accrued Liability Contribution (662.0) (604.7) (443.5) (396.3) (312.0) (125.0) (118.5) 57.2 51.9 49.4Experience: Valuation Asset Growth (836.1) 1,241.1 1,855.1 2,018.7 1,674.9 2,433.5 548.9 (132.3) 675.3 516.4 Pensioners’ Mortality 35.3 52.7 51.6 24.2 89.8 50.1 58.4 25.6 (40.7) (14.0) Turnover and Retirements 119.6 378.2 319.1 195.3 269.5 307.1 291.4 213.3 65.8 59.9 New Entrants 115.3 96.2 101.2 89.6 123.7 185.1 258.8 212.6 143.5 104.0 Salary Increases (624.9) (715.2) (709.9) (1,132.2) (1,040.5) 14.1 162.8 294.5 144.1 (227.5) Method Changes (4) — (926.7) — — — (2,062.3) — — (339.2) 313.7 Interest Smoothing 739.8 915.9 (627.0) 412.8 — — — — — — Amendments (1) — — — (685.5) — — 386.3 252.3 48.5 — Change in Member Contribution Rate (3) — — — — 12.8 — (15.7) (8.4) — — Assumption Changes (2) — — — — 1,472.4 — — — — 589.4 Miscellaneous 112.8 124.4 142.6 228.5 274.2 70.9 92.4 51.2 — —
Total Increase $ 84.4 $ 1,539.7 $ 1,535.4 $ 1,488.3 $ 3,051.1 $ 1,232.0 $ 1,882.1 $ 1,100.7 $ 822.3 $ 1,362.2
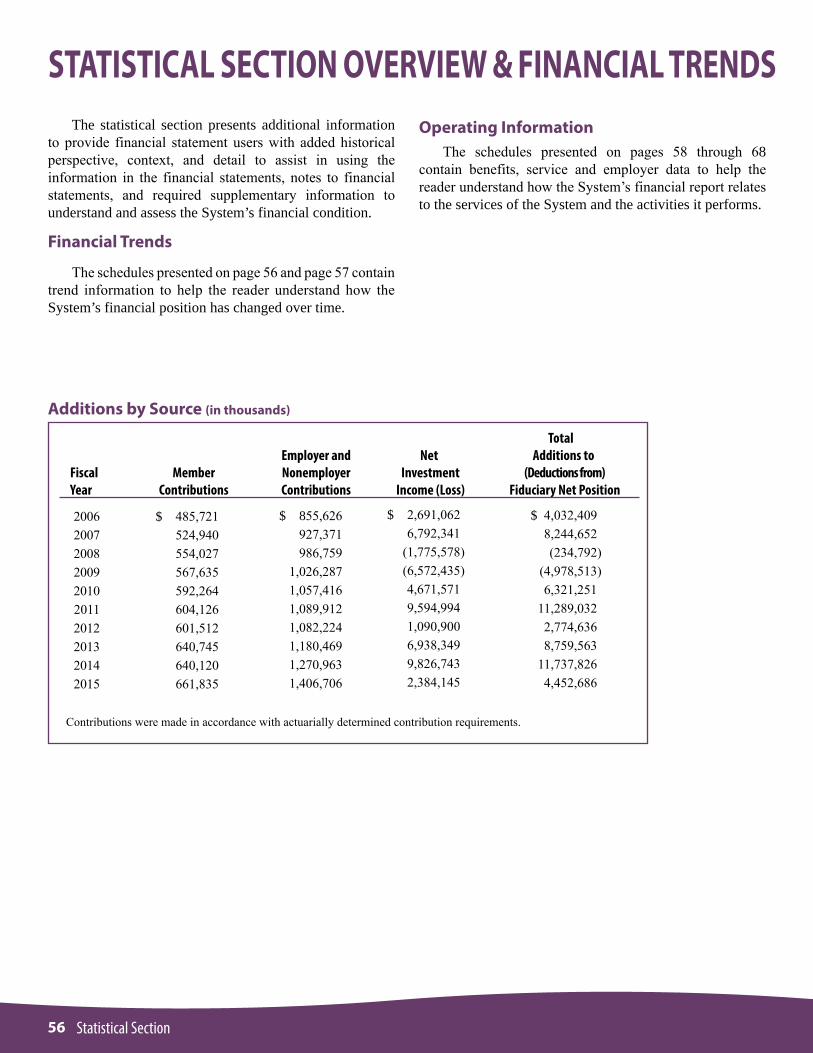
56 Statistical Section
STATISTICAL SECTION OVERVIEW & FINANCIAL TRENDS The statistical section presents additional information to provide financial statement users with added historical perspective, context, and detail to assist in using the information in the financial statements, notes to financial statements, and required supplementary information to understand and assess the System’s financial condition.
Financial Trends
The schedules presented on page 56 and page 57 contain trend information to help the reader understand how the System’s financial position has changed over time.
Additions by Source (in thousands)
Total Employer and Net Additions to
Fiscal Member Nonemployer Investment (Deductions from) Year Contributions Contributions Income (Loss) Fiduciary Net Position
2006200720082009201020112012201320142015
$ 485,721524,940554,027567,635592,264604,126601,512640,745640,120661,835
$ 855,626927,371986,759
1,026,2871,057,4161,089,9121,082,2241,180,4691,270,9631,406,706
$ 2,691,062 6,792,341 (1,775,578) (6,572,435) 4,671,571 9,594,994
1,090,900 6,938,349 9,826,743 2,384,145
$ 4,032,409 8,244,652 (234,792) (4,978,513) 6,321,251 11,289,032
2,774,636 8,759,563 11,737,826 4,452,686
Contributions were made in accordance with actuarially determined contribution requirements.
Operating Information The schedules presented on pages 58 through 68 contain benefits, service and employer data to help the reader understand how the System’s financial report relates to the services of the System and the activities it performs.
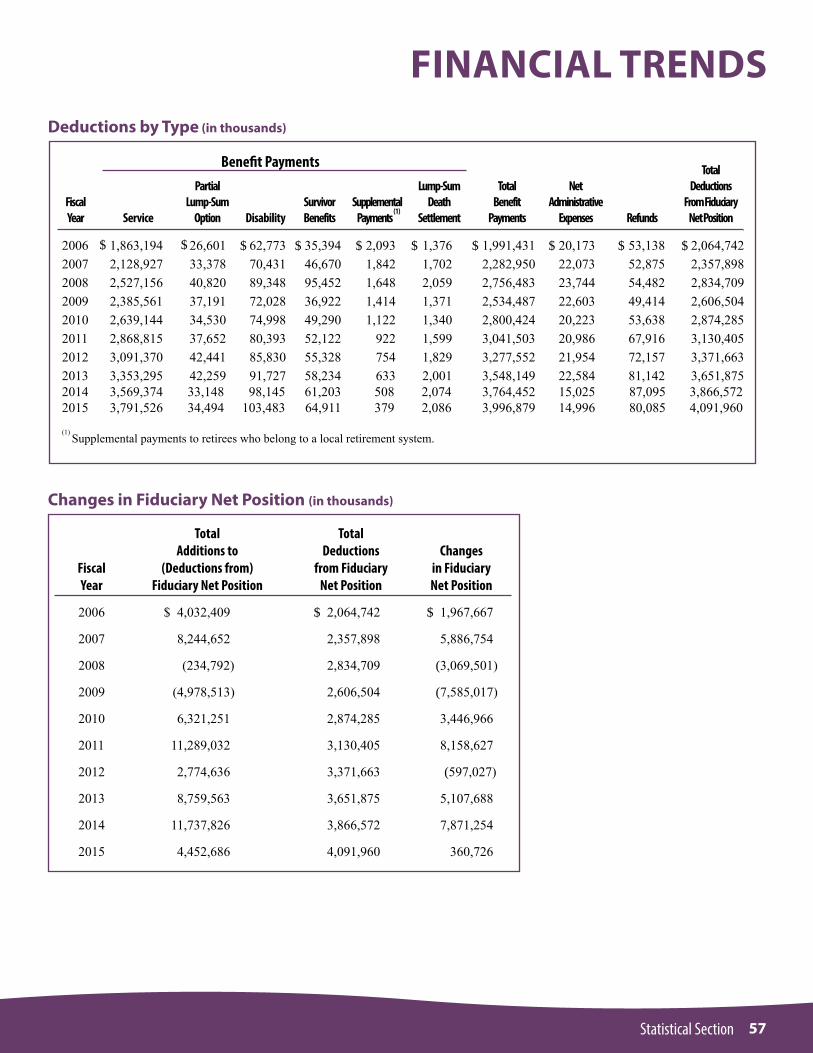
57Statistical Section
FINANCIAL TRENDSDeductions by Type (in thousands)
2006 1,863,194 26,601 62,773 35,394 2,093 1,376 1,991,431 20,173 53,138 2,064,742 2007 2,128,927 33,378 70,431 46,670 1,842 1,702 2,282,950 22,073 52,875 2,357,8982008 2,527,156 40,820 89,348 95,452 1,648 2,059 2,756,483 23,744 54,482 2,834,7092009 2,385,561 37,191 72,028 36,922 1,414 1,371 2,534,487 22,603 49,414 2,606,504 2010 2,639,144 34,530 74,998 49,290 1,122 1,340 2,800,424 20,223 53,638 2,874,285 2011 2,868,815 37,652 80,393 52,122 922 1,599 3,041,503 20,986 67,916 3,130,4052012 3,091,370 42,441 85,830 55,328 754 1,829 3,277,552 21,954 72,157 3,371,663 2013 3,353,295 42,259 91,727 58,234 633 2,001 3,548,149 22,584 81,142 3,651,875 2014 3,569,374 33,148 98,145 61,203 508 2,074 3,764,452 15,025 87,095 3,866,5722015 3,791,526 34,494 103,483 64,911 379 2,086 3,996,879 14,996 80,085 4,091,960 (1) Supplemental payments to retirees who belong to a local retirement system.
Fiscal Year Service
PartialLump-Sum
Option DisabilitySurvivorBenefits
Supplemental Payments
(1)
Lump-SumDeath
Settlement
Benefit PaymentsTotal
BenefitPayments
NetAdministrative
Expenses Refunds
TotalDeductions
From Fiduciary Net Position
$$ $$$$$$$$
Total Total Additions to Deductions Changes Fiscal (Deductions from) from Fiduciary in Fiduciary Year Fiduciary Net Position Net Position Net Position
2006 $ 4,032,409 $ 2,064,742 $ 1,967,667
2007 8,244,652 2,357,898 5,886,754
2008 (234,792) 2,834,709 (3,069,501)
2009 (4,978,513) 2,606,504 (7,585,017)
2010 6,321,251 2,874,285 3,446,966
2011 11,289,032 3,130,405 8,158,627
2012 2,774,636 3,371,663 (597,027)
2013 8,759,563 3,651,875 5,107,688
2014 11,737,826 3,866,572 7,871,254
2015 4,452,686 4,091,960 360,726
Changes in Fiduciary Net Position (in thousands)
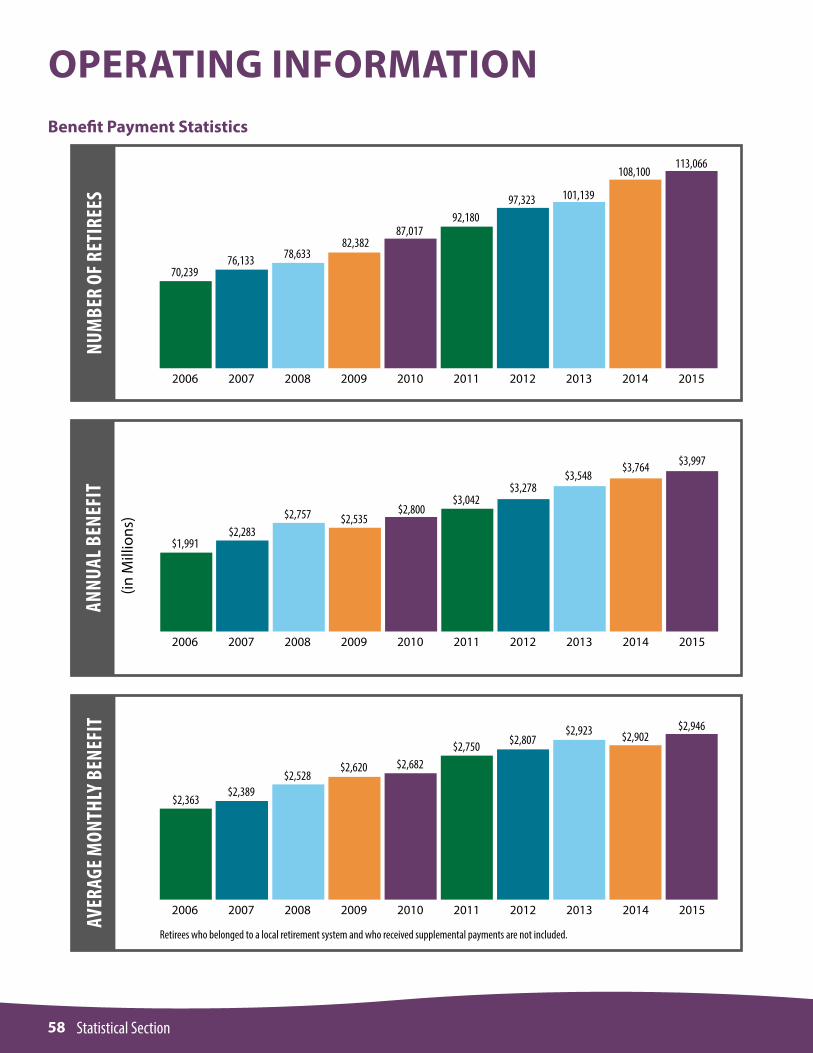
58 Statistical Section
OPERATING INFORMATION
20152006 2007 2008 2009 2010 2011 2012 2013 2014
$3,997
$1,991$2,283
$2,757 $2,535$2,800
$3,042$3,278
$3,548$3,764
ANNU
AL B
ENEF
IT
(in M
illio
ns)
20152006 2007 2008 2009 2010 2011 2012 2013 2014
70,23976,133 78,633
82,38287,017
92,18097,323 101,139
108,100113,066
NUM
BER
OF R
ETIR
EES
20152006 2007 2008 2009 2010 2011 2012 2013 2014
$2,946
$2,363$2,389
$2,528$2,620 $2,682
$2,750 $2,807$2,923 $2,902
AVER
AGE M
ONTH
LY B
ENEF
IT
Benefit Payment Statistics
Retirees who belonged to a local retirement system and who received supplemental payments are not included.
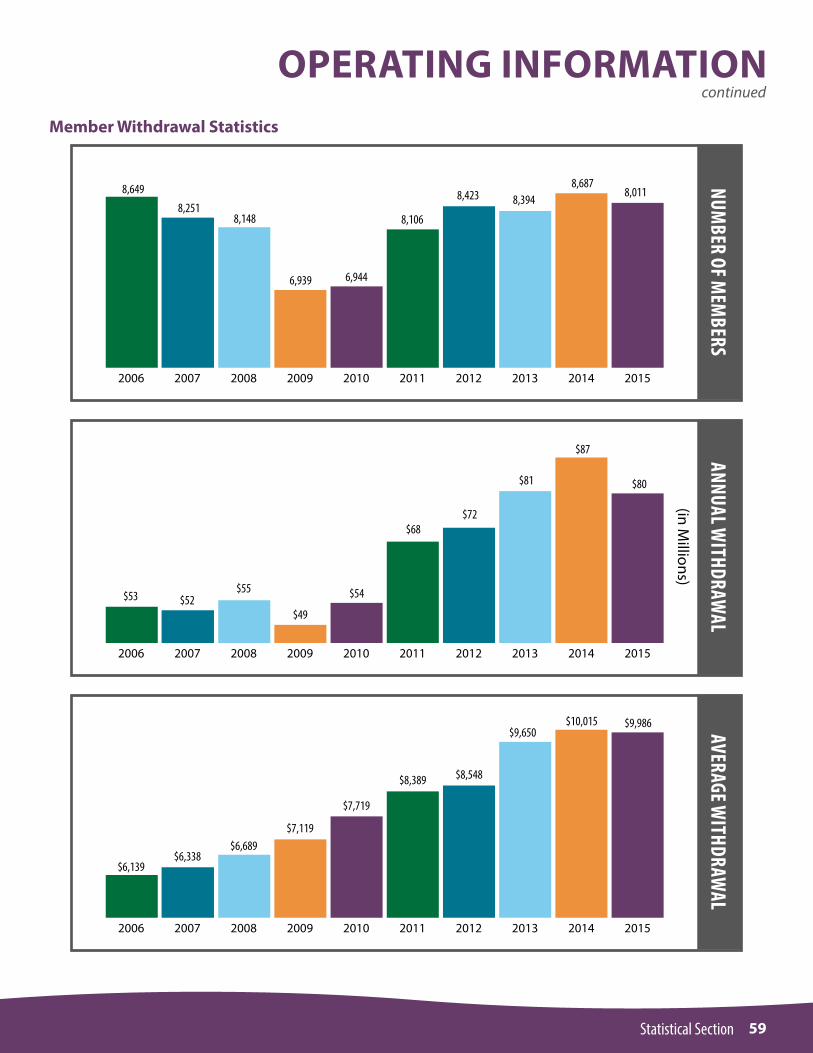
59Statistical Section
continuedOPERATING INFORMATION
ANNUAL WITHDRAW
ALNUM
BER OF MEM
BERSMember Withdrawal Statistics
20152006 2007 2008 2009 2010 2011 2012 2013 2014
8,6498,251
8,148
6,939 6,944
8,106
8,423 8,3948,687
8,011
20152006 2007 2008 2009 2010 2011 2012 2013 2014
$53 $52$55
$49
$54
$68$72
$81
20152006 2007 2008 2009 2010 2011 2012 2013 2014
$6,139$6,338
$6,689$7,119
$7,719
$8,389 $8,548
$9,650 AVERAGE WITHDRAW
AL
(in Millions)
$87
$80
$10,015 $9,986
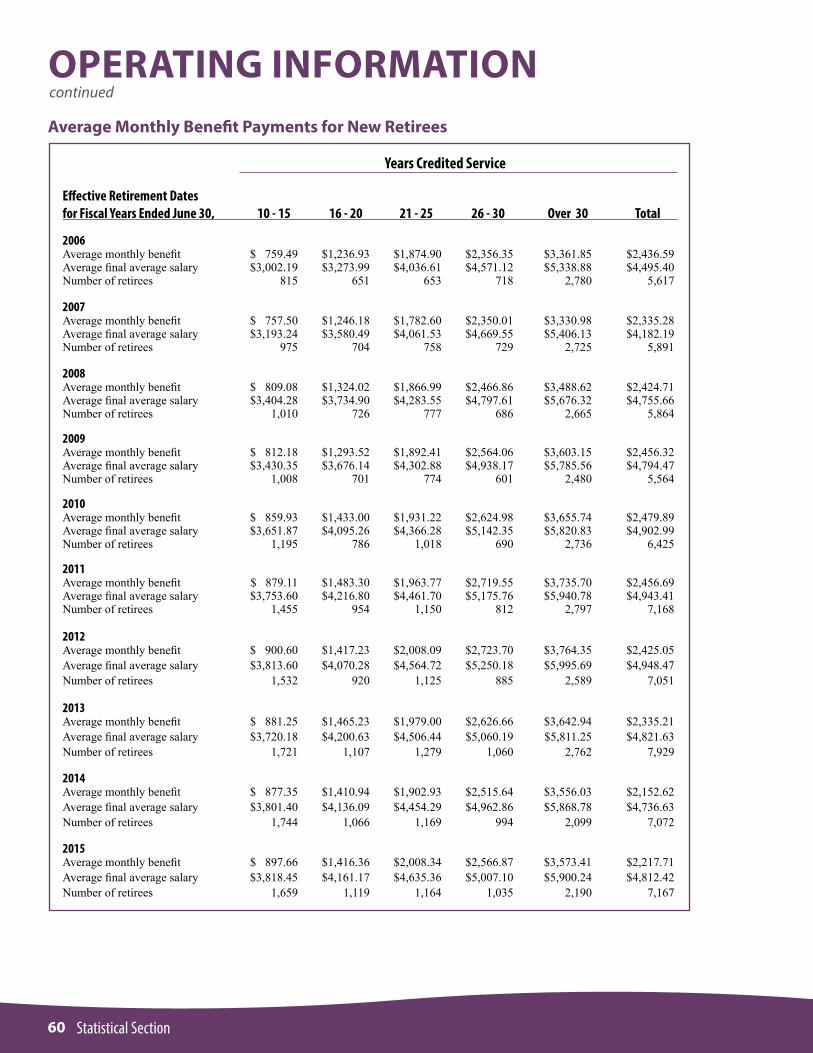
60 Statistical Section
OPERATING INFORMATIONAverage Monthly Benefit Payments for New Retirees
Years Credited Service Effective Retirement Dates for Fiscal Years Ended June 30, 10 - 15 16 - 20 21 - 25 26 - 30 Over 30 Total 2006 Average monthly benefit $ 759.49 $1,236.93 $1,874.90 $2,356.35 $3,361.85 $2,436.59Average final average salary $3,002.19 $3,273.99 $4,036.61 $4,571.12 $5,338.88 $4,495.40Number of retirees 815 651 653 718 2,780 5,617 2007 Average monthly benefit $ 757.50 $1,246.18 $1,782.60 $2,350.01 $3,330.98 $2,335.28Average final average salary $3,193.24 $3,580.49 $4,061.53 $4,669.55 $5,406.13 $4,182.19Number of retirees 975 704 758 729 2,725 5,891 2008 Average monthly benefit $ 809.08 $1,324.02 $1,866.99 $2,466.86 $3,488.62 $2,424.71Average final average salary $3,404.28 $3,734.90 $4,283.55 $4,797.61 $5,676.32 $4,755.66Number of retirees 1,010 726 777 686 2,665 5,864
2009Average monthly benefit $ 812.18 $1,293.52 $1,892.41 $2,564.06 $3,603.15 $2,456.32Average final average salary $3,430.35 $3,676.14 $4,302.88 $4,938.17 $5,785.56 $4,794.47Number of retirees 1,008 701 774 601 2,480 5,564
2010Average monthly benefit $ 859.93 $1,433.00 $1,931.22 $2,624.98 $3,655.74 $2,479.89Average final average salary $3,651.87 $4,095.26 $4,366.28 $5,142.35 $5,820.83 $4,902.99Number of retirees 1,195 786 1,018 690 2,736 6,425
2011Average monthly benefit $ 879.11 $1,483.30 $1,963.77 $2,719.55 $3,735.70 $2,456.69Average final average salary $3,753.60 $4,216.80 $4,461.70 $5,175.76 $5,940.78 $4,943.41Number of retirees 1,455 954 1,150 812 2,797 7,168
2012Average monthly benefit $ 900.60 $1,417.23 $2,008.09 $2,723.70 $3,764.35 $2,425.05 Average final average salary $3,813.60 $4,070.28 $4,564.72 $5,250.18 $5,995.69 $4,948.47Number of retirees 1,532 920 1,125 885 2,589 7,051
2013Average monthly benefit $ 881.25 $1,465.23 $1,979.00 $2,626.66 $3,642.94 $2,335.21Average final average salary $3,720.18 $4,200.63 $4,506.44 $5,060.19 $5,811.25 $4,821.63Number of retirees 1,721 1,107 1,279 1,060 2,762 7,929
2014Average monthly benefit $ 877.35 $1,410.94 $1,902.93 $2,515.64 $3,556.03 $2,152.62Average final average salary $3,801.40 $4,136.09 $4,454.29 $4,962.86 $5,868.78 $4,736.63Number of retirees 1,744 1,066 1,169 994 2,099 7,072
2015Average monthly benefit $ 897.66 $1,416.36 $2,008.34 $2,566.87 $3,573.41 $2,217.71Average final average salary $3,818.45 $4,161.17 $4,635.36 $5,007.10 $5,900.24 $4,812.42Number of retirees 1,659 1,119 1,164 1,035 2,190 7,167
continued
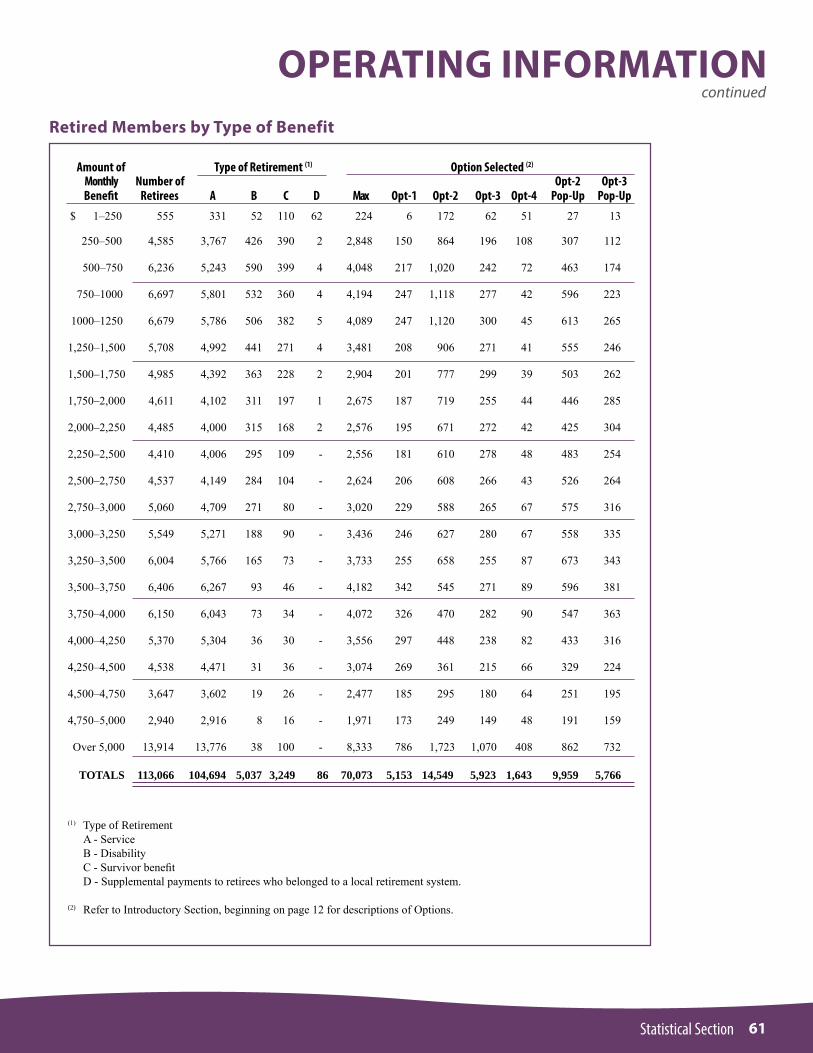
61Statistical Section
continuedOPERATING INFORMATION
Retired Members by Type of Benefit
Amount of Type of Retirement (1) Option Selected (2)
Monthly Number of Opt-2 Opt-3 Benefit Retirees A B C D Max Opt-1 Opt-2 Opt-3 Opt-4 Pop-Up Pop-Up $ 1–250 555 331 52 110 62 224 6 172 62 51 27 13
250–500 4,585 3,767 426 390 2 2,848 150 864 196 108 307 112
500–750 6,236 5,243 590 399 4 4,048 217 1,020 242 72 463 174
750–1000 6,697 5,801 532 360 4 4,194 247 1,118 277 42 596 223
1000–1250 6,679 5,786 506 382 5 4,089 247 1,120 300 45 613 265
1,250–1,500 5,708 4,992 441 271 4 3,481 208 906 271 41 555 246
1,500–1,750 4,985 4,392 363 228 2 2,904 201 777 299 39 503 262
1,750–2,000 4,611 4,102 311 197 1 2,675 187 719 255 44 446 285
2,000–2,250 4,485 4,000 315 168 2 2,576 195 671 272 42 425 304
2,250–2,500 4,410 4,006 295 109 - 2,556 181 610 278 48 483 254
2,500–2,750 4,537 4,149 284 104 - 2,624 206 608 266 43 526 264
2,750–3,000 5,060 4,709 271 80 - 3,020 229 588 265 67 575 316
3,000–3,250 5,549 5,271 188 90 - 3,436 246 627 280 67 558 335
3,250–3,500 6,004 5,766 165 73 - 3,733 255 658 255 87 673 343
3,500–3,750 6,406 6,267 93 46 - 4,182 342 545 271 89 596 381
3,750–4,000 6,150 6,043 73 34 - 4,072 326 470 282 90 547 363
4,000–4,250 5,370 5,304 36 30 - 3,556 297 448 238 82 433 316
4,250–4,500 4,538 4,471 31 36 - 3,074 269 361 215 66 329 224
4,500–4,750 3,647 3,602 19 26 - 2,477 185 295 180 64 251 195
4,750–5,000 2,940 2,916 8 16 - 1,971 173 249 149 48 191 159
Over 5,000 13,914 13,776 38 100 - 8,333 786 1,723 1,070 408 862 732
TOTALS 113,066 104,694 5,037 3,249 86 70,073 5,153 14,549 5,923 1,643 9,959 5,766
(1) Type of Retirement A - Service B - Disability C - Survivor benefit D - Supplemental payments to retirees who belonged to a local retirement system.
(2) Refer to Introductory Section, beginning on page 12 for descriptions of Options.
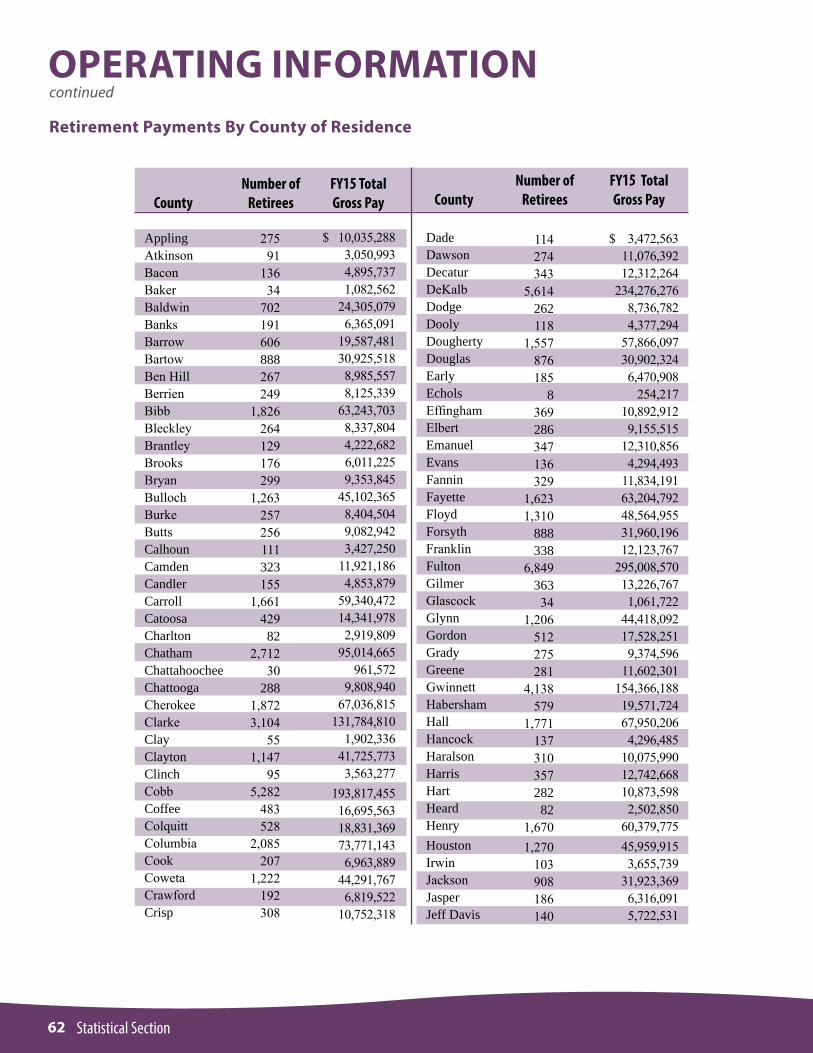
62 Statistical Section
OPERATING INFORMATIONRetirement Payments By County of Residence
$ 10,035,2883,050,9934,895,7371,082,562
24,305,0796,365,091
19,587,48130,925,5188,985,5578,125,339
63,243,7038,337,8044,222,6826,011,2259,353,845
45,102,3658,404,5049,082,9423,427,250
11,921,1864,853,879
59,340,47214,341,9782,919,809
95,014,665961,572
9,808,94067,036,815
131,784,8101,902,336
41,725,7733,563,277
193,817,45516,695,56318,831,36973,771,1436,963,889
44,291,7676,819,522
10,752,318
ApplingAtkinsonBaconBakerBaldwinBanksBarrowBartowBen HillBerrienBibbBleckleyBrantleyBrooksBryanBullochBurkeButtsCalhounCamdenCandlerCarrollCatoosaCharltonChathamChattahoocheeChattoogaCherokeeClarkeClayClaytonClinchCobbCoffeeColquittColumbiaCookCowetaCrawfordCrisp
27591
13634
702191606888267249
1,826264129176299
1,263257256111323155
1,66142982
2,71230
2881,8723,104
551,147
955,282
483528
2,085207
1,222192308
CountyNumber of
Retirees
FY15 Total Gross PayCounty
Number ofRetirees
FY15 Total Gross Pay
DadeDawsonDecaturDeKalbDodgeDoolyDoughertyDouglasEarlyEcholsEffinghamElbertEmanuelEvansFanninFayetteFloydForsythFranklinFultonGilmerGlascockGlynnGordonGradyGreeneGwinnettHabershamHallHancockHaralsonHarrisHartHeardHenryHoustonIrwinJacksonJasperJeff Davis
114274343
5,614262118
1,557876185
8369286347136329
1,6231,310
888338
6,84936334
1,206512275281
4,138579
1,77113731035728282
1,6701,270
103908186140
$ 3,472,56311,076,39212,312,264
234,276,2768,736,7824,377,294
57,866,09730,902,3246,470,908
254,21710,892,9129,155,515
12,310,8564,294,493
11,834,19163,204,79248,564,95531,960,19612,123,767
295,008,57013,226,7671,061,722
44,418,09217,528,2519,374,596
11,602,301154,366,18819,571,72467,950,2064,296,485
10,075,99012,742,66810,873,5982,502,850
60,379,77545,959,9153,655,739
31,923,3696,316,0915,722,531
continued
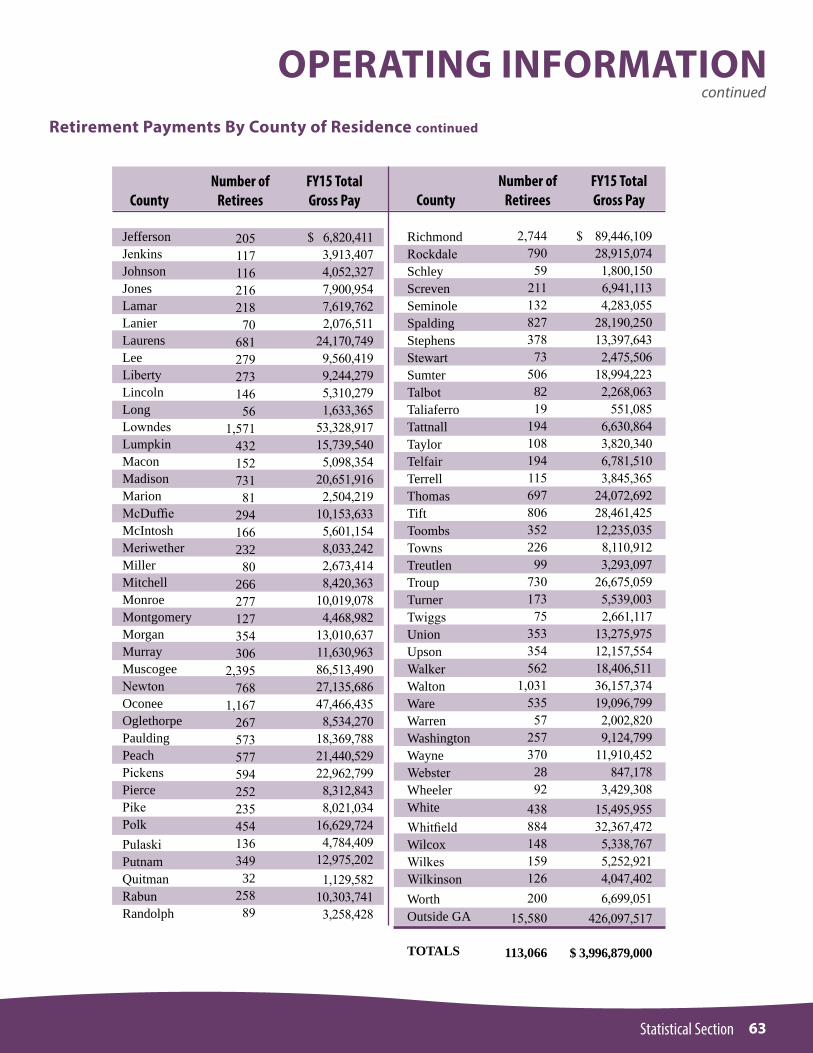
63Statistical Section
continuedOPERATING INFORMATION
Retirement Payments By County of Residence continued
CountyNumber of
Retirees
FY15 Total Gross Pay County
Number ofRetirees
FY15 Total Gross Pay
JeffersonJenkinsJohnsonJonesLamarLanierLaurensLeeLibertyLincolnLongLowndesLumpkinMaconMadisonMarionMcDuffieMcIntoshMeriwetherMillerMitchellMonroeMontgomeryMorganMurrayMuscogeeNewtonOconeeOglethorpePauldingPeachPickensPiercePikePolkPulaskiPutnamQuitmanRabunRandolph
20511711621621870
68127927314656
1,57143215273181
29416623280
266277127354306
2,395768
1,16726757357759425223545413634932
25889
$ 6,820,4113,913,4074,052,3277,900,9547,619,7622,076,511
24,170,7499,560,4199,244,2795,310,2791,633,365
53,328,91715,739,5405,098,354
20,651,9162,504,219
10,153,6335,601,1548,033,2422,673,4148,420,363
10,019,0784,468,982
13,010,63711,630,96386,513,49027,135,68647,466,4358,534,270
18,369,78821,440,52922,962,7998,312,8438,021,034
16,629,7244,784,409
12,975,2021,129,582
10,303,7413,258,428
RichmondRockdaleSchleyScrevenSeminoleSpaldingStephensStewartSumterTalbotTaliaferroTattnallTaylorTelfairTerrellThomasTiftToombsTownsTreutlenTroupTurnerTwiggsUnionUpsonWalkerWaltonWareWarrenWashingtonWayneWebsterWheelerWhiteWhitfieldWilcoxWilkesWilkinsonWorthOutside GA
TOTALS
2,74479059
21113282737873
5068219
19410819411569780635222699
73017375
353354562
1,03153557
2573702892
438884148159126200
15,580
113,066
$ 89,446,10928,915,0741,800,1506,941,1134,283,055
28,190,25013,397,6432,475,506
18,994,2232,268,063
551,0856,630,8643,820,3406,781,5103,845,365
24,072,69228,461,42512,235,035
8,110,9123,293,097
26,675,0595,539,0032,661,117
13,275,97512,157,55418,406,51136,157,37419,096,7992,002,8209,124,799
11,910,452847,178
3,429,30815,495,95532,367,4725,338,7675,252,9214,047,4026,699,051
426,097,517
$ 3,996,879,000
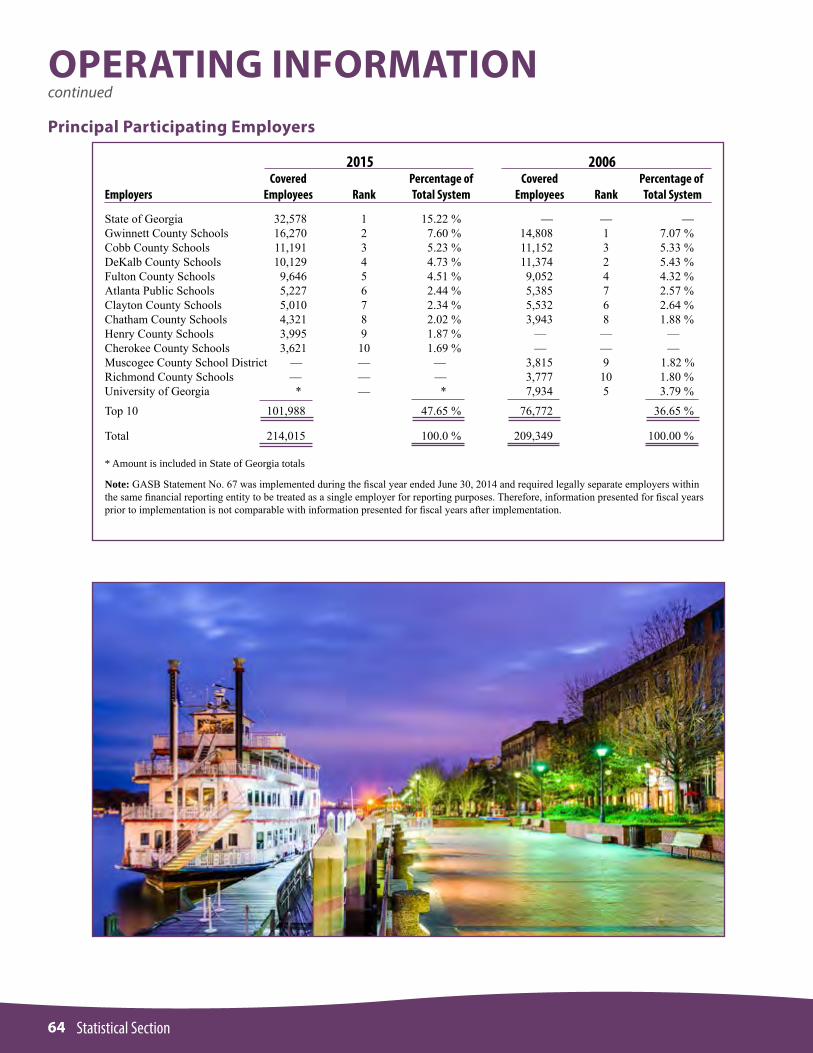
64 Statistical Section
OPERATING INFORMATIONPrincipal Participating Employers
continued
2015 2006 Covered Percentage of Covered Percentage ofEmployers Employees Rank Total System Employees Rank Total System
State of Georgia 32,578 1 15.22 % — — —Gwinnett County Schools 16,270 2 7.60 % 14,808 1 7.07 %Cobb County Schools 11,191 3 5.23 % 11,152 3 5.33 %DeKalb County Schools 10,129 4 4.73 % 11,374 2 5.43 %Fulton County Schools 9,646 5 4.51 % 9,052 4 4.32 %Atlanta Public Schools 5,227 6 2.44 % 5,385 7 2.57 %Clayton County Schools 5,010 7 2.34 % 5,532 6 2.64 %Chatham County Schools 4,321 8 2.02 % 3,943 8 1.88 %Henry County Schools 3,995 9 1.87 % — — —Cherokee County Schools 3,621 10 1.69 % — — —Muscogee County School District — — — 3,815 9 1.82 %Richmond County Schools — — — 3,777 10 1.80 %University of Georgia * — * 7,934 5 3.79 %
Top 10 101,988 47.65 % 76,772 36.65 %
Total 214,015 100.0 % 209,349 100.00 %
* Amount is included in State of Georgia totals
Note: GASB Statement No. 67 was implemented during the fiscal year ended June 30, 2014 and required legally separate employers within the same financial reporting entity to be treated as a single employer for reporting purposes. Therefore, information presented for fiscal years prior to implementation is not comparable with information presented for fiscal years after implementation.

65Statistical Section
continuedOPERATING INFORMATION
Reporting EntitiesUniversities and Colleges
Abraham Baldwin Agricultural CollegeAlbany State UniversityArmstrong Atlantic State UniversityAtlanta Metropolitan State CollegeBainbridge CollegeClayton College & State UniversityCollege of Coastal GeorgiaColumbus State UniversityCooperative Extension ServiceDalton State CollegeDarton CollegeEast Georgia State CollegeFort Valley State UniversityGeorgia College & State UniversityGeorgia Gwinnett CollegeGeorgia Highlands CollegeGeorgia Institute of TechnologyGeorgia Perimeter CollegeGeorgia Regents UniversityGeorgia Southern UniversityGeorgia Southwestern State UniversityGeorgia State UniversityGordon CollegeKennesaw State UniversityMiddle Georgia State CollegeSavannah State UniversitySouth Georgia State CollegeThe University of GeorgiaUniversity of North GeorgiaUniversity of West GeorgiaValdosta State University
Boards of Education
Appling CountyAtkinson CountyAtlanta PublicBacon CountyBaker CountyBaldwin CountyBanks CountyBarrow CountyBartow CountyBen Hill CountyBerrien CountyBibb CountyBleckley CountyBrantley CountyBremen CityBrooks CountyBryan CountyBuford CityBulloch CountyBurke CountyButts CountyCalhoun CityCalhoun CountyCamden CountyCandler CountyCarroll CountyCarrollton IndependentCartersville CityCatoosa CountyCharlton CountyChatham CountyChattahoochee CountyChattooga CountyCherokee CountyChickamauga CityClarke CountyClay CountyClayton CountyClinch CountyCobb CountyCoffee CountyColquitt CountyColumbia CountyCommerce CityCook CountyCoweta CountyCrawford County
Boards of Education, cont.
Crisp CountyDade CountyDalton CityDawson CountyDecatur CityDecatur CountyDeKalb CountyDodge CountyDooly CountyDougherty CountyDouglas CountyDublin CityEarly CountyEchols CountyEffingham CountyElbert CountyEmanuel CountyEvans CountyFannin CountyFayette CountyFloyd CountyForsyth CountyFranklin CountyFulton CountyGainesville CityGilmer CountyGlascock CountyGlynn CountyGordon CountyGrady CountyGreene CountyGriffin-Spalding CountyGwinnett CountyHabersham CountyHall CountyHancock CountyHaralson CountyHarris CountyHart CountyHeard CountyHenry CountyHouston CountyIrwin CountyJackson CountyJasper CountyJeff Davis CountyJefferson City

66 Statistical Section
OPERATING INFORMATIONcontinued
Reporting Entities, cont.Boards of Education, cont.
Jefferson CountyJenkins CountyJohnson CountyJones CountyLamar CountyLanier CountyLaurens CountyLee CountyLiberty CountyLincoln CountyLong CountyLowndes CountyLumpkin CountyMacon CountyMadison CountyMarietta CityMarion CountyMcDuffie CountyMcIntosh CountyMeriwether CountyMiller CountyMitchell CountyMonroe CountyMontgomery CountyMorgan CountyMurray CountyMuscogee County Newton CountyOconee CountyOglethorpe CountyPaulding CountyPeach CountyPelham CityPickens CountyPierce CountyPike CountyPolk School DistrictPulaski CountyPutnam CountyQuitman CountyRabun CountyRandolph CountyRichmond CountyRockdale CountyRome CitySchley CountyScreven County
Boards of Education, cont.
Seminole CountySocial Circle CityStephens CountyStewart CountySumter CountyTalbot CountyTaliaferro CountyTattnall CountyTaylor CountyTelfair CountyTerrell CountyThomas CountyThomaston-Upson County Thomasville CityTift CountyToombs CountyTowns CountyTreutlen CountyTrion CityTroup CountyTurner CountyTwiggs CountyUnion CountyValdosta CityVidalia CityWalker CountyWalton CountyWare CountyWarren CountyWashington CountyWayne CountyWebster CountyWheeler CountyWhite CountyWhitfield CountyWilcox CountyWilkes CountyWilkinson CountyWorth County
Public Libraries
Athens Regional LibraryBarnesville-Lamar County LibraryBartow County LibraryBartram Trail Regional LibraryBrooks County LibraryCamden County LibraryCatoosa County LibraryChatsworth-Murray County LibraryChattooga County Library SystemCherokee Regional LibraryChestatee Regional LibraryClayton County Regional LibraryCoastal Plains Regional LibraryCobb County Public LibraryConyers-Rockdale Library SystemCoweta Public LibraryDeKalb County Public LibraryDeSoto Trail Regional LibraryDougherty County Public LibraryEast Central Georgia Regional LibraryElbert County LibraryFitzgerald-Ben Hill County LibraryFlint River Regional LibraryForsyth County Public LibraryGwinnett County Public LibraryHall County LibraryHart County LibraryHenry County LibraryHouston County Public LibraryJackson Butts County LibraryJefferson County Library SystemKinchafoonee Regional LibraryLake Blackshear Regional Library Lee County LibraryLincoln County LibraryLive Oak Public LibrariesMary Vinson Memorial LibraryMiddle Georgia Regional LibraryMoultrie-Colquitt County LibraryMountain Regional Library

67Statistical Section
continuedOPERATING INFORMATION
Reporting Entities, cont.Public Libraries, cont.
Northeast Georgia Regional LibraryNewton County LibraryNorthwest Georgia Regional LibraryOcmulgee Regional LibraryOconee Regional LibraryOhoopee Regional Library Okefenokee Regional Library Peach Public LibraryPiedmont Regional LibraryPine Mountain Regional LibraryRoddenbery Memorial LibrarySara Hightower Regional LibrarySatilla Regional LibraryScreven-Jenkins Regional LibrarySequoyah Regional LibrarySouth Georgia Regional LibrarySouthwest Georgia Regional LibraryStatesboro Regional LibraryThomas County Public LibraryThree Rivers Regional LibraryTroup-Harris-Coweta Regional LibraryUncle Remus Regional LibraryWarren County Public LibraryWest Georgia Regional LibraryWorth County Library System
Technical Colleges
Albany Technical InstituteAthens Technical CollegeAtlanta Technical CollegeAugusta Technical InstituteCentral Georgia Technical CollegeChattahoochee Technical CollegeCoastal Pines Technical CollegeColumbus Technical InstituteGeorgia Northwestern Technical CollegeGeorgia Piedmont Technical CollegeGwinnett Technical CollegeLanier Technical College
Technical Colleges, cont.
Moultrie Technical CollegeNorth Georgia Technical InstituteOconee Fall Line Technical CollegeOgeechee Technical CollegeSavannah Technical CollegeSouth Georgia Technical InstituteSoutheastern Technical CollegeSouthern Crescent Technical CollegeSouthwest Georgia Technical CollegeWest Georgia Technical CollegeWiregrass Georgia Technical College
Regional Educational Service Agencies
Central Savannah River Area RESAChattahoochee Flint RESACoastal Plains RESAFirst District RESAGriffin RESAHeart of Georgia RESAMetro RESAMiddle Georgia RESANorth Georgia RESANortheast Georgia RESANorthwest Georgia RESAOconee RESAOkefenokee RESAPioneer RESASouthwest Georgia RESAWest Georgia RESA
Charter Schools
Academy for Classical Education, Inc.Amana AcademyAtlanta Classical AcademyAtlanta Heights Charter SchoolAtlanta Neighborhood Charter School, Inc.Baconton Community Charter SchoolBrighten AcademyCentennial AcademyCharles Drew Charter SchoolCharter Conservatory for Liberal Arts and Technology Chattahoochee Hills Charter School, Inc. Cherokee Charter AcademyCoweta Charter AcademyDeKalb Academy of Technology and EnvironmentDeKalb Path AcademyDeKalb Preparatory AcademyDestiny Achievers Academy of ExcellenceFoothills Education Charter High SchoolFulton Leadership AcademyFulton Science Academy High SchoolFulton Sunshine Academy Inc.Georgia Connections AcademyGeorgia Cyber AcademyGeorgia Magnet Charter SchoolInternational Academy of Smyrna Charter SchoolInternational Community SchoolIntown Academy Charter SchoolIvy Preparatory Academy for GirlsIvy Preparatory Young Men’s AcademyIvy Preparatory AcademyKennesaw Charter Science and Math AcademyKipp Metro Atlanta CollaborativeLatin Academy Charter School
68 Statistical Section
OPERATING INFORMATIONcontinued
Reporting Entities, cont.Charter Schools, cont.
Leadership Preparatory Academy Charter SchoolMountain Education Center Inc.New Life Academy of Excellence Inc.North Metro Academy of Performing ArtsOdyssey Charter SchoolPataula Charter AcademyProvost Academy GeorgiaTapestry Public Charter SchoolThe Globe AcademyThe Kindezi SchoolThe Main Street AcademyThe Museum School of Avondale EstatesUtopian Academy for the ArtsWesley International AcademyWestside Atlanta Charter School
State Agencies
Department of Administrative ServiceDepartment of Community HealthDepartment of CorrectionsDepartment of Human ServicesDepartment of Natural ResourceDepartment of Public HealthDepartment of Public SafetyDepartment of Behavioral Health and Development DisabilityGeorgia Building AuthorityGeorgia Bureau of InvestigationGeorgia Department of AuditsGeorgia Department of Community AffairsGeorgia Department of Driver ServicesGeorgia Department of Early Care and LearningGeorgia Department of EducationGeorgia Department of Juvenile JusticeGeorgia Department of LaborGeorgia Department of RevenueGeorgia General Assembly
State Agencies, cont.
Georgia Public Defender Standard CouncilGeorgia Public Telecommunications CommissionGeorgia Soil and Water Conservation CommissionGeorgia Student Finance CommissionGeorgia World Congress Center AuthorityGovernors Office of Planning and BudgetProsecuting Attorneys’ Council of GeorgiaSecretary of StateState Accounting OfficeState Board of Pardons and ParolesState Road Toll and AuthorityTechnical College System of GeorgiaUniversity System of Georgia
Other
Baldwin County Board of HealthClayton Center Community Service BoardDeKalb County DFACSEffingham County Tax Commissioner OfficeFloyd County DFACSGeorgia Military CollegeGlynn County Health Dept Coastal Health DistrictHall County DFACSWare County Health DepartmentWhitfield County Board of Health


Two Northside 75, Suite 100Atlanta, GA 30318
A COMPONENT UNIT OF THE STATE OF GEORGIA
(404) 352-6500 or (800) 352-0650www.TRSGA.com