Embed Size (px)
Citation preview

Clean Water Services2550 SW Hillsboro Highway
Hillsboro, Oregon 97123cleanwaterservices.org
REPORTC O M P R E H E N S I V EANNUAL FINANCIAL
A Component Unit ofWashington County, Oregon
for the fiscal year endedJune 30, 2017

CLEAN WATER SERVICES (A Component Unit of Washington County, Oregon)
Comprehensive Annual Financial Report
For the fiscal year ended June 30, 2017
Prepared by:
Business Operations Department

CLEAN WATER SERVICES (A Component Unit of Washington County, Oregon)
Table of Contents
Page(s)
INTRODUCTORY SECTION: Letter of Transmittal I Board of Directors and Principal Officer XII GFOA Certificate of Achievement for Excellence in Financial Reporting XIII Organizational Chart XIV
FINANCIAL SECTION:
REPORT OF INDEPENDENT AUDITOR 1 - 3
MANAGEMENT’S DISCUSSION & ANALYSIS 4 - 15
BASIC FINANCIAL STATEMENTS: Statement of Net Position 16 Statement of Revenues, Expenses and Changes in Net Position 17 Statement of Cash Flows 18 Notes to Basic Financial Statements 19-53
REQUIRED SUPPLEMENTARY INFORMATION: Schedule of Funding Progress Other Post-Employment Benefits 54 Schedule of Statutorily Required Employer Contributions Pension Plan 55 Schedule of Proportionate Share of the Collective Net Pension Liability 56
SUPPLEMENTARY INFORMATION:
COMBINING SCHEDULES: Combining Schedule of Net Position 57 Combining Schedule of Revenues, Expenses and Changes in Net Position 58 Combining Schedule of Cash Flows 59
BUDGETARY SCHEDULES:
Description of Budgetary Funds 60-61 Schedules of Revenues and Expenditures - Budget and Actual: General Fund 62 Storm and Surface Water Management Fund 63 Master Plan Update Debt Service Fund 64 Revenue Pension Bond Debt Service Fund 65 Liability Reserve Fund 66 Capital Expenditure Reserve Sanitary Sewer Fund 67 Sanitary Capital Replacement Fund 68 Sanitary Sewer LID Construction Fund 69 Surface Water Management LID Construction Fund 70 Sanitary Sewer Construction Fund 71 Tualatin Basin Water Supply Capital Project Construction Fund 72 Surface Water Management Capital Replacement Fund 73 Capital Expenditure Reserve Storm and Surface Water Management Fund 74 Surface Water Management Construction Fund 75

CLEAN WATER SERVICES
(A Component Unit of Washington County, Oregon)
Table of Contents
Page(s) Reconciliation of Revenues and Expenditures (Budgetary Basis) to Increase in Net
Position (GAAP Basis) 76 STATISTICAL SECTION:
Description of Statistical Section 77 FINANCIAL TRENDS
Net Position by Component 78 Changes in Net Position 79 Operating Revenues by Source 80 Operating Expenses 81 Nonoperating Revenues and Expenses 82
REVENUE CAPACITY Monthly Sewer and Storm/Surface Water Rates 83 System Development Charges and Revenues 84 Ten Largest Individual Ratepayers 85
DEBT CAPACITY Ratios of Outstanding Debt by Type 86 Pledged Revenue Coverage 87
DEMOGRAPHICS & ECONOMICS Demographic Statistics 88 Major Employment Industries in Washington County 89
OPERATING Administrative, Support and Operational Staff FTE 90 Summary of Treatment Plant Capacities 91 Operating and Capital Indicators 92
COMPLIANCE REPORT Independent Auditor’s Report Required by Oregon State Regulations 93-94

INTRODUCTORY
SECTION

I
December 12, 2017
To Board of Directors, Ratepayers and Interested Parties:
We are pleased to submit the Comprehensive Annual Financial Report of Clean Water Services (the District), a component unit of Washington County, Oregon, for the year ended June 30, 2017, together with the report thereon of the District’s independent auditors.
This report was prepared by Clean Water Services’ Business Operations Department in accordance with the provisions of Oregon Revised Statutes Chapter 297. District management assumes full responsibility for the accuracy of the data and the reliability of the presentations and all disclosures contained in this report. To provide a reasonable basis for making these representations, management of the District has established a comprehensive internal control framework that is designed both to protect the District’s assets from loss, theft, or misuse and to compile sufficient reliable information for the preparation of the District’s financial statements in conformity with the accounting principles generally accepted in the United States of America. Because the cost of internal control should not exceed anticipated benefits, the objective is to provide reasonable, rather than absolute, assurance that the financial statements are free of any material misstatements. We believe the data is accurate and complete in all material respects and that it presents fairly the financial position, results of operations and cash flows of the District for the year ended June 30, 2017. This report should be read in conjunction with Management’s Discussion and Analysis which begins on page 4.
Independent Audit
The provisions of Oregon Revised Statutes Chapter 297, known as the “Municipal Audit Law”, require that an independent audit of the District’s records be made within six months following the close of the fiscal year, with approved extensions. The auditors are appointed by the Board of Directors following a public competitive request for proposal process. The firm of Moss Adams LLP has completed its fourth audit of the District’s financial statements which is incorporated into the financial section of this report.
The firm of Moss Adams LLP has issued an unmodified opinion on the District’s financial statements for the year ended June 30, 2017. The independent auditor’s report is located at the front of the financial section of this report.

Transmittal Letter To Board of Directors, Ratepayers and Interested Parties: (Continued)
II
DISTRICT PROFILE
Clean Water Services is a county service district, which, in close cooperation with cities within its service area, provides sanitary sewer and surface water management utility services for the urbanized portion of Washington County (County) and small portions of the City of Portland, the City of Lake Oswego, and Multnomah and Clackamas counties. Clean Water Services’ service area encompasses most of the developed part of the Tualatin River watershed, an area of approximately 123 square miles and more than 95 percent of Washington County’s population. Cities located within and served by the District are as follows: Banks, Beaverton, Cornelius, Durham, Forest Grove, Gaston, Hillsboro, King City, North Plains, Sherwood, Tigard, Tualatin, and small portions of Lake Oswego and Portland.
The District began operation as Unified Sewerage Agency of Washington County on February 4, 1970 after its formation was authorized by popular vote. On July 1, 1990 it assumed responsibility for surface water management. Effective June 5, 2001, Unified Sewerage Agency of Washington County changed its name to “Clean Water Services.” The name change was made to better reflect the roles and responsibilities for providing cost-effective, environmentally sensitive management of water resources in the Tualatin River Basin.
The Clean Water Services’ Board of Directors is comprised of the same individuals who are elected to the Board of County Commissioners of Washington County. Although Clean Water Services maintains a close working relationship with Washington County, the District is a separately managed and financed municipal corporation under Oregon Revised Statutes Chapter 451. Administration and management of the District is the responsibility of the General Manager, who is appointed by the Board of Directors. Under the criteria of the Governmental Accounting Standards Board (GASB), the District is considered a component unit of Washington County for financial reporting purposes.
Operational and technical input to the Board is provided by Clean Water Services’ Advisory Commission (CWAC), a Board-appointed commission of 15 members. Accounting Systems & Budgetary Control
Clean Water Services’ accounting records are maintained by fund on a modified accrual accounting basis for budgetary reporting purposes. For financial reporting purposes, the financial statements are presented on a full accrual basis.
The Board of Commissioners is required to adopt a final budget prior to the beginning of the fiscal year. This annual budget serves as the foundation of the District’s financial planning and control. The legal level of budgetary control is by fund and organizational unit or other specified category, in accordance with Oregon Revised Statutes Local Budget Law.
For budgetary and legal purposes, the activities are accounted for in the funds described below:
• General Fund - accounts for normal recurring sewerage operations (also referred to as the Operating Fund).
• Storm and Surface Water Management Fund - accounts for normal storm and surface water
management operations.
Transmittal Letter To Board of Directors, Ratepayers and Interested Parties: (Continued)
III
• Master Plan Update Debt Service Fund - accounts for the redemption of bond principal and
interest. • Liability Reserve Fund - accounts for the District’s self-insurance programs.
• Capital Replacement Reserve Funds – (one each for Sanitary and Surface Water Management) – account for the replacement and renewal of existing District assets.
• Capital Expenditure Reserve Funds - (one each for Sanitary and Surface Water Management) -
account for the recovery of capital costs for maintenance, upkeep and improvement of the systems.
• Tualatin Basin Water Supply Capital Project Fund – accounts for the transactions of the Tualatin Basin Water Supply Project, which is a joint project to provide additional water volume to enable continued compliance with water quality requirements.
• Sanitary Sewer (LID) Construction Fund, Surface Water Management (LID) Construction Fund,
and Sanitary Sewer and Surface Water Management Construction Funds - account for capital construction expenditures by the District, or for capital construction expenditures made for the benefit of property owners in the case of the Sanitary Sewer and Surface Water Management LID Construction Funds.
• Revenue Pension Bond Debt Service Fund - accounts for the payment of the Series 2004 Revenue Pension Bonds used to finance the District’s unfunded actuarial liability in Oregon’s Public Employees Retirement System.
ECONOMIC CONDITION AND OUTLOOK
The economy of the District's service area reflects a diversity of industries including agriculture, high technology, sports apparel and services. Major employment industries in Washington County include professional and business services (19%), wholesale/retail trade (16%), computer and electronic equipment manufacturing (10%), healthcare and social services (10%), government services (8%) and leisure and hospitality (9%). The unemployment rate in Washington County continued a steady decline of about one percent per year with rates falling from a high of 10.3 percent in 2009 to a rate of 3.5 percent in June 2017, with the second lowest unemployment rate in Oregon. Washington County has experienced strong job growth, adding 48,417 jobs between 2010 and 2016, and per capita personal income is showing signs of modest continual growth. Washington County’s per capita personal income has consistently outpaced state average, and was third highest in the state in 2016.
Washington County, the second most populous county in Oregon, continues to be one of the fastest growing counties in the state, adding 47,225 more residents between 2012 and 2016. The region-wide population growth trend has remained steady. Although official population estimates for special districts are not available, Clean Water Services estimates the population of its service area at approximately

Transmittal Letter To Board of Directors, Ratepayers and Interested Parties: (Continued)
IV
583,000. Population growth within the District’s service area has consistently outpaced population growth within the region over the past decade or more and is expected to add an additional 170,000 people by 2030.
LONG RANGE FINANCIAL PLANNING AND RELEVANT FINANCIAL POLICIES
To ensure Clean Water Services is poised for the future to respond to continued economic growth at affordable customer rates, District rate increases are planned to be regular, predictable and relatively affordable, with capital plans that are phased so that revisions can be made to improve operational efficiencies and respond to changes in customer demand. In concert with the above, fund balances shall be kept at levels that provide appropriate working capital, funding for operating contingencies and planned capital improvements, while ensuring favorable credit ratings and maintaining strong coverage ratios. Moreover, financial forecasts are conservatively constructed so the District does not overestimate concomitant revenue growth.
The District’s policies on rates and careful management of resources have allowed the District to limit estimated average annual combined residential sanitary sewer and surface water management fee increases for the last ten years to less than 4.32 percent.
MAJOR NEW AND ONGOING INITIATIVES
District Forms Captive Insurance Company
On February 16, 2016, the Clean Water Services Board of Directors approved the District’s formation of Clean Water Insurance Company, LLC, a wholly owned subsidiary of the District, domiciled in the state of Hawaii. The District is the sole member of this captive insurance company, which will operate for the benefit of the District and its ratepayers. The captive, which will be managed by the District, will result in long term risk management program savings through the use of a formalized self-insurance program that can access the reinsurance markets for additional seismic coverages as well as provide a potential for funding of loss prevention and mitigation projects to further protect District assets or recover from a seismic event.
Series 2009A Bond Advanced Refunding
In October 2016, the District advance refunded $38.6 million of outstanding Revenue Bonds, Series 2009A, taking advantage of historically low interest rates and the District’s outstanding bond ratings. The refinancing netted over $5.3 million in present value savings, which will reduce debt and lower costs for our ratepayers.
Investing in Watershed Health
Clean Water Services has spent more than 40 years pursuing a cohesive strategy to advance the health of the Tualatin River Watershed for 583,000 residents in 12 cities. Through innovation, scientific knowledge and creativity we work to improve environmental health and value for our customers. These efforts have paid dividends for water quality, public health, and our community—the Tualatin River is healthier than it has been in generations and has become a valued recreational asset.

Transmittal Letter To Board of Directors, Ratepayers and Interested Parties: (Continued)
V
In September 2014 Clean Water Services set the highest bar yet in Tree-For-All with a goal to plant one million trees and native plants in one year for one water. We did it! Through innovative and collaborative partnerships in urban and agricultural areas and with great support from our communities we planted two million! And we’re not done. Tree-For-All is using Mother Nature as its guide to develop and implement long-term stewardship strategies while making the Tualatin Watershed a showcase of economic prosperity, ecological health, and community wellness. By implementing community-based restoration and enhancing the benefits that natural resources provide, we are leveraging partnerships to meet Clean Water Services’ goal of beautiful clean water while also meeting our partner’s goals – natural areas for wildlife, cleaner air, noise reduction, and scenic beauty – all at lower cost than if we did it alone.
Investing in Infrastructure, Public Health and the Environment
In the last 10 years, Clean Water Services and our partner Cities have invested more than $100 million to expand, replace and upgrade our community’s four wastewater treatment facilities, 42 pump stations, 851 miles of sewer lines, and 529 miles of storm sewers.
2016-17 Achievements
• Cleaned more than 26.5 billion gallons of wastewater. • Recycled 31 dry tons of biosolids a day on to agricultural fields in the Willamette Valley and
eastern Oregon to improve soil condition and crop production. • Monitored over 1,500 strict permit conditions at each treatment facility, including monthly,
weekly and daily limits established to protect the Tualatin River. • All four District Water Resource Recovery Facilities earned National Association of Clean Water
Agency’s highest awards for 100% permit requirements met or exceeded (Gold Award) including more than five consecutive years for three of the facilities (Platinum Award).
• Swept more than 13,284 miles of streets collecting almost 748 dump truck loads of debris and cleaned more than 15,855 catch basins collecting material equivalent to 137 dump truck loads to keep pollutants out of our river and streams.
• Replaced 104 sanitary sewer laterals and rehabilitated 9,500 linear feet of sewer mains and 320 manholes associated with the Infiltration and Inflow (I/I) reduction program.
• District and member cities retrofitted 95 manholes and catch basins to provide additional water quality treatment
• Increased area treated by 954 acres to almost 31% of the basin. • Managed over 488 permits issued to industrial customers to monitor and control their
discharges to the wastewater treatment facilities and to stormwater conveyance system, regulated discharges from 312 Dentist offices to control mercury discharges to the resource recovery facilities.

Transmittal Letter To Board of Directors, Ratepayers and Interested Parties: (Continued)
VI
Investing in Public Involvement & Education
Clean Water Services reaches out to the community to encourage residents to join our efforts in protecting public health, enhancing the region’s environmental quality of life, and planning for the region’s water future.
2016-17 Achievements
• Maintained and promoted Westside Voices (www.joinwestsidevoices.org ) –an online community engagement panel that allows residents to weigh in on community issues through surveys and focus groups. Just over 2,600 residents participate in the two-year-old program. Westside Voices is a partnership between Clean Water Services, Washington County, other local agencies and nonprofits.
• The award-winning Tualatin River Rangers program reached 3,000 students and an estimated 6,000 adults at nearly 30 percent of public elementary schools in the Tualatin Basin.
• More than 600 high school science students participated in Sewer Science and got hands on education about water treatment followed by a facility tour.
• More than 2,000 people from around the world toured Clean Water Services treatment facilities to learn how wastewater is cleaned at a higher level than 98% of the nation’s facilities.
• This year the Fernhill Natural Treatment System project continued to attract thousands of visitors including 300 who attended two public events (Birds and Brew, Eco-Blitz), engaged 600 students from 15 Tualatin Basin schools in place-based education, hosted tours and projects by students from Pacific University and Portland Community College (PCC) and was the subject of tours or presentations to 5 civic and professional groups.
• To engage our community in a discussion about water and how we can make water fit for purpose the District launched the Pure Water Brew project. The District supplied high purity water from 100% effluent to a non-profit association of local home brewers, the Oregon Brew Crew (OBC). Twenty-five homebrewers from the OBC brewed beer and submitted entries to a competition sponsored by Carollo. The top ten were featured at tastings at the national WaterReuse Symposium and the Water Environment Federation Conference. The project so far has generated regional, national, and international coverage with more than 500 media stories and started a wonderful conversation about the nature of water and how it is continually recycled and reused.
Investing in Resource Recovery
Wastewater treatment has transformed over the last decade, moving from waste disposal to a growing recognition as resource recovery facilities that produce clean water, recover valuable nutrients, and produce clean, renewable energy. Clean Water Services is on the leading edge of this transformation:
2016-17 Achievements
• Provided 60.6 million gallons of irrigation water to more than 218 acres of athletic fields, golf courses, wetlands and parks from the Durham Advanced Wastewater Treatment Facility.
Transmittal Letter To Board of Directors, Ratepayers and Interested Parties: (Continued)
VII
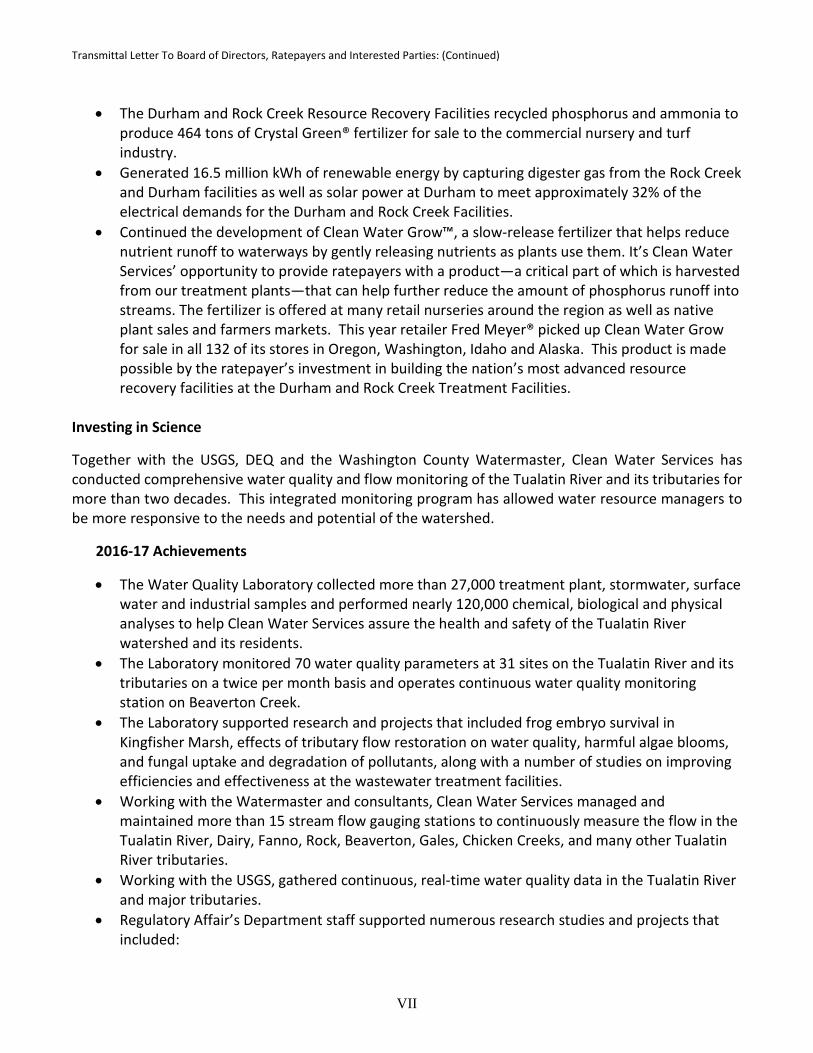
• The Durham and Rock Creek Resource Recovery Facilities recycled phosphorus and ammonia to produce 464 tons of Crystal Green® fertilizer for sale to the commercial nursery and turf industry.
• Generated 16.5 million kWh of renewable energy by capturing digester gas from the Rock Creek and Durham facilities as well as solar power at Durham to meet approximately 32% of the electrical demands for the Durham and Rock Creek Facilities.
• Continued the development of Clean Water Grow™, a slow-release fertilizer that helps reduce nutrient runoff to waterways by gently releasing nutrients as plants use them. It’s Clean Water Services’ opportunity to provide ratepayers with a product—a critical part of which is harvested from our treatment plants—that can help further reduce the amount of phosphorus runoff into streams. The fertilizer is offered at many retail nurseries around the region as well as native plant sales and farmers markets. This year retailer Fred Meyer® picked up Clean Water Grow for sale in all 132 of its stores in Oregon, Washington, Idaho and Alaska. This product is made possible by the ratepayer’s investment in building the nation’s most advanced resource recovery facilities at the Durham and Rock Creek Treatment Facilities.
Investing in Science
Together with the USGS, DEQ and the Washington County Watermaster, Clean Water Services has conducted comprehensive water quality and flow monitoring of the Tualatin River and its tributaries for more than two decades. This integrated monitoring program has allowed water resource managers to be more responsive to the needs and potential of the watershed.
2016-17 Achievements
• The Water Quality Laboratory collected more than 27,000 treatment plant, stormwater, surface water and industrial samples and performed nearly 120,000 chemical, biological and physical analyses to help Clean Water Services assure the health and safety of the Tualatin River watershed and its residents.
• The Laboratory monitored 70 water quality parameters at 31 sites on the Tualatin River and its tributaries on a twice per month basis and operates continuous water quality monitoring station on Beaverton Creek.
• The Laboratory supported research and projects that included frog embryo survival in Kingfisher Marsh, effects of tributary flow restoration on water quality, harmful algae blooms, and fungal uptake and degradation of pollutants, along with a number of studies on improving efficiencies and effectiveness at the wastewater treatment facilities.
• Working with the Watermaster and consultants, Clean Water Services managed and maintained more than 15 stream flow gauging stations to continuously measure the flow in the Tualatin River, Dairy, Fanno, Rock, Beaverton, Gales, Chicken Creeks, and many other Tualatin River tributaries.
• Working with the USGS, gathered continuous, real-time water quality data in the Tualatin River and major tributaries.
• Regulatory Affair’s Department staff supported numerous research studies and projects that included:

Transmittal Letter To Board of Directors, Ratepayers and Interested Parties: (Continued)
VIII
o Conducting nitrogen reduction pilot plant studies that produced the design and operational basis for the vertical flow wetlands being installed at the Fernhill Natural Treatment System.
o Developing a new automated analytical method for low level copper speciation – data from this analysis on treatment plant effluents will help the District to perform a more accurate reasonable potential analysis for compliance with applicable water quality criteria for copper.
o Performing comprehensive analyses on High Purity Water made from Durham AWWTF effluent to demonstrate that it met all applicable water quality criteria for potable drinking water, and therefore for brewing beer or any other need for clean water.
Investing in Community and Building Partnerships
Clean Water Services is building innovative partnerships to create a shared vision and strategy to advance the health of the Tualatin River Watershed:
2016-17 Achievements
• Worked with the Tualatin Soil and Water Conservation District, Tualatin Hills Park and Recreation District, U.S. Fish and Wildlife Service, Metro and other partners on over 110 miles of stream corridors that have been restored in agricultural and urban areas. This work provides temperature, water quality, habitat and recreational benefits along the Tualatin River and tributaries.
• Inspired Cities, non-profits, park districts, private landowners and agricultural partners to plant a diverse collection of more than 1,000,000 native trees, shrubs and plants along streams, wetlands and the river to filter pollutants, provide shade and create healthy wildlife habitat as part of the Tree-For-All campaign in each of the last three years.
• Catalyzed community organizations to rally thousands of volunteers to get their hands dirty on behalf of Mother Nature. The volunteers donated more than 10,000 hours, an estimated value of $220,000, and they rooted over 25,000 native plants to clean water, purify air, create wildlife habitat and promote Washington County’s scenic beauty.
• Partnered with community restoration organizations to access and deploy advanced technologies that increase efficiency of large scale planting operations and reduce staff time associated with plant inventory management and site review.
• Partnered with Portland Community College to develop Vegetated Private Water Quality Facilities Management Training modules.
• Partnered with Metro, Tualatin Riverkeepers, City of Hillsboro and other regional partners on two new nature recreation access points for the Tualatin River Water Trail with significant funding from the Oregon State Parks and Recreation Department.
• Galvanized a coalition of community support from urban, agricultural and government organizations for major restoration efforts at the Wapato Lake National Wildlife Refuge and finalized a 20 year Memorandum of Understanding (MOU) with United States Fish & Wildlife Services (USFWS) to safeguard water quality, enhance wildlife habitat and water management infrastructure at this influential upper watershed site.
Transmittal Letter To Board of Directors, Ratepayers and Interested Parties: (Continued)
IX
• Partnered with Portland Community College and community organizations to develop the Rock Creek Enhanced project, including a regional government (Metro) program Nature –in-Neighborhoods grant supporting education and outreach to culturally diverse groups, as well as 100 acres of stream and wetland enhancement in a strategic area downstream of new development around North Bethany.
Regulatory Climate In February 2004, the Oregon Department of Environmental Quality (DEQ) issued Clean Water Services the nation’s first integrated, municipal, watershed-based permit under the Clean Water Act. This innovative permit integrates the District’s four municipal wastewater treatment facilities and the municipal stormwater system permits into an integrated bundle, which changes the regulatory framework to allow the District greater flexibility to take advantage of creative approaches and new solutions. The watershed-based permit was renewed by DEQ in 2016. The renewed watershed-based permit continues to include several elements that were first included in the 2004 permit:
• Water quality credit trading for thermal loads between treatment facilities and the release of stored water from Hagg Lake and Barney Reservoirs.
• Water quality credit trading for thermal loads between treatment facilities and streamside shading improvements outside and inside the District’s service boundary.
• Establishes performance benchmarks for the stormwater management activities of the District, its partner cities and Washington County as a whole.
• Consolidation of regulatory reporting requirements.
Additionally, the renewed permit expands the watershed approach by allowing for new discharges from a natural treatment system in Forest Grove, expands thermal load trading strategies, and includes a bubble–load concept for suspended solids that provides operational flexibility to the District’s treatment facilities. The renewed permit also provides greater flexibility for the District to optimize operations and fully utilize existing infrastructure while accommodating new growth in the basin. The permit greatly increases monitoring requirements, establishes new limits for ammonia during the wet season, and increases reporting requirements to respond to changing regulatory requirements. Regulatory changes, including new, more stringent water quality standards for the protection of human health, more aggressive stormwater management requirements, and the stricter controls on wet weather flow management will pose new challenges to the District in maintaining regulatory compliance and meeting the overall ecological objectives for the Tualatin basin.
Water Quality Requirements The Environmental Quality Commission (EQC) has adopted several pollution control strategies known as Total Maximum Daily Loads (TMDLs) including those for phosphorus, temperature, bacteria, and ammonia-nitrogen in the Tualatin River to protect water quality and restore impaired beneficial uses of the river. The TMDLs define the quality of effluent that the District’s treatment plants may discharge to the Tualatin River. Limits are the most restrictive during the dry weather season. The TMDL structure targets in-stream concentration for phosphorus and maintaining adequate dissolved oxygen in the river. Augmentation of stream flows and thermal load trading occurs during the summer to reduce stream

Transmittal Letter To Board of Directors, Ratepayers and Interested Parties: (Continued)
X
temperatures. As growth occurs, limits have been established to control ammonia, along with Hydraulic loading and mass limits affect during peak wintertime flows.
Limits set on the Durham and Rock Creek Wastewater Treatment Plants’ effluent are some of the most stringent in the United States for phosphorus and ammonia-nitrogen. As a result, the District currently provides a higher level of wastewater treatment than 98 percent of the treatment facilities in the nation.
User Charges Clean Water Services’ Board of Directors is authorized by state law to set fees and charges for connection to, and use of, the public sewer system and connection to, and/or use of, the public facilities and public services related to surface water management, including storm water drainage. The District is 100 percent fee and charge supported. The District bills for all residential and non-industrial commercial customers in the unincorporated areas and in the smaller “franchise” cities of North Plains, Banks, Gaston, Durham, and King City. The cities of Beaverton, Tigard, Hillsboro, Tualatin, Forest Grove, Cornelius and Sherwood bill for services to residential and non-industrial commercial customers within their respective corporate limits and remit a portion of fees collected to the District by agreement. The cities of Portland and Lake Oswego bill residential and non-industrial customers within the District’s service area and remit a portion of fees collected to the District by agreement. The District directly bills all industrial permit holders. Clean Water Services establishes a basic schedule of rates and charges annually, and the Cities of Beaverton, Tigard, Hillsboro, Tualatin, Forest Grove, Cornelius and Sherwood bill according to District developed schedules. These seven largest cities may also approve additional supplemental charges. The Cities of Portland and Lake Oswego may bill at different rates but remit funds for District customers based on District rates. The monthly billing rate for residential and commercial sewer customers is calculated by adding a consumption component to a base rate component. The District’s average residential, commercial and industrial sewer rates for fiscal year 2017 increased by approximately 3 percent from fiscal year 2016.
Industrial customers are billed for domestic wastewater flows in a manner that is essentially identical to the process outlined above for residential and other non-industrial customers. Industrial and commercial customers with high-waste flows and high-strength wastes are monitored for permit compliance (including onsite pretreatment) and billed based on four components: volume, biochemical oxygen demand, suspended solids, and customer service.
Surface Water Management (SWM) fees are based on measured impervious surface areas, including roofs, paved areas such as parking lots and roads, and charged against an average residential measurement (2,640 square feet) or equivalent service unit (ESU). The rate charged for SWM services is $7.75 per month per ESU, an increase of 6.9% or $.50 per month to the average residential customer’s bill from fiscal year 2016. Residences are typically charged a flat 1.0 ESU rate.

Transmittal Letter To Board of Directors, Ratepayers and Interested Parties: (Continued)
XI
AWARDS
The Government Finance Officers Association of the United States of America and Canada (GFOA) awarded a Certificate of Achievement for Excellence in Financial Reporting to Clean Water Services for its Comprehensive Annual Financial Report (CAFR) for the fiscal year ended June 30, 2016. This was the 30th consecutive year that the District has achieved this prestigious award. In order to be awarded a Certificate of Achievement, a government must publish an easily readable and efficiently organized CAFR. The report must satisfy both generally accepted accounting principles and applicable legal requirements. A Certificate of Achievement is valid for a period of one year only. We believe that our current CAFR continues to meet the Certificate of Achievement Program’s requirements and we are submitting it to the GFOA to determine its eligibility for another certificate. In addition, the District’s Adopted Budget Document for the Fiscal Year 2016-17 received the Distinguished Budget Presentation Award from GFOA. This was the 29th consecutive year that the District has achieved this prestigious award. In order to qualify, the budget document must be judged proficient as a policy document, a financial plan, an operations guide and a communications device. ACKNOWLEDGMENTS
Clean Water Services would like to thank the entire Finance Team whose professionalism, dedication and efficiency are responsible for the preparation of this report. The District closes with a word of thanks for the continuing support of the Board of Directors in providing District staff with the tools necessary to assist in the careful stewardship of public resources.
Respectfully submitted, Bill Gaffi Diane Taniguchi-Dennis Mark Poling General Manager Deputy General Manager Business Operations Director
XII
Clean Water Services (A Component Unit of Washington County, Oregon)
Governing Body in accordance with ORS 451.485
Board of Directors
Washington County, Oregon 155 North First Avenue Hillsboro, OR 97124
Directors as of June 30, 2017
ELECTED: Term Expires
Andy Duyck, Chairman December 31, 2018 Dick Schouten, District 1 Director December 31, 2020 Greg Malinowski, District 2 Director December 31, 2018 Roy Rogers, District 3 Director December 31, 2020 Bob Terry, District 4 Director December 31, 2018
APPOINTED: Bill Gaffi, General Manager REGISTERED AGENT: Bill Gaffi, General Manager REGISTERED OFFICE: 2550 SW Hillsboro Highway Hillsboro, OR 97123
XIII
XIV
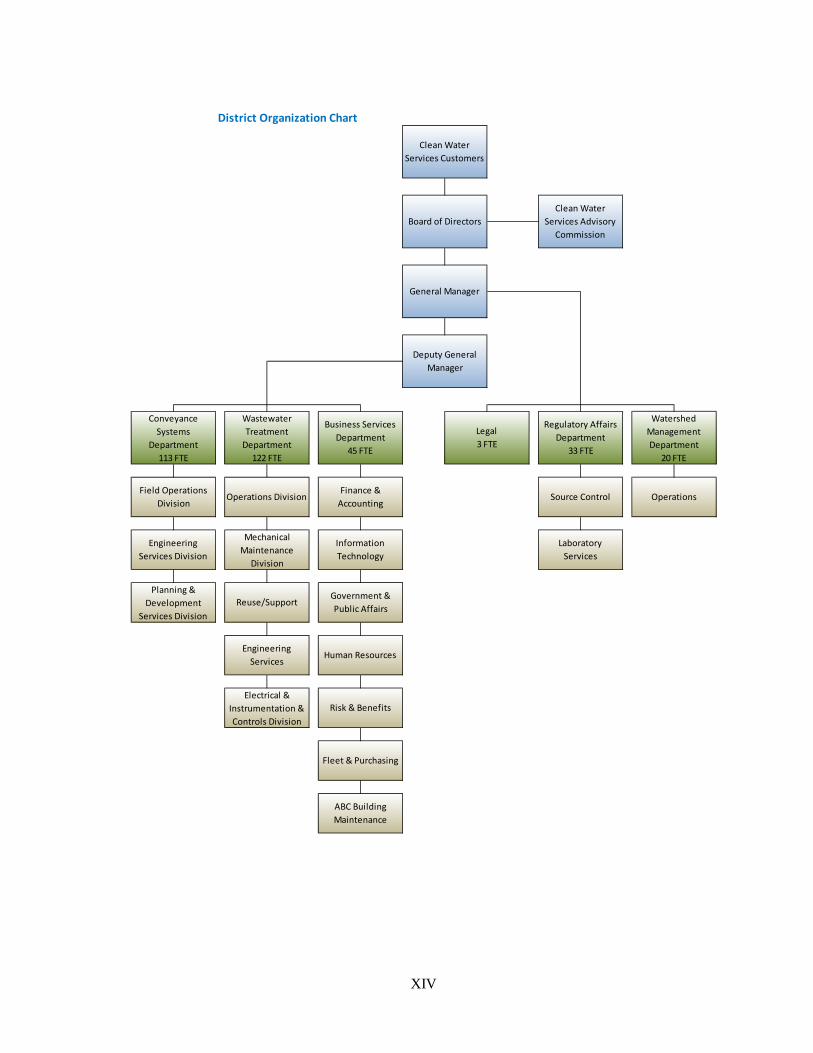
District Organization Chart
ABC Building Maintenance
Business Services Department
45 FTE
Clean Water Services Customers
Board of DirectorsClean Water
Services Advisory Commission
General Manager
Deputy General Manager
Regulatory Affairs Department
33 FTE
Source Control
Laboratory Services
Legal3 FTE
Fleet & Purchasing
Watershed Management Department
20 FTE
Wastewater Treatment
Department122 FTE
Conveyance Systems
Department113 FTE
Field Operations Division
Engineering Services Division
Operations Division
Mechanical Maintenance
Division
Operations
Planning & Development
Services Division Reuse/Support
Engineering Services
Electrical & Instrumentation & Controls Division
Finance & Accounting
Information Technology
Government & Public Affairs
Human Resources
Risk & Benefits

FINANCIAL SECTION

REPORT OF INDEPENDENT
AUDITOR

1
Report of Independent Auditors The Board of Directors Clean Water Services (A component unit of Washington County, Oregon) Hillsboro, Oregon Report on the Financial Statements
We have audited the accompanying financial statements of Clean Water Services (the District), a component unit of Washington County, Oregon, which comprise the statement of net position as of June 30, 2017, and the related statements of revenues, expenses, changes in net position, and cash flows for the year then ended, and the related notes to the financial statements, which collectively comprise the District’s basic financial statements as listed in the table of contents. Management’s Responsibility for the Financial Statements
Management is responsible for the preparation and fair presentation of these financial statements in accordance with accounting principles generally accepted in the United States of America; this includes the design, implementation, and maintenance of internal control relevant to the preparation and fair presentation of financial statements that are free from material misstatement, whether due to fraud or error. Auditor’s Responsibility
Our responsibility is to express an opinion on these financial statements based on our audit. We conducted our audit in accordance with auditing standards generally accepted in the United States of America. Those standards require that we plan and perform the audit to obtain reasonable assurance about whether the financial statements are free from material misstatement. An audit involves performing procedures to obtain audit evidence about the amounts and disclosures in the financial statements. The procedures selected depend on the auditor’s judgment, including the assessment of the risks of material misstatement of the financial statements, whether due to fraud or error. In making those risk assessments, the auditor considers internal control relevant to the entity’s preparation and fair presentation of the financial statements in order to design audit procedures that are appropriate in the circumstances, but not for the purpose of expressing an opinion on the effectiveness of the entity’s internal control. Accordingly, we express no such opinion. An audit also includes evaluating the appropriateness of accounting policies used and the reasonableness of significant accounting estimates made by management, as well as evaluating the overall presentation of the financial statements. We believe that the audit evidence we have obtained is sufficient and appropriate to provide a basis for our audit opinion.

2
Opinion
In our opinion, the financial statements referred to above present fairly, in all material respects, the financial position of the District as of June 30, 2017, and the results of its operations and its cash flows for the year then ended in accordance with accounting principles generally accepted in the United States of America. Emphasis of Matter
As discussed in Note 1, the financial statements present only the District and do not purport to, and do not present fairly the financial position of Washington County, Oregon, as of June 30, 2017 and the changes in its financial position and its cash flows for the years then ended, in accordance with accounting principles generally accepted in the United States of America. Our opinion is not modified with respect to this matter. Other Matters
Required Supplementary Information
Accounting principles generally accepted in the United States of America require that the management’s discussion and analysis, the schedule of funding progress other post-employment benefits, the schedule of statutorily required employer contributions pension plan, and the schedule of proportionate share of the collective net position liability be presented to supplement the basic financial statements. Such information, although not a part of the basic financial statements, is required by the Governmental Accounting Standards Board, who considers it to be an essential part of financial reporting for placing the basic financial statements in an appropriate operational, economic, or historical context. We have applied certain limited procedures to the required supplementary information in accordance with auditing standards generally accepted in the United States of America, which consisted of inquiries of management about the methods of preparing the information, then comparing the information for consistency with management’s responses to our inquiries, the basic financial statements, and other knowledge we obtained during our audit of the basic financial statements. We do not express an opinion or provide any assurance on the information because the limited procedures do not provide us with sufficient evidence to express an opinion or provide any assurance. Supplementary Information
Our audit was conducted for the purpose of forming an opinion on the financial statements that collectively comprise the District’s basic financial statements. The combining schedules and schedule of revenues and expenditures– budget and actual and related notes (the budgetary schedules) on pages 57 through 76, collectively represent supplementary information as provided in the table of contents, are presented for purposes of additional analysis and are not a required part of the basic financial statements.
3
The supplemental information is the responsibility of management and was derived from and relates directly to the underlying accounting and other records used to prepare the basic financial statements. Such information has been subjected to the auditing procedures applied in the audit of the basic financial statements and certain additional procedures, including comparing and reconciling such information directly to the underlying accounting and other records used to prepare the basic financial statements or to the basic financial statements themselves, and other additional procedures in accordance with auditing standards generally accepted in the United States of America. In our opinion, the supplementary information as described above is fairly stated, in all material respects, in relation to the basic financial statements as a whole. Other Information
Our audit was conducted for the purpose of forming an opinion on the financial statements that collectively comprise the District’s basic financial statements. The introductory and statistical sections have not been subjected to the auditing procedures applied in the audit of the basic financial statements, and accordingly, we do not express an opinion or provide any assurance on it. Report on Other Legal and Regulatory Requirements
In accordance with the Minimum Standards for Audits of Oregon Municipal Corporations, we have issued our report dated December 12, 2017, on our consideration of the District’s compliance with certain provisions of laws and regulations, including the provisions of Oregon Revised Statues as specified in Oregon Administrative Rules. The purpose of that report is to describe the scope of our testing of compliance and the results of that testing, and not to provide an opinion on compliance. Julie Desimone, Partner for Moss Adams, LLP December 12, 2017

MANAGEMENT’S
DISCUSSION
AND ANALYSIS

4
CLEAN WATER SERVICES
A Component Unit of Washington County, Oregon
MANAGEMENT’S DISCUSSION AND ANALYSIS Fiscal Year Ended June 30, 2017
As management of Clean Water Services (the District), a component unit of Washington County, Oregon, we offer readers of the District’s financial statements this narrative overview and analysis of the financial activities for the fiscal year ended June 30, 2017. We encourage readers to consider the information presented here in conjunction with additional information that we have furnished in our letter of transmittal (which can be found on pages I-XI of this report), and in the financial statements and notes to the basic financial statements (which immediately follow this discussion).
Financial Highlights
• The assets and deferred outflows of resources of the District exceeded its liabilities and deferred inflows of resources at the close of the fiscal year by $748.4 million (net position). Of this amount, $144.2 million represents unrestricted net position, which may be used to meet the District’s ongoing obligations to ratepayers and creditors.
• The District’s total net position increased by $61.3 million mainly due to net proceeds from current year operations and capital contributions from developers.
• The District’s total net capital assets increased $23.9 million primarily due to capital assets constructed and purchased in the current year totaling $56.7 million, and contributions of infrastructure systems and easements by developers totaling $9.4 million less District contributions of capital assets and loss on disposal totaling $1.4 million and current year depreciation and amortization of $40.8 million.
• Debt service coverage for senior debt was 3.64, which exceeded the 1.2 required by the bond covenants. The District had no subordinate debt outstanding during the year.
• Operating revenues total $137.2 million, an increase of $7.1 million. This is primarily attributed to a rate increase for sanitary and storm service charges during the year.
• Operating expenses total $106.4 million, a decrease of $2.5 million. The primary contributing factor is a decrease in labor costs related to pension expense in the current year.
• Long-term debt decreased by $14.8 million due to payment of outstanding bonds. The District had $214.3 million in net debt outstanding at year-end.

CLEAN WATER SERVICES A Component Unit of Washington County, Oregon
MANAGEMENT’S DISCUSSION AND ANALYSIS (Continued) Fiscal Year Ended June 30, 2017
5
Overview of the Financial Statements
This discussion and analysis is intended to serve as an introduction to Clean Water Services’ basic financial statements. The basic financial statements consist of the Statement of Net Position, Statement of Revenues, Expenses and Changes in Net Position, Statement of Cash Flows and Notes to Basic Financial Statements. The notes explain in more detail some of the information in the financial statements.
Financial Statements
The Statement of Net Position includes all of the District’s assets, liabilities, and deferred inflows/outflows of resources, with the difference reported as net position. This statement provides information about the nature and amounts of investments in resources (assets) and the obligations to the District’s creditors (liabilities). They also provide the basis for computing rate of return, evaluating the capital structure of the District and assessing the liquidity and financial flexibility of the District. Over time, increases or decreases in net position may serve as a useful indicator of whether the financial position of the District is improving or deteriorating.
All of the current year’s revenues and expenses are accounted for in the Statement of Revenues, Expenses and Changes in Net Position. This statement measures the success of the District’s operations over the past year and can be used to determine whether the District has successfully recovered all its costs through its user fees and other charges, and its profitability and credit worthiness.
The last financial statement is the Statement of Cash Flows. The primary purpose of this statement is to provide information about the District’s cash receipts and cash payments during the reporting period. The statement reports cash receipts, cash payments and net changes in cash resulting from operations, investing and financing activities and provides answers to such questions as where did the cash come from, what was the cash used for and what was the change in cash balance during the reporting period.
Clean Water Services maintains two operations, Sanitary Sewer and Surface Water Management (SWM), which the District accounts for and discloses separately in the Combining and Individual Schedules on pages 57-59 of this report. These statements offer short and long-term financial information about the activities of the two operations.
Notes to Basic Financial Statements
The notes provide additional information that is essential to a full understanding of the data provided in the government-wide statements. The Notes to Basic Financial Statements can be found on pages 19-53 of this report.
Other Information
In addition to the basic financial statements and accompanying notes, this report also presents certain required supplementary information concerning the District’s other post-employment health benefits,

CLEAN WATER SERVICES A Component Unit of Washington County, Oregon
MANAGEMENT’S DISCUSSION AND ANALYSIS (Continued) Fiscal Year Ended June 30, 2017
6
pension plan, and budgetary comparisons. Required supplementary information can be found on pages 54-56 of this report.
Financial Analysis
Financial Position
As noted earlier, net position over time may serve as a useful indicator of financial position. In the case of Clean Water Services, assets and deferred outflows of resources exceeded liabilities and deferred inflows of resources by $748.4 million at the close of the most recent fiscal year, an increase of $61.3 million. The table below provides a summary of net position at fiscal year-end.
Net Position(in Thousands)
2017 2016 Amount %
ASSETSCurrent assets $ 179,485 $ 153,526 $ 25,959 16.9%Noncurrent assets Cash and investments - restricted 136,407 135,543 864 0.6% Capital assets, net 682,344 658,415 23,929 3.6% Investment in joint venture 2,418 2,491 (73) -2.9% Other noncurrent assets 627 3,530 (2,903) -82.2%
Total assets 1,001,281 953,505 47,776 5.0%
Deferred outflows of resources 23,818 3,617 20,201 558.5%
LIABILITIESCurrent liabilities 35,282 36,806 (1,524) -4.1%Noncurrent liabilities 240,094 228,674 11,420 5.0%
Total liabilities 275,376 265,480 9,896 3.7%
Deferred inflows of resources 1,283 4,480 (3,197) 100.0%
NET POSITIONNet investment in capital assets 477,185 436,635 40,550 9.3%Restricted 127,024 131,179 (4,155) -3.2%Unrestricted 144,231 119,348 24,883 20.8%
Total net position, end of year $ 748,440 $ 687,162 $ 61,278 8.9%
Change

CLEAN WATER SERVICES A Component Unit of Washington County, Oregon
MANAGEMENT’S DISCUSSION AND ANALYSIS (Continued) Fiscal Year Ended June 30, 2017
7
Net investment in capital assets
63.8%
Restricted16.9%
Unrestricted19.3%
Net PositionJune 30, 2017
Net Position
By far the largest portion of Clean Water Services’ net position ($477.2 million or 63.8%) reflects its investment in capital assets (e.g., treatment facilities, collection and conveyance systems, land, sewer lines, stormwater management improvements, buildings, plant and office equipment and automotive equipment), less any related outstanding debt used to acquire or construct those assets. Clean Water
Services uses these capital assets to provide services to ratepayers; consequently, these assets are not available for future spending. Although Clean Water Services’ investment in capital assets is reported net of related debt, it should be noted that the resources needed to repay this debt must be provided from services to customers (ratepayers) or other sources, since the capital assets themselves cannot be used to liquidate these liabilities.
An additional portion of Clean Water Services’ net position ($127.0 million or 16.9%) represents resources that are subject to external restrictions on how they may be used. These restricted net assets include System Development Charges (SDC’s) collected from District customers when they connect to the sanitary sewer system to pay the cost of infrastructure expansion as needed to meet demands of population growth and to share cost burdens with existing customers for collection and treatment systems already built, funds restricted for debt service, and funds restricted for capital asset construction.
The remaining balance of unrestricted net position ($144.2 million or 19.3%) may be used to meet the District’s ongoing obligations to ratepayers and creditors.

CLEAN WATER SERVICES A Component Unit of Washington County, Oregon
MANAGEMENT’S DISCUSSION AND ANALYSIS (Continued) Fiscal Year Ended June 30, 2017
8
Results of Operations
In addition to the analysis of net position, it is useful to analyze the financial operations that took place during the year. The following table provides a summary of the changes in net position:
2017 2016 Amount %
REVENUESOperating revenues:
Service fees $ 129,696 $ 124,230 $ 5,466 4.4%Other revenues 7,490 5,822 1,668 28.6%
Total operating revenues 137,186 130,052 7,134 5.5%
Nonoperating revenues:Interest income 1,365 2,319 (954) -41.1%
Total revenues 138,551 132,371 6,180 4.7%
EXPENSESOperating expenses 106,429 108,896 (2,467) -2.3%Nonoperating expenses:
Interest 6,931 8,650 (1,719) -19.9%Loss on disposal of capital assets 1,339 182 1,157 635.7%Loss on equity in joint venture 73 77 (4) -5.2%Capital Donations - 2,425 (2,425) -100.0%
Total expenses 114,772 120,230 (5,458) -4.5%Income before contributions 23,779 12,141 11,638 95.9%
Capital contributions 37,499 37,031 468 1.3%Change in net position 61,278 49,172 12,106 24.6%
Net position, beginning of year, before adjustment 687,162 637,990 49,172 7.7%Net position, end of year $ 748,440 $ 687,162 $ 61,278 8.9%
Change
Changes in Net Position(in Thousands)

CLEAN WATER SERVICES A Component Unit of Washington County, Oregon
MANAGEMENT’S DISCUSSION AND ANALYSIS (Continued) Fiscal Year Ended June 30, 2017
9
Revenues
Total revenues for FY 2017, including operating revenues, non-operating revenues and contributed capital, totaled $176.1 million, an increase of approximately 3.9% over FY 2016. The increase in total revenues was primarily due to an increase in service fees.
Sanitary & SWM Service Charges: Operating revenue consists mainly of user charges for sewage and storm services. Monthly service charge revenues increased by 4.4%, totaling $129.7 million. This increase was primarily related to the sanitary sewer rate increase of 3% and a corresponding rate increase for the SWM service charge of 6.9% along with customer growth.
Capital Contributions: This revenue source includes System Development Charges (SDC’s), developer donated infrastructure, donated easements and third party contributions for District projects. Capital contributions totaled $37.5 million, an increase of $0.5 million, or 1.3% compared to the prior year. The increase is due to an increase in connections to the system (customer base growth) of $6.0 million in the current year. Developer donated infrastructure and donated easements were down by $5.2 million, as compared to the prior year. Capital contributions also reflects an additional one-time transfer of contributed capital of $47,279 to the Captive insurance company.
Other Income: This revenue source includes all other fees, grant revenues, subsidy payments and refunds. Other income increased totaled $7.5 million, an increase of $1.7 million, or 28.6% compared to the prior year. A majority of these revenues relate to a one-time revenue source for the District.
Investment Income: Investment income totaled $1.4 million in 2017, a decrease of $0.9 million compared to 2016, attributed to investment valuation losses at year-end.
$0
$20
$40
$60
$80
$100
$120
$140
Sani ServiceCharges
SWM ServiceCharges
CapitalContributions
Other Income InvestmentIncome
REVENUES BY SOURCE
2017
2016

CLEAN WATER SERVICES A Component Unit of Washington County, Oregon
MANAGEMENT’S DISCUSSION AND ANALYSIS (Continued) Fiscal Year Ended June 30, 2017
10
Expenses
Total expenses for FY 2017, including operating expenses, non-operating expenses and donated capital, totaled $114.8 million, a decrease of approximately 4.5% over FY 2016. The decrease in total expenses was primarily due to a decrease in pension expense in the current year.
Operating costs decreased by $2.5 million or 2.3%. This decrease was primarily due to a decrease in labor related costs. Even with the addition of 8.45 full-time-equivalent (FTE) positions during the year at an added cost of $1.4 million, total pension expense decreased by $7.9 million. The previous year reflected a $12.0 million dollar increase in pension expense resulting from the shift from a net pension asset of $5.8 million in FY 2015 to a net pension lability of $15.0 million at prior year-end. All other operating costs including utilities, professional services, supplies and depreciation and amortization were relatively flat or decreased during the year.
Non-operating costs decreased by $3.0 million or 26.4%. Bond debt service interest expense decreased by $1.7 million due to a decrease in debt service with the final payoff of the Series 2010A Revenue Bonds in October 2015 and Series 2004 in October 2016, advanced refunding of the Series 2009A Bonds, and an increase in capitalized interest during FY 2017 of $0.4 million, consistent with the increase in Construction-in-Progress at year-end. The District had no capital donations to others in FY 2017, as compared to $2.4 million in the prior year. Capital donations include project costs incurred by the District on joint construction projects with other local jurisdictions. Once the project is complete, the asset is donated to the jurisdiction that owns the asset and will continue to maintain it. However, the District experienced an increase in loss on disposal of capital assets of $1.2 million in the current year.
The District’s financial condition remains strong, with adequate liquid assets for ongoing operations, treatment plants and collection systems functioning at a level necessary to meet demand and a reasonable level of unrestricted net position. The current financial condition, support staff capabilities and Operating and Capital Improvement Plans (CIP) needed to meet anticipated growth within the service area are well balanced and under control.
$0
$5
$10
$15
$20
$25
$30
$35
$40
$45
$50
PersonnelExpense
Materials &Services
Depreciation &Amortization
Interest on Debt Loss on Disposalof Assets
CapitalDonations
EXPENSES BY TYPE
2017
2016

CLEAN WATER SERVICES A Component Unit of Washington County, Oregon
MANAGEMENT’S DISCUSSION AND ANALYSIS (Continued) Fiscal Year Ended June 30, 2017
11
Capital assets
As of year-end, the District has $682.3 million (net of accumulated depreciation and amortization) invested in capital assets, as reflected in the table below. Capital assets include treatment facilities, collection and conveyance systems, land, sewer lines, stormwater management improvements, buildings, plant and office equipment, automotive equipment and intangible assets including easements and patents. Total additions to capital assets from current year activity, before depreciation and amortization, were $56.7 million. The net change in capital assets from current year activity was an increase of $23.9 million over FY 2016.
2017 2016 Amount %
Land $ 16,882 $ 16,575 $ 307 1.9%Easements 11,752 8,787 2,965 33.7%Construction in progress 92,371 107,482 (15,111) -14.1%Buildings and improvements 38,110 32,484 5,626 17.3%Land improvements 75,617 75,263 354 0.5%Treatment plants 249,252 230,559 18,693 8.1%Sewer lines 158,336 154,936 3,400 2.2%Plant equipment 34,337 27,023 7,314 27.1%Automotive equipment 1,951 1,427 524 36.7%Plans and studies 2,772 2,906 (134) -4.6%Office equipment 816 854 (38) -4.4%Temporary Easements 50 54 (4) -7.4%Patents 98 65 33 50.8% Total capital assets $ 682,344 $ 658,415 $ 23,929 3.6%
Change
Capital Assets(Net of Depreciation and Amortization)
(in Thousands)

CLEAN WATER SERVICES A Component Unit of Washington County, Oregon
MANAGEMENT’S DISCUSSION AND ANALYSIS (Continued) Fiscal Year Ended June 30, 2017
12
Capital additions by category during FY 2017 included the following:
Additional information on Clean Water Services’ capital assets can be found in note 5 on page 31 of this report.
Treatment plant facilities $ 32,158,941 Sanitary conveyance systems 13,485,320 Stormwater conveyance systems 1,931,377 Pump stations 2,171,188 Watershed 5,024,660 Other (facilities, fleet, IT) 1,881,315
$ 56,652,801

CLEAN WATER SERVICES A Component Unit of Washington County, Oregon
MANAGEMENT’S DISCUSSION AND ANALYSIS (Continued) Fiscal Year Ended June 30, 2017
13
Long-term debt
Debt outstanding at year-end is summarized in the table below. Revenue bonds, which are the District’s principal source of debt financing, are paid from sanitary sewer system operating revenues.
As of year-end, the District had total net bonded debt outstanding of $214.3 million versus $229.1 million at the end of fiscal year 2016, and of that amount $13.9 million is due within one year. All of this debt (i.e., revenue bonds) is secured solely by specified revenue sources of the sanitary sewer operations.
Sewer revenue bonds are expected to be the preferred debt instrument for the District. The District advanced refunded a portion of the Series 2009A Revenue Bonds in October 2016. The District’s strong financial position resulted in an upgrade in the rating by Standard & Poor’s from AA+ to AAA and Moody’s from Aa2 to Aa1.
Historically, District bond credit ratings have been enhanced by funding required debt service reserves with bond surety insurance policies. District bond surety providers experienced significant credit rating downgrades in 2008, which created the need to fund debt service reserve requirements on the District’s recent issues with cash from bond proceeds. This change in practice will also enhance the District’s capacity to market future bond issues.
Additional information on Clean Water Services long-term debt can be found in note 7 on pages 32-37 of this report.
2017 2016 Amount %
Sewer revenue bonds $ 200,900 $ 215,137 $ (14,237) -6.6%Revenue pension bonds 13,435 14,000 (565) -4.0%
Total $ 214,335 $ 229,137 $ (14,802) -6.5%
Change
Long-term Debt(Net of Premiums and Discounts)
(in Thousands)

CLEAN WATER SERVICES A Component Unit of Washington County, Oregon
MANAGEMENT’S DISCUSSION AND ANALYSIS (Continued) Fiscal Year Ended June 30, 2017
14
Economic Factors and Next Year's Budgets and Rates
• The adopted budget for 2018 reflects a 4.2% increase in operating expenses. This increase is primarily due to increased labor costs of $2.8 million or 6.9%, which reflects an increase of 13 FTE from the prior year. Materials and services are expected to increase by approximately $256,400, or 0.9% and capital outlay decreased by $179,800 or 32.8% for equipment purchases.
• Budgeted positions for fiscal year 2018 increased by 13 FTE, or 3.8% from the prior year.
• Adopted sanitary sewer fee rates increased by 3% for fiscal year 2018. This will add an estimated $1.26 per month to the average residential customer’s bill. Storm water maintenance fees are increasing by 6.45%, which will add an estimated 50 cents per month to the average residential customer’s bill.
• The District has budgeted for an estimated $74.7 million in new sanitary sewer system improvements and $4.7 million in new surface water management system improvements in FY 2018. These projects will be funded using a combination of cash reserves from system development charges and service fees and contributions from developers or partnering agencies. These investments are planned to increase system capacity, meet regulatory requirements for water quality, and enhance overall watershed health.
• The adopted budget for FY 2018 reflects a decrease in debt service of $4.3 million or 16.2%. This decrease is due to the final pay off of the Series 2004 Revenue Bonds in the prior year and the advanced refunding of a portion of the Series 2009A Revenue Bonds.
All of these factors were considered in preparing Clean Water Services’ budget for the 2018 fiscal year.
The District annually prepares a 10-year financial outlook that incorporates capital improvement planning (CIP) with operational planning. The 10-year CIP plans are developed using new project requests and updates to the status of existing projects. The CIP plans are developed by division and program managers and reviewed with recommendations as to projects needing funding incorporated into the financial forecast. Project spending is then matched with either cash reserves or debt financing. Depending upon the reserves needed, the financial plan then becomes a model of integrating productivity improvements, growth projections, rate increases, debt restructuring and debt financing of capital. The first year of the CIP becomes the basis for the next year’s budget with respect to investments in capital improvements.
The current 10-year forecast projects that estimated future sanitary operating revenues will safely cover operating expenses and all current and future debt service requirements. The current 10-year forecast for SWM operations indicates ending reserves will slowly increase if the District manages SWM capital expenditures with modest annual increases going forward and continues to increase the SWM rates annually consistent with the recent trending at $0.50 per ESU. The District will continue to evaluate the need for capital expenditures and options for funding costs in the future.

CLEAN WATER SERVICES A Component Unit of Washington County, Oregon
MANAGEMENT’S DISCUSSION AND ANALYSIS (Continued) Fiscal Year Ended June 30, 2017
15
Requests for Information
The financial report is designed to provide a general overview of Clean Water Services’ finances for all those with an interest in the District’s finances. Questions concerning any of the information provided in this report or requests for additional information should be addressed to the Business Operations Department Director, Clean Water Services, 2550 SW Hillsboro Highway, Hillsboro, Oregon 97123.

BASIC
FINANCIAL STATEMENTS

See notes to basic financial statements16
Current assets:$ 158,169,486
17,905,240 1,240,267
380,910 496,126
Current assets - unrestricted 178,192,029
4,729 758,894 154,185 375,509
Current assets - restricted 1,293,317
Total current assets 179,485,346
Noncurrent assets:136,407,390
203,243
Land 16,881,760 Permanent easements 11,751,869 Construction in progress 92,370,786
561,191,710 Intangible assets, net of accumulated amortization 148,193 Investment in joint venture 2,417,767 Prepaid electricity 422,941
Total noncurrent assets 821,795,659
Total assets 1,001,281,005
Deferred outflow of resources:Deferred loss on refunding 4,018,037 Pension related 19,799,852
Total assets and deferred outflow of resources $ 1,025,098,894
Current liabilities:$ 5,325,254
5,396,472 99,479
2,343,514 13,915,725
Current liabilities - payable from unrestricted assets 27,080,444
8,127,180 73,985
Current liabilities - payable from restricted assets 8,201,165
Total current liabilities 35,281,609
Noncurrent liabilities:200,419,331
Net pension liability 38,730,244 569,385 374,751
Total noncurrent liabilities 240,093,711
Total liabilities 275,375,320
Deferred inflow of resources:Pension related 1,283,456
Total liabilities and deferred inflow of resources 276,658,776
Net position:477,184,721
Restricted for:107,270,147
19,504,099 Captive Insurance 250,000
Unrestricted 144,231,151
Total net position 748,440,118
Total liabilities, deferred inflow of resources and net position $ 1,025,098,894
Accounts payableAccrued payrollAccrued self insurance
Liabilities and Net Position
Accrued self insurance
Net investment in capital assets
Capital constructionDebt service
Accrued interest payable Current portion of bonds payable, net
Accounts payable - from restricted assetsAccrued interest payable- from restricted assets
Postemployment benefits other than pensions
Bonds payable, net
Capital assets, not being depreciated or amortized:
Capital assets, net of accumulated depreciation
Contracts receivable-restricted
Prepaid expenses
Cash and investments-restricted
Connection fees receivable-restrictedContributions receivable from local governments-restrictedBuild America Bonds (BABs) subsidy receivable-restricted
Cash with bond trustee - restricted
June 30, 2017
CLEAN WATER SERVICES(A Component Unit of Washington County, Oregon)
Statement of Net Position
Cash and investmentsAccounts receivable (net of allowance for uncollectibles)Materials and supplies inventoryCurrent portion contracts receivable
Assets

See notes to basic financial statements17
Operating revenues:$ 129,696,545
7,489,713
Total operating revenues 137,186,258
Operating expenses:38,494,637
4,392,787 8,989,321 4,207,025 3,755,123
424,605 1,427,661 3,943,731
40,793,639
Total operating expenses 106,428,529
Operating income 30,757,729
Nonoperating revenues (expenses):1,346,020
Interest on assessments and contracts 18,537 (1,339,175)
(73,069) (6,931,004)
Total nonoperating expense (6,978,691)
Income before contributions 23,779,038
Capital contributions:27,409,774 10,041,999
Contributed capital - CWIC captive insurance 47,279
Total capital contributions 37,499,052
Change in net position 61,278,090
Net position, beginning of year 687,162,028
Net position, end of year $ 748,440,118
Insurance
Loss on equity in joint ventureInterest expense
ChemicalsDepreciation and amortization expense
Investment income
Net loss on disposal of capital assets
System development chargesInfrastructure donated by developers
For the year ended June 30, 2017
CLEAN WATER SERVICES (A Component Unit of Washington County, Oregon)
Statement of Revenues, Expensesand Changes in Net Position
Service feesOther
Labor and fringe benefitsUtilitiesProfessional servicesSuppliesAdministrative costsRepairs and maintenance

See notes to basic financial statements18
Cash flows from operating activities:$ 131,129,763
(27,309,896) (34,169,032)
6,918,826
Net cash from operating activities 76,569,661
Cash flows from noncapital financing activities:(565,000) (847,010)
Contributed capital - CWIC captive insurance 47,279
Net cash from noncapital financing activities (1,364,731)
Cash flows from capital and related financing activities:33,225,000
8,534,747 (3,969,162)
(837,389) (53,396,481) (53,355,000)
(9,975,392) 4,409,724
(21,895) 28,004,102
38,499
Net cash from capital and related financing activities (47,343,247)
Cash flows from investing activities:1,383,094
Net increase in cash and cash equivalents 29,244,777
Cash and cash equivalents, beginning of year 265,336,828
Cash and cash equivalents, end of year 294,581,605
158,169,486 136,412,119
Total cash and investments $ 294,581,605
Reconciliation of operating income to net cash from operating activities:
$ 30,757,729
Adjustments to reconcile operating income to net cashfrom operating activities:
40,793,639 27,522
3,993,632 6,820
10,970
851,361 24,440
3,844 457,883
(358,179)
45,811,932
$ 76,569,661
$ 9,447,671 $ (73,069)
Net cash from operating activities
Schedule of non-cash capital and related financing activities:Contributions of capital assets by developersLoss on equity in joint venture
Materials and supplies inventoryPrepaid expensesAccrued expensesAccounts payable
Total adjustments
Postemployment benefit costs other than pensionsBABs subsidyChanges in assets and liabilities:
Accounts receivable
Operating income
Depreciation and amortization
Net pension expenseAmortization of prepaid electric
Proceeds from sale of capital assets
Interest on investments
Unrestricted cash and investmentsRestricted cash and investments
Interest paid on bonds
Interest received on assessments and contractsCapital contributed by customers and cities
Principal received on assessments and contracts
Proceeds from issuance of debt-premiumProceeds from issuance of debt-bond issueNet proceeds from refunding-Series 2001 bondsAcquisition and construction of capital assetsPrincipal paid on bonds
Payments to suppliersPayments to employees for servicesOther operating revenue
Proceeds from issuance of debt
Principal paid on pension bondsInterest paid on pension bonds
CLEAN WATER SERVICES(A Component Unit of Washington County, Oregon)
Statement of Cash Flows
For the year ended June 30, 2017
Received from customers
CLEAN WATER SERVICES (A Component Unit of Washington County, Oregon)
NOTES TO BASIC FINANCIAL STATEMENTS
Fiscal Year Ended June 30, 2017
19
(1) Summary of Significant Accounting Policies
(a) Reporting Entity
Clean Water Services (the District) (formerly known as the Unified Sewerage Agency of Washington County), a Component Unit of Washington County, Oregon was formed February 4, 1970 under the provisions of Oregon Revised Statutes (ORS) Chapter 451 to operate a sanitary sewer system in the Tualatin River Drainage Basin. Sixteen individual sanitary districts were consolidated to form the District. Subsequently, thirteen municipalities selected the District to perform sewage collection and treatment of waste. On July 1, 1990, the District assumed responsibility for surface water management in the Basin. As required by ORS 451.485, the Washington County Board of Commissioners is the governing body of the District. Principal funding sources are charges to users and system development charges (SDCs).
The District is considered a component unit of Washington County, Oregon (County) because the elected officials of the County also serve as the Board for the District. The District is presented in the Comprehensive Annual Financial Report of the County as a discretely presented component unit.
Clean Water Institute
On March 2, 2010, the Clean Water Services Board of Directors instructed the District to form Clean Water Institute (CWI). The General Manager of the District currently serves as the Executive Director for CWI. One of the District’s Board Members currently serves on CWI’s Board.
CWI is a nonprofit 501(c)(3) formed to advance watershed restoration and resource recovery through innovative strategies and to promote scientific research, education, and environmental protection activities that benefit watersheds throughout the country and around the world. For the fiscal year ended June 30, 2017, the transactions between the District and CWI are deemed to be immaterial, and therefore, CWI is not reported as a component unit of the District.
Clean Water Insurance Company
On February 16, 2016, the Clean Water Services Board of Directors instructed the District to form Clean Water Insurance Company (CWIC or “the Captive”), a wholly owned subsidiary of the District, domiciled in the state of Hawaii. The District is the sole member of this captive insurance company.
The Captive is a registered Limited Liability Company (LLC) formed to advance long term risk management program savings through the use of a formalized self-insurance program that can access the reinsurance markets for additional seismic coverages as well as provide a potential for funding of loss prevention and mitigation projects to further protect District assets or recover from a seismic event.
The Captive is considered a component unit of the District and is presented in the Comprehensive Annual Financial Report of the District as a blended component unit because it provides services exclusively to the District. CWIC issues separate financial statements and they can be obtained upon request from the District.
CLEAN WATER SERVICES (A Component Unit of Washington County, Oregon)
NOTES TO BASIC FINANCIAL STATEMENTS (continued)
Fiscal Year Ended June 30, 2017
20
(1) Summary of Significant Accounting Policies (Continued)
(b) Basis of Presentation and Accounting
The District's financial statements are maintained on a flow of economic resources measurement focus. With this measurement focus, all assets and liabilities are included in the Statement of Net Position. The Statement of Revenues, Expenses and Changes in Net Position presents increases (e.g. revenues) and decreases (e.g. expenses) in total net position.
The District’s financial statements are presented on the accrual basis of accounting. Under the accrual basis of accounting, revenues are recorded at the time they are earned and expenses are recorded at the time liabilities are incurred.
The District reports the following operating segment:
• The sanitary sewer operations segment accounts for the activities of the District which manage the public sanitary system. The District operates 4 sewage treatment plants, 42 pump stations, and maintains responsibility for 770 miles of sanitary gravity mains, 67 miles of force mains, and 14 miles of reuse mains.
(c) Operating vs. Nonoperating Revenues and Expenses
The District has defined operating revenues to include all service charges and other applicable charges for services directly attributable to providing either sanitary or surface water management services, plan check, product sales or other related activity.
Operating expenses are defined as those expenses directly related to providing services including administrative expenses and depreciation and amortization, and excludes personnel services utilized directly for capital projects which are charged to capital assets.
Nonoperating revenues and expenses are not directly attributable to the services provided. This includes investment interest, capital donations and contributions, gain (loss) on disposal of capital assets, gain (loss) on equity in joint ventures and non-operating grant revenue. Capital donations relate to infrastructure constructed by the District which is donated to another jurisdiction upon completion. Capital contributions include sewer and storm connections fees collected from customers newly connecting to the system and developer constructed infrastructure donated to the District.

CLEAN WATER SERVICES (A Component Unit of Washington County, Oregon)
NOTES TO BASIC FINANCIAL STATEMENTS (continued)
Fiscal Year Ended June 30, 2017
21
(1) Summary of Significant Accounting Policies (Continued)
(d) Cash and Investments
The District’s cash and investments are comprised of pooled funds held and invested by 1) the Washington County Department of Support Services, Finance Division, 2) the State of Oregon Treasurer’s Local Government Investment Pool, 3) Tualatin Valley Water District as a fiscal agent, and 4) Bank of Hawaii for the Captive. Cash and investments are presented at fair value in accordance with GASB Statement No. 31, Accounting and Financial Reporting for Certain Investments and for External Investment Pools, and GASB Statement No 72, Fair Value Measurement and Application. Interest earned on investments is allocated monthly by the County based upon the District’s average monthly cash balance.
(e) Cash Equivalents/Statement of Cash Flows
For purposes of the Statement of Cash Flows, cash and cash equivalents include all cash and investments held by the District’s Treasurer, since it has the general characteristics of a demand deposit (i.e. deposits of additional cash may be made at any time and cash may be withdrawn at any time without prior notice or penalty).
(f) Accounts Receivable
Accounts receivable represent user charges which are recognized as earned. An allowance for doubtful accounts is established for amounts deemed to be uncollectible, based on historical collection percentages. At June 30, 2017, the allowance was $340,000.
(g) Materials and Supplies Inventory
Inventories of operating supplies and repair parts are valued at the lower of cost (average cost) or market and are charged against operations as used.
(h) Assessments and Contracts Receivable
Assessments receivable represent amounts assessed against property owners for local sewer improvements. An allowance for doubtful accounts is not deemed necessary as the assessments represent liens against the property. Outstanding assessments are payable over ten to twenty years at interest rates ranging from 3.5% to 6.46%.
(i) Restricted Assets and Liabilities
Assets, the use of which is restricted to specific purposes by state statute, bond indenture, or other outside party, and related liabilities, are segregated on the Statement of Net Position.

CLEAN WATER SERVICES (A Component Unit of Washington County, Oregon)
NOTES TO BASIC FINANCIAL STATEMENTS (continued)
Fiscal Year Ended June 30, 2017
22
(1) Summary of Significant Accounting Policies (Continued)
(j) Capital Assets
Capital asset items purchased are valued at historical cost or estimated historical cost if actual historical cost is not available. Contributed capital assets, donated works of art and similar items, and capital assets received in a service concession arrangement are reported at acquisition value at the time received.
Major additions, improvements and replacements including related plans and studies are capitalized. Normal maintenance and repairs are charged to operations as incurred. Gains or losses realized from disposal of capital assets are reflected in the Statement of Revenues, Expenses and Changes in Net Position. Assets costing more than $5,000 with a life of 5 years or more are capitalized and depreciated over their useful lives. One-half year’s depreciation is taken in the year of acquisition and disposal of asset. Depreciation is computed on capital assets placed in service using the straight-line method over their estimated useful lives as follows:
Sewer lines 50 years Treatment plants 25 years Land improvements 25 years Plans and studies 5-25 years Buildings 20 years Plant and office equipment 5-10 years Automotive equipment 5 years
(k) Intangible Capital Assets
Intangible assets, including easements, water rights, patents and internally generated computer software, are reported in the financial statements. Intangible assets purchased are valued at historical cost or estimated historical cost if actual historical cost is not available. Contributed intangible assets are reported at acquisition value at the time received.
Intangible capital assets with an individual cost of $5,000 and a useful life of more than five years are capitalized and amortized over their useful lives. Intangible assets with indefinite lives are not amortized. Additions or improvements and other capital outlays that significantly extend the useful life of an asset, or that significantly increase the capacity of an asset are capitalized. Normal maintenance and repairs are charged to operations as incurred.
Amortization on exhaustible intangible capital assets is reported on the straight-line basis over the estimated useful life of the asset. One-half year’s amortization is taken in the year of acquisition and disposal of the asset. Gains or losses realized from disposal of intangible capital assets are reflected in the Statement of Revenues, Expenses and Changes in Net Position.
(l) Investments in Joint Venture
Investments in joint venture with other governments are reported at cost plus or minus the District’s share of operating income or loss (equity method).

CLEAN WATER SERVICES (A Component Unit of Washington County, Oregon)
NOTES TO BASIC FINANCIAL STATEMENTS (continued)
Fiscal Year Ended June 30, 2017
23
(1) Summary of Significant Accounting Policies (Continued)
(m) Premium and Discount on Bonds Payable
Premiums and discounts are amortized by the effective interest method over the life of the respective debt instruments. Bonds payable are reported net of the applicable bond premium or discount.
(n) Post-employment Benefits Other than Pensions
The entity’s net Other Post-Employment Benefits (OPEB) Obligation is recognized as a long-term liability.
The District offers health benefits to retirees under age 65 as well as their qualified dependents, as required by state law. The District’s subsidized retiree health benefits are not pre-funded and are reported on a pay-as-you-go basis.
(o) Contributions Other Than Capital Assets
Contributions which represent non-exchange transactions are comprised of the following:
Customers – Sewer line and storm and surface water management connection fees from sewer patrons and sewer pipe installation fees from developers.
Capital Grants – Funds received from federal and state agencies restricted for acquisition and construction of sewage facilities.
Contributions from Local Governments – Funds received from cities and Washington County for shared construction costs of collection systems owned and maintained by the District, and for other projects with regional benefit undertaken by the District.
(p) Insurance
The District is insured under a guaranteed cost plan for workers' compensation and for costs in excess of insurance policy retention (deductible) limits on fire loss, property damage, general liability, auto liability, and all risk coverage (theft, vandalism, etc.). The District currently provides for estimated losses from pending claims on all self-insured retention risks which are reported as a current expense and liability.
Incurred but not reported (IBNR) claims for general and employment liability are claims that are incurred through the end of the fiscal year but not reported until after that date and are reported as noncurrent liabilities.
(q) Accrued Compensated Absences
The District allows employees to accumulate earned but unused vacation and sick leave benefits and compensatory time balances. Unused sick pay is not recognized as a liability because it does not vest. Accumulated compensation for overtime and vacation pay accrued at the end of each year is used within one year and is reported as a current expense and liability.
CLEAN WATER SERVICES (A Component Unit of Washington County, Oregon)
NOTES TO BASIC FINANCIAL STATEMENTS (continued)
Fiscal Year Ended June 30, 2017
24
(1) Summary of Significant Accounting Policies (Continued)
(r) Deferred Outflows/Inflows of Resources
In addition to assets, the Statement of Net Position will sometimes report a separate section for deferred outflows of resources. This separate financial statement element, deferred outflows of resources, represents a consumption of net position that applies to a future period and so will not be recognized as an outflow of resources (expense/expenditure) until then.
In addition to liabilities, the Statement of Net Position will sometimes report a separate section for deferred inflows of resources. This separate financial statement element, deferred inflows of resources, represents an acquisition of net position that applies to a future period and so will not be recognized as an inflow of resources (revenue) until then.
Loss on Refunding. The item that qualifies in this category is the deferred loss on refunding reported in the Statement of Net Position. Deferred charges, resulting from the carrying value of refunded debt and its reacquisition price, are deferred and amortized over the shorter of the life of the refunded debt or refunding debt.
Pensions. For purposes of measuring the net pension liability, deferred outflows of resources and deferred inflows of resources related to pensions, and pension expense, information about the fiduciary net position of the Oregon Public Employees Retirement System (OPERS) and additions to/deductions from OPERS’s fiduciary net position have been determined on the same basis as they are reported by OPERS. For this purpose, benefit payments (including refunds of employee contributions) are recognized when due and payable in accordance with the benefit terms. Investments are reported at fair value.
(s) Net Position
Net position comprises various net earnings from operating and nonoperating revenues, expenses and contributions of capital. Net position is classified in the following three components: net investment in capital assets; restricted net position; and unrestricted net position.
Net investment in capital assets consists of all capital assets less accumulated depreciation, and debt less unspent debt proceeds that is attributable to the acquisition, construction and improvement of those assets.
Restricted net position consists of net assets for which constraints are placed thereon by external parties, such as lenders, grantors, contributors, laws, regulations and enabling legislation.
Unrestricted net position consists of all other net assets not included in the above categories.
The District has not established a formal policy regarding the use of its restricted and unrestricted fund balance amounts.
(t) Use of Estimates
The preparation of the financial statements, in conformity with accounting principles generally accepted in the United States of America, requires management to make estimates and assumptions that affect the reported amounts of assets and liabilities and disclosure of contingent assets and liabilities on the date of the financial statements and the reported amounts of revenues and expenses during the reporting period. Actual results could differ from those estimates.

CLEAN WATER SERVICES (A Component Unit of Washington County, Oregon)
NOTES TO BASIC FINANCIAL STATEMENTS (continued)
Fiscal Year Ended June 30, 2017
25
(1) Summary of Significant Accounting Policies (Continued)
(u) Adoption of new GASB pronouncements
During the fiscal year ended June 30, 2017, the District implemented the following GASB pronouncements:
GASB Statement No. 74, Financial Reporting for Postemployment Benefit Plans Other Than Pension Plans
This Statement replaces Statements No. 43, Financial Reporting for Postemployment Benefit Plans Other Than Pension Plans, as amended, and No. 57, OPEB Measurements by Agent Employers and Agent Multiple-Employer Plans. It also includes requirements for defined contribution OPEB plans that replace the requirements for those OPEB plans in Statement No. 25, Financial Reporting for Defined Benefit Pension Plans and Note Disclosures for Defined Contribution Plans, as amended, Statement No. 43, and Statement No. 50, Pension Disclosures. The District does not have any plans that fall within the scope of this Statement, therefore the provisions of this statement do not apply to the District.
GASB Statement No. 77, Tax abatement Disclosures
This Statement requires governments that enter into tax abatement agreements to disclose information about those agreements. GASB Statement No. 77 was implemented by the District for the fiscal year ended June 30, 2017. The District does not have any tax abatement agreements that fall within the scope of this Statement to report.
GASB Statement No. 80, Blending Requirements for Certain Component Units
This Statement improves financial reporting by clarifying the financial statement presentation requirements for certain component units. GASB 80 was implemented by the District for the fiscal year ended June 30, 2017.
(2) Stewardship, Compliance, and Accountability
Oregon Local Budget Law requires the District to prepare and adopt a budget by individual funds prior to July 1 of the budget year. The resolution authorizing appropriations, adopted in the categories of operating expenses, debt service, capital outlay, contingency and operating transfers for each fund sets the level by which expenditures cannot legally exceed appropriations. Appropriations lapse at the end of the fiscal year. The District’s budget is prepared on the modified accrual basis of accounting.
Unexpected additional resources may be added to the original budget through the use of a supplemental budget and appropriation resolution. A supplemental budget, greater than 10% of the fund’s original budget, requires hearings before the public, publications in newspapers and approval by the Board of Directors. Original and supplemental budgets may be modified by the use of appropriation transfers between the levels of control. Such transfers require approval by the Board of Directors. During the fiscal year ended June 30, 2017, the Board approved one appropriation transfer.

CLEAN WATER SERVICES (A Component Unit of Washington County, Oregon)
NOTES TO BASIC FINANCIAL STATEMENTS (continued)
Fiscal Year Ended June 30, 2017
26
(3) Cash and Investments
Washington County, Oregon maintains a common cash and investment pool for all County funds including those of the District, except the Captive. The types of investments in which the County and District may invest are restricted by State of Oregon Statutes and a Board adopted investment policy. Authorized investments include general obligations of the United States Government and its agencies, certain bonded obligations of Oregon municipalities, banker’s acceptances, certain high-grade commercial paper, repurchase agreements, and the State of Oregon Treasurer's Local Government Investment Pool (LGIP), among others. The District also maintains restricted cash in reserves with the Tualatin Valley Water District as a fiscal agent for the District. The Captive cash is held in bank demand deposits with the Bank of Hawaii.
Cash and investments for the District at June 30, 2017 are as follows: Petty cash $ 3,850 Cash with fiscal agents 258,521 Cash with bond trustee 4,729 Bank of Hawaii – Captive Insurance/CWIC 677,540 Investments 293,636,965 $ 294,581,605
Cash and investments are reflected on the statement of net position as follows: Cash and investments $ 158,169,486 Restricted cash and investments 136,412,119 $ 294,581,605
Investments at June 30, 2017 were as follows: State of Oregon Treasurer's Local Government Investment Pool $ 19,702,868 Washington County investment pool 273,934,097 Total investments $ 293,636,965
(a) Investment in the Oregon State Treasurer’s Local Government Investment Pool
Investments in the Local Government Investment Pool (LGIP) are included in the Oregon Short-Term Fund, which is an external investment pool, and is not registered with the U.S. Securities and Exchange Commission as an investment company. Investments in the Short-Term Fund are governed by ORS 294.135, Oregon Investment Council, and portfolio guidelines issued by the Oregon Short-Term Fund Board. Investment in the LGIP is neither insured nor guaranteed by the FDIC or any other government agency. The State Treasurer is the investment officer for the LGIP and is responsible for all funds in the LGIP. These funds must be invested and the investments managed, as a prudent investor would, exercising reasonable care, skill and caution. Investments in the LGIP are stated at fair market value. Separate financial statements for the Oregon Short Term Fund are available from the Oregon Audits Division, 255 Capital Street NE, Suite 500, Salem, OR 97301.

CLEAN WATER SERVICES (A Component Unit of Washington County, Oregon)
NOTES TO BASIC FINANCIAL STATEMENTS (continued)
Fiscal Year Ended June 30, 2017
27
(3) Cash and Investments (Continued)
The table below outlines the LGIP’s investment maturity limitations and the actual maturities at June 30, 2017:
Allowableper Policy
LGIP Maturity: Up to 93 days Minimum of 50% 65%
94 days to 1 year Maximum of 25% 20%
1 to 3 years Maximum of 25% 15%
Actual
(b) Cash and investments include pooled cash and investments held by Washington County, Oregon, on behalf of the District
Disclosures relating to Custodial Credit Risk: This is the risk that in the event of bank failure, the District deposits may not be returned to them. As required by Oregon Revised Statues, deposits in excess of federal depository insurance were held at a qualified depository for public funds. All qualified depositories for public funds are included in the multiple financial institution collateral pool that is maintained by and in the name of the Office of the State Treasurer. As a result, the District’s remaining deposits in excess of Federal Depository Insurance Corporation (FDIC) insurance are considered to be fully collateralized.
Deposits with Bank of Hawaii for the Captive are comprised of bank demand deposits. The combined total bank balance is $677,540. Of these deposits, $250,000 is covered by federal depository insurance.
Disclosures relating to Interest Rate Risk: Interest rate risk is the risk that would adversely affect the fair value of an investment should market interest rates change. Generally, the longer the maturity of an investment, the greater the sensitivity of its fair value to changes in market interest rates. District management believes the liquidity in the portfolio is sufficient to meet cash flow requirements and preclude the District from having to sell investments below original cost for that purpose. The District relies upon their treasurer, Washington County, to monitor the interest rate risk inherent in its portfolio by comparing the maturity dates of its investments to the minimum maturity dates outlined in the investment policy.

CLEAN WATER SERVICES (A Component Unit of Washington County, Oregon)
NOTES TO BASIC FINANCIAL STATEMENTS (continued)
Fiscal Year Ended June 30, 2017
28
(3) Cash and Investments (Continued)
The table below outlines the investment maturity limitations and the actual maturities of the Washington County investment pool at June 30, 2017:
Maturity: Less than 30 days 10% 10% Less than 1 year 25% 30% 5 years or less 100% 100%Weighted Average Maturity 2.5 years 1.8 yearsCallable Agency Securities 25% 8%
MinimumAllowed Actual
Disclosures relating to Credit Risk: This is the risk that an issuer of an investment will not fulfill its obligation to the holder of the investment. Credit risk is measured by the assignment of a rating by a nationally recognized rating organization and is minimized by purchasing only those securities, which are rated by three of the nationally recognized credit rating agencies, at the time of purchase. The District’s investment policy specifies ratings – Standard & Poor’s = minimum AA-, and Moody’s Investors Services = minimum Aa3.
The District categorizes its fair value measurements within the fair value hierarchy established by generally accepted accounting principles. The hierarchy is based on the valuation inputs used to measure the invested value of the asset. Level 1 inputs are quoted prices in active markets for identical assets; Level 2 inputs are significant other observable inputs: Level 3 inputs are significant unobservable inputs. The District has the following recurring fair value measurements as of June 30, 2017:
• Federal agency coupon securities are valued using quoted market prices (Level 1 inputs) • Corporate notes are valued using quoted market prices (Level 1 inputs) • Treasury coupon securities are valued using quoted market prices (Level 1 inputs)
For more detailed information, reference should be made to the Washington County Comprehensive Annual Financial Report for June 30, 2017.

CLEAN WATER SERVICES (A Component Unit of Washington County, Oregon)
NOTES TO BASIC FINANCIAL STATEMENTS (continued)
Fiscal Year Ended June 30, 2017
29
(4) Receivables
SANI SWM TOTALService receivable 16,326,764$ 1,880,932$ 18,207,696$ Interest receivable 23,258 - 23,258 Other 14,286 - 14,286
Unrestricted Accounts Receivable 16,364,308 1,880,932 18,245,240 Allowance for doubtful accounts (290,000) (50,000) (340,000)
Net Unrestricted Accounts Receivable 16,074,308 1,830,932 17,905,240
Connection fees receivable 758,894 - 758,894 Contributions receivable from local governments 133,397 20,788 154,185 Build America Bonds subsidy receivable 375,509 - 375,509
Restricted Accounts Receivable 1,267,800 20,788 1,288,588
Total Net Accounts Receivable 17,342,108$ 1,851,720$ 19,193,828$
ACCOUNTS RECEIVABLE - CURRENT
CURRENT NON-CURRRENT TOTALWashington County Fleet 51,070$ -$ 51,070$ City of Forest Grove Sunset Drive Sanitary Sewer 115,895 - 115,895 Clean Water Instittute Operating Loan 213,945 - 213,945
Unrestricted Contracts Receivable 380,910 - 380,910
Local Improvement District Assessments - 203,243 203,243 Restricted Contracts Receivable - 203,243 203,243
Total Contracts Receivable 380,910$ 203,243$ 584,153$
CONTRACTS RECEIVABLE

CLEAN WATER SERVICES (A Component Unit of Washington County, Oregon)
NOTES TO BASIC FINANCIAL STATEMENTS (continued)
Fiscal Year Ended June 30, 2017
30
(4) Receivables (Continued)
Washington County Fleet
The District brought fleet service in-house and entered into an intergovernmental agreement between the District and Washington County dated September 18, 2001. The District paid Washington County the marginal cost the County incurred $510,700 in constructing additional capacity in the fleet facility at Walnut Street to accommodate District vehicles and equipment. The County agreed to make payments to the District totaling $51,070, beginning on December 31, 2008, annually for ten years, coinciding with the County’s future capacity needs.
City of Forest Grove Notes Receivable
Intergovernmental agreement between the District and City of Forest Grove for construction of sanitary sewer lines on Sunset Drive, dated September 19, 2006. The City agreed to reimburse the District for cost of construction. On July 15, 2008, Forest Grove entered into a 10 year note with a beginning balance of $987,835, annual interest rate of 4.20% and semi-annual payments of $60,997.
Clean Water Institute Loan
On October 26, 2010, the District entered into a loan agreement with CWI. The agreement allows for loans and/or advances from the District to CWI of up to $400,000 over the following four fiscal years. Interest on outstanding loan balances due from CWI to the District are calculated monthly and based on 1.1 times the average monthly Oregon Local Government Investment Pool (LGIP) rates.
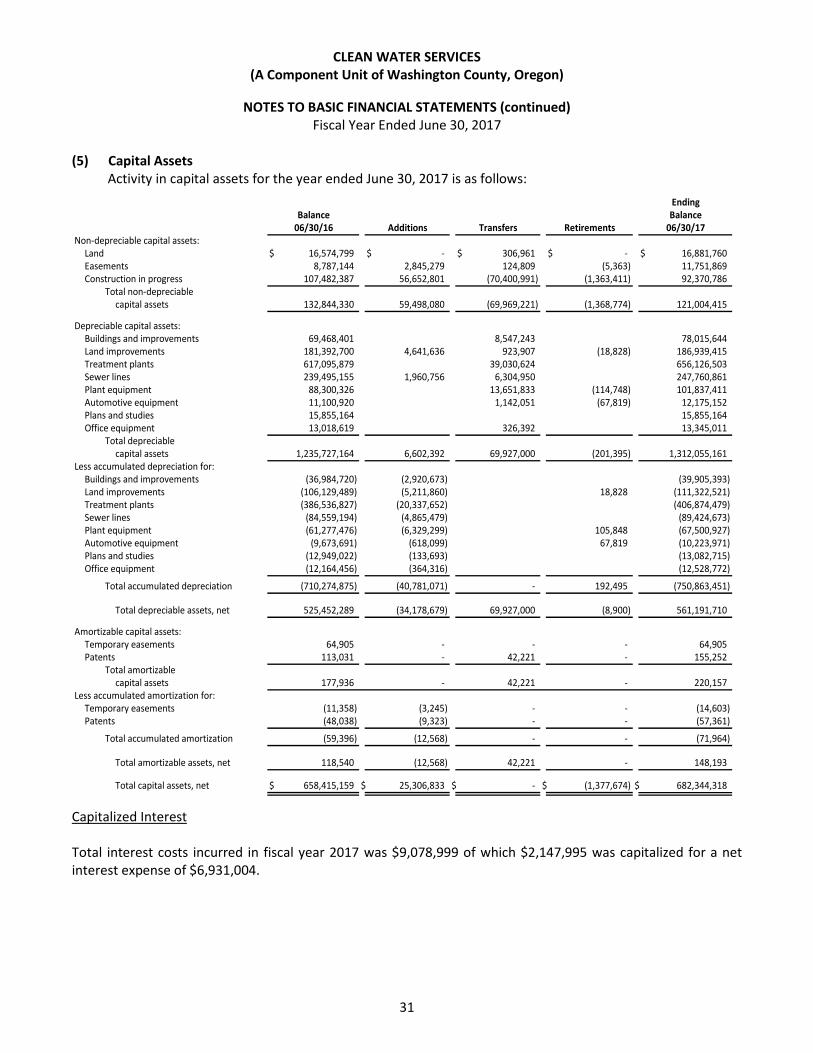
CLEAN WATER SERVICES (A Component Unit of Washington County, Oregon)
NOTES TO BASIC FINANCIAL STATEMENTS (continued)
Fiscal Year Ended June 30, 2017
31
(5) Capital Assets Activity in capital assets for the year ended June 30, 2017 is as follows:
Non-depreciable capital assets:Land $ 16,574,799 $ - $ 306,961 $ - $ 16,881,760 Easements 8,787,144 2,845,279 124,809 (5,363) 11,751,869 Construction in progress 107,482,387 56,652,801 (70,400,991) (1,363,411) 92,370,786
Total non-depreciable capital assets 132,844,330 59,498,080 (69,969,221) (1,368,774) 121,004,415
Depreciable capital assets:Buildings and improvements 69,468,401 8,547,243 78,015,644 Land improvements 181,392,700 4,641,636 923,907 (18,828) 186,939,415 Treatment plants 617,095,879 39,030,624 656,126,503 Sewer lines 239,495,155 1,960,756 6,304,950 247,760,861 Plant equipment 88,300,326 13,651,833 (114,748) 101,837,411 Automotive equipment 11,100,920 1,142,051 (67,819) 12,175,152 Plans and studies 15,855,164 15,855,164 Office equipment 13,018,619 326,392 13,345,011
Total depreciablecapital assets 1,235,727,164 6,602,392 69,927,000 (201,395) 1,312,055,161
Less accumulated depreciation for:Buildings and improvements (36,984,720) (2,920,673) (39,905,393) Land improvements (106,129,489) (5,211,860) 18,828 (111,322,521) Treatment plants (386,536,827) (20,337,652) (406,874,479) Sewer lines (84,559,194) (4,865,479) (89,424,673) Plant equipment (61,277,476) (6,329,299) 105,848 (67,500,927) Automotive equipment (9,673,691) (618,099) 67,819 (10,223,971) Plans and studies (12,949,022) (133,693) (13,082,715) Office equipment (12,164,456) (364,316) (12,528,772)
Total accumulated depreciation (710,274,875) (40,781,071) - 192,495 (750,863,451)
Total depreciable assets, net 525,452,289 (34,178,679) 69,927,000 (8,900) 561,191,710
Amortizable capital assets:Temporary easements 64,905 - - - 64,905 Patents 113,031 - 42,221 - 155,252
Total amortizablecapital assets 177,936 - 42,221 - 220,157
Less accumulated amortization for:Temporary easements (11,358) (3,245) - - (14,603) Patents (48,038) (9,323) - - (57,361)
Total accumulated amortization (59,396) (12,568) - - (71,964)
Total amortizable assets, net 118,540 (12,568) 42,221 - 148,193
Total capital assets, net $ 658,415,159 $ 25,306,833 $ - $ (1,377,674) $ 682,344,318
Balance06/30/16 Retirements
Ending
06/30/17Balance
Additions Transfers
Capitalized Interest Total interest costs incurred in fiscal year 2017 was $9,078,999 of which $2,147,995 was capitalized for a net interest expense of $6,931,004.

CLEAN WATER SERVICES (A Component Unit of Washington County, Oregon)
NOTES TO BASIC FINANCIAL STATEMENTS (continued)
Fiscal Year Ended June 30, 2017
32
(6) Joint Venture
The Barney Reservoir Joint Ownership Commission (the Commission) was formed to own, operate, and expand the J.W. Barney Reservoir. Ownership of the joint venture is comprised of the District (10%), Tualatin Valley Water District (35%), and the cities of Hillsboro (31%), Forest Grove (2.5%), and Beaverton (21.5%). The Commission is governed by one member from each entity. The operating costs of the joint venture are shared by the participating agencies and are reported as an operating expense in the District’s Sanitary Sewer Fund. The net position of the Commission continues to decline due to depreciation expense, which is not funded by the joint venture partners. There are no significant projects identified in the 10 year capital plan for the Commission. If future projects are identified by the Commission, the District will include its proportionate share of costs in the annual Capital Improvement Plan. The District’s year-end equity investment in the Commission was $2,417,767.
Financial statements for the Commission may be obtained from the City of Hillsboro, Finance Department at 150 East Main Street, Hillsboro, Oregon, 97123.
(7) Bonds Payable
The District has issued revenue bonds in accordance with ORS 451.545. The District’s revenue bonds are payable exclusively from the District’s net sewer revenue as defined in the bond indenture agreements. The District’s tax-exempt debt remains in compliance with all Internal Revenue Service arbitrage regulations.
Legal Debt Margin The District’s legal debt limitation, as defined by Oregon Revised Statutes 451.545, shall not exceed 13 percent of the true cash value of all property assessed within the District’s boundaries. The limitation applies to the aggregate of all outstanding General Obligation Bonds. The legal debt limit and debt margin for the District are both $12.094 billion at June 30, 2017, because the District had no outstanding general obligation debt.
Investment in joint venture at June 30, 2016 2,490,836$ Investment - Income (loss ) for the year (73,069) Investment in joint venture at June 30, 2017 2,417,767$
INVESTMENT IN JOINT VENTURE

CLEAN WATER SERVICES (A Component Unit of Washington County, Oregon)
NOTES TO BASIC FINANCIAL STATEMENTS (continued)
Fiscal Year Ended June 30, 2017
33
(7) Bonds Payable (Continued)
The details of the individual bond issues are as follows:
Is sue Origina l Insta l lment Pledged for InterestBonds Date Issue Payments Repayment Purpose Rates
Sewer Revenue Bonds :
2004 SeriesSenior Lien 07/01/04 26,455,000$ Annual ly Net sewer Refunding 2.0-5.25%
through 2017 revenue2009 Series ASenior Lien 03/25/09 58,755,000 Annual ly Net sewer Sewer capi ta l 3.0-5.25%
through 2028 revenue improvement2010 Series BSenior Lien 04/28/10 90,260,000 Annual ly Net sewer Sewer capi ta l 3.97-5.801%
through 2036 revenue improvement2011 Series ASenior Lien 08/24/11 30,255,000 Annual ly Net sewer Refunding 2.0-5.0%
through 2022 revenue2011 Series BSenior Lien 08/24/11 50,000,000 Annual ly Net sewer Sewer capi ta l 2.5-5.0%
through 2033 revenue improvement
2016 Series A 10/13/16 33,225,000 Annual ly Net sewer Refunding 5.00%Senior Lien through 2028 revenue
Revenue Pens ion Bonds :2004 Series 05/27/04 15,990,000 Annual ly Gross sewer Pens ion 4.596-6.095%
through 2028 revenue l iabi l i ty304,940,000$
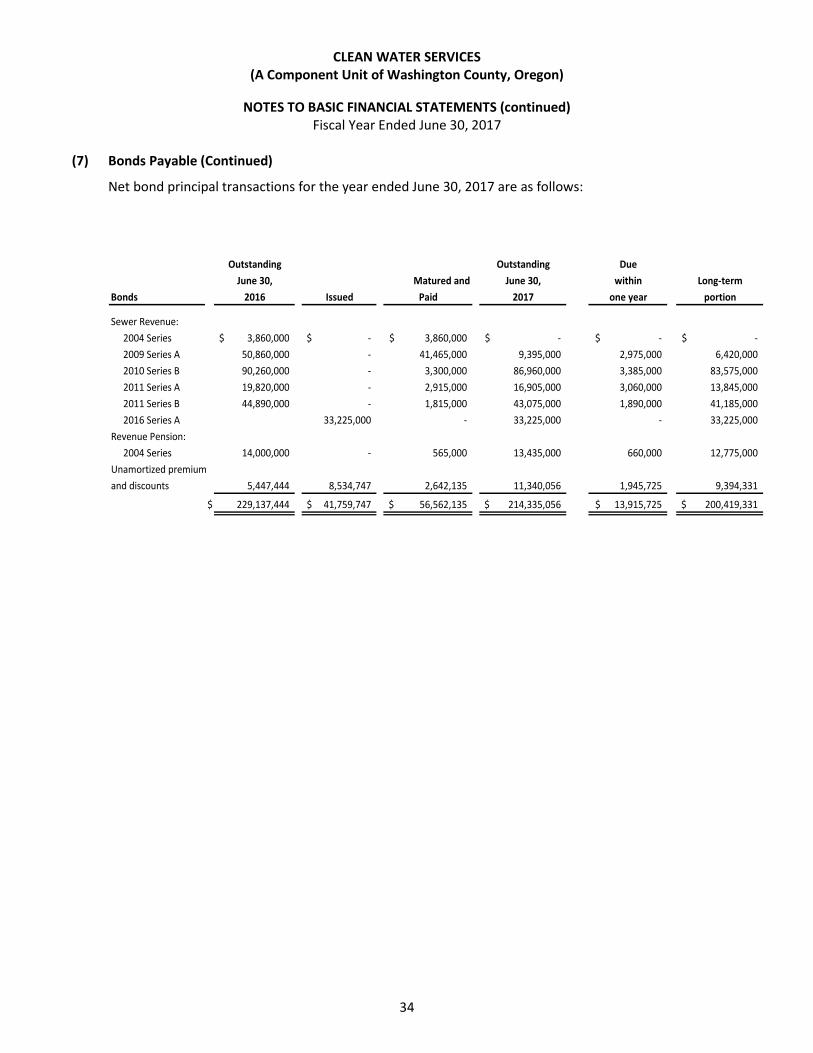
CLEAN WATER SERVICES (A Component Unit of Washington County, Oregon)
NOTES TO BASIC FINANCIAL STATEMENTS (continued)
Fiscal Year Ended June 30, 2017
34
(7) Bonds Payable (Continued)
Net bond principal transactions for the year ended June 30, 2017 are as follows:
Outstanding Outstanding DueJune 30, Matured and June 30, within Long-term
Bonds 2016 Issued Paid 2017 one year portion
Sewer Revenue:2004 Series 3,860,000$ -$ 3,860,000$ -$ -$ -$ 2009 Series A 50,860,000 - 41,465,000 9,395,000 2,975,000 6,420,000 2010 Series B 90,260,000 - 3,300,000 86,960,000 3,385,000 83,575,000 2011 Series A 19,820,000 - 2,915,000 16,905,000 3,060,000 13,845,000 2011 Series B 44,890,000 - 1,815,000 43,075,000 1,890,000 41,185,000 2016 Series A 33,225,000 - 33,225,000 - 33,225,000
Revenue Pension: 2004 Series 14,000,000 - 565,000 13,435,000 660,000 12,775,000
Unamortized premiumand discounts 5,447,444 8,534,747 2,642,135 11,340,056 1,945,725 9,394,331
$ 229,137,444 41,759,747$ 56,562,135$ 214,335,056$ 13,915,725$ 200,419,331$

CLEAN WATER SERVICES (A Component Unit of Washington County, Oregon)
NOTES TO BASIC FINANCIAL STATEMENTS (continued)
Fiscal Year Ended June 30, 2017
35
(7) Bonds Payable (Continued)
Future maturities of bond principal and interest at June 30, 2017 are as follows:
2004
Total Sewer Revenue
Revenue Pension
Fiscal Year 2009A 2010B 2011A 2011B 2016A Bonds Bonds Total Principal
Principal
2018 2,975,000$ 3,385,000$ 3,060,000$ 1,890,000$ -$ 11,310,000$ 660,000$ 11,970,000$
2019 3,130,000 3,475,000 3,210,000 1,965,000 - 11,780,000 760,000 12,540,000
2020 3,290,000 3,575,000 3,375,000 2,060,000 - 12,300,000 870,000 13,170,000
2021 3,680,000 3,540,000 2,165,000 3,180,000 12,565,000 990,000 13,555,000
2022 3,790,000 3,720,000 2,275,000 3,340,000 13,125,000 1,125,000 14,250,000
2023-2027 20,835,000 - 13,020,000 19,455,000 53,310,000 7,990,000 61,300,000
2028-2032 24,815,000 - 16,080,000 7,250,000 48,145,000 1,040,000 49,185,000
2033-2037 - 23,405,000 - 3,620,000 - 27,025,000 - 27,025,000
9,395,000 86,960,000 16,905,000 43,075,000 33,225,000 189,560,000 13,435,000 202,995,000
Bond premium 55,116 - 1,203,589 2,394,480 7,686,871 11,340,056 - 11,340,056
Bonds payable, net 9,450,116$ 86,960,000$ 18,108,589$ 45,469,480$ 40,911,871$ 200,900,056$ 13,435,000$ 214,335,056$
2004
Total Sewer Revenue
Revenue Pension
Fiscal Year 2009A 2010B 2011A 2011B 2016A Bonds Bonds Total Interest
Interest
2018 395,375$ 4,591,082$ 768,750$ 1,803,350$ 1,661,250$ 9,219,807$ 813,839$ 10,033,646$
2019 242,750 4,444,415 612,000 1,726,250 1,661,250 8,686,665 774,628 9,461,293
2020 82,250 4,286,540 447,375 1,635,450 1,661,250 8,112,865 728,914 8,841,779
2021 4,120,447 274,500 1,529,825 1,581,750 7,506,522 676,584 8,183,106
2022 3,945,696 93,000 1,418,825 1,418,750 6,876,271 617,035 7,493,306
2023-2027 16,738,327 - 5,449,725 4,341,375 26,529,427 1,882,954 28,412,381
2028-2032 10,451,981 - 2,383,400 318,250 13,153,631 63,388 13,217,019
2033-2037 - 2,778,244 - 72,400 2,850,644 - 2,850,644
720,375 51,356,732 2,195,625 16,019,225 12,643,875 82,935,832 5,557,342 88,493,174
Tota l Principa l
and Interest 10,115,375$ 138,316,732$ 19,100,625$ 59,094,225$ 45,868,875$ 272,495,832$ 18,992,342$ 291,488,174$

CLEAN WATER SERVICES (A Component Unit of Washington County, Oregon)
NOTES TO BASIC FINANCIAL STATEMENTS (continued)
Fiscal Year Ended June 30, 2017
36
(7) Bonds Payable (Continued)
Sewer revenue bond indenture agreements require the District to maintain net operating revenues, as defined in the indenture agreements, in each fiscal year at least equal to 1.2 times annual debt service on the Senior Lien Bonds and 1.1 times annual debt service on the Subordinate Lien Bonds and to maintain adequate insurance on the facilities. Additionally the bond indenture agreements establish that bonds are secured by a pledge from the District to maintain separate Senior Lien and Subordinate Lien reserve accounts in an amount equal to annual debt service for each class of bonds. The District has fulfilled the reserve requirements by obtaining surety bonds as allowed by the bond indenture agreements for the Series 2004 issues and funded reserves with debt proceeds for the Series 2009A issued in fiscal year 2009, the Series 2010A and 2010B issued in fiscal year 2010, and the Series 2011B issued in fiscal year 2011, of $5.3 million, $0.6 million, $5.8 million, and $1.8 million, respectively. No reserves were required for the Series 2016A refunding bonds issued in October 2016 and reserves for the Series 2009A of $1.97 million were released to advance refund the debt.
Future pledged revenues for outstanding revenues bonds are as follows:
Current refunding On October 13, 2016, the District issued $33,225,000 in Senior Lien Sewer Revenue Refunding Bonds and released $1,970,012 in Debt Service Reserves for an advanced refunding of $38,620,000 of the Series 2009A Senior Lien Sewer Revenue Bonds. The bonds were issued at a premium of $8,534,162. The refunding was undertaken to reduce total future debt service payments and results in a net present savings of $5.3 million. The acquisition price exceeded the net carrying amount of the old debt by $3,969,162. This amount is being netted against the new debt and amortized over the remaining life of the advance refunded debt.
Build America Bonds The District issued $99,155,000 in Senior Lien Sewer Revenue Bonds in fiscal year 2010 including $8,895,000 in tax exempt Series 2010A and $90,260,000 in federally taxable Series 2010B. The Series 2010B Bonds are issued as “Build America Bonds” (BABs) and are eligible under current federal law for a 35% interest subsidy. The District is not able to reduce the annual debt service or maximum annual debt service by the amount of the interest subsidies received for purposes of determining compliance with the District’s rate covenant and the tests for issuing additional Senior Lien Parity Obligations.
Revenue, Net For the YearFor the Year of Related Ended JuneEnding June Future Pledged Expenses for 30, 2017 Debt30, of Final Revenue Debt the Year Ended (P&I)
Issue Purpose Revenue Stream Payments Outstanding June 30, 2017 Payments2004 Series Refunding Refunding Net sewer revenue 2017 -$ 90,455,569$ * 3,961,325$ 2009 Series A Sewer capital improvement Net sewer revenue 2029 9,395,000 * 4,421,923 2010 Series B Sewer capital improvement Net sewer revenue 2036 86,960,000 * 8,026,318 2011 Series A Refunding Net sewer revenue 2022 16,905,000 * 3,833,125 2011 Series B Sewer capital improvement Net sewer revenue 2033 43,075,000 * 3,692,450 2016 Series A Refunding Net sewer revenue 2029 33,225,000 * 775,250
189,560,000$ 90,455,569$ 24,710,391$
* same revenue source pledged for all six bond series outstanding

CLEAN WATER SERVICES (A Component Unit of Washington County, Oregon)
NOTES TO BASIC FINANCIAL STATEMENTS (continued)
Fiscal Year Ended June 30, 2017
37
(7) Bonds Payable (Continued)
The federal interest subsidy was reduced by 6.8% and 6.9% for the October 1, 2016 and April 1, 2017 bond interest payments, respectively, which reduced the subsidy by approximately $113,300. The total reduction in subsidy payments to-date has been $482,272. This was in response to the requirements of the Balanced Budget and Emergency Deficit Control Act of 1985. The District will receive Federal subsidy payments totaling approximately $18 million over the remaining life of the issue. This subsidy may be reduced in the future based on federal balanced budget constraints.
Pension related debt The revenue pension bond agreement issued in May 2004 requires debt service to be paid from gross sewer revenues. Accordingly, debt service for these bonds will be treated as operating expenses in determining debt service coverage in future periods.
Defeased debt In the current and prior years, the District defeased certain bonds by placing the proceeds of refunding bonds in an irrevocable trust to provide for all future debt service on the defeased bonds. Accordingly, the trust account assets and the related liability for those defeased bonds are not included in the District's financial statements. As of June 30, 2017, $58,185,000 of defeased bonds remain outstanding.
(8) Deferred compensation plan
During 1977 the District adopted, and has made subsequent amendments to, the Clean Water Services Deferred Compensation Plan. This plan is created in accordance with IRS code section 457(b), and was most recently amended and restated effective June 26, 2012. The General Manager, and the Risk and Benefits Manager of the District are the Trustee and Administrators of the plan. Plan contributions and assets are set aside in trust, with the custodial trustee and administrator, Empower Retirement (formerly Great West Life), for the exclusive benefit of participants and beneficiaries.
The plan generally covers any full-time employee working 37.5 or more hours per week, and any regular part-time employee working fewer than 40 hours per week. The plan permits participating employees to contribute up to 100% of gross pay or the statutorily prescribed annual dollar limit whichever is smaller. The District may, at its discretion, make employer contributions. The District’s plan as currently adopted does not provide for employer contributions. Plan contributions and earnings thereon are available to participating employees upon termination of employment, retirement, death, or unforeseen emergency.
Contributions from plan members during fiscal year 2017 were $1,471,524.

CLEAN WATER SERVICES (A Component Unit of Washington County, Oregon)
NOTES TO BASIC FINANCIAL STATEMENTS (continued)
Fiscal Year Ended June 30, 2017
38
(9) Pension Plan
Plan Description
Substantially all District employees are members in the Oregon Public Employees Retirement System (OPERS); a cost-sharing, multiple-employer defined benefit pension plan that acts as a common investment and administrative agent for government units in the State of Oregon. Employees hired before August 29, 2003 belong to the Tier One/Tier Two Retirement Benefit Program (established pursuant to ORS Chapter 238), while employees hired on or after August 29, 2003 belong to the OPSRP Pension Program (established pursuant to ORS Chapter 238A).
Beginning January 1, 2004, PERS active Tier One and Tier Two members became members of the Individual Account Program (IAP) of OPSRP. PERS members retain their existing Defined Benefit Plan accounts, but member contributions are now deposited into the member’s IPA account, not into the member’s Defined Benefit Plan account. Accounts are credited with earnings and losses net of administrative expenses.
OPERS produces an independently audited CAFR which can be found at: http://www.oregon.gov/pers/EMP/Pages/Actuarial-Financial-Information.aspx.
Benefits Provided
Tier One/Tier Two Retirement Benefit
Pension Benefits. The PERS retirement allowance is payable monthly for life. It may be selected from 13 retirement benefit options. These options include survivorship benefits and lump-sum refunds. The basic benefit is based on years of service and final average salary. A percentage (2.0% for police and fire employees, 1.67% for general service employees) is multiplied by the number of years of service and the final average salary. Benefits may also be calculated under either a formula plus annuity (for members who were contributing before August 21, 1981) or a money match computation if a greater benefit results.
A member is considered vested and will be eligible at a minimum retirement age for a service retirement allowance if he or she has had contribution in each of five calendar years or has reached at least 50 years of age before ceasing employment with a participating employer (age 45 for police and fire members). General service employees may retire after reaching age 55. Police and fire members are eligible after reaching age 50. Tier One general service employee benefits are reduced if retirement occurs prior to age 58 with fewer than 30 years of service. Police and fire member benefits are reduced if retirement occurs prior to age 55 with fewer than 25 years of service. Tier Two members are eligible for full benefits at age 60. The ORS Chapter 238 Defined Benefit Pension Plan is closed to new members hired on or after August 29, 2003.
Death Benefits. Upon the death of a non-retired member, the beneficiary receives a lump-sum refund of the member’s account balance (accumulated contributions and interest). In addition, the beneficiary will receive a lump-sum payment from employer funds equal to the account balance, provided one or more of the following conditions are met:
• the member was employed by a PERS employer at the time of death,
• the member died within 120 days after termination of PERS-covered employment,
• the member died as a result of injury sustained while employed in a PERS-covered job, or
• the member was on an official leave of absence from a PERS-covered job at the time of death.

CLEAN WATER SERVICES (A Component Unit of Washington County, Oregon)
NOTES TO BASIC FINANCIAL STATEMENTS (continued)
Fiscal Year Ended June 30, 2017
39
(9) Pension Plan (Continued)
Disability Benefits. A member with 10 or more years of creditable service who becomes disabled from other than duty-connected causes may receive a non-duty disability benefit. A disability resulting from a job-incurred injury or illness qualifies a member for disability benefit regardless of the length of PERS-covered service. Upon qualifying for either a non-duty or duty disability, service time is computed to age 58 (55 for police and fire members) when determining the monthly benefit.
Benefit Changes After Retirement. Members may choose to continue participation in a variable equities investment account after retiring and may experience annual benefit fluctuations due to changes in the market value of equity investments. Under ORS 238.360 monthly benefits are adjusted annually through cost-of-living changes. The COLA is capped at 2.0% . OPSRP Pension Program
Pension Benefits. The Pension Program (ORS Chapter 238A) provides benefits to members hired on or after August 29, 2003. This portion of OPSRP provides a life pension funded by employer contributions. Benefits are calculated by formula for members who attain normal retirement age. For general service members, 1.5% is multiplied by the number of years of service and the final average salary. Normal retirement age for general service members is age 65, or age 58 with 30 years of retirement credit. For police and fire members, 1.8% is multiplied by the number of years of service and the final average salary. Normal retirement age for police and fire members is age 60 or age 53 with 25 years of retirement credit. To be classified as a police and fire member, the individual must have been employed continuously as a police and fire member for at least five years immediately preceding retirement.
A member of the OPSRP Pension Program becomes vested on the earliest of the following dates: the date the member completes 600 hours of service in each of five calendar years, the date the member reaches normal retirement age, and, if the pension program is terminated, the date on which termination becomes effective.
Death Benefits. Upon the death of a non-retired member, the spouse or other person who is constitutionally required to be treated in the same manner as the spouse receives for life 50 percent of the pension that would otherwise have been paid to the deceased member.
Disability Benefits. A member who has accrued 10 or more years of retirement credits before the member becomes disabled or a member who becomes disabled due to job-related injury shall receive a disability benefit of 45 percent of the member’s salary determined as of the last full month of employment before the disability occurred.
Benefit Changes After Retirement. Under ORS 238A.210 monthly benefits are adjusted annually through cost-of-living changes.
Contributions
PERS funding policy provides for monthly employer contributions at actuarially determined rates. These contributions, expressed as a percentage of covered payroll, are intended to accumulate sufficient assets to pay benefits when due. Employer contribution rates for the period were based on the December 31, 2013 actuarial valuation. The rates based on a percentage of payroll, first became effective July 1, 2015. The District’s contribution rates for the period were 12.29% for Tier One/Tier Two member and 5.96% for OPSRP General

CLEAN WATER SERVICES (A Component Unit of Washington County, Oregon)
NOTES TO BASIC FINANCIAL STATEMENTS (continued)
Fiscal Year Ended June 30, 2017
40
(9) Pension Plan (Continued)
Service members. The District’s total contributions were $2,543,871. Covered employees are required to contribute 6% of their annual covered salary to the Plan. OPSRP Individual Account Program (IAP)
Pension Benefits. An IAP member becomes vested on the date the employee account is established or the date the rollover account was established. If the employer makes optional employer contributions for a member, the member becomes vested on the earliest of the following dates: the date the member completes 600 hours of service in each of five calendar years, the date the member reaches normal retirement age, the date the IAP is terminated, the date the active member becomes disabled, or the date the active member dies.
Death Benefits. Upon the death of a non-retired member, the beneficiary receives in a lump sum the member’s account balance, roller account balance, and vested employer optional contribution account balance. If a retired member dies before the installment payments are completed, the beneficiary may receive the remaining installment payments or choose a lump-sum payment.
Pension Assets, Liabilities, Pension Expense, Deferred Outflows of Resources and Deferred Inflows of Resources Related to Pensions
At June 30, 2017, the District reported a liability of $38,730,244 for its proportionate share of the OPERS net pension liability. The net pension liability was measured as of June 30, 2016, and the total pension liability used to calculate the net pension liability was determined by an actuarial valuation as of December 31, 2014 rolled forward to June 30, 2016. The District’s proportion of the net pension liability was based on a projection of the District’s long-term share of contributions to the pension plan relative to the projected contributions of all participating employers, actuarially determined. At June 30, 2017, the District’s proportion was 0.2579897%, which decreased by .00333% from its proportion measured as of June 30, 2016.
For the year ended June 30, 2017, the District recognized pension expense of $6,719,269. At June 30, 2017, the District reported deferred outflows of resources and deferred inflows of resources related to pensions from the following sources:
Deferred Outflows Deferred Inflowsof Resources of Resources
Differences between expected and actual experience 1,281,366$ -$
Changes of assumptions 8,260,230 -
Net difference between projected and actual earnings on investments 7,651,471 -
Change in proportionate share 62,914 179,397
Differences between employer contributions and proportionate share of contributions - 1,104,059
Contributions subsequent to the measurement date 2,543,871 -
Total 19,799,852$ 1,283,456$

CLEAN WATER SERVICES (A Component Unit of Washington County, Oregon)
NOTES TO BASIC FINANCIAL STATEMENTS (continued)
Fiscal Year Ended June 30, 2017
41
(9) Pension Plan (Continued)
Deferred outflows of resources related to pensions of $2,543,871 resulting from the District’s contributions subsequent to the measurement date will be recognized as either a reduction of the net pension liability or an increase in the net pension asset in the year ended June 30, 2018. Other amounts reported as deferred inflows of resources related to pensions will be recognized in pension expense as follows:
2018 2,724,002$ 2019 2,724,002 2020 5,592,744 2021 4,328,244 2022 603,533
Total 15,972,525$
Year ended June 30:

CLEAN WATER SERVICES (A Component Unit of Washington County, Oregon)
NOTES TO BASIC FINANCIAL STATEMENTS (continued)
Fiscal Year Ended June 30, 2017
42
(9) Pension Plan (Continued)
Actuarial Methods and Assumptions
The total pension liability in the December 31, 2014 actuarial valuation was determined using the following actuarial methods and assumptions:
Actuarial Cost Method Entry Age Normal
Amortization Method Amortized as a level percentage of payroll as layered amortization bases over a closed period; Tier One/Tier Two UAL is amortized over 20 years and OPSRP pension UAL is amortized over 16 years
Asset Valuation Method Market value of assets
Actuarial Assumptions:
Inflation Rate 2.5% (reduced from 2.75%)
Investment Rate of Return 7.5% (reduced from 7.75%)
Projected Salary Increases 3.5% overall payroll growth (reduced from 3.75%); salaries for individuals are assumed to grow at 3.5% plus assumed rates of merit/longevity increases based on service.
Cost of living adjustments (COLA) Blend of 2.00% COLA and graded COLA (1.25%/0.15%) in accordance with Moro decision; blend based on service.
Mortality Healthy retirees and beneficiaries:
RP-2000 Sex-distinct, generational per Scale BB, with collar adjustments and set-backs as described in the valuation.
Active members:
Mortality rates are a percentage of healthy retiree rates that vary by group, as described in the valuation.
Disabled retirees:
Mortality rates are a percentage (70% for males, 95% for females) of the RP-2000 Sex-distinct, generational per Scale BB, disabled morality table.

CLEAN WATER SERVICES (A Component Unit of Washington County, Oregon)
NOTES TO BASIC FINANCIAL STATEMENTS (continued)
Fiscal Year Ended June 30, 2017
43
(9) Pension Plan (Continued)
Actuarial valuations of an ongoing plan involve estimates of the value of projected benefits and assumptions about the probability of events far into the future. Actuarially determined amounts are subject to continual revision as actual results are compared to past expectations and new estimates are made about the future. Experience studies are performed as of December 31 of even numbered years. The methods and assumptions shown above are based on the 2014 Experience Study, which reviewed experience for the four-year period ending on December 31, 2014.
Long-Term Expected Rate of Return
To develop an analytical basis for the selection of the long-term expected rate of return assumption, in July 2015 the PERS Board reviewed long-term assumptions developed by both Milliman’s capital market assumptions team and the Oregon Investment Council’s (OIC) investment advisors. The table below shows Milliman’s assumptions for each of the asset classes in which the plan was invested at that time based on the OIC long-term target asset allocation. The OIC’s description of each asset class was used to map the target allocation to the asset classes shown below. Each asset class assumption was based on a consistent set of underlying assumptions, and includes adjustment for the inflation assumption. These assumptions are not based on historical returns, but instead are based on a forward-looking capital market economic model.
CompoundAnnual Return
Asset Class Target (Geometric)Core Fixed Income 8.00% 4.00%Short-Term Bonds 8.00% 3.61%Bank/Leveraged Loans 3.00% 5.42%High Yield Bonds 1.00% 6.20%Large/Mid Cap US Equities 15.75% 6.70%Small Cap US Equities 1.31% 6.99%Micro Cap US Equities 1.31% 7.01%Developed Foreign Equities 13.13% 6.73%Emerging Market Equities 4.12% 7.25%Non-US Small Cap Equities 1.88% 7.22%Private Equity 17.50% 7.97%Real Estate (Property) 10.00% 5.84%Real Estate (REITS) 2.50% 6.69%Hedge Funds of Funds - Diversified 2.50% 4.64%Hedge Fund - Event-driven 0.63% 6.72%Timber 1.88% 5.85%Farmland 1.88% 6.37%Infrastructure 3.75% 7.13%Commodities 1.88% 4.58% Total 100.00%Assumed Inflation - Mean 2.50%

CLEAN WATER SERVICES (A Component Unit of Washington County, Oregon)
NOTES TO BASIC FINANCIAL STATEMENTS (continued)
Fiscal Year Ended June 30, 2017
44
(9) Pension Plan (Continued)
Discount Rate
The discount rate used to measure the total pension liability was 7.5% for the Defined Benefit Pension Plan. The projection of cash flows used to determine the discount rate assumed that contributions from plan members and those contributing employers are made at the contractually required rates, as actuarially determined. Based on those assumptions, the Pension Plan’s fiduciary net position was projected to be available to make all projected future benefit payments of current Plan members. Therefore, the long-term expected rate of return on Pension Plan investments was applied to all periods of projected benefit payments to determine the total pension liability.
Sensitivity of the District’s proportionate share of the net pension liability to changes in the discount rate
The following presents the District’s proportionate share of the net pension liability (asset) calculated using the discount rate of 7.5%, as well as what the District’s proportionate share of the net pension liability (asset) would be if it were calculated using a discount rate that is 1-percentage-point lower (6.5%) or 1-percentage-point higher (8.5%) than the current rate:
1% Decrease
(6.5%)
Current Discount Rate
(7.5%) 1% Increase
(8.5%) District's proportionate share of the net pension liability (asset) $ 62,536,431 $ 38,730,244 $ 18,832,438
Pension Plan Fiduciary Net Position
Detailed information about the pension plan’s fiduciary net position is available in the separately issued OPERS financial report.
The schedule of funding progress, presented as required supplementary information following the notes to the financial statements, presents multiyear trend information about whether the actuarial value of plan assets is increasing or decreasing relative to the actuarial accrued liability for benefits.

CLEAN WATER SERVICES (A Component Unit of Washington County, Oregon)
NOTES TO BASIC FINANCIAL STATEMENTS (continued)
Fiscal Year Ended June 30, 2017
45
(10) Other Post-Employment Benefits (OPEB)
(a) Post-Employment Healthcare Plan
Plan Description The District offers health benefits to retirees under age 65 as well as their qualified dependents at the same rate provided to current employees, as required by Oregon Revised Statutes 243.303. Retirees electing to remain on the District sponsored health plans pay the entire premium for that coverage in order to maintain coverage. Even though the District does not pay any portion of the retiree premium, there is an implicit rate subsidy with respect to retired employees because the medical premium rates charged are less than they would be if the retirees were in a separately rated health plan. Actual medical premium rates are determined by blending both active employee and retiree experience. This “plan” is a single-employer plan and is not a stand-alone plan, and therefore, does not issue its own financial statements. No formal/legal trust has been established for the handling of resources used to fund this benefit.
The number of plan participants are as follows:
Active participants 154Retired employees 17
Total participants 171
Funding Policy The District collects insurance premiums from all retirees each month. The District then pays the health insurance premiums for all retirees at the blended rate for each family classification. The required contributions to the plan include the entity’s pay-as-you-go amount, an amount paid by retirees and an additional amount calculated to pre-fund future benefits as determined by the actuary.
For fiscal year 2017, the District contributed $110,977 consisting of retiree payments. The District has elected to not pre-fund the actuarially determined future cost amount of $569,385.
The required monthly contributions of the plan members were as follows for the year ended June 30, 2017:
Health InsuranceProvidence Providence
Open Option Connect KaiserEmployee $ 508.01 $ 416.91 $ 654.85 Employee + 1 $ 1,031.39 $ 846.42 $ 1,335.89 Full Family $ 1,448.17 $ 1,188.45 $ 1,866.31

CLEAN WATER SERVICES (A Component Unit of Washington County, Oregon)
NOTES TO BASIC FINANCIAL STATEMENTS (continued)
Fiscal Year Ended June 30, 2017
46
(10) Other Post-Employment Benefits (OPEB) (Continued)
Annual OPEB Cost and Net OPEB Obligation The District’s annual other post-employment benefit (OPEB) cost is calculated based on the annual required contribution (ARC) of the District, an amount actuarially determined in accordance with the parameters of GASB Statement No. 45. The ARC represents a level of funding that, if paid on an ongoing basis, is projected to cover normal cost each year and amortize any unfunded actuarial liabilities over a thirty year period.
The annual OPEB cost and net OPEB obligation at June 30, 2017 was as follows:
Annual required contribution $ 143,921Interest on net OPEB Obligation 22,502 Adjustment to annual required contribution (48,626)Annual OPEB cost 117,797Contributions made 110,977Increase in net OPEB obligation 6,820 Net OPEB obligation, beginning of year 562,565 Net OPEB obligation, end of year $ 569,385
The District’s annual OPEB cost, the percentage of annual OPEB cost contributed to the plan and the net OPEB obligation for the last three fiscal years ended were as follows:
Fiscal
Annual
Percent of Annual
Net
Year
OPEB
OPEB Cost
OPEB Ended
Cost
Contribution
Obligation
6/30/2017 $ 117,797 94% $ 569,385 6/30/2016
$ 115,142
90%
$ 562,565
6/30/2015
$ 113,291
102%
$ 550,800
Funding status and Funding Progress As of July 1, 2015, the most recent actuarial valuation date, the plan was funded on a pay-as-you-go basis, and therefore, had no assets. The actuarial accrued liability for benefits was $1,406,532 and also equaled the unfunded actuarial accrued liability (UAAL). The annual payroll of active employees covered by the plan (covered payroll) was $25,650,242 and the ratio of the UAAL to the covered payroll was 5.5%.
Actuarial valuations of the ongoing plan involve estimates of the value of reported amounts and assumptions about the probability of occurrence of events far into the future. Examples include assumptions about future employment, mortality, and the healthcare cost trend. Amounts determined regarding the funded status of the plan and the annual required contributions of the employer are subject to continual revisions as actual results are compared with past expectations and new estimates are made about the future.

CLEAN WATER SERVICES (A Component Unit of Washington County, Oregon)
NOTES TO BASIC FINANCIAL STATEMENTS (continued)
Fiscal Year Ended June 30, 2017
47
(10) Other Post-Employment Benefits (OPEB) (Continued)
Actuarial Methods and Assumptions Projections of benefits for financial reporting purposes are based on the substantive plan (the plan as understood by the employer and plan members) and include the types of benefits provided at the time of each valuation and the historical pattern of sharing of benefit costs between the employer and plan members to that point. The actuarial methods and assumptions used include techniques that are designed to reduce the effects of short-term volatility in actuarial results consistent with the long-term perspective of the calculations.
In the July 1, 2015 valuation, the projected unit credit actuarial cost method was used, with accrued benefits allocated in equal proportion over the participant’s years of service from hire to expected retirement. The actuarial assumptions included (a) a 4 percent accrued liability discount rate, (b) a 2.5 percent inflation component, and (c) healthcare cost trend rate of 7 percent for 2016 grading down over seventeen years to 5 percent. The Unfunded Actuarial Accrued Liability (UAAL) is being amortized over an open period of thirty years as a level percentage of payroll for Non-Represented Retirees, and over a closed period of four years as a flat dollar amount for Represented Retirees.
The schedule of funding progress presented immediately following the financial statements as required supplementary information, presents multi-year trend information about whether the actuarial value of plan assets is increasing or decreasing over time relative to the actuarial accrued liability for benefits.
(b) Retirement Health Insurance Account (RHIA)
Plan Description As a member of Oregon Public Employees Retirement System (OPERS), the District contributes to the Retirement Health Insurance Account (RHIA) for each of its eligible employees. RHIA is a cost-sharing, multiple-employer defined benefit other post-employment benefit plan administered by OPERS. RHIA pays a monthly contribution toward the cost of Medicare companion health insurance premiums of eligible retirees. Oregon Revised Statute (ORS) 238.420 established this trust fund. Authority to establish and amend the benefit provisions of RHIA reside with the Oregon Legislature. The plan is closed to new entrants hired on or after August 29, 2003. OPERS issues a publicly available financial report that includes financial statements and required supplementary information. That report may be obtained by writing to the Oregon Public Employees Retirement System, P.O. Box 23700, Tigard, OR 97281-3700, by calling 1-888-320-7377, or by accessing the PERS web site at http://oregon.gov/PERS/.
Actuarial Actuarial Actuarial Unfunded AnnualValuation Value of Accrued Liability Funded Covered UAAL as
Date Assets Liability (AAL) (UAAL) Ratio Payroll % of Payroll
7/1/2015 $ - $ 1,406,532 $ 1,406,532 0.0% $ 25,650,242 5.5%

CLEAN WATER SERVICES (A Component Unit of Washington County, Oregon)
NOTES TO BASIC FINANCIAL STATEMENTS (continued)
Fiscal Year Ended June 30, 2017
48
(10) Other Post-Employment Benefits (OPEB) (Continued)
Funding Policy Because RHIA was created by enabling legislation (ORS 238.420), contribution requirements of the plan members and the participating employers were established and may be amended only by the Oregon Legislature. ORS require that an amount equal to $60 or the total monthly cost of Medicare companion health insurance premiums coverage, whichever is less, shall be paid from the RHIA established by the employer, and any monthly cost in excess of $60 shall be paid by the eligible retired member in the manner provided in ORS 238.410. To be eligible to receive this monthly payment towards the premium cost the member must: (1) have eight years or more of qualifying service in PERS at the time of retirement or receive a disability allowance as if the member had eight years or more of creditable service in PERS, (2) receive both Medicare Part A and B coverage, and (3) enroll in a PERS-sponsored health plan. A surviving spouse or dependent of a deceased PERS retiree who was eligible to receive the subsidy is eligible to receive the subsidy if he or she (1) is receiving a retirement benefit or allowance from PERS or (2) was insured at the time the member died and the member retired before May 1, 1991.
Participating employers are contractually required to contribute to RHIA at a rate assessed each year by OPERS, currently 0.53% of annual covered payroll for Tier One and Tier Two members and 0.45% of annual covered payroll for OPSRP members. The OPERS Board of Trustees sets the employer contribution rate based on the annual required contribution of the employers (ARC), an amount actuarially determined in accordance with the parameters of GASB Statement No. 45. The ARC represents a level of funding that, if paid on an ongoing basis, is projected to cover normal cost each year and amortize any unfunded actuarial liabilities (or funding excess) of the plan over a closed period not to exceed thirty years. The District’s contributions to RHIA for the years ended June 30, 2017, 2016, and 2015 were $130,738, $122,079, and $125,299 which equaled the required contributions each year.
(11) Risk Management/Insured Risks and Captive Insurance
It is the policy of the District to periodically assess the proper combination of commercial insurance and retention of risk to cover losses to which it may be exposed. The District currently utilizes two government entity self-insured risk pools through Special Districts Association of Oregon (SDAO) for its workers’ compensation and liability insurance. The District purchases a commercial insurance policy for all-risk property coverage. The District has earmarked approximately $5.5 million of its unrestricted net assets for future uninsured risks at June 30, 2017. The District funds self-insurance retention reserves through the Captive.
The Captive was formed under the laws of the State of Hawaii as single member Limited Liability Company (LLC) captive insurance company pursuant to Chapter 428 and Article 19 of Chapter 431 of the Hawaii Revised Statutes. The Captive received its Certificate of Authority from the Hawaii Insurance Division on June 30, 2016, and operations commenced on July 1, 2016. The Certificate of Authority enables the Captive to operate as a captive insurance company in the State of Hawaii. The District is the sole member of the Captive. Insurance exposures covered by the Captive will include the non-represented employee self-insurance dental plan, general liability self-insured retention of $50,000, automobile liability self-insured retention of $50,000, property damage self-insured retention of $5 million, and uninsured risk within these categories up to policy limits.

CLEAN WATER SERVICES (A Component Unit of Washington County, Oregon)
NOTES TO BASIC FINANCIAL STATEMENTS (continued)
Fiscal Year Ended June 30, 2017
49
(11) Risk Management/Insured Risks and Captive Insurance (Continued)
The District’s liabilities are reported when it is both probable that a loss has occurred and the amount of that loss can be reasonably estimated. Liabilities include an amount for claims that have been incurred but not reported. Liabilities are reevaluated periodically to consider current settlements, frequency of claims, past experience and economic factors. Management believes the reserve for losses and loss expenses is adequate. The estimates are continually reviewed and adjusted, as necessary, as experience develops or new information becomes known; such adjustments are included in current operations. During the past three years, there were no settlements which exceeded insurance coverage and no significant reduction in coverage in the last year.
Changes in the balances of the District’s claims liabilities during fiscal years 2016 and 2017 are as follows:
(12) Net Position
Net position represents the difference between assets and liabilities. The components of net position at June 30, 2017 were as follows:
2016 2017Balance as of July 1 $ 310,300 $ 341,500
Incurred related toCurrent period 129,441 607,897
Total incurred 129,441 607,897
Paid related toCurrent period (98,241) (475,167)
Total paid (98,241) (475,167)
Balance at June 30 $ 341,500 $ 474,230
Net Investment in Capital Assets: Net capital assets in service $ 682,344,318 Less: Revenues bonds payable, net (196,882,020) Accounts payable for capital assets (8,277,577)
$ 477,184,721
Restricted for Capital Acquisition and Debt Service: Total Restricted Net Position-due to enabling legislation $ 40,125,140 Total Restricted Net Position-other 97,193,785 Total Restricted Net Position- CWIC capitve insurance 250,000 Total Restricted Net Position 137,568,925 Deductions Liabilities payable from restricted net position proceeds-enabling legislation (37,294) Liabilities payable from restricted net position proceeds-other (10,507,385) Liabilities payable from restricted net position proceeds (10,544,679)
Restricted Net Position-due to enabling legislation 40,087,846 Restricted Net Position-other 86,686,400 Total Restricted Net Position- CWIC capitve insurance 250,000 Restricted Net Position $ 127,024,246

CLEAN WATER SERVICES (A Component Unit of Washington County, Oregon)
NOTES TO BASIC FINANCIAL STATEMENTS (continued)
Fiscal Year Ended June 30, 2017
50
(12) Net Position (Continued)
The Hawaii Insurance Division established certain minimum capital and surplus requirements for the Captive which are required to be maintained at all times. The minimum was set at $250,000 at formation. As of June 30, 2017, the Captive was in compliance with the minimum capital and surplus requirements of the State of Hawaii.
(13) Related Party Transactions
Washington County performs certain fiscal and accounting services, partnering in capital projects and provides certain facility related services, for which the District was charged approximately $209,180 during fiscal 2017.
On April 16, 2013, the District entered into a new Operating Agreement with the Clean Water Institute (CWI). Under the Operating Agreement, the District may provide resources to conduct work for CWI. Upon mutual agreement, the District and CWI may enter into agreements which shall describe the particular scope of services to be performed by the District for CWI. The District may also provide staff and resources to provide administrative support to CWI and charge CWI for such support. The District has billed CWI $6,500 for such services under the Operating Agreement for fiscal year ended June 30, 2017.
Clean Water Institute billed the District $22,170 for professional services during fiscal year 2017.
On October 26, 2010, the District entered into a loan agreement with CWI. The agreement allows for loans and/or advances from the District to CWI of up to $400,000 over the following four fiscal years. Interest on outstanding loan balances due from CWI to the District are calculated monthly and based on 1.1 times the average monthly Oregon Local Government Investment Pool (LGIP) rates. During fiscal year 2017, CWI received additional loan proceeds of $50,000, was charged $2,478 in interest and made payments totaling $43,615 leaving a loan balance of $214,250 as of June 30, 2017.
On September 21, 2010, the District entered into an Assignment Agreement with CWI, which assigned certain intellectual property rights to CWI. The agreement requires CWI to share future revenues generated from the licensing of these intellectual property rights with the District. Per this agreement, all revenues associated with the agreement received by CWI shall first be applied to repay the loan amounts to the District and any revenues in excess of the loan amount will be shared equally between CWI and the District. In accordance with the agreement, CWI has remitted proceeds of $13,027 to the District in fiscal year 2017 which were applied against the loan balance referenced above.
Clean Water Insurance Company began operations July 1, 2016. The District transferred an additional $47,279 from self-insured dental plan reserves in April 2017. The District also paid dental premiums of $249,715 and auto, general liability and property insurance premiums totaling $335,000 during fiscal year 2017. CWIC reimbursed the District for claims filed totaling $3,756 during fiscal year 2017.
(14) Commitments and Contingencies
`
The District is committed for approximately $39.3 million for various construction projects and other significant commitments at June 30, 2017. The District plans to finance these projects using existing resources.
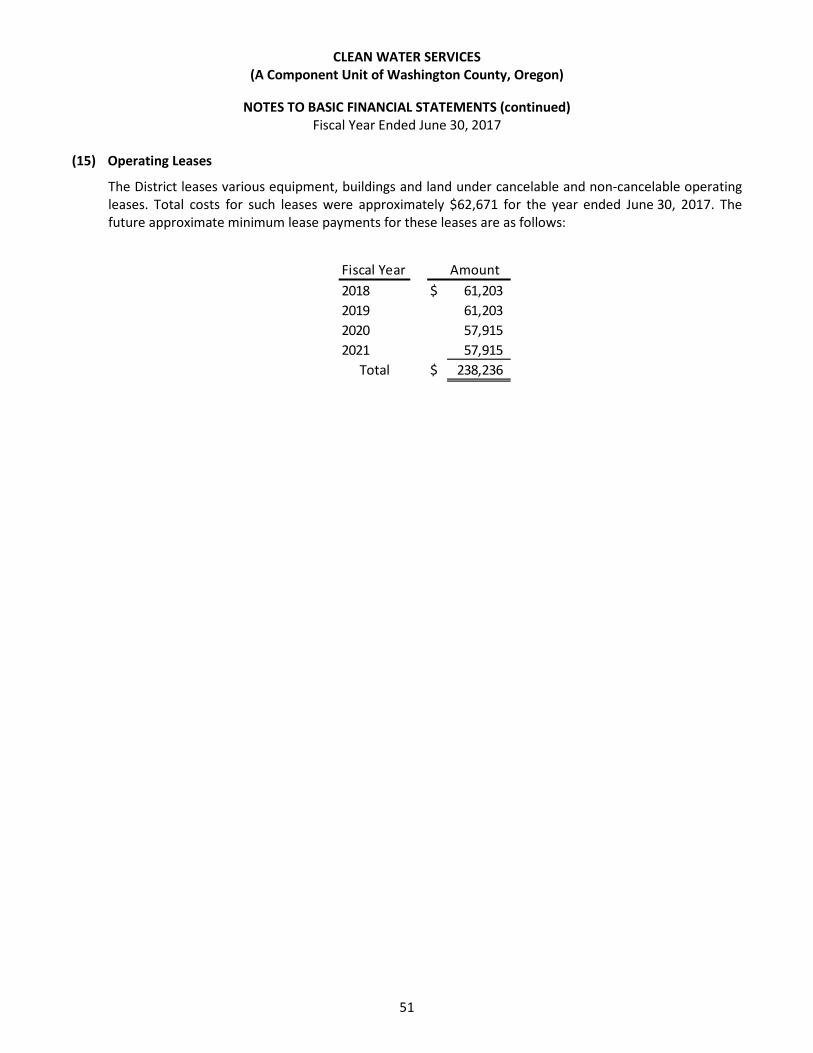
CLEAN WATER SERVICES (A Component Unit of Washington County, Oregon)
NOTES TO BASIC FINANCIAL STATEMENTS (continued)
Fiscal Year Ended June 30, 2017
51
(15) Operating Leases
The District leases various equipment, buildings and land under cancelable and non-cancelable operating leases. Total costs for such leases were approximately $62,671 for the year ended June 30, 2017. The future approximate minimum lease payments for these leases are as follows:
Fiscal Year Amount2018 $ 61,203 2019 61,203 2020 57,915 2021 57,915
Total $ 238,236

CLEAN WATER SERVICES (A Component Unit of Washington County, Oregon)
NOTES TO BASIC FINANCIAL STATEMENTS (continued)
Fiscal Year Ended June 30, 2017
52
(16) Segment Information
The Sanitary Sewer Segment accounts for the provision of sanitary sewer services within the Tualatin River Drainage Basin.
Segment information as of and for the year ended June 30, 2017 is as follows:
Sanitary Sewer Assets :
Current assets 166,831,737$ Noncurrent assets 723,712,155
Tota l assets 890,543,892 Deferred outflow of resources 23,817,889
Tota l assets and deferred outflow of resources 914,361,781
Liabi l i ties :Current l iabi l i ties 34,910,447 Noncurrent l iabi l i ties 239,968,960
Tota l l iabi l i ties 274,879,407 Deferred inflow of resources 1,283,456
Tota l l iabi l i ties and deferred inflow of resources 276,162,863
Net pos i tion:Net investment in capi ta l assets 386,774,220 Restricted net assets 107,270,147 Unrestricted 144,154,551
Tota l net pos i tion 638,198,918$
Operating revenues 121,286,144$ Depreciation and amortization (35,284,407) Other operating expenses (55,874,245)
Operating income (loss ) 30,127,492
Nonoperating revenues (expenses):Investment income 1,270,784 Interest on assessment and contracts 18,537 Net loss on disposa l of capi ta l assets (1,314,659) Loss on equity in joint venture (73,069) Interest expense (6,931,004) Tota l nonoperating revenues (expenses) (7,029,411)
Capi ta l contributions 29,855,525 Change in net pos i tion 52,953,606
Net pos i tion, beginning of year, before adjustment 585,245,312 Net pos i tion, end of year 638,198,918$
Cash flows from:Operating activi ties 70,467,433$ Non-capi ta l financing activi ties (1,412,010) Capi ta l and related financing activi tes (45,884,889) Investment activi ties 1,307,858
Net increase 24,478,392 Beginning cash and investments 251,912,405 Ending cash and investments 276,390,797$
Condensed Statements of Net Position
Condensed Statements of Revenues, Expenses and Changes in Net Position
Condensed Statements of Cash Flows

CLEAN WATER SERVICES (A Component Unit of Washington County, Oregon)
NOTES TO BASIC FINANCIAL STATEMENTS (continued)
Fiscal Year Ended June 30, 2017
53
(16) Subsequent Event
At its July 28, 2017 meeting, the PERS Board lowered the assumed rate of return on investments from 7.5% to 7.2%. The new assumed rate will become effective for Tier One earnings crediting in calendar year 2018 and will be used as the basis for updated actuarial equivalency factors effective January 1, 2018. The lowered rate is expected to increase the PERS net pension liability by an estimated $2.3 billion. Of this increase, the District’s portion is estimated at $5.9 million.
REQUIRED
SUPPLEMENTARY
INFORMATION

54
CLEAN WATER SERVICES(A Component Unit of Washington County, Oregon)
Required Supplementary Information
Schedule of Funding ProgressOther Post Employment Benefits
Unfunded ActuarialUnfunded Accrued Liability
Actuarial Actuarial Actuarial Actuarial (Asset) as a PercentValuation Value of Accrued Accrued Funded Covered of Covered
Date Assets Liability Liability (Asset) Ratio Payroll Payroll7/1/2015 -$ 1,406,532$ 1,406,532$ 0 % 25,650,242$ 5.5 %7/1/2013 -$ 1,369,136$ 1,369,136$ 0 % 23,362,845$ 5.9 %7/1/2011 -$ 1,548,140$ 1,548,140$ 0 % 21,608,777$ 7.2 %

55
(b) (b/c)(a) Contributions in (a-b) (c) Contributions
Year Statutorily relation to the Contribution District's as a percentEnded required statutorily required deficiency covered of covered
June 30, contribution contribution (excess) payroll payroll
2017 2,543,871$ 2,543,871$ -$ 29,042,050$ 8.76%2016 2,372,887$ 2,372,887$ -$ 27,123,860$ 8.75%2015 1,793,128$ 1,793,128$ -$ 25,570,409$ 7.01%2014 1,700,572$ 1,700,572$ -$ 24,174,163$ 7.03%
*
(A Component Unit of Washington County, Oregon)CLEAN WATER SERVICES
Schedule of Statutorily Required Employer ContributionsPension Plan
Required Supplementary Information
Last Four Fiscal Years*
Fiscal year 2015 was the first year that the new reporting requirements of GASB 68 were implemented at the District. This schedule is required to illustrate 10-years of information. However, until a full 10-year trend has been compiled, information is presented only for the years for which the required supplementary information is available.

56
CLEAN WATER SERVICES(A Component Unit of Washington County, Oregon)
Required Supplementary Information
Schedule of Proportionate Share of the CollectiveNet Pension Liability (Asset)
(b/c)District's
(a) (b) Plan fiduciaryDistrict's District's (c) net position as
Year proportion of proportionate share District's a percentage of Ended the net pension of the net pension covered the total pension
June 30, liability (asset) liability (asset) payroll liability
2017 0.25798970% 38,730,244$ 27,123,860$ 142.79% 80.53%2016 0.26132208% 15,003,706$ 25,570,409$ 58.68% 91.88%2015 0.25658001% (5,815,937)$ 24,174,163$ -24.06% 103.59%2014 0.25658001% 13,093,654$ 24,141,544$ 54.24% 91.97%
*
proportionate share of the net pension liability
(asset) as a percentage of its covered payroll
Last Four Fiscal Years*
Fiscal year 2015 was the first year that the new reporting requirements of GASB 68 were implemented at the District. This schedule is required to illustrate 10-years of information. However, until a full 10-year trend has been compiled, information is presented only for the years for which the required supplementary information is available.

SUPPLEMENTARY
INFORMATION Combining Schedules

57
Combining Schedule of Net Position
Sanitary Surface Water CWIC Assets Sewer Management Captive Insurance Total
Current assets:$ 147,367,597 $ 10,374,349 $ 427,540 $ 158,169,486
16,074,308 1,830,932 - 17,905,240 1,240,267 - - 1,240,267
380,910 - - 380,910 496,126 - - 496,126
Current assets - unrestricted 165,559,208 12,205,281 427,540 178,192,029
4,729 - 4,729 758,894 - - 758,894 133,397 20,788 - 154,185 375,509 375,509
Current assets - restricted 1,272,529 20,788 - 1,293,317
Total current assets 166,831,737 12,226,069 427,540 179,485,346
Noncurrent assets:129,018,471 7,138,919 250,000 136,407,390
203,243 - 203,243
Land 16,881,760 - - 16,881,760 Permanent easements 2,922,767 8,829,102 - 11,751,869 Construction in progress 87,909,149 4,461,637 - 92,370,786
483,838,165 77,353,545 - 561,191,710 Intangible assets, net of accumulated amortization 97,892 50,301 - 148,193
2,417,767 - - 2,417,767 Prepaid expenses 422,941 - - 422,941
Total noncurrent assets 723,712,155 97,833,504 250,000 821,795,659
Total assets 890,543,892 110,059,573 677,540 1,001,281,005
Deferred outflow of resources:Deferred loss on refunding 4,018,037 - - 4,018,037 Pension related 19,799,852 - - 19,799,852
Total assets and deferred outflow of resources $ 914,361,781 $ 110,059,573 $ 677,540 $ 1,025,098,894
Current liabilities:Accounts payable $ 5,266,454 $ 14,158 $ 44,642 $ 5,325,254 Accrued payroll 5,396,472 - - 5,396,472 Accrued self insurance 70,670 - 28,809 99,479 Accrued interest payable 2,343,514 - - 2,343,514 Current portion of bonds payable, net 13,915,725 - - 13,915,725
Current liabilities - payable from unrestricted assets 26,992,835 14,158 73,451 27,080,444
Accounts payable- from restricted assets 7,843,627 283,553 - 8,127,180 Accrued interest payable-from restricted assets 73,985 - - 73,985
Current liabilities - payable from restricted assets 7,917,612 283,553 - 8,201,165
Total current liabilities 34,910,447 297,711 73,451 35,281,609
Noncurrent liabilities:Bonds payable, net 200,419,331 - - 200,419,331 Net pension liability 38,730,244 - - 38,730,244 Postemployment benefits other than pensions 569,385 - - 569,385 Accrued self insurance 250,000 - 124,751 374,751
Total noncurrent liabilities 239,968,960 - 124,751 240,093,711
Total liabilities 274,879,407 297,711 198,202 275,375,320
Deferred inflow of resources:Pension related 1,283,456 - - 1,283,456
Total liabilities and deferred inflow of resources 276,162,863 297,711 198,202 276,658,776
Net position:Net investment in capital assets 386,774,220 90,410,501 - 477,184,721 Restricted net assets 107,270,147 19,504,099 250,000 127,024,246 Unrestricted 144,154,551 (152,738) 229,338 144,231,151
Total net position 638,198,918 109,761,862 479,338 748,440,118 Total liabilities, deferred inflow of resources and net position $ 914,361,781 $ 110,059,573 $ 677,540 $ 1,025,098,894
Materials and supplies inventoryCurrent portion contracts receivablePrepaid expenses
CLEAN WATER SERVICES (A Component Unit of Washington County, Oregon)
Cash and investmentsAccounts receivable (net of allowance for
uncollectibles)
June 30, 2017
Cash with bond trustee - restricted
Liabilities and Net Position
Capital assets, net of accumulated depreciation
Investment in joint venture
Cash and investments-restricted
Connection fees receivable-restrictedContributions receivable from local governments-restricted
Capital assets, not being depreciated or amortized:Contracts receivable-restricted
BABs subsidy receivable-restricted

58
(A Component Unit of Washington County, Oregon)
Combining Schedule of Revenues, Expenses
Sanitary Surface Water CWICSewer Management Captive Insurance Total
Operating revenues:$ 115,946,429 $ 13,750,116 $ - $ 129,696,545
5,339,715 1,568,141 581,857 7,489,713
Total operating revenues 121,286,144 15,318,257 581,857 137,186,258
Operating expenses:31,881,376 6,613,261 - 38,494,637
4,207,644 185,143 - 4,392,787 8,041,440 933,948 13,933 8,989,321 3,892,635 314,390 - 4,207,025 2,648,141 1,041,172 65,810 3,755,123
340,005 84,600 - 424,605 930,535 90,633 406,493 1,427,661
3,932,469 11,262 - 3,943,731 35,284,407 5,509,232 - 40,793,639
91,158,652 14,783,641 486,236 106,428,529
30,127,492 534,616 95,621 30,757,729
1,270,784 74,803 433 1,346,020 Interest on assessments and contracts 18,537 - - 18,537
(1,314,659) (24,516) - (1,339,175) (73,069) - - (73,069)
(6,931,004) - - (6,931,004)
(7,029,411) 50,287 433 (6,978,691)
23,098,081 584,903 96,054 23,779,038
System development charges 26,369,857 1,039,917 - 27,409,774 Infrastructure donated by developers 3,485,668 6,556,331 - 10,041,999
- - 47,279 47,279
29,855,525 7,596,248 47,279 37,499,052
52,953,606 8,181,151 143,333 61,278,090
585,245,312 101,580,711 336,005 687,162,028
$ 638,198,918 $ 109,761,862 $ 479,338 $ 748,440,118
For the year ended June 30, 2017
Net position, end of year
Capital contributions:
Total capital contributions
Interest expense
Income (loss) before contributions
Change in net position
Net position, beginning of year
Operating income (loss)
Nonoperating revenues (expenses):Investment income
Total operating expenses
Loss on equity in joint venture
Contributed capital - CWIC captive insurance
Insurance
CLEAN WATER SERVICES
and Changes in Net Position
Service feesOther
Labor and fringe benefitsUtilitiesProfessional servicesSuppliesAdministrative costsRepairs and maintenance
Total nonoperating revenues (expenses)
Chemicals
Net gain/(loss) on disposal of capital assets
Depreciation and amortization

59
CLEAN WATER SERVICES(A Component Unit of Washington County, Oregon)
Combining Schedule of Cash Flows
Sanitary Surface Water CWICSewer Management Captive Insurance Total
$ 116,843,153 $ 13,704,753 $ 581,857 $ 131,129,763 (24,170,634) (2,851,228) (288,034) (27,309,896) (27,555,771) (6,613,261) - (34,169,032)
5,350,685 1,568,141 - 6,918,826
Net cash from operating activities 70,467,433 5,808,405 293,823 76,569,661
(565,000) - - (565,000) (847,010) - - (847,010)
- - 47,279 47,279
Net cash from noncapital financing activities (1,412,010) - 47,279 (1,364,731)
33,225,000 - - 33,225,000 8,534,747 - - 8,534,747
(3,969,162) - - (3,969,162) (837,389) - - (837,389)
(50,898,206) (2,498,275) - (53,396,481) (53,355,000) - - (53,355,000)
(9,975,392) - - (9,975,392) 4,409,724 - - 4,409,724
(21,895) - - (21,895) 26,964,185 1,039,917 - 28,004,102
38,499 - - 38,499
financing activities (45,884,889) (1,458,358) - (47,343,247)
1,307,858 74,803 433 1,383,094
24,478,392 4,424,850 341,535 29,244,777
251,912,405 13,088,418 336,005 265,336,828
276,390,797 17,513,268 677,540 294,581,605
147,367,597 10,374,349 427,540 158,169,486 129,023,200 7,138,919 250,000 136,412,119
$ 276,390,797 $ 17,513,268 $ 677,540 $ 294,581,605
$ 30,127,492 $ 534,616 $ 95,621 $ 30,757,729
35,284,407 5,509,232 - 40,793,639 27,522 - - 27,522
Net pension expense 3,993,632 3,993,632 6,820 - - 6,820
10,970 - - 10,970
896,724 (45,363) - 851,361 24,440 - - 24,440
3,844 - - 3,844 304,323 - 153,560 457,883
(212,741) (190,080) 44,642 (358,179)
40,339,941 5,273,789 198,202 45,811,932
$ 70,467,433 $ 5,808,405 $ 293,823 $ 76,569,661
$ 2,891,340 $ 6,556,331 $ - $ 9,447,671 $ (73,069) $ - $ - $ (73,069)
For the year ended June 30, 2017
Loss on equity in joint venture
Depreciation and amortization
Total adjustments
Net cash from operating activities
Schedule of non-cash capital and related financing activities:Contributions of capital assets by developers
Accounts payable
Postemployment benefit costs other than pensionsBABs subsidyChanges in assets and liabilities:
Accounts receivableMaterials and supplies inventoryPrepaid expensesAccrued expenses
Amortization of prepaid electric
Net increase (decrease) in cash and cash equivalents
Cash and cash equivalents, beginning of year
Cash and cash equivalents, end of year
Unrestricted cash and investmentsRestricted cash and investments
from operating activities:
Acquisition and construction of capital assets
Total cash and investments
Reconciliation of operating income (loss) to net cash fromoperating activities:
Interest on investments
Principal paid on bonds Interest paid on bonds
Proceeds from sale of capital assets
Net cash from capital and related
Cash flows from investing activities:
Interest received on assessments and contractsCapital contributed by customers and cities
Operating income (loss)
Principal received on assessments and contracts
Adjustments to reconcile operating income (loss) to net cash
Net proceeds from refunding-Series 2009A bonds
Cash flows from capital and related financing activities:
Cash flows from noncapital financing activities:Principal paid on pension bondsInterest paid on pension bonds
Proceeds from issuance of debtProceeds from issuance of debt-premiumProceeds from issuance of debt-loss on refunding
Contributed capital - CWIC captive insurance
Cash flows from operating activities:Received from customersPayments to suppliersPayments to employees for servicesOther operating revenue

SUPPLEMENTARY
INFORMATION Budgetary Schedules

CLEAN WATER SERVICES (A Component Unit Of Washington County, Oregon)
DESCRIPTION OF BUDGETARY FUNDS
June 30, 2017
60
Legal requirements set forth in Oregon Budget Law require the District to prepare and adopt a budget by individual funds. Therefore, activities of the District, for budgetary and legal purposes, are accounted for in the funds described below.
General Fund
This fund accounts for the District’s normal recurring sanitary sewer operations. The primary source of revenue is sewer service fees.
Storm and Surface Water Management (SWM) Fund
The SWM Fund provides for storm and surface water management in the Tualatin River Basin. Its primary source of revenue is SWM service fees.
Master Plan Update Debt Service Fund
The Master Plan Update Debt Service Fund accounts for the redemption of sewer revenue bonds and interest thereon. The primary resource is sewer revenues transferred from the General Fund.
Revenue Pension Bond Debt Service Fund
The Revenue Pension Bond Debt Service Fund accounts for the redemption of sewer revenue pension related bonds and interest thereon. The primary resource is sewer revenues transferred from the General Fund.
Liability Reserve Fund
The Liability Reserve Fund accounts for the District’s expense incurred under its self-insurance programs for:
• Fire loss, property damage, and all risks (theft, vandalism, etc.) up to a self-insured retention limit of $1.0 million.
• Workers’ compensation claims relating to job injuries.
The primary resources are interest earnings, insurance settlements and transfers from other funds.
Capital Expenditure Reserve (Sanitary Sewer) Fund
The Capital Expenditure Reserve (Sanitary Sewer) Fund accounts for the recovery of capital costs for maintenance and upkeep of the sewerage system. The primary resources are connection fees and earnings on investments.

CLEAN WATER SERVICES (A Component Unit Of Washington County, Oregon)
DESCRIPTION OF BUDGETARY FUNDS (Continued)
June 30, 2017
61
Sanitary Sewer Capital Replacement Fund
The Sanitary Sewer Capital Replacement Fund accounts for routine replacement of rolling stock, computers and minor treatment facility and collection system needs. The primary resource is sewer revenues transferred from the General Fund.
Sanitary Sewer LID Construction Fund
The LID Construction Fund accounts for sanitary sewer capital construction expenditures for benefited property owners. The primary resources are from the sale of bonds or bond anticipation notes and assessment collections.
Surface Water Management LID Construction Fund
The LID Construction Fund accounts for surface water management construction expenditures for benefited property owners. The primary resources are from the sale of bonds or bond anticipation notes and assessment collections.
Sanitary Sewer Construction Fund
The Sanitary Sewer Construction Fund provides for the construction of projects financed from a combination of revenue bond proceeds, sanitary system development charges and transfers from the General Fund.
Tualatin Basin Water Supply Capital Project Construction Fund
The Tualatin Basin Water Supply Capital Project Construction Fund provides financing for capital improvements to provide additional water volume in the Tualatin River, enabling continued compliance with the water quality requirements. The partners funding the project include the District, the Cities of Hillsboro and Beaverton, the Tualatin Valley Water District and the US Bureau of Reclamation.
Surface Water Management Capital Replacement Fund
The Surface Water Management Capital Replacement Fund accounts for routine replacement of rolling stock and collection system needs. The primary resource is storm revenues transferred from the SWM operating fund.
Capital Expenditure Reserve Storm and Surface Water Management Fund
The Capital Expenditure Reserve Storm and Surface Water Management Fund provides for the construction and extension of storm water systems and facilities. Primary revenue resources are connection fees and interest earnings.
Surface Water Management Construction Fund
The Surface Water Management Construction Fund provides for the construction of projects primarily financed by system development charges and transfers from the SWM operating fund.

62
CLEAN WATER SERVICES (A Component Unit of Washington County, Oregon)
General Fund 101
Schedule of Revenues and Expenditures - Budget and Actual
For the year ended June 30, 2017
VarianceInitial Final from
Budget Budget Actual budget
Revenues:Sewer service fees $ 117,133,900 $ 117,133,900 $ 115,860,016 $ (1,273,884) Interest earned 273,200 273,200 642,754 369,554 Septage charges 847,900 847,900 1,180,279 332,379 Plan check fees 253,100 253,100 329,892 76,792 Grants, contributions, & assessments 300,000 300,000 2,722 (297,278) Other 895,800 895,800 3,218,977 2,323,177
Total revenues 119,703,900 119,703,900 121,234,640 1,530,740
Expenditures:Personnel Services 40,060,400 40,060,400 33,865,560 6,194,840 Materials and services 27,573,100 27,573,100 25,369,076 2,204,024 Capital outlay 3,003,800 3,128,800 887,090 2,241,710 Contingency 10,250,000 10,125,000 - 10,125,000
Total expenditures 80,887,300 80,887,300 60,121,726 20,765,574
Excess of revenues over expenditures 38,816,600 38,816,600 61,112,914 22,296,314
Other financing sources (uses):Transfers from other funds 9,461,200 9,461,200 9,269,384 (191,816) Transfers to other funds (48,415,100) (48,415,100) (48,412,000) 3,100
Total other financing sources (uses) (38,953,900) (38,953,900) (39,142,616) (188,716)
Net change in fund balance (137,300) (137,300) 21,970,298 22,107,598
Fund balance, beginning of year 122,899,936 122,899,936 124,194,296 1,294,360 Fund balance, end of year $ 122,762,636 $ 122,762,636 146,164,594 $ 23,401,958
Reconciliation to net postion - GAAP BasisAdjust for accrued performance bonus (1,751,742) Adjust for CWI loan receivable 213,945 Adjust for prepaid electricity - current 27,522 Adjust for prepaid electricity - long term 411,524 Adjust for net pension liability (38,730,244) Adjust for deferred outflows - pension 19,799,852 Adjust for deferred inflows - pension (1,283,456) Adjust for OPEB liability being accrued (569,385) Adjust for investment in joint venture 2,417,767 Adjust for capital assets not being depreciated 20,307,543 Adjust for capital assets , net of accumulated depreciation 483,936,057
Net position - GAAP Basis $ 630,943,977

63
CLEAN WATER SERVICES(A Component Unit of Washington County, Oregon)
Storm and Surface Water Management Fund 201
Schedule of Revenues and Expenditures - Budget and Actual
For the year ended June 30, 2017
VarianceInitial Final from
Budget Budget Actual budget
Revenues:Stormwater service fees $ 13,539,200 $ 13,539,200 $ 13,470,619 $ (68,581) Regional stormwater management charge - - 667,936 667,936 Erosion control fees 405,700 405,700 369,201 (36,499) Plan check fees 234,100 234,100 330,193 96,093 Interest earned 50,500 50,500 39,559 (10,941) Other 562,500 562,500 668,678 106,178
Total revenues 14,792,000 14,792,000 15,546,186 754,186
Expenditures:Other 218,900 218,900 50,695 168,205 Contingency 500,000 500,000 - 500,000
Total expenditures 718,900 718,900 50,695 668,205
Excess of revenues over expenditures 14,073,100 14,073,100 15,495,491 1,422,391
Other financing (uses):Transfers to other funds (14,461,200) (14,461,200) (13,718,684) 742,516
Net change in fund balance (388,100) (388,100) 1,776,807 2,164,907
Fund balance, beginning of year 7,438,788 7,438,788 9,141,136 1,702,348
Fund balance, end of year $ 7,050,688 $ 7,050,688 10,917,943 $ 3,867,255
Reconciliation to net postion - GAAP BasisAdjust for capital assets not being depreciated 8,829,102 Adjust for capital assets , net of accumulated depreciation 77,403,847
Net position - GAAP Basis $ 97,150,892

64
CLEAN WATER SERVICES (A Component Unit of Washington County, Oregon)
Master Plan Update Debt Service Fund 111
Schedule of Revenues and Expenditures - Budget and Actual
For the year ended June 30, 2017
VarianceInitial Final from
Budget Budget Actual budgetRevenues:
Interest earned $ 157,800 $ 157,800 $ 86,441 $ (71,359) Build America Bonds subsidy 1,534,200 1,534,200 1,529,940 (4,260)
Total revenues 1,692,000 1,692,000 1,616,381 (75,619)
Expenditures:Debt payments 24,854,131 24,854,131 24,710,392 143,739 Bond issuance costs - - 92,541 (92,541) *Contingency 1,242,700 1,242,700 - 1,242,700
Total expenditures 26,096,831 26,096,831 24,802,933 1,293,898
Excess of expenditures over revenues (24,404,831) (24,404,831) (23,186,552) 1,218,279
Other financing sources:Refunding bonds issued - - 33,027,047 33,027,047 *Premium on refunding bonds issued 8,534,747 Payment to refunded bond escrow agent - - (43,426,551) (43,426,551) *Transfers from other funds 23,502,100 23,502,100 23,502,100 -
Total other financing sources 23,502,100 23,502,100 21,637,343 (10,399,504)
Net change in fund balance (902,731) (902,731) (1,549,209) (646,478)
Fund balance, beginning of year 24,827,431 24,827,431 22,876,891 (1,950,540)
Fund balance, end of year $ 23,924,700 $ 23,924,700 21,327,682 $ (2,597,018)
Reconciliation to net postion - GAAP BasisAdjust for prepaid bond discount - current 399,116 Adjust for prepaid bond discount - long term 3,618,921 Adjust for bond premium - current (1,945,725) Adjust for bond premium - long term (9,394,331) Adjust for interest payable being accrued (2,343,514) Adjust for bonds payable - due within one year (11,310,000) Adjust for long term bonds payable (178,250,000)
Net position - GAAP Basis $ (177,897,851)
* Expenditures authorized under 294.338ORS 294.338 (4) allows for exception to Oregon budget law for expenditureson bonds issued during the current budget year.
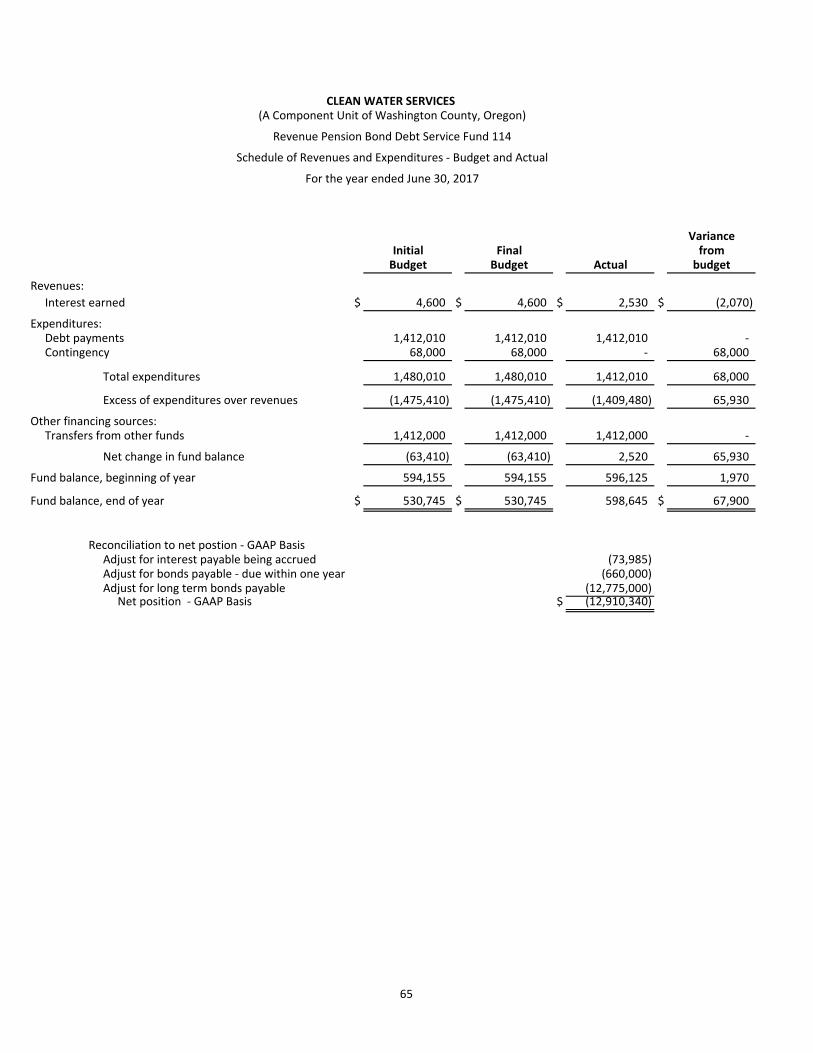
65
CLEAN WATER SERVICES (A Component Unit of Washington County, Oregon)
Revenue Pension Bond Debt Service Fund 114
Schedule of Revenues and Expenditures - Budget and Actual
For the year ended June 30, 2017
VarianceInitial Final from
Budget Budget Actual budget
Revenues:Interest earned $ 4,600 $ 4,600 $ 2,530 $ (2,070)
Expenditures:Debt payments 1,412,010 1,412,010 1,412,010 - Contingency 68,000 68,000 - 68,000
Total expenditures 1,480,010 1,480,010 1,412,010 68,000
Excess of expenditures over revenues (1,475,410) (1,475,410) (1,409,480) 65,930
Other financing sources:Transfers from other funds 1,412,000 1,412,000 1,412,000 -
Net change in fund balance (63,410) (63,410) 2,520 65,930
Fund balance, beginning of year 594,155 594,155 596,125 1,970
Fund balance, end of year $ 530,745 $ 530,745 598,645 $ 67,900
Reconciliation to net postion - GAAP BasisAdjust for interest payable being accrued (73,985) Adjust for bonds payable - due within one year (660,000) Adjust for long term bonds payable (12,775,000)
Net position - GAAP Basis $ (12,910,340)
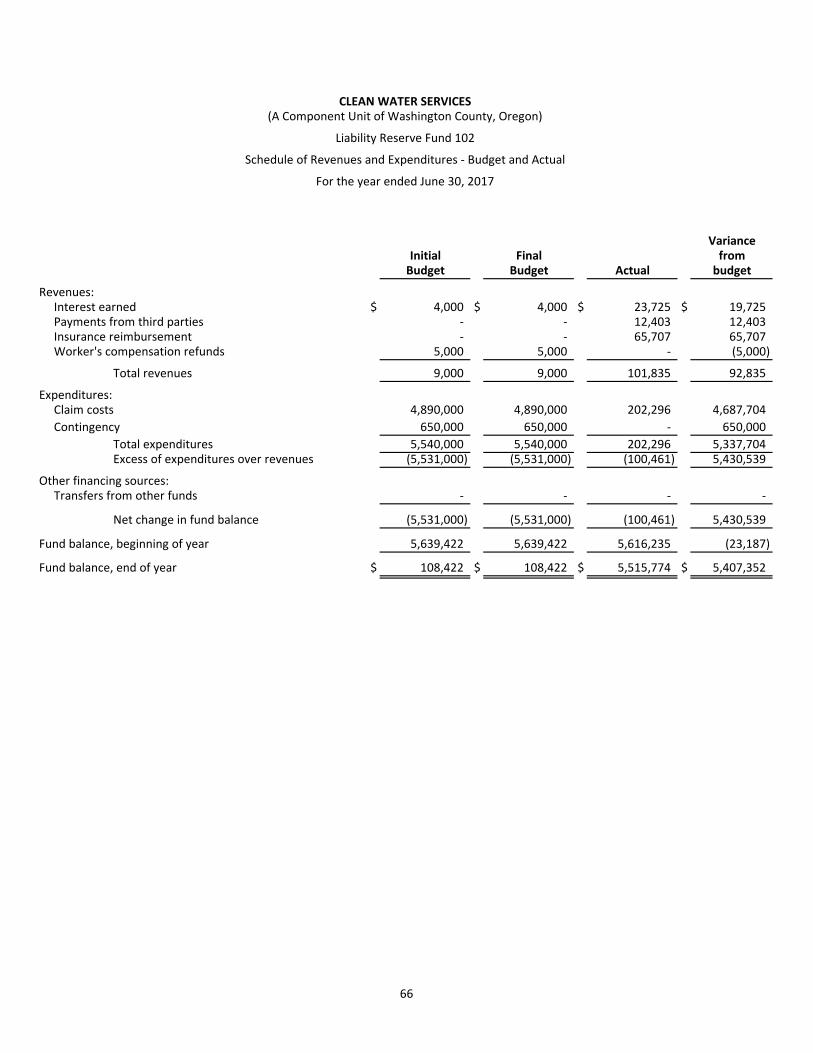
66
CLEAN WATER SERVICES(A Component Unit of Washington County, Oregon)
Liability Reserve Fund 102
Schedule of Revenues and Expenditures - Budget and Actual
For the year ended June 30, 2017
VarianceInitial Final from
Budget Budget Actual budget
Revenues:Interest earned $ 4,000 $ 4,000 $ 23,725 $ 19,725 Payments from third parties - - 12,403 12,403 Insurance reimbursement - - 65,707 65,707 Worker's compensation refunds 5,000 5,000 - (5,000)
Total revenues 9,000 9,000 101,835 92,835
Expenditures:Claim costs 4,890,000 4,890,000 202,296 4,687,704 Contingency 650,000 650,000 - 650,000
Total expenditures 5,540,000 5,540,000 202,296 5,337,704 Excess of expenditures over revenues (5,531,000) (5,531,000) (100,461) 5,430,539
Other financing sources:Transfers from other funds - - - -
Net change in fund balance (5,531,000) (5,531,000) (100,461) 5,430,539
Fund balance, beginning of year 5,639,422 5,639,422 5,616,235 (23,187)
Fund balance, end of year $ 108,422 $ 108,422 $ 5,515,774 $ 5,407,352

67
CLEAN WATER SERVICES
Capital Expenditure Reserve Sanitary Sewer Fund 107
Schedule of Revenues and Expenditures - Budget and Actual
For the year ended June 30, 2017
VarianceInitial Final from
Budget Budget Actual budget
Revenues:Connection fees $ 21,799,700 $ 21,799,700 $ 26,369,857 $ 4,570,157 Interest earned 67,300 67,300 197,278 129,978
Total revenues 21,867,000 21,867,000 26,567,135 4,700,135
Expenditures:Contingency 4,125,600 4,125,600 - 4,125,600
Excess of revenues over expenditures 17,741,400 17,741,400 26,567,135 8,825,735
Other financing uses:Transfers to other funds (30,500,900) (30,500,900) (30,500,900) -
Net change in fund balance (12,759,500) (12,759,500) (3,933,765) 8,825,735
Fund balance, beginning of year 43,000,079 43,000,079 42,963,319 (36,760)
Fund balance, end of year $ 30,240,579 $ 30,240,579 $ 39,029,554 $ 8,788,975
(A Component Unit of Washington County, Oregon)
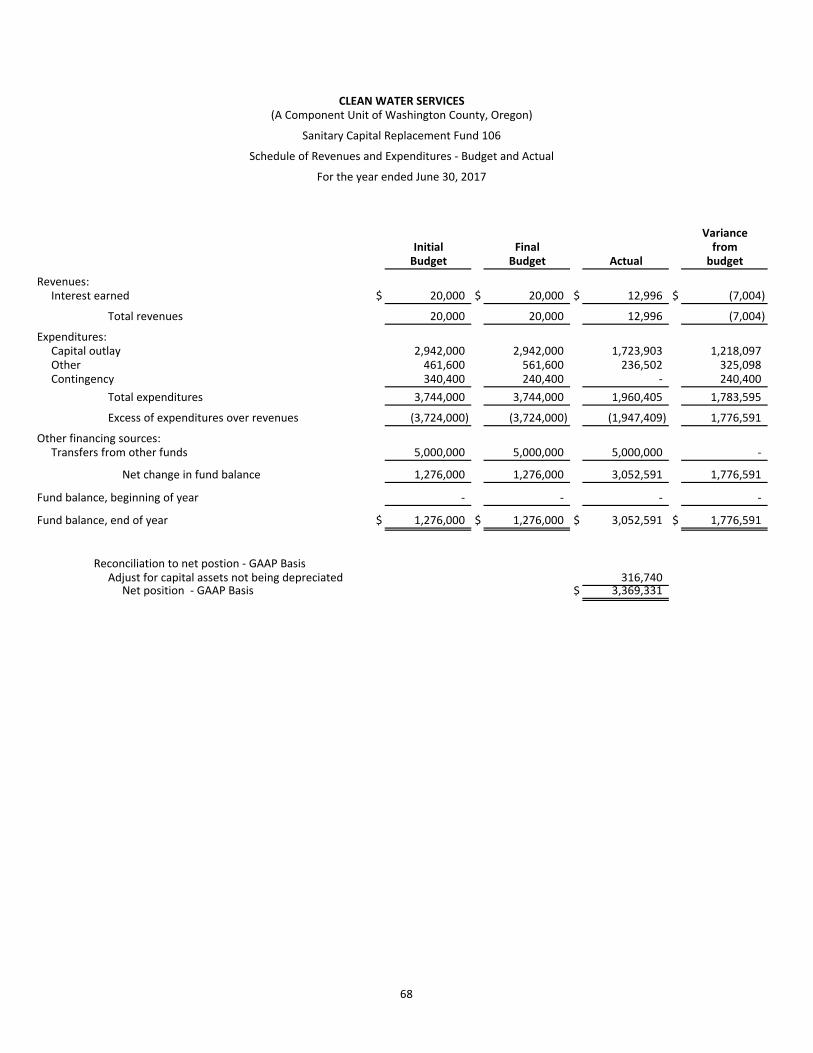
68
CLEAN WATER SERVICES
Sanitary Capital Replacement Fund 106
Schedule of Revenues and Expenditures - Budget and Actual
For the year ended June 30, 2017
VarianceInitial Final from
Budget Budget Actual budget
Revenues:Interest earned $ 20,000 $ 20,000 $ 12,996 $ (7,004)
Total revenues 20,000 20,000 12,996 (7,004)
Expenditures:Capital outlay 2,942,000 2,942,000 1,723,903 1,218,097 Other 461,600 561,600 236,502 325,098 Contingency 340,400 240,400 - 240,400
Total expenditures 3,744,000 3,744,000 1,960,405 1,783,595 Excess of expenditures over revenues (3,724,000) (3,724,000) (1,947,409) 1,776,591
Other financing sources:Transfers from other funds 5,000,000 5,000,000 5,000,000 -
Net change in fund balance 1,276,000 1,276,000 3,052,591 1,776,591
Fund balance, beginning of year - - - -
Fund balance, end of year $ 1,276,000 $ 1,276,000 $ 3,052,591 $ 1,776,591
Reconciliation to net postion - GAAP BasisAdjust for capital assets not being depreciated 316,740
Net position - GAAP Basis $ 3,369,331
(A Component Unit of Washington County, Oregon)

69
CLEAN WATER SERVICES
Sanitary Sewer LID Construction Fund 108
Schedule of Revenues and Expenditures - Budget and Actual
For the year ended June 30, 2017
VarianceInitial Final from
Budget Budget Actual budget
Revenues:Assessment liens, principal $ 164,400 $ 164,400 $ - $ (164,400) Interest earned 72,100 72,100 21,604 (50,496)
Total revenues 236,500 236,500 21,604 (214,896)
Expenditures:Capital outlay 50,000 50,000 - 50,000 Other 50,000 50,000 - 50,000 Contingency 100,000 100,000 - 100,000
Total expenditures 200,000 200,000 - 200,000
Excess of revenues over expenditures 36,500 36,500 21,604 (14,896)
Fund balance, beginning of year 1,685,851 1,685,851 1,673,023 (12,828)
Fund balance, end of year $ 1,722,351 $ 1,722,351 $ 1,694,627 $ (27,724)
(A Component Unit of Washington County, Oregon)
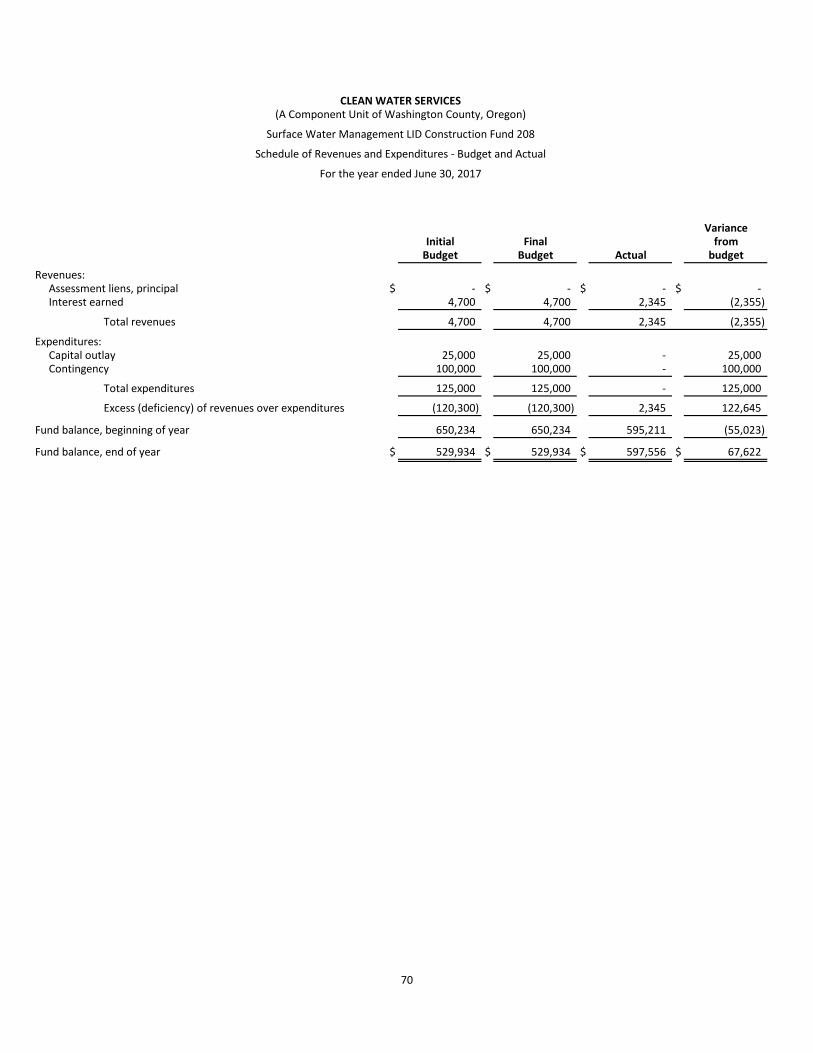
70
CLEAN WATER SERVICES
Surface Water Management LID Construction Fund 208
Schedule of Revenues and Expenditures - Budget and Actual
VarianceInitial Final from
Budget Budget Actual budget
Revenues:Assessment liens, principal $ - $ - $ - $ - Interest earned 4,700 4,700 2,345 (2,355)
Total revenues 4,700 4,700 2,345 (2,355)
Expenditures:Capital outlay 25,000 25,000 - 25,000 Contingency 100,000 100,000 - 100,000
Total expenditures 125,000 125,000 - 125,000
Excess (deficiency) of revenues over expenditures (120,300) (120,300) 2,345 122,645
Fund balance, beginning of year 650,234 650,234 595,211 (55,023)
Fund balance, end of year $ 529,934 $ 529,934 $ 597,556 $ 67,622
(A Component Unit of Washington County, Oregon)
For the year ended June 30, 2017

71
CLEAN WATER SERVICES
Sanitary Sewer Construction Fund 112
Schedule of Revenues and Expenditures - Budget and Actual
For the year ended June 30, 2017
VarianceInitial Final from
Budget Budget Actual budget
Revenues:Interest earned $ 709,300 $ 709,300 $ 302,673 $ (406,627) Contributions from developers 2,085,000 2,085,000 280,515 (1,804,485) Other 50,000 50,000 168,962 118,962
Total revenues 2,844,300 2,844,300 752,150 (2,092,150)
Expenditures:Capital outlay 61,482,000 61,482,000 50,453,532 11,028,468 Other 100,000 100,000 - 100,000 Contingency 7,000,000 7,000,000 - 7,000,000
Total expenditures 68,582,000 68,582,000 50,453,532 18,128,468
Excess of expenditures over revenues (65,737,700) (65,737,700) (49,701,382) 16,036,318
Other financing sources (uses):Bond sale proceeds - - 197,953 197,953 Transfers from other funds 48,998,800 48,998,800 48,448,100 (550,700) Transfers to other funds - - - -
Total other financing sources (uses) 48,998,800 48,998,800 48,646,053 (352,747)
Net change in fund balance (16,738,900) (16,738,900) (1,055,329) 15,683,571
Fund balance, beginning of year 52,353,388 52,353,388 61,936,012 9,582,624
Fund balance, end of year $ 35,614,488 $ 35,614,488 60,880,683 $ 25,266,195
Reconciliation to net postion - GAAP BasisAdjust for capital assets not being depreciated 87,089,393
Net position - GAAP Basis $ 147,970,076
(A Component Unit of Washington County, Oregon)

72
CLEAN WATER SERVICES
Tualatin Basin Water Supply Capital Project Construction Fund 115
Schedule of Revenues and Expenditures - Budget and Actual
For the year ended June 30, 2017
VarianceInitial Final from
Budget Budget Actual budget
Revenues:Interest earned $ 2,600 $ 2,600 $ - $ (2,600) Rental income - - - - Contributions from partners 6,900 6,900 104,060 97,160
Total revenues 9,500 9,500 104,060 94,560
Expenditures:Capital outlay 10,000 24,000 20,987 3,013 Other 10,000 - - - Contingency 10,000 6,000 - 6,000
Total expenditures 30,000 30,000 20,987 9,013
Excess (deficiency) of revenues over expenditures (20,500) (20,500) 83,073 103,573
Other financing sources:Transfers from other funds 3,100 3,100 - (3,100)
Net change in fund balance (17,400) (17,400) 83,073 100,473
Fund balance, beginning of year 368,062 368,062 400,681 32,619
Fund balance, end of year $ 350,662 $ 350,662 483,754 $ 133,092
(A Component Unit of Washington County, Oregon)

73
CLEAN WATER SERVICES
Surface Water Management Capital Replacement Fund 206
Schedule of Revenues and Expenditures - Budget and Actual
For the year ended June 30, 2017
VarianceInitial Final from
Budget Budget Actual budget
Revenues:Interest earned $ 9,000 $ 9,000 $ 2,714 $ (6,286) Other - - - -
Total revenues 9,000 9,000 2,714 (6,286)
Expenditures:Capital outlay 364,000 364,000 327,089 36,911 Contingency 18,200 18,200 - 18,200
Total expenditures 382,200 382,200 327,089 55,111
Excess of expenditures over revenues (373,200) (373,200) (324,375) 48,825
Other financing sources:Transfers from other funds 1,000,000 1,000,000 1,000,000 -
Net change in fund balance 626,800 626,800 675,625 48,825
Fund balance, beginning of year - - - -
Fund balance, end of year $ 626,800 $ 626,800 $ 675,625 $ 48,825
(A Component Unit of Washington County, Oregon)

74
CLEAN WATER SERVICES
Capital Expenditure Reserve Storm and SurfaceWater Management Fund 207
Schedule of Revenues and Expenditures - Budget and Actual
For the year ended June 30, 2017
VarianceInitial Final from
Budget Budget Actual budget
Revenues:Connection fees $ 200,600 $ 200,600 $ 306,543 $ 105,943 Interest earned 6,300 6,300 4,874 (1,426) Other 75,000 75,000 - (75,000)
Total revenues 281,900 281,900 311,417 29,517
Expenditures:Contingency 30,000 30,000 - 30,000
Excess of revenues over expenditures 251,900 251,900 311,417 59,517
Other financing (uses):Transfers to other funds (100,000) (100,000) (100,000) -
Net change in fund balance 151,900 151,900 211,417 59,517
Fund balance, beginning of year 777,919 777,919 846,379 68,460
Fund balance, end of year $ 929,819 $ 929,819 $ 1,057,796 $ 127,977
(A Component Unit of Washington County, Oregon)

75
CLEAN WATER SERVICES
Surface Water Management Construction Fund 212
Schedule of Revenues and Expenditures - Budget and Actual
For the year ended June 30, 2017
VarianceInitial Final from
Budget Budget Actual budget
Revenues:Other $ 50,000 $ 50,000 $ 45,000 $ (5,000) Interest 33,700 33,700 25,311 (8,389) Reimbursement from developers 95,000 95,000 - (95,000)
Total revenues 178,700 178,700 70,311 (108,389)
Expenditures:Capital outlay 3,563,000 3,563,000 2,322,469 1,240,531 Other 50,000 50,000 - 50,000 Contingency 225,000 225,000 - 225,000
Total expenditures 3,838,000 3,838,000 2,322,469 1,515,531
Excess of expenditures over revenues (3,659,300) (3,659,300) (2,252,158) 1,407,142
Other financing sources:Transfers from other funds 4,100,000 4,100,000 4,100,000 -
Net change in fund balance 440,700 440,700 1,847,842 1,407,142
Fund balance, beginning of year 3,983,683 3,983,683 3,970,515 (13,168)
Fund balance, end of year $ 4,424,383 $ 4,424,383 5,818,357 $ 1,393,974
Reconciliation to net postion - GAAP BasisAdjust for capital assets not being depreciated 4,461,636
Net position - GAAP Basis $ 10,279,993
(A Component Unit of Washington County, Oregon)

76
CLEAN WATER SERVICES
Reconciliation of Revenues and Expenditures(Budgetary Basis) to Increase in Net Position (GAAP Basis)
For the year ended June 30, 2017
Fund Revenues Expenditures Net
101 General Fund $ 121,234,640 $ 60,121,726 $ 61,112,914 201 Storm and Surface Water Management Fund 15,546,186 50,695 15,495,491 111 Master Plan Update Debt Service Fund 1,616,381 24,802,933 (23,186,552) 114 Revenue Pension Bond Debt Service Fund 2,530 1,412,010 (1,409,480) 102 Liability Reserve Fund 101,835 202,296 (100,461) 107 Capital Expenditure Reserve (Sanitary Sewer) Fund 26,567,135 - 26,567,135 106 Sanitary Capital Replacement Fund 12,996 1,960,405 (1,947,409) 108 Sanitary Sewer LID Construction Fund 21,604 - 21,604 208 Surface Water Management LID Construction Fund 2,345 - 2,345 112 Sanitary Sewer Construction Fund 752,150 50,453,532 (49,701,382) 115 Tualatin Basin Water Supply Capital Project Construction Fund 104,060 20,987 83,073 206 Surface Water Management Capital Replacement Fund 2,714 327,089 (324,375) 207 Capital Expenditure Reserve Storm and Surface Water
Management Fund 311,417 - 311,417 212 Surface Water Management Construction Fund 70,311 2,322,469 (2,252,158)
$ 166,346,304 $ 141,674,142 24,672,162
Reconciliation to change in net postion - GAAP BasisExpenditures capitalized 54,504,806 Interest capitalized 2,147,995 Bond principal paid 15,300,000 Contributions of capital assets 6,602,392 Contributions of intangible assets 2,845,279 Loss on disposal of capital assets (1,377,674) Loss on equity in joint venture (73,069) Net postemployment benefits costs other than pension (6,820) Net accrued performance bonus (417,920) Depreciation (40,781,071) Amortization of intangibles (12,568) Amortization of prepaid bond discount (305,139) Amortization of prepaid bond premium 1,804,746 Net pension expense (3,993,632) Accrued bond interest payable 243,796 Contract receivable from CWI 8,996 Amoritization of prepaid electric (27,522) Contributed capital - CWIC, captive insurance 47,279 Net operations - CWIC, captive insurance 96,054
Increase in net position - GAAP Basis $ 61,278,090
(A Component Unit of Washington County, Oregon)

STATISTICAL SECTION
CLEAN WATER SERVICES (A Component Unit of Washington County, Oregon)
STATISTICAL SECTION June 30, 2017
77
This part of Clean Water Services’ Comprehensive Annual Financial Report presents detailed information as a context for understanding what the information in the financial statements, note disclosures, and required supplementary information says about the District’s overall financial health. This section contains the following tables and information:
Financial Trends
These schedules contain trend information to help the reader understand how the District’s financial performance and well-being have changed over time.
Revenue Capacity
These schedules contain trend information to help the reader assess the District’s most significant local revenue source, the District sewer rate.
Debt Capacity
These schedules present information to help the reader assess the affordability of the District’s current levels of outstanding debt and the District’s ability to issue additional debt in the future.
Demographic and Economic Information
These schedules offer demographic and economic indicators to help the reader understand the environment within which the District’s financial activities take place.
Operating Information
These schedules contain service and infrastructure data to help the reader understand how the information in the District’s financial report relates to the services the District provides and the activities it performs.
Sources
Unless otherwise noted, the information in these schedules is derived from the Comprehensive Annual Financial Reports for the relevant year. The District implemented GASB Statement No. 34 in 2001; schedules presenting government-wide information include information beginning in that year.

FINANCIAL TRENDS
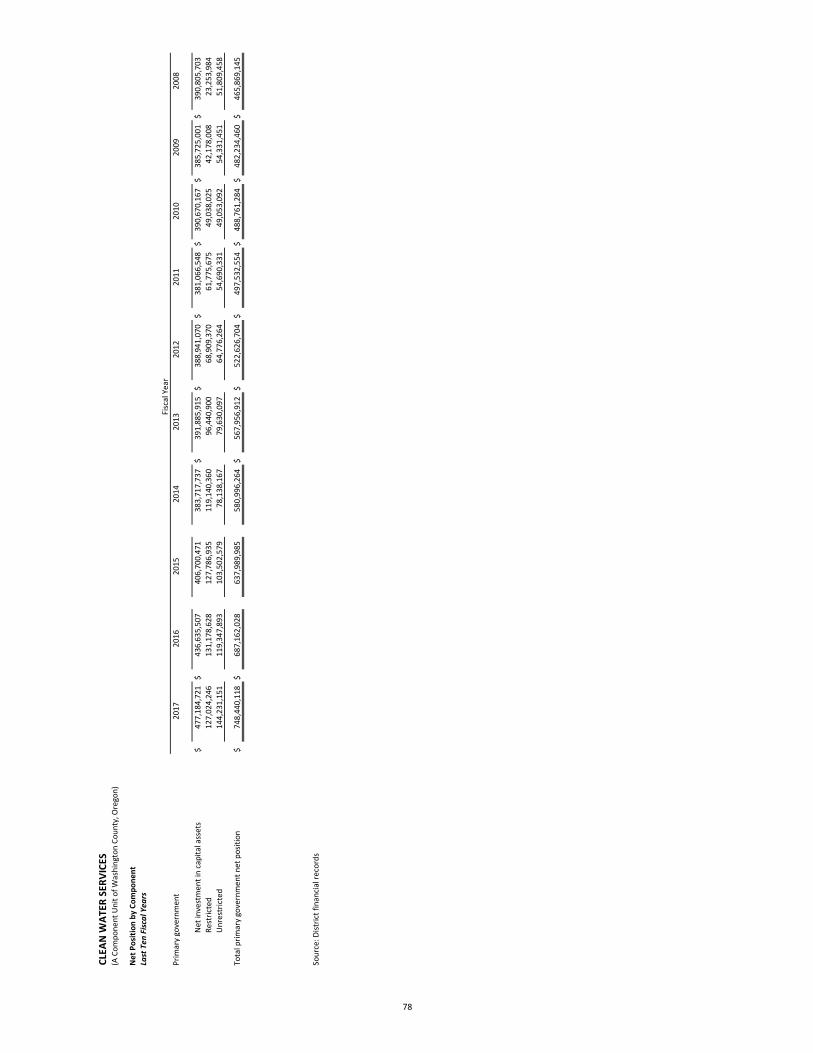
CLEA
N W
ATER
SER
VICE
S (A
Com
pone
nt U
nit o
f Was
hing
ton
Coun
ty, O
rego
n)
Net
Pos
ition
by
Com
pone
ntLa
st T
en F
iscal
Yea
rs
Fisc
al Y
ear
Prim
ary
gove
rnm
ent
2017
2016
2015
2014
2013
2012
2011
2010
2009
2008
Net
inve
stm
ent i
n ca
pita
l ass
ets
$47
7,18
4,72
1$
436,
635,
507
406,
700,
471
383,
717,
737
$39
1,88
5,91
5$
388,
941,
070
$38
1,06
6,54
8$
390,
670,
167
$38
5,72
5,00
1$
390,
805,
703
Rest
ricte
d12
7,02
4,24
613
1,17
8,62
812
7,78
6,93
511
9,14
0,36
096
,440
,900
68,9
09,3
7061
,775
,675
49,0
38,0
2542
,178
,008
23,2
53,9
84U
nres
tric
ted
144,
231,
151
119,
347,
893
103,
502,
579
78,1
38,1
6779
,630
,097
64,7
76,2
6454
,690
,331
49,0
53,0
9254
,331
,451
51,8
09,4
58
Tota
l prim
ary
gove
rnm
ent n
et p
ositi
on$
748,
440,
118
$68
7,16
2,02
863
7,98
9,98
558
0,99
6,26
4$
567,
956,
912
$52
2,62
6,70
4$
497,
532,
554
$48
8,76
1,28
4$
482,
234,
460
$46
5,86
9,14
5
Sour
ce: D
istric
t fin
anci
al re
cord
s
78

CLEA
N W
ATER
SER
VICE
S (A
Com
pone
nt U
nit o
f Was
hing
ton
Coun
ty, O
rego
n)
Chan
ges i
n N
et P
ositi
onLa
st T
en F
isca
l Yea
rs
Fisc
al
Year
Ope
ratin
g Re
venu
esO
pera
ting
Expe
nses
Ope
ratin
g In
com
e
Tota
l N
onop
erat
ing
Reve
nues
/ (E
xpen
ses)
Inco
me/
(Los
s)
befo
re C
apita
l Co
ntrib
utio
nsCa
pita
l Co
ntrib
utio
nsCh
ange
in N
et
Posi
tion
2017
$13
7,18
6,25
8$
106,
428,
529
$30
,757
,729
$(6
,978
,691
)$
23,7
79,0
38$
37,4
99,0
52$
61,2
78,0
9020
1613
0,05
2,08
610
8,89
5,98
221
,156
,104
(9,0
15,1
48)
12,1
40,9
5637
,031
,087
49,1
72,0
4320
1512
5,44
8,79
789
,618
,408
35,8
30,3
89(1
1,33
9,29
0)24
,491
,099
32,5
02,6
2256
,993
,721
2014
120,
174,
299
96,2
80,6
4223
,893
,657
(14,
651,
481)
9,24
2,17
628
,309
,974
37,5
52,1
5020
1311
7,09
8,32
194
,068
,352
23,0
29,9
69(1
4,42
0,16
6)8,
609,
803
36,7
20,4
0545
,330
,208
2012
107,
029,
050
90,5
54,0
1416
,475
,036
(6,5
98,3
45)
9,87
6,69
115
,217
,459
25,0
94,1
5020
1110
3,37
3,53
589
,766
,997
13,6
06,5
38(1
4,08
7,71
5)(4
81,1
77)
9,25
2,44
78,
771,
270
79
2010
96,3
29,0
8088
,092
,976
8,23
6,10
4(7
,809
,866
)42
6,23
86,
100,
586
6,52
6,82
420
0989
,584
,555
82,9
66,6
126,
617,
943
(6,0
14,7
92)
603,
151
15,7
62,1
6416
,365
,315
2008
84,7
53,8
0978
,282
,300
6,47
1,50
9(6
,036
,886
)43
4,62
321
,670
,866
22,1
05,4
89
Sour
ce: D
istric
t fin
anci
al re
cord
s
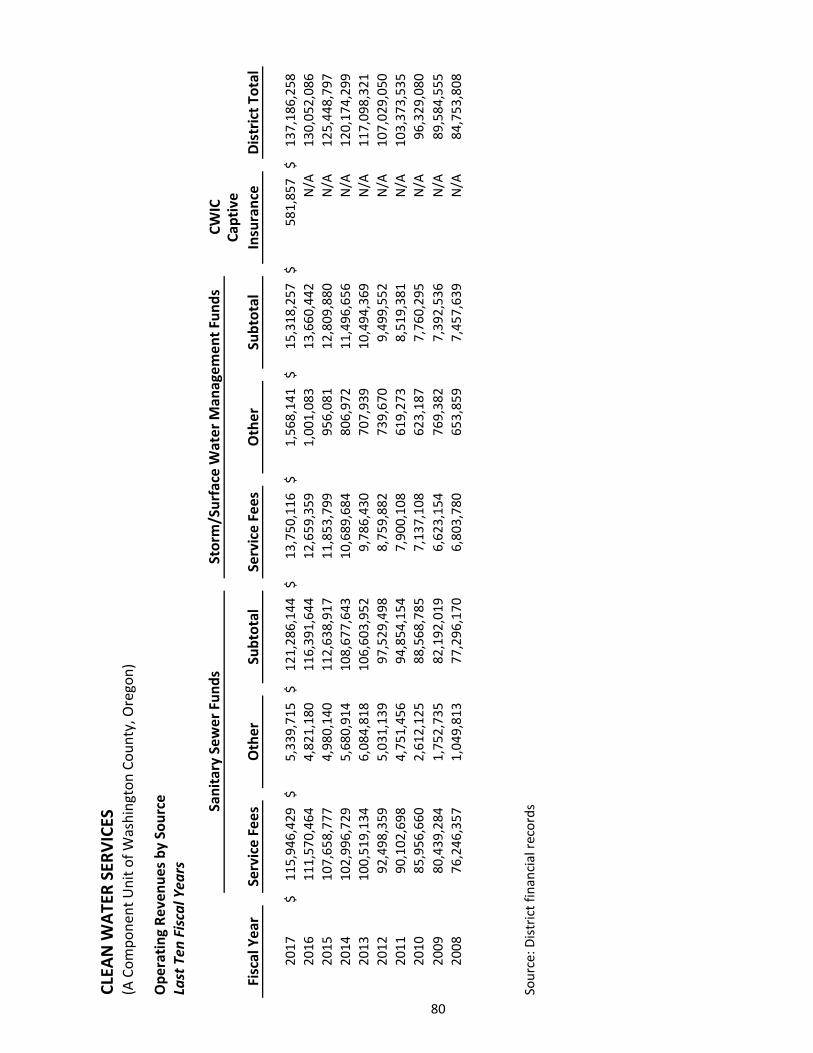
CLEA
N W
ATER
SER
VICE
S (A
Com
pone
nt U
nit o
f Was
hing
ton
Coun
ty, O
rego
n)
Ope
ratin
g Re
venu
es b
y So
urce
Last
Ten
Fis
cal Y
ears
CWIC
Fisc
al Y
ear
Serv
ice
Fees
Oth
erSu
btot
alSe
rvic
e Fe
esO
ther
Subt
otal
Capt
ive
Insu
ranc
eDi
stric
t Tot
al
2017
$11
5,94
6,42
9$
5,33
9,71
5$
121,
286,
144
$13
,750
,116
$1,
568,
141
$15
,318
,257
$58
1,85
7$
137,
186,
258
2016
111,
570,
464
4,82
1,18
011
6,39
1,64
412
,659
,359
1,00
1,08
313
,660
,442
N/A
130,
052,
086
2015
107,
658,
777
4,98
0,14
011
2,63
8,91
711
,853
,799
956,
081
12,8
09,8
80N
/A12
5,44
8,79
720
1410
2,99
6,72
95,
680,
914
108,
677,
643
10,6
89,6
8480
6,97
211
,496
,656
N/A
120,
174,
299
2013
100,
519,
134
6,08
4,81
810
6,60
3,95
29,
786,
430
707,
939
10,4
94,3
69N
/A11
7,09
8,32
120
1292
,498
,359
5,03
1,13
997
,529
,498
8,75
9,88
273
9,67
09,
499,
552
N/A
107,
029,
050
2011
90,1
02,6
984,
751,
456
94,8
54,1
547,
900,
108
619,
273
8,51
9,38
1N
/A10
3,37
3,53
520
1085
,956
,660
2,61
2,12
588
,568
,785
7,13
7,10
862
3,18
77,
760,
295
N/A
96,3
29,0
80
80
2009
80,4
39,2
841,
752,
735
82,1
92,0
196,
623,
154
769,
382
7,39
2,53
6N
/A89
,584
,555
2008
76,2
46,3
571,
049,
813
77,2
96,1
706,
803,
780
653,
859
7,45
7,63
9N
/A84
,753
,808
Sour
ce: D
istric
t fin
anci
al re
cord
sSani
tary
Sew
er F
unds
Stor
m/S
urfa
ce W
ater
Man
agem
ent F
unds

CLEA
N W
ATER
SER
VICE
S (A
Com
pone
nt U
nit o
f Was
hing
ton
Coun
ty, O
rego
n)
Ope
ratin
g Ex
pens
esLa
st T
en F
isca
l Yea
rs
Fisc
al
Year
Labo
r &
Bene
fits
Util
ities
Prof
essi
onal
Se
rvic
esCh
emic
als
Oth
er
Ope
ratin
g Ex
pens
es(1
)
Subt
otal
, be
fore
De
prec
iatio
n/Am
ortiz
atio
nDe
prec
iatio
n/Am
ortiz
atio
nTo
tal O
pera
ting
Expe
nses
2017
$38
,494
,637
$4,
392,
787
$8,
989,
321
$3,
943,
731
$9,
814,
414
$65
,634
,890
$40
,793
,639
$10
6,42
8,52
920
1644
,920
,532
4,44
5,65
78,
777,
456
3,57
4,66
17,
439,
183
69,1
57,4
8939
,738
,493
108,
895,
982
2015
23,4
65,1
964,
546,
965
8,57
0,14
93,
682,
534
7,55
1,69
847
,816
,542
41,8
01,8
6689
,618
,408
2014
30,0
75,1
635,
086,
259
9,07
2,82
43,
761,
027
7,73
9,70
955
,734
,982
40,5
45,6
6096
,280
,642
2013
29,8
44,6
954,
738,
941
7,94
3,52
43,
607,
150
8,08
9,57
454
,223
,884
39,8
44,4
6894
,068
,352
2012
29,9
97,5
094,
775,
989
7,54
7,52
63,
274,
779
7,67
7,18
853
,272
,991
37,2
81,0
2390
,554
,014
2011
29,2
37,2
124,
648,
207
7,74
6,57
53,
062,
877
7,11
9,11
251
,813
,983
37,9
53,0
1489
,766
,997
2010
28,5
74,2
944,
751,
022
8,28
8,03
23,
161,
181
7,95
3,64
252
,728
,171
35,3
64,8
0588
,092
,976
81
2009
27,7
11,8
384,
633,
182
7,73
5,52
63,
018,
492
7,19
7,13
450
,296
,172
32,6
70,4
4082
,966
,612
2008
24,5
73,2
185,
032,
352
7,18
5,84
92,
803,
784
7,26
1,23
346
,856
,436
31,4
25,8
6478
,282
,300
(1) O
ther
Ope
ratin
g Ex
pens
es in
clud
e su
pplie
s, a
dmin
istra
tive
cost
s, re
pairs
and
mai
nten
ance
, ins
uran
ce a
nd a
mor
tizat
ion
of p
repa
id b
ond
cost
s.
Sour
ce: D
istric
t fin
anci
al re
cord
s

CLEA
N W
ATER
SER
VICE
S (A
Com
pone
nt U
nit o
f Was
hing
ton
Coun
ty, O
rego
n)
Non
oper
atin
g Re
venu
es a
nd E
xpen
ses
Last
Ten
Fis
cal Y
ears
Fisc
al
Year
Inve
stm
ent
Inco
me
Gai
n/Lo
ss o
n di
spos
al o
f as
sets
Oth
erIn
tere
st
Expe
nse
Tota
l N
onop
erat
ing
Expe
nses
2017
$1,
346,
020
$(1
,339
,175
)$
(54,
532)
$(6
,931
,004
)$
(6,9
78,6
91)
2016
2,30
4,24
6(1
82,2
09)
(2,4
87,6
74)
(8,6
49,5
11)
(9,0
15,1
48)
2015
1,84
7,40
2(7
6,24
2)(3
,533
,567
)(9
,576
,883
)(1
1,33
9,29
0)20
141,
653,
029
(1,8
80,7
62)
(5,1
94,1
39)
(9,2
29,6
09)
(14,
651,
481)
2013
517,
151
(3,7
73,6
29)
(2,9
22,3
53)
(8,2
41,3
35)
(14,
420,
166)
2012
1,56
2,18
1(1
15,5
49)
(994
,750
)(7
,050
,227
)(6
,598
,345
)20
111,
497,
433
54,4
43(4
,464
,323
)(1
1,17
5,26
8)(1
4,08
7,71
5)20
101,
386,
567
32,2
56(7
0,16
3)(9
,158
,526
)(7
,809
,866
)
82
2009
2,29
1,29
975
,584
(70,
066)
(8,3
11,6
09)
(6,0
14,7
92)
2008
3,08
2,02
1(5
36)
(81,
703)
(9,0
36,6
68)
(6,0
36,8
86)
Sour
ce: D
istric
t fin
anci
al re
cord
s

REVENUE CAPACITY
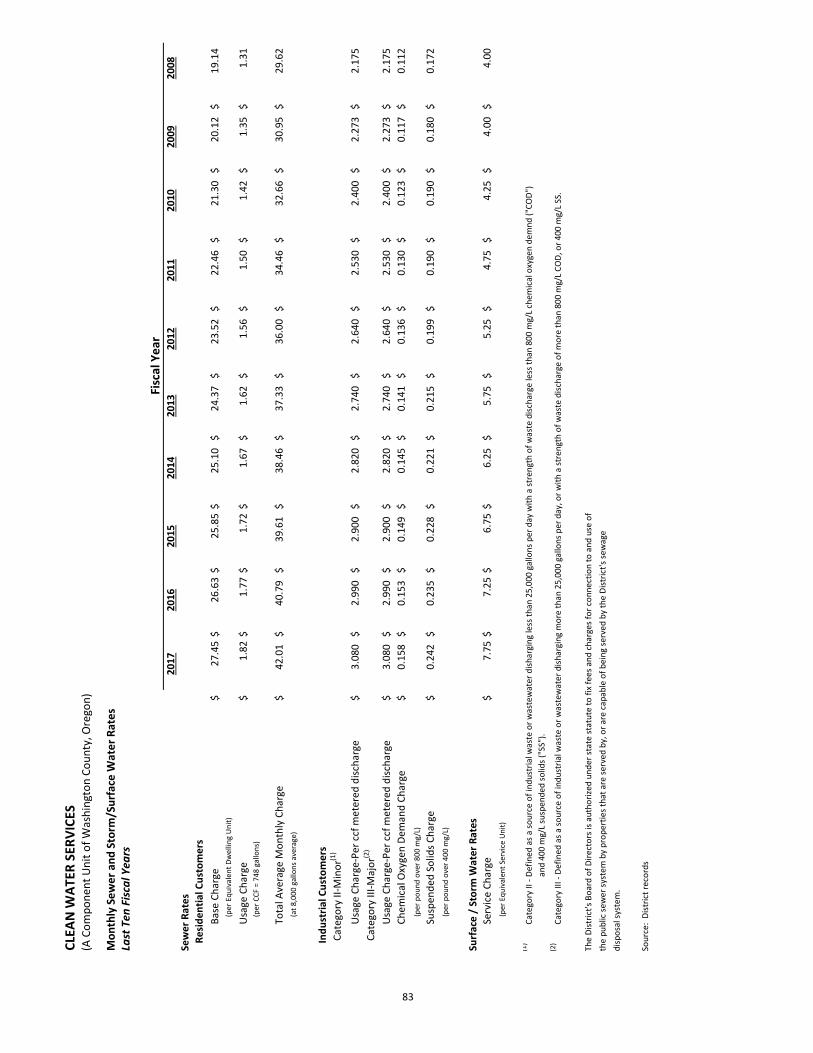
CLEA
N W
ATER
SER
VICE
S (A
Com
pone
nt U
nit o
f Was
hing
ton
Coun
ty, O
rego
n)
Mon
thly
Sew
er a
nd S
torm
/Sur
face
Wat
er R
ates
Last
Ten
Fis
cal Y
ears
Fisc
al Y
ear
2017
2016
2015
2014
2013
2012
2011
2010
2009
2008
Sew
er R
ates
Re
side
ntia
l Cus
tom
ers
Base
Cha
rge
$27
.45
$26
.63
$25
.85
$25
.10
$
24.3
7
$23
.52
$
22.4
6
$21
.30
$
20.1
2
$19
.14
(per
Equ
ival
ent D
wel
ling
Uni
t)
Usa
ge C
harg
e $
1.82
$1.
77$
1.72
$1.
67
$1.
62
$1.
56
$1.
50
$1.
42
$1.
35
$1.
31
(p
er C
CF =
748
gal
lons
)
Tota
l Ave
rage
Mon
thly
Cha
rge
$42
.01
$40
.79
$39
.61
$38
.46
$
37.3
3
$36
.00
$
34.4
6
$32
.66
$
30.9
5
$29
.62
(at 8
,000
gal
lons
ave
rage
)
In
dust
rial C
usto
mer
s
Cat
egor
y II-
Min
or(1
)
Usa
ge C
harg
e-Pe
r ccf
met
ered
disc
harg
e$
3.08
0
$
2.99
0
$
2.90
0
$
2.82
0
$2.
740
$
2.64
0
$2.
530
$
2.40
0
$2.
273
$
2.17
5
C
ateg
ory
III-M
ajor
(2)
Usa
ge C
harg
e-Pe
r ccf
met
ered
disc
harg
e$
3.08
0
$
2.99
0
$
2.90
0
$
2.82
0
$2.
740
$
2.64
0
$2.
530
$
2.40
0
$2.
273
$
2.17
5
Chem
ical
Oxy
gen
Dem
and
Char
ge$
0.15
8
$
0.15
3
$
0.14
9
$
0.14
5
$0.
141
$
0.13
6
$0.
130
$
0.12
3
$0.
117
$
0.11
2
(p
er p
ound
ove
r 800
mg/
L)
Susp
ende
d So
lids C
harg
e$
0.24
2
$
0.23
5
$
0.22
8
$
0.22
1
$0.
215
$
0.19
9
$0.
190
$
0.19
0
$0.
180
$
0.17
2
(p
er p
ound
ove
r 400
mg/
L)
Surf
ace
/ St
orm
Wat
er R
ates
Serv
ice
Char
ge
$7.
75$
7.25
$6.
75$
6.25
$
5.75
$
5.25
$
4.75
$
4.25
$
4.00
$
4.00
(per
Equ
ival
ent S
ervi
ce U
nit)
(1)
Cate
gory
II -
Defin
ed a
s a so
urce
of i
ndus
tria
l was
te o
r was
tew
ater
dish
argi
ng le
ss th
an 2
5,00
0 ga
llons
per
day
with
a st
reng
th o
f was
te d
ischa
rge
less
than
800
mg/
L ch
emic
al o
xyge
n de
mnd
("CO
D")
a
nd 4
00 m
g/L
susp
ende
d so
lids (
"SS"
).(2
)Ca
tego
ry II
I - D
efin
ed a
s a so
urce
of i
ndus
tria
l was
te o
r was
tew
ater
dish
argi
ng m
ore
than
25,
000
gallo
ns p
er d
ay, o
r with
a st
reng
th o
f was
te d
ischa
rge
of m
ore
than
800
mg/
L CO
D, o
r 400
mg/
L SS
.
The
Dist
rict's
Boa
rd o
f Dire
ctor
s is a
utho
rized
und
er st
ate
stat
ute
to fi
x fe
es a
nd c
harg
es fo
r con
nect
ion
to a
nd u
se o
fth
e pu
blic
sew
er sy
stem
by
prop
ertie
s tha
t are
serv
ed b
y, o
r are
cap
able
of b
eing
serv
ed b
y th
e Di
stric
t's se
wag
edi
spos
al sy
stem
.
Sour
ce:
Dist
rict r
ecor
ds
83

CLEA
N W
ATER
SER
VICE
S (A
Com
pone
nt U
nit o
f Was
hing
ton
Coun
ty, O
rego
n)
Syst
em D
evel
opm
ent C
harg
es a
nd R
even
ues
Last
Ten
Fis
cal Y
ears
Fisc
al y
ear
Perc
ent
Perc
ent
Perc
ent
ende
dCo
nnec
tion
Tota
lin
crea
seCo
nnec
tion
Tota
lin
crea
seCo
nnec
tion
Tota
lin
crea
seJu
ne 3
0fe
eam
ount
(dec
reas
e)fe
eam
ount
(dec
reas
e)fe
eam
ount
(dec
reas
e)
2017
$51
0$
228,
597
(11.
36)
%$
5,30
0$
26,3
69,8
5728
.92
%$
5,81
0$
26,5
98,4
5428
.42
%20
1650
025
7,88
5(1
5.25
)5,
100
20,4
54,7
219.
635,
600
20,7
12,6
069.
2320
1550
030
4,29
051
.91
4,90
018
,658
,680
(10.
85)
5,40
018
,962
,970
(10.
26)
2014
500
200,
315
16.0
94,
800
20,9
30,1
15(3
3.87
)5,
300
21,1
30,4
30(3
3.60
)20
1350
017
2,55
87.
004,
665
31,6
49,9
8517
1.17
5,16
531
,822
,543
168.
9320
1250
016
1,26
957
.76
4,50
011
,671
,613
61.0
95,
000
11,8
32,8
8261
.04
2011
500
102,
221
(1.8
9)4,
100
7,24
5,46
2(2
0.65
)4,
600
7,34
7,68
3(2
0.44
)20
1050
010
4,19
318
.46
3,60
09,
131,
098
20.2
94,
100
9,23
5,29
120
.26
2009
500
87,9
57(6
7.12
)3,
100
7,59
1,18
5(3
.52)
3,60
07,
679,
142
(5.6
1)20
0850
026
7,52
7(2
.55)
2,80
07,
868,
133
(8.1
6)3,
300
8,13
5,66
0(7
.99)
Sour
ce:
Dist
rict r
ecor
ds
Stor
m/S
urfa
ce W
ater
Man
agem
ent
Sani
tary
Sew
erCo
mbi
ned
84

CLEA
N W
ATER
SER
VICE
S(A
Com
pone
nt U
nit o
f Was
hing
ton
Coun
ty, O
rego
n)
Ten
Larg
est I
ndiv
idua
l Rat
epay
ers
Curr
ent Y
ear a
nd T
en Y
ears
Ago
Cust
omer
Amou
nt%
Cust
omer
Amou
nt%
Inte
l Cor
pora
tion
- Ron
ler A
cres
Cam
pus
$
7,
845,
664
6.77
%In
tel C
orpo
ratio
n - R
onle
r Acr
es $
3,3
82,8
48
4.07
%In
tel C
orpo
ratio
n - A
loha
Cam
pus
1,
503,
229
1.30
%Re
sers
Fin
e Fo
ods -
Jenk
ins R
d
5
13,6
72
0.62
%Pa
cific
Foo
ds o
f Ore
gon
836,
454
0.72
%M
axim
Inte
grat
ed P
rodu
cts
449
,208
0.
54%
Max
im In
tegr
ated
Pro
duct
s
68
1,69
1 0.
59%
Paci
fic F
oods
of O
rego
n
4
14,2
04
0.50
%Re
sers
Fin
e Fo
ods -
Jenk
ins R
d
49
4,99
7 0.
43%
Inte
grat
ed D
evic
e Te
chno
logy
, Inc
.
3
21,9
96
0.39
%So
larW
orld
Indu
strie
s Am
eric
a In
c.
47
7,45
8 0.
41%
Mer
ix C
orpo
ratio
n - P
opla
r Lan
e21
7,28
4
0.26
%Jir
eh S
emic
ondu
ctor
, Inc
.
45
0,78
7 0.
39%
Fujim
i Am
eric
a FO
Fac
ility
255
,840
0.
31%
Prov
iden
ce H
ealth
Sys
tem
s - S
t. Vi
ncen
t
37
5,98
8 0.
32%
Gray
and
Com
pany
164
,628
0.
20%
Hills
boro
Lan
dfill
Inc.
246,
214
0.21
%Tr
iqui
nt S
emic
ondu
ctor
9
6,92
4 0.
12%
Herit
ag V
illag
e M
obile
Par
k
24
2,67
0 0.
21%
OHS
U -
Wes
t Cam
pus
5
5,65
6 0.
07%
Subt
otal
(10
larg
est i
ndus
tria
l rat
epay
ers)
13,
155,
152
11.3
5%Su
btot
al (1
0 la
rges
t ind
ustr
ial r
atep
ayer
s)
5,8
72,2
60
7.07
%
Bala
nce
from
oth
er c
usto
mer
s(1)
1
02,7
91,2
77
88.6
5%Ba
lanc
e fr
om o
ther
cus
tom
ers(1
)
77,1
77,8
77
92.9
3%
Gran
d To
tals
$
1
15,9
46,4
29
100.
00%
Gran
d To
tals
$
83
,050
,137
10
0.00
%
(1)
Incl
udes
Res
iden
tial C
usto
mer
s and
Who
lesa
le C
usto
mer
s (ot
her c
ities
).
Sour
ce:
Dist
rict f
inan
cial
reco
rds
Fisc
al Y
ear 2
017
Fisc
al Y
ear 2
008
85

DEBT CAPACITY

CLEA
N W
ATER
SER
VICE
S(A
Com
pone
nt U
nit o
f Was
hing
ton
Coun
ty, O
rego
n)
Ratio
s of O
utst
andi
ng D
ebt b
y Ty
peLa
st T
en F
isca
l Yea
rs
Fisc
al y
ear
Gen
eral
Banc
roft
As a
Sha
reen
ded
Obl
igat
ion
Impr
ovem
ent
Reve
nue
Pens
ion
Per
of P
erso
nal
June
30
Bond
sBo
nds
Bond
sBo
nds
Cont
ract
sAm
ount
Capi
taIn
com
e20
17$
-
$
-
$20
0,90
0,05
6
$
13,4
35,0
00
$
-
$
214,
335,
056
$36
7
N
/A20
16-
-
215,
137,
444
14,0
00,0
00
-
229,
137,
444
402
0.77
%20
15-
-
230,
252,
553
14,4
80,0
00
-
244,
732,
553
437
0.88
%20
14-
-
244,
931,
787
14,8
85,0
00
-
259,
816,
787
472
1.02
%20
13-
-
258,
223,
432
15,2
15,0
00
-
273,
438,
432
504
1.08
%20
12-
-
282,
016,
651
15,4
80,0
00
-
297,
496,
651
555
1.26
%20
11-
-
250,
492,
819
15,6
85,0
00
-
266,
177,
819
501
1.22
%20
10-
-
271,
168,
155
15,8
35,0
00
-
287,
003,
155
542
1.32
%20
09-
-
190,
516,
159
15,9
35,0
00
-
206,
451,
159
397
0.91
%
86
2008
-
-
14
7,86
2,29
5
15
,990
,000
-
16
3,85
2,29
5
32
1
0.
77%
N/A
- In
form
atio
n no
t ava
ilabl
e as
of p
rintin
g
Sour
ce: D
istric
t fin
anci
al re
cord
s, P
ortla
nd S
tate
Pop
ulat
ion
Rese
arch
Cen
ter,
and
Bure
au o
f Eco
nom
ic A
naly
sis
Tota
l

CLEA
N W
ATER
SER
VICE
S(A
Com
pone
nt U
nit o
f Was
hing
ton
Coun
ty, O
rego
n)
Pled
ged-
Reve
nue
Cove
rage
Last
Ten
Fis
cal Y
ears
2017
2016
2015
2014
2013
2012
2011
2010
2009
2008
GRO
SS R
EVEN
UES
(1) :
Rat
e re
venu
e $
11
5,94
6,42
9
$
111,
570,
464
$
10
7,65
8,77
7
$
102,
996,
729
$
10
0,51
9,13
4
$
92,4
98,3
59
$
90
,102
,698
$
85,9
56,6
60
$
80
,439
,284
$
76
,246
,357
S
yste
m d
evel
opm
ent c
harg
es26
,369
,857
20,4
54,7
21
18
,658
,680
20,9
30,1
15
31
,649
,985
11,6
71,6
13
7,
245,
462
9,13
1,09
8
7,
591,
187
7,86
8,13
3
I
nter
est i
ncom
e1,
270,
784
2,19
0,48
6
1,
814,
026
1,59
5,79
1
50
6,96
4
1,
523,
061
1,44
5,82
2
1,
324,
665
1,91
7,02
3
2,
334,
393
Oth
er re
venu
e3,
604,
067
3,07
2,78
0
3,
273,
958
2,34
9,67
6
(1
,035
,255
)
1,
676,
171
2,27
4,16
5
1,
626,
436
1,51
3,03
4
1,
009,
194
Tota
l gro
ss re
venu
e14
7,19
1,13
7
137,
288,
451
13
1,40
5,44
1
127,
872,
311
13
1,64
0,82
8
107,
369,
204
10
1,06
8,14
7
98,0
38,8
59
91
,460
,528
87
,458
,077
OPE
RATI
NG
EXPE
NSE
S(1) :
Lab
or a
nd fr
inge
ben
efits
(2)
33,2
93,3
86
(
5)39
,716
,239
(4)
18,5
57,2
26
(
3)25
,240
,700
24,9
58,0
15
24
,860
,163
23,5
57,9
17
23
,104
,049
23,6
17,0
07
20,8
10,5
08
Util
ities
4,20
7,64
4
4,
307,
678
4,39
1,29
4
4,
961,
727
4,58
8,51
7
4,
610,
517
4,50
7,90
6
4,
603,
445
4,48
7,20
4
4,
917,
736
Pro
fess
iona
l ser
vice
s8,
041,
440
7,66
9,11
4
7,
488,
054
7,98
2,17
9
7,
007,
149
6,50
4,01
4
6,
591,
481
6,84
8,29
5
6,
010,
866
6,34
4,71
9
S
uppl
ies
3,89
2,63
5
3,
496,
465
3,62
7,71
7
3,
745,
608
4,11
1,53
6
3,
584,
252
3,09
9,88
7
3,
610,
806
3,73
6,09
3
3,
749,
776
Adm
inist
rativ
e co
sts
2,64
8,14
1
1,
502,
225
1,59
7,19
8
1,
588,
969
1,36
5,53
6
1,
266,
169
1,21
6,90
5
1,
264,
781
1,45
1,81
8
1,
365,
570
Rep
air a
nd m
aint
enan
ce34
0,00
5
41
9,77
5
29
2,12
9
39
3,19
3
45
4,72
7
41
5,94
6
27
8,91
2
34
9,03
2
18
7,26
5
156,
214
I
nsur
ance
930,
535
753,
061
758,
030
710,
448
575,
899
584,
027
537,
178
618,
005
714,
417
66
5,87
8
Che
mic
als
3,93
2,46
9
3,
566,
961
3,66
7,49
7
3,
748,
437
3,59
3,94
8
3,
269,
986
3,06
1,66
0
3,
155,
413
3,01
1,12
8
2,
794,
825
Tota
l ope
ratin
g ex
pens
es57
,286
,255
61,4
31,5
18
40
,379
,145
48,3
71,2
61
46
,655
,327
45,0
95,0
74
42
,851
,846
43,5
53,8
26
43
,215
,798
40
,805
,226
TOTA
L AV
AILA
BLE
FOR
DEBT
SER
VICE
$
89,9
04,8
82
$
75
,856
,933
$
91,0
26,2
96
$
79
,501
,050
$
84,9
85,5
01
$
62
,274
,130
$
58,2
16,3
01
$
54
,485
,033
$
48,2
44,7
30
$
46,6
52,8
51
DEBT
SER
VICE
SEN
IOR
BON
DS
199
2 Re
venu
e Bo
nds-
Serie
s A $
-
$
-
$
-
$
-
$
-
$
-
$
-
$
-
$
3,
093,
000
$
7,77
6,00
0
199
6 Re
venu
e Bo
nds-
Serie
s 199
6-
-
-
-
-
-
-
-
2,
620,
152
2,61
5,93
0
199
7 Re
venu
e Bo
nds-
Serie
s A-
-
-
-
10
,205
,200
10,1
99,5
00
10
,202
,750
10,2
06,9
63
7,
112,
181
2,42
3,63
1
200
1 Re
venu
e Bo
nds-
Serie
s 200
1-
-
-
-
-
2,65
4,75
0
4,
393,
600
4,38
5,05
6
4,
377,
488
4,38
3,18
8
200
4 Re
venu
e Bo
nds-
Serie
s 200
43,
961,
325
3,95
8,72
5
3,
961,
800
3,96
1,55
0
3,
952,
800
3,96
6,30
0
3,
958,
614
3,95
3,30
3
1,
336,
177
1,33
1,97
8
200
9 Re
venu
e Bo
nds-
Serie
s 200
9A4,
421,
923
5,34
2,51
3
5,
339,
713
5,34
0,23
8
2,
843,
263
2,84
3,26
3
2,
843,
263
2,89
0,65
0
-
-
2
010
Reve
nue
Bond
s-Se
ries 2
010A
-
3,
157,
000
3,16
3,47
5
3,
149,
950
356,
950
356,
950
330,
179
-
-
-
2
010
Reve
nue
Bond
s-Se
ries 2
010B
8,02
6,31
8
4,
791,
823
4,79
1,82
3
4,
791,
823
4,79
1,82
3
4,
791,
823
4,43
2,43
7
-
-
-
201
1 Re
venu
e Bo
nds-
Serie
s 201
1A3,
833,
125
3,83
5,37
5
3,
835,
750
3,87
7,65
0
3,
767,
850
794,
588
-
-
-
-
201
1 Re
venu
e Bo
nds-
Serie
s 201
1B3,
692,
450
3,69
5,07
5
3,
691,
900
3,69
3,08
7
2,
058,
775
1,20
0,95
2
-
-
-
-
2
016
Reve
nue
Bond
s-Se
ries 2
016A
775,
250
-
-
-
-
-
-
-
-
-
Tota
l Sen
ior D
ebt S
ervi
ce $
24
,710
,391
$
24,7
80,5
11
$
24
,784
,461
$
24,8
14,2
98
$
27
,976
,661
$
26,8
08,1
26
$
26
,160
,843
$
21,4
35,9
72
$
18
,538
,998
$
18
,530
,727
Seni
or D
ebt S
ervi
ce C
over
age
3.64
3.06
3.67
3.20
3.04
2.32
2.23
2.54
2.60
2.52
JU
NIO
R BO
NDS
1
997
Rev
enue
Bon
ds-S
erie
s One
$
-
$
-
$
-
$
-
$
7,04
6,93
8
$
7,
049,
888
$
7,05
1,56
3
$
7,
053,
112
$
7,05
0,54
4
$
7,
049,
862
Tota
l Jun
ior D
ebt S
ervi
ce $
-
$
-
-
$
-
$
7,
046,
938
$
7,04
9,88
8
$
7,
051,
563
$
7,05
3,11
2
$
7,
050,
544
$
7,04
9,86
2
Ju
nior
Deb
t Ser
vice
Cov
erag
e0.
000.
000.
000.
007.
304.
273.
804.
083.
693.
46
(1) A
s def
ined
in R
esol
utio
ns a
nd O
rder
s No.
87-
53, 8
9-58
, 92-
55, a
nd 0
9-7.
Rev
enue
s and
exp
ense
s rep
orte
d ar
e fo
r San
itary
Sew
er a
ctiv
ities
onl
y.(2
) Inc
lude
s deb
t ser
vice
on
the
Pens
ion
Bond
s.(3
) Pen
sion
expe
nse
was
redu
ced
by $
7 m
illio
n w
ith im
plem
enta
tion
of G
ASB
68 a
nd re
port
ing
of a
net
pen
sion
asse
t of $
5.8
mill
ion
at y
ear-
end.
(4) P
ensio
n ex
pens
e in
crea
sed
by $
12 m
illio
n re
sulti
ng fr
om a
net
pen
sion
liabi
lity
of $
15 m
illio
n at
yea
r-en
d.(5
) Pen
sion
expe
nse
incr
ease
d by
$4.
0 m
illio
n re
sulti
ng fr
om a
net
pen
sion
liabi
lity
of $
38.7
mill
ion
at y
ear-
end.
Sour
ce: D
istric
t rec
ords
87

DEMOGRAPHICS AND ECONOMICS

88
CLEAN WATER SERVICES(A Component Unit of Washington County, Oregon)
Demographic StatisticsLast Ten Fiscal Years
Fiscal year Personalended Population income Per capita Unemployment
June 30 (estimated) (in thousands) income rate2017 583,595 N/A N/A 3.5%2016 570,510 29,812,561$ 51,909$ 4.7%2015 560,465 27,911,782 49,553 5.0%2014 550,990 25,628,991 46,123 5.8%2013 542,845 25,483,103 46,508 6.6%2012 536,370 23,759,750 44,011 7.3%2011 531,070 21,771,434 40,950 7.9%2010 529,710 21,553,989 41,079 9.0%2009 519,925 22,405,740 43,438 10.3%2008 511,075 21,288,122 41,836 5.0%
N/A - Information not available as of printing
Source - Portland State Population Research Center, Bureau of Economic Analysis, and Oregon Employment Department

89
CLEAN WATER SERVICES(A Component Unit of Washington County, Oregon)
Major Employment Industries in Washington CountyCurrent Year and Ten Years Ago
% of Total % of TotalManufacturing:
Wood and Lumber 1,023 1,554Metals 3,455 3,278Food 1,928 1,608Rubber/Plastic 2,117 2,400Computer and Electronic Equipment/Instruments 28,390 27,046Machinery 4,275 3,635Other 7,315 7,923
Total Manufacturing 48,503 17% 47,444 19%Trade, Transportation, and Utilities:
Wholesale Trade 13,359 17,727Retail Trade 31,139 29,912Transportation and Utilities 4,567 3,843
Total Trade, Transportation, and Utilities 49,065 17% 51,482 21%Information:
Publishing 2,986 3,734Telecommunications 2,216 2,122Other (broadcasting, ISP's, etc.) 2,236 2,088
Total Information 7,438 3% 7,944 3%Financial Activities:
Finance and Insurance 10,699 10,667Real Estate 3,698 3,803
Total Financial Activities 14,397 5% 14,470 6%Professional and Business Services 54,004 19% 35,073 14%Construction 14,806 5% 15,508 6%Educational Services 5,160 2% 4,463 2%Healthcare and Social Assistance 28,036 10% 21,165 8%Leisure and Hospitality 25,593 9% 20,235 8%Other Services (agriculture, repairs, private homes, misc.) 13,228 5% 11,723 5%Government (federal, state, and local) 22,949 8% 21,168 8%
TOTAL EMPLOYMENT 283,179 100% 250,675 100%
* Fiscal Year 2017 information includes data through 12/31/16
Source: Oregon Employment Department Labor Market Information System (OLMIS)
Annual Average 2017 * 2008
Annual Average

OPERATING

CLEA
N W
ATER
SER
VICE
S (A
Com
pone
nt U
nit o
f Was
hing
ton
Coun
ty, O
rego
n)Ad
min
istr
ativ
e, S
uppo
rt a
nd O
pera
tiona
l Sta
ff F
TELa
st T
en F
isca
l Yea
rs
Fisc
al y
ear
ende
dJu
ne 3
0N
umbe
rPe
rcen
tN
umbe
rPe
rcen
tN
umbe
rPe
rcen
tN
umbe
rPe
rcen
tN
umbe
rPe
rcen
t
2017
3611
%49
15%
198
59%
5516
%33
810
0%20
1635
11%
4915
%19
760
%49
15%
330
100%
2015
3611
%49
15%
191
60%
4414
%32
010
0%20
1435
11%
5016
%18
760
%41
13%
313
100%
2013
3110
%57
18%
192
62%
3210
%31
110
0%20
1234
11%
5217
%18
157
%49
15%
316
100%
2011
4013
%53
17%
175
55%
4815
%31
610
0%20
1042
13%
4915
%17
856
%49
16%
319
100%
2009
4213
%49
15%
178
56%
4916
%31
910
0%20
0838
12%
4916
%17
256
%48
16%
308
100%
Sour
ce:
Dist
rict r
ecor
ds
90
Adm
inis
trat
ive
staf
fTo
tal s
taff
Supp
ort s
taff
Ope
ratio
ns st
aff
Capi
tal s
taff

CLEA
N W
ATER
SER
VICE
S (A
Com
pone
nt U
nit o
f Was
hing
ton
Coun
ty, O
rego
n)
Sum
mar
y of
Tre
atm
ent P
lant
Cap
aciti
esFi
scal
Yea
r End
ing
June
30,
201
7
Annu
alAv
erag
eD
ry w
eath
erAv
erag
eW
et w
eath
erav
erag
edr
y w
eath
erde
sign
wet
wea
ther
desi
gnPe
ak d
ayPe
ak d
esig
nflo
w (M
GD
)flo
w (M
GD
)ca
paci
ty (M
GD
)1
flow
(MG
D)
capa
city
(MG
D)
1flo
w (M
GD
)flo
w (M
GD
)2
Durh
am28
.2
22
.0
33
.0
34
.4
49
.0
87
.5
14
0.0
Rock
Cre
ek43
.6
34
.5
45
.0
52
.6
70
.0
12
4.0
15
0.0
Fore
st G
rove
5.5
4.
3
8.0
6.
7
20.0
22.5
20.0
Hills
boro
5.2
4.
0
—
6.
4
16.0
17.5
16.0
Dist
rict t
otal
s82
.5
64
.8
86
.0
10
0.1
15
5.0
25
1.5
32
6.0
MG
D –
Mill
ion
Gal
lons
Per
Day
1Th
e de
sign
capa
city
stat
istic
s rep
ort s
yste
m fl
ows t
hat a
re tr
eate
d in
the
plan
ts a
nd re
flect
per
mit
requ
irem
ents
bas
ed o
n th
e tim
e of
the
year
.Th
e Di
stric
t ope
rate
s und
er se
para
te p
erm
its fo
r the
dry
wea
ther
and
wet
wea
ther
seas
ons.
The
dry
wea
ther
seas
on h
as m
ore
rest
rictiv
e pe
rmit
requ
irem
ents
and
requ
ires h
ighe
r qua
lity
trea
tmen
t of f
low
s. T
his r
esul
ts in
low
er sy
stem
cap
acity
in d
ry w
eath
er m
onth
s as c
ompa
red
to w
et w
eath
erca
paci
ty.
The
Fore
st G
rove
and
Hill
sbor
o tr
eatm
ent p
lant
s are
clo
sed
and
non-
perm
itted
dur
ing
the
dry
wea
ther
seas
on a
nd fl
ows a
re d
iver
ted
toRo
ck C
reek
.2
The
peak
des
ign
flow
refle
cts m
axim
um h
ydra
ulic
flow
thro
ugh
the
plan
ts.
Thes
e flo
ws m
ay n
ot b
e fu
lly tr
eate
d.
Sour
ce-D
istric
t rec
ords
Plan
t
91

CLEA
N W
ATER
SER
VICE
S(A
Com
pone
nt U
nit o
f Was
hing
ton
Coun
ty, O
rego
n)
Ope
ratin
g an
d Ca
pita
l Ind
icat
ors
Last
Ten
Fis
cal Y
ears
Fisc
al Y
ear
2017
2016
2015
2014
2013
2012
2011
2010
2009
2008
Was
tew
ater
Tre
atm
ent
Num
ber o
f Tre
atm
ent P
lant
s4
44
44
44
44
4N
umbe
r of P
ump
Stat
ions
4240
4040
4041
4141
4040
Dry
Wea
ther
Des
ign
Capa
city
(MGD
)86
7878
7875
7571
.371
.371
.371
.3Av
erag
e Dr
y W
eath
er F
low
(MGD
)64
.855
.553
.355
.556
.354
.156
.456
.751
.953
.1U
nuse
d ca
paci
ty(m
illio
ns o
f gal
lons
)21
2325
2319
2115
1519
18Pe
rcen
tage
of c
apac
ity u
tilize
d75
%71
%68
%71
%75
%72
%79
%80
%73
%74
%
Conv
eyan
ce S
yste
ms
Num
ber o
f Sys
tem
Dev
elop
men
t per
mits
8099
8478
5934
2544
5492
Num
ber o
f Con
nect
ions
1,41
01,
593
1,17
61,
033
793
804
640
703
663
1,00
4To
tal m
iles o
f sew
er li
ne85
183
883
984
083
283
782
681
179
679
1To
tal m
iles o
f sto
rm w
ater
line
529
516
495
503
491
490
487
474
469
464
Dist
rict-
Wid
eEs
timat
ed N
umbe
r of E
DU's
serv
iced
295,
214
289,
821
285,
495
281,
670
277,
032
271,
223
269,
130
267,
237
264,
540
261,
305
Oth
er P
rogr
ams
Rive
r Ran
gers
pro
gram
#
of S
tude
nts
3,29
52,
620
2,02
43,
673
4,25
83,
251
3,78
73,
883
3,72
54,
071
#
of S
choo
ls42
3833
4958
4754
4041
48St
orm
dra
in S
tenc
iling
#
of d
rain
s ste
ncile
d41
334
693
610
560
31,
191
1,11
31,
338
1,47
71,
049
N/A
- in
form
atio
n no
t ava
ilabl
eM
GD -
Mill
ion
Gallo
ns P
er D
ayED
U -
Equi
vale
nt D
wel
ling
Uni
t
Sour
ce-D
istric
t Rec
ords
92
COMPLIANCE
REPORT

93
Report of Independent Auditors on Compliance and Internal Control Over Financial Reporting Based on an Audit of Financial Statements Performed in Accordance with Oregon Auditing Standards The Board of Directors Clean Water Services (A component unit of Washington County, Oregon) Hillsboro, Oregon We have audited the accompanying financial statements of the Clean Water Services, a component unit of Washington County, Oregon (the District), as of and for the year ended June 30, 2017, and have issued our report thereon dated December 12, 2017. We conducted our audit in accordance with auditing standards generally accepted in the United States of America. Those standards require that we plan and perform the audit to obtain reasonable assurance about whether the financial statements are free of material misstatement. Compliance
As part of obtaining reasonable assurance about whether the District’s financial statements are free of material misstatement, we performed tests of its compliance with certain provisions of laws, regulations, contracts and grants, including provisions of Oregon Revised Statutes as specified in Oregon Administrative Rules (OAR) 162-010-000 to 162-010-330, as set forth below, noncompliance with which could have a direct and material effect on the determination of financial statement amounts:
The accounting records and related internal control over financial reporting. The amount and adequacy of collateral pledged by depositories to secure the deposit of
public funds. The requirements relating to debt. The requirements relating to budgeting. The requirements relating to insurance and fidelity bond coverage. The appropriate laws, rules, and regulations pertaining to programs funded wholly or
partially by other governmental agencies. The statutory requirements pertaining to the investment of public funds. The requirements pertaining to the awarding of public contracts and the construction of
public improvements. The results of our tests disclosed no matters of noncompliance with those provisions that are required to be reported under Minimum Standards for Audits of Oregon Municipal Corporations, prescribed by the Secretary of State. However, providing an opinion on compliance with those provisions was not an objective of our audit and, accordingly, we do not express such an opinion.

94
Internal Control Over Financial Reporting
In planning and performing our audit, we considered the District’s internal control over financial reporting as a basis for determining our auditing procedures for the purpose of expressing our opinion on the financial statements, but not for the purpose of expressing an opinion on the effectiveness of the District’s internal control over financial reporting. Accordingly, we do not express an opinion on the effectiveness of the District’s internal control over financial reporting. A control deficiency exists when the design or operation of a control does not allow management or employees, in the normal course of performing their assigned functions, to prevent or detect misstatements on a timely basis. A significant deficiency is a control deficiency, or combination of control deficiencies, that adversely affect the District’s ability to initiate, authorize, record, process, or report financial data reliably in accordance with generally accepted accounting principles such that there is more than a remote likelihood that a misstatement of the District’s financial statements that is more than inconsequential will not be prevented or detected by the District’s internal controls. A material weakness is a significant deficiency, or combination of significant deficiencies, that results in more than a remote likelihood that a material misstatement of the financial statements will not be prevented or detected by the District’s internal control. Our consideration of the internal control over financial reporting was for the limited purpose described in the first paragraph of this section and would not necessarily identify all deficiencies in internal control that might be significant deficiencies or material weaknesses. We did not identify any deficiencies in internal control over financial reporting that we consider to be material weaknesses as defined above. Purpose of this Report
This report is intended solely for the information and use of the District’s management, the Board of Directors, and the Secretary of State, Division of Audits of the State of Oregon and is not intended to be and should not be used by anyone other than these specified parties. Julie Desimone, Partner for Moss Adams, LLP December 12, 2017