Embed Size (px)
Citation preview


Comprehensive Annual Financial Report
For The
Virginia Biotechnology Research Partnership Authority
A Component Unit of the Commonwealth of Virginia
For The Fiscal Year Ended
June 30, 2015
Prepared by the Director of Business Development and Administration of the
Virginia Biotechnology Research Partnership Authority


TABLE OF CONTENTS VIRGINIA BIOTECHNOLOGY RESEARCH PARK
INTRODUCTORY SECTION 1-6
LETTER FROM THE EXECUTIVE DIRECTOR 3-4
BOARD OF DIRECTORS 5
FINANCIAL SECTION 7-44
MANAGEMENT’S DISCUSSION AND ANALYSIS 9-14
FINANCIAL STATEMENTS 15-18
STATEMENT OF NET POSITION 15
STATEMENT OF REVENUES, EXPENSES, AND CHANGE IN NET POSITION 16
STATEMENT OF CASH FLOWS 17-18
NOTES TO THE FINANCIAL STATEMENTS 19-44
REQUIRED SUPPLEMENTARY INFORMATION 45-48
SCHEDULE OF CHANGES IN NET PENSION LIABILITY AND RELATED RATIOS 46
SCHEDULE OF EMPLOYER CONTRIBUTIONS 47
NOTES TO REQUIRED SUPPLEMENTARY INFORMATION 48
INDEPENDENT AUDITOR’S REPORT 49
REPORT ON FINANCIAL STATEMENTS 50-52


INTRODUCTORY SECTION


3
October 2015
Dear Authority and Corporation Boards and Stakeholders:
Over the course of the 2014-15 fiscal year, many changes have been implemented, partnerships
have been strengthened and created, and the Virginia Biotechnology Research Partnership
Authority and Research Park are moving forward as an innovation leader in the Richmond region
and Commonwealth at large.
The Research Park’s Shared Lab opened in the fall of 2014 and is a story of partnerships.
Generous donations of lab equipment from Altria’s Center for Research and Technology have
allowed Biotech Center companies to reduce costs and save significant amounts of time, as
processes are shortened from hours to minutes. In addition, the Shared Lab allows for increased
collaboration amongst our research scientists in the Research Park. The Shared Lab is not only a
resource for the resident businesses but also for life sciences companies outside of the Research
Park footprint.
The Research Partnership Authority restructured and strengthened our affiliation with the
Dominion Resources Innovation Center in the Town of Ashland in Hanover County. This
partnership allows for more focus on research, development and commercialization at the Center
with the administrative functions being handled by the Authority.
In addition to growing our partnerships, we have expanded the reach of our programming. The
Research Park has transformed our scientific luncheon series to be a broader luncheon series
highlighting all forms of innovation happening in the Richmond region in addition to our life
science focus. Some examples of topics covered by the #innovateinRVA series include the
science of craft brewing, an update on the new Institute for Contemporary Art at VCU, the story
of former Biotech Center company kaléo from Authority Board member Eric Edwards, and how
biotech startup, C3 Nexus, is revolutionizing the healthcare industry using patient-generated
data. Other new events including food trucks coming twice per month and our Perk in the Park –
a monthly coffee and networking event – provide opportunities for residents to interact in a more
social setting. Our inclusive approach to community is another example of how we are
strengthening relationships within the Research Park.
The Research Park was a key sponsor and involved in the planning of the statewide THRIVE
conference for the Virginia Biotechnology Association in April and serves as a member of the
Virginia Beach Biomedical and Healthcare Task Force. These organizations are instrumental in
moving the region, and the Commonwealth, forward in the area of life sciences.
We continue to strengthen our great partnership with Virginia Commonwealth University in a
number of ways. In September 2014, the capabilities of the conference room were upgraded
significantly and we were able to save $60,000 by leveraging our partnership with VCU. Dr.
Rao committed $1.2 million in matching funds for startups, demonstrating the university’s belief
in the goals of the Research Park and the rebranded Innovation Council (Virginia Biotechnology
800 East Leigh Street – Richmond, Virginia – 23219 www.vabiotech.com
4
Research Park Corporation). The Research Park is also working with VCU’s Innovation
Gateway and their pre-accelerator program aimed at helping students make their business ideas a
reality. Finally, we have been the customer to a VCU entrepreneurship class – mapping the
resources in the region’s innovation ecosystem. The end product will be a tool that can be
leveraged by the entire community.
Perhaps our biggest accomplishment this year is the rebranding of the Virginia Biotechnology
Research Park Corporation as The Innovation Council completing the strategic vision adopted in
the prior fiscal year. The transition was approved during the June 2015 meeting of the Boards
with the Council being a forum for collaboration and coordinated innovation activities amongst
stakeholders in the Region. The role of the Innovation Council of the Research Park Corporation
is:
To set goals and metrics in innovation for the Region and monitoring progress toward
goals.
To identify gaps in the innovation ecosystem and lead efforts to identify sources to fill
gaps in the Region.
To identify gaps in capital requirements and leading effort to provide the financial means
to sustain a successful innovation ecosystem.
To craft a message for marketing organizations at the local, regional and statewide level
of innovation excellence to help in recruitment, retention and expansion.
As we take a step back to our journey we began with the adoption of a new strategic vision in
June 2014, we have put ourselves in a more competitive and compelling position. We have
strengthened our partnerships and relationships in the region and the Commonwealth, and we are
creating a greater sense of community within the Research Park. The market is responding – it is
invigorating and exciting.
Regards,
Carrie Roth
Executive Director
Virginia Biotechnology Research Partnership Authority
800 East Leigh Street – Richmond, Virginia – 23219 www.vabiotech.com

5
VIRGINIA BIOTECHNOLOGY RESEARCH PARTNERSHIP AUTHORITY As of June 30, 2015
Board of Directors
Michael Rao, Ph.D., Ex-Officio and Chair Mary C. Doswell, Vice Chair
Ken Ampy Gail Letts Eric Edwards, M.D., Ph.D. Tonya Mallory Douglas E. Harvey
The Hon. Dwight C. Jones, Ex Officio The Hon. Maurice Jones, Ex Officio
Executive Director Carrie Roth
Officers to the Board Samuel B. Hunter M.D., Secretary to the Board
Joy P. Edgett, Treasurer Sara Maddox, Assistant Secretary to the Board
VIRGINIA BIOTECHNOLOGY RESEARCH PARK CORPORATION As of June 30, 2015
Board of Directors
Michael Rao, Ph.D., Ex-Officio and Chair Charles H. Foster, Jr., Vice Chair Samuel B. Hunter, M.D., Secretary
Donna Owens Cox Carlton E. Miller, M.D. Ed A. Grier James. A. Strickland, Ph.D. Cecil R. “Rhu” Harris, Jr. William “Sandy” White Douglas E. Harvey Patricia M. Woolsey Francis L. Macrina, Ph.D.
The Honorable Dwight C. Jones, Ex Officio The Honorable Maurice Jones, Ex Officio
James J. L. “Jay” Stegmaier, Ex Officio John A. Vithoulkas, Ex Officio
President and CEO Carrie Roth
Officers to the Board Joy P. Edgett, Treasurer
Sara Maddox, Assistant Secretary to the Board


FINANCIAL SECTION


9
MANAGEMENT’S DISCUSSION AND ANALYSIS
Our discussion and analysis of the Virginia Biotechnology Research Partnership Authority’s (“the
Authority”) financial performance provides an overview of the financial activities for the fiscal year
ending June 30, 2015. Please read it in conjunction with the Authority’s financial statements and notes
to financial statements.
About the Authority
The Authority is a political subdivision of the Commonwealth of Virginia created pursuant to
Chapter 946, 1993 Virginia Acts of Assembly, as amended by Chapter 731, 2000 Acts of Assembly and
Chapter 788, 2005 Acts of Assembly. The mission of the Authority is to advance life sciences by
promoting scientific research and economic development through the attraction and creation of new
jobs and companies. In order to facilitate and coordinate scientific and technological research and
development, the Authority promotes the industrial and economic development of the Virginia
Biotechnology Research Park (Research Park) and the Commonwealth, and also has authority for
financing construction through bonds and other authorized means. The Research Park is a life sciences
community adjacent to the Virginia Commonwealth University (VCU) Medical Center―housing private
sector companies, research institutes, non-profits, and state and federal laboratories on a 34-acre
campus in downtown Richmond, Virginia. The Research Park has also developed partnerships with
neighboring Chesterfield, Hanover and Henrico Counties to expand its 34-acre downtown campus to
extend the reach of the Research Park for sites that may accommodate larger companies on suburban
campuses in the Greater Richmond area. The Dominion Resources Innovation Center located in the
Town of Ashland is an affiliate of the Research Park. The staff of the Authority manages the daily
operations of the Research Park.
The Virginia Biotechnology Research Park Corporation (Corporation) is an Internal Revenue Code
Section 501-c-3 corporation, and is organized and operated exclusively for scientific, educational and
charitable purposes. The Authority and the Corporation have a financial and operational relationship
requiring the Corporation’s financial statements be blended into the Authority’s financial statements
(Blended Component Unit). Condensed combining statements are presented in the notes to the
financial statements.
The Authority does not have taxing powers. Operations are funded from lease and ancillary
service revenues. Bond issuances, long-term notes payable, line of credit debt, appropriations from the
Commonwealth, voluntary assessments from property owners located in the Research Park and contract
support payments from VCU have funded both the operations and the acquisition and construction of
capital assets. The Research Park, as of June 30, 2015, is home to 60 private and non-profit companies,
state and federal laboratories, and research institutes/administrative functions of VCU and the VCU

10
Health System, filling nearly 1,100,000 square feet of laboratory and office space in seven buildings and
employing approximately 2,400 researchers, scientists, engineers and support personnel.
Overview of Annual Financial Statements
Management’s Discussion and Analysis (MD&A) serves as an introduction to the basic financial
statements. The MD&A represents management’s examination and analysis of the financial condition
and performance of the Authority. The financial statements of the Authority are presented using the
accrual method of accounting. Because not all the information was available to restate FY 2014
statements due to the effect of the implementation of GASB 68 the changes have been reflected in the
2015 statements. The financial statements themselves consist of the Statement of Net Position,
Statement of Revenues, Expenses, and Changes in Net Position, the Statement of Cash Flows, and Notes
to the Financial Statements.
The Statement of Net Position presents the financial position of the Authority including
information about the type and amount of resources and obligations on June 30, 2015. The Statement
of Revenues, Expenses, and Changes in Net Position present the results of the Authority’s operating and
non-operating activities and provide information as to changes to the net position. The Statement of
Cash Flows presents changes in cash and cash equivalents, as a result of operational, non-operational,
and financing activities.
The Notes to the Financial Statements provide required disclosures and other pertinent
information necessary to provide a reader of the financial statements a complete understanding of the
data being presented. The notes are comprised of information about the Authority’s accounting
policies, significant account balances, obligations, commitments, contingencies, and subsequent events.
CONDENSED FINANCIAL INFORMATION
Statement of Net Position
The Statement of Net Position presents the financial position of the Authority at the end of the
fiscal year. The statement includes all assets and liabilities of the Authority. Net position is an indicator
of the current fiscal health of the organization and the Authority’s financial position over time.
A condensed summary of the Authority’s assets, liabilities, and net position at June 30, 2015 and
2014 are as follows:

11
The Authority’s total assets decreased six percent due mainly to payments received on the lease
receivable. Total liabilities decreased eleven percent from scheduled payment made toward the
outstanding bond. The total assets and deferred outflows of resources of the Authority exceeded
liabilities by $13 million.
Statement of Revenues, Expenses, and Changes in Net Position
All of the current year’s revenues and expenses are accounted for in the Statement of Revenues,
Expenses, and Changes in Net Position. This statement measures the success of the Authority’s
operations and can be used to determine whether the Authority’s fiscal condition has improved or
worsened during the year. A summary of the Authority’s revenues, expenses, and changes in net
position for the years ended June 30, 2015 and 2014 are as follows:
Percentage Value of Of
2015 2014 Change Change
Assets:
Current and other assets 38,584,389$ 41,111,269$ (2,526,880)$ (6%)
Capital assets, net 3,433,321 3,454,196 (20,875) (1%)
Total assets 42,017,710 44,565,465 (2,547,755) (6%)
Deferred outflows of resources:
Deferred pension contributions 23,634 - 23,634 100%
Deferred amount on refunding 1,688,821 1,939,017 (250,196) (13%)
Total deferred outflows of resources 1,712,455 1,939,017 (226,562) (12%)
Liabilities:
Current and other liabilities 3,945,602 3,828,392 117,210 3%
Long-term liabilities 26,759,452 30,623,392 (3,863,940) (13%)
Total liabilities 30,705,054 34,451,784 (3,746,730) (11%)
Deferred inflows of resources:
Deferred pension investment experience 117,556 - 117,556 100%
Net position:
Net investment in capital assets 3,433,321 3,454,196 (20,875) (1%)
Restricted for pensions 396,470 - 396,470 100%
Restricted for donor purposes 32,063 - 32,063 100%
Unrestricted 9,045,701 8,598,502 447,199 5%
Total net position 12,907,555$ 12,052,698$ 854,857$ 7%
Statement of Net Position, as of June 30, 2015 and 2014

12
Operating revenues increased seven percent from the prior fiscal year due to new revenue
generated from Business support services and program revenues and contributions. Operating
expenses decreased twenty-three percent from the prior fiscal year due mainly to the decrease in
salary expense and professional fees.
Statement of Cash Flows
The Statement of Cash Flows provides information about the Authority’s cash receipts, cash
payments, and net changes in cash resulting from operations, investing and financing activities and
Percentage
Value of Of
Change Change
Operating revenues:
Rental income 312,327$ 307,135$ 5,192$ 2%
Parking income 340,805 323,851 16,954 5%
Development fee 17,625 19,125 (1,500) (8%)
Assessment fee 291,576 296,898 (5,322) (2%)
Business support services 18,447 - 18,447 100%
Program revenues and contributions 57,082 - 57,082 100%
Other income 13,619 31,640 (18,021) (57%)
Total operating revenues 1,051,481 978,649 72,832 7%
Operating expenses:
Salaries and benefits 519,194 654,129 (134,935) (21%)
Marketing and promotion 64,373 69,413 (5,040) (7%)
Occupancy costs 91,616 108,659 (17,043) (16%)
Administrative 106,459 195,775 (89,316) (46%)
Depreciation expense 57,535 56,500 1,035 2%
Bad debt expense - 1,538 (1,538) (100%)
Total operating expenses 839,177 1,086,014 (246,837) (23%)
Operating income (loss) 212,304 (107,365) 319,669 (298%)
Non-operating revenues and expenses 375,678 1,643,596 (1,267,918) (77%)
Change in net position 587,982 1,536,231 (948,249) (62%)
Net position - beginning of year 12,319,573 10,516,467 1,803,106 17%
Net position - end of year 12,907,555$ 12,052,698$ 854,857$ 7%
Statement of Revenues, Expenses, and Changes in Net Position
for the years ended June 30, 2015 and 2014
2015 2014
13
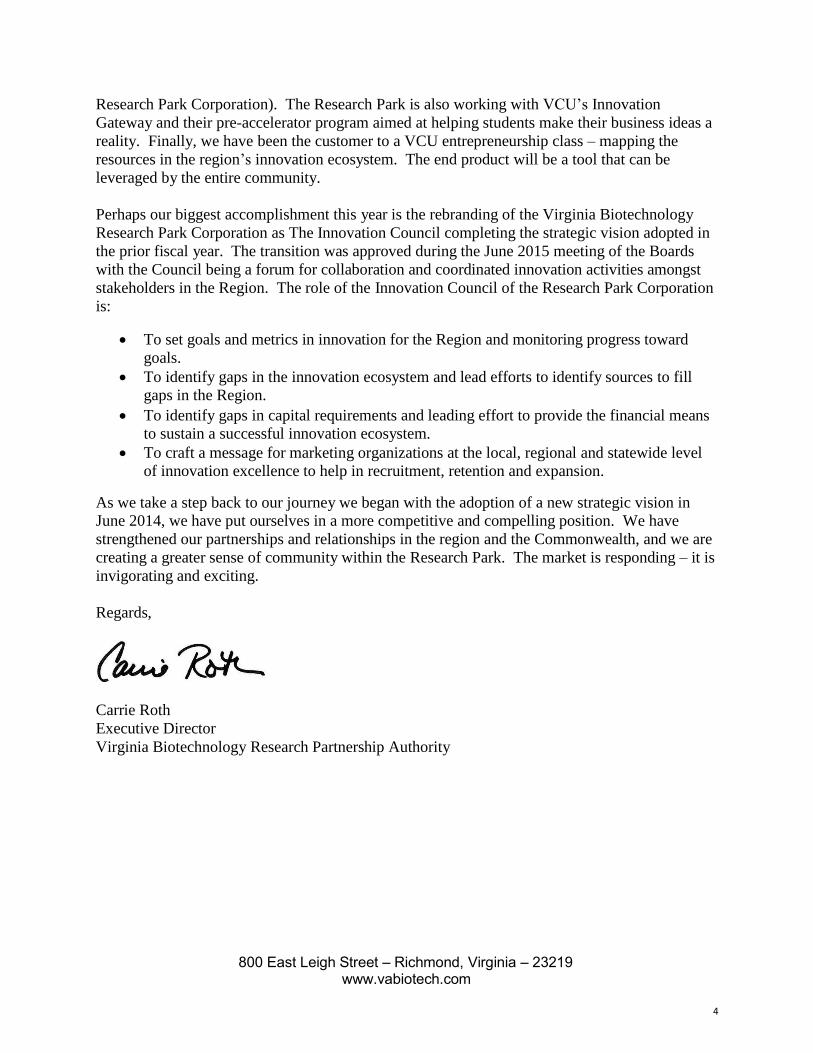
provides answers to such questions as where cash came from, what was it used for, and what was the
change in cash balance during the reporting period.
The Authority’s available cash and cash equivalents increased from $3.0 million at the end of
2014 to $3.7 million at the end of 2015.
CAPITAL ASSETS AND DEBT ADMINISTRATION
Capital Assets
The Authority’s investment in capital assets as of June 30, 2015, amounted to $3.4 million (net
of accumulated depreciation). This investment in capital assets primarily includes land and equipment.
Long-Term Debt
Bonds
At June 30, 2015, the Authority had $26.7 million in long-term bond debt, excluding current
maturities.
The Authority’s Lease Revenue Refunding bonds were issued in 2009 for $36.7 million. Proceeds
were used to refund a portion of the Authority’s Lease Revenue bonds issued in 2001, which were paid
in full fiscal year 2012. The 2009 bonds carry an AA+ rating from Standard and Poor’s, Aa1 rating from
Moody’s Investor Services and AA+ rating from Fitch Rating, Inc. The balance excluding current
maturities at June 30, 2015, was $26.7 million.
In 2002, the Authority issued Variable Rate Revenue Bonds in the amount of $12 million for the
construction of Biotech Seven. The 2002 bonds were issued as a conduit to finance construction of the
new national headquarters for the United Network for Organ Sharing (UNOS) and as such the Authority
does not have a financial obligation and does not carry a balance on the financial statements. The
bonds carry a Standard and Poor’s rating of A+/A-1.
2015 2014
Cash flows from operating activities 210,878$ (127,413)$
Cash flows from non-capital financing activities 361,879 554,604
Cash flows from capital and related financing activities 148,797 (753,052)
Net increase in cash and cash equivalents 721,554 (325,861)
Beginning of year 3,021,553 3,347,414
End of year 3,743,107$ 3,021,553$
Condensed Statement of Cash Flows
for the years ended June 30, 2015 and 2014

14
In 2006, the Authority served as the conduit for issuing $14 million in tax-exempt variable rate
revenue bonds to finance the construction of new facilities for Virginia Blood Services (VBS) in Henrico
County, Virginia. The bonds were secured by pledge payments from VBS and ASTREA, the parent
company of VBS and were secured by a letter of credit issued by Sun Trust Bank. The Bonds were
defeased during fiscal year 2013.
During 2013, the Authority served as the conduit for issuing $15,000,000 variable rate revenue
bonds to assist the Institute for Transfusion Medicine (ITxM) in connection with the transfer to ITxM of
the sole corporate membership interest in VBS. The bonds are secured by a bond trust indenture and
are payable solely from payments made by the borrower under the loan agreement.
Other Debt
During fiscal year 2014, the Authority paid off in full its revolving line of credit with SunTrust
bank. At June 30, 2015, the $2.5M line of credit is still available to the Authority.
CONTACTING THE AUTHORITY’S FINANCIAL MANAGEMENT
This financial report is designed to provide citizens, customers, investors, and creditors with a
general overview of the Authority’s finances and to show the Authority’s accountability for the money
we receive. If you have any questions about this report or need additional financial information, please
contact the Authority’s Director of Business Development and Administration at 800 East Leigh Street,
Richmond, VA 23219, (804) 828-0963.

15
VIRGINIA BIOTECHNOLOGY RESEARCH PARTNERSHIP AUTHORITYSTATEMENT OF NET POSITIONAs of June 30, 2015
ASSETSCurrent assets:
Cash and cash equivalents (Note 1 & 2) 731,509$ Cash with Local Government Investment Pool (Note 2) 3,011,598 Accounts receivable, net of allowance for doubtful accounts of $-0- 28,786 Prepaid expenses 2,278 Net investment in lease receivable - current portion (Note 5) 3,525,000
Total current assets 7,299,171
Non-current assets, net of depreciation:Net investment in lease receivable (Note 5) 24,725,000 Net Pension Asset (Note 10) 396,470 Investment in Biotech 8, LLC (Note 14) 530,227 Investment in Bioling, LLC (Note 14) 21,960 Investment in other partnerships (Note 14) 55,625 Commonfund Investments (Note 2) 5,555,936 Non-depreciable capital assets (Note 4) 3,369,446 Depreciable capital assets, net of accumulated depreciation (Note 1 & 4) 63,875
Total non-current assets 34,718,539
Total assets 42,017,710
DEFERRED OUTFLOWS OF RESOURCESDeferred pension contributions (Note 1 & 10) 23,634 Deferred amount on refunding (Note 1) 1,688,821
1,712,455
LIABILITIESCurrent liabilities:
Accounts payable 43,326 Customer deposit 10,985 Unearned revenue 15,375 Long-term debt - current portion (Note 8) 3,875,916
Total current liabilities 3,945,602
Non-current liabilities:Long-term debt (Note 8) 26,742,767 Compensated absences (Note 1 & 8) 16,685
Total non-current liabilities 26,759,452
Total liabilities 30,705,054
DEFERRED INFLOWS OF RESOURCESDeferred pension investment experience 117,556
NET POSITIONNet investment in capital assets 3,433,321 Restricted for pensions 396,470 Restricted for donor purposes 32,063 Unrestricted 9,045,701
Total net position 12,907,555$

16
VIRGINIA BIOTECHNOLOGY RESEARCH PARTNERSHIP AUTHORITY
STATEMENT OF REVENUES, EXPENSES, AND CHANGES IN NET POSITION
For the year ended June 30, 2015
Operating revenues:
Rental income 312,327$
Parking income 340,805
Development Fee 17,625
Assessment Fee 291,576
Business support services 18,447
Program revenues and contributions 57,082
Other income 13,619
Total operating revenues 1,051,481
Operating expenses:
Salaries and benefits 519,194
Marketing and promotion 64,373
Occupancy costs 91,616
Administrative 106,459
Depreciation expense (Note 4) 57,535
Total operating expenses 839,177
Income from operations 212,304
Non-operating revenue/(expenses):
Interest revenue 1,370,150
Interest expense (1,269,430)
Unrealized gain on Commonfund Investments 204,248
Gain from Biotech Eight LLC (Note 14) 507,011
Gain from Bioling LLC (Note 14) 24,349
Loss on Investments (Note 14) (500,000)
HLA Loan Payments (Note 6) 39,350
Total non-operating activity 375,678
Change in net position 587,982
Net position restated- 06/30/14 (Note 1 & 10) 12,319,573
Net position - 06/30/15 12,907,555$

17
VIRGINIA BIOTECHNOLOGY RESEARCH PARTNERSHIP AUTHORITY
STATEMENT OF CASH FLOWS
For the year ended June 30, 2015
Cash flows from operating activities:
Cash received from rent 322,265$
Cash received from parking 332,115
Cash received from assessment program 280,535
Cash received from business support services 18,447
Cash received from development fees 36,750
Cash received from miscellaneous income 13,619
Cash received from donors 30,932
Payments for personnel expenses (554,149)
Payments for marketing expenses (69,769)
Payments for occupancy expenses (87,497)
Payments for administrative expenses (112,370)
Net cash provided by operating activities 210,878
Cash flows from non-capital financing activities:
Distributions received from Biotech 8, LLC 345,119
Distributions received from Bioling, LLC 16,760
Net cash provided by noncapital financing activities 361,879
Cash flows from capital and related financing activities:
HLA payments received 180,858
Purchase of capital assets (32,061)
Net cash provided by capital and related financing activities 148,797
Net increase in cash 721,554
Cash and cash equivalents - 6/30/14 3,021,553
Cash and cash equivalents - 6/30/15 3,743,107$

18
VIRGINIA BIOTECHNOLOGY RESEARCH PARTNERSHIP AUTHORITY
STATEMENT OF CASH FLOWS
For the year ended June 30, 2015
Reconciliation of net operating income (loss) to net cash provided
(used) by operating activities:
Operating income 212,304$
Adjustments to reconcile net income to net cash provided by
operating activities:
Depreciation expense 57,535
Decrease in accounts payable (4,110)
Increase in operating accounts receivable (5,936)
Decrease in customer deposits (1,331)
Decrease in unearned revenue (9,551)
Increase in prepaid expenses (1,937)
Decrease in leave accrual (423)
Increase in net pension asset and related deferred inflows/outflows
of resources (35,673)
Net cash provided by operating activities 210,878$
SUPPLEMENTAL DISCLOSURE OF NONCASH FINANCING AND INVESTING ACTIVITIES
An unrealized gain of $204,248 on the Commonfund Investments was recognized during the year.
The accompanying Notes to Financial Statements are an integral part of this financial statement.
Under the Biotech Six lease agreement, the Department of General Services makes lease payments
directly to the Commonwealth of Virginia, which are applied to the Authority's outstanding lease revenue
bonds. During fiscal year 2015, payments under this agreement resulted in a $3,385,000 reduction in the
Authority's lease receivable and a corresponding reduction in its outstanding debt. The Authority also
recorded non-cash capital lease interest income and bond interest expense of $1,370,150 under this
agreement for the year.
During the year, the Authority purchased $36,660 in fixed assets, $4,600 was included in accounts
payable at 6/30/15.

19
NOTES TO FINANCIAL STATEMENTS
AS OF JUNE 30, 2015
1. SUMMARY OF SIGNIFICANT ACCOUNTING POLICIES
Reporting Entity
The Virginia Biotechnology Research Partnership Authority (Authority), which began operations effective
July 1, 1993, provides a mechanism for financing construction of the Biotechnology Research Park
through bond issuances and other approved means.
The Authority is responsible for developing, leasing, operating, managing, and maintaining the Research
Park properties and grounds, as well as oversight of contractors.
The Authority is a component unit of the Commonwealth and is included in the basic financial
statements of the Commonwealth. A separate report is prepared for the Commonwealth that includes
all agencies, boards, commissions, and authorities over which the Commonwealth exercises or has the
ability to exercise oversight authority.
The accompanying annual financial report includes the financial activities of the Authority, and its component units, which are the Virginia Biotechnology Research Park Corporation (the Corporation) and the Virginia Biosciences Development Center (the Center). The Center had no operating activity during the year and as of June 30, 2015, had no assets or liabilities. Financial information for the Authority and these component units is accounted for in the accompanying financial statements in accordance with principles defining the governmental reporting entity adopted by the Government Accounting Standards Board.
Blended Component Unit
The Virginia Biotechnology Research Park Corporation (the Corporation) is an Internal Revenue Code
Section 501(c)(3) corporation and is organized and operated exclusively for scientific, educational, and
charitable purposes. The Authority and the Corporation have a financial and operational relationship
which requires that the Corporation’s financial statements be blended into the Authority’s financial
statements. Condensed combining financial statements for the Authority and its blended component
unit are presented in Note 3 below.
Basis of Accounting
The financial statements of the Authority have been prepared using the economic resources
measurement focus and the accrual basis of accounting in conformity with generally accepted
accounting principles, which provides that revenues are recorded when earned and expenses are
recorded when incurred.

20
The Authority defines operating revenues as revenue derived from the primary business activities of the
Authority. These activities include the following: 1) lease revenues related to non-capitalized leases
with lease terms of one-year or less; 2) contributed income directly supporting the operations or
advancement of the Research Park; 3) revenue derived from ownership and management of parking
surface lots within the footprint of the Research Park; and 4) assessments and other miscellaneous
revenue sources such as event fees for conference facilities, tenant fax and copying fees, and
expenditure reimbursements that are not related to a specific capital outlay project.
The Authority defines non-operating revenues as revenue derived from capital lease agreements and
capital financing activities such as interest income on funds held in trust accounts and
developer’s/issuer’s fees earned on bond issuances and project development.
Cash and Cash Equivalents
For the purpose of reporting cash flows, the Authority considers all highly-liquid investments purchased
with an original maturity of three months or less to be cash equivalents.
Asset Capitalization and Depreciation Method
Capital assets are generally assets with an initial cost of $2,500 or more and an estimated useful life in
excess of two years. Capital assets are valued at historical costs or estimated historical cost if actual cost
is not available. Capital assets are comprised of land, buildings, equipment, construction-in-progress,
and other improvements. Donated capital assets are carried at market value at the date of contribution.
Accumulated depreciation is reported on the Statement of Net Position. Depreciation is computed on
the straight-line basis over the estimated useful life of the asset ranging from three to 48 years.
Depreciable Capital Assets were evaluated at the beginning of the fiscal year 2005 and determined to
have 40 years of useful life remaining from July 2004 going forward.
Buildings 20-48 years Improvements 5-15 years Equipment 3-20 years Land Non-depreciable assets
The costs for maintenance and repairs are charged to occupancy expense as incurred. When items are
retired or otherwise disposed of, the related costs and accumulated depreciation are eliminated from
the accounts and any resulting profit or loss on such dispositions is reflected in non-operating activities.
Long-Term Obligations
Long-term obligations are reported as liabilities in the Statement of Net Position. In accordance with
paragraph 146 of GASB Statement No. 34, bond premiums and discounts are deferred and amortized
over the life of the bonds using the effective interest method. Bonds payable are reported net of the
applicable bond premium or discount. The Authority elected to apply this policy prospectively
beginning July 1, 2004.

21
Compensated Absences
Compensated absences represent the amounts of paid time off (PTO) hours earned by employees, but
not taken at June 30, 2015. PTO combines traditional vacation and sick leave and accrues based on
employee’s years of service. The amount reflects all earned PTO and related payroll taxes to be paid
under the Authority’s leave pay out policy upon employment termination.
Interest Income
Interest income and expense from operating and Local Government Investment Pool accounts are
recorded as operating revenue. Interest income and administrative fees related to the bond accounts
are recorded as non-operating revenue.
Unamortized Deferred Amount on Refunding
The deferred amount on refunding, resulting from the advance refunding of a portion of the Series 2006
Revenue Bonds, is being amortized on a straight-line basis over the life of the Series 2009 Bond. The
amortization of $250,196 is included in interest expense for fiscal year 2015.
Pensions
For purposes of measuring the net pension asset, deferred outflows of resources, and deferred inflows
of resources related to pensions, and pension expense, information about the fiduciary net position of
the Political Subdivision’s Retirement Plan and the additions to/deductions from the Political
Subdivision’s Retirement Plan’s net fiduciary position have been determined on the same basis as they
were reported by the Virginia Retirement System (VRS). For this purpose, benefit payments (including
refunds of employee contributions) are recognized when due and payable in accordance with the
benefit terms. Investments are reported at fair value.
GASB Accounting Pronouncement
The Authority implemented GASB Statement No. 68, Accounting and Financial Reporting for Pensions –
An Amendment of GASB Statement No. 27 (“GASB No. 68”) and GASB Statement No. 71, Pension
Transition for Contributions Made Subsequent to the Measurement Date – an amendment of GASB
Statement No. 68 (“GASB No. 71”) during fiscal year 2015. GASB No. 68 provides accounting and
financial reporting guidance for measuring and recognizing liabilities, deferred outflows of resources,
and deferred inflows of resources, and expense/expenditures related to pensions and related
disclosures. GASB No. 71 provides accounting and financial reporting guidance for contributions, if any,
made by the employer to a defined benefit pension plan after the measurement date of the
government’s beginning net pension liability. The accounting changes required by GASB No. 68 and No.
71 are applied by restating beginning net position as follows:

22
Retrospective Application of a Change in Accounting Principle
2. DEPOSITS AND INVESTMENTS
Deposits
Deposits with banks are covered by the Federal Deposit Insurance Corporation (FDIC) and collateralized
in accordance with the Virginia Security for Public Deposits Act (the “Act”) Section 2.2-4400 et. seq. of
the Code of Virginia. Under the Act, banks and savings institutions holding public deposits in excess of
the amount insured by the FDIC must pledge collateral to the Commonwealth of Virginia Treasury Board.
Financial Institutions may choose between two collateralization methodologies and depending upon that
choice, will pledge collateral that ranges in the amounts from 50% to 130% of excess deposits.
Accordingly, all deposits are considered fully collateralized. Cash with the trustee represents bond
proceeds held by trustees. Other funds of the Authority are invested in the State Treasurer’s Local
Government Investment Pool (LGIP), whose carrying value is equal to the market value.
Investments
Code of Virginia section 2.2-4500 et.seq. authorize local governments and other public bodies to invest
in obligations of the United States or agencies thereof, obligations of the Commonwealth of Virginia or
political subdivisions thereof; obligations of the International Bank for Reconstruction and Development
(World Bank), the Asian Development Bank, and the African Development Bank; “prime quality”
commercial paper and certain corporate notes; banker’s acceptances repurchase agreements; and the
State Treasurer’s Local Government Investment Pool (LGIP).
Concentration of Credit Risk
The Authority places no limit on the amount the Authority may invest in any one issuer. More than 5
percent of the Authority’s investments are in Commonfund Institutional Multi-Strategy Equity Fund, LLC
and Commonfund Institutional Multi-Strategy Bond Fund, LLC. These investments are 65% and 35%,
(As Previously
Reported) (As Adjusted)
June 30, 2014 June 30, 2014
Total assets 44,565,465$ 248,784$ 44,814,249$
Deferred outflows of resources 1,939,017 18,091 1,957,108
Total liabilities 34,451,784 - 34,451,784
Net position
Net investment in capital assets 3,454,196 - 3,454,196
Restricted - 248,784 248,784
Unrestricted 8,598,502 18,091 8,616,593
Total net position 12,052,698$ 266,875$ 12,319,573$
Record Effects
of GASB 68 & 71

23
respectively, of the Authority’s total investments in Commonfund.
Credit Risk
The Commonfund is an external investment pool whose asset portfolio is unrated.
Foreign Currency Risk
The Authority’s exposure to foreign currency risk derives from its holdings of foreign securities and the
use of derivatives to hedge the related foreign currency exposure back to the U.S. dollar. These foreign
securities are part of the holdings included in the Commonfund Institutional Multi-Strategy Equity Fund,
LLC and Commonfund Institutional Multi-Strategy Bond Fund, LLC and represent 16% and 9% of the
fund’s holdings, respectively. The Authority does not have a formal policy to limit foreign currency risk.
3. BLENDED COMPONENT UNIT
The Authority accounts for the Corporation as a blended component unit. Condensed combining
information for the Corporation and the Authority is as follows:
Condensed Combining Statement of Net Position
Current assets
VBRPA VBRPC Total
$ 7,266,108 $ 33,063 $ 7,299,171
Capital assets 3,369,446 - 3,369,446
Other assets 31,349,093 - 31,349,093
Total assets 41,984,647 33,063 42,017,710
Deferred outflows of resources 1,712,455 - 1,712,455
Current liabilities 3,593,686 1,000 3,594,686
Long-term liabilities 27,110,368 - 27,110,368
Total liabilities 30,704,054 1,000 30,705,054
Deferred inflows of resources 117,556 - 117,556
Net investment in capital assets 3,433,321 - 3,433,321
Restricted 396,470 32,063 428,533
Unrestricted 9,045,701 - 9,045,701
Total net position $ 12,875,492 $ 32,063 $ 12,907,555

24
Condensed Combining Statement of Revenues, Expenses, and Changes in Net Position
Operating revenues
VBRPA VBRPC Total
Rental income $ 312,327 $ - $ 312,327
Parking income 340,805 - 340,805
Development fee 17,625 - 17,625
Assessment fee 291,576 - 291,576
Business support services 18,447 - 18,447
Other income 13,619 - 13,619
Program revenues and contributions - 57,082 57,082
Total operating revenues 994,399 57,082 1,051,481
Operating expenses 814,158 25,019 839,177
Operating income (loss) 180,241 32,063 212,304
Nonoperating revenues (expenses)
Interest revenue 1,370,150 - 1,370,150
Interest expense (1,269,430) - (1,269,430)
Net gain on investments 235,608 - 235,608
HLA loan payments 39,350 - 39,350
Total nonoperating revenues 375,678 - 375,678
Change in net position 555,919 32,063 587,982
Beginning net position restated 12,319,573 - 12,319,573
Ending net position $ 12,875,492 $ 32,063 $ 12,907,555
Condensed Combining Statement of Cash Flows
VBRPA VBRPC Total
Net cash provided by operating activities
Net cash provided by non-capital
$ 203,965 $ 6,913 $ 210,878
financing activities 361,879 - 361,879
Net cash provided by capital and related
financing activities 148,797 - 148,797
Net increase in cash 714,641 6,913 721,554
Beginning cash and cash equivalents 3,021,553 - 3,021,553
Ending cash and cash equivalents $ 3,736,194 $ 6,913 $ 3,743,107
25
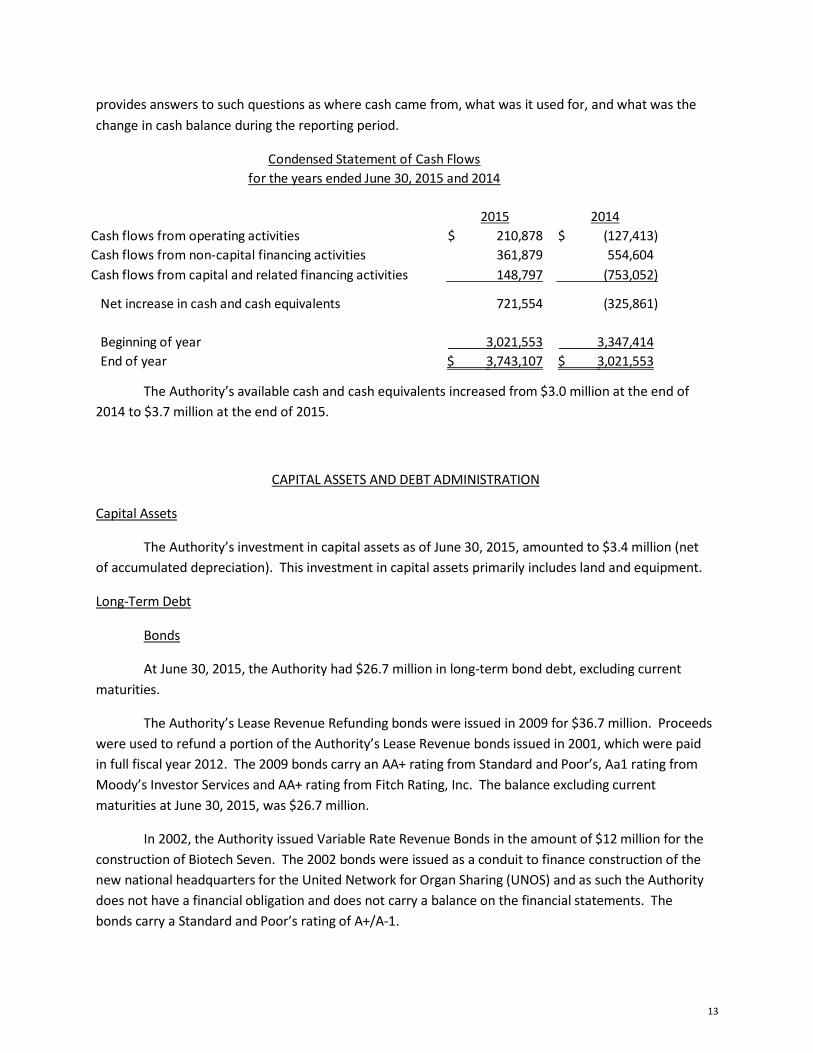
4. PROPERTY, PLANT, AND EQUIPMENT
A summary of changes in the Authority’s Property, Plant, and Equipment for the year ended June 30,
2015, is presented as follows:
Beginning
Balance
Ending
Acquired Deleted Balance
Land $ 3,369,446 $ - $ - $ 3,369,446 Equipment 282,500 36,660 - 319,160
Total at historical cost 3,651,946 36,660 - 3,688,606
Less accumulated depreciation for: Equipment 197,750 57,535 - 255,285
Total accumulated depreciation 197,750 57,535 - 255,285
Capital assets, net $ 3,454,196 $ (20,875) $ - $ 3,433,321
5. LEASE RECEIVABLE
The Authority has a capital lease agreement with the Department of General Services for the Biotech Six
building. The capital lease has a value of $33,287,275 at June 30, 2015, which equals the remaining
principal and interest due on the debt for the Biotech Six building. The financial statements include
unearned income of $5,037,275 related to the capital lease receivable for interest due in future periods.
The following lists the components of the net investment in lease receivable as of June 30, 2015:

26
Current portion:
Minimum lease payments receivable
less: unearned revenue
Current net investment in lease receivable
Non-current portion:
$ 4,756,950
(1,231,950)
3,525,000
At June 30, 2015, lease payments for each of the succeeding fiscal years are as follows:
Year Amount
2016 $ 4,756,950
2017 4,753,150
2018 4,753,550
2019 4,752,500
2020 4,757,750
2021 – 2022 9,513,375
Total lease payments $ 33,287,275
6. BIOTECH EIGHT, LLC HLA LAB RECEIVABLE
The Authority is in partnership with Biotech Eight, LLC, which owns the Biotech Eight building. Effective
May 2008, the Authority advanced funds to the Virginia Commonwealth University Health System in the
amount of $1,188,671 for the build out of their lab located within the Biotech Eight building. The
Virginia Commonwealth University Health System is invoiced $18,085 monthly as additional rent for the
term of the lease, which includes both repayment of the advance and interest over the seven-year life of
the agreement. As of June 30, 2015, the balance was $0 and the entire receivable had been collected.
Minimum lease payments receivable 28,530,325
Less: unearned revenue (3,805,325)
Non-current net investment in lease receivable 24,725,000
Total net investment in lease receivable $ 28,250,000

27
7. CONDUIT DEBT OBLIGATIONS
On April 9, 2002, the Authority issued $12,000,000 in Series 2002 Variable Rate Revenue Bonds to fund
construction of the Biotech Seven project. Biotech Seven is an office and data facility built specifically
for United Network for Organ Sharing (UNOS).
The bonds are secured by a letter of credit and are payable solely from the payments made by the
borrower under the loan agreement. Upon repayment of the bonds, ownership of the facility transfers
to UNOS. The bonds do not constitute a debt or pledge of the faith and credit of the Authority or the
Commonwealth and accordingly have not been reported in the accompanying financial statements.
These bonds have a scheduled maturity date of April 1, 2027.
On October 1, 2006, the Authority issued $14,000,000 in Series 2006 Variable Rate Revenue Bonds to
finance the Virginia Blood Services (VBS) project. The Virginia Blood Services project was issued to
finance the acquisition of land and the construction, equipping, and development of a new 60,000
square foot headquarters facility in Henrico County, including a collection center, a production facility, a
distribution area, and other related improvements. In June 2013, the Authority issued $5,000,000 in
Series 2013B Variable Rate Revenue Bonds, primarily to refund the remaining Series 2006 bonds. The
proceeds from the Series 2013B Bonds were placed in an irrevocable trust with an escrow agent to
provide for all future debt service payments on the Series 2006 bonds. As a result, the Series 2006
bonds are considered to be defeased at June 30, 2014. The Series 2013B bonds are secured by a bond
trust indenture and are payable solely from payments made by the borrower under the loan
agreement. The bonds do not constitute a debt or pledge of the faith and credit of the Authority or
the Commonwealth and accordingly have not been reported in the accompanying financial
statements. These bonds have a scheduled maturity date of October 1, 2028.
On June 1, 2013, the Authority issued $15,000,000 in Series 2013A Variable Rate Revenue Bonds to assist
the Institute for Transfusion Medicine (ITxM) in connection with the transfer to ITxM of the sole
corporate membership interest in VBS. VBS provides blood supply services, including collection, storage,
and distribution of blood to hospitals and other health care providers in the Commonwealth of Virginia,
and conducts related research. The bonds are secured by a bond trust indenture and are payable solely
from payments made by the borrower under the loan agreement. The bonds do not constitute a debt
or pledge of the faith and credit of the Authority or the Commonwealth and accordingly have not been
reported in the accompanying financial statements. These bonds have a scheduled maturity date of
June 1, 2023.
8. NON-CURRENT LIABILITIES
The Authority’s non-current liabilities consist of long-term debt, accrued, and other non-current
liabilities.
Long-term debt of the Authority consists of the following bonds at June 30, 2015:

28
3.00 percent to 5.00 percent Virginia Biotechnology Research Park
Authority Commonwealth of Virginia Lease Revenue Bonds, (Biotech
Six Consolidated Laboratories Project), Series 2009. $ 28,250,000
A summary of changes in the Authority’s non-current liabilities for the year ended June 30, 2015 is
presented as follows:
Beginning Ending Due within
Balance Additions Reductions Balance One Year
Bonds payable:
Commonwealth of Virginia
lease revenue bonds
$31,635,000 $ - $ 3,385,000 $28,250,000 $3,525,000
Unamortized bond premium 2,719,599 - 350,916 2,368,683 350,916
Net bonds payable 34,354,599 - 3,735,916 30,618,683 3,875,916
Compensated absences 17,108 - 423 16,685 -
Total long-term liabilities $34,371,707 $ - $ 3,736,339 $30,635,368 $3,875,916
Long-term debt matures as follows:
9. LINE OF CREDIT
The Authority has a $2,500,000 unsecured revolving line of credit with SunTrust dated November 2012.
The credit line charges interest at the LIBOR market index rate plus 2.00% and matures on September
30, 2015. There were no borrowings under this line at June 30, 2015.
Fiscal year Total Interest Total
2016 3,525,000$ 1,231,950$ 4,756,950$
2017 3,665,000 1,088,150 4,753,150
2018 3,815,000 938,550 4,753,550
2019 3,990,000 762,500 4,752,500
2020 4,200,000 557,750 4,757,750
2021-2022 9,055,000 458,375 9,513,375
Total $ 28,250,000 $ 5,037,275 $ 33,287,275

29
10. DEFINED BENEFIT PENSION PLAN
The Authority contributes to the Virginia Retirement System (VRS), an agent, multiple-employer defined
benefit pension plan administered by the VRS.
Plan Description
All full-time, salaried permanent (professional) employees of the Authority are automatically covered by
VRS Retirement Plan upon employment. This plan is administered by the Virginia Retirement System
(the System) along with plans for other employer groups in the Commonwealth of Virginia. The Political
Subdivision Retirement Plans are an agent, multiple-employer plan. Members earn one month of service
credit for each month they are employed and they and their employer are paying contributions to VRS.
Members are eligible to purchase prior public service, based on specific criteria as defined in the Code of
Virginia, as amended. Eligible prior service that may be purchased includes prior public service, active
military service, certain periods of leave and previously refunded service.
The System administers three different benefit structures for covered employees – Plan 1, Plan 2, and,
Hybrid. Each of these benefit structures has a different eligibility criteria. The specific information for
each plan and the eligibility for covered groups within each plan are set out below:
VRS PLAN 1
About VRS Plan 1
VRS Plan 1 is a defined benefit plan. The retirement benefit is based on a member’s age, creditable
service and average final compensation at retirement using a formula. Employees are eligible for VRS
Plan 1 if their membership date is before July 1, 2010, and they were vested as of January 1, 2013.
Eligible Members
Employees are in VRS Plan 1 if their membership date is before July 1, 2010, and they were vested as of
January 1, 2013.
Hybrid Opt-In Election
VRS non-hazardous duty covered Plan 1 members were allowed to make an irrevocable decision to opt
into the Hybrid Retirement Plan during a special election window held January 1 through April 30, 2014.
The Hybrid Retirement Plan’s effective date for eligible VRS Plan 1 members who opted in was July 1,
2014.
If eligible deferred members returned to work during the election window, they were also eligible to opt
into the Hybrid Retirement Plan.
Members who were eligible for an optional retirement plan (ORP) and had prior service under VRS Plan
1 were not eligible to elect the Hybrid Retirement Plan and remain as VRS Plan 1 or ORP.

30
Retirement Contributions
Employees contribute 5% of their compensation each month to their member contribution account
through a pre-tax salary reduction. Some school divisions and political subdivisions elected to phase in
the required 5% member contribution; all employees will be paying the full 5% by July 1, 2016. Member
contributions are tax-deferred until they are withdrawn as part of a retirement benefit or as a refund.
The employer makes a separate actuarially determined contribution to VRS for all covered employees.
VRS invests both member and employer contributions to provide funding for the future benefit
payment.
Creditable Service
Creditable service includes active service. Members earn creditable service for each month they are
employed in a covered position. It also may include credit for prior service the member has purchased or
additional creditable service the member was granted. A member’s total creditable service is one of the
factors used to determine their eligibility for retirement and to calculate their retirement benefit. It also
may count toward eligibility for the health insurance credit in retirement, if the employer offers the
health insurance credit.
Vesting
Vesting is the minimum length of service a member needs to qualify for a future retirement benefit.
Members become vested when they have at least five years (60 months) of creditable service. Vesting
means members are eligible to qualify for retirement if they meet the age and service requirements for
their plan. Members also must be vested to receive a full refund of their member contribution account
balance if they leave employment and request a refund.
Members are always 100% vested in the contributions that they make.
Calculating the Benefit
The Basic Benefit is calculated based on a formula using the member’s average final compensation, a
retirement multiplier and total service credit at retirement. It is one of the benefit payout options
available to a member at retirement.
An early retirement reduction factor is applied to the Basic Benefit if the member retires with a reduced
retirement benefit or selects a benefit payout option other than the Basic Benefit.
Average Final Compensation
A member’s average final compensation is the average of the 36 consecutive months of highest
compensation as a covered employee.
Service Retirement Multiplier
The retirement multiplier is a factor used in the formula to determine a final retirement benefit. The
retirement multiplier for non-hazardous duty members is 1.7%. The retirement multiplier for sheriffs
and regional jail superintendents is 1.85%. The retirement multiplier of eligible political subdivision
hazardous duty employees other than sheriffs and regional jail superintendents is 1.7% or 1.85% as
elected by the employer.

31
Normal Retirement Age
Age 65. Political subdivisions hazardous duty employees: Age 60.
Earliest Unreduced Retirement Eligibility
Members who are not in hazardous duty positions are eligible for an unreduced retirement benefit at
age 65 with at least five years (60 months) of creditable service or at age 50 with at least 30 years of
creditable service.
Hazardous duty members are eligible for an unreduced retirement benefit at age 60 with at least five
years of creditable service or age 50 with at least 25 years of creditable service.
Earliest Reduced Retirement Eligibility
Members who are not in hazardous duty positions may retire with a reduced benefit as early as age 55
with at least five years (60 months) of creditable service or age 50 with at least 10 years of creditable
service.
Hazardous duty members are eligible for a reduced retirement benefit at age 50 with at least five years
of creditable service.
Cost-of-Living Adjustment (COLA) in Retirement
The Cost-of-Living Adjustment (COLA) matches the first 3% increase in the Consumer Price Index for all
Urban Consumers (CPI-U) and half of any additional increase (up to 4%) up to a maximum COLA of 5%.
Eligibility
For members who retire with an unreduced benefit or with a reduced benefit with at least 20
years of creditable service, the COLA will go into effect on July 1 after one full calendar year
from the retirement date.
For members who retire with a reduced benefit and who have less than 20 years of creditable
service, the COLA will go into effect on July 1 after one calendar year following the unreduced
retirement eligibility date.
Exceptions to COLA Effective Dates
The COLA is effective July 1 following one full calendar year (January 1 to December 31) under
any of the following circumstances:
• The member is within five years of qualifying for an unreduced retirement benefit as of
January 1, 2013.
• The member retires on disability.
• The member retires directly from short-term or long-term disability under the Virginia
Sickness and Disability Program (VSDP).
• The member is involuntarily separated from employment for causes other than job
performance or misconduct and is eligible to retire under the Workforce Transition Act
or the Transitional Benefits Program.

32
• The member dies in service and the member’s survivor or beneficiary is eligible for a
monthly death-in-service benefit. The COLA will go into effect on July 1 following one
full calendar year (January 1 to December 31) from the date the monthly benefit begins.
Disability Coverage
Members who are eligible to be considered for disability retirement and retire on disability, the
retirement multiplier is 1.7% on all service, regardless of when it was earned, purchased or granted.
Most state employees are covered under the Virginia Sickness and Disability Program (VSDP), and are
not eligible for disability retirement.
VSDP members are subject to a one-year waiting period before becoming eligible for non-work related
disability benefits.
Purchase of Prior Service
Members may be eligible to purchase service from previous public employment, active duty military
service, an eligible period of leave or VRS refunded service as creditable service in their plan. Prior
creditable service counts toward vesting, eligibility for retirement and the health insurance credit. Only
active members are eligible to purchase prior service. When buying service, members must purchase
their most recent period of service first. Members also may be eligible to purchase periods of leave
without pay.
VRS PLAN 2
About VRS Plan 2
VRS Plan 2 is a defined benefit plan. The retirement benefit is based on a member’s age, creditable
service and average final compensation at retirement using a formula. Employees are eligible for VRS
Plan 2 if their membership date is on or after July 1, 2010, or their membership date is before July 1,
2010, and they were not vested as of January 1, 2013.
Eligible Members
Employees are in VRS Plan 2 if their membership date is on or after July 1, 2010, or their membership
date is before July 1, 2010, and they were not vested as of January 1, 2013.
Hybrid Opt-In Election
VRS Plan 2 members were allowed to make an irrevocable decision to opt into the Hybrid Retirement
Plan during a special election window held January 1 through April 30, 2014.
The Hybrid Retirement Plan’s effective date for eligible VRS Plan 2 members who opted in was July 1,
2014.
If eligible deferred members returned to work during the election window, they were also eligible to opt
into the Hybrid Retirement Plan.

33
Members who were eligible for an optional retirement plan (ORP) and have prior service under VRS Plan
2 were not eligible to elect the Hybrid Retirement Plan and remain as VRS Plan 2 or ORP.
Retirement Contributions
Employees contribute 5% of their compensation each month to their member contribution account
through a pre-tax salary reduction. Some political subdivisions elected to phase in the required 5%
member contribution but all employees will be paying the full 5% by July 1, 2016. Beginning July 1,
2012, the Authority opted for employees to pay the entire 5% member contribution.
Creditable Service
Same as VRS Plan 1.
Vesting
Same as VRS Plan 1.
Calculating the Benefit
See definition under VRS Plan 1.
Average Final Compensation
A member’s average final compensation is the average of their 60 consecutive months of highest
compensation as a covered employee.
Service Retirement Multiplier
Same as Plan 1 for service earned, purchased or granted prior to January 1, 2013. For non-hazardous
duty members the retirement multiplier is 1.65% for creditable service earned, purchased or granted on
or after January 1, 2013. The retirement multiplier for sheriffs and regional jail superintendents and for
hazardous duty employees is the same as Plan 1.
Normal Retirement Age
Normal Social Security retirement age. Political subdivisions hazardous duty employees: same as Plan
1.
Earliest Unreduced Retirement Eligibility
Members who are not in hazardous duty positions are eligible for an unreduced retirement benefit
when they reach normal Social Security retirement age and have at least five years (60 months) of
creditable service or when their age and service equal 90.
Hazardous duty members are eligible for an unreduced retirement benefit at age 60 with at least five
years of creditable service or age 50 with at least 25 years of creditable service.
Earliest Reduced Retirement Eligibility
Members may retire with a reduced benefit as early as age 60 with at least five years (60 months) of
creditable service.

34
Hazardous duty members are eligible for a reduced retirement benefit at age 50 with at least five years
of creditable service.
Cost-of-Living Adjustment (COLA) in Retirement
The Cost-of-Living Adjustment (COLA) matches the first 2% increase in the CPI-U and half of any
additional increase (up to 2%), for a maximum COLA of 3%.
Eligibility
Same as VRS Plan 1
Exceptions to COLA Effective Dates
Same as VRS Plan 1
Disability Coverage
Members who are eligible to be considered for disability retirement and retire on disability, the
retirement multiplier is 1.65% on all service, regardless of when it was earned, purchased or granted.
Most state employees are covered under the Virginia Sickness and Disability Program (VSDP), and are
not eligible for disability retirement.
VSDP members are subject to a one-year waiting period before becoming eligible for non-work related
disability benefits.
Purchase of Prior Service
Same as VRS Plan 1.
HYBRID RETIREMENT PLAN
About the Hybrid Retirement Plan
The Hybrid Retirement Plan combines the features of a defined benefit plan and a defined contribution
plan. Most members hired on or after January 1, 2014 are in this plan, as well as VRS Plan 1 and VRS Plan
2 members who were eligible and opted into the plan during a special election window. (See “Eligible
Members”)
• The defined benefit is based on a member’s age, creditable service and average final
compensation at retirement using a formula.
• The benefit from the defined contribution component of the plan depends on the member and
employer contributions made to the plan and the investment performance of those
contributions.
• In addition to the monthly benefit payment payable from the defined benefit plan at retirement,
a member may start receiving distributions from the balance in the defined contribution
account, reflecting the contributions, investment gains or losses, and any required fees.
Eligible Members
Employees are in the Hybrid Retirement Plan if their membership date is on or after January 1, 2014.
This includes:
35
• State employees*
• School division employees
• Political subdivision employees*
• Judges appointed or elected to an original term on or after January 1, 2014
• Members in VRS Plan 1 or VRS Plan 2 who elected to opt into the plan during the election
window held January 1-April 30, 2014; the plan’s effective date for opt-in members was July 1,
2014
*Non-Eligible Members
Some employees are not eligible to participate in the Hybrid Retirement Plan. They include:
• Members of the State Police Officers’ Retirement System (SPORS)
• Members of the Virginia Law Officers’ Retirement System (VaLORS)
• Political subdivision employees who are covered by enhanced benefits for hazardous duty
employees
Those employees eligible for an optional retirement plan (ORP) must elect the ORP plan or the Hybrid
Retirement Plan. If these members have prior service under VRS Plan 1 or VRS Plan 2, they are not
eligible to elect the Hybrid Retirement Plan and must select VRS Plan 1 or VRS Plan 2 (as applicable) or
ORP.
Retirement Contributions
A member’s retirement benefit is funded through mandatory and voluntary contributions made by the
member and the employer to both the defined benefit and the defined contribution components of the
plan. Mandatory contributions are based on a percentage of the employee’s creditable compensation
and are required from both the member and the employer. Additionally, members may choose to make
voluntary contributions to the defined contribution component of the plan, and the employer is required
to match those voluntary contributions according to specified percentages.
Creditable Service
Defined Benefit Component:
Under the defined benefit component of the plan, creditable service includes active service.
Members earn creditable service for each month they are employed in a covered position. It also
may include credit for prior service the member has purchased or additional creditable
service the member was granted. A member’s total creditable service is one of the factors used
to determine their eligibility for retirement and to calculate their retirement benefit. It also may
count toward eligibility for the health insurance credit in retirement, if the employer offers the
health insurance credit.
Defined Contributions Component:
Under the defined contribution component, creditable service is used to determine vesting for
the employer contribution portion of the plan.
36
Vesting
Defined Benefit Component:
Defined benefit vesting is the minimum length of service a member needs to qualify for a future
retirement benefit. Members are vested under the defined benefit component of the Hybrid
Retirement Plan when they reach five years (60 months) of creditable service. VRS Plan 1 or VRS
Plan 2 members with at least five years (60 months) of creditable service who opted into the
Hybrid Retirement Plan remain vested in the defined benefit component.
Defined Contributions Component:
Defined contribution vesting refers to the minimum length of service a member needs to be
eligible to withdraw the employer contributions from the defined contribution component of
the plan.
Members are always 100% vested in the contributions that they make.
Upon retirement or leaving covered employment, a member is eligible to withdraw a percentage of
employer contributions to the defined contribution component of the plan, based on service.
• After two years, a member is 50% vested and may withdraw 50% of employer contributions.
• After three years, a member is 75% vested and may withdraw 75% of employer contributions.
• After four or more years, a member is 100% vested and may withdraw 100% of employer
contributions.
Distribution is not required by law until age 70½.
Calculating the Benefit
Defined Benefit Component:
See definition under VRS Plan 1
Defined Contribution Component
The benefit is based on contributions made by the member and any matching contributions
made by the employer, plus net investment earnings on those contributions.
Average Final Compensation
Same as VRS Plan 2. It is used in the retirement formula for the defined benefit component of the plan.
Service Retirement Multiplier
The retirement multiplier is 1.0%.
For members that opted into the Hybrid Retirement Plan from VRS Plan 1 or VRS Plan 2, the applicable
multipliers for those plans will be used to calculate the retirement benefit for service credited in those
plans.
Normal Retirement Age
Defined Benefit Component
Same as VRS Plan 2.
37
Defined Contribution Component
Members are eligible to receive distributions upon leaving employment, subject to restrictions.
Earliest Unreduced Retirement Eligibility
Defined Benefit Component
Members are eligible for an unreduced retirement benefit when they reach normal Social
Security retirement age and have at least five years (60 months) of creditable service or when
their age and service equal 90.
Defined Contribution Component
Members are eligible to receive distributions upon leaving employment, subject to restrictions.
Earliest Reduced Retirement Eligibility
Defined Benefit Component:
Members may retire with a reduced benefit as early as age 60 with at least five years (60
months) of creditable service.
Defined Contribution Component:
Members are eligible to receive distributions upon leaving employment, subject to restrictions.
Cost-of-Living Adjustment (COLA) in Retirement
Defined Benefit Component
Same as VRS Plan 2.
Defined Contribution Component
Not applicable.
Eligibility
Same as VRS Plan 1 and VRS Plan 2.
Exceptions to COLA Effective Dates
Same as VRS Plan 1 and VRS Plan 2.
Disability Coverage
Eligible political subdivision and school division (including VRS Plan 1 and VRS Plan2 opt-ins) participate
in the Virginia Local Disability Program (VLDP) unless their local governing body provides and employer-
paid comparable program for its members.
State employees (including VRS Plan 1 and VRS Plan2 opt-ins) participating in the Hybrid Retirement Plan
are covered under the Virginia Sickness and Disability Program (VSDP), and are not eligible for disability
retirement.
Hybrid members (including VRS Plan 1 and VRS Plan 2 opt-ins) covered under VSDP or VLDP are subject
to a one-year waiting period before becoming eligible for non-work related disability benefits.
38
Purchase of Prior Service
Defined Benefit Component
Same as VRS Plan 1, with the following exceptions:
Hybrid Retirement Plan members are ineligible for ported service.
The cost for purchasing refunded service is the higher of 4% of creditable compensation
or average final compensation.
Plan members have one year from their date of hire or return from leave to purchase all
but refunded prior service at approximate normal cost. After than one-year period, the
rate for most categories of service will change to actuarial cost.
Defined Contribution Component
Not applicable.
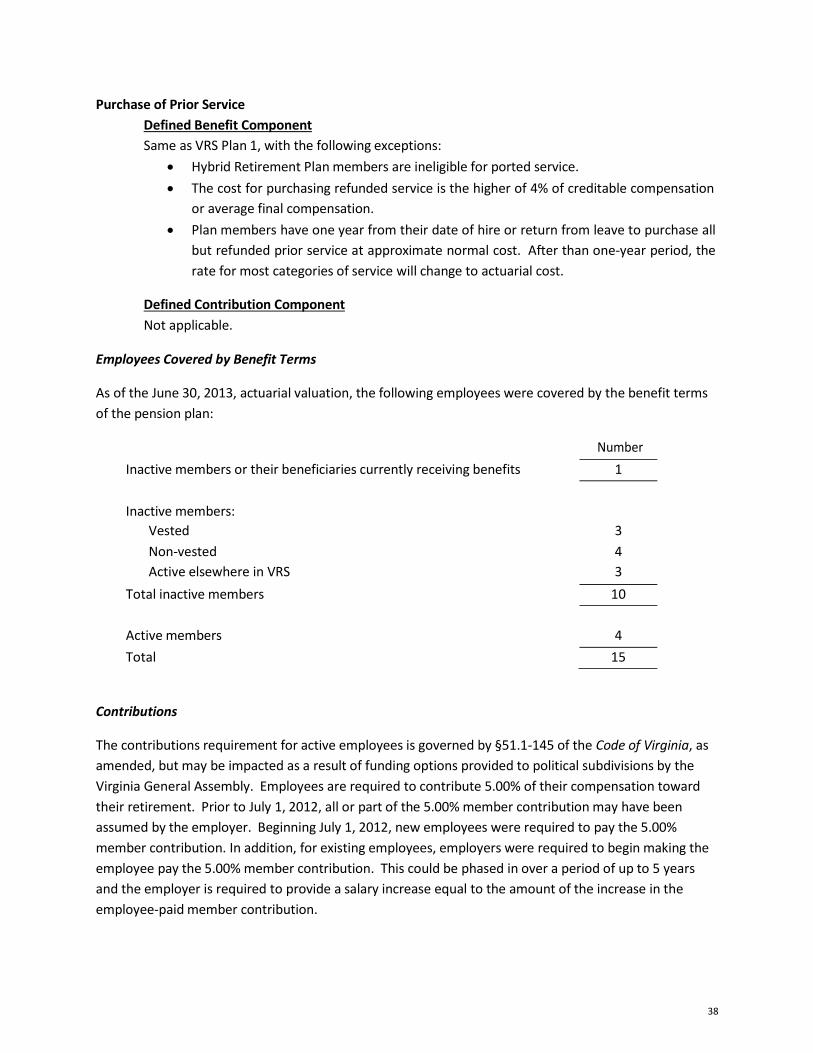
Employees Covered by Benefit Terms
As of the June 30, 2013, actuarial valuation, the following employees were covered by the benefit terms
of the pension plan:
Number
Inactive members or their beneficiaries currently receiving benefits 1
Inactive members:
Vested 3
Non-vested 4
Active elsewhere in VRS 3
Total inactive members 10
Active members 4
Total 15
Contributions
The contributions requirement for active employees is governed by §51.1-145 of the Code of Virginia, as
amended, but may be impacted as a result of funding options provided to political subdivisions by the
Virginia General Assembly. Employees are required to contribute 5.00% of their compensation toward
their retirement. Prior to July 1, 2012, all or part of the 5.00% member contribution may have been
assumed by the employer. Beginning July 1, 2012, new employees were required to pay the 5.00%
member contribution. In addition, for existing employees, employers were required to begin making the
employee pay the 5.00% member contribution. This could be phased in over a period of up to 5 years
and the employer is required to provide a salary increase equal to the amount of the increase in the
employee-paid member contribution.

39
The political subdivision’s contractually required contribution rate for the year ended June 30, 2015 was
5.15% of covered employee compensation. This rate was based on an actuarially determined rate from
an actuarial valuation as of June 30, 2013.
This rate, when combined with employee contributions, was expected to finance the costs of benefits
earned by employee during the year, with an additional amount to finance any unfunded accrued
liability. Contributions to the pension plan from the Authority were $23,634 and $18,091 for the years
ended June 30, 2015 and June 30, 2014, respectively.
Net Pension Asset
The Authority’s net pension asset was measured as of June 30, 2014. The total pension liability used to
calculate the net pension asset was determined by an actuarial valuation performed as of June 30, 2013,
using updated actuarial assumptions, applied to all periods included in the measurement and rolled
forward to the measurement date of June 30, 2014.
Actuarial Assumptions
The total pension liability for General Employees in the Authority’s Retirement Plan was based on an
actuarial valuation as of June 30, 2013, using the Entry Age Normal actuarial cost method and the
following assumptions, applied to all periods included in the measurement and rolled forward to the
measurement date of June 30, 2014.
Inflation 2.5%
Salary increases, including inflation 3.5% - 5.35%
Investment rate of return 7.0%, net of pension plan investment expenses,
Including inflation*
* Administrative expenses as a percent of the market value of assets for the last experience study were
found to be approximately 0.06% of the market assets for all of the VRS plans. This would provide an
assumed investment return rate for GASB purposes of slightly more than the assumed 7.0%. However,
since the difference was minimal, and a more conservative 7.0% investment return assumption provided
a projected plan net position that exceeded the projected benefit payments, the long-term expected rate
of return on investments was assumed to be 7.0% to simplify preparation of pension liabilities.
Mortality rates: 14% of deaths are assumed to be service related
Largest 10 – Non-LEOS:
Pre-Retirement:
RP-2000 Employee Mortality Table Projected with Scale AA to 2020 with males set forward 4
years and females were set back 2 years.
Post-Retirement:
RP-2000 Combined Mortality Table Projected with Scale AA to 2020 with males set forward
1 year.
Post-Disablement:

40
RP-2000 Disability Life Mortality Table Projected to 2020 with males set back 3 years and no
provision for future mortality improvement
All Others (Non 10 Largest) – Non-
LEOS: Pre-Retirement:
RP-2000 Employee Mortality Table Projected with Scale AA to 2020 with males set forward
4 years and females were set back 2 years.
Post-Retirement:
RP-2000 Combined Mortality Table Projected with Scale AA to 2020 with males set
forward 1 year.
Post-Disablement:
RP-2000 Disability Life Mortality Table Projected to 2020 with males set back 3 years and no
provision for future mortality improvement
The actuarial assumptions used in the June 30, 2013 valuation were based on the results of an actuarial
experience study for the period from July 1, 2008 through June 30, 2012. Changes to the actuarial
assumptions as a result of the experience study are as follows:
Largest 10 – Non-LEOS:
- Update mortality table
- Decrease in rates of service retirement
- Decrease in rates of disability retirement
- Reduce rates of salary increase by 0.25% per
year All Others (Non 10 Largest) – Non-LEOS:
- Update mortality table
- Decrease in rates of service retirement
- Decrease in rates of disability retirement
- Reduce rates of salary increase by 0.25% per year
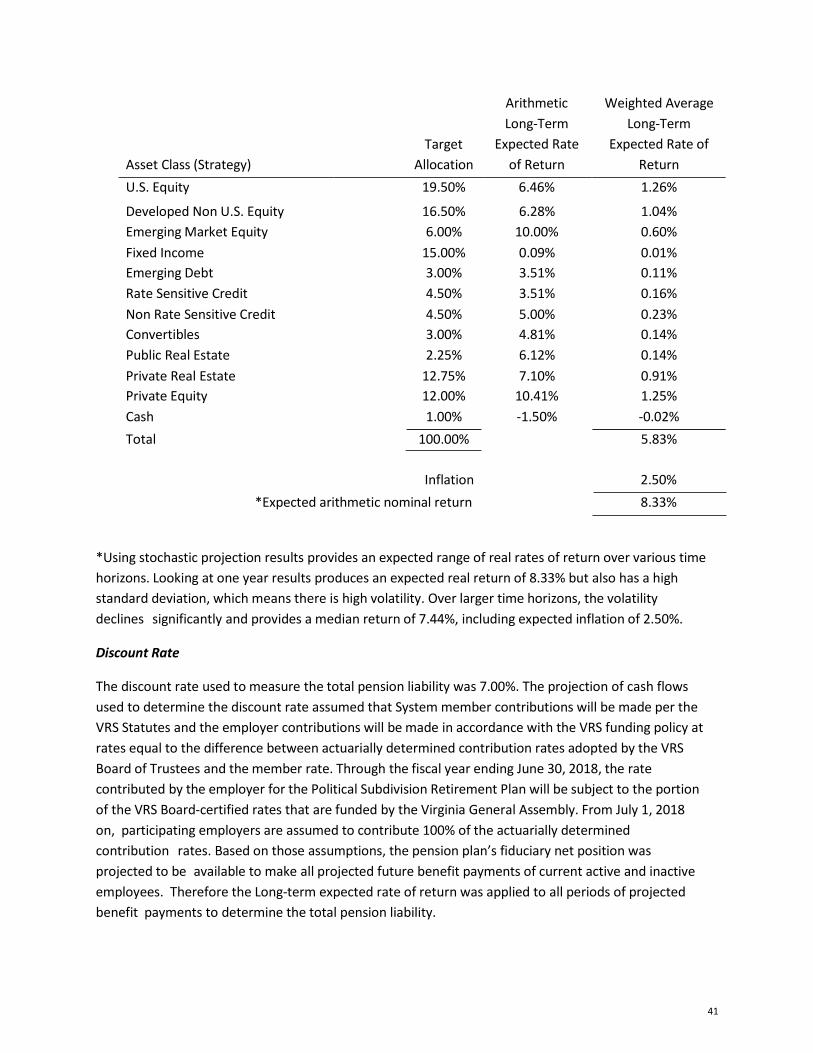
Long-Term Expected Rate of Return
The long-term expected rate of return on pension investments was determined using a log-normal
distribution analysis in which best-estimate ranges of expected future real rates of return (expected
returns, net of pension investment expense and inflation) are developed for each major asset class.
These ranges are combined to produce the long-term expected rate of return by weighting the
expected future real rates of return by the target asset allocation percentage and by adding expected
inflation.
The target asset allocation and best estimate of arithmetic real rates of return for each major asset
class are summarized in the following table:
41
Asset Class (Strategy)
Target
Allocation
Arithmetic
Long-Term
Expected Rate
of Return
Weighted Average
Long-Term
Expected Rate of
Return
U.S. Equity 19.50% 6.46% 1.26%
Developed Non U.S. Equity 16.50% 6.28% 1.04%
Emerging Market Equity 6.00% 10.00% 0.60%
Fixed Income 15.00% 0.09% 0.01%
Emerging Debt 3.00% 3.51% 0.11%
Rate Sensitive Credit 4.50% 3.51% 0.16%
Non Rate Sensitive Credit 4.50% 5.00% 0.23%
Convertibles 3.00% 4.81% 0.14%
Public Real Estate 2.25% 6.12% 0.14%
Private Real Estate 12.75% 7.10% 0.91%
Private Equity 12.00% 10.41% 1.25%
Cash 1.00% -1.50% -0.02%
Total 100.00% 5.83%
Inflation 2.50%
*Expected arithmetic nominal return 8.33%
*Using stochastic projection results provides an expected range of real rates of return over various time
horizons. Looking at one year results produces an expected real return of 8.33% but also has a high
standard deviation, which means there is high volatility. Over larger time horizons, the volatility
declines significantly and provides a median return of 7.44%, including expected inflation of 2.50%.
Discount Rate
The discount rate used to measure the total pension liability was 7.00%. The projection of cash flows
used to determine the discount rate assumed that System member contributions will be made per the
VRS Statutes and the employer contributions will be made in accordance with the VRS funding policy at
rates equal to the difference between actuarially determined contribution rates adopted by the VRS
Board of Trustees and the member rate. Through the fiscal year ending June 30, 2018, the rate
contributed by the employer for the Political Subdivision Retirement Plan will be subject to the portion
of the VRS Board-certified rates that are funded by the Virginia General Assembly. From July 1, 2018
on, participating employers are assumed to contribute 100% of the actuarially determined
contribution rates. Based on those assumptions, the pension plan’s fiduciary net position was
projected to be available to make all projected future benefit payments of current active and inactive
employees. Therefore the Long-term expected rate of return was applied to all periods of projected
benefit payments to determine the total pension liability.

42
Changes in Net Pension Asset
Total Pension
Liability
(a)
Plan Fiduciary
Net Position
(b)
Net Pension
Liability (Asset)
(a) - (b)
$1,402,757 $1,651,541 $(248,784)
Balances at June 30, 2013
Changes for the year:
Service cost 57,102 - 57,102
Interest 96,454 - 96,454
Contributions – employer - 18,091 (18,091)
Contributions – employee - 22,363 (22,363)
Net investment income - 262,181 (262,181)
Benefit payments, including refunds of employee
contributions (49,685) (49,685) -
Administrative expense - (1,407) 1,407
Other changes - 14 (14)
Net changes 103,871 251,557 (147,686)
Balances at June 30, 2014 $1,506,628 $1,903,098 $(396,470)
Sensitivity of the Net Pension Asset to Changes in the Discount Rate
The following represents the net pension asset calculated using the stated discount rate, as well as
what the net position asset would be if it were calculated using a stated discount rate that is one-
percentage- point lower or one-percentage-point higher than the current rate:
1% Decrease
6.00%
Current
Discount Rate
7.00%
1% Increase
8.00%
Plan’s Net Pension Liability (Asset) $(211,680) $(396,470) $(550,987)
Pension Expense and Deferred Outflows of Resources and Deferred Inflows of Resources
Related to Pensions
For the year ending June 30, 2015, the Authority recognized pension expense (recovery) of
$(12,039). At June 30, 2015, the Authority reported deferred outflows of resources and
deferred inflows of resources related to pensions from the following sources:

43
Deferred
Outflows of
Resources
Deferred
Inflows of
Resources
Employer contributions made subsequent to
measurement date $ 23,634 $ -
Net difference between projected and actual earnings
on plan investments - 117,556
$ 23,634 $ 117,556
Amounts reported as deferred inflows of resources related to pensions as of June 30, 2015, will be
recognized in pension expense as follows:
Year ended June 30:
2016 $ 29,389
2017 29,389
2018 29,389
2019 29,389
Total $ 117,556
11. OTHER POST-EMPLOYMENT BENEFITS – LIFE INSURANCE PROGRAM
The Authority participates in the VRS-administered statewide group life insurance program, which
provides post-employment life insurance benefits to eligible retired and terminated employees.
Information relating to these plans is available at the statewide level in the CAFR. The Authority
contributed 1.19% of eligible covered payroll in 2015 to this program for a total of $5,461.
12. OTHER POST-EMPLOYMENT BENEFITS – HEALTH INSURANCE CREDIT PROGRAM
The Authority participates in the VRS Retiree Health Insurance Credit Program which is an agent,
multiple-employer plan. It provides eligible retirees a tax-free reimbursement for health insurance
premiums for single coverage under qualifying health plans, including coverage under a spouse’s plan,
not to exceed the amount of the monthly premium or the maximum credit, whichever is less. Premiums
for health plans covering specific conditions are ineligible for reimbursement. The amount is financed
based on employer contribution rates determined by the VRS’s actuary. The Authority contributed
0.13% of eligible covered payroll in 2015 to this program for a total of $597.
13. RISK MANAGEMENT AND EMPLOYEE HEALTH CARE PLANS
The Authority is exposed to various risks of loss related to torts; theft of, damage to, and destruction of
assets; errors and omissions; non-performance of duty; injuries to employees; and natural disasters.
The Authority participates in insurance plans maintained by the Commonwealth. The Department of
Human Resource Management administers the state employee health care plan. The risk management

44
insurance plans and worker’s compensation plans are administered by a private insurance agency. Risk
management insurance includes property and general liability plans and faithful performance of duty
bond. The Authority pays premiums directly to the vendor for insurance coverage. Information relating
to the Commonwealth’s employee health care plan is available at the statewide level in the
Commonwealth’s Comprehensive Annual Financial Report.
14. INVESTMENT IN PARTNERSHIPS
Biotech Eight, LLC, is a for-profit development entity in which the Virginia Biotechnology Research Park
has an equity interest. During fiscal year 2007, the Authority contributed land (740 Navy Hill Road) with
a book value of $97,709 and a market value of $1,000,000 and cash in the amount of $500,000, for a
total equity contribution of $1,500,000. In September 2009, an additional $115,000 was contributed per
a loan agreement. During 2011, the Operating Agreement was amended to exclude the Authority from
sharing in any additional profits or losses of the LLC. However, accounting standards require the
Authority to recognize its proportionate share of the profit and losses in the LLC in line with allocation
ratios used for preferred return distributions. The Authority will receive preferred returns of any
distributions of excess cash and upon the sale or refinancing of the property from the LLC.
During fiscal year 2013, the Operating Agreement was amended to allow for the admission of another
member. As a result, the Authority’s equity interest was reduced from approximately 15.6 percent to
approximately 11 percent. The net investment in Biotech Eight, LLC was $530,227 at June 30, 2015.
During fiscal year 2012, Virginia Biotechnology Research Park committed to an 8% equity interest in
Bioling LLC, a for-profit development entity. The Park is subject to potential cash calls in proportion to
their Percentage Interests and will share in distributions of excess cash in accordance with its
partnership percentage. The net investment in Bioling, LLC was $21,960 at June 30, 2015.
As of June 30, 2014, the Authority had equity interests in partnerships with a book value (cost) of
$555,625. The equity interests in partnerships were acquired in June 2013 through a transfer from
Virginia Biosciences Development Center Inc., a component unit of the Authority. During 2015, it was
determined that one of the partnership equity interests was impaired and the entire interest of
$500,000 was written off. As of June 30, 2015, the Authority had equity interests in the remaining
partnerships with a book value (cost) of $55,625.
15. RELATED PARTY OPERATING LEASE
In November, 2011, the Authority entered into a lease agreement with Virginia Commonwealth
University for the use of the real property, building, and improvements located at 800 East Leigh Street,
otherwise known as Biotech Center. Biotech Center is the property from which the Authority conducts
the majority of its operations. The rent under the lease agreement was $30 and was paid in a lump sum
at the beginning of the lease; therefore, there is no related rent expense represented within these
financial statements. The lease term ends November 2041.

REQUIRED SUPPLEMENTARY INFORMATION

46
VIRGINIA BIOTECHNOLOGY RESEARCH PARTNERSHIP AUTHORITYSchedule of Changes in Net Pension Liability and Related RatiosAs of June 30, 2015 FY 2014
Total pension liability
Service cost 57,102$
Interest 96,454
Benefit payments (49,685)
Net change in total pension liability 103,871
Total pension liability - beginning 1,402,757
Total pension liability - ending (a) 1,506,628$
Plan fiduciary net position
Contributions - employer 18,091$
Contributions - employee 22,363
Net investment income 262,181
Benefit payments (49,685)
Administrative expenses (1,407)
Other changes 14
Net change in plan fiduciary net position 251,557
Plan fiduciary net position - beginning 1,651,541
Plan fiduciary net position - ending (b) 1,903,098$
Authority's net pension liability (asset) - ending (a) - (b) (396,470)$
Plan fiduciary net position as a percentage of
the total pension liability 126.3%
Covered-employee payroll 388,489$
Net pension liability (asset) as a percentage of covered-
employee payroll -102.1%
Note: Information in this schedule is presented for the year in which information is available. Information
will be added each year until a full 10-year trend is presented.

47
Note: Information in this schedule is presented for the year in which information is available. Information will be added each year until a full 10-year trend is presented.
VIRGINIA BIOTECHNOLOGY RESEARCH PARTNERSHIP AUTHORITYSchedule of Employer ContributionsFor the year ended June 30, 2015
2015
Actuarially determined contribution 23,634$ Contributions in relation to the actuarially
determined contribution 23,634
Contribution deficiency (excess) -$
Covered-employee payroll 458,917$
Contributions as a percentage covered-employee payroll 5.1%
Notes to Schedule
Actuarial cost method Entry age normal
Amortization method Level percent closed
Remaining amortization period 30 years
Asset valuation method 5-year smoothed market
Actuarial assumptions: 5-years for investment gains and losses
Investment rate of return* 7.00%
Projected salary increases* 3.50% - 5.35%
Cost-of-living adjustments 2.25% - 2.50%
*Includes inflation at 2.50%
Actuarily determined contribution rates are based on the most recent valuation date, which was June 30,
2013. Methods and assumptions used to determine contribution rates are as follows:

48
VIRGINIA BIOTECHNOLOGY RESEARCH PARTNERSHIP AUTHORITY
Notes to Required Supplementary Information
For the year ended June 30, 2015
Changes of benefit terms:
There have been no significant changes to the System benefit provisions since the prior actuarial
valuation. A hybrid plan with changes to the defined benefit plan structure and a new defined
contribution component were adopted in 2012. The hybrid plan applies to most new employees
hired on or after January 1, 2014 and not covered by enhanced hazardous duty benefits. The
liabilities presented do not reflect the hybrid plan since it covers new members joining the System
after the valuation date of June 30, 2013, and the impact on the liabilities as of the measurement
date of June 30, 2014 are minimal.
Changes of assumptions:
The following changes in actuarial assumptions were made effective June 30, 2013 based on the
most recent experience study of the System for the four-year period ending June 30, 2012:
Largest 10 - Non-LEOS:
- Update mortality table
- Decrease in rates of service retirement
- Decrease in rates of disability retirement
- Reduce rates of salary increase by 0.25% per year
Largest 10 - LEOS:
- Update mortality table
- Decrease in male rates of disability
All Others (Non 10 Largest) - Non-LEOS:
- Update mortality table
- Decrease in rates of service retirement
- Decrease in rates of disability retirement
- Reduce rates of salary increase by 0.25% per year
All Others (Non 10 Largest) - LEOS:
- Update mortality table
- Adjustments to rates of service retirement for females
- Increase in rates of withdrawal
- Decrease in male and female rates of disability

INDEPENDENT AUDITOR’S REPORT

www.apa.virginia.gov | (804) 225-3350 | [email protected]
November 18, 2015 The Honorable Terence R. McAuliffe Governor of Virginia The Honorable John C. Watkins Chairman, Joint Legislative Audit And Review Commission Virginia Biotechnology Research Partnership Authority Board Virginia Biotechnology Research Park Corporation Board
INDEPENDENT AUDITOR’S REPORT Report on Financial Statements
We have audited the accompanying financial statements of the Virginia Biotechnology
Research Partnership Authority, a component unit of the Commonwealth of Virginia, as of and for the year ended June 30, 2015, and the related notes to the financial statements, which collectively comprise the Authority’s basic financial statements as listed in the table of contents. Management’s Responsibility for the Financial Statements Management is responsible for the preparation and fair presentation of these financial statements in accordance with accounting principles generally accepted in the United States of America; this includes the design, implementation, and maintenance of internal control relevant to the preparation and fair presentation of financial statements that are free from material misstatement, whether due to fraud or error. Auditor’s Responsibility
Our responsibility is to express an opinion on these financial statements based on our audit. We conducted our audit in accordance with auditing standards generally accepted in the United States of America and the standards applicable to financial audits contained in Government Auditing Standards, issued by the Comptroller General of the United States. Those
50

standards require that we plan and perform the audit to obtain reasonable assurance about whether the financial statements are free of material misstatement.
An audit involves performing procedures to obtain audit evidence about the amounts and
disclosures in the financial statements. The procedures selected depend on the auditor’s judgment, including the assessment of the risks of material misstatement of the financial statements, whether due to fraud or error. In making those risk assessments, the auditor considers internal control relevant to the entity’s preparation and fair presentation of the financial statements in order to design audit procedures that are appropriate in the circumstances, but not for the purpose of expressing an opinion on the effectiveness of the entity’s internal control. Accordingly, we express no such opinion. An audit also includes evaluating the appropriateness of accounting policies used and the reasonableness of significant accounting estimates made by management, as well as evaluating the overall financial statement presentation.
We believe that the audit evidence we have obtained is sufficient and appropriate to
provide a reasonable basis for our audit opinion. Opinion
In our opinion, the financial statements referred to above present fairly, in all material respects, the financial position of the Virginia Biotechnology Research Partnership Authority as of June 30, 2015, and the changes in its financial position and its cash flows for the year then ended, in accordance with accounting principles generally accepted in the United States of America. Emphasis of Matter As discussed in Note 1 to the financial statements, the Authority implemented Governmental Accounting Standards Board (GASB) Statements No. 68 and No. 71, related to pension accounting and financial reporting for employers. Our opinion is not modified with respect to these matters. Other Matters
Required Supplementary Information Accounting principles generally accepted in the United States of America require that the
Management’s Discussion and Analysis on pages 9 through 14, the Schedule of Changes in Net Pension Liability and Related Ratios on page 46, the Schedule of Employer Contributions on page 47, and the Notes to Required Supplementary Information on page 48 be presented to supplement the basic financial statements. Such information, although not a part of the basic financial statements, is required by the Governmental Accounting Standards Board who considers it to be an essential part of the financial reporting for placing the basic financial
51
statements in an appropriate operational, economic, or historical context. We have applied certain limited procedures to the required supplementary information in accordance with auditing standards generally accepted in the United States of America, which consisted of inquiries of management about the methods of preparing the information and comparing the information for consistency with management’s responses to our inquiries, the basic financial statements, and other knowledge we obtained during our audit of the basic financial statements. We do not express an opinion or provide any assurance on the information because the limited procedures do not provide us with sufficient evidence to express an opinion or provide any assurance. Other Reporting Required by Government Auditing Standards
In accordance with Government Auditing Standards, we have also issued our report dated November 18, 2015, on our consideration of the Virginia Biotechnology Research Partnership Authority’s internal control over financial reporting and on our tests of its compliance with certain provisions of laws, regulations, contracts and grant agreements, and other matters. The purpose of that report is to describe the scope of our testing of internal control over financial reporting and compliance and the results of that testing, and not to provide an opinion on the internal control over financial reporting or on compliance. That report is an integral part of an audit performed in accordance with Government Auditing Standards in considering the Authority’s internal control over financial reporting and compliance.
AUDITOR OF PUBLIC ACCOUNTS ZLB/clj
52