Embed Size (px)
Citation preview
The Journal of Engineering Research Vol. 5, No.1, (2008) 79-96
________________________________Corresponding author e-mail:[email protected]
Comparison between Experimental and 3D Finite ElementAnalysis of Reinforced and Partially Pre-Stressed Concrete
Solid Beams Subjected to Combined Load of Bending,Torsion and Shear
A. S. Alnuaimi
Department of Civil and Architectural Engineering, College of Engineering, PO Box 33, PC 123, Al-Khoud, Muscat, Oman
Received 8 August 2006; accepted 8 April 2007
Abstract: This paper presents a non-linear analysis of three reinforced and two partially prestressed concrete solid beamsbased on a 20 node isoparametric element using an in-house 3D finite element program. A non linear elastic isotropic model,proposed by Kotsovos, was used to model concrete behaviour, while steel was modelled as an embedded element exhibit-ing elastic-perfectly plastic response. Allowance was made for shear retention and for tension stiffening in concrete aftercracking. Only in a fixed direction, smeared cracking modelling was adopted. The beams dimensions were 300x300 mmcross section, 3800 mm length and were subjected to combined bending, torsion and shear. Experimental results were com-pared with the non-linear predictions. The comparison was judged by load displacement relationship, steel strain, angle oftwist, failure load, crack pattern and mode of failure. Good agreement was observed between the predicted ultimate load andthe experimentally measured loads. It was concluded that the present program can confidently be used to predict the behav-iour and failure load of reinforced and partially prestressed concrete solid beams subjected to a combined load of bending,torsion and shear.
Keywords: Beam, Solid beam, Bending, Shear, Torsion, Direct design, Concrete, Reinforced concrete,Stress analysis, Combined loading
á«FõL á«fÉ°SôN õFGƒLh áë∏°ùŸŸG áfÉ°SôÿG øe ¬àª°üe õFGƒ÷ IO~ÙG ô°UÉæ©dG ΩG~îà°SÉH »ZGôØdG π«∏ëàdGh á«∏ª©ŸG èFFÉàædG ÚH áfQÉ≤e
¢ü≤dG h AGƒàd’Gh AÉæëf’G øe á©ªà› ∫ɪMC’ â©° NG OÉ¡L’G
»ª«©ædG »∏Y
áá°°UUÓÓÿÿGGá≤jôW Ω~îà°ùj »Hƒ°SÉM èeÉfôH ΩG~îà°SÉH É«FõL OÉ¡L’G á≤HÉ°S áfÉ°SôÿG øe øjõFÉLh áë∏°ùŸG áfÉ°SôÿG øe ¬àª°üe õFGƒL áKÓãd É«£N ’ Ó«∏– ábQƒdG √òg ¢Vô©J :
π«ã“ ” ɪæ«H ,¢Sƒaƒ°ùJƒc ¤G iõ©j »£N ’ ¿ôe êPƒ‰ ΩG~îà°SÉH èeÉfÈdG ‘ áfÉ°SôÿG ∑ƒ∏°S πãe ~bh .á£≤f øjô°ûY GP OÉ©H’G »KÓK Gô°üæY πª©à°ùj …òdG IO~ÙG ô°UÉæ©dG
ɪc .≥≤°ûàdG ~©H ~°ûdG áehÉ≤e á«°UÉNh ¢ü≤dG áehÉ≤e AÉ≤HG ‘ áfÉ°SôÿG á«°UÉN ¿ÉÑ°ù◊G ‘ òNG ~bh .¢üdÉN »WÉ£eh ¿ôe ∑ƒ∏°S äGP áfƒa~e ô°UÉæ©c í«∏°ùàdG ~j~M ∑ƒ∏°S
¤G â©° NGh Ϊ«∏e3800 õFÉ÷G ∫ƒWh Ϊ«∏e 300*300 õFÉé∏d »°Vô©dG ™£≤ŸG OÉ©HG âfÉc ~bh .§≤a âHÉK √ÉŒG ‘ ≥°ûdG AÉ≤H ¢VGÎaG ™e ¬àà°ûŸG ¥ƒ≤°ûdG êPƒ‰ Ω~îà°SG
QG~≤eh ,πª◊Gh áMGRE’G ÚH ábÓ©dG øª° àJ áfQÉ≤ŸG ô°UÉæY âfÉch .á«£NÓdG π«dÉëàdG èFÉàæH á«∏ª©ŸG èFÉàædG áfQÉ≤e â“ ~bh .¢ü≤dGh AGƒàd’Gh AÉæëf’G øe á©ªà› ∫ɪMG
øe É¡«∏Y π°üM »àdG á«FÉ¡ædG ∫ɪM’G ÚH √~«L âfÉc á≤aGƒŸG ¿CG ßMƒd ~bh .QÉ«¡f’G ´ƒfh ≥≤°ûàdG •É‰Gh ,QÉ«¡fÓd áÑÑ°ùŸG ∫ɪM’Gh ,πàØdG ájhGRh ,~j~◊G ‘ √ƒ°ûàdG
õFGƒé∏d QÉ«¡f’G ∫ɪMGh ∑ƒ∏°ùH DƒÑæà∏d á≤K πµH áeG~îà°SG øµÁ π«∏ëàdG ‘ Ω~îà°ùŸG ܃°SÉ◊G èeÉfôH ¿G ∂dP øe èàæà°ùjh .πª©ŸG ‘ â°ù«b »àdG ∫ɪM’Gh »£NÓdG π«∏ëàdG
.¢ü≤dGh AGƒàd’Gh AÉæëf’G øe á©ªà› ∫ɪM’ á°Vô©ŸGh OÉ¡L’G á«FõL á«fÉ°SôÿG õFGƒ÷Gh áë∏°ùŸG á«fÉ°SôÿG
áá««MMÉÉààØØŸŸGG ääGGOOôôØØŸŸGG.OÉ¡LC’G ,áë∏°ùŸG áfÉ°SôÿG ,¢üb ,AGƒàdEG ,AÉæëfEG ,ô°TÉÑŸG º«ª°üàdG á≤jôW ,áરüŸG ¿Gõ«÷G ,¿Gõ«÷G :
Notation Md, Td, Vd = Design bending moment, torsion and shear force respectively
Le/Lc = Experimental to computed failure load ratio
L.F. = Load factor (percentage of applied load to design load ) L.F.= (T/Td+M/Md)/2
EXP = experimentally measured values
fcu = concrete cube compressive strength
80
The Journal of Engineering Research Vol. 5, No.1, (2008) 79-96
1. Introduction
The behaviour of solid beams when subjected to com-bined loading is very complex. A detailed analysis wouldnormally require a three-dimensional finite elementmodel.
Preston and Austin (1992) cited that "The design andanalysis of RC beams is so complex that, in general, it is impossible for engineers to consider all aspects of aproblem at once". Ojha, et al. (1974) have studied thebehaviour of reinforced concrete rectangular beams undercombined torsion, bending and shear and found a sharpreduction in the torsional stiffness compared to flexuralstiffness after cracking of the beam. The reductiondepends on a number of factors such as the loading com-bination, the strength and distribution of the steel rein-forcement and the form of the cross section.
Tests conducted by Thurlimann (1979), revealed thatthe torsional strength of beams relies on the outer concreteshell of about 1/6 the diameter of the largest circleinscribed into the perimeter connecting the corner longitu-dinal bars. Mitchell and Collins (1974), described the tor-sional shear stress as circulating in the periphery of thesection. Its intensity is distributed in a parabolic shapewith the maximum stress at the outside fibre and zero atsome distance from the surface. Rahal and Collins (1995)developed a three-dimensional analytical model capableof analysing rectangular sections subjected to combinedloading of biaxial bending, biaxial shear, torsion and axial
load. The model takes into account the shear-torsion inter-action and concrete spalling. It idealizes the rectangularcross-section resisting shear and torsion as made of fourtransversely reinforced walls with a varying thickness andvarying angle of a principal compressive strains. The ver-tical shear stress due to the shear force is uniformly resis-ted by the vertical walls and the lateral shear stress isresisted by the horizontal walls. They tested their modeland concluded that the model predicts very close results toexperimental behavioural and ultimate load results. Rahal(2000) developed an equation relating the ultimate tor-sional moment and ultimate shearing stress in the walls ofthe equivalent tube. The walls of the section resisting theshear stresses were idealized as a reinforced concretemembrane element subjected to pure in-plane shearingstress. MacGregor and Ghoneim (1995) stated that "in asolid section, the shear stresses due to direct shear areassumed to be distributed uniformly across the width ofthe section, while the torsional shears only exist in thewalls of the assumed thin-walled tube. For this reason, thedirect summation of the two terms tends to be conservativeand a root square summation is used". They proposeddesign equations for torsional resistance in which theouter skin alone contributes to the torsional resistance of asolid beam. They claimed that the thickness of the wallresisting torsion in a solid member is on the order of one-sixth to one-quarter of the minimum width of a rectangu-lar member. Ibell, et al. (1998) used an upper-bound plas-ticity analysis in a 2D model for the assessment of shear
f’c = concrete cylinder compressive strength
f t' = concrete tensile strength
fy = Yield stress of the longitudinal steel
fyv = Yield stress of the transverse steel
fpu = ultimate strength of the pre -stressing wire
tshr = Shear stress in concrete due to shear force
ttor = Shear stress due to torsion
εy = longitudinal steel yield strain ( εy = fy/E)
εpy = prestressed wires yield strain (εpy = fpy/E)
εyv = transverse steel yield strain ( εyv = fyv/E)
G = the elastic shear modulus of the un -cracked concrete
β = shear retention factor
åcr = cracking strain ('t
crc
få
E= )
ån = average of the three principal strains at any cracked point ( å å åån
+ += 1 2 3
3)
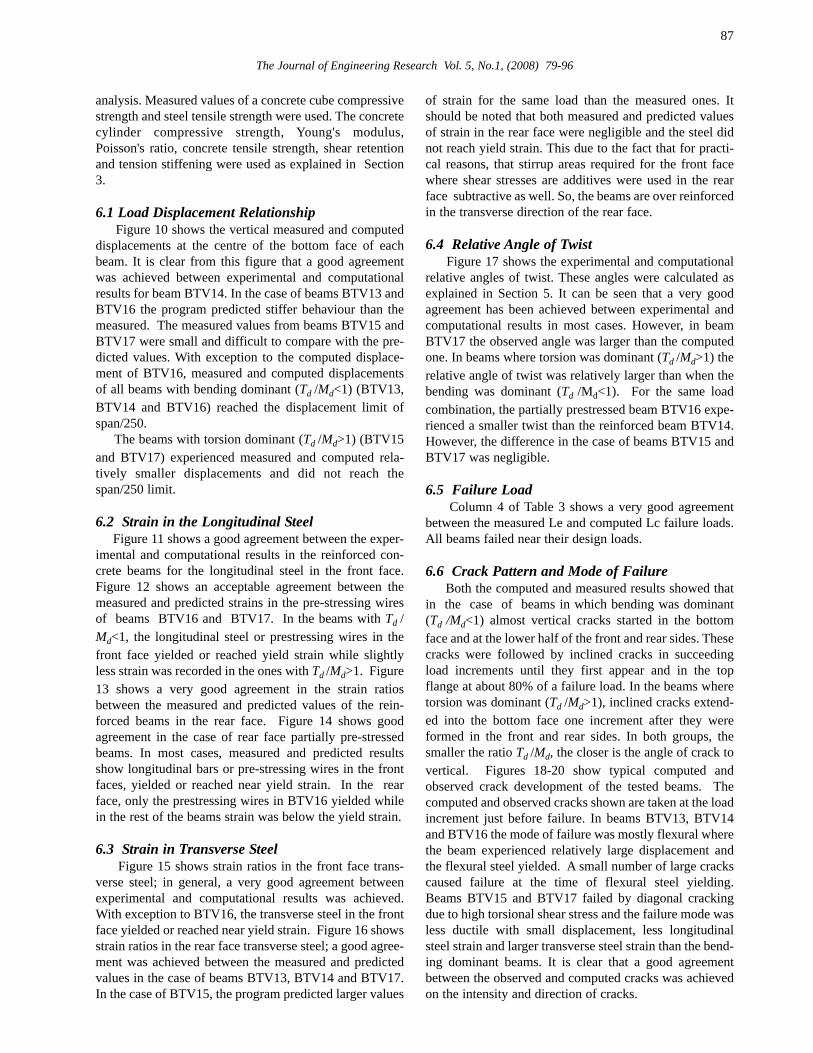
èi = Angle of twist at a section èi = (df+dr)/Lh (See Fig. 9)
ø = Rate of twist ø = ( è2 – è1)/a
81
The Journal of Engineering Research Vol. 5, No.1, (2008) 79-96
in reinforced concrete beams. The results from this modelwere compared with experimental results. It was recom-mended that the 2D analysis to be extended to more gen-eral 3D collapse analysis. Rabczuk and Eibl (2004), pre-sented a model using a mesh free 2D Galerkin/ finite ele-ment approach. The concrete was modelled with particlesand reinforcement with beam elements. For steel, anelastoplastic constitutive law with isotropic hardening andtension cut-off was used. The concrete was modelled viaa continuum damage model, where an anisotropic tensiledamage variable was used to capture the behaviour of con-crete in tension. They used a displacement controlledapproach for testing their model. They compared theresults from their model with experimental results fromone rectangular and one I-section pre-stressed beams.They concluded that a full 3D simulation would be moreappropriate.
In this research a in-house 3-D finite element programwas used for non-linear analysis of this computationalstudy. The program was developed by El-Nuonu (1985)using Kotsovs' concrete model. This model was based onexperimental data obtained at Imperial College Londonfrom tests on the behaviour of concrete under complexstress states (Kotsovos and Newman, 1979; and Kotsovos,1979). The testing techniques used to obtain this data werevalidated by comparing them with those obtained in aninternational co-operative programme of research into theeffect of different test methods on the behaviour of con-crete. This model is capable of describing the behaviour ofconcrete under uniaxial, biaxial and triaxial stress condi-tions. It requires only the concrete cube compressivestrength fcu to define the behaviour of concrete under dif-ferent stress states. More information about this model isgiven in (Kotsovos and Pavlovic, 1995).
2. Research Significance
Predictions from an in-house 3D FE program are com-pared with experimental results of solid reinforced andpartially pre-stressed concrete beams subjected to com-bined load of bending, shear and torsion. The beams weredesigned using the direct design approach with plasticstress field for the reinforced beams and elastic stress fieldfor the partially pre-stressed beams.
3. A 3D Finite Element Program
A standard incremental-iterative procedure was adopt-ed for solution. The load increments were equal to 10% ofthe design load for the first two increments and 5% for theremaining increments. The maximum number of incre-ments was 50 and the maximum number of iterations ineach increment was 200. The convergence being deemedsatisfactory if the ratio of the square roots of the sum ofthe squares of the residual forces to that of the appliedloads did not exceed 5%.
The stresses in the cross-section nearest to mid-spanwere analysed. The stress distribution at the last con-verged increment was used for the analysis. In deciding onthe predicted mode of failure, the load-deflection relation-ship, steel strain and ultimate load were taken into consid-eration. The program was extensively used by Bhatt andLim (1999)(a,b) for the analysis of slabs, internal column-flat slab junctions and punching shear failure of flat slabsLim and Bhatt (1998). Good agreement between predict-ed and experimental results was found.
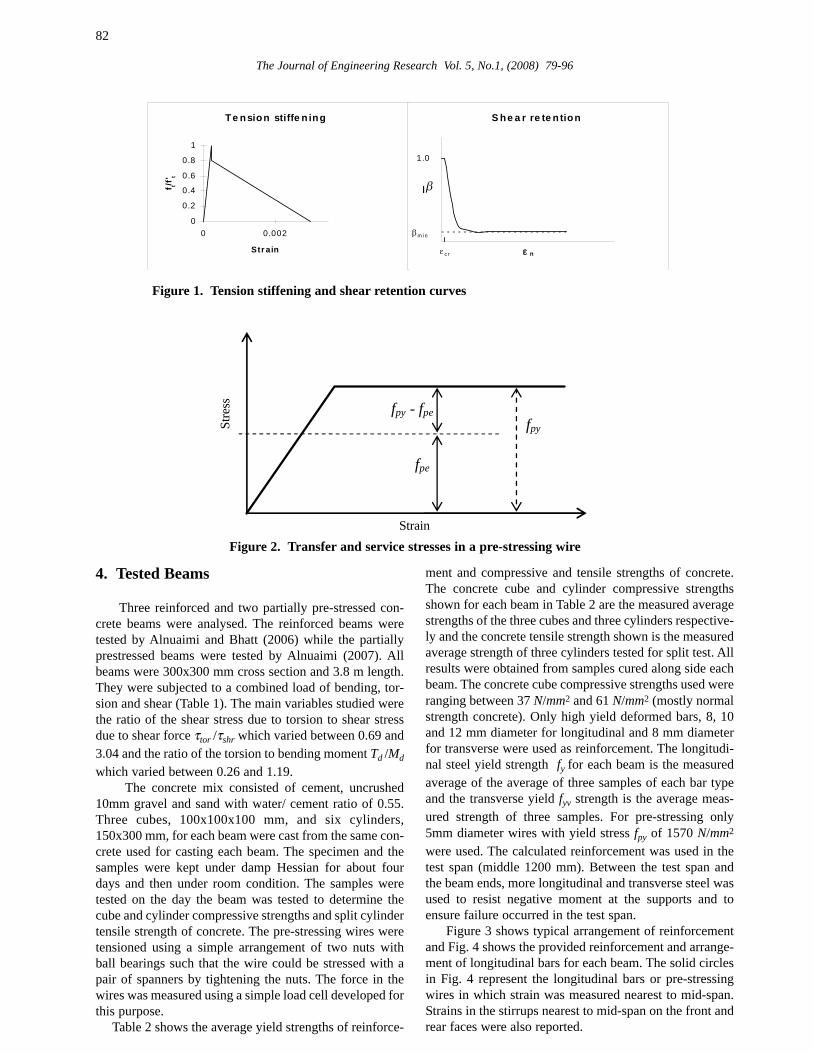
Before cracking or crushing, the concrete behaviour is assumed to be non -linear elastic isotropic. Crushing occurs at a point when all the three principal stresses are compressive and th e state of stress is on the ‘yield’ surface. In the case of concrete crushing, complet e loss of strength is assumed ie. no compression softening is allowed for. When the concrete cracks in any direction, concrete ceases to be isotropic and crushing can occur if the minimum principal strain (compressive) reaches a value taken as equal to 0.003. After cracking, smeared crack approach with simple tension stiffening and shear retention equations are employed to represent the post cracking behaviour of concrete ( Fig. 1). Cracks are assumed to be orthogonal and once formed remain in their direction. The stress -strain relationship in tension was assumed to be linear up to '
tf and immediately
after cracking the tensile stress tf is reduced to 0.8 'tf .
Thereafter, tf decreases linearly with strain and is zero at the maximum strain of 0.003 which roughly corresponds to yield strain of steel of 0.0025. Transfer of shear stresses across cracks is mode lled by means of the 'shear retention' factor β which defines the shear modulus of cracked concrete as âG, where G is the elastic shear modulus of the un -cracked concrete. The shear retention factor â = 1.0 if εn ≤ åcr and â = 0.25 åcr/
ån if ån > åcr, where εcr = cracking strain ( å't
crc
fE
= )
and ån = average of the three principal strains at any
cracked point ( 1 2 3å å åå
3n+ +
= ). The reinforcement is
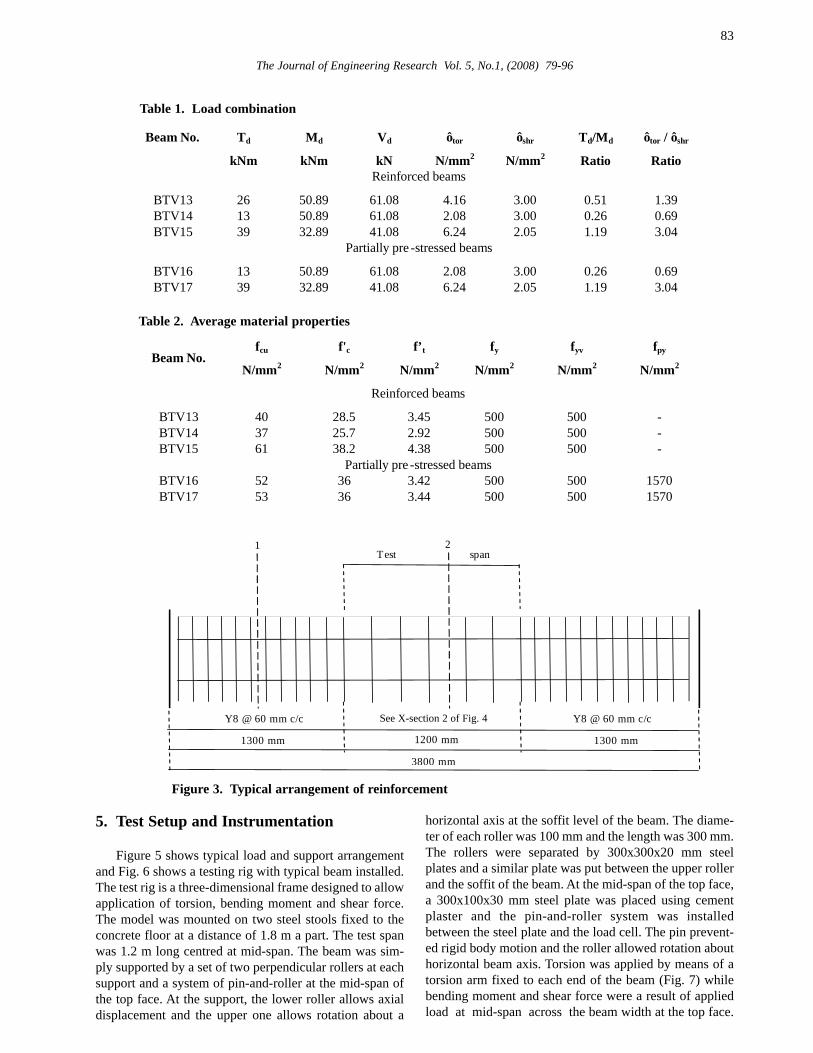
modelled as one dimensional element embedded in the solid concrete elements. Elast ic-plastic stress -strain behaviour without strain hardening was used in this research. Only uniaxial resistance is considered with no provision for kinking or dowel action of bars. In the cells were the pre -stressing wires are present th e pre-stressing wires are assumed to act as unstressed steel with a yield stress equal to the difference between the yield stress fpy and the stress at service fpe (Fig. 2).
In the 3D program, a 150x150x150 mm iso-parametric solid element with twenty node and twenty seven Gauss points was used. The concrete cylinder compressive strength '
cf is taken as f’c= 0.8fcu N/mm2,
the Young’s modulus Ec = 5000 'cf N/mm2, the split
cylinder tensile strength ' 't cf . f= 054 N/mm2 and the
Poisson’s ratio was set at a constant value of 0.15.
82
The Journal of Engineering Research Vol. 5, No.1, (2008) 79-96
4. Tested Beams
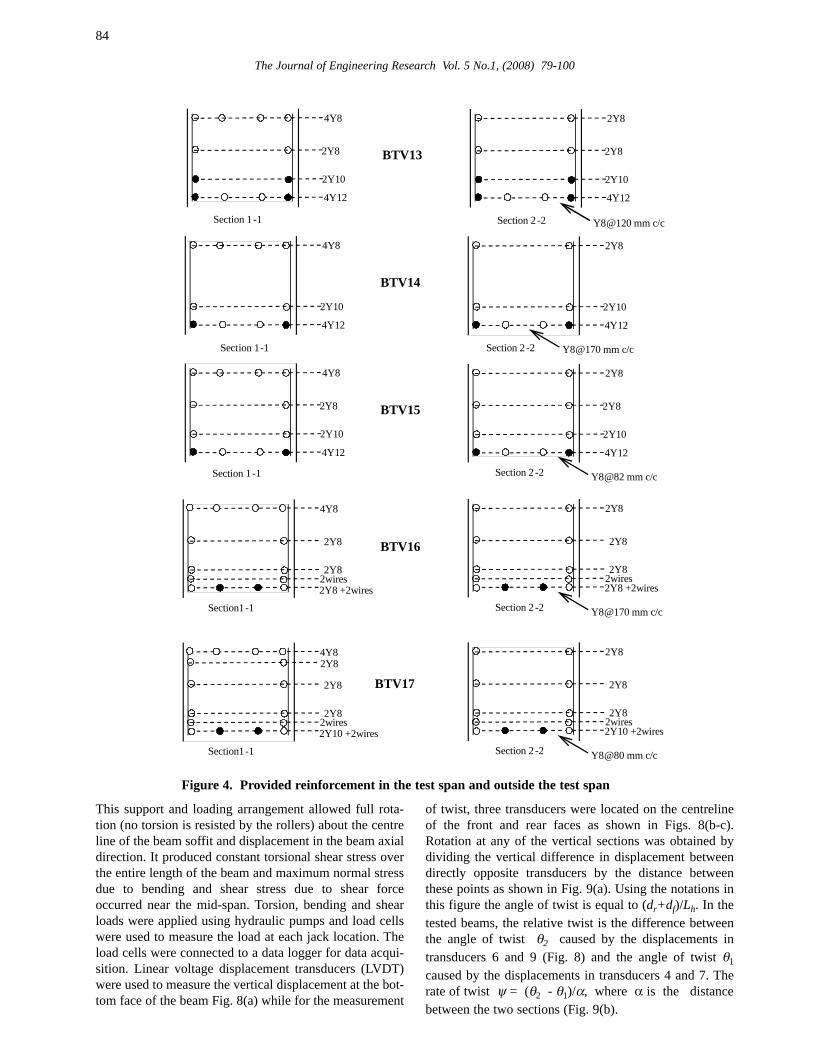
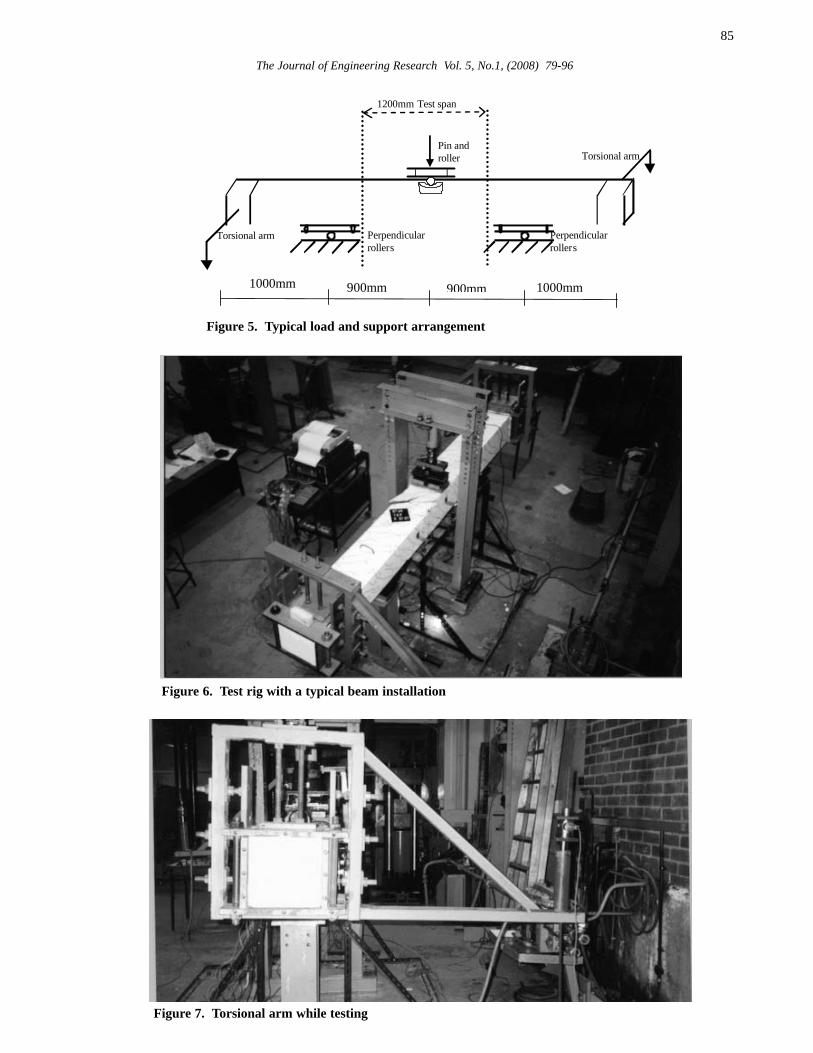
Three reinforced and two partially pre-stressed con-crete beams were analysed. The reinforced beams weretested by Alnuaimi and Bhatt (2006) while the partiallyprestressed beams were tested by Alnuaimi (2007). Allbeams were 300x300 mm cross section and 3.8 m length.They were subjected to a combined load of bending, tor-sion and shear (Table 1). The main variables studied werethe ratio of the shear stress due to torsion to shear stressdue to shear force τtor /τshr which varied between 0.69 and3.04 and the ratio of the torsion to bending moment Td /Mdwhich varied between 0.26 and 1.19.
The concrete mix consisted of cement, uncrushed10mm gravel and sand with water/ cement ratio of 0.55.Three cubes, 100x100x100 mm, and six cylinders,150x300 mm, for each beam were cast from the same con-crete used for casting each beam. The specimen and thesamples were kept under damp Hessian for about fourdays and then under room condition. The samples weretested on the day the beam was tested to determine thecube and cylinder compressive strengths and split cylindertensile strength of concrete. The pre-stressing wires weretensioned using a simple arrangement of two nuts withball bearings such that the wire could be stressed with apair of spanners by tightening the nuts. The force in thewires was measured using a simple load cell developed forthis purpose.
Table 2 shows the average yield strengths of reinforce-
ment and compressive and tensile strengths of concrete.The concrete cube and cylinder compressive strengthsshown for each beam in Table 2 are the measured averagestrengths of the three cubes and three cylinders respective-ly and the concrete tensile strength shown is the measuredaverage strength of three cylinders tested for split test. Allresults were obtained from samples cured along side eachbeam. The concrete cube compressive strengths used wereranging between 37 N/mm2 and 61 N/mm2 (mostly normalstrength concrete). Only high yield deformed bars, 8, 10and 12 mm diameter for longitudinal and 8 mm diameterfor transverse were used as reinforcement. The longitudi-nal steel yield strength fy for each beam is the measuredaverage of the average of three samples of each bar typeand the transverse yield fyv strength is the average meas-ured strength of three samples. For pre-stressing only5mm diameter wires with yield stress fpy of 1570 N/mm2
were used. The calculated reinforcement was used in thetest span (middle 1200 mm). Between the test span andthe beam ends, more longitudinal and transverse steel wasused to resist negative moment at the supports and toensure failure occurred in the test span.
Figure 3 shows typical arrangement of reinforcementand Fig. 4 shows the provided reinforcement and arrange-ment of longitudinal bars for each beam. The solid circlesin Fig. 4 represent the longitudinal bars or pre-stressingwires in which strain was measured nearest to mid-span.Strains in the stirrups nearest to mid-span on the front andrear faces were also reported.
Te nsion stiffe n ing
0
0.2
0.4
0.6
0.8
1
0 0.002
Str ain
f t/f' t
S he a r re te ntion
εε nε c r
βm in
1.0
Figure 1. Tension stiffening and shear retention curves
fpy
fpe
fpy - fpe
Stre
ss
Strain Figure 2. Transfer and service stresses in a pre-stressing wire
β
83
The Journal of Engineering Research Vol. 5, No.1, (2008) 79-96
5. Test Setup and Instrumentation
Figure 5 shows typical load and support arrangementand Fig. 6 shows a testing rig with typical beam installed.The test rig is a three-dimensional frame designed to allowapplication of torsion, bending moment and shear force.The model was mounted on two steel stools fixed to theconcrete floor at a distance of 1.8 m a part. The test spanwas 1.2 m long centred at mid-span. The beam was sim-ply supported by a set of two perpendicular rollers at eachsupport and a system of pin-and-roller at the mid-span ofthe top face. At the support, the lower roller allows axialdisplacement and the upper one allows rotation about a
horizontal axis at the soffit level of the beam. The diame-ter of each roller was 100 mm and the length was 300 mm.The rollers were separated by 300x300x20 mm steelplates and a similar plate was put between the upper rollerand the soffit of the beam. At the mid-span of the top face,a 300x100x30 mm steel plate was placed using cementplaster and the pin-and-roller system was installedbetween the steel plate and the load cell. The pin prevent-ed rigid body motion and the roller allowed rotation abouthorizontal beam axis. Torsion was applied by means of atorsion arm fixed to each end of the beam (Fig. 7) whilebending moment and shear force were a result of appliedload at mid-span across the beam width at the top face.
Td Md Vd ôtor ôshr Td/Md ôtor / ôshr Beam No.
kNm kNm kN N/mm2 N/mm2 Ratio Ratio Reinforced beams
BTV13 26 50.89 61.08 4.16 3.00 0.51 1.39 BTV14 13 50.89 61.08 2.08 3.00 0.26 0.69 BTV15 39 32.89 41.08 6.24 2.05 1.19 3.04
Partially pre -stressed beams
BTV16 13 50.89 61.08 2.08 3.00 0.26 0.69 BTV17 39 32.89 41.08 6.24 2.05 1.19 3.04
Table 1. Load combination
fcu f'c f’t fy fyv fpy Beam No.
N/mm2 N/mm2 N/mm2 N/mm2 N/mm2 N/mm2
Reinforced beams
BTV13 40 28.5 3.45 500 500 - BTV14 37 25.7 2.92 500 500 - BTV15 61 38.2 4.38 500 500 -
Partially pre -stressed beams BTV16 52 36 3.42 500 500 1570 BTV17 53 36 3.44 500 500 1570
Table 2. Average material properties
See X-section 2Y8 @ 60 mm c/c Y8 @ 60 mm c/c
1300 mm 1200 mm 1300 mm
3800 mm
2Test span
1
Figure 3. Typical arrangement of reinforcement
See X-section 2 of Fig. 4
84
The Journal of Engineering Research Vol. 5 No.1, (2008) 79-100
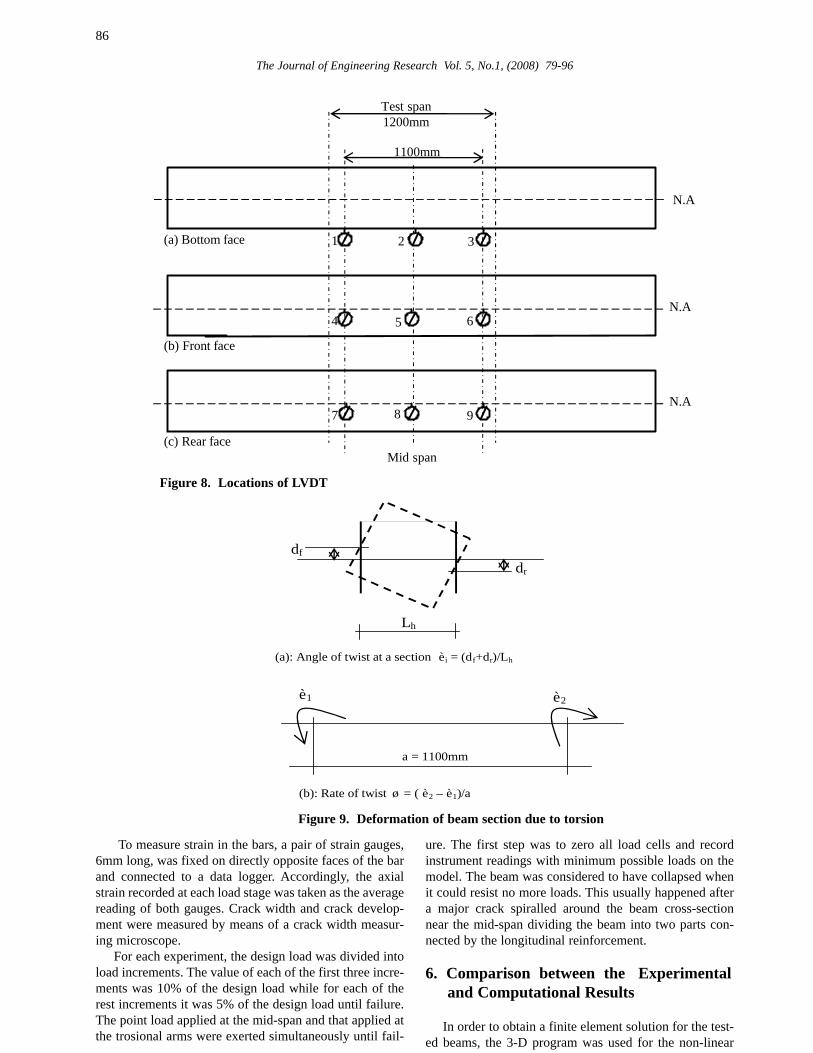
This support and loading arrangement allowed full rota-tion (no torsion is resisted by the rollers) about the centreline of the beam soffit and displacement in the beam axialdirection. It produced constant torsional shear stress overthe entire length of the beam and maximum normal stressdue to bending and shear stress due to shear forceoccurred near the mid-span. Torsion, bending and shearloads were applied using hydraulic pumps and load cellswere used to measure the load at each jack location. Theload cells were connected to a data logger for data acqui-sition. Linear voltage displacement transducers (LVDT)were used to measure the vertical displacement at the bot-tom face of the beam Fig. 8(a) while for the measurement
of twist, three transducers were located on the centrelineof the front and rear faces as shown in Figs. 8(b-c).Rotation at any of the vertical sections was obtained bydividing the vertical difference in displacement betweendirectly opposite transducers by the distance betweenthese points as shown in Fig. 9(a). Using the notations inthis figure the angle of twist is equal to (dr+df)/Lh. In thetested beams, the relative twist is the difference betweenthe angle of twist θ2 caused by the displacements intransducers 6 and 9 (Fig. 8) and the angle of twist θ1caused by the displacements in transducers 4 and 7. Therate of twist ψ = (θ2 - θ1)/α, where α is the distance between the two sections (Fig. 9(b).
Section 1-1
4Y8
2Y10
4Y12
BTV14
2Y8
2Y10
4Y12
Y8@170 mm c/c Section 2 -2
BTV15
4Y8
2Y8
2Y10
4Y12
Section 1 -1
2Y8
2Y8
2Y10
4Y12
Y8@82 mm c/c Section 2 -2
Section 1 -1
4Y8
2Y8
2Y10
4Y12
2Y8
2Y8
2Y10
4Y12
BTV13
Y8@120 mm c/c Section 2 -2
BTV16
2Y8
2Y8
2Y8
2Y8 +2wires
Y8@170 mm c/c Section 2 -2
2wires 2Y8 +2wires
Section1-1
4Y8
2Y8
2Y8 2wires
BTV17
2Y8
2Y8
2Y8
2Y10 +2wires
Y8@80 mm c/c Section 2 -2
2wires 2Y10 +2wires
Section1-1
4Y8
2Y8
2Y8 2wires
2Y8
Figure 4. Provided reinforcement in the test span and outside the test span
85
The Journal of Engineering Research Vol. 5, No.1, (2008) 79-96
Pin and roller
1000mm 900mm 900mm 1000mm
1200mm Test span
Perpendicular rollers
Perpendicular rollers
Torsional arm
Torsional arm
Figure 5. Typical load and support arrangement
Figure 6. Test rig with a typical beam installation
Figure 7. Torsional arm while testing
86
The Journal of Engineering Research Vol. 5, No.1, (2008) 79-96
To measure strain in the bars, a pair of strain gauges,6mm long, was fixed on directly opposite faces of the barand connected to a data logger. Accordingly, the axialstrain recorded at each load stage was taken as the averagereading of both gauges. Crack width and crack develop-ment were measured by means of a crack width measur-ing microscope.
For each experiment, the design load was divided intoload increments. The value of each of the first three incre-ments was 10% of the design load while for each of therest increments it was 5% of the design load until failure.The point load applied at the mid-span and that applied atthe trosional arms were exerted simultaneously until fail-
ure. The first step was to zero all load cells and recordinstrument readings with minimum possible loads on themodel. The beam was considered to have collapsed whenit could resist no more loads. This usually happened aftera major crack spiralled around the beam cross-sectionnear the mid-span dividing the beam into two parts con-nected by the longitudinal reinforcement.
6. Comparison between the Experimental and Computational Results
In order to obtain a finite element solution for the test-ed beams, the 3-D program was used for the non-linear
N.A
Mid span
2
Test span 1200mm
1 3 (a) Bottom face
N.A 4 5 6
N.A 7 8 9
1100mm
(b) Front face
(c) Rear face
Figure 8. Locations of LVDT
df dr
Lh
a = 1100mm
è1 è2
(a): Angle of twist at a section èi = (df+dr)/Lh
(b): Rate of twist ø = ( è2 – è1)/a
Figure 9. Deformation of beam section due to torsion
87
The Journal of Engineering Research Vol. 5, No.1, (2008) 79-96
analysis. Measured values of a concrete cube compressivestrength and steel tensile strength were used. The concretecylinder compressive strength, Young's modulus,Poisson's ratio, concrete tensile strength, shear retentionand tension stiffening were used as explained in Section3.
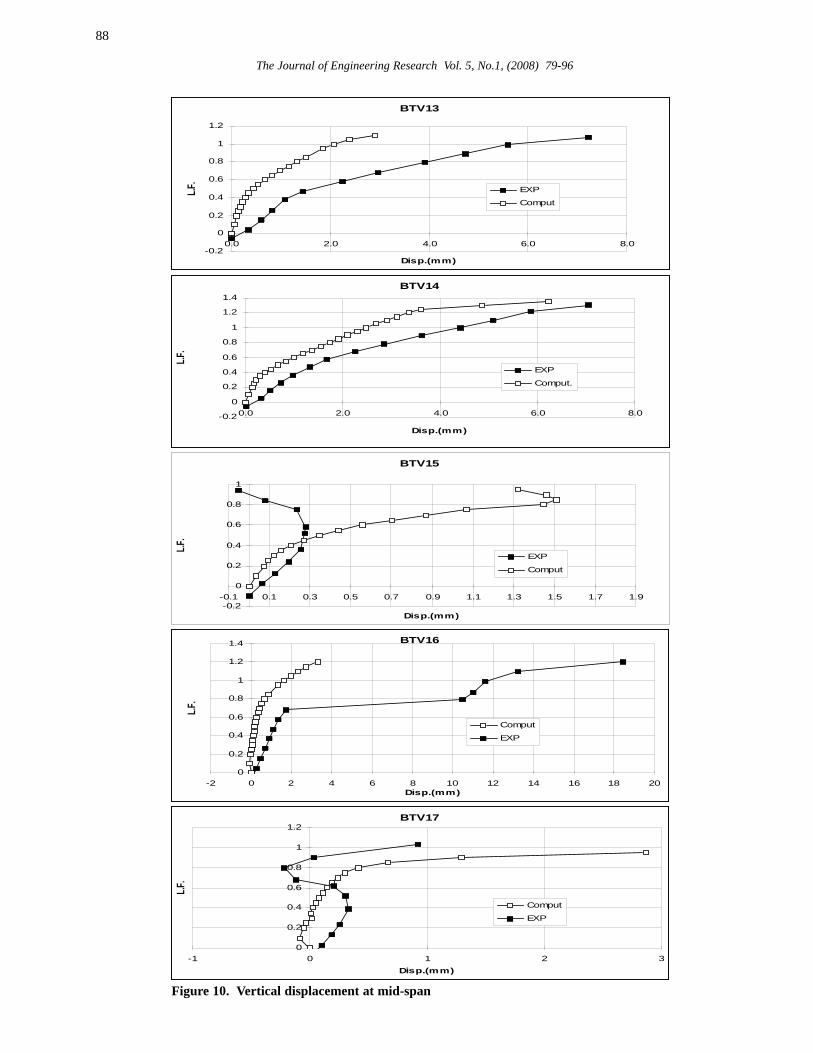
6.1 Load Displacement Relationship Figure 10 shows the vertical measured and computed
displacements at the centre of the bottom face of eachbeam. It is clear from this figure that a good agreementwas achieved between experimental and computationalresults for beam BTV14. In the case of beams BTV13 andBTV16 the program predicted stiffer behaviour than themeasured. The measured values from beams BTV15 andBTV17 were small and difficult to compare with the pre-dicted values. With exception to the computed displace-ment of BTV16, measured and computed displacementsof all beams with bending dominant (Td /Md<1) (BTV13,BTV14 and BTV16) reached the displacement limit ofspan/250.
The beams with torsion dominant (Td /Md>1) (BTV15and BTV17) experienced measured and computed rela-tively smaller displacements and did not reach thespan/250 limit.
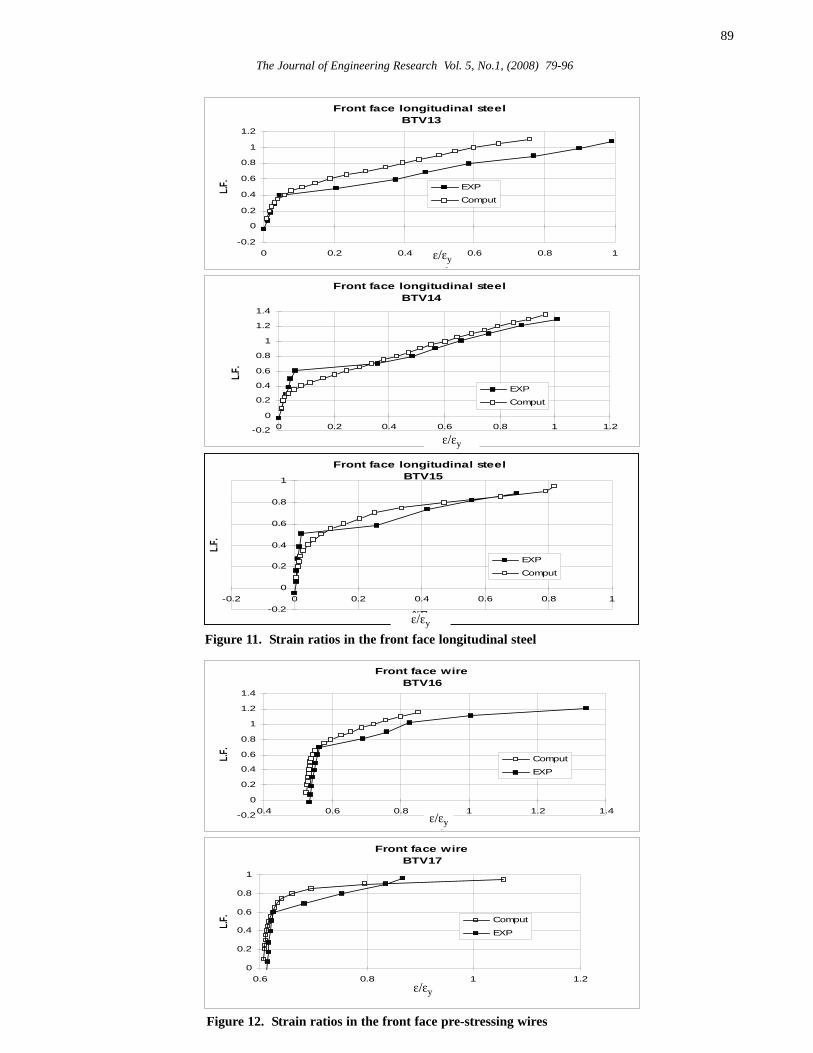
6.2 Strain in the Longitudinal SteelFigure 11 shows a good agreement between the exper-
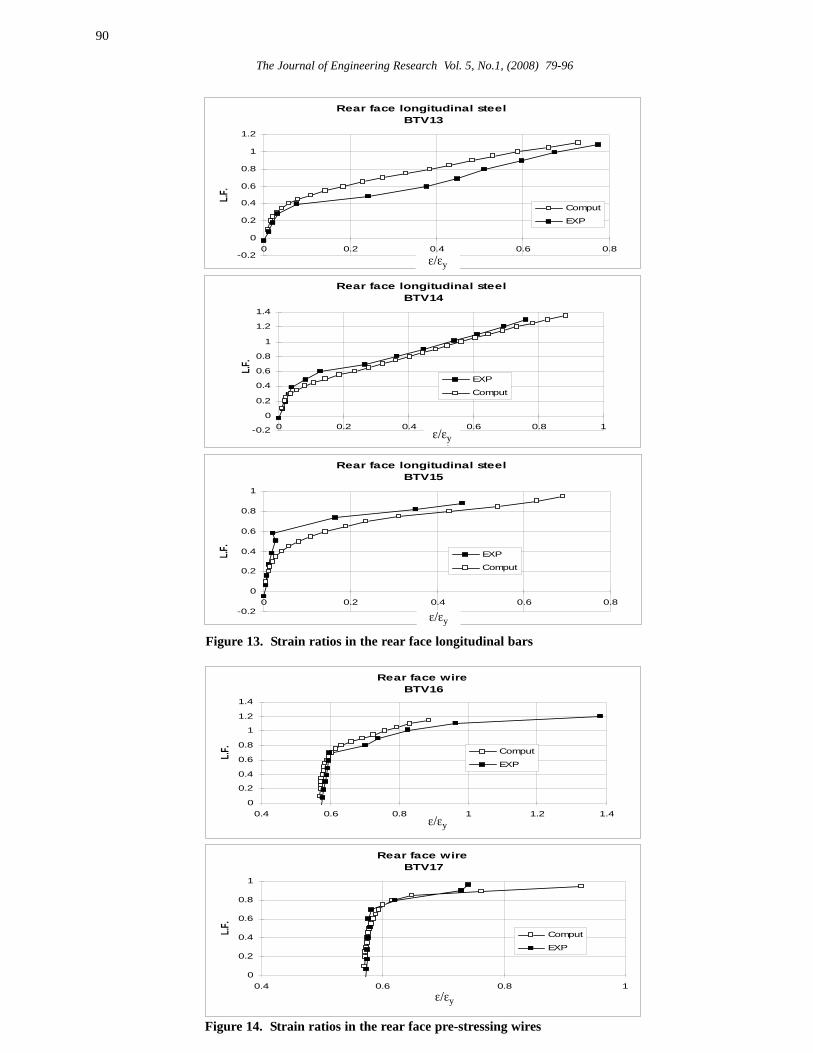
imental and computational results in the reinforced con-crete beams for the longitudinal steel in the front face.Figure 12 shows an acceptable agreement between themeasured and predicted strains in the pre-stressing wiresof beams BTV16 and BTV17. In the beams with Td /Md<1, the longitudinal steel or prestressing wires in thefront face yielded or reached yield strain while slightlyless strain was recorded in the ones with Td /Md>1. Figure13 shows a very good agreement in the strain ratiosbetween the measured and predicted values of the rein-forced beams in the rear face. Figure 14 shows goodagreement in the case of rear face partially pre-stressedbeams. In most cases, measured and predicted resultsshow longitudinal bars or pre-stressing wires in the frontfaces, yielded or reached near yield strain. In the rearface, only the prestressing wires in BTV16 yielded whilein the rest of the beams strain was below the yield strain.
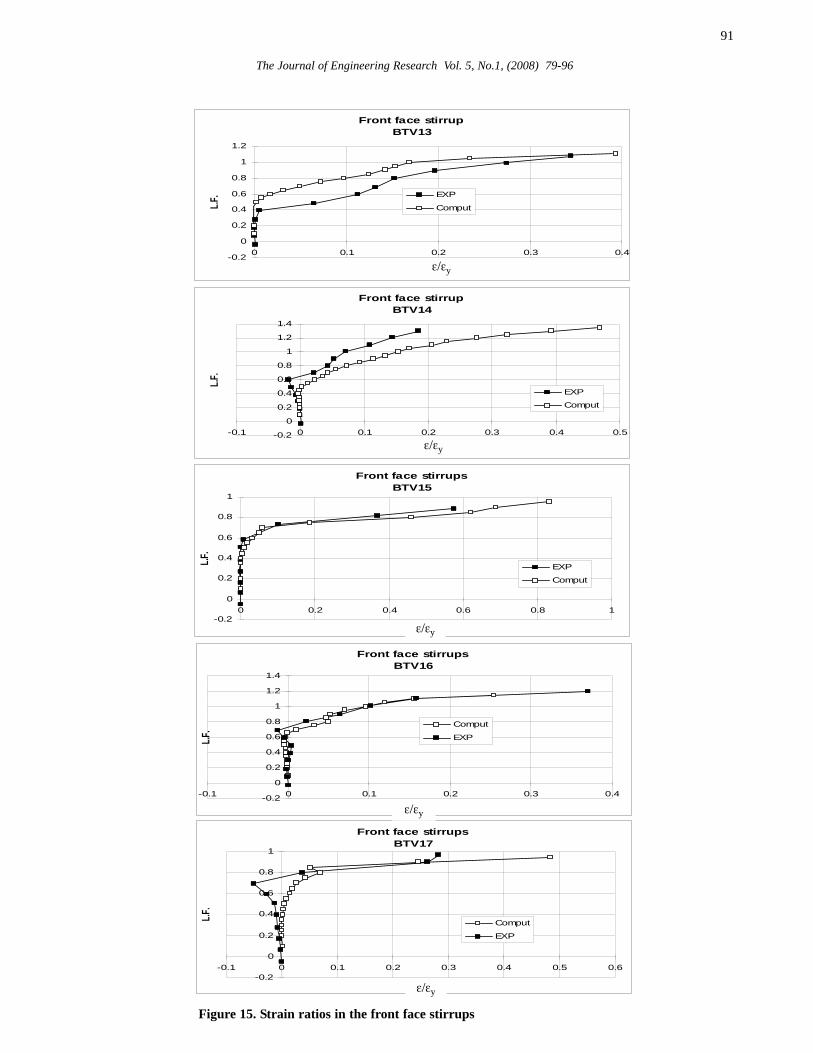
6.3 Strain in Transverse SteelFigure 15 shows strain ratios in the front face trans-
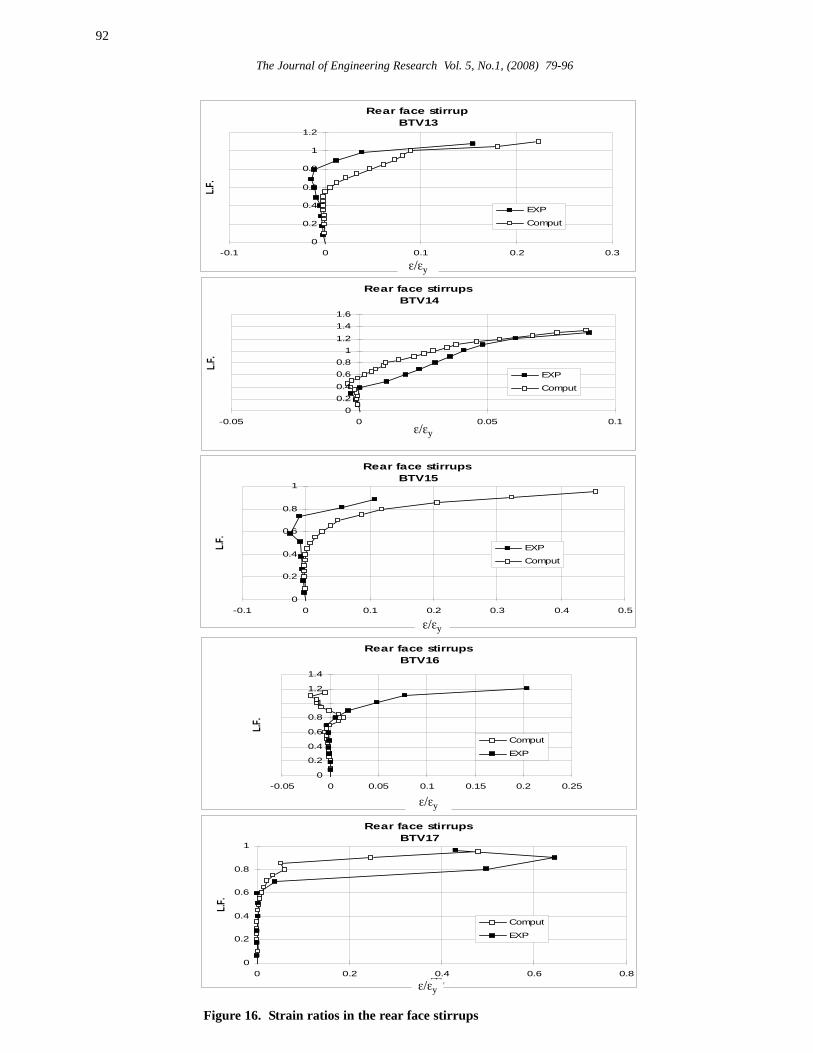
verse steel; in general, a very good agreement betweenexperimental and computational results was achieved.With exception to BTV16, the transverse steel in the frontface yielded or reached near yield strain. Figure 16 showsstrain ratios in the rear face transverse steel; a good agree-ment was achieved between the measured and predictedvalues in the case of beams BTV13, BTV14 and BTV17.In the case of BTV15, the program predicted larger values
of strain for the same load than the measured ones. Itshould be noted that both measured and predicted valuesof strain in the rear face were negligible and the steel didnot reach yield strain. This due to the fact that for practi-cal reasons, that stirrup areas required for the front facewhere shear stresses are additives were used in the rearface subtractive as well. So, the beams are over reinforcedin the transverse direction of the rear face.
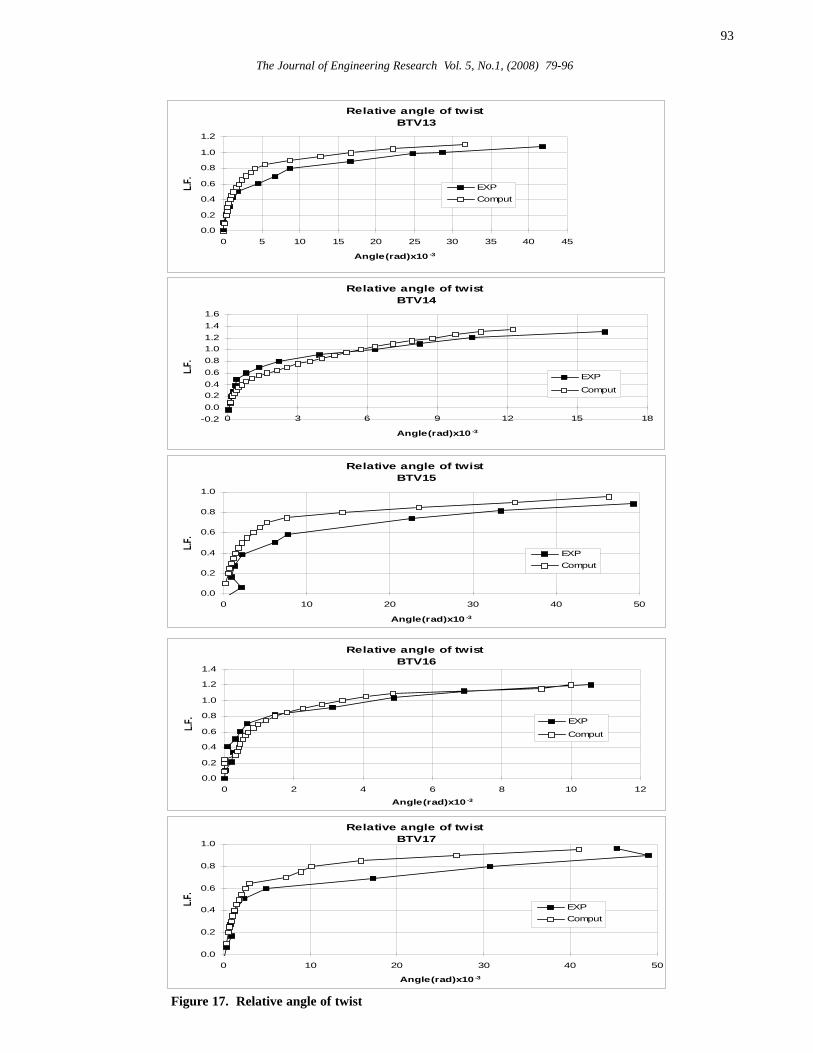
6.4 Relative Angle of TwistFigure 17 shows the experimental and computational
relative angles of twist. These angles were calculated asexplained in Section 5. It can be seen that a very goodagreement has been achieved between experimental andcomputational results in most cases. However, in beamBTV17 the observed angle was larger than the computedone. In beams where torsion was dominant (Td /Md>1) therelative angle of twist was relatively larger than when thebending was dominant (Td /Md<1). For the same loadcombination, the partially prestressed beam BTV16 expe-rienced a smaller twist than the reinforced beam BTV14.However, the difference in the case of beams BTV15 andBTV17 was negligible.
6.5 Failure LoadColumn 4 of Table 3 shows a very good agreement
between the measured Le and computed Lc failure loads.All beams failed near their design loads.
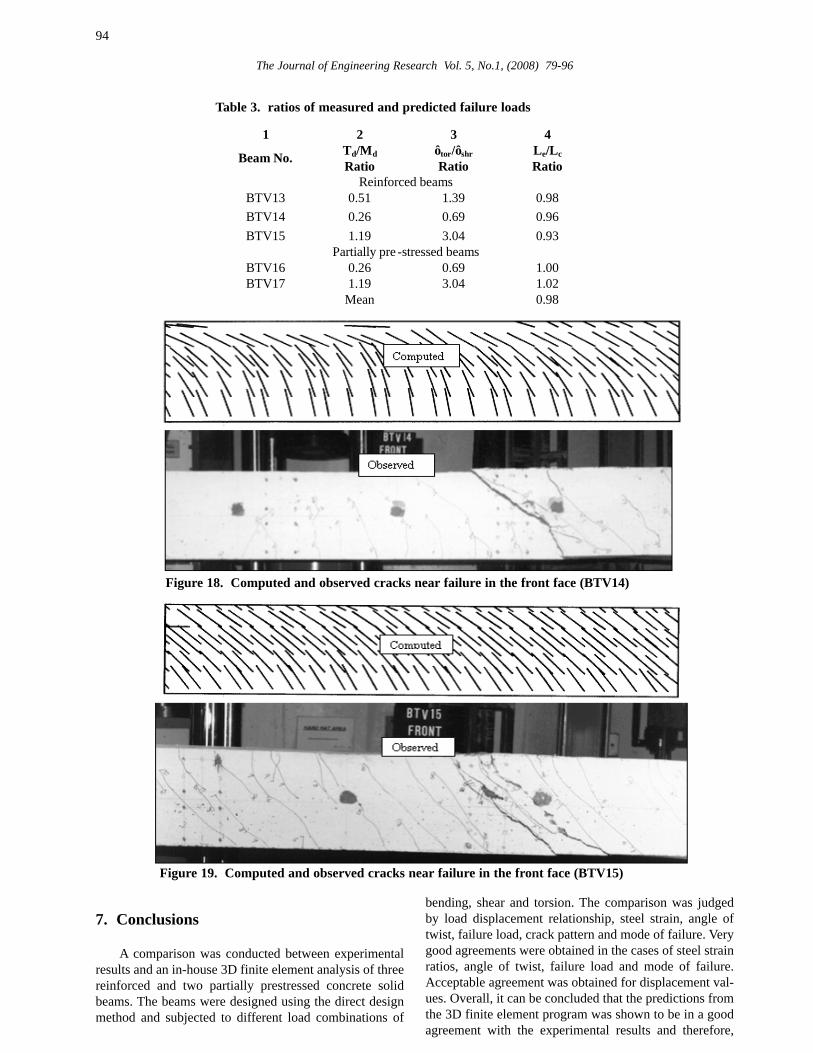
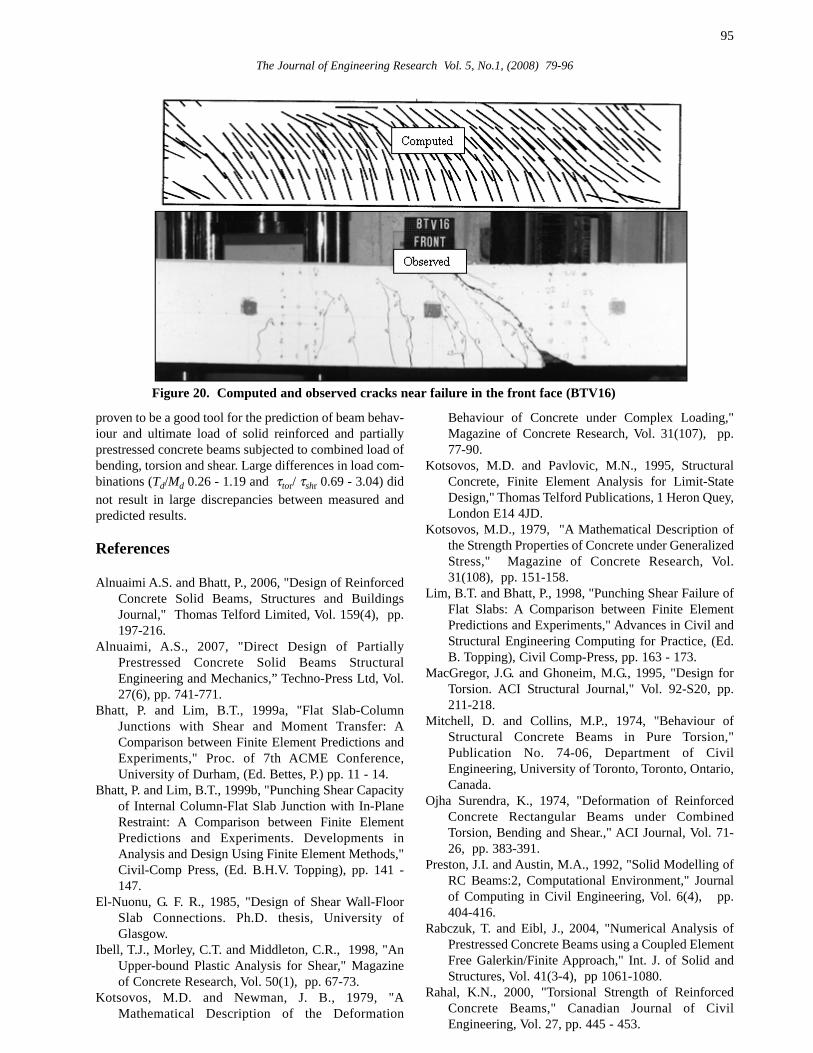
6.6 Crack Pattern and Mode of FailureBoth the computed and measured results showed that
in the case of beams in which bending was dominant(Td /Md<1) almost vertical cracks started in the bottomface and at the lower half of the front and rear sides. Thesecracks were followed by inclined cracks in succeedingload increments until they first appear and in the topflange at about 80% of a failure load. In the beams wheretorsion was dominant (Td /Md>1), inclined cracks extend-ed into the bottom face one increment after they wereformed in the front and rear sides. In both groups, thesmaller the ratio Td /Md, the closer is the angle of crack tovertical. Figures 18-20 show typical computed andobserved crack development of the tested beams. Thecomputed and observed cracks shown are taken at the loadincrement just before failure. In beams BTV13, BTV14and BTV16 the mode of failure was mostly flexural wherethe beam experienced relatively large displacement andthe flexural steel yielded. A small number of large crackscaused failure at the time of flexural steel yielding.Beams BTV15 and BTV17 failed by diagonal crackingdue to high torsional shear stress and the failure mode wasless ductile with small displacement, less longitudinalsteel strain and larger transverse steel strain than the bend-ing dominant beams. It is clear that a good agreementbetween the observed and computed cracks was achievedon the intensity and direction of cracks.
88
The Journal of Engineering Research Vol. 5, No.1, (2008) 79-96
BTV13
-0.2
0
0.2
0.4
0.6
0.8
1
1.2
0.0 2.0 4.0 6.0 8.0
Disp.(mm)
L.F.
EXP
Comput
BTV14
-0.2
0
0.2
0.4
0.6
0.8
1
1.2
1.4
0.0 2.0 4.0 6.0 8.0
Disp.(mm)
L.F.
EXP
Comput.
BTV15
-0.2
0
0.2
0.4
0.6
0.8
1
-0.1 0.1 0.3 0.5 0.7 0.9 1.1 1.3 1.5 1.7 1.9
Disp.(mm)
L.F.
EXP
Comput
BTV16
0
0.2
0.4
0.6
0.8
1
1.2
1.4
-2 0 2 4 6 8 10 12 14 16 18 20Disp.(mm)
L.F.
Comput
EXP
BTV17
0
0.2
0.4
0.6
0.8
1
1.2
-1 0 1 2 3Disp.(mm)
L.F.
Comput
EXP
Figure 10. Vertical displacement at mid-span
89
The Journal of Engineering Research Vol. 5, No.1, (2008) 79-96
Front face longitudinal steel
BTV13
-0.2
0
0.2
0.4
0.6
0.8
1
1.2
0 0.2 0.4 0.6 0.8 1◊◊ y
L.F.
EXP
Comput
Front face longitudinal steelBTV14
-0.2
0
0.2
0.4
0.6
0.8
1
1.2
1.4
0 0.2 0.4 0.6 0.8 1 1.2
◊◊ y
L.F.
EXP
Comput
Front face longitudinal steel BTV15
-0.2
0
0.2
0.4
0.6
0.8
1
-0.2 0 0.2 0.4 0.6 0.8 1
◊◊ y
L.F.
EXP
Comput
Figure 11. Strain ratios in the front face longitudinal steel
Front face wire
BTV16
-0.2
0
0.2
0.4
0.6
0.8
1
1.2
1.4
0.4 0.6 0.8 1 1.2 1.4
ΗΗψψ⎤⎤y
L.F.
Comput
EXP
Front face wireBTV17
0
0.2
0.4
0.6
0.8
1
0.6 0.8 1 1.2
ΗΗψψ⎤⎤ y
L.F.
Comput
EXP
Figure 12. Strain ratios in the front face pre-stressing wires
ε/εy
ε/εy
ε/εy
ε/εy
ε/εy
90
The Journal of Engineering Research Vol. 5, No.1, (2008) 79-96
Rear face longitudinal steel
BTV13
-0.2
0
0.2
0.4
0.6
0.8
1
1.2
0 0.2 0.4 0.6 0.8ΗΗψψ⎤⎤y
L.F.
Comput
EXP
Rear face longitudinal steelBTV14
-0.2
0
0.2
0.4
0.6
0.8
1
1.2
1.4
0 0.2 0.4 0.6 0.8 1
ΗΗψψ⎤⎤y
L.F.
EXP
Comput
Rear face longitudinal steelBTV15
-0.2
0
0.2
0.4
0.6
0.8
1
0 0.2 0.4 0.6 0.8
ΗΗψψ⎤⎤y
L.F.
EXP
Comput
Figure 13. Strain ratios in the rear face longitudinal bars
Rear face wire
BTV16
0
0.2
0.4
0.6
0.8
1
1.2
1.4
0.4 0.6 0.8 1 1.2 1.4
ΗΗψψ⎤⎤ y
L.F.
Comput
EXP
Rear face wireBTV17
0
0.2
0.4
0.6
0.8
1
0.4 0.6 0.8 1
ΗΗψψ⎤⎤y
L.F.
Comput
EXP
Figure 14. Strain ratios in the rear face pre-stressing wires
ε/εy
ε/εy
ε/εy
ε/εy
ε/εy
91
The Journal of Engineering Research Vol. 5, No.1, (2008) 79-96
Front face stirrupBTV13
-0.2
0
0.2
0.4
0.6
0.8
1
1.2
0 0.1 0.2 0.3 0.4
y
L.F. EXP
Comput
Front face stirrupBTV14
-0.2
0
0.2
0.4
0.6
0.8
1
1.2
1.4
-0.1 0 0.1 0.2 0.3 0.4 0.5
y
L.F.
EXP
Comput
Front face stirrupsBTV15
-0.2
0
0.2
0.4
0.6
0.8
1
0 0.2 0.4 0.6 0.8 1
y
L.F.
EXP
Comput
Front face stirrups
BTV16
-0.2
0
0.2
0.4
0.6
0.8
1
1.2
1.4
-0.1 0 0.1 0.2 0.3 0.4
y
L.F. Comput
EXP
Front face stirrupsBTV17
-0.2
0
0.2
0.4
0.6
0.8
1
-0.1 0 0.1 0.2 0.3 0.4 0.5 0.6
y
L.F.
Comput
EXP
Figure 15. Strain ratios in the front face stirrups
ε/εy
ε/εy
ε/εy
ε/εy
ε/εy
92
The Journal of Engineering Research Vol. 5, No.1, (2008) 79-96
Rear face stirrup
BTV13
0
0.2
0.4
0.6
0.8
1
1.2
-0.1 0 0.1 0.2 0.3≅≅&& y
L.F.
EXP
Comput
Rear face stirrupsBTV14
00.20.40.60.8
11.21.41.6
-0.05 0 0.05 0.1
≅≅&& y
L.F.
EXP
Comput
Rear face stirrupsBTV15
0
0.2
0.4
0.6
0.8
1
-0.1 0 0.1 0.2 0.3 0.4 0.5≅≅&& y
L.F.
EXP
Comput
Rear face stirrups
BTV16
0
0.2
0.4
0.6
0.8
1
1.2
1.4
-0.05 0 0.05 0.1 0.15 0.2 0.25
≅≅ y
L.F.
Comput
EXP
Rear face stirrupsBTV17
0
0.2
0.4
0.6
0.8
1
0 0.2 0.4 0.6 0.8≅≅ y
L.F.
Comput
EXP
Figure 16. Strain ratios in the rear face stirrups
ε/εy
ε/εy
ε/εy
ε/εy
ε/εy
93
The Journal of Engineering Research Vol. 5, No.1, (2008) 79-96
Relative angle of twistBTV13
0.0
0.2
0.4
0.6
0.8
1.0
1.2
0 5 10 15 20 25 30 35 40 45
Angle(rad)x10 -3
L.F.
EXPComput
Relative angle of twistBTV14
-0.20.00.20.40.60.81.01.21.41.6
0 3 6 9 12 15 18
Angle(rad)x10 -3
L.F.
EXP
Comput
Relative angle of twistBTV15
0.0
0.2
0.4
0.6
0.8
1.0
0 10 20 30 40 50
Angle(rad)x10 -3
L.F.
EXPComput
Relative angle of twistBTV16
0.0
0.2
0.4
0.6
0.8
1.0
1.2
1.4
0 2 4 6 8 10 12
Angle(rad)x10 -3
L.F. EXP
Comput
Relative angle of twistBTV17
0.0
0.2
0.4
0.6
0.8
1.0
0 10 20 30 40 50
Angle(rad)x10 -3
L.F.
EXPComput
Figure 17. Relative angle of twist
94
The Journal of Engineering Research Vol. 5, No.1, (2008) 79-96
7. Conclusions
A comparison was conducted between experimentalresults and an in-house 3D finite element analysis of threereinforced and two partially prestressed concrete solidbeams. The beams were designed using the direct designmethod and subjected to different load combinations of
bending, shear and torsion. The comparison was judgedby load displacement relationship, steel strain, angle oftwist, failure load, crack pattern and mode of failure. Verygood agreements were obtained in the cases of steel strainratios, angle of twist, failure load and mode of failure.Acceptable agreement was obtained for displacement val-ues. Overall, it can be concluded that the predictions fromthe 3D finite element program was shown to be in a goodagreement with the experimental results and therefore,
1 2 3 4 Td/Md ôtor/ôshr Le/Lc Beam No. Ratio Ratio Ratio
Reinforced beams BTV13 0.51 1.39 0.98 BTV14 0.26 0.69 0.96 BTV15 1.19 3.04 0.93
Partially pre -stressed beams BTV16 0.26 0.69 1.00 BTV17 1.19 3.04 1.02
Mean 0.98
Table 3. ratios of measured and predicted failure loads
Figure 18. Computed and observed cracks near failure in the front face (BTV14)
Figure 19. Computed and observed cracks near failure in the front face (BTV15)
95
The Journal of Engineering Research Vol. 5, No.1, (2008) 79-96
proven to be a good tool for the prediction of beam behav-iour and ultimate load of solid reinforced and partiallyprestressed concrete beams subjected to combined load ofbending, torsion and shear. Large differences in load com-binations (Td/Md 0.26 - 1.19 and τtor/ τshr 0.69 - 3.04) didnot result in large discrepancies between measured andpredicted results.
References
Alnuaimi A.S. and Bhatt, P., 2006, "Design of ReinforcedConcrete Solid Beams, Structures and BuildingsJournal," Thomas Telford Limited, Vol. 159(4), pp.197-216.
Alnuaimi, A.S., 2007, "Direct Design of PartiallyPrestressed Concrete Solid Beams StructuralEngineering and Mechanics,” Techno-Press Ltd, Vol.27(6), pp. 741-771.
Bhatt, P. and Lim, B.T., 1999a, "Flat Slab-ColumnJunctions with Shear and Moment Transfer: AComparison between Finite Element Predictions andExperiments," Proc. of 7th ACME Conference,University of Durham, (Ed. Bettes, P.) pp. 11 - 14.
Bhatt, P. and Lim, B.T., 1999b, "Punching Shear Capacityof Internal Column-Flat Slab Junction with In-PlaneRestraint: A Comparison between Finite ElementPredictions and Experiments. Developments inAnalysis and Design Using Finite Element Methods,"Civil-Comp Press, (Ed. B.H.V. Topping), pp. 141 -147.
El-Nuonu, G. F. R., 1985, "Design of Shear Wall-FloorSlab Connections. Ph.D. thesis, University ofGlasgow.
Ibell, T.J., Morley, C.T. and Middleton, C.R., 1998, "AnUpper-bound Plastic Analysis for Shear," Magazineof Concrete Research, Vol. 50(1), pp. 67-73.
Kotsovos, M.D. and Newman, J. B., 1979, "AMathematical Description of the Deformation
Behaviour of Concrete under Complex Loading,"Magazine of Concrete Research, Vol. 31(107), pp.77-90.
Kotsovos, M.D. and Pavlovic, M.N., 1995, StructuralConcrete, Finite Element Analysis for Limit-StateDesign," Thomas Telford Publications, 1 Heron Quey,London E14 4JD.
Kotsovos, M.D., 1979, "A Mathematical Description ofthe Strength Properties of Concrete under GeneralizedStress," Magazine of Concrete Research, Vol.31(108), pp. 151-158.
Lim, B.T. and Bhatt, P., 1998, "Punching Shear Failure ofFlat Slabs: A Comparison between Finite ElementPredictions and Experiments," Advances in Civil andStructural Engineering Computing for Practice, (Ed.B. Topping), Civil Comp-Press, pp. 163 - 173.
MacGregor, J.G. and Ghoneim, M.G., 1995, "Design forTorsion. ACI Structural Journal," Vol. 92-S20, pp.211-218.
Mitchell, D. and Collins, M.P., 1974, "Behaviour ofStructural Concrete Beams in Pure Torsion,"Publication No. 74-06, Department of CivilEngineering, University of Toronto, Toronto, Ontario,Canada.
Ojha Surendra, K., 1974, "Deformation of ReinforcedConcrete Rectangular Beams under CombinedTorsion, Bending and Shear.," ACI Journal, Vol. 71-26, pp. 383-391.
Preston, J.I. and Austin, M.A., 1992, "Solid Modelling ofRC Beams:2, Computational Environment," Journalof Computing in Civil Engineering, Vol. 6(4), pp.404-416.
Rabczuk, T. and Eibl, J., 2004, "Numerical Analysis ofPrestressed Concrete Beams using a Coupled ElementFree Galerkin/Finite Approach," Int. J. of Solid andStructures, Vol. 41(3-4), pp 1061-1080.
Rahal, K.N., 2000, "Torsional Strength of ReinforcedConcrete Beams," Canadian Journal of CivilEngineering, Vol. 27, pp. 445 - 453.
Figure 20. Computed and observed cracks near failure in the front face (BTV16)

96
The Journal of Engineering Research Vol. 5 No.1, (2008) 79-96
Rahal, K.N. and Collins, M.P., 1995, "Analysis ofSections Subjected to Combined Shear and Torsion ,"A Theoretical Model. ACI Structural Journal, Vol.92(4), pp. 459-469.
Thurlimann, B., 1979, "Torsional Strength of Reinforcedand Prestressed Concrete Beams-CEB Approach,"Institut fur Baustatik und konstruktion, ETH. Zurich.,Vol. 92, pp 117-143. Also can be found in: AmericanConcrete Institute, Detroit, SP59.