Embed Size (px)
Citation preview

FINITE ELEMENT ANALYSIS AND EXPERIMENTAL VALIDATION OF REINFORCED
CONCRETE SINGLE-MAT SLABS SUBJECTED TO BLAST LOADS
A THESIS IN
Civil Engineering
Submitted to the Faculty of the University of Missouri-Kansas City in partial fulfillment of
requirements for the degree of MASTER OF SCIENCE
by
Gunjan Ashok Shetye
Bachelor of Civil Engineering (B.E.)
University of Mumbai - Sardar Patel College of Engineering
University of Missouri-Kansas City
2012-13

Copyright © by Gunjan Ashok Shetye
2012-13

iii
FINITE ELEMENT ANALYSIS AND EXPERIMENTAL VALIDATION OF REINFORCED
CONCRETE SINGLE-MAT SLABS SUBJECTED TO BLAST LOADS
Gunjan Ashok Shetye, Candidate for the Master of Science Degree,
University of Missouri- Kansas City
ABSTRACT
The work done in this research is to study the response of reinforced concrete slabs
subjected to blast loading as they can be used as protective structures around the main
structure. An experimental investigation has been performed in a separate study involving
blast-testing of 12 reinforced concrete slabs in a shock tube (Blast Load Simulator). The data
from this experimental investigation was made available for performing advanced finite
element analysis done in this research to study the behavior of these slabs towards blast
loading.
A non-linear transient dynamic finite element analysis program LS-DYNA® is used for
this study. The finite element models of these 12 slab panels are developed in LS-DYNA® and
blast pressures equivalent to those generated in the experiment are applied to them. These slabs
include two material combinations based on their strength namely, the high-strength concrete
reinforced with high-strength steel slabs and normal-strength concrete reinforced with normal-
strength steel slabs. The primary objective is to study the response of material combinations to
blast loading by using two different concrete material models available in LS-DYNA namely,
Winfrith Concrete Model and Concrete Damage Model Release 3 and comparing it with the
experimental results. Validation of these models with experimental data will provide a

iv
numerical analysis procedure which will be less expensive and safer than performing blast
testing.
On performing this study, finite element analysis and experimental validation of
reinforced concrete single-mat slabs subjected to blast loading it is concluded that the Winfrith
Concrete Model predicts a better response in terms of deflection and crack propagation for both
normal and high strength concrete. Concrete Damage Model Release 3 needs additional
parameters to be defined based on concrete laboratory testing data for it to predict a better
response in the normal-strength and high-strength category. These additional parameters have
been developed and recommended in this study.

v
APPROVAL PAGE
The faculty listed below, appointed by the Dean of the School of Computing and
Engineering have examined a thesis titled “Finite Element Analysis and Experimental Validation
of Reinforced Concrete Single-Mat Slabs Subjected to Blast Loads,” presented by Gunjan Ashok
Shetye, candidate for Master of Science in Civil Engineering, and certify that in their opinion it
is worthy of acceptance.
Supervisory Committee
Ganesh Thiagarajan, Ph.D., P.E., Committee Chair
Departmentof Civil and Mechnical Engineering
Ceki Halmen, Ph.D., P.E.
Departmentof Civil and Mechnical Engineering
ZhiQiang Chen, Ph.D.
Departmentof Civil and Mechnical Engineering

vi
TABLE OF CONTENTS
ABSTRACT .......................................................................................................................iii
LIST OF ILLUSTRATIONS ............................................................................................. ix
LIST OF TABLES ........................................................................................................... xvi
ACKNOWLEDGEMENTS ............................................................................................ xvii
CHAPTER .............................................................................................................................
1. INTRODUCTION ........................................................................................................... 1
1.1 An Overview on Blast Effects on Structures ..................................................... 1
1.2 Significance of Studying Blast Effects on Reinforced Concrete Slabs ............. 2
1.3 Proposed Solution .............................................................................................. 3
1.4 Thesis Organization ............................................................................................ 5
2. LITERATURE SURVEY ............................................................................................... 7
3. OBJECTIVE AND SCOPE ........................................................................................... 14
3.1 Problem Statement ............................................................................................... 14
3.2 Objective .............................................................................................................. 14
3.3 Tasks .................................................................................................................... 16
4. EXPERIMENTAL INVESTIGATION ........................................................................ 18
4.1 Materials .............................................................................................................. 19
4.2 Methods ................................................................................................................ 21
4.3 Experimental Data ............................................................................................... 22

vii
5. NUMERICAL MODELING IN LS-DYNA® .............................................................. 24
5.1 Significance of Numerical Modeling in LS-DYNA® ......................................... 24
5.2 Geometric Models ................................................................................................ 25
5.3 Boundary Conditions ........................................................................................... 32
5.4 Material Models in LS-DYNA® ......................................................................... 35
5.5 Blast Load Application in LS-DYNA® ............................................................... 50
6. NUMERICAL analysis RESULTS and comparison with Experiments ....................... 52
6.1 Comparison Criterion 1; Peak Deflection for Slab .............................................. 52
6.2 Comparison Criterion 2; Crack Propagation Study ........................................... 112
7. DISCUSSION OF RESULTS ..................................................................................... 128
7.1 High-Strength Concrete – Comparison of Model with 1 in. (25.4 mm.) Mesh to ½ in. (12.7 mm.) Mesh Model. ............................................................................................ 128
7.2 High Strength Concrete – Comparison of Winfrith Concrete Model with Concrete Damage Release 3. ............................................................................................... 129
7.3 Normal Strength Concrete – Comparison of model with 1 in. (25.4 mm.) mesh to ½ in. (12.7 mm.) mesh model. ............................................................................................. 129
7.4 Normal Strength Concrete – Comparison of Winfrith Concrete Model with Concrete Damage Release 3. ............................................................................................... 130
7.5 Comparison of High Strength Material with Normal Strength Material. ......... 130
7.6 Comparison of Slabs with 4 in. (101.6 mm.) c/c Longitudinal Steel to 8 in. (203.2 mm.) c/c Longitudinal Steel. ................................................................................................ 131
7.7 Comparison for validation of numerical analysis by studying damage response .............................................................................................................................................. 132
8. CONCLUSIONS AND FUTURE WORK .................................................................. 133

viii
8.1 Future Scope of Work ........................................................................................ 135
APPENDIX A - Pressure and Impulse Data for 12 Slabs ............................................... 136
APPENDIX B - Pressure and Impulse Plots for 12 RC Slabs ........................................ 137
APPENDIX C - Summary Tables ................................................................................... 143
APPENDIX D – LS-DYNA INPUT ............................................................................... 145
REFERENCES ................................................................................................................ 152
VITA ............................................................................................................................... 155

ix
LIST OF ILLUSTRATIONS
Figure Page
4-1: Reinforced Concrete Slab with 4 in. Type Single Layer of Steel ......................................... 20
4-2: Reinforced Concrete Slab with 8 in. Type Single Layer of Steel .......................................... 20
4-3 : Blast Load Simulator (Shock Tube) at US Army ERDC ..................................................... 21
4-4: Post-test damage patterns observed on Slab # 7 .................................................................... 23
5-1: Single-Mat Reinforced Concrete slab model with Solid Elements 1 in. (25.4 mm.) mesh size ....................................................................................................................................................... 27
5-2: Single-Mat Reinforced Concrete slab model with Solid Elements 1/2 in. (12.7 mm.) mesh size. ................................................................................................................................................ 27
5-3: Single-Mat Reinforced Concrete slab model with Solid Elements 1/4 in. (6.35 mm.) mesh size. ................................................................................................................................................ 28
5-4: Single layer reinforcement in 4 in. type single-mat RC slab ................................................. 28
5-5: Single layer reinforcement in 8 in. type single-mat RC slab ................................................. 29
5-6: Boundary conditions on the front face of slab ....................................................................... 33
5-7: Boundary conditions on the back face of the slab ................................................................. 34
5-8: Boundary conditions on the top and bottom face of the slab ................................................. 34
5-9 : Pressure Versus Volumetric Strain Curve for Equation of State Form 8 with compaction for 11.6 ksi concrete ............................................................................................................................ 48
5-10 Pressure Versus Volumetric Strain Curve for Equation of State Form with compaction for 5 Ksi concrete ................................................................................................................................... 49
6-1: Deflection Comparison between 1 in. (25.4 mm.) and 1/2 in. (12.7 mm.) mesh sizes for Concrete Damage Model Release 3 and Experimental Deflection for Slab#1 – HSC-V1-4in. .... 56

x
6-2: Deflection Comparison between 1 in. (25.4 mm.) and 1/2 in. (12.7 mm.) mesh sizes for Winfrith Concrete Model and Experimental Deflection for Slab#1 – HSC-V1-4in. .................... 57
6-3: Deflection Comparison between Concrete Damage Model Release 3 and Winfrith Concrete for 1 in. (25.4 mm.) mesh model with Experimental Deflection for Slab#1 – HSC-V1-4in. ....... 58
6-4: Deflection Comparison between Concrete Damage Model Release 3 and Winfrith Concrete for 1/2 in. (12.7 mm.) mesh model with Experimental Deflection for Slab#1 – HSC-V1-4in. .... 59
6-5: Deflection Comparison between 1 in. (25.4 mm.) and 1/2 in. (12.7 mm.) mesh sizes for Concrete Damage Model Release 3 and Experimental Deflection for Slab#3 – HSC-V2-4in. .... 60
6-6: Deflection Comparison between 1 in. (25.4 mm.) and 1/2 in. (12.7 mm.) mesh sizes for Winfrith Concrete Model and Experimental Deflection for Slab#3 – HSC-V2-4in. .................... 61
6-7: Deflection Comparison between Concrete Damage Model Release 3 and Winfrith Concrete for 1 in. (25.4 mm.) mesh model with Experimental Deflection for Slab#3 – HSC-V2-4in. ....... 62
6-8: Deflection Comparison between Concrete Damage Model Release 3 and Winfrith Concrete for 1/2 in. (12.7 mm.) mesh model with Experimental Deflection for Slab#3 – HSC-V2-4in. .... 63
6-9: Deflection Comparison between Concrete Damage Model Release 3 and Winfrith Concrete for 1 in. (25.4 mm.) mesh model with Experimental Deflection for Slab#1 – HSC-V1-4in and Slab#3 – HSC-V2-4in. .................................................................................................................. 63
6-10 : Deflection Comparison between 1 in. (25.4 mm.) and 1/2 in. (12.7 mm.) mesh sizes for Concrete Damage Model Release 3 and Experimental Deflection for Slab#5 – HSC-V3-4in. .... 65
6-11: Deflection Comparison between 1 in. (25.4 mm.) and 1/2 in. (12.7 mm.) mesh sizes for Winfrith Concrete Model and Experimental Deflection for Slab#5 – HSC-V3-4in. .................... 66
6-12: Deflection Comparison between Concrete Damage Model Release 3 and Winfrith Concrete for 1 in. (25.4 mm.) mesh model with Experimental Deflection for Slab#5 – HSC-V3-4in. ....... 68
6-13: Deflection Comparison between Concrete Damage Model Release 3 and Winfrith Concrete for 1/2 in. (12.7 mm.) mesh model with Experimental Deflection for Slab#5 – HSC-V3-4in. .... 68
6-14: Deflection Comparison between 1 in. (25.4 mm.) and 1/2 in. (12.7 mm.) for mesh sizes for Concrete Damage Model Release 3 and Experimental Deflection for Slab#7 – HSC-V4-8in. .... 69
6-15: Deflection Comparison between 1 in. (25.4 mm.) and 1/2 in. (12.7 mm.) mesh sizes for Winfrith Concrete Model and Experimental Deflection for Slab#7 – HSC-V4-8in. .................... 70

xi
6-16: Deflection Comparison between Concrete Damage Model Release 3 and Winfrith Concrete for 1 in. (25.4 mm.) mesh model with Experimental Deflection for Slab#7 – HSC-V4-8in. ....... 72
6-17: Deflection Comparison between Concrete Damage Model Release 3 and Winfrith Concrete for 1/2 in. (12.7 mm.) mesh model with Experimental Deflection Slab#7 – HSC-V4-8in. .......... 72
6-18: Deflection Comparison between Concrete Damage Model Release 3 and Winfrith Concrete for 1 in. (25.4 mm.) mesh model with Experimental Deflection for Slab#5 – HSC-V3-4in. and Slab#7 – HSC-V4-8in. .................................................................................................................. 73
6-19: Deflection Comparison between 1 in. (25.4 mm.) and 1/2 in. (12.7 mm.) mesh sizes for Concrete Damage Model Release 3 and Experimental Deflection for Slab#9 – HSC-V5-8in. .... 75
6-20: Deflection Comparison between 1 in. (25.4 mm.) and 1/2 in. (12.7 mm.) for mesh sizes Winfrith Concrete Model and Experimental Deflection for Slab#9 – HSC-V5-8in. .................... 76
6-21: Deflection Comparison between Concrete Damage Model Release 3 and Winfrith Concrete for 1 in. (25.4 mm.) mesh model with Experimental Deflection for Slab#9 – HSC-V5-8in. ....... 77
6-22: Deflection Comparison between Concrete Damage Model Release 3 and Winfrith Concrete for 1/2 in. (12.7 mm.) mesh model with Experimental Deflection Slab#9 – HSC-V5-8in. .......... 78
6-23: Deflection Comparison between 1 in. (25.4 mm.) and 1/2 in. (12.7 mm.) mesh sizes for Concrete Damage Model Release 3 and Experimental Deflection for Slab#11– HSC-V6-8in. ... 79
6-24: Deflection Comparison between 1 in. (25.4 mm.) and 1/2 in. (12.7 mm.) mesh sizes for Winfrith Concrete Model and Experimental Deflection for Slab#11 – HSC-V6-8in. .................. 80
6-25: Deflection Comparison between Concrete Damage Model Release 3 and Winfrith Concrete for 1 in. (25.4 mm.) mesh model with Experimental Deflection for Slab#11 – HSC-V6-8in. ..... 81
6-26: Deflection Comparison between Concrete Damage Model Release 3 and Winfrith Concrete for 1/2 in. (12.7 mm.) mesh model with Experimental Deflection Slab#11 – HSC-V6-8in. ........ 82
6-27: Deflection Comparison between Concrete Damage Model Release 3 and Winfrith Concrete for 1 in. (25.4 mm.) mesh model with Experimental Deflection for Slab#9 – HSC-V5-8in and Slab#11 – HSC-V6-8in. ................................................................................................................ 82
6-28: Deflection Comparison between 1 in. (25.4 mm.) and 1/2 in. (12.7 mm.) mesh sizes for Concrete Damage Model Release 3 and Experimental Deflection for Slab#2 – RSC-R1-4in. .... 85
6-29: Deflection Comparison between 1 in. (25.4 mm.) and 1/2 in. (12.7 mm.) mesh sizes for Winfrith Concrete Model and Experimental Deflection for Slab#2 – RSC-R1-4in. .................... 86

xii
6-30: Deflection Comparison between Concrete Damage Model Release 3 and Winfrith Concrete for 1 in. (25.4 mm.) mesh model with Experimental Deflection for Slab#2 – RSC-R1-4in. ........ 88
6-31: Deflection Comparison between Concrete Damage Model Release 3 and Winfrith Concrete for 1/2 in. (12.7 mm.) mesh model with Experimental Deflection Slab#2– RSC-R1-4in. ........... 88
6-32: Deflection Comparison between 1 in. (25.4 mm.) and 1/2 in. (12.7 mm.) mesh sizes for Concrete Damage Model Release 3 and Experimental Deflection for Slab#4 – RSC-R2-4in. .... 89
6-33: Deflection Comparison between 1 in. (25.4 mm.) and 1/2 in. (12.7 mm.) mesh sizes for Winfrith Concrete Model and Experimental Deflection for Slab#4 – RSC-R2-4in. .................... 90
6-34: Deflection Comparison between Concrete Damage Model Release 3 and Winfrith Concrete for 1 in. (25.4 mm.) mesh model with Experimental Deflection for Slab#4 – RSC-R2-4in. ........ 92
6-35: Deflection Comparison between Concrete Damage Model Release 3 and Winfrith Concrete for 1/2 in. (12.7 mm.) mesh model with Experimental Deflection Slab#4– RSC-R2-4in. ........... 92
6-36: Deflection Comparison between Concrete Damage Model Release 3 and Winfrith Concrete for 1 in. (25.4 mm.) mesh model with Experimental Deflection for Slab#2 – RSC-R1-4in. and Slab#4 – RSC-R2-4in. ................................................................................................................... 93
6-37: Deflection Comparison between 1 in. (25.4 mm.) and 1/2 in. (12.7 mm.) for mesh sizes Concrete Damage Model Release 3 and Experimental Deflection for Slab#6 – RSC-R3-4in. .... 95
6-38: Deflection Comparison between 1 in. (25.4 mm.) and 1/2 in. (12.7 mm.) mesh sizes for Winfrith Concrete Model and Experimental Deflection for Slab#6 – RSC-R3-4in. .................... 96
6-39: Deflection Comparison between Concrete Damage Model Release 3 and Winfrith Concrete for 1 in. (25.4 mm.) mesh model with Experimental Deflection for Slab#6 – RSC-R3-4in. ........ 97
6-40: Deflection Comparison between Concrete Damage Model Release 3 and Winfrith Concrete for 1/2 in. (12.7 mm.) mesh model with Experimental Deflection Slab#6– RSC-R3-4in. ........... 98
6-41: Deflection Comparison between 1 in. (25.4 mm.) and 1/2 in. (12.7 mm.) mesh sizes for Concrete Damage Model Release 3 and Experimental Deflection for Slab#8 – RSC-R4-8in. .... 99
6-42 : Deflection Comparison between 1 in. (25.4 mm.) and 1/2 in. (12.7 mm.) mesh sizes for Winfrith Concrete Model and Experimental Deflection for Slab#8 – RSC-R4-8in. .................. 100
6-43: Deflection Comparison between Concrete Damage Model Release 3 and Winfrith Concrete for 1 in. (25.4 mm.) mesh model with Experimental Deflection for Slab#8 – RSC-R4-8in. ...... 101

xiii
6-44: Deflection Comparison between Concrete Damage Model Release 3 and Winfrith Concrete for 1/2 in. (12.7 mm.) mesh model with Experimental Deflection for Slab#8 – RSC-R4-8in. .. 102
6-45: Deflection Comparison between 1 in. (25.4 mm.) and 1/2 in. (12.7 mm.) mesh sizes for Concrete Damage Model Release 3 and Experimental Deflection for Slab#10 – RSC-R5-8in. 103
6-46: Deflection Comparison between 1 in. (25.4 mm.) and 1/2 in. (12.7 mm.) mesh sizes for Winfrith Concrete Model and Experimental Deflection for Slab#10 – RSC-R5-8in. ................ 104
6-47: Deflection Comparison between Concrete Damage Model Release 3 and Winfrith Concrete for 1 in. (25.4 mm.) mesh model with Experimental Deflection for Slab#10 – RSC-R5-8in. .... 105
6-48: Deflection Comparison between Concrete Damage Model Release 3 and Winfrith Concrete for 1/2 in. (12.7 mm.) mesh model with Experimental Deflection for Slab#10 – RSC-R5-8in. 106
6-49 : Deflection Comparison between 1 in. (25.4 mm.) and 1/2 in. (12.7 mm.) mesh sizes for Concrete Damage Model Release 3 and Experimental Deflection for Slab#12 – RSC-R6-8in. 107
6-50: Deflection Comparison between 1 in. (25.4 mm.) and 1/2 in. (12.7 mm.) mesh sizes for Winfrith Concrete Model and Experimental Deflection for Slab#12 – RSC-R6-8in. ................ 108
6-51: Deflection Comparison between Concrete Damage Model Release 3 and Winfrith Concrete for 1 in. (25.4 mm.) mesh model with Experimental Deflection for Slab#12 – RSC-R6-8in. .... 109
6-52: Deflection Comparison between Concrete Damage Model Release 3 and Winfrith Concrete for 1/2 in. (12.7 mm.) mesh model with Experimental Deflection for Slab#12 – RSC-R6-8in. 110
6-53: Deflection Comparison between Concrete Damage Model Release 3 and Winfrith Concrete for 1 in. (25.4 mm.) mesh model with Experimental Deflection for Slab#10 – RSC-R5-8in. and Slab#12 – RSC-R6-8in. ............................................................................................................... 110
6-54: Damage crack patters for Slab # 1 from (a) Concrete Damage Rel3 Model, (b) Experiment and (c) Winfrith Concrete Model ................................................................................................ 113
6-55: Damage crack patters for Slab # 3 from (a) Concrete Damage Rel3 Model, (b) Experiment and (c) Winfrith Concrete Model ................................................................................................ 114
6-56: Damage crack patters for Slab # 5 from (a) Concrete Damage Rel3 Model, (b) Experiment and (c) Winfrith Concrete Model ................................................................................................ 115
6-57: Damage crack patters for Slab # 7 from (a) Concrete Damage Rel3 Model, (b) Experiment and (c) Winfrith Concrete Model ................................................................................................ 117

xiv
6-58: Damage crack patters for Slab # 9 from (a) Concrete Damage Rel3 Model, (b) Experiment and (c) Winfrith Concrete Model ................................................................................................ 118
6-59: Damage crack patters for Slab # 11 from (a) Concrete Damage Rel3 Model, (b) Experiment and (c) Winfrith Concrete Model ............................................................................ 119
6-60: Damage crack patters for Slab # 2 from (a) Concrete Damage Rel3 Model, (b) Experiment and (c) Winfrith Concrete Model ................................................................................................ 121
6-61: Damage crack patters for Slab # 4 from (a) Concrete Damage Rel3 Model, (b) Experiment and (c) Winfrith Concrete Model ................................................................................................ 122
6-62: Damage crack patters for Slab # 6 from (a) Concrete Damage Rel3 Model, (b) Experiment and (c) Winfrith Concrete Model ................................................................................................ 123
6-63: Damage crack patters for Slab # 8 from (a) Concrete Damage Rel3 Model, (b) Experiment and (c) Winfrith Concrete Model ................................................................................................ 125
6-64: Damage crack patters for Slab # 10 from (a) Concrete Damage Rel3 Model, (b) Experiment and (c) Winfrith Concrete Model ............................................................................ 126
6-65: Damage crack patters for Slab # 12 from (a) Concrete Damage Rel3 Model, (b) Experiment and (c) Winfrith Concrete Model ............................................................................ 127
B-1 : Average Pressure-time History for Slab # 1. ...................................................................... 137
B-2: Average Pressure-time History for Slab # 2. ....................................................................... 137
B-3: Average Pressure-time History for Slab # 3. ....................................................................... 138
B-4: Average Pressure-time History for Slab # 4. ....................................................................... 138
B-5: Average Pressure-time History for Slab # 5. ....................................................................... 139
B-6: Average Pressure-time History for Slab # 6. ....................................................................... 139
B-7: Average Pressure-time History for Slab # 7. ....................................................................... 140
B-8: Average Pressure-time History for Slab # 8. ....................................................................... 140
B-9: Average Pressure-time History for Slab # 9. ....................................................................... 141

xv
B-10: Average Pressure-time History for Slab # 10. ................................................................... 141
B-11: Average Pressure-time History for Slab # 11. ................................................................... 142
B-12: Average Pressure-time History for Slab # 12. ................................................................... 142
D-1: Input and Output Control Parameters ................................................................................. 145
D-2: Input Parameters for Concrete Damage Model Release 3 for High-Strength Concrete ..... 146
D-3: Input Parameters Generated by Concrete Damage Model Release 3 for High- Strength Concrete. ...................................................................................................................................... 147
D-4: Input Parameters for Concrete Damage Model Release 3for Normal-Strength Concrete .. 148
D-5: Input Parameters Generated by Concrete Damage Model Release 3 for High-Strength Concrete ....................................................................................................................................... 149
D-6: Input Parameters for Winfrith Concrete Model for High-Strength Concrete ..................... 150
D-7: Input Parameters for Winfrith Concrete Model for Normal-Strength Concrete ................. 150
D-8: Input Parameters for Plastic-Kinematic Model for High-Strength Concrete ...................... 150
D-9: Input Parameters for Plastic-Kinematic Model for High-Strength Concrete ...................... 150
D-10: Input Parameters for Constrained Lagrange in Solid Formulation ................................... 151
D-11: Input Parameters for Mat Add Erosion Model .................................................................. 151

xvi
LIST OF TABLES
Table Page
4 1: Experimental program schedule.........................................................................................18
4 2: Designations used in Experimental Program......................................................................19
5 1: Input variables provided in *MAT_WINFRITH_CONCRETE required for defining the
plasticity model in Winfrith model for two different types of concrete......................................40
5 2: Winfrith concrete model generated Volume Compaction curve for 11.6 ksi and 5 ksi
concrete.........................................................................................................................................41
6 1: Analytical and Experimental Peak Slab Deflection Summary for High Strength
Slabs..............................................................................................................................................53
6 2: Analytical and Experimental Residual Slab Deflection Summary for High Strength
Slabs..............................................................................................................................................53
6 3: Analytical and Experimental Peak Slab Deflection Summary for Normal Strength
Slabs..............................................................................................................................................53
6 4: Analytical and Experimental Residual Slab Deflection Summary for Normal Strength
Slabs..............................................................................................................................................54
6 5: Percentage Comparison of Peak Slab Deflections with the Experimental Value for High
Strength
Slabs..............................................................................................................................................55
6 6: Percentage Change in Peak Slab Deflection when the Mesh Size was Reduced from 1 in.
(25.4mm.) to ½ in. (12.7 mm.) for High Strength Slabs..............................................................55
6 7: Percentage comparison of deflections with the experimental value for normal strength
slabs...............................................................................................................................................84
6 8: Percentage change in deflection when the mesh size was reduced from 1 in. (25.4mm.) to
½ in. (12.7 mm.) for normal strength slabs...................................................................................84
C 1: Input Parameters for Winfrith Concrete Model.................................................................143
C 2: Input parameters for Concrete Damage Model Release 3................................................144
C 3: Input Parameters for Plastic Kinematic Model for Steel Rebar.........................................144

xvii
ACKNOWLEDGEMENTS
It is a pleasure to thank all those who helped me to complete this thesis.
It is with immense gratitude that I acknowledge the guidance and encouragement of my
advisor, Dr. Ganesh Thiagarajan throughout the length of my education and research at
University of Missouri – Kansas City. His constant support and valuable insights made the
completion of thesis possible.
I am grateful to Dr. Ceki Halmen and Dr. Zhiqiang Chen for serving as the members on
the supervisory committee providing valuable inputs and suggestions. I am thankful to School of
Computing and Engineering for providing necessary facilities to pursue research studies for this
thesis.
I like to express my deepest gratitude to my senior lab mates Dr. Yun Kai Lu, Dr.
Michael Eilers, Rasekh Rahimzadeh, Anirudha Kadmabi and Jitesh Nalagotla for their inspiring
research work which motivated me and developed my interest in doing research and giving me
the opportunity to learn from them. I am also thankful to all my wonderful lab mates Kevin
Buck, Vidya Sridhar, Pranav Vishnumolakala, Qiwei Cao, Harsh Shah, Bhargav Javvaji, Mayuri
Patil, Timothy Hines, Bhavani Ramneedi and Aritra for the fun and memorable moments in the
research lab. I owe my sincere thanks to my dear friends Priya and Raghu for their moral
support throughout my studies at UMKC.
I also wish to thank all my family members and friends for their support. Most
importantly, I owe my loving thanks to my parents Ashok and Vidya Shetye, my brother Ruchir
Shetye and my grandparents for their encouragement, patience and understanding throughout my
studies abroad. To them I dedicate this thesis.

1
CHAPTER 1
INTRODUCTION
1.1 An Overview on Blast Effects on Structures
The need to design blast resistant civilian structures has arisen due to aggressor
attacks on many civilian structures around the world. The April 19th, 1995 Oklahoma City
bombing incident which destroyed Alfred P. Murrah building and the February 26, 1993
bombing on the North tower building of World Trade Center in New York City are two of
the many aggressor attacks from the past two decades [1]. The collapse of the structural
elements notwithstanding the blast loading has been the reason behind claiming lives of the
building inhabitants. In order to minimize the damage to structural systems in such event, an
efficient design approach considering the blast loading design should be adopted. Although
military structures have been designed for blast loading in the past, it has become important
to develop design guidelines which are feasible for implementing in civilian structures as
most of the civilian and Government buildings pose a potential threat of attack. Design
guidelines such as DoD Minimum Antiterrorism Standards for Buildings, UFC 4-010-01
have established standards providing minimum levels of protection under terrorist attacks
for the Department of Defense buildings [2]. These recommended guidelines are certainly
extended to design of military facilities but application of blast-effects mitigation
technologies from military to civilian structures should also be made feasible. The National
Research Council explains the term blast-effects mitigation as the reduction in the severity
of effects of an explosion on a structure resulting from having taken specified blast
hardening measures to reduce or eliminate the effects of an explosion [3]. For this reason, it
2
is necessary to have an upgrade in the performance of the buildings under blast loadings.
Extensive research is carried out in the blast field for finding best alternatives for design of
building components such as slabs, beams, columns, wall panels, etc. Such considerations
are critical for structures consisting offices, educational institutions, recreational facilities,
etc. which house human population in large numbers and thus prone to aggressor attacks.
1.2 Significance of Studying Blast Effects on Reinforced Concrete Slabs
An explosion near or within the building can have disastrous effects by damaging the
structure’s external or internal structural framework, collapsing walls, debris and shutting
down of fire-safety and life-safety systems. One solution would be to strengthen the
structure itself to resist total failure in case of an explosion near or inside it. Strengthening
the structure can make it less economical for its practical application on a wide scale.
Mlakar et al, in his report on analysis of blast damage caused to Alfred P. Murrah building
during the Oklahoma City Bombing, has evaluated the effect of the blast caused by the truck
bomb on the buildings structural frame [1]. Major damage was caused to the column in the
vicinity of the blast while the structural bays above and below each floor slabs were filled
with blast induced pressures. The upward load that built on each slab because of the pressure
difference below and above the slab caused a maximum deflection of 9.3 in. in the upward
direction which exceeded its ultimate load capacity and thus led to collapse of the slab.
Reinforced concrete slabs are an important element of the structural system which requires
strengthening against blast loading as they are one of the basic members. Also, protective
wall panels around main structures are like reinforced concrete slabs. Hence, studying the
behavior of slabs by analyzing its dynamic behavior under short duration and high peak

3
value blast loads is the motivation behind this research study. Advanced analysis methods
have been employed by structural designers around the world to assess the structural
integrity of their design when subjected to blast loading. In order to achieve blast resistant
technology advanced analysis procedure should be developed through research to make it
easily applicable. This objective of adopting advanced analysis methods for evaluating
civilian structures can be achieved through experimental studies, theoretical analyses and
advanced numerical simulation approaches for predicting blast loads and the responses of
structural systems.
1.3 Proposed Solution
Experiments and theory are necessary for prediction of blast effects and quantifying
the structural response based on the explosion and its interaction with the structure. The
outcome can be utilized in developing computational approaches for estimating structural
response to an explosion. Computational approaches are far less expensive than the
experiments. Validation of such computational approaches by experiment is necessary to
make computational approaches completely reliable. Military organizations have conducted
numerous experiments for validating these computer programs over the years but the tests
were performed relevant to military structures and their applicability to civilian structures,
which can be much more complex, needs further investigation.
This research involves strengthening an important component of a structural system,
a reinforced concrete slab by making use of high strength material and comparing it with
normal strength material by performing experimental and analytical studies. The
effectiveness in resisting blast loading of such a strengthened slab is analyzed using

4
computer based Finite Element Method (FEM). In this method, discretization of the problem
by dividing it into subdomains called elements, interconnected by nodes is carried out to
deal with complex geometries. A non-linear transient dynamic finite element analysis
program code LS-DYNA® is used in this research. The LS-DYNA® program has numerous
features for analyzing the model by defining pressure-time histories generated in the blast
event. The material properties description for the two materials, concrete and steel can be
defined using commercially available material models. The concrete material models
considered in this study are Concrete Damage Model Release 3 and Winfrith Concrete
Model [4]. A plastic kinematic model was used for modeling the steel.
Initially an experimental investigation was carried out on twelve single-mat
reinforced concrete RC slab panels at the U.S. Army Engineering Research and
Development Center, Vicksburg, MS. The twelve slab panels consisted of two distinct sets
of six panels each. One set included High Strength Concrete reinforced with High Strength
Steel Reinforcing bars (HSC-V) while the other set included Normal Strength Concrete
reinforced with Normal Strength Steel Reinforcing bars (NSC-R). Also each set had two
different reinforcement ratios. The first set had #3 bars spaced at 4 inch (101.6 mm.) while
the second set had #3 bars spaced at 8 inch (203.2 mm.). The experimental work involved
testing of two sets of reinforced concrete panels by subjecting them to pressure conditions
equivalent to those in a blast load. Blast load conditions were generated by a shock tube
(Blast Load Simulator) at the U.S. Army Engineering Research & Development Center,
Vicksburg, MS. The experimental data collected for this testing includes pressure versus
time history at 6 locations on the slab, displacement at mid-span measured using laser

5
deflection gages and accelerometers, strains measured at two locations using strain gages
and photos and videos showing damage crack patterns for each slab.
1.4 Thesis Organization
This thesis is organized as follows.
1. Chapter 1 introduces the subject of this thesis which is about finite element analysis
and experimental validation of reinforced concrete single mat slabs subjected to blast
loading.
2. Chapter 2 gives the details of the literature reviewed in this thesis.
3. Chapter 3 defines the objective and scope of thesis.
4. Chapter 4 provides the details for experimental investigation program conducted by
Dr. Ganesh Thiagarajan, Principal Investigator for this project at U.S. Army
Engineer Research and Development Center at Vicksburg, MS. The experimental
investigation was not performed as a part of this thesis and hence the information
obtained is discussed in detail. The information on the types of reinforced concrete
panels, the equipment used for applying blast pressures and the various types of data
collected is presented. The data obtained from this experimental program is used in
this research for performing numerical analysis.
5. Chapter 5 discusses the numerical modeling of the reinforced concrete slabs in detail.
The significance of the software used for modeling and analysis, the geometry of the
finite element models, the various mesh sizes adopted and the material models used
for modeling the concrete and steel is addressed in this chapter.

6
6. Chapter 6 provides the observations and results of numerical simulations performed
using LS-DYNA®. The results are provided for different combinations of two
different concrete models and three different mesh sizes for the 12 reinforced
concrete slab panels.
7. Chapter 7 discusses the results presented in Chapter 6
8. Chapter 8 draws the conclusions based on the analysis of results and gives details on
future work.

7
CHAPTER 2
LITERATURE SURVEY
Improving blast resistance of buildings has been a topic of interest among
researchers. The objective has been to design protective technologies which can be easily
implemented. The effort has been driven to develop a knowledge base which can be made
easily available to structural designers. Crawford and Lan [5] have described technologies
which have been evaluated and proven to improve blast resistance of buildings by adopting
engineering techniques. Based on their study of blast and impact effects testing and
numerical modeling, they recommended the development of high-fidelity physics-based
(HFPB) finite element models. These models provide sophisticated representation of the
behaviors involved in a blast event and also validation of these models using impacts and
blast test is stated to be significant to arrive at the blast resistant solutions. The three key
design issues for developing new concepts, identified in their paper, are; ductility and plastic
behavior, shock related behaviors, and use of standard materials in a non-standard way. The
phenomena of shock related behavior response of reinforced concrete slab systems in which
supports must accommodate large loads in short time is addressed by them as the subject of
attention.
Hao and Zhongxian [6] performed numerical analysis of dynamic behavior of RC
slabs under blast loading. They numerically investigated the influence of slab dimension,
concrete strength, and reinforcement ratios on the slab response to blast loading. They
concluded that a reasonable increase in slab thickness can improve the blast carrying

8
capacity of RC slabs. They have recommended modifications for slab dimensions and
reinforcement ratios.
Mosalam and Mosallam [7] developed computational models for reinforced concrete
(RC) slabs using finite element method. They carried out non-linear transient analysis for
investigating the effects of retrofitting the RC slabs with carbon fiber reinforced polymer
(CFRP) as compared to as-built RC slabs to mitigate the effects of blast loading. The
computational models were verified using experimental results. The results of non-linear
transient analysis using these computational models proved the efficiency of the CFRP
composite retrofits in improving the slab behavior under blast loading. The maximum
displacement reduced by 40-70% with the CFRP retrofit compared to the as-built slab.
Agardh [8] presented results of experiments and FE-simulations on fiber reinforced
concrete slabs subjected to blast loads. Their study aimed at accurate FE modeling of the
behavior of such elements loaded by transient dynamic loads. The results of blast
experiments performed in a shock tube on steel fibre and conventionally reinforced concrete
slabs were used for validation of codes and material models. LS-DYNA® and
ABAQUS®/explicit were the two codes used. Winfrith concrete model for LS-DYNA® and
Constitutive model for brittle cracking in ABAQUS®/Explicit were the two models used for
this study. The numerical simulations provided accurate results for variables like,
displacements for low loads and the ability to predict failure loads. They also recommended
the omission of strain rate effects as the distance between the slabs and charge was large
causing the strain rate effect to be insignificant.
Kuang [9] modeled only a quarter of the three dimensional solid FE model of the RC
slab due to its symmetry and performed numerical simulations by applying blast loading in

9
LS-DYNA®. Kuang employed Johnson-Holmquist Concrete (H-J-C) [4] model for concrete
to account for damage and strain rate effect. Also, for modeling the spallation process they
used erosion technique in LS-DYNA®. Comparison of their numerical simulation results
with the blast test results have demonstrated the effectiveness of predicting the response of
reinforced concrete sections to blast loads by using numerical simulations.
El-Dakhakhni [10] studied the validity of Single-Degree-of-Freedom (SDOF)
models for analyzing the response of two-way reinforced concrete panels under blast
loading. In their study, a single-degree-of-freedom SDOF model, based on the guidelines of
the UFC 3-340-02 is used [2]. RC panels with different dimensions, aspect and
reinforcement ratios, and support conditions were considered. Their finite element FE model
for concrete utilized the parameter generation capability of
*MAT_CONCRETE_DAMAGE_REL3 (mat type 72R3) model whereas the steel was
modeled using PLASTIC_KINEMATIC (mat type 003) material model in LS-DYNA® [4].
They validated their FE model with experiments previously reported by Razaqpur (2006).
The response predictions were compared to the results of nonlinear explicit finite-element
(FE) analyses and significant differences in deflection and shear predictions were observed.
The work presented in this paper is expected to contribute to improving the modeling
provisions of the two-way RC panels in the future edition of the UFC 3-340-02 by
understanding the limitations of SDOF models and overcoming them using advanced FE
analysis techniques. The limitations of SDOF model which are suggested to be overcome by
adopting FE analysis are the inclusion of accounting for different failure modes i.e. shear,
bar slippage, etc., and material strength enhancement due to strain rate effects.

10
Over the last few decades significant research has been conducted to account for
concrete material properties in finite element models developed for concrete structures. It is
essential to have knowledge of behavior of concrete structures to a pre-defined loading
condition to replicate the exact behavior in the finite element model. The first step towards
this type of study is to conduct laboratory experiments with a definite control over the
structural parameters and collection of accurate results of the outcome. The laboratory test
results can then be used to calibrate the available computer models. Malvar and Schwer [11]
reported an outcome of a similar study which compared well characterized 45.6 MPa
unconfined compressive strength concrete parameters obtained in laboratory test with the
corresponding material response from the commercial K & C concrete model in LS-
DYNA® [4]. Recommendations were made on using the model parameter generation
capability of Mat72R3 which requires only unconfined compressive strength of concrete to
be given as input.
Tanapornaweekit [12] performed blast analysis on 1.19m X 2.19m X 0.14m RC
panel by conducting a 500kg TNT testing at Woomera, South Australia. In their study the
blast properties were predicted by computer programs AIR3D and CONWEP and they were
compared to pressures measured by pressure transducers in the test. Similarly, the RC panel
was modeled and analyzed in LS-DYNA® and the deflection of the panel was compared to
the deflections obtained in the blast tests. To model the concrete material for the panel
*MAT_CONCRETE_DAMAGE_REL3 model which considers three failure surface
surfaces namely maximum shear failure surface, residual failure surface and initial yield
surface is adopted due to its automatic parameter generation capability [4]. A total of eight
surface parameters obtained by automatic input data generation based on concrete

11
compressive strength of 40 MPa were reported. The three equations which define the three
failure surfaces namely maximum failure, residual failure and yield failure surfaces, are
discussed in this thesis. The dependability of stress difference at each failure surface on the
pressure in a particular element is evident from the parameter values generated for their
model. The steel is modeled using *MAT_PLASTIC_KINEMATIC model [4]. A full bond
between concrete and steel is assumed by sharing nodes between concrete and steel
reinforcement. The FE model reports a maximum and rebound deflections of tested panels
as 30 mm and 4 mm respectively which corresponds well with the 36mm and 5mm reported
by the experiment thus, showing a difference of 17% in the maximum deflection in both
results. This study demonstrated the capability of the software package to simulate the
structural behavior of a RC panel under explosion.
Zhou and Kuznetsov [13] adopted a dynamic plastic damage model of concrete for
their study on both ordinary reinforced and high-strength steel fiber reinforced concrete slab.
Their concrete material model is developed using derived parameters based on
characteristics like strain-rate effect, definition of damage, concrete strength envelope and
equation of strength for concrete received from different static and dynamic material testing
and material models used by other researchers. Initially they have modeled the detonation
and the blast wave propagation in a 2D simulation. The blast wave model is then applied to
the slab model in a 3D numerical simulation as two sequential similar blast events. The
numerical results thus obtained for the response of the slabs are compared to the explosive
tests conducted by the Weapons Systems Division, Department of Australia. They found
that the numerical results compared well with the tests for t < 2ms; when t > 2ms the

12
numerical results underestimated the ultimate deflection of the slab on both normal RC and
the high strength Steel Fiber Reinforced Concrete (SFRC) slabs from the first blast.
Broadhouse [14] in his report on development of Winfrith Concrete Model in LS-
DYNA® state that a pressure versus volumetric strain curve should be given as input
parameter in order to determine the hydrostatic stress state in concrete [4]. This curve is
called Volume Compaction Curve and is introduced in the material parameters for Winfrith
Model. Similarly, Gebbeken and Ruppert [15] also recommended a necessity to input an
equation of state to ensure laws of conservation on which numerical simulations are based.
Experimental investigations are however very expensive and require testing apparatus which
is not readily available. Therefore, it is essential to develop finite element models which can
be used for analysis in accurate prediction of structural response under the constraints of
available material parameters; the choice of available material models, exact boundary
conditions, and description of reinforcement bonding with concrete. The results obtained
from relevant research work have thus been surveyed in this research.
Low and Hao [16] performed a reliability study for analyzing the dynamic behavior
of reinforced concrete structural slab subjected to blast loading to account for the various
uncertainties involved in accurately predicting the response to blast loading. The need for
incorporating the random effects associated with material, geometry and loading into
analysis for more realistic estimation was the objective of their research. A slab designed to
behave as a flexural member was subjected to blast loading generated by an explosion at
some distance above the slab. For simplifying the analysis they assumed uniformly
distributed pressure loading. They also accounted for strain rate effect on material strength
to account for rapid loading rate. The study was performed by setting up of displacement

13
and strain performance functions for an equivalent SDOF system. The SDOF model is
verified using finite element analysis performed using Monte Carlo simulations. Parametric
studies have been performed on the verified model to identify parameters that have
significant impact on the performance of the slab which demonstrated that increasing the
thickness of slab and percentage of steel reinforcement and reducing the slab rigidity by
changing its support conditions have positive effects on the performance of flexural
response of RC slabs subjected to dynamic loading.
The literature reviewed here indicates that the different types of blast mitigation
techniques have been performed previously and each of them have been evaluated using
either finite element modeling or SDOF system to study the effects of dynamic loading on
reinforced concrete slabs. In this thesis a combination of these techniques involving two
different strength materials, two different reinforcement ratios, two different mesh sizes, two
different material models and a comparison of numerical analysis to the experimental results
are performed under one study to validate the numerical approach.

14
CHAPTER 3
OBJECTIVE AND SCOPE
3.1 Problem Statement
Finite element modeling of reinforced concrete slabs to accurately predict their
structural response to dynamic loads is a challenging task. In order to capture the rapidly
changing material behavior of reinforced concrete slab in a dynamic response it becomes
necessary to give exact material description of material parameters given as input to the
model. This requires comprehensive material testing to be performed in the laboratory to
achieve accurate characteristic material properties which is difficult to achieve. Hence,
inherent material model descriptions of commercially available codes have to be utilized to
study the behavior and response of FE slab models developed. Validation of these material
models by comparison of numerical analysis with experimental results is thus required.
3.2 Objective
The goal of this research is to study the effects of blast loading on Reinforced
Concrete (RC) one way slabs having single layer of reinforcement by performing Finite
Element (FE) simulations and comparing them to experimental data. The goal is achieved as
defined by the following objectives.
1. Utilize the data obtained from experimental investigation for performing
numerical modeling and analysis in LS-DYNA. The goal here is to utilize the; pressure-time
histories, deflection-time histories and damage patterns captured in the post-test
photographs.

15
2. Create a finite element geometric model of the slab having dimensions 64 in. x 34
in. x 4in. (1652 mm. x 863 mm. x 101.6 mm.) in LS-DYNA.
3. Use three uniform mesh sizes of 1 in. (25.4 mm) having 4 elements through the
slab thickness, ½ in. (12.7 mm.) having 8 elements through the slab thickness and ¼ in.
(6.35 mm.) having 16 elements through the slab thickness.
3. To study the effect of reinforcement ratio on the response by looking at two
different reinforcement ratios for each slab combination.
4. To consider two types of material combinations based on the concrete strength;
high strength concrete reinforced with high strength steel and normal strength concrete
reinforced with normal strength steel.
4. Utilize the material models in LS-DYNA namely Winfirth Concrete Model and
Concrete Damage Model Release 3 to model the concrete and Plastic Kinematic Model to
model the steel. Make use of the Constrained Lagrange in Solid formulation to model the
bond between concrete and steel.
5. A comparison is made between the two material models in LS-DYNA® and the
experimental results to recommend the best material model for accurate prediction of
response of RC slab subjected to equivalent blast pressures as the experiment. Thus,
validating the two material models using the results of experiments and provide
recommendations on using these material models for analyzing the response of RC slabs to
blast loading instead of expensive blast experiments is the goal of this study.

16
3.3 Tasks
Task 1: To utilize the information from experimental investigation; which
was not a part of this thesis. The experimental investigation was carried out on 12
Reinforced Concrete (RC) slab panels having combination of high strength concrete
reinforced with high strength steel (HSC-V) and normal strength concrete reinforced
with normal strength steel (RSC-R). The slab is a 64 in. (1625 mm.) X 34in. (864
mm.) X 4 in. (101.6 mm.) reinforced concrete panel with single-mat reinforcement.
The performance of two types of RC slabs with combinations namely normal
strength concrete (5 ksi, 34.47 MPa) with normal strength steel (60 ksi, 413.68 MPa)
and high strength concrete (15 ksi, 103.42 MPa) reinforced with high strength
vanadium steel (83 ksi, 572.26 MPa) was tested by applying blast pressures in a
Shock Tube. The pressure and impulse histories were recorded on six different
regions on the slab. The laser deflection gage at the center of the slab recorded the
deflection-time history. Accelerometers were also placed at the center of the slab to
record acceleration from which deflections were derived. Also, the strain gauges
located at quarter points of the unloaded face of the slab recorded the strain history.
Task 2: Reinforced concrete behavior is modeled using three commercially
available material models. Winfrith Concrete model and Concrete Damage Model
Release 3 is used for concrete while steel is modeled using Plastic Kinematic Model.
The effects of mesh density on the response of FE model are also studied. The
verification of FE analysis results with experimental results will primarily be based
on deflection history observed in the slab when subjected to blast pressures and

17
impulses that the experimental specimen were subjected to. The crack patterns
developed in two cases will also be compared.
Task 3: The effect of reinforcement ratio on the response is also considered
by looking at two different reinforcement ratios for each slab combination. The slabs
are spanning one-way in the longitudinal direction. First six slabs are reinforced with
#3 bars spaced at 4in. c/c (101.6 mm.) in the longitudinal direction (reinforcement
ratio = 0.68%) while the next six slabs are reinforced with #3 bars spaced at 8in. c/c
in the longitudinal direction (reinforcement ratio = 0.46%) as main steel while
shrinkage steel is #3 bars spaced at 12in (304.8 mm.) in both the slabs. Therefore,
two finite element models are developed in LS-DYNA® for two different
reinforcement ratios. They are termed as 4in. model and 8in. model referring to the
two different bar spacing.
The results obtained in this study are used for making recommendations on using
high strength materials and the two material models in LS-DYNA® for studying the effects
of blast loading on RC slabs in future.

18
CHAPTER 4
EXPERIMENTAL INVESTIGATION
The experimental investigation, done as a part of separate study, was performed on a
set of twelve 1/3 scale reinforced concrete (RC) slab panels with clear spans of 58 inch
(1473.2 mm.). The testing facility equipped with Blast Load Simulator (Shock tube) at U.S.
Army Engineer Research and Development Center at Vicksburg, MS was utilized in this
Experimental Program. The slabs were fabricated at the facility and then tested in the blast
load simulator. The schedule for the experimental program given in Table 4-1 gives details
of the 12 slabs used in the experiments. Designations used for describing the slab type are
given in Table 4-2. The date when the experiment was performed on each slab is given
along with the driver pressure and the explosion type usedin the shock tube.
Table 4-1 : Experimental program schedule Slab # Slab Type Date Driver pressure Explosion Type
1 HSC - V1 - 4in. 12/13/2010 1150 psi 100% Air
2 RSC - R1 - 4in. 12/14/2010 1150 psi 100% Air
3 HSC - V2 - 4in. 12/15/2010 1150 psi 100% Air
4 RSC - R2 - 4in. 12/16/2010 1150 psi 100% Air
5 HSC - V3 -4 in. 12/17/2010 900 psi 100% Air
6 RSC - R3 - 4in. 02/01/2011 900 psi 100% Air
7 HSC - V4 - 8in. 02/03/2011 900 psi 100% Air
8 RSC - R4 - 4in. 02/03/2011 700 psi 25% Helium
9 HSC - V5 - 8in. 02/04/2011 700 psi 25% Helium
10 RSC - R5 - 4in. 02/07/2011 750 psi 25% Helium
11 HSC - V6 - 8in. 02/08/2011 800 psi 25% Helium
12 RSC - R6 - 4in. 02/09/2011 725 psi 25% Helium

19
4.1 Materials
This experimental study was performed by Dr. Ganesh Thiagarajan, Principal
Investigator for this project. The experiments investigated the use of high-strength materials
for resisting dynamic loads as compared to the normal strength materials. The overall
dimensions for the single-mat slab panels tested which are 1/3 scale models are 64 in. (1625
mm.) X 34in. (864 mm.) X 4 in. (101.6 mm.). Two slab combinations based on the material
strength namely, high-strength material combination denoted as “HSC-V” and the normal-
strength material combination denoted as “RSC-R” were used in this study. The detailed
description of slab-designation is given in Table 4.2 below:
Table 4-2: Designations used in Experimental Program Designation Description Material strength HSC High-strength concrete 15 ksi (103.42MPa) RSC Normal-strength concrete 5 ksi (34.47MPa) V Vanadium steel rebar 83 ksi (572.26MPa) R Grade 60 Conventional rebar 60 ksi (413.68MPa) 4 in. Longitudinal bars spacing - 8 in. Longitudinal bars spacing -
Also, two different reinforcement spacing for longitudinal bars were used. The first
set of 6 slabs had #3 bars spaced at 4 inch (101.6 mm.) while the next set of 6 slabs had #3
bars spaced at 8 inch (203.2 mm.) . The detailed layout for the two types of slabs based on
the reinforcement spacing can be seen in Figure 4.1 and Figure 4.2.

20
Figure 4-1: Reinforced Concrete Slab with 4 in. Type Single Layer of Steel
Figure 4-2: Reinforced Concrete Slab with 8 in. Type Single Layer of Steel

21
4.2 Methods
The two most widely used methods for performing blast tests on structural elements
are field tests and shock tubes. Field tests have safety and security issues related to them.
Also, the measurements of blast pressures generated in the test have to be predicted using a
definite prediction model. In the experimental study, which was not a part of this thesis, the
blast load application was performed using a Blast Load Simulator (Shock Tube). Blast
Load Simulator provides a controlled generation and uniform application of blast pressures
on the face of the slab. The pressure versus time variation in both positive and negative
phases can be accurately recorded in the blast load simulator. Pressure data at six different
locations namely the four corners and two sides on the slab were recorded in this
experiment. The laser deflection measurement device and central accelerometers were used
to record the deflection on the back face of the slabs. The response of the slabs was recorded
using high speed video cameras. Also the crack patterns developed on the slab are
highlighted and recorded in photographs taken after the test for purpose of studying the
damage. The raw data captured in this experiment compiled into a usable format was
provided which was then used for the finite element modeling in this thesis. The details of
the data captured are provided in the next section.
Figure 4-3: Blast Load Simulator (Shock Tube) at US Army ERDC

22
4.3 Experimental Data
The experimental investigation of twelve 1/3 scale RC slabs involved the
measurement of following four parameters:
1. Pressure at four corners and two sides on the front face of the slab.
2. Mid-span deflections at the center of the back-face.
3. Strains at mid-way top and bottom from the center of the slab on the back-face as
can be seen in Figure 4.4.
4. Crack patterns recorded as post-blast photographs.
The pressure vs. time data was recorded at six different locations on the slab. Both
the positive and negative phases of the pressure vs. time history were recorded. The pressure
vs. time histories were recorded using pressure gages located on the loading frame inside the
blast load simulator. The average peak pressures and impulse for all twelve slabs was
reported with experimental data (Appendix A). The plots for these pressures vs. time
histories for the twelve slabs are provided in Appendix B. The co-ordinates for pressure vs.
time plots as obtained from the spreadsheets in comma separated format is used for the
purpose numerical simulation. The pressures are applied as uniformly distributed over the
entire slab area.
The RC slabs were subjected to pre-determined blast pressures which caused
dynamic response to the applied blast loading. This dynamic response was recorded as
center-span displacements and strains measured with respect to time for a short duration.
The displacement-time history measured using lasers and accelerometers in the experiment
were used for the purpose of experimental validation of the numerical models developed in
this study.

23
The post-test damage patterns observed on the twelve slabs were recorded in the
form of digital images taken after each slab was tested as seen in Figure 4.4. The observed
cracks were marked with the location details using dimensions denoted by scale. The crack
patterns recorded were later used for comparison with the crack patterns developed in the
numerical model.
Figure 4-4: Post-test damage patterns observed on Slab # 7
The experimental investigation program gave information on geometry, loading and
response of the 12 single-mat RC Slabs which is utilized in numerical modeling of the 12
slabs for finite element analysis. The pressure data available from the experiments is useful
for loading the finite element slab models and the deflection data is useful in comparing with
the slab deflections obtained using numerical model.

24
CHAPTER 5
NUMERICAL MODELING IN LS-DYNA®
The numerical model of the single-mat RC slab was developed and used for studying
the response to blast loading. The numerical simulations were performed in LS-DYNA®.
The results from the numerical simulation are used for comparison with the results from the
experiment to achieve the primary objective of studying the behavior of reinforced single-
mat slabs subjected to blast loading. The experimental validation of the two commercial
material models was performed using this numerical simulation study. The significance of
using LS-DYNA® for simulations, finite element model, boundary conditions, constitutive
material models and blast load application is described in detail in this chapter.
5.1 Significance of Numerical Modeling in LS-DYNA®
The finite element modeling of the single-mat reinforced concrete slab was
performed using LS-DYNA® which is a general purpose finite element program. LS-
DYNA® is a highly non-linear, transient dynamic finite element analysis program which
uses explicit time integration. LS-DYNA® provides numerous material models in its
material library and provides various types of element formulations in the element library [4,
17].
The finite element modeling of the reinforced concrete is challenging due to the non-
homogeneity in the material and the composite behavior of concrete and steel. This
composite action should be defined in the model to produce good response to the loading
applied. The perfect bond between steel and concrete can be modeled by defining the
interface between them. LS-DYNA® has pre-defined material models for concrete and steel

25
which require basic material properties to define them and are used in this study to model
the concrete and steel. Two different element types viz. solid element for concrete and beam
elements for steel can be modeled in LS-DYNA® with the concrete bond description given
by *CONSTRAINED_LAGRANGE_IN_SOLID keyword and merging the nodes in both
elements [4]. Further sections in this chapter present the details of the numerical modeling of
the two types of Single-mat RC slabs performed in LS-DYNA® for this study.
5.2 Geometric Models
5.2.1 Meshing for Concrete Model
The single-mat reinforced concrete slab with two types of reinforcement spacing is
modeled using the pre-processor in LS-DYNA®. The models consists of two parts namely
the rectangular concrete block and the reinforcing steel bars. The rectangular concrete block
of dimensions 64 in. x 34 in. x 4in. (1652 mm. x 863 mm. x 101.6 mm.) is modeled using
the eight-noded hexahedron elements with constant stress solid element formulation. Six
different slab models consisting of three different mesh sizes modeled for two different
reinforced sections were developed for this study. Three uniform mesh sizes of 1 in. (25.4
mm) having 4 elements through the slab thickness, ½ in. (12.7 mm.) having 8 elements
through the slab thickness and ¼ in. (6.35 mm.) having 16 elements through the slab
thickness were applied to the concrete block as seen in Figure 5.1, Figure 5.2 and Figure 5.3.
The total number of solid elements in the model with 1 in. (25.4 mm) mesh size is 8,704
solid elements consisting of 11,375 nodes. The total number of solid elements in the model
with ½ in. (12.7 mm.) mesh size is 69,632 solid elements consisting of 80,109 nodes. The

26
total number of solid elements in the model with ¼ in. (6.35 mm.) mesh size is 557,056
solid elements consisting of 598,553 nodes.
5.2.2 Meshing for Steel Model
The single-mat RC slab has a single layer reinforcement modeled at 1 in. (25.4 mm.)
concrete cover spacing from the back face. The steel reinforcement is modeled using the
Hughes-Liu beam elements having cross-section integration formulation. Three different
mesh sizes of 1 in. (25.4 mm), ½ in. (12.7 mm.) and ¼ in. (6.35 mm.) are used. The two
model types distinguished by the main steel spacing are the one with 4 in. (101.6 mm.) type
and 8 in. (203.2 mm.) type. The 4 in. type RC slabs as seen in Figure 5.4 have main steel
modeled at 4 in. (101.6 mm.) spacing on center with the two end bars at 2 in. (50.8 mm.)
spacing and shrinkage steel modeled at 12 in. (304.8 mm.) spacing on center; while the 8 in.
type RC slabs as seen in Figure 5.5 have main steel modeled at 8 in. (101.6 mm.) spacing on
center with the two end bars at 6 in. (152.4 mm.) spacing and shrinkage steel modeled at 12
in. (304.8 mm.) spacing on centers. The total number of beam elements for the 4 in. type in
the model with 1 in. (25.4 mm) mesh size is 746 elements; the model with ½ in. (12.7 mm.)
mesh size consists of 1492 beam elements while the model with ¼ in. (6.35 mm.) mesh size
consists of 2983 elements. The total number of beam elements for the 8 in. type in the model
with 1 in. (25.4 mm) mesh size is 490 elements; the model with ½ in. (12.7 mm.) mesh size
consists of 980 beam elements while the model with ¼ in. (6.35 mm.) mesh size consists of
1958 elements.

27
Figure 5-1: Single-Mat Reinforced Concrete slab model with Solid Elements 1 in. (25.4 mm.) mesh size
Figure 5-2: Single-Mat Reinforced Concrete slab model with Solid Elements 1/2 in. (12.7
mm.) mesh size.

28
Figure 5-3: Single-Mat Reinforced Concrete slab model with Solid Elements 1/4 in. (6.35 mm.) mesh size.
Figure 5-4: Single layer reinforcement in 4 in. type single-mat RC slab

29
5.2.3 The Constrained Lagrange in solid formulation
The interface between concrete and steel which is assumed to be a perfect bond is
modeled using the *CONSTRAINED_LAGRANGE_IN_SOLID (CLS) formulation such
that the nodes in the steel element are modeled independent of the nodes in the concrete
element. A previous study was performed by Vasudevan [18] on the effects of using the
CLS formulation for modeling the double-mat reinforced concrete slabs. In this study it was
observed that deflection response of the numerical model matched well with the deflection
response in the experiment.
5.2.4 The Constant Stress Solid Element Formulation
LS-DYNA® element library provides different types of element formulations based
on the different types of integration methods. The type of element formulation required is
Figure 5-5: Single layer reinforcement in 8 in. type single-mat RC slab

30
specified in the *SECTION keyword under the variable ‘ELFORM’. The default
formulation used in LS-DYNA® is the constant stress solid formulation which uses reduced
integration [19]. This formulation is denoted by ELFORM value of 1 and it is useful in large
deformation applications. The constant stress solid element uses the single point integration
which reduces the time spent in stress determination. In reduced integration the number of
integration points is reduced and thus it is advantageous in decreasing the CPU time and
storage requirements [20]. A trial study was first performed to use different types of element
formulations for modeling a reinforced concrete slab subjected to blast loads. Trials
were carried out for Slab # 1 with Concrete Damage Model Release 3 material and ONE
inch mesh model. The observations made for the two element formulations namely,
ELFORM = 1 which uses reduced integration and ELFORM = 2 which uses fully integrated
S/R solid elements be seen in Figure 5-6 and Figure 5-7 respectively.
The total clock time for simulations using the two different element formulation was,
32 minutes with normal termination for ELFORM = 1 and it was 240 minutes with error
Figure 5-6: Slab response with ELFORM = 1 Figure 5-7: Slab response with ELFORM = 2

31
termination; negative volume in elements for ELFORM = 2. The use of constant stress solid
element reduced the time spent in stress determination by factor of 8.
The negative volume effect which is dominant in the fully integrated S/R solid
elements (ELFORM=2) subjected to large deformation causing instabilities and error
terminations can be overcome by using constant stress solid elements[21]. But the reduced
integration formulation can cause no straining at the integration points thus leading to
deformation modes called zero-energy modes or “hourglass modes”. A zero-energy mode
starts propagating through the mesh making the element rank-deficient. This phenomenon is
termed as “hourglassing” [22]. To avoid such excessive deformations an additional artificial
stiffness is added to the element associated with its zero-energy deformation modes. This
procedure adopted by many Finite Element Programs is termed as Hourglass Control
procedure [20, 22].
5.2.5 Hourglass Control in LS-DYNA®
LS-DYNA® recommends introduction of viscous damping or small elastic stiffness
capable of resisting undesirable hourglassing by stopping the formation of zero energy
modes. LS-DYNA® uses the algorithms developed by Kosloff and Frazier and Wilkins [23]
[24]. In an eight-node element with one integration point a total of twelve hourglass modes
exist. An hourglass-resisting force is implemented in the code represented by force vectors.
This force vector includes a user defined constant, QHG which is usually set to a value
between 0.05 and 0.15 [20].
In LS-DYNA®, hourglass control procedure is implemented using
*CONTROL_HOURGLASS keyword option which allows to set the type of hourglass

32
viscosity through variable IHQ and the hourglass co-efficient through variable QH [4]. The
hourglass viscosity type recommended for stiffness type control is given by IHQ types 4 &
5. The coefficient QH can take user defined values but values exceeding 0.15 may cause
instabilities. However, the work done by hourglass resistance is neglected in the energy
equation and may cause loss of energy. The total energy in the structures which remains
constant during the analysis has to be analyzed to confirm the accuracy of the simulation.
The hourglass energy is related to the non-physical modes of deformation occurring in the
under-integrated element formulation such as the constant stress solid element formulation
used here. The energy loss due to the dissipation of energy by hourglass forces reacting
against the formation of hourglass modes can be reported in output files MATSUM and
GLSTAT. The HGEN variable in *CONTROL_ENERGY is set to type 2 for computation
of hourglass energy and inclusion in the energy balance [4]. The non-physical hourglass
energy should be small relative to the peak internal energy (< 10% as rule of thumb) for
confirming the effectiveness of hourglass control [21]. Remennikov and Kong performed
numerical simulation of the response of non-composite steel-concrete-steel sandwich panels
where they reported hourglass energy up to 50% of its peak internal energy when the effects
of strain rate were considered in the simulation. They recommended exclusion of strain rate
effects to minimize the hourglass energy as that reduced it to 15% of internal energy [21].
The default hourglass control was used for the FE slab models studied in this thesis and the
strain rate effects were turned off.
5.3 Boundary Conditions
The boundary restraints applied in the numerical model are described here:

33
i. Figure 5.6 shows the front face of the slab which was not restrained and the slab was
free to move with the negative pull generated by the negative phase of the blast
pressure wave.
ii. A 3 in. restraint in the Z-direction after a distance of 3 in. from the top and bottom
edge is applied on the back face of the slab as shown in Figure 5.7.
iii. A single line of nodes in the center of 4 inch thick slab was restrained in Y-direction
at both top and bottom faces as seen in the isometric view of the slab in Figure 5.8.
These boundary conditions were used in order to be consistent with the experiment
and keeping the modeling of boundary restraints simple by restraining the nodes
rather than modeling a frame and its interaction with slab.
Figure 5-6: Boundary conditions on the front face of slab
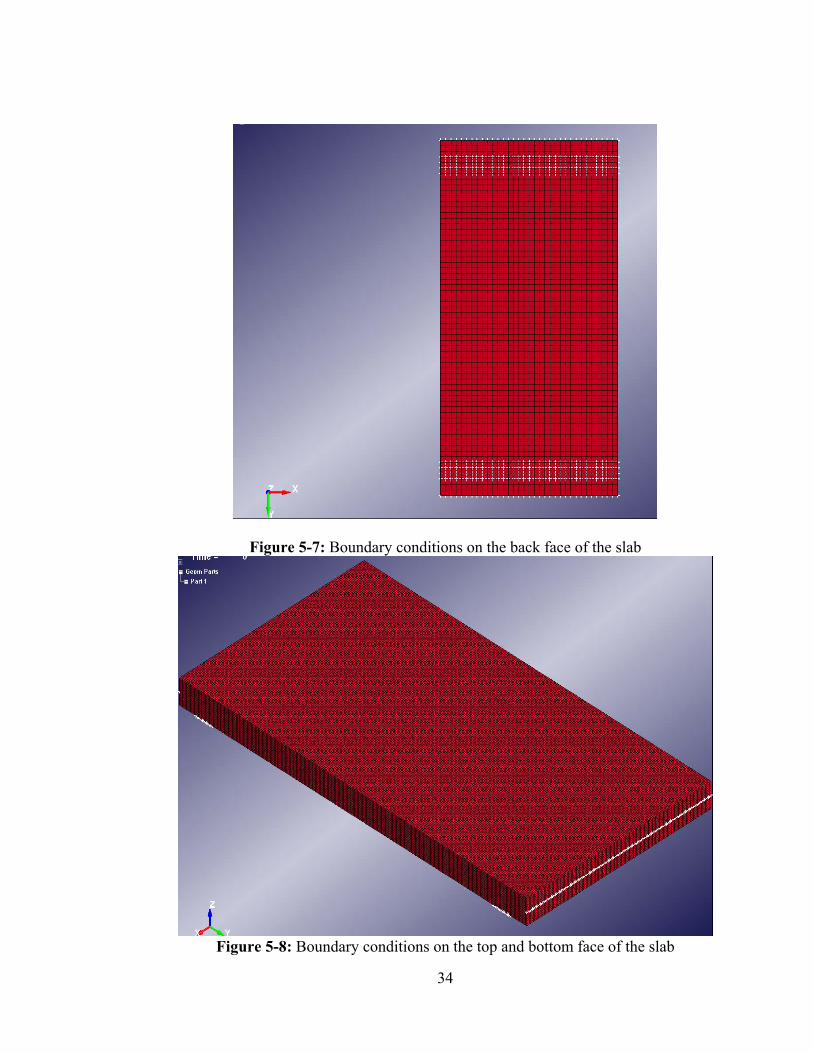
34
Figure 5-7: Boundary conditions on the back face of the slab
Figure 5-8: Boundary conditions on the top and bottom face of the slab

35
5.4 Material Models in LS-DYNA®
LS-DYNA® provides ‘simple input’ concrete models for modeling the behavior of
concrete using basic strength test data and thus reducing the burden of performing
comprehensive tests on concrete to determine the parameters. The ‘simple input’ concrete
models available in LS-DYNA® are *MAT_WINFRITH_CONCRETE (Mat 084 and Mat
085); *MAT_CONCRETE_DAMAGE_REL3 (Mat 072R3); *MAT_PSEUDO_TENSOR
(Mat 016) and *MAT_CSCM_CONCRETE (Mat 159) [19]. In this research the Winfrith
Concrete Model and the Concrete Damage Model Release 3 were chosen to model the
concrete in the Single-mat RC slabs in order to be consistent with the available parameter
input for both high-strength and normal-strength concrete. These parameters are tabulated in
Appendix C.
5.4.1 The Winfrith Concrete Model
The Winfrith Concrete Model [19] is a smeared crack model (pseudo crack) which is
implemented in the 8-node single integration point continuum element. The most important
capability of this model is the generation of an additional binary output database giving
details of crack location and its dimensions. This constitutive material model for reinforced
concrete employs the smeared rebar approach, i.e. the reinforcement stresses are calculated
separately from the calculation of concrete stresses and the two components are smeared
together according to their relative cross-sectional area to give the total element stress.
However, in this research the smeared rebar function in the Winfrith Concrete Model is not
utilized. The steel is modeled using a different material model called the
*MAT_PLASTIC_KINEMATIC[4] and the detailed discussion is given later in this chapter.

36
Also, the interface between steel and concrete is defined using
*CONSTRAINED_LAGRANGE_IN_SOLID formulation [4]. This formulation was
adapted for Winfrith Concrete model in order to be consistent with the modeling performed
using the *MAT_CONCRETE_DAMAGE_REL3 material model which does not provide
formulation for defining the rebar within the concrete material model.
In further sections the various parameters required to be given as input in
*MAT_WINFRITH_CONCRETE (*MAT084-085) [4] and their significance is discussed in
detail.
5.4.1.1 Plasticity Model Definition in Winfrith Concrete
The Winfrith Concrete Model in LS-DYNA® provides a basic plasticity model
which has the plasticity portion based upon the shear failure surface as proposed by Ottosen
[25, 26]. The basic plasticity model is referred to as a four parameter model in which the
first two parameters denoted by constants ‘a’ and ‘b’ depend on the ratio of the unconfined
tensile strength ft’, to the unconfined compressive strength fc’. The uniaxial compression and
uniaxial tension are required input, in *MAT_WINFRITH_CONCRETE (*MAT084-085)
[4].
The representation of shear failure surface proposed by Ottosen [25] is a quadratic
given as:
F I , J , cos3θ aJ′
J′ ′ 1
………………………….Equation 1
Here, constants a and b control the meridional shape of the shear failure surface, and
λ = λ (cos 3θ) ranging -1 ≤ cos3θ ≤ +1 for triaxial compression to triaxial extension controls
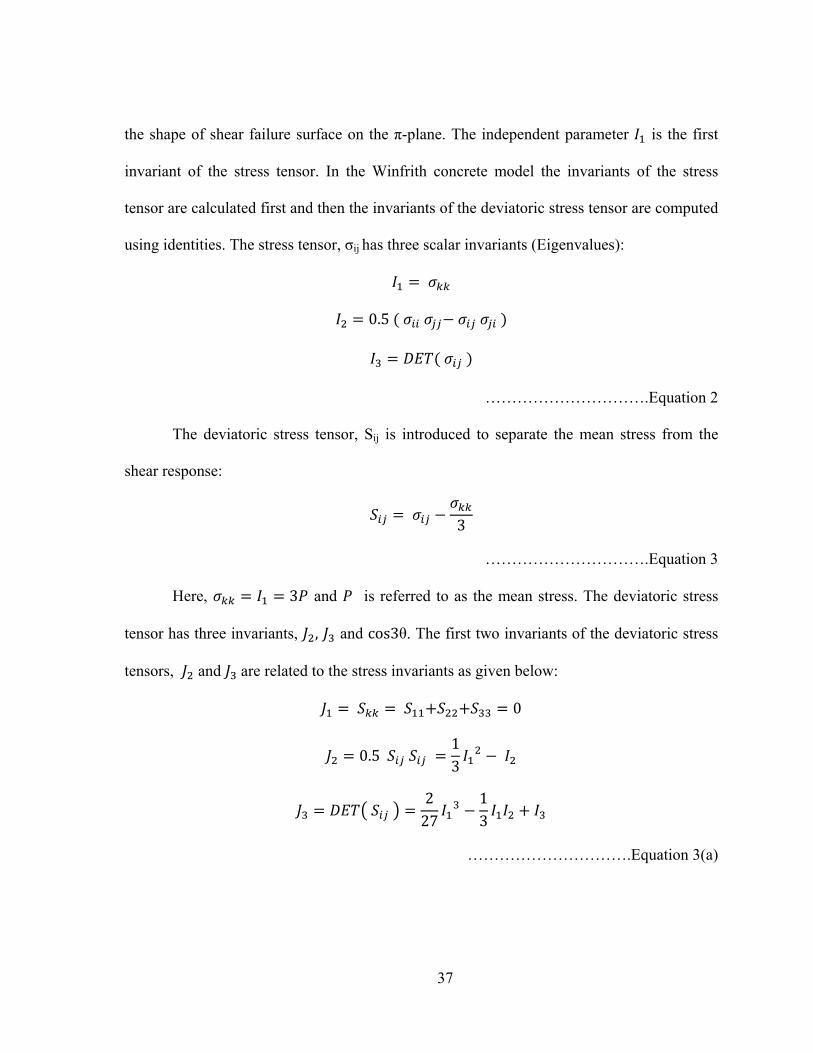
37
the shape of shear failure surface on the π-plane. The independent parameter is the first
invariant of the stress tensor. In the Winfrith concrete model the invariants of the stress
tensor are calculated first and then the invariants of the deviatoric stress tensor are computed
using identities. The stress tensor, σij has three scalar invariants (Eigenvalues):
0.5
………………………….Equation 2
The deviatoric stress tensor, Sij is introduced to separate the mean stress from the
shear response:
3
………………………….Equation 3
Here, 3 and is referred to as the mean stress. The deviatoric stress
tensor has three invariants, , and cos3θ. The first two invariants of the deviatoric stress
tensors, and are related to the stress invariants as given below:
0
0.5 13
227
13
………………………….Equation 3(a)

38
The third invariant of the deviatoric stress is represented as an angle in the π
– plane with limits 0 ≤ θ ≤ π/3 and is defined in terms of deviatoric stress tensor invariants,
and ; and the Lode Angle, θ.
cos3θ3√32 .
………………………….Equation 3(b)
The meridional shape parameters’ a’ and ‘b’ are internally generated based on the
data provided for unconfined tensile and compressive strengths and they are considered to
be best fitting the shear failure surface of laboratory data. In the Winfrith model the user
cannot determine these parameters ‘a’ and ‘b’ from the available data. Instead the Winfrith
model introduces three non-dimensional constants:
α 1.16; β 0.5907445; γ 0.6123724
The meridional shape parameters a and b are evaluated by the model using these
constants in the following equations:
1
3
………………………….Equation 4
Where ′
′ 1 is the ratio of the unconfined tensile to compressive strength.
The Octahedral Shape Parameters are the remaining two parameters of the four
parameter model and are denoted as k1 and k2 in Ottosen’s notation. These parameters define

39
the shape of the shear failure surface in the octahedral (π – plane). Two additional constants
are defined in the Winfrith Model in terms of constants a and b:
√3 1
3
3 3
√3
………………………….Equation 5
The two constants c and d thus are included in the definition of the π – plane shape
factors as
cos 31
√3
2
√3
cos
………………………….Equation 6
Also, the function 3Ɵ is now defined in terms of the constants and
as defined below:
cos Ɵ 3Ɵ 0
cos Ɵ 3Ɵ 0
..….……………………Equation 7
The four parameters a, b, and thus define the shear failure surface in the
Winfrith concrete model [26]. The uniaxial compressive strength and the uniaxial tensile
strength are provided as input parameters along with mass density, initial tangent modulus
of concrete, Poisson’s ratio for concrete. Table 5-2 gives the details of the user input
variables provided:

40
Table 5-1: Input variables provided in *MAT_WINFRITH_CONCRETE required for defining the plasticity model in Winfrith model for two different types of concrete.
Variable Description Input value for High strength concrete
Input value for Normal strength concrete
RO Mass Density 2.246E-04lb-s/in3 2.246E-04lb-s/in3 TM Initial Tangent Modulus of
Concrete 3.6E+06 psi 3.6E+06 psi
PR Poisson’s Ratio 0.18 0.18 UCS Uniaxial Compressive Strength 11600 psi 5000 psi UTS Uniaxial Tensile Strength 928 psi 460 psi
5.4.1.2 Volume Compaction curve in Winfrith Model
The Winfrith concrete model is called the ‘flat cap’ model [26] because the pressure
versus volume strain relation can be represented as a straight line normal to the mean stress
axis in the meridional plane. Broadhouse B J [14]] in his report on development of Winfrith
Concrete Model in LS-DYNA® states that a Pressure-v-volumetric strain curve is given as
input parameter in order to determine the hydrostatic stress state in concrete. This curve is
called Volume Compaction Curve and is introduced in the material parameters for Winfrith
Model. Eight pairs of natural volume strains and corresponding pressures can be given as
user input but the Winfrith model has the predefined pressure versus volume strain input
option. These predefined values are derived strain and pressures occurring at the unconfined
compressive strength, ′. The pressure values are derived from the mean stress given by
′
and the volume strain is approximated by , the elastic bulk modulus k is
also computed from the elastic modulus and Poisson’s ratio given as user input using the
relation . Table5-2 provides the pressure versus volume strain points generated by
the Winfrith model for two different strengths of concrete. The tabulated data are given in

41
order of increasing compression, with no initial zero point. A scaled curve is automatically
used where is the pressure at uniaxial compressive failure form:
′
= = 3866.7 psi = 26.66 MPa
′
= = 1666.7 ksi = 11.49 MPa
and K is the bulk unloading modulus computed as
K = = .
∗ ∗ .= 1.875e+6
Table 5-2: Winfrith concrete model generated Volume Compaction curve for 11.6 ksi and 5 ksi concrete.
11.6 ksi
volumetric Strain
Pressure (x*Pc)
Pressure Pressure
-Pc/K x (Psi) (Mpa) -0.000019 1.00 3866.7 26.66
-0.002 1.50 5800.0 39.99 -0.004 3.00 11600.1 79.98 -0.010 4.80 18560.1 127.97 -0.020 6.00 23200.2 159.96 -0.030 7.50 29000.2 199.95 -0.041 9.45 36540.3 251.93 -0.051 11.55 44660.4 307.92 -0.062 14.25 55100.5 379.91 -0.094 25.05 96860.8 667.83
5 ksi
volumetric Strain
Pressure (x*Pc)
Pressure Pressure
-Pc/K X (Psi) (Mpa) -0.000019 1.00 1666.7 11.49
-0.002 1.50 2500.0 17.23 -0.004 3.00 5000.0 34.47 -0.010 4.80 8000.0 55.16 -0.020 6.00 10000.0 68.95 -0.030 7.50 12500.0 86.18 -0.041 9.45 15750.0 108.6 -0.051 11.55 19250.0 132.72 -0.062 14.25 23750.0 163.75 -0.094 25.05 41750.0 287.86
5.4.1.3 Strain Rate effects in Winfrith Concrete Model
Another important parameter in the Winfrith Model is the inclusion of strain rate
effect. The Winfrith concrete model in LS-DYNA® offers two strain rate options to include
or exclude strain rate effects which are selected via the user input parameter RATE. Two
values 0 or 1 are given as input to turn the strain rate effect on or off respectively. The use

42
of strain rate option for including strain rate effects i.e. RATE = 0 is not recommended
since many researchers have reported the Winfrith model to give odd results thus doubting
the accuracy and reliability of results [8, 26]. Hence, strain rate effects were not included in
this model.
5.4.1.4 Crack Analysis Using Winfrith Concrete Model
The Winfrith Concrete Model provides information on crack propagation in
concrete. A user input parameter for tensile cracking, denoted as ‘FE’ in the LS-DYNA set
of input parameters for the Winfrith Concrete Model has to be provided. The definition of
parameter ‘FE’ depends on the RATE parameter [4]. When strain rate effects are turned off
the parameter ‘FE’ defines the crack width at which the tensile stress normal to the crack
goes to zero. This crack width denotes the size of the gap formed by a planar tensile crack
propagating through the medium. The crack width formulation used in the Winfrith model
is a function of the crack opening displacement. As the crack opening displacement
increases the crack length also increases and the work done in propagating the crack is
utilized in creating a new crack surface. The energy per unit area dissipated in opening the
crack is termed as the specific fracture energy [27]. The visual definition of this specific
fracture energy in measurable terms is given by Wittman (1988) as the area under the
stress-displacement curve [28]. These stress displacement curve is obtained from the force –
displacement variation data measurements which includes specific fracture energy, crack
opening displacement and maximum load for a large number concrete samples. Based on
the specific fracture energy and the unconfined tensile strength a strain softening response
is developed which is a normalized version of the stress displacement curve and a relation

43
between crack width , specific fracture energy G and unconfined tensile strength is
defined in terms of parameter c is given by [27].
G
………………………….Equation 8
This strain softening response is implemented in the Winfrith concrete model in LS-
DYNA®[26] [27]. For RATE=0, with strain rates the cracking form is defined by a linear
strain softening response where the relation between crack width , specific fracture energy
G and unconfined tensile strength is given by
2G
………………………….Equation 9
The Winfrith concrete model for no strain rate form (i.e. RATE=1) this parameter
‘FE’ denotes the crack width at which the crack-normal tensile stress goes to zero. The
value provided here was 0.0002 inch. The parameter ASIZE which denotes the aggregate
size was given as 0.125 inch.
The database generated for providing the details of crack propagation is
implemented at the execution line in LS-DYNA® by giving the input, q = CRACK, where
CRACK is the name of the crack database [4]. This database includes the information on
crack location, directions and widths. This crack database can be opened in LS-Prepost,
which displays the cracks on deformed mesh plots. The visible cracks displayed in LS-
Prepost are used for basic comparison with the crack pattern recorded for each slab in the
experimental analysis.

44
The material parameters provided as input in the Winfrith Concrete Material model
are tabulated in Table C-1 of Appendix C.
5.4.2 The Concrete Damage Model Release 3
The Concrete Damage Model Release 3 is another type of ‘simple input’
model which is available in LS-DYNA® material model library. The most important
capability of this material model is to generate model parameters based on unconfined
compressive strength of concrete. This capability is important because it reproduces
concrete behavior critical to blast analysis by characterizing most of the concrete properties
which include both the elastic and plastic response [29]. This model is termed as the
‘Simplified’ model as it uses minimum user input (i.e. 1 or 2 Parameters) and it has been
simplified for user’s use to provide a robust representation of many response characteristics
of a complex material, concrete [11, 30]. This model can also be used with complete user
specified inputs although it provides internal parameter generation. If the laboratory test
data for various parameters required to be given as input is available then it is
recommended to use them as per the study performed by Malvar and Schwer [11] which
compared a well characterized 45.6 MPa unconfined compression strength concrete
material parameters obtained in laboratory with the corresponding material response from
the K&C Concrete Model. This paper reports mainly two types of test i.e. isotropic
(hydrostatic) compression test and tri-axial compression test measuring the pressure versus
volume strain compaction response and compressive failure surface respectively for 45.6
Mpa concrete. The comparison for 45.6 Mpa concrete has shown fairly accurate prediction
of parameters by the Material type 72R3. For modifying the generated model parameters,
the generated parameters for a particular unconfined compressive strength of concrete are

45
written to the LS-DYNA® message file. The pressure-volume strain response for the model
is also generated in the form ‘Tabulated Compaction Equation-of-state’ (EOS 8) and its
parameters are also written to the LS-DYNA® “messag” file [4]. This model parameters
generated in the message file are studied, modified and given as input in the keyword file.
The keyword file is then processed in LS-DYNA® and the results are observed using LS-
PrePost.
5.4.2.1 The Three-Shear Failure Surfaces in Concrete Damage Model Release 3
The *Concrete Damage Model Release 3 (*MAT072R3) is a three invariant model
which uses 3-shear failure surfaces namely maximum shear failure surface, residual failure
surface and initial yield surface. This model also incorporates damage and strain-rate
effects. This Karagozian and Case (K&C) – Concrete Damage Model Release III requires a
set of seven cards of model input parameters to be defined. An Equation-of-State is also
required for the pressure-volume strain response [19].
The three failure surfaces are defined by three sets of parameters; (a0,a1,a2) :
maximum shear failure surface, (a0f, a1f, a2f) : residual failure surface and (a0y,a1y,a2y) :
yield failure surface. The compressive shear strength measured using a triaxial compression
test is represented mostly by plotting the results in which the two axes comprise of stress
difference and mean stress. The equation for this graph is represented in the equation (10):
Von mises stress = = 0
∗
………………..Equation 10
Thus, a total of eight parameters define the three fixed surfaces, as follows [12, 30]:
0∗
(maximum failure surface)

46
∗
(residual failure surface)
∗
(yield failure surface)
………………..Equation 11
Where, is the difference in the principal stresses and p is the pressure in an
element.
The maximum shear failure surface parameter value characterized for the particular
type of concrete is given as input for the variables a0, a1 and a2. But if laboratory testing
results are not available for a particular concrete then the unconfined compressive strength
fc’ is provided as input instead of a0 with a negative sign to represent compression. This
value is used by the Concrete Damage Model Release 3 for automatic parameter generation.
However, the surface parameters generated for the model can be read in the “messag” file.
5.4.2.2 The tensile strength of concrete
The next important input parameter which is the tensile strength of concrete can be
given as input based upon the unconfined compressive strength using the following
relationship which is a standard concrete relations given in CEB-FIP Model Code 1990 as
used by Malvar and Schwer [11] :
1.58 ∗
for unconfined compressive strength of 11.6 ksi concrete the tensile strength
generated is 1.58 ∗ . 7.832 ksi and similarly for unconfined
compressive strength of 5 ksi concrete the tensile strength generated is 1.58 ∗

47
4.62 ksi . The tensile strength generated by Concrete Damage Model Release 3
automatic parameter generation capability also gives the same value as verified in LS-
DYNA® output messag file.
5.4.2.3 Equation of State for Concrete Damage Model Release 3
An equation-of-state is also used by Concrete Damage Model Release 3 to provide
the pressure and volume strains. The default parameters generated for a standard 45.6 MPa
concrete as studied by Malvar and Schwer [11] when compared to the laboratory data
available to them has shown underestimation of the post elastic bulk modulus. The
comparison of slope for both data plots clearly has shown the response of Concrete Damage
Model Release 3 lower than the laboratory data for 45.6 MPa concrete. Due to such
variability in the volumetric response for concrete (Equation of State) the calibration of this
model to specific material characterization data is warranted [29]. It is therefore
recommended to use the pressure-volume strain data for the particular concrete of interest if
it available. The default parameters generated by Concrete Damage Model Release 3 can be
replaced by providing Equation-of-state input keyword and provide the available pressure-
volume data. The laboratory data available for 11.6 Ksi and 5 Ksi concrete for the pressure
versus volume strain response is shown in Figure 5-9 and Figure 5-10 respectively.
The pressure and volumetric strain values from the curve shown in Figure 5-9 and 5-
10 were given as input in the Equation of state description provided as input in the keyword
file. The Equation of state form used here to give the new values as input is the
*EOS_TABULATED_COMPACTION. In the *EOS_TABULATED_COMPACTION
about 10 points for pressure versus volume data can be given as input. Volumetric strain
values are given with negative sign (in compression) while pressure is positive in

48
compression. The volume strain data obtained from the laboratory had to be converted to
natural strains by using their natural logarithmic values. The details of the EOS form is
given in Appendix D as a part of the *PART form. The EOSID input parameter in the
*PART card had to be specified as per the EOSID used. In this case for pressure-volume
data the EOSID recommended in LS-DYNA® keyword manual was EOSID=8 [20]. The
input parameters for the Concrete Damage Model Release3 for two types of concrete are
tabulated in Table C-2 in Appendix C.
Figure 5-9 : Pressure Versus Volumetric Strain Curve for Equation of State Form 8 with compaction for 11.6 ksi concrete

49
Figure 5-10 Pressure Versus Volumetric Strain Curve for Equation of State Form with compaction for 5 Ksi concrete
5.4.2.4 Crack Analysis Using Concrete Damage Model Release 3
The Concrete Damage Model Release 3 is not capable of generating crack
output to simulate the physical crack patterns which develop in FE concrete slab model. In
order to generate physical crack patterns an additional keyword needs to be introduced. This
additional keyword is a material model called the Mat_Add_Erosion which is used with the
constitutive models which do not allow failure and erosion. The Mat_Add_Erosion option
provides a way of including failure in such constitutive models. This keyword allows
several criteria to be defined independently to model the erosion and failure. The elements
get deleted during simulation when one of the criteria is satisfied. [4]
5.4.3 The Plastic Kinematic Model for Steel
For modeling of the steel reinforcement, the elastic-plastic Plastic Kinematic
material model was adopted. This model formulated by Krieg and Key is a very cost
effective model suited to model the isotropic and kinematic hardening plasticity with the

50
option of including rate effects [31]. A parameter Beta is varied between values 0 < β < 1 in
order to specify the kinematic, isotropic or a combination of kinematic and isotropic
hardening. In this study kinematic hardening was taken into consideration and thus the
value of Beta was given as zero. The strain rate effects were not taken into consideration
and thus the strain rate parameter was given as zero. The other parameters for specifying the
material properties of steel are mass density, Young’s modulus, Poisson’s ratio, Yield
strength and tangent modulus. The input parameters for the Plastic Kinematic model for two
types of steel are tabulated in Table C-3 in Appendix C.
5.5 Blast Load Application in LS-DYNA®
In an explosion phenomenon the most significant feature is the sudden release of
energy in the atmosphere causing a change in pressure which is termed as a blast wave.
This blast wave propagates outwards from the source in all directions at a very high speed.
The magnitude and shape of the blast wave depends on the nature of the explosion and the
distance of the point under consideration from the explosion epicenter.
In the blast experiments a shock tube was used to generate pressures equivalent to
the pressures generated in the blast wave. The characteristic shape of the blast wave
generated is that of the shock wave type. The shock wave consists of a sudden rise in
pressure above ambient atmospheric condition to a peak overpressure followed by a gradual
fall to ambient pressure resulting in a negative pressure wave.
The parameter’s that are used to define a blast wave are peak side-on positive
overpressure, Pso having positive phase duration, td and the corresponding positive impulse,
Io; peak side-on negative overpressure, Pso- having negative phase duration, td
- and the
corresponding negative impulse, Io-. It is important to have a definite description of these

51
parameters to simulate the blast wave in the finite element analysis to resemble the blast
phenomenon inside the shock tube. The pressure vs. time histories with the impulse values
is shown in appendix B for all 12 slabs. The load curves as seen in the figures B-1 to B12
are then applied uniformly over the slab front face. The *LOAD_SEGMENT_SET keyword
in LS-DYNA is used to define the load curve and slab surface interaction. The pressure vs
time co-ordinates are defined using *DEFINE_CURVE while the surface is defined using
the *SET_SEGMENT keywords.
The numerical modeling for 12 reinforced concrete single-mat slabs was completed
using various functionalities available in LS-DYNA®. The results of the numerical
simulation are made available in LS-DYNA post-processor. The results which are important
for this thesis were the mid-span deflection-time histories, crack damage patterns in slabs
using Winfirth Concrete Model and contours for max-principal strain in slabs using the
Concrete Damage Model Release 3. The results from numerical analysis are presented and
discussed in detail in the next chapter.

52
CHAPTER 6
NUMERICAL ANALYSIS RESULTS AND COMPARISON WITH EXPERIMENTS
In this chapter the results obtained from the numerical simulations performed in LS-
DYNA are compared with the experimental results. The two criteria used for the
comparison are peak slab deflections and damage patterns. The numerical simulation
comparison with the experiments was done for all 12 slabs which consists of two sets
namely the combination of high strength concrete reinforced with high strength steel (HSC-
V) and normal strength concrete reinforced with normal strength steel (RSC-R).
6.1 Comparison Criterion 1; Peak Deflection for Slab
The peak deflections observed in the numerical simulation are compared with the
peak deflections of slab observed in the experiment as follows:
1. Two different mesh sizes are compared, namely 1 in. (25.4 mm) and ½ in. (12.7
mm). The two different models are denoted as “One Inch Mesh Model” and “Half Inch
Mesh Model”. This study is termed as “Mesh Size Effect”.
2. Two concrete material models namely, the Winfrith Concrete Model and the
Concrete Damage Model Release 3. This study is termed as “Material Model Effect”.
The overall deflection results for the simulations and the experiments for all 12 slabs
are tabulated in Table 6-1 to Table 6-4. Table 6-1 and Table 6-2 give the peak and residual
deflection respectively as observed in all the high strength slabs. Table 6-3 and Table 6-4
give the peak and residual deflection respectively as observed in all the normal strength
slabs.

53
Table 6-1: Analytical and Experimental Peak Slab Deflection Summary for High Strength
Slabs. Slab No. Description Deflections 1 in.mesh 0.5in. mesh Experimental Winfrith Damage
Release 3 Winfrith Damage
Release 3
Slab 1 HSC-V1-4in. 3.83 3.8 5.63 4.37 3.89 Slab 3 HSC-V2-4in. 4.77 4.28 5.11 4.31 4.53 Slab 5 HSC-V3-4in. 2.94 3.38 3.14 3.41 2.46 Slab 7 HSC-V4-8in. 6.97 4.61 ** 5.37 7.20 Slab 9 HSC-V5-8in. 3.25 3.49 3.71 ** 3.40 Slab 11 HSC-V6-8in. 3.25 3.88 4.30 4.09 3.38
** Negative volume in elements terminated the analysis.
Table 6-2: Analytical and Experimental Residual Slab Deflection Summary for High Strength Slabs.
Slab No. Description Deflections 1 in.mesh 0.5in. mesh Experimental Winfrith Damage
Release 3 Winfrith Damage
Release 3
Slab 1 HSC-V1-4in. 2.18 1.99 4.22 0.82 1.98 Slab 3 HSC-V2-4in. 3.69 2.81 4.97 1.95 3.48 Slab 5 HSC-V3-4in. 2.37 1.25 2.62 Slab rebounds 1.30 Slab 7 HSC-V4-8in. 4.87 1.69 ** 1.99 5.56 Slab 9 HSC-V5-8in. 2.58 3.43 2.91 ** 1.40 Slab 11 HSC-V6-8in. 2.55 2.04 3.86 Slab rebounds 1.92
** Negative volume in elements terminated the analysis.
Table 6-3: Analytical and Experimental Peak Slab Deflection Summary for Normal Strength Slabs.
Slab No. Description Deflections 1 in.mesh 0.5in. mesh Experimental Winfrith Damage
Release 3 Winfrith Damage
Release 3
Slab 2 RSC-R1-4in. 3.30 4.73 3.67 5.69 4.29 Slab 4 RSC-R2-4in. 3.27 4.45 3.73 5.71 4.45 Slab 6 RSC-R3-4in. 2.13 3.47 2.45 ** 3.17 Slab 8 RSC-R4-8in. 2.80 3.65 2.55 4.66 3.38 Slab 10 RSC-R5-8in. 3.29 3.98 2.93 4.92 3.6 Slab 12 RSC-R6-8in. 3.01 3.42 2.75 5.23 3.17
** Negative volume in elements terminated the analysis.

54
Table 6-4: Analytical and Experimental Residual Slab Deflection Summary for Normal Strength Slabs.
Slab No. Description Deflections 1 in.mesh 0.5in. mesh Experimental Winfrith Damage
Release 3 Winfrith Damage
Release 3
Slab 2 RSC-R1-4in. 0.22 2.74 2.48 3.56 3.38 Slab 4 RSC-R2-4in. 1.15 3.2 2.29 4.46 3.34 Slab 6 RSC-R3-4in. 1.31 0.9 1.71 ** 1.97 Slab 8 RSC-R4-8in. 2.26 Slab rebounds 1.53 Slab rebounds 1.8 Slab 10 RSC-R5-8in. 2.58 Slab rebounds 1.77 Slab rebounds 1.48 Slab 12 RSC-R6-8in. 2.38 Slab rebounds 1.63 Slab rebounds 2.05
** Negative volume in elements terminated the analysis.

55
6.1.1 High Strength Concrete with High Strength Steel Slabs (HSC-V)
The first set of slabs studied here are the ones having combination of high strength
concrete reinforced with high strength steel (HSC-V). The deflection-time histories for each
of the 6 slabs are represented in this section. The comparison is made between two mesh
sizes i.e. 1” and 0.5” for each of the two material models as shown in Table 6-5 and Table
6-6.
Table 6-5: Percentage Comparison of Peak Slab Deflections with the Experimental Value
for High Strength Slabs. Slab No.
Description Pressure (psi)/Impulse
(psi-msec)
Percentage Change in Deflections in the Numerical Model from Experimental
Deflection values. 1 in.mesh 0.5in. mesh Winfrith Damage
Release 3 Winfrith Damage
Release 3 1 HSC-V1-4in. 52.82/1013.28 ↓1.5% ↓2% ↑44% ↑12% 3 HSC-V2-4in. 49.28/997.62 ↑5% ↓5% ↑12% ↓5% 5 HSC-V3-4in. 42.04/773.95 ↑19% ↑37% ↑27% ↑38% 7 HSC-V4-8in. 44.42/753.56 ↓3% ↓36% ** ↓25% 9 HSC-V5-8in. 34.01/511.77 ↓4% ↑2.5% ↑9% ** 11 HSC-V6-8in. 37.05/576.07 ↓4% ↑14% ↑27% ↑21%
** Negative volume in elements terminated the analysis.
Table 6-6: Percentage Change in Peak Slab Deflection when the Mesh Size was Reduced from 1 in. (25.4mm.) to ½ in. (12.7 mm.) for High Strength Slabs.
Slab No. Description Deflection Percentage Winfrith Damage
Release 3 Slab 1 HSC-V1-4in. ↑46% ↑15% Slab 3 HSC-V2-4in. ↑7% ↑0.7% Slab 5 HSC-V3-4in. ↑6% ↑0.8% Slab 7 HSC-V4-8in. ** ↑16% Slab 9 HSC-V5-8in. ↑14% ** Slab 11 HSC-V6-8in. ↑32% ↑5%
** Negative volume in elements terminated the analysis.

56
6.1.1.1.1 Mesh Size Effect for Slab # 1 (HSC-V1-4in.)
The deflection results obtained from numerical simulations for slab # 1
which is a HSC-V1-4in. is compared for two different mesh sizes. This slab experienced a
peak pressure of 52.82 psi (0.36 MPa) and an impulse of 1013.28 psi-msec (6.98 MPa-
msec) in the blast experiment. The blast pressures recorded for this slab are summarized in
Appendix A. The average deflection obtained from the experiment was 3.89 in (98.8 mm.)
recorded at 28 milliseconds.
Figure 6-1: Deflection Comparison between 1 in. (25.4 mm.) and 1/2 in. (12.7 mm.) mesh sizes for Concrete Damage Model Release 3 and Experimental Deflection for Slab#1 –
HSC-V1-4in.
The deflection results obtained from LS-DYNA® concrete models with two mesh
sizes for Concrete Damage Model Release 3 (CDMR3) are compared with the experimental
deflection in Figure 6-1. The peak deflection obtained from the CDMR3 with 1 in. (25.4
mm.) mesh was 3.8in (96.52 mm.) recorded at 30.5 milliseconds while for 1/2 in. (12.7
mm.) mesh model it was 4.37 in. (110.98 mm.) recorded at 27.5 milliseconds. The

57
deflections obtained from the models for CDMR3 with 1 in. (25.4 mm) mesh size showed a
2% decrease while for the 1/2 in. (12.7 mm.) model showed a 12% increase when compared
to the experimental values.
Figure 6-2: Deflection Comparison between 1 in. (25.4 mm.) and 1/2 in. (12.7 mm.) mesh sizes for Winfrith Concrete Model and Experimental Deflection for Slab#1 – HSC-V1-4in.
The deflection results obtained from LS-DYNA® concrete models with two mesh
sizes for Winfrith Concrete Model (WCM) are compared with the experimental deflections
in Figure 6-2. The peak deflections obtained from the WCM with 1 in. (25.4 mm.) mesh
was 3.83in (97.28 mm.) recorded at 27.5 milliseconds while for 1/2 in. (12.7 mm.) mesh
model it was 5.63 in. (143 mm.) recorded at 32.5 milliseconds. The deflections obtained
from the models for WCM with 1 in. (25.4 mm) mesh size showed a 1.5% decrease while
for the 1/2 in. (12.7 mm.) model showed a 44% increase when compared to the experiment.
From Figure 6-1 and Figure 6-2 it can be noted that varying the mesh size from 1 in.
(25.4 mm.) to 1/2 in. (12.7 mm.) increased the deflection by 1.8 in. (45.72 mm.) for the

58
WCM and by 0.57 in. (14.48 mm.) for CDMR3 respectively. The 1 in. mesh (25.4 mm) can
be useful to predict the deflection accurately in both the models in comparison with the
experimental deflection.
6.1.1.1.2 Material Model Effect for Slab # 1 (HSC-V1-4in.)
Figure 6-3 and Figure 6-4 compare the deflections between two material models for
two mesh sizes. From Figure 6-3 for the 1 in. (25.4 mm) mesh model the WCM predicted
the deflection 0.06 in. (1.52 mm.) less while the CDMR3 predicted the deflection 0.09 in.
(2.28 mm.) less than the experimental value respectively. From Figure 6-4 for the 1/2 in.
(12.7 mm) mesh model the CDMR 3 predicted the deflection 0.48 in. (12.19 mm.) more
while the WCM predicted the deflection 1.74 in. (44.2 mm.) more than the experimental
value respectively. The CDMR3 predicted the response better in both mesh size category.
Figure 6-3: Deflection Comparison between Concrete Damage Model Release 3 and Winfrith Concrete for 1 in. (25.4 mm.) mesh model with Experimental Deflection for
Slab#1 – HSC-V1-4in.

59
Figure 6-4: Deflection Comparison between Concrete Damage Model Release 3 and Winfrith Concrete for 1/2 in. (12.7 mm.) mesh model with Experimental Deflection for
Slab#1 – HSC-V1-4in.
6.1.1.2.1 Mesh Size Effect for Slab # 3 (HSC-V2-4in.)
The deflection results obtained from numerical simulations for slab # 3 which is a
HSC-V2-4in. is compared in this section for two different mesh sizes. This slab experienced
a peak pressure of 49.28 psi (0.34 MPa) and an impulse of 997.62 psi-msec (6.878 MPa-
msec) in the blast experiment. The blast pressures recorded for this slab are summarized in
Appendix A. The average deflection obtained from the experiment was 4.53 in (115.06
mm.) recorded at 33.9 milliseconds.

60
Figure 6-5: Deflection Comparison between 1 in. (25.4 mm.) and 1/2 in. (12.7 mm.) mesh sizes for Concrete Damage Model Release 3 and Experimental Deflection for Slab#3 –
HSC-V2-4in.
The deflection results obtained from LS-DYNA® concrete models with two mesh
sizes for CDMR3 are compared with the experimental deflections in Figure 6-5. The peak
deflections obtained from the CDMR3 with 1 in. (25.4 mm.) mesh was 4.28 in (108.7 mm.)
recorded at 30.5 milliseconds while for 1/2 in. (12.7 mm.) mesh model it was 4.31 in.
(109.47 mm.) recorded at 27.5 milliseconds. The deflections obtained from the models for
CDMR3 with 1 in. (25.4 mm) mesh size showed a 5% decrease while with the 1/2 in. (12.7
mm.) model showed a 5% decrease when compared to the experimental values.

61
Figure 6-6: Deflection Comparison between 1 in. (25.4 mm.) and 1/2 in. (12.7 mm.) mesh sizes for Winfrith Concrete Model and Experimental Deflection for Slab#3 – HSC-V2-4in.
The deflection results obtained from LS-DYNA® concrete models with two mesh
sizes for WCM are compared with the experimental deflections in Figure 6-4. The peak
deflections obtained from the WCM with 1 in. (25.4 mm.) mesh was 4.77in (121.16 mm.)
recorded at 30 milliseconds while for 1/2 in. (12.7 mm.) mesh model it was 5.11 in. (129.79
mm.) recorded at 31.5 milliseconds. The deflections obtained from the models for WCM
with 1 in. (25.4 mm) mesh size showed a 5% increase while the deflections obtained from
the 1/2 in. (12.7 mm.) model showed a 12% increase when compared to the experimental
values.
From Figure 6-5 and Figure 6-6 it can be noted that varying the mesh size from 1 in.
(25.4 mm.) to 1/2 in. (12.7 mm.) increased the deflection by 0.34 in. (8.64 mm.) for the
WCM and by 0.03 in. (0.76 mm.) for CDMR3 respectively. The 1 in. mesh (25.4 mm) can

62
be useful to predict the deflection accurately in both the models in comparison with the
experimental deflection.
6.1.1.2.2 Material Model Effect for Slab # 3 (HSC-V2-4in.)
Figure 6-7 and Figure 6-8 compare the deflections between two material models for
two mesh sizes. From Figure 6-7 for the 1 in. (25.4 mm) mesh model the WCM predicted
the deflection 0.24 in. (6.09 mm.) more while the CDMR3 predicted the deflection 0.25 in.
(6.35 mm.) less than the experimental deflection. From Figure 6-8 for the 1/2 in. (12.7 mm)
mesh model the CDMR3 predicted the deflection 0.22 in. (5.58 mm.) less while the WCM
predicted the deflection 0.58 in. (14.73 mm.) more respectively than the experimental value.
The CDMR3 predicted the response better in both mesh size categories.
Figure 6-7: Deflection Comparison between Concrete Damage Model Release 3 and Winfrith Concrete for 1 in. (25.4 mm.) mesh model with Experimental Deflection for
Slab#3 – HSC-V2-4in.

63
Figure 6-8: Deflection Comparison between Concrete Damage Model Release 3 and Winfrith Concrete for 1/2 in. (12.7 mm.) mesh model with Experimental Deflection for
Slab#3 – HSC-V2-4in.
Figure 6-9: Deflection Comparison between Concrete Damage Model Release 3 and Winfrith Concrete for 1 in. (25.4 mm.) mesh model with Experimental Deflection for
Slab#1 – HSC-V1-4in and Slab#3 – HSC-V2-4in.

64
Figure 6-9 compares the two slabs i.e. Slab#1–HSC-V1-4in. and Slab#3–HSC-V2-
4in. for both the experimental and numerical analysis results. The numerical analysis results
presented here are using the 1 in. (25.4 mm.) mesh model as this mesh size yielded good
results as compared to other mesh sizes in both the concrete material models used. These
slabs were subjected to similar pressures of 52.82 psi (0.36 MPa) and 49.28 psi (0.34 MPa)
respectively and an impulse of 1013.28 psi-msec (6.98 MPa-msec) and 997.6 psi-msec
(6.878 MPa-msec) respectively during the experimental program.
As seen in the plot the peak deflections for the two slabs occured within a very small
timeframe ranging between 27.5 milliseconds and 33.9 milliseconds. The experimental
peak deflections recorded for the two slabs are 3.89 in. (98.81 mm.) and 4.53 in. (115.06
mm.) respectively. For both of these slabs when modeled using the two concrete material
models gave a good prediction of the deflection as observed from the peak and residual
displacements as noted in Table 6-1 and 6-2. The CDMR3 Model predicted the deflection
response very closely to the experiment even in the post peak region. Although the peak
values deviates more from the experimental peak deflection as compared to the WCM. The
WCM predicted the peak deflections more closely but the post-peak deflection response is
not very accurate. The two slabs under consideration here could withstand higher pressure
and impulse when designed using high-strength material. The numerical analysis also
shows a stable response with lesser rebound of the slab in the post-peak deflection-time
history.

65
6.1.1.3.1 Mesh Size Effect for Slab # 5 (HSC-V3-4in.)
The deflection results obtained from numerical simulations for slab # 5 which is a
HSC-V3-4in. is compared for two different mesh sizes. This slab experienced a peak
pressure of 42.04 psi (0.28 MPa) and an impulse of 773.95 psi-msec (5.34 MPa-msec) in
the blast experiment. The blast pressures recorded for this slab are summarized in Appendix
A. The average deflection obtained from the experiment was 2.46 in (62.48 mm.) recorded
at 19.94 milliseconds.
Figure 6-10 : Deflection Comparison between 1 in. (25.4 mm.) and 1/2 in. (12.7 mm.) mesh sizes for Concrete Damage Model Release 3 and Experimental Deflection for Slab#5 – HSC-V3-4in.
The deflection results obtained from LS-DYNA® concrete models with two mesh
sizes for CDMR3 are compared with the experimental deflections in Figure 6-10. The peak
deflections obtained from the CDMR3 with 1 in. (25.4 mm.) mesh was 3.38 in. (85.85 mm.)
recorded at 27 milliseconds while for 1/2 in. (12.7 mm.) mesh model it was 3.41 in. (86.61
mm.) recorded at 36 milliseconds. The deflection obtained from the models with 1 in. (25.4

66
mm) mesh size were higher when compared to the experiments as the CDMR3 showed a
37% increase while the deflection obtained from the 1/2 in. (12.7 mm.) model are higher by
38% when compared to the experimental values.
Figure 6-11: Deflection Comparison between 1 in. (25.4 mm.) and 1/2 in. (12.7 mm.) mesh sizes for Winfrith Concrete Model and Experimental Deflection for Slab#5 – HSC-V3-4in.
The deflection results obtained from LS-DYNA® concrete models with two mesh
sizes for WCM are compared with the experimental deflections in Figure 6-11. The peak
deflections obtained from the WCM with 1 in. (25.4 mm.) mesh was 2.94 in. (74.67 mm.)
recorded at 25 milliseconds while for 1/2 in. (12.7 mm.) mesh model it was 3.14 in. (129.79
mm.) recorded at 26.5 milliseconds. The deflections obtained from the models with 1 in.
(25.4 mm) mesh size when compared to the experiments for the WCM showed a 19%
increase while the deflections obtained from the 1/2 in. (12.7 mm.) model are higher by
27% when compared to the experiment.

67
From Figure 6-10 and Figure 6-11 it can be noted that varying the mesh size from 1
in.(25.4 mm.) to 1/2 in. (12.7 mm.) increased the deflection by 0.2 in. (5.08 mm.) for the
WCM and by 0.03 in. (0.76 mm.) for CDMR3 respectively. The 1 in. mesh (25.4 mm) can
be useful to predict the deflection accurately in both the models in comparison with the
experimental deflection.
6.1.1.3.2 Material Model Effect for Slab # 5 (HSC-V3-4in.)
Figure 6-12 and Figure 6-13 compare the deflections between two material models
for two mesh sizes. From Figure 6-12 for the 1 in. (25.4 mm) mesh model the WCM
predicted the deflection 0.48 in. (12.19 mm.) more while the CDMR3 predicted the
deflection which was 0.92 in. (23.36 mm.) more than the experimental values respectively.
From Figure 6-13 for the 1/2 in. (12.7 mm) mesh model the WCM predicted the deflection
0.68 in. (17.27 mm.) more while the CDMR3 predicted the deflection which was 0.95 in.
(24.13 mm.) more than the experimental values. The Winfrith Concrete Model gave a better
prediction of the response in both mesh size categories.

68
Figure 6-12: Deflection Comparison between Concrete Damage Model Release 3 and Winfrith Concrete for 1 in. (25.4 mm.) mesh model with Experimental Deflection for
Slab#5 – HSC-V3-4in.
Figure 6-13: Deflection Comparison between Concrete Damage Model Release 3 and Winfrith Concrete for 1/2 in. (12.7 mm.) mesh model with Experimental Deflection for
Slab#5 – HSC-V3-4in.

69
6.1.1.4.1 Mesh Size Effect for Slab # 7 (HSC-V4-8in.)
The deflection results obtained from numerical simulations for slab # 7 which is a
HSC-V4-8in. is compared for two different mesh sizes. This slab experienced a peak
pressure of 44.42 psi (0.306 MPa) and an impulse of 753.56 psi-msec (5.19 MPa-msec) in
the blast experiment. The blast pressures recorded for this slab are summarized in Appendix
A. The average deflection obtained from the experiment was 7.2 in. (182.88 mm.) recorded
at 38.73 milliseconds.
Figure 6-14: Deflection Comparison between 1 in. (25.4 mm.) and 1/2 in. (12.7 mm.) for mesh sizes for Concrete Damage Model Release 3 and Experimental Deflection for Slab#7 – HSC-V4-
8in. The deflection results obtained from LS-DYNA® concrete models with two mesh
sizes for CDMR3 are compared with the experimental deflections in Figure 6-14. The peak
deflections obtained from the CDMR3 with 1 in. (25.4 mm.) mesh was 4.61 in. (117.09
mm.) recorded at 36 milliseconds while for 1/2 in. (12.7 mm.) mesh model it was 5.37 in.
(136.39 mm.) recorded at 35 milliseconds. The deflections obtained from the models with 1

70
in. (25.4 mm) mesh size were lower when compared to the experiments as the CDMR3
showed a 36% decrease while the deflections obtained from the 1/2 in. (12.7 mm.) model
are lower by 25% when compared to the experiment.
Figure 6-15: Deflection Comparison between 1 in. (25.4 mm.) and 1/2 in. (12.7 mm.) mesh sizes for Winfrith Concrete Model and Experimental Deflection for Slab#7 – HSC-V4-8in.
The deflection results obtained from LS-DYNA® concrete models with two mesh
sizes for WCM are compared with the experimental deflections in Figure 6-15. The peak
deflections obtained from the WCM with 1 in. (25.4 mm.) mesh was 6.97 in. (177.04 mm.)
recorded at 38.5 milliseconds while for 1/2 in. (12.7 mm.) mesh model the simulation
terminated at 26.5 milliseconds before reaching the peak deflection as some of the elements
reached velocities which were out-of-range. The deflections obtained from the models for
WCM with 1 in. (25.4 mm) mesh size showed a 3% decrease while the deflections obtained
from the 1/2 in. (12.7 mm.) model could not be compared to the experiment as the program
terminated before it reached the peak deflection.

71
From Figure 6-14 and Figure 6-15 it can be noted that varying the mesh size from 1
in.(25.4 mm.) to 1/2 in. (12.7 mm.) increased the deflection by 0.76 in. (19.3 mm.) for the
CDMR3. The 1 in. mesh (25.4 mm) model with Winfrith Concrete has shown considerably
accurate prediction of the deflection-time history from the experiment. Thus the 1 in. mesh
(25.4 mm) model can be useful to predict the deflection accurately in both the models in
comparison with the experimental deflection.
6.1.1.4.2 Material Model Effect for Slab # 7 (HSC-V4-8in.)
Figure 6-16 and Figure 6-17 compare the deflections between two material models
for two mesh sizes. From Figure 6-16 for the 1 in. (25.4 mm) mesh model with the WCM
predicted the deflection 0.23 in. (5.84 mm.) less while the CDMR3 predicted the deflection
2.59 in. (65.78 mm.) less than the experimental values respectively. From Figure 6-17 for
the 1/2 in. (12.7 mm) mesh model the CDMR3 predicted the deflection 1.83 in. (46.48
mm.) less than the experimental deflection while the WCM predicted the deflection 0.38 in.
(9.65 mm.) more than the experiment at 22 milliseconds after which the program
terminated. The CDMR3 predicted the response lower in both mesh size category while the
WCM predicted the response better in this case.

72
Figure 6-16: Deflection Comparison between Concrete Damage Model Release 3 and Winfrith Concrete for 1 in. (25.4 mm.) mesh model with Experimental Deflection for
Slab#7 – HSC-V4-8in.
Figure 6-17: Deflection Comparison between Concrete Damage Model Release 3 and Winfrith Concrete for 1/2 in. (12.7 mm.) mesh model with Experimental Deflection Slab#7
– HSC-V4-8in.

73
Figure 6-18: Deflection Comparison between Concrete Damage Model Release 3 and Winfrith Concrete for 1 in. (25.4 mm.) mesh model with Experimental Deflection for
Slab#5 – HSC-V3-4in. and Slab#7 – HSC-V4-8in.
Figure 6-18 compares the two slabs i.e. Slab#5 – HSC-V3-4in and Slab#7 – HSC-
V4-8in. having the high-strength combination of concrete and steel with 4 in. and 8 in. steel
spacing respectively for both the experimental and numerical analysis results. The
numerical analysis results presented here are using the 1 in. (25.4 mm.) mesh model as this
mesh size yielded good results as compared to other mesh sizes in both the concrete
material models used. These slabs were subjected to similar pressures of 42.04 psi (0.28
MPa) and 44.42 psi (0.306 MPa) respectively and an impulse of 773.95 psi-msec (5.34
MPa-msec) and 753.56 psi-msec (5.19 MPa-msec) respectively during the experimental
program.
The experimental peak deflections recorded for the two slabs are 2.46 in. (62.48
mm.) and 7.2 in. (182.88 mm.) respectively. The two different reinforcement ratios in the

74
two slab types is the reason for such a large difference in the observed deflection. For both
of these slabs when modeled using the WCM gave a good prediction of the deflection as
observed from the peak and residual displacements as noted in Table 6-1 and 6-2. The
CDMR3 predicted the deflection response not very close to the experiment even in the post
peak region. The WCM predicted the peak deflections more closely but the post-peak
deflection response is not very accurate.
The slabs under consideration here are reinforced with #3 bars spaced at 4in. c/c
(101.6 mm.) in the longitudinal direction (reinforcement ratio = 0.68%) and with #3 bars
spaced at 8in. c/c (203.2 mm.) in the longitudinal direction (reinforcement ratio = 0.46%)
respectively. The slab with higher reinforcement ratio produced lesser deflection.
6.1.1.5.1 Mesh Size Effect for Slab # 9 (HSC-V5-8in.)
The deflection results obtained from numerical simulations for slab # 9 which is a
HSC-V5-8in. is compared for two different mesh sizes. This slab experienced a peak
pressure of 34.01 psi (0.23 MPa) and an impulse of 511.77 psi-msec (3.52 MPa-msec) in
the blast experiment. The blast pressures recorded for this slab are summarized in Appendix
A. The average deflection obtained from the experiment was 3.4 in. (86.36 mm.) recorded
at 33.4 milliseconds.

75
Figure 6-19: Deflection Comparison between 1 in. (25.4 mm.) and 1/2 in. (12.7 mm.) mesh sizes for Concrete Damage Model Release 3 and Experimental Deflection for Slab#9 –
HSC-V5-8in.
The deflection results obtained from LS-DYNA® concrete models with two mesh
sizes for CDMR3 are compared with the experimental deflections in Figure 6-19. The peak
deflections obtained from the CDMR3 with 1 in. (25.4 mm.) mesh was 3.49 in. (88.646
mm.) recorded at 34.5 milliseconds while for 1/2 in. (12.7 mm.) mesh model it was 0.91 in.
(23.11 mm.) recorded at 59 milliseconds. The deflections obtained from the models with 1
in. (25.4 mm) mesh size showed a 2.5% increase while the deflections obtained from the
1/2 in. (12.7 mm.) model showed a decrease by 73% when compared to the experimental
values. This must be the case because the analysis terminated with an error due to
occurrence of negative volume in certain elements.

76
Figure 6-20: Deflection Comparison between 1 in. (25.4 mm.) and 1/2 in. (12.7 mm.) for mesh sizes Winfrith Concrete Model and Experimental Deflection for Slab#9 – HSC-V5-
8in.
The deflection results obtained from LS-DYNA® concrete models with two mesh
sizes for WCM are compared with the experimental deflections in Figure 6-20. The peak
deflections obtained from the WCM with 1 in. (25.4 mm.) mesh was 3.84 in. (97.54 mm.)
recorded at 27.5 milliseconds while for 1/2 in. (12.7 mm.) mesh model it was 3.72 in.
(94.48 mm.) recorded at 32 milliseconds. The deflections obtained from the models with 1
in. (25.4 mm) mesh size showed a 4% decrease while the deflections obtained from the 1/2
in. (12.7 mm.) model showed an increase by 9% when compared to the experimental
values.
From Figure 6-19 and Figure 6-20 it can be noted that varying the mesh size from 1
in.(25.4 mm.) to 1/2 in. (12.7 mm.) increased the deflection by 0.46 in. (11.68 mm.) for the
Winfrith Concrete Model. The 1 in. mesh (25.4 mm) can be useful to predict the deflection
accurately in both the models in comparison with the experimental deflection.

77
6.1.1.5.2 Material Model Effect for Slab # 9 (HSC-V5-8in.)
Figure 6-21 and Figure 6-22 compare the deflections between two material models
for two mesh sizes. From Figure 6-21 for the 1 in. (25.4 mm) mesh model the WCM
predicted the deflection 0.15 in. (3.81 mm.) less while the CDMR3 predicted the deflection
0.09 in. (2.28 mm.) more than the experimental values. From Figure 6-22 for the 1/2 in.
(12.7 mm) mesh model the WCM predicted the deflection 0.31 in. (7.87 mm.) more while
the CDMR3 predicted the deflection 2.49 in. (63.24 mm.) less than the experimental values.
Here, the Winfrith Concrete Model predicted the response better in both mesh size
category.
Figure 6-21: Deflection Comparison between Concrete Damage Model Release 3 and Winfrith Concrete for 1 in. (25.4 mm.) mesh model with Experimental Deflection for
Slab#9 – HSC-V5-8in.

78
Figure 6-22: Deflection Comparison between Concrete Damage Model Release 3 and Winfrith Concrete for 1/2 in. (12.7 mm.) mesh model with Experimental Deflection Slab#9
– HSC-V5-8in.
6.1.1.6.1 Mesh Size Effect for Slab # 11 (HSC-V6-8in.)
The deflection results obtained from numerical simulations for slab # 11 which is a
HSC-V6-8in. is compared for two different mesh sizes. This slab experienced a peak
pressure of 37.05 psi (0.255 MPa) and an impulse of 576.07 psi-msec (3.97 MPa-msec) in
the blast experiment. The blast pressures recorded for this slab are summarized in Appendix
A. The average deflection obtained from the experiment was 3.38 in. (85.85 mm.) recorded
at 28.7 milliseconds.

79
Figure 6-23: Deflection Comparison between 1 in. (25.4 mm.) and 1/2 in. (12.7 mm.) mesh sizes
for Concrete Damage Model Release 3 and Experimental Deflection for Slab#11– HSC-V6-8in.
The deflection results obtained from LS-DYNA® concrete models with two
mesh sizes for CDMR3 are compared with the experimental deflections in Figure 6-23. The
peak deflections obtained from the CDMR3 with 1 in. (25.4 mm.) mesh was 3.88 in. (98.55
mm.) recorded at 29.5 milliseconds while for 1/2 in. (12.7 mm.) mesh model it was 4.09 in.
(103.88 mm.) recorded at 35.5 milliseconds. The deflections obtained from the models with
1 in. (25.4 mm) mesh size when compared to the experiments showed a 14% increase while
the deflections obtained from the 1/2 in. (12.7 mm.) model are higher by 21% when
compared to the experiment.

80
The deflection results obtained from LS-DYNA® concrete models with two mesh
sizes for WCM is compared with the experimental deflections in Figure 6-24. The peak
deflections obtained from the Winfrith Concrete model with 1 in. (25.4 mm.) mesh was
3.25 in. (82.55 mm.) recorded at 28.9 milliseconds while for 1/2 in. (12.7 mm.) mesh model
it was 4.31 in. (109.47 mm.) recorded at 32.5 milliseconds. The deflections obtained from
the models with 1 in. (25.4 mm) mesh size when compared to the experiments showed a 4%
decrease while the deflections obtained from the 1/2 in. (12.7 mm.) model are higher by
27% when compared to the experiment.
From Figure 6-23 and Figure 6-24 it can be noted that varying the mesh size from 1
in.(25.4 mm.) to 1/2 in. (12.7 mm.) increased the deflection by 1.05 in. (26.67 mm.) for the
WCM and by 0.12 in. (3.05 mm.) for CDMR3 respectively. The 1 in. mesh (25.4 mm) can
be useful to predict the deflection accurately in both the models in comparison with the
experimental deflection.
Figure 6-24: Deflection Comparison between 1 in. (25.4 mm.) and 1/2 in. (12.7 mm.) mesh sizes for Winfrith Concrete Model and Experimental Deflection for Slab#11 – HSC-V6-8in.

81
6.1.1.6.2 Material Model Effect for Slab # 11 (HSC-V6-8in.)
Figure 6-25 and Figure 6-26 compare the deflections between two material models
for two mesh sizes. From Figure 6-25 for the 1 in. (25.4 mm) mesh model the WCM
predicted the deflection 0.13 in. (3.3 mm.) less while the CDMR3 predicted the deflection
1/2 in. (12.7 mm.) more than the experiment. From Figure 6-26 for the 1/2 in. (12.7 mm)
mesh model the CDMR3 predicted the deflection 0.71 in. (18.03 mm.) more while the
WCM predicted the deflection 0.92 in. (23.37 mm.) more than the experimental values
respectively. Both the concrete models predict the response higher than the experiment for
the 1/2 in. (12.7 mm.) category.
Figure 6-25: Deflection Comparison between Concrete Damage Model Release 3 and Winfrith Concrete for 1 in. (25.4 mm.) mesh model with Experimental Deflection for
Slab#11 – HSC-V6-8in.

82
Figure 6-26: Deflection Comparison between Concrete Damage Model Release 3 and Winfrith Concrete for 1/2 in. (12.7 mm.) mesh model with Experimental Deflection
Slab#11 – HSC-V6-8in.
Figure 6-27: Deflection Comparison between Concrete Damage Model Release 3 and Winfrith Concrete for 1 in. (25.4 mm.) mesh model with Experimental Deflection for
Slab#9 – HSC-V5-8in and Slab#11 – HSC-V6-8in.

83
Figure 6-27 compares the two slabs i.e. Slab#9 – HSC-V5-8in and Slab#11 – HSC-
V6-8in. having the high-strength combination of concrete and steel with 8 in. steel spacing
for both the experimental and numerical analysis results. The numerical analysis results
presented here are using the 1 in. (25.4 mm.) mesh model as this mesh size yielded good
results as compared to other mesh sizes in both the concrete material models used. These
slabs were subjected to similar pressures of 34.01 psi (0.23 MPa) and 37.05 psi (0.255
MPa) respectively and an impulse of 511.77 psi-msec (3.52 MPa-msec) and 576.07 psi-
msec (3.97 MPa-msec) respectively during the experimental program.
As seen in the plot the peak deflections for the two slabs occured within a very small
timeframe ranging between 28.7 milliseconds and 33.4 milliseconds. The experimental
peak deflections recorded for the two slabs are 3.4 in. (86.36 mm.) and 3.38 in. (85.85 mm.)
respectively. For both of these slabs when modeled using the two concrete material models
gave a good prediction of the deflection as observed from the peak and residual
displacements as noted in Table 6-1 and 6-2. The Concrete Damage Release 3 Model
predicted the deflection response very close to the experiment even in the post peak region.
Although the peak values deviates more from the experimental peak deflection as compared
to the Winfrith Concrete Model. The Winfrith Concrete Model predicted the peak
deflections more closely but the post-peak deflection response is not very accurate.
The slabs under consideration here are reinforced with #3 bars spaced at 8in. c/c
(203.2 mm.) in the longitudinal direction (reinforcement ratio = 0.46%). The numerical
analysis using the Winfrith Concrete Model shows a stable response with lesser rebound of
the slab in the post-peak deflection-time history.

84
6.1.2 Normal Strength Concrete with Normal Strength Steel Slabs (RSC-R)
The second set of slabs studied here are the ones having combination of normal
strength concrete reinforced with normal strength steel (RSC-R). The deflection-time
histories for each of the 6 slabs are represented in this section. The comparison is made
between two mesh sizes i.e. 1” and 0.5” for each of the two material models as shown in
Table 6-7 and Table 6-8.
Table 6-7: Percentage comparison of deflections with the experimental value for
normal strength slabs. Slab No.
Description Pressure (psi)/Impulse (psi-msec)
Percentage Change in Deflections in the Numerical Model from Experimental
Deflection values. 1 in.mesh 0.5in. mesh Winfrith Damage
Release 3 Winfrith Damage
Release 3 2 RSC-R1-4in. 53.1/976.71 ↓23% ↑10% ↓14% ↑32% 4 RSC-R2-4in. 52.39/1000.38 ↓26.5% 0% ↓16% ↑28% 6 RSC-R3-4in. 44.2/785.35 ↓33% ↑9% ↓22.7% ** 8 RSC-R4-8in. 33.4/494.39 ↓17% ↑8% ↓24.5% ↑37% 10 RSC-R5-8in. 34.78/549.5 ↓8% ↑10% ↓18% ↑36% 12 RSC-R6-8in. 33.74/509.01 ↓5% ↑7% ↓13% ↑64%
** Negative volume in elements terminated the analysis.
Table 6-8: Percentage change in deflection when the mesh size was reduced from 1 in. (25.4mm.) to ½ in. (12.7 mm.) for normal strength slabs.
Slab No. Description Deflections Winfrith Damage
Release 3 Slab 2 RSC-R1-4in. ↑11% ↑20% Slab 4 RSC-R2-4in. ↑14% ↑28% Slab 6 RSC-R3-4in. ↑15% ** Slab 8 RSC-R4-8in. ↓23% ↑27% Slab 10 RSC-R5-8in. ↓17% ↑23% Slab 12 RSC-R6-8in. ↓11% ↑52%

85
6.1.2.1.1 Mesh Size Effect for Slab # 2 (RSC-R1-4in.)
The deflection results obtained from numerical simulations for slab # 2 which is a
RSC-R1-4in. is compared for two different mesh sizes. This slab experienced a peak
pressure of 53.1 psi (0.366 MPa) and an impulse of 976.17 psi-msec (6.73 MPa-msec) in
the blast experiment. The blast pressures recorded for this slab are summarized in Appendix
A. The average deflection obtained from the experiment was 4.29 in (108.96 mm.) recorded
at 29.94 milliseconds.
Figure 6-28: Deflection Comparison between 1 in. (25.4 mm.) and 1/2 in. (12.7 mm.) mesh sizes for Concrete Damage Model Release 3 and Experimental Deflection for Slab#2 –
RSC-R1-4in.
The deflection results obtained from LS-DYNA® concrete models with two mesh
sizes for CDMR3 are compared with the experimental deflections in Figure 6-28. The peak
deflections obtained from the CDMR3 with 1 in. (25.4 mm.) mesh was 4.73 in. (120.14
mm.) recorded at 36.5 milliseconds while for 1/2 in. (12.7 mm.) mesh model it was 5.69 in.

86
(144.53 mm.) recorded at 28.5 milliseconds. The deflections obtained from the models for
CDMR3 with 1 in. (25.4 mm) mesh size showed a 10% increase when compared to the
experiments. The deflections obtained from the 1/2 in. (12.7 mm.) model are higher by 32%
when compared to the experiment.
Figure 6-29: Deflection Comparison between 1 in. (25.4 mm.) and 1/2 in. (12.7 mm.) mesh sizes for Winfrith Concrete Model and Experimental Deflection for Slab#2 – RSC-R1-4in.
The deflection results obtained from LS-DYNA® concrete models with two mesh
sizes for WCM are compared with the experimental deflections in Figure 6-29. The peak
deflections obtained from the Winfrith Concrete model with 1 in. (25.4 mm.) mesh was 3.3
in. (83.82 mm.) recorded at 24.5 milliseconds while for 1/2 in. (12.7 mm.) mesh model it
was 3.67 in. (93.22 mm.) recorded at 25 milliseconds. The deflections obtained from the
models with 1 in. (25.4 mm) mesh size showed a 23% decrease while the deflections
obtained from the 1/2 in. (12.7 mm.) model showed a 14% decrease when compared to the
experimental values respectively.

87
From Figure 6-28 and Figure 6-29 it can be noted that varying the mesh size from 1
in.(25.4 mm.) to 1/2 in. (12.7 mm.) increased the deflection by 0.37 in. (9.4 mm.) for the
WCM and by 0.96 in. (24.38 mm.) for CDMR3 respectively. The 1 in. mesh (25.4 mm) can
be useful to predict the deflection accurately in both the models in comparison with the
experimental deflection.
6.1.2.1.2 Material Model Effect for Slab # 2 (RSC-R1-4in.)
Figure 6-30 and Figure 6-31 compare the deflections between two material models
for two mesh sizes. From Figure 6-30 for the 1 in. (25.4 mm) mesh model the CDMR3
predicted the deflection 0.44 in. (11.18 mm.) more than the experimental deflection while
the WCM predicted the deflection which was 0.99 in. (2.28 mm.) less than the experiment.
From Figure 6-31 for the 1/2 in. (12.7 mm) mesh model the WCM predicted the deflection
0.62 in. (25.15 mm.) less than the experimental deflection while the CDMR3 predicted the
deflection 1.4 in. (35.56 mm.) more than the experiment. The Winfrith Concrete Model
predicted the response better in both mesh size category.

88
Figure 6-30: Deflection Comparison between Concrete Damage Model Release 3 and Winfrith Concrete for 1 in. (25.4 mm.) mesh model with Experimental Deflection for
Slab#2 – RSC-R1-4in.
Figure 6-31: Deflection Comparison between Concrete Damage Model Release 3 and Winfrith Concrete for 1/2 in. (12.7 mm.) mesh model with Experimental Deflection
Slab#2– RSC-R1-4in.

89
6.1.2.2.1 Mesh Size Effect for Slab # 4 (RSC-R2-4in.)
The deflection results obtained from numerical simulations for slab # 4 which is a
RSC-R2-4in. is compared for two different mesh sizes. This slab experienced a peak
pressure of 52.39 psi (0.361 MPa) and an impulse of 1000.38 psi-msec (6.89 MPa-msec) in
the blast experiment. The blast pressures recorded for this slab are summarized in Appendix
A. The average deflection obtained from the experiment was 4.45 in. (113.03 mm.)
recorded at 32.73 milliseconds.
Figure 6-32: Deflection Comparison between 1 in. (25.4 mm.) and 1/2 in. (12.7 mm.) mesh
sizes for Concrete Damage Model Release 3 and Experimental Deflection for Slab#4 – RSC-R2-4in.
The deflection results obtained from LS-DYNA® concrete models with two mesh
sizes for CDMR3 are compared with the experimental deflections in Figure 6-32. The peak
deflections obtained from the CDMR3 with 1 in. (25.4 mm.) mesh was 4.45 in. (113.03
mm.) recorded at 36.5 milliseconds while for 1/2 in. (12.7 mm.) mesh model it was 5.71 in.
(145.03 mm.) recorded at 28.99 milliseconds. The deflections obtained from the models

90
with 1 in. (25.4 mm) mesh size showed no change when compared to the experiments.The
deflections obtained from the 1/2 in. (12.7 mm.) model are higher by 28% when compared
to the experiment.
Figure 6-33: Deflection Comparison between 1 in. (25.4 mm.) and 1/2 in. (12.7 mm.) mesh sizes for Winfrith Concrete Model and Experimental Deflection for Slab#4 – RSC-R2-4in.
The deflection results obtained from LS-DYNA® concrete models with two mesh
sizes for WCM are compared with the experimental deflections in Figure 6-33. The peak
deflections obtained from the WCM with 1 in. (25.4 mm.) mesh was 3.28 in. (83.31 mm.)
recorded at 24.5 milliseconds while for 1/2 in. (12.7 mm.) mesh model it was 3.73 in.
(94.74 mm.) recorded at 25.5 milliseconds. The deflections obtained from the models with
1 in. (25.4 mm) mesh size showed a 26.5% decrease while the deflections obtained from the
1/2 in. (12.7 mm.) model decreased by 16% when compared to the experiment.
From Figure 6-32 and Figure 6-33 it can be noted that varying the mesh size from 1
in.(25.4 mm.) to 1/2 in. (12.7 mm.) increased the deflection by 0.46 in. (11.68 mm.) for the

91
WCM and by 1.26 in. (32 mm.) for CDMR3 respectively. The 1 in. mesh (25.4 mm) can be
useful to predict the deflection accurately with the CDMR3 in comparison with the
experimental deflection.
6.1.2.2.2 Material Model Effect for Slab # 4 (RSC-R2-4in.)
Figure 6-34 and Figure 6-35 compare the deflections between two material models
for two mesh sizes. From Figure 6-34 for the 1 in. (25.4 mm) mesh model the CDMR3
predicted the deflection same as the experimental deflection. The Winfrith Concrete Model
predicted the deflection which was 1.14 in. (29.9 mm.) less than the experiment. From
Figure 6-35 for the 1/2 in. (12.7 mm) mesh model the WCM predicted the deflection 0.72
in. (18.29 mm.) less than the experimental deflection while the CDMR3 predicted the
deflection 1.26 in. (32 mm.) more than the experiment. The Concrete Damage Model
Release 3 predicted the response better in both mesh size category.

92
Figure 6-34: Deflection Comparison between Concrete Damage Model Release 3 and Winfrith Concrete for 1 in. (25.4 mm.) mesh model with Experimental Deflection for
Slab#4 – RSC-R2-4in.
Figure 6-35: Deflection Comparison between Concrete Damage Model Release 3 and
Winfrith Concrete for 1/2 in. (12.7 mm.) mesh model with Experimental Deflection Slab#4– RSC-R2-4in.

93
Figure 6-36: Deflection Comparison between Concrete Damage Model Release 3 and Winfrith Concrete for 1 in. (25.4 mm.) mesh model with Experimental Deflection for
Slab#2 – RSC-R1-4in. and Slab#4 – RSC-R2-4in.
Figure 6-36 compares the two slabs i.e. Slab#2 – RSC-R1-4in. and Slab#4 – RSC-
R2-4in. having the normal-strength combination of concrete and steel with 4 in. steel
spacing for both the experimental and numerical analysis results. The numerical analysis
results presented here are using the 1 in. (25.4 mm.) mesh model as this mesh size yielded
good results as compared to other mesh sizes in both the concrete material models used.
These slabs were subjected to similar pressures of 53.1 psi (0.366 MPa) and 52.39 psi
(0.361 MPa) respectively and an impulse of 976.17 psi-msec (6.73 MPa-msec) and
1000.38 psi-msec (6.89 MPa-msec) respectively during the experimental program. As seen
in the plot the peak deflections for the two slabs occured within a very small timeframe
ranging between 29.94 milliseconds and 34.73 milliseconds. The experimental peak
deflections recorded for the two slabs are 4.29 in. (108.96 mm.) and 4.45 in. (113.03 mm.)

94
respectively. For both of these slabs when modeled using the CDMR3 gave a good
prediction of the deflection as observed from the peak and residual displacements as noted
in Table 6-3 and Table 6-4. The CDMR3 predicted the deflection response very closely to
the experiment n in the peak as well as post-peak region. The peak values deviates more
from the experimental peak deflection as compared to the response of WCM.
These slabs having RSC-R-4in. (reinforcement ratio = 0.68%) could withstand
higher pressure and impulse even when designed using normal-strength material. The
numerical analysis also shows a stable response with lesser rebound of the slab in the post-
peak deflection-time history for the CDMR3. The response for the Winfrith Concrete
Model in the normal strength category is however not very accurate for the 1 in. model. A
finer mesh is required to be used when modeling with the Winfrith Concrete Model.
6.1.2.3.1 Mesh Size Effect for Slab # 6 (RSC-R3-4in.)
The deflection results obtained from numerical simulations for slab # 6 which is a
RSC-R3-4in. is compared in this section for two different mesh sizes. This slab experienced
a peak pressure of 44.2 psi (0.305 MPa) and an impulse of 785.35 psi-msec (5.42 MPa-
msec) in the blast experiment. The blast pressures recorded for this slab are summarized in
Appendix A. The average deflection obtained from the experiment was 3.17 in. (113.03
mm.) recorded at 23.36 milliseconds.

95
Figure 6-37: Deflection Comparison between 1 in. (25.4 mm.) and 1/2 in. (12.7 mm.) for mesh sizes Concrete Damage Model Release 3 and Experimental Deflection for Slab#6 –
RSC-R3-4in.
The deflection results obtained from LS-DYNA® concrete models with two mesh
sizes for CDMR3 are compared with the experimental deflections in Figure 6-37. The peak
deflections obtained from the CDMR3 with 1 in. (25.4 mm.) mesh was 3.47 in. (88.14 mm.)
recorded at 37.5 milliseconds while for 1/2 in. (12.7 mm.) mesh model the simulation
stopped because negative volume developed in some elements . The deflections obtained
from the models with 1 in. (25.4 mm) mesh size showed a 9% increase when compared to
the experiments while the deflections obtained from the 1/2 in. (12.7 mm.) model could not
be compared to the experiment as the analysis terminated due to generation of negative
volume in the elements.

96
Figure 6-38: Deflection Comparison between 1 in. (25.4 mm.) and 1/2 in. (12.7 mm.) mesh sizes for Winfrith Concrete Model and Experimental Deflection for Slab#6 – RSC-R3-4in.
The deflection results obtained from LS-DYNA® concrete models with two mesh
sizes for WCM are compared with the experimental deflections in Figure 6-38. The peak
deflections obtained from the WCM with 1 in. (25.4 mm.) mesh was 2.13 in. (54.1 mm.)
recorded at 21.5 milliseconds while for 1/2 in. (12.7 mm.) mesh model it was 2.45 in.
(62.23 mm.) recorded at 22.5 milliseconds. The deflections obtained from the models with
1 in. (25.4 mm) mesh size showed a 33% decrease when compared to the experimental
while the deflections obtained from the 1/2 in. (12.7 mm.) model decreased by 22.7% when
compared to the experiment.
From Figure 6-37 and Figure 6-38 it can be noted that varying the mesh size from 1
in.(25.4 mm.) to 1/2 in. (12.7 mm.) increased the deflection by 0.32 in. (8.13 mm.) for the
WCM. The 1 in. mesh (25.4 mm) can be useful to predict the deflection accurately in both
the models in comparison with the experimental deflection.

97
6.1.2.3.2 Material Model Effect for Slab # 6 (RSC-R3-4in.)
Figure 6-39 and Figure 6-40 compare the deflections between two material models
for two mesh sizes. From Figure 6-39 for the 1 in. (25.4 mm) mesh model the CDMR3
predicted the deflection 0.3 in. (7.62 mm.) more than the experimental deflection while the
WCM predicted the deflection 1.04 in. (26.42 mm.) less than the experiment. From Figure
6-40 for the 1/2 in. (12.7 mm) mesh model the WCM predicted the deflection 0.72 in. (18.3
mm.) less than the experimental deflection while the CDMR3 predicted the deflection much
higher than the experiment as the analysis ended in the error. The Winfrith Concrete Model
predicted the response better in both mesh size category.
Figure 6-39: Deflection Comparison between Concrete Damage Model Release 3 and Winfrith Concrete for 1 in. (25.4 mm.) mesh model with Experimental Deflection for
Slab#6 – RSC-R3-4in.

98
Figure 6-40: Deflection Comparison between Concrete Damage Model Release 3 and Winfrith Concrete for 1/2 in. (12.7 mm.) mesh model with Experimental Deflection
Slab#6– RSC-R3-4in.
6.1.2.4.1 Mesh Size Effect for Slab # 8 (RSC-R4-8in.)
The deflection results obtained from numerical simulations for slab # 8 which is a
RSC-R4-8in. is compared in this section for two different mesh sizes. This slab experienced
a peak pressure of 33.4 psi (0.23 MPa) and an impulse of 494.39 psi-msec (3.41 MPa-msec)
in the blast experiment. The blast pressures recorded for this slab are summarized in
Appendix A. The average deflection obtained from the experiment was 3.38 in. (85.85
mm.) recorded at 28.74 milliseconds.

99
Figure 6-41: Deflection Comparison between 1 in. (25.4 mm.) and 1/2 in. (12.7 mm.) mesh
sizes for Concrete Damage Model Release 3 and Experimental Deflection for Slab#8 – RSC-R4-8in.
The deflection results obtained from LS-DYNA® concrete models with two mesh
sizes for CDMR3 are compared with the experimental deflections in Figure 6-41. The peak
deflections obtained from the CDMR3 with 1 in. (25.4 mm.) mesh was 3.66 in. (92.96 mm.)
recorded at 38.5 milliseconds while for 1/2 in. (12.7 mm.) mesh model it was 4.66 in.
(118.36 mm.) recorded at 36 milliseconds. The deflections obtained from the models with 1
in. (25.4 mm) mesh size showed an 8% increase when compared to the experiments while
the deflections obtained from the 1/2 in. (12.7 mm.) model are higher by 37% when
compared to the experiment.

100
Figure 6-42 : Deflection Comparison between 1 in. (25.4 mm.) and 1/2 in. (12.7 mm.)
mesh sizes for Winfrith Concrete Model and Experimental Deflection for Slab#8 – RSC-R4-8in.
The deflection results obtained from LS-DYNA® concrete models with 1 in. (25.4
mm.) and 1/2 in. (12.7 mm.) mesh sizes for WCM are compared with the experimental
deflections in Figure 6-42. The peak deflections obtained from the WCM with 1 in. (25.4
mm.) mesh was 2.8 in. (71.12 mm.) recorded at 28.5 milliseconds while for 1/2 in. (12.7
mm.) mesh model it was 2.5 in. (63.5 mm.) recorded at 24.5 milliseconds. The deflections
obtained from the models with 1 in. (25.4 mm) mesh size showed a 17% decrease when
compared to the experiments. The deflections obtained from the 1/2 in. (12.7 mm.) model
are lower by 24.5% when compared to the experiment.
From Figure 6-41 and Figure 6-42 it can be noted that varying the mesh size from 1
in. (25.4 mm.) to 1/2 in. (12.7 mm.) decreased the deflection by 0.25 in.(6.35 mm.) for the
WCM and increased by 1.01 in. (25.65 mm.) for CDMR3 respectively. The 1 in. mesh (25.4

101
mm) can be useful to predict the deflection accurately in both the models in comparison
with the experimental deflection.
6.1.2.4.2 Material Model Effect for Slab # 8 (RSC-R4-8in.)
Figure 6-43 and Figure 6-44 compare the deflections between two material models
for two mesh sizes. From Figure 6-43 for the 1 in. (25.4 mm) mesh model the CDMR3
predicted the deflection 0.27 in. (6.86 mm.) more than the experimental deflection while the
WCM predicted the deflection 0.58 in. (14.73 mm.) less than the experiment. From Figure
6-44 for the 1/2 in. (12.7 mm) mesh model the WCM predicted the deflection 0.83 in.
(20.99 mm.) less than the experimental deflection while the CDMR3 predicted the
deflection 1.28 in. (32.51 mm.) more than the experiment. The WCM predicted the
response better in both mesh size category.
Figure 6-43: Deflection Comparison between Concrete Damage Model Release 3 and Winfrith Concrete for 1 in. (25.4 mm.) mesh model with Experimental Deflection for
Slab#8 – RSC-R4-8in.

102
Figure 6-44: Deflection Comparison between Concrete Damage Model Release 3 and Winfrith Concrete for 1/2 in. (12.7 mm.) mesh model with Experimental Deflection for
Slab#8 – RSC-R4-8in.
6.1.2.5.1 Mesh Size Effect for Slab # 10 (RSC-R5-8in.)
The deflection results obtained from numerical simulations for slab # 10 which is a
RSC-R5-8in. is compared in this section for two different mesh sizes. This slab experienced
a peak pressure of 34.78 psi (0.24 MPa) and an impulse of 549.5 psi-msec (3.78 MPa-msec)
in the blast experiment. The blast pressures recorded for this slab are summarized in
Appendix A. The average deflection obtained from the experiment was 3.6 in. (91.44 mm.)
recorded at 30.3 milliseconds.

103
Figure 6-45: Deflection Comparison between 1 in. (25.4 mm.) and 1/2 in. (12.7 mm.) mesh sizes for Concrete Damage Model Release 3 and Experimental Deflection for Slab#10 –
RSC-R5-8in.
The deflection results obtained from LS-DYNA® concrete models with two mesh
sizes for CDMR3 are compared with the experimental deflections in Figure 6-45. The peak
deflections obtained from the CDMR3 with 1 in. (25.4 mm.) mesh was 3.98 in. (101.09
mm.) recorded at 18.0 milliseconds while for 1/2 in. (12.7 mm.) mesh model it was 4.93 in.
(125.22 mm.) recorded at 27.0 milliseconds. The deflections obtained from the models with
1 in. (25.4 mm) mesh size showed a 10% increase when compared to the experiments while
the deflections obtained from the 1/2 in. (12.7 mm.) model are higher by 36% when
compared to the experiment.

104
Figure 6-46: Deflection Comparison between 1 in. (25.4 mm.) and 1/2 in. (12.7 mm.) mesh sizes for Winfrith Concrete Model and Experimental Deflection for Slab#10 – RSC-R5-8in.
The deflection results obtained from LS-DYNA® concrete models with two mesh
sizes for WCM are compared with the experimental deflections in Figure 6-46. The peak
deflections obtained from the Winfrith Concrete model with 1 in. (25.4 mm.) mesh was
3.29 in. (83.57 mm.) recorded at 31.5 milliseconds while for 1/2 in. (12.7 mm.) mesh model
it was 2.93 in. (63.5 mm.) recorded at 26 milliseconds. The deflections obtained from the
models with 1 in. (25.4 mm) mesh size showed an 8% decrease when compared to the
experiments while the deflections obtained from the 1/2 in. (12.7 mm.) model are lower by
18% when compared to the experiment.
From Figure 6-45 and Figure 6-46 it can be noted that varying the mesh size from 1
in.(25.4 mm.) to 1/2 in. (12.7 mm.) decreased the deflection by 0.97 in. (24.64 mm.) for the
WCM and by 0.94 in. (23.88 mm.) for CDMR3 respectively. The 1 in. mesh (25.4 mm) can
be useful to predict the deflection accurately in both the models in comparison with the
experimental deflection.

105
6.1.2.5.2 Material Model Effect for Slab # 10 (RSC-R5-8in.)
Figure 6-47 and Figure 6-48 compare the deflections between two material models
for two mesh sizes. From Figure 6-47 for the 1 in. (25.4 mm) mesh model the WCM
predicted the deflection 0.31 in. (7.87 mm.) less than the experimental deflection CDMR3
predicted the deflection 0.38 in. (9.65 mm.) more than the experimental values. From
Figure 6-48 for the 1/2 in. (12.7 mm) mesh model the WCM predicted the deflection 0.67
in. (17.02 mm.) less than the experimental deflection while the CDMR3 predicted the
deflection 1.32 in. (33.53 mm.) more than the experiment. The Winfrith Concrete Model
predicted the response better in both mesh size category.
Figure 6-47: Deflection Comparison between Concrete Damage Model Release 3 and Winfrith Concrete for 1 in. (25.4 mm.) mesh model with Experimental Deflection for
Slab#10 – RSC-R5-8in.

106
Figure 6-48: Deflection Comparison between Concrete Damage Model Release 3 and Winfrith Concrete for 1/2 in. (12.7 mm.) mesh model with Experimental Deflection for
Slab#10 – RSC-R5-8in.
6.1.2.6.1 Mesh Size Effect for Slab # 12 (RSC-R6-8in.)
The deflection results obtained from numerical simulations for slab # 12 which is a
RSC-R6-8in. is compared for two different mesh sizes. This slab experienced a peak
pressure of 33.74 psi (0.23 MPa) and an impulse of 509.01 psi-msec (3.51 MPa-msec) in
the blast experiment. The blast pressures recorded for this slab are summarized in Appendix
A. The average deflection obtained from the experiment was 3.17 in. (80.52 mm.) recorded
at 23.36 milliseconds.

107
Figure 6-49 : Deflection Comparison between 1 in. (25.4 mm.) and 1/2 in. (12.7 mm.) mesh sizes for Concrete Damage Model Release 3 and Experimental Deflection for Slab#12
– RSC-R6-8in.
The deflection results obtained from LS-DYNA® concrete models with two mesh
sizes for CDMR3 are compared with the experimental deflections in Figure 6-49The peak
deflections obtained from the CDMR3 with 1 in. (25.4 mm.) mesh was 3.43 in. (87.122
mm.) recorded at 38.5 milliseconds while for 1/2 in. (12.7 mm.) mesh model it was 5.23 in.
(132.84 mm.) recorded at 37.0 milliseconds. The deflections obtained from the models with
1 in. (25.4 mm) mesh size showed a 7% increase when compared to the experiments while
the deflections obtained from the 1/2 in. (12.7 mm.) model are higher by 64% when
compared to the experimental values.

108
Figure 6-50: Deflection Comparison between 1 in. (25.4 mm.) and 1/2 in. (12.7 mm.) mesh sizes for Winfrith Concrete Model and Experimental Deflection for Slab#12 – RSC-R6-8in.
The deflection results obtained from LS-DYNA® concrete models with two mesh
sizes for WCM are compared with the experimental deflections in Figure 6-50. The peak
deflections obtained from the WCM with 1 in. (25.4 mm.) mesh was 3.02 in. (76.71 mm.)
recorded at 28.5 milliseconds while for 1/2 in. (12.7 mm.) mesh model it was 2.74 in. (63.5
mm.) recorded at 24.5 milliseconds. The deflections obtained from the models with 1 in.
(25.4 mm) mesh size showed a 5% decrease when compared to the while the deflections
obtained from the 1/2 in. (12.7 mm.) model are lower by 13% when compared to the
experimental values.
From Figure 6-49 and Figure 6-50 it can be noted that varying the mesh size from 1
in.(25.4 mm.) to 1/2 in. (12.7 mm.) decreased the deflection by 0.26 in. (6.6 mm.) for the
Winfrith Concrete Model and increased by 1.81 in. (45.97 mm.) for Concrete Damage

109
Model Release 3 respectively. The 1 in. mesh (25.4 mm) can be useful to predict the
deflection accurately in both the models in comparison with the experimental deflection.
6.1.2.6.2 Material Model Effect for Slab # 12 (RSC-R6-8in.)
Figure 6-51 and Figure 6-52 compare the deflections between two material models
for two mesh sizes. From Figure 6-51 for the 1 in. (25.4 mm) mesh model the WCM
predicted the deflection 0.16 in. (4.06 mm.) less than the experimental deflection while the
CDMR3 predicted the deflection 0.25 in. (6.35 mm.) more than the experiment. From
Figure 6-52 for the 1/2 in. (12.7 mm) mesh model the WCM predicted the deflection 0.42
in. (10.67 mm.) less than the experimental deflection while the CDMR3 predicted the
deflection 2.03 in. (51.56 mm.) more than the experiment. The Winfrith Concrete Model
predicted the response better in both mesh size category.
Figure 6-51: Deflection Comparison between Concrete Damage Model Release 3 and Winfrith Concrete for 1 in. (25.4 mm.) mesh model with Experimental Deflection for
Slab#12 – RSC-R6-8in.

110
Figure 6-52: Deflection Comparison between Concrete Damage Model Release 3 and Winfrith Concrete for 1/2 in. (12.7 mm.) mesh model with Experimental Deflection for
Slab#12 – RSC-R6-8in.
Figure 6-53: Deflection Comparison between Concrete Damage Model Release 3 and Winfrith Concrete for 1 in. (25.4 mm.) mesh model with Experimental Deflection for
Slab#10 – RSC-R5-8in. and Slab#12 – RSC-R6-8in.

111
Figure 6-53 compares the two slabs i.e. Slab#10 – RSC-R5-8in. and Slab#12 – RSC-
R6-8in. having the high-strength combination of concrete and steel with 8 in. steel spacing
for both the experimental and numerical analysis results. The numerical analysis results
presented here are using the 1 in. (25.4 mm.) mesh model as this mesh size yielded good
results as compared to other mesh sizes in both the concrete material models used. These
slabs were subjected to similar pressures of 34.78 psi (0.24 MPa) and 33.74 psi (0.23 MPa)
respectively and an impulse of 549.5 psi-msec (3.78 MPa-msec) and 509.01 psi-msec (3.51
MPa-msec) respectively during the experimental program.
As seen in the plot the peak deflections for the two slabs occured within a very small
timeframe ranging between 23.36 milliseconds and 30.3 milliseconds. The experimental
peak deflections recorded for the two slabs are 3.6 in. (91.44 mm.) and 3.17 in. (80.52 mm.)
respectively. For both of these slabs when modeled using the two concrete material models
gave a good prediction of the deflection as observed from the peak and residual
displacements as noted in Table 6-3 and Table 6-4. The WCM predicted the deflection
response very close to the experiment but the post-peak deflection response deviates more
from the experimental post-peak deflection. The CDMR3 predicted the peak deflections
higher than the experiment also the post-peak deflection response is not very accurate as the
slab rebounds completely.

112
6.2 Comparison Criterion 2; Crack Propagation Study
The crack patterns observed in the numerical simulation are compared with
the crack patterns developed on the slab as observed in the experiment. Two concrete
material models namely, the WCM and the CDMR3 are considered for comparison. The
slab model used for studying the crack patterns is the 0.25 in. (6.35 mm) mesh model for
both 4 in. and 8 in. type slabs. The 0.25 in. mesh model was used because the finer mesh
can predict finer cracks as they are formed.
6.2.1 High Strength Concrete with High Strength Steel Slabs (HSC-V-4 in.)
In this section the High Strength Slabs with #3 bars spaced at 4 in. c/c (101.6 mm.)
in the longitudinal direction (reinforcement ratio = 0.68%) are considered for comparison
based on damage crack patterns developed on the slab. The damage crack patterns captured
on the slab after the experiment and numerical analysis are represented in Figure 6-54,
Figure 6-55 and Figure 6-56 for this type of slab. Since this type of slab has the
combination of high strength materials combined with higher reinforcement ratio the crack
patterns observed on the slab are very narrow.
The damage patterns observed on the CDMR3 are represented in Part (a) of these
figures. The lateral damage crack patterns are seen as contours of the max. principal strain
as well as erosion of elements in the cracked area. The propagation of crack from the center
of the slab to the periphery can be observed on the slab models as the simulation progresses.
The LS-DYNA model displays all of the cracks that generate in the model including narrow
cracks which cannot be easily distinguished in the results. The damage patterns observed on
the WCM are represented in Part (c) of these figures. The narrow cracks could be neglected
by setting the minimum crack width as 0.0002 in. (0.0051 mm.).

113
6.2.1.1 Damage Crack Patterns for Slab # 1 (HSC-V1-4in.)
Figure 6-54: Damage crack patters for Slab # 1 from (a) Concrete Damage Rel3 Model, (b) Experiment and (c) Winfrith Concrete Model
(a)
(b) (c)

114
6.2.1.2 Damage Crack Patterns for Slab # 3 (HSC-V2-4in.)
Figure 6-55: Damage crack patters for Slab # 3 from (a) Concrete Damage Rel3 Model, (b) Experiment and (c) Winfrith Concrete Model
(a)
(b) (c)

115
6.2.1.3 Damage Crack Patterns for Slab # 5 (HSC-V3-4in.)
Figure 6-56: Damage crack patters for Slab # 5 from (a) Concrete Damage Rel3 Model, (b) Experiment and (c) Winfrith Concrete Model
(a)
(b) (c)

116
6.2.2 High Strength Concrete with High Strength Steel Slabs (HSC-V-8 in.)
In this section the High Strength Slabs with #3 bars spaced at 8in. c/c in the
longitudinal direction (reinforcement ratio = 0.46%) are considered for comparison based
on damage crack patterns developed on the slab. The damage crack patterns captured on the
slab after the experiment and numerical analysis are represented in Figure 6-57, Figure 6-58
and Figure 6-59 for this type of slab. Since this type of slab has the combination of high
strength materials combined with lower reinforcement ratio the crack patterns observed on
the slab are much wider.
The damage patterns observed on the CDMR3 are represented in Part (a) of these
figures. The LS-DYNA model displays all of the cracks that generate in the model
including narrow cracks which cannot be easily distinguished in the results. However, the
wide cracks that are generated in these slabs are very well predicted in the numerical model
as the elements in this region have been eroded. The damage patterns observed on the
WCM are represented in Part (c) of these figures. Slab # 7 experienced a higher pressure
and impulse in this category and thus shows wider cracks in the center of the slabs which
are also predicted well in the CDMR3 slab model. Slab # 9 and Slab # 11 experienced
pressure and impulse much lower than Slab # 7 and thus the damage observed is
comparatively less in both experimental and also the numerical slab models.

117
6.2.2.1 Damage Crack Patterns for Slab # 7 (HSC-V4-8in.) v
Figure 6-57: Damage crack patters for Slab # 7 from (a) Concrete Damage Rel3 Model, (b) Experiment and (c) Winfrith Concrete Model
(a)
(b) (c)

118
6.2.2.2 Damage Crack Patterns for Slab # 9 (HSC-V5-8in.)
Figure 6-58: Damage crack patters for Slab # 9 from (a) Concrete Damage Rel3 Model, (b) Experiment and (c) Winfrith Concrete Model
(a)
(b) (c)

119
6.2.2.3 Damage Crack Patterns for Slab # 11 (HSC-V6-8in.)
Figure 6-59: Damage crack patters for Slab # 11 from (a) Concrete Damage Rel3 Model, (b) Experiment and (c) Winfrith Concrete Model
(a)
(b) (c)
120
6.2.3 Normal Strength Concrete with Normal Strength Steel Slabs (RSC-R- 4in.)
In this section the Normal Strength Steel Slabs with #3 bars spaced at 4in. c/c (101.6
mm.) in the longitudinal direction (reinforcement ratio = 0.68%) are considered for
comparison based on damage crack patterns developed on the slab. The damage crack
patterns captured on the slab after the experiment and numerical analysis are represented in
Figure 6-60, Figure 6-61 and Figure 6-62 for this type of slab. Since this type of slab has the
combination of normal strength materials combined with higher reinforcement ratio the
crack patterns observed on the slab are narrow.
The damage patterns observed on the CDMR3 are represented in Part (a) of these
figures. The lateral damage crack patterns are seen as contours of the max. principal strain
as well as erosion of elements in the cracked area. The propagation of crack from the center
of the slab to the periphery can be observed on the slab models as the simulation progresses.
The LS-DYNA model displays all of the cracks that generate in the model including narrow
cracks which cannot be easily distinguished in the results. The damage patterns observed on
the WCM are represented in Part (c) of these figures. The narrow cracks could be neglected
by setting the minimum crack width as 0.0002 in. (0.0051 mm.).

121
6.2.3.1 Damage Crack Patterns for Slab # 2 (RSC-R1-4in.)
Figure 6-60: Damage crack patters for Slab # 2 from (a) Concrete Damage Rel3 Model, (b) Experiment and (c) Winfrith Concrete Model
(a)
(b) (c)
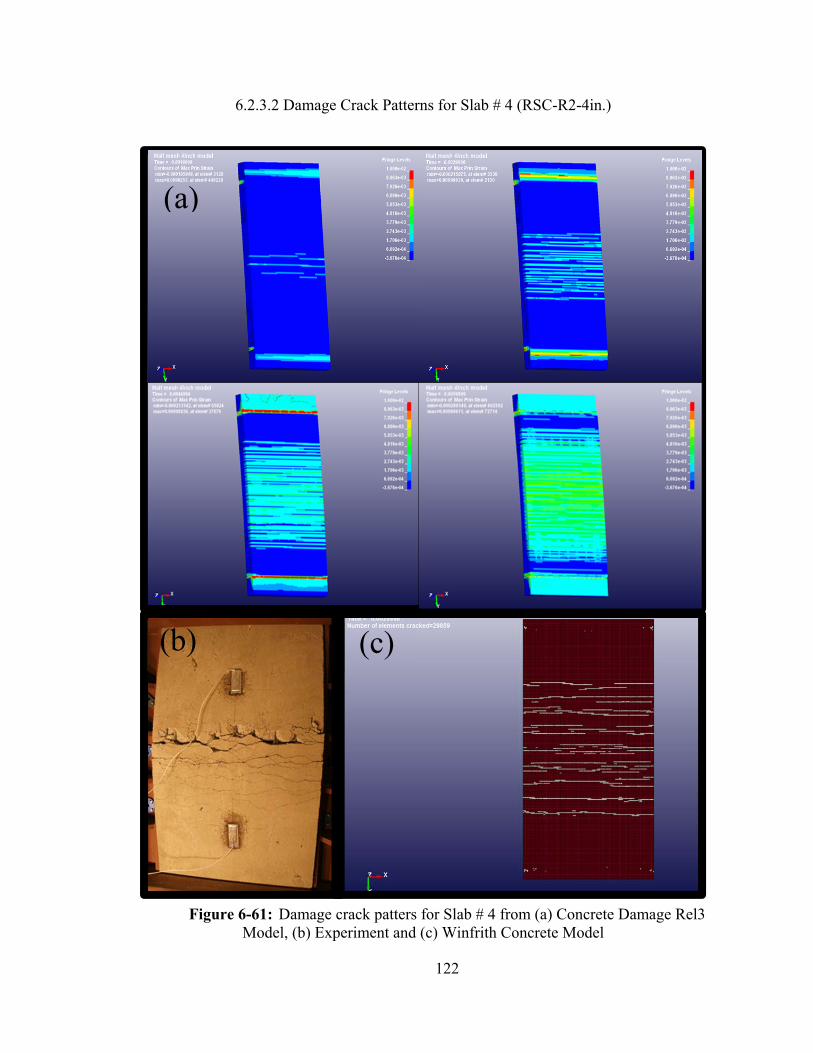
122
6.2.3.2 Damage Crack Patterns for Slab # 4 (RSC-R2-4in.)
Figure 6-61: Damage crack patters for Slab # 4 from (a) Concrete Damage Rel3 Model, (b) Experiment and (c) Winfrith Concrete Model
(a)
(b) (c)

123
6.2.3.3 Damage Crack Patterns for Slab # 6 (RSC-R3-4in.)
Figure 6-62: Damage crack patters for Slab # 6 from (a) Concrete Damage Rel3 Model, (b) Experiment and (c) Winfrith Concrete Model
(a)
(b) (c)

124
6.2.4 Normal Strength Concrete with Normal Strength Steel Slabs (RSC-R- 8in.)
In this section the High Strength Slabs with #3 bars spaced at 8in. c/c in the
longitudinal direction (reinforcement ratio = 0.46%) are considered for comparison based
on damage crack patterns developed on the slab. The damage crack patterns captured on the
slab after the experiment and numerical analysis are represented in Figure 6-63, Figure 6-64
and Figure 6-65 for this type of slab.
The damage patterns observed on the CDMR3 are represented in Part (a) of these
figures. The LS-DYNA model displays all of the cracks that generate in the model
including narrow cracks which cannot be easily distinguished in the results. However, the
wide cracks that are generated in these slabs are very well predicted in the numerical model
as the elements in this region have been eroded. The damage patterns observed on the
WCM are represented in Part (c) of these figures.
The Normal Strength Concrete with Normal Strength Steel Slabs with with #3 bars
spaced at 8in. c/c in the longitudinal direction (reinforcement ratio = 0.46%) has the
weakest combination with regards to the material strength and the reinforcement ratio but
these slabs experienced lower pressures and impulse and hence do not show a high visible
damage.

125
6.2.4.1 Damage Crack Patterns for Slab # 8 (RSC-R4-8in.)
Figure 6-63: Damage crack patters for Slab # 8 from (a) Concrete Damage Rel3 Model, (b) Experiment and (c) Winfrith Concrete Model
(a)
(b) (c)

126
6.2.4.2 Damage Crack Patterns for Slab # 10 (RSC-R5-8in.)
Figure 6-64: Damage crack patters for Slab # 10 from (a) Concrete Damage Rel3 Model, (b) Experiment and (c) Winfrith Concrete Model
(a)
(b) (c)

127
6.2.4.3 Damage Crack Patterns for Slab # 12 (RSC-R6-8in.)
Figure 6-65: Damage crack patters for Slab # 12 from (a) Concrete Damage Rel3 Model, (b) Experiment and (c) Winfrith Concrete Model
(a)
(b) (c)

128
CHAPTER 7
DISCUSSION OF RESULTS
The numerical analysis results for the set of 12 RC slabs on comparison with the
experimental data provide an understanding on the behavior of the RC slabs when subjected
to blast loading. The two combinations of slabs namely, high-strength concrete with high-
strength steel (HSC-V) and normal-strength concrete with normal-strength steel (RSC-R)
have been discussed in detail here for the deflection and damage response shown by both
numerical analysis and experimental investigation which lead to achieving the primary
objective of experimental validation of the numerical analysis.
7.1 High-Strength Concrete – Comparison of Model with 1 in. (25.4 mm.) Mesh to ½ in.
(12.7 mm.) Mesh Model.
The percentage change in peak slab deflection when mesh size was reduced from 1
in. (25.4 mm.) to ½ in. (12.7 mm.) has been shown in Table 6-6 in Chapter 6. It was
observed that a finer mesh of ½ in. (12.7 mm.) substantially increased the deflection in both
the concrete models namely the Winfrith Concrete Model and the Concrete Damage Model
Release 3. However, the increase in deflection is comparatively more for the Winfrith
Concrete Model with a percentage increase of 46% in slabs having 4in. spaced steel while a
percentage increase of 32% in slabs having 8 in. spaced steel. However, the 1in. (25.4
mm.) mesh model produces the deflection near the experimental values as compared to the
½ in. (12.7 mm.) mesh model.

129
7.2 High Strength Concrete – Comparison of Winfrith Concrete Model with Concrete
Damage Release 3.
The two concrete models used for modeling concrete behavior namely the Winfrith
Concrete Model with Concrete Damage Release 3 have performed well in predicting peak
and residual deflections in the high-strength concrete category with the 1 in. (25.4 mm.)
mesh model. The deflection response for the two models is compared with the experiments
in Table 6-5. The Winfrith Concrete Model has predicted the deflection closer to the
experiment as compared to the Concrete Damage Model Release 3 in both the peak and
residual deflection region of the deflection time-history. When the Winfrith Concrete Model
is used for slabs having 4 in. (101.6 mm.) spaced steel the peak deflection is 1.5% less than
the experimental deflection and the residual deflection is 10% more than the experimental
deflection. Similarly, when the Winfrith Concrete Model is used for slabs having 8 in.
(203.2 mm.) spaced steel the peak deflection is 3% less than the experimental deflection the
residual deflection is 12% less than the experimental deflection.
7.3 Normal Strength Concrete – Comparison of model with 1 in. (25.4 mm.) mesh to ½ in.
(12.7 mm.) mesh model.
The percentage change in peak slab deflection when mesh size was reduced from 1
in. (25.4 mm.) to ½ in. (12.7 mm.) has been shown in Table 6-8 in Chapter 6. It was
observed that a finer mesh of ½ in. (12.7 mm.) substantially increased the deflection in the
Concrete Damage Model Release 3 for both the models having 4 in. (101.6 mm.) and 8 in.
(203.3 mm.) spaced steel. The Winfrith Concrete Model has shown an increase in deflection
of 11% to 15% on reduction of mesh size from 1 in. (25.4 mm.) to ½ in. (12.7 mm.) for the

130
model having steel spaced at 4 in. (101.6 mm.). But, the model having steel spaced at 8 in.
(203.2 mm.) has a reduction in deflection up to 23% when the mesh size is reduced to ½
in.
7.4 Normal Strength Concrete – Comparison of Winfrith Concrete Model with Concrete
Damage Release 3.
In the normal strength category out of the two concrete models the Concrete
Damage Model Release 3 has performed better than the Winfrith Concrete Model in
predicting the peak-deflection for both slabs having 4 in. (101.6 mm.) and 8 in. (203.2 mm.)
spaced steel. However the post-peak response for the Concrete Damage Model Release 3 is
not as good as that of Winfrith Concrete Model in terms of its residual deflection. The
Winfrith Concrete Model predicts the response 33% lower than the experimental value in
the peak-deflection region but the post-peak deflection response is closer to the
experimental deflection response.
7.5 Comparison of High Strength Material with Normal Strength Material.
The performance of high-strength slabs when compared to the normal-strength slabs
having 4 in. (101.6 mm.) longitudinally spaced steel doesn’t show a distinct reduction in the
peak deflection due to use of high strength material. The reinforcement ratio of 0.68%
makes the effect of strength negligible as can be observed from the deflection values
presented in Table 6-1 and Table 6-2. Both types of slabs in the 0.68% reinforcement ratio
category have experienced pressures in the range of 49.28 psi. to 53.1 psi. and have
produced deflection in the range of 3.89 in. to 4.53 in. Thus, on increasing the concrete

131
strength the deflection reduced by 9% in the experimental analysis. While in the numerical
analysis for Winfrith Concrete Model the deflection increased by 16% while for Concrete
Damage Release 3 the deflection reduced by 19%.
The performance of high-strength slabs when compared to the normal-strength slabs
having 8 in. (203.2 mm.) longitudinally spaced steel also doesn’t show a distinct reduction
in the peak deflection due to use of high strength material. These types of slabs have been
subjected to pressures in the range of 511.77 psi. to 576.07 psi. for the high-strength and in
the range of 509.01 psi. to 549.5 psi. for normal strength slabs. The deflection obtained
from the slab consisting of high-strength material was less by 5% than the deflection
obtained from the slab consisting of normal-strength material. Thus the effect of using
higher-strength material is only reasonable when higher pressures and impulses are acting
on the slab.
7.6 Comparison of Slabs with 4 in. (101.6 mm.) c/c Longitudinal Steel to 8 in. (203.2 mm.)
c/c Longitudinal Steel.
Comparison of slabs with 4 in. (101.6 mm.) c/c longitudinal steel to 8 in. (203.2
mm.) c/c longitudinal steel can be made at two levels based on the two strengths of
materials used. For high-strength slabs the deflection increased by 190% when the
reinforcement ratio was reduced from from 0.68% to 0.46%. This is also true for normal-
strength slabs where the deflection increased by 6% when the reinforcement ratio was
reduced from from 0.68% to 0.46%. The use of higher reinforcement ratio has improved
the response of the slab when combined with high-strength materials.

132
7.7 Comparison for validation of numerical analysis by studying damage response
Through visual observation it is seen that the damage patterns as recorded in the
experiment have been predicted well by Concrete Damage Model Release 3 and Winfrith
Concrete Model. The Winfrith Concrete Model used a ¼ in. (6.35 mm.) mesh model to
generate the visual crack patterns. The narrow cracks were neglected by setting a minimum
crack width and thus a clear damage pattern was generated which was good for
comparison with the experimental damage recorded in the photographs. The Concrete
Damage Model Release 3 which used an erosion criterion also needed ¼ in. (6.35 mm.)
mesh model to generate the visual crack patterns. The maximum principal strain in the
material which was represented using different color contours gave information regarding
crack generation and propagation. But as the simulation progressed the contours were not
distinctly visible and hence only the initial response of the slab could be considered for
comparison. The cracks produced during the initial phase of the simulation by the Concrete
Damage Model Release 3 with the erosion material model have provided a good match to
the crack produced during the experiment.
The analyses of the results obtained during the comparison of numerical analysis
with experimental investigation have been summarized and conclusions and
recommendations for future work are presented in the next chapter.

133
CHAPTER 8
CONCLUSIONS AND FUTURE WORK
This chapter gives the conclusions based on the numerical analysis done on the 12
single-mat reinforced concrete slabs subjected to blast loading and their comparison with
the results obtained from the experimental investigation in order to validate the material
models namely, Winfrith Concrete Model and Concrete Damage Model Release 3. This
chapter also includes the scope of future studies using the observations and results of this
study.
1. In the high-strength material slabs (HSC-V) and normal-strength material slabs
(RSC-R) on reducing the mesh sizes from 1 in. (25.4 mm.) to ½ in. (12.7 mm.) the
deflection increases by up to 1.1 to 1.5 times for both Winfrith Concrete Model
and Concrete Damage Model Release 3 in slabs having longitudinal reinforcement
spaced at 4 in. (101.6 mm.) c/c.
2. In both high-strength material slabs (HSC-V) and normal-strength material slabs
(RSC-R) modeled using Winfrith Concrete Model and Concrete Damage Model
Release 3 the 1 in. (25.4 mm.) mesh model has predicted peak deflections closer to
the experimental values and has utilized less number of CPU hours.
3. Winfrith Concrete Model has predicted deflection closer to the experimental
deflection in high-strength slabs in both peak-deflection and post-peak deflection
regions.
4. For Concrete Damage Model Release 3 laboratory test data for concrete can be
utilized to give input parameters by combining them with generated parameters.

134
5. In the high-strength material slabs (HSC-V) and normal-strength material
slabs (RSC-R) having longitudinal reinforcement ratio of 0.68% (4in. c/c spaced
longitudinal steel gives reinforcement ratio = 0.68%) when subjected to
similar pressure and impulse values the deflection observed is not affected by
reduction in strength of concrete and steel in both experimental and numerical
analysis.
6. On reduction of the reinforcement ratio from 0.68% to 0.46% the slab
deflection increased by twice the amount.
7. The capability of Winfrith Concrete Model to generate the crack patterns with a
¼ in. (6.53 mm.) mesh model can be used to perform detailed crack analysis by
comparing the cracks developed in the numerical model with experimental crack
data.
8. The Concrete Damage Model Release 3 also required the ¼ in. (6.53 mm.) mesh
model to generate the crack patterns developed on the slab. However it was not
suitable in making comparison with the experimental results because of erosion of
elements from the slab model.
9. The Winfrith Concrete Model provides better prediction of slab response to blast
loading for both high-strength and normal-strength slabs, for two-different slabs
reinforcement ratios based on the comparison of peak deflections in numerical
model with the experimental results .

135
8.1 Future Scope of Work
The future work that can be performed based on the conclusions obtained from this
study are suggested in the following.
1. There is scope of improvement in using modified parameters in the Concrete
Damage Model Release 3 to predict the response more close to experiment for normal-
strength concrete.
2. Use of hourglass control needs to be studied in order to develop relation between
its parameters and the strength of concrete used.
3. Pressure-impulse diagrams can be developed based on the experimental data
available for single-mat slabs.

136
APPENDIX A - PRESSURE AND IMPULSE DATA FOR 12 SLABS
Summary of Peak Pressures and Impulse for twelve RC slabs recorded at six
locations on each slab:
P+ I+ P+ I+ P+ I+ P+ I+(psi) (psi-msec) (psi) (psi-msec) (psi) (psi-msec) (psi) (psi-msec)
P1 48.97 994.16 P1 52.55 971.56 P1 47.43 973.95 P1 48.25 986.22P2 54.72 1142.59 P2 56.73 1089.44 P2 52.74 1140.11 P2 54 1073.28P3 52.39 998.72 P3 51.72 972.04 P3 48.68 984.34 P3 50.49 988.37P4 53.1 966.49 P4 53.3 889.41 P4 48.55 923 P4 55.83 1014.28P5 53.48 978.36 P5 51.87 974.37 P5 48.45 971.28 P5 52.1 974.33P6 53.04 996.94 P6 53.67 985.68 P6 50.74 1011.77 P6 51.65 993.69PD 53.2 986.16 PD 49.98 967.83 PD 47.6 976.78 PD 49.58 992.68PE 53.65 1042.8 PE 55 959 PE 50.02 999.73 PE 57.2 980.16Sum 422.55 8106.22 Sum 424.82 7809.33 Sum 394.21 7980.96 Sum 419.1 8003.01Avg 52.82 1013.28 Avg 53.10 976.17 Avg 49.28 997.62 Avg 52.39 1000.38
Deflection Deflection Deflection Deflection(in) (in) (in) (in)
L1 3.89 L1 4.29 L1 4.53 L1 4.45A1 3.97 A1 5.37 A1 4.69 A1 NG
Strain Strain Strain StrainS1 S1 S1 S1S2 S2 S2 S2
P+ I+ P+ I+ P+ I+ P+ I+(psi) (psi-msec) (psi) (psi-msec) (psi) (psi-msec) (psi) (psi-msec)
P1 42.4 756.33 P1 43.97 778.53 P1 41.89 755.87 P1 32.38 493.5P2 44.62 805.45 P2 43.63 789.51 P2 45.87 743.29 P2 32.91 532.02P3 42.1 754.03 P3 44.57 772.82 P3 44.92 757.07 P3 35 494.99P4 43.19 806.8 P4 45.65 800.56 P4 50.61 766.41 P4 34.41 401.28P5 41.05 744.67 P5 43.19 771.71 P5 46.83 744.18 P5 33.9 488.51P6 41.47 778.9 P6 44.84 799.05 P6 42.18 753.33 P6 34.32 534.79PD 39.81 758.61 PD 44.46 773.35 PD 40.22 749.39 PD 31.73 498.04PE 41.67 786.8 PE 43.28 797.28 PE 42.87 761.35 PE 32.57 511.95Sum 336.31 6191.59 Sum 353.59 6282.81 Sum 355.39 6030.89 Sum 267.22 3955.08Avg 42.04 773.95 Avg 44.20 785.35 Avg 44.42 753.86 Avg 33.40 494.39
Deflection Deflection Deflection Deflection(in) (in) (in) (in)
L1 2.46 L1 3.17 L1 7.2 L1 3.36A1 NG A1 NA A1 A1 3.38
Strain Strain Strain StrainS1 S1 S1 S1S2 S2 S2 S2
P+ I+ P+ I+ P+ I+ P+ I+(psi) (psi-msec) (psi) (psi-msec) (psi) (psi-msec) (psi) (psi-msec)
P1 32.65 490.44 P1 34.94 518.32 P1 37.91 565.13 P1 34.17 484.64P2 35.09 553.94 P2 36.43 549.86 P2 37.18 571.36 P2 33.4 400.48P3 36.25 492.39 P3 37 519.8 P3 37.19 578.71 P3 36.91 485.62P4 35.69 535.85 P4 34.94 582.35 P4 37.45 586.54 P4 32.6 592.56P5 32.34 488.46 P5 33.4 511.01 P5 37.47 569.86 P5 33.43 499.28P6 33.69 515.66 P6 33.94 615.82 P6 37.76 582.16 P6 32.24 558.79PD 33.81 501.71 PD 33.24 529.24 PD 35.79 571.33 PD 32.73 519.73PE 32.57 515.72 PE 34.37 569.58 PE 35.65 583.47 PE 34.4 531Sum 272.09 4094.17 Sum 278.26 4395.98 Sum 296.4 4608.56 Sum 269.88 4072.1Avg 34.01 511.77 Avg 34.78 549.50 Avg 37.05 576.07 Avg 33.74 509.01
Deflection Deflection Deflection Deflection(in) (in) (in) (in)
L1 3.4 L1 3.6 L1 3.38 L1 3.17A1 A1 3.75 A1 3.96 A1
Strain Strain Strain StrainS1 S1 S1 S1S2 S2 S2 S2
1.78, 3.57 2.12, 2.85
Slab #4
Slab #8
Slab #9 Slab #10 Slab #11 Slab #12
Slab #1 Slab #2 Slab #3
Slab #5 Slab #6 Slab #7
5.44, 7.28, 8.61

137
APPENDIX B - PRESSURE AND IMPULSE PLOTS FOR 12 RC SLABS
Figure B-1 : Average Pressure-time History for Slab # 1.
Figure B-2: Average Pressure-time History for Slab # 2.

138
Figure B-3: Average Pressure-time History for Slab # 3.
Figure B-4: Average Pressure-time History for Slab # 4.

139
Figure B-5: Average Pressure-time History for Slab # 5.
Figure B-6: Average Pressure-time History for Slab # 6.

140
Figure B-7: Average Pressure-time History for Slab # 7.
Figure B-8: Average Pressure-time History for Slab # 8.

141
Figure B-9: Average Pressure-time History for Slab # 9.
Figure B-10: Average Pressure-time History for Slab # 10.

142
Figure B-11: Average Pressure-time History for Slab # 11.
Figure B-12: Average Pressure-time History for Slab # 12.

143
APPENDIX C - SUMMARY TABLES
Table C-1: Input Parameters for Winfrith Concrete Model
Variable Description Input value for High strength concrete
Input value for Normal strength concrete
RO Mass Density 2.246E-04lb-s/in3 2.246E-04lb-s/in3 TM Initial Tangent Modulus of Concrete 3.6E+06 psi 3.6E+06 psi PR Poisson’s Ratio 0.18 0.18 UCS Uniaxial Compressive Strength 11600 psi 5000 psi UTS Uniaxial Tensile Strength 928 psi 460 psi FE Fracture Energy/Crack Width 0.0002 0.0002 ASIZE Aggregate Size (radius) 0.125 in. 0.125 in. E Young’s modulus of rebar Default Default YS Yield stress of rebar Default Default EH Hardening modulus of rebar Default Default UELONG Ultimate elongation before rebar fails Default Default RATE Rate effects 1 1 CONM Factor to convert model mass units to
Kg -1 -1
CONL Factors to convert model length units to meters
0.0254 0.0254
CONT Factors to convert model length units to meters
1 1
EPS1,.. Volumetric Strain Values Default Default P1, P2,.. Pressures corresponding to volumetric
strain values Default Default

144
Table C-2: Input parameters for Concrete Damage Model Release 3 Variable Description Input value for
High strength concrete
Input value for Normal strength concrete
RHO Mass Density 2.24E-04 lb-s/in3 2.24E-04 lb-s/in3
PR Poisson’s Ratio 0.18 0.18 FT Uniaxial Tensile Strength 928 psi 462psi A0/-fc’ Uniaxial Compressive Strength 4700 3200 A1 Maximum shear surface parameter 0.55 0.60 A2 Maximum shear failure parameter 0.0000082 0.00000152 B1 Damage Scaling Parameter 1.6 1.6 OMEGA Fractional dilatancy 0.5 0.5 A1F Residual Failure Coefficient 0.4417 0.4417 Sλ Stretch factor 100 100 NOUT Output selector for effective plastic
strain 2 2
RSIZE Unit Conversion factor for length 1 1 UCF Unit Conversion factor for stress 1 1 LCRATE Load Curve for strain rate effects 0 0 LOCWID Maximum aggregate diameter 1 1 λ01-λ13 Damage Functions default default B3 Damage scaling coefficient for tri-
axial tension 1.15 1.15
A0Y Initial yield surface cohesion 3460 1500 A1Y Initial yield surface coefficient 0.625 0.625 η01-η13 Scale factor default default B2 Tensile Damage scaling coefficient 1.35 1.35 A2F Residual failure surface coefficient 0.00000763 0.0000177 A2Y Initial yield surface coefficient 0.0000166 0.0000384
Table C-3: Input Parameters for Plastic Kinematic Model for Steel Rebar
Variable Description Input value for High strength steel
Input value for Normal strength steel
RO Mass Density 7.30E-04 lb-s/in3 7.30E-04 lb-s/in3 E Young’s Modulus of Rebar 2.90E+07 psi 2.90E+07 psi PR Poisson’s Ratio 3.00E-01 psi 3.00E-01 psi SIGY Yield strength of Rebar 83000 psi 60000 psi ETAN Tangent Modulus Default Default BETA Hardening Parameter Default Default SRC Strain Rate Parameter Default Default SRP Strain Rate Parameter Default Default FS Failure Strain for Eroding Elements Default Default

145
APPENDIX D – LS-DYNA INPUT
Figure D-1: Input and Output Control Parameters
$# LS-DYNA Keyword fil~ er~at~d by LS-PREPOST 3.0 - 30Hay2010(20:~8)
$# Cr~ae~d on Jul-25-2012 (11:21: 13) ·KEYlJORD >TITLEI $# title LS-DYNA k~yword d~ek by LS-Pr~po~e ·CONTROL ACCURACY $ el~an~d up (~liminae~d unu~~d eonunand~, pare~)
$# osu inn pido~u
1 0 0 ·CONTROL ENERGY $ r~due~ e~~f
$# hgen rwen slnten rylen 2 2 2 2
·CONTROL HOURGLASS $ 1 0 . 0 $# ihq qh
• 1.~00000
·CONTROL TERMINATION $# ~ndeim ~ndeye dtmin ~nd~ng ~ncima~
O. HSOOO 0 0.000 0.000 0.000 ·CONTROL TIHESTEP $ 0.0 0.0 0 0.0 0.0 $# dtinit t~~fae i~do t~ 1 imt dt2m~ letm ~rode m~1~t
0.000 0.600000 0 0.000 0.000 0 0 0 $# dt2m~f dt2m~le im~e 1
0.000 0 0 ·DATABASE BNDOUT $# dt binary leur ioopt
0 . 001000 0 0 1
·DATABASE GLSTAT $# dt binary leur ioopt
0.001000 0 0 1 ·DATABASE HATSUH $# dt binary leur ioope
0 . 001000 0 0 1
·DATABASE BINARY D3PLOT $# dt ledt beam nplte psetid S . OOOOE-~ 0 0 0 0
$# ioopt 0
·DATABASE BINARY D3THDT $# dt lede beam nplee p~eeid
O.OO~OOO 0 0 0 0 ·DATABASE EXTENT BINARY - -$# neiph neips maxint ~trflg ~igflg epsflg rltflg engflg
0 0 0 1 0 0 0 0 $# empflg ieverp be:arnip deomp ~hge st~~z n3thdt ialemat
0 0 1 0 0 0 0 0 $# nint~ld pkp_~en selp unu~ed mssel therm iniout iniout
0 0 1 . 000000 0 0 OSTRESS STRESS

146
Figure D-2: Input Parameters for Concrete Damage Model Release 3 for High-Strength Concrete
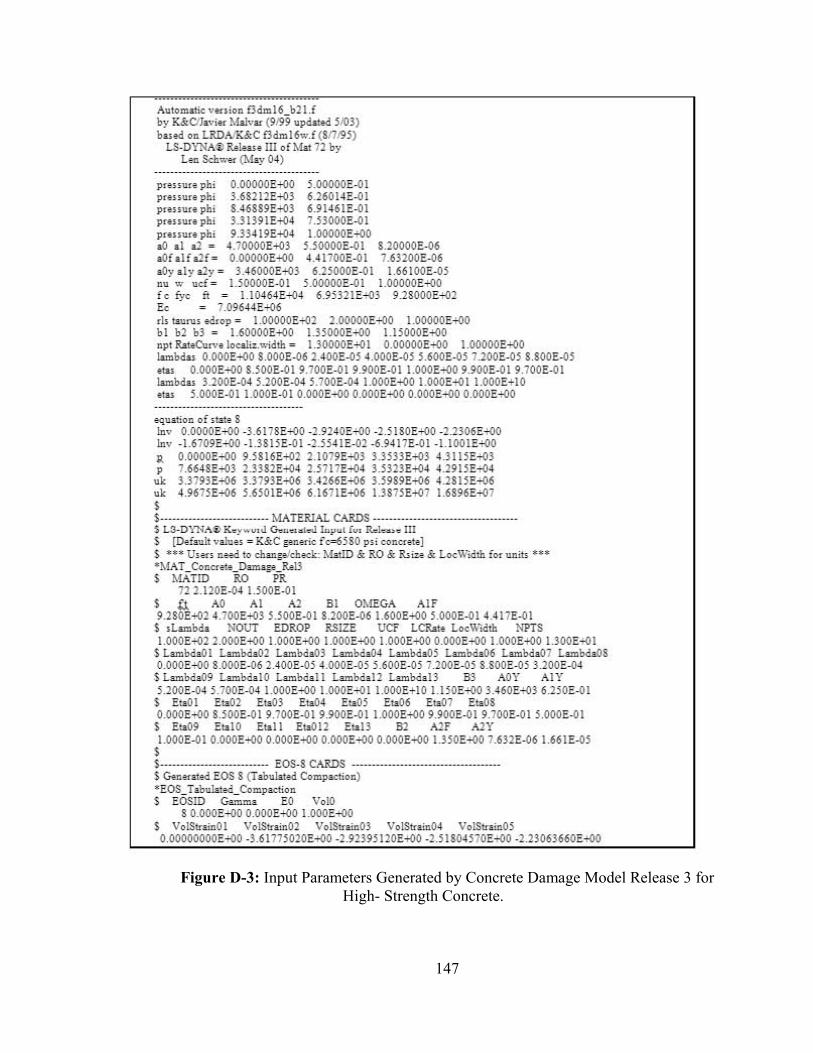
147
Figure D-3: Input Parameters Generated by Concrete Damage Model Release 3 for High- Strength Concrete.
A.to""'" voni •• f1dm16_bll .f by n CIJ .... io< ~w, ... (911l9 .p<!.tod I~ l)
" ,od .. LRDA~C f1dm16 ... f ( l nlll l ) LS-D'fNAt> 1Woa,. UI .fM .. J2 '"
L .. S.._(M&v"')
", ,,,,,,.ploi O.OOOOOE..oo I .OOOOOE-Ol ", ,,,,,,.ploi l .6Il11E~l 6 .!~14E-Ol
", ,,,,,,.ploi U6119E~l 6 .91461E-Ol ", ,,,,,,.ploi l .l1l91E..o.I J .IlOOOE-Ol ",."",.ploi 9 .ll. 19E..o.I I.OOOOOE..oo 00 .1 o! _ 4. JOOOOE~l I .IOOOOE-Ol UOOOOE-06 oOfolfo!f_ O.OOOOOE..oo U lJOOE-Ol HnOOE-06 oOy.lyo!y_ H6OO<JE~l 6 .ll000E-Ol U6100E-OI .. .. . of_ UOOOOE-Ol I .OOOOOE-Ol I.OOOOOE..O<J f< fy< ~ _ 1.1o..64E-4I 6 .9InlE~l 9 .ll000E~l
E< _ 7 .09644E-<l6 ,h """' , od<., _ I.OOOOOE..ol 2 .00000E..O<J I.OOOOOE..O<J bl bl bJ _ I.60000E..oo l.lIOOOE..oo l.lIOOOE..oo .",Jtat.oCu<.,·.Io<.li • . N,._ l.lOOOOE~ J O.OOOOOE..oo I.OOOOOE..oo IamMo, O.OOOE..oo I .OOOE-06 H OOE-OI •. OOOE-Ol 1.600E-OI UOOE-OI I .IOOE-OI .,., O.OOOE..oo I .IOOE-Ol 9 . JOOE-Ol 9 .'IOOE-Ol I.OOOE..O<J 9 .'IOOE-Ol 9 . JOOE-Ol IamMo, UOOE41 UOOE4II .JOOE41 I.000E..oo I.OOOE-.<J lI.OOOE+10 .,., I .OOOE-Ol I.OOOE-OI O.OOOE..O<J O.OOOE..oo O.OOOE..oo O.OOOE..oo
... ", ... f"otol mv O.OOOOE..oo _HlJIE..oo _Hl. VE..oo _l .IIIOE..oo _l .ll<ME..oo mv _UJ09E..oo _l.llllE-Ol _DI. IE-Ol ~ .9. lJE -Ol _I.lOOl E..oo R O.OOOOE..O<J 9 .1116E..ol l .1079E..ol l .llllE..ol 4. l11IE..ol , J .664!E..ol l.llllE-4I DJlJE-4I l .lnJE-4I 4.l91IE-4I .. l .lJ9JE_ l .lJ9JE_ Hl66E_ l .1919E_ 4.!11IE_ .k 4.96JIE_ 1.6101E_ 6.16J1E_ l.lIJIE..o7 UI96E..o7 , 1 __________________________ MATEIUAL CARDS _
~ L5-D'fNh. K.,~",,, o-.......u ...... 1 '"' n.Jo.,. III 1 [Dof .. l, ,-.bo., _ K&C __ f.,.;5110 "i , .. "' oto[ 1 ... U, .. , no..! " ,,,,,,,,",d>o<k, ld&tlD .t RO .t R>iu.t L..,Wld,. f" .. it> ... ·~{AT_C.n<,~_~_~
1 ~{ATID RO PR lll.llOE41 I.l00E-Ol
1 A M Al A1 HI O~!EGA Alf 9 .!IOE~l •. JOOE-.<Jl I .IOOE-Ol UOOE-06 I.600E..oo I .OOOE-Ol H lJE-Ol 1 ,L_Mo NOm EDROP RSIZE UCI' LCRato L..,\\lO,. NPTS I.OOOE~ll.OOOE..O<J I.OOOE..O<J I.OOOE..oo I.OOOE..oo O.OOOE..O<J I.OOOE..O<J l.lOOE~ l 1 L"",bdoOl L"",bdoOl L"",bdoOl L"",b<!o<J.I L"",bdoOl L"",b<!006 L_bdo07 L"",bdoOl O.OOOE..oo I .OOOE-06 H OOE-OI •. OOOE-Ol 1.600E-OI UOOE-OI I .IOOE-OI UOOE41 IL"",bdo09 L_MolO L_Moll L_MoU L_Moll Hl MY A1Y UOOE41 I . JOOE41 I.OOOE..O<J I.OOOE ~l I.OOOE _10 1.1 IOE..O<J H~E..ol 6 .l10E-Ol 1 EtaO l EtaOl EtaOl Eta<J.I EtaOl Eta06 Eta07 EtaO l O.OOOE..oo I .IOOE-Ol 9 . JOOE-Ol 9 .'IOOE-Ol I.OOOE..O<J 9.'IOOE-Ol 9. JOOE-Ol I .OOOE-Ol 1 Eta09 EtalO Etall EtaOU Etall ill A1f A1Y I.OOOE-Ol O.OOOE..oo O.OOOE..oo O.OOOE..O<J O.OOOE..O<J 1.llOE..oo HnE-06 U61 E-OI ,
1__ EOS-I CARDS 1 c-..atod EOS I (Tobulatod c."",_ •• ) ' E os _ r ... latod _ c."",_ .. 1 EOSID Gomm& EJ V.lO
I O.OOOE..oo O.OOOE..oo I.OOOE..O<J 1 V.iSt< .... Ol V.iSt< .... Ol V.iSt< .... Ol v.iSt< .... '" V.iSt< .... OI O.OOOOOOOOE.oo _l .61 J71010E.oo _1.91391 110E.oo _1.111"'1 JOE.oo _ l.no.;J6~E.oo

148
Figure D-4: Input Parameters for Concrete Damage Model Release 3for Normal-Strength Concrete

149
Figure D-5: Input Parameters Generated by Concrete Damage Model Release 3 for High-Strength Concrete
""'=c;, ,.,.;'" ~"""_"'l.f l»: UC Jr. i . ".1", <""'" """'" , OJ) !woO "" U'D" UC ~"" "'" (" " "') l,n,,,,,, R ...... m o"lot -, by
l & ''''''" ('I • .,. '"') ........ ,.. O.O::<:«I -OO '.O::<:«Ul ........ ,.. U )))3I O{ ) ' .',",'Ul ........ ,.. '.""'-,_" ' .,","Ul ........... '.OIOXI_,", . " >XUl ........ , '" '." ,no{' .O::<:«I -OO IO..A! ,, _ 1."Om o{ ) ... " X Ul U O,, -U, L'."", _ O.O::<:«I_OO ... 1"OCUl 1.-"'-U' ~'"''' ''''' 1.' '''''_'' '.' ",,",Ul ).""SM"
1.""",,,UI '.O::<:«UI 1.0000000I -OO
'."OC«I_" ).00""_" ,."""""

150
Figure D-6: Input Parameters for Winfrith Concrete Model for High-Strength Concrete
Figure D-7: Input Parameters for Winfrith Concrete Model for Normal-Strength Concrete
Figure D-8: Input Parameters for Plastic-Kinematic Model for High-Strength Concrete
Figure D-9: Input Parameters for Plastic-Kinematic Model for High-Strength Concrete

151
Figure D-10: Input Parameters for Constrained Lagrange in Solid Formulation
Figure D-11: Input Parameters for Mat Add Erosion Model

152
REFERENCES
1. Mlakar Sr, P., et al., The Oklahoma City bombing: Analysis of blast damage to the Murrah Building. Journal of Performance of Constructed Facilities, 1998. 12: p. 113.
2. (DoD), D.o.D., Unified facilities criteria (UFC), DoD minimum antiterrorism standards for buildings. Department of Defense, UFC 4-010-01, 2007.
3. Committee, A.o.B.M.T., Protecting Buildings from Bomb Damage - Transfer of Blast-Effects Mitigation Technologies from Military to Civilian Applications. National Research Council, 1995.
4. LSDYNAV970, 971 Keyword manual Vol. 1 and Vol. 2, . Livermore Software Technology Corporation, Livermore, CA.
5. Crawford, J. and S. Lan, Design and Implementation of Protective Technologies for Improving Blast Resistance of Buildings, in Enhancing Building Security Seminar Proceedings. 2005: Singapore.
6. Hao, D.U.a.L., Zhongxian, Numerical Analysis of Dynamic Behavior of RC slabs Under Blast Loading. Transactions of Tianjin University, 2008. 15(1): p. 61-64.
7. Mosalam, K.M. and A.S. Mosallam, Nonlinear Transient Analysis of Reinforced Concrete Slabs Subjected to Blast Loading and Retrofitted with CFRP Composites. Composites Part B: Engineering, 2001. 32(8): p. 623-636.
8. Ågårdh, L., Finite element modeling of fibre reinforced concrete slabs subjected to blast load. Le Journal de Physique IV, 1997. 7(C3): p. 3-3.
9. Kuang, X., et al., Numerical Simulation for Responses of Reinforced Concrete Slabs under Blast Loads. Computational Structural Engineering Journal, 2009: p. 691-698.
10. El-Dakhakhni, W.W., W.F. Mekky, and S.H.C. Rezaei, Validity of SDOF Models for Analyzing Two-Way Reinforced Concrete Panels under Blast Loading. Journal of Performance of Constructed Facilities, 2010. 24(4): p. 311-325.

153
11. Schwer, L. and L. Malvar, Simplified Concrete Modeling with MAT_CONCRETE_DAMAGE_REL3, in JRI LS-DYNA User Week. 2005: LS-DYNA Anwenderforum, Bamberg.
12. Tanapornraweekit, G., et al. Modelling of a Reinforced Concrete Panel Subjected to Blast Load by Explicit Non-linear Finite Element Code. in Proceedings of the Earthquake Engineering 2007. Australia.
13. Zhou, X., et al., Numerical prediction of concrete slab response to blast loading. International Journal of Impact Engineering, 2008. 35(10): p. 1186-1200.
14. Broadhouse, B., The Winfrith Concrete Model in LS-DYNA3D. Report: SPD/D (95), Impact, Fire and Blast Department, Winfrith Technology Center, Dorset, UK, 1993: p. 339-344.
15. Gebbeken, N. and M. Ruppert, A new material model for concrete in high-dynamic hydrocode simulations. Archive of Applied Mechanics, 2000. 70(7): p. 463-478.
16. Low, H.Y. and H. Hao, Reliability analysis of reinforced concrete slabs under explosive loading. Journal of Structural Safety, 2001. 23(2): p. 157-178.
17. Hallquist, J.O., D.W. Stillman, and T.L. Lin, LS-DYNA3D users manual. LSTC Report, Livermore, CA, 1994. Vol. 1007.
18. Kadambi Vasudevan, A., Finite element analysis and experimental comparison of doubly reinforced concrete slabs subjected to blast loads. 2012, UNIVERSITY OF MISSOURI-KANSAS CITY.
19. LSDYNAV970, 971 Keyword manual Vol. 1 and Vol. 2, . Livermore Software Technology Corporation.
20. Hallquist, J.O., LS-DYNA theory manual. Livermore Software Technology Corporation, 2006. 3.
21. Kong, S., A. Remennikov, and B. Uy, Numerical simulation of the response of non-composite steel-concrete-steel sandwich panels to impact loading. Australian Journal of Structural Engineering. 12(3): p. 211-224.

154
22. Hibbitt, Karlsson, and Sorensen, ABAQUS theory manual. 1998: Hibbitt, Karlsson & Sorensen.
23. Kosloff, D. and G.A. Frazier, Treatment of Hourglass Patterns in Low Order Finite Element Codes. International journal for numerical and analytical methods in geomechanics, 2005. Vol. 2(1): p. 57-72.
24. Wilkins, M.L., Use of artificial viscosity in multidimensional fluid dynamic calculations. Journal of Computational Physics, 1980. 36(3): p. 281-303.
25. Ottosen, N.S., A failure criterion for concrete. Journal of the Engineering Mechanics Division, 1977. 103(4): p. 527-535.
26. Schwer, L., The Winfrith Concrete Model: Beauty or Beast? Insights into the Winfrith Concrete Model. 8th European LS-DYNA Users Conference, 2011.
27. Wittmann, F., et al., Fracture energy and strain softening of concrete as determined by means of compact tension specimens. Materials and structures, 1988. 21(1): p. 21-32.
28. Broadhouse, B. and G. Attwood, Finite element analysis of the impact response of reinforced concrete structures using dyna3d, in SMiRT-12, K. Kussmaul, Editor. 1993, Elsevier Science Publishers, B.V. p. 339-344.
29. Magallanes, J.M., et al. Recent Improvements to Release III of the K&C Concrete Model. in 11th International LS-DYNA Users Conference. 2010.
30. Malvar, L.J., et al., A Plasticity Concrete Material Model for DYNA3D. International Journal of Impact Engineering, 1997. 19(9-10): p. 847-873.
31. Hallquist, J.O., LS-DYNA theory manual. Livermore Software Technology Corporation, Livermore, CA, 2006. Vol. 3.

155
VITA
Gunjan Ashok Shetye was born in Mumbai, in the state of Maharashtra, India on
November 16, 1988. She joined University of Mumbai’s Sardar Patel College of
Engineering to pursue her Civil Engineering Studies. She was awarded the Bachelor of
Engineering degree from University of Mumbai in May, 2010.
Gunjan joined University of Missouri – Kansas City (UMKC) in the fall term of
2010 to pursue her Master’s degree in Civil Engineering. She started working as a Graduate
Research and Teaching Assistant in Civil and Mechanical Engineering Department since
Fall 2010. She pursued her research interests in the field of finite-element analysis of
reinforced concrete slabs subjected to blast loading in the Computational Mechanics
Laboratory (UMKC) with Dr. Ganesh Thiagarajan. She is currently pursuing practical
training as a Structrual Engineer with Black and Veatch in Overland Park, Kansas.
Upon completion of her degree requirements, Gunjan plans to continue her career in
field of Structural Engineering and to pursue research interests.