Embed Size (px)
Citation preview
MTL TR 91-2 [AD I
AN EXPERIMENTAL AND FINITE ELEMENT
INVESTIGATION INTO THE NONLINEAR
MIATERIAL BEHAVIOR OF PIN-LOADED
00 COMPOSITE LAMINATES0
N STEVEN M. SERABIANMECHANICS AND STRUCTURES BRANCH DTICELECTE
January 1991
Approved for public release; distribution unlimited.
p'ti.0o"rS1 All D'IO repwaInt,,i,.- vill bo 14z bla.4k~l &di C
US ARMYLABORATORY COMMAND U.S. ARMY MATERIALS TECHNOLOGY LABORATORYMATEflALS TIECHMXOG¥ LMTOI Watertown, Massachusetts 02172-0001
The findings in this report are not to be construed as an officialDepartment of the Army position, unless so designated by otherauthorized documents.
Mention of any trade names or manufacturers in this reportshall not be construed u advertising nor as an officialindorsement or approval of such products or companies bythe United States Government.
OISPOSITION INSTIUCTIOWS
Oeurov this reoort when it is no longer neded,Oo not return it to the originmtor.
UNCLASSIFIEDSECURITY CLASSIFICATION OF THIS PAGE (3t3e. DaOn Catered)_
REPORT DOCUMIENTATION PAGE READ fISTRUCTIONSBEFORE COMPLETING FORMI. RE[PORT NUMBER 2. GOVT ACCESSION NO. 2. RECIPIENT'S CATALOG NUMBER
MTL TR 91-214. TITLE (and Subltlo) S. TYPE OF REPORT & PERIOD COVERED
AN EXPERIMENTAL AND FINITE ELEMENT INVESTIGATION Final ReportINTO THE NONLINEAR MATERIAL BEHAVIOR OF PIN-LOADED COMPOSITE LAMINATES 6 PERFORMING ORG. REPORT NUMBER
7. AUTNOR a) S. CONTRACT OR GRANT NUMBER(s)
Steven M. Serabian
S. PERFORMING ORGANIZATION NAME AND ADDRESS 10. PROGRAM ELEMENT. PROJECT. TASKAREA G.WORK UNIT NUMBERS
U.S. Army Materials Technology Laboratory D/A Project: 1L1621O5AH84Watertown, Massachusetts 02172-0001 AMCMS Code: 612105.AH840011ATTN: SLCMT-MRS Agency Accession: DA 312774
I1. CONTROLLING OFFICE NAME AND ADDRESS 12. REPORT DATE
U.S. Army Laboratory Command January 19912800 Powder Mill Road IS. NUMBER OF PAGES
Adelphi, Maryland 20783-1145 27214. MONITORING AGENCY NAME & ADDRESS(I1 diflernit from Controlling Ollice) IS. SECURITY CLASS. (ol Nile report)
UnclassifiedISa. DECLASSIFICATION/OOWNGRADING
SCHEDULE
I. DISTRIBUTION STATEMENT (of this Report)
Approved for public release; distribution unlimited.
17. DISTRIBUTION STATEMENT (of thoe abstraect entered in Block 0. it diffe ll frm Rapaef)
IS. SUPPLEMENTARY NOTES
Thesis submitted to the University of Lowell, Lowell, Massachusetts, in partialfulfillment of the requirements for the Degree of Doctor of Engineering inMechanical Engineering, October 26, 1989.
19. KEY WOIOS (Continue an feverse aide If necessary and Identify by Nock number)
Composite materials Moire analysis Nonlinear analysisBolted joints Stress analysis Optical methodsFinite element analysis Failure Laminates
20. ABSTRACT (Continue an reverie side Of necoeeanr and identify by Nock nmber)
(SEE REVERSE SIDE)
DO I 1473 EO.TO. F -NOVS ISOSOLETE UNCLASSIFIED
SECURITY CLASSIFICATION OF THIS PAGE (em'm Date Entered)
UNCLASSIFIEDSECURITY CLASSIFICATION OF THIS PAGE (We8 nDes En1e.*.d
Block No. 20
ABSTRACT
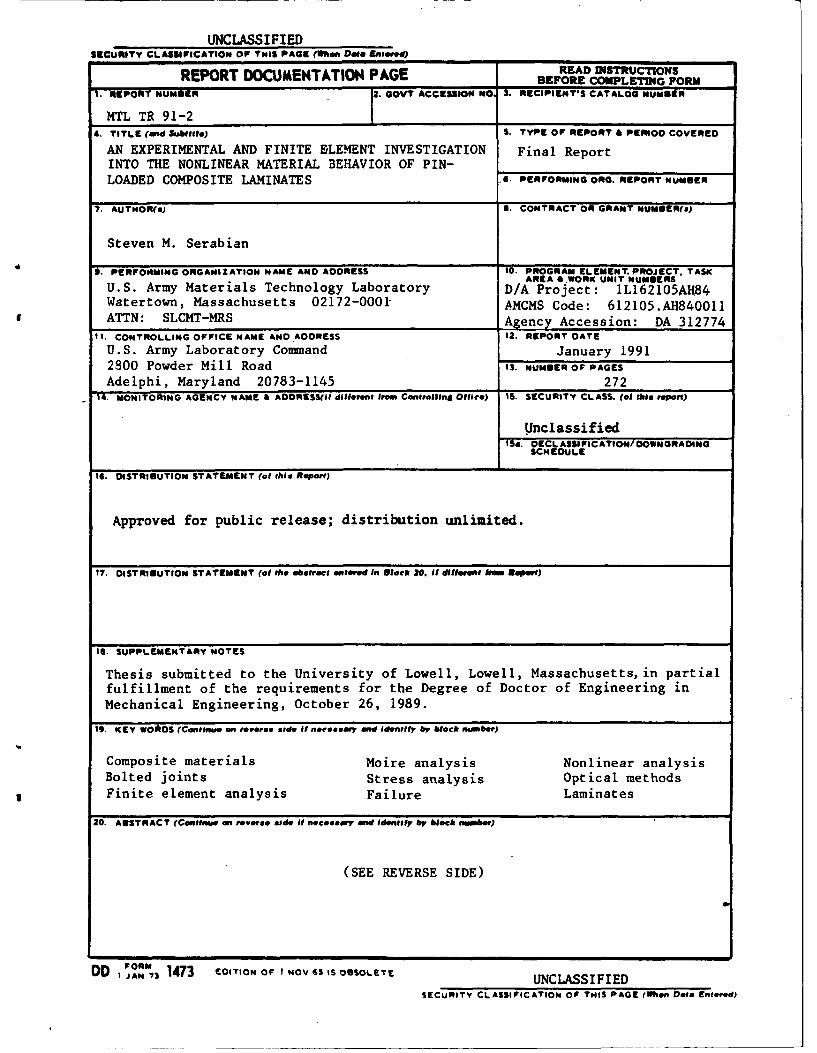
The effect of crossply nonlinear intralaminar shear behavior on the modelingaccuracy of pin-loaded [(0/90)nls and [(+45/-45)n]s composite laminates was quan-titatively investigated. Both linear and nonlinear elastic three dimensionalfinite element approximations that included pin elasticity and contact angleformation were generated. These approximations were compared to both front sur-face in-plane and out-of-plane experimental moire displacement contours generatedfrom geometric and projection shadow moire techniques.
A modified three point bend test was used to obtain values of laminate trans-verse shear moduli while through thickness contraction measurements on laminatetension tests were employed to obtain estimates of the Poisson ratio values. Non-linear crossply intralaminar shear behavior was determined from the ASTM D3518-76specification.
Three dimensional constitutive equations for the [(0/90)n]s laminate weredeveloped from effective and actual lamina mechanical properties. A material axistransformation of these constitutive equations was employed to produce[(+45/-45)nls laminate constitutive equations. The validity of these constitutiveequations and the effects of nonlinear intralaminar shear behavior were experi-mentally investigated by a comparison with uniaxial tension tests of both lami-nates. A sensitivity analysis of through thickness modulus was also done in thiscomparison in hope of providing insight into the selection of its magnitude.
Comparisons of linear and nonlinear elastic finite element results show sig-nificant stress level reductions and increased strain values in [(+45/-45)3]slaminate net and bearing sections. Similar results were observed in the[(0/90)3,O]s laminate shearout section. Both pin proximity and load levelintensified these effects. Net section ((+45/-45)3]s experimental strains agreedwell with nonlinear elastic finite element results at low pin load levels, butsurpassed them at higher pin load levels. Closer pin proximity and increasesload level intensified these results. Similar trends were observed in[(+45/-45)3]s bearing and [(0/90)3,0]s shearout sections, but were affected byunsymmetric experimental pin boundary conditions.
A qualitative determinatien of material damage within the pin-loaded lami-nates indicated material failure in those regions where experimental and nonlinearelastic finite element results diverged.
PI
UNCLASSIFIED
SECURITY CLASSIFICATION Of TMIS PAGE (W 0.a. Ente,o)
PEFACE
The research presented in this report was carried out at the Army
Materials Technology Center in Watertown Massachusetts and the University of
Lowell in Lowell, Massachusetts.
The report is excerpted fron the D. Eng. thesis of the author that was
completed in October, 1989 in the Department of Mechanical Engineering at the
University of Lowell. The thesis was supervised in its infancy by the late
Professor John McElman and in its completion by Professor Struan Robertson of
the Mechanical Engineering Department at the University of Lowell. Also
serving on the advisory committee were Professors Craig Douglas, and William
Kyros of the University of Lowell and Arthur R. Johnson of AMTL.
NTIS GRA&IDTIC TAB 0Unannounced• utif ia o_
SBy
Distribution/
AvailabilitY Codes
Avail ndODist Special
iii
TABLE OF CONTENTS
PAGE
INTRODUCTION I
1.1 Composite Materials 11.2 Mechanical Fastening of Composite Structures 2
2. RELATED PAST WORK EFFORTS 6
2.1 Analytical/Numerical Approaches 62.2 Experimental Approaches 122.3 Combined Approaches 14
3. UNRESOLVED CRITICAL ISSUES 24
3.1 Three Dimensional Effects 243.2 Constitutive Equation Modeling 243.3 Pin/Composite Interface Interaction 263.4 Composite Material Failure Mechanisms 263.5 Experimental/Analytical Comparative Link 27
4. RESEARCH OBJECTIVE AND APPROACH 28
4.1 Research Objective 284.2 Research Approach 28
5. THREE DIMENSIONAL EXPERIMENTAL DISPLACEMENT CONTOURING 30
5.1 Specimen Description and Fabrication 305.2 Out-of-Plane Displacement Contouring 31
5.2.1 Projet.'on Shadow Moire 315.2.2 Projection and Optical Processing Experimental
Arrangements 315.2.3 System Qualification 335.2.4 Experimental Testing 345.2.5 Experimental Results 35
5.3 In-Plane Displacement Contouring 35
5.3.1 Geometric Moire 355.3.2 Experimental Testing 375.3.4 Optical Processing of Experimental Results 395.3.5 Experimental Results 40
6. LAMINA/LAMINATE MECHANICAL PROPERTY EVALUATION 63
6.1 In-Plane Lamina Mechanical Property Data Base 636.2 Intralaminar Shear Testing 64
6.2.1 ASTM D3518-76 Test Arrangement 646.2.2 Specimen Description and Preparation 65
V
PAGE
6.2.3 Test Procedures and Results 65
6.3 Transverse Shear Testing 66
6.3.1 Three Point Bend Test Arrangement 666.3.2 Specimen Description 686.3.3 Test Procedures and Results 696.3.4 Test Modifications and Results 73
6.4 Through Thickness Poisson Ratio Testing 74
6.4.1 Unixalal Tension Test and Displacement Clip Gage 746.4.2 Test Procedures and Results 75
7. THREE DIMENSIONAL CONSTITUTIVE EQUATION MODELING 92
7.1 Effective Two Dimensional Laminate Mechanical Properties 927.2 Three Dimensional Orthotropic Constitutive Equations 94
7.2.1 [(0/90)3,01. Laminate Configuration 947.2.2 [(+45/-45)3]. Laminate Configuration 97.2.3 Experimental Corroboration 98
7.3 Through Thickness Laminate Mechanical Property SensitivityAnalysis 99
7.4 In-Plane Laminate Mechanical Property Sensitivity Analysis 100
8. CONSTITUTIVE EQUATION IMPLEMENTATION 116
8.1 Final Constitutive Equation Constants 1168.2 ABAQUS User Material Subroutine Description 1178.3 Subroutine Single Element Verification 1188.4 Subroutine Single Element Performance Investigation 1198.5 Subroutine Multiple Element Verification 120
9. FINITE ELEMENT MODELING 128
9.1 Model Description 1289.2 Finite Element Computations 1309.3 Post Processing of Finite Element Results 1309.4 Finite Element Results 131
9.5 Modeling Observations 132
9.5.1 [(0/90)3,O], Laminate Configuration 1329.5.2 [(+45/-45)3]s Laminate Configuration 134
10. EXPERIMENTAL/NUMERICAL MODELING COMPARISONS 206
10.1 Post Processing of Moire Displacement Contours 20610.2 ((0/90)3,01 Laminate Comparisons 20710.3 [(+45/-45)3]s Laminate Comparisons 208
vi
PAGE
11. QUALITATIVE MATERIAL DAMAGE INVESTIGATION 225
111. Experimental Damage Detection Technique 22511.2 Test Procedures 22611.3 Test Results 226
12. CONCLUSIONS 244
13 RECOMMENDATIONS FOR FUTURE WORK 248
14 BIOGRAPHICAL SKETCH OF AUTHOR 249
15 APPENDIX 250
16. LITERATURE CITED 260
vii
CHAPTER 1. INTRODUCTION
1.1 COMPOSITE MATERIALS
Composite materials were born out of the ideology that a material
with improved properties could be created through the combination of two or
more constituent materials. Materials consisting of continuous,
unidirectional, load carrying fibers imbedded in a homogeneous, load
distributing support matrix is one such example of this. Known as a lamina
and possessing orthotropic material properties, it may be stacked to construct
what is known as a laminate whose anisotropic material properties are dictated
by laminae stacking sequence and fiber angle orientation. The use of high
strength high modulus fibers such as boron or graphite can create a composite
of tailored material properties with a high strength to weight ratio.
This group of materials was widely used by the aerospace industries
during the late sixties and early seventies. Their high strength to weight
ratio allowed the design engineer to solve many stringent structural criteria
in both space and military vehicles. Structures fabricated from composites
improved craft mission capability through enhanced performance and increased
payload capacity.
Hand in hand with this new capability came the different task of
understanding and characterizing the material's mechanical behavior to obtain
design confidence. Past design philosophies for isotropic materials proved to
be far to inadequate. Extensive research and development efforts and cautious
structural applications provided for learning experiences. Many of these
initial applications were in space and missile systems with subsequent
applications in aircraft, helicopter, and propulsion systems. Cost effective
consumer applications based on the early applications may be seen in the
automotive, boating, sporting goods, and commercial aircraft industries.
Recent trends have placed composite materials in primary load
2
carrying structures as opposed to earlier secondary structures. Better
characterization of mechanical response and failure behavior is needed to
insure higher design confidence levels.
1.2 MECHANICAL FASTENING OF COMPOSITE STRUCTURES
The joining of composite structures by mechanical fastening methods
is one area where higher design confidence levels are needed. Although the
use of bonding procedures inherent in composite fabrication techniques can
reduce the use of mechanically fastened joints, bonded joint strength
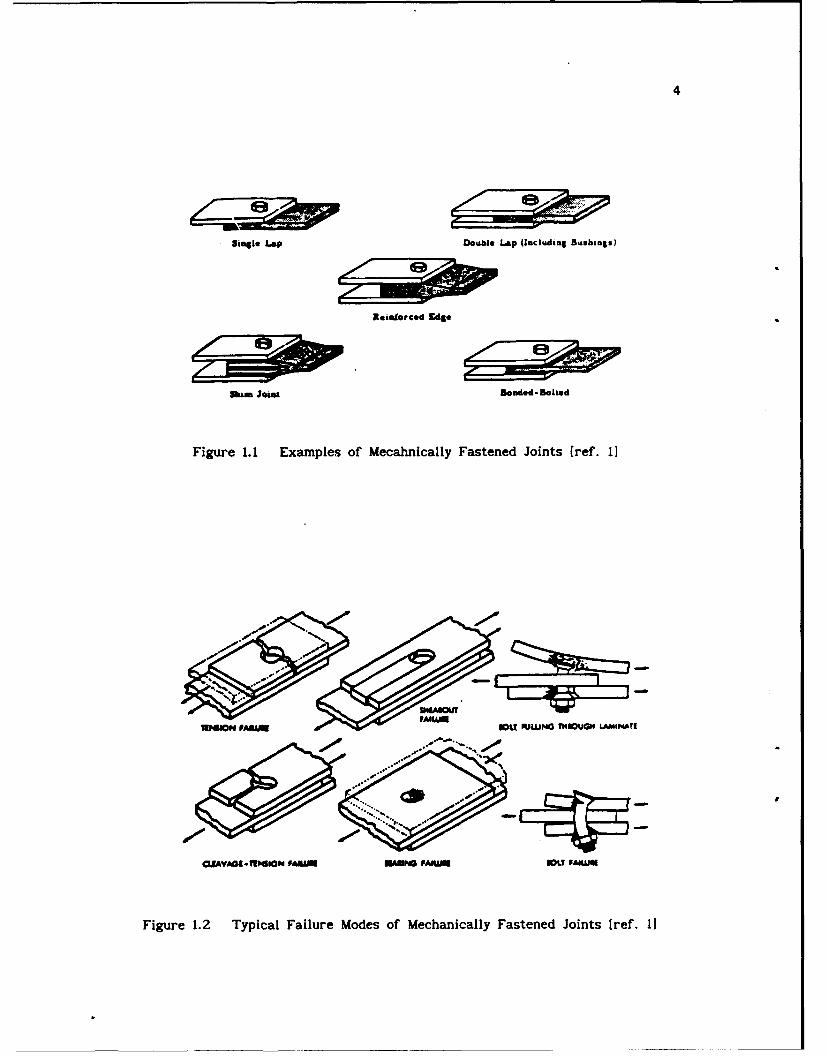
limitations and structural disassembly necessitate their use. Examples of
mechanically fastened joints include riveted, pinned, or bolted arrangements
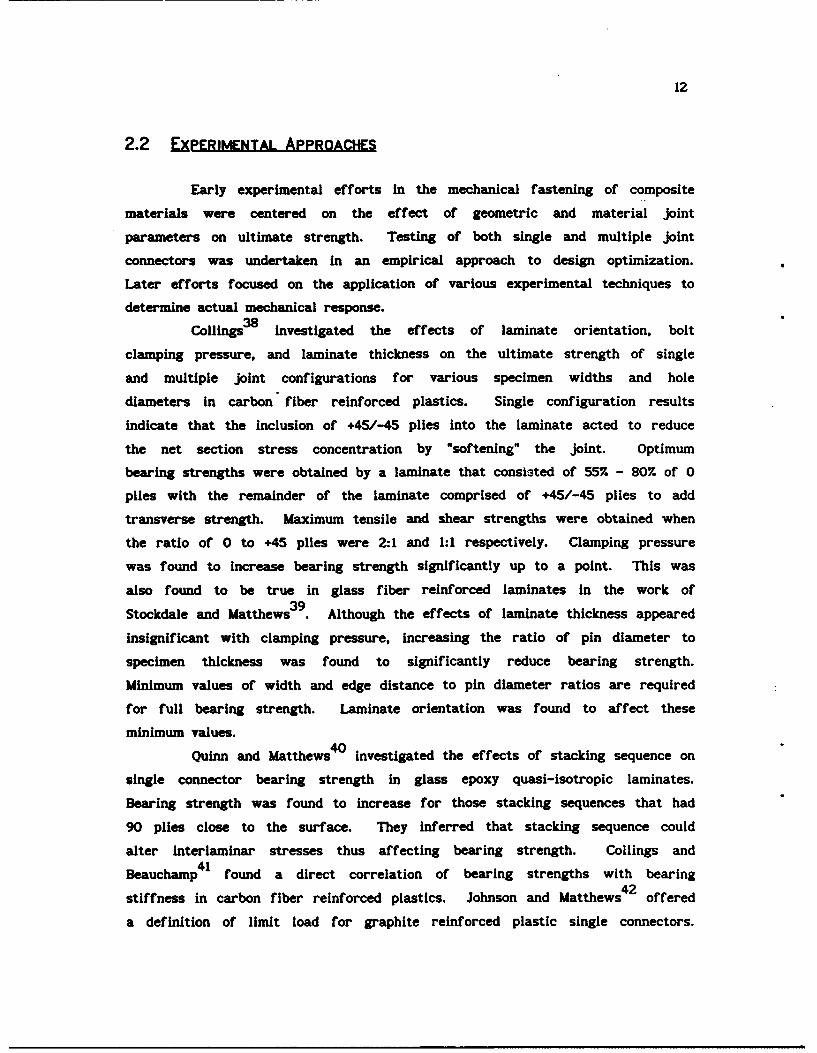
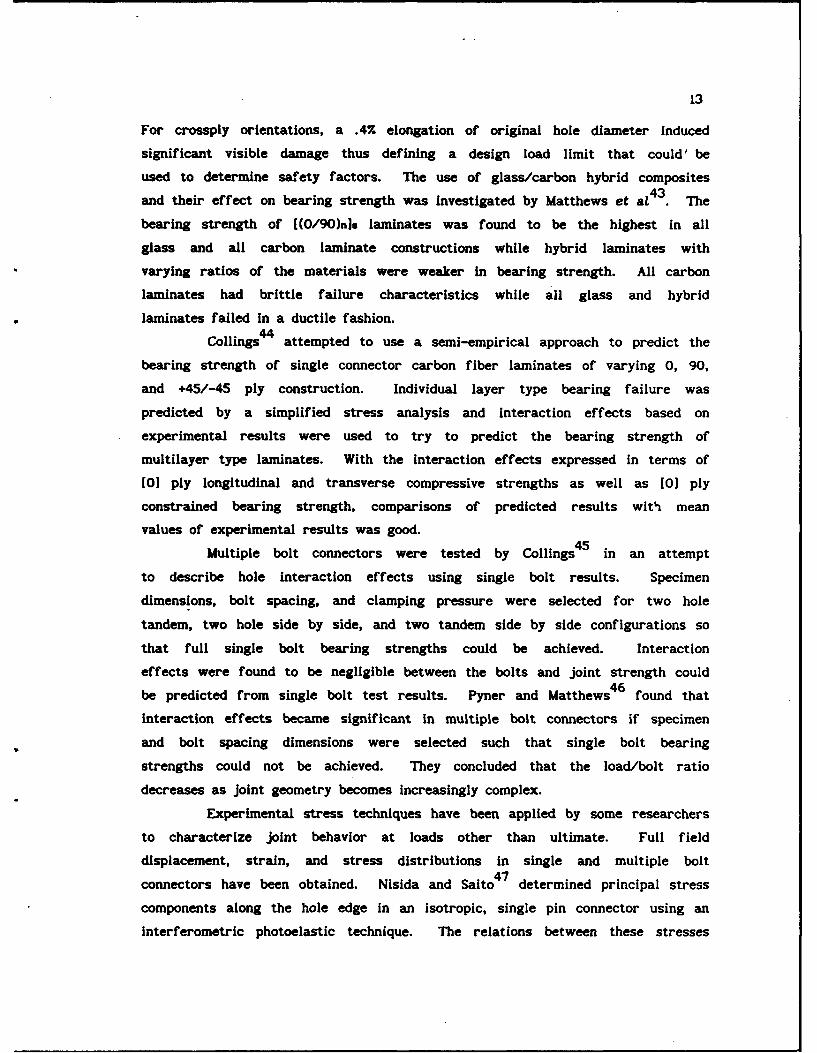
in single and multiple joint configurations. Figure 1.1 shows some examples
of single bolted joint configurations while Figure 1.2 illustrates some of
their typical failure modes. 1
Increased structural performance requirements for composite material
systems translate into higher stresses in and around the vicinity of bolted
joints. The anisotropic character of composites can be utilized to reduce
joint stress concentrations while maintaining joint strength. Laminae ply
orientation and stacking sequence as well as joint geometric parameters have
been shown to greatly affect these performance characteristics.
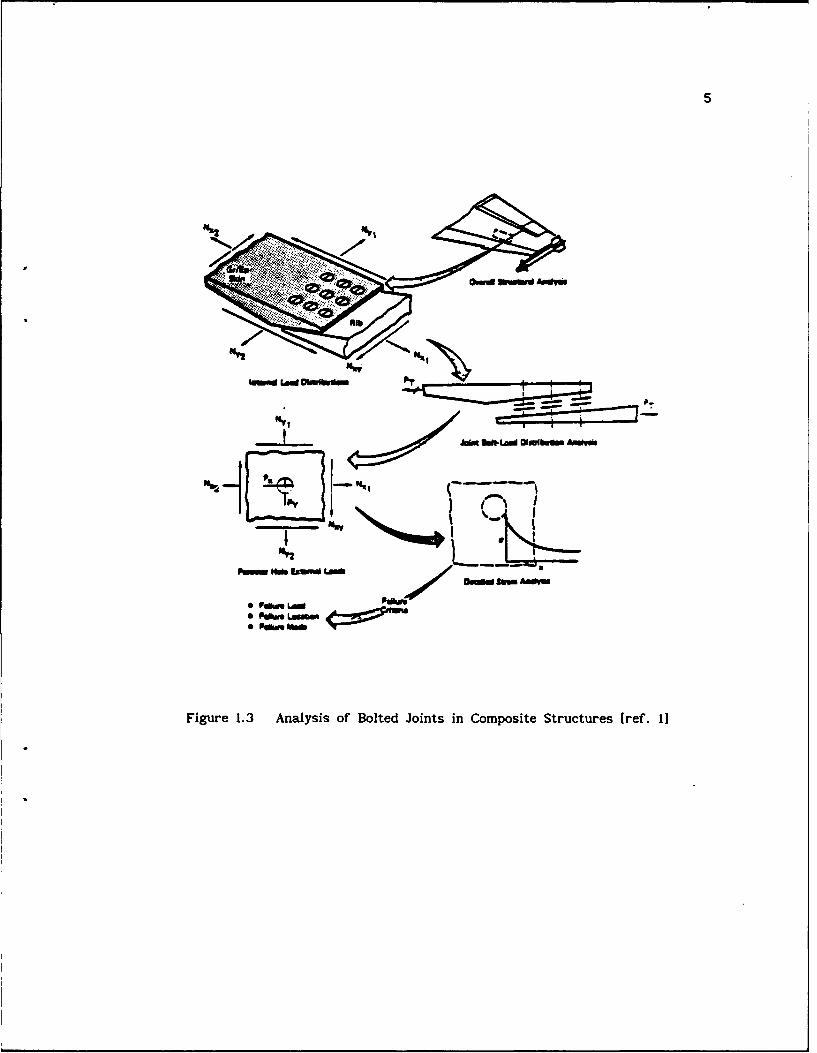
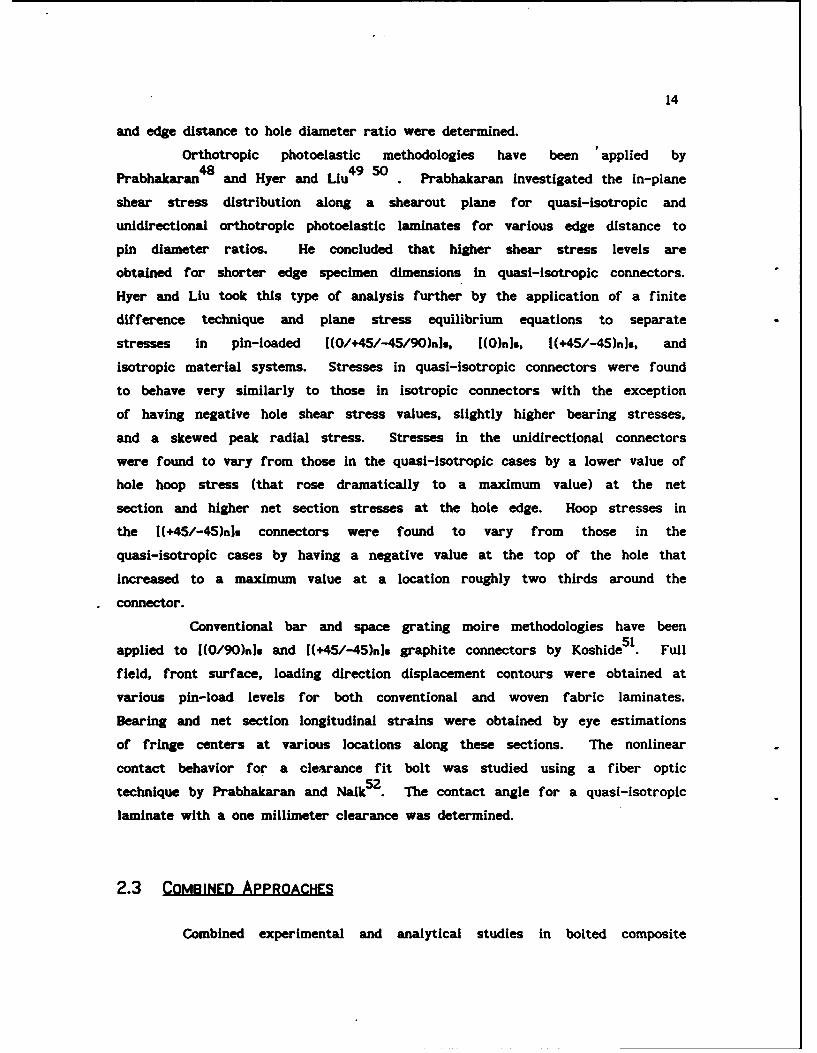
Analysis of bolted joints in composite structures generolly begins
with an overall structural assessment to predict the approximate loads appied
to the joint as a whole. Individual bolt loads within these joints are then
determined by a bolt load distribution analysis [1]. The effects of material
type and laminate orientation upon structural integrity are iteratively
investigated and a preliminary material system and laminate orientation is
selected. A detailed stress analysis of those critical individual bolts is
then undertaken in which a material failure criterion is applied to predict
joint strength. This complete analysis technique is shown in Figure 1.3.
It is in this detailed stress analysis that modeling assumptions must
be made. Material constitutive equations, bolt/material interactions, and
material failure behavior are exemplary details that must be understood
thoroughly before being incorporated into the stress analysis. Verification
3
of assumptions regarding these details can only be acheived by rigorous
experimental testing.
4
Saige Lap Double Lap (including Bushings)
Reinderced Edge
Skim jomi Bonded.Boil.d
Figure 1. 1 Examples of Mecahnically Fastened Joints [ref. 11
1114KINFAIIIIII OU P RJW, flHWU LANINAft
Figure 1.2 Typical Failure Modes of Mechanically Fastened Joints Iref. 11
NP2w
know Ld P
P7 "@f Ift.L LmVdm *y
* Few Ledm* PdkN 4% <
Figure 1.3 Analysis of Bolted Joints in Composite Structures [ref. 1]
6
CHAPTER 2. RELATED PAST WORK EFFORTS
There have been numerous studies of the mechanical response of bolted
joints in composite structures. Some of these have been analytical or
numerical in nature while others have been experimental. Nearly all the
analytical and numerical studies have relied on a planar treatment of the
problem. Experimental approaches range from ultimate failure testing to the
application of highly sophisticated experimental stress analysis techniques
A limited number of studies have attempted to verify analytical assumptions
experimentally . Both single and multiple connector configurations have been
investigated. While this section is an attempt to review these efforts, it
does so only as they apply to the present research work and may thus be
noninclusive.
2.1 ANALYTICAL/NUMERICAL APPROACHES
Perhaps one of the earliest analytical efforts was the planar
approach of Bickley2 that attempted to find the stresses in an infinite plate
with a hole subjected to point, pressure, and shear traction loading. Stress
functions were employed and the effects of nonuniform loading conditions
around the hole were investigated. In this work, the pin forces acting on the
isotropic plate were approximated by a cosinusoidal radial loading around the
upper half of the pin. Effects of plate finiteness in this type- of approach
were studied by Howland, 3 Knight 4 , and Theocaris 5 , by the superposition of
analytic solutions. The effects of plasticity in an isotropic6pin-loaded plate was investigated by Howland
The use of composite structures with bolted joints requires the
knowledge not only of the complex stress distributions around the hole, but
also the ultimate strength of the joint itself. Elasticity approaches have
7
been employed by many researchers to this avail. Oplinger and Gandhi used a
least squares boundary collocation method in conjunction with a complex
variable formulation to model the two dimensional elastic response of single
and periodic array fasteners with rigidly pinned arrangements. Friction-less
contact, linear elastic material conditions, and an assumed cosinusoidal
radial pin displacement were used to investigate the effects of various pin
spacings to diameter and edge distance to pin diameter ratios for (0)ns,
[(0/90)n]s, and [(O/+45/-45)nls glass and graphite epoxy laminates. Failure
mechanisms were studied using a layer by layer application of Hoffman's 8
quadratic failure rule. The effects of pin friction were accounted for in
this approach by the authors in a latter work. 9 In a similar approach, de10
Jong calculated the stress distributions around both isotropic and
orthotropic pin-loaded holes. As in the earlier work of Oplinger and Gandhi,
the pin was considered to be rigid and frictionless. The effects of pin11friction and loading direction were analyzed later by de Jong . He concluded
that pin friction had a significant effect on both the stress distribution and
strength of the connector.
Garbo and Ogonowski 12 used the anisotropic two dimensional theory of
elasticity in conjunction with laminate plate theory and the point stress
failure hypothesis of Whitney and Nuismer 13 on a ply by ply basis in their Bolt
Joint Stress Field Model (BJSFM). Stress distributions and ultimate strength
of pin-loaded laminates were predicted assuming a cosinusoidal radial pressure
distribution for the pin/laminate interaction. Reasonable experimental
agreement was found for tension and shearout failure modes, but bearing
failure predictions appeared to be conservative.
A more compact analytical solution to the problem was obtained by
Zhang and Ueng 14 by first assuming displacement expressions that accommodated
the displacement requirements and then calculating the appropriate stress
functions by anisotropic elasticity. A rigid pin that included frictional
effects was assumed while [(+45/-45)n]= and [(0/+45/-45)nJ. laminates were
modeled. Mahajerin and Sikarskie modified the boundary element method (BEM)
to evaluate singularities thus improving the accuracy of the methodology.
They evaluated a pin-loaded laminate with a rigid, no slip, and cosinusoidal
distribution of surface traction pin/plate interaction. Computational
comparisons to a two dimensional linear elastic finite element approximation
8
of the same problem were presented.
The effects of pin elasticity, clearance, and Coulomb friction on the
stresses developed in an infinite pin-loaded plate were studied by Hyer et a/16
in a two bodied elasticity contact problem. A complex Fourier series was used
to model the unknown boundary tractions on infinite plates of varying
orthotropy. Collocation was employed to arrive at a solution that satisfied
all boundary conditions while an iterative technique established the proper
contact angle. The results indicated that pin rigidity had negligible
influence on radial and circumferential stress magnitudes and distributions,
while material orthotropy had a great effect. Radial tractions along the pin
boundary were significantly different from Bickley's cosinusoidal assumption
for highly orthotropic plates where the principal stiffness direction is
perpendicular to the pin loading direction. For moderately orthotropic
plates, increasing friction reduced and shifted the peak bearing stress on the
top of the pin while the sign of the circumferential stress was reversed at
this location. Increases in pin clearance acted to widen the peak
circumferential stress distribution and shift it towards the top of the pin.
Radial stress magnitudes were increased.
The effects of washer clamp-up in composite bolted joints was
investigated by Smith et al'7 . Through thickness clamping forces from pin
washers were modeled in the hope of explaining observable increased ultimate
bearing failures.
There have been numerous finite element approximations of the
pin-loaded orthotropic connector. Various levels of problem modeling
involving assumptions for pin/plate boundary conditions, material linearity
and elasticity, failure mechanisms, and three dimensional effects may be seen
in past efforts.
Waszczak and Crews 18 modeled [(+45/-45)nls, [(O/+45/-45)ns,
[(+45/-45/90)nls, and [(+45/-45/0/90)n]s pin-loaded laminates with a two
dimensional finite element approximation in an attempt to predict joint
strength and failure mode. A cosinusoidal radial pressure distribution was
used with a frictionless assumption to represent the pin/plate interaction
while the Tsai-Hill19 distortional energy failure criterion was used to predict
laminate failure strength and mode. An excellent correlation of failure modes
to experimentally available data was reported, but conservative strengths were
9
obtained.
Wong and Matthews 2 0 used a two dimensional finite element
approximation to obtain strain distributions in single and double bolted
orthotropic joints. Like the earlier work of Wasczcak and Cruse, a
cosinusoidal radial pressure was used, but failure laws were not applied. A
similar approach was attempted by Chang2 1 where the Yamada-Sun failure
criterion was used in conjunction with a characteristic failure curve.
Pin/plate interaction was modeled with a rigid pin and a cosinusoidal radial
pressure distribution. An iterative determination of the contact angle was
made based on the sign of the radial stresses. The joint strength and failure
modes agreed well with those available in existing literature, leading Chang
to conclude that the cosinusoidal radial stress distribution is acceptable if
a proper failure criterion is employed.
Agarwal 2 3 used the first ply failure criterion of Grimes and Whitney 2 4
to determine laminate strength and the Whitney-Nuismer 2 5 average stress
criteria to predict failure strength in a two dimensional NASTRAN finite
element approximation of [(0/90)ns, [(+45/-45)nls, and [(0/ 9 0/+45/-45)nls
connectors. Surprisingly, Agarwal used a uniform displacement condition at
the opposite end of the coupon yet enforced a complete ninety degree contact
angle about the rigid pin. Failure strength and mode compared favorably with
existing experimental data with the exception of conservative failure
strengths for those laminates that exhibit nonlinear stress-strain behavior.
In similar approaches, Soni2 6 and Pipes et al27 altered Agarwal's analysis by
using the Tsai-Wu2 8 tensor polynomial failure criterion along with a last ply
failure stress assumption and the Pipes-Wetherhold-Gillespi point stress
failure criterion respectively. As in the Agarwal results, failure strengths
were conservative.
The assumption of an elastic pin can be seen in the work of Crews et
al 2 9 where [(0)nls, [(0/90)nls, [(+45/-45)n s, and [(O/90/+45/-45)ns finite
width connectors were modeled with a two dimensional finite element
approximation. The discretized pin was connected to the coupon through short,
stiff spring elements thus insuring a frictionless contact between the two.
The contact angle of the connector was found through an iterative procedure
where the stiffness of those springs that had tensile forces in them were
negated. Radial stress peak values and distributions were seen to vary
10
dramatically with increasing orthotropy while maximum tensile stresses were
strongly Influenced by finite width and edge distances.
The effects of nonlinear material behavior after initial ply failure
upon bearing failure strengths were investigated by Tsujimoto and Wilson3 .
Their two dimensional finite element analysis attempted to model bearing
failure by assuming an elastic-perfectly elastic bimodular material model. A
cosinusoidal pressure distribution signifying a rigid, perfectly fitted pin
was used as well as the Coulomb friction assumption. Incremental failure
contours for each laminae were obtained using laminate plate theory and the
Hill3 1 yield criterion. Comparison to linear elastic analysis with point
stress failure assumptions (that use the Tsai-Hill or Tsai-Wu quadratic
interaction failure models) and available experimental results indicate a more
accurate prediction of joint strength and failure type.
Eriksson3 2 mirrored the two body elasticity approach of Hyer and Klang
when he investigated the effects of material orthotropy, pin elasticity,
clearance, and friction with a two dimensional, linear elastic finite element
model. Similar results to Hyer and Clang were obtained and experimental
strains along the coupon bearing plane and net section were in agreement with
model strains.
Through thickness effects in the pin bearing problem were
investigated by Matthews et al33 in their three dimensional, linear elastic
finite element analysis. Effective laminate three dimensional constitutive
equations were arrived at by the application of laminate theory (ie; inplane
transformation of unidirectional lamina and application of three dimensional,
orthotropic constitutive relationships along with a thickness weighted
average). Single element, half thickness, half width symmetry was used in
defining the mesh while pin-loading was accomplished by a an axial
displacement boundary condition of the central nodes to the coupon.
Establishment of the contact angle was done in a similar fashion in the afore
mentioned work of Crews et al with the exception that contact forces were
averaged through the thickness. Lamina and interlamina stresses were obtained
by the substitution of the finite element strains Into the individual lamina
constitutive equations. In addition to the well known pin-loaded
configuration, they also simulated pin-loading with both a finger tightened
and a fully tightened clamped bolt washer assembly by Imposing through
11
thickness displacement and pressure boundary conditions respectively on the
first ring of elements in the mesh during the pin-loading of the coupon.
Results for [(O/+45/-45)nls and [(0/90/+45/-45)nJs laminates indicated that
through thickness tensile forces were reduced from the straight pin-loaded
case to the finger tigh*ened clamped case. Significant increases in the axial
compressive stress and one interlaminar shear stress were observed at the
washer edge for the fully tightened bolt washer assembly.
The issue of interlaminar stress singularities at curved free edge
surfaces and their possible role in delamination initiation was studied in34
greater detail by a host of investigators. Rybicki and Schmueser used a
three dimensional linear elastic finite element analysis to observe the
effects of stacking sequence at curved free edge surfaces. By todays
standards, a relatively course mesh was used to model a circular hole in
tension. Certain adjacent plies were "smeared" or averaged creating effective
properties to reduce the number of required elements.
Stacking sequence has been found to greatly affect the normal
interlaminar stress in magnitude and in some cases in sign. Raju and Crews3
used a highly refined mesh In their three dimensional linear elastic finite
element analysis of the same problem in hopes of modeling the interlaminar
stress singularity. Two dimensional modeling was done away from the >ole while
three dimensional modeling in which each lamina received a layer of elements
was done near the hole. A three dimensional to two dimensional transition
region was placed in between them while [0/901s and [90/01s laminate
arrangements were looked at. Mesh refinement increased the singularities
magnitude and definition. Carlsson3 6 investigated the same problem, but with a
laminate that had twenty eight plies. Each ply was modeled with three 20 node
volume elements through the thickness in his linear elastic three dimensional
finite element approximation. High interlaminar stress locations were found
to agree closely with TBE enhanced X-ray photographs of a fatigue damaged
specimen. Lucking et a13 7 used the concept of substructuring to evaluate the
effects of geometry on the Interlaminar stresses in a [0/901s laminate. Large
values of hole radius to laminate thickness ratios tended to increase
interlaminar stresses thus leading the authors to conclude that laminate
strength might be reduced.
12
2.2 EXPERIMENTAL APPROACHES
Early experimental efforts in the mechanical fastening of composite
materials were centered on the effect of geometric and material joint
parameters on ultimate strength. Testing of both single and multiple joint
connectors was undertaken in an empirical approach to design optimization.
Later efforts focused on the application of various experimental techniques to
determine actual mechanical response.
Collings investigated the effects of laminate orientation, bolt
clamping pressure, and laminate thickness on the ultimate strength of single
and multiple joint configurations for various specimen widths and hole
diameters in carbon fiber reinforced plastics. Single configuration results
indicate that the inclusion of +45/-45 plies into the laminate acted to reduce
the net section stress concentration by "softening" the joint. Optimum
bearing strengths were obtained by a laminate that consisted of 55%. - 80% of 0
plies with the remainder of the laminate comprised of +45/-45 plies to add
transverse strength. Maximum tensile and shear strengths were obtained when
the ratio of 0 to +45 plies were 2:1 and 1:1 respectively. Clamping pressure
was found to increase bearing strength significantly up to a point. This was
also found to be true in glass fiber reinforced laminates in the work of39
Stockdale and Matthews . Although the effects of laminate thickness appeared
insignificant with clamping pressure, increasing the ratio of pin diameter to
specimen thickness was found to significantly reduce bearing strength.
Minimum values of width and edge distance to pin diameter ratios are required
for full bearing strength. Laminate orientation was found to affect these
minimum values.
Quinn and Matthews 4 0 investigated the effects of stacking sequence on
single connector bearing strength in glass epoxy quasi-isotropic laminates.
Bearing strength was found to increase for those stacking sequences that had
90 plies close to the surface. They inferred that stacking sequence could
alter interlaminar stresses thus affecting bearing strength. Collings and
Beauchamp 4 1 found a direct correlation of bearing strengths with bearing
stiffness in carbon fiber reinforced plastics. Johnson and Matthews 4 2 offered
a definition of limit load for graphite reinforced plastic single connectors.
13
For crossply orientations, a .4%. elongation of original hole diameter induced
significant visible damage thus defining a design load limit that could' be
used to determine safety factors. The use of glass/carbon hybrid composites
and their effect on bearing strength was investigated by Matthews et aL4 . The
bearing strength of [(O/90)nls laminates was found to be the highest in all
glass and all carbon laminate constructions while hybrid laminates with
varying ratios of the materials were weaker in bearing strength. All carbon
laminates had brittle failure characteristics while all glass and hybrid
laminates failed in a ductile fashion.
Collings 4 4 attempted to use a semi-empirical approach to predict the
bearing strength of single connector carbon fiber laminates of varying 0, 90,
and +45/-45 ply construction. Individual layer type bearing failure was
predicted by a simplified stress analysis and interaction effects based on
experimental results were used to try to predict the bearing strength of
multilayer type laminates. With the interaction effects expressed in terms of
[01 ply longitudinal and transverse compressive strengths as well as [0] ply
constrained bearing strength, comparisons of predicted results with mean
values of experimental results was good.45
Multiple bolt connectors were tested by Collings in an attempt
to describe hole interaction effects using single bolt results. Specimen
dimensions, bolt spacing, and clamping pressure were selected for two hole
tandem, two hole side by side, and two tandem side by side configurations so
that full single bolt bearing strengths could be achieved. Interaction
effects were found to be negligible between the bolts and joint strength could
be predicted from single bolt test results. Pyner and Matthews 4 6 found that
interaction effects became significant in multiple bolt connectors if specimen
and bolt spacing dimensions were selected such that single bolt bearing
strengths could not be achieved. They concluded that the load/bolt ratio
decreases as joint geometry becomes increasingly complex.
Experimental stress techniques have been applied by some researchers
to characterize joint behavior at loads other than ultimate. Full field
displacement, strain, and stress distributions in single and multiple bolt
connectors have been obtained. Nisida and Saito4 7 determined principal stress
components along the hole edge in an isotropic, single pin connector using an
interferometric photoelastic technique. The relations between these stresses
14
and edge distance to hole diameter ratio were determined.
Orthotropic photoelastic methodologies have been 'applied by
Prabhakaran4 8 and Hyer and Liu 4 9 50 Prabhakaran investigated the in-plane
shear stress distribution along a shearout plane for quasi-isotropic and
unidirectional orthotropic photoelastic laminates for various edge distance to
pin diameter ratios. He concluded that higher shear stress levels are
obtained for shorter edge specimen dimensions in quasi-isotropic connectors.
Hyer and Liu took this type of analysis further by the application of a finite
difference technique and plane stress equilibrium equations to separate
stresses in pin-loaded [(O/+45/-45/ 90)ns, (O)n]s, [(+45/-45)n]., and
isotropic material systems. Stresses in quasi-isotropic connectors were found
to behave very similarly to those in isotropic connectors with the exception
of having negative hole shear stress values, slightly higher bearing stresses,
and a skewed peak radial stress. Stresses in the unidirectional connectors
were found to vary from those in the quasi-isotropic cases by a lower value of
hole hoop stress (that rose dramatically to a maximum value) at the net
section and higher net section stresses at the hole edge. Hoop stresses in
the [(+45/-45)ns connectors were found to vary from those in the
quasi-isotropic cases by having a negative value at the top of the hole that
increased to a maximum value at a location roughly two thirds around the
connector.
Conventional bar and space grating moire methodologies have been51applied to [(0/90)ns and [(+45/-45)nls graphite connectors by Koshide Full
field, front surface, loading direction displacement contours were obtained at
various pin-load levels for both conventional and woven fabric laminates.
Bearing and net section longitudinal strains were obtained by eye estimations
of fringe centers at various locations along these sections. The nonlinear
contact behavior for a clearance fit bolt was studied using a fiber optic
technique by Prabhakaran and NaIk 5 2 . The contact angle for a quasi-isotropic
laminate with a one millimeter clearance was determined.
2.3 CoMBINED APPROACHES
Combined experimental and analytical studies in bolted composite
15
joints have been limited in comparison to separate experimental or analytical
studies. Some studies have tended to emphasis one approach more than the
other. There have been few that give equal weighting to both approaches thus
allowing for the valid comparison of experimental and analytical results.
Some studies have used finite element approximations to model and predict the
ultimate strength of the connector. These models were validated by ultimate
strength testing of representative connectors.
Chang et al53 employed a two dimensional linear elastic finite element
approximation to obtain the stress distribution of various pin-loaded
laminates. A cosinusoidal radial stress distribution around the pin was used
with linear elastic material assumptions. Failure prediction was accomplished
by assuming laminate failure as per the Yamada-Sun 5 4 failure criterion along a
chosen characteristic failure curve whose normal radii were determined
experimentally. The failure mode was determined by the angular location of
the failure. Models were verified by comparisons with previous investigators
experimentally determined values of ultimate strength and failure modes in
graphite epoxy laminates of [(O/90)n]u, [(+45/-45)nls., and [(O/90/+45/-45)nls
configurations. This approach was extended to evaluate two hole tandem and two
hole side by side bolted configurations 5 5 in [(0/±45/90)3)19,
[(90z/±60/±30)z], [(±45)6]s, and 1(0/90)6]s laminates with various pin
diameters, edge distances, and widths. Results for quasi-isotropic laminates
and [(90z/±60/±30)219 laminates revealed that predicted strengths were
conservative by 10-30 percent with specimen geometry having little effect.
Crossply and angleply laminate results indicated predicted strengths were
conservative by 10-40 7. with better accuracy being obtained for smaller holes.
Failure modes were predicted with much greater success. Chang et aL56 used
this model and results to design bolted connections with more then two bolts.
No experimental verification was presented.
Chang et al57 modified their analysis to include nonlinear
intralaminar shear stress-strain behavior in hope of reducing their
conservative predictions for single bolted configurations only. Comparison to
earlier experimental results indicated that inclusion of this nonlinear
material behavior reduced predicted strength values for [(0/90)n]s and
[(+45/-4S)nls laminates to a 10-25 % level from a previous 10-40 %. level.
Failure mode predictions in these laminates were more realistic.
16
In an attempt to understand the progressive nature of failure in
laminated composites, Chang et at 5 8 altered their two dimensional nonlinear
elastic finite element analysis to include an incremental loading and failure
approach. At each load increment, incremental and total stresses and strains
were found and transformed into laminae stresses and strains. Failure
criterion that predicted the failure modes of matrix cracking, fiber-matrix
shearing, and fiber breakage were used. A material property degradation model
that altered laminae stiffnesses was employed to recalculate updated laminate
stiffness. Stresses were redistributed by rebalancing the finite element
equilibrium equations at the particular load level with these updated
stiffnesses for that load step using a Modified Newton-Raphson iterative
scheme. Joint failure was assumed when damage was present across a complete
boundary of the laminate. The matrix failure criterion was the summation of
the squared normalized transverse and shear stresses where normalization was
to ultimate transverse tensile and shear strengths respectively. The
fiber-matrix shearing and fiber breakage failure criterion were similar, but
used the longitudinal stress and ultimate stress value respectively. Property
degradation took the form of setting the transverse stiffness and Poisson
ratio values to zero for matrix cracking within a lamina. For fiber breakage
and/or fiber-matrix shearing, setting the longitudinal stiffness and Poisson
ratio to zero was accompanied by a reduction in the transverse and shear
moduli in accordance to a micromechanics approach for fiber bundle failure.
The ultimate strength of tensile specimens with a central circular hole was
predicted for various laminate orientations. Model verification was done by
experimentally obtaining the ultimate strengths. Predicted results agreed to
experimental ones within 20 7. while failure modes were accurate.
Chang et al 5 9 extended this analysis to pin-loaded composite
connectors. Compressive matrix failure was incorporated into the analysis
through the Hashin Failure Criterion 6 0 . Comparisons to earlier pin-loaded
ultimate strengths and failure modes showed that the predicted ultimate
strengths were within 20 7. of the experimental values and that failure modes
were accurately determined.
An experimental/analytical investigation into the damage build up in
glass and graphite [(0/+-45)3/0] laminates was conducted *by Tsiang and
Mandell61. Both tensile specimens with central circular holes and pin-loaded
17
specimens were incrementally loaded. Ply by ply specimen damage was found
through a de-plying technique at the various load levels. A two dimensional
linear elastic finite element approximation was undertaken with the
application of the Tsai-Hill and Whitney-Nuismer failure criteria. First ply
failure around the hole was predicted with the Tsai-Hill criterion while
ultimate specimen strength was predicted by the point and average stress
methods of the Whitney-Nuismer criterion. Comparisons of these predictions
and the observed damage at the various load levels were done. No direct
physical correlation was found suggesting that the non-frictional cosinusoidal
radial pressure distribution used in the analysis was incorrect.
Oplinger 6 2 investigated the linear and nonlinear joint response of
pin-loaded laminates by using an analytic two dimensional linear elastic
boundary collocation scheme, and experimental techniques of strain gages and
conventional moire methodologies. Comparison of net section strain gage
readings with analytic results for [(0)4/(+-45)3]s, and [(+45/-45)n]s,
laminates as well as aluminum specimens suggested that [(0)4/(+-45)3]s
laminate behaved linearly while [(+45/-45)nai specimens behaved nonlinearly
like its aluminum counterpart. Comparison of strains from front surface
experimental moire displacement contours and linear elastic analytic results
suggested that [0/901 laminates behaved nonlinearly in shear along a
prescribed locus of maximum shear strain. The experimental shearout failure
mode for 10/901 laminates was found to be along this locus.
Wilkinson and Rowlands 6 3 used a combined experimental and numerical
approach in their study of Sitka-spruce single pin-loaded connectors.
Conventional moire methods and strain gages were used to obtain front surface
strain values along the bearing section for specimens of varying pin to hole
diameter, edge to width, and edge to end distance ratios. Comparisons were
made along the bearing section to a two dimensional linear elastic finite
element analysis that accounted for friction effects and pin-hole separation
(i.e. contact angle determination). Model results indicated that friction was
found to reduce the bearing area thus increasing peak radial stresses while
radial and tangential stresses were found to be independent of edge distances.
Radial stresses were found to be reduced and more uniformly distributed with
decreasing end distances. Decreasing the pin to hole ratio was found to
reduce contact area thus increasing maximum radial stress values. This
18
modeling effort was expanded to include tandem connector arrangements in boron
and glass epoxy laminates. 6 4 Pin bypass loads were assumed.
Cloud et aL65 applied both conventional and interferometric moire
techniques to obtain displacement contours of the orthotropic pin-loaded
connectors that Mahajerin [151 had modeled earlier with a boundary element
analysis. Net section strains were obtained and net section stresses were
calculated using a two dimensional Hooke's stress-strain approximation.
Laminate longitudinal and transverse moduli as well as Poisson's ratio were
obtained from single respective direction tension tests. Comparison showed
that these experimentally obtained net section stresses were approximately 25
7 lower than those from the boundary element analysis.
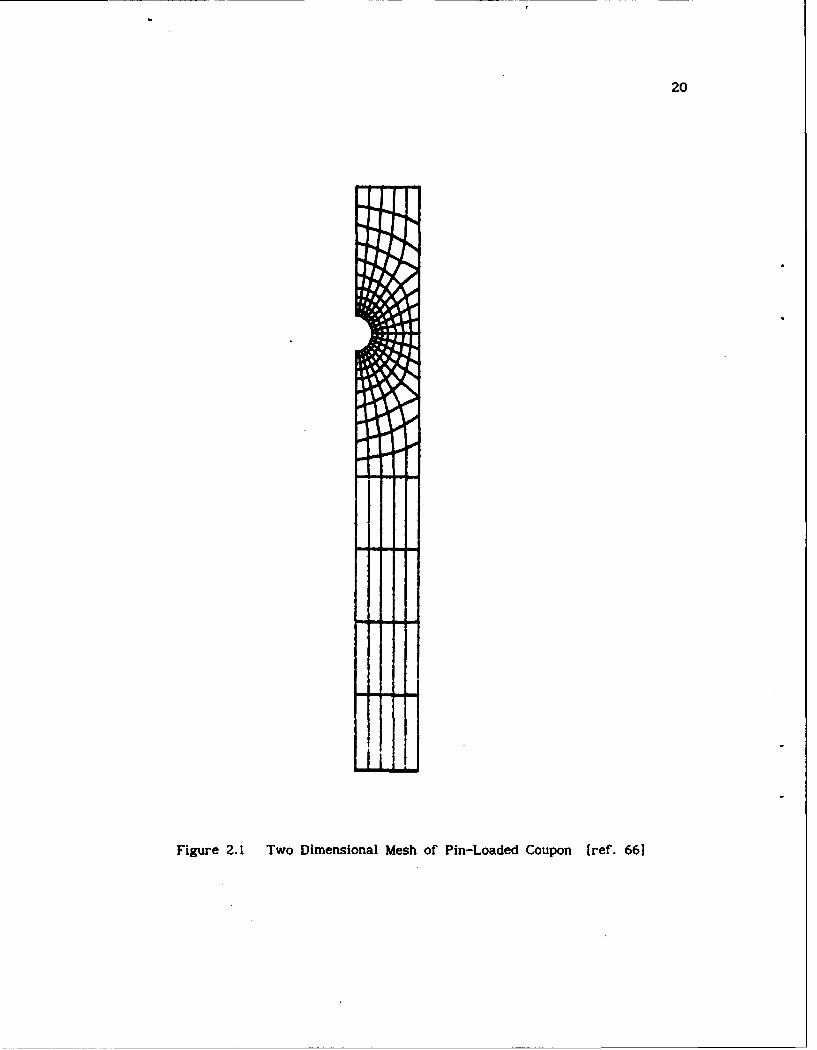
Serabian6 6 applied conventional moire techniques and a two dimensional
linear elastic finite element analysis in his investigation of ((0/90)3,01
S2-glass pin-loaded laminates. Both u and v front surface displacement
contours of the laminate were found at various load increments up to incipient
failure. Experimental shear strains along a maximum locus were obtained at
each load level from these displacement contours through graphical analysis.
A frictionless finite element approximation of the coupon that accounted for
pin/hole separation effects and an end loading arrangement predicted a similar
locus of maximum shear strain. Figure 2.1 illustrates the finite element mesh
of the coupon that was employed. An extensive lamina characterization was
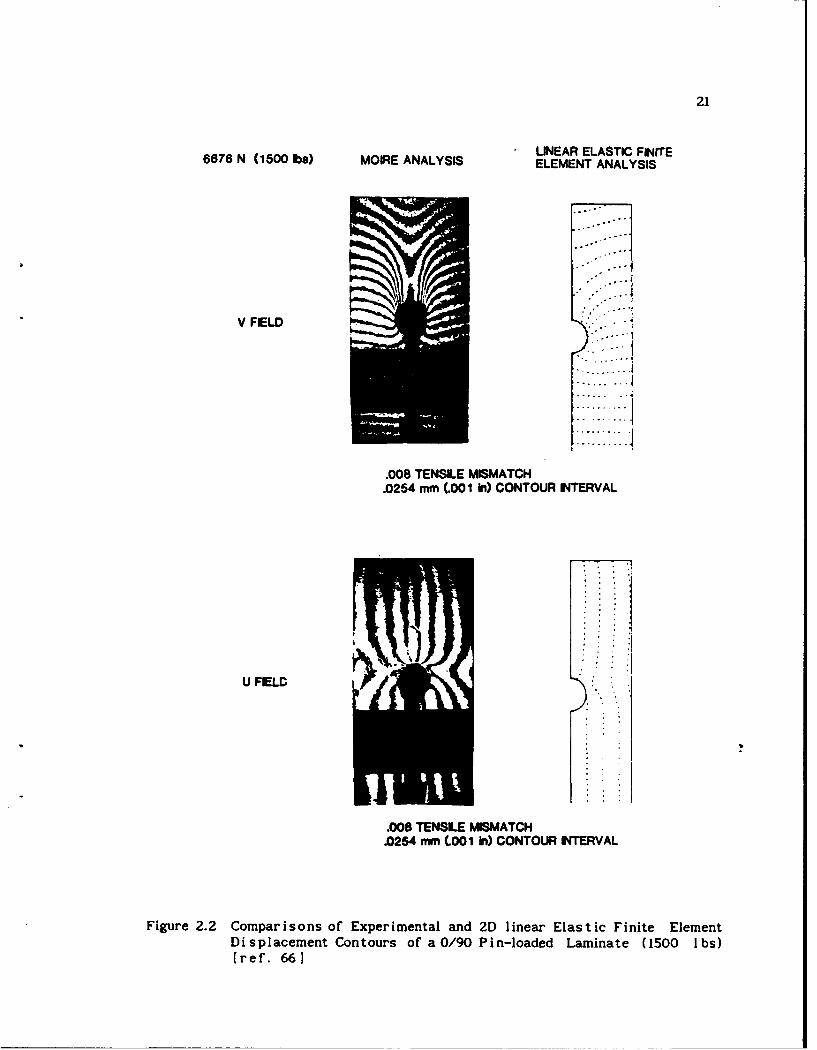
undertaken to develop an average lamina (in-plane) mechanical property data67base . Tangent lamina mechanical properties were used in conjunction with
laminate plate theory to provide effective laminate mechanical properties in
the finite element approximation. A two dimensional version of Hoffman's
failure criteria [81 was applied to transformed laminate strains and ply
failure zones at each load increment were obtained. Finite element
displacement fields were post processed to reflect experimental optical
processing conditions. Visual comparisons of these displacement fields with
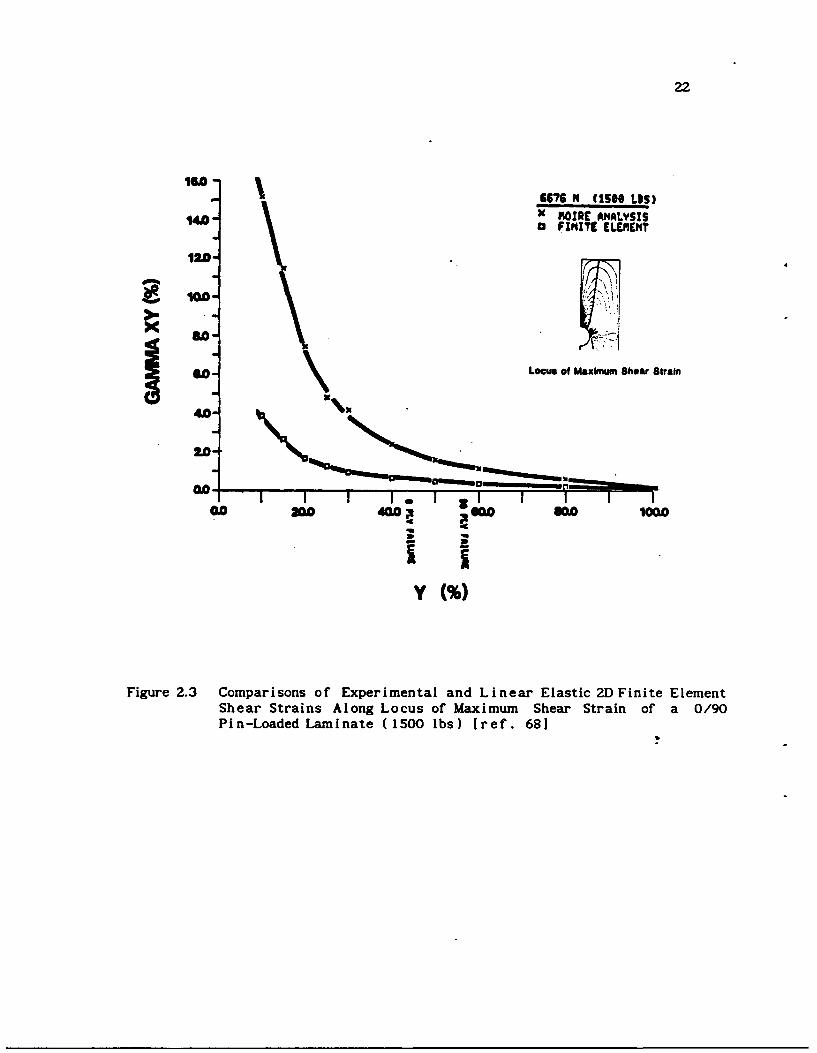
their experimental counterparts, as seen in Figure 2.2, indicated increasingly
higher experimental shear strains near the pin-hole interface. This
difference was more pronounced with increasing load levels. Numerical
comparisons of these shear strains as seen in Figure 2.3 indicated similar
results. Locus location of these variations in these strains corresponded
well with ply failure zone location for all load increments.
19
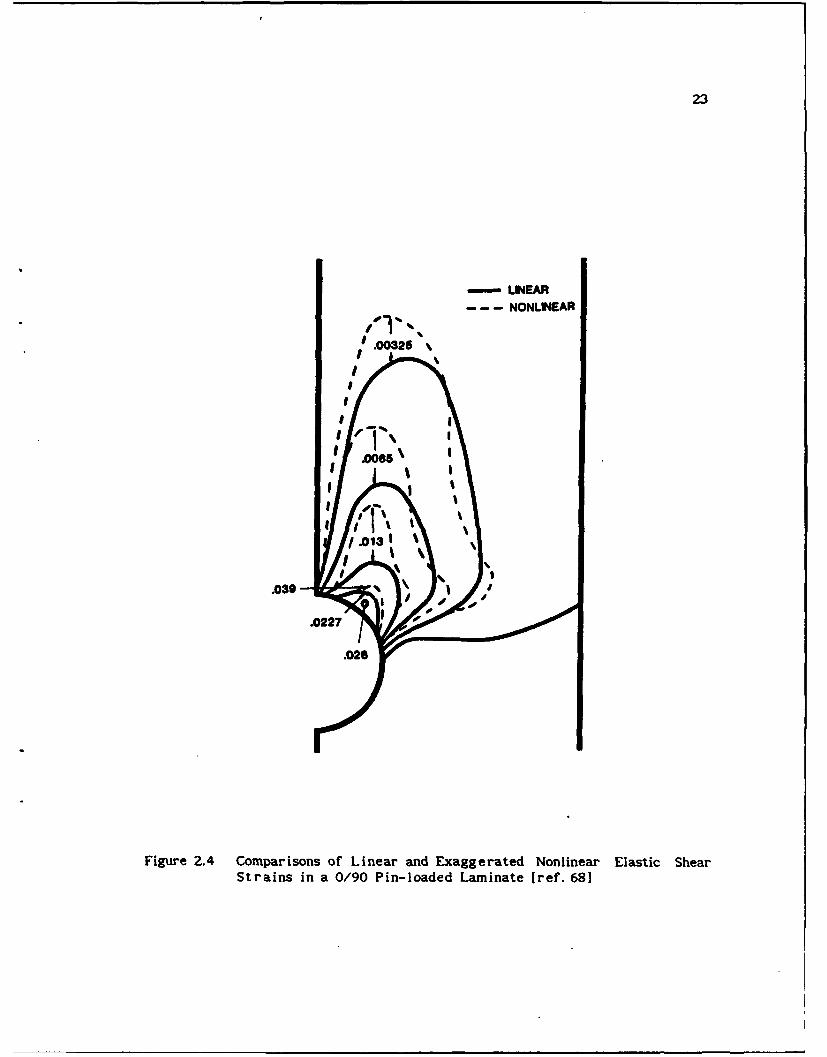
The effects of intralaminar shear nonlinearity was investigated by
Serabian and Oplinger 6 8 by comparison of these analytical results with those
obtained from a similar finite element approximation that modeled shear
softening through an effective secant moduli approach. An exaggerated
nonlinear material shear stress shear strain law was used in search of shear
softening. Comparisons of linear and nonlinear shear strains along the
maximum locus as seen in Figure 2.4 indicate a definite shear softening
phenomenon.
20
Figure 2.1 Two Dimensional Mesh of Pin-Loaded Coupon [ref. 661
21
LINEAR ELASTIC FINITE6676 N (1500 be) MOIRE ANALYSIS ELEMENT ANALYSIS
V FELD
.I~I:II7.i
.008 TENSILE MISMATCH.0254 mm (.001 in) CONTOUR INTERVAL
U FELD
.008 TENSILE MISMATCH.0254 mmv (C001 in) CONTOUR INTERVAL
Figure 2.2 Comparisons of Experimental and 2D linear Elastic Finite ElementDisplacement Contours of a 0/90 Pin-loaded Laminate (1500 Ibs)[ref. 66]
22
6676 N (ISO# LoS)
1M X MOIRE ANALVSIS~~a FINTE? ELEMEqNT
SLocus of Mazhuum Shear Strain
m1 X441
120.
4 M.
Figure 2.3 Comparisons of Experimental and Linear Elastic 2D Finite ElementShear Strains Along Locus of Maximum Shear Strain of a 0/90Pin-Loaded Laminate (1500 lbs) [ref. 681
23
-LINEAR
- - - NONLINEAR
%
.00325 %
%M5
/.13
.039
04 doo
Figure 2.4 Comparisons of Linear and Exaggerated Nonlinear Elastic ShearSt rains in a 0/90 Pin-loaded Laminate [ref. 681
24
CHAPTER 3. UNESOLVED CRITICAL ISSUES
3.1 THREE DIMENSIONAL EFFECTS
Three dimensional effects in bolted composite connectors have been
left all but untreated by investigators. Although experimental efforts have
looked at the effects of washer clamp-up on bearing strength, treatment of
three dimensional effects has been limited to the modeling of unloaded holes
in uniaxial tension or compression and Matthew's et al 1331 analysis of a
pin-loaded coupon. From these studies, it is appareht that high interlaminar
stresses exist near the hole boundary. These through thickness stresses
intuitively must play a major role in the initiation of failure. If accurate
joint strength predictions are to be made, inclusion of these stresses
necessitate a three dimensional approach. Variations in ultimate strength and
observed damage from washer clamp-up is testament to this fact.
From the literature, it can be seen that there has been no known
experimental determination of out-of-plane deformation of pin-loaded
laminates. An experimental determination of this throughout the load history
of the laminate could lead to an understanding of this phenomenon and point to
the inadequacy of two dimensional modeling approaches.
3.2 CONSTITUTIVE EQUATION MODELING
It is apparent from past studies that laminate configuration greatly
affects the mechanical response of pin-loaded laminates. Analysis based on
linear elastic behavior, while sufficient for certain classes of laminates,
clearly becomes inadequate for others in particular [(O/90)njs and
[(+45/-45)nl]. Joint strength prediction for these classes of laminates from
analysis based on linear elastic material behavior are extremely conservative.
25
Shear or tensile stress reduction, referred to as "softening" by some
investigators, is not accounted for by linear elastic approaches thus leading
to unreasonably high predicted stresses and lower ultimate strengths from
associated failure theories. Recent two dimensional modeling efforts that
include intralaminar shear nonlinearity have provided more realistic stress
states thus reducing this conservatism, but not eliminating it.
Past work by the author [661 that characterized the lamina mechanical
properties of his fiber/resin system showed that other secondary
nonlinearities do exist beside the major intralaminar shear nonlinearity. It
is not apparent to what extent these secondary nonlinearities affect laminate
mechanical response. Furthermore it is apparent that the use of laminate
theory with these lamina nonlinearities will not include those nonlinearities
that are produced from ply interaction effects. A prime example of this is
matrix cracking in crossply laminates. Occurring at low strain levels, it has
been shown to reduce axial stiffness by as much as 357. for minimally69constrained fiberglass laminates such as [0/90nis . The property degradation
model of Chang and co-workers tries to account for this nonlinearity on a
layer by layer basis by eliminating the layer's transverse modulus and
Poisson's ratio when their transverse tensile and shear strengths are reached.
This type of "on-off" approach, more commonly referred to as "ply
discounting", does not allow for a gradual degradation of those properties and
has been shown to over estimate axial stiffness loss in highly constrained
laminates such as [(0/90)nls. 7 0 In addition to this, since it is applied on an
element level, its macroscopic effects are dependant on the refinement of the
mesh used in the analysis. Clearly constitutive equation modeling should
account for nonlinearities resulting from ply interaction effects and should
be independent of mesh refinemeat. Computational efficiency is also prudent
for large scale finite element implementation.
Three dimensional modeling requires the use of three dimensional
constitutive equations. The use of two dimensional laminate theory along with
three dimensional orthotropic constitutive equations to predict three
dimensional mechanical response has been successfully used by some
investigators. Inherent in this approach are the use of laminate properties
such as through thickness Poisson ratios and tensile modulus as well as
transverse shear moduli. For lack of experimentally determined values, these
26
laminate mechanical properties have been assumed. It is not apparent what
effect that these assumptions have on the results of their analyses. Proper
characterization of these properties or sensitivity analyses should be
undertaken to clarify this.
3.3 PIN/CoMPosITE INTERFACE INTERACTION
The representation of pin-loading has evolved from the simple
cosinusoidal pressure distribution of Bickley [21 to a complicated complex
variable collocation procedure of Hyer et al [161. The effects of pin
elasticity, friction, and clearance have been analytically shown in a two
dimensional elasticity analysis to affect the stress distributions in
pin-loaded orthotropic connectors. Most past two dimensional finite element
approximations have not simultaneously included all three facets of the
problem. Three dimensional element approximations have only accounted for
contact angle determination. Experimental verification of pin elasticity,
friction, and clearance effects cannot be found in the literature.
3.4 COMPOSITE MATERIAL FAILURE MECHANISMS
Chang et al [55-591 have included failure mechanisms into models of
pin-loaded composite connectors. Their progressive approach, that models
various types of damage in conjunction with the Yamada-Sun failure criteria,
has proven somewhat effective in modeling two dimensional failure aspects.
Ultimate strength predictions have been made to within 20 . of experimentally
obtained values while failure mode predictions have followed observable
trends. Delamination damage is not treated in this two dimensional type of
analysis.
Three dimensional treatment of failure mechanisms in pin-loaded
connectors has not been undertaken to date. Three dimensional modeling of
both unloaded and pin-loaded holes has revealed that high interlaminar
stresses exist near the hole boundary. At the present time, it is not clear
to what extent these stresses play in failure initiation and, in particular,
27
the delamination mode of failure. Experimental determination of damage within
pin-loaded coupons, although limited to 1(0/+45/-45)3/0]s laminate
orientations, has shown that delamination damage Is present within the coupon.
3.5 EXPERIMENTAL/ANALYTICAL COMPARATIVE LINK
There have been limited comparisons between experimental and
analytical studies. Many comparisons have been made with ultimate strength
and failure modes while more quantitative comparisons have been limited to
strain comparisons at certain points (ie; strain gage) or along specified
sections (ie; moire displacement contouring) in the coupon. While illustrating
the differences between modeling and experimentation, they lack the
informativeness that a two dimensional, load level dependent, comparison would
yield. This type of comparison would allow the investigator to quantitatively
identify the load dependency of their modeling assumptions through "zones" of
difference rather then sections.
Comparisons have generally been limited to the aforementioned due to
the lack of an automated full field data reduction system. Most section
comparisons have been done by cumbersome graphical hand techniques that
require that displacement contour fringe centers be found by eye and curve
fitted to obtain strain values. Automation of this technique has been
accomplished through video digitizing equipment and an automated multi section
approach has been established to yield full field results7 1 . However; the
accuracy of this particular method has not been determined to date.
Recently Tessler et al 7 2 have applied a least squares penalty
constraint finite element method to generate strain fields from moire
displacement contours. This approach allows for a two dimensional smoothing
of the raw video intensity data. To date, the methodology has only been
applied tQ limited test cases to assess its accuracy. Initial results
indicate that extremely accurate strain fields may be obtained. However;
effects of fringe curvature and mismatch strains need to be investigated.
28
CHAPTER 4. RESEARCH OBJECTIVE AND APPROACH
4.1 RESEARCH OBJECTIVE
The objective of this dissertation is to quantitatively establish the
effects of crossply intralaminar shear material nonlinearity on the modeling
accuracy of [(0/ 9 0)nls and [(+45/-45)nls pin-loaded laminates.
4.2 - RESEARCH APPROACH
The dissertation's research objective was carried out by the
following combined experimental/analytical approach. The mechanical response
of both [(+45/-45)3]o and ((0/90)3,0]a pin-loaded laminates were determined
through three dimensional experimental displacement contouring using both
conventional and projected moire methodologies.
The in-plane mechanical property data base of the fiber/resin
material system was extended from past efforts [661 to include intralaminar
shear stress shear strain response by the ASTM D3518 specification. Effective
laminate mechanical properties were calculated using these in-plane values and
classical laminate plate theory.
Based on the appreciable through thickness mechanical response of the
pin-loaded laminates, a three dimensional modeling approach was taken. This
approach necessitated the need for laminate through thickness Poisson ratio
and transverse shear moduli values. A modified three point bend test was used
to obtain values of laminate transverse shear moduli while through thickness
contraction measurements on laminate tension tests were employed to obtain
estimates of the Poisson ratio values.
Three dimensional constitutive equations for the [(0/ 9 0)nls laminate
were developed from effective and actual lamina mechanical properties.
29
Three dimensional constitutive equations for the [(+45/-45)nls laminate were
developed from a material axis transformation of the ((0/90)nls three
dimensional constitutive equations. The validity of these constitutive
equations and the effects of nonlinear intralaminar shear behavior were
experimentally investigated through a comparison with uniaxial tension tests
of both laminates. A sensitivity analysis of through thickness modulus was
also done in this comparison in hope of providing insight into the selection
its magnitude.
Implementation of these constitutive equations was accomplished by
developing two user material subroutines (UMAT) for the finite element code
ABAQUS. Both verification and performance rating of these subroutines were
done on both a single and multi three dimensional element level using the
ABAQUS finite element code.
Three dimensional finite element models of the pin and coupon were
generated. Interaction of these two structures was modeled using INTER9
interface elements within the ABAQUS element library. Both linear elastic and
nonlinear elastic three dimensional finite element approximations of both
laminate configurations were generated.-
Comparisons of both linear and nonlinear finite element results with
graphically determined strain values from the experimental moire displacement
contouring were made. Assessment of nonlinear crossply intralaminar shear
behavior on modeling accuracy was determined.
A qualitative investigation into the effects of material damage on
the mechanical response of the pin-loaded laminates was done by taking
advantage of the translucent nature of the specimens. Backlit specimens
soaked in liquid penetrant at various pin-load levels were photographed in
hope of qualitatively investigating damage development.
30
CHAPTER 5. THREE DIMENSIONAL EXPERIMENTAL DISPLACEMENT CONTOURING
Out-of-plane displacements of the pin-loaded laminates were
determined with projection shadow moire. Optical system qualification was
accomplished by contouring a centrally loaded clamped circular plate.
Out-of-plane contouring sensitivity of the pin-loaded laminates was limited to
.001" by experimental concerns. In-plane displacement contouring of the
pin-loaded laminates was obtained by geometric moire. A contouring interval
of .001" was obtainable by using 500 line/inch specimen gratings and Fourier
filtering techniques.
5.1 SPECIMEN DESCRIPTION AND FABRICATION
Coupon geometry followed that of reference [66J which is shown in
Figure 5.1. The 6" x I" [(+45/-45)3]s coupons were cut from the central
section of a 3' x 3' laminated plate that was manufactured from a 3M SP250-S2
glass fiber/resin system. The prepreg tape of 2-5/8" width was cut into 3'
long sections and laid up in a [(+45/-45)3]s laminate orientation. This layup
was then sandwiched between two flat aluminum plates, vacuumed bagged, and
cured in an autoclave under the temperature and pressure conditions specified
by 3M. A solid carbide drill was used to drill the .251" diameter pin hole in
the center of the coupon I" down from the top. The [(0/90)3,0]s coupons were
obtained from the similar manufacturing processes of an earlier effort [ref.
661.
31
5.2 OUT-OF PLANE DISPLACEMENT CONTOURING
5.2.1 PROJECTION SHADOW MOIRE
The geometric shadow moire technique was employed to determine the
out-of-plane deformations of both the [(O/90)3,O]s and [(+45/-45)315 pin73
loaded coupons. In this technique, the interference of a projected grating
and its shadow upon a specimen that has undergone an out-of-plane deformation74
produces fringes that represent a depthwise contour map. This phenomenon may
be seen in Figure 5.2 where an originally flat specimen with incident
projected grating pitch (Ps) and projection angle (a) has been displaced
out-of-plane by a distance QA. As seen from the recording camera's viewing
angle (), the original projected grating covering length TS appears to cover
length TR upon the deformed surface. This length variation (RS) may be used
to trigonometrically relate the out-of-plane displacement (w) to both the
projection and viewing angles through the grating pitch. Upon doing so, we
find that;
w = N PeffN Ps-- .1w Per = (tan a + tan ) (5.1)
5.2.2 PROJECTION AND OPTICAL PROCESSING EXPERIMENTAL ARRANGEMENTS
The optical arrangement in Figure 5.3 was used to form and project a
moire grating on the surface of the pin-loaded coupon. A 15 mW Helium Neon
laser was spatially filtered by passing it through a 40X microscope objective
and lOm pinhole. A multi element transform lens was employed to bring the
frequency content of a moire glass master line grating of given pitch P into
the Fourier filtering plane. Passage of the ±Nd diffraction orders from this
filtering plane produced a sharpened line grating image of pitch P/2. A field
lens collimated this grating image and projected it onto the coupon at a given
angle (a) from its normal. Designating the distance from the moire glass
master grating to the Fourier filtering plane as S and the distance from the
field lens to the Fourier filtering plane as f, the projected pitch (Ps) of
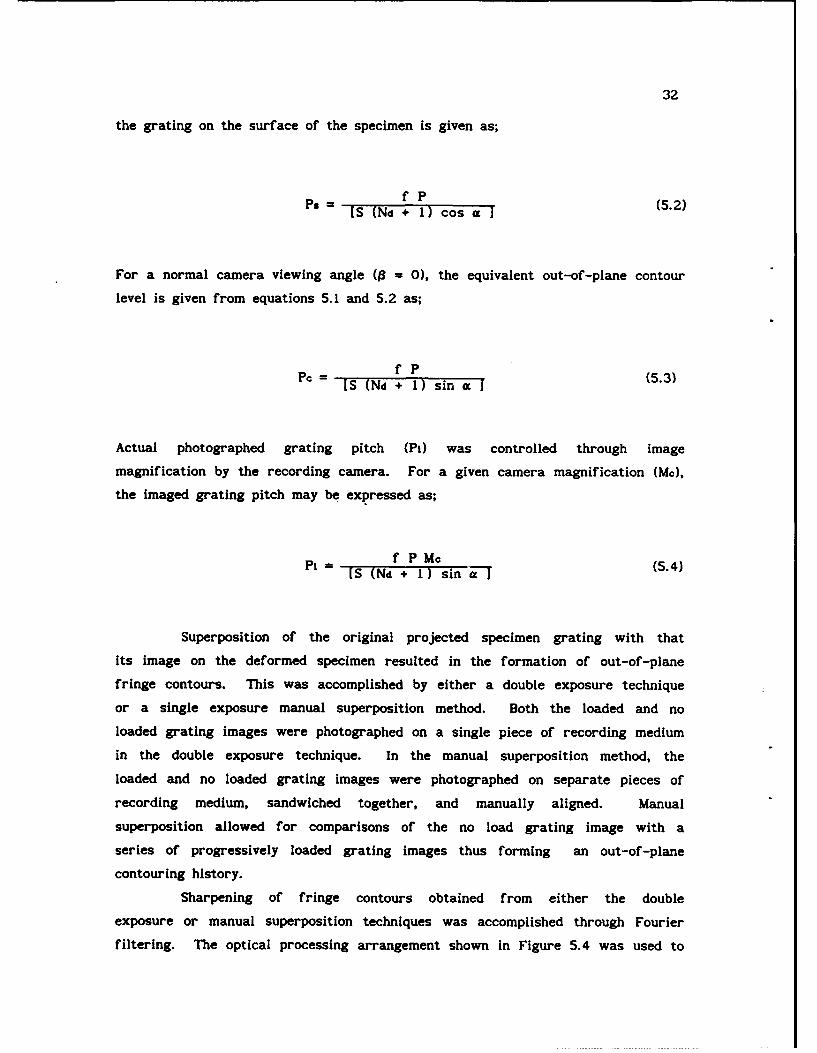
32
the grating on the surface of the specimen is given as;
fPPf [ (Nd + 1) o ] (5.2)
For a normal camera viewing angle (13 = 0), the equivalent out-of-plane contour
level is given from equations 5.1 and 5.2 as;
fP
I [S (Nd + 1) sin ](53
Actual photographed grating pitch (P) was controlled through image
magnification by the recording camera. For a given camera magnification (Mc),
the imaged grating pitch may be expressed as;
f P McP1= [S (Nd + I sin 35.
Superposition of the original projected specimen grating with that
its image on the deformed specimen resulted in the formation of out-of-plane
fringe contours. This was accomplished by either a double exposure technique
or a single exposure manual superposition method. Both the loaded and no
loaded grating images were photographed on a single piece of recording medium
in the double exposure technique. In the manual superposition method, the
loaded and no loaded grating images were photographed on separate pieces of
recording medium, sandwiched together, and manually aligned. Manual
superposition allowed for comparisons of the no load grating image with a
series of progressively loaded grating images thus forming an out-of-plane
contouring history.
Sharpening of fringe contours obtained from either the double
exposure or manual superposition techniques was accomplished through Fourier
filtering. The optical processing arrangement shown in Figure 5.4 was used to
33
accomplish this. A 6 mW Helium Neon laser was spatially filtered by passing
it through a 40X microscope objective and lOm pinhole. The expanding beam
was collimated through a collimating lens and passed through the photographs
of the superimposed load no load projected gratings. A transform lens
transformed this information into the frequency domain. The +1 diffraction
order was allowed to pass from the Fourier filtering plane and photographed by
a camera. Micropositioning equipment was utilized for the proper alignment of
the load no load projected grating images.
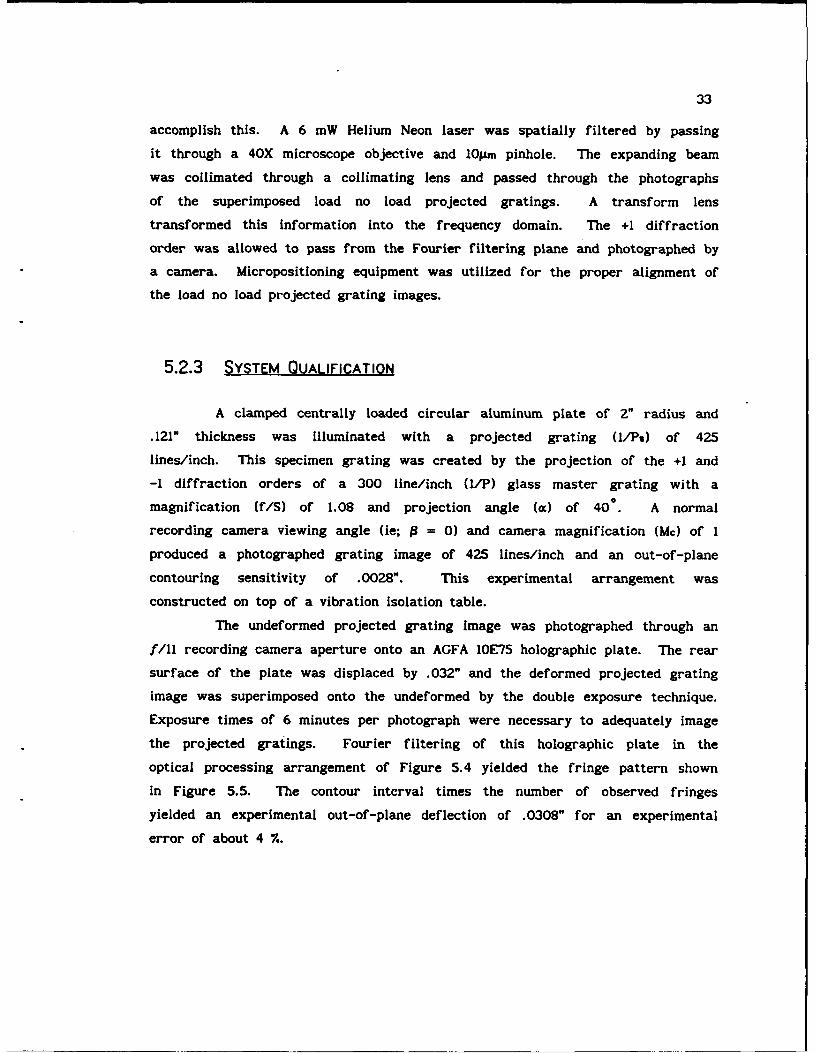
5.2.3 SYSTEM QUALIFICATION
A clamped centrally loaded circular aluminum plate of 2" radius and
.121" thickness was illuminated with a projected grating (1/Ps) of 425
lines/inch. This specimen grating was created by the projection of the +1 and
-1 diffraction orders of a 300 line/inch (I/P) glass master grating with a
magnification (f/S) of 1.08 and projection angle (a) of 400. A normal
recording camera viewing angle (ie; g = 0) and camera magnification (Mc) of I
produced a photographed grating image of 425 lines/inch and an out-of-plane
contouring sensitivity of .0028". This experimental arrangement was
constructed on top of a vibration isolation table.
The undeformed projected grating image was photographed through an
f/1i recording camera aperture onto an AGFA 10E75 holographic plate. The rear
surface of the plate was displaced by .032" and the deformed projected grating
image was superimposed onto the undeformed by the double exposure technique.
Exposure times of 6 minutes per photograph were necessary to adequately image
the projected gratings. Fourier filtering of this holographic plate in the
optical processing arrangement of Figure 5.4 yielded the fringe pattern shown
in Figure 5.5. The contour interval times the number of observed fringes
yielded an experimental out-of-plane deflection of .0308" for an experimental
error of about 4 %.
34
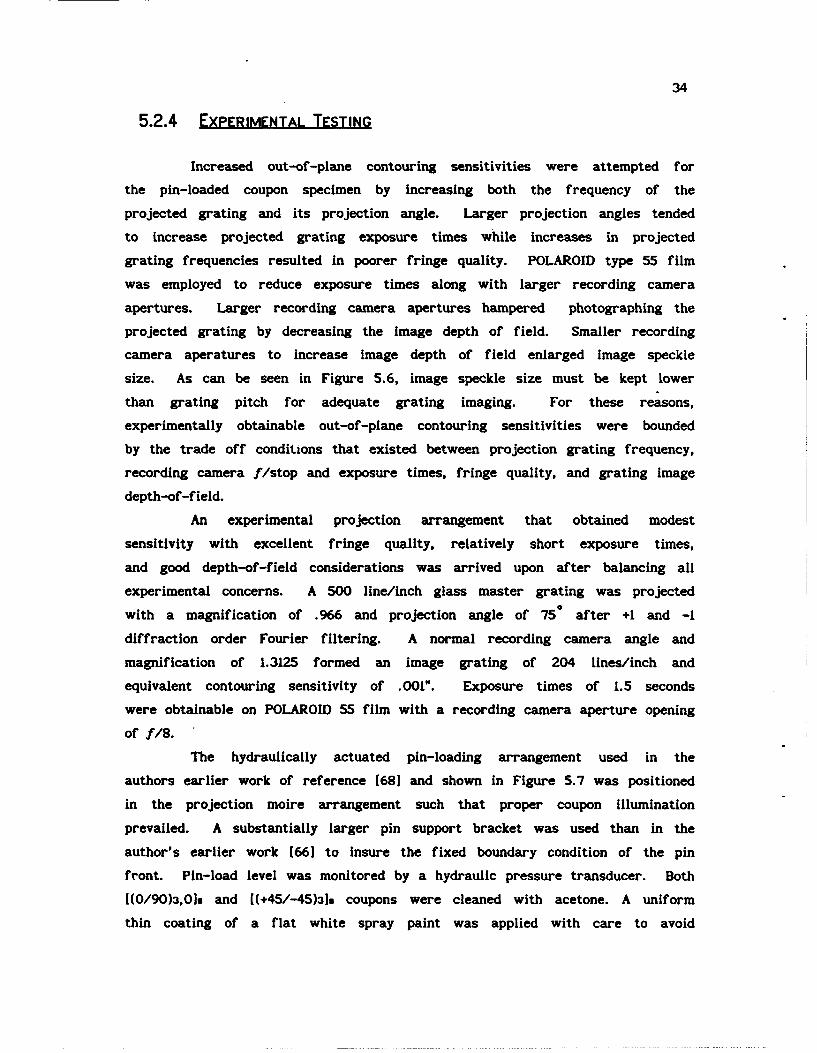
5.2.4 EXPERIMENTAL TESTING
Increased out-of-plane contouring sensitivities were attempted for
the pin-loaded coupon specimen by Increasing both the frequency of the
projected grating and its projection angle. Larger projection angles tended
to increase projected grating exposure times while increases in projected
grating frequencies resulted in poorer fringe quality. POLAROID type 55 film
was employed to reduce exposure times along with larger recording camera
apertures. Larger recording camera apertures hampered photographing the
projected grating by decreasing the image depth of field. Smaller recording
camera aperatures to increase image depth of field enlarged image speckle
size. As can be seen in Figure 5.6, image speckle size must be kept lower
than grating pitch for adequate grating imaging. For these reasons,
experimentally obtainable out-of-plane contouring sensitivities were bounded
by the trade off conditions that existed between projection grating frequency,
recording camera f/stop and exposure times, fringe quality, and grating image
depth-of-field.
An experimental projection arrangement that obtained modest
sensitivity with excellent fringe quality, relatively short exposure times,
and good depth-of-field considerations was arrived upon after balancing all
experimental concerns. A 500 line/inch glass master grating was projected
with a magnification of .966 and projection angle of 750 after +1 and -1
diffraction order Fourier filtering. A normal recording camera angle and
magnification of 1.3125 formed an image grating of 204 lines/inch and
equivalent contouring sensitivity of .001". Exposure times of 1.5 seconds
were obtainable on POLAROID 55 film with a recording camera aperture opening
of f/8.
The hydraulically actuated pin-loading arrangement used in the
authors earlier work of reference (681 and shown in Figure 5.7 was positioned
in the projection moire arrangement such that proper coupon illumination
prevailed. A substantially larger pin support bracket was used than in the
author's earlier work [661 to insure the fixed boundary condition of the pin
front. Pin-load level was monitored by a hydraulic pressure transducer. Both
[(0/90)3,01s and ((+45/-45)3]s coupons were cleaned with acetone. A uniform
thin coating of a flat white spray paint was applied with care to avoid
35
excessive paint buildup within the coupon hole. A white metal target area was
juxtaposed next to the coupon in the same focal plane.
For each specimen, a no load projection grating photograph was taken
followed by separate progressively loaded deformed projection grating
photographs. Specimen loading was continued until coupon failure occurred.
Manual superposition of the no load photograph with the loaded photograph in
the optical processing arrangement produced an out-of-plane contouring history
of each specimen type. During this process, rotational alignment of the
photographs was insured by obtaining a null field of the target area since
this area was void of deformations.
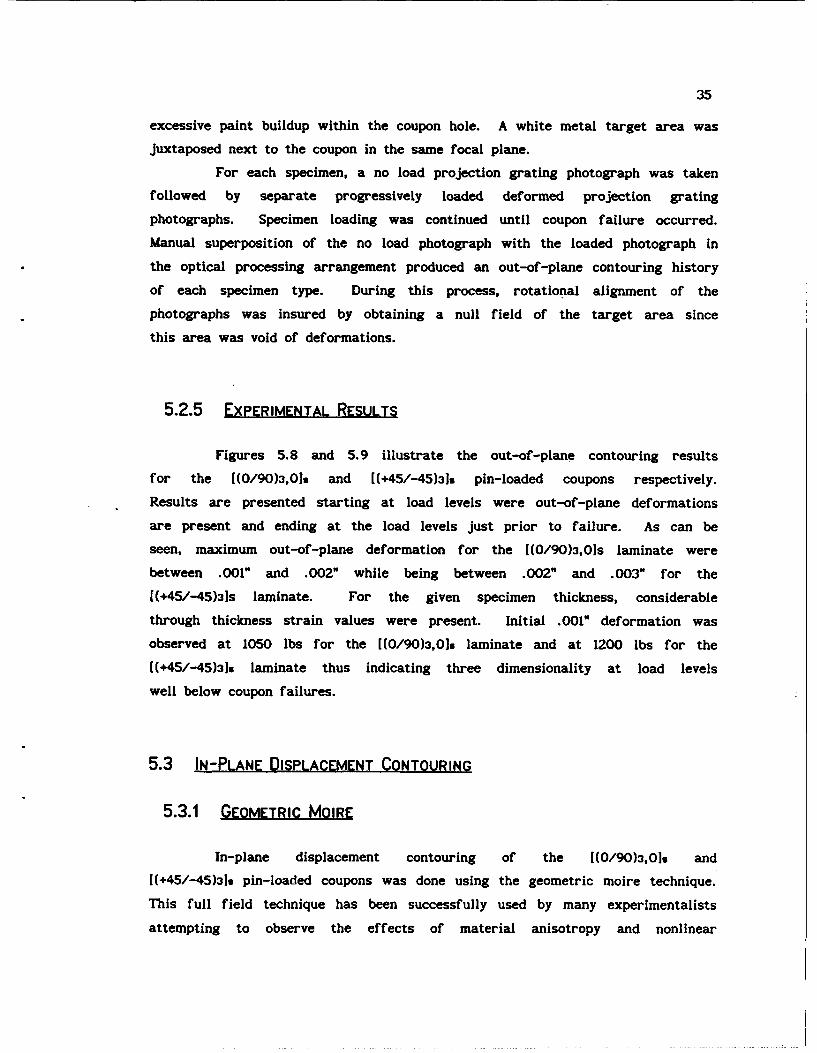
5.2.5 EXPERIMENTAL RESULTS
Figures 5.8 and 5.9 illustrate the out-of-plane contouring results
for the [(0/90)3,0]s and [(+45/-45)3]s pin-loaded coupons respectively.
Results are presented starting at load levels were out-of-plane deformations
are present and ending at the load levels just prior to failure. As can be
seen, maximum out-of-plane deformation for the [(0/90)3,0]s laminate were
between .001" and .002" while being between .002" and .003" for the
[(+45/-45)3]S laminate. For the given specimen thickness, considerable
through thickness strain values were present. Initial .001" deformation was
observed at 1050 lbs for the [(0/90)3,0] laminate and at 1200 lbs for the
[(+45/-45)3]s laminate thus indicating three dimensionality at load levels
well below coupon failures.
5.3 IN-PLANE DISPLACEMENT CONTOURING
5.3.1 GEOMETRIC MOIRE
In-plane displacement contouring of the [(0/90)3,0]. and
[(+45/-45)3]s pin-loaded coupons was done using the geometric moire technique.
This full field technique has been successfully used by many experimentalists
attempting to observe the effects of material anisotropy and nonlinear
36
behavior in composite materials [741.
As in the case of projection moire, in-plane contouring is based upon
the interaction of superimposed bar and space specimen grating images. In
this instance however; grating images are created by photographing a specimen
grating that is adhered to the front surface of the specimen that has
undergone deformation. Superposition of this deformed specimen grating image
onto a glass master grating of original undeformed specimen grating pitch
produces contours of in-plane displacement.
Fringe formation is governed by resulting intensity variations
created by the superposition of deformed and undeformed gratings as seen in
Figure 5.10 High intensity values occur when the bars of the two gratings
align themselves, while low intensity values occur when the bar of one grating
aligns itself with the space of the other grating. These low intensity values
are located where deformed grating displacements (u), normal to undeformed
grating bars, are an integral value (Nx) of undeformed grating pitch (P) [741.
High intensity values are formed at half integral values. This may be stated
as;
u = Nx P where Nx = 0, .5, 1, 1.5, 2 .... (5.5)
In a similar fashion, use of orthogonal bar and space specimen gratings will
yield intensity variations for displacements normal to those discussed above
which may be expressed as;
v = Ny P where Ny = 0, .5, 1, 1.5, 2 .... (5.6)
In-plane strains contouring may be obtained from in-plane
displacement fringe fields through differentiation. Scans and cross scans of
an in-plane displacement u fringe field will yield curves of fringe order, Nx,
versus specimen location, x or y, as seen in Figure 5.11. Similarly, scans
and cross scans of an in-plane v fringe field will yield curves of fringe
order, Ny, versus specimen location, x or y. Numerical differentiation of
these curves will yield normal and shear strain components. These may be
expressed as;
37
ex = 8u/x = P 8Nx/8x (5.7)
cy = 8v/Oy = P 8Ny/Oy (5.8)
xy= [(au/y) + (Sv/8x)J = [(PaNx/Sy) + (P8Ny/8x)] (5.9)
In some instances, the plots of fringe order vs specimen location may
not be defined sufficiently due to localized regions of low fringe density.
Erroneous strain values may result in the differentiation of these curves.
Linear mismatch methods may be used to overcome this problem [741. Increases
in fringe density may be created by employing an initial pitch differential
between master and specimen gratings. A resulting uniformly spaced fringe
field representing an initial artificial strain increases fringe density. The
magnitude of this fictitious strain (ca) is related to original grating pitch
(P) and fringe field spacing (aa) by;
Ca = Pt/Ba (5.10)
When this artificial strain value is superimposed with subsequent
strains due to loading, more clearly define fringe order versus specimen
location plots are generated. Subtraction of the initial artificial strain
value from resulting strains will yield specimen strains due to deformation
only. Both compressive or tensile mismatch strain fields may be used.
5.3.2 EXPERIMENTAL TESTING
A contact printed image of an orthogonal 500 line/inch chrome master
grating on KODAK transparent stripping film was adhered to the front surface
of the [(+45/-45)319 with a thin uniform layer of ECOBOND #45 clear adhesive
and # 15 clear catalysts. The coupon was initially cleaned in acetone and
covered with an even coating of flat white spray paint. Grating alignment was
obtained by trimming one edge of the grating parallel with its bars and the
use of a curing fixture. This curing fixture aligned both the trimmed grating
and coupon edges while immobilizing them during the adhesive cure cycle. The
thin flat uniform layer of adhesive was obtained by covering the grating with
38
a weighting rigid surface. The backing of the stripping was carefully removed
from the specimen after curing of the adhesive. The photographic emulsion
containing the orthogonal array of grating bar and spaces remained intact on
the specimen surface. Its magnified image may be seen in Figure 5.12. Excess
grating emulsion and adhesive were carefully trimmed along the coupon sides
and hole with an X-ACTO knife.
The loading frame and pressure transducer were mounted on an 8"
machinist's rotary stage affixed to the vibration isolation table. Specimen
illumination was accomplished by concentrating a high intensity quartz-iodine
lamp using a 10" single element lens. The specimen grating was photographed
with a 4" x 5" back SINAR-P copy camera. Proper camera alignment (ie normal
viewing) and 1:1 specimen magnification was obtained by placing an orthogonal
500 line/inch glass grating in the film plane of the camera. Adjustments to
the camera and/or loading frame were made until a null field (no fringes) was
observed in the back of the camera signifying its alignment. Pin shadow
elimination and enhanced specimen grating imaging were obtained by rotating
the loading frame -45°with the rotary table.
A series of trial exposures were made with KODAK ortho type III film
using an f/16 camera aperture to provide adequate depth of field. Exposures
were controlled by switching of the quartz-iodine lamp with a timer mechanism
to avoid shutter Induced camera vibrations that were found earlier to blur the
specimen grating image. All shiny metallic loading frame and fixture surfaces
were covered to avoid back reflections of the illumination source that were
found earlier to produce specimen grating intensity variations. Correct
exposure and fine focusing of the photographs was obtained by their
microscopic inspection.
The [(+45/-45)3]s coupon was pin-loaded and photographed for
increasing pin-load levels. A specimen loading history was obtained from
monitoring the transducer output. Deformed grating photographs were developed
in accordance to film specifications.

39
5.3.3 OPTICAL PROCESSING OF EXPERIMENTAL RESULTS
Optical processing of the deformed grating photographs for in-plane
displacement contouring was done with a Fourier optics system shown in Figure
5.13. The system effectively allowed for the projection of a photographed
specimen grating onto the image of a glass master moire grating to produce
fringes of constant displacement. Fourier filtering of the deformed specimen
grating photograph was done for separation of orthogonal displacement
components, fringe multiplication for Increased contouring sensitivity, and
fringe sharpening.
The light of a 15 mW Helium-Neon laser was expanded by a 40x
microscope objective and filtered through a 10 MAm pinhole. This expanded beam
was passed through the no load specimen grating photograph and focused in the
Fourier filtering plane by a transform lens. Passage of the (+1,0) and (-1,0)
Fourier frequency components into a field lens and onto a 500 line/inch glass
master moire grating in the image plane with a two fold magnification created
a v displacement field with a contouring sensitivity of .001". Rotary and
orthogonal adjustments of the specimen grating as well as magnification
adjustments through field lens translation were made to properly align and
magnify the projected specimen grating image with respect to the glass master
grating. This effect was noted by creation of a null fringe field on the
glass master grating. Translation of the field lens created the initial pitch
differential between the specimen grating image and the glass master grating
for a .010 inch/inch tensile mismatch v displacement field. Use of this
tensile mismatch field produced increased fringe density in the net section of
the coupon for more accurate ey strain determinations. No load specimen
grating photographs were then replaced with deformed grating photographs to
produce the in-plane v displacement contouring of the [(+45/-45)31s specimen
for the various pin-load levels. This procedure was repeated with an initial
-. 010 compressive mismatch field to increase fringe density in the bearing
section of the coupon for more accurate cy strain determinations. All fringe
fields were photographed with a 4" x 5" back camera and POLAROID type 55 film.
. ..... ... .
40
5.3.4 EXPERIMENTAL RESULTS
The In-plane contour v displacement fields of the [(+45/-45)3]s
coupon for both the +.010 inch*inch and -. 010 inch/inch mismatch fields are
shown in Figures 5.14 through 5.18. The 300 lb pin-load level fringe field
was unable to be processed due to a poor deformed specimen grating exposure.
The in-plane u and v displacement fields of the [(0/90)3,0]. coupon from the
authors earlier work [661 may be seen in Figures 5.19 through 5.24.
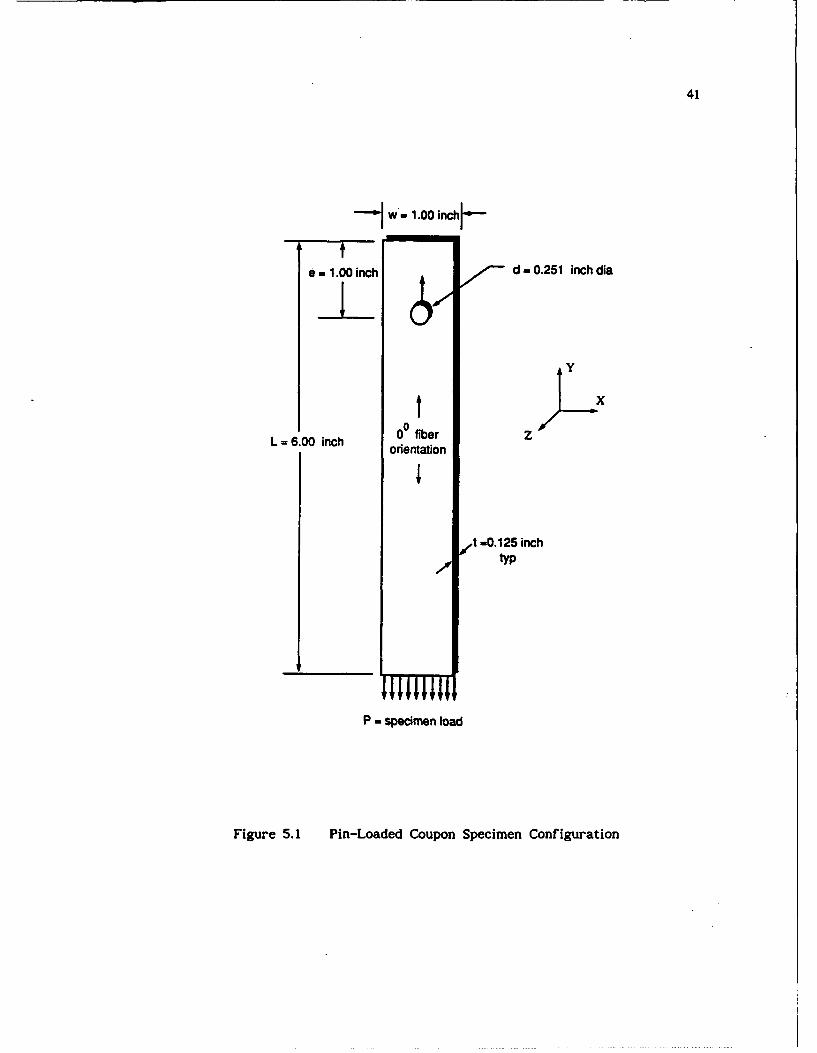
41
w -1.00 in+_j
* 1.00 inch d - 0.251 inch dia
y
t xL 10 nh0 fiber ZL = .00 nch orientation
t -0. 125 inchtyp
P - specimen load
Figure 5.1 Pin-Loaded Coupon Specimen Configuration
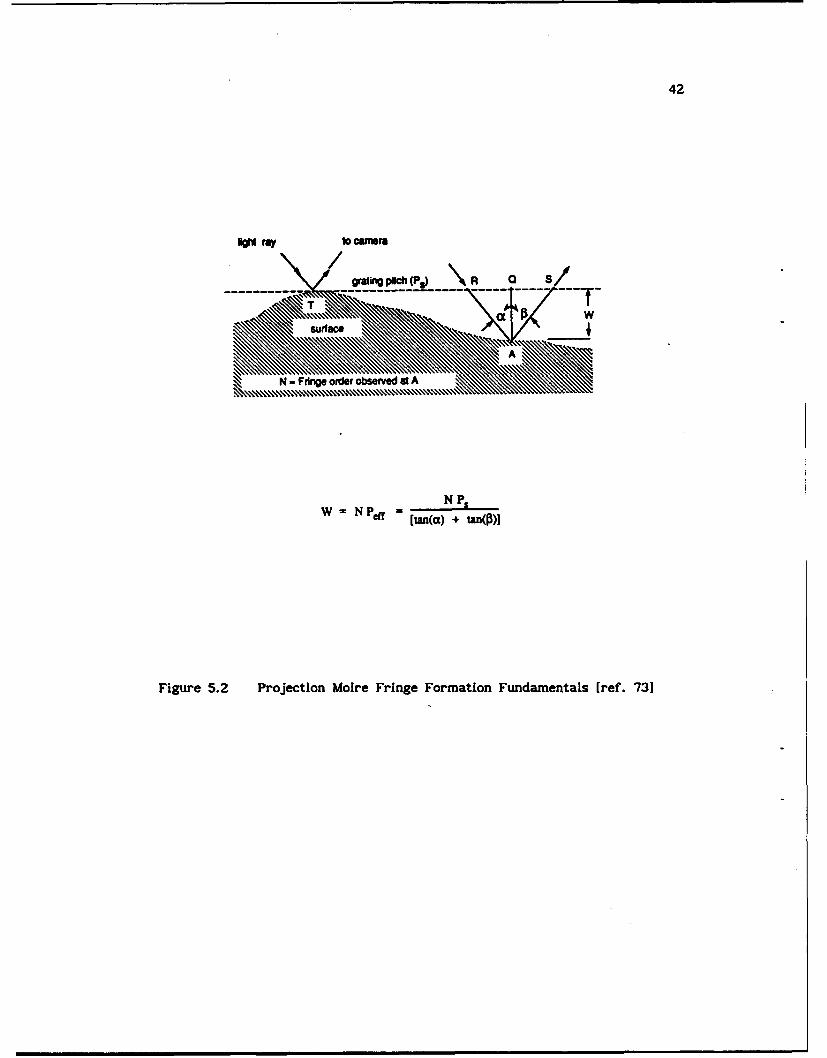
42
Wg fay to cawra
gratig p "c(P ) R - S -
W NPeff N NPs[tan(rz) + tan(p))
Figure 5.2 Projection Moire Fringe Formation Fundamentals [ref. 731
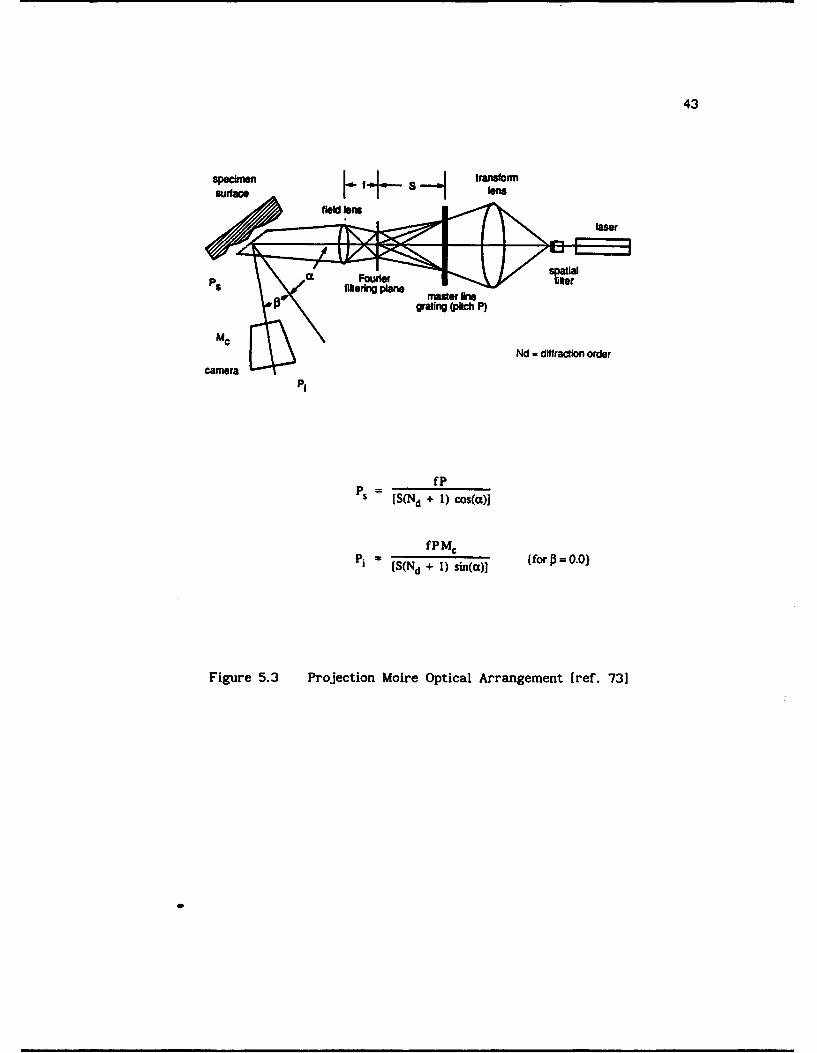
43
specirnen S ranslonnsurface tn
Ndel tonsrdinore
camerar
carner[S(N cosifratio)ode
fP
i [S(Nd + 1) sin(a)] 'for T- fM 0.01
Figure 5.3 Projection Moire Optical Arrangement [ref. 73]
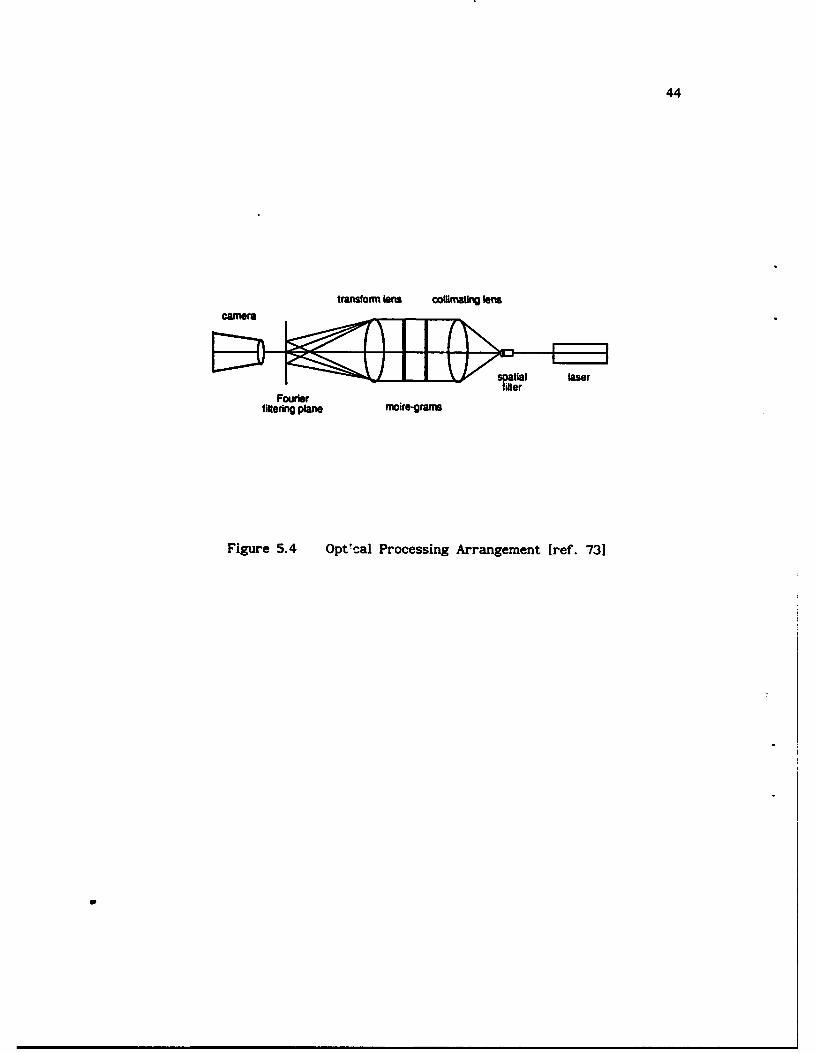
44
transfotmn Ions ollimating lens
Fourierfiltering plane mnoire-gramns
Figure 5.4 Optfcal Processing Arrangement [ref. 731
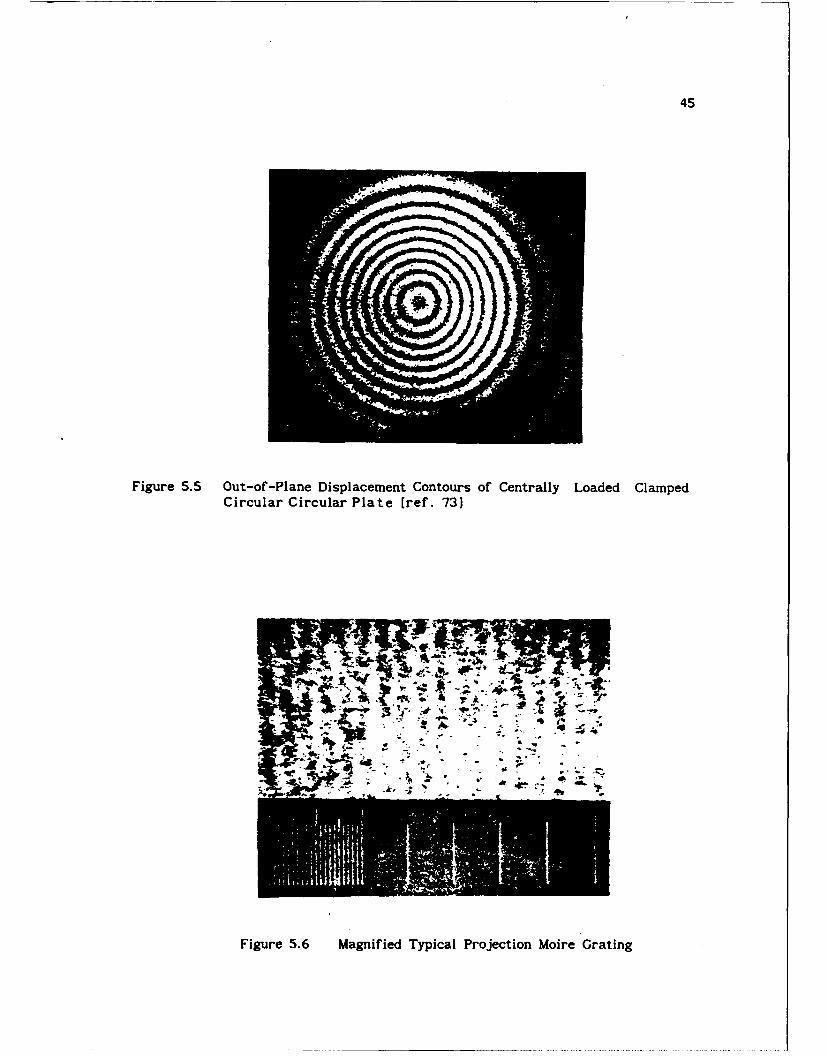
45
Figure 5.5 Out-of-Plane Displacement Contours of Centrally Loaded ClampedCircular Circular Plate (ref. 73)
Figure 5.6 Magnified Typical Projection Moire Grating
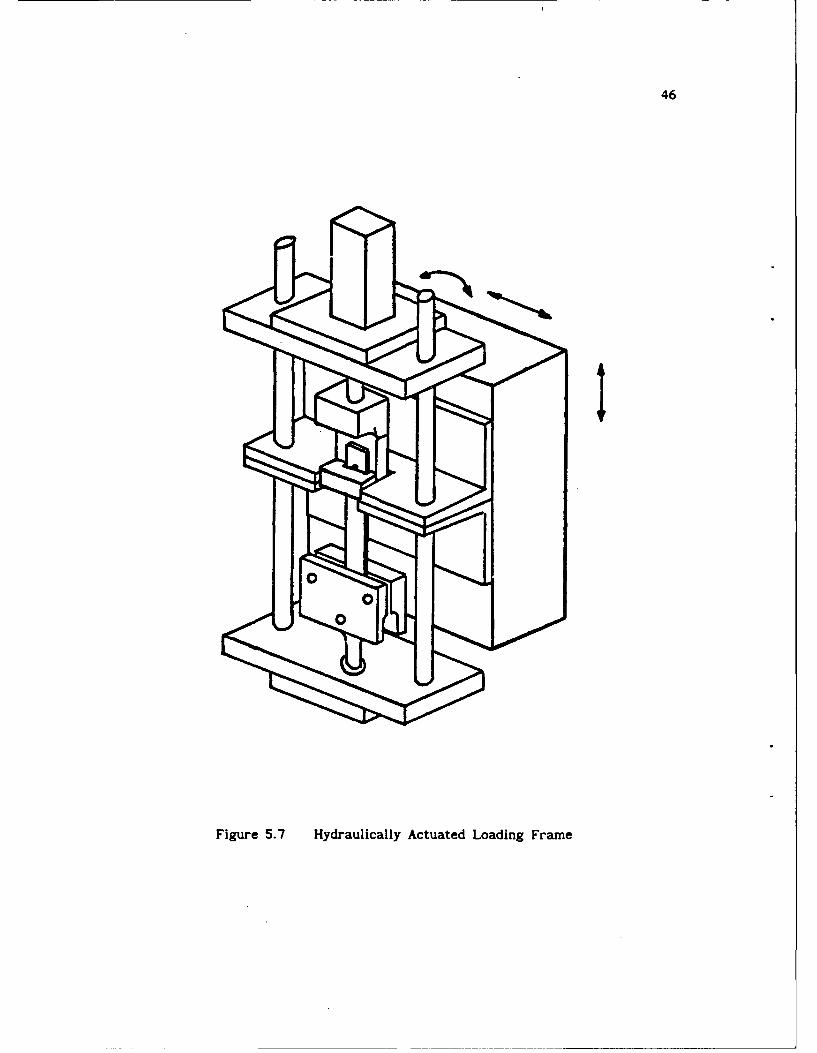
46
Fy
Figure 5.7 Hydraulically Actuated Loading Frame
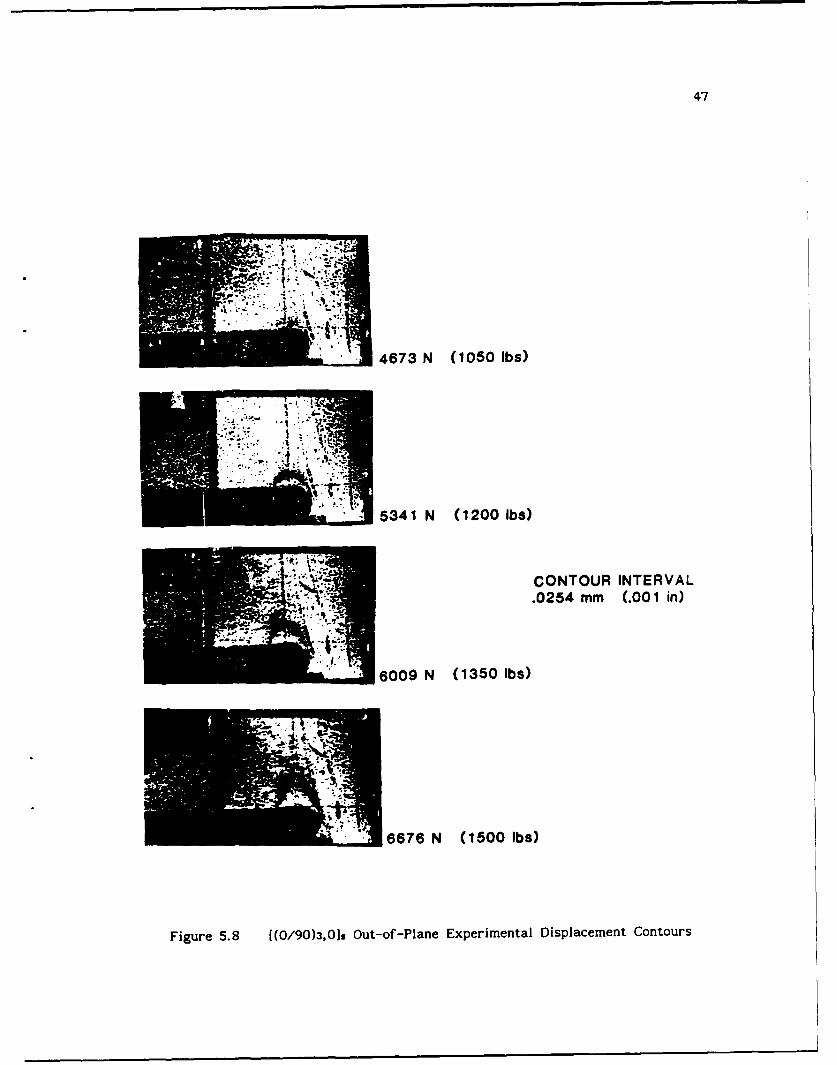
47
4673 N (1050 Ibs)
5341 N (1200 Ibs)
CONTOUR INTERVAL.0254 mm (.00 1 in)
6009 N (1350 Ibs)
6676 N (1500 Ibs)
Figure 5.8 [(0/90)3,0]9 Out-of-Plane Experimental Displacement Contours
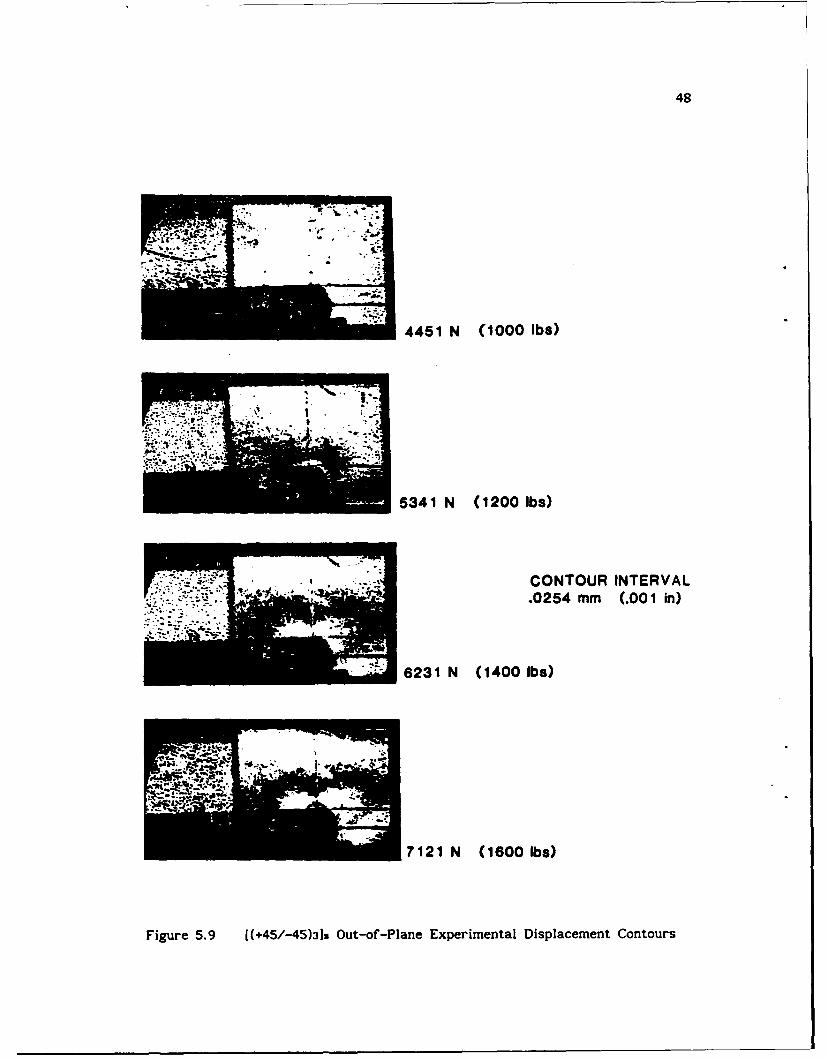
48
4451 N (1000 lbs)
5341 N (1200 lb.)
CONTOUR INTERVAL.0254 mmn (.00 1 in)
6231 N (1400 lbs)
7121 N (1600 Ibs)
Figure 5.9 [(+45/-45)3]2 Out-of-Plane Experimental Displacement Contours
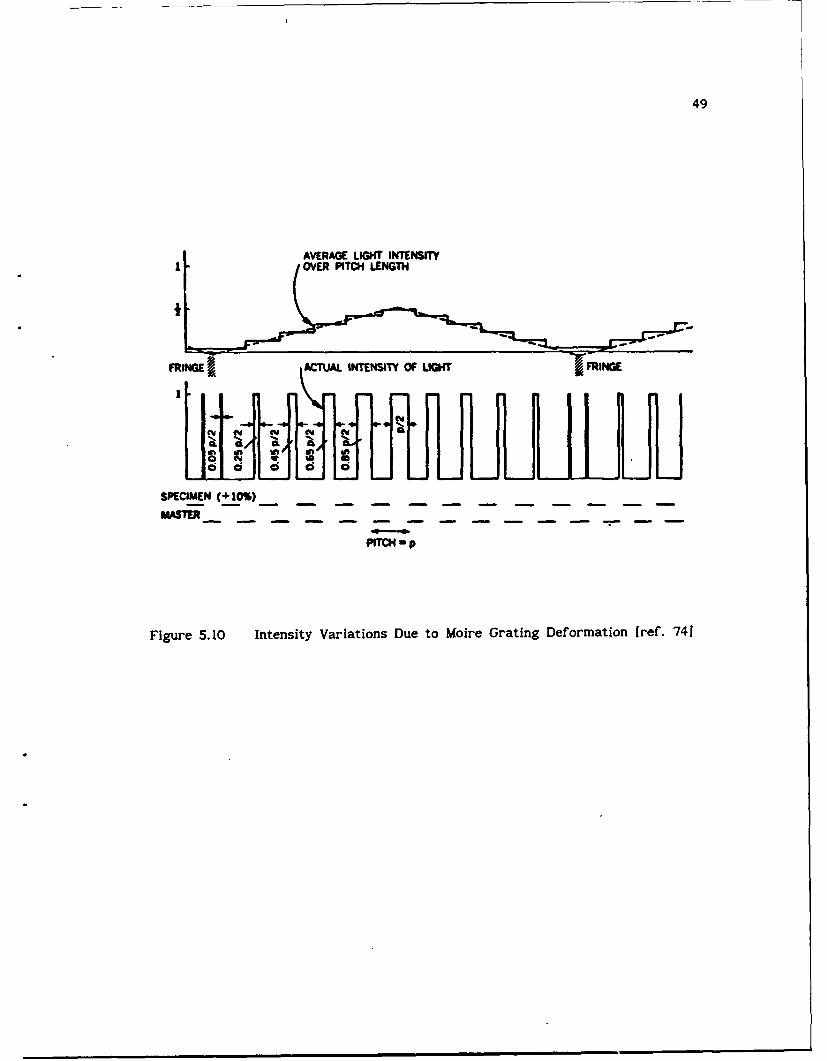
49
AVERAGE LIGHT INTENSITYI OVER PITCH LENGTH
* = = -
FRINGE A CTUAL INTENSITY OF LIGHT FRINGE
SPECIMEN (+ 10%)
Figure 5. 10 Intensity Variations Due to Moire Grating Deformation f ref. 741
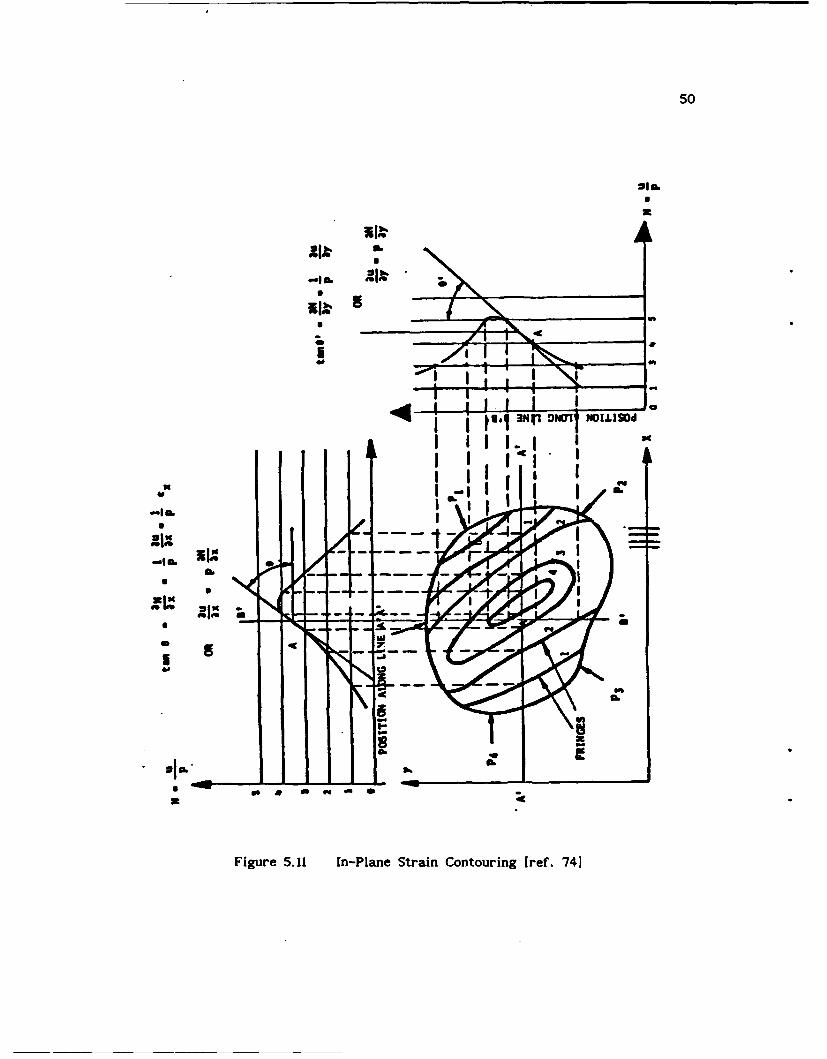
050
Vale.
Sa
-Ia. Z~4V
40O
-II.
Ur
Fiue51 I-ln tai otuin rf 4
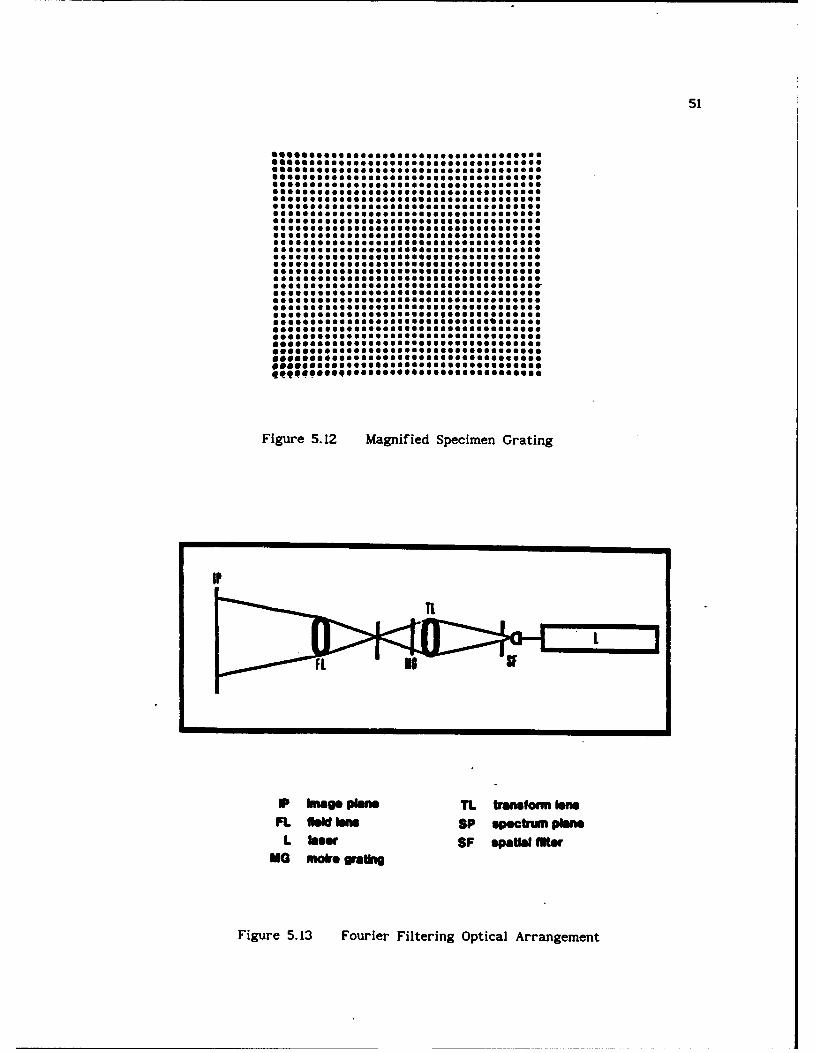
51
6060O66OO u66.6O 6 a se meOceeO 60066O66666
*6OOO0O06O6066.66 666I6I606066666666
OOOOO 6 606 666066e006 066 OOO00606066O0
OC 6060660 6 0 0066 6 66O0 06O00 6060665OOO6 0066OOS 000000066666666000006666 06SSOOO66O6O66SSO06600S600000006O5666600C6SSO0S00666S06S0066S000000
606 WO O0 66666666 6606666606000000O
SOSO66.000606 6O6 666605660 66000005 6 6
0O65 66666060600666666 60006666 66O6O666066 6 606006606000066660666.666O0 00OO066
OOO600000000016666606666666660066606066666066 O6606666666066S0066eOOOO00
O6006606OOO606666OO0666O0000606600OO006O6O6066O6O6666660O606066666.6060
*66*0*6666 00 6O6O60666 6OO0660660 6 60 O00q*g06696O600OOOO0006666066O00000
Figure 5.12 Magnified Specimen Grating
P Inage plis' T. iraneonn IonsFL field lens SP spectruml plane
L law SF spatial fiterMG mie grating
Figure 5.13 Fourier Filtering Optical Arrangement
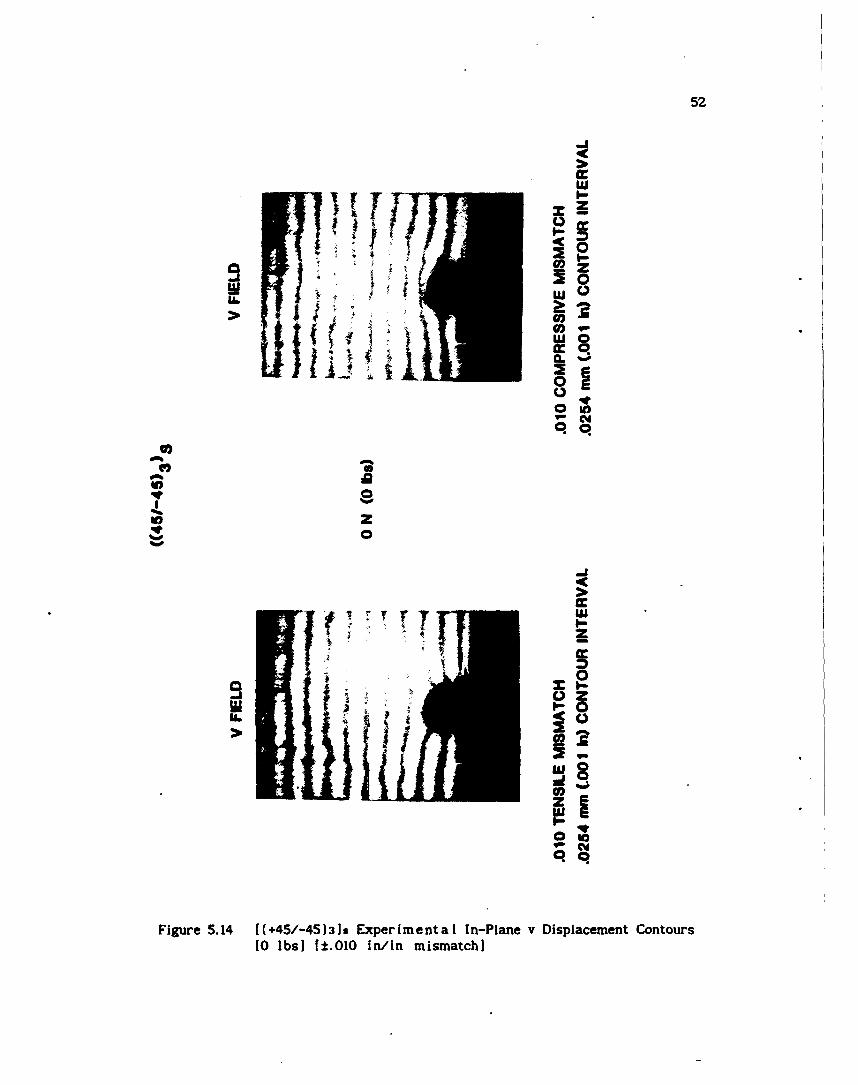
52
:1
w
w
too
C.
1-9UU
UU
ca
Figure 5. 14 [(+45/-45)313 Exper imernt al In-Plane v Displacement Contours[0 ibsi I±.01O in/in mismatch]
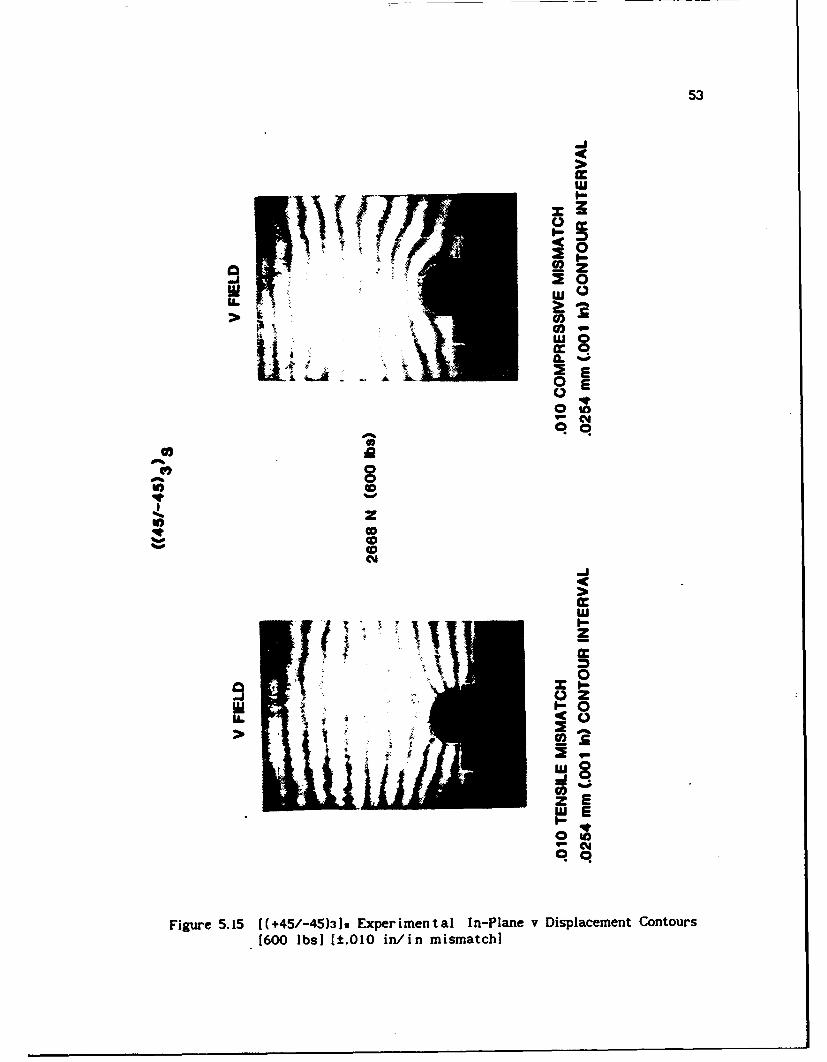
53
_j
AU
C
LO z2 0
U, 0
zUO
0
_U a
0cz
EJ
V
Figure .15 [(45/-453)s Exprimentl In-Pane v iaeetCnor(600~I lbK[.1 ni imth
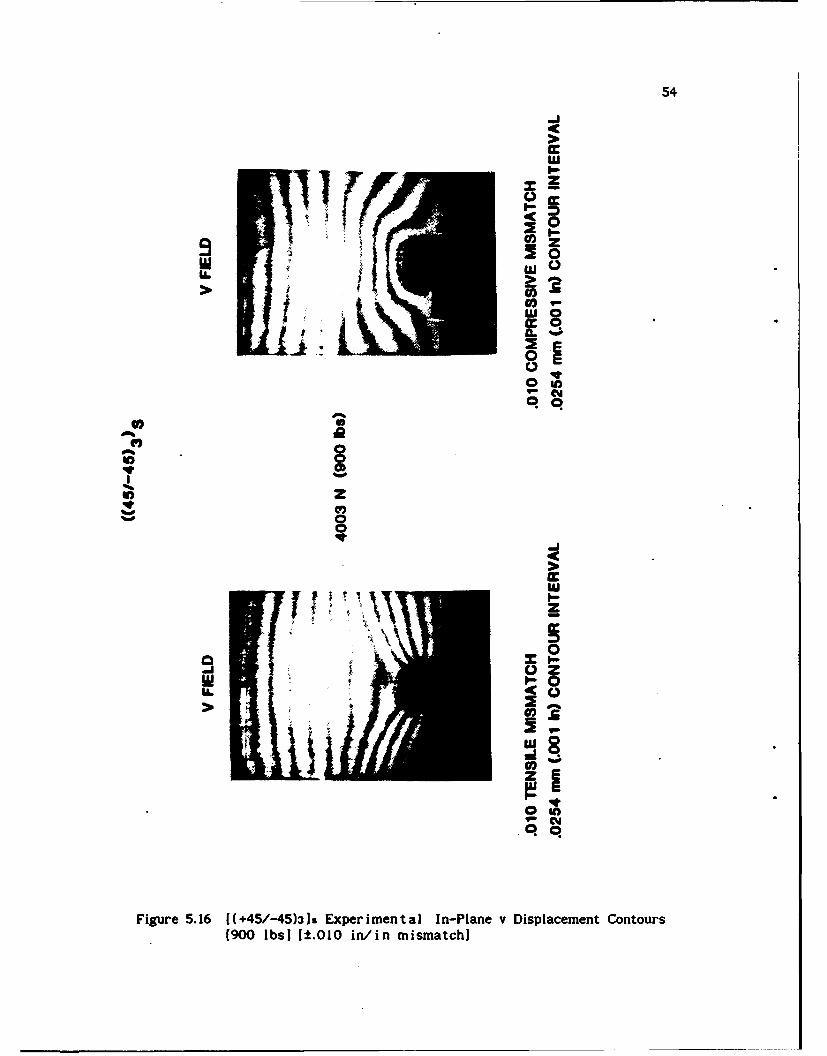
54
w
'a. ULLa
u
0 SA1-0
U 8
_~
00
0
Figure 5.16 [(+45/-45)3]s Experimental In-Plane v Displacement Contours(900 IbsI [t.010 in/in mismatch]
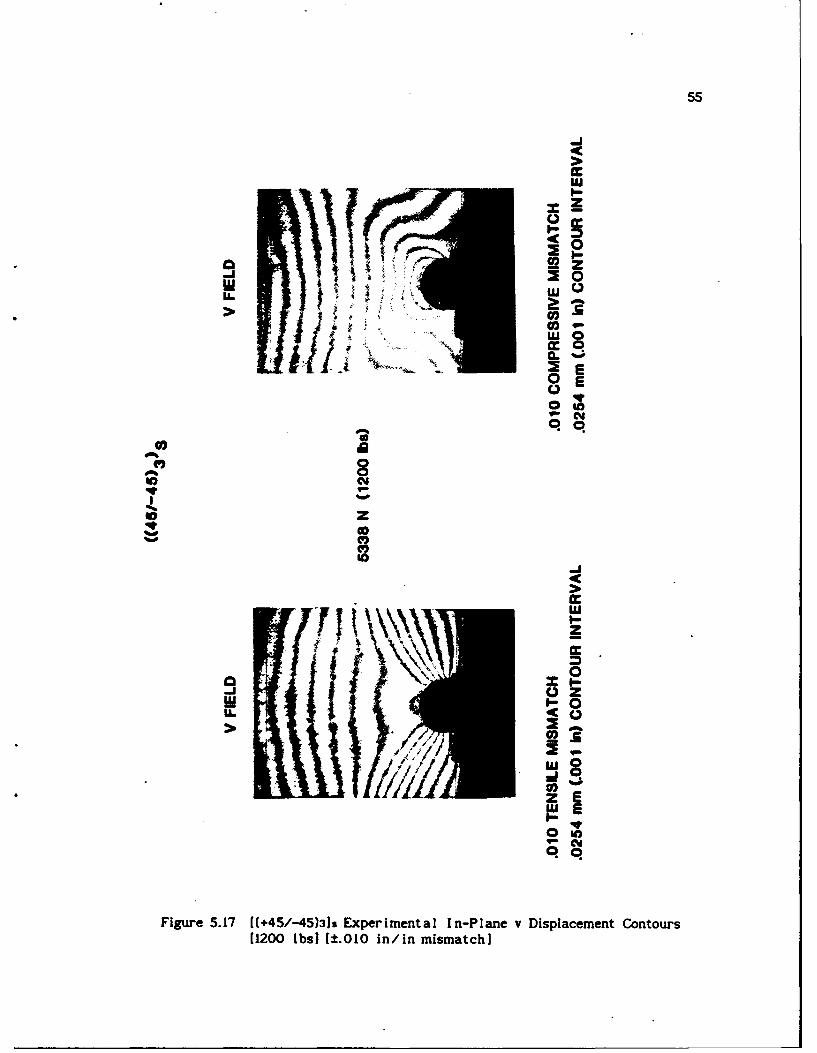
55
_j
~Ui
0j a
iq~j
zqqO
z
/131/ 0U. A A
Figure 5.17 [(+45/-45)31s Experimental I n-Plane v Displacement Contours(1200 IbsI [:t.010 in/in mismatch]
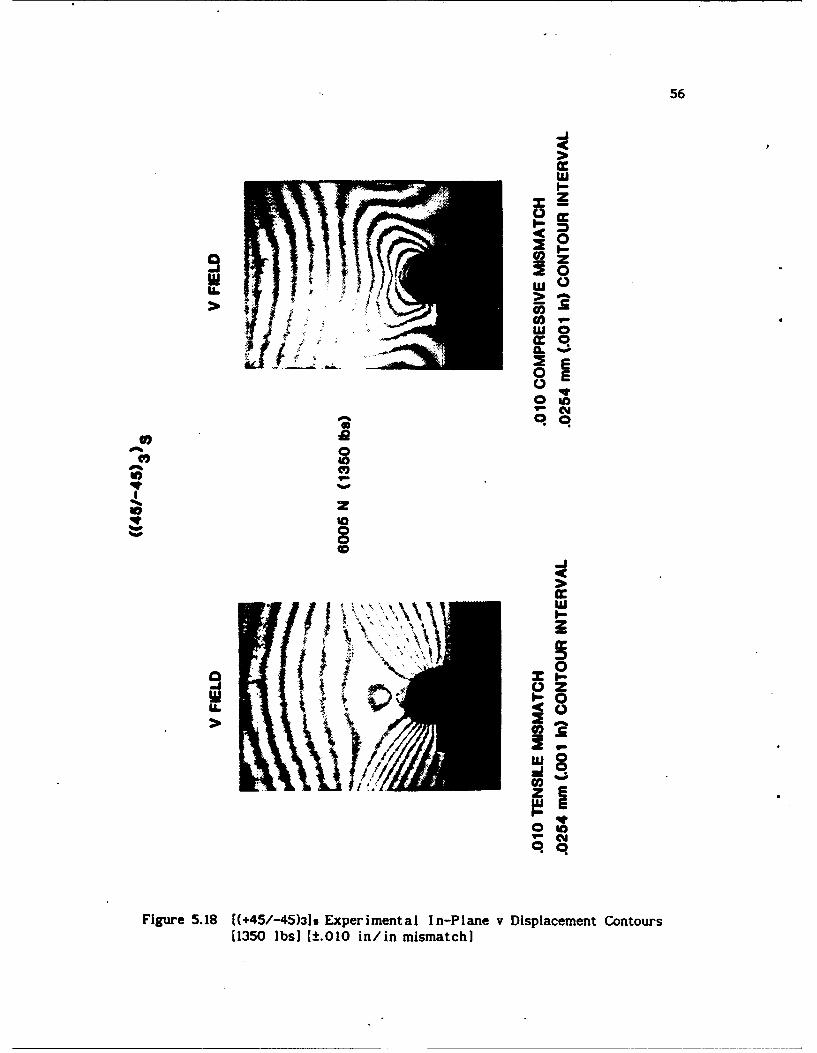
56
cc
aa
LO) 0
Wa
U.U> w
0jLwIL
00IC
z
000
W
z \'~z
!qn
Figure 5.18 [(+45/-45)3]s Experimental I n-Plane v Displacement Contours(1350 ibsI [±.010 in/in mismatch]
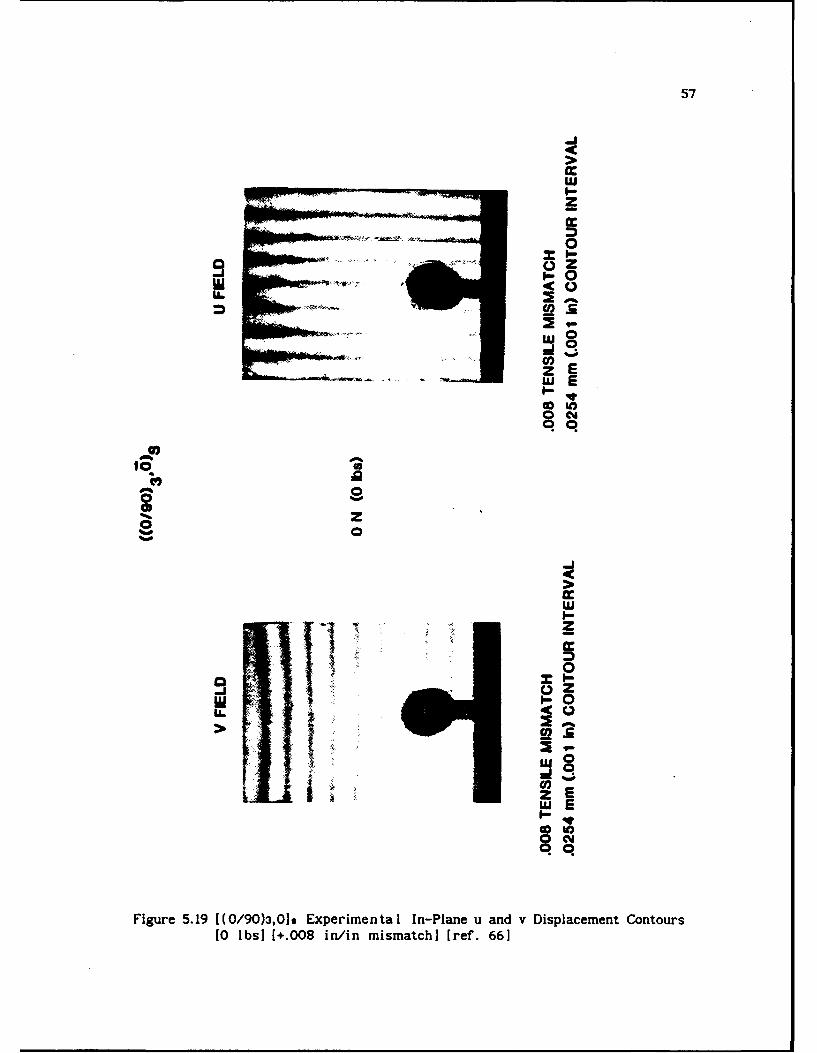
57
_j
CJ
IL(
U)
41))
z
w
-I OZW 1-0
U.U
0 1Y
Figure 5.19 f ( /90)3,O~s Experimenta I In-Plane u and v Displacement Contours[0 ibsI [+.008 in/in mismatch] [ref. 661
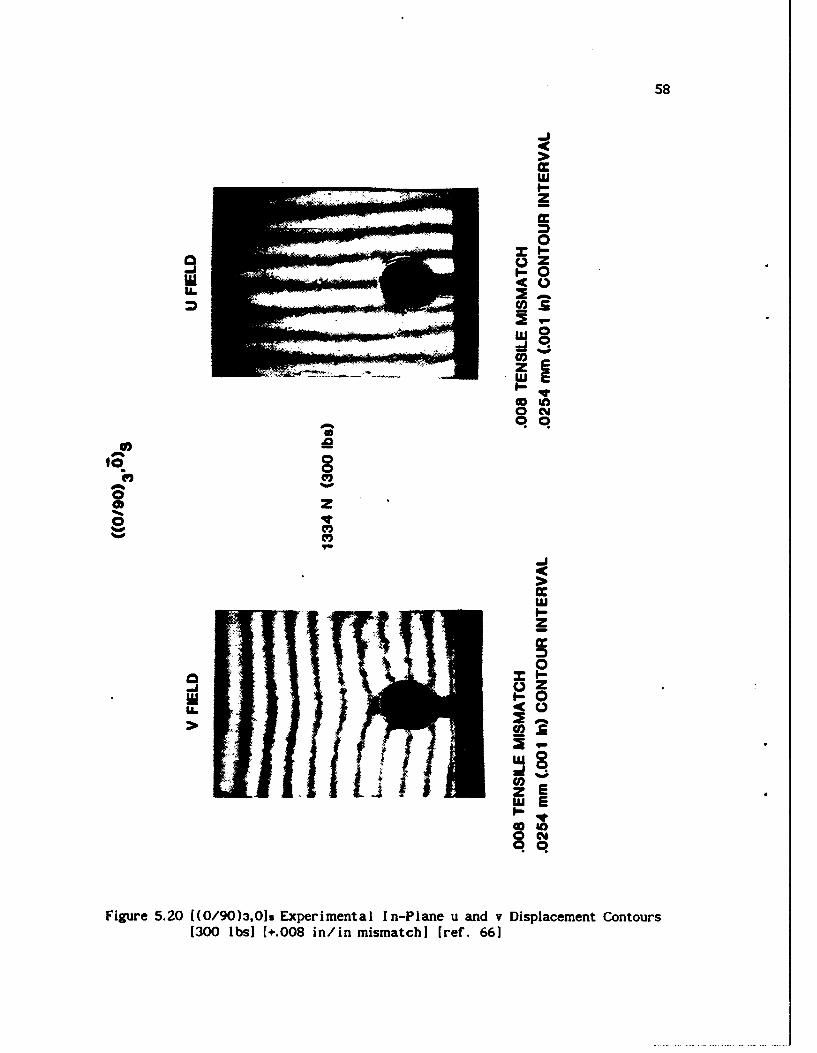
58
I-
0
IA.
z 00
0j E00
0 z
Cf)
cc
00z
(0
z E
0.0N
Figure 5.20 ((0/90)3,019 Experimental I n-Plane u and v Displacement Contours(300 ibsI I +.008 in/in mismatch] (ref. 661
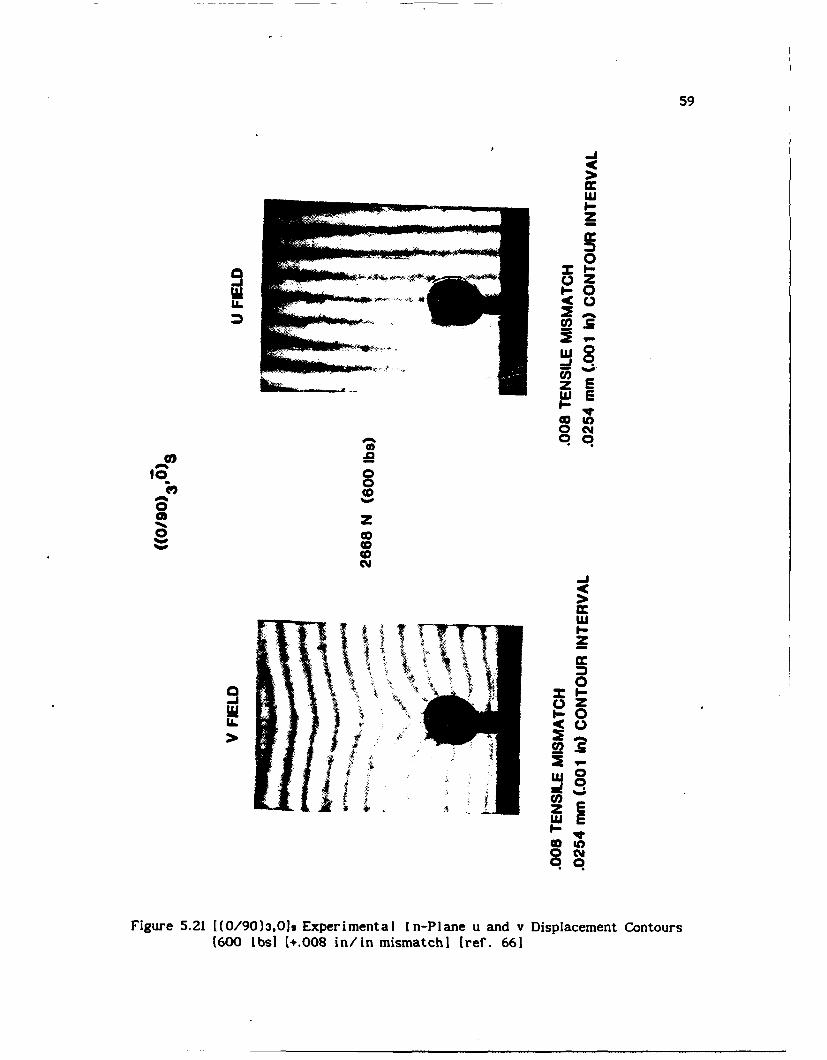
59
-j
zI-
_j z
Uj0
U-
ccWo0 ,
zzdoE
(000
* z
0Z
0i00
Nz
LUP_ -
a 0
Figure 5.21 ((0/90)3,01. Experimental in-Plane u and v Displacement Contours(600 IbsI [+.008 in/in mismatch] (ref. 661
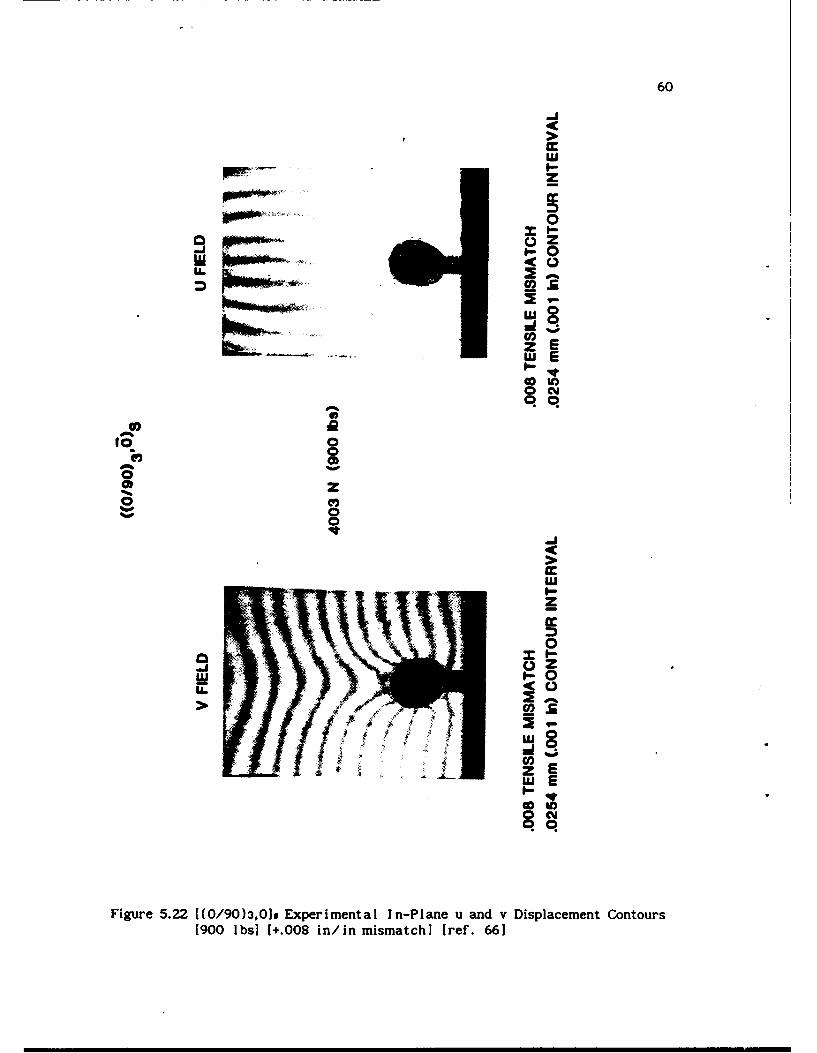
60
_j
z
0
w 4U.j
z
tO 0)0
* z
00
J
zWI-V
0C
Fiue5.2U/0),1 xprmntlI-laeuad iplcmn Cnor[90w s +08i/n imth rf 6
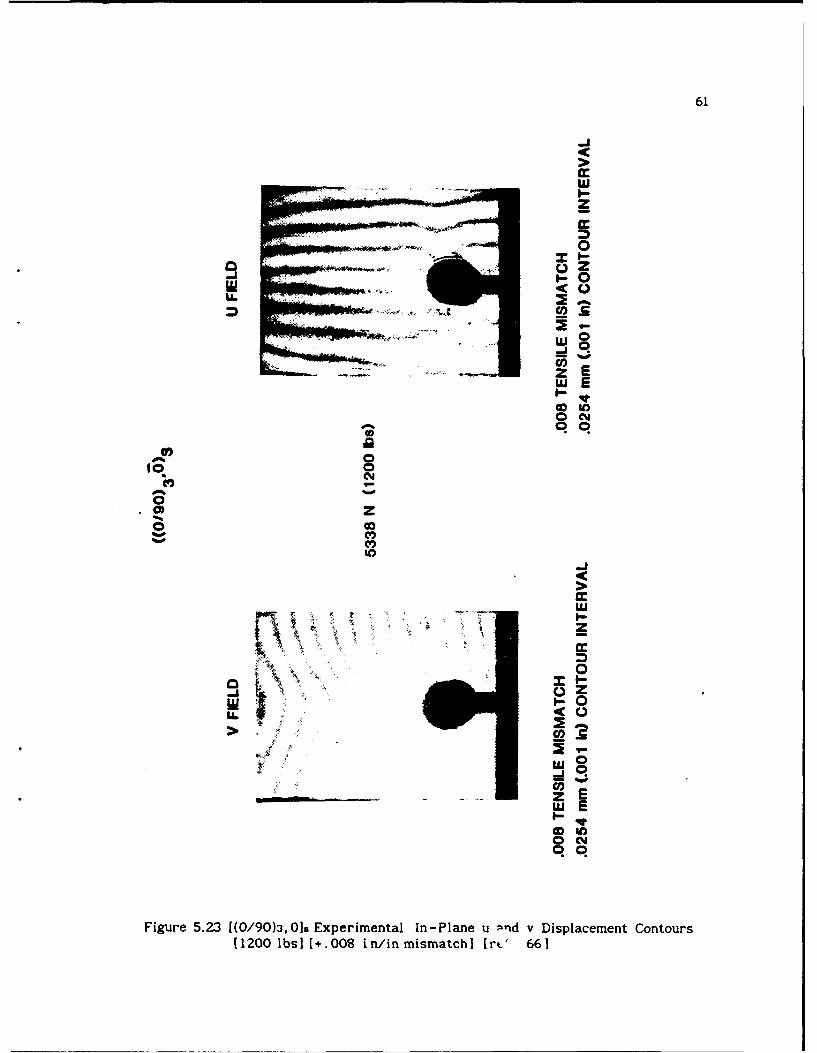
61
-J
I-
0
0i
zWEI- IV
0 ooM
0C0
zz
OJ 0_ Cj
0 C,0 q
Figur 5.231(0/9)3,Os Exprimenal I-Plan u -,d v ispaeetCnor
( 100lb II . 08i /i msmtc I[ t' 66
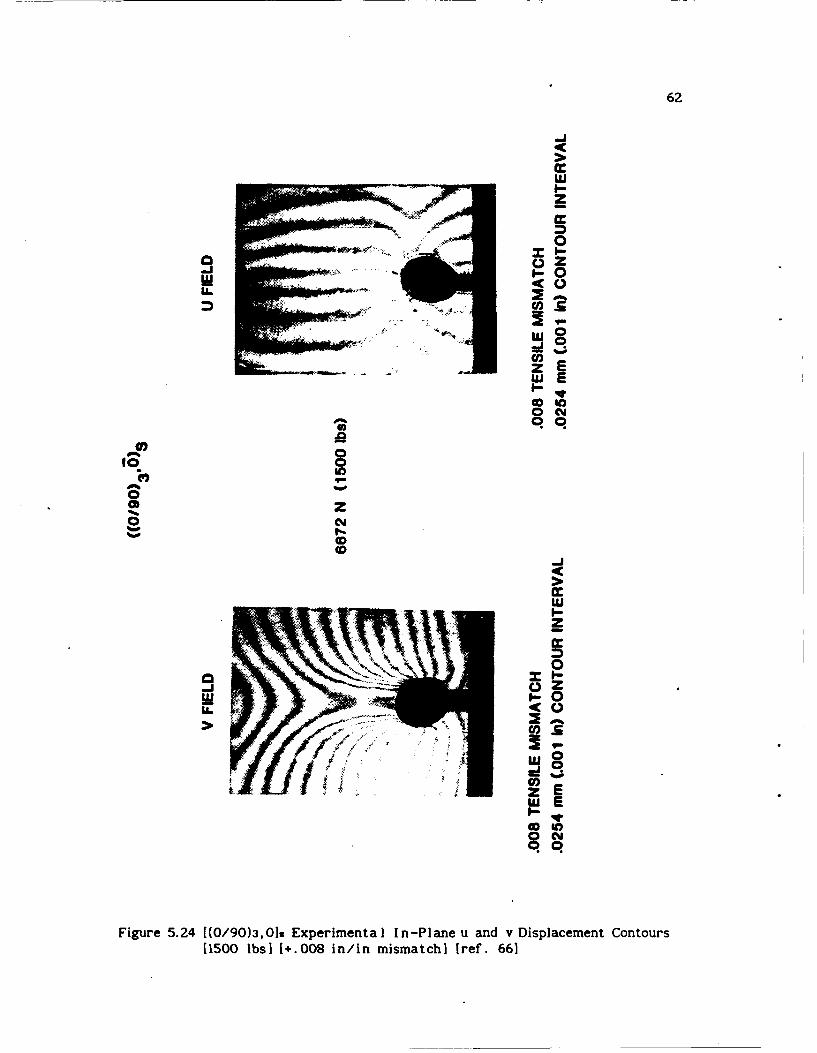
62
-J
z
aZ
U.
UUCO to
0 C
* z0
CDICDI
Lu
z
zwE
CD 0
Figure 5.24 [(0/90)3,01s Experimental In-Plane u and v Displacement Contours[1500 Ibs] [+.008 in/in mismatch] [ref. 66]
63
CHAPTER 6. LAMINA/LAMINATE MECHANICAL PROPERTY EVALUATION
Three dimensional constitutive equations were developed for each
laminate configuration from a lamina/laminate mechanical property data base.
Intralaminar shear response was characterized by the ASTM D3518-76
specification and used with previously determined [661 in-plane lamina
properties (Ei, E2, V12, and vz) to form the lamina mechanical property data
base. Through thickness laminate Poisson ratio and transverse shear moduli
properties were determined from tension and modified three point bend tests to
form the laminate mechanical property data base. This section will first
review the authors' earlier in-plane lamina property tests and results. A
discussion of the intralaminar shear, transverse shear, and through thickness
Poisson ratio tests and results will then be discussed.
6.1 IN-PLANE LAMINA MECHANICAL PROPERTY DATA BASE
Both in-plane lamina moduli and Poisson ratio values of the SP250-S2
Glass fiber/resin system were successfully previously characterized by the
author [661. AMMRC SL-3 streamlined tension specimens, shown in Figure 6.1,
were manufactured from eight ply SP250-S2 Glass unidirectional laminated
plates. A total of six (O) and six (90)s specimens were shaped on a
pantograph by carbide router bits and instrumented with back to back BLH
FAET-06A-35-Sl3E strain gages. These gages were wired in series and connected
to the single active arm of a Wheatstone bridge to alleviate specimen bending
effects. The specimens were tested in a 20K INSTRON testing machine.
Longitudinal and transverse specimen strains and loads were monitored using
conventional XY recorders.
The load-strain curves of the SL-3 tension specimens were digitized.
Average as well as plus and minus standard deviation stress-strain curves were
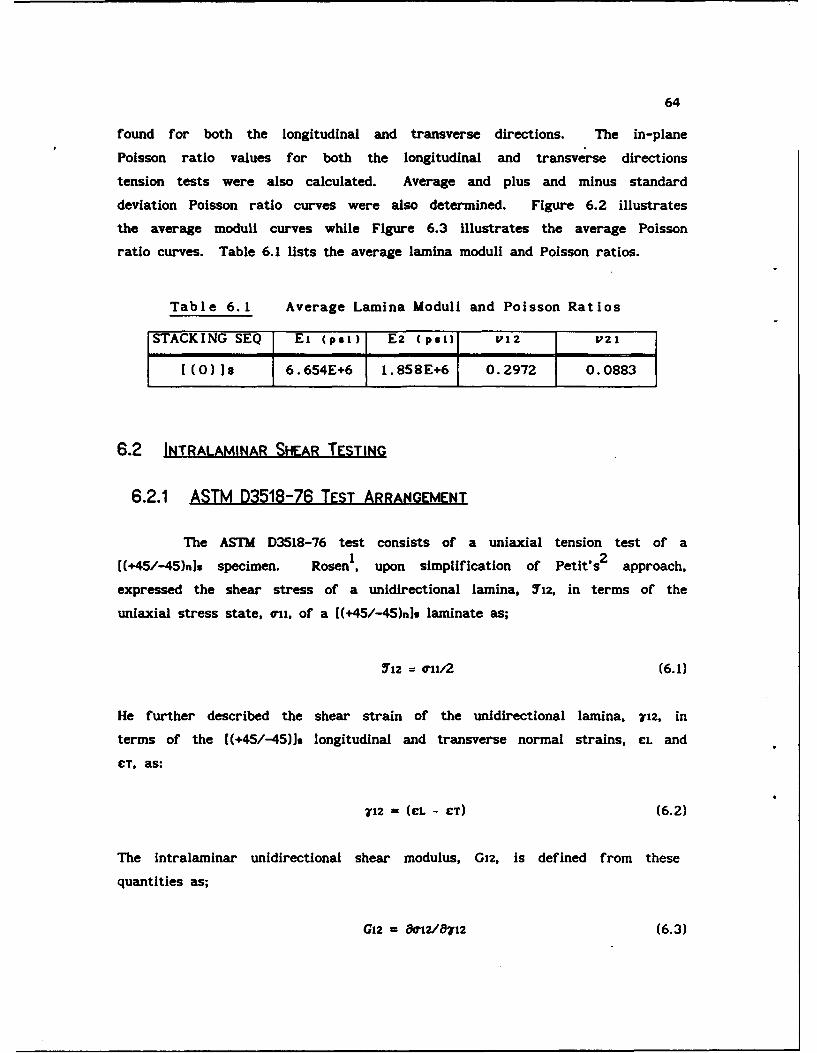
64
found for both the longitudinal and transverse directions. The in-plane
Poisson ratio values for both the longitudinal and transverse directions
tension tests were also calculated. Average and plus and minus standard
deviation Poisson ratio curves were also determined. Figure 6.2 illustrates
the average moduli curves while Figure 6.3 illustrates the average Poisson
ratio curves. Table 6.1 lists the average lamina moduli and Poisson ratios.
Table 6.1 Average Lamina Moduli and Poisson Ratios
STACKING SEQ Ei (psl) E2 (psi) P12 U21
[(O)]8 6.654E+6 1. 858E+6 0.2972 0.0883
6.2 INTRALAMINAR SHEAR TESTING
6.2.1 ASTM D3518-76 TEST ARRANGEMENT
The ASTM D3518-76 test consists of a uniaxial tension test of a
[(+45/-45)nls specimen. Rosen1 , upon simplification of Petit's 2 approach,
expressed the shear stress of a unidirectional lamina, T'12, in terms of the
uniaxial stress state, ow1, of a [(+45/-45)nlu laminate as;
712 = iu/2 (6.1)
He further described the shear strain of the unidirectional lamina, X12, in
terms of the [(+45/-45)]s longitudinal and transverse normal strains, CL and
CT, as:
J12 = (CL - CT) (6.2)
The intralaminar unidirectional shear modulus, Giz, is defined from these
quantities as;
G12 = 8.12/8712 (6.3)
65
The intralaminar shear modulus of the [(0/90)ns laminate configuration, Gxy,
can be shown to be equal to this unidirectional shear modulus, Gz, within the
bounds of Classical Lamination Theory [801.
A recent comparison of intralaminar shear tests by Lee and Munro 3
have shown the ASTM D3518-76 test to be quite attractive in comparison to
other shear test methods. The basis for their decision lay in various criteria
that include accuracy of strength and stiffness predictions and ease of
specimen preparation and test procedure.
6.2.2 SPECIMEN DESCRIPTION ANI PREPARATION
The geometry of the intralaminar test specimen was taken from ASTM
specification D3518-76. Illustrated in Figure 6.4, the specimen was
manufactured from a [(+45/-45)2]s laminated plate that was fabricated from 3M
SP-250 S2-Glass prepreg tape. Beveled tabs manufactured from specimen
material were adhered to the specimens with American Cyanamid FM-100 film
adhesive. Both sides of the specimen were instrumented with BLH
FAET-06A-35-Sl3E biaxial strain gages. A total of four test specimens were
produced.
6.2.3 TEST PROCEDURES AND RESULTS
All of the D3518-76 test specimens were placed into a 20K Instron
testing machine. Front and rear surface strain gages were wired into a two
active arm Wheatstone bridge that was used in conjunction with a PACIFICO
signal conditioning unit. Both longitudinal and transverse strains as well as
load levels were digitally recorded using a KEITHLEY/IBM data acquisition
system. Tension test were conducted at a rate of .02 in/min while data
acquisition was done at a 4 sample/second rate.
The resulting digital data files were transferred into the
Computational Mechanics local area network. Processing on an APOLLO DN3000
work station resulted in average as well as plus and minus standard deviation
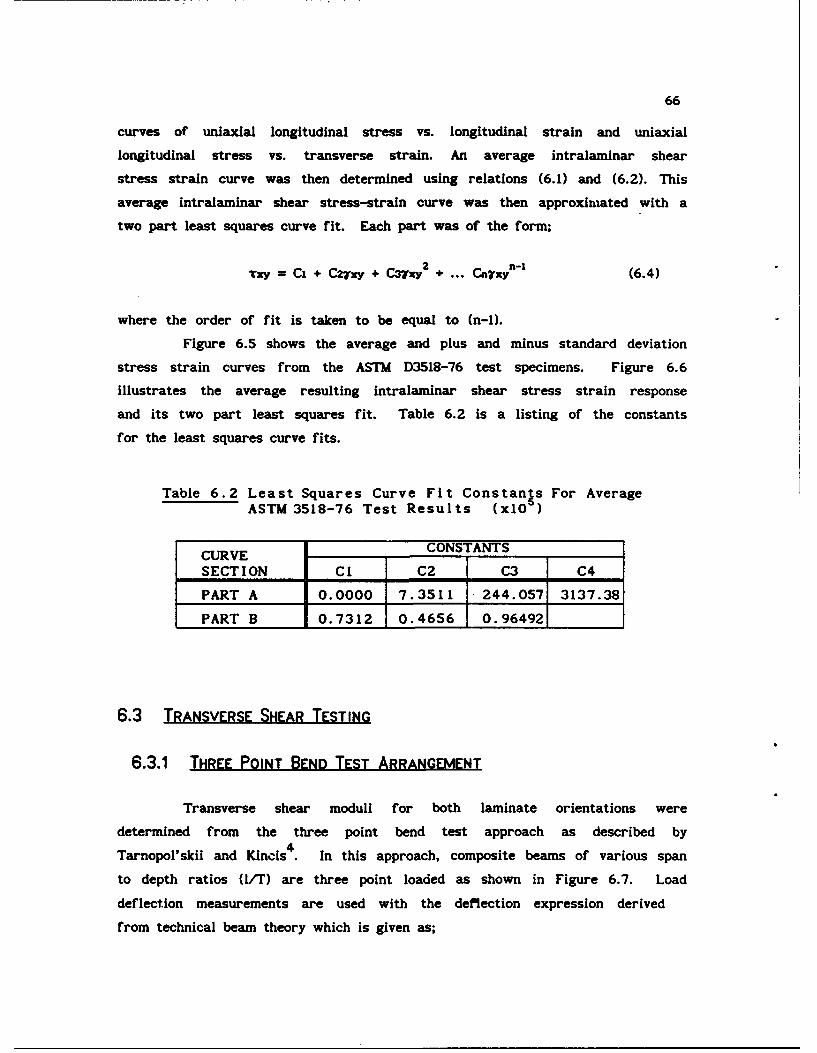
66
curves of uniaxial longitudinal stress vs. longitudinal strain and uniaxial
longitudinal stress vs. transverse strain. An average intralaminar shear
stress strain curve was then determined using relations (6.1) and (6.2). This
average intralaminar shear stress-strain curve was then approximiated with a
two part least squares curve fit. Each part was of the form;
Txy = Ci + C27xy + C37xy2 + ... Cn 'xy - (6.4)
where the order of fit is taken to be equal to (n-I).
Figure 6.5 shows the average and plus and minus standard deviation
stress strain curves from the ASTM D3518-76 test specimens. Figure 6.6
illustrates the average resulting intralaminar shear stress strain response
and its two part least squares fit. Table 6.2 is a listing of the constants
for the least squares curve fits.
Table 6.2 Least Squares Curve Fit Constants For AverageASTM 3518-76 Test Results (x1O 5 )
CURVE CONSTANTS
SECTION Cl C2 C3 C4
PART A 0.0000 7.3511 244.057 3137.38
PART B 0.7312 0.4656 0.96492
6.3 TRANSVERSE SHEAR TESTING
6.3.1 THREE POINT BEND TEST ARRANGEMENT
Transverse shear moduli for both laminate orientations were
determined from the three point bend test approach as described by4Tarnopol'skii and Kincis. In this approach, composite beams of various span
to depth ratios (I/T) are three point loaded as shown in Figure 6.7. Load
deflection measurements are used with the deflection expression derived
from technical beam theory which Is given as;
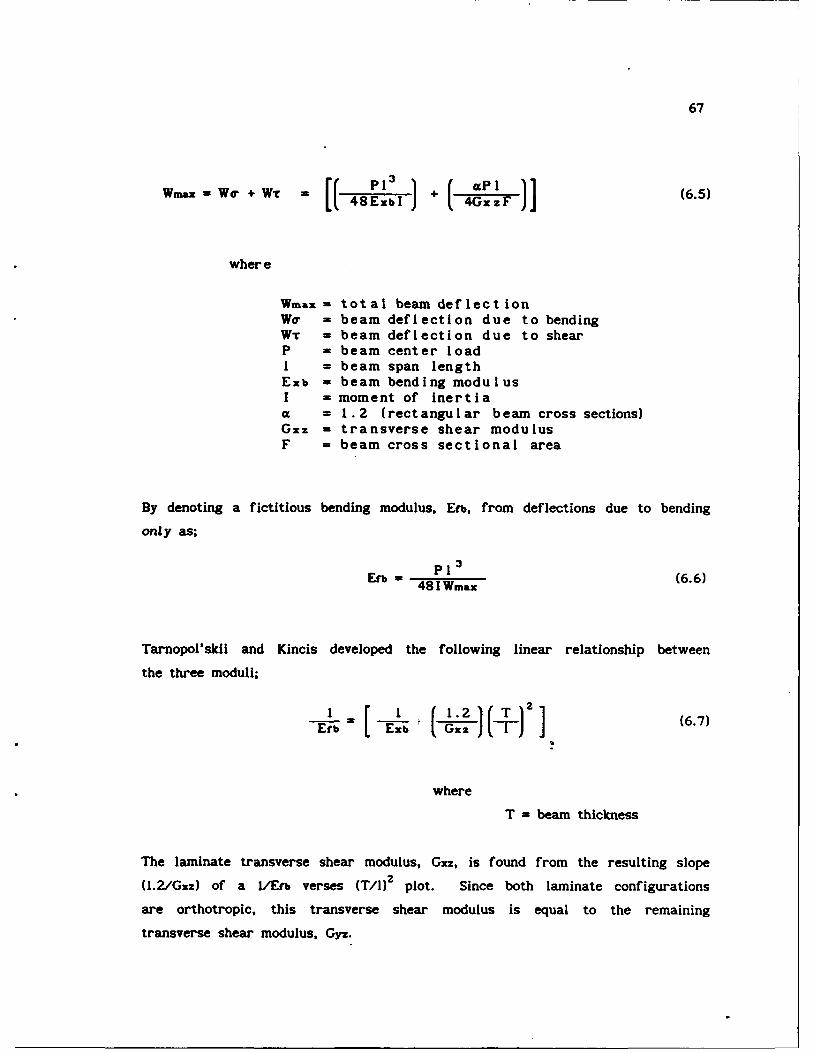
67
Wmax = W + WT [ P8E ) + (GzF (6.5)R48ExbI + Gz
where
Wmax - total beam deflect ionWe = beam deflection due to bendingWT - beam deflection due to shearP = beam center loadI = beam span lengthExb = beam bending modulusI = moment of inertiaa = 1.2 (rectangular beam cross sections)Gxz = transverse shear modulusF = beam cross sectional area
By denoting a fictitious bending modulus, Erb, from deflections due to bending
only as;
Eb = P1 (6.6)481 Wmax
Tarnopol'skii and Kincis developed the following linear relationship between
the three moduli;
Efb E; r~xzj 1(6.7)
where
T = beam thickness
The laminate transverse shear modulus, Gxz, is found from the resulting slope
(1.2/Gxz) of a hErb verses (T/) 2 plot. Since both laminate configurations
are orthotropic, this transverse shear modulus is equal to the remaining
transverse shear modulus, Gyz.
68
6.3.2 SPECIMEN DESCRIPTION
Both [(0/90)419 and [(+45/-45)419 3M SP250-S2 glass specimens of
nominal 0.125" thickness were used In the three point bend tests. Specimen
span lengths were selected as to provide apprecLable deflections due to shear
for accuracy in experimental determination of the transverse shear moduli
[781. From equation 6.5, it can readily be seen that the ratio of shear
deflection to total beam deflection may be expressed as;
3 I + Eb (6.8)
which may graphically seen in Figure 6.8. A prtorL assumption of a moduli
ratio of .1 will yield deflection ratios of approximately 437., 16%, 8., and 47.
for respective beam spans of 0.5", 1.0", 1.5", and 2.0". A specimen width of
0.5" was selected relative to the resulting span to depth ratios in accordance
to the b = .59" (0.039" s T S 0.39") recommendation of Tarnopol'skii [781. A
specimen of 5" span were also selected to experimentally determine an Exb
value for comparison to the graphically obtained one from equation 6.7.
Specimens of 2.5" and 5.0" length by 0.5" width were manufactured
from the 16 ply laminated plates. Their locations within the plate were
selected as to minimize specimen thickness and volume fraction variations.
Table 6.3 lists exact three point bend test specimen dimensions.
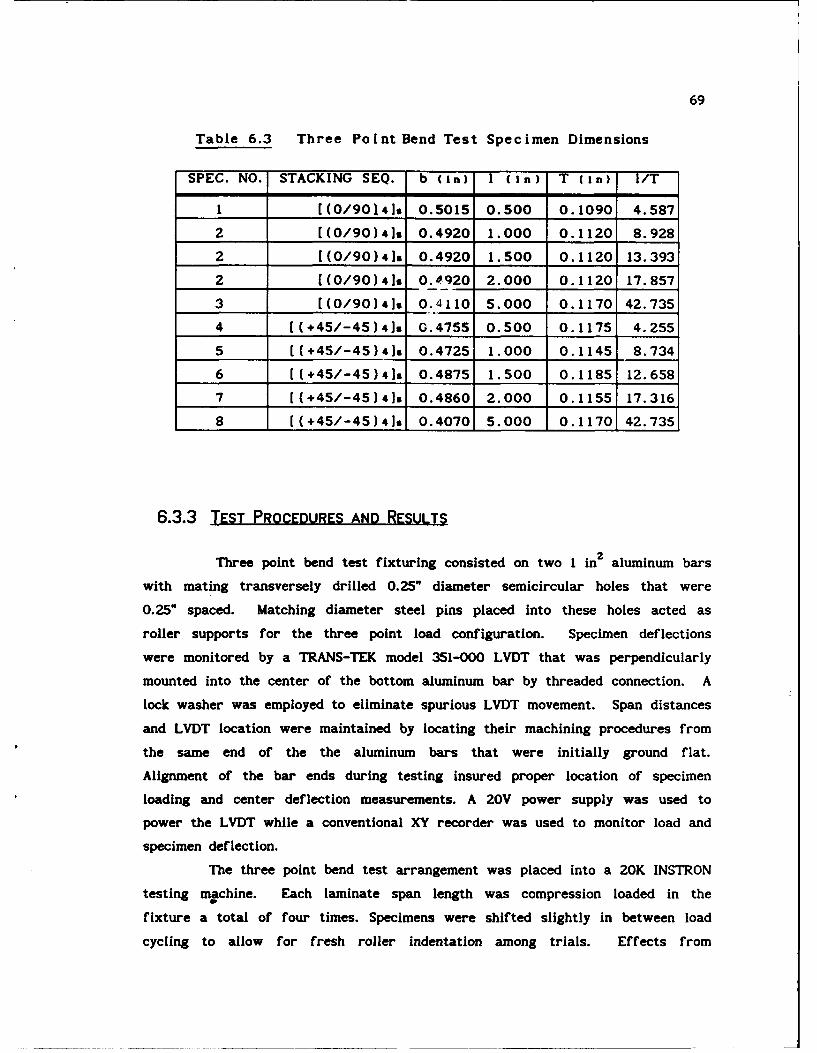
69
Table 6.3 Three Point Bend Test Specimen Dimensions
SPEC. NO. STACKING SEQ. b (in) 1 (In) T (In) Il/T
1 [(0/9014]s 0.5015 0.500 0.1090 4.587
2 [(0/90)4]I 0.4920 1.000 0.1120 8.928
2 [(0/90)4Is 0.4920 1.500 0.1120 13.393
2 [(0/90)4]s 0. 92O 2.000 0.1120 17.857
3 (0/90)4]I 0.4110 5.000 0.1170 42.735
4 [(+45/-45)4], G.4755 0.500 0.1175 4.255
5 [ (+45/-45) 4]s 0.4725 1.000 0.1145 8.734
6 [(+45/-45)41 0.4875 1.500 0.1185 12.658
7 [ (+45/-45)4]a 0.4860 2.000 0.1155 17.316
8 [ (+45/-45)41, 0.4070 5.000 0.1170 42.735
6.3.3 TEST PROCEDURES AND RESULTS
Three point bend test fixturing consisted on two I in2 aluminum bars
with mating transversely drilled 0.25" diameter semicircular holes that were
0.25" spaced. Matching diameter steel pins placed into these holes acted as
roller supports for the three point load configuration. Specimen deflections
were monitored by a TRANS-TEK model 351-000 LVDT that was perpendicularly
mounted into the center of the bottom aluminum bar by threaded connection. A
lock washer was employed to eliminate spurious LVDT movement. Span distances
and LVDT location were maintained by locating their machining procedures from
the same end of the the aluminum bars that were initially ground flat.
Alignment of the bar ends during testing insured proper location of specimen
loading and center deflection measurements. A 20V power supply was used to
power the LVDT while a conventional XY recorder was used to monitor load and
specimen deflection.
The three point bend test arrangement was placed into a 20K INSTRON
testing machine. Each laminate span length was compression loaded in the
fixture a total of four times. Specimens were shifted slightly in between load
cycling to allow for fresh roller indentation among trials. Effects from
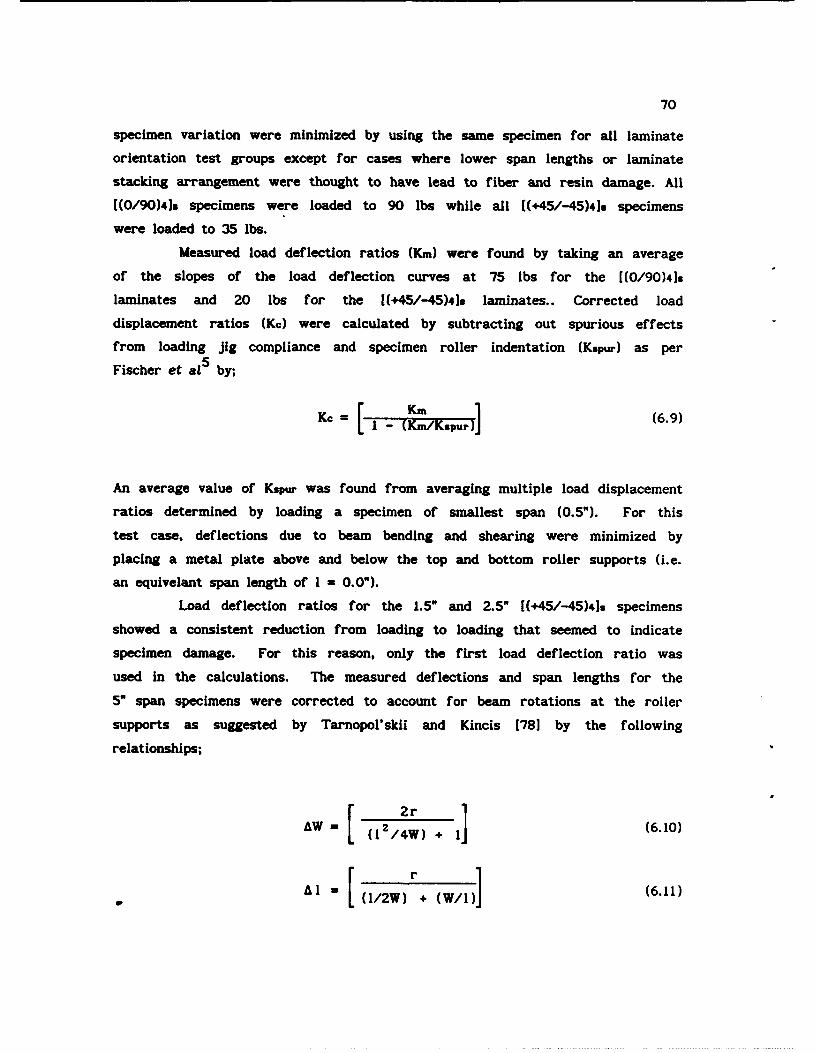
70
specimen variation were minimized by using the same specimen for all laminate
orientation test groups except for cases where lower span lengths or laminate
stacking arrangement were thought to have lead to fiber and resin damage. All
[(0/90)41. specimens were loaded to 90 lbs while all [(+45/-45)4]. specimens
were loaded to 35 lbs.
Measured load deflection ratios (Kin) were found by taking an average
of the slopes of the load deflection curves at 75 lbs for the [1(0/90)4]s
laminates and 20 lbs for the [(+45/-45)4.) laminates.. Corrected load
displacement ratios (K) were calculated by subtracting out spurious effects
from loading jig compliance and specimen roller indentation (Kspur) as per
Fischer et a15 by;
Km(69Kc I [ - (Kin/Kupur](.9
An average value of Kspur was found from averaging multiple load displacement
ratios determined by loading a specimen of smallest span (0.5"). For this
test case, deflections due to beam bending and shearing were minimized by
placing a metal plate above and below the top and bottom roller supports (i.e.
an equivelant span length of I = 0.0").
Load deflection ratios for the 1.5" and 2.5" [(+45/-45)4]. specimens
showed a consistent reduction from loading to loading that seemed to indicate
specimen damage. For this reason, only the first load deflection ratio was
used in the calculations. The measured deflections and span lengths for the
5" span specimens were corrected to account for beam rotations at the roller
supports as suggested by Tarnopol'skii and Kincis (781 by the following
relationships;
AW = (I 2 /4w) + ] (6.10)
Al (/2W) + (W/l)]
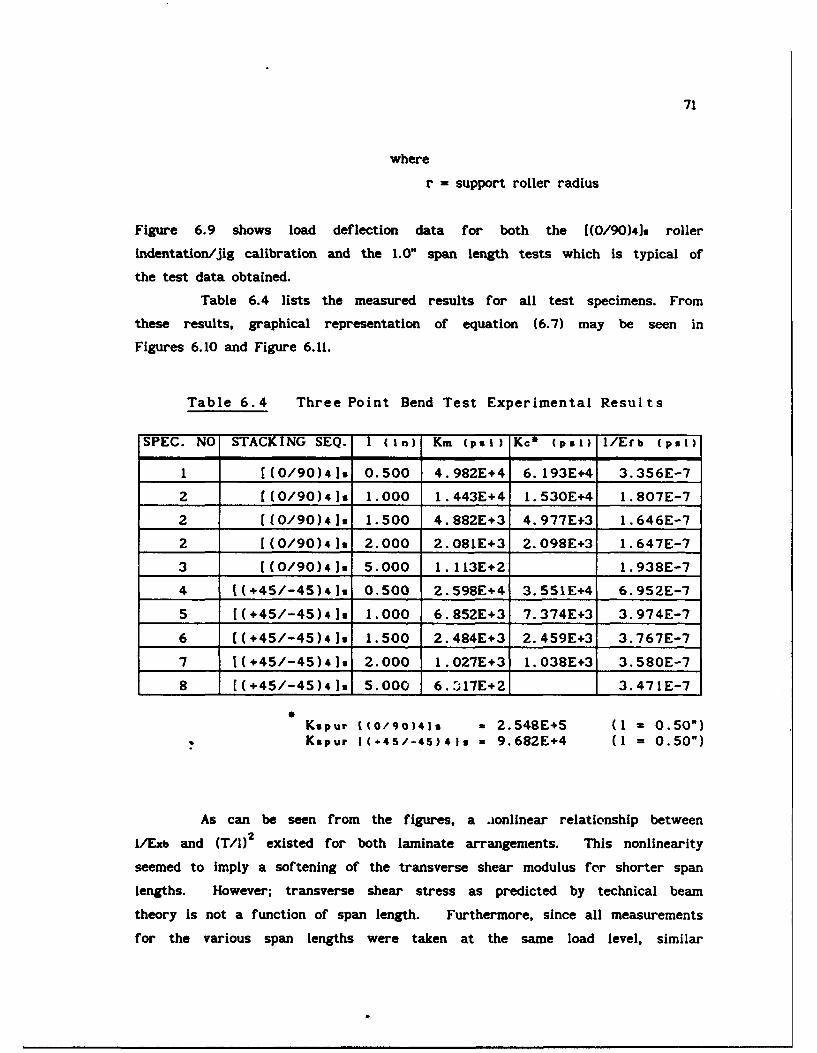
71
where
r = support roller radius
Figure 6.9 shows load deflection data for both the [(0/90)4]s roller
indentation/jig calibration and the 1.0" span length tests which is typical of
the test data obtained.
Table 6.4 lists the measured results for all test specimens. From
these results, graphical representation of equation (6.7) may be seen in
Figures 6.10 and Figure 6.11.
Table 6.4 Three Point Bend Test Experimental Results
SPEC. NO STACKING SEQ. I (in) Km (psi) Kc* (psi) I/Erb (psi)
1 [(0/90)41 0.500 4.982E+4 6.193E+4 3.356E-7
2 [(0/90)4]s 1.000 1.443E+4 1.530E+4 1.807E-7
2 [(0/90)4]s 1.500 4.882E+3 4.977E+3 1.646E-7
2 1(0/90)41s 2.000 2.081E+3 2.098E+3 1.647E-7
3 [(0/90)4]s 5.000 1.113E+2 1.938E-7
4 [(+45/-45)4]s 0.500 2.598E+4 3.551E+4 6.952E-7
5 [(+45/-45)4]s 1.000 6.852E+3 7.374E+3 3.974E-7
6 [(+45/-45)4]s 1.500 2.484E+3 2.459E+3 3.767E-7
7 [(+45/-45)4]s 2.000 1.027E+3 1.038E+3 3.580E-7
8 [ (+45/-45) 4 1 5.000 6. 317E+2 I 3.471E-7
Kspur 1(0/90)41s M 2.548E+5 (I = 0.50")Kspur [(45/-45)4]s = 9.682E+4 (I = 0.50")
As can be seen from the figures, a aonlinear relationship between
1/Exb and (T/)2 existed for both laminate arrangements. This nonlinearity
seemed to imply a softening of the transverse shear modulus for shorter span
lengths. However; transverse shear stress as predicted by technical beam
theory is not a function of span length. Furthermore, since all measurements
for the various span lengths were taken at the same load level, similar
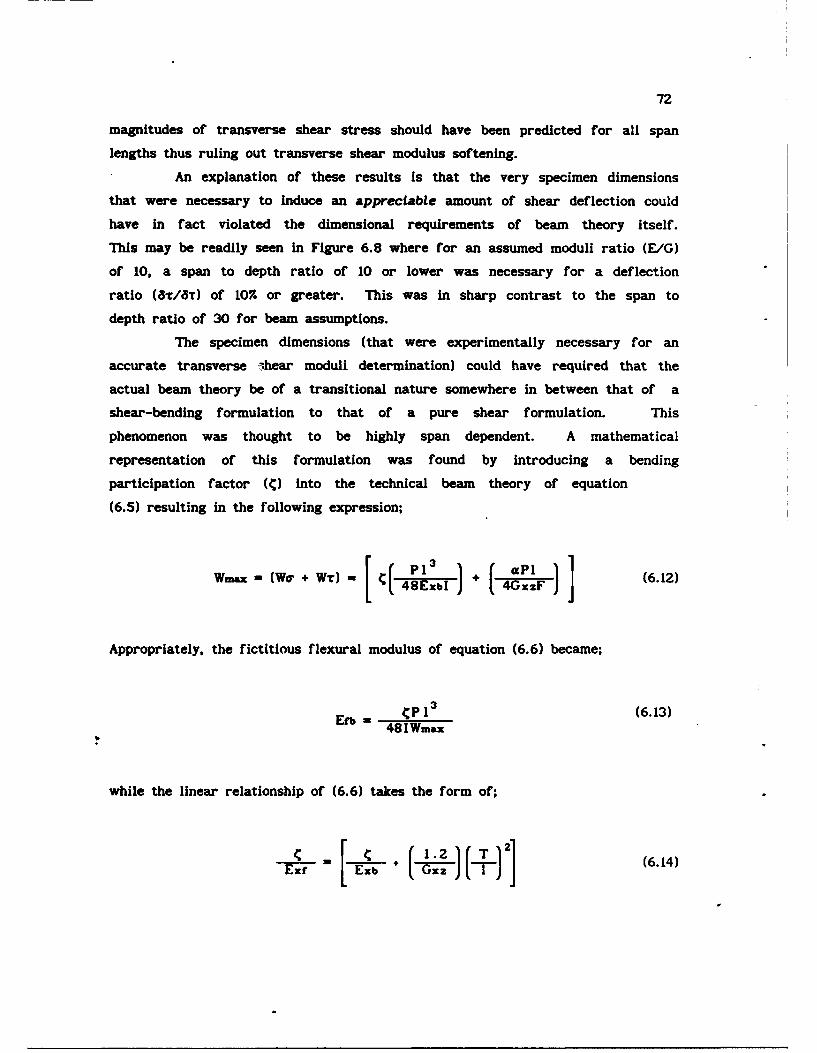
72
magnitudes of transverse shear stress should have been predicted for all span
lengths thus ruling out transverse shear modulus softening.
An explanation of these results is that the very specimen dimensions
that were necessary to Induce an appreciable amount of shear deflection could
have in fact violated the dimensional requirements of beam theory itself.
This may be readily seen in Figure 6.8 where for an assumed moduli ratio (E/G)
of 10, a span to depth ratio of 10 or lower was necessary for a deflection
ratio (a5r/aT) of 10% or greater. This was in sharp contrast to the span to
depth ratio of 30 for beam assumptions.
The specimen dimensions (that were experimentally necessary for an
accurate transverse 7hear moduli determination) could have required that the
actual beam theory be of a transitional nature somewhere in between that of a
shear-bending formulation to that of a pure shear formulation. This
phenomenon was thought to be highly span dependent. A mathematical
representation of this formulation was found by introducing a bending
participation factor (C) into the technical beam theory of equation
(6.5) resulting in the following expression;
+W - (p 3 M) , + P6.12)
Wiax o -= 48ExbI J+ -4GxzF (
Appropriately, the fictitious flexural modulus of equation (6.6) became;
Ef= CPI 3 (6.13)48 1Wmax
while the linear relationship of (6.6) takes the form of;
1x.f b (6.14)
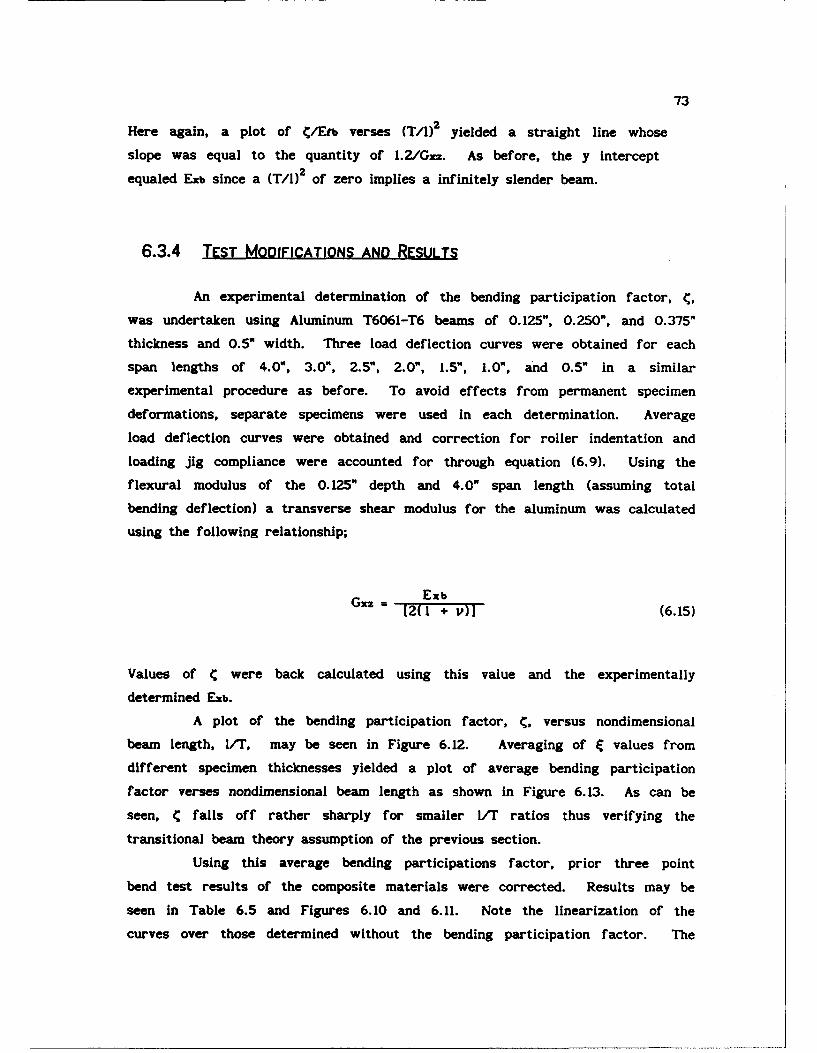
73
Here again, a plot of C/Efb verses (T/I)2 yielded a straight line whose
slope was equal to the quantity of 1.2/Gxz. As before, the y intercept
equaled Exb since a (T/l)2 of zero implies a infinitely slender beam.
6.3.4 TEST MODIFICATIONS AND RESULTS
An experimental determination of the bending participation factor, C,
was undertaken using Aluminum T6061-T6 beams of 0.125", 0.250", and 0.375"
thickness and 0.5" width. Three load deflection curves were obtained for each
span lengths of 4.0", 3.0", 2.5", 2.0", 1.5", 1.0", and 0.5" in a similar
experimental procedure as before. To avoid effects from permanent specimen
deformations, separate specimens were used in each determination. Average
load deflection curves were obtained and correction for roller indentation and
loading jig compliance were accounted for through equation (6.9). Using the
flexural modulus of the 0.125" depth and 4.0" span length (assuming total
bending deflection) a transverse shear modulus for the aluminum was calculated
using the following relationship;
GrZ Exb[2(1 + v)] (6.15)
Values of C were back calculated using this value and the experimentally
determined Exb.
A plot of the bending participation factor, C, versus nondimensional
beam length, l/T, may be seen in Figure 6.12. Averaging of C values from
different specimen thicknesses yielded a plot of average bending participation
factor verses nondimensional beam length as shown in Figure 6.13. As can be
seen, C falls off rather sharply for smaller I/T ratios thus verifying the
transitional beam theory assumption of the previous section.
Using this average bending participations factor, prior three point
bend test results of the composite materials were corrected. Results may be
seen in Table 6.5 and Figures 6.10 and 6.11. Note the linearization of the
curves over those determined without the bending participation factor. The
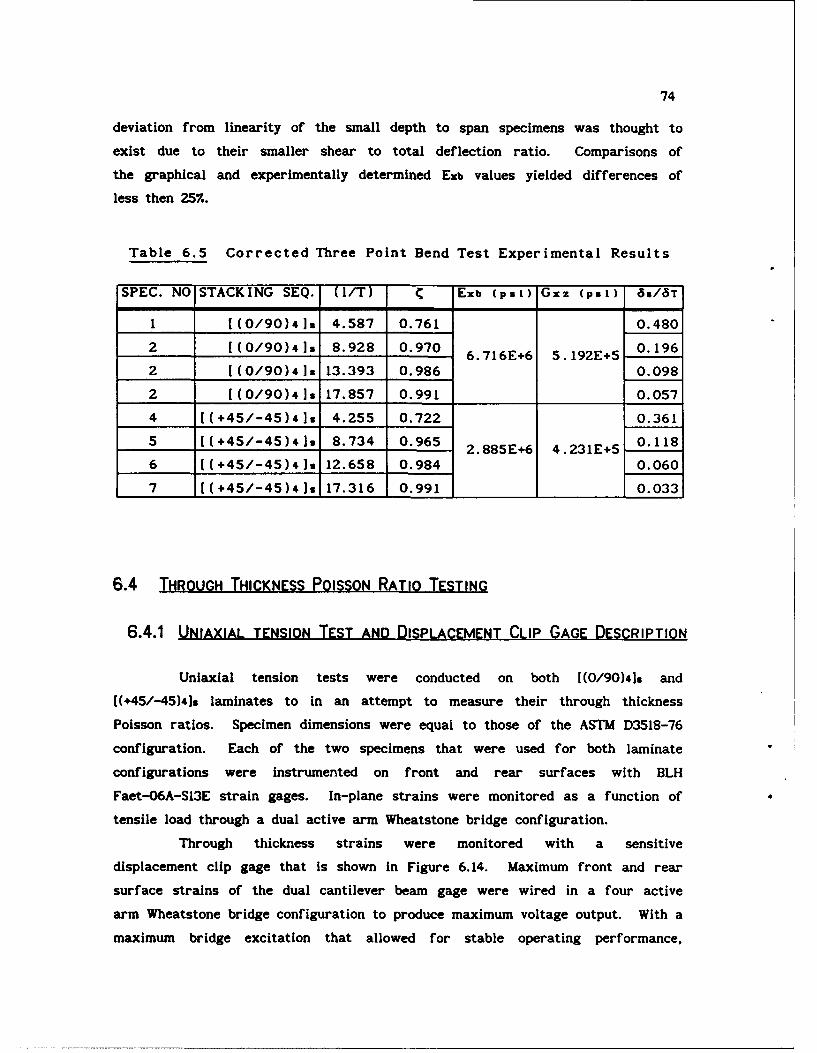
74
deviation from linearity of the small depth to span specimens was thought to
exist due to their smaller shear to total deflection ratio. Comparisons of
the graphical and experimentally determined Exb values yielded differences of
less then 25%.
Table 6.5 Corrected Three Point Bend Test Experimental Results
SPEC. NO STACKING SEQ. (I/T) C Exb (psi) Gxz (psi) a,/aT
1 1(0/90)419 4.587 0.761 0.480
2 1(0/90)4] 8.928 0.970 0.1966. 716E+6 5. 192E+5
2 [(0/90)4]s 13.393 0.986 0.098
2 [(0/90)419 17.857 0.991 0.057
4 [(+45/-45)41] 4.255 0.722 0.361
5 [(+45/-45)4]s 8.734 0.965 0.116 4.231E+5 0.1182. 88 5E6 4.315
6 [(+45/-45)4]s 12.658 0.984 0.060
7 1(+45/-45)4], 17.316 0.991 0.033
6.4 THROUGH THICKNESS POISSON RATIO TESTING
6.4.1 UNIAXIAL TENSION TEST AND DISPLACEMENT CLIP GAGE DESCRIPTION
Uniaxial tension tests were conducted on both [(0/90)41. and
[(+45/-45)4]s laminates to in an attempt to measure their through thickness
Poisson ratios. Specimen dimensions were equal to those of the ASTM D3518-76
configuration. Each of the two specimens that were used for both laminate
configurations were instrumented on front and rear surfaces with BLH
Faet-06A-SI3E strain gages. In-plane strains were monitored as a function of
tensile load through a dual active arm Wheatstone bridge configuration.
Through thickness strains were monitored with a sensitive
displacement clip gage that is shown in Figure 6.14. Maximum front and rear
surface strains of the dual cantilever beam gage were wired in a four active
arm Wheatstone bridge configuration to produce maximum voltage output. With a
maximum bridge excitation that allowed for stable operating performance,
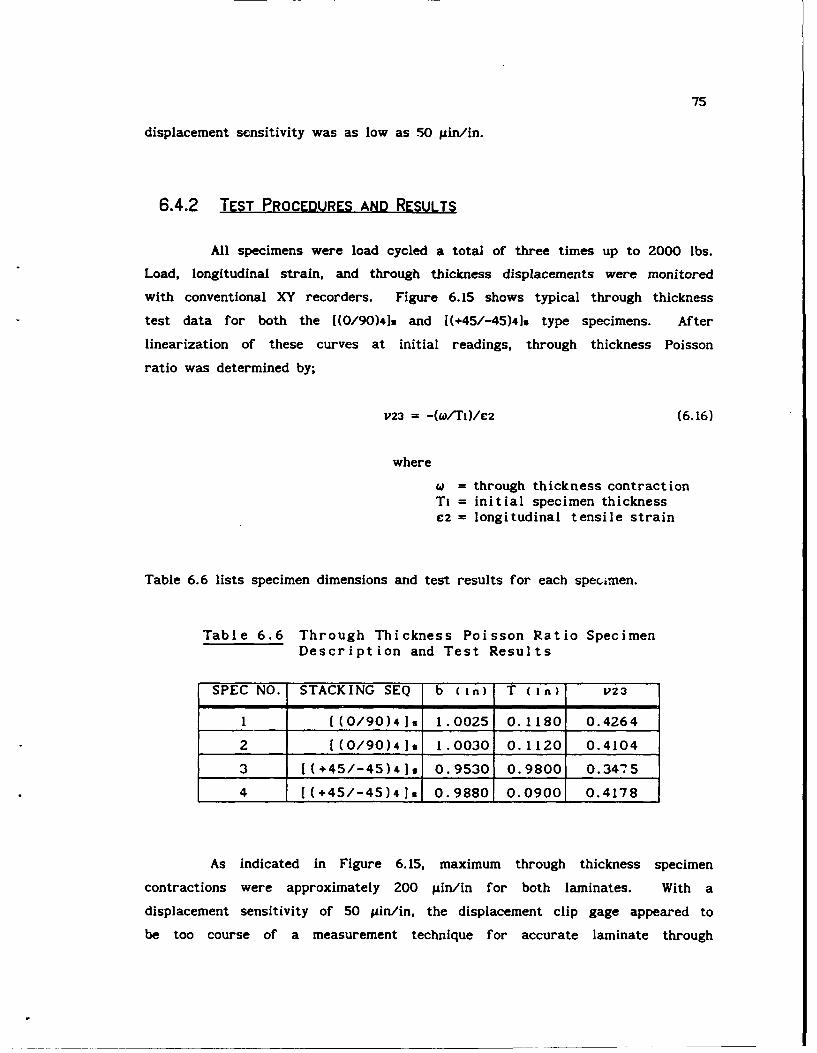
75
displacement sensitivity was as low as .50 gin/in.
6.4.2 TEST PROCEDURES AND RESULTS
All specimens were load cycled a total of three times up to 2000 lbs.
Load, longitudinal strain, and through thickness displacements were monitored
with conventional XY recorders. Figure 6.15 shows typical through thickness
test data for both the [(0/90)4]. and [(+45/-45)4]. type specimens. After
linearization of these curves at initial readings, through thickness Poisson
ratio was determined by;
V23 = -(w/TI)/C2 (6.16)
where
= through thickness contractionTi = initial specimen thicknessC2 = longitudinal tensile strain
Table 6.6 lists specimen dimensions and test results for each specimen.
Table 6.6 Through Thickness Poisson Ratio SpecimenDescription and Test Results
SPEC NO. STACKING SEQ b (In) T (In) V23
1 [(0/90)4]s 1.0025 0.1180 0.4264
2 [(0/90)4]s 1.0030 0.1120 0.4104
3 [(+45/-45)4]s 0.9530 0.9800 0.3475
4 [(+45/-45)4121 0.9880 0.0900 0.4178
As indicated in Figure 6.15, maximum through thickness specimen
contractions were approximately 200 gin/in for both laminates. With a
displacement sensitivity of 50 gin/in, the displacement clip gage appeared to
be too course of a measurement technique for accurate laminate through
76
thickness Poisson ratio determinations. The experimental values obtained were
thus used as best estimates.
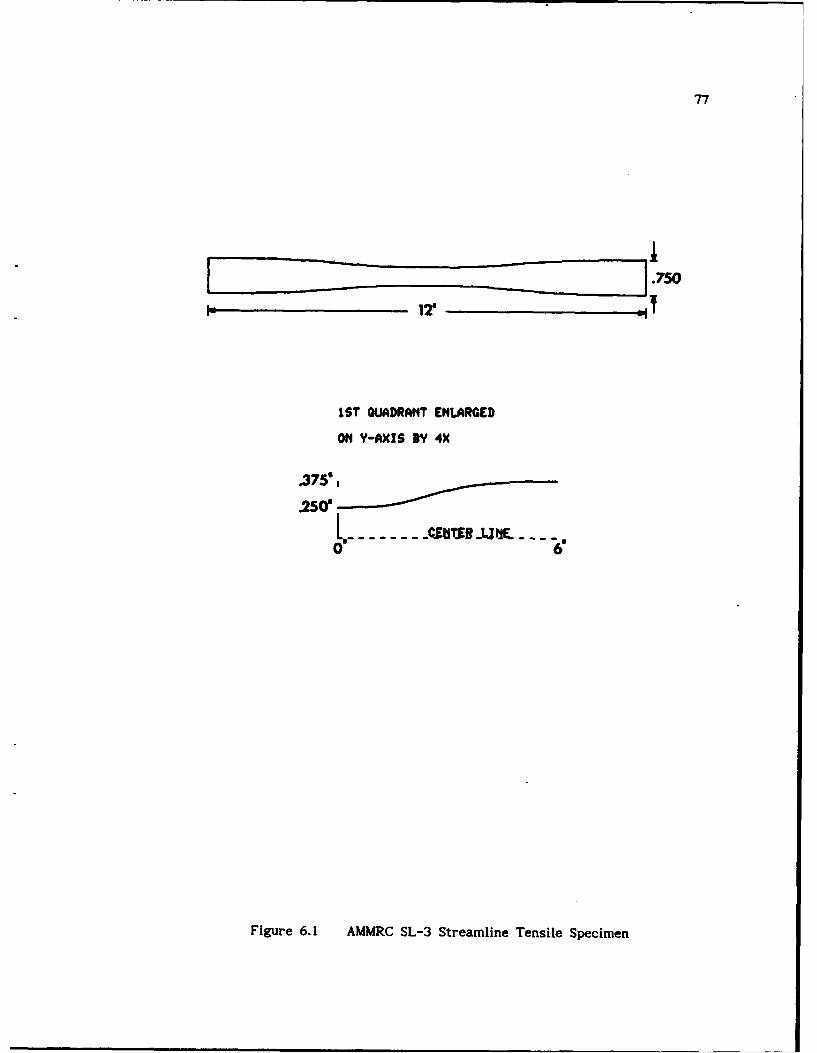
77
.750
12 @if
1ST QUADRANT ENLARGED
ON Y-AXIS BV 4X
.375*
250 0 s- - - - U B j fL - -
Figure 6.1 AMMRC SL-3 Streamline Tensile Specimen
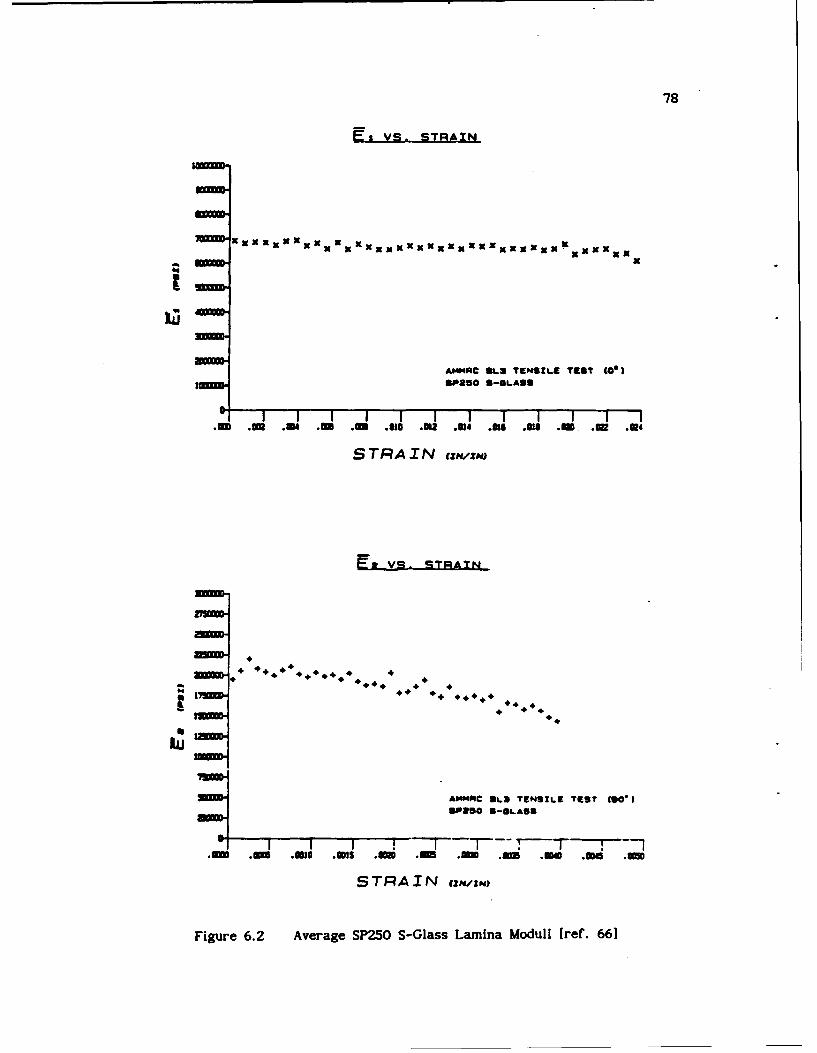
78
E, yr.. STRAIN
Imm
ammm- AMNAC 8L3 TENSILE TEST C01
5PRG0 S-GLASS
A m OR W . .m Nomn W 4 .06 .6n .00 M. a
STRAIN tzt4Uo
E&_vs- sTRAxN
zmm
ZROC5L ENIL ES (0
3M=D * 4 #*
908S0 5-SLASS
Figure 6.2 Average SP250 S-Glass Lamina Moduli [ref. 66]
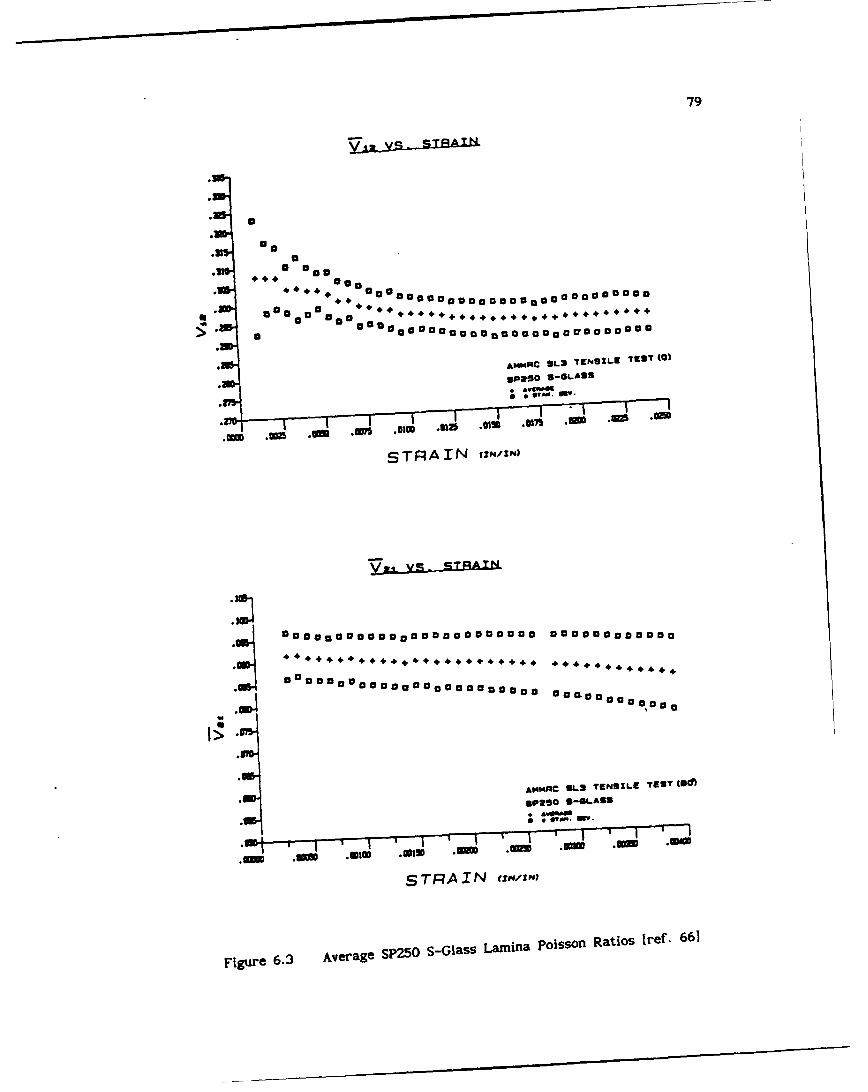
79
.hI
AMMAC SLS TENSILE TIEST (0)
SP26O S-GLASS
STRAIN hSTAN.
STRAINaRAI
j00000000000000000sa0a 000000000000
A$M0RC ULS TENSILE TEST (8d0
gp2SO S-GLASS
S TRA IN rxilim"
Figure 6.3 Average Sp25O S-Glass Lamina PoissOn Ratios tref. 661
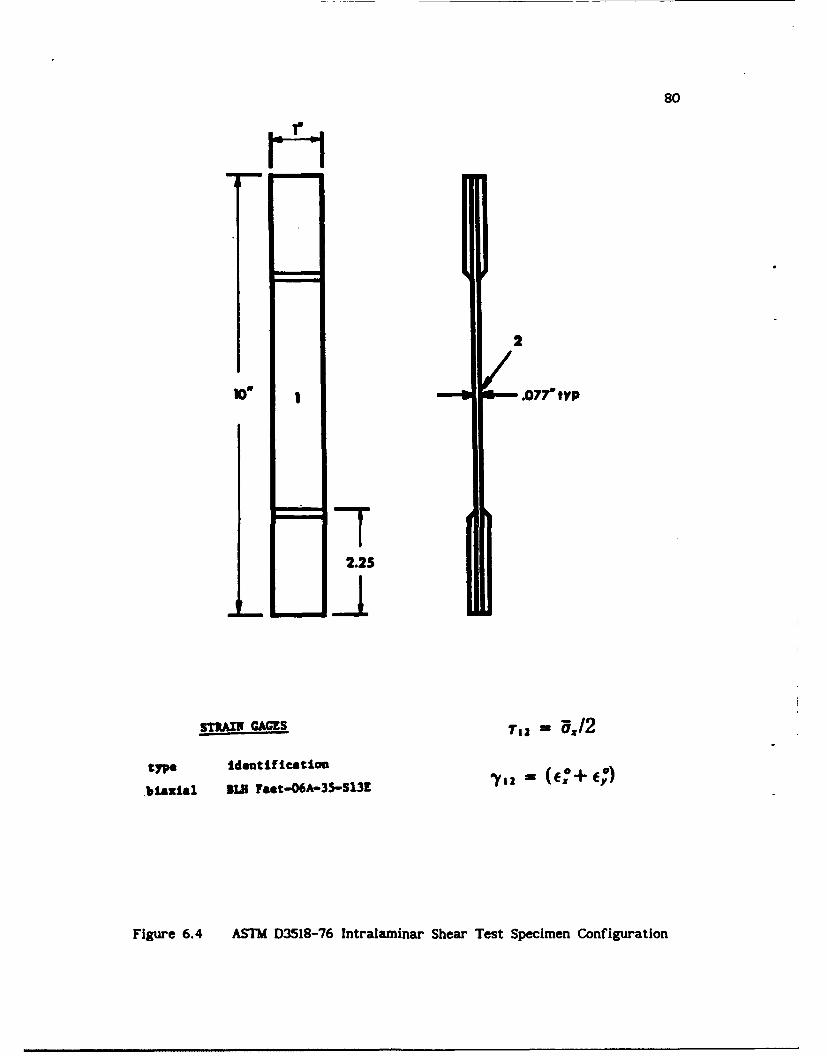
80
2
ow .077" typ
--72.25
STpIN CAGES T1 1 a./2
type identification (.0+.biaxial EsK rat-06A-35-13E 'V - ()
Figure 6.4 ASTM D3518-76 Intralaminar Shear Test Specimen Configuration
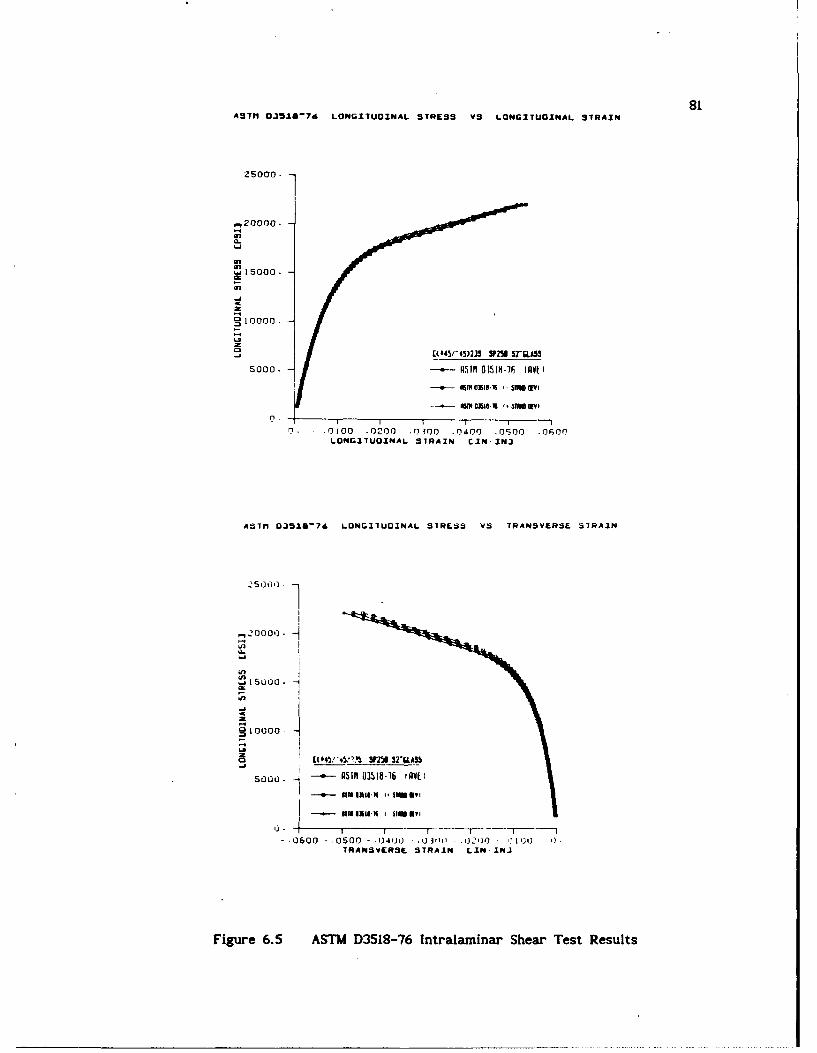
81ASTM 03518-76 LONGITUOZNAL STRESS VS LONG'TUOZNAL STRAIN
25000.
20000
W3a-
W.i15000.
O 100001
2r t 4/4)2JS I25 IrGLAS
n. -IOl .0 00 .0300 .0400 -0500 .0Fo0r
LONG1"TUOXNAL STRAIN CIN,'INJ
A~1ri 0". Sa-76 LO.Z,1UOI NAL STRL.:5 V5 1RAN5VE R"E 1R7A. N5000.•
SuuO
I 0000.
0 . ll lS4l -'lli l I
S0600 - 0500 -00 .030 -0400 - 00 .TRANSVEIRSE. STRAIN IN- INJ
Figure 6.5 ASTN D3518-76 Intrala inar Shear Test Results
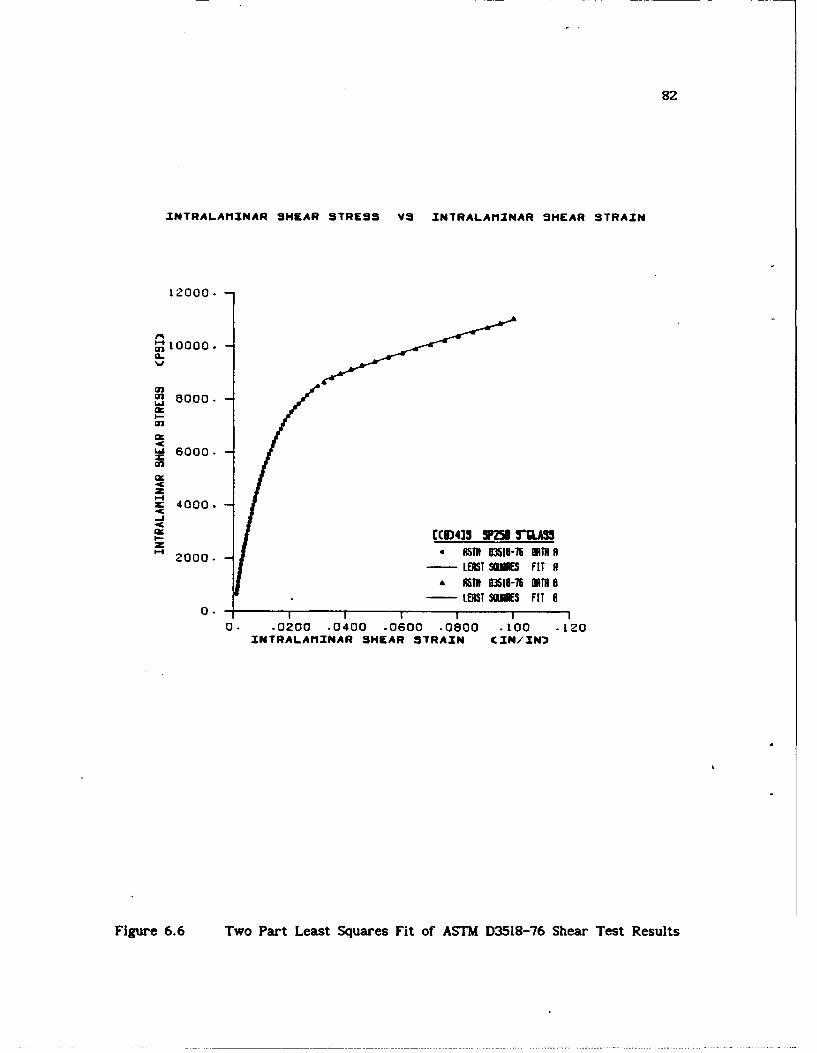
82
INTRALAIIINAR SHEAR STRESS VS INTRALAVIINAR SHEAR STRAIN
12000.
"10000.
5000
W6000.
cz
4000.
CUD433 WM5 MIASS
2000. 05I 03518-75 ORIN
- LEN T SME5 FIT 0
0 .- - - - -T - -0. -0200 .0400 .0600 .0800 .100 .120
INTRALAIIINAR SHEAR STRAIN CIN/IN)
Figure 6.6 Two Part Least Squares Fit of ASTM D3518-76 Shear Test Results
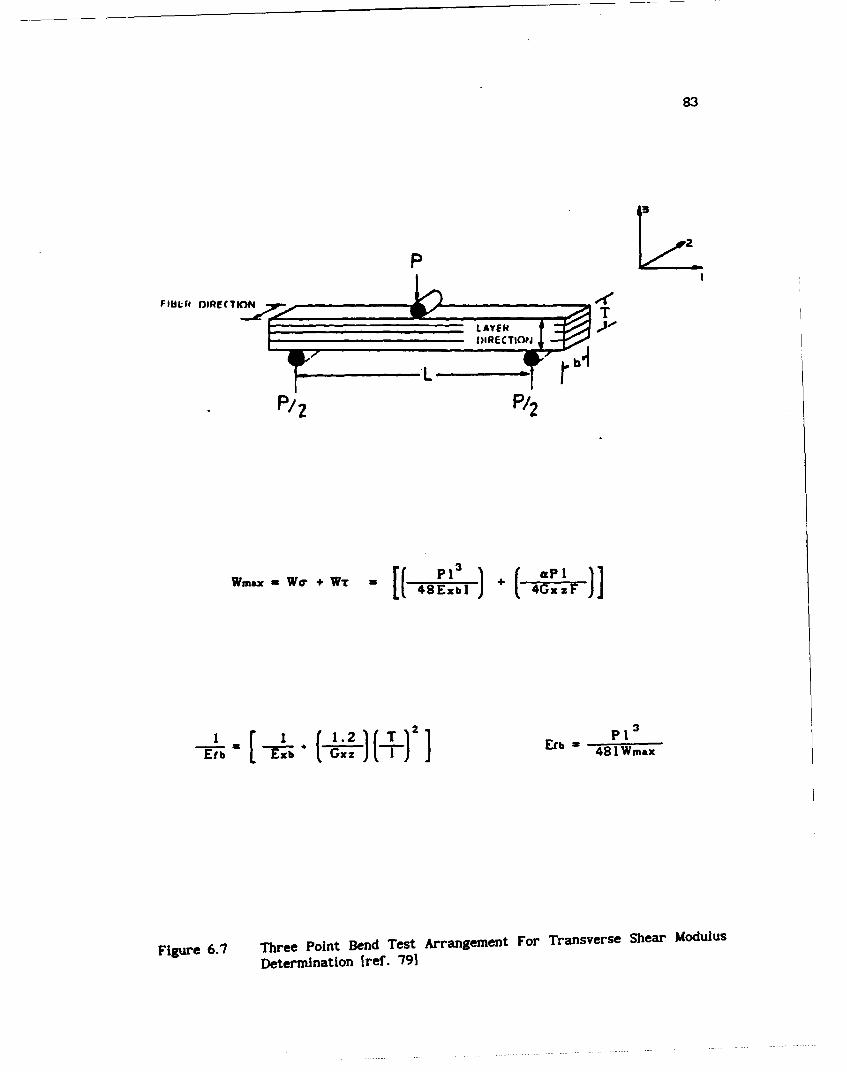
83
FILT DIRECTIONT
P/2z P/2
Wmax - Wo + WT = 4 3)xbI 4GxzF
1, (..L34( T 1Efb 48 maEfb LEb I Gxz H, 1 ra
Figure 6.7 Three Point Bend Test Arrangement For Transverse Shear Modulus
Determination [ref. 791
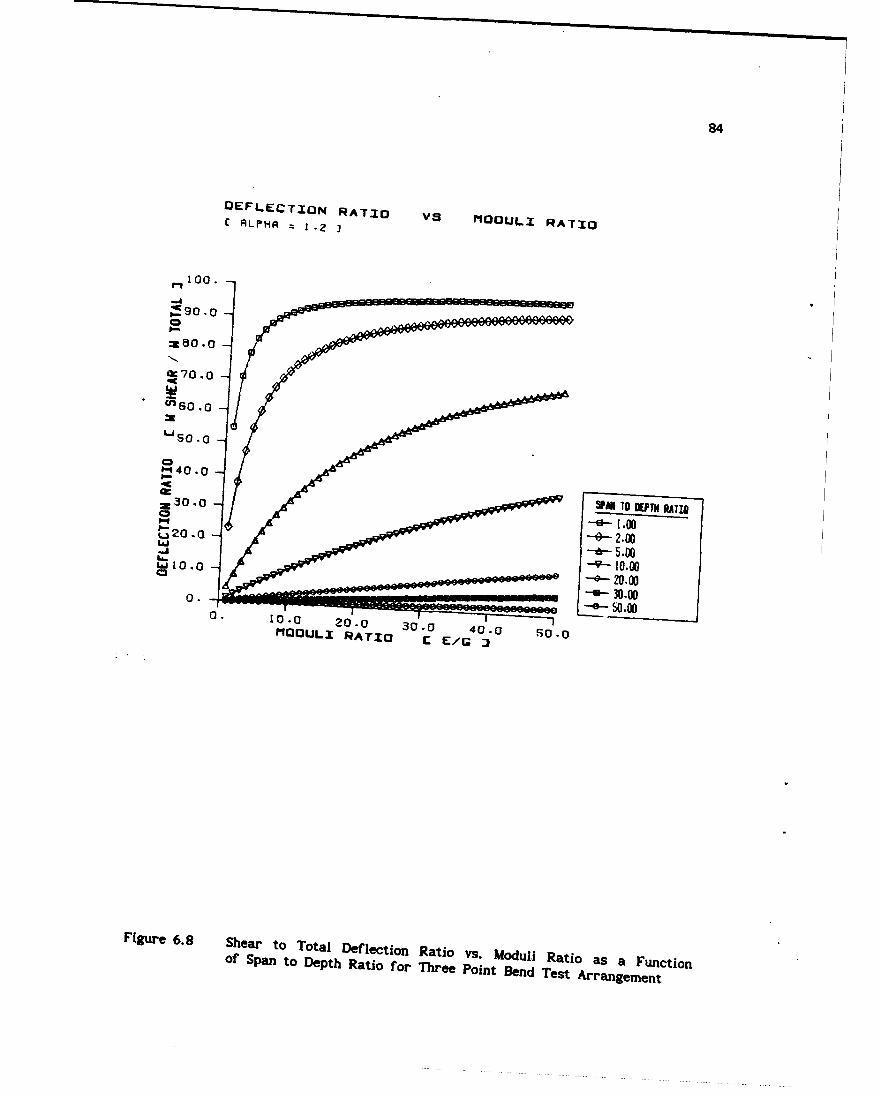
84
DEFL.ECTION RATIO vs MODULI RATIOI ALPHR
00.
-
AC
=30-0SPA TO KFW RATO
Li.
0-La 10.0
19- L90. 0
0. C)~ 20.o 30-0 40.0 50.0MODULI RATIO C E/r .
Figure 6. 8 Shear to Total Deflection Ratio vs. Modul-i Ratio as a FunctionOf Span to Depth Ratio for Three Point Bend Test Arrangement
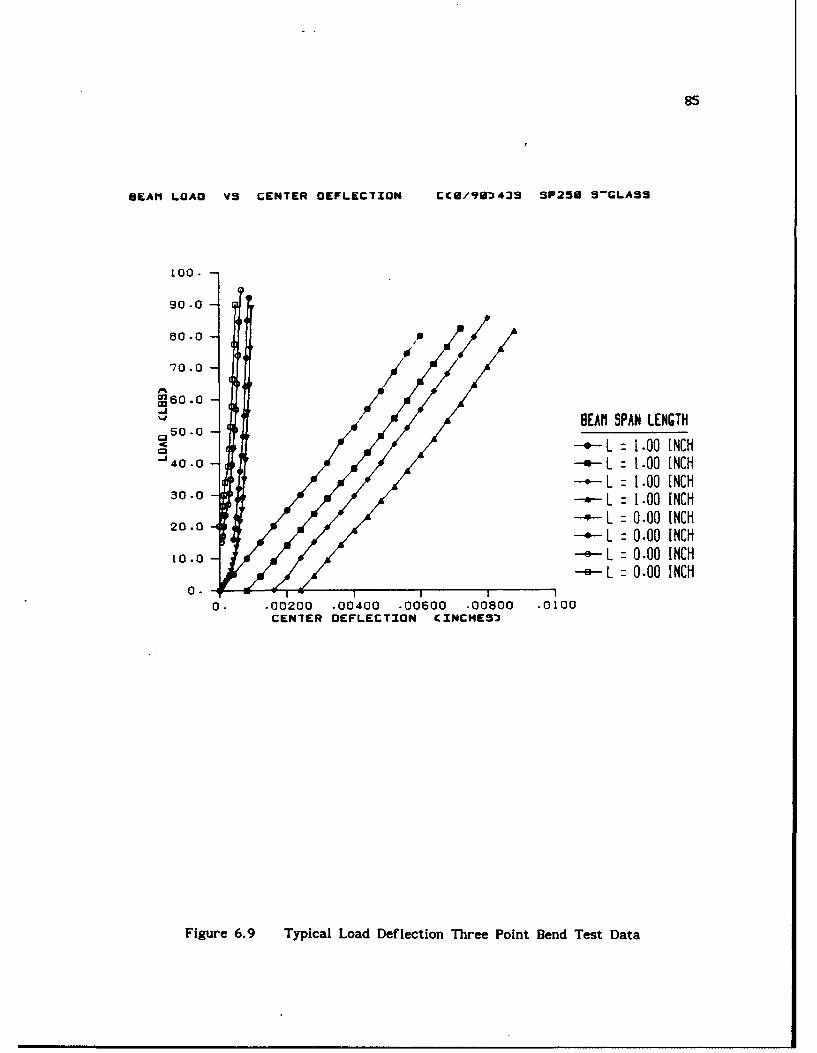
85
BEAM' LOAD VS CENTER DEFLECTION CCO/96U)4"S 5P250 S-GLASS
100. -
90.0 -
80.0 -
70.0 -
960.0 -
.0 - BEAl SPAN LENGTH,50 .0-
L: 1.00 INCH40.0 --- L 1.00 [NCH
L = 1.00 INCH30.0 : L1.00 INCH
20.0 L : 0.00 INCHL = 0.00 INCH
10.0 -L 0.00 INCH-e-L = 0.00 INCH
0.0. .00200 .00400 .00600 .00800 .0100
CENTER DEFLECTION CINCHES'
Figure 6.9 Typical Load Deflection Three Point Bend Test Data
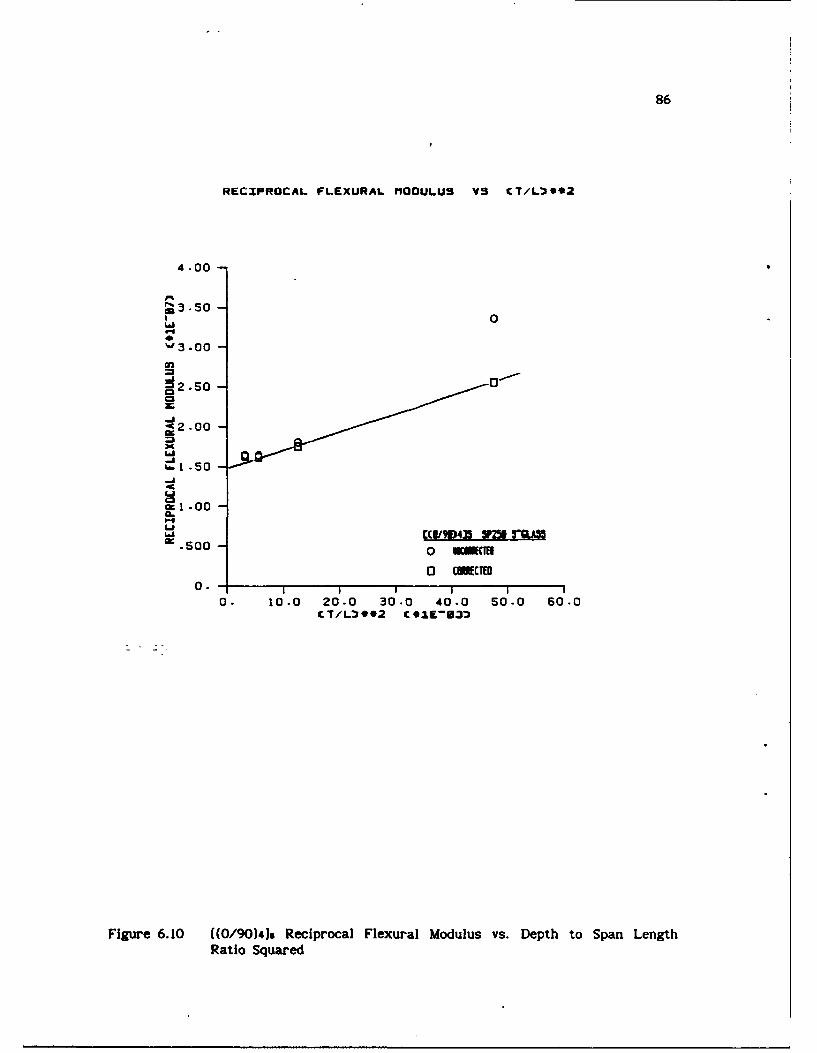
86
RECIPROCAL FLEXURAL. MOOULUS VS CT/L09*2
4.00 -
'3.50 -0
%.00
-j
cI .00
a .500 - 0
0 CWECTO0 . 1 i I I
0. 10.0 20.0 30.0 40.0 50.0 6 .0C1/L t*2 c ei..-U3
Figure 6.10 [(0/90)419 Reciprocal Flexural Modulus vs. Depth to Span LengthRatio Squared
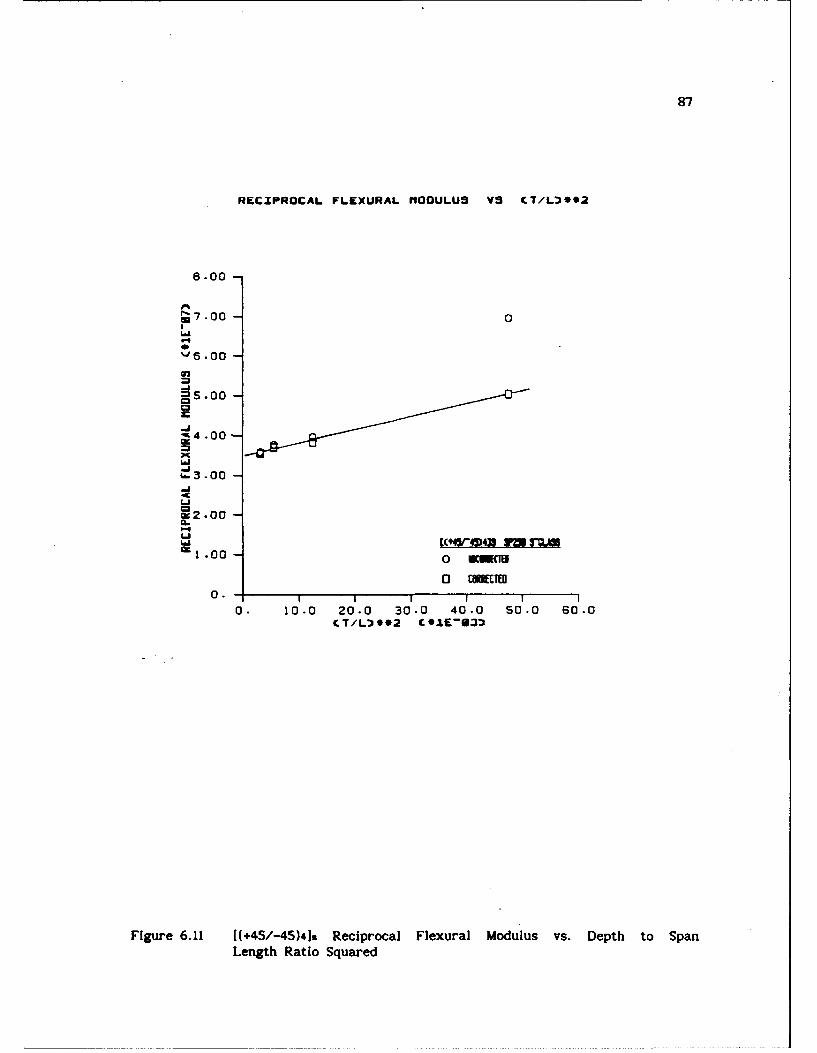
87
RECIPROCAL FLEXURAL MIODULUS VS CT/L3*92
8.00
7 .00 -0
- .00
5-00
M4.00
.300
-j
Li00
U('4904 TO TUM.00 -0 mcUiII
0 CMETED0. 1 1 1
0. 10.0 20.0 30.0 40.0 50.0 60.0CT/L"J*02 C91EU633
Figure 6. 11 [(+45/-45)4]s Reciprocal Flexural Modulus vs. Depth to SpanLength Ratio Squared
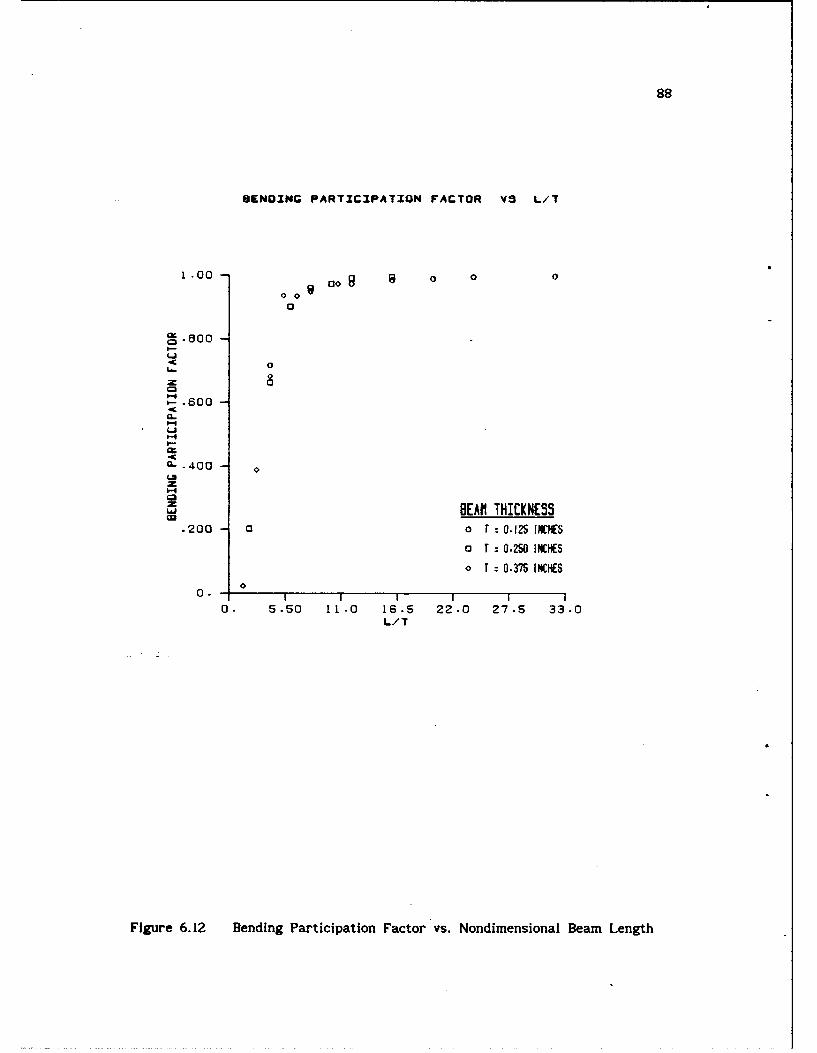
88
ENOING PARTICIPATION FACTOR VS L/T
I-00 - 8 3 o
ay .800 -ic-I
K0z- 8I-.
6-.00
b-i
a..400
,.00 BEAR THICKNESS200 -o r = 0.125 INCHES
a T = 0.250 INCHES
o T = 0.375 INCHES
0.0 . I I I I I
0. 5.50 11.0 16.5 22.0 27.5 33.0
Figure 6.12 Bending Participation Factor vs. Nondimensional Beam Length
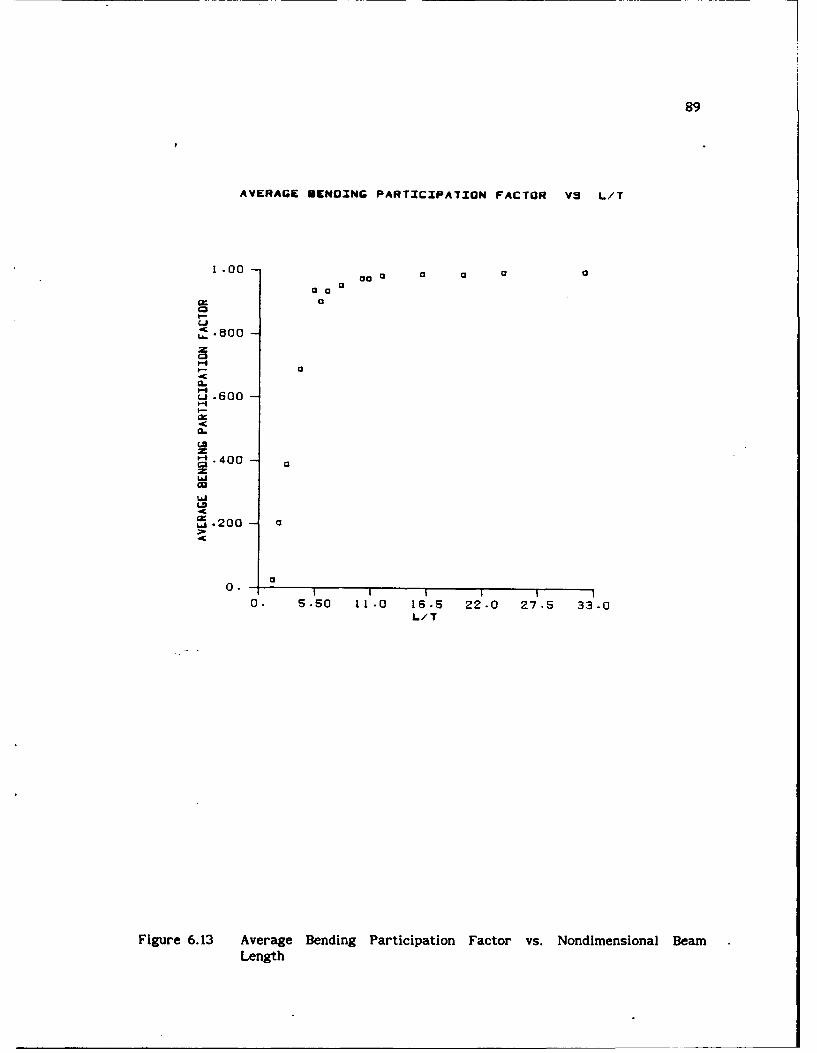
89
AVERAGE BENDING PARTICIPATION FACTOR VS L/T
1 .00 000 0a
.00 -8- 0 o
. .00-
00
LS/
"a
L_
• 200 --
0.-I I I II0. 5.50 11 .0 16.5 22.0 27.5 33.0
L/T
Figure 6.13 Average Bending Participation Factor vs. Nondimensional BeamLength
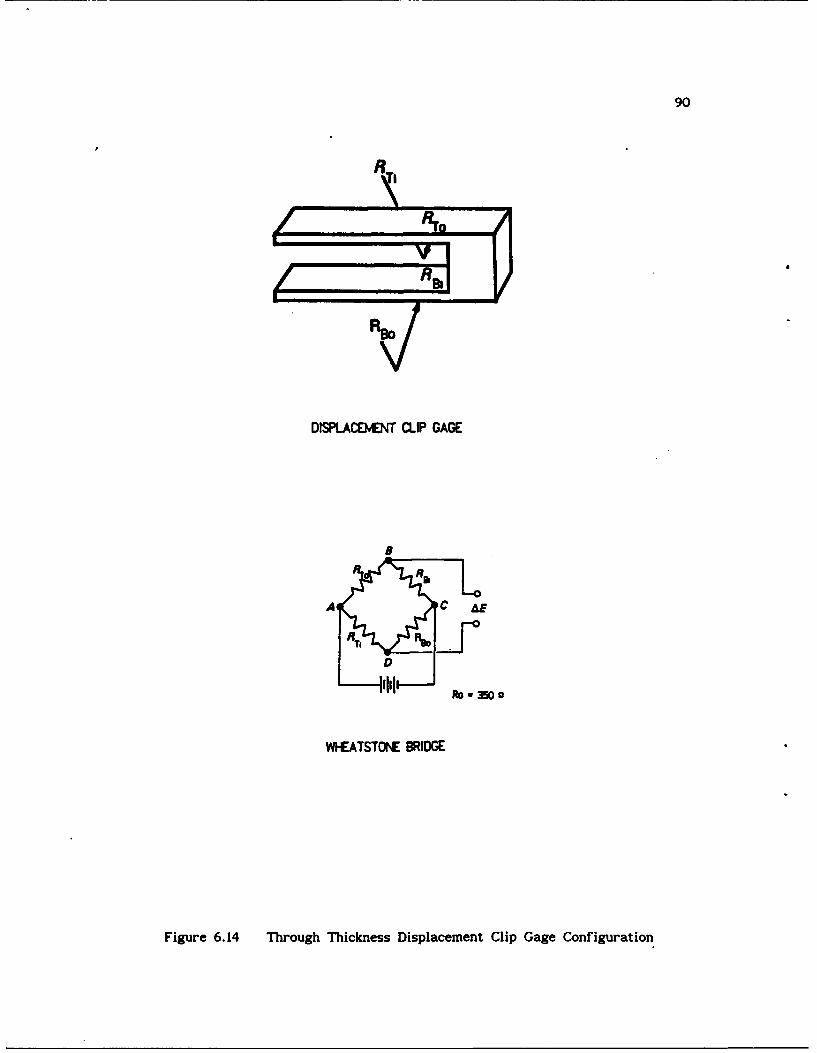
90
A
DISPLACEDENT CLIP GAGE
A C E
D
WHEATSTONE BRIDGE
Figure 6.14 Through Thickness Displacement Clip Gage Configuration

91
LONGITUDINAL LOAD V'S THROUGH THICKNESS CONTRACTION
2000.
1800.
1600.
1400. -
Z1200. -
< 1000
= 800. -pI
.Z -e- [(0/901415 TRIl al600.
-*B0- ((0/90141S TRIL *2400. -- -- [(0/90141S TRIlL .3
[ ,((45/- 4s 5 IN. M l200. - [1I45/-41415 1313. M 2
-8- [t4/-151415 tRIl. 30- I
0. .000500 .00100 .00150 .00200THROUGH THICKNESS CONTRACTION CINCHESP
Figure 6.15 Longitudinal Load vs Through Thickness Contraction for[(0/90)4]. and [(+45/-45)4]s laminate Configurations
92
CHAPTER 7. THREE DIMENSIONAL CONSTITUTIVE EQUATION MODELING
The three dimensional constitutive equations for the [(0/90)3,018
laminate were derived by using effective two dimensional laminate mechanical
properties from the lamina/laminate mechanical property data base. Three
dimensional orthotropic stress strain laws were then used in conjunction with
these effective mechanical properties. Intralaminar shear nonlinearity was
accounted for by using the results fron, the ASTM D33518-76 test results.
The [(+45/-45)31. laminate constitutive equations were generated by
appropriate material axes transformations of [(0/90)3]s three dimensional
constitutive equations. The laminate's constitutive equation constants were
expressed as a function of trigonometric expressions and [(0/90)315
constitutive equation constants.
The constitutive equation were verified by uniaxial laminate tension
tests. The experimental stress and strain states of the laminates were
compared to those predicted by constitutive equations. The effect of
nonlinear crossply intralaminar shear behavior upon [(+45/-45)4]. modeling
accuracy was determined. Sensitivity analyses of [(0/90)4]s E3 and P23
through thickness properties and ((0/90)41. E2 and vzt in-plane properties
were conducted to assess their effects on unlaxial stress state prediction.
7.1 EFFECTIVE TWO DIMENSIONAL LAMINATE MECHANICAL PROPERTIES
Effective laminate mechanical properties for [(0/90)3,01.,
1(0/90)3]., and [(+45/-45)31. stacking sequences were found from the average
lamina mechanical properties of Table 6.1 using the two dimensional
orthotropic constitutive equations of classical laminate plate theory6 .
For plane stress conditions, the stress-strain relations of a lamina
of arbitrary orientation within a laminated p!ate as shown in Figure 7.1 were
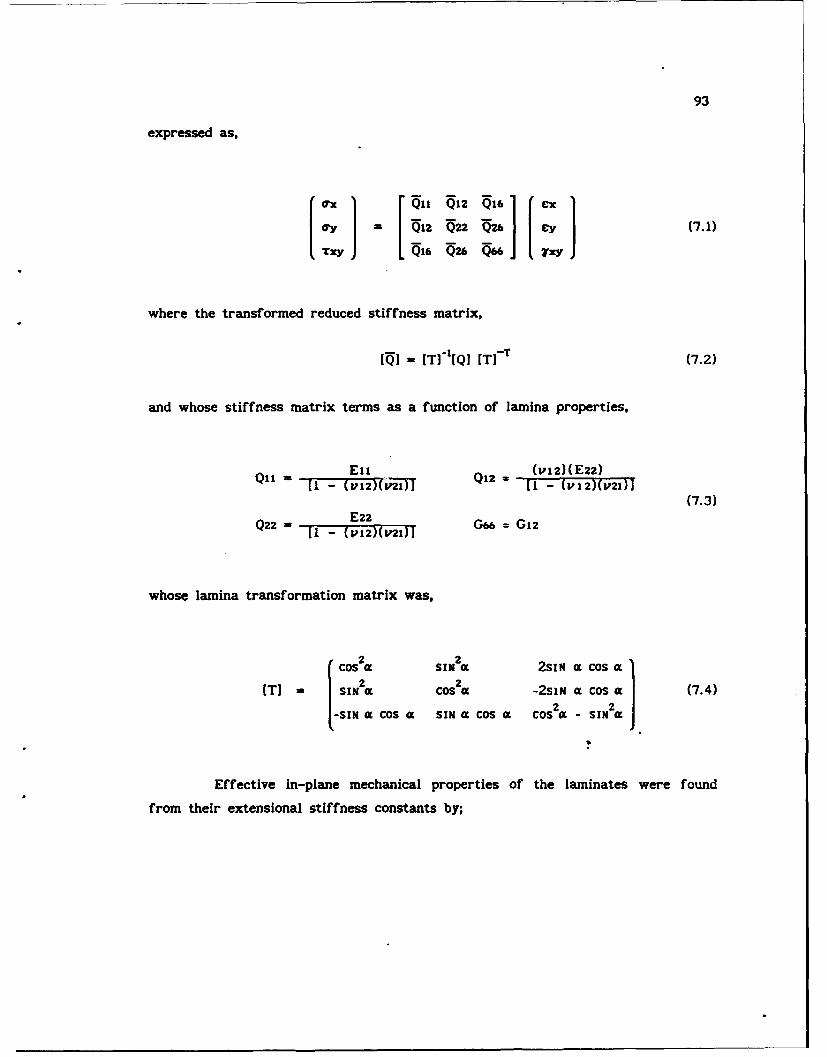
93
expressed as,
Ciz j51 52 i516 (7.1{y 51 i520 056 CyiTy] i[16 Q26 i66
where the transformed reduced stiffness matrix,
[5 = [T]-[QJ [T]- T (7.2)
and whose stiffness matrix terms as a function of lamina properties,
oil = [ E - (vi2)(l Qz [1 - (vi2)(vE2)
(7.3)E22
Q22 = -[I - (vi2)(mV2)] = Gi2
whose lamina transformation matrix was,
Cosa sINa 2si, a cosa
[T] = SIN2 a COS 2a -2sIN a cos a (7.4)
-SIN a COS a SIN a COS £ COS20 - SIN2£t
Effective in-plane mechanical properties of the laminates were found
from their extensional stiffness constants by;
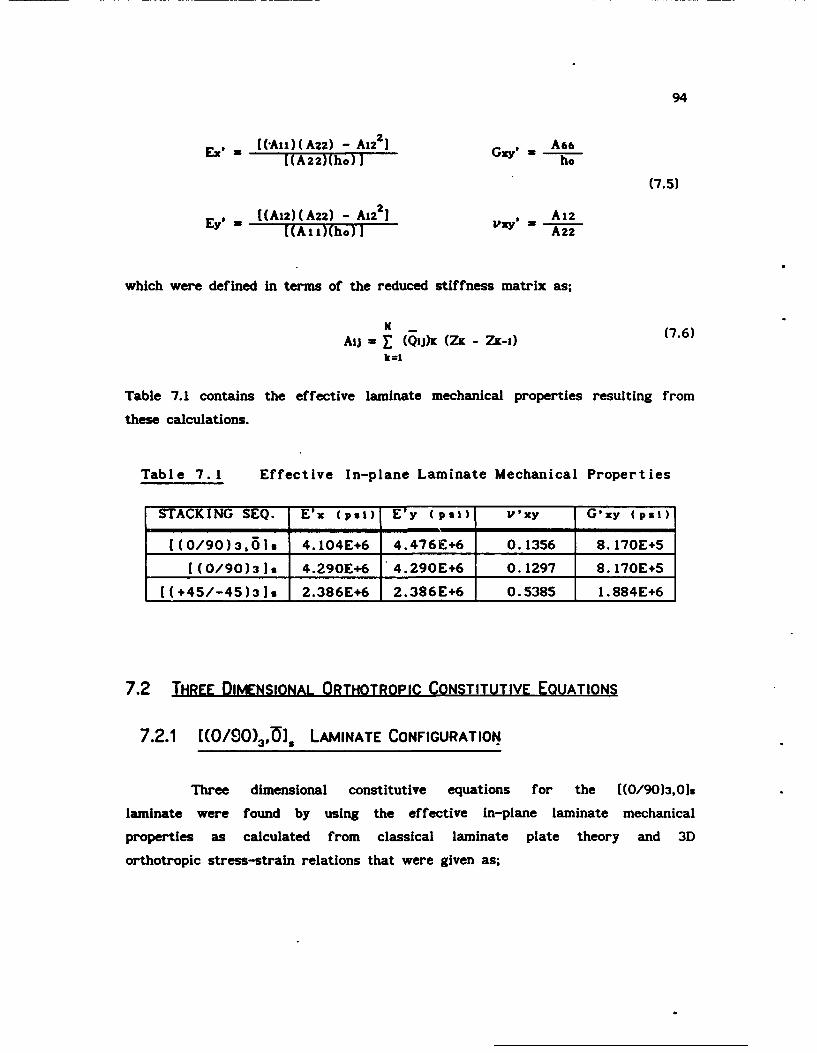
94
-xp W [(AIi)(A22) - A12 2 Gy' A66
[(Azz)(ho)! ho
(7.5)
Ey [ A (A12)(A22) - A1z2 ] A12[(A1i)(ho) A22
which were defined in terms of the reduced stiffness matrix as;
N (76
Aui r (QJ)K (ZK - ZK-i) (7.6)k=1
Table 7.1 contains the effective laminate mechanical properties resulting from
these calculations.
Table 7.1 Effective In-plane Laminate Mechanical Properties
STACKING SEQ. E'x (psi) E'y (psi) V'xy G'xy (psi)
1(0/90)3,6]s 4.104E+6 4.476E+6 0.1356 8. 170E+5
1(0/90)3]s 4.290E+6 4.290E+6 0.1297 8. 170E+5
[(+45/-45)3s 1 2.386E+6 2.386E+6 0.5385 1.884E+6
7.2 THREE DIMENSIONAL ORTHOTROPIC CONSTITUTIVE EQUATIONS
7.2.1 [(0/90)3,u], LAMINATE CONFIGURATION
Three dimensional constitutive equations for the [(0/90)3,012
laminate were found by using the effective in-plane laminate mechanical
properties as calculated from classical laminate plate theory and 3D
orthotropic stress-strain relations that were given as;
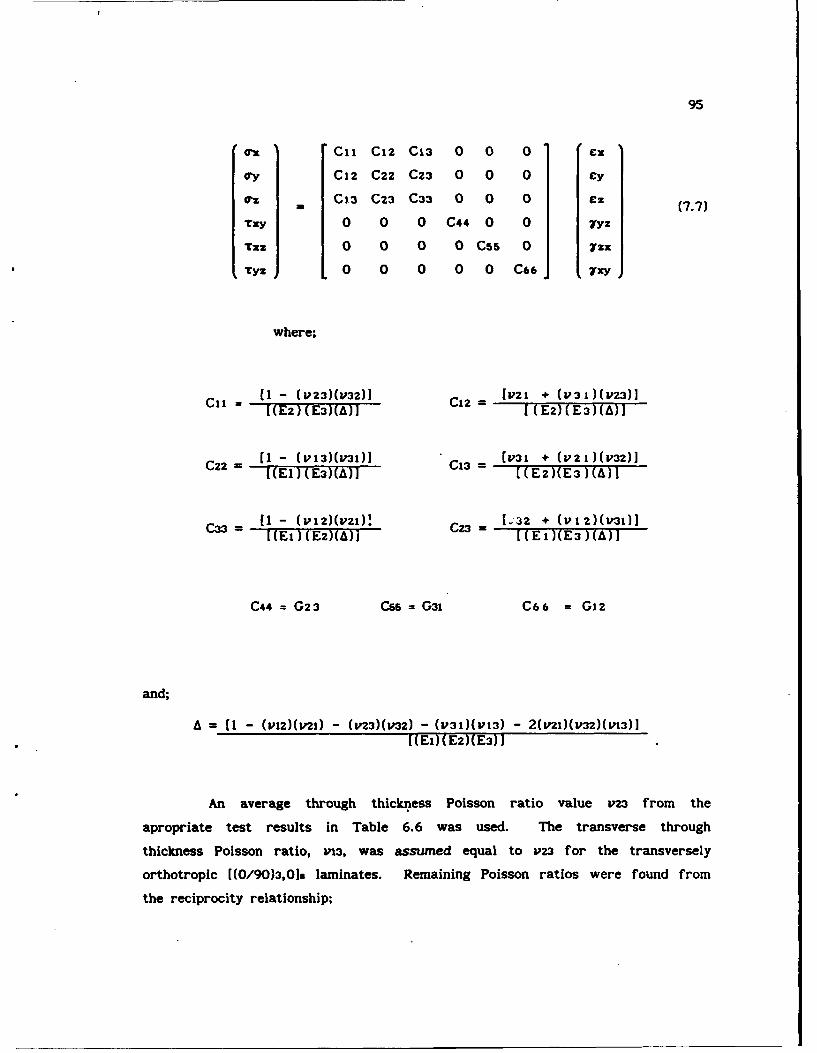
95
Ci CIZ C13 0 0 0 ex
o'y C12 C22 C23 0 0 0 Cy
o-z C13 C23 C33 0 0 0 Cz
TKy 0 0 0 C44 0 0 7yz
Txz 0 0 0 0 C55 0 7zx
Tyz 0 0 0 0 0 C66 7xy
where;
Cii - (1 - (Vz3)(V32)] C12 = [z1 + (V31)( V23)][(EZ)(E3)(A)] [ (EZ)(E3) (A)]
C = ( - (v13)(v31)] C13 = [V31 + (v2,)(V32)][(EI ) (E3)(A)] [ (EZ)(E3 ) (A) ]
C3 = [I - (V,2)(v21) = 1.-3 + (v1z)(v3)[(Ei ) (Ez)(A)j [ (E1)(E3) (A)]
C44 = G23 C55 = G31 C66 = G12
and;
A = [1 - (v12)(v21) - (t,23)(V32) - (v31)(v13) - 2(,21)(v32)(v13)]
[(Ei)(E2)(E3)]
An average through thickness Poisson ratio value z3 from the
apropriate test results in Table 6.6 was used. The transverse through
thickness Poisson ratio, V13, was assumed equal to Y23 for the transversely
orthotropic ((0/90)3,0], laminates. Remaining Poisson ratios were found from
the reciprocity relationship;
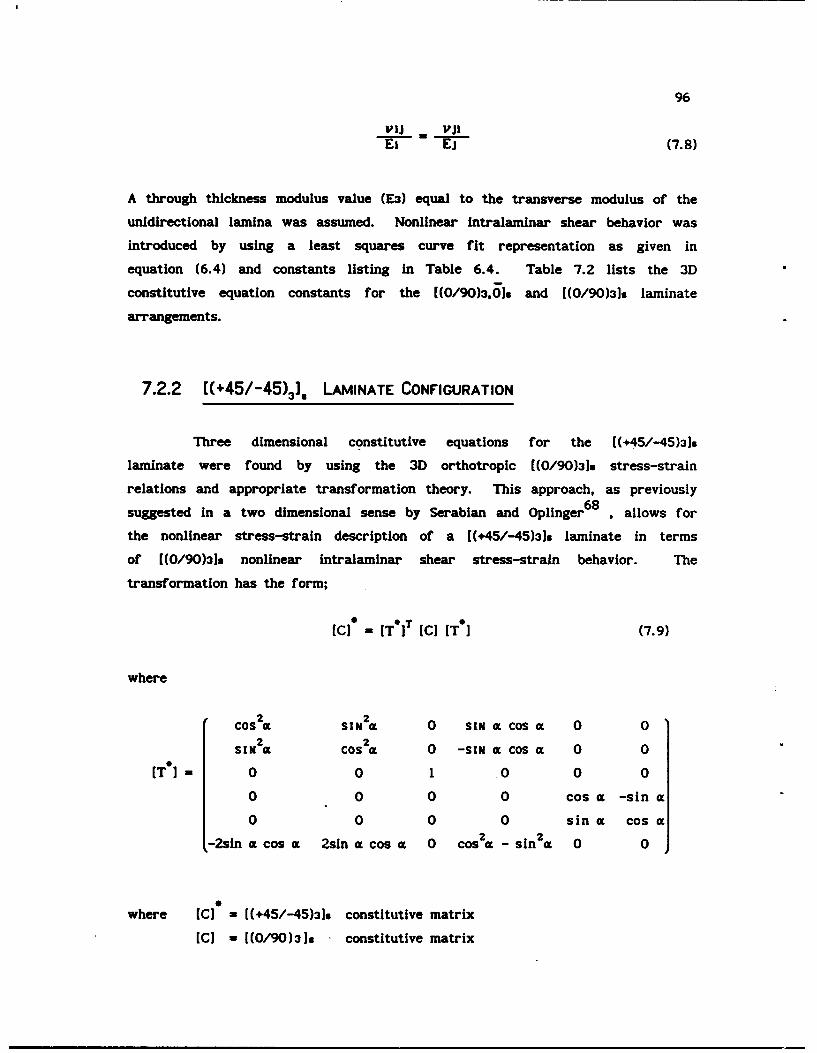
96
IIJ Iji
Ei (7.8)
A through thickness modulus value (E) equal to the transverse modulus of the
unidirectional lamina was assumed. Nonlinear Intralaminar shear behavior was
introduced by using a least squares curve fit representation as given in
equation (6.4) and constants listing in Table 6.4. Table 7.2 lists the 3D
constitutive equation constants for the [(0/90)3,01. and [(0/90)31. laminate
arrangements.
7.2.2 [(+45/-45)3] , LAMINATE CONFIGURATION
Three dimensional constitutive equations for the [(+45/-45)3].
laminate were found by using the 3D orthotropic [(0/90)31. stress-strain
relations and appropriate transformation theory. This approach, as previously68suggested in a two dimensional sense by Serabian and Oplinger , allows for
the nonlinear stress-strain description of a [(+45/-45)3]. laminate in terms
of [(0/90)31. nonlinear intralaminar shear stress-strain behavior. The
transformation has the form;
[CI - [TI]T [C) [T*] (7.9)
where
22
COs a SiN2t 0 sixa Cos a 0 0
SIN a Cos 2 0 -SiN a COsa 0 0
[T*] 0 0 1 0 0 0
0 0 0 0 cos a -sin a
0 0 0 0 sin a cosa
-2sin a cos a 2sin a cos a 0 cosa - sin2a 0 0
0
where (C] = [(+45/-45)3]9 constitutive matrix
[C) - 1(0/90)319 - constitutive matrix
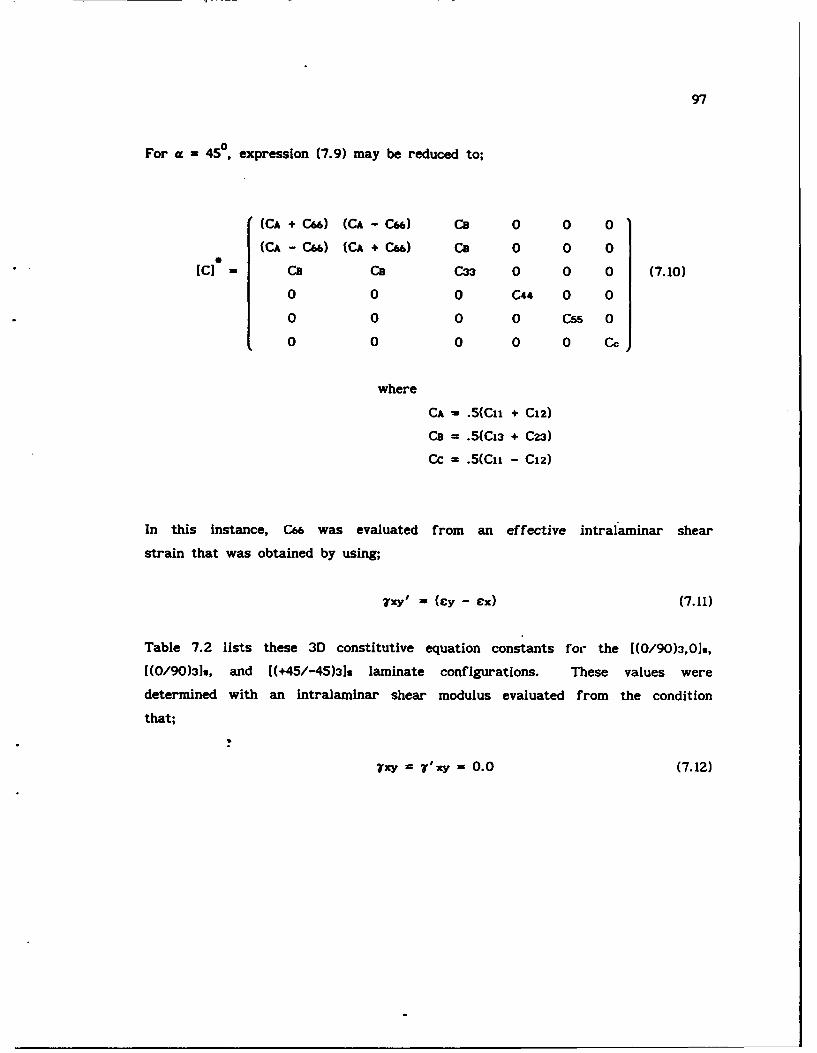
97
For a - 450, expression (7.9) may be reduced to;
(CA + C6) (CA - C6) Ca 0 0 0
(CA -C6) (CA + C6) Ca 0 0 0
[CJ= C Ca C33 0 0 0 (7.10)
0 0 0 C4 0 0
0 0 0 0 Css 0
0 0 0 0 0 Cc
where
CA = .5(Cii + C12)
Ca = .5(C13 + C23)
Cc = .5(Cii - C12)
In this instance, C66 was evaluated from an effective intralaminar shear
strain that was obtained by using;
7xy' = (Cy - cx) (7.11)
Table 7.2 lists these 3D constitutive equation constants for the [(0/90)3,01,
[(0/90)3]s, and [(+45/-45)3]s laminate configurations. These values were
determined with an intralaminar shear modulus evaluated from the condition
that;
'xy T'xy = 0.0 (7.12)
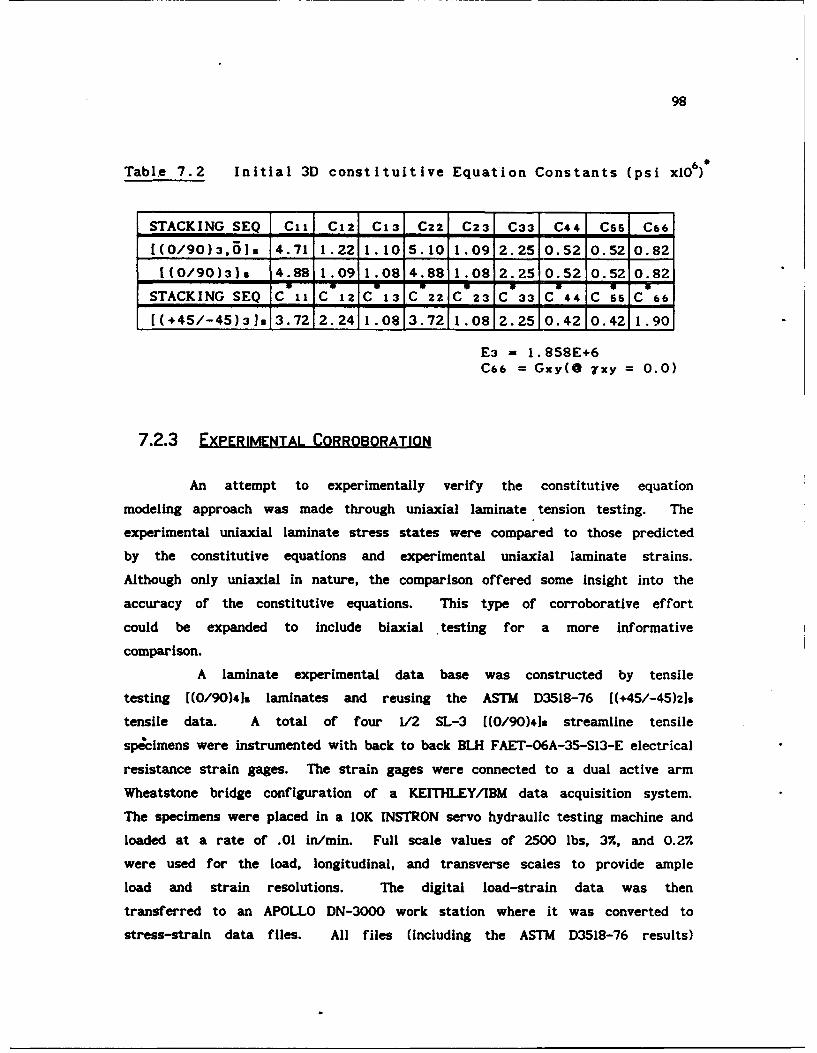
98
Table 7.2 Initial 3D constituitive Equation Constants (psi xlO6
STACKING SEQ C11 C12 C13 C22 C23 C33 C44 Css C66
[(0/90)3,6]s 4.71 1.22 1.10 5.10 1.09 2.25 0.52 0.52 0.82
[(0/90)3] 4.88 1.09 1.08 4.88 1.08 2.25 0.52 0.52 0.82U Uq -g U U U U
STACKING SEQ C ii C 12 C 13 C 22 C 23 C 33 C 44 C 55 C 66
[(+45/-45)31. 3.72 2.24 1.08 3.72 1.08 2.25 0.42 0.42 1.90
E3 f 1.858E+6C66 Gxy(@ 7xy = 0.0)
7.2.3 EXPERIMENTAL CORROBORATION
An attempt to experimentally verify the constitutive equation
modeling approach was made through uniaxial laminate tension testing. The
experimental uniaxial laminate stress states were compared to those predicted
by the constitutive equations and experimental uniaxial laminate strains.
Although only uniaxial in nature, the comparison offered some insight into the
accuracy of the constitutive equations. This type of corroborative effort
could be expanded to include biaxial testing for a more informative
comparison.
A laminate experimental data base was constructed by tensile
testing [(0/90)41s laminates and reusing the ASTM D3518-76 [(+45/-45)z]s
tensile data. A total of four 1/2 SL-3 ((0/90)41 streamline tensile
specimens were instrumented with back to back BLH FAET-6A-35-S13-E electrical
resistance strain gages. The strain gages were connected to a dual active arm
Wheatstone bridge configuration of a KEITHLEY/IBM data acquisition system.
The specimens were placed in a 10K INSTRON servo hydraulic testing machine and
loaded at a rate of .01 in/min. Full scale values of 2500 lbs, 3%, and 0.2%
were used for the load, longitudinal, and transverse scales to provide ample
load and strain resolutions. The digital load-strain data was then
transferred to an APOLLO DN-3000 work station where it was converted to
stress-strain data files. All files (including the ASTM D3518-76 results)
99
were then sorted, linearly interpolated, and averaged among specimens to
produce average stress-strain curves. Strain standard deviations were also
computed for each specimen set.
Figures 7.2 and 7.3 illustrate the longitudinal (cy) and transverse
(cx) stress-strain response of the [(0/90)419 specimens. The longitudinal and
transverse stress-strain ASTM D3518-76 response was previously illustrated in
Figure 6.5. Note that the [(+45/-45)z1 response is based on the average of
four specimens. Only one [(0/90)4], specimen reached a longitudinal 3% strain
value while total response is projected to a 47. longitudinal strain level.
For both laminate arratgements, these experimental strains were used
with the constitutive equations (7.7) and (7.10) to predict the experimental
tensile stress state. Comparisons were done at each stress interval up to the
maximum 47. longitudinal strain limit. The predicted stress states were then
compared to the actual uniaxial stress condition. Normalized percent error
functions with respect to the actual uniaxial stress were formed.
Figure 7.4 shows this normalized uniaxial stress state comparison for
the [(0/90)4]s laminate. Figures 7.5 and 7.6 illustrates a similar conlparison
for the [(+45/-45)z] specimens with linear and nonlinear intralaminar shear
stress-strain behavior respectively. Maximum normalized errors of
approximately 400 7. and 30 7. were observed for the [(+45/-45)2]s laminate with
linear and nonlinear intralaminar shear stress-strain response respectively.
This observation underscored the importance of this constitutive modeling
assumption particularly at higher uniaxial strain levels. Similarly, the
[(0/90)412 laminate comparison yielded a maximum normalized error of 35 %.
It was not apparent what effect the [(0/90)4]s E3 and v23 through
thickness properties had on the resulting normalized errors. Remembering that
a marginal measuring sensitivity was used to determine v23 and noting that E3
may have a lower bound of that of pure SP250 resin (0.40xE+6), a sensitivity
analysis to determine these effects was undertaken.
7.3 THROUGH THICKNESS LAMINATE MECHANICAL PROPERTY SENSITIVITY ANALYSIS
Effects of the (0/90)418 through thickness mechanical properties
were investigated by introducing variations of their values in the uniaxial
100
stress state comparisons. For both laminate arrangements, E3 was varied from
values of pure resin to that for a transverse lamina ( ie 0. 4OxE+6 s E3 s
1.858xE+6) (with mz3 equal to the experimentally determined value). Similarly,
a separate + 50 . variation in vma (with an E3 of 1.858 xE6 ) was introduced
into the constitutive equations.
Figures 7.7 and 7.8 illustrate the normalized [(0 UO0)4]s uniaxial
stress state errors resulting from the E3 and vm variations. Figures 7.9 and
7.10 show the normalized [(+45/-45)419 uniaxial stress state errors resulting
from the E3 and vz3 variations. Graphically, these variations are seen
traversing across each normalized stress component. As can be seen, both
variations had minimal affect on the [(0/90)4]. laminate results, but greatly
affected the [(+45/-45)4]s results. In both cases, the lower bound of the
through thickness modulus yields lower az error values. Note also that these
lower values occured with this the experimentally determined value of P23.
With these through thickness values and the inclusion of intralaminar shear
nonlinearity , maximum normalized [(+45/-45)2]. uniaxial constitutive equation
modeling error was reduced to approximately 20. while the maximum [(0/90)4].
error remained at 35 %.
7.4 IN-PLANE LAMINATE MECHANICAL PROPERTY SENSITIVITY ANALYSIS
The experimental uniaxial stress strain response of the [(0/90)4]
laminate shown in Figures 7.2 and 7.3 indicated nonlinearities in both the
in-plane Poisson ratio, V21, and tensile modulus, Ez. In order to assess the
effects of these nonlinearities on the remaining normalized uniaxial stress
state errors, experimental V21 and E2 nonlinearities were introduced into the
constitutive equations. A five point "rolling average" of these values was
computed as a functLon of longitudinal tensile strain to promote smooth
descriptions.
Figure 7.11 shows the effect of in-plane Poisson ratio P21 while
Figure 7.12 shows the effect on in-plane modulus Ez for the [(0/90)412
laminate. As can be seen, the P21 nonlinearity acted to nullify the
transverse normalized error while the E2 nonlinearity acted to greatly reduce
the normal normalized stress error.
101
Figure 7.13 illustrates the effects of both in-plane properties upon
the [(+45/-45)2]s laminate. In this case, both the [(0/90)4], Et and E2
moduli were equated and nonlinearized due to the equality of the transformed
tensile loading existing within the laminate. As can be seen, the effects
were minimal in regards to the normalized stress error. However; a 20 .
reduction of these moduli values nullified the remaining normalized stress
errors of the [(+45/-45)4]s laminate as can be seen in Figure 7.14. Reduced
moduli values might have resulted from seperate autoclaving runs that were
used to manufacture the laminated specimens.
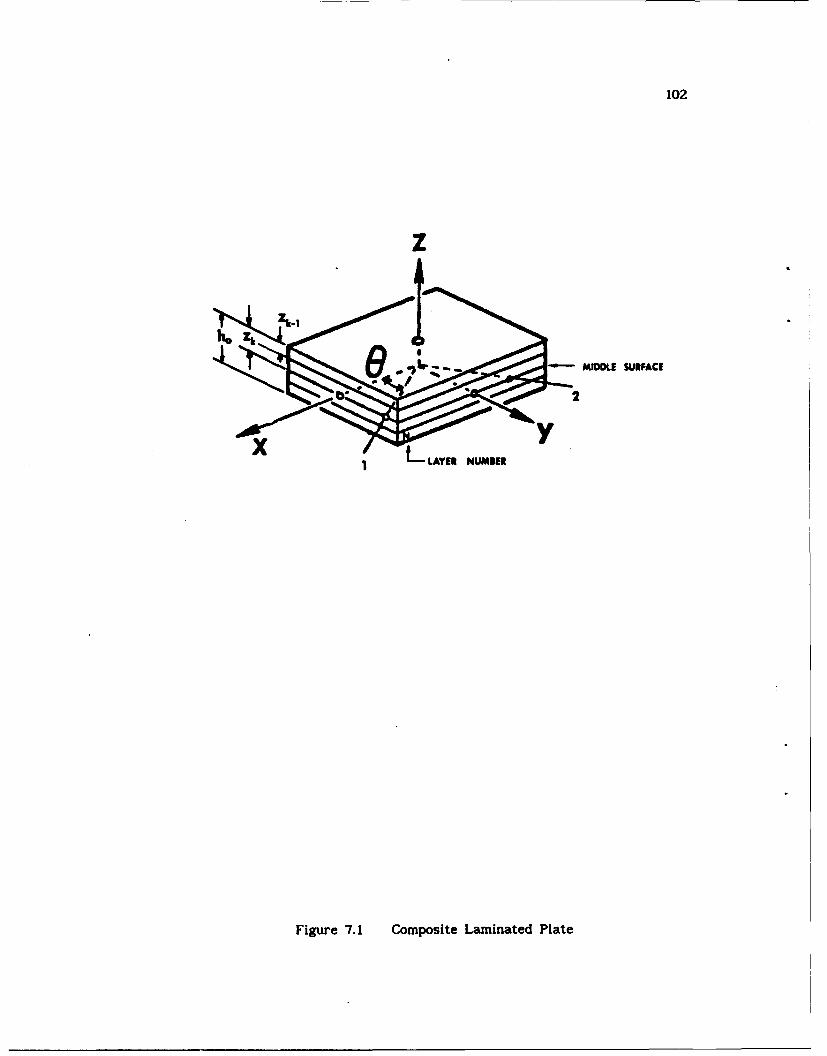
102
xz' q MIMDE SURFACE
2
F r 1 opLAEe NUMie
Figure 7.1 Composite Laminated Plate
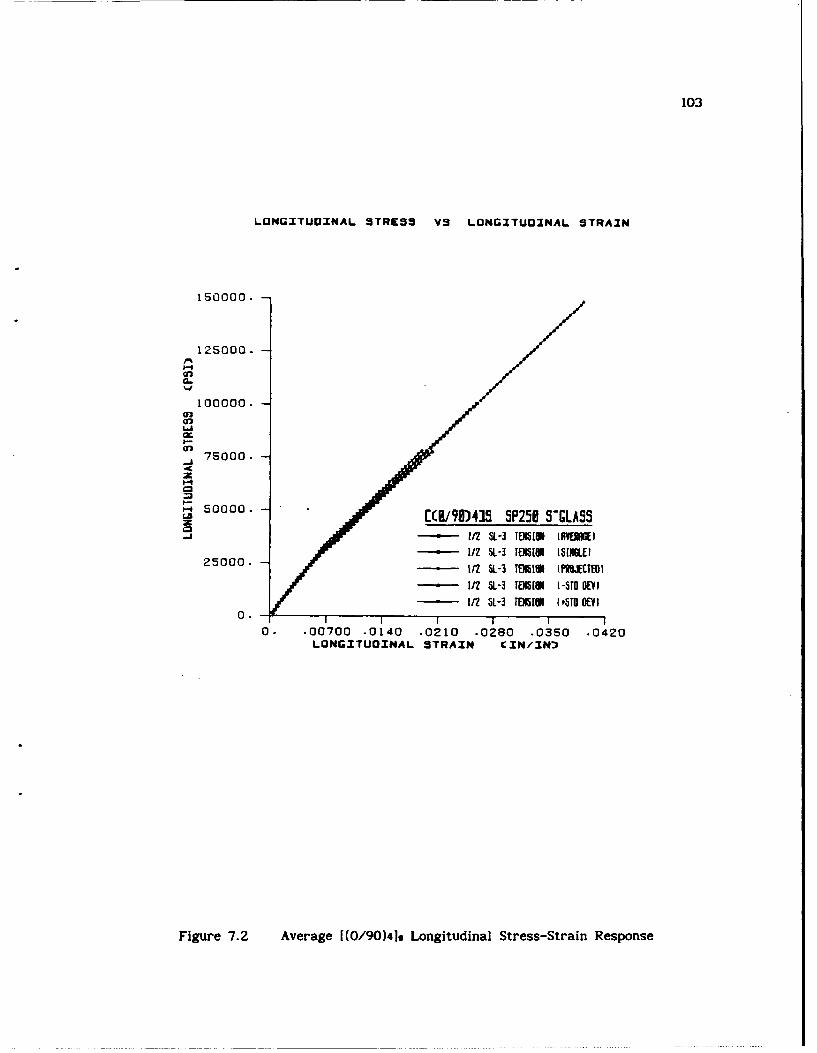
103
LONGITUDINAL 3TRES VS LONGITUDINAL STRAIN
150000. -
125000. -
cn
100000.
(2
75000.
0 .00000(9/90)4]5 P25 0 02LASS
- *N I/2 SL- TENSIS t 5RN/E I0.- 1 1
0. .00700 .0140 .0210 .0280 .03S0 .0420LONGITUDINAL STRAIN CIN/XN'3
Figure 7.2 Average [(0/90)4]s Longitudinal Stress-Strain Response
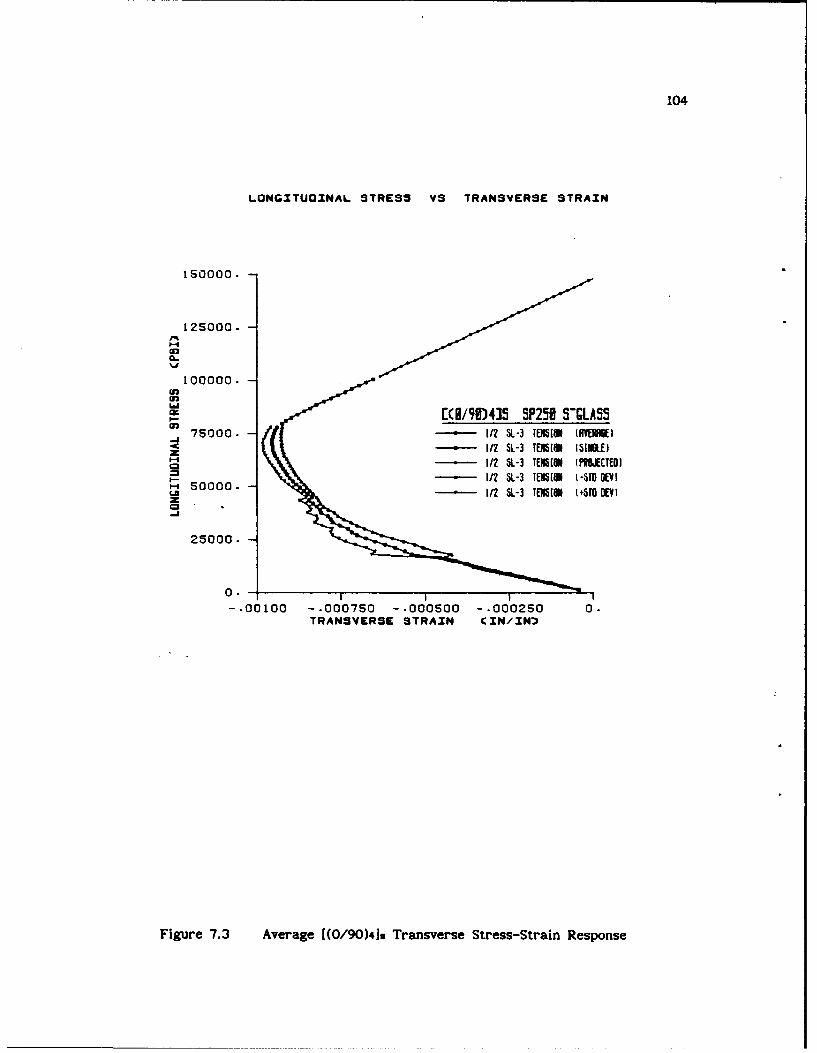
104
LONGITUOINAL STRESS VS TRANSVERSE STRAIN
150000. -
I 2S000.
0.
100000.
en
70.(0/99)4]S SP250 S'GLASS----- 1/2 S-3 TIEN1M IV.,I
-.--- 1/2 S.-3 TE1SlM ISM I
a- 1/2 SL-3 TE 1U (PIISJECTEOI-1/2 SH- TEM510 1-51 0 (EV I
50000.- 1/2 1- TENI 1tSTOOEVI
-,I
25000.
0.--. 00100 -. 000750 -. 000S00 -. 000250 0.
TRANSVERSE STRAZN C(ZN/IN
Figure 7.3 Average 1(0/90)4]s Transverse Stress-Strain Response
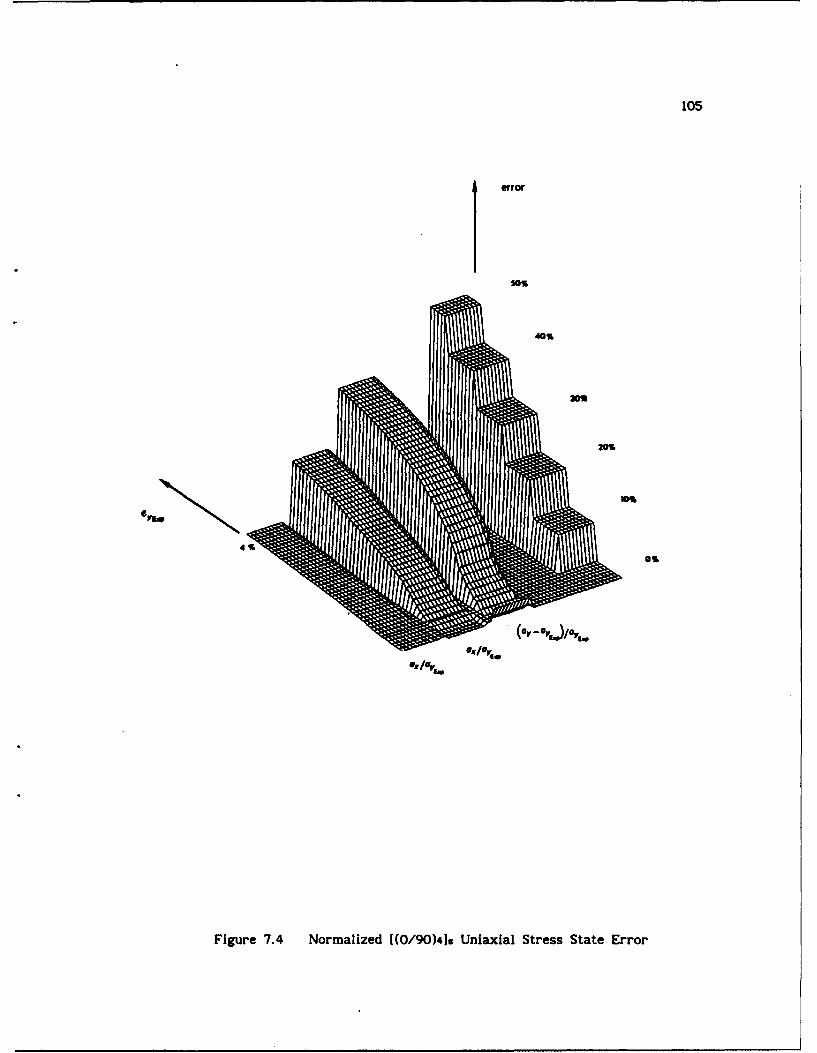
105
error
5o%
(e,°,.,)/,,.
20%
o,0%
Figure 7.4 Normalized [(0/90)41s Uniaxial Stress State Error
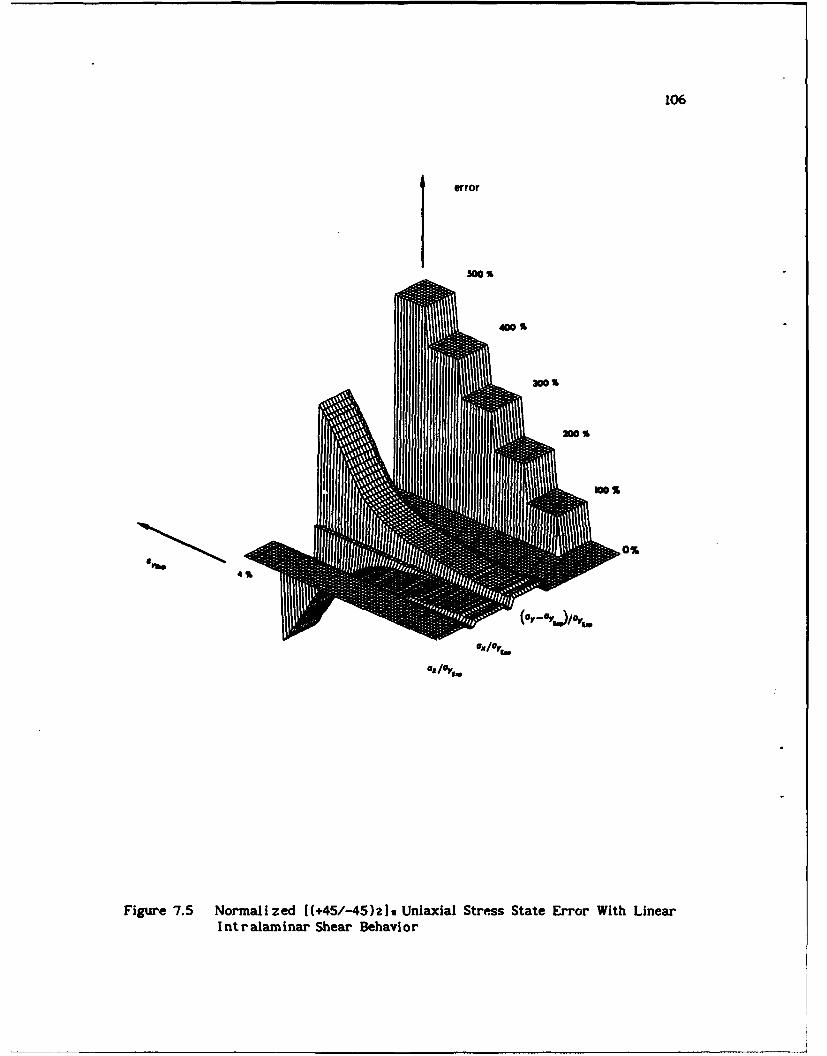
106
* error
'vSao%
Figure 7. 5 Normal i z ed [(+45/-45) 2 1.Uniaxial Stress State Error With LinearIntralaxninar Shear Behavior
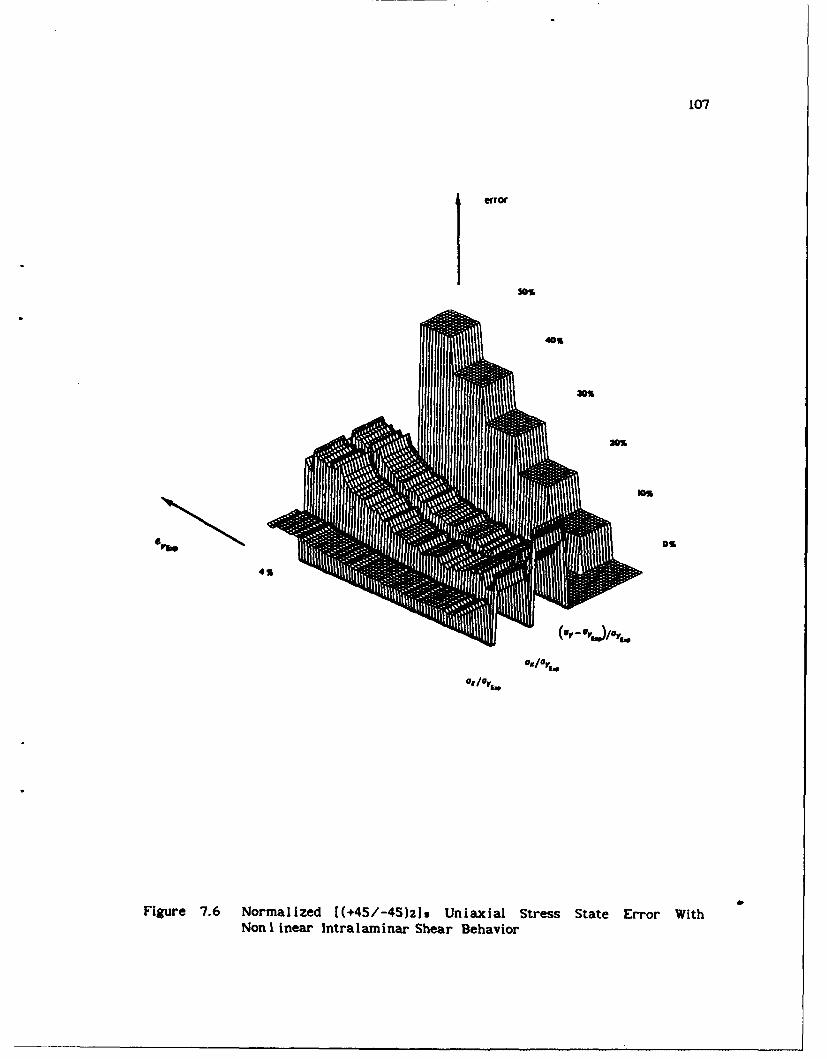
107
error
0%
30%
0%%
(,,-°,.,,)/,,...
I.%
Figure 7.6 Normalized [(+45/-45)2]s Uniaxial Stress State Error WithNon 1inear Intralaminar Shear Behavior
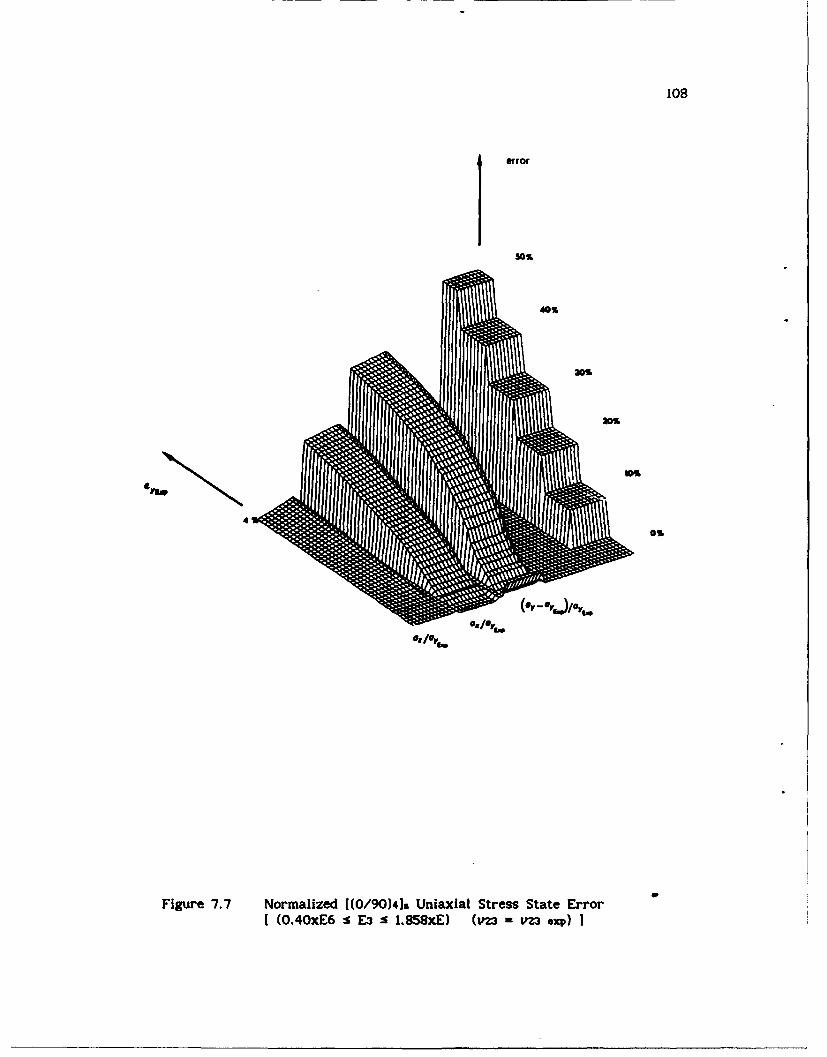
108
error
so%
440%
30%%
Figure 7.7 Normalized [(0/90)4]s Uniaxial Stress State Error(0.4OxE6 :s E3 :s L.85BxE) (v'23 - vza exp)
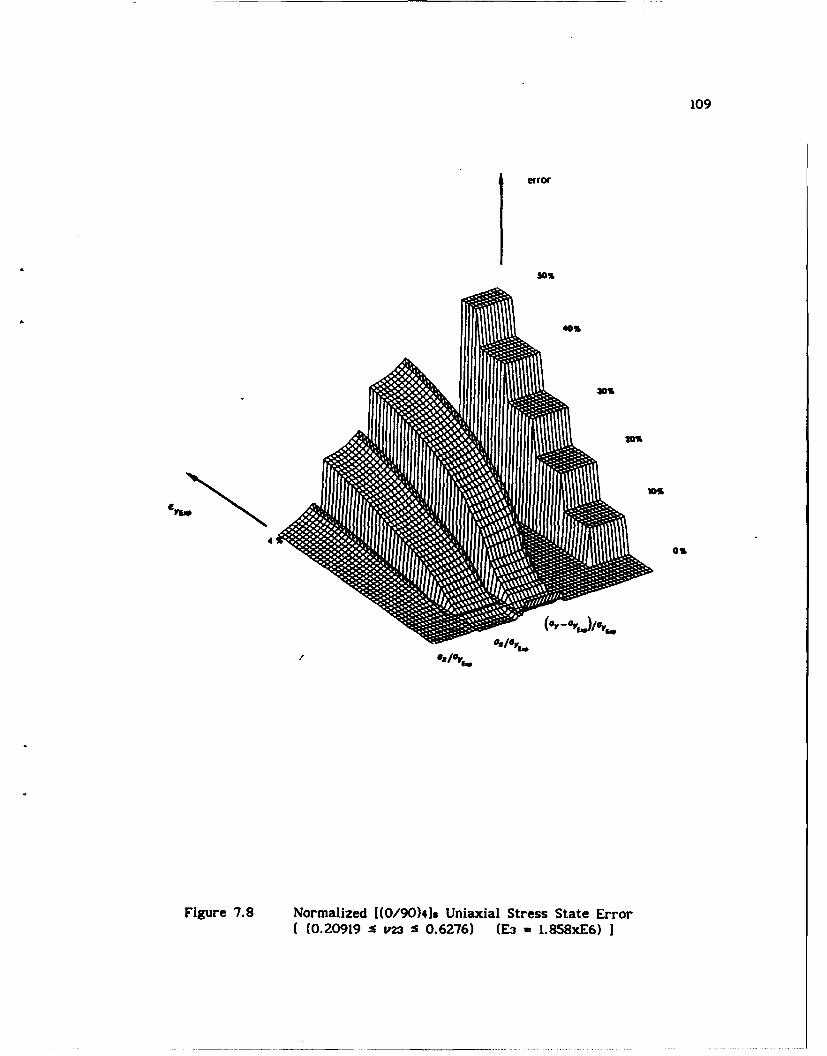
109
error
40
a-s
Figure 7.8 Normalized [(0/90)4 19 Uniaxial Stress State Error(0. 20919 5 vz3 S 0. 6276) (E3 = 1. 85BxE6)
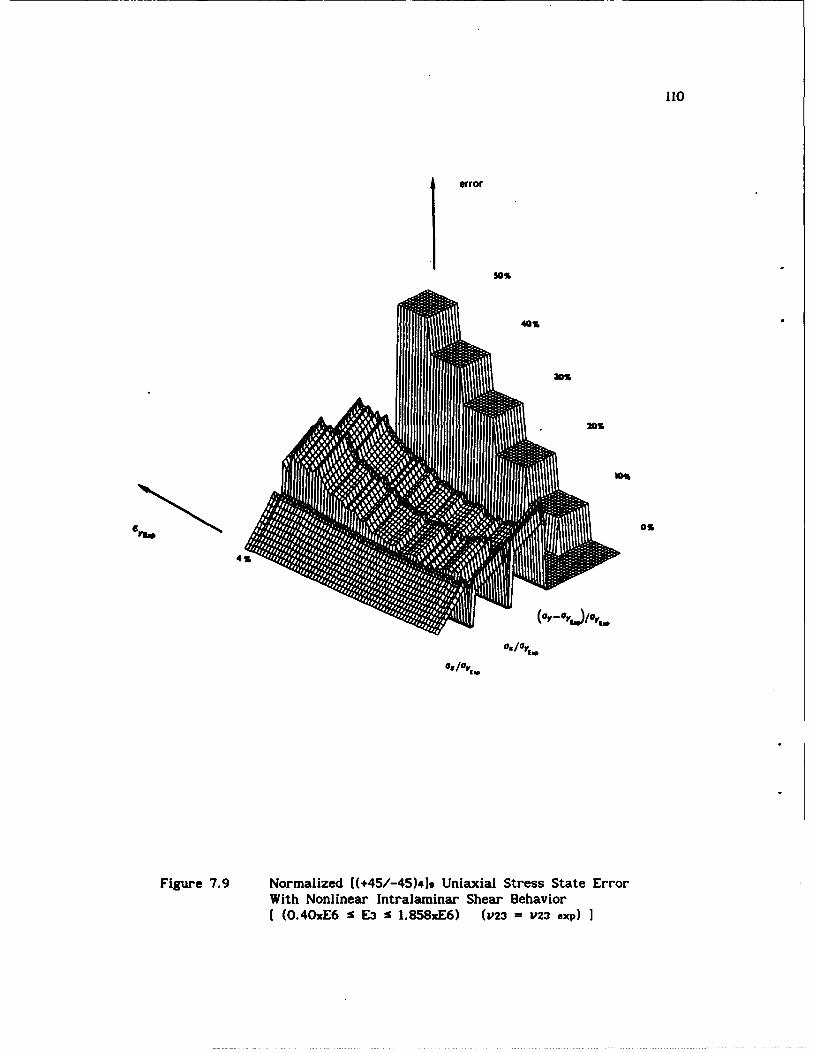
110
error
50%
* 40%
05/a%
0,/o%
Figure 7.9 Normalized [(+45/-45)419 Unlaxial Stress State ErrorWith Nonlinear Intralaminar Shear BehaviorI(0.40xE6 :s E3 :s I.MSxE6) (V'23 =V23 exp)
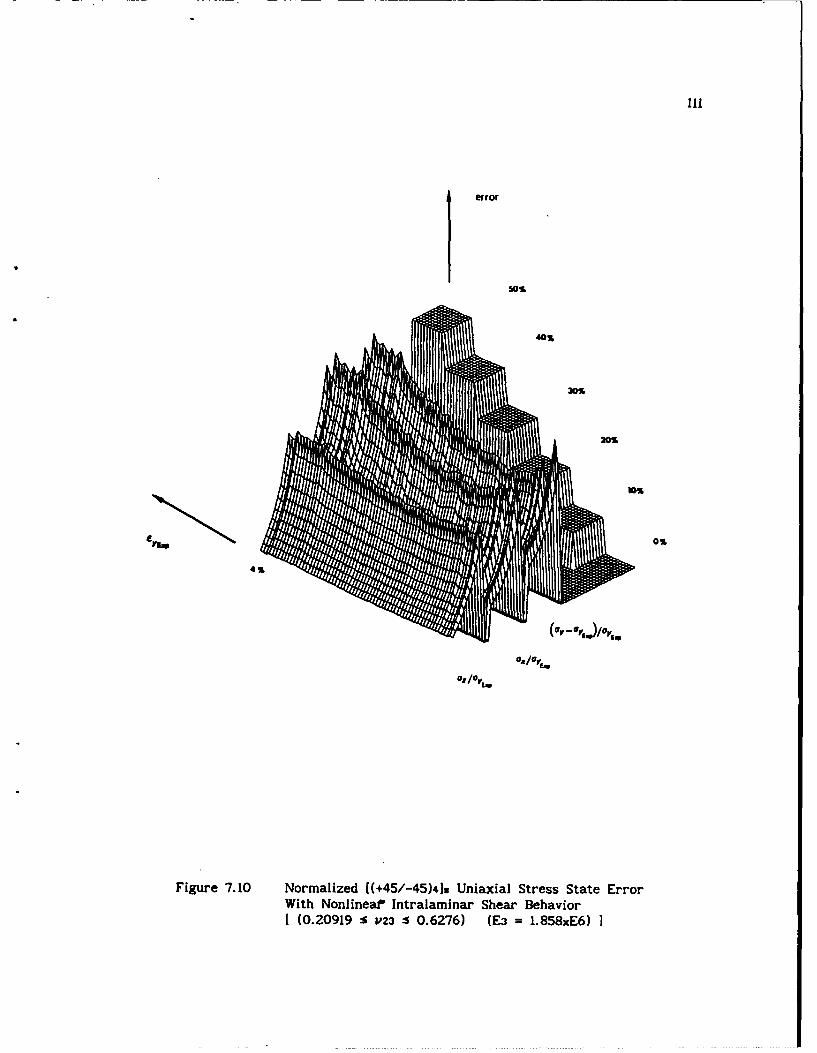
error
40%
C
0%
Figure 7. 10 Normalized [(+45/-45)419 Uniaxial Stress State ErrorWith NonlineaP Intralaminar Shear Behavior
(0. 20919 :5 P23 S 0. 6276) (E3 =1. 858xE6)I
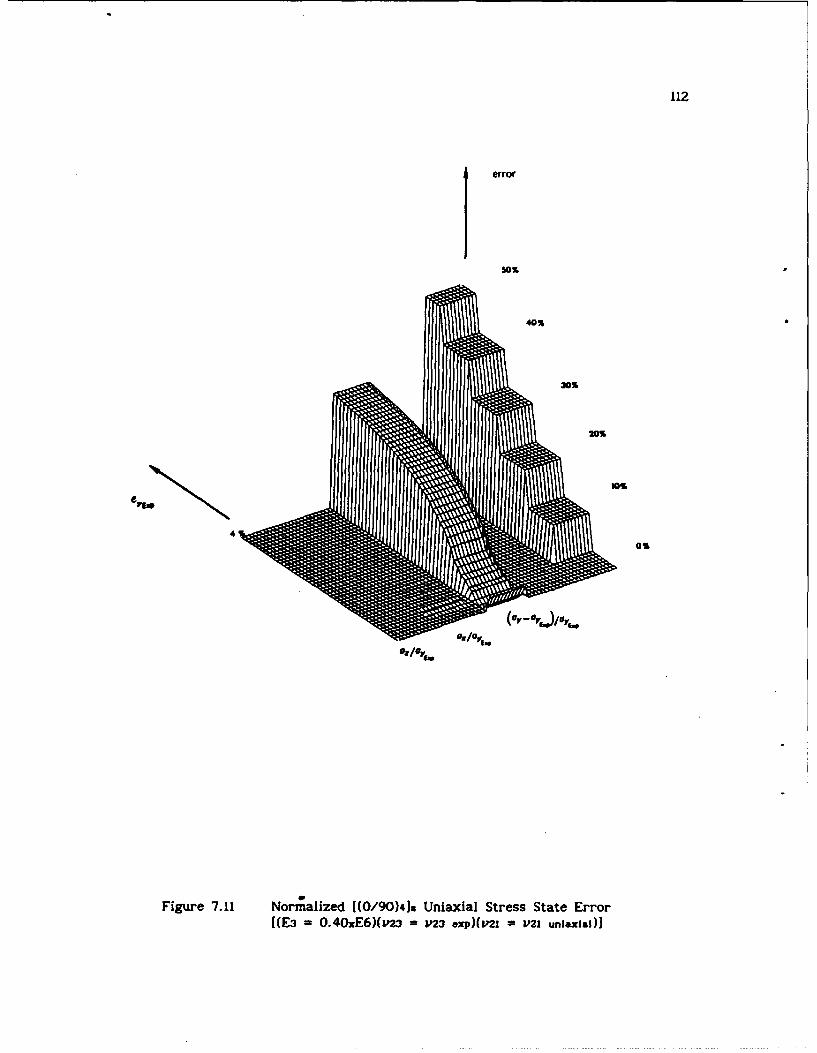
112
error
0%
20%
.5/or/o t
Figure 7. 11 Normalized 1(0/90)4]s Uniaxial Stress State Error[(E3 - 0.40xE6)(v23 = 1)23 exp)(p21 = 1)21 unlaxial)J
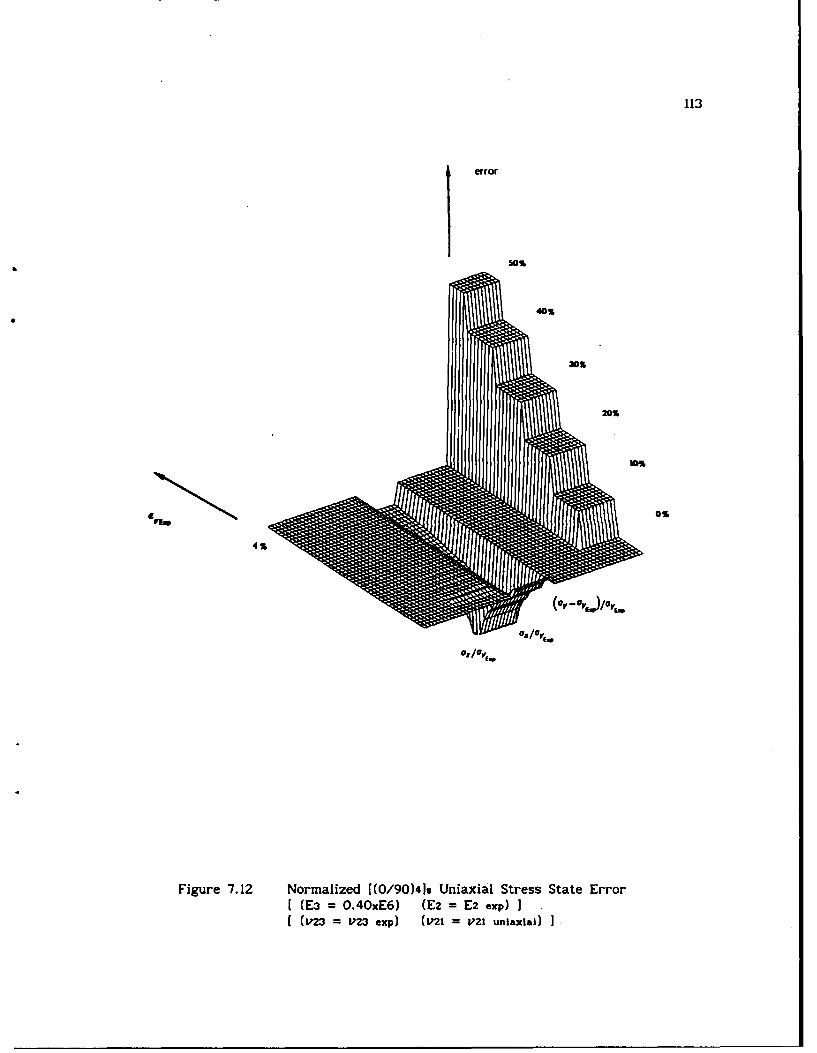
113
error
40%
30
20
Figure 7.12 Normalized [(0/90)419 Uniaxial Stress State Errorf (E3 0 .4OxE6) (E2 E2 exp) I.((v23 V 23 exp) (v21 V 21 unlaxial)
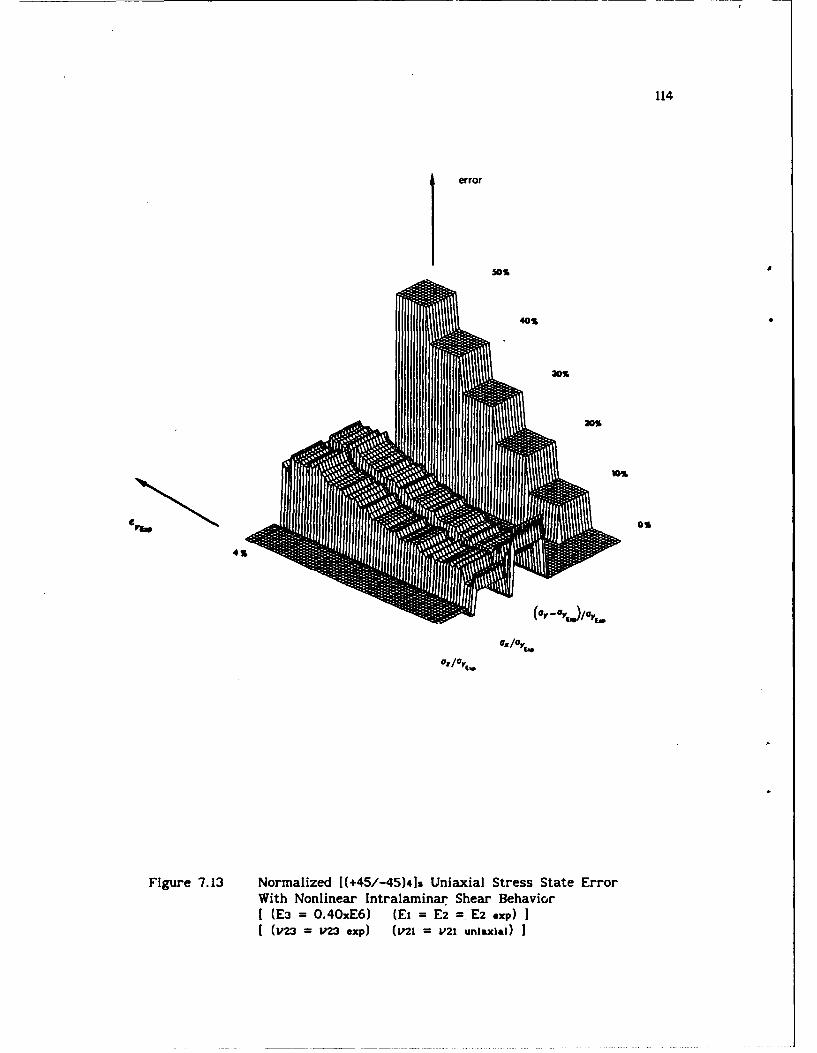
114
*error
asa
qa/Or
Figure 7.13 Normalized [(+45/-45)4]s Uniaxial Stress State ErrorWith Nonlinear Intralaminar Shear Behavior
[(E3 0 .4OxE6) (Ei =E2 =. E2 exp)I((V23 V 123 .xp) (V21 = 121 uniaxlal)
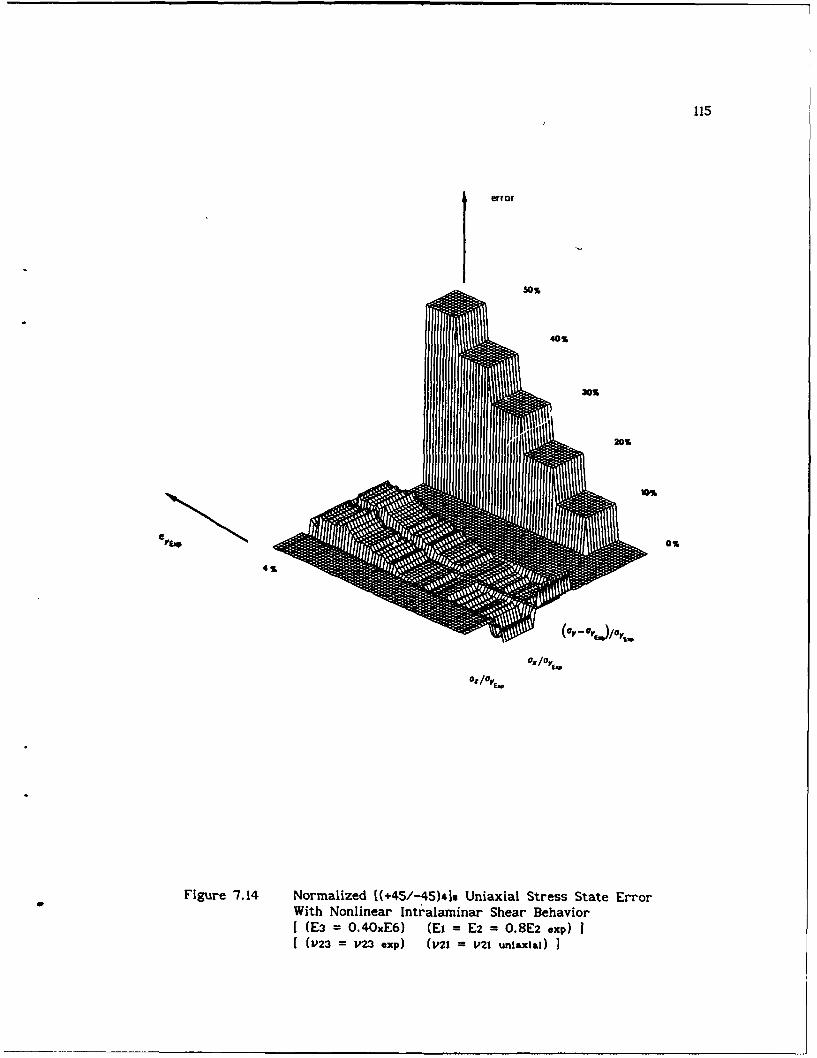
115
error
50
40%~p)G
0,/0%
Figure 7.14 Normalized ((+45/-45)]s Uniaxial Stress State ErrorWith Nonlinear Intralaminar Shear Behavior
(E3 0 .4OxE6) (Et E2 = 0.8E2 exp)(V23 V 23 exp) (V21 V 21 unlaxial)
116
CHAPTER 8. CONSTITUTIVE EQUATION IMPLEMENTATION
Results of the through thickness mechanical property sensitivity
analysis were used to select the constitutive equation constants for both
laminate configurations. Implementation of constituitive equations in the
finite element code ABAQUS was done by developing user material subroutines.
Single and multiple element verification of these subroutines was undertaken.
Performance of the [(+45/-45)3]s laminate subroutine was investigated.
8.1 FINAL CONSTITUTIVE EQUATION CONSTANTS
Selection of the final constitutive equation constants were based on
the outcome of the laminate through thickness property sensitivity analysis.
In-plane laminate property variations, while being informative of their
effects on uniaxial stress state prediction, were not included in this work
due to the complexity of their implementation into the finite element
computations.
From chapter seven, the constitutive equation modeling approach was
experimentally shown to be sensitive to E3 and vm for the [(+45/-45)z]s
laminate but not for the 1(0/90)419. It was shown that use of the
experimental [(0/90)4]6 in3 value obtained from displacement clip gage testing
precLudes the use of a lower E3 value for [(+45/-45)4]s uniaxial stress state
error reduction. While the experimental value of mf3 was questionable due to
measurement methodology, its value is in strong agreement with the 0.413 value
predicted by Herakovich7 for [(0/90)]s graphite epoxy laminates. For this
reason, the experimentally obtained [(0/90)4]s v23 value was used in
conjunction with an E3 of pure SP250 resin.
Table 8.1 shows the final value of the laminate constitutive equation
constants resulting from the E3 and um values and equations (7.7) and (7.10).
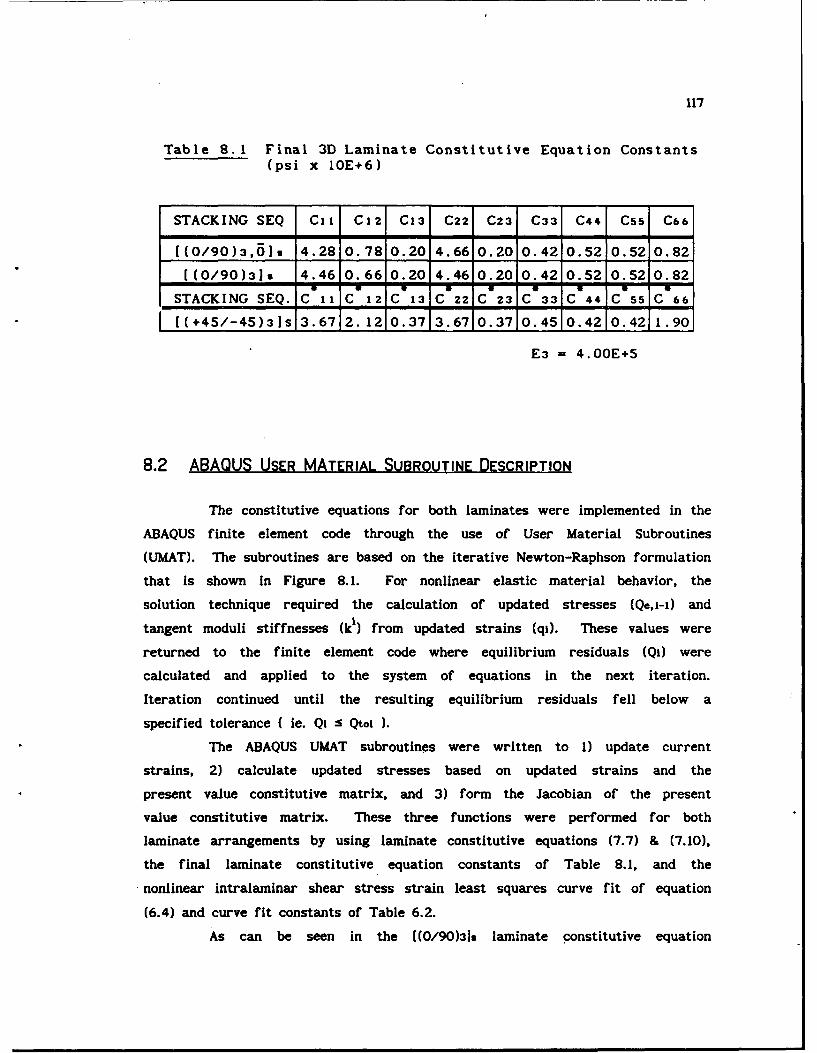
117
Table 8.1 Final 3D Laminate Constitutive Equation Constants(psi x 1OE+6)
STACKING SEQ C1i C12 C13 C22 C23 C33 C44 C55 C66
[(0/90)3,6]s 4.28 0.78 0.20 4.66 0.20 0.42 0.52 0.52 0.82
[(0/90)3]s 4.46 0.66 0.20 4.46 0.20 0.42 0.52 0.52 0.82
STACKING SEQ. C ii C 12 C 13 C 22 C 23 C 33 C 44 C 55 C 66
[(+45/-45)3]s 3.67 2. 12 0.37 3.67 0.37 0.45 0.42 0.42 1.90
E3 = 4.00E+5
8.2 ABAQUS USER MATERIAL SUBROUTINE DESCRIPTION
The constitutive equations for both laminates were implemented in the
ABAQUS finite element code through the use of User Material Subroutines
(UMAT). The subroutines are based on the iterative Newton-Raphson formulation
that is shown in Figure 8.1. For nonlinear elastic material behavior, the
solution technique required the calculation of updated stresses (Qe,i-i) and
tangent moduli stiffnesses (kI ) from updated strains (qi). These values were
returned to the finite element code where equilibrium residuals (Q1) were
calculated and applied to the system of equations in the next iteration.
Iteration continued until the resulting equilibrium residuals fell below a
specified tolerance ( ie. Qi s Qtoi ).
The ABAQUS UMAT subroutines were written to I) update current
strains, 2) calculate updated stresses based on updated strains and the
present value constitutive matrix, and 3) form the Jacobian of the present
value constitutive matrix. These three functions were performed for both
laminate arrangements by using laminate constitutive equations (7.7) & (7.10),
the final laminate constitutive equation constants of Table 8.1, and the
nonlinear intralaminar shear stress strain least squares curve fit of equation
(6.4) and curve fit constants of Table 6.2.
As can be seen in the [(0/90)3]s laminate constitutive equation
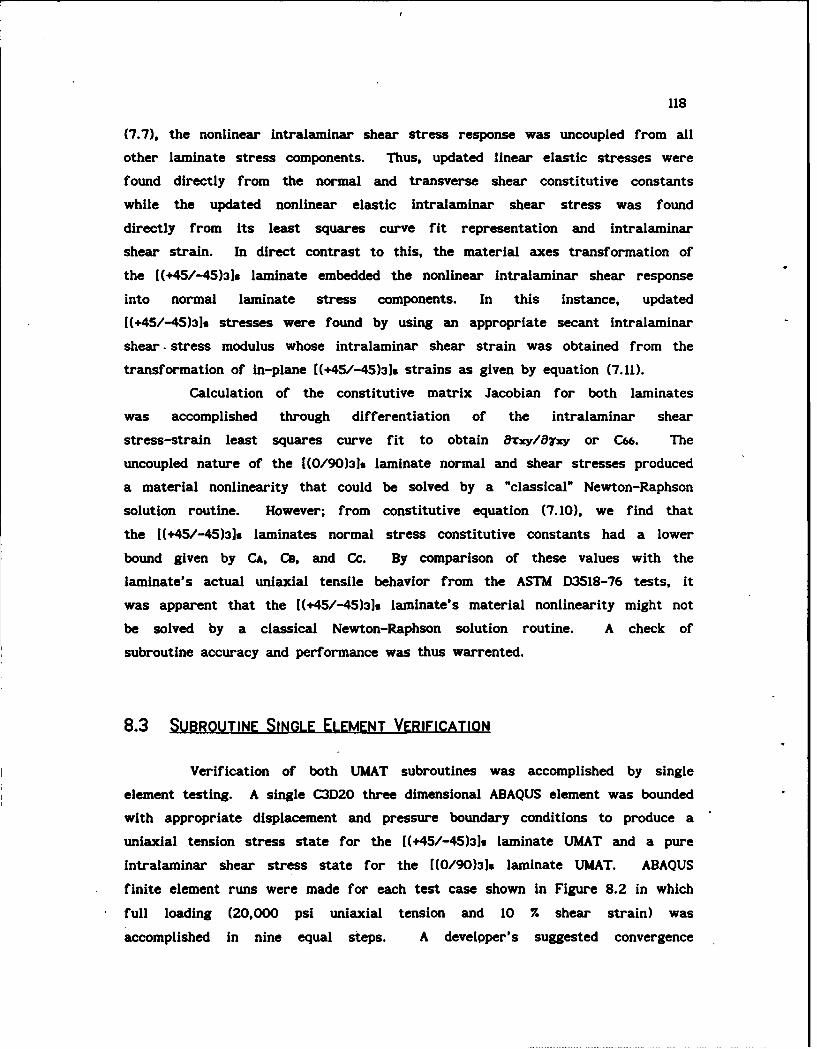
118
(7.7). the nonlinear intralaminar shear stress response was uncoupled from all
other laminate stress components. Thus, updated linear elastic stresses were
found directly from the normal and transverse shear constitutive constants
while the updated nonlinear elastic intralaminar shear stress was found
directly from its least squares curve fit representation and intralaminar
shear strain. In direct contrast to this, the material axes transformation of
the [(+45/-45)3]. laminate embedded the nonlinear intralaminar shear response
into normal laminate stress components. In this instance, updated
[(+45/-45)3]s stresses were found by using an appropriate secant intralaminar
shear, stress modulus whose intralaminar shear strain was obtained from the
transformation of in-plane [(+45/-45)31. strains as given by equation (7.11).
Calculation of the constitutive matrix Jacobian for both laminates
was accomplished through differentiation of the intralaminar shear
stress-strain least squares curve fit to obtain &ixy/ayxy or C6. The
uncoupled nature of the [(0/90)319 laminate normal and shear stresses produced
a material nonlinearity that could be solved by a "classical" Newton-Raphson
solution routine. However; from constitutive equation (7.10), we find that
the [(+45/-45)3]. laminates normal stress constitutive constants had a lower
bound given by CA, CB, and Cc. By comparison of these values with the
laminate's actual unlaxial tensile behavior from the ASTM D3518-76 tests, it
was apparent that the [(+45/-45)31. laminate's material nonlinearity might not
be solved by a classical Newton-Raphson solution routine. A check of
subroutine accuracy and performance was thus warrented.
8.3 SUBROUTINE SINGLE ELEMENT VERIFICATION
Verification of both UMAT subroutines was accomplished by single
element testing. A single C3D20 three dimensional ABAQUS element was bounded
with appropriate displacement and pressure boundary conditions to produce a
uniaxial tension stress state for the [(+45/-45)3]s laminate UMAT and a pure
intralaminar shear stress state for the [(0/90)3]s laminate UMAT. ABAQUS
finite element runs were made for each test case shown in Figure 8.2 in which
full loading (20,000 psi unaxial tension and 10 %. shear strain) was
accomplished in nine equal steps. A developer's suggested convergence
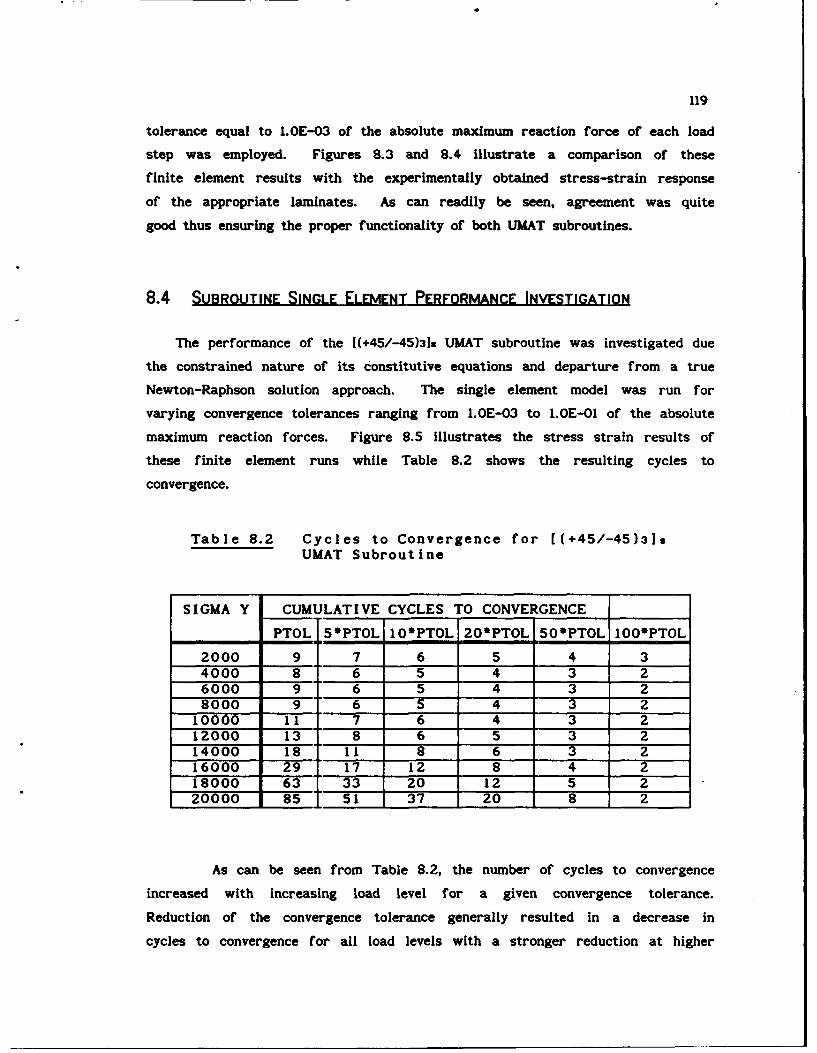
119
tolerance equal to 1.OE-03 of the absolute maximum reaction force of each load
step was employed. Figures 8.3 and 8.4 illustrate a comparison of these
finite element results with the experimentally obtained stress-strain response
of the appropriate laminates. As can readily be seen, agreement was quite
good thus ensuring the proper functionality of both UMAT subroutines.
8.4 SUBROUTINE SINGLE ELEMENT PERFORMANCE INVESTIGATION
The performance of the [(+45/-45)3]s UMAT subroutine was investigated due
the constrained nature of its constitutive equations and departure from a true
Newton-Raphson solution approach. The single element model was run for
varying convergence tolerances ranging from .OE-03 to 1.OE-01 of the absolute
maximum reaction forces. Figure 8.5 illustrates the stress strain results of
these finite element runs while Table 8.2 shows the resulting cycles to
convergence.
Table 8.2 Cycles to Convergence for [(+45/-45)319UMAT Subroutine
SIGMA Y CUMULATIVE CYCLES TO CONVERGENCEPTOL 5PTOL 10 PTOL 20PTOL 5O*PTOL l00'PTOL
2000 9 7 6 5 4 34000 8 6 5 4 3 26000 9 6 5 4 3 28000 9 6 5 4 3 210000 11 7 6 4 3 212000 13 8 6 5 3 214000 18 11 8 6 3 216000 29 17 12 8 4 218000 63 33 20 12 5 220000 85 51 37 20 8 2
As can be seen from Table 8.2, the number of cycles to convergence
increased with increasing load level for a given convergence tolerance.
Reduction of the convergence tolerance generally resulted in a decrease in
cycles to convergence for all load levels with a stronger reduction at higher
120
load levels. Figure 8.5 illustrates the resulting stress strain response as a
function of convergence tolerance. As can be seen, the error in the stress
strain state increased with increasing convergence tolerance and load level.
8.5 SUBROUTINE MULTIPLE ELEMENT VERIFICATION
The effects of element orientation on UMAT subroutine calculations
were investigated by performing a patch test. The single element test cases
shown in Figure 8.2 were subdivided into two 37 element (C3D20 ABAQUS) layers
whose total thickness was .0625". This total thickness is similar to the
thickness that was used for the pin-loaded coupon finite element model. The
same displacement and pressure boundary conditions of the single element test
cases were placed upon the multi element mesh shown in Figure 8.6. A
convergence tolerance of 1.OE-03 of the absolute maximum reaction forces was
employed while total loading was broken down into nine load steps as before.
Large displacement theory was used as in the previous single element cases.
Figure 8.7 shows the variation of these calculated and experimental
inplane shear and uniaxial stress states for the highest load cases for both
the [(0/90)31 and [(+45/-45)31] multi element test cases respectively. As
can be seen, variations from experimental results are less than .3. throughout
the entire model thus indicating an element orientation independence and
proper UMAT subroutine results.
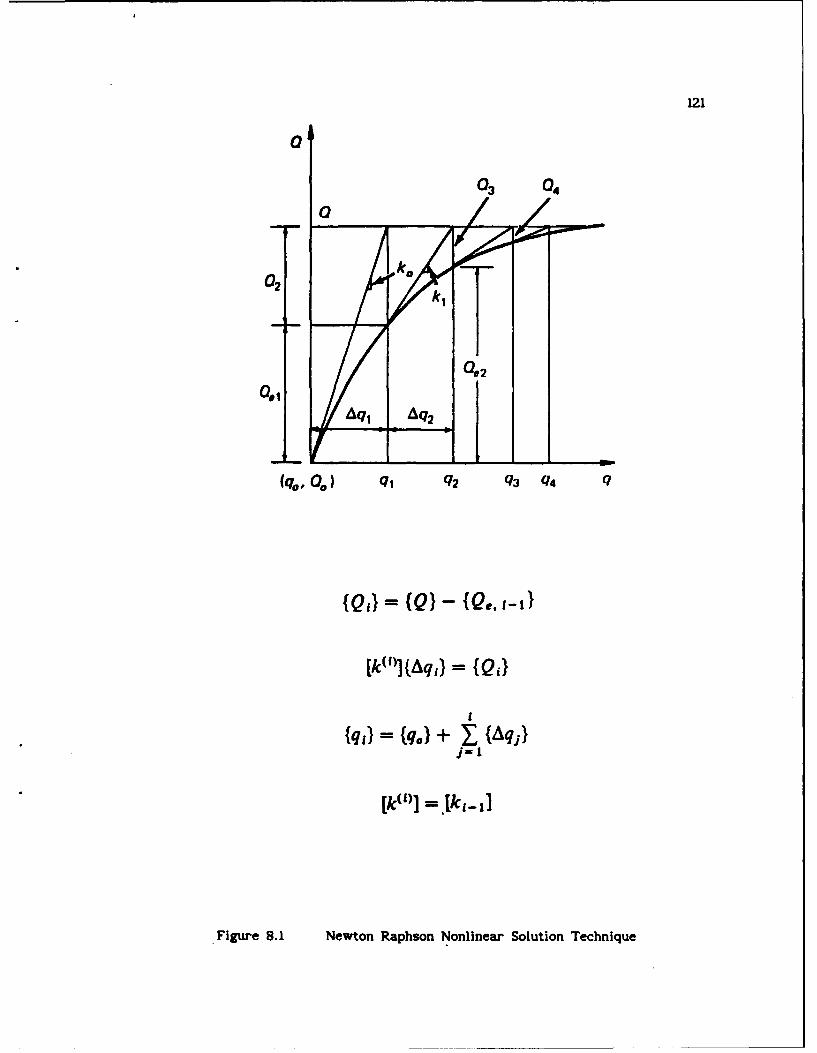
121
0
0.1 0
(qO, 0) q, q2 q3 q4 q
(Qi} = (Q} - (Q,. I-I}
[k(I](Aq,} = {QI)
{q1} - {q) + {Aqj}
Figure -[k 1.-l]
Figure 8.1 Newton Raphson Nonlinear Solution Technique
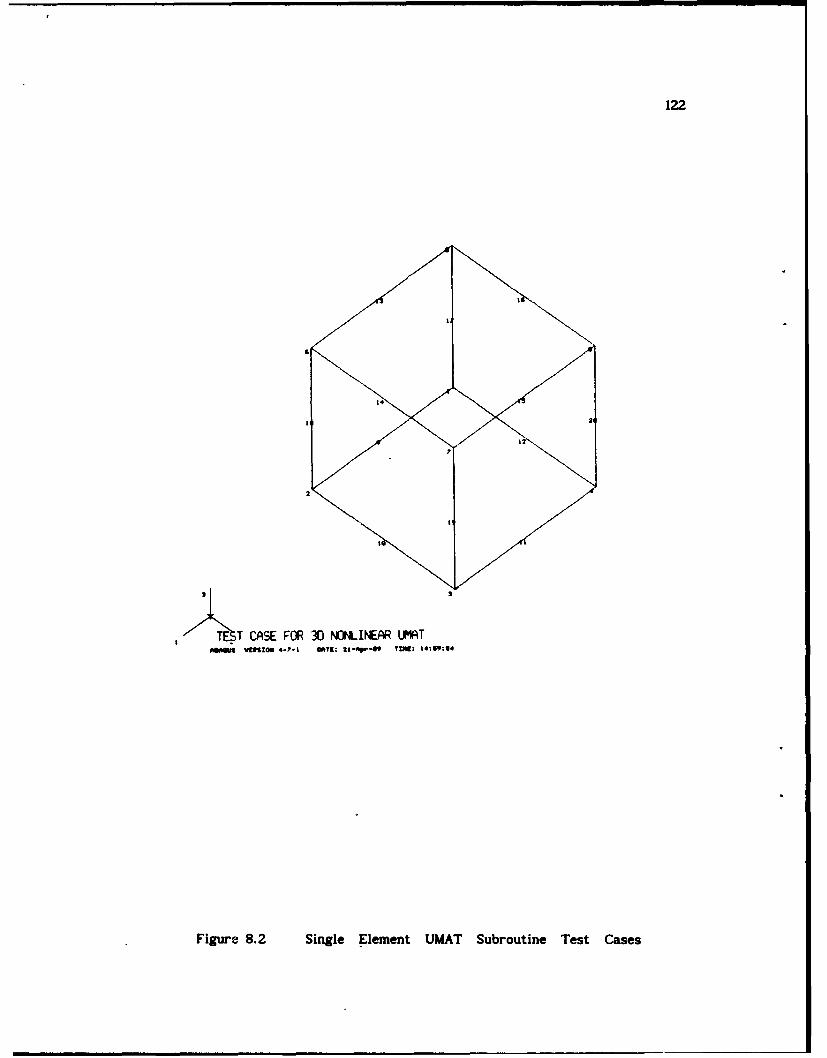
122
T CASE OR 3NONLINERUMAT
Figure 8.2 Single Element UMAT Subroutine Test Cases
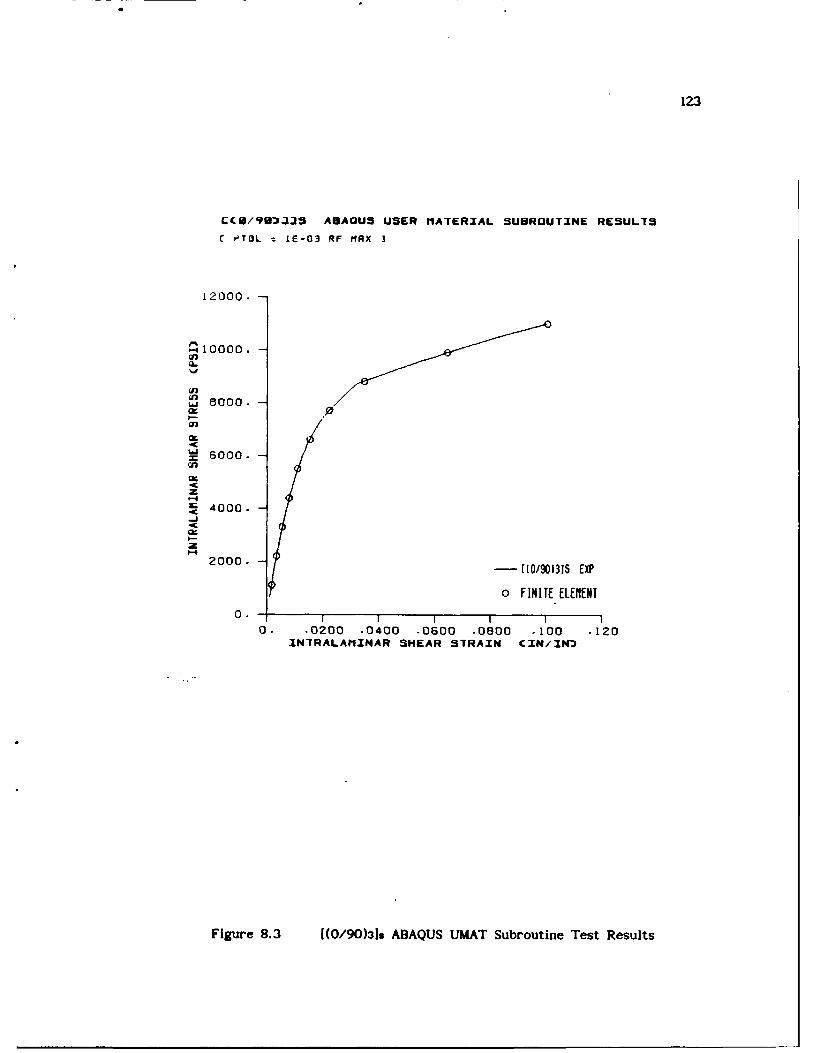
123
CC@/96')J3 ABAOUS USER MATERIAL SUBROUTINE RESULTS
C PTOL LE-03 RF PfRX I
12000. -
110000 .
cnw 8000-
Q9
= 6000.
z
= 4000.--
2000. - -(O/9I31S EX?
o FINITE ELNEN
0 .I I I II
0. .0200 .0400 .0600 .0800 .100 .120IN7RALAMINAR SHEAR STRAIN CIN/XNDI
Figure 8.3 ((0/90)3). ABAQUS UMAT Subroutine Test Results
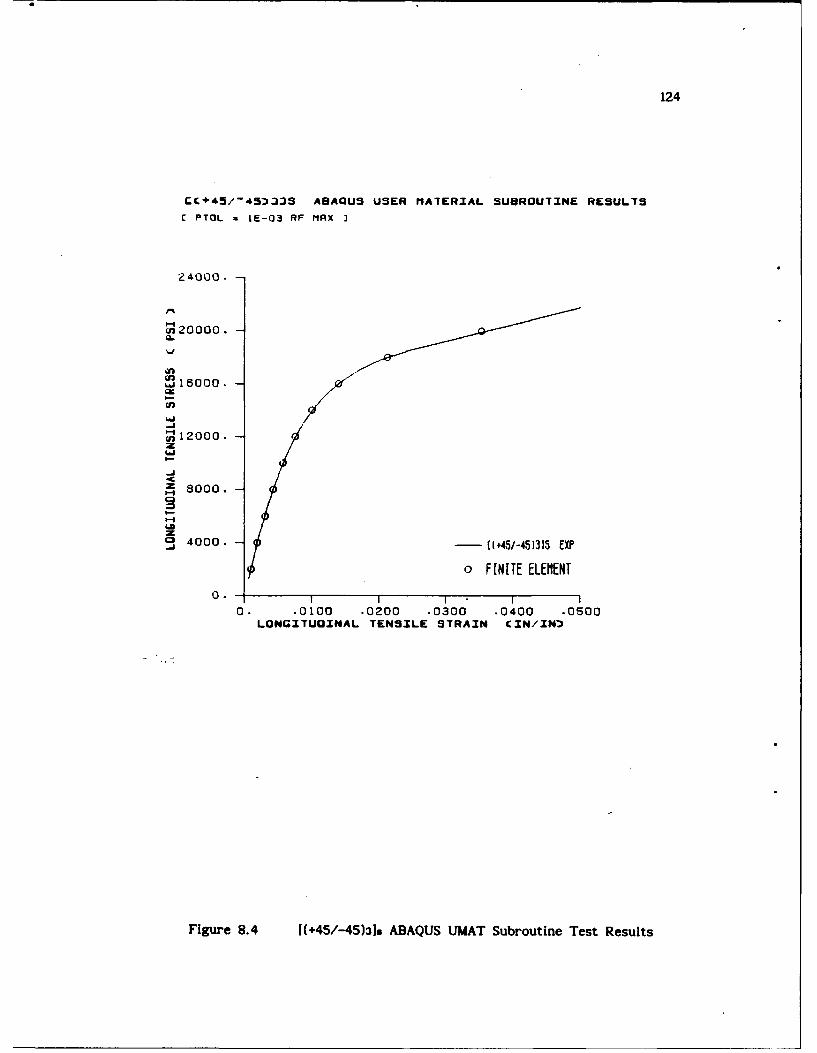
124
C+45/-45)3S ABAQUS USER MATERIAL SUBROUTINE RESULTS
C PTOL = lE-03 RF MRX I
24000.-
cn20000.
Q.
(n
I-.
S12000.
z
A 8000.
o4000.40- [(+45/-4.51315 EXP
o FINITE ELEMENI
0.- I I0. .0100 .0200 .0300 .0400 .0500
LONGITUDINAL TENSILE STRAIN CIN/IN')
Figure 8.4 [(+45/-45)3]. ABAQUS UMAT Subroutine Test Results
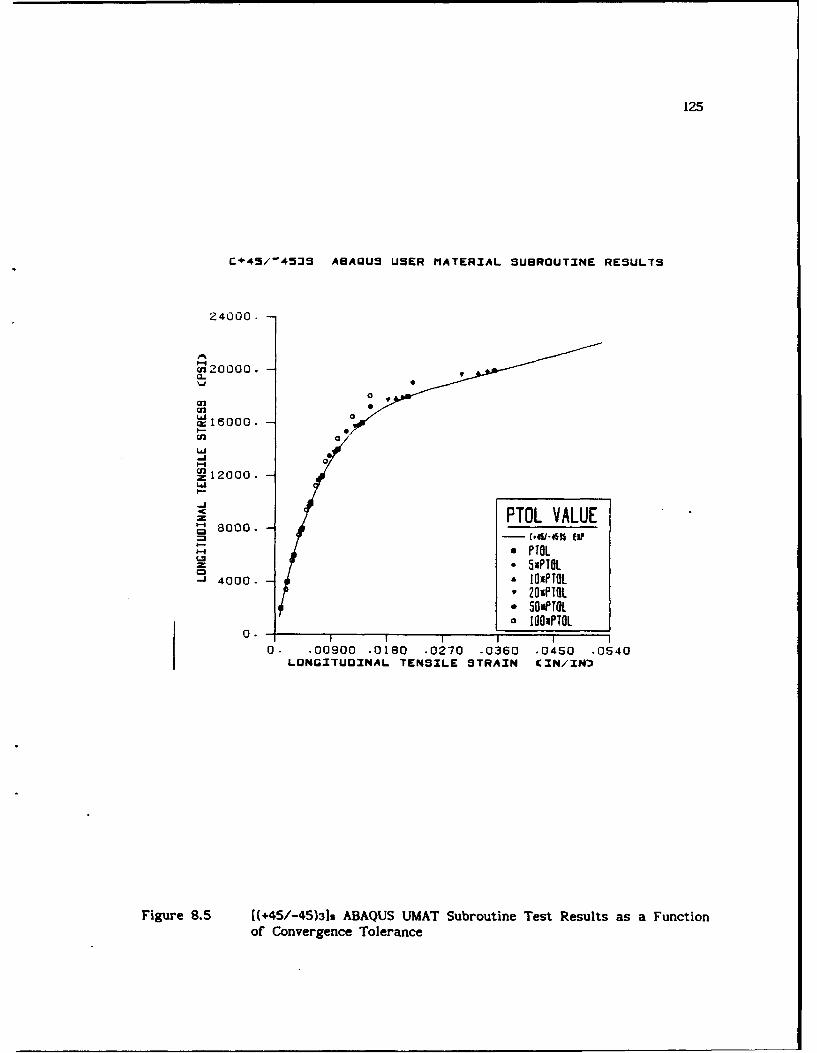
125
C+45/-453 ABAQUS USER MATERIAL SUBROUTINE RESULTS
24000- -
m20000. -
mLwj(= 16000.C-
< PTOL VALUE8000.
--
* PTOLT* PTOL
4000- £ IO0PTOL• 20P0TLo IO50PTOL
S0II I I
0. .00900 .0180 .0270 .0360 .0450 .0S40LONGITUDINAL TENSILE STRAIN (IN/IN)
Figure 8.5 [(+45/-45)319 ABAQUS UMAT Subroutine Test Results as a Functionof Convergence Tolerance
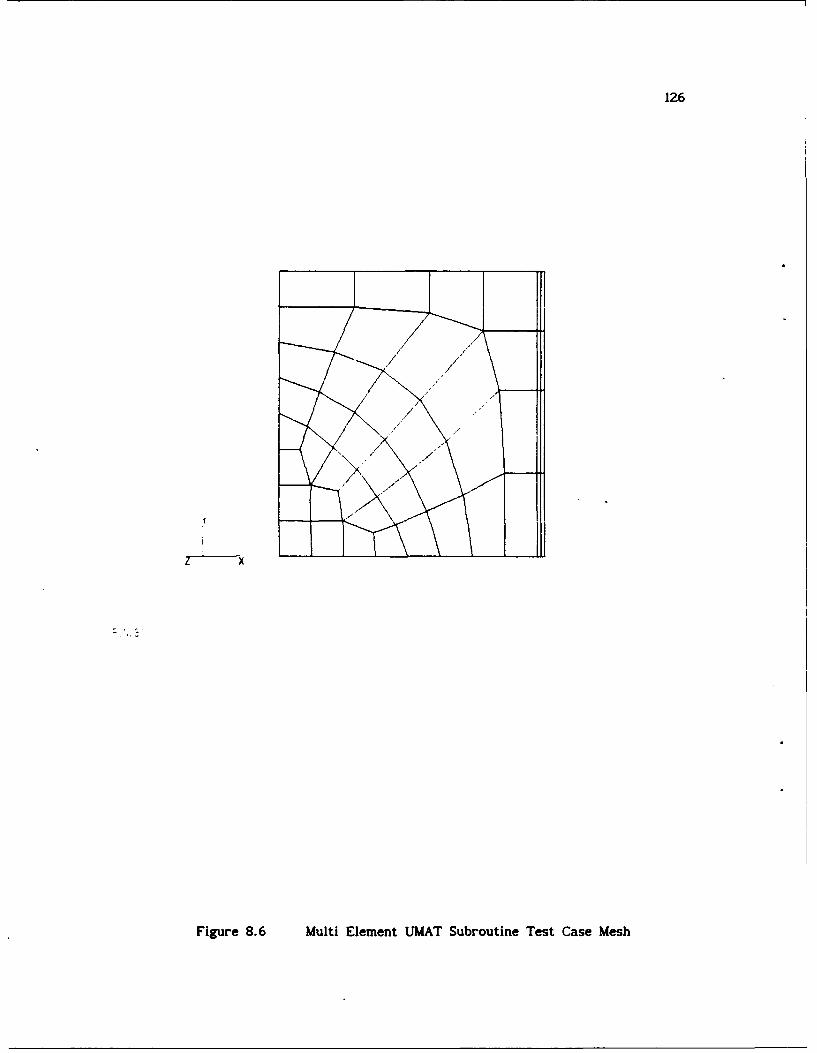
126
/ 1'
Figre8. Mlt EemntUMT ubouin TstCae es

127
Figure 8.7 Nonlinear Stress States for Full Load Multi Element UMATSubroutine Test Cases
128
CHAPTER 9. FINITE ELEMENT MODELING
A three dimensional finite element modeling approach was taken due to
the experimentally observed three dimensional behavior of the pin loaded
coupons. Pin elasticity and pin/plate interactions were included within the
model by a finite element representation of the pin and the use of gap contact
elements between the two structures. Frictionless contact was assumed. Both
linear elastic and nonlinear elastic finite element computations were made
with the ABAQUS finite element code using the UMAT subroutines described in
section seven.
Post processing of the finite element results was done to obtain net,
bearing, and pin boundary sectional stresses (normalized to the maximum pin
bearing stress) through the thickness of the coupon at the various load levels
of the moire analysis. Total coupon front surface in-plane stresses and
strains as well as out-of-plane displacements for the various load levels were
.obtained using the finite element post processing software PATRAN. Through
thickness coupon stresses for the highest load case were also obtained. UNIX
scripts were employed to automate all post processing activities.
9.1 MODEL DESCRIPTION
Four isoparametric element types from the ABAQUS element library were
used in the finite element representation of the pin/coupon structure. Twenty
noded C3D20 solid continuum brick elements were used to model the majority of
the coupon and pin. Twenty-two noded C3D27 variable node solid continuum
brick elements were employed for the inner and outer elements of the coupon
and pin respectively. Fifteen noded C3D15 wedge elements were used for the
inner most portion of the pin. Eighteen noded INTER9 gap interface elements
were used to model the pin/coupon interaction. Figure 9.1 illustrates the
129
physical representation of all four of these elements.
Conventional continuum element formulations and theories govern all
continuum element behavior while the Lagrange multiplier theory was used with1
the INTER9 elements to enforce contact between the pin and the coupon.
Contact between the pin and coupon occurs at a zero separation distance
between respective nodes of the INTER9 elements. Tangential displacements of
these nodes were permitted upon contact.
The three dimensional finite element mesh of the coupon was
constructed using the two dimensional mesh of earlier efforts 1681 that is
shown in Figure 2.3-1. A Fortran program entitled MG3DV was written to
project this mesh in the thickness direction. Program execution transformed
the nodal listing and eight noded quad nodal connectivity listings of this
mesh into the nodal listing and twenty noded brick connectivity listings of a
two element, half thickness three dimensional representation of the coupon.
Additional centroidal and midface nodes were added to the inner most ring of
these coupon elements to form the necessary C3D27 variable noded elements that
were connected to the INTERI9 gap elements.
The three dimensional representation of the pin was constructed using
the preprocessing module of PATRAN. Its diameter measures 0.124" thus leaving
a 0.001" clearance between itself and the coupon. In a similar procedure as
with the coupon, the outer most layer of pin elements (but first two in the
axial z location) were edited to form the matching C3D27 variable noded
elements for INTER9 gap elements. This pin was substructured using the
superelement approach within ABAQUS to reduce computation time. Active pin
degrees of freedom (those associated pin nodes that were common to the pin and
gap interface elements) were retained while all others were condensed by a
Guyan statical condensation technique 1821. However; this substructure was
not used in finite element computations due to an associated error in the
ABAQUS version being used.
Figures 9.2 and 9.3 illustrates the three dimensional discretization
of the pin/coupon structure (less the C3D15 wedge elements that were not
accepted in the ABAPAT translation of the model for PATRAN display). A total
of 312 coupon elements, 216 pin elements, and 36 gap interface elements
comprised this 564 element model.
The quarter symmetry model was bounded by constraining all nodes
130
along the Y axis from movements in the x direction, all nodes along the Z = 0
plane from movement in the z direction, and the pin tip (bottom side) from
movement in the y direction. The constitutive equation constants of Table 8.1
were used for the material constants for the coupon while material properties
of steel were used for the pin.
9.2 FINITE ELEMENT COMPUTATIONS
The finite element computations were done with the ABAQUS finite
element code. A series of six steps were used for the complete loading
history of the model. The first step consisted of a 0.001" y direction rigid
body translation of the coupon to place it in contact with the pin. The
remaining five steps consisted of 300 lb incremental loadings of the coupon
through appropriate cy boundary condition at its far end. A direct
incrementation approach was employed with a single increment being used for
the coupon rigid . body translation. Load steps two and three used ten
increments apiece while all remaining load steps used sixteen increments.
Convergence tolerances were selected as to approach the developer's suggested
1.OE-03 of the maximum coupon reaction force.
ABAQUS restart results files were written at the midpoint and end of
each step (ie 150 lb loading increments). Maximum coupon reaction forces were
obtained from the restart files to insure the fulfillment of convergence
requirements prior to continuation of latter modeling steps. Linear elastic
approximations were made for both laminate orientations with the constitutive
equation constants of Table 8.1 while nonlinear elastic approximations were
made with the appropriate UMAT subroutine described in section seven. Large
displacement theory was employed for the nonlinear elastic approximations.
9.3 PosT PROCESSING OF FINITE ELEMENT RESULTS
Finite element results were obtained at each load level from the post
processing of each restart results file. A UNIX script entitled POSTPR as
well as several other fortran programs were written to accomplish this.
131
Figure 9.4 illustrates a flow chart of the script. As can be seen,
three separate ABAQUS post processing runs (POSTNBP, POSTPBI, and POSTPIN)
were done to create the necessary .FIL files that contained nodal stresses,
strains, and displacements. Net, bearing, and far field coupon data was
generated in POSTNBP while pin boundary radial stress nodal data was generated
in POSTPBI. Top surface pin nodal displacement data was produced from
POSTPIN.
The nodal data contained in each *.FIL file was then sorted and
averaged at the nodes for the various sections (ie bearing, net, far field,
and pin top) by a series of fortran programs. Actual and pin bearing stresses
(normalized to maximum pin bearing load S) along with strain values and
displacements were obtained through the thickness of the coupon and placed
into the proper format for the xy plotting routine of PATRAN PPLOT by programs
NBPSECT, PBSECTC, PBSECTI, and PINSECTP.
Total coupon stress, strains, and displacements were nodal averaged
and placed in proper format for PATRAN post processing software through a
fortran translator program entitled STABAPAT. The translator was written to
operate on the *.FIL files (generated from the ABAQUS post processing runs) to
create smaller PATRAN nodal data files in liu of larger files obtained from
the commercially available ABAPAT translator.
Display of coupon stresses and strains were done using the
aforementioned PATRAN nodal data files and the post processing package PATRAN.
PATRAN session files were written to display these results throughout the load
history of each laminated coupon for both the linear and nonlinear elastic
finite element analysis. Execution of PATRAN and these session files were in
turn controlled by various UNIX scripts for file manipulation and hardcopy
printing within the Computational Mechanics local area network.
9.4 FINITE ELEMENT RESULTS
Results obtained from post processing of finite element restart
results files are presented in the following section. A presentation format
to illustrate the effects of nonlinear material behavior and through thickness
variations upon pertinent coupon stresses throughout the loading history was
selected.
132
Figures 9.5 through 9.16 illustrate net, bearing, and pin boundary
normalized sectional stresses for all major load levels of the [(0/90)3,0]9
linear and nonlinear elastic analyses. Both mid and front surface coupon
locations (ie. Z = 0.0000" and Z = 0.0625") are shown. Figures 9.17 through
9.28 illustrate similar results for the [(+45/-45)3], analysis.
Intralaminar shear stresses and strains are depicted in Figures 9.29
through 9.38 for all major load levels of the 1(0/90)3,01. linear and
nonlinear elastic analysis. Normal Y stresses and strains are shown in
Figures 9.39 through 9.48 for all major load levels of the [(+45/-45)318
linear and nonlinear elastic analysis. Out-of plane displacements of the
nonlinear analysis of both laminate orientation are presented for all major
load levels in Figures 9.49 through 9.53. Through thickness stresses on the
front surface of each coupon element layer are shown in Figures 9.54 and 9.55
for both laminate orientations of the linear and nonlinear elastic analysis.
The [(0/90)3,01 nonlinear intralaminar shear modulus is shown as a
function of load level in Figures 9.56 through 9.60. Pertinent [(+45/-45)3]s
nonlinear normal constitutive constants are shown as a function of load level
in Figures 9.61 through 9.65.
Top surface pin displacements as a function of load level are shown
for both the linear and nonlinear elastic analysis of both laminate
orientations in Figures 9.66 through 9.69.
Tables A.1 through A.4 of the appendix list the historical
computational aspects of the linear and nonlinear [(0/90)3,01. and
[(+45/-45)3] analysis.
9.5 MODELING OBSERVATIONS
9.5.1 [(/90)3 ,0 LAMINATE CONFIGURATION
Both pin bearing load normalized net and bearing [(0/90)3,0]s
sectional stresses were slightly higher for the nonlinear elastic analysis
than for the linear elastic analysis. This variation was more predominant at
higher pin load levels. Both linear and nonlinear elastic pin bearing load
normalized [(0/90)3,0] radial stresses (as determined from the gap interface
133
elements) departed from the often assumed 4wcose distribution. This was in
part due to the formation of the contact angle which was created by the
initial 0.001" clearance between the pin and the coupon. The contact angle
had an initial angle of 55*and was seen to grow with progressive loading as
the [(0/90)3,0]= coupon was wrapped around the pin. A maximum contact angle
of 74 0 was seen to form at the highest load level. This partial contact
resulted from a net section Poisson contraction affect. The nonlinear elastic
intralaminar shear material assumption .caused a significant redistribution of
the 1(0/90)3,0]s radial stresses. These stresses were reduced at an angular
location that coincides with the location of maximum coupon intralaminar shear
stress and were increased elsewhere within the contact region. This
redistribution effect was increasingly seen with progressive loading. A
reduction in contact angle was also seen for the nonlinear material
assumptions at the Z = 0.0000" nodal plane yet not at the Z = 0.0625 " nodal
plane. An increase in the 1(0/90)3,0]s circumferential stress (as determined
from the inner most ring of coupon elements) was observed from the nonlinear
elastic material assumption.
The simply supported pin condition was found to cause a small through
thickness variation in almost all sectional stresses for both the linear and
nonlinear elastic [(0/90)3,0]s analysis. Front surface linear and nonlinear
elastic coupon net and bearing sectional stresses appeared to be slightly
larger than their midsurface counterparts due to the nature of the pin
deflection and resulting load transfer. Linear elastic coupon radial stresses
also followed this trend while nonlinear elastic [(0/90)3,01. radial stresses
were found to be slightly higher and slightly lower in front of and behind the
angular location of maximum intralaminar shear stress respectively. Both
linear and nonlinear elastic [(0/90)3,01 coupon front surface circumferential
stresses appeared to be slightly higher and lower in front of and behind the
angular location of maximum intralaminar shear stress respectively than their
midsurface counterparts.
The effects of the nonlinear elastic material behavior were quite
evident when viewing the [(0/90)3,01, coupon intralaminar shear stress / shear
strain results. Progressively higher intralaminar shear strains were observed
along the locus of maximum intralaminar shear strain within the coupon for the
nonlinear elastic analysis in comparison to the linear elastic analysis. This
134
variation increased with increasing pin load level with a more than a two fold
increase at the highest pin load level. In a similar fashion, progressively
higher linear elastic intralaminar shear stresses were observed along the
locus than their nonlinear elastic counterparts. This variation also
increased with pin load level with almost a three fold increase at the highest
pin load level. Review of the intralaminar shear modulus along this locus and
throughout the coupon revealed significant reductions (50%) at even the lowest
of pin load levels. More than a ten fold intralaminar shear modulus reduction
was observed at the highest of pin load levels. These results are not
surprising given the observed highly nonlinear intralaminar shear stress
strain behavior.
Through thickness stresses appear to be negligible in comparison to
in plane stress magnitudes for the [(0/90)3,0]s laminate. The highest of
these values appeared closer to the midsurface of the coupon. The nonlinear
elastic intralaminar shear stress-strain assumption acted to increase through
thickness stresses slightly.
Out-of-plane deformations for the nonlinear elastic analysis appeared
to be considerably lower than those obtained from the projection moire study.
These variations indicated the presenco of a severe through thickness matrix
material nonlinearity or failure. However; the deformations appeared to agree
in a qualitative sense in their similar shapes. The effects of the crossply
laminate orientation was seen in the oblong shape of the front surface
deformation patterns.
9.5.2 [(+45/-45)3] , LAMINATE CONFIGURATION
Pin bearing load normalized [(+45/-45)319 net section stresses showed
a reduction for the nonlinear elastic material analysis in comparison to the
linear elastic analysis. However; maximum net section stresses in the
vicinity of the pin appeared to be unchanged. This yieldiag phenomenon
becomes increasingly apparent with higher pin load levels. Normalized bearing
stresses appeared to be lowered significantly for the nonlinear elastic
analysis in comparison to the linear elastic analysis. An outward shift along
the bearing section of this maximum value was observed. As with the net
135
section stresses, these effects became increasingly apparent with higher pin
load levels.
Both the linear and nonlinear elastic normalized [(+45/-45)3]s radial
stresses departed from the often assumed 4mcosO radial pressure distribution.
As with the 1(0/90)3,0] laminate, contact angles less than 90°we.e obtained..
These contact angles grew with progressive pin load level as the coupon
wrapped itself around the pin until a maximum of 80owas observed. The
nonlinear elastic material behavior redistributed the radial stress by
significantly lowering its value near the pin bearing section and increasing
it for the remainder of the contact angle. Somewhat higher contact angles
were observed with nonlinear elastic material assumptions as compared to
linear elastic assumptions. An increase in circumferential coupon stresses
(as calculated from the inner most ring of coupon elements) was noticed for
the nonlinear elastic material assumptions in comparison with the linear
elastic analysis. All of these effects increased with increasing pin load
level.
Both linear and nonlinear elastic net, bearing, and circumferential
[(+45/-45)3]s normalized sectional stresses appeared to be unaltered by the
simply supported boundary condition of the pin. However; front surface radial
stresses appeared to be slightly higher than their midsurface counterparts.
The redistribution of these radial stresses for nonlinear elastic material
assumptions was shown to be greater for front surface coupon location than
for the midsurface.
Progressively higher nonlinear elastic cy coupon strain values were
seen in and around the net and bearing regions of the [(+45/-45)3]s laminate
than for the linear elastic analysis. The largest variations between the two
analyses were observed closest to the pin. This ductile behavior, although
almost unnoticeable at lower pin load levels, becomes more apparent at higher
pin load levels. As much as a two and three fold increase in bearing and net
section Cy strains were respectively observed. Corresponding oy stresses
appeared to follow suit with linear elastic stresses being higher than those
of the nonlinear elastic analysis. However; appreciably smaller increases in
bearing section 40y stresses were observed than net section stresses for the
linear elastic analysis in comparison to the nonlinear elastic analysis.
Review of the Ca and C22 angleply constitutive equation constants throughout
136
the coupon revealed significant reductions in the bearing section and along
the fiber directions in the net section even at the lowest pin load level.
These zones of "softened" material behavior grew with increasing pin load
level yet were bounded by the constitutive equations of equation 7.10 and the
values in Table 8.1.
As in the case of the [(0/90)3,0]. laminate, through thickness
[(+45/-45)31. stresses appear to be negligible in comparison to in plane
stress magnitudes. The highest of these values appeared closer to the
midsurface of the coupon. The nonlinear elastic material assumptions acted to
increase through thickness stresses slightly.
As in the case of the [(0/90)3,01. laminate, out-of-plane
deformations for the nonlinear elastic analysis appeared to be considerable
lower then those obtained from the projection moire study. These variations
indicated the presence of a severe through thickness matrix material
nonlinearity or failure. However; the deformations appeared to agree in a
qualitative sense in their similar shapes. The effects of the angleply
laminate orientation was seen in the "butterfly" shape of the front surface
deformation patterns.
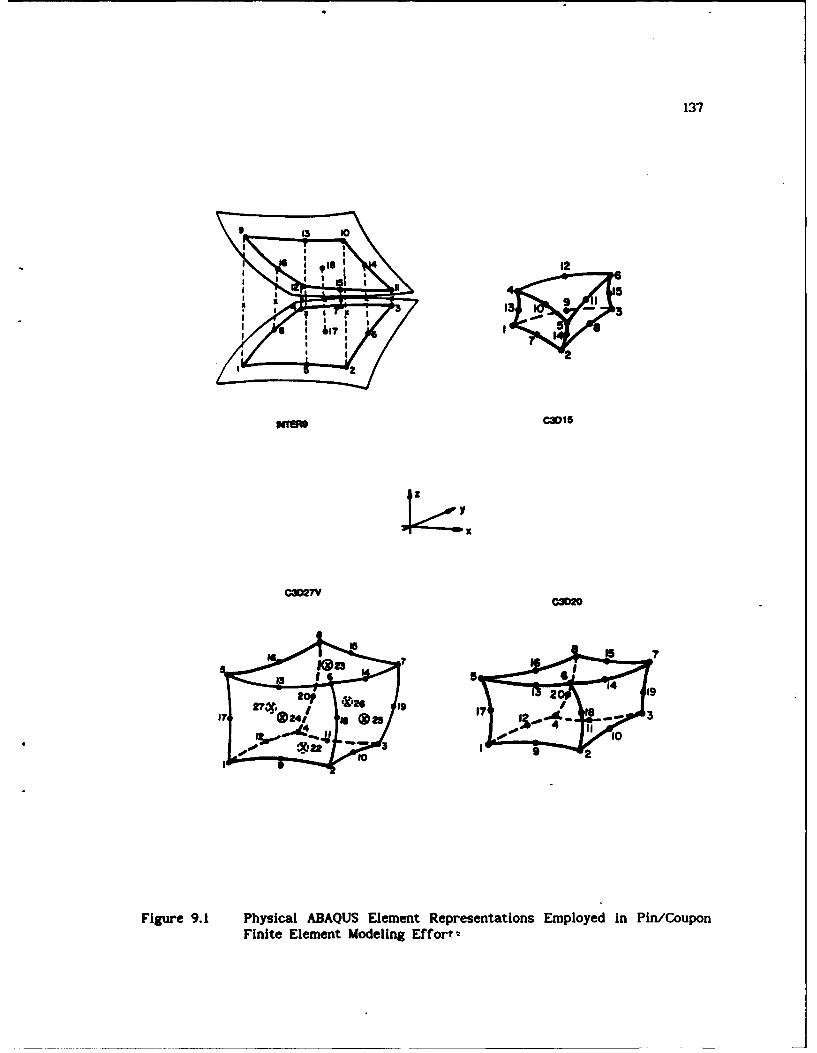
137
13 10
'010 2
H~in caoi
151 1
F~gue 91 Pysicl AAQU EleentRepesetatins mplyed n Pn/CupoFinit Elmn1Mdln3Efr
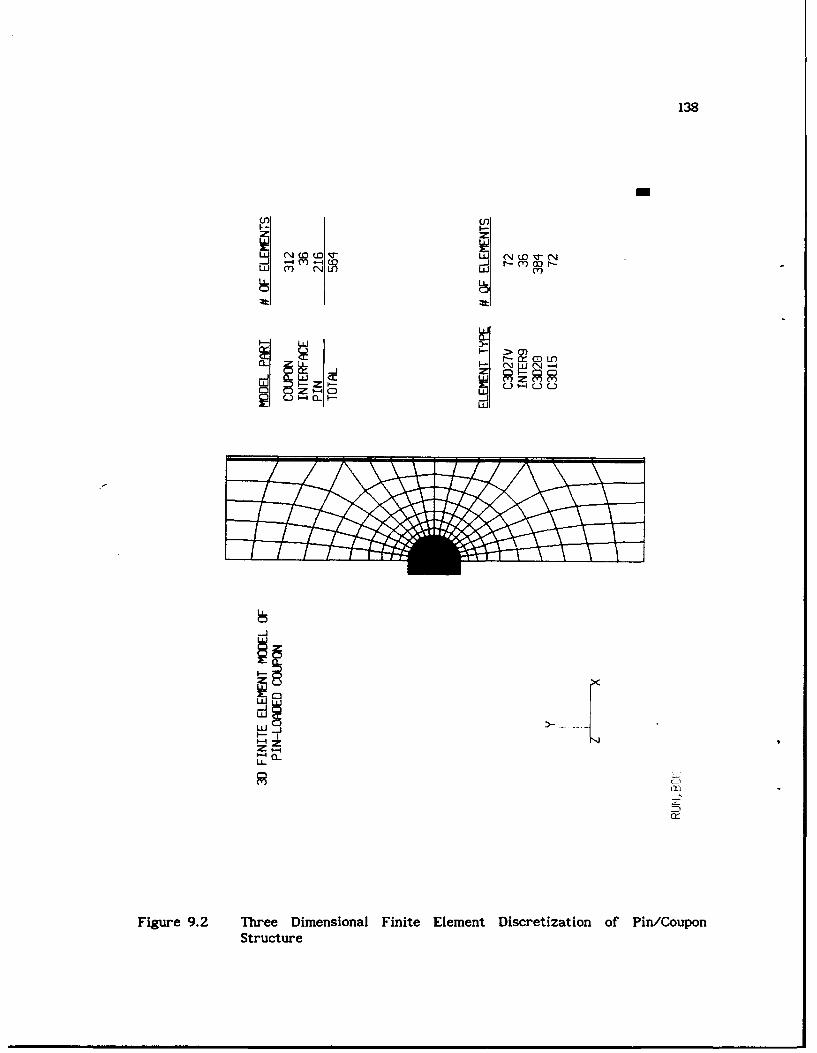
138
Ld 4 r- M 00r--UJ
U-J0
CL-
M L 0
Fiur.2 Tre imnioa Fiit Eleen Dieizto of Pi/ouoSu t -z 0e:
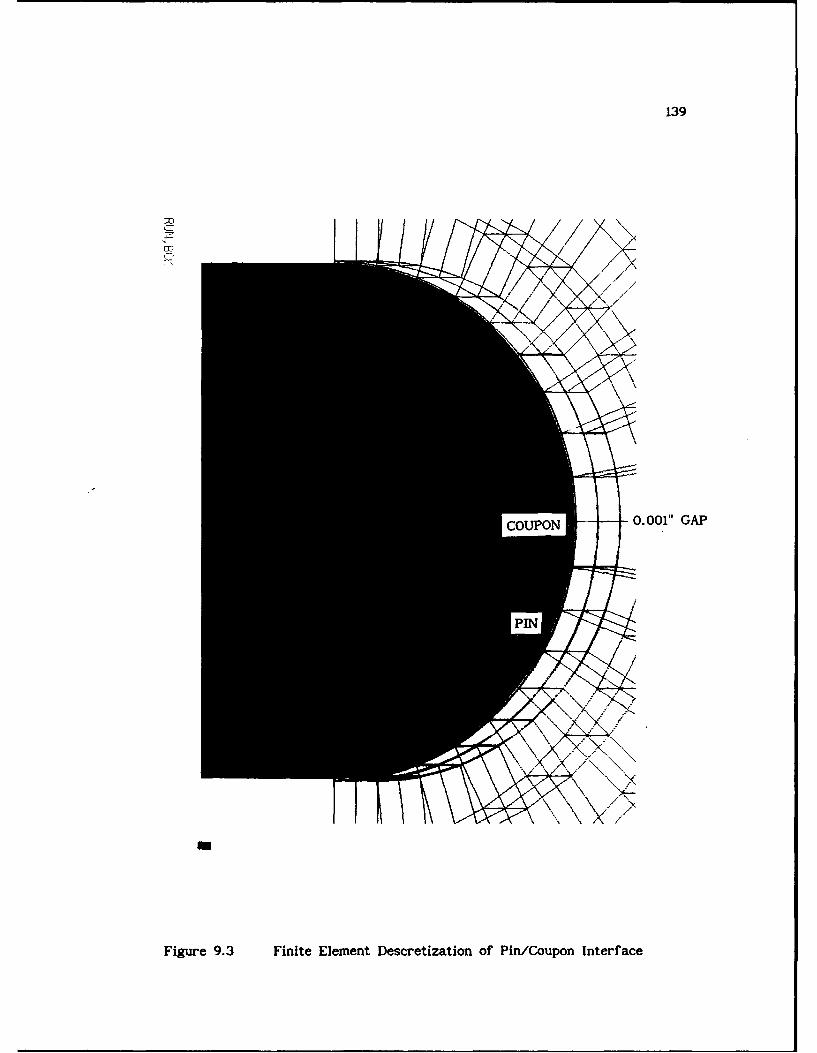
139
COUPON 0.001" GAP
mi
Figure 9.3 Finite Element Descretization. of Pin/Coupon Interface
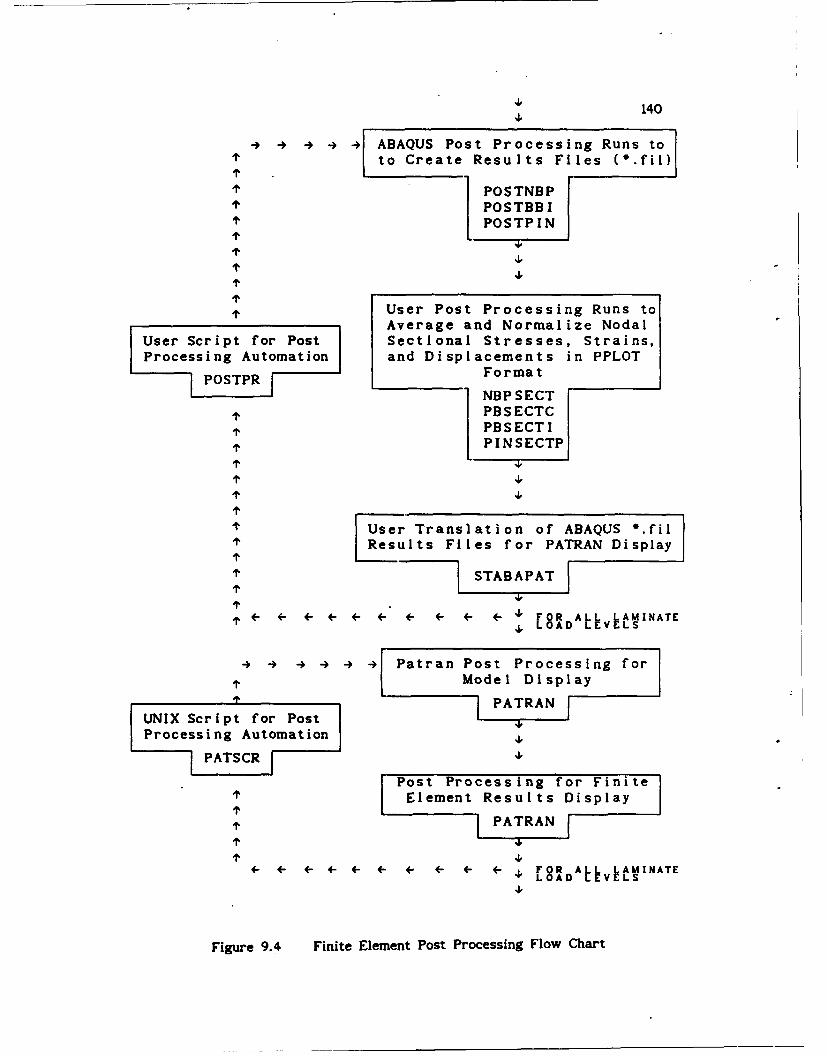
4,140
- - - 4 4 ABAQUS Post Processing Runs toto Create Results Files (O.fil)
l POSTNBPPOSTBB I
POSTPIN1"
IT. 4,1" 4,
User Post Processing Runs toAverage and Normalize Nodal
User Script for Post Sectional Stresses, Strains,Processing Automation and Displacements in PPLOT
POSTPR j Format
NBP SECTI PBS ECTC
PBSECTIPINSECTP
1' 4,1" 4,
User Translation of ABAQUS *.filResults Files for PATRAN Display
1STABAPAT1"
4 4 4- 4 4 4 4 F 4, FOR AfL VAMINATE4, LOAD ELS
44 4 4 Patran Post Processing forModel Display
I'l [ PATRAN
UNIX Script for PostProcessing Automation 4
PATSCR 4,
Post Processing for FiniteElement Results Display
1, [PATRAN
- - 4 4 4 - 4 4- 4, F °0o RDA Lk~VA INATE
4,
Figure 9.4 Finite Element Post Processing Flow Chart
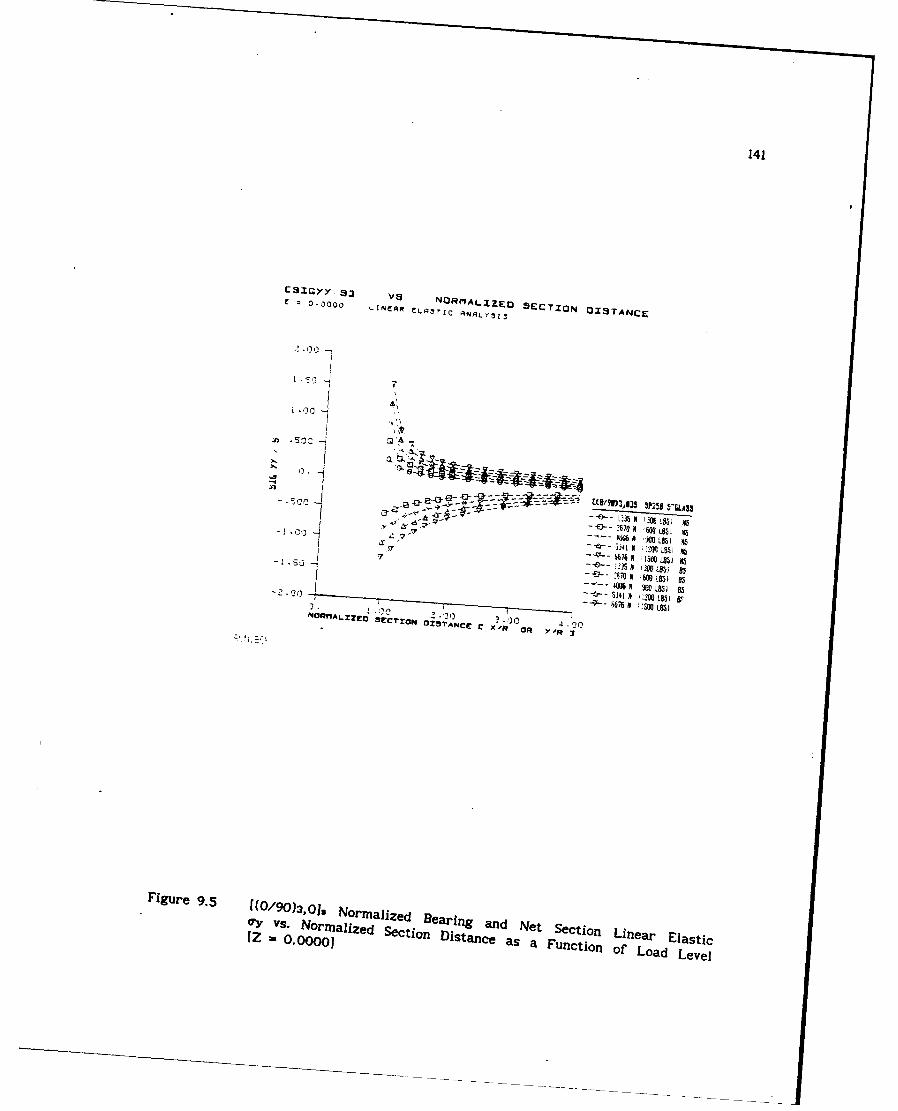
141
CS~ yvs NORM.ALZED SECTION OSA C0t0000 CLA.3rrC ARLy1, I TAC
=1 .1 "
SrrIN LK
Figure~~ 9L5 IO9),1 Normalized34 BeNn and NeXet5 ina lsi0 y v . N o m al z e d e cti n D sta n e a s a F n cti50o Lo a d L eS eAV O.Ooooj
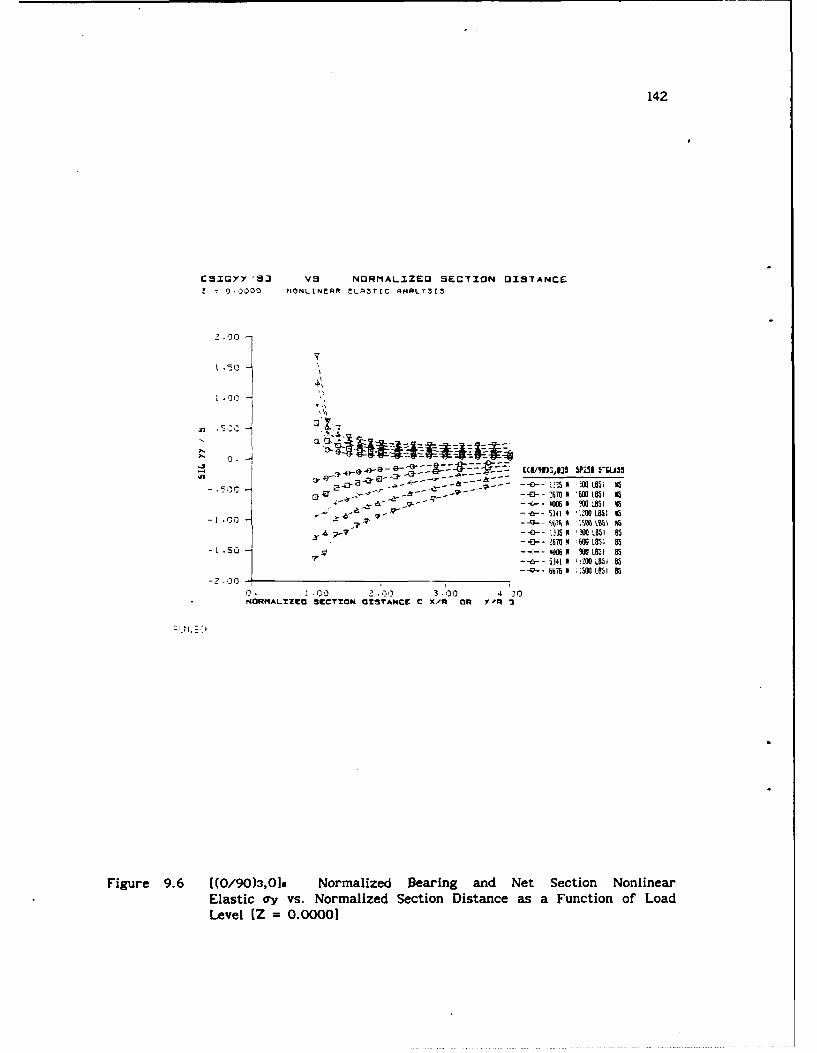
142
CSI YY 5J VS NORMALIZED SECTION DISTANCE
0.0000 NONLINEAfR ELA3TIC INALr35
I:::]__.a_________60___L60 IL I I
2.L 130 2 .00 3 .00 4.)0PdCRtALXZCO SECTTOM OMSTAMCC C X/q OnY~
Figure 9.6 [(0/90),0]s Normalized Bearing and Net Section NonlinearElastic ey vs. Normalized Section Distance as a Function of LoadLevel (Z = 0.00001
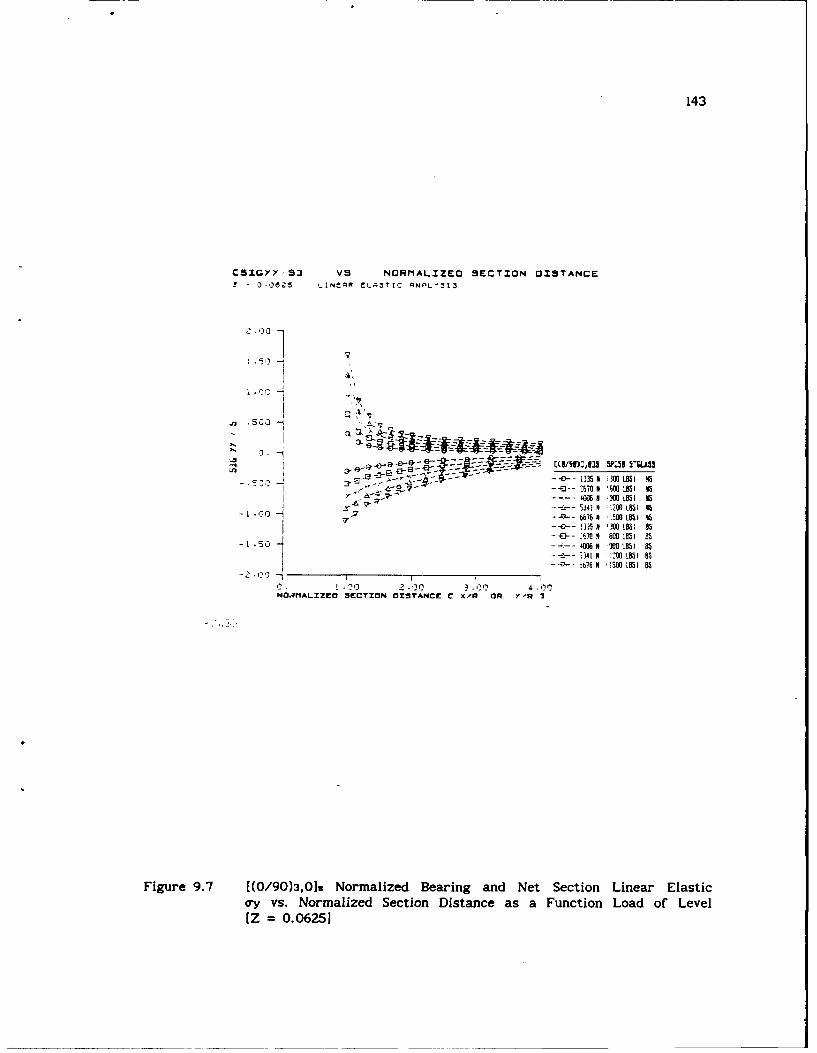
143
CSIGyy ,. VS NORMALIZED SECTION DISTANCE
f = 03-065 LENCAR eLA3TIC AN'L"313
t .s5a -
*- -- 0- 5-GLA 3
S- --- 0--- 133t00 OJ]L.I 5G% 3,IN 'M L851 N5
-- '7--- 6676 A M , : B0 LS1 5
2 .00 -- 0
NOAMALXZO SECTION OISTANCE C X/ OR Y'R 3
Figure 9.7 ((0/90)3,0] Normalized Bearing and Net Section Linear Elastic0y vs. Normalized Section Distance as a Function Load of Level[Z = 0.06251
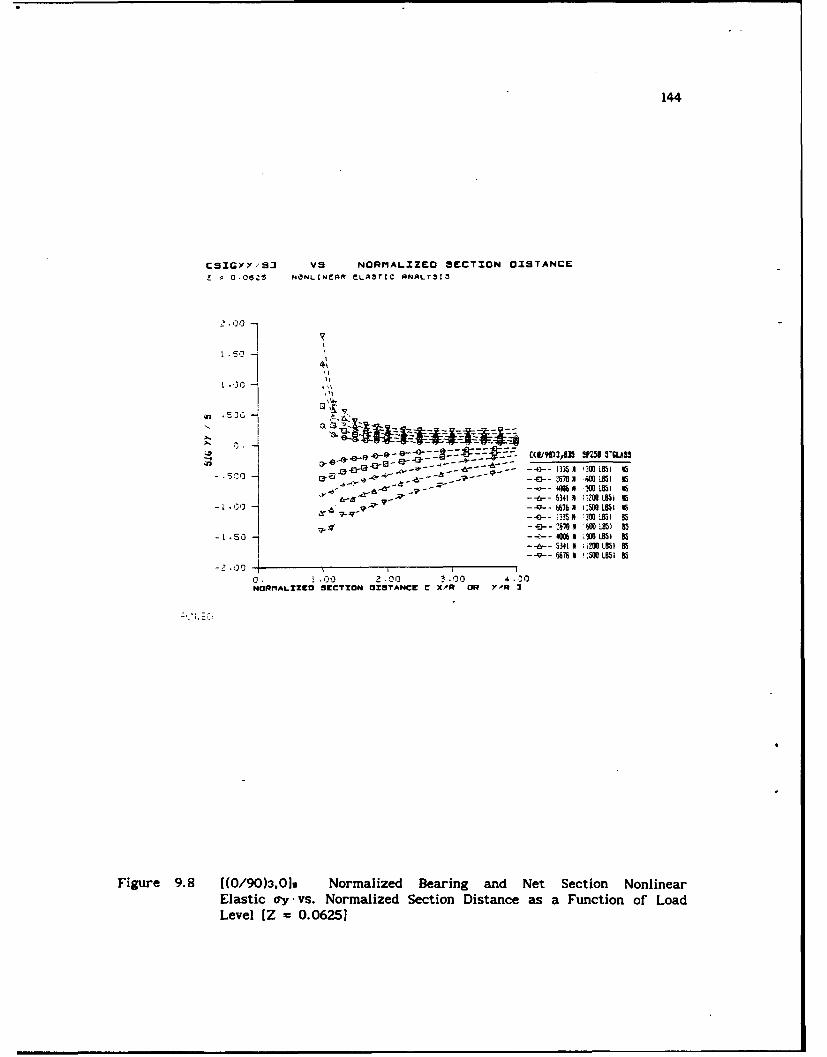
144
CSIGYY/,,- VS NORMALIZEO SECTION DISTANCE
E- 0,065 NONLINEAR eLAlriC RNALTZ13
1.50
IS
--a--,# 5 F41 4 3OS S
-t -- 5-- I676 11 L85i NS
-- 0 -3 5N L383 85583) 83
- .5U 4-- 00-- SoI I OIS I Is
-2. 00 -7 5I 8
0 .00 2 .001 .00 4 .00NORMIALZZCO SEf TN OTSTANCE C X.ft OR Y- R 3
Figure 9.8 [(0/90)3,012 Normalized Bearing and Net Section NonlinearElastic oy vs. Normalized Section Distance as a Function of LoadLevel [Z = 0.06251
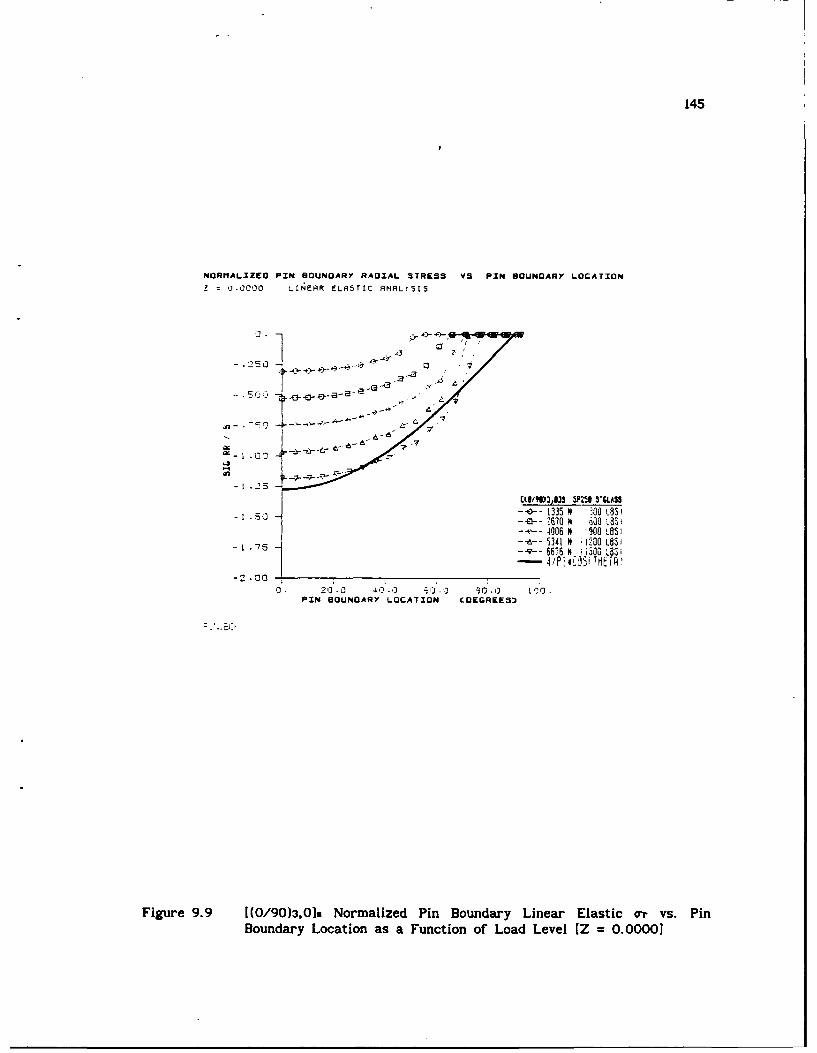
145
NORMALIZED PIN BOUNDARY RADIAL TRESS VS PIN BOUNDARY LOCATION
? 0 -0000 L .EAR EL RsTtC ANALr515
-a -- -
-7
-i .5 -
-.1 -Z70N 60L
20 -S- 1335 N 300 LOS i
-. a-- '670 N 6aa 85-- t'- 4006 N '00 L 8Os--d-- 5341 1N [200 LOS i-.-- 66 76 N i500 LO3i- 4/P! ,Ce _i TH AET
Z 0 013 . 10.
P I N B O U N D A R Y L O C A T I O N "O E rGR E E S '
F igure 9.9 1(0/90 )3,0]s N orm alized Pin Boundary L inear E lastic o vs. P inBoundary Location as a Function of Load Level [Z = 0.00001
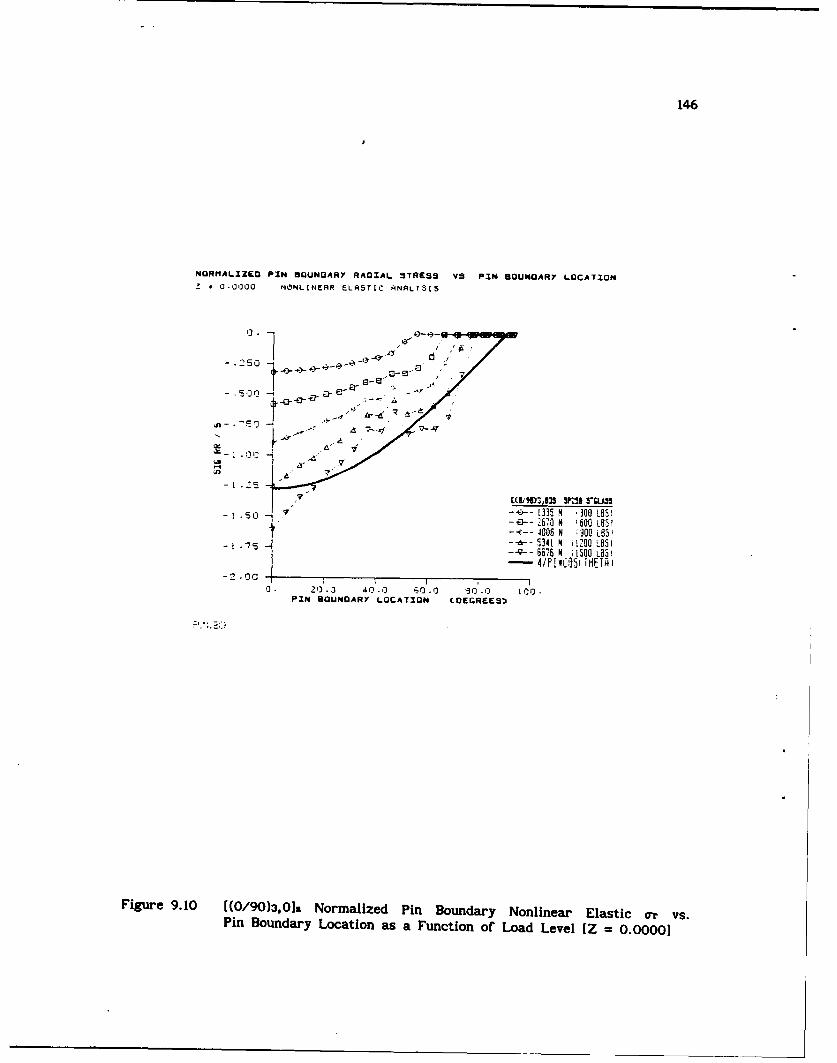
146
NORMALIZED PIN BQUNOARY RAOAL UTRESS VS PIN BOUNOARY LOCATIONZ 0.0000 NIONLINERR ELR5TC ANALYSIS
00. 0-3 .601- -
./3 1 O 0 / I
1.250
-0-
-
.7 E(UM3l,l33 91251 5 LASS.. o 7 -. 1 335 N -300 L951
-i. 0 -- 250 N '600 L851-- a-- 4006 H i300 L85I-,-- 34L " i200 Losi-- 66-- 5575N 1 500 LaS'
0-0 4/P[L0Oh THETI I
0. 210.0 410.0 50-0 0.0 1o.PIN BOUNDARY LOCATION COE4REE3S:)
Figure 9.10 ((0/90)3,0]s Normalized Pin Boundary Nonlinear Elastic or vs.Pin Boundary Location as a Function of Load Level [Z = 0.0000)
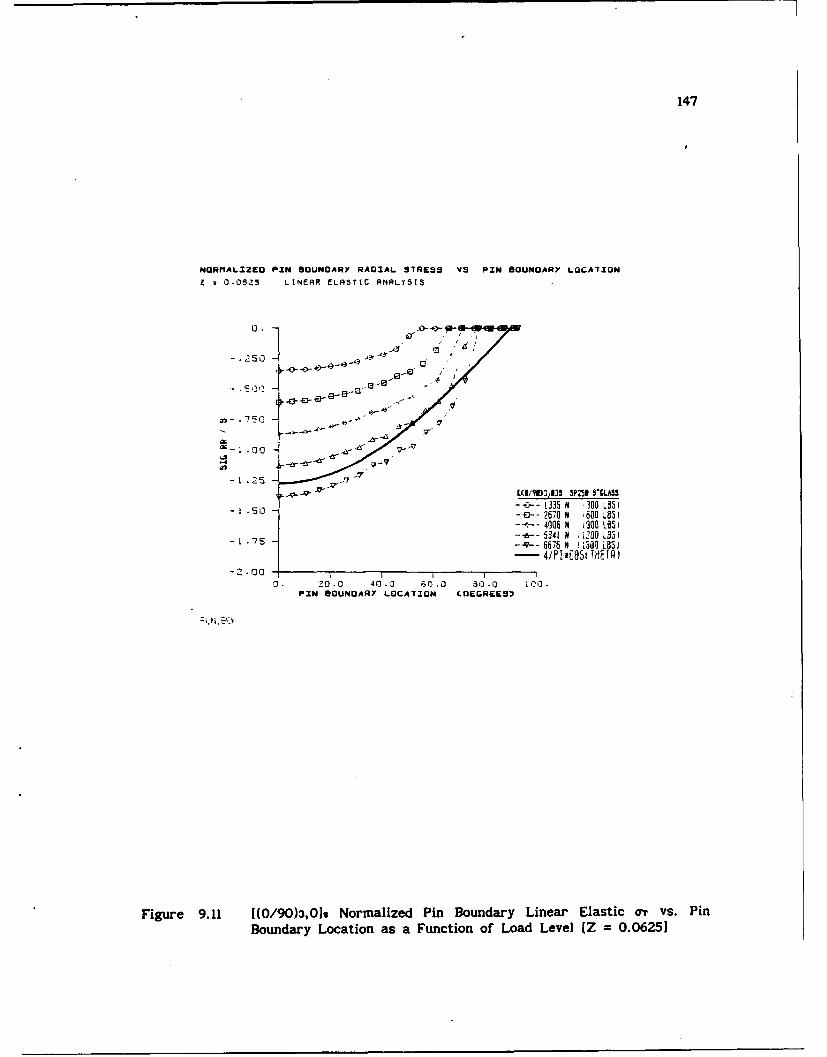
147
NORMALIZEO PIN BOUNOARY RADIAL STRESS VS PIN BOUNOARY LOCATION
Z 0-06Z5 L NERR ELRSTIC RNRLY5
,or
--< )- -a -3 E l 1 3O B
--3- 40.14 L O i3
1 12
--9- 9-CI9~I Sp 5 -C rLASS
- s-t-C-- L335 N ; 30 LOSI5 0 - -- 2 6 7 0 N ,600 L O S J- 4-- 4 6M t Igo LosI
-1.75 -- 6-- 5341 N (200 LO5I-..-66M6 N !L500 LOSiJ
0. 20.0 40.10 i 0 .3.0 00 .PIN BOUNDARY LOCATION COEGREES.'
Figure 9.11 [(0/90)3,0 ] Normalized Pin Boundary Linear Elastic Mr vs. PinBoundary Location as a Function of Load Level [Z = 0.0625]
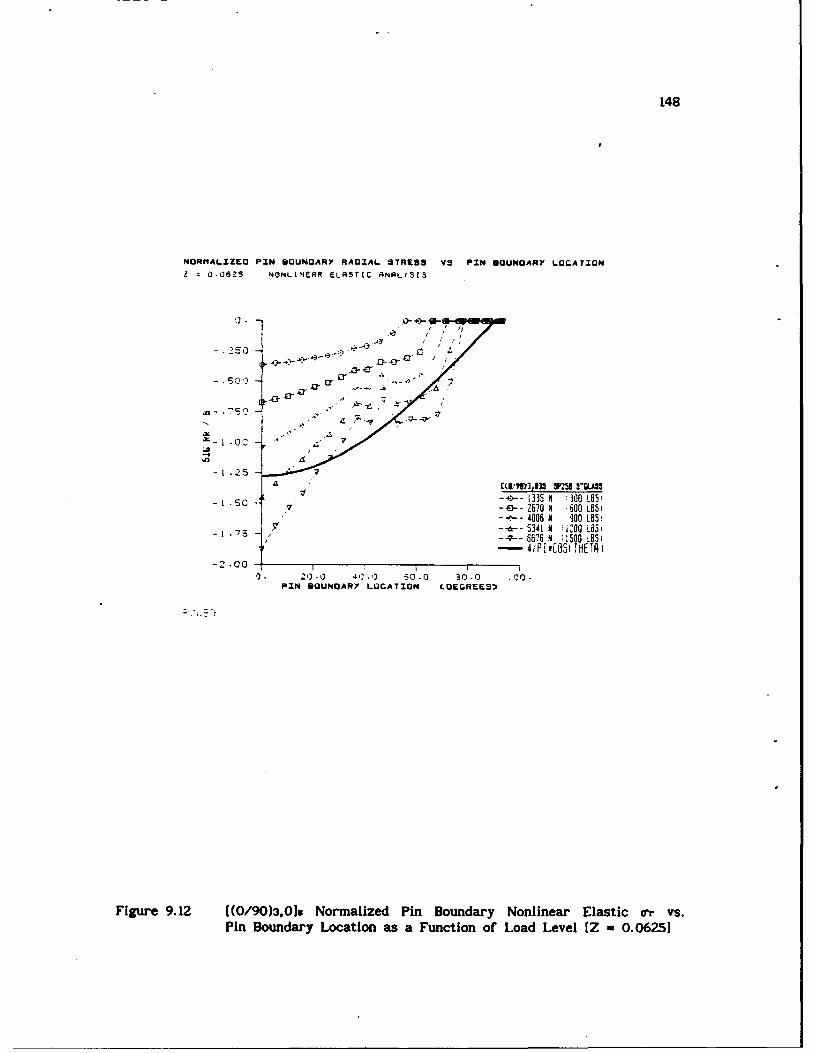
148
NORMALIZED PIN BOUNOARY RAOIAL STRESS VS PIN BOUNOARY LOCATION0.0625 NONL[NEAR ELASTIC ANRLf5IS
-.:250 ~ ~ Z -.o •
" 217 I . 3- L
- . E,'3-3pU 929 r-LAu5
7 ,50 1335 N :300 LOS,--E-- 2670 A .00 LOSI
4006 N 300 LOS-1 .75- 5341 M 1900 i Hs
-v-6676 M 115a0 LOSi- 4;FE,#CS jtETAj
PIN BOUNOARY LOCATION COGREES"
Figure 9.12 ((0/90)3,O]o Normalized Pin Boundary Nonlinear Elastic 0-r vs.Pin Boundary Location as a Function of Load Level [Z = 0.06251
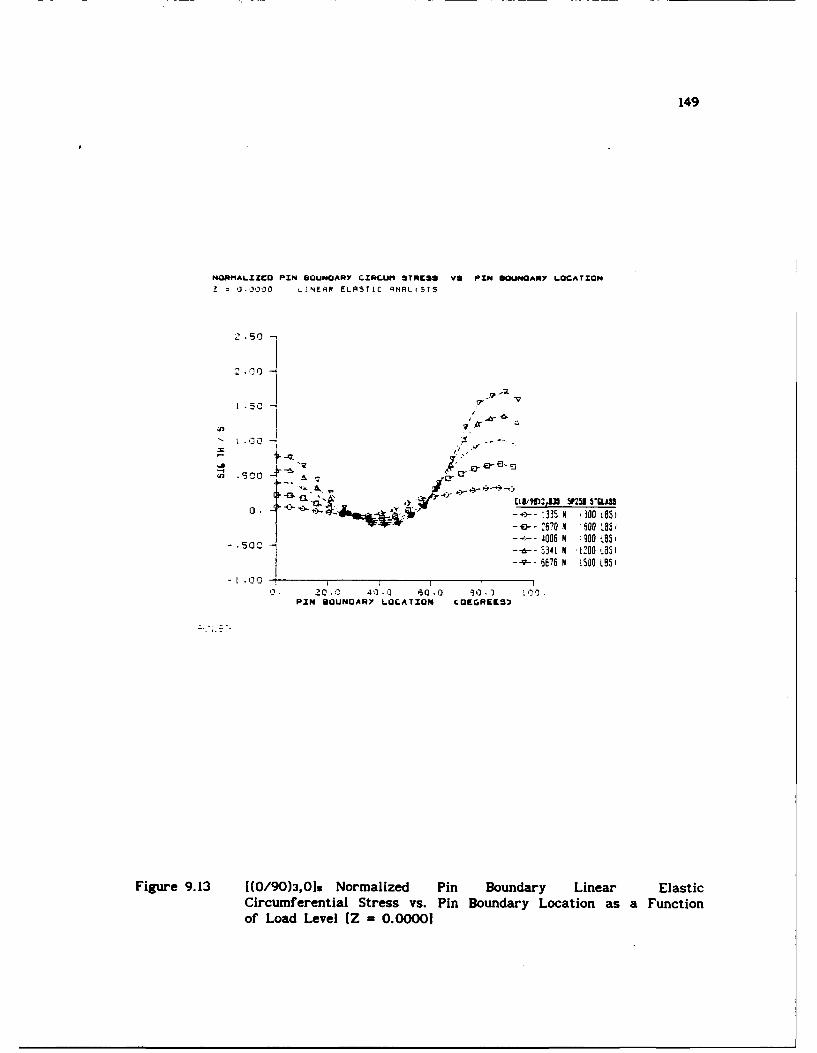
149
NQRtALIZO PZN 9UNDARY CIRCUII STRESS V2 PIN OQUNOARY LOCATION
Z 0.000 ."EAR ELASTLC qNPLr5[5
.50
1 .50
.900 -
0 .00 M 1
o . ,_ ->--L]51 N ,200 L81
"1a= - -- 2.67G 6 "00 LS
57-6-- N !500 L95
-1 00 -
- . .0 z 4 1) P . 0 O1 .0)PIN IOUNOARY LOCATION COEGREES')
Figure 9.13 [(O/90)3,ols Normalized Pin Boundary Linear ElasticCircumferential Stress vs. Pin Boundary Location as a Functionof Load Level [Z = 0.00001
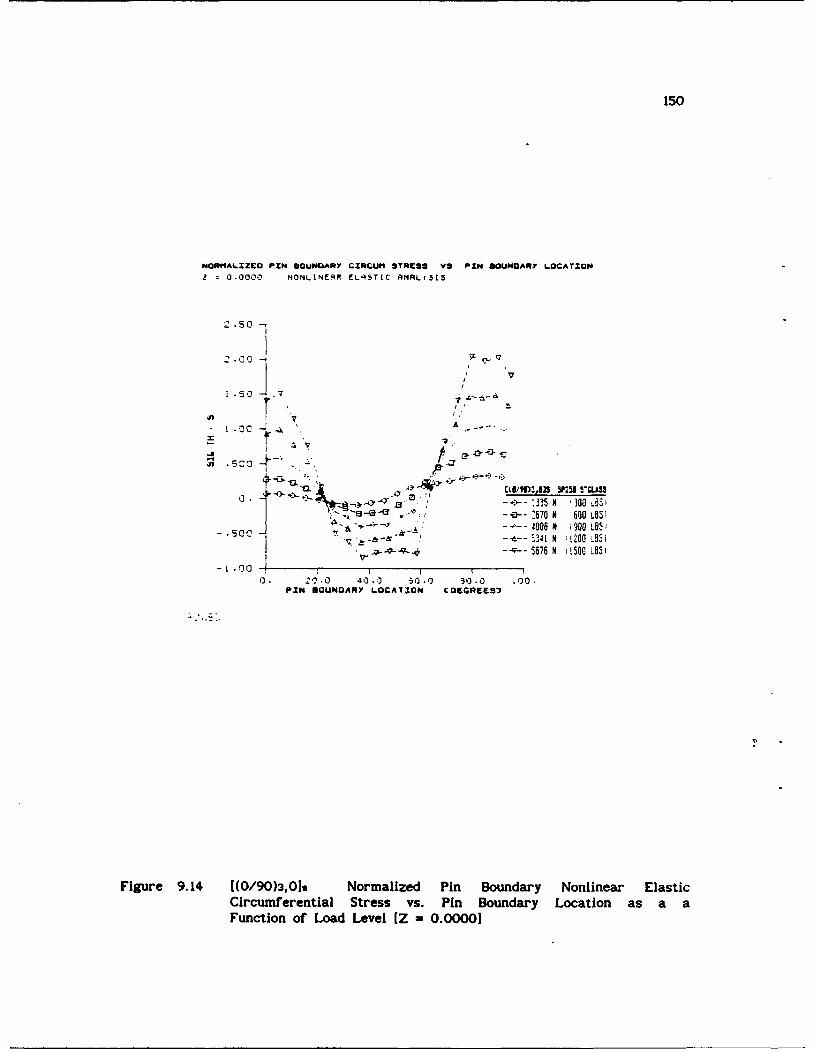
150
NORMALIZEO PIN BOUNDARY CIRCUM STRESS VS PIN BOUNOARY LOCATION
Z 0.0000 NONLINEAR ELASTIC ANRLr3S5
.50 -0
1 .50] --
. . . i > ) ,, LI/9g)3,g1s 21 S'LSS
0. -- ~--,335 N '300 35 1
-E)-- 670 N 600 L851
-~~~~ .50~-'-~-341 N L200 8031
V.5676 N 150 L8S'
-1.J00.0
0 20.0 40.) 50 3 50 .0 0PIN BOUNOARY LOCATION COEGREES)
Figure 9.14 [(0/90)3,019 Normalized Pin Boundary Nonlinear ElasticCircumferential Stress vs. Pin Boundary Location as a aFunction of Load Level [Z = 0.00001
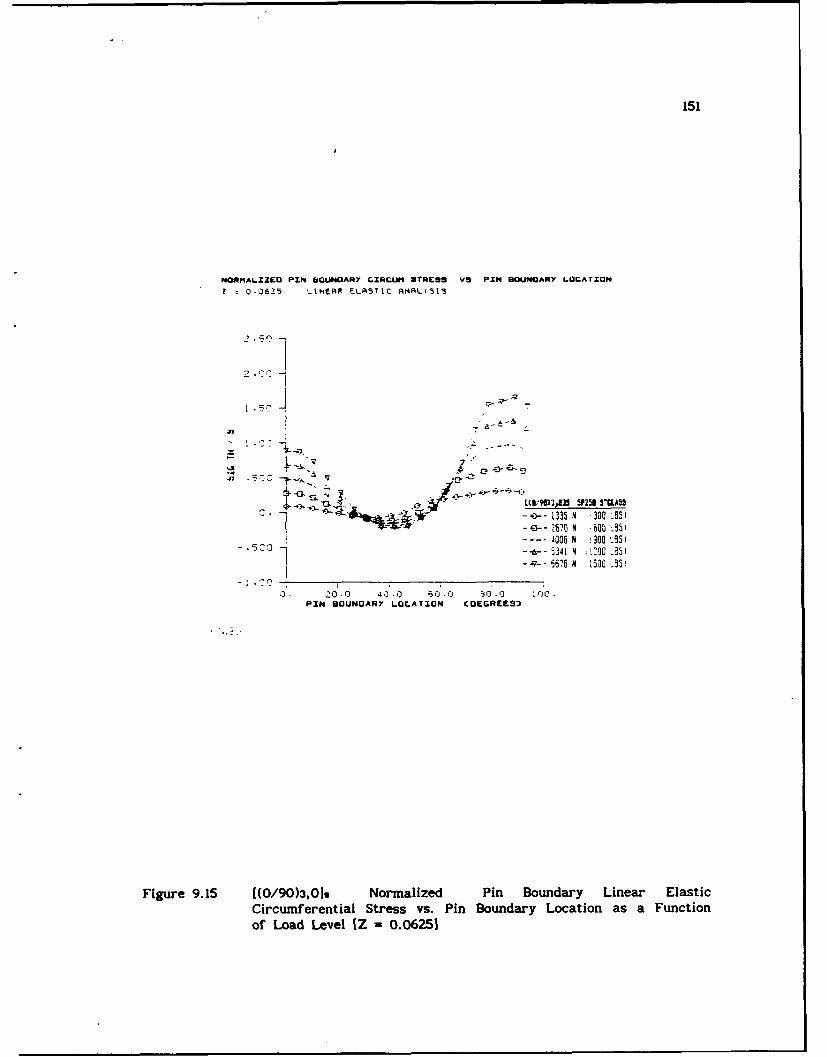
151
NORMALIZED PIN 8OUNODARY GIRCU" STOESS VS PIN BOUNDARY LOCATION
E 0.0625 LINRR ELASTIC ASAIL513
I -H'TI ',7 -
2'*-
A7
I i, -4 . ...... .
.- 3-- 135 N 300 LOS)- '6- .00 N W 0 0S1
4006 N A00 LS_ 1.5341 N !90 A5
0 . 0 0 0 .0 .0 0 00PIN BOUNOARY LOCATION COEGR.ES
Figure 9.15 1(0/90)3,O1 Normalized Pin Boundary Linear ElasticCircumferential Stress vs. Pin Boundary Location as a Functionof Load Level [Z = 0.06251
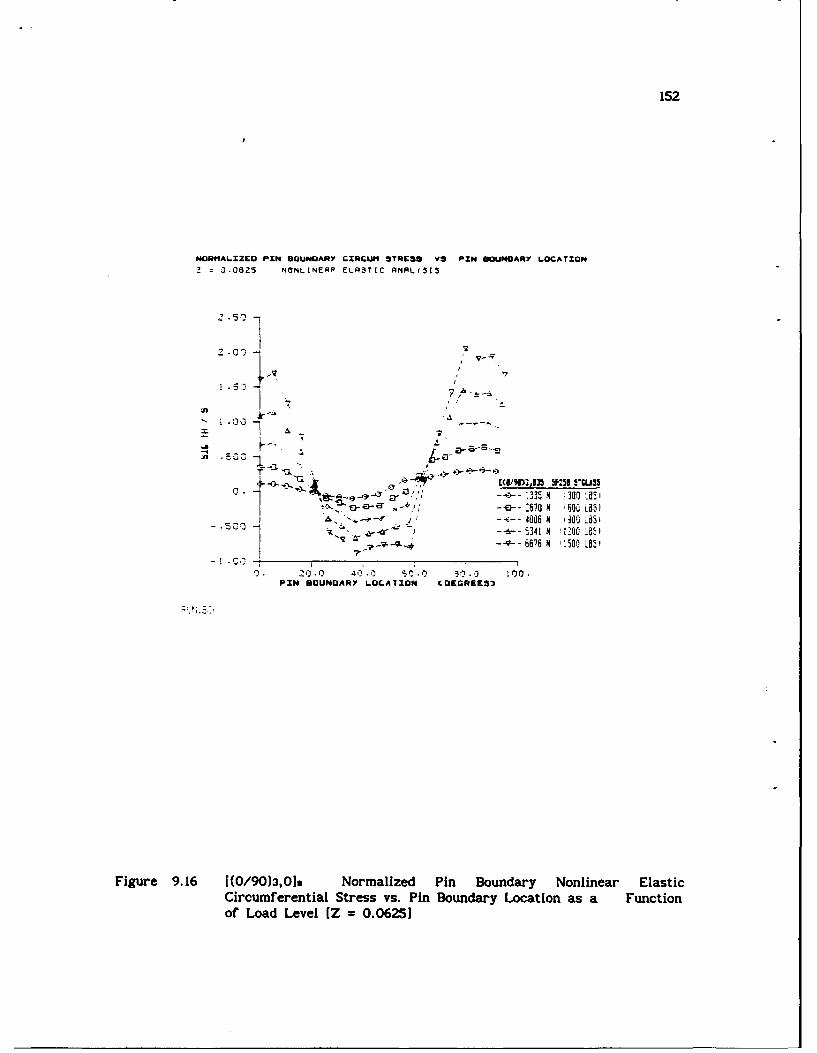
152
NORIZIAIZCO PIN OUNOARY QIRCUM STRrC2 VS PIN BOUNDARY LOCATION
S=30625 M NLENERP ELA rIC ANALfSLS
gI
00-
i" 10 --0 A5 ".
-o- 670 N -600 La.^)S-4006 N 30 351
--6;- 5.341 N 129G 3051
V--7-- 6616 N 1500S L851
41 0QC 0C. S~. 0 t.~ 1) i00 0PIN BOUNDARY LOCAT1ON COEGREES
Figure 9.16 [(0/90)3,0]S Normalized Pin Boundary Nonlinear ElasticCircumferential Stress vs. Pin Boundary Location as a Functionof Load Level [Z = 0.06251
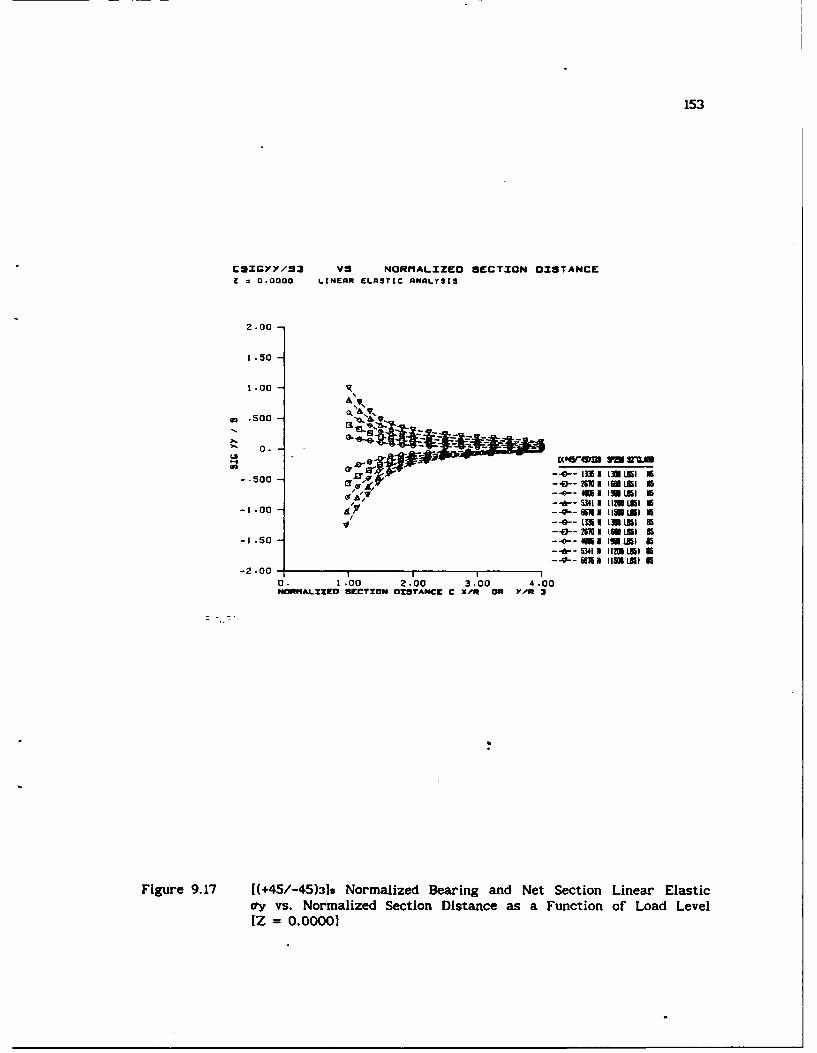
153
CSrGYY/3 VS NORMALIZED SECTION DISTANCEZ Z 0.0000 LINEAR ELASTIC ANALYSIS
2.00 -
1 .50
1.00
QLm.500
0.
Gar 50,G -- 0--I T51 IN11.95 1510 -- EF- 2610 I 15 151 5
' ---- R I 1.851 l-100 I19 -=- 1.151 1
-- 0-- 135I 11 o 851 5aE--0-- 210 1 1 6L51 5
-1 .50 - - 4 Ism 11-- 4--51 I I1 L51 5-9-- 5a1 II=SI 1
-2.00 -l I I I
0. 1.00 2.00 3.00 4.00NON'ALICO SECTION OZYTANCE C X/R ON Y *R
Figure 9.17 [(+45/-45)31 Normalized Bearing and Net Section Linear Elasticoy vs. Normalized Section Distance as a Function of Load Level1Z = 0.00001
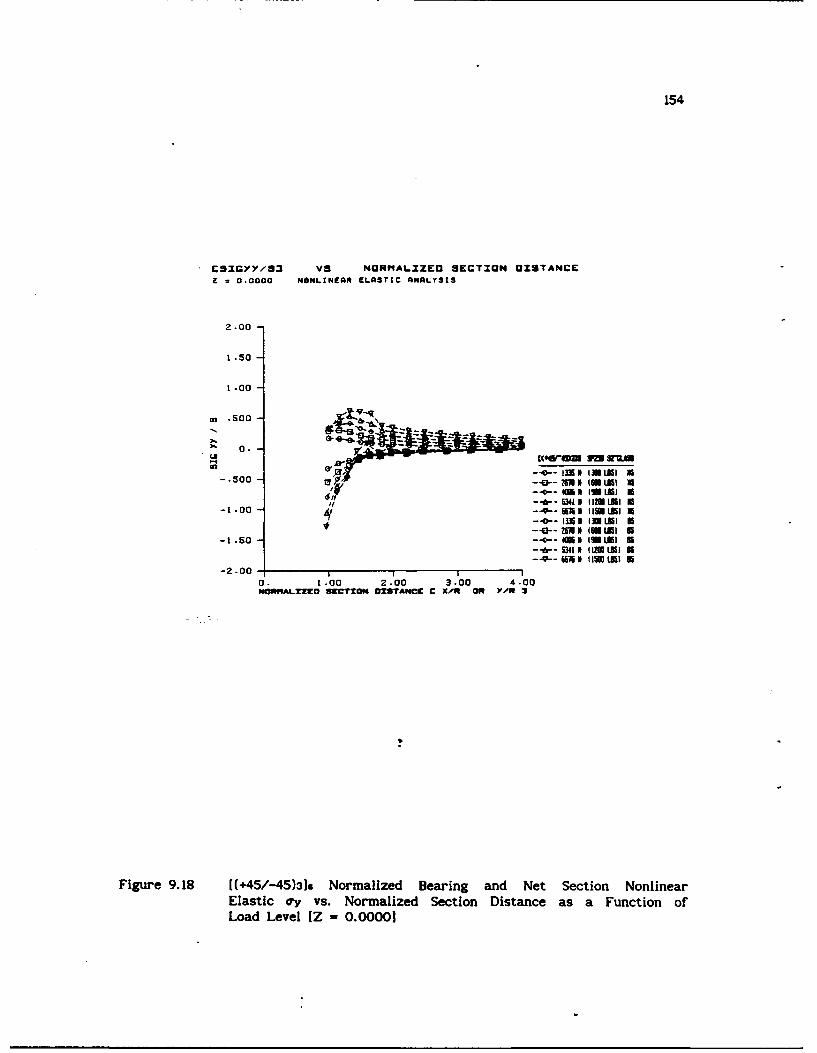
154
C91GYY/53 Vs NORMALIZED SECTION DISTANCEZ . 0.0000 NONLINEAR ELaSTIC AMNLYStS
2.00 -
1 .50 -
1 .00 -
.500
0.
0 p--.0-- 1imm IISII U5)3 --a-- AN I lral 5
-1.00- 67' -- 9--UNi61 UI~IJIIl U/ ~--0--* 13fI UHLNIl USo --a-- 20 A (a U15 a
-1.50 -- 0--a l 4 Ll I A 9 . 1
--.-- 13411 (iUlSir U I
If -- I&-- SRI 0(12HLMI U
- . 0 - i N i
0. 0.00 2.00 3 4.00
NOMALZZIO SCCToN 02sTANCE C X/N OW Y/N 3
Figure 9.18 [(+45/-45)3]s Normalized Bearing and Net Section NonlinearElastic -y vs. Normalized Section Distance as a Function ofLoad Level [Z - 0.00001
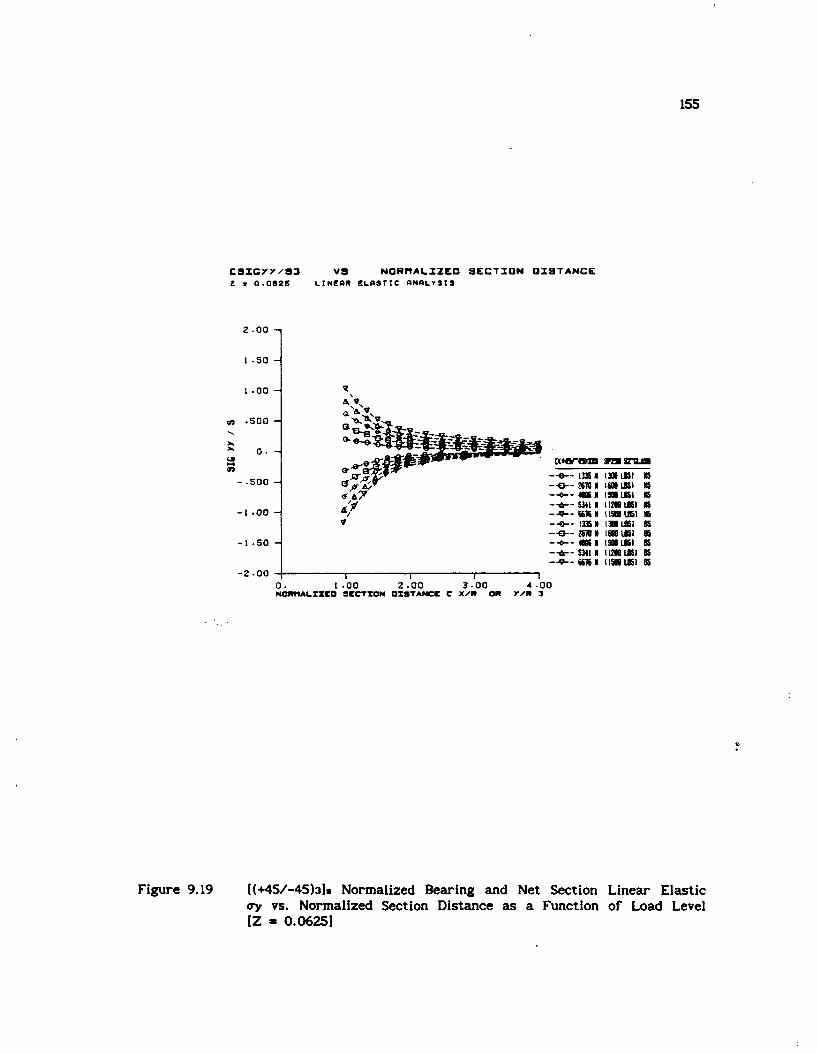
155
CSIGYy/33 VS NORMALIZEO SECTION OXSTANCEZ = 0.062S LINEAR ELASItriC ANALYSIS
2.00
1 .50
1.0002 .oo
0.
.500 -3 --0--13G I NS mIt MS
-- 0-- I511 U L51 N5
10 0-0--2NMI to 851 N5-1.50----I ,3 10 U51 N5
-- 5-- 23IN IIS L.51,-- G-- US l 1315tIt II
-2.00 O I I0. 1.00 2.00 3.00 4.00NOMALXZL'D SECTIZON OISTANCW C X/R OR /Pt 3
Figure 9.19 [(+45/-45)31 Normalized Bearing and Net Section Linear Elasticoy vs. Normalized Section Distance as a Function of Load Level[Z = 0.06251

156
CSIGYY/'3 Vs NORlALIZED SECTION DISTANCEZ = 0.092S NONLINEAR ELASTIC ANALYSIS
2.00
1 .50
1 .00
E(9.0 .1_ Sr.. .G g- - - - 1 3 3 6 (I N L 8 5 1 5
-.500
'1 -- '--5341] MlIL U15-1.00 -- 9-- 60:l =lM~ U15--- 13 O 151 0
-- C0-- 20 1 tol U151 as-1.50 ---- Si (WLI 5
-- N--341I (I=i U8-- ,-- 66111 IIMLMS I N-2.00O0 I O.O
0. 1.00 2.00 3.00 4.00NORMALZZCU S9CTZON OZSTANCE C X/N O0 YIP 3
Figure 9.20 [(+45/-45)3]s Normalized Bearing and Net Section NonlinearElastic a-y vs. Normalized Section Distance as a Function ofLoad Level [Z = 0.06251
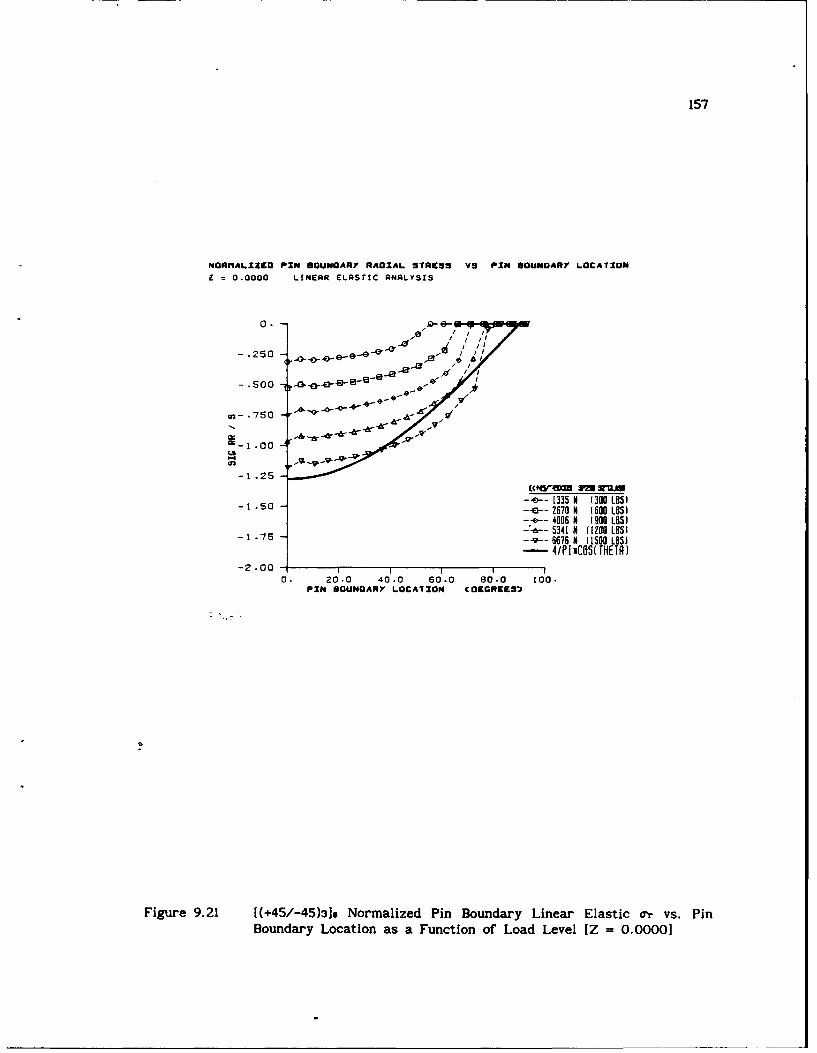
157
NORAIALIZE PIN BOUNOARY RADIAL STRESS VS PIN BOUNOARY LOCATION
Z O.oO0 LINEAR ELASTIC ANALYSIS
0.
-. 50O0
ca- * 750 - A"""r" eee /
I -
"
-1 .25 -
- -[335 N (300 LO- . 5 0 2 7 0 M 1 0 0 L O S )
- -4006 N (W LO534 N (300 LI
- ----- 6676 N (1500 LOS)- 4/P[,COS(IHETR)
-2 .00- It O I I
0. 20.0 40.0 60.0 80-0 100.PIN BOUNOARY LOCATION COEGREES)
Figure 9.21 [(+45/-45)31, Normalized Pin Boundary Linear Elastic 0r vs. PinBoundary Location as a Function of Load Level [Z = 0.0000]
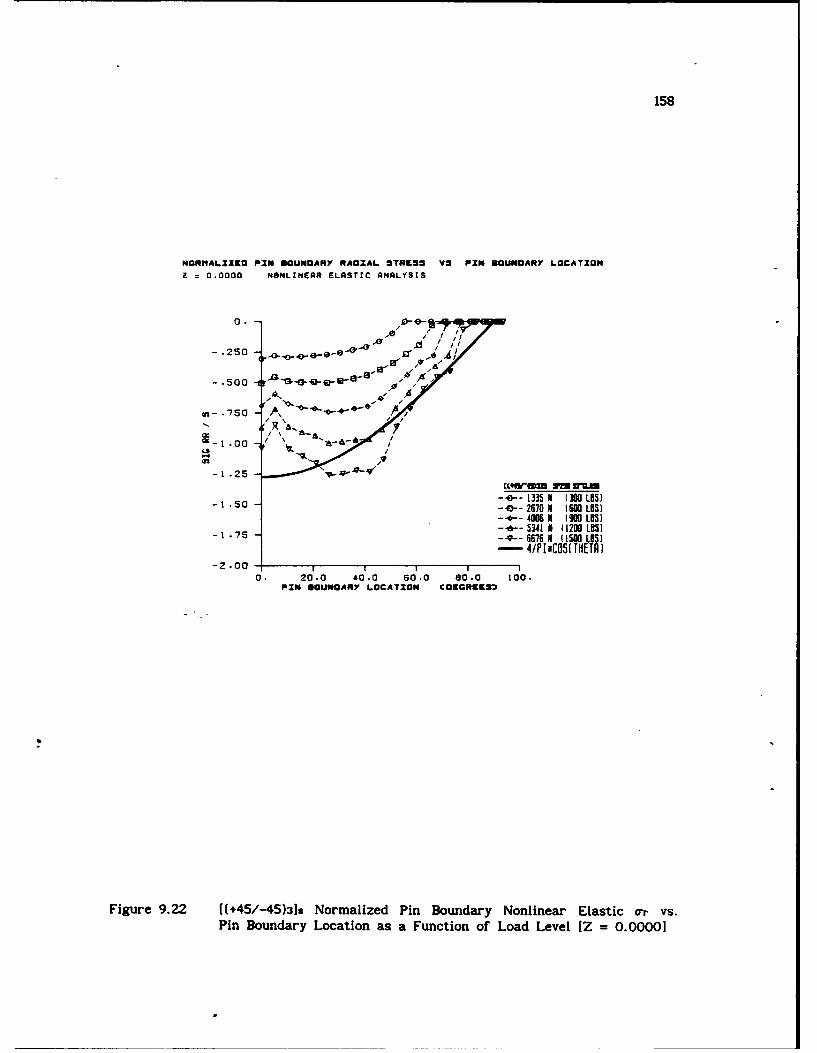
158
NORHALIZED PIN BOUNDARY RADIAL STRESS VS PIN BOUNDARY LOCATION
Z 0.0000 NONLINEAR ELASTIC ANALYSIS
0.r
-. 50 4- -- e 1313 K,
-.250 A, ~
1 .500 E.e.75
( I
- 1 .5 ..ECW4 7Z S
-1.5 -- V-67 t(300L85)
-4IPIECOS(THETA)
0. 20.0 40.0 50.0 80-0 t00.PIN BOUNDARY LOCATION COEGREES)3
Figure 9.22 [(+45/-45)319 Normalized Pin Boundary Nonlinear Elastic arr vs.Pin Boundary Location as a Function of Load Level [Z = 0.00001
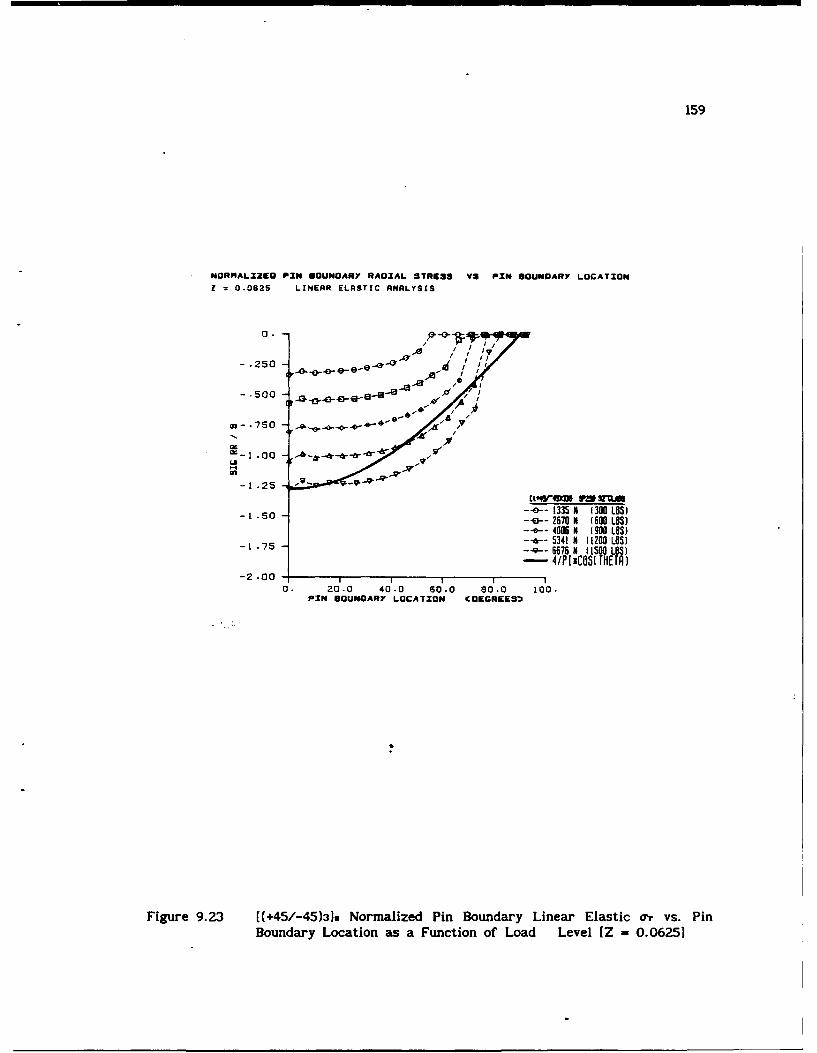
159
HORnALIZED PIN BOUNDARY RADIAL STRESS VS PIN BOUNDARY LOCATIONZ 0.0625 LINEAR ELASTIC ANALYSIS
-. 250 -4yI
-. 5-0
'0(
-1 .25
EcVcMM 9m ruMA-1.50 1335 N (300 LOS)
260N (600 LOS)---4006 M (900 LOS)
-1.5 -a--5341 N (1200 LOS)-1--7S-- 6676 N (1500 LOS)
-4/P[iCBS(rHETR)
-2.00-0. 20.0 40.0 50.0 80.0 100.
PIN BOUNDARY LOCATION COEGRCESM
Figure 9.23 [(+45/-45)31s Normalized Pin Boundary Linear Elastic o0r vs. PinBoundary Location as a Function of Load Level [Z = 0.06251
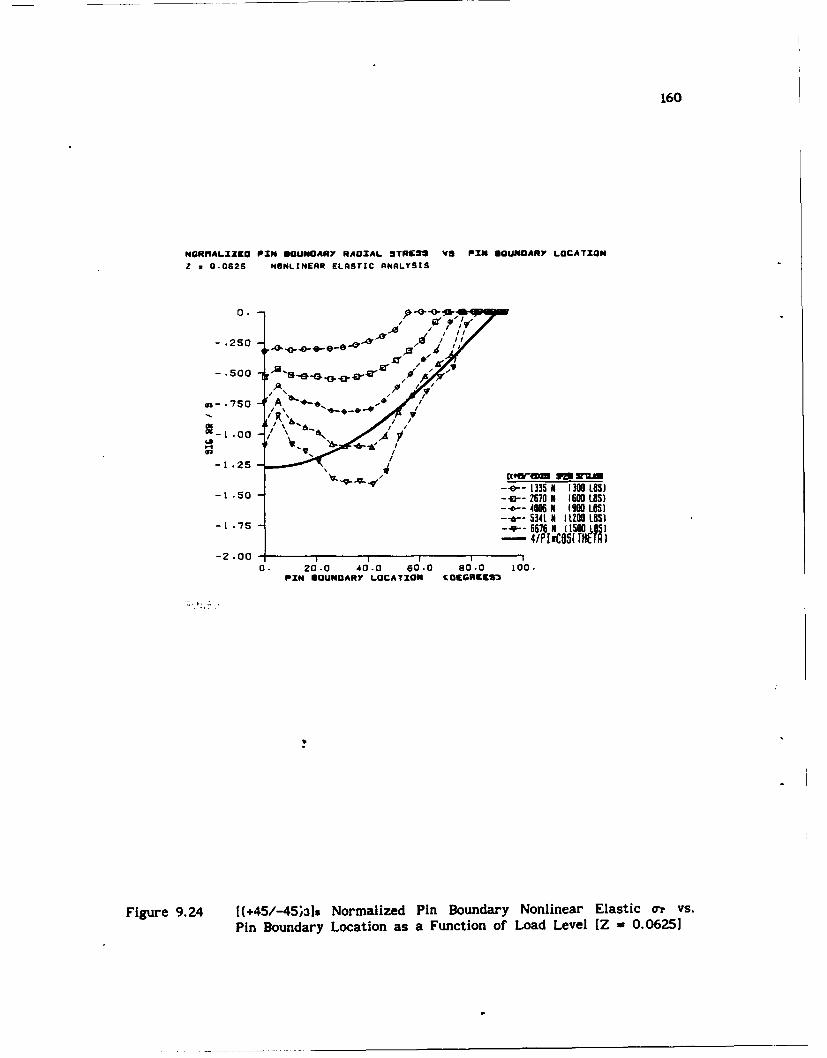
160
NORlALIXEO PIN BOUNOARY RADIAL STRi[ VS PIN BOUNDARY LOCATION
Z = O.062S NONLINEAR ELASTIC ANALYSIS
-~ ~ ~ ~ ~ ~ 00j .50 --,J'm.o(..o. /- .250
- 5500 A')0
~- '75 A v-5
-1.00 A
-1.-25
.50 2670 M (600 1851--4006N (90 LOS)-*-5341 N I1200 1IS)
- 1.75 -.- 6676 A U500O 1O51-4/PI485(HETRA
0. 20.0 40.0 0.0 80.0 100.PIN BOUNOARY LOCATION COEGRgEs,
Figure 9.24 [(+45/-45;3]s Normalized Pin Boundary Nonlinear Elastic or vs.Pin Boundary Location as a Function of Load Level [Z = 0.06251
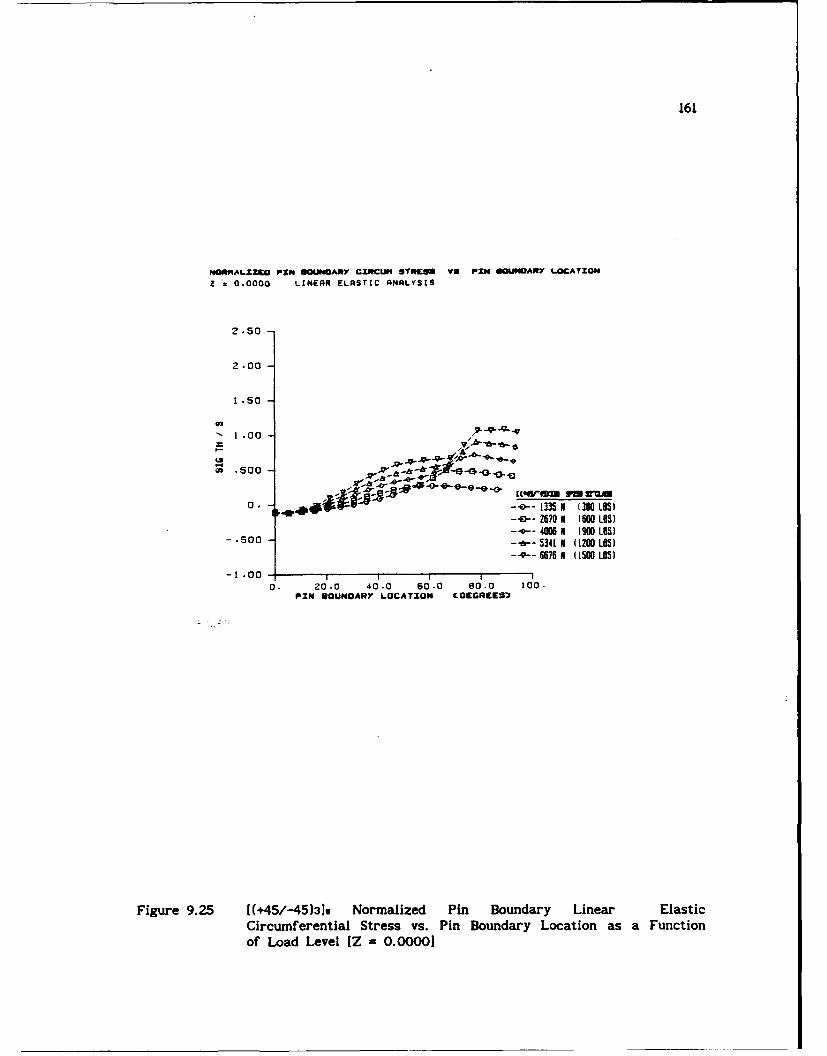
161
MNtIAL.ZZO PIN DOUNOARY CZIRCU STRIES VS PZN SGNOUARY L.OCATXON
Z 0.0000 LINEAR ELASTIC ANALYSIS
2.50 -
2.00 -
1 .50 -
1 .00 -
So -J .&0 ~ -&yf- G - -
0. - -e-- 1335 N (300 183--G-- Z670 N 1600 LOS)-- ,0'-- 4006 N (900 LOS)
- .500 -",*-- 5341 N (Q200 15--q-- 6676 N (1500 LOS)
-1 .00 - -I I
0. 20.0 40.0 60.0 80.0 100.PIN GOUNOARY LOCATION COEGREKsE
Figure 9.25 [(+45/-45)31s Normalized Pin Boundary Linear ElasticCircumferential Stress vs. Pin Boundary Location as a Functionof Load Level [Z - 0.00001
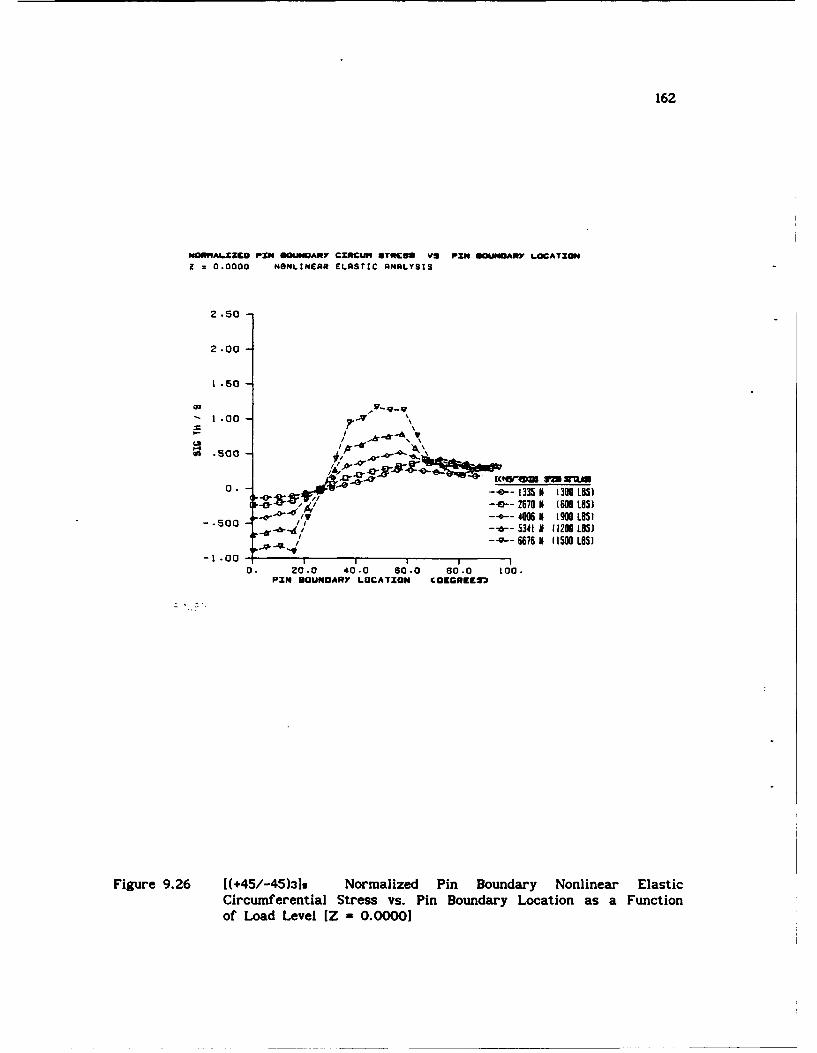
162
GNOA6ZZE PIN OUNOAR CXRCW STRESS VS PIN S S^UNAY LOCATXOI = 0.0000 NONLINEAR ELASTIC ANALYSIS
2.50
2.00
1.50
"" 1.00 V
l/ .. &. ,' \
.soo .'...-..o-'*
0. - - -- 1335 N 1300 LO8)-& ---- 2670 N (600 LOS)
--.-- 6676 I (1500 LOS)-1 .00- i I I i
0. 20.0 40.0 60.0 80.0 t00.PIN SOUNOARY LOCATION COEGREES=
: i,. -.
Figure 9.26 [(+45/-45)3]s Normalized Pin Boundary Nonlinear ElasticCircumferential Stress vs. Pin Boundary Location as a Functionof Load Level [Z = 0.0000]
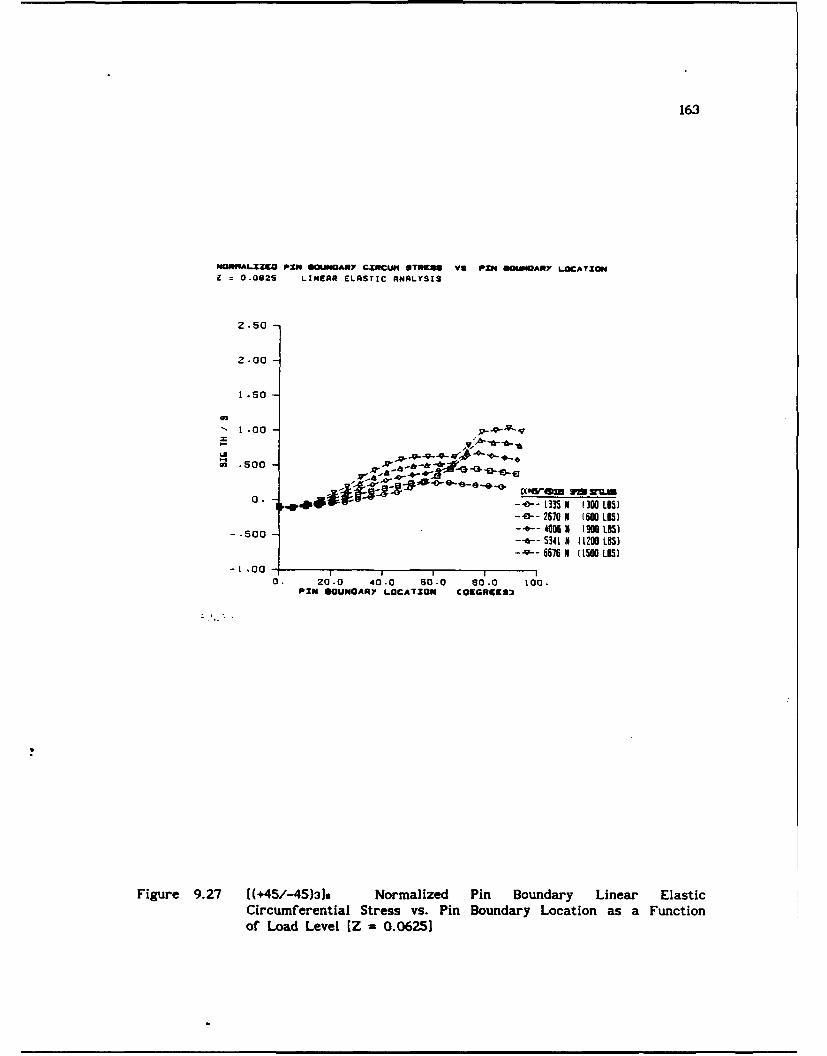
163
NMWNALZKO PIN 1OUNOAMV CINCUm STOCUl V1 PIN WaUWOAIRY LOCATIONI : 0.0625 LINEAR ELASTIC ANALYSIS
2.50
2.00
1 .50
1 .S0 -
02 .500 -- ~-.'r~ '-~
0. ,--- 1335N 1300 L8S)--.-- 2670M (600 18I
-. 00- -- 4086 1900 L8)-..-- 5341 N 1 120 LO8)-. 9-- 6676 X (1SO L85)
-1 .00 1 I0 I
0. 20.0 40.0 60-0 80.0 t0.PIN 1OUNOARY LOCATION CO[GRCES
Figure 9.27 [(+45/-45)33 Normalized Pin Boundary Linear ElasticCircumferential Stress vs. Pin Boundary Location as a Functionof Load Level [Z = 0.06251
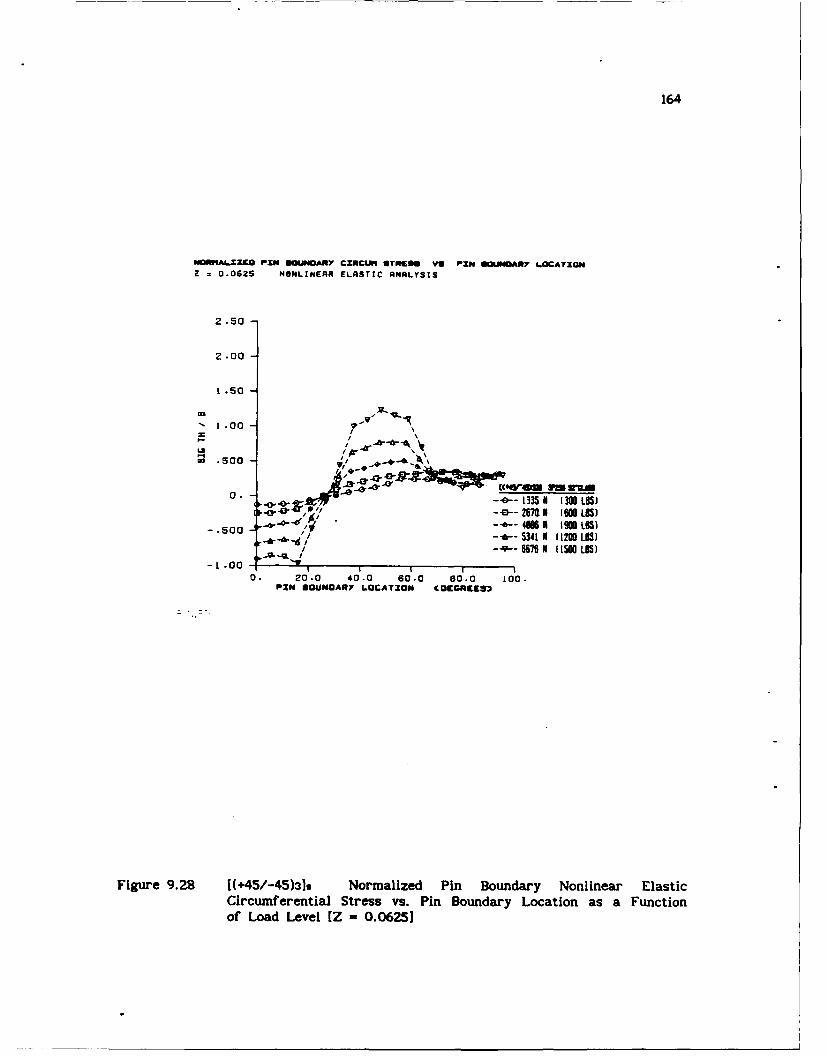
164
NOIMALXZrO PIN DOIJNOAMY CINCM OTIRin VS PIN SOJNGAMY LOCATION
Z 0.062S NONLINEAR ELASTIC ANALYSIS
2.50
2 .00
1 .50
' ,-GM-V-
- 0 / _a~h - "" - a
1 .00 o /, ..500 / - 4 20
0. -..-- ?1335 N 13 O LOS)42572M N 61 1600 IS
- .500 -*-5410 N (192116S)-1 L.00 11200 L--
667 N I 8f" L85
0. 20.0 40.0 6 0.0 e0.0 L00.PIN IOUNOARY LOCATION COKGR992S)
Figure 9.28 [(+45/-45)3]s Normalized Pin Boundary Nonlinear ElasticCircumferential Stress vs. Pin Boundary Location as a Functionof Load Level (Z = 0.06251
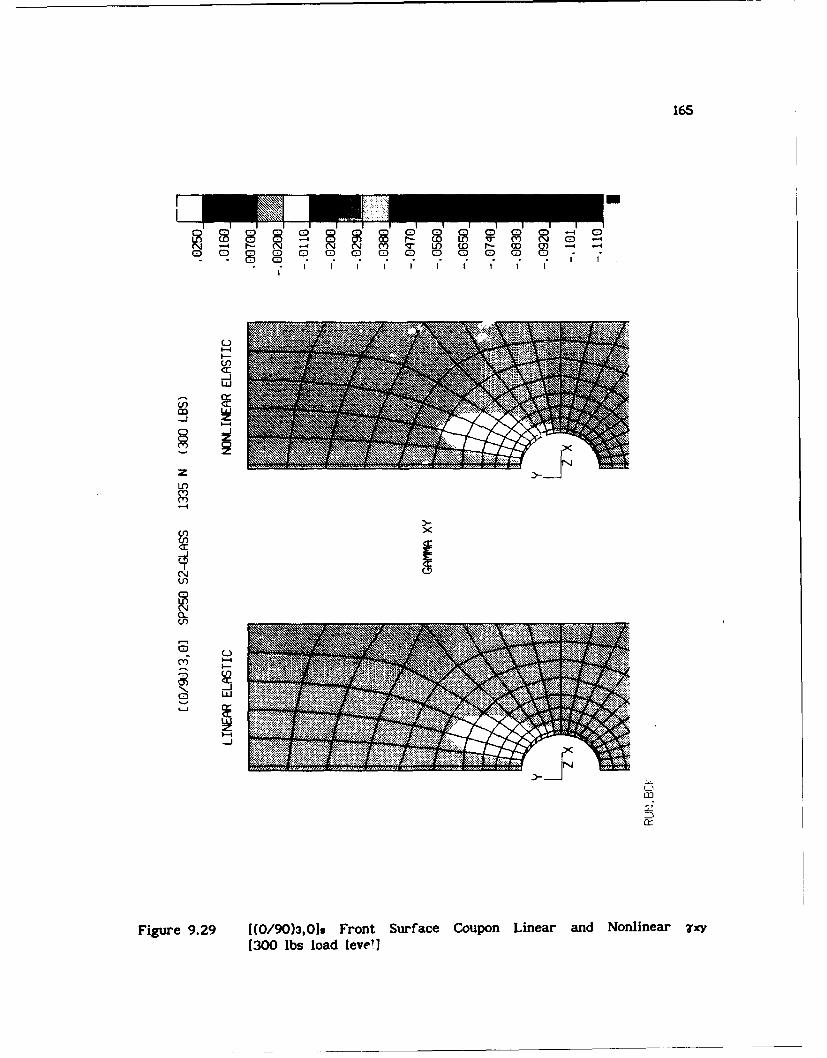
165
a) 0 C) 0 I I
4 C *I*00 I I*I*V * M
LO
UL)
mv
cLn
C,,
M ,
:D
Figure 9.29 [(0/90)3,O1s Front Surface Coupon Linear and Nonlinear Txy[300 lbs load level]
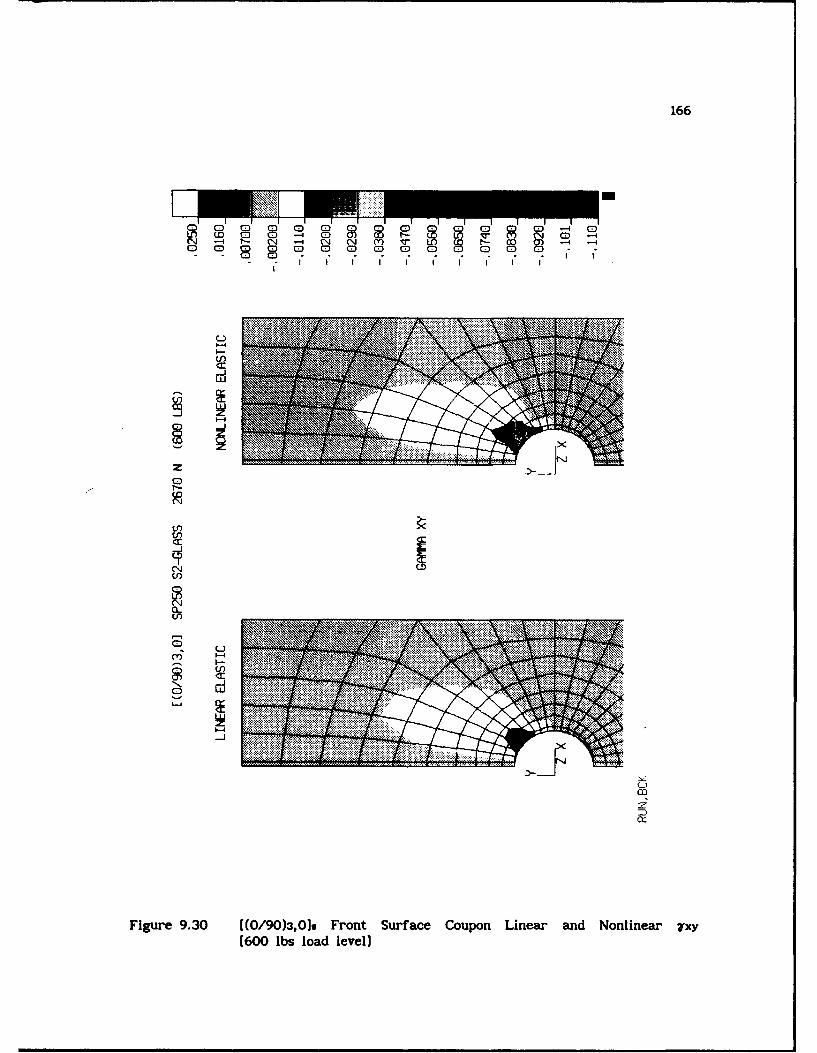
166
0 (z) 0 0 ? ) --q M-4 cl - w r- w - IC a) C) o I C) 0 I I I z
I-.>RN
z
(N
LO L
N, -j
C)0)
Figure 9.30 [(0/90)3,01s Front Surface Coupon Linear and Nonlinear T'xy(600 lbs load level]
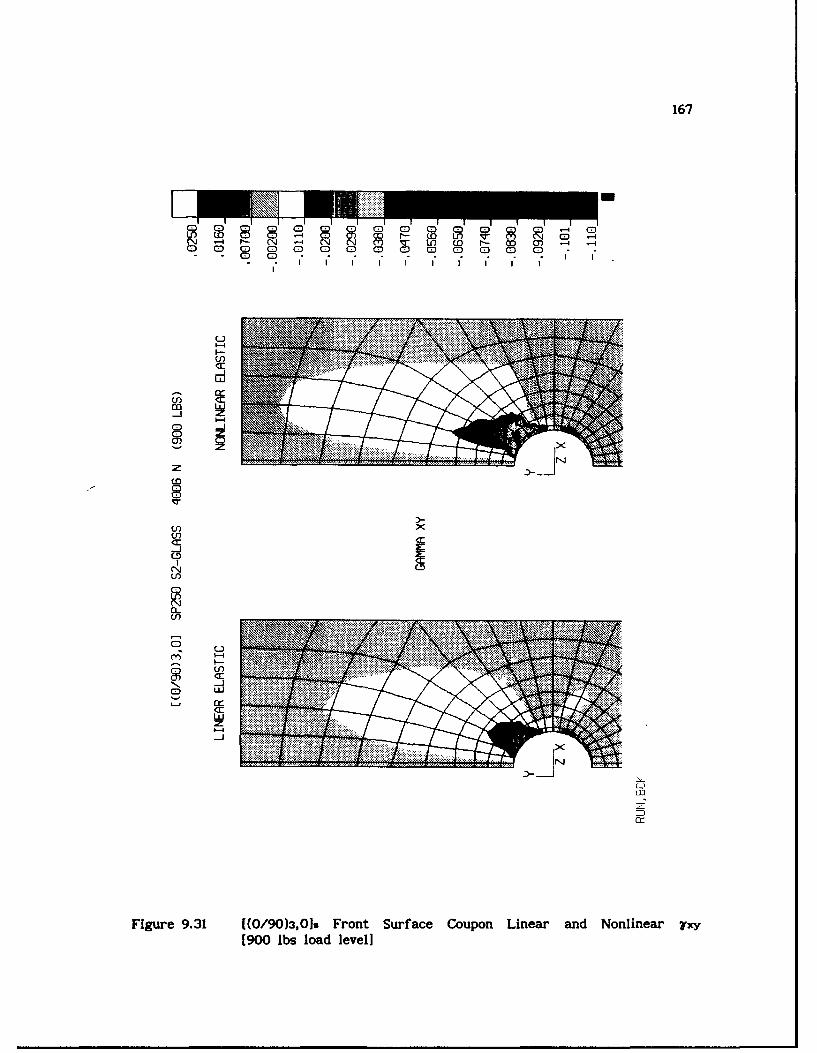
167
s IS tI-: LO CY I~ C(N -4 N (j CY) V-U (D I- M 0M -4-4
C! 88 0~ (C 0 C
m
LO X
(0
U)
C)
U')(NOL
$-
M
Figure 9.31 1(0/90)3,O~s Front Surface Coupon Linear and Nonlinear yxy[900 lbs load level]
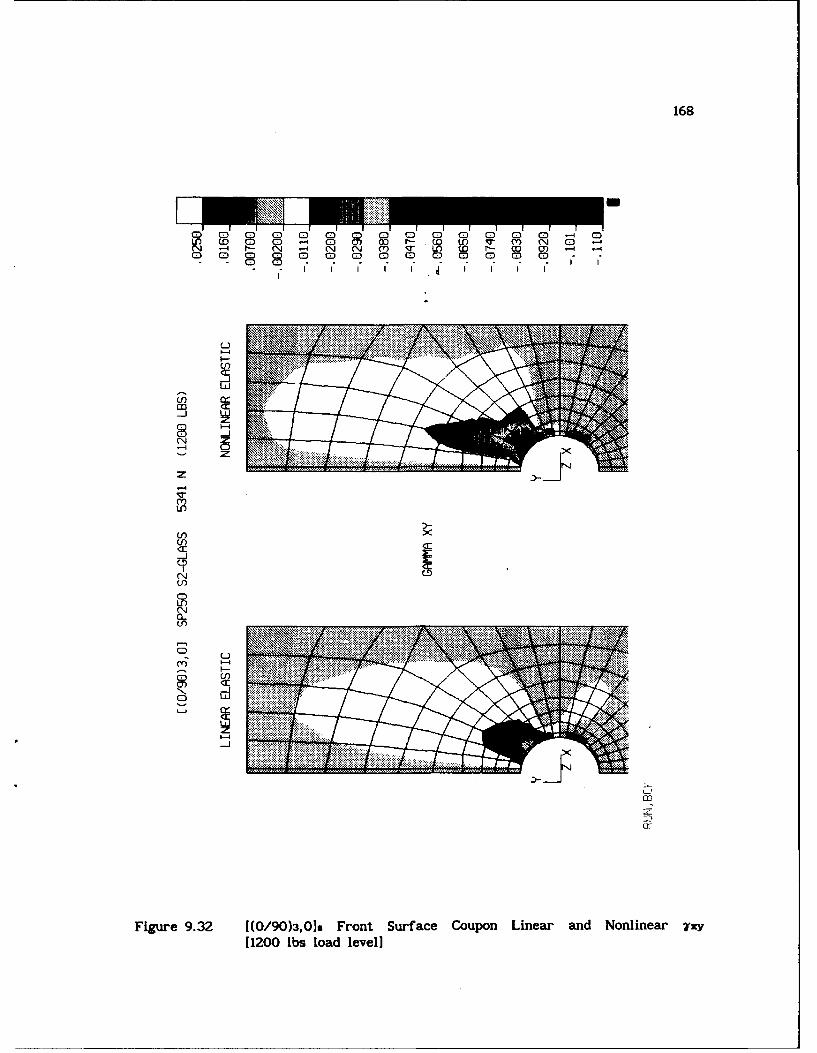
168
CS 0 8C (CM~ ) C) 0) M) M)C -4 C)C)- C ) )r- W~ Mf V- M~Y (N 0)-(N-4 r- (N --4 "N "N M 'r M W I- WX 0M -4-4
m) CD m) m) 0 C) ) C) m) C) C 0) m) m- C) CD . .-
c-n
-J
I(N
. .....
Fiue93z(/030sFotSrac opnLna n olna x-40 bsla lvl
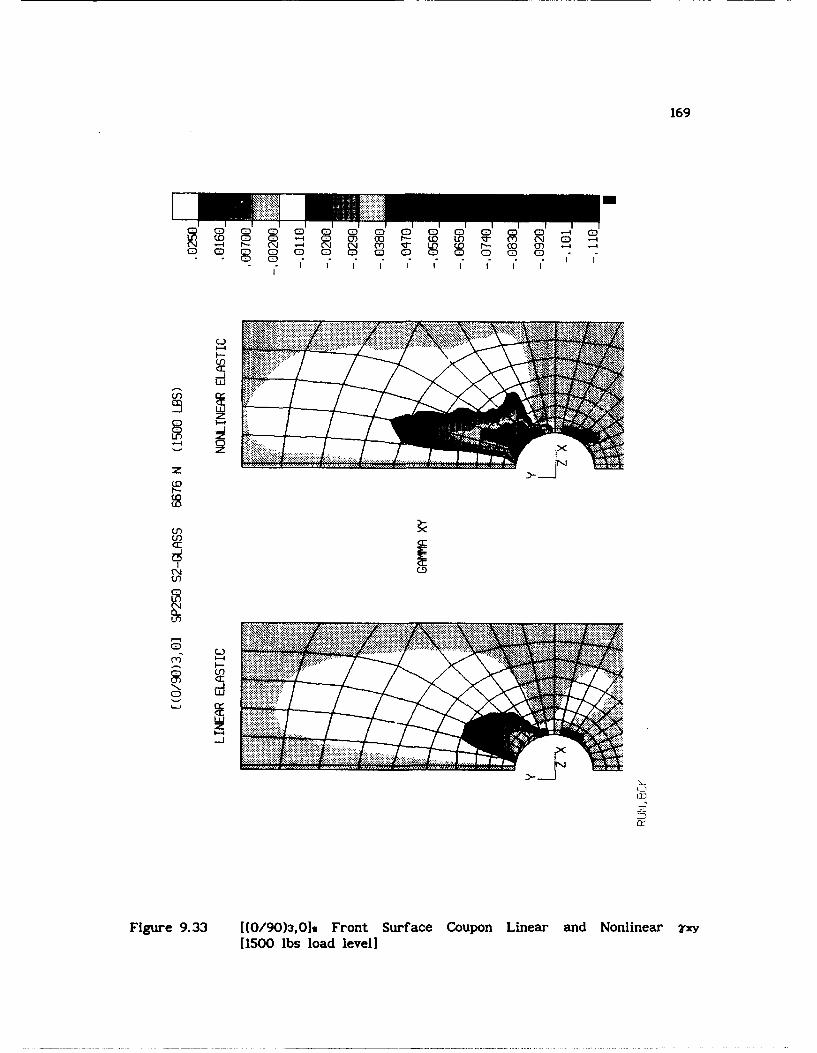
169
I I I I r 1 r v ia)~~ ~ ~ ~ 0 -)0 0r -M N C) -411'- - (N -4 (N (N M~ 'r M) WD - E M - -4
m m m m m m C 0 C5 b CDM -) - - - - - - - - - -
U.)
--
co)
U) X
U)
CC
L )
LOi
Figure 9.33 [(0/90)3,O1s Front Surface Coupon Linear and Nonlinear yxy[1500 lbs load level]
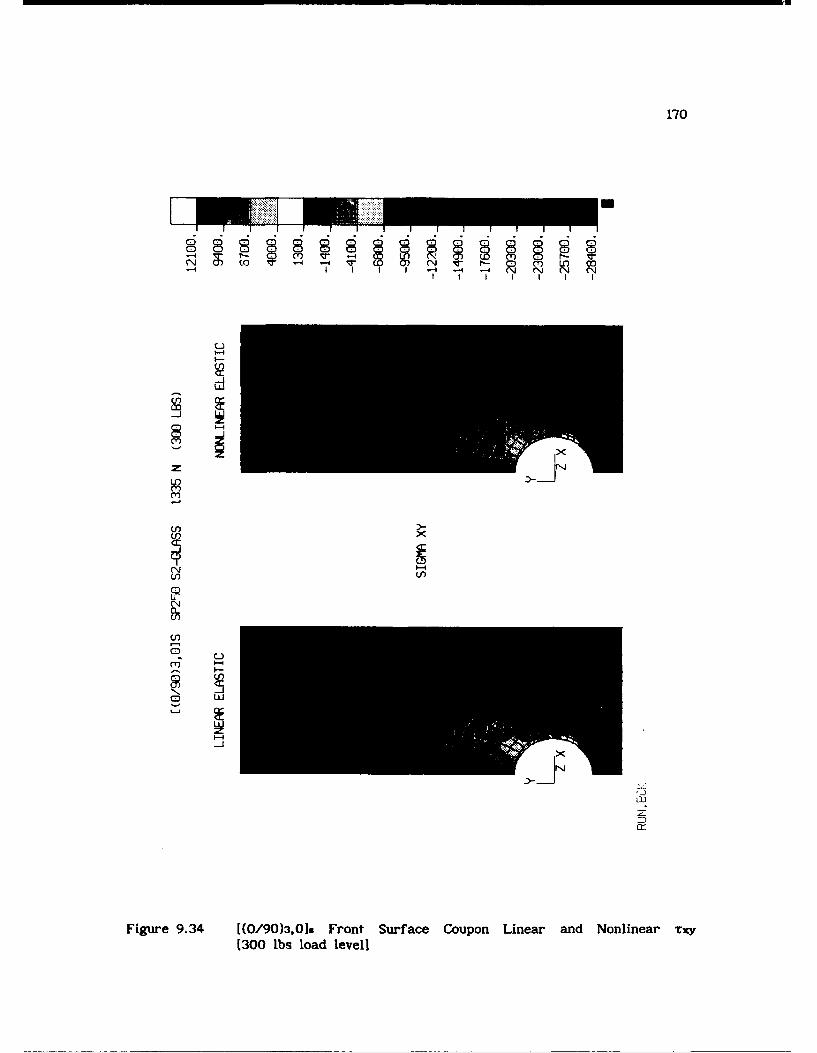
170
I M vr -I M * * II I
(N (a -4 -- 1 q, C 0 ) N Ir fl- aLn~ L C O
LuI
Fiue93z(/03OsFotSraeCuo ieradNnier-x
-304slodlvl

171
-II I I I -4 .4 -4 (N c (NJl
I-4
zL
(~Lb
Fiue93 (/0309 rn ufc opnLieradNnier-x
[60lb oa evl
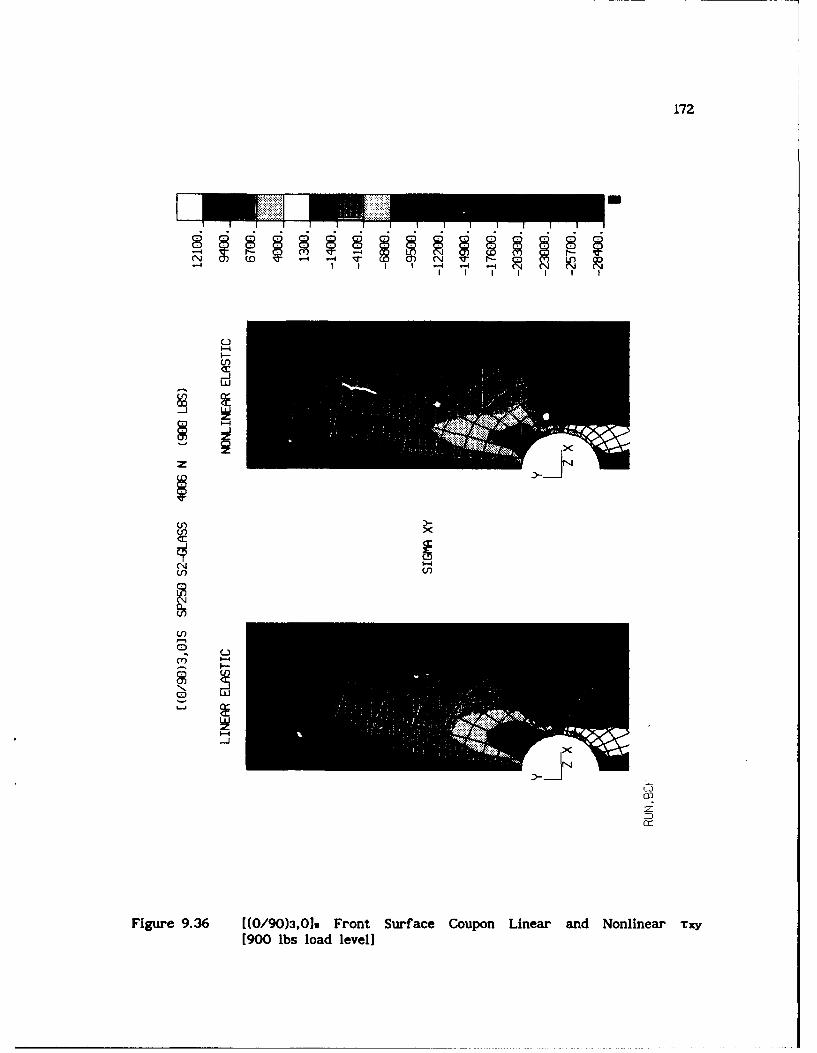
172
I I I I I
LO'--4 - T ,4- -
z
C-)r
Figure 9.36 [(0/90)3,019 Front Surface Coupon Linear and Nonlinear 'rxy[900 lbs load level]
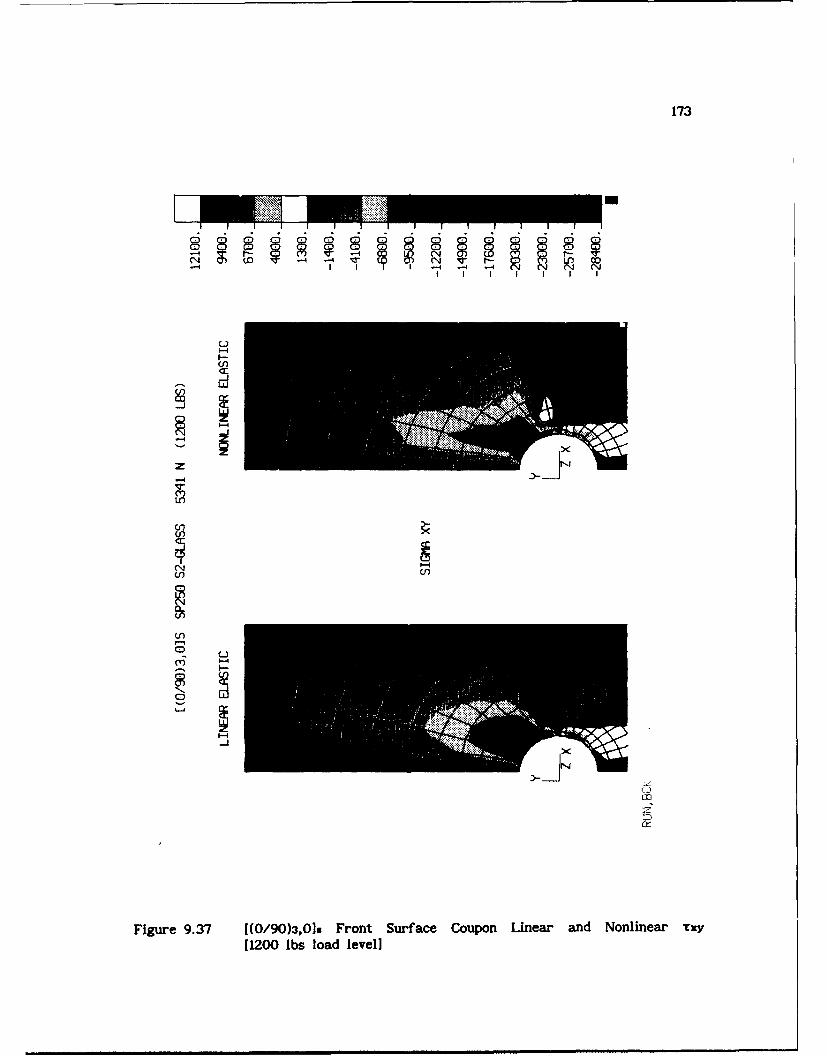
173
CY,
IXx
Fiue9.7 [0/03O~ rntSrac opo iea n Nniea x
[10 b odlvl
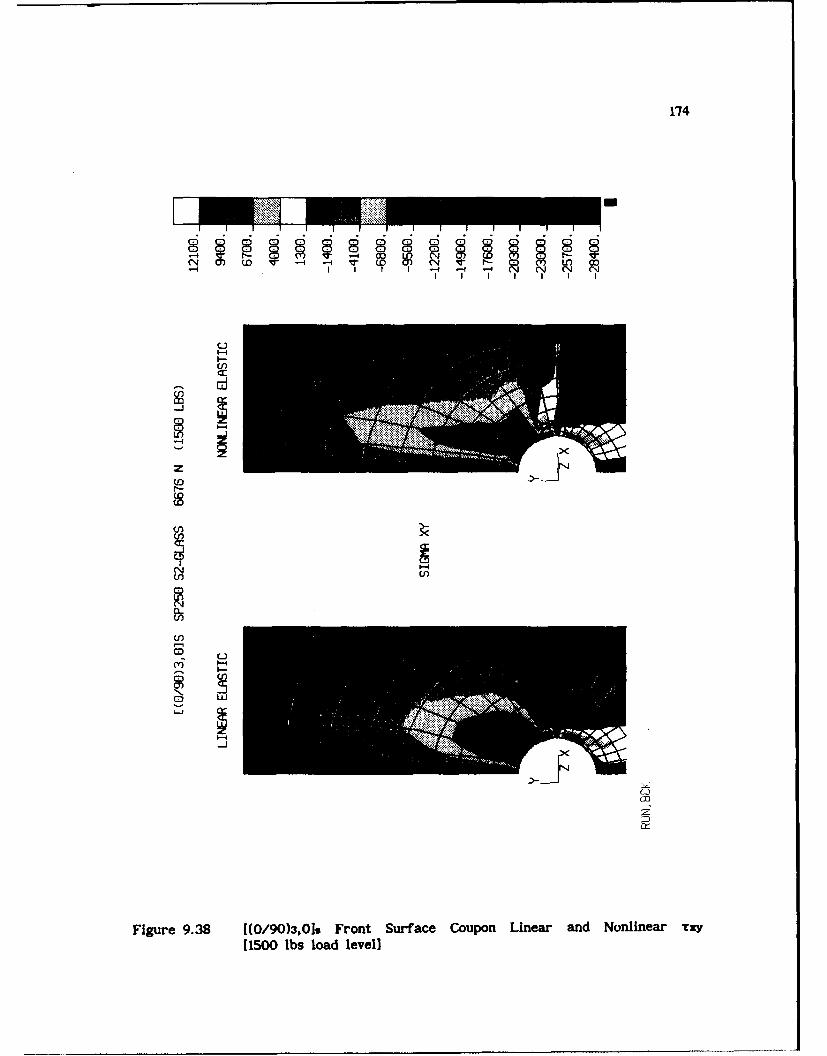
174
-4 -- U- 05 -
C
Z:11
Fiue93 (/0309FotSrac opnLna n olna x110 b odlvl
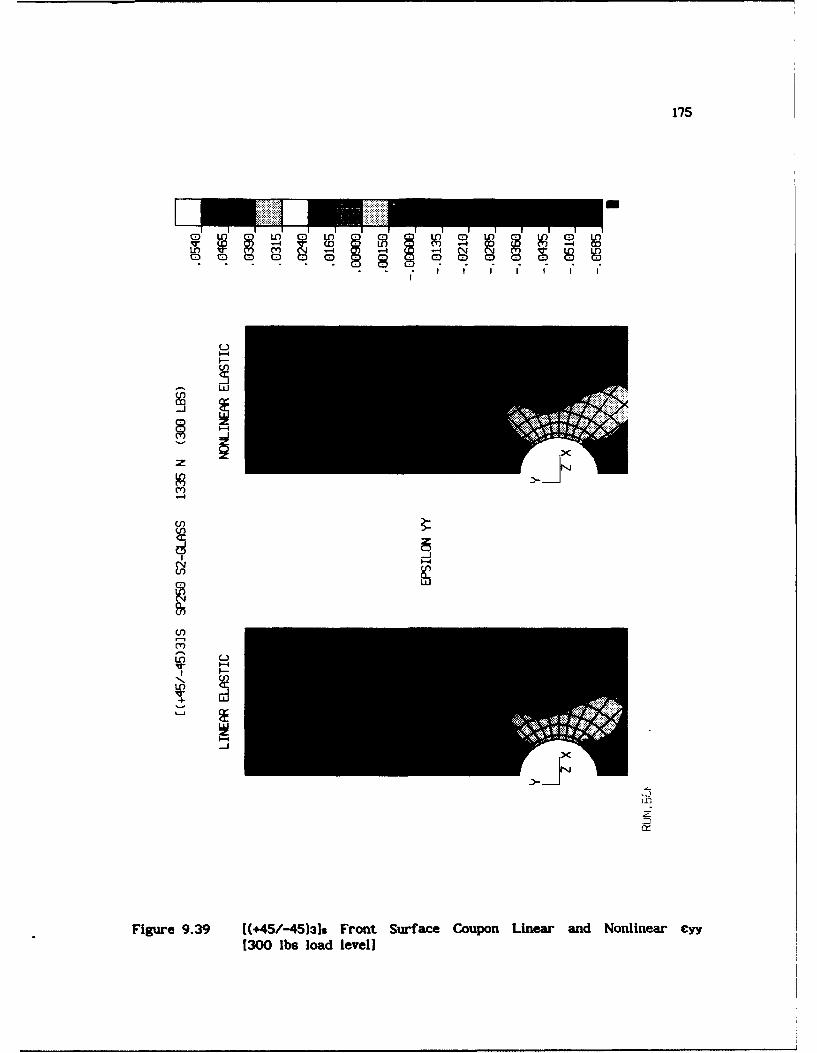
175
4 -4 m
(n~
N
U)
V-
cr
Figure 9.39 ((+45/-45)3]s Front Surface Coupon Linear and Nonlinear £yy(300 lbs load level]
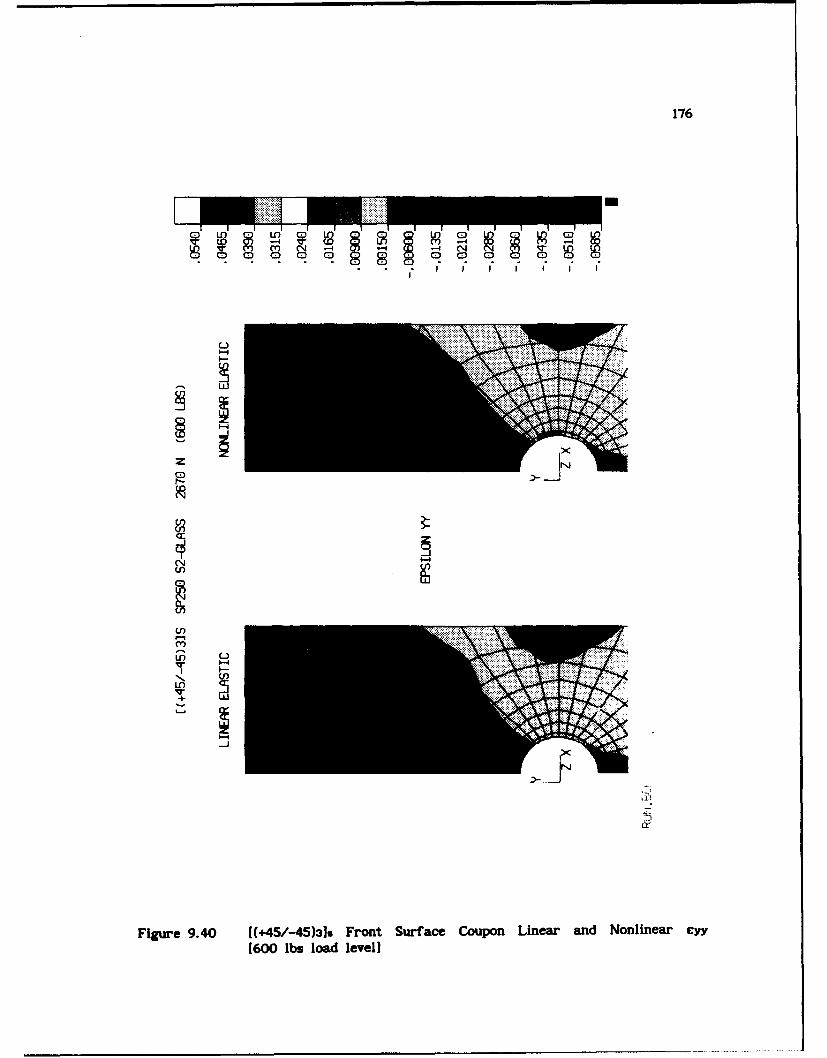
176
m 4 - -4 0
U)
In L
Figure 9.40 [(+45/-45)319 Front Surface Coupon Linear and Nonlinear £yy
(600 lbs load level)
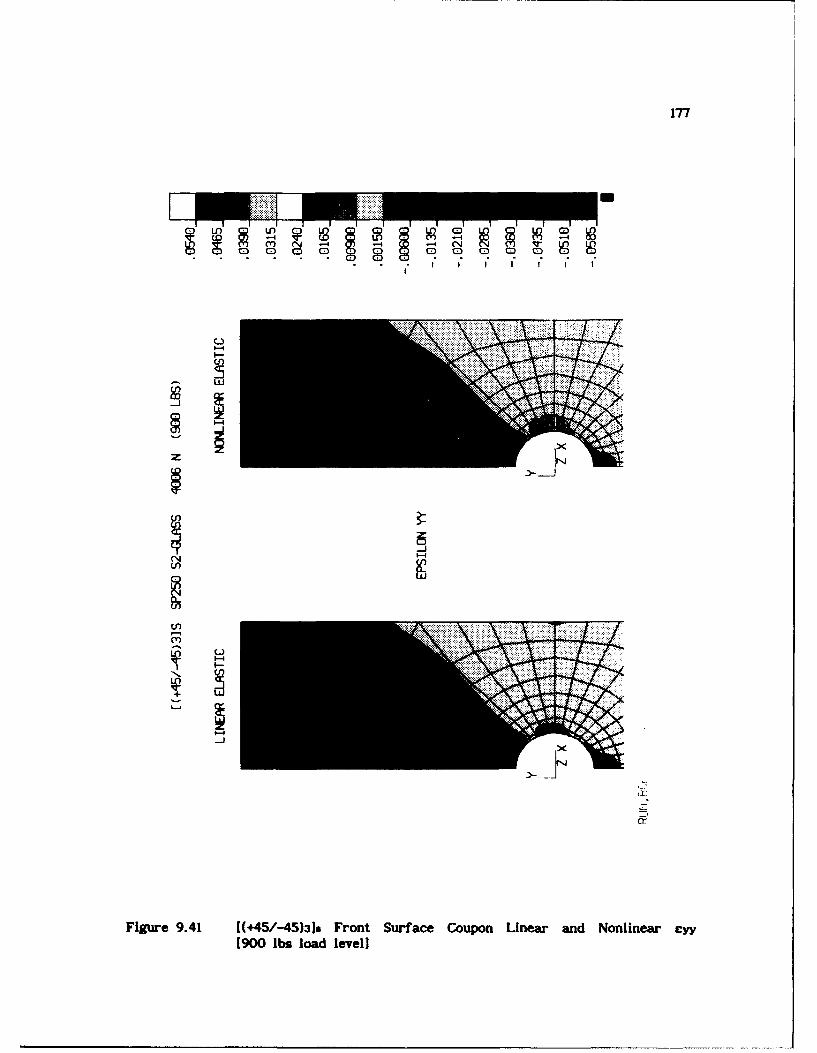
177
LU
I-IN
F igue94 (4/4)1 rn ufc opnLna n olna190lslodlvl
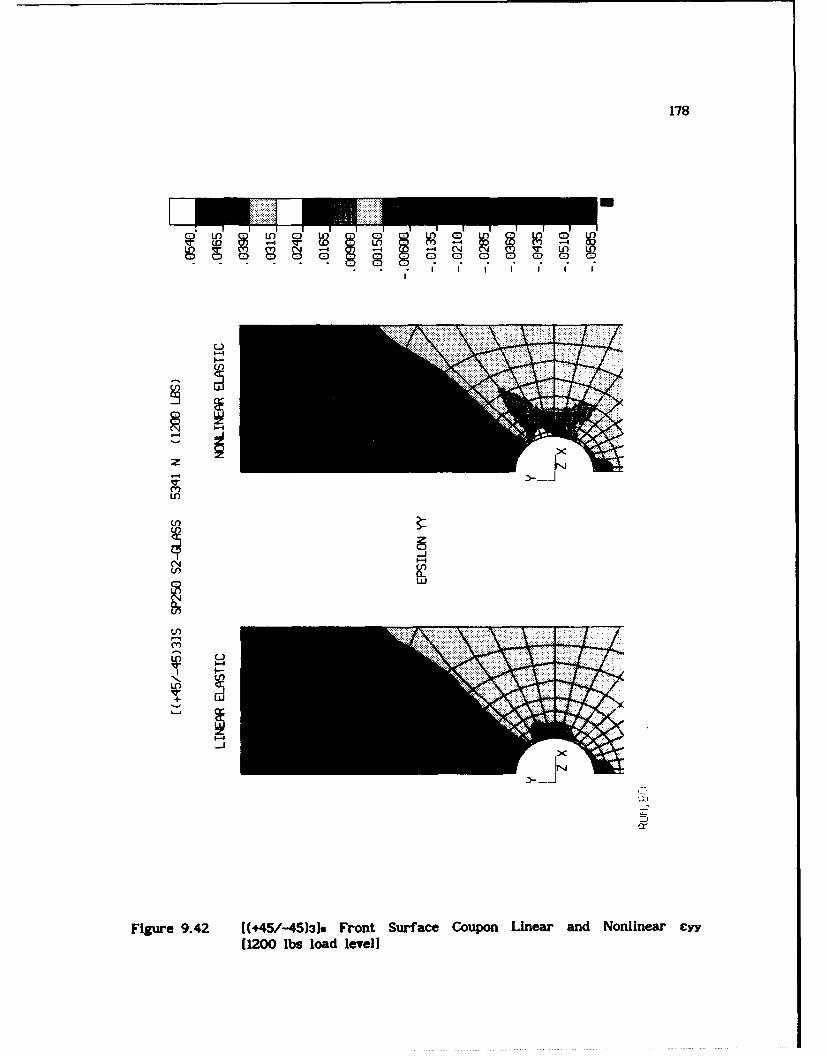
178
I~~~~~~~ IImII I t t-1-------
Ln InOIw0 0 Ln000
V-4
LO
UY)
UU)
Figure 9.42 [(+45/-45)3)9 Front Surface Coupon Linear and Nonlinear £yy
11200 lbs load level]
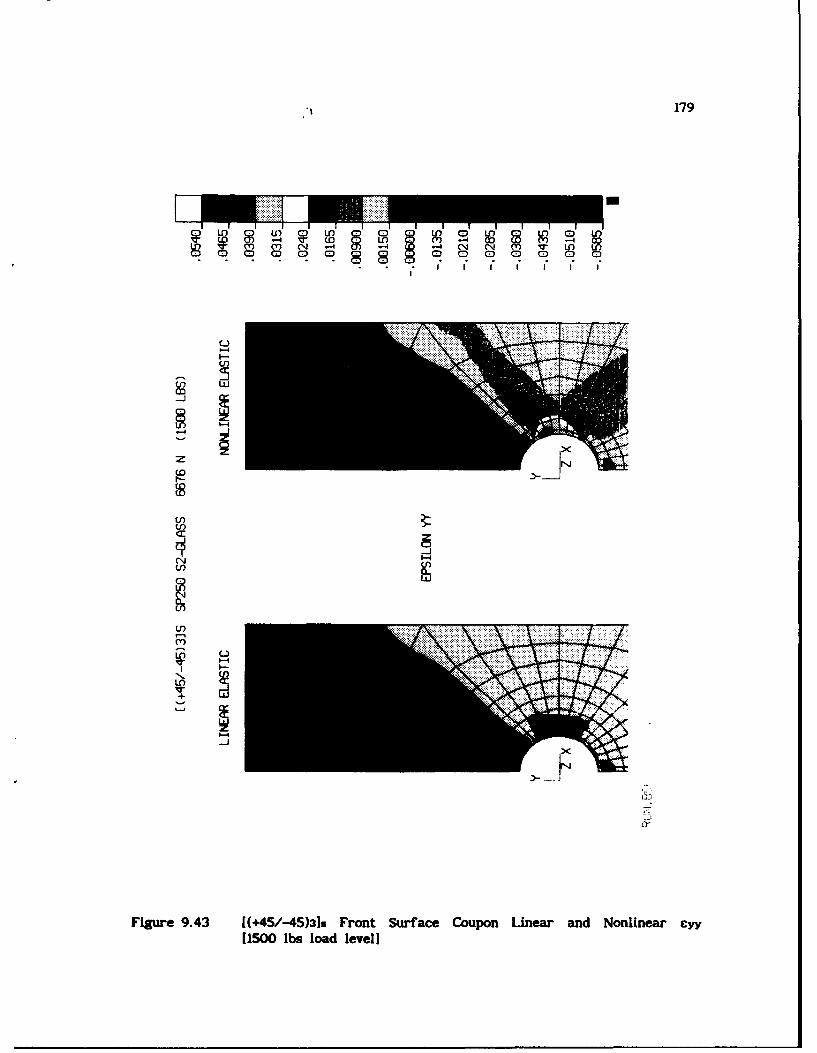
179
4 C (0 Oq C4
z - 4-4 0 *CoC? C C
c,)
Cl)
t'-
.. ....
Fiue94 (4/4))sFotSraeCuo Lna n olna y
[10 bsla lvl
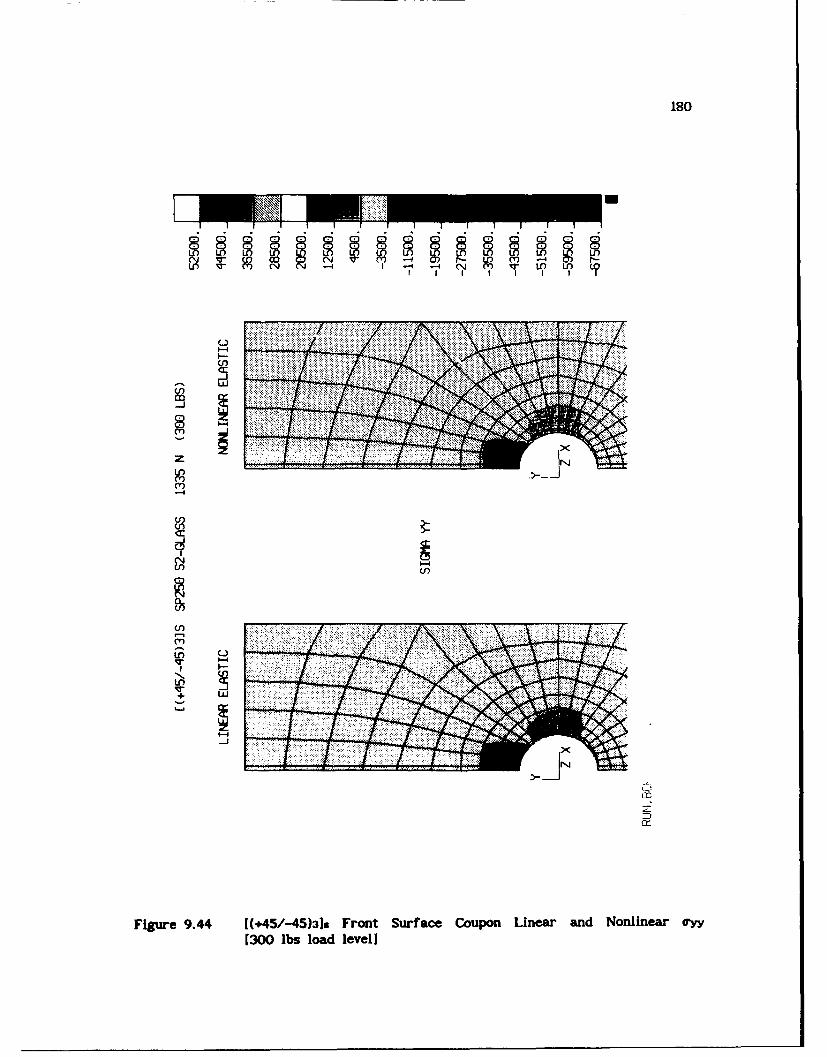
180
C-,
U-4
-4-
Figre9.4 [+4/-5))s rot uraceCuo ieradNnieray[300 ls loadlevel
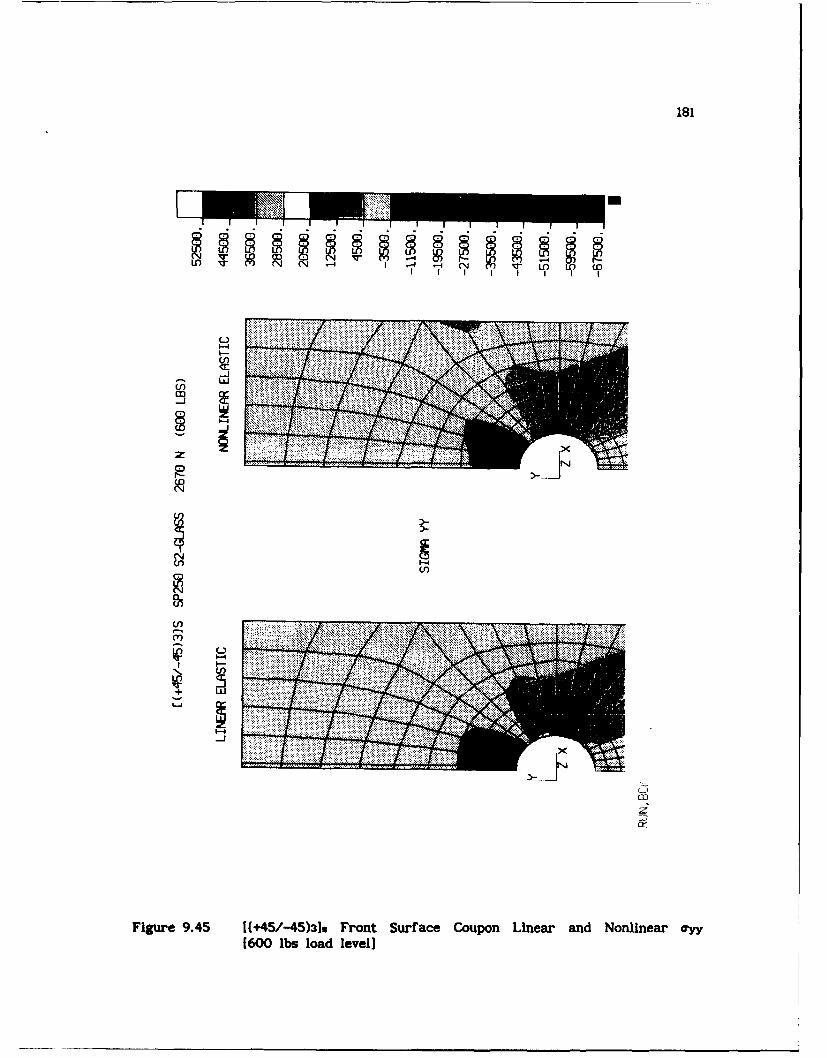
181
I n T -4LO
I z1~~
LO I I l
C-)U
Fiur 9.5 145-w3*FotSrae opnLna n olna y
1600slodlvl
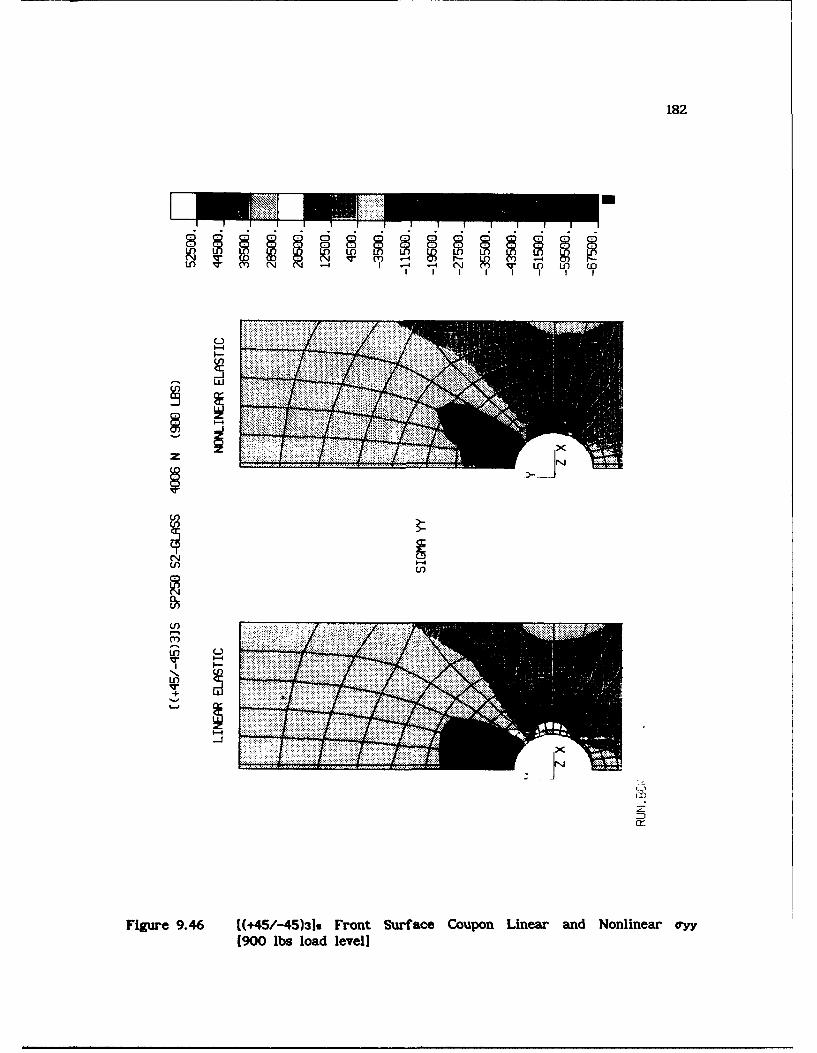
182
M I I § 1 I § I
LO T N1- 4V-4nL
CYU)
(/)L
Figure 9.46 (445/-45)3]s Front Surface Coupon Linear and Nonlinear vyy(900 lbs load level]
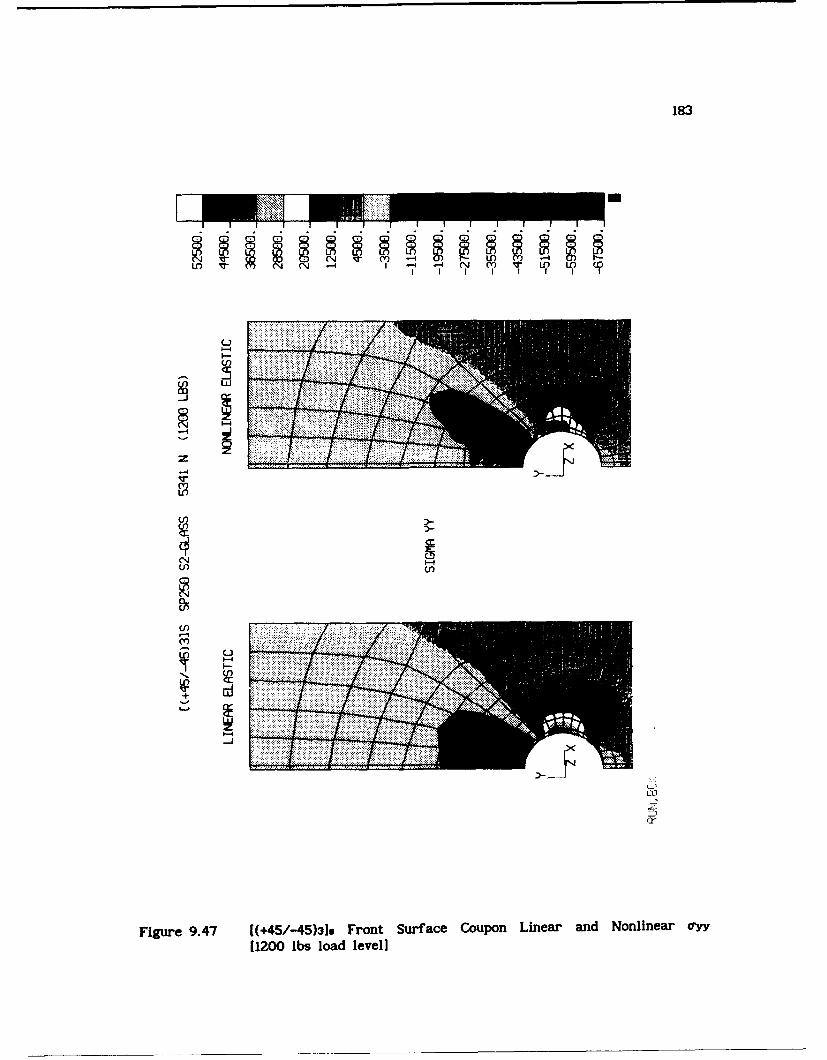
183
..... .... . .m
Ut) IT m - 4 - -4 (14 (Y) V-T LOU
C-)LO
Ln (/)
U,)
Figure 9.47 [(+45/-45)31* Front Surface Coupon Linear and Nonlinear aw(1200 lbs load level]
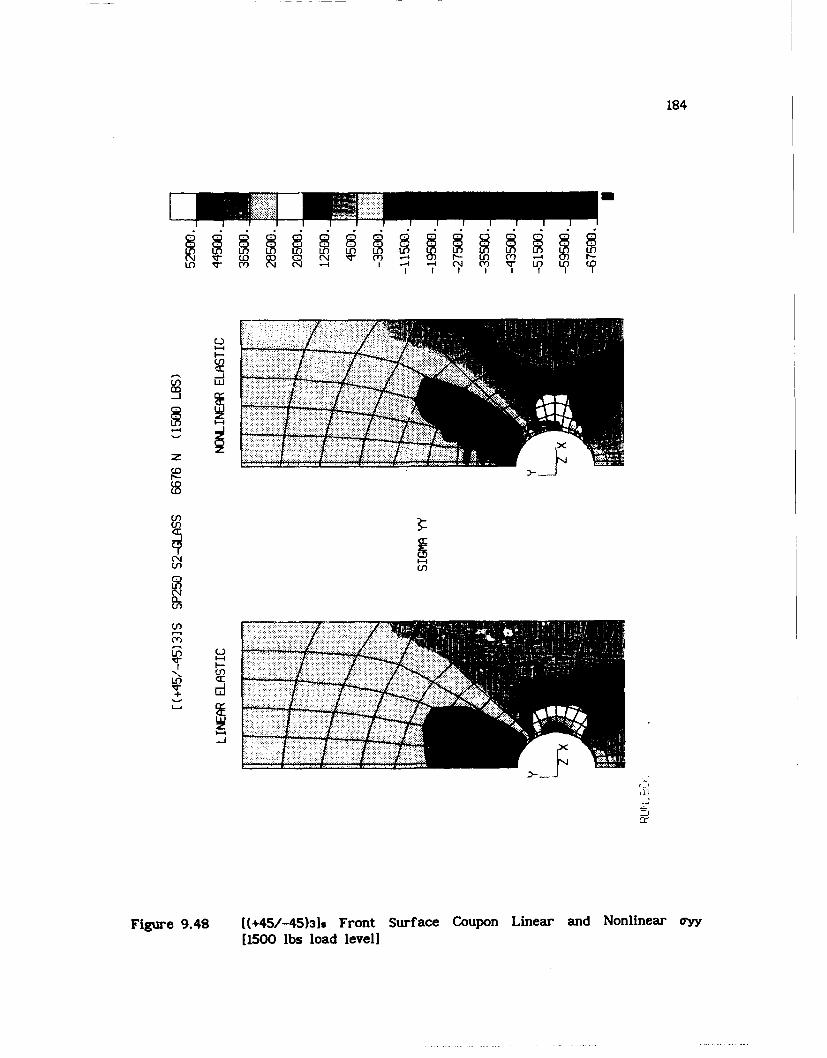
184
I I I I I f IN
Co§
(0 0 i M IO O C)-
LO V m C m/)
f-nX
C,,
Figure 9.48 [(+45/-45)319 Front Surface Coupon Linear and Nonlinear vyy[1500 lbs load level]
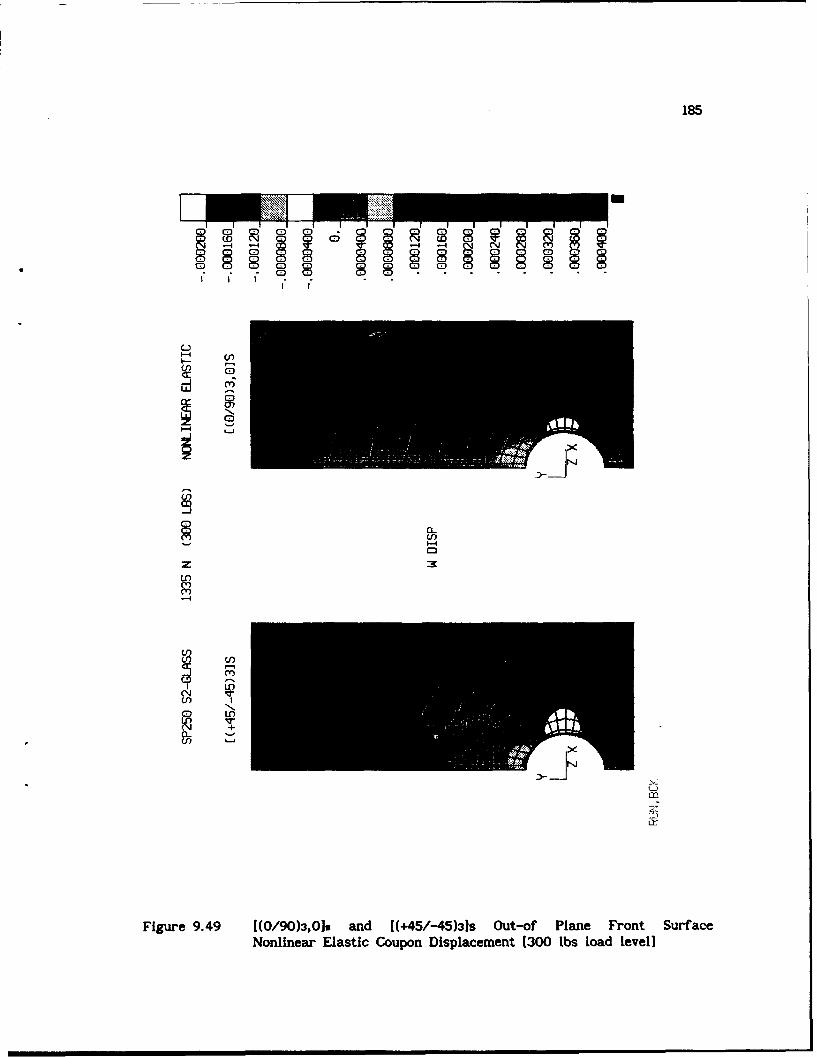
I I IN
CR IR
f-0CI
LU -L
JO
Figre .4 1(/903,~a nd (+5/-5))S ~t-f lan FrntSuracNonlinear Elastic Coupon ispaeet 30lslodlvl
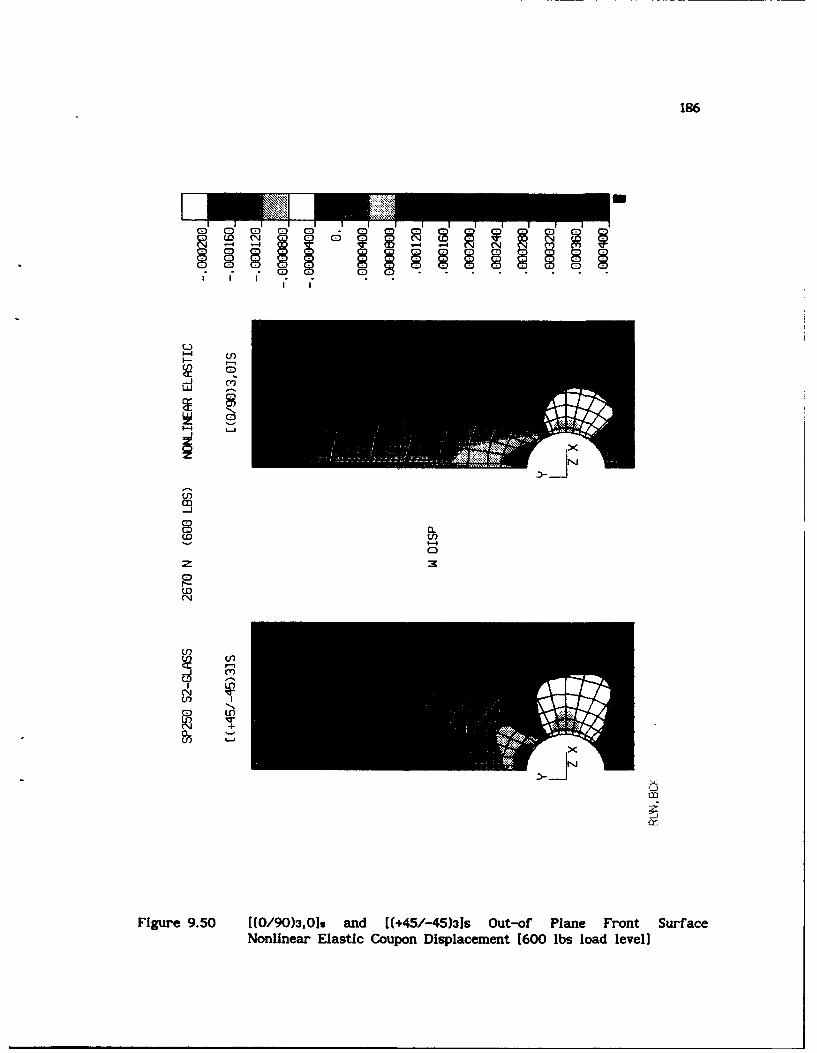
186
_______________C______C_______a)__CI: R ? r'r----
R
ci- , -
cr0
zL
Fgr9.0 [0/0309 ad [45453S OtO Pln Frt Sufc
Nolna lsi opnDslaeet[00b odlvl
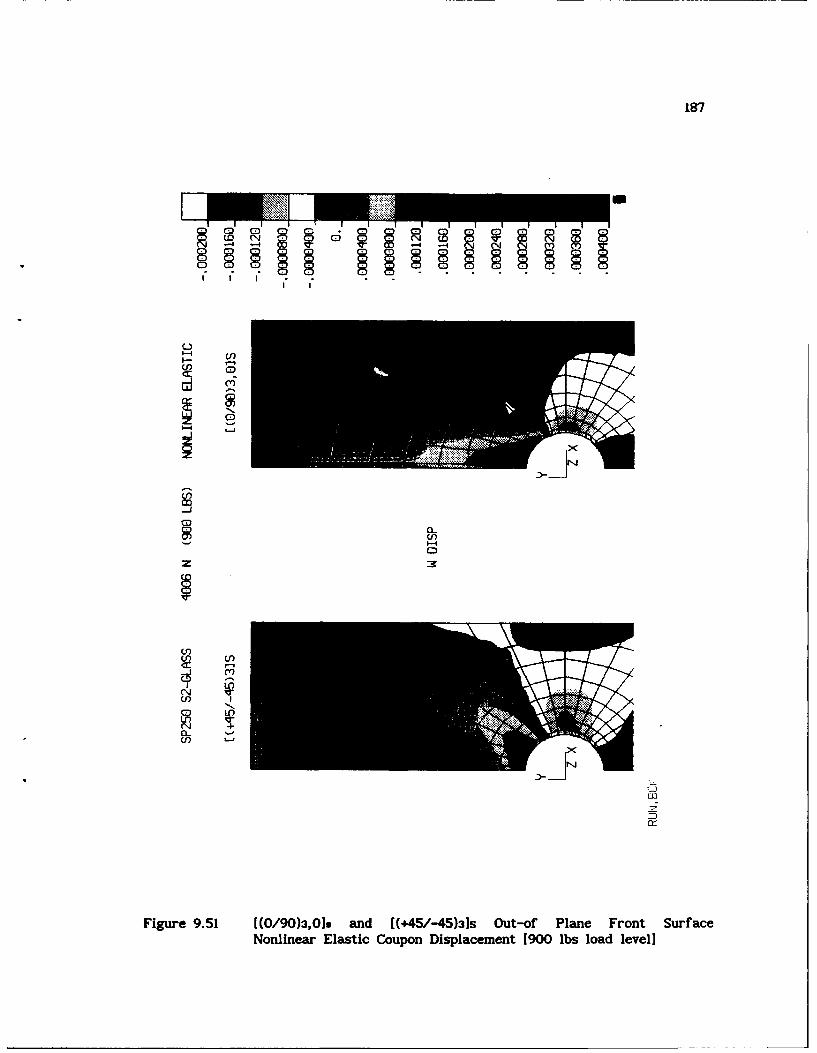
187
I -
(/)C)
z
(L
Fue 9.1 [09),1 nI4/4)3S Oto ln rn ufcNolna lsi opnDslaeet[0 b odlvl
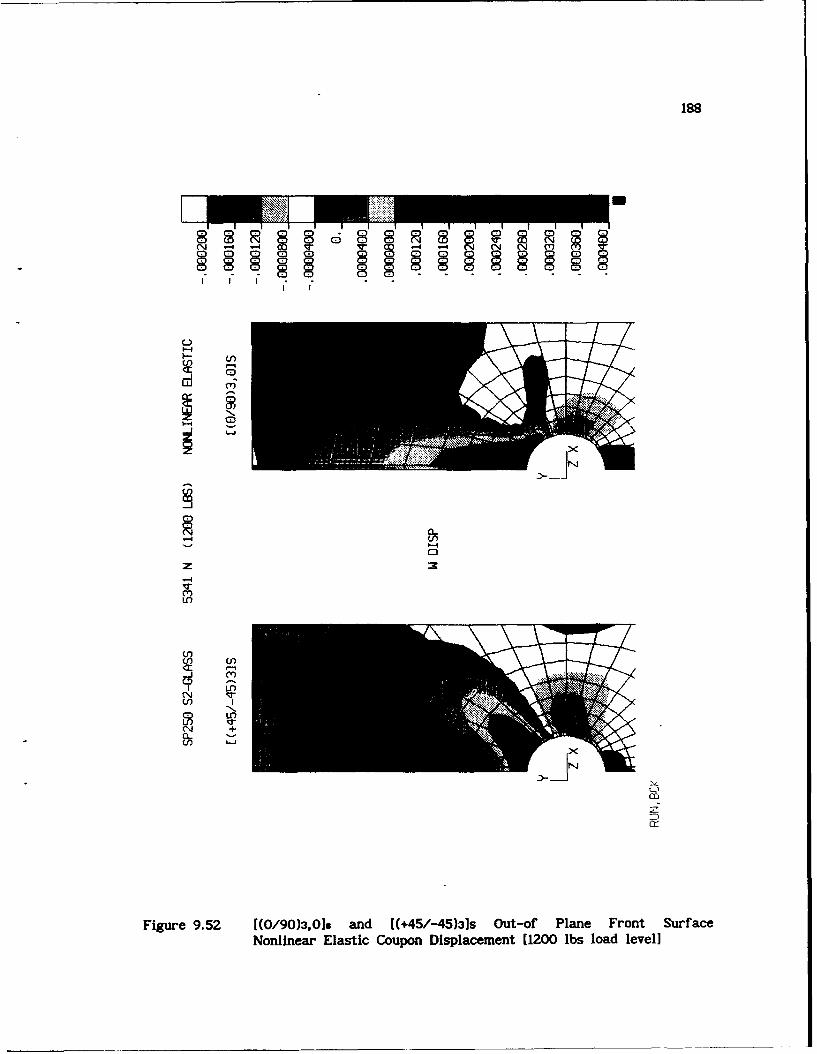
188
C-,L
Cr,3
Cr)
(.D
I 0L)
LrJ
Ur
Fiue95-J/03Oo n (4/4)] u-o ln rn ufc
Noliea EasicCopo Dspacmet 120 bslod0evl
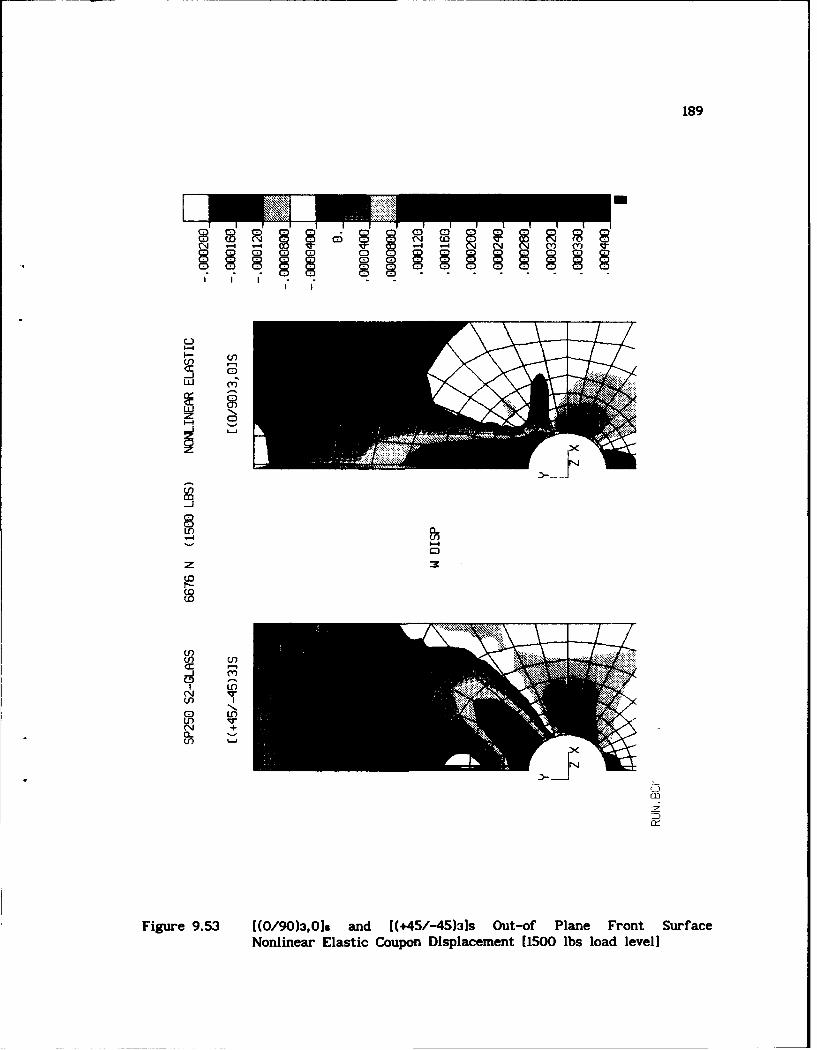
189
'0 (' ( ''4
C-,3
T LO
-4-
CDr
Fi ue95)(/0309 ad [+5-53S Oto ln rn ufcNoliea Elsi opnDipaeet[50 odlvl
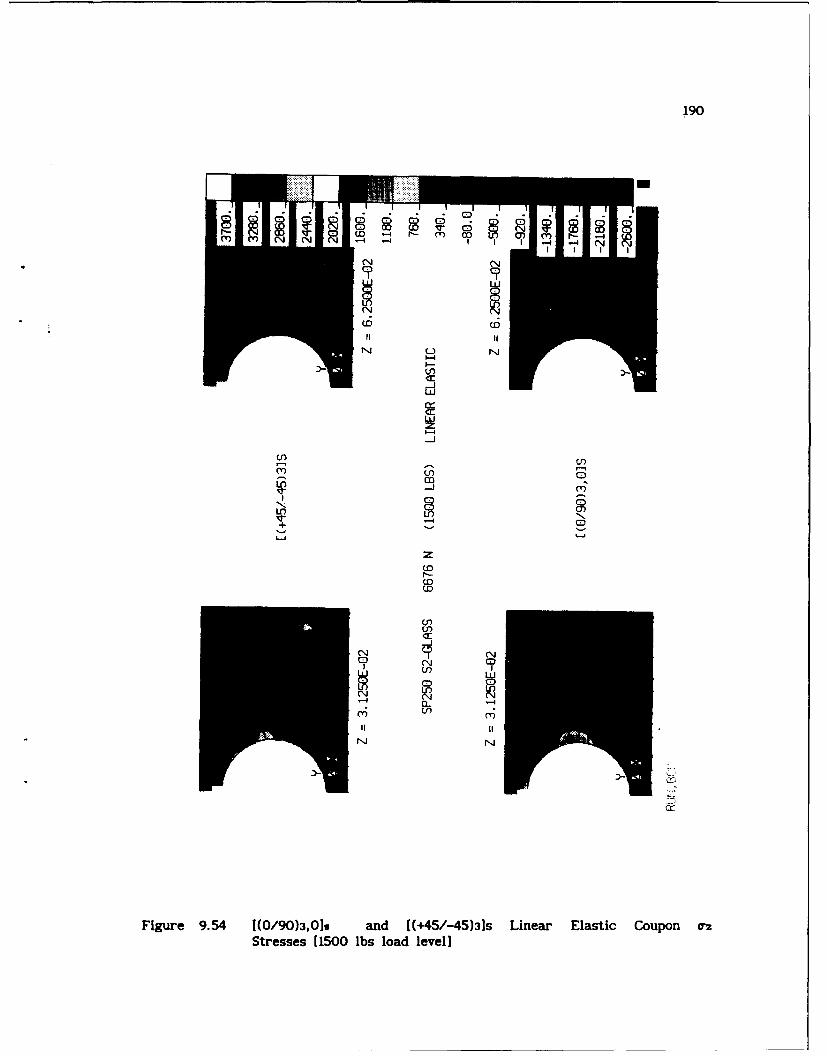
190
Co C
C14
-LO
U) U)
(YO U')Vn
zCoCo
(D
N fI NN 0
Co In
m LO
Figure 9.54 1(0/90)3,018 and [(+45/-45)3]s Linear Elastic Coupon rzStresses (1500 lbs load level]I
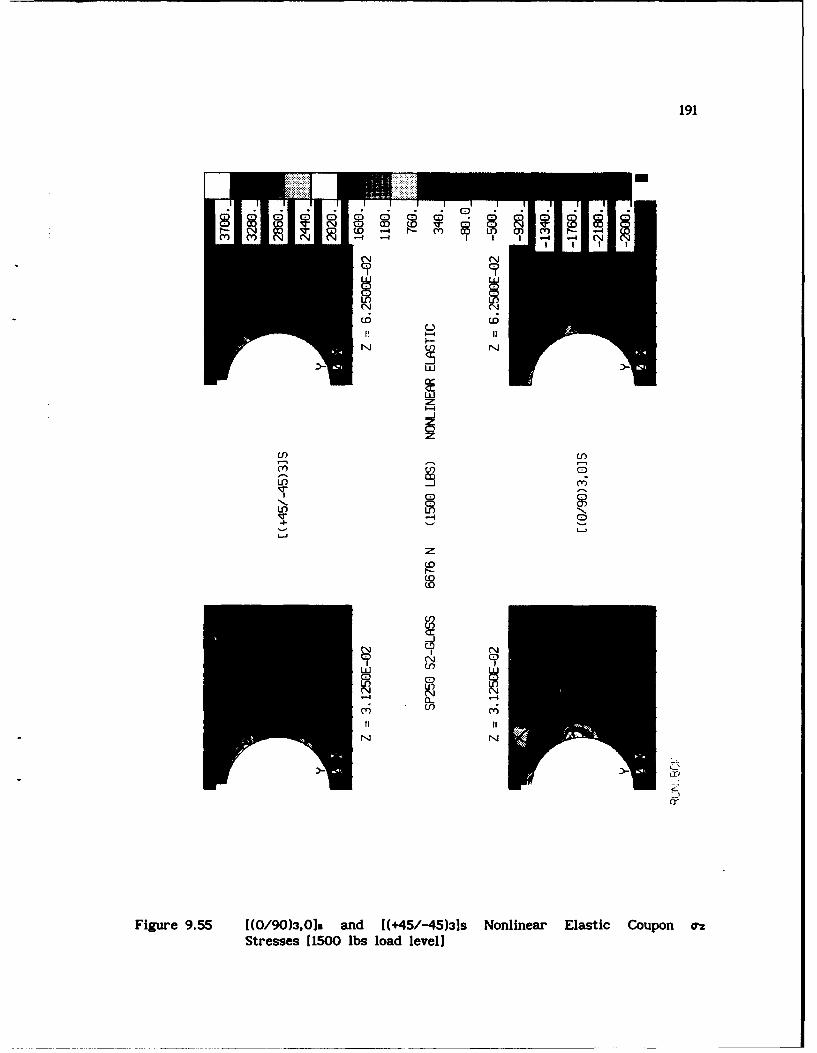
191
to .
-,
z
(y).
11 8§
z
(NN
-~ a_
r'.4
Figure 9.55 [(0/90)3,O~s and [(+45/-45)3]s Nonlinear Elastic Coupon wzStresses [1500 lbs load level]
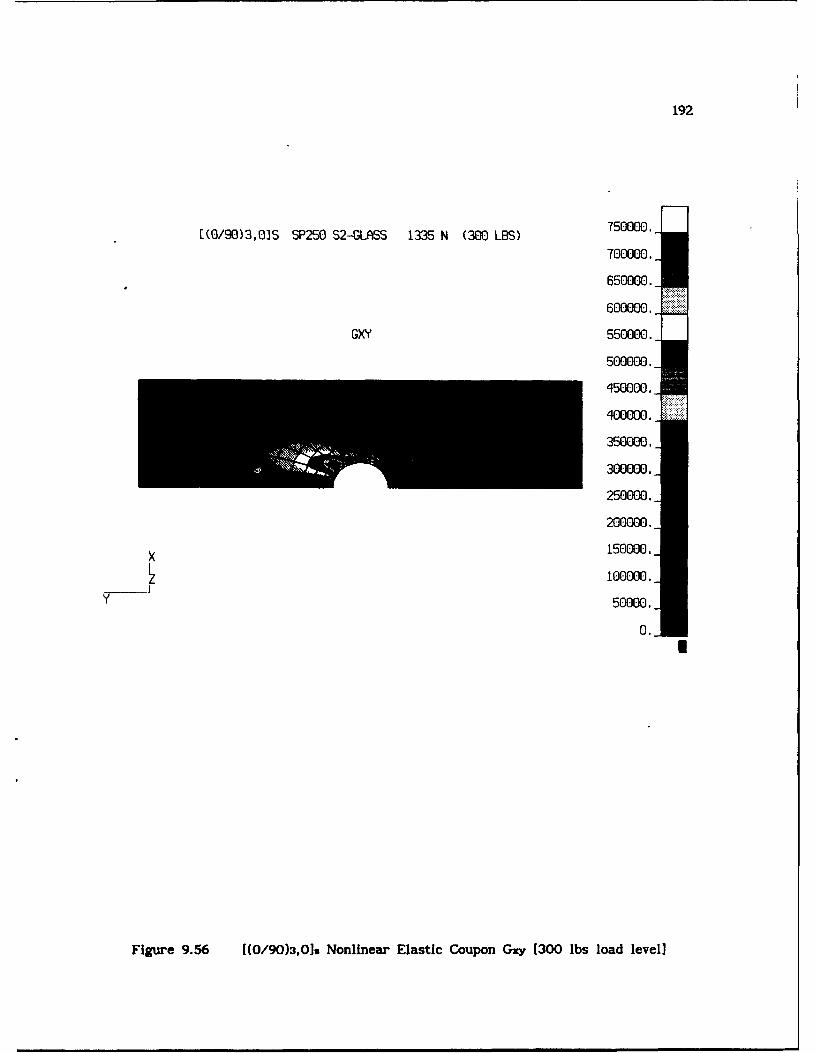
192
1(0/90)3,0]S SP250 52-GLASSi 1335 N (300 LOS)750.
700000.
650000.
600000.
GXY 550000.
500000.
450000.
400000.
350000.
300000.
250000.
200000.
150000.
100000.
50000.
0.
Figure 9.56 [(O/90)3,O~s Nonlinear Elastic Coupon Gxy [300 lbs load level]
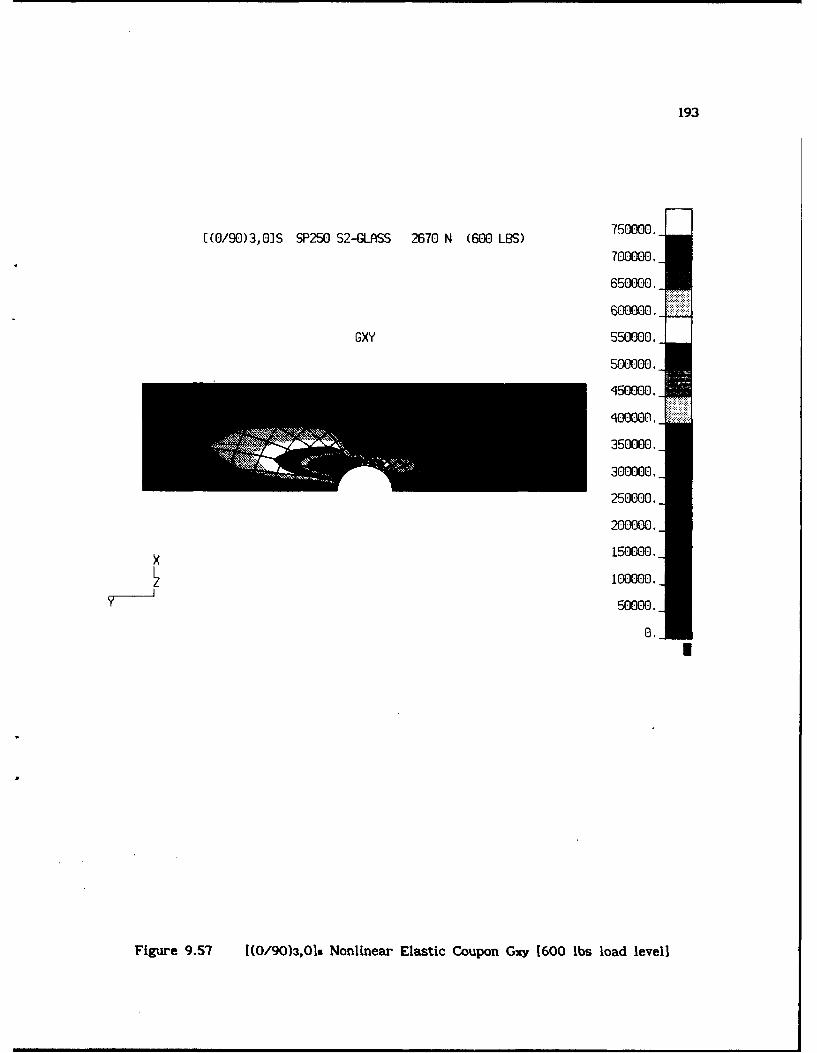
193
1(0/90)3,0]S SP250 S2-9-APSS 2670 N (600 LBS) 750000.
700000.
650000.
600000.
GXY 550000.
500000.
350000.
300000.
250000.
200000.
150000.
100000.
y 50000.
0.
Figure 9.57 ((0/90)3,Olz Nonlinear Elastic Coupon Gxy 1600 lbs load level]
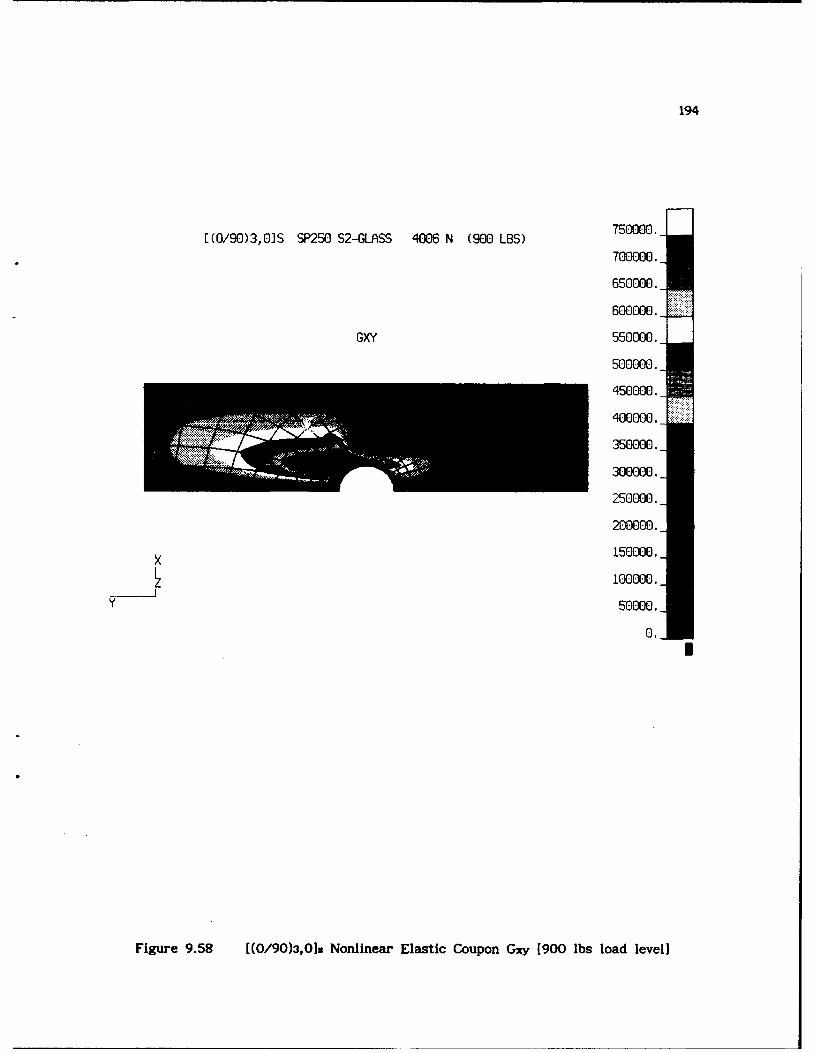
194
[(0/90)3,0]S SP250 S2-CLASS 4006 N (900 LBS) 750000.
700000.
650000.
600000.
GXY 550000.
500000.
450000.
400000.
350000.
300000.
250000.
200000.
150000.
100000.
Y 50000.
0.
Figure 9.58 [(0/90)3,Os Nonlinear Elastic Coupon Gxy (900 lbs load level]
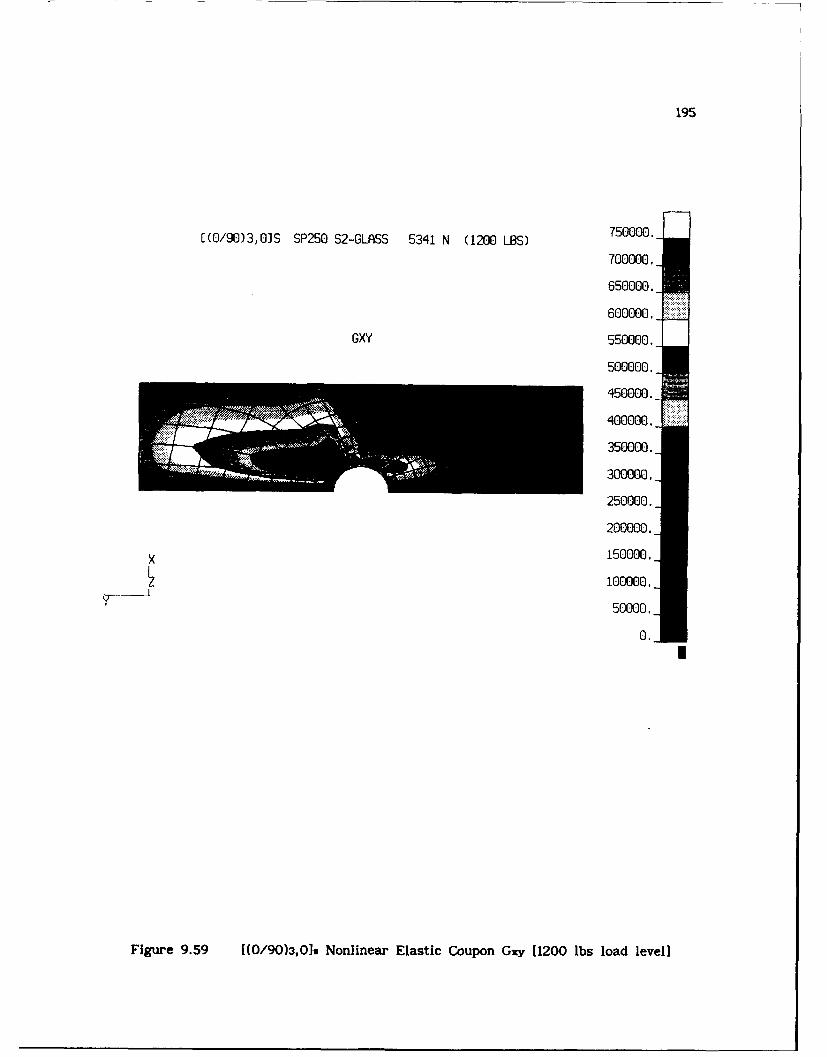
195
1(0/90)3,0]S SP250 S2-GLASS 5341 N (1200 LBS) 750000.
700000.
650000.
600000.
GXY 550000.
500000.
1450000.
... ~ 400000.-
350000.
300000.
250000.
200000.
x 150000.
100000.
50000.
0.
Figure 9.59 ((0/90)3,013 Nonlinear Elastic Coupon Gxy [1200 lbs load level]
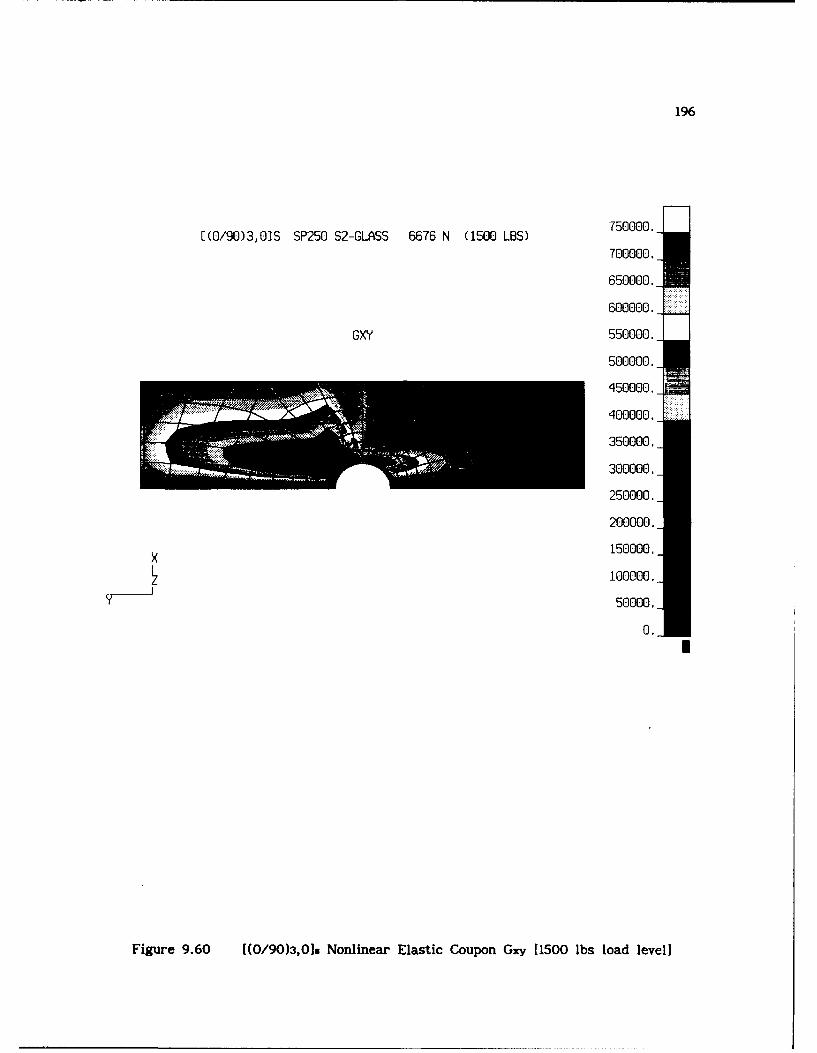
196
[(0/90)3,0]S SP250 S2-GLASS 6676 N (1500 LBS)750.
700000.
650000.
600000.
GXY 550000.
500000.
450000.
400000.
350000.
300000.
250000.
200000.
x t50000.
100000.
y ~50000 ,
0.
Figure 9.60 [(0/90)3,01. Nonlinear Elastic Coupon Gxy [1500 lbs load level]
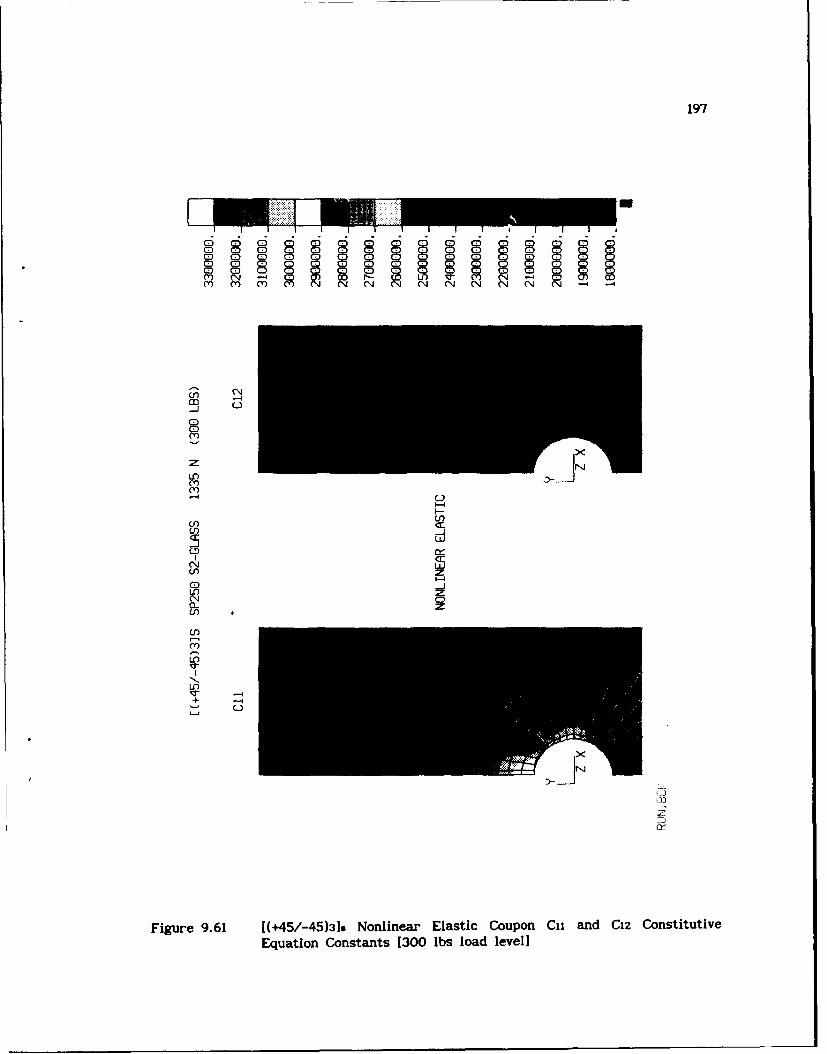
197
. . . . . I . . .
zU)
m I-I
CO
U)
LOU
U')
%r
(NJ
Fue96 4/4)] olna lstcCuo aadC2Cntttv
EqainCntat 30ls odlvl
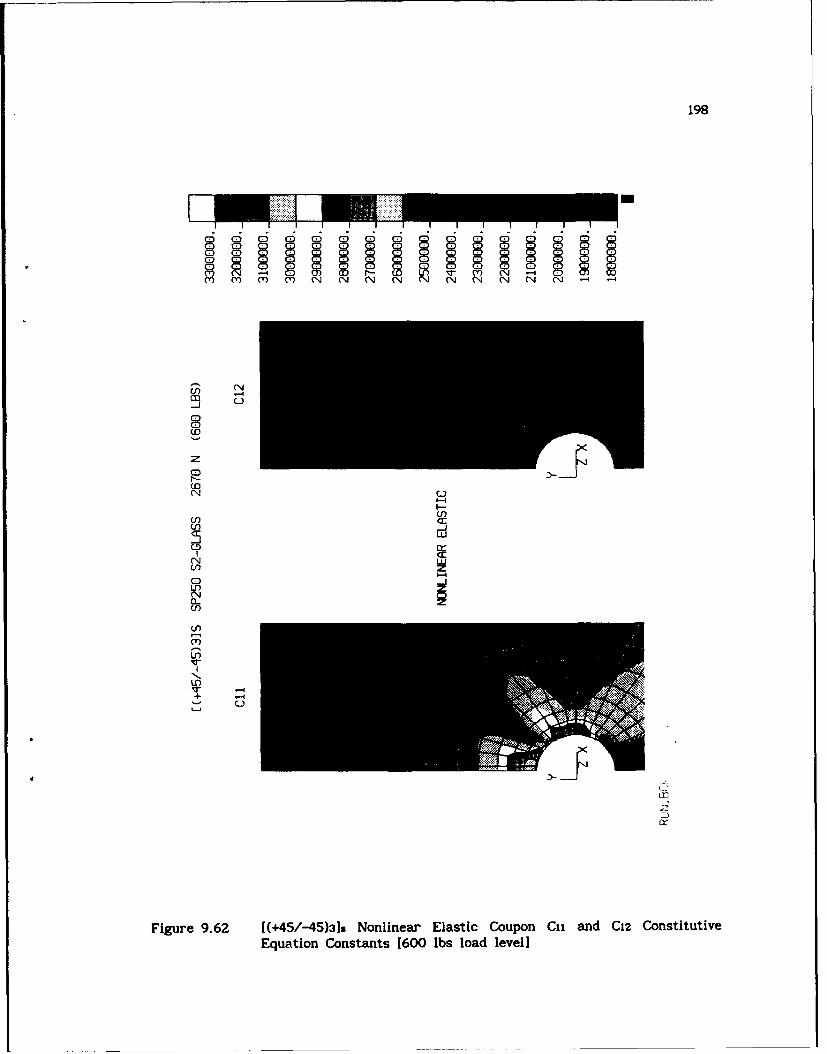
198
CY) CY C) C) N N N N4 (N (N N (N (N ( I
C w
(NQ'-
C Oi
Fiue96-(4/4)] NnierEatcCuo CiadC2Cntttv
EqainCntat(60Ns odlvl
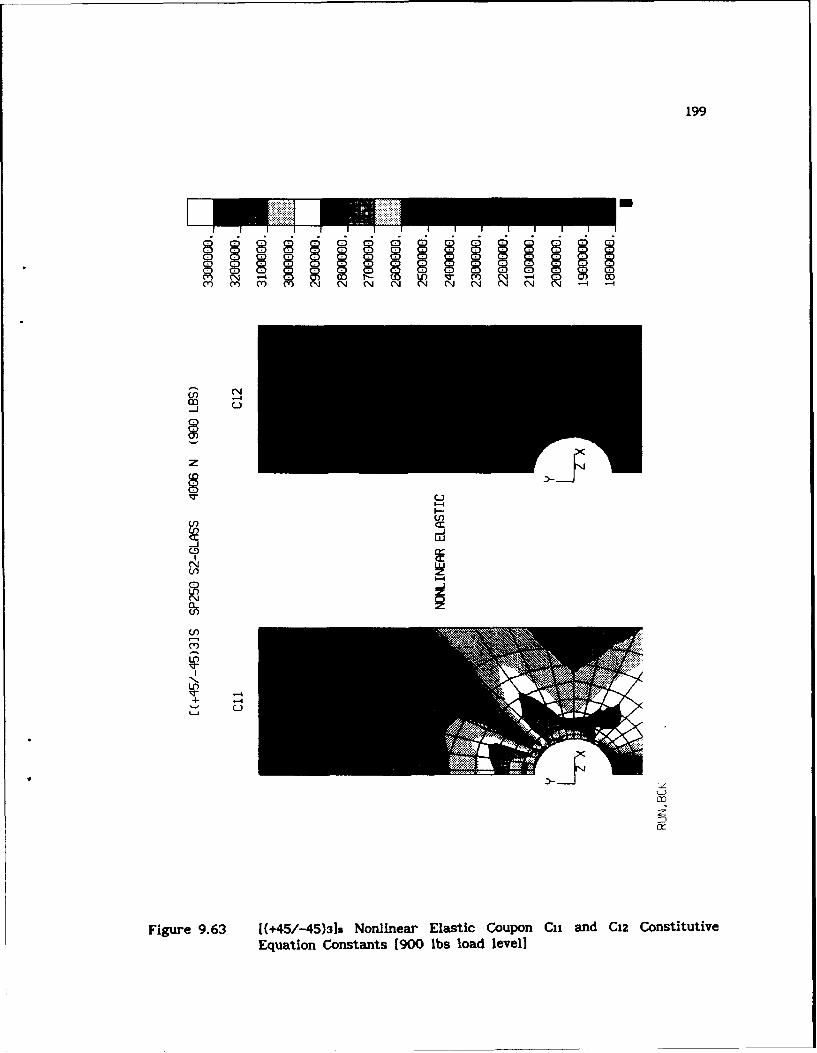
199
f I I I I III I I I I I
z(08
U)U
-C,
LO.......
IT)
Fiue961(4/4)] NnierEatcCuo C1adC2CntttvEqainCntat 90rs odlvl
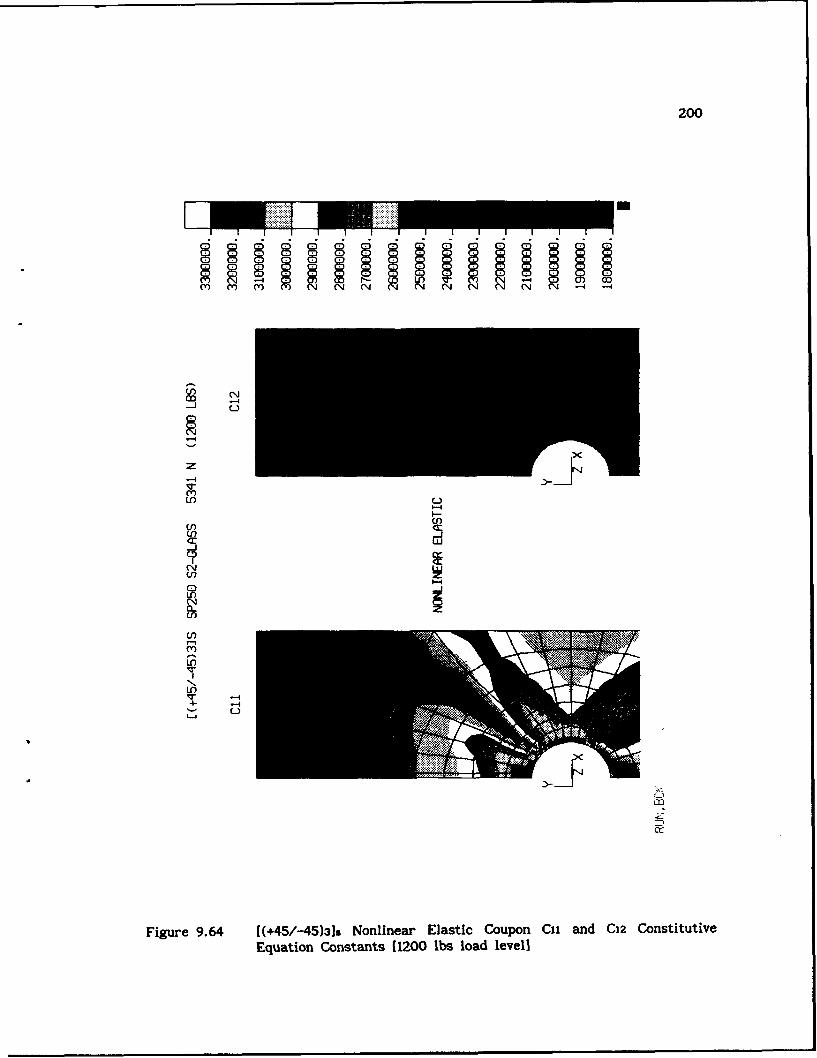
200
(r) c ( Y O' 0) 0 N
() C') Y C) (
U-U)
(N
I- -
+-4
UV
IfX
Figue 964 [+45-45)]s onlnearElatic oupn Ci an C1 Contittiv
Equtio Costats 120 lb lod lvel
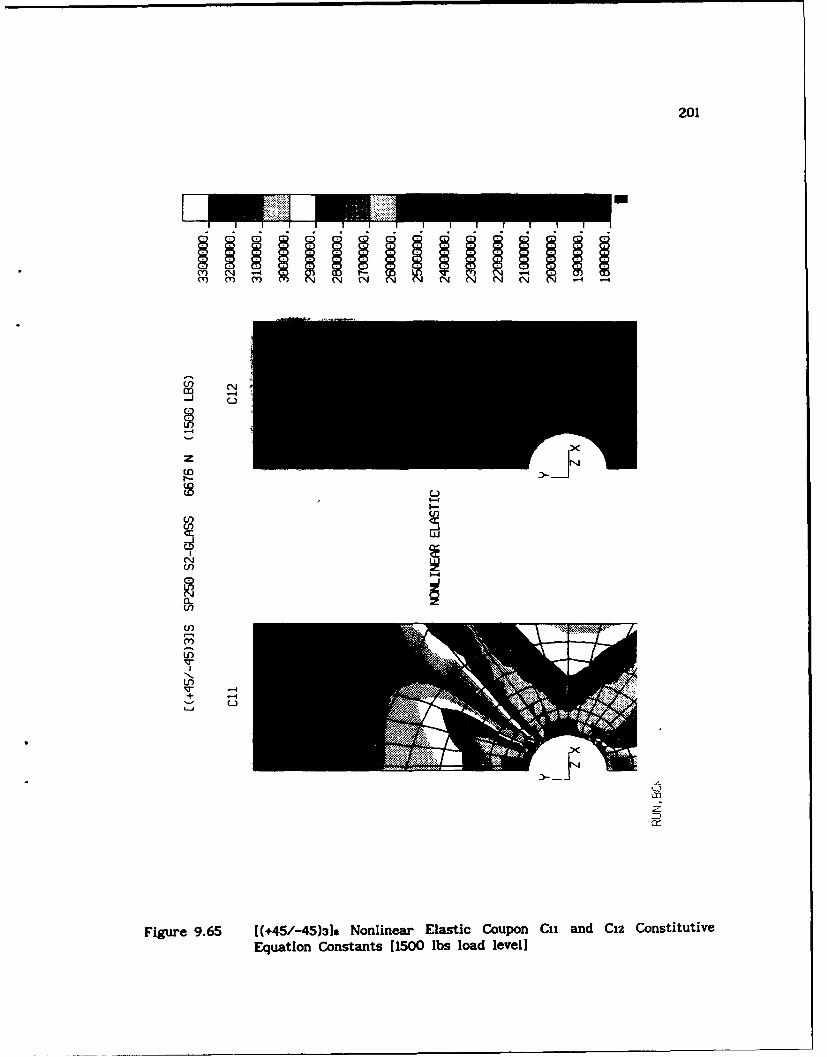
201
I I Iw
z110W-(0
to U
(IO
. ........
UD
UX
Fiue96 (4/4)] NnierEatcCuo CiadC2CntttvEqainCntns[10 b odlvl
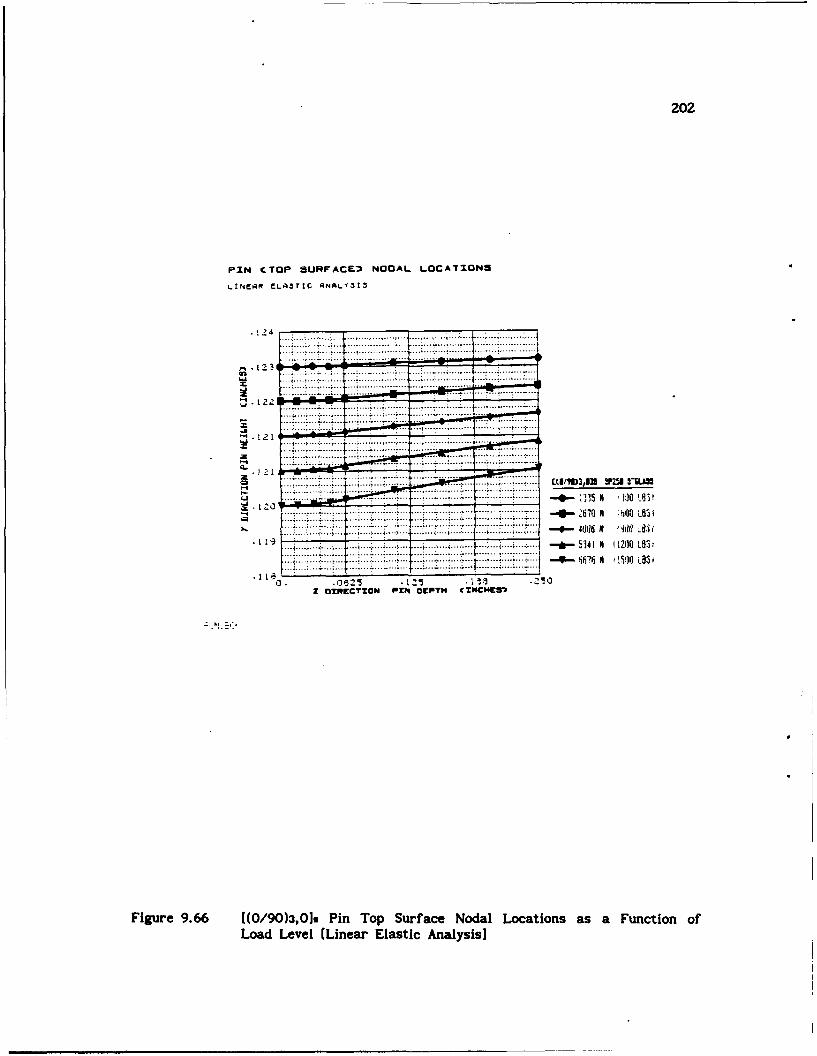
202
PIN CTOP SURFACE.3 NOGAL. L-OCATI0O
LtNeAR eLAartC ANAL1.~Z5
. ... ...... .. .. ....
.. ..... .... .. . ......... .. .. .
cn ~ ~~~~~ ~ ~ ~ ~ ........... .. 2~ .. ....... .. - .... .... -........ ....... ............. ........ _ I. ... .. -: ... .... I. ... ..
4. .. ... .. .. .. t *~ O ~...... .~1 .... .........
.... .... .. ..... ... .... .... .... .. ..... . .. .... .... ...
C.1
Figur 9.66 --/-)301 Pi To ....rface.. Nba Loaton asa FunctionrofLoad... Le.l.LinarElati....yis
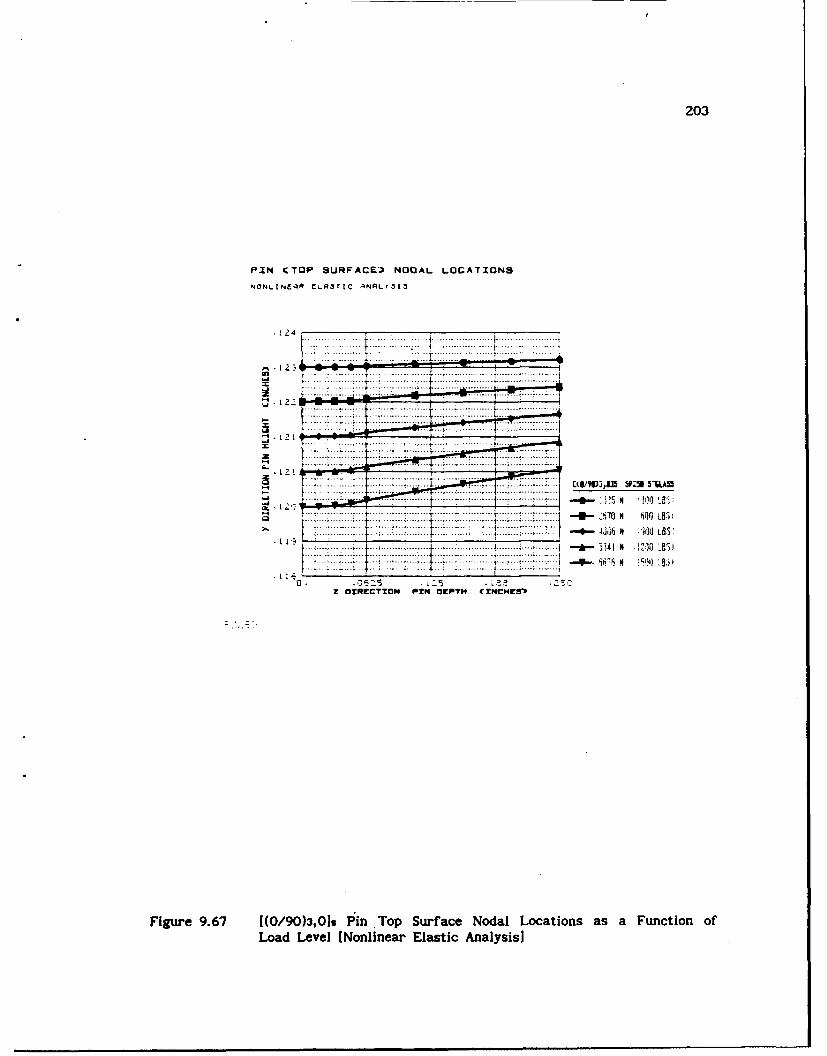
203
PIN CTOP SURFACE31 NOCAL LOCATIONS
NONLINE~ft CLsrtc ANRLr.513
. .. . . . . . . . ........ ............... . ....I
12 4 Q(~~,3 .PJ --- 9,-- -........_ .. 5 Ia ........ ...... *-1 -1 Il
.. .... ... .... . .Z O IR ~C TT.............. . E5
Figure~... 9.6......,Ou in. o S. fc Nodal.. Loaton as.a.uncton.oLoad.... Level..... [Nonlinea. Elsi -nls
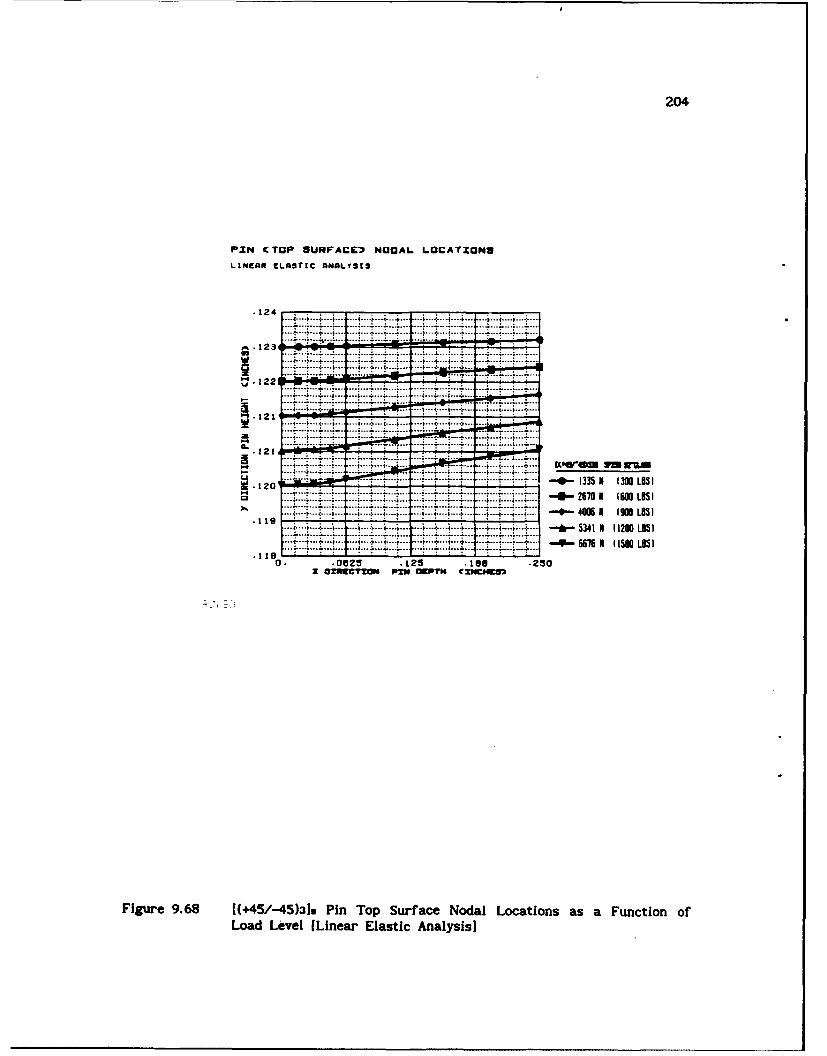
204
PIN CTOP SURFACE.1 NOGAL LOCATIONU
LINEARt ELASTIC ANALYSIS
.124
a.... ....... .
........... ... .. .... ... 399............... ... 91..1
121.. 052 ... 5 !8 .. 250.I.. . ..z. . z g io ...... ...... d. .... .... .. .........
Fiur 9.68......5)3. .in Top Su.ac Noda Lcain as. a.FunctionLo.LodLvl(Lna lsicAayi
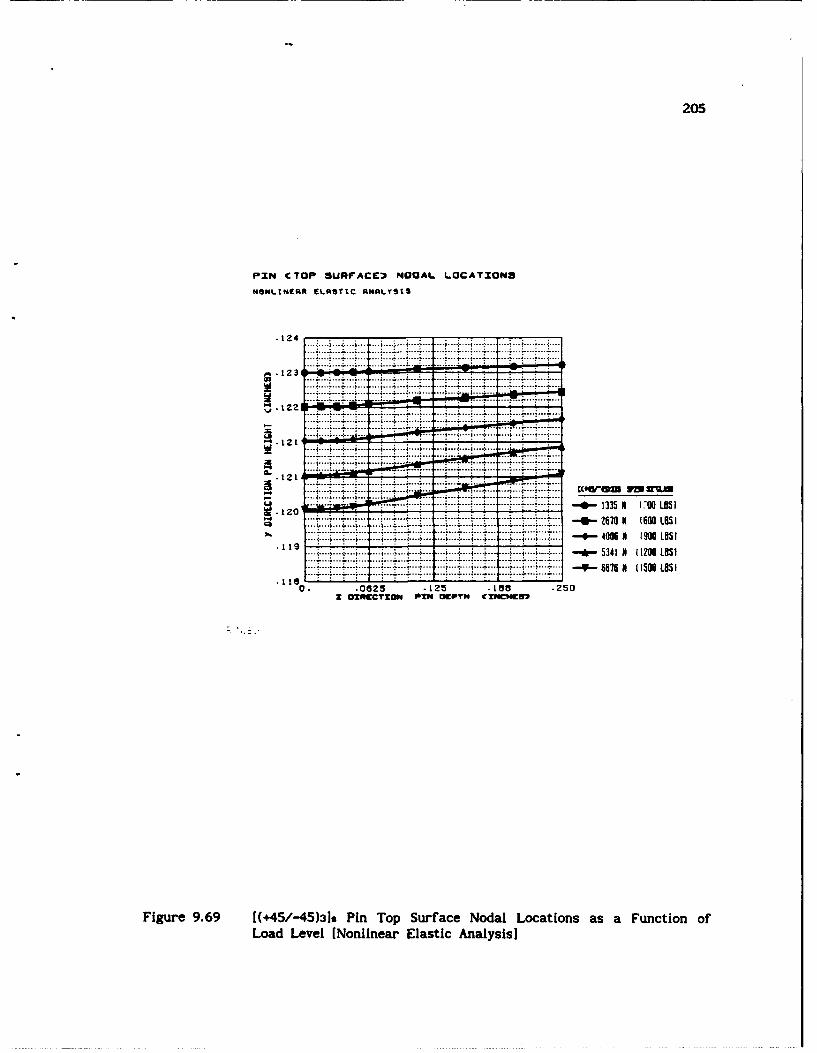
205
PIN C TOP SURFACg, MODAL LOCATIONS
NO#4LIt4EQ0 CLASVC R#4QLYStS
124
--- -- 3--- .. (.1 1...
5 0825 ..... 18825.. .~ C O ..... .C T ..... ..... ...
F~ue9.9 [+414)3.Pn o ufaeNda oatosasaFncinoLoa Level. [Noliea Elsic ..lss
206
CHAPTER 10. EXPERIMENTAL/ 1JVERICAL MODELING COMPARISONS
Post processing of the [(+45/-45)3]s tensile and compressive mismatch
moire displacement fields was undertaken along net and bearing section
respectively to determine experimental Ly strain values. Comparisons of these
strains with three dimensional linear and nonlinear finite element
approximations were made. Experimental and two dimensional linear elastic
finite element [(0/90) 3 ,019 intralaminar shear strains results 1661 were
compared to their respective values from three dimensional linear and
nonlinear elastic finite element approximations.
10.1 Post PROCESSING OF MOIRE DISPLACEMENT CONTOURS
The [(+45/-45)3]s experimental moire displacement contours were post
processed using the moire fringe data acquisition system shown in Figure 10.1.
The CIOOO-O HAMAMATSU video camera was mounted at the end of the optical rail
shown in Figure 5.13 to image the moire displacement fringe patterns within a
CONRAC video monitor. Single light intensity scans were acquired with the
HEWLETT-PACKARD 9845B computer through the C1000 HAMAMATSU digitizing unit.
Light and dark fringe intensities of the 1024 pixel scan were digitized on a
256 grey level scale. Smoothing of these fringe intensity variations was done
by slightly misfocusing the fringe pattern image. A typical scan line is
shown in Figure 10.2. As can be seen, increased fringe density allowed a more
accurate fringe center selection.
The [(+45/-45)31@ moire fringe patterns with a compressive mismatch
were used to obtain bearing section cy strains. Half order fringe locations
of contour interval .0005" were obtained from a bearing section scan.
Graphical differentiation of the resulting v displacement versus y location
curve (av/Oy) and subtraction of mismatch pattern strains yielded bearing
207
section cy strains at ten section locations. This procedure was followed for
all load levels with the exception of the 300 lb case which suffered from
poor photographic quality.
The [(+45/-45)3]s moire fringe patterns with a tensile mismatch were
used to obtain net section cy strains. A total of ten vertical scans
throughout the net section were made. Fringe shifting methods1 were employed
to straddle a light / dark fringe intensity variation over the net section for
each scan. The .0005" displacement contour interval of this light / dark
fringe pair divided by its measured fringe spacing yielded the net section cy
strains for each scan. This procedure was followed for all load levels with
the exception of the 300 lb case which suffered from poor photographic
quality.
10.2 [(0/90)3,01, LAMINATE COMPARISONS
Maximum [(0/90)3,01. intralaminar shear strain values for both the
linear and nonlinear elastic three dimensional finite element analysis were
compared to those from the two dimensional linear elastic finite element and
moire results from the authors earlier work (661. These comparisons may be
seen in Figures 10.3 through 10.7. The two dimensional linear elastic finite
element results were slightly less than their three dimensional linear elastic
counterparts. Moire Intralaminar shear strain values appeared to be somewhat
lower than these two dimensional results for the 300 lb load level. The 600
lb and 900 lb load levels showed an agreement with the two and three
dimensional analysis respectively while the 1200 lb load level showed a closer
agreement with the three dimensional nonlinear elastic analysis. However; the
300 lb, 600 lb, and 900 lb load level moire results were lower closer to the
pin than their sectional trends suggested. Moire results for the 1500 lb load
level were in good agreement with the three dimensional nonlinear elastic
results away from the pin, but showed an increased tendency to exceed those
values closer to the pin.
The observation of slightly higher )xy strain values for the three
dimensional analysis in comparison to those of the two dimensional analysis
was no doubt caused by pin elasticity effects. The simply supported pin
208
boundary conditions employed in the three dimensional analysis produced pin
deflections that caused an uneven through thickness load transfer between the
pin and the coupon. This may be seen In the pin deflections of Figures 9.65 -
9.68. In this instance, front surface strains were slightly higher than
midsurface or rigid pin strains.
The increased tendency of the moire strain data to approach and
surpass the three dimensional nonlinear elastic analysis results with
increasing load level was caused by the unsymmetric experimental pin boundary
conditions and the presence of a material shear failure mechanism. The
clamped/simply supported boundary conditions of the respective rear and front
pin surfaces employed during the experimental moire analysis resulted in
unsymmetric pin deflections. This type of deflection caused the rear surface
of the coupon to carry a higher percentage of the pin load than the front
surface forcing initial front surface moire strains to be lower than those
predicted by analysis. This is born out by the uneven front and rear surface
coupon strain values observed in the author's earlier work [661 where a
clamped/free (rear/front) pin boundary condition was initially investigated.
Lower experimental moire shear strains near the pin in the 300 lb, 600 lb, and
900 lb load cases was caused by using only the Ov/8x component of shear strain
in determining Vxy. The 8u/8y component of shear strain could not be
determined due to a lack of u field contouring sensitivity. The presence of a
material shear failure mechanism no doubt acted to progressively increase the
shear strain values for the higher load levels thus causing them to approach
and surpass those of the nonlinear elastic analysis.
10.3 [(*45/-45)3], LAMINATE COMPARISONS
A comparison of three dimensional linear and nonlinear elastic
analysis [(+45/-45)319 bearing section Cy strains' with those for the
experimental moire analysis may be seen in Figures 10.8 through 10.11.
Similar net section cy strain comparisons may be seen in Figures 10.12 through
10.15.
For the 600 lb load, moire and finite element bearing strains were
inclose comparison far. from the pin. However, moire strain values appeared
209
lower than the linear elastic results close to the pin. All other load levels
indicated a good agreement between moire and three dimensional nonlinear
elastic finite element bearing strains. However, slightly lower moire bearing
strain values were seen close to the pin followed by slightly higher moire
bearing strain values just beyond the pin. Far field bearing strains were in
excellent agreement with finite element results.
The 600 lb moire net section strains were in excellent agreement with
the three dimensional nonlinear elastic finite element results. At subsequent
load levels, net section moire strains appeared to exhibit progressively
higher values than those of the nonlinear elastic analysis at close pin
proximity. This divergence spread deeper into the net section with higher
load level until the 1350 lb load case where far field net section moire
strains exceeded those of the nonlinear elastic analysis.
Bearing strain comparisons close to tle pin for the [(+45/-45)31]
laminate appear to be affected by the clamped/simply supported (rear/front)
experimental pin boundary conditions in much the same fashion as the
[(0/90)3,019 intralaminar shear strain comparisons. Higher experimental moire
strains are expected if a symmetric simply supported pin boundary condition
was used during the experiment. Net section strain comparisons did not appear
to suffer from this experimental pin boundary condition effect. This seemed
plausible in that the unsymmetric pin/coupon load transfer occured in the
bearing region and not the net section. Variations in net section moire
strains from those of the three dimensional nonlinear elastic analysis were
highly suggestive of a tensile material failure mechanism.
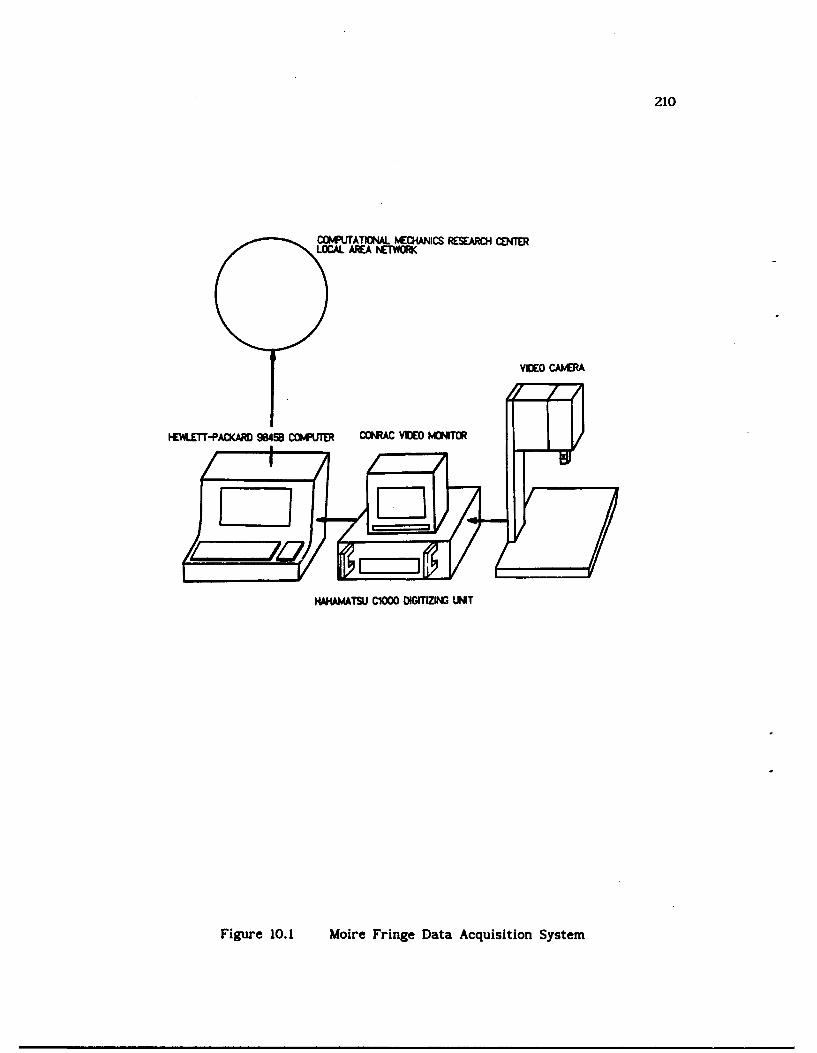
210
COMPLTAT04kA NE4NICS RESARCH aDTERLOCAL AIEA NETWORK
VIDEO CAMERA
HEWLETT-PACKAI 98M5 COMIDLM CONRAC VIDEO MOMTOR
KWAMATSU ClOO0 DIGIIZING LT
Figure 10. 1 Moire Fringe Data Acquisition System
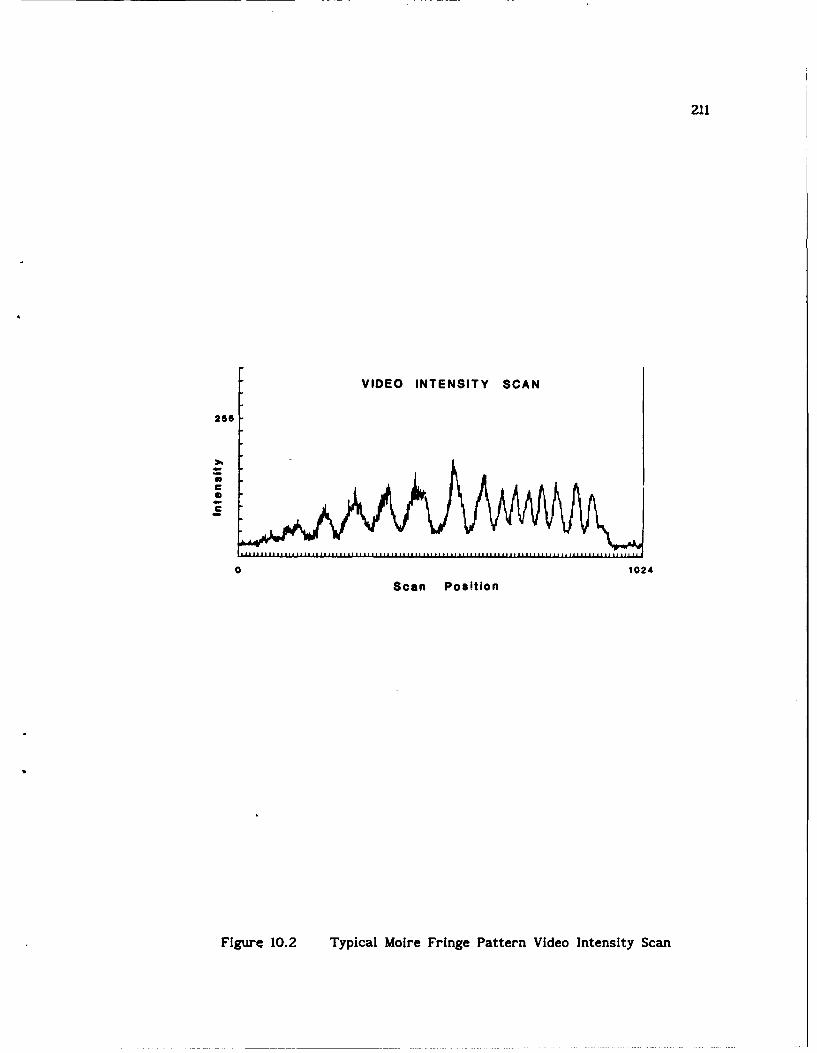
211
VIDEO INTENSITY SCAN
256
0 1024
Scan Position
Figure 10.2 Typical Moire Fringe Pattern Video Intensity Scan
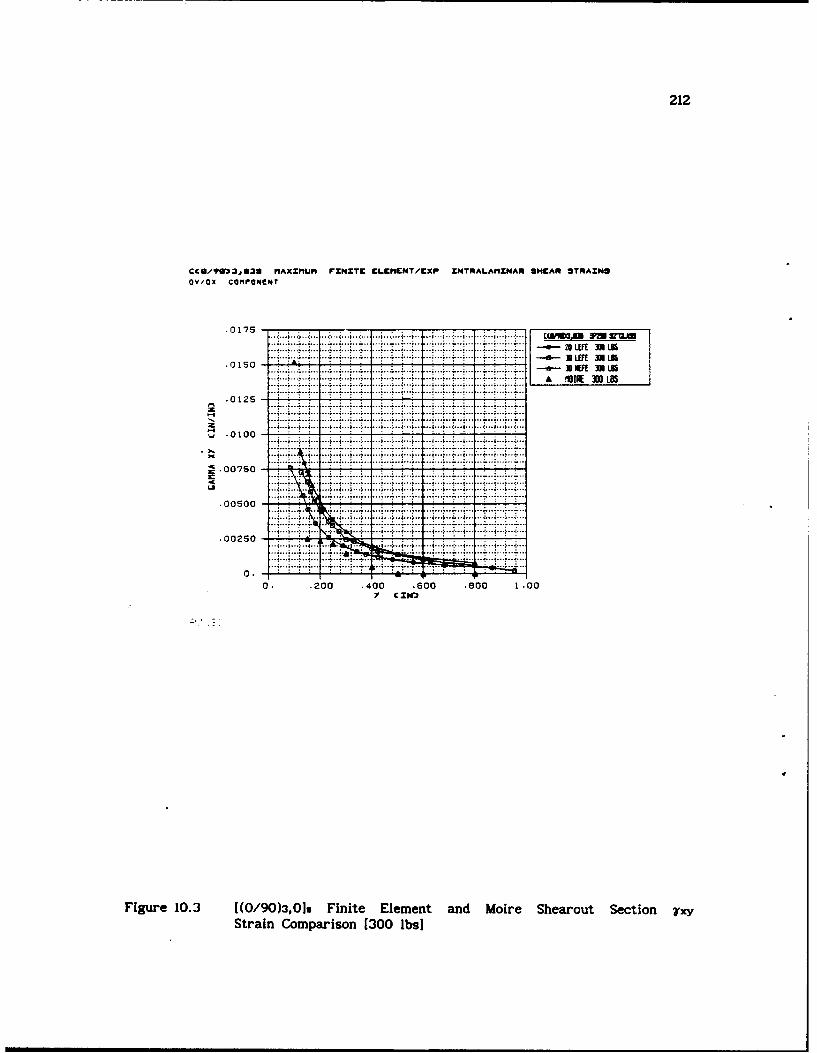
212
CCIB/90 3,638 MAXIMUM FINITE ELCI1CNT/EXP XNTftALAflINAX GHEAR OTRAXHOOV.'OX COMPOMCNT
.0 7 ....... .............. ... .................. ....... .........
.0150 'A . . . .......... ]aof LS
.....01....5.
....... ..0..0
0050 - *
0. . .0 .400 .. .60 .0 1.0
Strain Coprsn 30 s
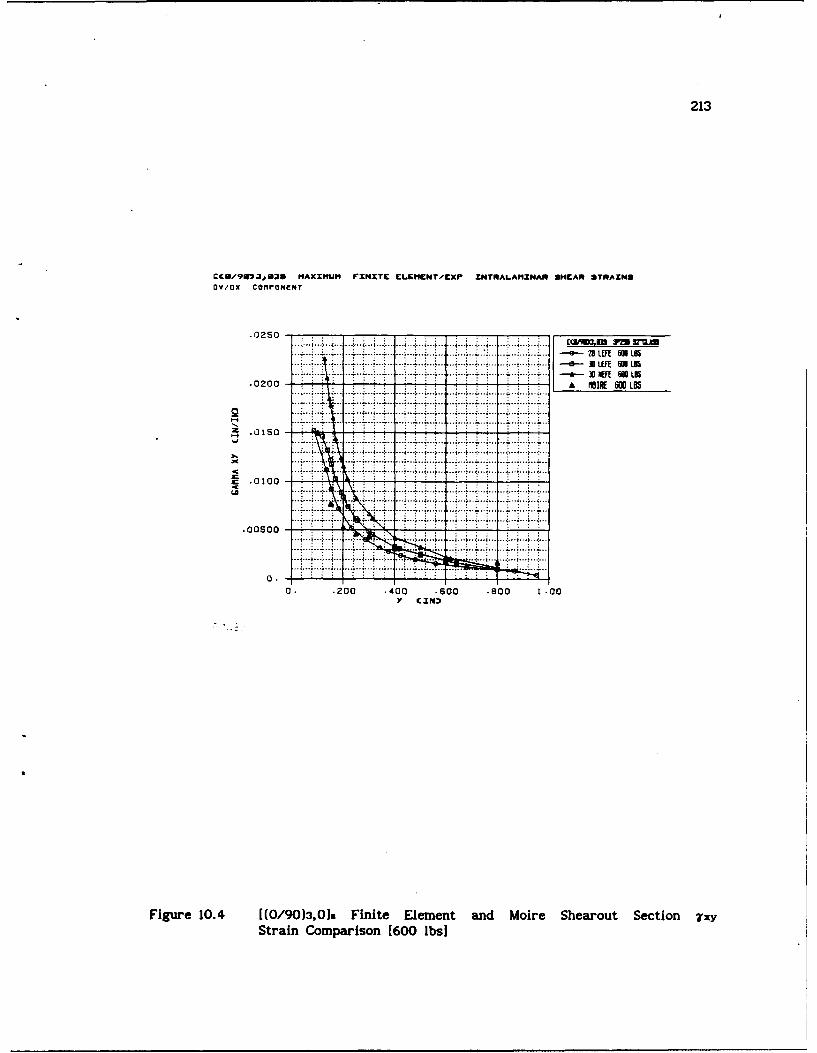
213
CC/90U3f,3U MAXIMPM FrNXTE ELKMCNT/EXP INTRALAMINAM SHEAR STRAINS
Ov/ax COnrONENT
t02f t........ ... ... ...... ..... .... ....... ..... ..... ...... -- . ....; .------... .. 20 Im m at wre 5
----.. --.. ... --- - ;--. .........-... ... * ...... . .. . -:...... 3. . .0-;- o fF 600 t85
.0200 £ IRE K60 LOS
Z. .. ...-...... .. .-
2C -.. .. .. . . ...... i .. ... ...... ... ..-... ..-... -... - .... - .-
...... ...... ...... .. -. ...... ?......... .. ...... . .... ... .... ... ......
.. ... ... .. .. .. .. ... .. .. ......i ..:: ... .. . i.. ...... ...... ..
C 0100LO...... .... .
...... ........ .." ...............
0 •20 0 .400 -00 -800 1 .00
Y CIZN)
Figure 10.4 [(0/90)3,O1 Finite Element and Moire Shearout Section )'xy
Strain Comparison [600 lbsi
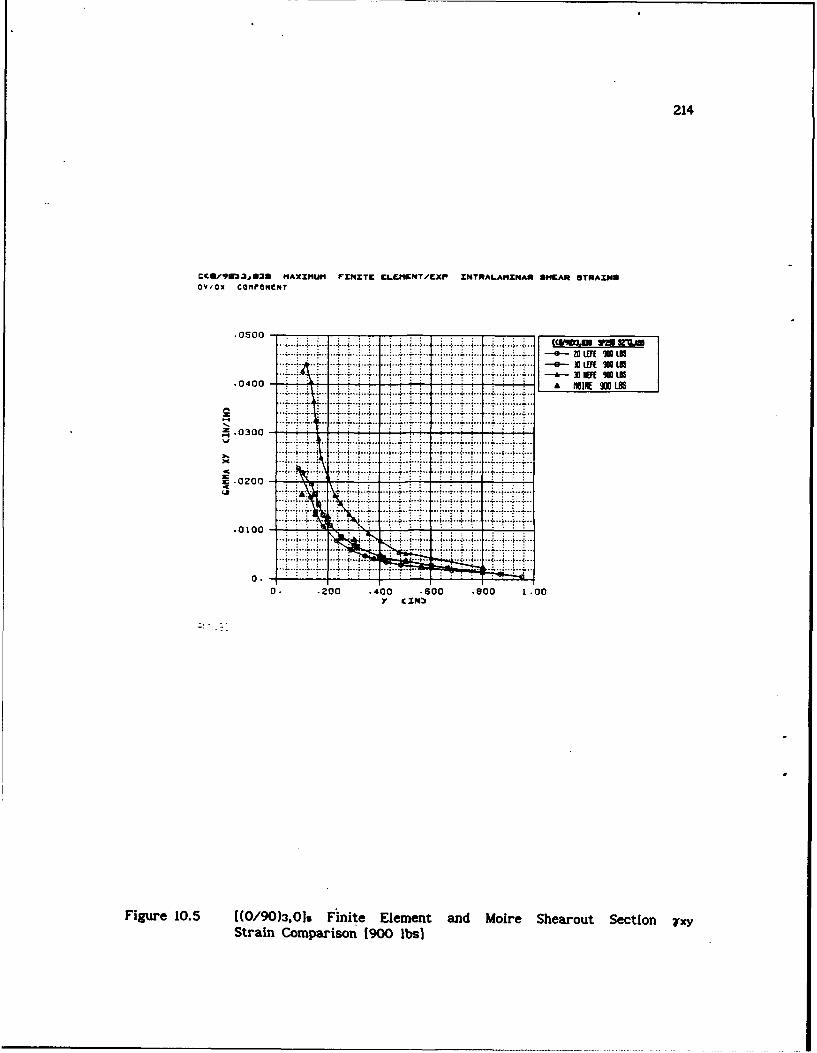
214
CCO/9U=3,039 "AXXIM FINITE ELEMENT/CXP XNTRAL.AMXNAR SHMAR STRAINSDy/Ox coNFG~e#4r
.0500 -___ ______
.0400 -.- *-.--BIR-4*---i-£ Ef 9 15
....... 4.. ......
= 0300
.0100
.. . .. . .. .. . . . .. . .
0.0. .200 .400 .600 .800 1.00
y C IN
Figure 10.5 [(0/90)3,01, Finite Element and Moire Shearout Section yxyStrain Comparison (900 ibs)
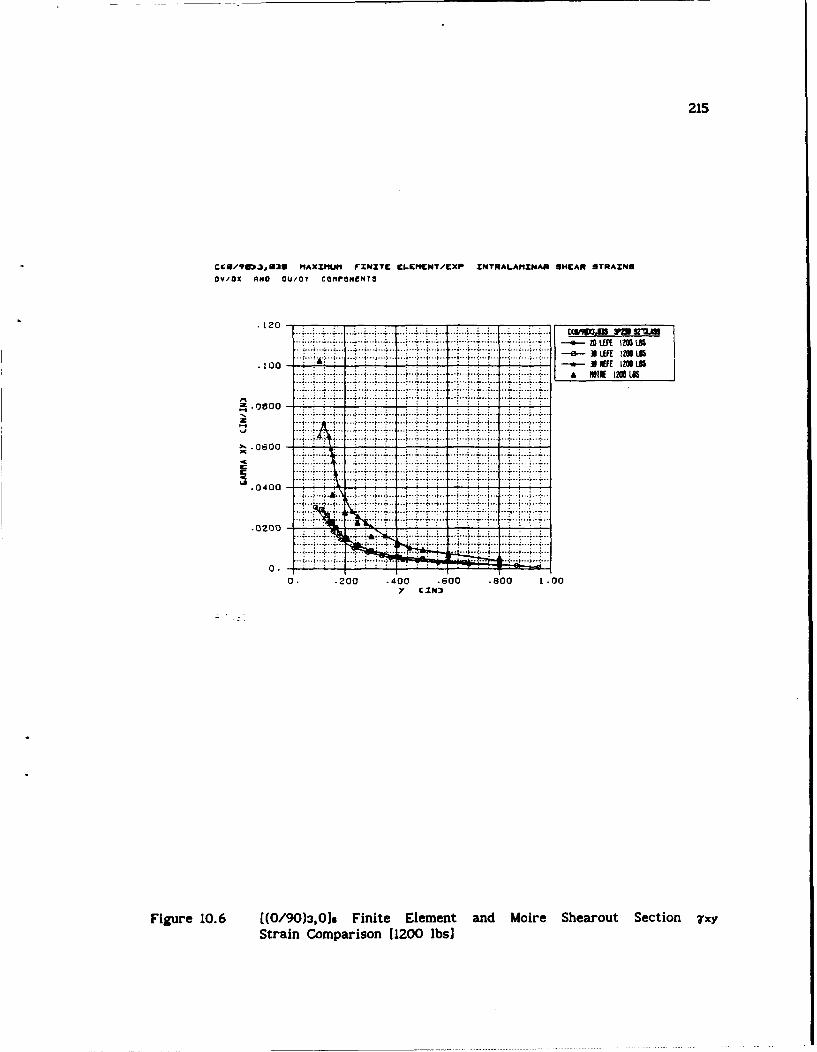
21S
CCG/?IYU,3,U IIAXIIIUf rZmXC ECCCNT/CXP INTRALAMINAN aNEAR 2TRAXNUOV/Ox ANO OU/OY cOHPeNeNT8
20 - :.: : * ; . .
Se.-LEFE I= L85
.100 0NE10L8
.0800
.00 20 40 60 00 10.. .. .. .. ... .. ....
Figure.. 10. [./0) 1 Finite.... Eleen and .. Mor7 harotSctoStrai Coprsn(20ls
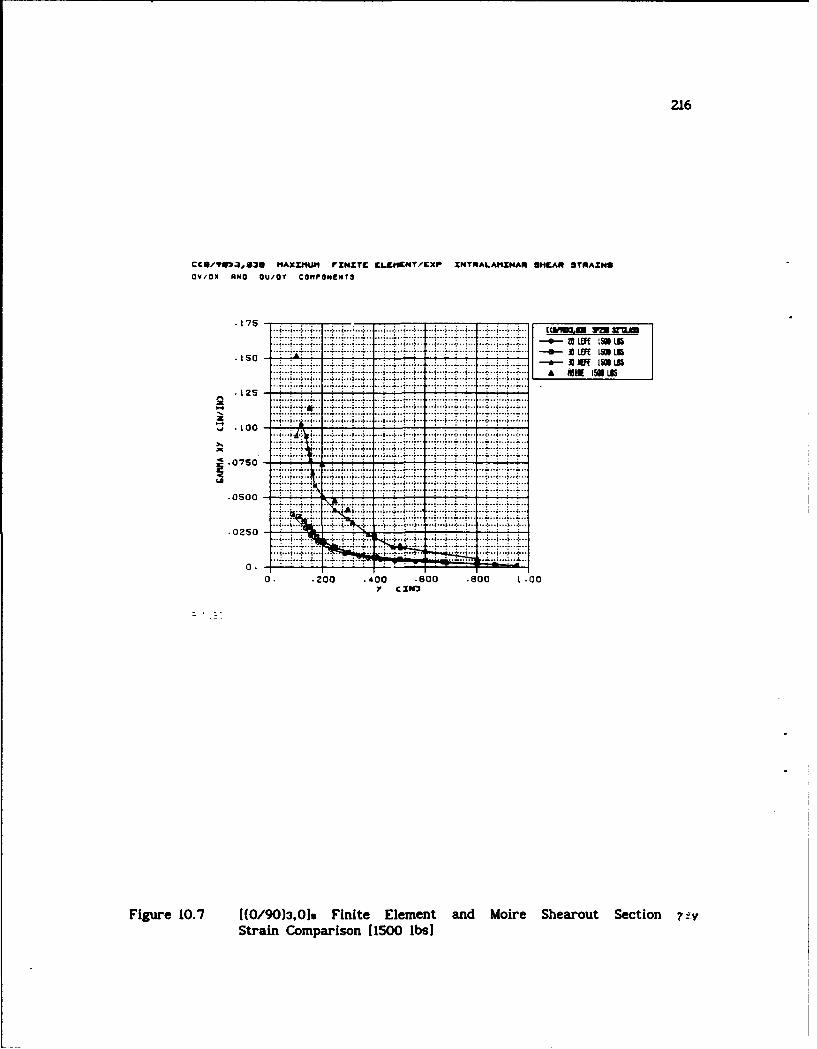
216
ccUwYU~J,z3e IAxIIIW rXNXTE ELEIIENT/CXP XNTftALAnXNAM SMAR 9TRAXNSOVIOX ANO Ou/OY COMPONENT3
.. . .... ...75.. C V
If 1205LO-4 4.4.....4. . .
..100.. . . .......... .......... .. ...... ........
... .0750... .... ...
.. . ...... .....
'.0250
. 0 . .0 ..0 ...0 . . . .0
Strain Coprsn[50is
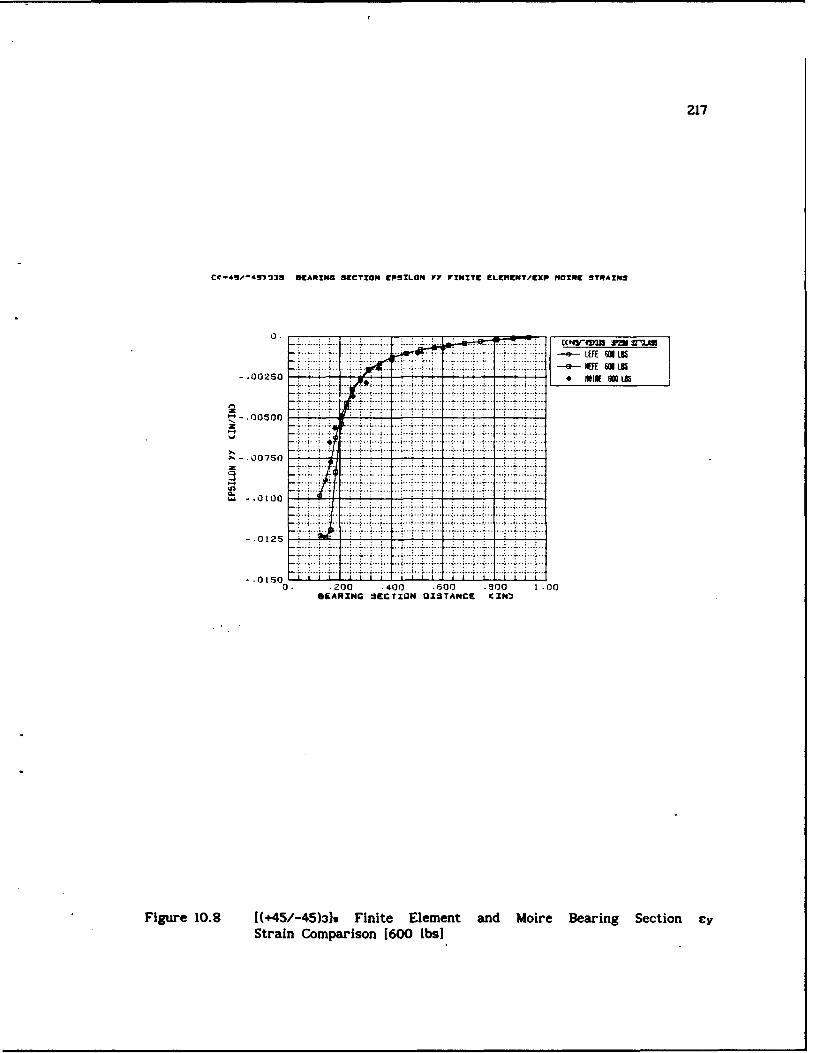
217
LIT-~E FALOS
.... ..002.5. ...-~~ * K II 0 8LS
- 00500
~. 007S0
- 01t00
.... ... ... ..
0. 200 .400 .600 -F00 1-00BEARING SECTION 01STANCE CINI
Figure 10.8 [(+45/-45)319 Finite Element and Moire Bearing Section cyStrain Comparison (600 ibsI
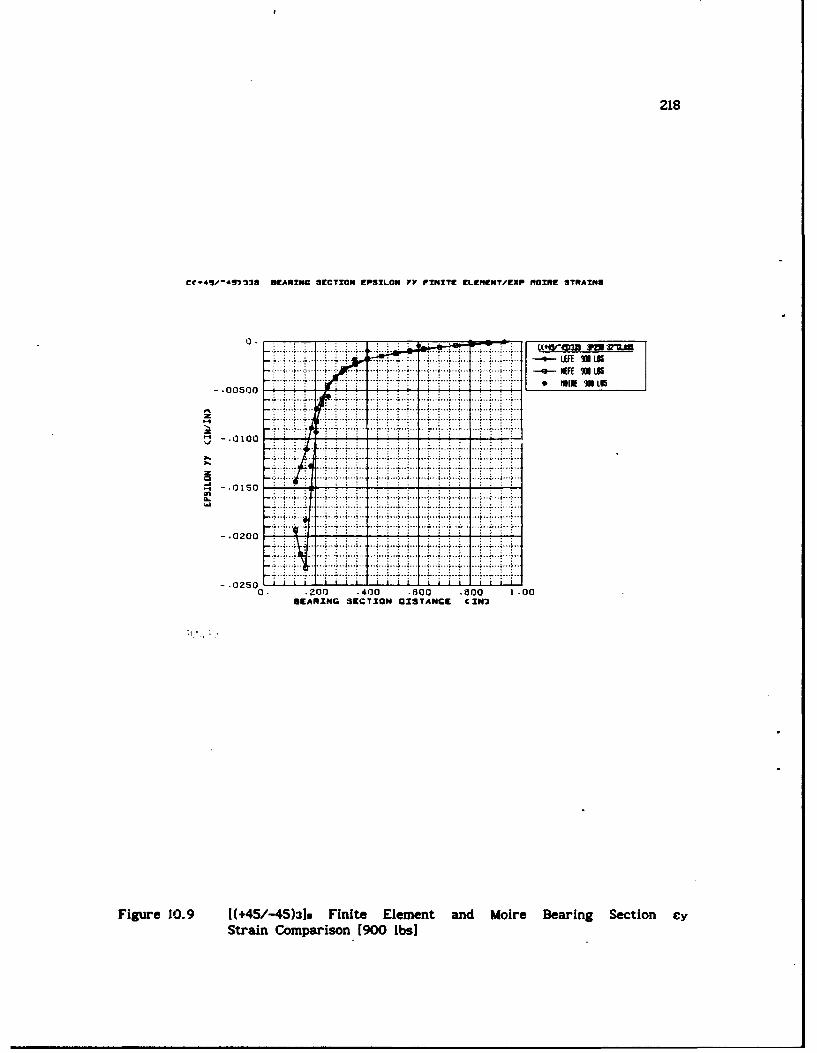
218
Cr.45/-491JI3 *tAR21NG SECTION EPSILON Yy FINITEC LCPWNT/CXP NlOTRE STRAINS
0. 1
.a .___ . __..__ _ON a 8- .00500
-~.. .0...... __
-00 20 40 80 0 0
BEARING SECTION DISTANCE CX#O
Figure 10.9 [(+45/-45)31* Finite Element and Moire Bearing Section cyStrain Comparison 1900 ibsl
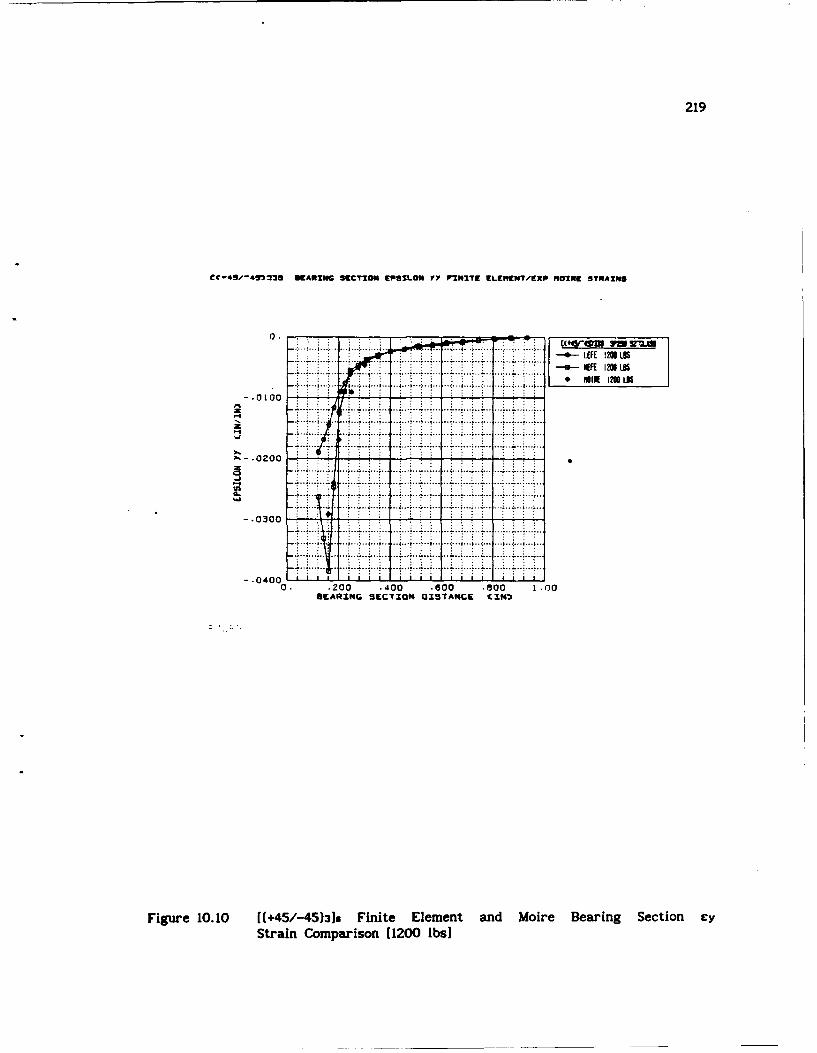
219
CC-49-4!92 OCAUWC S(CTXN IEPSILON YY FINITE tL9MtNT/EXP M02RE SYUATHS
-LEFE 1201LOS.. ~ ~ ~ l~ .... .......
#Au 1200 LS
...... L.z .. .NIE-211 1
.. .... . ...
z ... ..... .... .... .... .. ..... ...
--. 0200
.~ .. . . . . . . . . . .. .
.40 20 0 0 0 -)GEARING SECTXON DISTANCE CXN)3
Figure 10. 10 [((45/-45)3]s Finite Element and Moire Bearing Section cyStrain Comparison [1200 ibs)
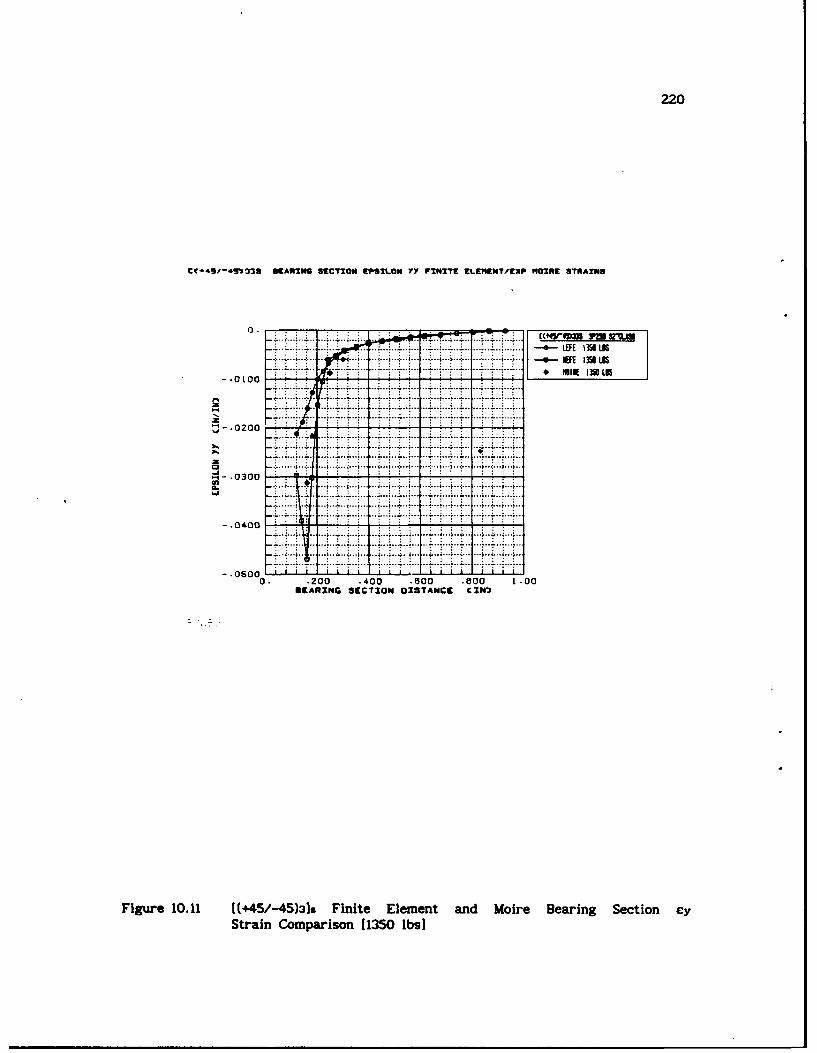
220
Ct.4S/-4n39 GEARING SECTION EPSILON YY FINITE ZLENEW!/ZXP M~OIRE STRAINS
EaOMM
.......... ..... Lu 30 OMR- 135 ~LB
..............-.........
.- 0200. ..
~-.0300
- 0300
0 . .20 .400 ... 00. . .0 .00.
*CARNG SECTION DISTANCE CZ#O
Figure 10.11 [(+45/-45)319 Finite Element and Moire Bearing Section cyStrain Comparison 11350 ibsI
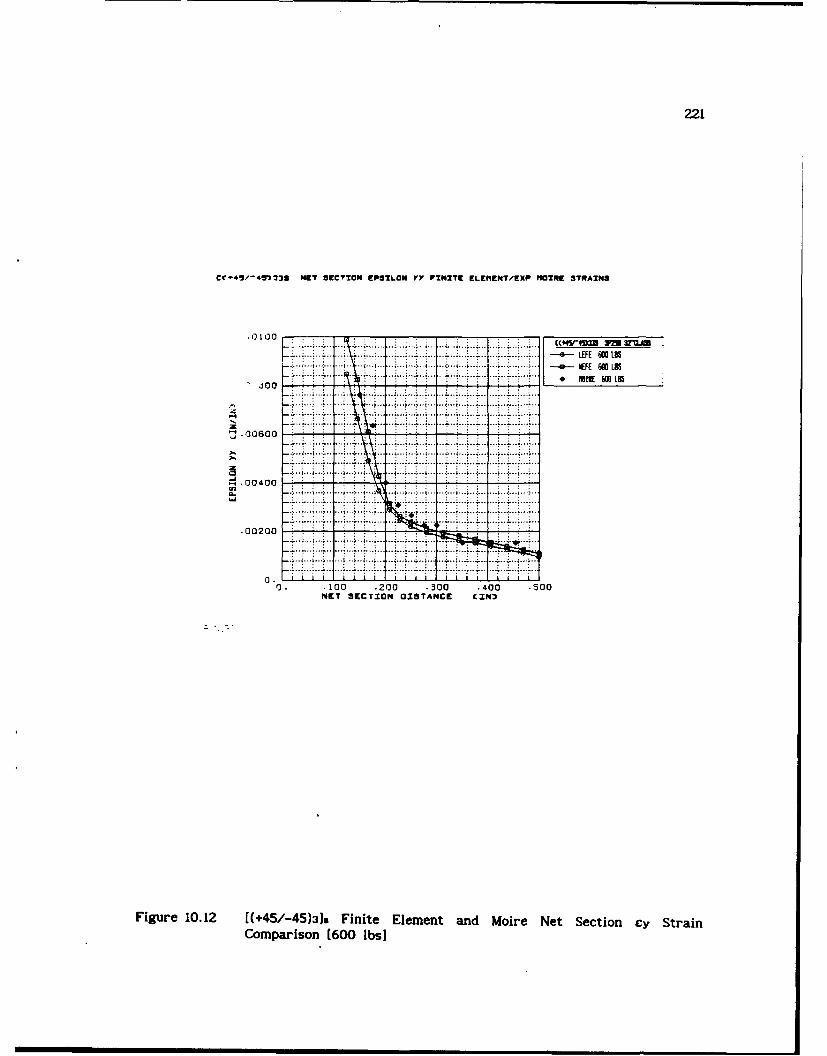
221
CC-49/-491J33 MET SECTION EPSILON Yy FINITE ELEMENT/WXP MOIRE STRAINS
0.....0 ..... .. (54 M M WL
........ .. .. ....... .... . . .. .. e LEFE 60LB... .. ..... -.. EFE 6W LB
.................. SI ....... L.... .J00 : : -.- .- :-
. . . .mff648
.. .. . ... .. .. .
.. ... 0..00.
. 34 0 . 0 20 30 40.0
NET SECTION DISTANCE CZN13
Figure 10. 12 [(+45/-45)319 Finite Element and Moire Net Section cy StrainComparison (600 IbsI
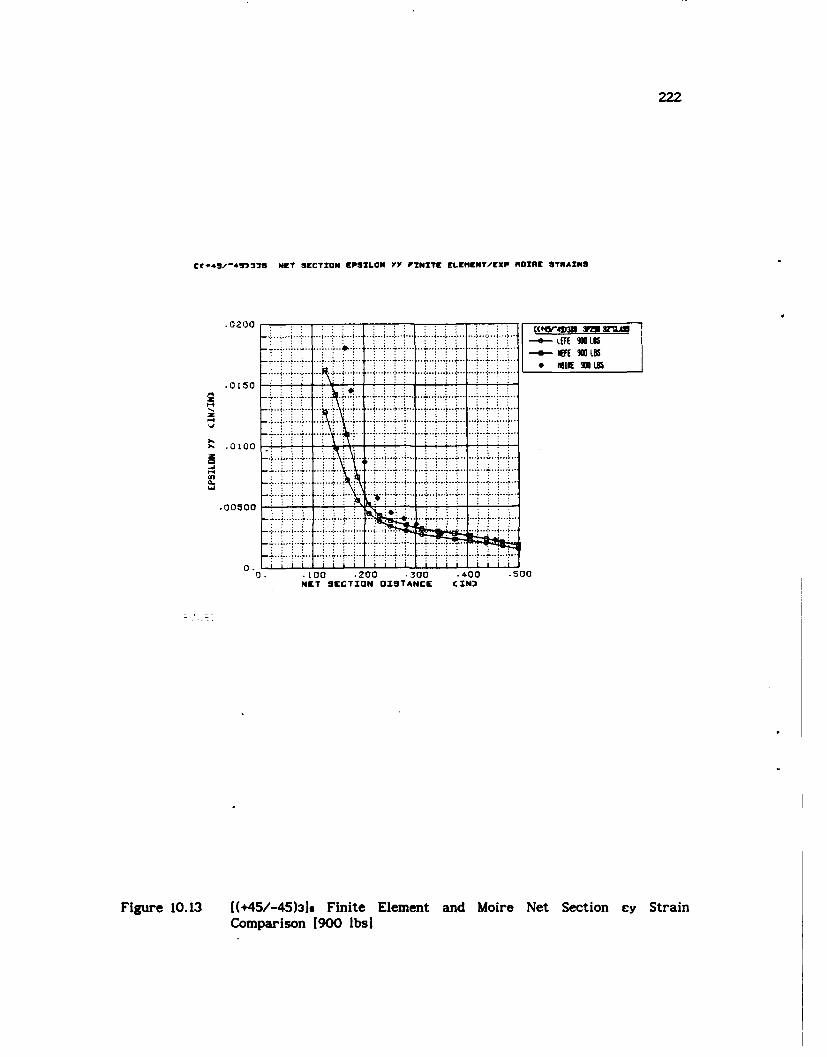
222
CC.49-491338 NET SECTION EPSILON YY PINXTE ELEIIEN7'EXP MOIRE STRAINS
.0200 .
-a EFE 90 LOS
* 0150. . . . . . .
-4
~.0100
.. ...... . * . .. . . .
.00500 ___
--4......... ....
0.
.......
0. .100 .200 -300 .400 .500MET SECTION DISTANCE C IN'.
Figure 10. 13 [(+45/-45)3]s Finite Element and Moire Net Section cy StrainComparison (900 ibsI
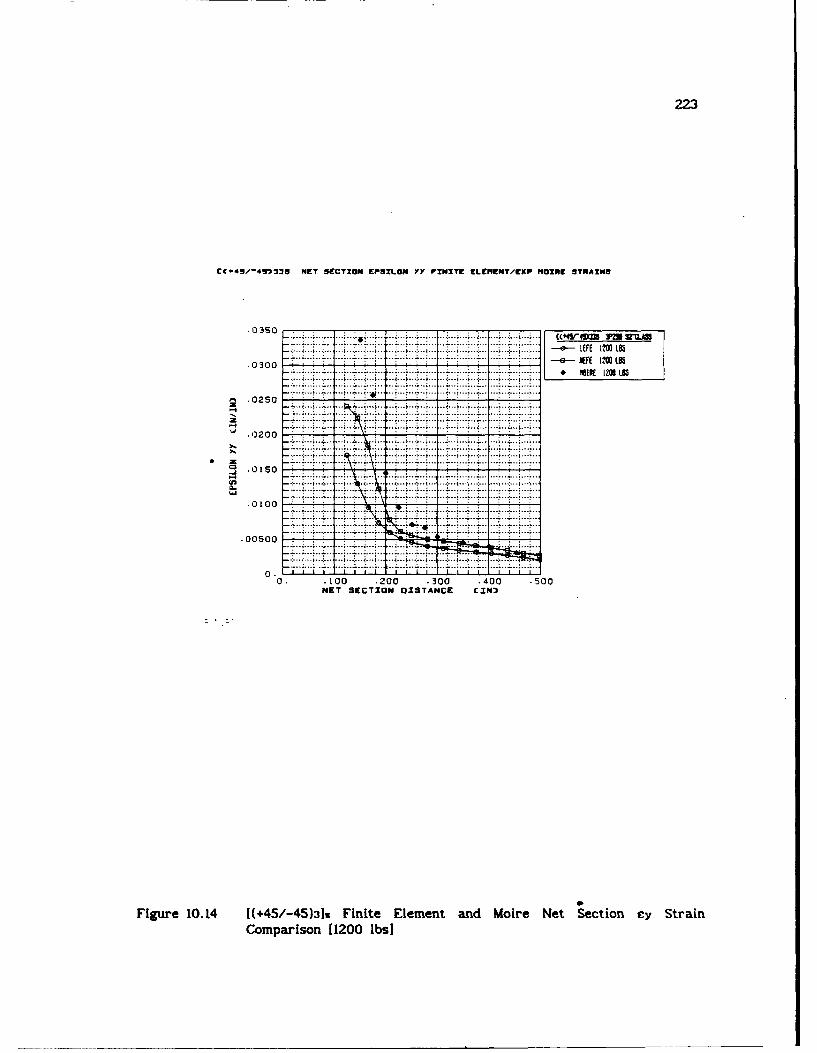
223
~C-945'f)29 NET SECTION EPSILON Yy FINITE ELCPIENT/EXP MOIRE STRAINS
.0250 4
.0300 ..... ........ a WE 10LO
.00500 ..
.~. .. .00 .20..00 .400 .. 00NET... IETO ..... E XN
Figure 10l14 ((45-51 Fint Elmn.n or e eto ySri.o...iso 1200... .Ibs...I ....
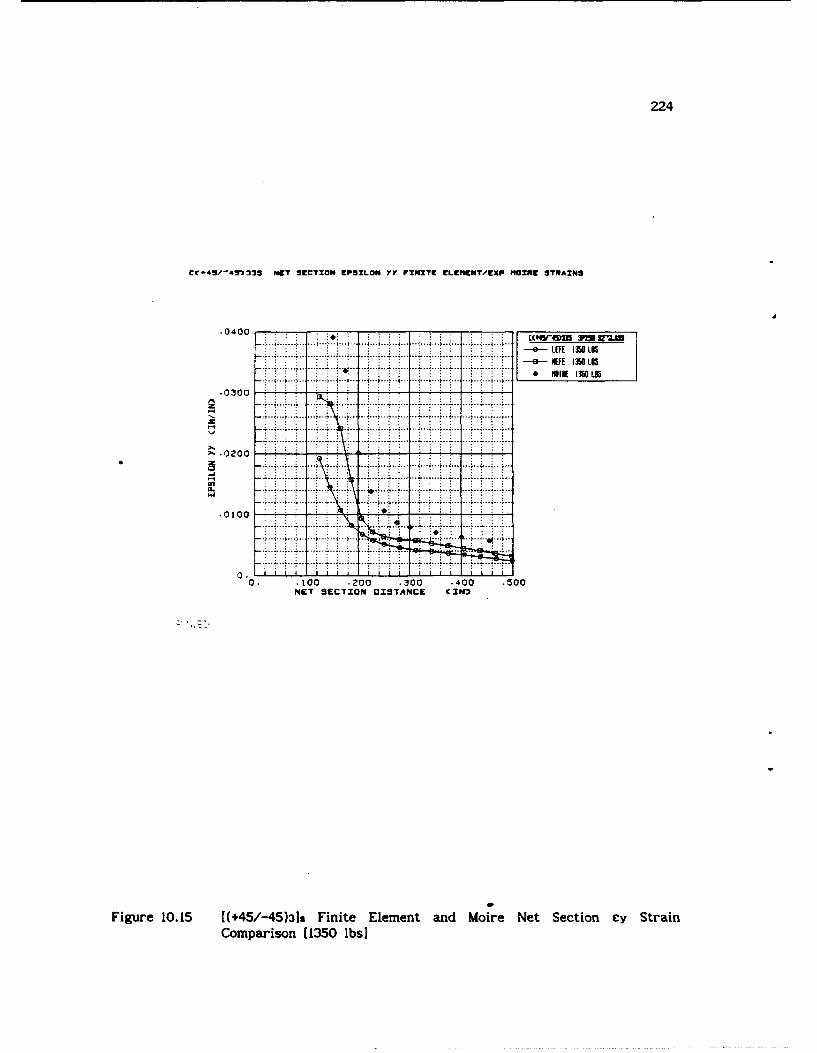
224
*C49/-45923 MET SETION EPSILON 77 FINITE CLfI1EN?/EXP MaINE STRAIN9
.0400
-LEFE 1350LB
* -e-- FE 1350LOS
.0300
'.0200
... ... .. . ... ...
-0100 ...
0. 100 .200 .300 .400 .500NET SECTION DISTANCE CZN13
Figure 10. 15 ((+45/-45)31s Finite Element and Moire Net Section Cy StrainComparison [1350 ibs]
225
CHAPTER 11. QUALITATIVE MATERIAL DAMAGE INVESTIGATION
Comparisons of sectional strains obtained from finite element
approximations and those from the experimental moire results indicated
possible material failure occurring within the net and bearing sections of
the [(+45/-45)3]s laminate and in the locus of maximum shear stress within the
[(0/90)3,0]9 laminate respectively. A qualitative investigation of this
observation was undertaken in the hope of providing insight. Use of the
translucent nature of the SP250 S-2 fiber / resin system, liquid penetrant and
a backlighting experimental arrangement were employed to provide a qualitative
planer view of progressive coupon damage for each laminate type.
11.1 EXPERIMENTAL DAMAGE DETECTION TECHNIQUE
The experimental arrangement shown in Figure 11.1 was used in the
qualitative damage detection study. A doubly simple supported pin arrangement
of span length equivalent to that used in both the Moire and finite element
analysis was used. The fixture was placed into a 20,000 lbs INSTRON
mechanical testing machine with one mechanical wedge grip grabbing the top
part of the fixture and the other grabbing the coupon itself. A NIKON 35 mm
SLR camera with motor drive film advancing unit and 80-120 mm VIVITAR zoom
lens was positioned to image the front surface of the pin-loaded portion of
the coupon. A thick, black cardboard mask was placed around the coupon to
eliminate stray light from overexposing the photographs. A quartz-iodine high
intensity lamp was placed behind the coupon at such a distance to provide
uniform front surface coupon illumination. KODAK Tri-X Panchromatic black and
white film was used as a recording medium.
226
11.2 TEST PROCEDURES
A series of trial exposures were made to determine what shutter speed
and appropriate f stop camera settings would yield optimum photographic
results. After subsequent development and printing of all trial exposures,
the camera settings were determined.
For both laminate arrangements, the coupon was placed within the
experimental arrangement of figure 11.1. The coupons were subjected to 300
lbs loading increments to 900 lbs, 100 lbs loading increments to 1200 lbs, and
50 lbs loading increments till failure. In between each load increment, the
coupon was removed from the experimental arrangement and submersed in
MAGNAFLUX type SKL-HF liquid penetrant for approximately twenty minutes. The
coupon was then wiped of front and rear surface excess penetrant with
MAGNAFLUX type SKL-NF/ZC-7B cleaner and placed back into the experimental
arrangement for photographing at the predetermined camera settings. Care was
taken for proper specimen fixture alignment during its reinstallation. Both
specimens were loaded until significant load riduction was observed upon
reloading Cie failure).
11.3 sTR m
Figures 11.2 - 11.9 represent the experimental results for the
[(0/90)3,0]s coupon while Figures 11.10 - 11.15 represent those of the
[(+45/-45)3]s coupon.
A vertical crack was seen in the right side of the [(0/90)3,0]s
coupon at the locus of maximum shear strain at the 1000 lb load level. This
crack grew in a vertical fashion with increased load level until the 1300 lb
load level where several smaller vertical cracks were observed on the left
side of the coupon in the vicinity of the locus of maximum shear strain. The
existence of transverse cracks were seen in this location at the 1350 lb load
level. With increased loading, both vertical and transverse cracks enlarged
while the formation of transverse cracks were observed around the pin. Ply
delamination or three dimensional "brooming" of the material was observed on
the left coupon side near the initial site of transverse crack formation at
227
the 1400 lb load level. This delamination area grew until failure at just
over 1600 lb load level where massive ply delamination occurred above the pin.
The [(+45/-45)31$ coupon exhibited cracks along the -45°fiber
direction in the net section at the 1000 lb load level. These cracks
continued to grow in length and number at the net section with increasing load
level. Cracks along the +45Sfiber direction were initiated in the net section
at the 1250 lb load level. The 1300 lb load load level saw the initiation of
+450and -450 cracks to the left and right of the bearing section respectively.
These bearing section cracks grew in length and formed a "cone" like formation
above the pin with increased load level. Ply delamination was observed in
the net and bearing section crack initiation locations at the 1400 lb load
level. Increased loading caused massive ply delamination above the pin.
The vertical cracks in the [(0/90)3,01. laminate suggested an initial
matrix shear failure along the locus of maximum shear strain in the 900ply
layers. The ensuing observation of transverse cracks in the 00layers is
suggestive of a load transfer to and matrix failure of these plies. The
existence of this shear failure mechanism and the lack of inelastic material
behavior in the modeling effort caused experimental / finite element shear
strain discrepancies along the locus of maximum shear strain. Similar
experimental and finite element pin boundary conditions might have allowed a
load level correlation between observable damage and shear strain
discrepancies.
The observation of cracks along the fiber directions within the net
and bearing sections of the [(+45/-45)3]s laminate suggested a matrix / fiber
interface failure. This type of failure manifested itself in a "scissoring"
action of the +45" and -45 ° plies. Discrepancies between net section cy
experimental / finite element strains exhibited a load level correlation with
observable net section damage thus indicating the presence of inelastic
material behavior. This same conclusion might have been drawn for bearing
section Cy strains had similar experimental and finite element pin boundary
conditions prevailed.
Delaminations and resulting coupon failures were no doubt due to the
unrestrained through thickness coupon boundary condition. A true double lap
joint configuration would provide this through thickness restraint thus
producing a delamination suppression mechanism. Since both shearout and net
228
section damage mechanisms were present prior to delamination formation within
the [(0/90)3,0]. and [(+45/-45)31 coupons respectively, delamination
suppression most likely would have resulted In these coupon failure modes.
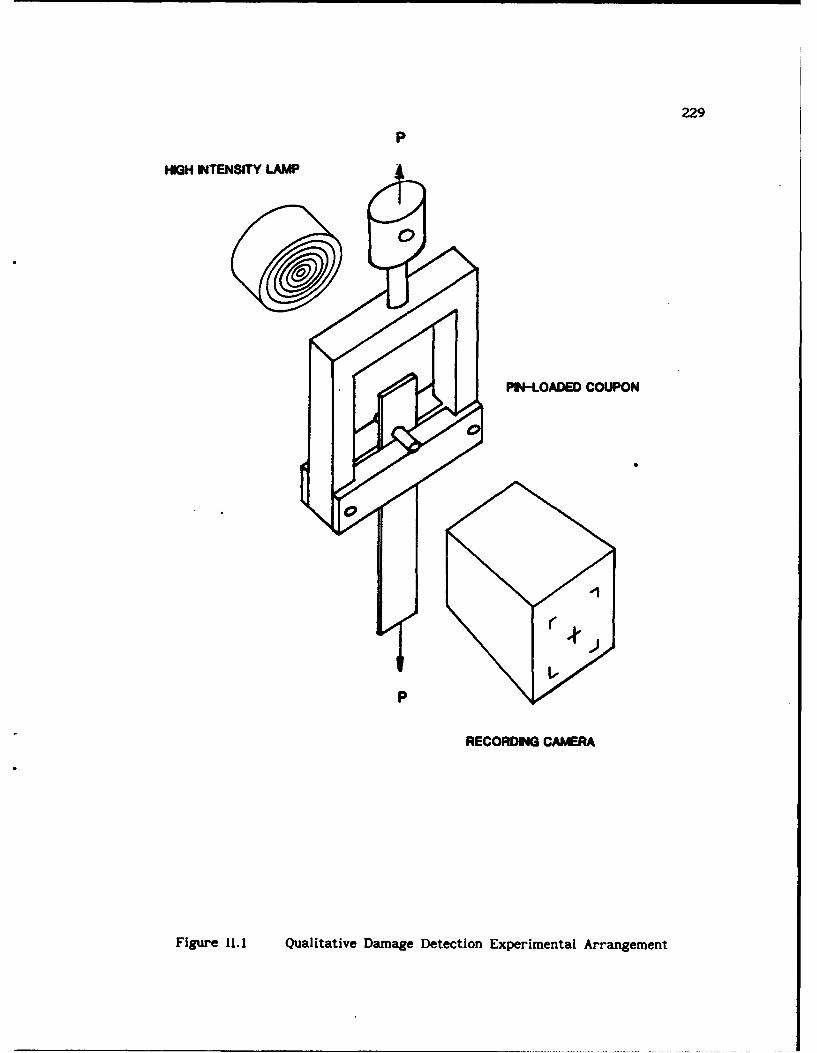
229
P
HIGH INTENSITY LAMP
0
PIN-LOADED COUPON
"PRECORDING CAMERA
Figure 11.1 Qualitative Damage Detection Experimental Arrangement
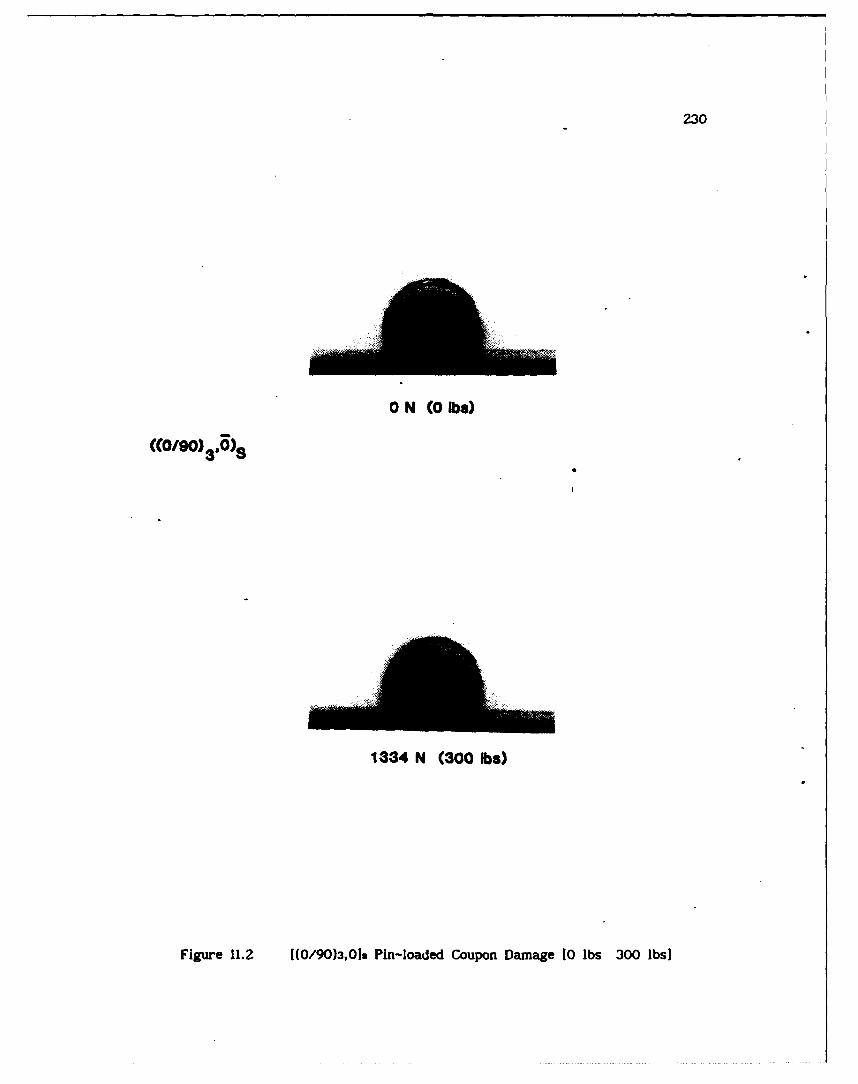
230
0 N (0 lbs)
((o/90)3,0) s
1334 N (300 lbs)
Figure 11.2 [(0/90)3,010 Pin-loaded Coupon Damage [0 lbs 300 Ibs]
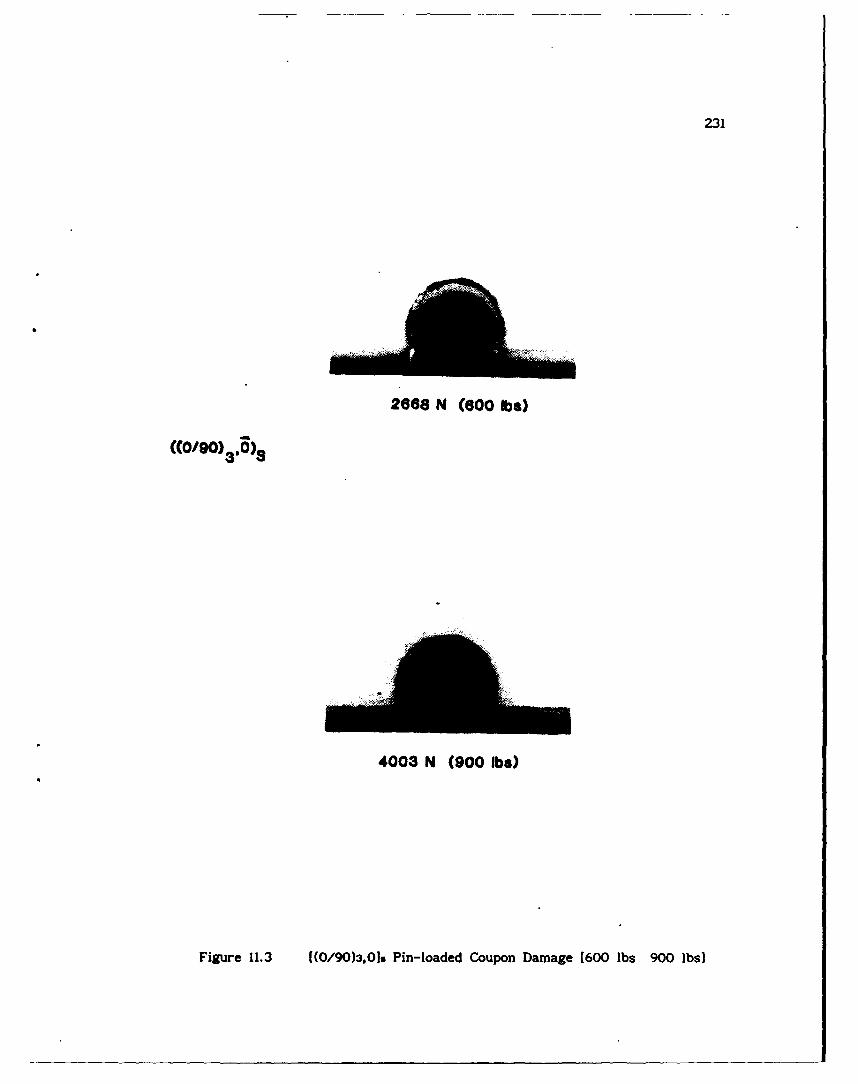
231
2668 N (600 lbs)
((0/90) 360)
4003 N (900 Ibs)
Figure 11.3 1(0/90)3,0]s Pin-loaded Coupon Damage [600 lbs 900 lbs]
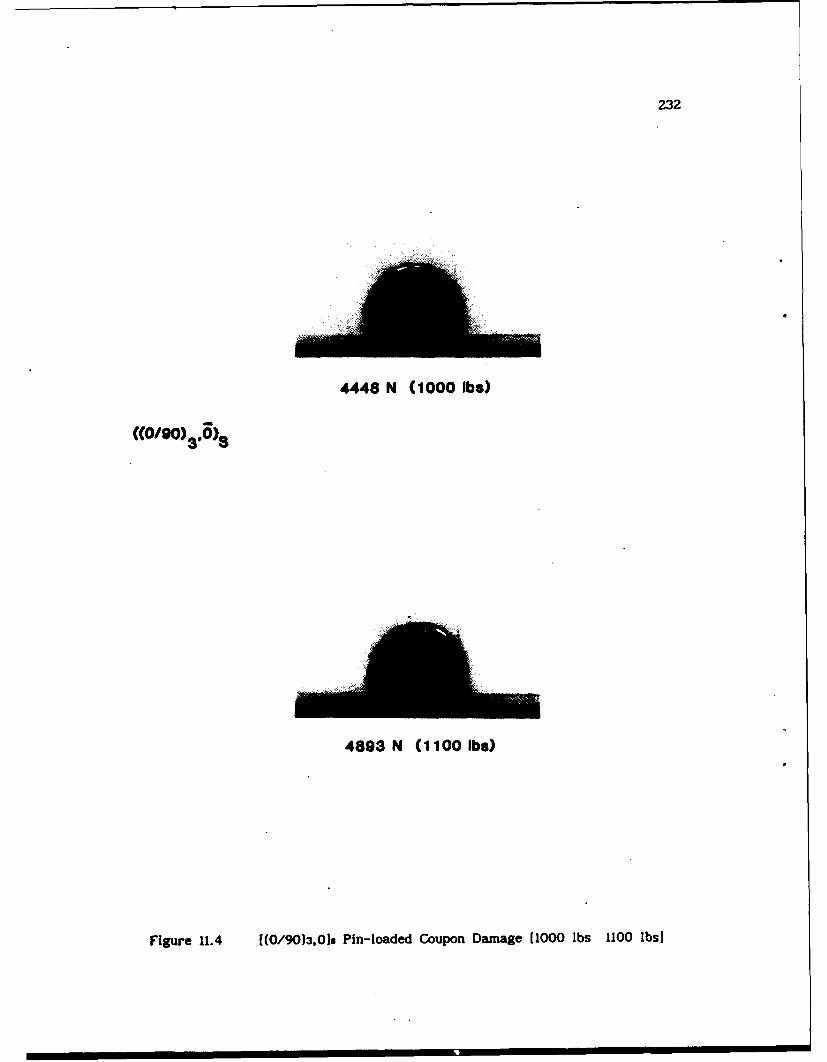
232
4448 N (1000 lb.)
((0/90)30)8s
4893 N (1100 lb.)
Figure 11.4 [(0/90)3,012 Pin-loaded Coupon Damage (1000 lbs 1100 ibsI
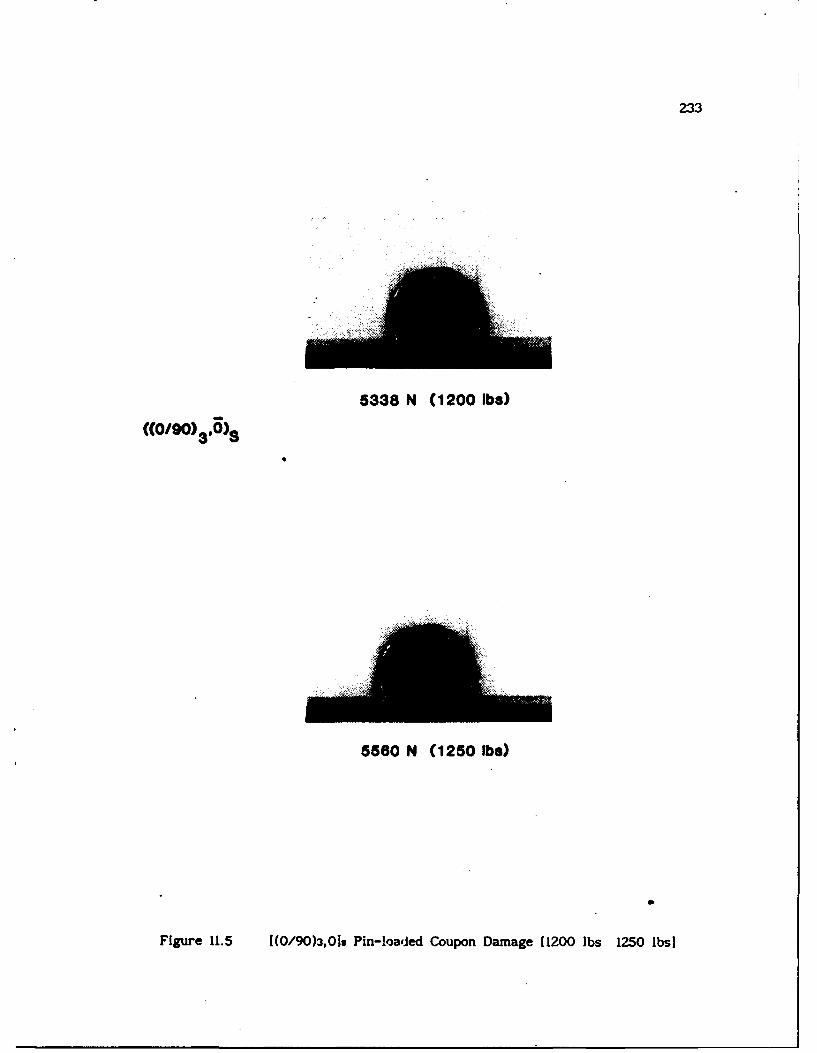
233
5338 N (1200 lb.)
((0/90) 305)
5560 N (1250 lb.)
Figure 11.5 [(0/90)3.0]s Pin-loaded Coupon Damage (1200 lbs 1250 Ibs]
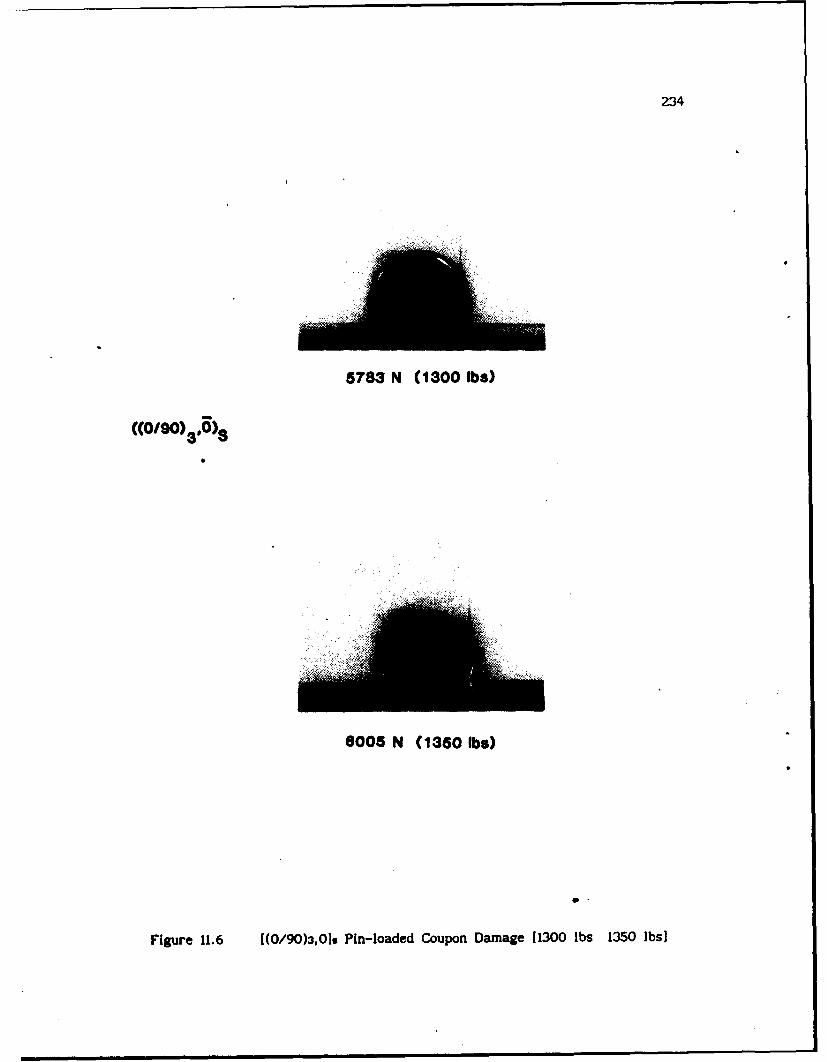
234
5783 N (1300 lb.)
((0/90)3.)
6005 N (1350 lb.)
Figure 11. 6 [(0/90)3,019 Pin-loaded Coupon Damage (1300 lbs 1350 ibs)
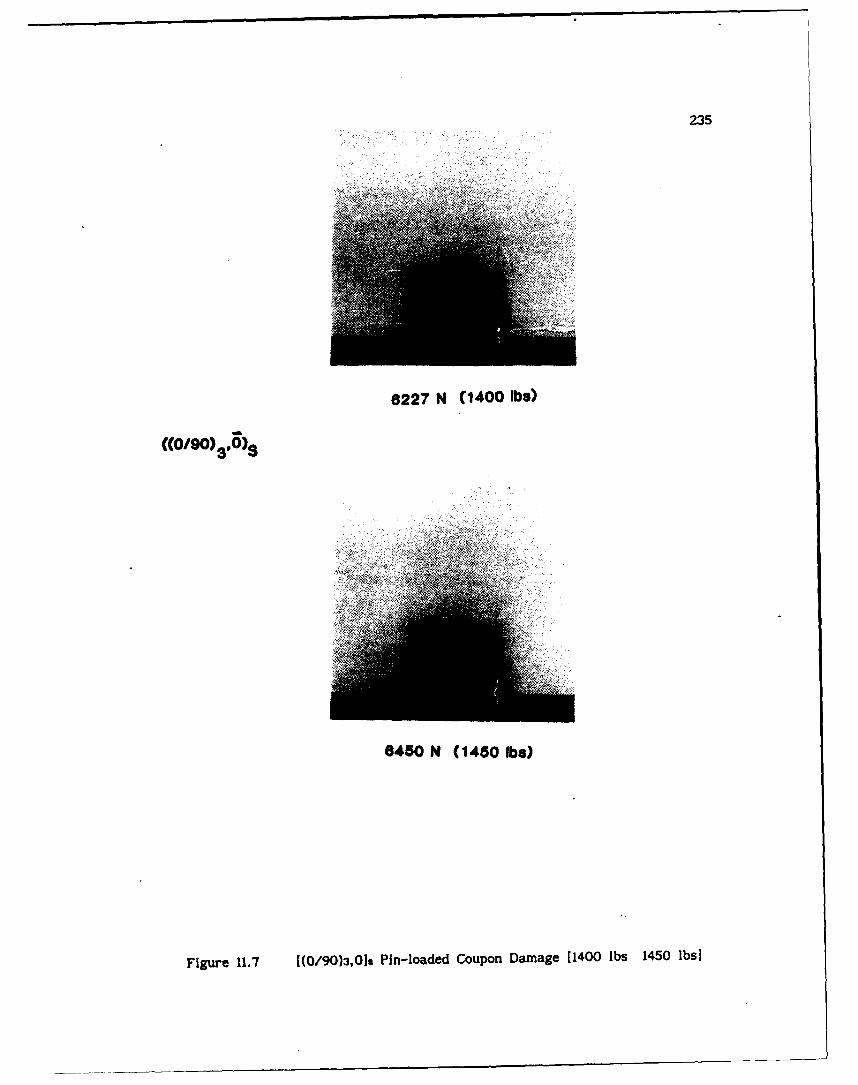
235
6227 N (1400 Ibs)
(0/90) 30 ~
8450 N (1450 lbs)
Figure 11.7 1(0/90)3,013 Pin-loaded Coupon Damage [1400 lbs 1450 ibs)
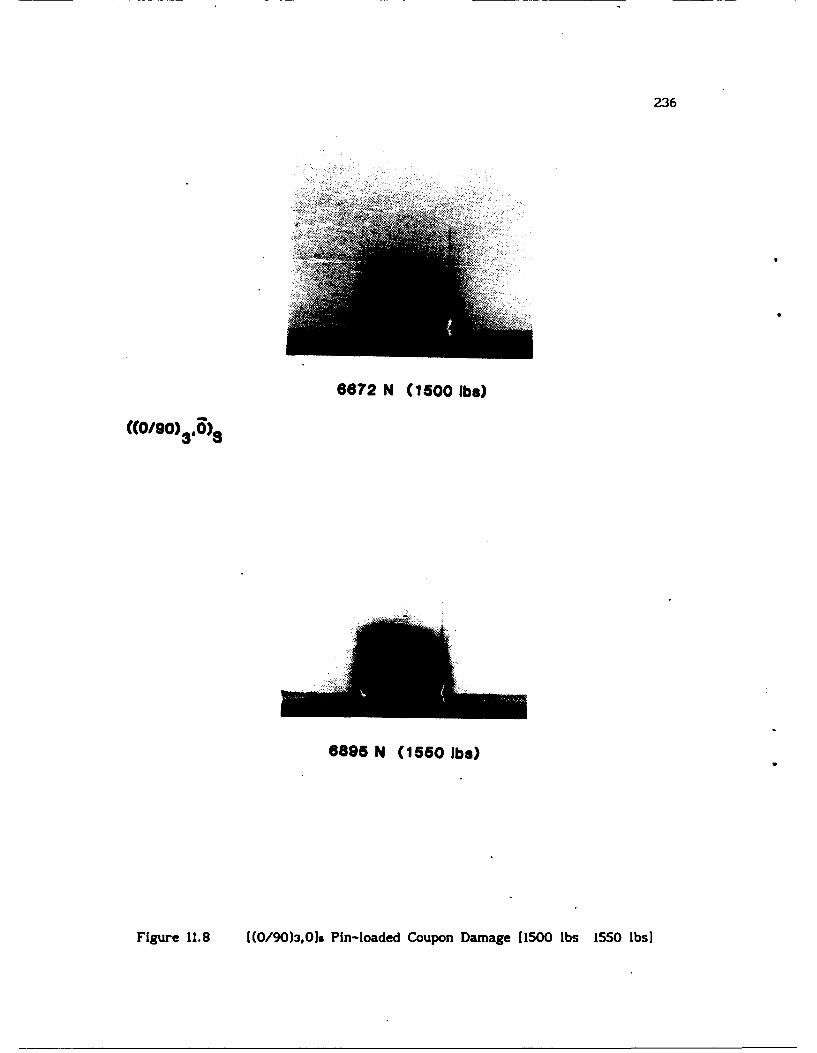
236
6672 N (1500 lb.)
6895 N (1560 lb.)
Figure 11.8 [(0/90)3,019 Pin-loaded Coupon Damage [1500 lbs 1550 Ibs)
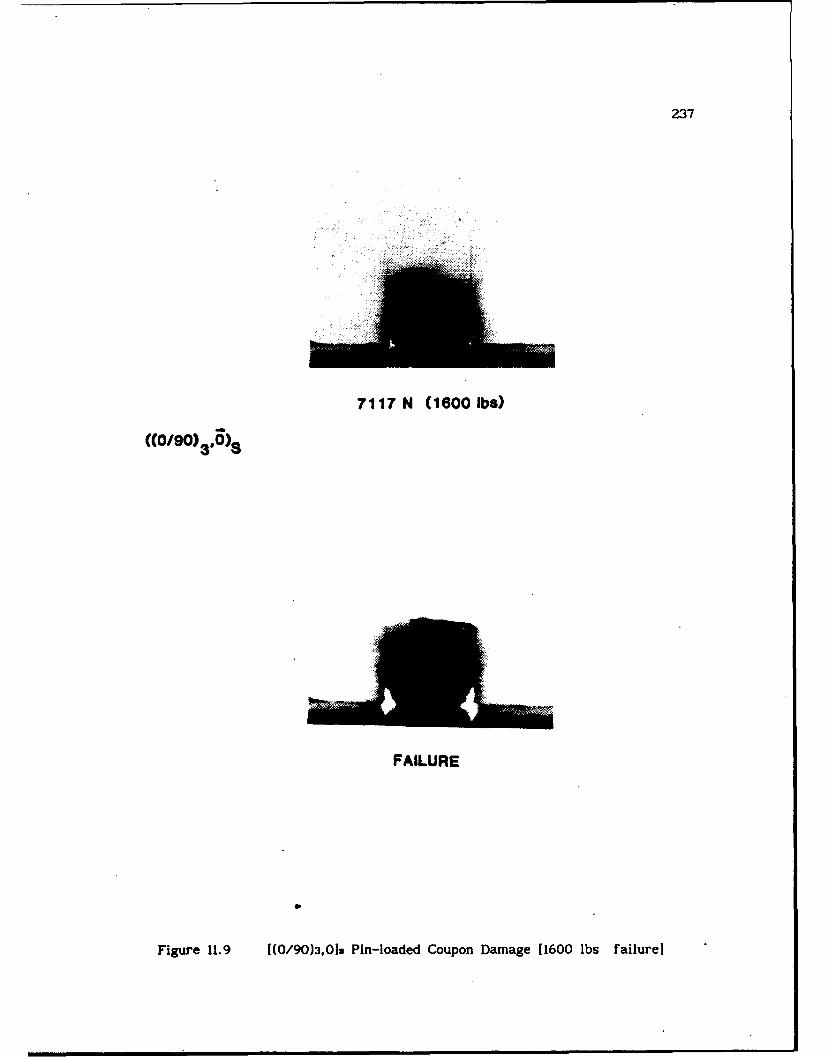
237
7117 N (1l00 ibs)
(0/90) 30 )8
FAILURE
Figure 11. 9 [(0/90)3,018 Pin-loaded Coupon Damage [1600 lbs failure]
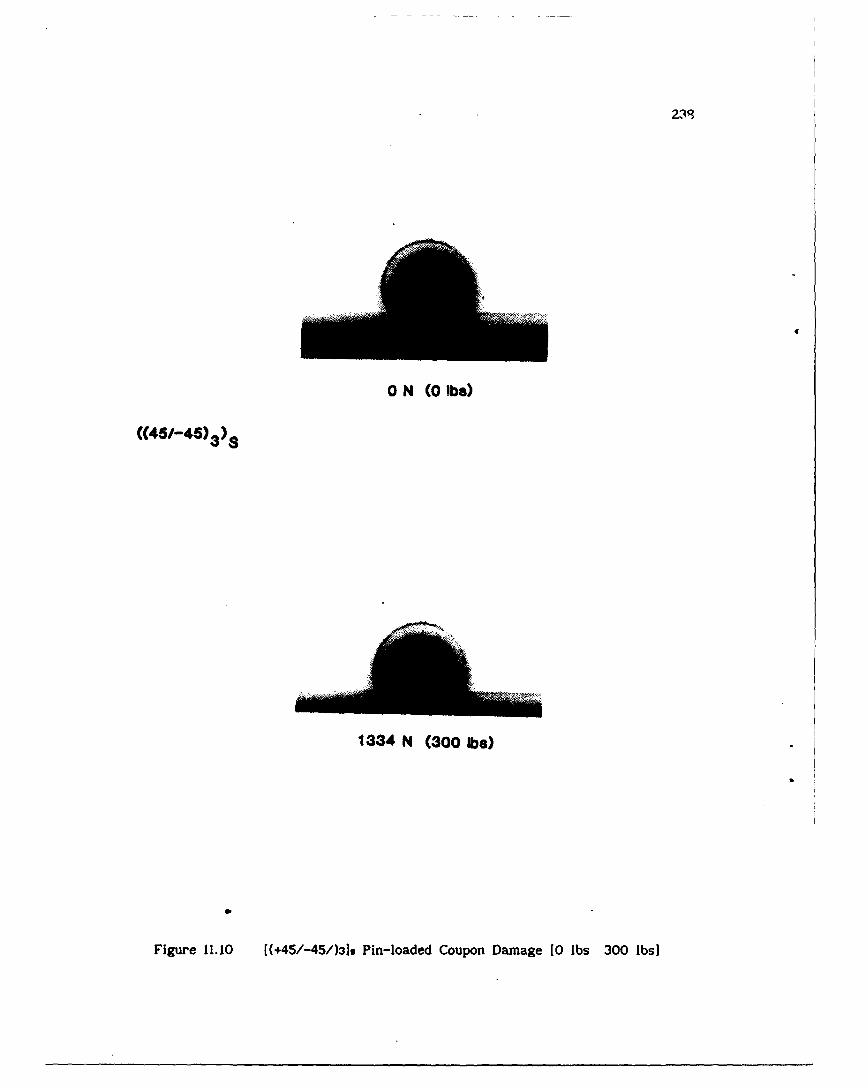
2-19
0 N (0 lb.)
((45/-45)3)3
1334 N (300 Ibs)
Figure 11.10 [(+45/-45/)3]s Pin-loaded Coupon Damage (0 lbs 300 lbsJ

239
21868 N (600 lb.)
((45/-45) 3
4003 N (900 lb.)
Figure 11.11 [(+45/-45/)3]s Pin-loaded Coupon Damage 1600 lbs 900 Ibsj
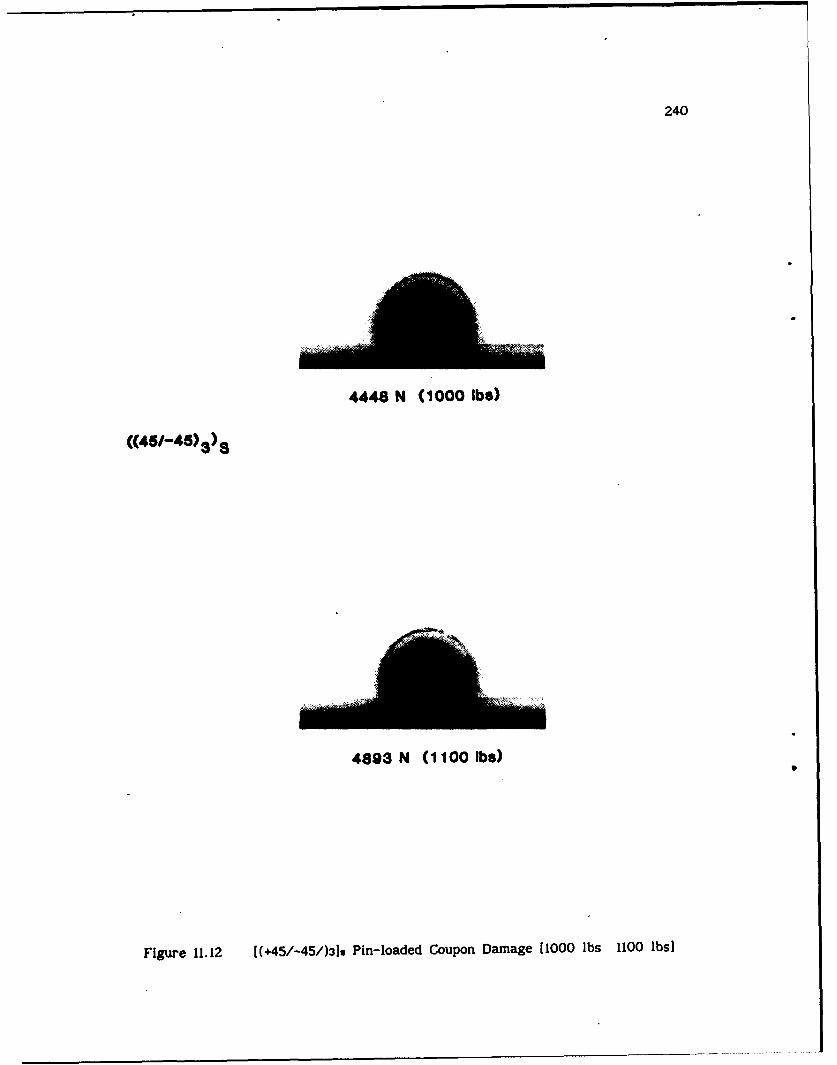
240
4448 N (1000 Wb.)
((45/-45) 3)S
48,93N (I 100lbs)
Figure 11. 12 [(+45/-45/)3]s Pin-loaded Coupon Damage [1000 lbs 1100 ibs]
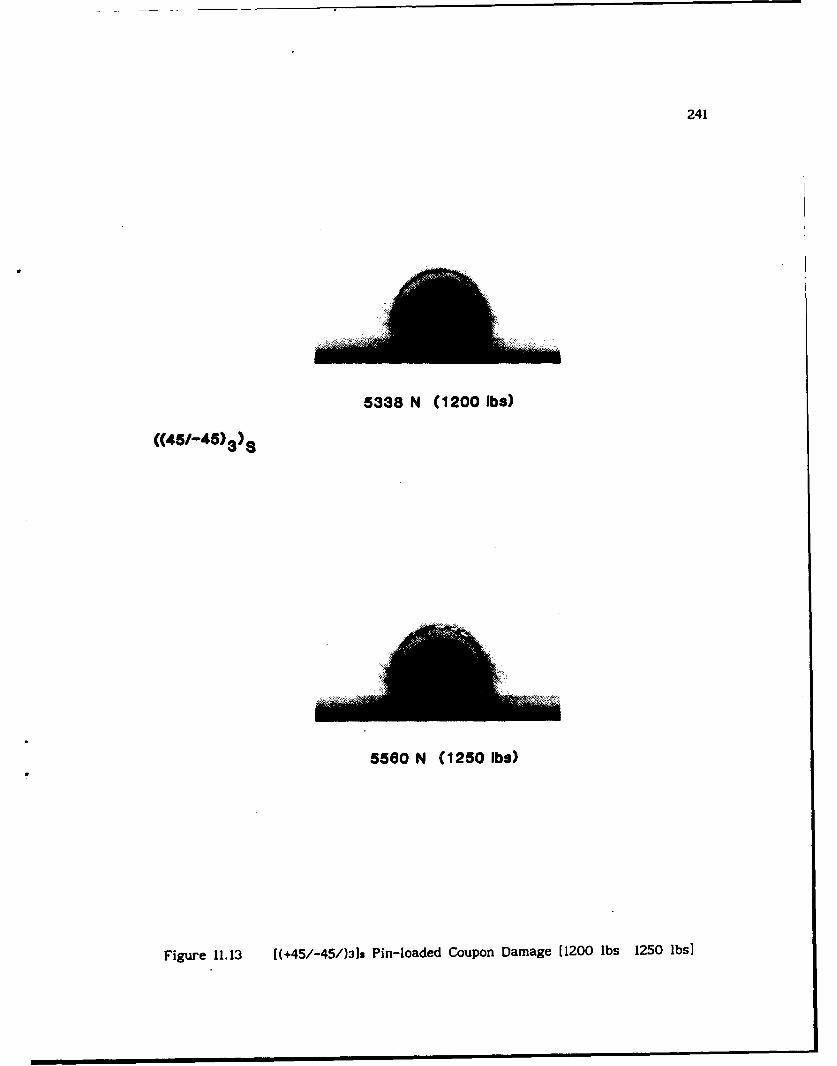
241
5338 N (1200 lb.)
5560 N (1250 lb.)
Figure 11. 13 [(+45/-45/)318 Pin-loaded Coupon Damage [1200 lbs 1250 Ibs]
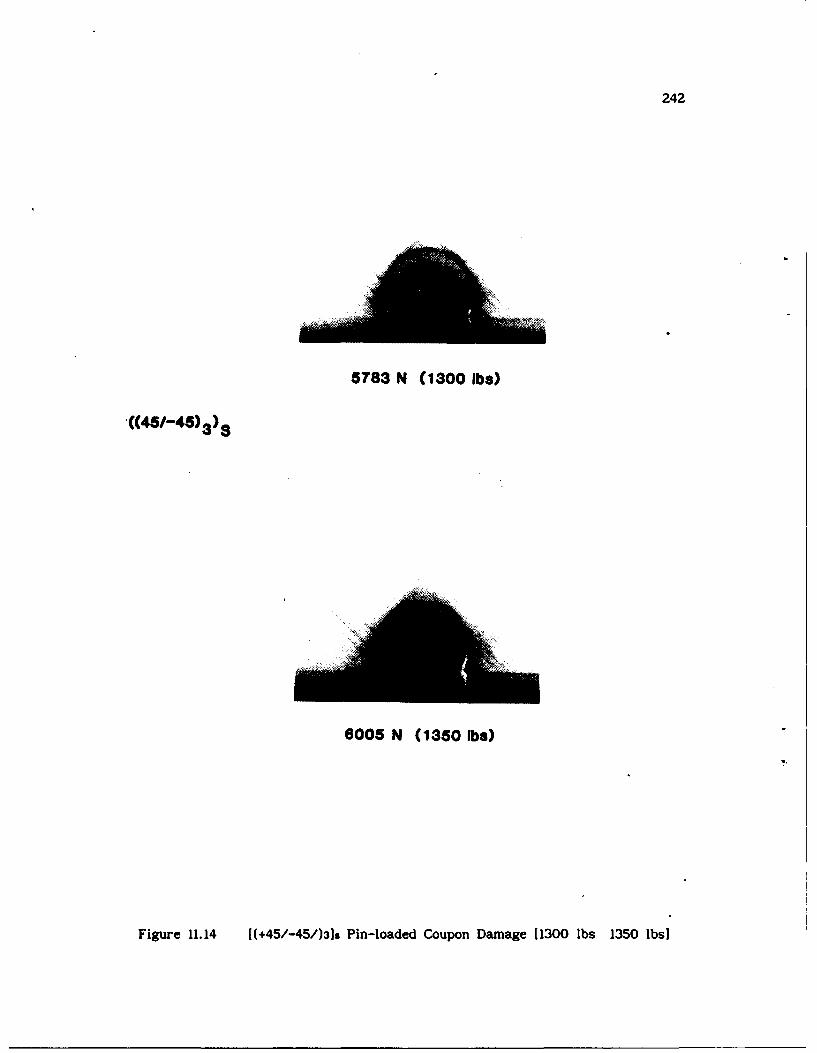
242
5783 N (1300 lb.)
6005 N (1350 lb.)
Figure 11.14 ((+45/-45/)319 Pin-loaded Coupon Damage [1300 lbs 1350 lbsJ
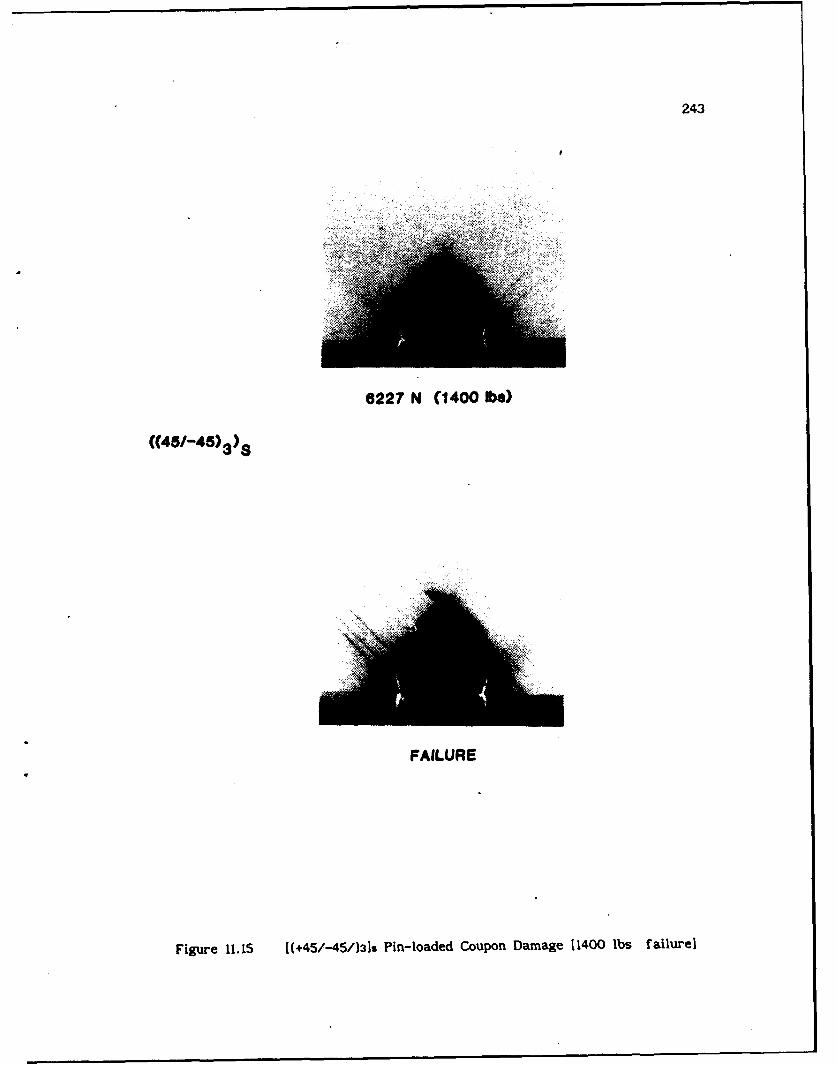
243
6227 N (1400 lb.)
((5/45 3) s
FAILURE
Figure 11.15 [(+45/-451)31s Pin-loaded Coupon Damage 11400 lbs failurel
244
CHAPTER 12. CONCLUSIONS
The combined experimental and analytical nature of this dissertation
has served to answer some crucial questions regarding the mechanical response
and modeling assumptions of [(0/90)nl] and [(+45/-45)nl pin-loaded laminates.
Its interdisciplanary approach allowed for relevant experimental / analytical
comparisons that led to validated conclusions.
Application of projection shadow moire clearly illustrated a
significant through thickness mechanical response of both laminates at load
levels considerably lower than failure. These observations led to a three
dimensional finite element modeling approach.
Through thickness laminate mechanical property determinations
produced fairly accurate estimation of these values for constitutive equation
development. Transverse shear modulus determinations of both laminate
orientations through a conventional three point bend test arrangement yielded
highly inaccurate results. Application of calibrated beam deflection
equations in the small span to depth ratio regime yielded a more accurate
determination of laminate transverse moduli. Use of a displacement clip gage
during laminate tension tests suffered from lack of measurement sensitivity,
yet gave good approximations for laminate through thickness Poisson ratios.
The ((+45/-45)3]9 through thickness Poisson ratio was extremely nonlinear in
nature.
Use of effective in-plane laminate mechanical properties and the
application of three dimensional orthotropic constitutive relations in
conjunction with through thickness laminate mechanical properties provided a
sound constitutive equation approach for laminate stress-strain behavior.
Development of laminate constitutive equations including nonlinear crossply
intralaminar shear behavior was successfully accomplished for both laminate
orientations. The material axes transformation of the [(O/90)n]u constitutive
equations led to compact yet accurate expressions for[(+45/-45)n],
245
constitutive equations. Unlaxial stress predictions for the [(+45/-45)nls
laminate underscored the importance of including crossply based nonlinear
intralaminar shear behavior within the constitutive expressions.
A sensitivity analysis showed that [(0/90)419 uniaxial stress
predictions were insensitive to through thickness [(0/90)419 modulus and
Poisson ratio value variations. However; uniaxial [(+45/-45)4]8 stress
predictions were effected by ((+45/-45)4]s through thickness modulus and
crossply based Poisson ratio value variations. Assuminga through thickness
modulus equal to that of pure resin reduced this sensitivity.
Both single and multi-element verifications of laminate ABAQUS user
material subroutines were successful. The Newton-Raphson nonlinear solution
technique employed by ABAQUS converged well when using the [(0/90)4)s
subroutine. However; the constrained nature of the [(+45/-45)4]s subroutine
required increased cycles for convergence. Effects of convergence tolerance
upon solution accuracy and computation time were investigated proving the
[(+45/-45)41 user subroutine to be computationally inefficient. It is not
apparent if computational efficiency could have been acheived by use of a
Modified Newton-Raphson approach in which global stiffness is not updated.
The linear and nonlinear three dimensional finite element
approximations of [(0/90)3,0] and [(+45/-45)319 pin-loaded laminates
analytically established the effects of nonlinear crossply intralaminar shear
material behavior. Both radial and circumferential pin boundary coupon
stresses were significantly affected by the inclusion of the material
nonlinearity for both laminate orientations. An approximate threefold
reduction of maximum rxy stresses was observed in the shearout section of the
[(0/90)3,01. pin-loaded coupon. A similar reduction occured in the net
section of the [(+45/-45)31 laminate. Nonlinear elastic predictions of
[(0/90)3,0] 7xy values along the coupon locus of maximum shear strain were
observed to gradually increase over linear elastic predictions with increasing
pin-load level. These variations increased closer to the pin. In a similar
fashion, nonlinear elastic predictions of [(+45/-45)3]s cy values in the
coupon net and bearing sections was observed to gradually increase from those
of the linear elastic prediction with increasing pin-load level. These
variations also increased closer to the pin.
Through thickness a-z finite element stresses were negligable in
246
comparison to in-plane laminate stresses. Larger values were observed closer
to the midplane of the laminates than the front surface. The nonlinear
material assumptions increased these rz stresses for both laminate
arrangements.
Variations of nonlinear elastic constitutive equation constants were
observed for both laminate configurations. These variations were seen at the
lowest pin-load level of 300 lbs and became more pronounced at higher pin
loads. A softening of the [(0/90)3,0]8 intralaminar shear modulus was seen
along the locus of maximum shear stress. A similar effect was seen in Cu in
the net and bearing sections of the [(+45/-45)3]s laminate. Corresponding net
and bearing section [(+45/-45)3] C1z values increased.
Application of geometric moire successfully generated in-plane
displacement contours for the [(+45/-45)3]s pin-loaded laminate. Application
of Fourier filtering, mismatch methods, and semi-automated fringe digitization
procedures allowed for accurate strain determinations in both the net and
bearing sections of the coupon. Detailed displacement contouring around the
circumference of the pin in order to observe frictional effects could not be
made due to the lack of experimental displacement contouring sensitivity.
Comparisons of experimental and finite element strains in the
shearout section of the [(0/90)3,01. coupon and in the net and bearing section
of the [(+45/-45)318 coupon validated the importance of including nonlinear
crossply Intralaminar shear material behavior in numerical computations and
highlighted the effects of material damage. Net section ((+45/-45)31 Cy
experimental strains were seen to follow nonlinear elastic finite element
predictions at low pin-load levels. Increasingly higher experimental cy
values were observed with increasing pin-load levels. This departure
increased with closer pin proximity suggesting the presence of a net section
tensile damage mechanism. Similar trends in [(+45/-45)3]s bearing section cy
and in [(0/90)3,0] shear out section Txy were observed, but were altered
somewhat by unsymmetric experimental pin boundary conditions.
The qualitative material damage investigation effectively illustrated
the role material damage plays in pin-loaded composite connectors. Load level
comparisons with both linear and nonlinear finite element and experimental
sectional strain values indicated the presence of tensile and shear damage
mechanisms for the [(+45/-45)31 and ((0/90)3,019 laminate respectively. The
247
progressive nature of the damage was observed in both laminates at pin-load
levels well under failure.
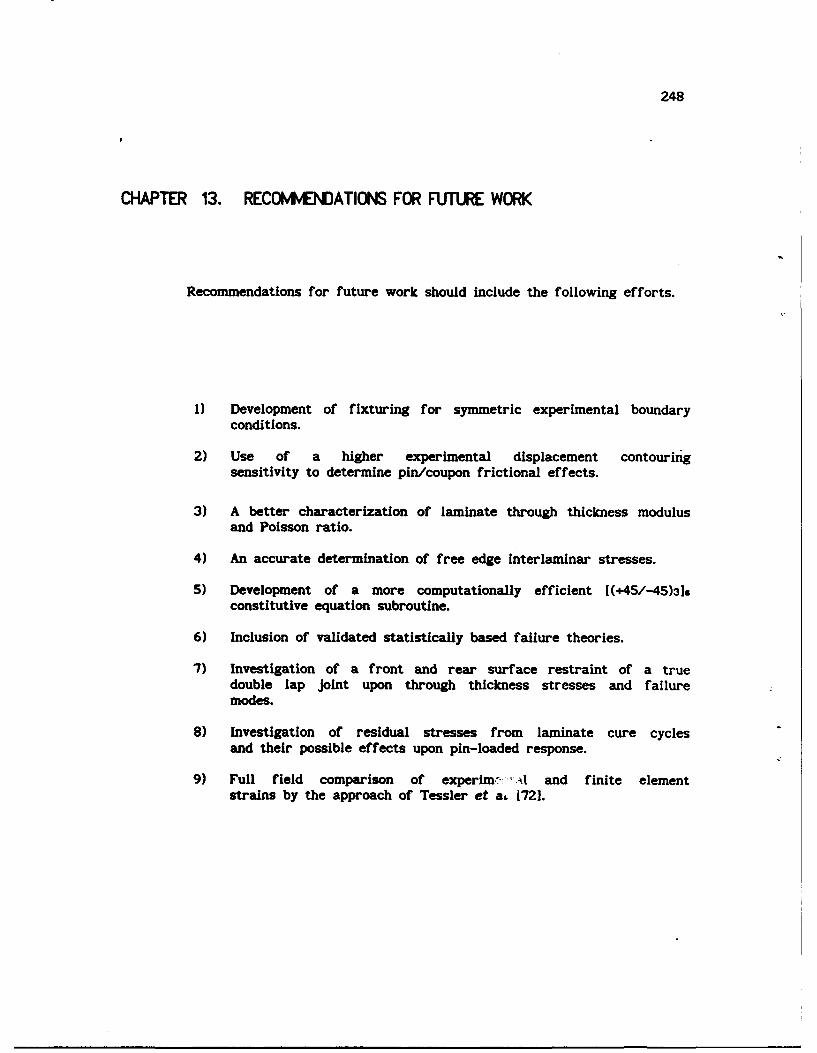
248
CHAPTER 13. RECO M ATIONS FOR FUTURE WORK
Recommendations for future work should include the following efforts.
1) Development of fixturing for symmetric experimental boundaryconditions.
2) Use of a higher experimental displacement contouringsensitivity to determine pin/coupon frictional effects.
3) A better characterization of laminate through thickness modulus
and Poisson ratio.
4) An accurate determination of free edge interlaminar stresses.
5) Development of a more computationally efficient [(+45/-45)3],constitutive equation subroutine.
6) Inclusion of validated statistically based failure theories.
7) Investigation of a front and rear surface restraint of a truedouble lap joint upon through thickness stresses and failuremodes.
8) Investigation of residual stresses from laminate cure cyclesand their possible effects upon pin-loaded response.
9) Full field comparison of experimn. .*x and finite elementstrains by the approach of Tessler et && 1721.
249
14. BIOGRAPHICAL SKETCH OF AUTHOR
The author was born in Schenectady, New York on February 18,1958. He
attended Chelmsford High School in Chelmsford, Massachusetts until graduation
in 1976. He entered the University of Lowell in the Fall of the same year and
received his Bachelors in Mechanical Engineering in 1980.
In 1981 he joined the Mechanics of Advanced Structures and Materials
Branch of the Mechanics and Structural Integrity Laboratory at the Army
Materials Technology Laboratory (formerly AMMRC). The author became involved
with structural testing, finite element modeling, and experimental stress
techniques in support of departmental composite materials research efforts.
In the Fall of 1982, the author enrolled in the Mechanical
Engineering Department of the University of Lowell while maintaining his
position at the Army Materials Technology Center. His research work in bolted
composite joints under the late Professor John- McElman led to a Masters of
Science Degree in the Fall of 1985.

250
15. APPENDIX
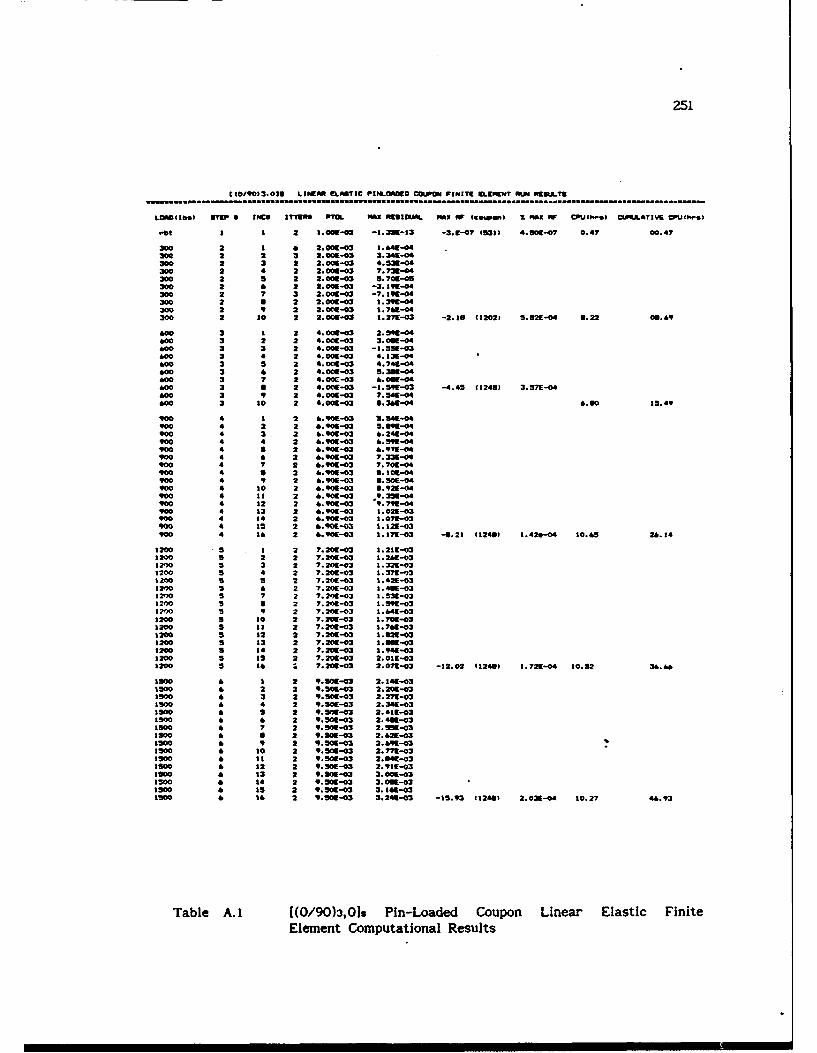
251
C 0/90)3.016 LINMA ELASTIC PtN.LOAOD COUPON FINITE ELEMENT RU R6IUUTS
LOAD(ilb) §TW I N IC* 1TTE 77 MAX. AnEUfL MAN wH tCmw) % MX OF CPUth..) C19ATIvE CoU(hre)
r4t I 1 2 1.00.-S -1.=9E-13 -3.1-07 (531) 4.50=-07 0.47 00.47
300 2 1 * 2.00E-03 1. 69-04300 2 2 3 2.006-03 3.349-04300 2 3 2 2.005-03 4. 531-04300 2 4 2 2.006-03 7. 73-04300 2 S 2 2.005-03 5. 705-05300 2 & 2 2.005-03 -2.195-04300 2 7 3 2.OO -03 -7.191-04300 2 U 2 2.009-03 I.39E-04300 2 9 2 2.001-03 1.7*E-04300 2 10 2 2.005-03 1.272-03 -2.11 (1202) 5.2E-04 6.22 02.69
600 2 I 2 4.00-03 2. 56-04600 3 2 2 4.006-03 3.06-04600 3 3 2 4.O0E-03 -1.55E-03600 3 4 2 4.009-03 4.139-04400 3 5 2 4.0M-03 4.74-04600 3 6 2 4.005-03 5.30E-04600 3 7 2 4.00-03 6.066-04600 3 e 2 4.0061-03 -1.595-03 -4.45 (1246) 3.57E-04*00 3 9 2 4.005-03 7.54"-04600 3 1o 2 4.005-03 6. 3&E-04 6.60 15.49
v0 4 1 2 4.906-03 .546.-04900 4 2 2 6.9f-03 5. I5-0490 4 3 2 6.90-03 6.241[-0490 4 4 2 6.906-03 4.596-04900 4 a 2 6. .90-03 4.97g-04900 4 & 2 6. 90E03 7.33E-04900 4 7 2 6. 90-03 7.705-04900 4 0 2 4.901-03 •.106-04900 4 9 2 6.901E-03 •. 50-04900 4 10 2 6. 90E-03 6.9219-04900 4 11 2 &.906-03 *9.35f-0490 4 12 2 .96. -03 9.79E-049o 4 13 2 6.90-03 1.0211-03900 4 14 2 6.905-03 1.07-0390 4 15 2 6.90E-03 1. 12E-03900 4 16 2 6.906-03 1. 17E-03 -6.21 (124•) 1.420-04 10.65 24.14
1200 5 I 2 7.20-03 2.21E-031200 5 2 2 7.209-03 1.2&E-031200 5 3 2 7.206-03 1.321-031200 5 4 2 7.20E-03 1.371-03I'm 5 5 2 7.206-03 1.426-031200 5 & 2 7.206-03 1. -031200 5 7 2 7.206-03 I. 53E-03120 5 6 2 7.20E-03 1.59M-031200 5 9 2 7.206-03 1.64-031200 5 10 2 7.206-03 1.709-033200 5 1I 2 7.2061-03 3.761-031200 5 12 2 7.206-03 1.6 2-031200 5 13 2 7.206-03 1[.M-031200 9 34 2 7.209-0 1.946-021200 3 I5 2 7.205E-03 2-OIE-031200 5 16 2 7.20-03 2.071-03 -12.02 (1241) 1.721-04 10.52 36.44
1300 6 I 2 9.505-03 2. 146-031500 6 2 2 9.506-03 2.20E-031500 & 3 2 9.505-03 2.271E-031500 4 4 2 9.506-03 2.34E-031500 6 9 2 9.505-03 2.419-031500 * 6 2 9.50E-03 2.4t-031500 4 7 2 9.50-03 2. S5-031500 * a 2 9.S0E-03 2.4 &-0315o0 4 O 2 9.506-03 2.4,95-031500 4 t0 2 9.506L-03 2.7711-031500 4 1I 2 9.506-03 2.3 4-031500 4 12 2 9.S06-03 2.911-031500 & 13 2 9.505-03 3.01-031500 4 14 2 9.506-03 3.061-031500 * is 2 9.506-03 3. I6-031500 4 14 2 9.501-03 3.246-03 -15.93 11240) 2.0=-04 10.27 46.93
Table A.I [(0/90)3,01s Pin-Loaded Coupon Linear Elastic FiniteElement Computational Results
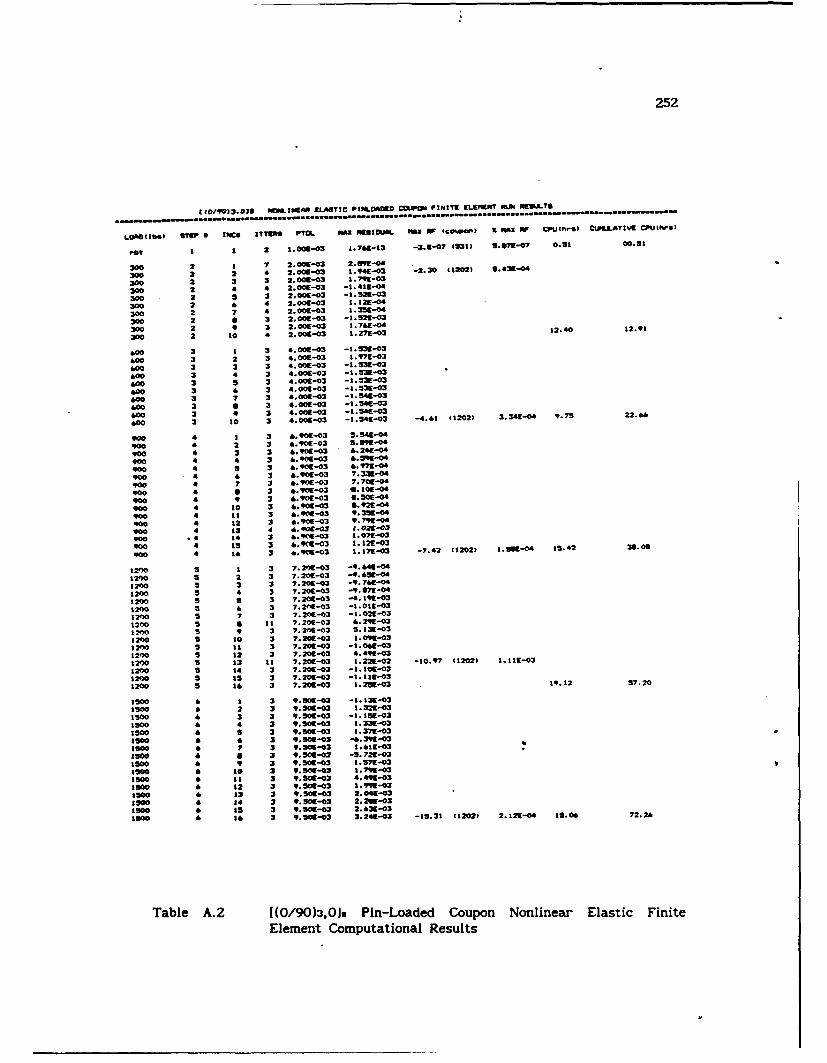
252
C60/90)3,031 NI.IMAMA ELASTIC P364..04,5D CDwi P FINI( "LME6NT UM ACOA.T•
LOAa43b.3 SyE * IM ITTROW PI1 max MUIm.k. max w f0,0wW) Z "I W CPU.hr%) CtJPDAT1VN CPU(hrg)
rt 1 2 1. 00-03 A. 76-13 -3.E-07 (5313 S.•71-07 0.51 00.5
300 2 9 7 2.00E-03 2.691[--04
300 2 2 * 2.001-03 1.941E-03 2.30 (1202) •.43-04
300 2 3 3 2.00-03 .79E-03
300 2 4 4 2.00E-03 -1.416-04
300 2 5 3 2.00*-03 -1.526-03
300 2 4 4 2.00-03 1.12,-04
300 2 7 4 2.00E-03 1.35E-04
300 2 0 3 2.O0-03 -1.52E-03
300 2 9 3 2.001E03 1.7&6-04,
300 2 10 4 2.00E-03 1.27-03 12.40 12.91
600 3 1 3 . 006.E.03 -31.5-03
400 3 2 3 4.OOE-03 1.71-03
600 3 3 3 4.006-03 -1.53E-03
400 3 4 3 4.00E-03 -1.16-03
600 3 5 3 4.00E-03 -I.536-03
400 3 & 3 4.001-03 -I.536-03
600 3 7 3 4.00-03 -1.541
-03
400 3 a 3 4.006[-03 -1.4-03
400 3 9 3 4.00E-03 -. 4-03
400 3 t0 3 4.006-03 -1.54E-03 -4.61 (1202) 3.34E-04 9.75 22.44
900 4 3 3 .9E03 5. 54-04
900 4 2 3 C-906-03 5.89E.-4
900 4 3 3 6.90-03 6.24[-04
90 4 4 3 4.9A-03 6.9M.-04
900 4 5 3 &. 906-03 6. q-"4
900 4 6 3 6.9060
3 7.336-04
900 4 7 3 6. 96-03 7.70E-04
900 4 0 3 4. 906-03 4.106-44
900 4 9 3 .96 -03 6. 50 -04
90 4 10 3 6.906-03 6.92-04
9o 4 11 3 &.9M6-03 9.339-04
q0 4 12 3 6. 91-03 9. 7 -04
900 4 13 4 6. 90c-03 I •021-03
900 4 14 3 6.403 1.07E-03
900 4 15 3 6. 90-03 1. 12E-03
90 4 16 3 &4 9M-03 1.171-03 -7.42 (1202) 1. -04 15.42 36.0
1200 5 3 3 7.20-03 -9. 64-04
1200 5 2 3 7.20E-03 -9. &M-04
1200 5 3 3 7.206-03 -9.746 04
1200 5 4 3 7.206-03 -9. 47f-04
1200 5 5 3 7. 20E-03 -4. 19t-03
1 2r0 5 & 3 7.2AE-03 -1.011-03
132 5 7 3 7.206-03 -1. 02-03
1200 5 It 7.20E-03 4.29E-03
1200 5 9 3 7.2061-03 5.13-03
1200 5 30 3 7.209-03 1.o9-03
1200 5 1 3 7.206-03 -3.04a-03
1200 5 12 3 7.206-03 4.49-03
1200 S 13 11 7.206-03 1.221902 -IO.q7 (1202) 1.11-03
1200 a 14 3 7.206-03 -1.30-03
1200 S 15 3 7.20E-03 -1. 1 IE-03
3200 5 16 3 7.20E-03 1. 2W-03 19.12 57.20
15o0 & 1 3 9. 06-03 -1.139-03
3500 6 2 3 9. S0-03 3.32E-03
1500 4 3 3 9.506-03 -1.139-03
1500 & 4 3 9.S-03 1.336-03
1500 & 5 3 9. 50-03 1.37n-03
1500 & 6 3 9. 50-03 -6.3W6-03
lo0 4 7 3 9.5"-03 1.61.-03
Is" 6 0 3 9.50m-03 -. 72-031500 & 9 3 9.50E-03 9.571-3
1500 4 10 3 9. S0-03 1. 7W-03
Is"0 & 13 3 9.51-03 4.49E-03
Ism0 & 12 3 9.506-03 1. 9W-03
3500 6 13 3 9.506-03 2.046-03
3500 4 14 3 9.506-03 2. 21-03
3900 & Is 3 9. 50-03 2.&6-03
Is0 4 16 3 9. 5=-03 3.24t-03 -15.31 (1202) 2.326L-04 35.04 72.26
Table A.2 [(0/90)3,012 Pin-Loaded Coupon Nonlinear Elastic Finite
Element Computational Results
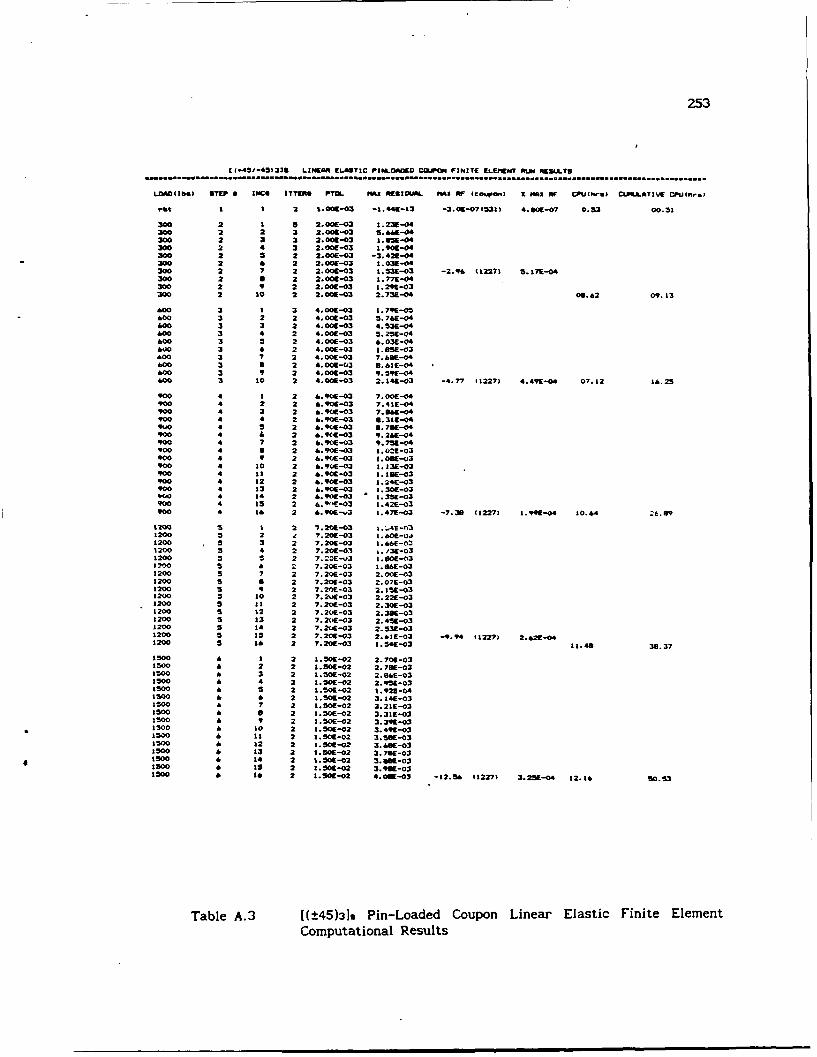
253
((.5--45324 LIN•JAt ELASTIC P3(4.0*04I0 COUPON I|NITI rLEIIENT Aw RULJITSi
LDfD(lIbe) 5TEP INCO TT•N* PT MAX OtESI|UAL. "I N (CD0Ma.) I MAX NF CPU(hrol) CJIUA.ATVIE CPU(hre)
eat 1 I 2 1.09-03 -1.444-13 -3.OE-07(531) 4. @M-07 0.53 00.31
300 2 I 5 2.00-03 1.23E-04300 2 2 3 2. OO-03 5.64-.04300 2 3 3 2.0041-03 1.am-04300 2 4 3 2.001-03 1.90E-04300 2 S 2 2. OOE-03 -3.42E-04300 2 4 2 2.004-03 1.034-04300 2 7 2 2.004-03 t. 53-03 -2.96 U12271 '.17E--04300 2 a 2 2.00E-03 1.77E-04300 2 9 2 2 00E-03 1.294-03300 2 so 2 2. O0-03 2.73E-04 06.42 09.13
400 3 1 3 4.00E-03 1.M-05600 3 2 2 4.004-03 5.7&E-04600 3 3 2 4.004-03 4.53-04600 3 4 2 4.004-03 5.25E-04400 3 3 2 4.00E-03 6.034-04400 3 6 2 4.004-03 .S5-03600 3 7 2 4.004-03 7.43•-04boo 3 a 2 4. 0OE-03 8.61E-04600 3 9 2 4.004-03 9.59-04400 3 10 2 4.Q-03 2.14&-03 -4.77 (1227) 4.49E-04 07.12 16.25
900 4 A 2 4.90E-03 7.004-04900 4 2 2 .904-03 7.41E-04900 4 3 2 4..4-03 7. 86--04900 4 4 2 6. 9a-03 .316-049 w, 4 5 2 4.9.0 -03 '.Y7 4-04900 4 & 2 6. 904[-03 9. 2&E-04900 4 7 2 4. 90E-03 9.75E-04900 4 a 2 6.90E-03 1.024E-03900 4 9 2 6.904-03 I . OE-03900 4 10 2 6.90E-03 I.|34-03900 4 10 2 &.904-03 I. BI-03900 4 12 2 6. 90-03 1.24E-0390D 4 13 2 6. 90M-03 1.30E-03
0 4 *4 2 4.904-03 * 1.3W4-03900 4 15 2 6.91--03 1.42E-03900 4 16 2 •. 9W4--E3 1.47E-03 -7.38 (1227) 1. 99E-04 10.44 .S9
t2o Is 1 2 7.2M4-03 ... 4E-n31200 5 2 J 7.20E-03 1.o04-041200 5 3 2 7.20E-03 I.46"-01200 5 4 2 7.204-03 1.13E-031200 5 ! 2 7.3E-u3 1 .60-03
00 5 4 2 7. 20E:03 1.66E-031200 5 2 7. 20E 03 2.004-031200 5 0 2 7. 20E-03 2.074-031200 5 9 2 7.204-03 2.1i4-031200 5 to 2 7. 20-03 2.22E-031200 5 t1 2 7.204-03 2.30E-031200 5 12 2 7.20E-03 2. 38-031200 5 t3 2 7.2(0-03 2.45 -03*200 5 14 2 7.204E-03 2.53E-031200 5 .5 2 7. 20E-03 2.iE-03 -9.94 11227) 2.42-[041200 5 14 2 7. 20-03 1.544-03 11.48 30.37
*500 4 1 2 1.504-02 2.70E-031500 4 2 2 1.50E-02 2. 76E-031500 & 3 2 1.504-02 2.86E-031500 & 4 2 1.504-02 2.954-031500 4 5 2 1. S0-02 1. 92-04t500 & 2 1.50E-02 3.14E-03$500 4 7 2 1.50E-02 3.21E-031500 0 6 2 1.50E-02 3.31E-031500 4 9 2 1.504-02 3.39 -031500 10 2 1 • 04-02 3.49E-031500 1 11 2 1. S0-02 3.56-021500 12 2 1. 504-02 3 .4&-031500 1 *3 2 1.504-02 3. 78E-031500 4 14 2 1. 504-02 3 .64-0ism0 4 IS 2 1.30E-02 3.964-03500 4 16 2 1.S04-02 4.0w-03 -12.54 (1227) 3.254-04 12.16 50.53
Table A.3 [(±45)318 Pin-Loaded Coupon Linear Elastic Finite ElementComputational Results
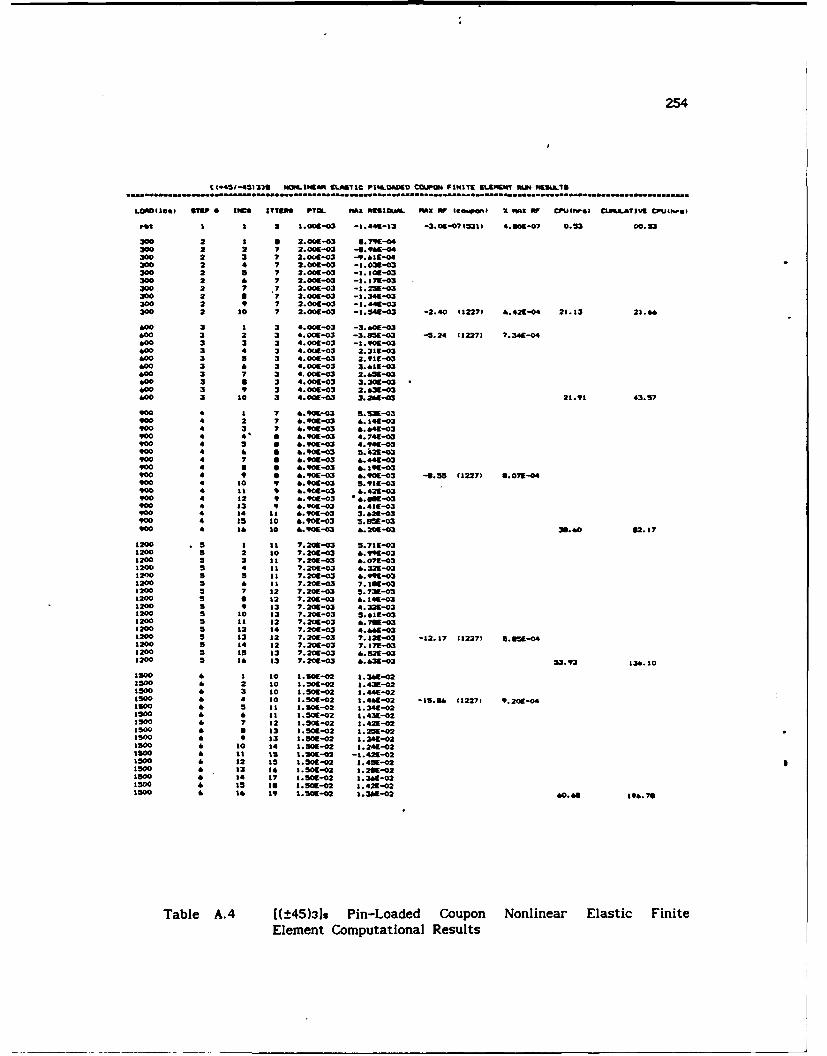
254
C 51-45133 ELAS.191 CL.ITIC PINL.0DED COL.O. FINITE 9141.EN i, R&SUIS
LOAD(Ibs) STEP 6 INC O TI PIO MA9X [ISIUML MA*X WP 4oupon) X 9,*X OF MINU¢-) CIUL*TIV CP3Uh,6
rbt I I 2 1.00--03 -%.4-13 -3.09-07311 4.401-07 0.33 00.53
300 2 1 a 2.009-03 8.79S-04300 2 2 7 2.001-03 -8.941-04300 2 3 7 2.001-03 -9.41[-04300 2 4 7 2.00[-03 -9. 03-03300 2 S 7 2 001-03 -1.01-03300 2 6 7 2.001-03 -1.171-03300 2 7 2.001-03 -1.2M31O300. 2 7 .7 2.OOE-03 1: 2'5E[*03
300 2 a 7 2. OOE-03 -1.341-03300 2 9 7 2.001-03 -1.441E-03300 2 t0 7 2.006-03 -1.5"4-03 -2.40 41227) 6.421-04 21.13 21.66
600 3 1 3 4. O01-03 -3 401-03600 3 2 3 4.001-03 -3.85E-03 -5.24 (1227) 7.34E-04600 3 3 3 4. 001-03 -i.VO-03400 3 4 3 4. 001-03 2.311-03400 3 a 3 4.001-03 2.911-03400 3 & 3 4. O01-03 3.311[-0340 3 7 3 4,OOE-03 2 .43-03600 3 a 3 4.001-03 3.301-03600 3 9 3 4. 00-03 2.63E-03400 3 .0 3 4. 00-03 3.24-03 21.91 43.57
900 4 1 7 4. q-03 %.%W-03900 4 2 7 6.90=-03 6.141-03900 4 3 7 4.901-03 64.41-03900 4 4' U 4.901-03 4.741-03900 4 3 U 4.90E-03 4.941-03q0 4 & I4.-03 5.421E-03900 4 7 6 4.90E-03 6.4411-03900 4 & 6 6.90E03 6.19-03900 4 9 6 4.901-03 6. 901-03 -4.35 (1227) 6. 071-04900 4 10 9 4. 901-03 5.919-0390 4 1 9 6.906-03 6.421-03900 4 12 9 a.901-03 6. GW--03900 4 13 9 4.906-03 6.41E03900 4 4 .1 .901-03 3.21-03900 4 35 30 ,. 90-03 5.3 O-03900 4 16 10 6. 9a-03 6. 20-03 3.60 82.17
1200 3 1 11 7.201-03 5.711-031200 5 2 30 7.20E-03 6.9q[-031200 3 3 a1 7.201-03 4.07-031200 3 4 11 7.201-03 6.321-03120 5 5 1 7.201-03 4.991-031200 46 11 7.20E-03 7161-031200 5 7 12 7.201-03 5.731-031200 a 12 7.201-03 .141-031200 5 9 13 7.201E-03 4.321-031200 5 30 13 7.2o-03 5.411-031200 .11 32 7.209-03 4.71-031200 5 12 14 7.20E-03 4.64-031200 3 13 12 7.201-03 7.121-03 -12.17 11227) S. 1-041200 5 14 12 7.201-03 7.71-031200 5 15 33 7.201-03 4.521-0313200 5 16 13 7. 201-03 6.&3 -03 33.93 136.10
1300 1 3 30 3.3 0-02 1.341-02So30 4 2 3 E0 1-02 1.439-021500 4 3 t0 1.501-02 1.441-021300 6 4 10 1.50-02 .441-02 -15.86 112271 9.20.-041500 4 5 31 .301-02 1. 341-021300 4 6 It 1.301-02 .431-021500 & 7 12 I3.S0-02 1.421-021500 1 6 33 5.01-02 1.25E-021500 4 9 13 1.50E-02 1.34E-021300 6 10 14 .301-02 1.24a-021SOO 4 1 1S 1.301-02 -1421-021300 4 12 33 1.50E-02 1.45E-021500 6 13 14 .501-02 1.201-02Iwo 4 14 17 .50-02 3.341-021500 4 15 18 150-02 1.421[-021500 4 14 19 1. 301-02 1.361-02 60.68 196.76
Table A.4 ((±45)31s Pin-Loaded Coupon Nonlinear Elastic FiniteElement Computational Results
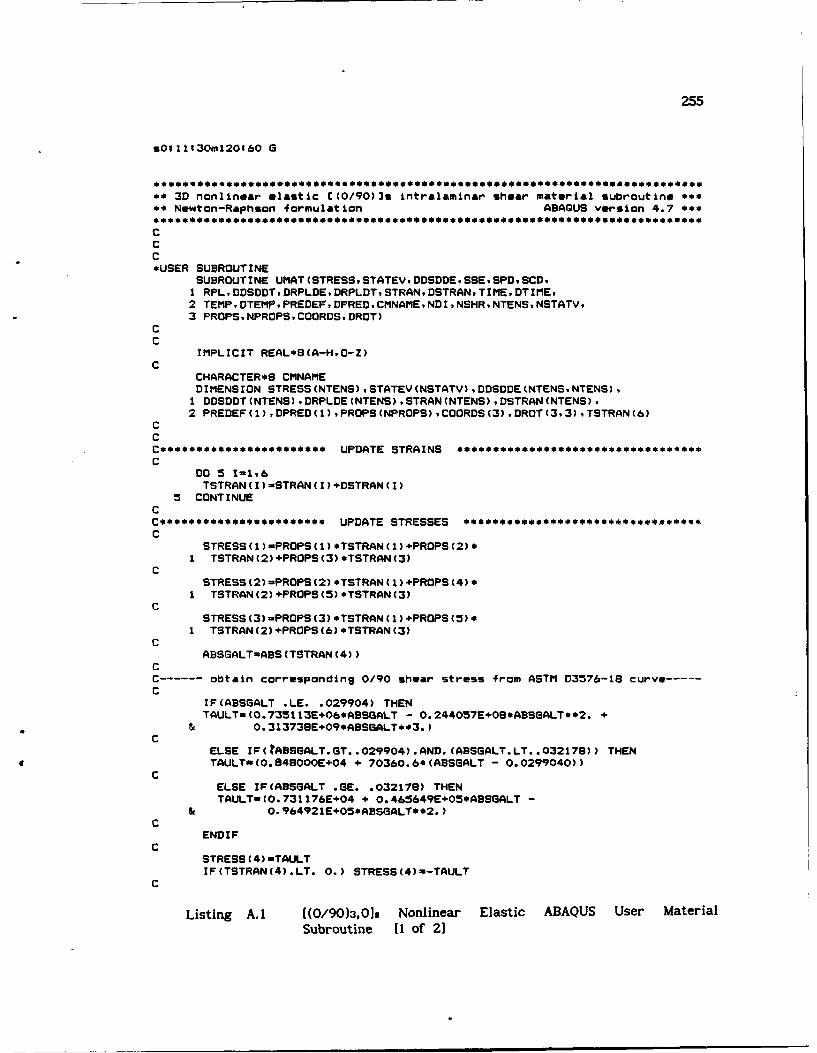
255
sO;l1;30m1201&0 G
s3D nonlinear elastic C(0/90)3s intralaminar shear material subroutine s**Newton-Raphson formulation ABAQUS version 4.7 so*
CCC*USER SUBROUTINE
SUBROUTINE UMAT (STRESS. STATEV. DDSODE. SSE. SPD. SCO.1 RPL. DDSDDT. ORPLOK. ORPLOT. STRAN. OSTRAN. TIME, OTIME,2 TEMP. OTEMP. PREDEF, DPRED. CMNAME. NDI *NSHR. NTENS, NSTATV.3 PROPS. NPROPS. COORDS. DROT)
CC
IMPLICIT REAL*S(A-H.O-Z)C
CHARACTER*8 CMNAMEDIMENSION STRESS (NTENS) *STATEV (NSTATV) * DEDDE (NTENS* NTENS)II DDSDDT CNTENS) *DRPLDE (NTENS) ,STRAN (NTENS) , STRAN (NTENS).2 PREDEF(1),DPRED(1),PROPS(NPROPS) .COORDS(3),DROT(3,3) .TSTRAN(6)
CC
Cs~s****ss**s****** UPDATE STRAINS ****S*********S*S
CDOS11.TSTRAN(I)-STRAN(I)+DSTRAN(I)
5 CONTINUEC
C****S*S***S~**S***UPDATE STRESSES *S**************
CSTRESS(1)-PROPS(1)'eTSTRAN(l).PROPS(2).
I TSTRAN(2) +PROPS (3) sTSTRAN(3)C
STRESS (2) -PROPS (2) sTSTRAN (1) PROPS (4) *1 TSTRAN (2) +PROPS (5) STSTRAN (3)
CSTRESS (3)-PROPS (3) .TSTRAN(1)kPROPS(5)*
1 TSTRAN(2) +PROPS (6) .TSTRAN(3)C
ABSI3ALT-ASS(TSTRAN (4))CC --------obtain corresponding 0/90 shear stress from ASTM D3576-18 curve--C
IF(ABSGALT .LE. .029904) THENTAULT- (0.7351 13E.Q6SASALT - 0. 244057E+08.ABSGALTO*2. +
& 0.31373eE.09.ABSBALT*#3.)C
ELSE IF ( ABSGALT. GT. .029904).*AND. (ADSGALT. LT..*032179)) THEN* TAULTn(0.848000E+04 + 70360.6*(ABSBALT - 0.0299040))
CELSE IF(ABSGALT BEK. .032178) THENTAULT-CO. 731 176E+04 + 0. 465649E+05*ABSGALT-
& O.964921E.OSSABSGALT**2.)C
END IF
STRESS (4) -TAULTIF(TSTRAN(4) .LT. 0.) STRESS(4)--TAULT
C
Listing A.1 [(0/90)3,01s Nonlinear Elastic ABAQUS User MaterialSubroutine 11 of 21
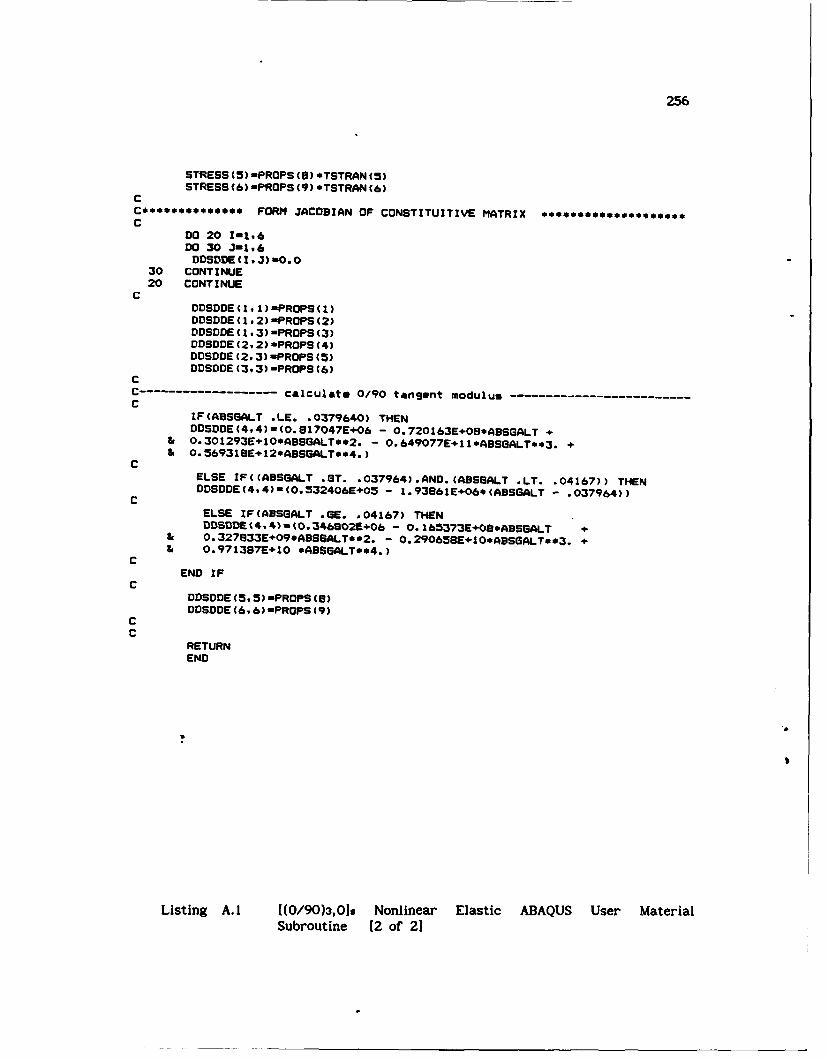
256
STRESS (5)-PROPS(S) *TSTRAN (5)STRESS (8)-PROPS (9) *TSTRAN (6)
CC********e*** FORM JACOBIAN OF CONSTITUITIVE MATRIX * ***..,.~C
DO 20 1-1.6DO 30 Jin1.&DOSODE (I, 3) -0 *
30 CONTINUE20 CONTINUE
CDOSDDE (1 1) -PROPS (UODSDDE (1 *2)-PROPS (2)DDSDOE(1.3)-PROPS(3)DDSDDE (2,2) -PROPS (4)DSDE (2.3)-PROPS(5)DOSDDE (3,3)-PROPS (6)
CC--------------------- calculate 0/90 tangent modulus-------------C
IF(ABSSALT .LE. .0379640) THENDDSDDE (4,4)-Co.817047E+06 - .720163E+08*ASSGALT +
& 0. 301293E.10*ABSGALT**2. -0. 649077E+1 1.ABSGALT.*3.+& 0.569318E+12*ABSBALT..4.)
CELSE IFC(ADSGALT .ST. .037964).AND.(ABSOALT .LT. .04167)) THENDOSDDE (4.4)-CO. 532406E+05 - I. 93861E.06. (ABSGALT - .037964))
CELSE IF(ABSGALT GIE. .04167) THENDDSDDE (4.4) (0. 3465025.06 - 0. 165373E+08*ABSBALT +
& 0. 327833E.09.ABSGALT*02. - 0. 290658E+10*ABSGALr..3.+& 0.971387E+10 *ADSGALT**4.)
CEND IF
CDDSDDE (5.5) -PROPS (8)DDSDOE (6,6)-PROPS (9)
CC
RETURNEND
Listing A.l I ((0/90)3,01s Nonlinear Elastic ABAQUS User MaterialSubroutine (2 of 21
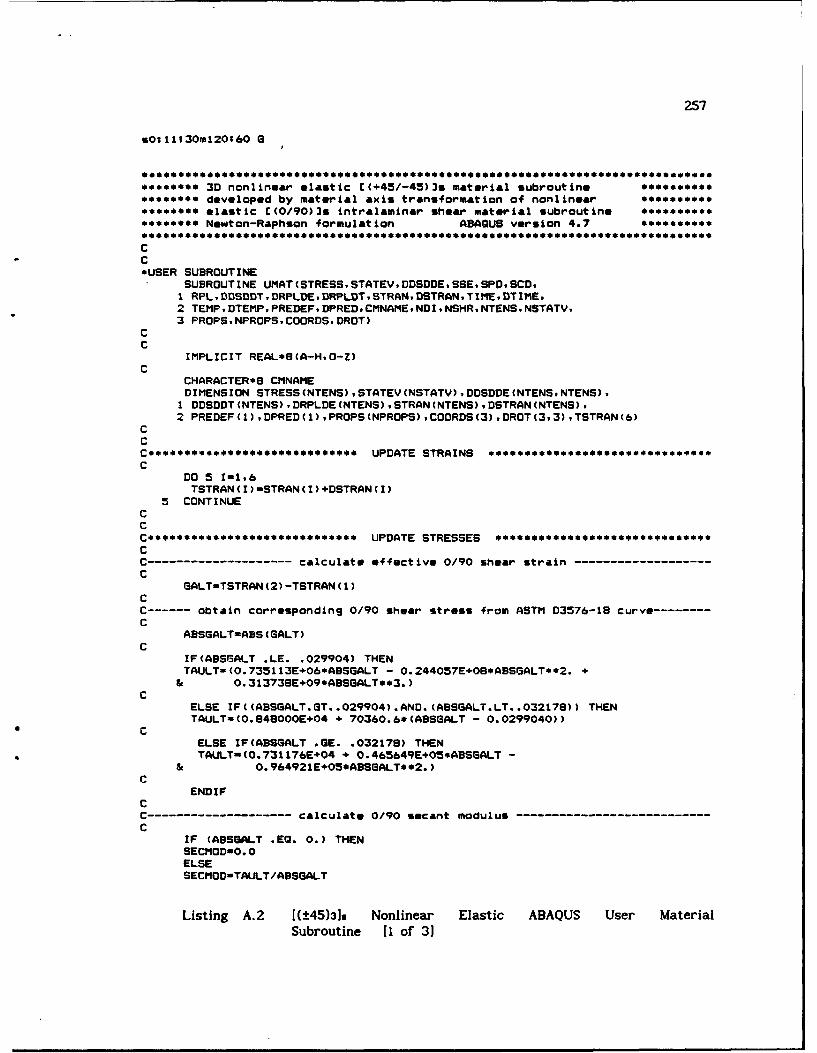
257
sO111:30m120160 6
*.*****3D nonlinear elastic E(e45/-45)3s material subroutine**.***.developed by material axis transformation of nonlinear*...*.*elastic C(0/90)3s intralaminar shear material subroutine ***********Newton-Raphson formulation ABAGUS version 4.7
CC* USER SUBROUTINE
SUBROUTINE UPIAT (STRESS. STATEY. DDSDDE, SSE, SPD. SCD,I RPL. DOSOOTDRPLDE. ORPLOT. STRAN. OSTRAN. TIME, DTIMEF.2 TEMP. DTEMP,*PREDEF. DPRED. CMNAME. NDI.*NSHR. NTE-NS, NSTATV,3 PROPS. NPROPS. COORDS. DROT)
CC
IMPLICIT REAL*e(A-H.O-Z)C
CHARACTER*8 CMNAMEDIMENSION STRESS (NTENS) ,STATEV (NSTATV) ,DDSDDE (NTENS. NTENS),
1 DDSDDT (NTENS) .DRPLDE (NTENS) ,STRAN (NTENS) , STRAN CNTENS),2 PREDEF(1) .DPRED(l).PROPS(NPROPS),COORDS(3),DROTC3,3),TSTRAN(6)
CC
C***********************UPDATE STRAINS .,.* .. **...*..*C
DO 5 1-1.6TSTRAN (I) =STRAN (I) +DSTRAN (I)
5 CONTINUECC
C.***...***.*.**.*.*.*** UPDATE STRESSES *..****~.*.*.**CC--------------------- calculate effective 0/90 shear strain---------------------C
GALT-TSTRAN (2) -TSTRAN Cl)CC ------- obtain corresponding 0/90 shear stress from ASTM D3576-18 curve---------C
ADSGALT-ADS(C ALT)C
IF(ABSI3ALT .LE. .029904) THENTAULT= (0.7351 13E+06*ADSGALT - 0. 244057E+08*ADSGALT**2. +
& 0.313738E+09*ABSGALT*.3.)C
ELSE IFCCABSGALT.ST..029904).AN.(ABS3ALT.LT..03217S)) THENTAULT- (0. 848000E+04 + 70340.6* (ABSALT - 0.0299040))
* CELSE IF(ABSSALT GSE. .032178) THEN
* TAULT (0.731 176E+04 + 0. 465649E+05*ABSGALT -& 0.964921E+05*AS3ALT*02.)
CENDIF
CC---------------------- calculate 0/90 scant modulu-------------------------------C
IF (ABSGALT .EQ. 0.) THENSECMOD-0. 0ELSESECMOD-TAULT/ABSGALT
Listing A.2 [(±45)3]s Nonlinear Elastic ABAQUS User MaterialSubroutine (1 of 31
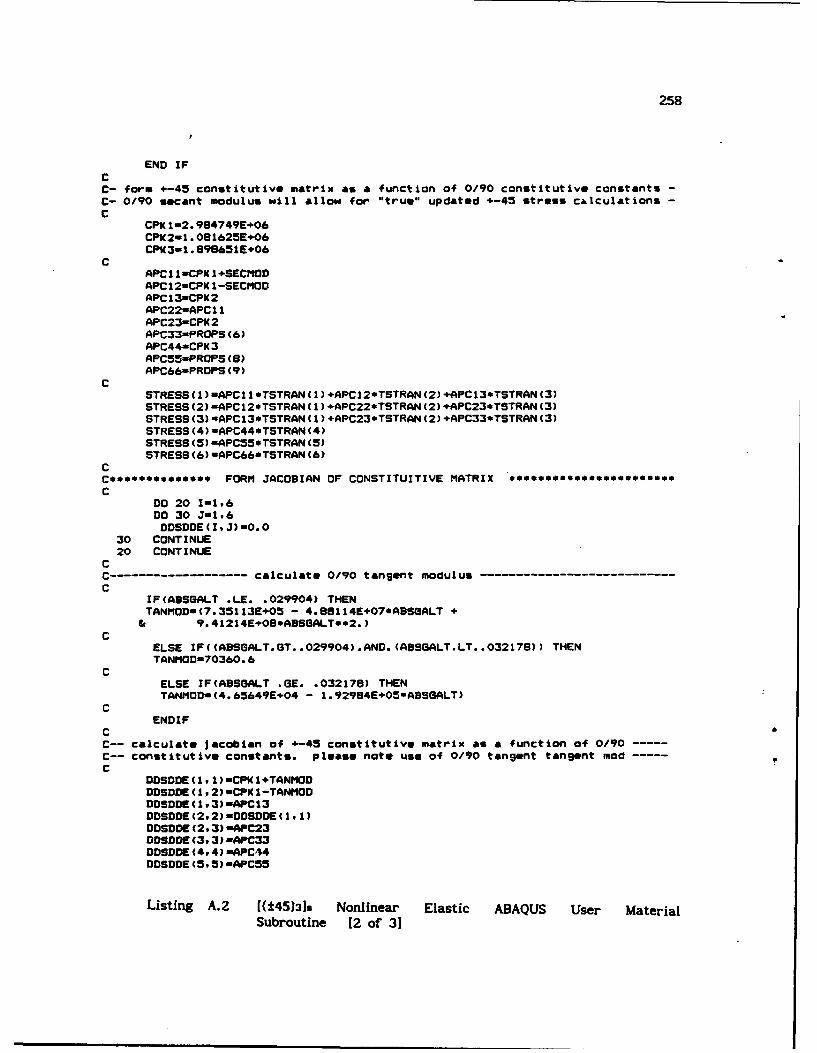
258
END IFCC- form +-45 constitutive matrix as a function of 0/90 constitutive constants -C- 0/90 scant modulus will allow for "true" updated 4-45 stress calculations -C
CPI 2. 984749E+06CPK2- . 081625E.06CPK3-1 .898651E.06
CAPCl -CPK l.SECMODAPC1 2CPKIl-SECMODAPC13-CPK2APC22-APCllIAPC23-CPK2APC33-PROPS (6)APC44-CPK(3APC55-PROPS (8)APC66-PROPS (9)
CSTRESS (1)-APCIl1 TSTRAN (1) .APCl2*TSTRAN (2) +APCl3*TSTRAN (3)STRESS (2)-APC12*TSTRAN (1) APC22*TSTRAN (2) +APC23*TSTRAN (3)STRESS (3)-APCl3.TSTRAN (1) APC23.TSTRAN (2) .APC33*TSTRAN (3)STRESS (4) -APC44*TSTRAN (4)STRESS(S) -APC55.TSTRAN (5)STRESS (6)-APC66*TSTRAN (6)
CC*.***.*.a. FORM JACOBIAN OF CONSTITUITIVE MATRIX ********.**C
00 20 1-1,6DO 30 J-1,6DDSDDE(IJ)mO.0
30 CONTINUE20 CONTINUE
CC ----------------- calculate 0/90 tangent modulus-----------------------------C
IF(ABSGALT .LE. .029904) THENTANMOD-(7.351 13E+05 - 4.891 l4E.07.ABSOALT +
& 9. 41214E.08*ADSBALT*.2.)C
ELSE IF((ABSGALT.ST..029904).AND.(ABS6ALT.LT..032178)) THENTANMOD-7O36O. 6
CELSE IF(ABSGALT .GE. .032178) THENTANMOD (4. 65649E+04 - 1. 92984E.05*ABSBALT)
CENDIF
CC-- calculate jacobian of 4-45 constitutive matrix as a function of 0/90 --C-- constitutive constants. please note use of 0/90 tangent tangent mod --C
DDSDDE(i. l)-CPKleTANMODDDSDDE (1,2) -CPK 1-TANfIODDDSDDE (1.3)-APC13DOSDDE(2.2)-DDSDDE(1. 1)DOSDDE(23)-APC23DVSDDE(31P3)-APC33DDSDDE(44)-APC44DDSDDE (5,5) -APC55
Listing A. 2 ((±45)3]s Nonlinear Elastic ABAQUS User MaterialSubroutine (2 of 31
259
DDSDDE (6.6)-APC66CC
RETURNEND
Listing A.2 [(±45)3)s Nonlinear Elastic ABAQUS User MaterialSubroutine [3 of 31
260
16 LITERATURE CITED
'NASA-DOD Advanced Composites Design Guide, Contract F33615-78-C-3202,Rockwell International Corporation, North American Aircraft Operations, July1983.
2 BIckley, W., G., "The Distribution of Stresses Around a Circular Hole in aPlate", Phil. Trans. Royal Soc., London, Vol 227A, 383-415, July, 1928.
3 Howland, R., C., "On Stresses in Flat Plates Containing Rivet Holes",Proceedings of the 3rd International Congress of Applied Mechanics, Vol. II,1930, p. 74-79.
4 Knight, R., C., "The Action of a Rivet in a Plate of Finite Breadth", Phil.Mag., Series 7, Vol. 19, No. 127, March 1935, pp. 517-540.
5 Theocaries, P. S., "The Stress Distribution in a Strip Loaded in Tension byMeans of a Central Pin", Transaction ASME, Journal of Applied Mechanics, Vol.23, No. 1, March 1956, pp. 85-90.
6 Howland, R.C., "On Stresses in, Flat Plates Containing Rivet Holes",Proceedings of 3rd International Congress of Applied Mechanics, Vol I, 1930,pp. 74-79.
7 Oplinger, D.W. and Gandhi, K.R., "Stresses in Mechanically FastenedOrthotropic Laminates", 2nd Conference on Fibrous Composites in Flight VehicleDesign, pp. 813-841, May 1974, Dayton, OH, AFFDL Report * AFFDL-TR-74-103,September 1974, pp. 811-842 (AD-B00135L).
8 Hoffman, 0., "The Brittle Strength of Orthotropic Materials", Journal ofComposite Materials, 1, 1967, pp. 200-206.
9 Oplinger, D.W., and Gandhi, K.R., "Analytic Studies of Structural PerformanceIn Mechanically Fastened Fiber Reinforced. Plates", Army Symposium on SolidMechanics, September 1974, pp. 211-240.
t
'Ode Jong, T., "Stresses Around Pin-Loaded Holes in Elastically Orthotropic andIsotropic Plates", Journal of Composite Materials, 11, 1977, pp. 313-331.
'1 de Jong, T., "The Influence of Friction on the Theoretical Strength ofPin-Loaded Holes In Orthotropic Plates", Report # LR-350, Department ofAerospace Engineering, Delft University Tech., 1982.
261
12Garbo, S.P. and Ogonowski, J.M., "The Effects of Variances and Manufacturingtolerances on the Design Strength and Life of Mechanically Fastened CompositeJoints", AFWAL-TR-81-3041, Vols. 1-3, 1981.
' 3 Whitney, J.M. and Nuismer, R.J., "Stress Fracture Criteria for LaminatedComposites Containing Stress Concentrations", Journal of Composite Materials,8, July 1974, pp. 253.
14Zhang, K. and Ueng, C., "Stresses Around a Pin-Loaded Hole in Orthotropic
Plates", Journal of Composite Materal. 18, September 1984, pp. 432-446.
i5 Mahajerin, E. and Sikarskie, D.L., "Boundary Element Study of a Loaded Holein an Orthotropic Plate", Journal of Composite Materials, 20, July 1986, pp.375-389.
16 Hyer, M.H., Klang, E.C., and Cooper, D.E., "The Effects of Pin Elasticity,Clearance, and Friction on the Stresses in a Pin-Loaded Orthotropic Plate",Journal of Composite Materials, 21, March 1987, pp. 190-206.
17 Smith, P.A., Ashby, M.F., and Pascoe, K.J., "Modeling Clamp-up Effects inComposite Bolted Joints", Journal of Composites, 21, October 1987, pp.878-897.
18 Waszczak, J.P. and Cruise, T.A., "Failure Modes and Strength Predictionsof Anisotropic Bolt Bearing Specimens", Journal of Composite MaterLals,5, July 1971, pp. 421-425.
19 Tsai, S.W., "Mechanics of Composite Materials, Part II-Theoretical Aspects",Air Force Materials Laboratory Technical Report AFML-TR-66-149, 1966.
2 0 Wong, C.M.S. and Matthews, F.L.' "A Finite Element Analysis of Single andTwo-Hole Bolted Joints in Fiber Reinforced Plastics", Journal of ComposLteMaterials, 15, September 1981, pp. 481-491.
2LChang, F.K., "The Effects of Pin Load Distribution on the Strength. of
* Pin-Loaded Holes in Laminated Composites", Journal of Composite Materials," 20,July 1986, pp. 401-408.
22Yamada, S.E. and Sun, C.T., "Analysis of Laminate Strength and ItsDistribution" Journal of Composite Materials, 12, 1987, pp. 275-284.
23Agarwal, B.L., "Static Strength Predictions of Bolted Joints in CompositeMaterials", AIAA Journal, 18, No. 11, November 1980, pp. 1371-1375.
262
2 4 Grimes, G.C. and Whitney, J.M., "Degradation of Graphite/Epoxy CompositeMaterials Because of Load Induced Micromechanical Damage", SAMPE QuarterLy, 5,July 1974, pp. 1-13.
25Whitney, J.M. and Nuismer, R.J., "Stress Fracture Criteria for LaminatedComposites Containing Stress Concentrations", Journal of Composite Materials,8, 1974, pp. 253-265.
2 6 Soni, S.R., "Failure Analysis of Composite Laminates with a Fastener Hole",ASTM-STP-749, Keward, K.T., 1981, pp. 145-164.
27Pipes, R.B., YorkJ.L., and Wilson, D.W., "Analysis of Net Tension Failure
Mode In Composite Bolted Joints". Journal of Reinforced Plastics andComposites, 1, April 1982, pp. 141-152.
28Tsa, S.W. and Wu, E.M., "A General Theory of Strength of AnisotropicMaterials", Journal of Composite Materials, 5, 1971, pp. 58-80.
2 9 Crews, J.H., Jr., Hong, C.S., and Raju, I.S., " Stress Concentration FactorsIn Finite Orthotropic Laminates With a Pin-Loaded Whole", NASA Technical Paper1862, May 1981.
3OTsujlmoto, Y. and Wilson, D., "Elasto-Plastic Failure Analysis of compositeBolted Joints", Journal of Composite Materials, 20, May 1986, pp. 236-252.
3 1Hill, R., "The Mathematical Theory of Plasticity', Oxford Press, 1950.
3 2 Eriksson, L.I., "Contact Stresses in Bolted Joints of Composite Laminates",Composite Structures, 6, 1986, pp.57-75.
33Matthews, F.L., Wong, C.M., and Chryssafitis, S., "Stress Distribution Arounda Single Bolt in Fiber Reinforced Plastic", Composites, July 1982, pp.316-322.
3 4 Rybicki, E.F. and Schmueser, D.W.' "Effects of Stacking Sequenc& and Lay-upAngle on Free Edge Stresses Around a Hole in a Laminated Plate in Tension", PJournal of Composites, 12, July 1978, pp. 300-312.
35Raju, I.S. and Crews, J.H., "Three Dimensional Analysis of (0/90). and(90/0)s Laminates With a Central Circular Hole", Composites Technology Review,4, Winter 1982, pp. 116-124.
3 6 Carlsson, L, "Interlaminar Stresses at a Hole in a Composite Member Subjectedto In-Plane Loading", Journal of Composites, 17, May 1983, pp. 238-249.
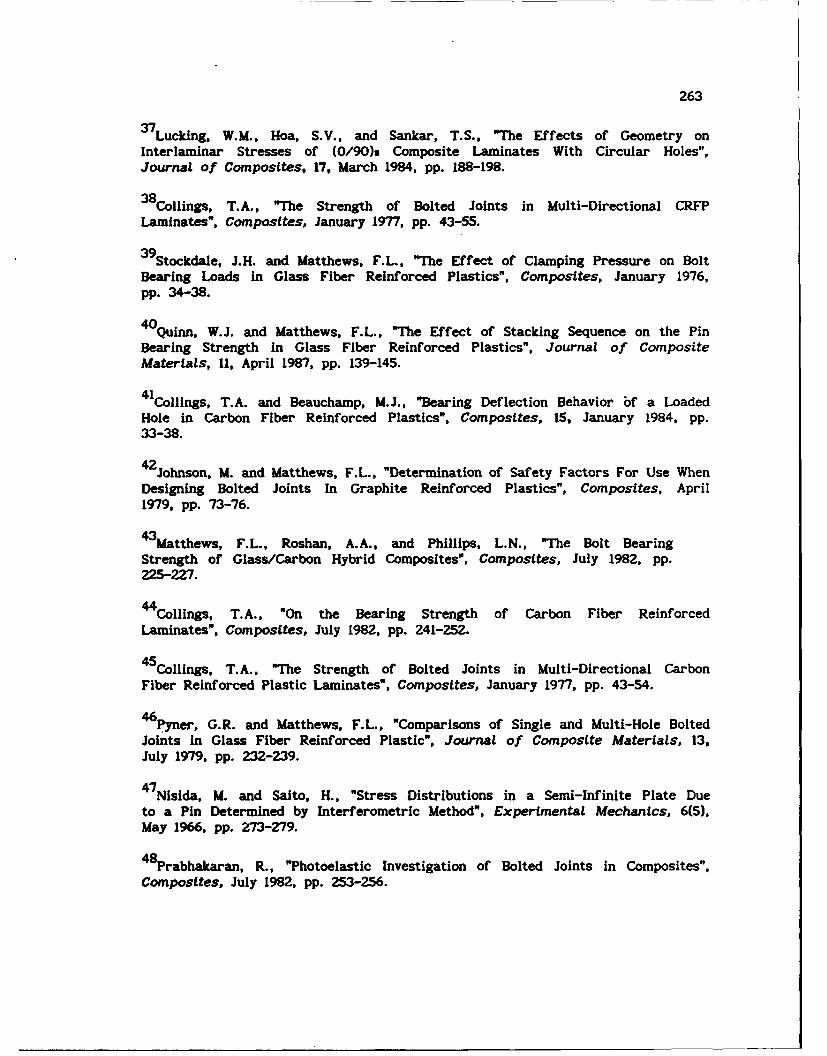
263
3 7 Lucking, W.M., Hoa, S.V., and Sankar, T.S., "The Effects of Geometry onInterlaminar Stresses of (0/90)s Composite Laminates With Circular Holes",Journal of Composites, 17, March 1984, pp. 188-198.
3 8 Collings, T.A., "The Strength of Bolted Joints in Multi-Directional CRFPLaminates", Composites, January 1977, pp. 43-55.
3 9 Stockdale, J.H. and Matthews, F.L., "The Effect of Clamping Pressure on BoltBearing Loads in Glass Fiber Reinforced Plastics", Composites, January 1976,pp. 34-38.
40Quinn, W.J. and Matthews, F.L., "The Effect of Stacking Sequence on the Pin
Bearing Strength in Glass Fiber Reinforced Plastics", Journal of CompositeMaterials, 11, April 1987, pp. 139-145.
4 1Collings, T.A. and Beauchamp, M.J., "Bearing Deflection Behavior bf a LoadedHole in Carbon Fiber Reinforced Plastics", Composites, 15, January 1984, pp.33-38.
4 2 johnson, M. and Matthews, F.L., "Determination of Safety Factors For Use WhenDesigning Bolted Joints In Graphite Reinforced Plastics", Composites, April1979, pp. 73-76.
4 3 Matthews, F.L., Roshan, A.A., and Phillips, L.N., "The Bolt BearingStrength of Glass/Carbon Hybrid Composites", Composites, July 1982, pp.225-227.
44Collings, T.A., "On the Bearing Strength of Carbon Fiber ReinforcedLaminates", Composites, July 1982, pp. 241-252.
4 5 Collings, T.A., "The Strength of Bolted Joints in Multi-Directional CarbonFiber Reinforced Plastic Laminates", Composites, January 1977, pp. 43-54.
4 6 Pyner, G.R. and Matthews, F.L., "Comparisons of Single and Multi-Hole BoltedJoints in Glass Fiber Reinforced Plastic", Journal of Composite Materials, 13,July 1979, pp. 232-239.
4 7 Nisida, M. and Salto, H., "Stress Distributions in a Semi-Infinite Plate Dueto a Pin Determined by Interferometric Method", Experimental Mechanics, 6(5),May 1966, pp. 273-279.
4 8 rabhakaran, R., "Photoelastic Investigation of Bolted Joints in Composites",Composites, July 1982, pp. 253-256.
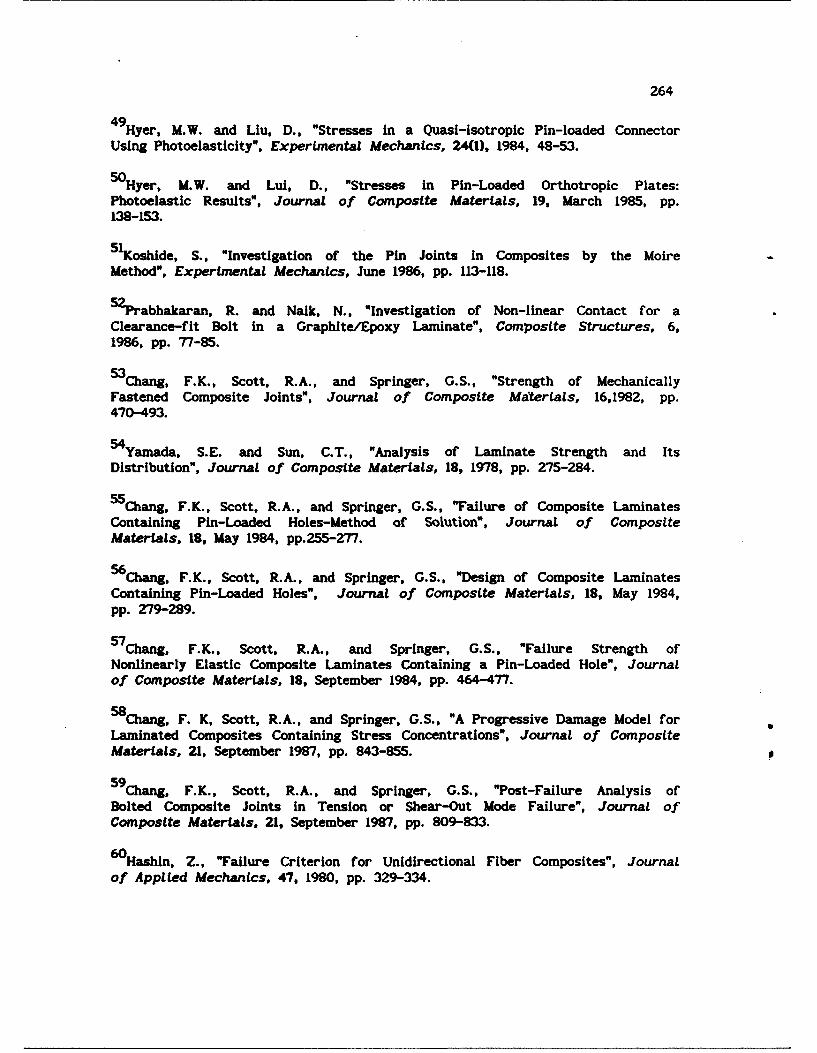
264
4 9 Hyer, M.W. and Liu, D., "Stresses In a Quasi-isotropic Pin-loaded ConnectorUsing Photoelasticity", Experimental Mechanics, 24(1), 1984, 48-53.
soHyer, M.W. and Lul, D., "Stresses in Pin-Loaded Orthotropic Plates:Photoelastic Results", Journal of Composite Materials, 19, March 1985, pp.138-153.
5 1Koshlde, S., "Investigation of the Pin Joints in Composites by the MoireMethod", Experimental Mechanics, June 1986, pp. 113-118.
5 2 rabhakaran, R. and Naik, N., "Investigation of Non-linear Contact for aClearance-fit Bolt in a Graphite/Epoxy Laminate", Composite Structures, 6,1986, pp. 77-85.
5 3 Chang, F.K., Scott, R.A., and Springer, G.S., "Strength of MechanicallyFastened Composite Joints", Journal of Composite Mterals, 16,1982, pp.470-493.
4yamada, S.E. and Sun, C.T., "Analysis of Laminate Strength and Its
Distribution", Journal of Composite Materials, 18, 1978, pp. 275-284.
5 5 Chang, F.K., Scott, R.A., and Springer, G.S., "Failure of Composite LaminatesContaining Pin-Loaded Holes-Method of Solution", Journal of CompositeMaterials, 18, May 1984, pp.255-277.
56Chang, F.K., Scott, R.A., and Springer, G.S., "Design of Composite LaminatesContaining Pin-Loaded Holes", Journal of Composite Materials, 18, May 1984,pp. Z79-289.
57Chang, F.K., Scott, R.A., and Springer, G.S., "Failure Strength ofNonlinearly Elastic Composite Laminates Containing a Pin-Loaded Hole", Journalof Composite Materials, 18, September 1984, pp. 464-477.
58Chang, F. K, Scott, R.A., and Springer, G.S., "A Progressive Damage Model forLaminated Composites Containing Stress Concentrations", Journal of CompositeMaterials, 21, September 1987, pp. 843-855.
59Chang, F.K., Scott, R.A., and Springer, G.S., "Post-Failure Analysis ofBolted Composite Joints in Tension or Shear-Out Mode Failure", Journal ofComposite Materials, 21, September 1987, pp. 809-833.
6 0 Hashin, Z., "Failure Criterion for Unidirectional Fiber Composites", Journal
of Applied Mechanics, 47, 1980, pp. 329-334.
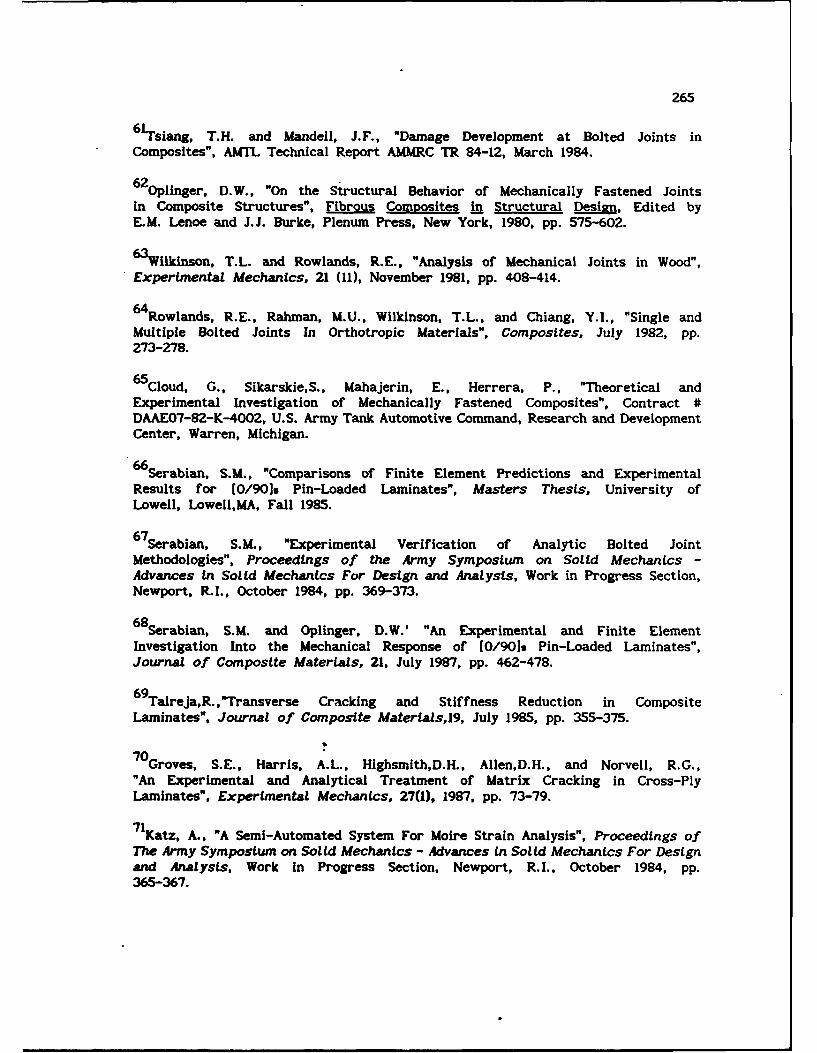
265
6 1Tsiang, T.H. and Mandell, J.F., "Damage Development at Bolted Joints inComposites", AMTL Technical Report AMMRC TR 84-12, March 1984.
6 2 Oplinger, D.W., "On the Structural Behavior of Mechanically Fastened Jointsin Composite Structures", Fibrous Comoosites in Structural Design, Edited byE.M. Lenoe and J.J. Burke, Plenum Press, New York, 1980, pp. 575-602.
63Wilkinson, T.L. and Rowlands, R.E., "Analysis of Mechanical Joints in Wood",Experimental Mechanics, 21 (11), November 1981, pp. 408-414.
64Rowlands, R.E., Rahman, M.U., Wilkinson, T.L., and Chiang, Y.I., "Single andMultiple Bolted Joints In Orthotropic Materials", Composites, July 1982, pp.273-278.
65Cloud, G., Sikarskie,S., Mahajerin, E., Herrera, P., "Theoretical andExperimental Investigation of Mechanically Fastened Composites", Contract #DAAEO7-82-K-4002, U.S. Army Tank Automotive Command, Research and DevelopmentCenter, Warren, Michigan.
66Serabian, S.M., "Comparisons of Finite Element Predictions and ExperimentalResults for [0/901. Pin-Loaded Laminates", Masters Thesis, University ofLowell, Lowell,MA, Fall 1985.
6 7 Serabian, S.M., "Experimental Verification of Analytic Bolted JointMethodologies", Proceedings of the Army Symposium on Solid Mechanics -Advances in Solid Mechanics For Design and Analysis, Work in Progress Section,Newport, R.I., October 1984, pp. 369-373.
6 8 Serabian, S.M. and Oplinger, D.W.' "An Experimental and Finite ElementInvestigation Into the Mechanical Response of [0/901s Pin-Loaded Laminates",Journal of Composite Materials, 21, July 1987, pp. 462-478.
6 9 Tareja,R.,"Transverse Cracking and Stiffness Reduction in CompositeLaminates", Journal of Composite Materals,19, July 1985, pp. 355-375.
7 0 Groves, S.E., Harris, A.L., Highsmith,D.H., Allen,D.H., and Norvell, R.G.,"An Experimental and Analytical Treatment of Matrix Cracking in Cross-PlyLaminates", Experimental Mechanics, 27(1), 1987, pp. 73-79.
7 1Katz, A., "A Semi-Automated System For Moire Strain Analysis", Proceedings ofThe Army Symposium on Solid Mechanics - Advances in Solid Mechanics For Designand Analysis, Work In Progress Section, Newport, R.I., October 1984, pp.365-367.
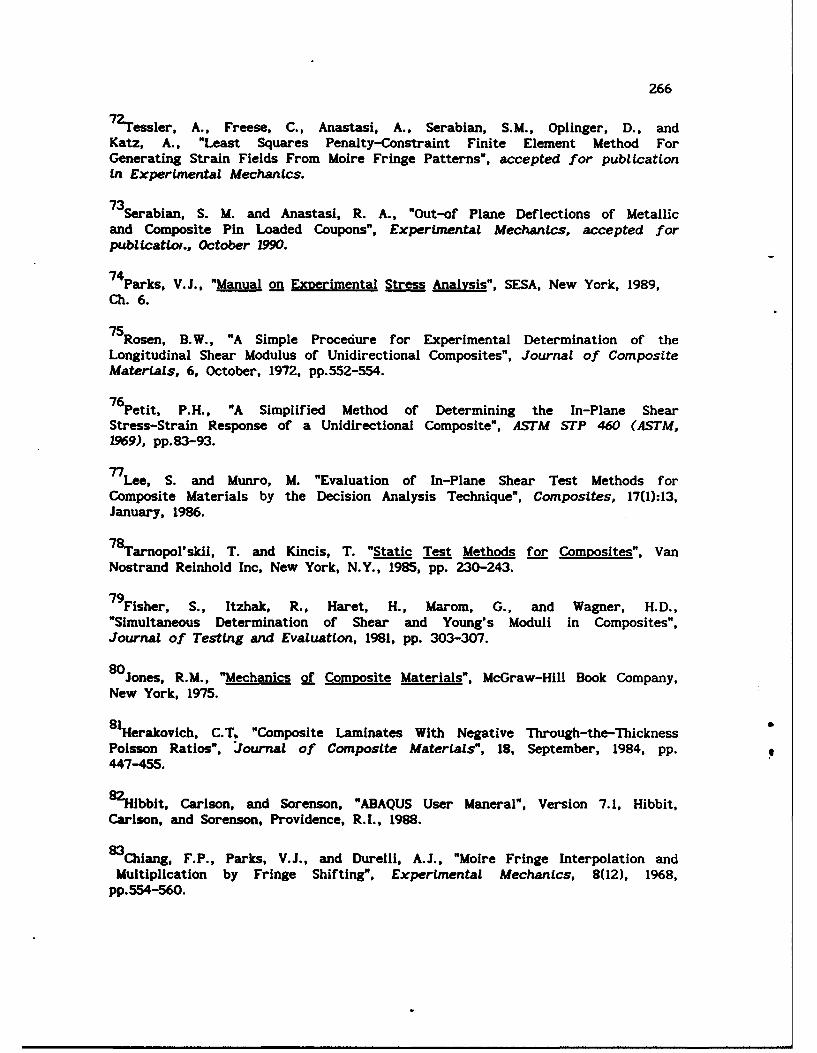
266
7 2 Tessler, A., Freese, C., Anastasi, A., Serabian, S.M., Oplinger, D., andKatz, A., "Least Squares Penalty-Constraint Finite Element Method ForGenerating Strain Fields From Moire Fringe Patterns", accepted for publicationin Experimental Mechanics.
7 3 Serabian, S. M. and Anastasi, R. A., "Out-of Plane Deflections of Metallicand Composite Pin Loaded Coupons", Experimental Mechanics, accepted forpubllcatlot., October 1990.
74Parks, V.J., "Manual on Experimental Stress Analysis", SESA, New York, 1989,Ch. 6.
7 5 Rosen, B.W., "A Simple Procedure for Experimental Determination of theLongitudinal Shear Modulus of Unidirectional Composites", Journal of CompositeMaterials, 6, October, 1972, pp.552-554.
7 6 Petit. P.H., "A Simplified Method of Determining the In-Plane Shear
Stress-Strain Response of a Unidirectional Composite", ASTM STP 460 (ASTM,1969), pp.83-93.
77Lee, S. and Munro, M. "Evaluation of In-Plane Shear Test Methods forComposite Materials by the Decision Analysis Technique", Composites, 17(1):13,January, 1986.
7 8 Tarnopol'skll, T. and Kincis, T. "Static Test Methods for Composites", VanNostrand Reinhold Inc, New York, N.Y., 1985, pp. 230-243.
7 9 Fisher, S., Itzhak, R., Haret, H., Marom, G., and Wagner, H.D.,"Simultaneous Determination of Shear and Young's Moduli in Composites",Journal of Testing and Evaluation, 1981, pp. 303-307.
8 0 Jones, R.M., "Mechanics of Comosite Materials", McGraw-Hill Book Company,New York, 1975.
8 1Herakovich, C.T. "Composite Laminates With Negative Through-the-ThicknessPoisson Ratios", "Journal of Composite Materials", 18, September, 1984, pp.447-455.
2Hlbbit, Carlson, and Sorenson, "ABAQUS User Maneral", Version 7.1, Hibbit,Carlson, and Sorenson, Providence, R.I., 1988.
8 3 Chiang, F.P., Parks, V.J., and Durelli, A.J., "Moire Fringe Interpolation andMultiplication by Fringe Shifting", Experimental Mechanics, 8(12), 1968,
pp.554-560.
DISTRIBUTION LIST
No. ofCopies To
1 Office of the Under Secretary of Defense for Research and Engineering,The Pentagon. Washington, DC 20301
Commander, U.S. Army Laboratory Command, 2800 Powder Mill Road, Adelphi,MD 20783-1145
1 ATTN: AMSLC-IM-TL1 AMSLC-CT
Commander, Defense Technical Information Center, Cameron Station, Building 5,5010 Duke Street, Alexandria, VA 22304-6145
2 ATTN: DTIC-FDAC
1 Metals and Ceramics Information Center, Battelle Columbus Laboratories,505"King Avenue, Columbus, OH 43201
Commander, Army Research Office, P.O. Box 12211, Research Triangle Park,NC 27709-2211
1 ATTN: Information Processing Office
Commander, U.S. Army Materiel Command, 5001 Eisenhower Avenue,Alexandria, VA 22333
1 ATTN: AMCLD
Commander, U.S. Army Materiel Systems Analysis Activity,Aberdeen Proving Ground, MD 21005
1 ATTN: AMXSY-MP, H. Cohen
Commander, U.S. Army Missile Command, Redstone Scientific Information Center,Redstone Arsenal, AL 35898-5241
1 ATTN: AMSMI-RD-CS-q!Doc1 AMSMI-RLM
Commander, U.S. Army Armament, Munitions and Chemical Command, Dover, NJ 078012 ATTN: Technical Library1 AMDAR-LCA, Mr. Harry E. Pebly, Jr., PLASTEC, Director
Commander, U.S. Army Natick Research, Development and Engineering Center,Natick, MA 01760-5010
1 ATTN: Technical Library
Commander, U.S. Army Satellite Communications Agency, Fort Monmouth, NJ 07703I ATTN: Technical Document Center
Commander, U.S. Army Tank-Automotive Command, Warren, MI 48397-50001 ATTN: AMSTA-ZSK2 AMSTA-TSL, Technical Library
Commander, White Sands Missile Range, NM 880021 ATTN: STEWS-WS-VT
,resident, Airborne, Electronics and Special Warfare Board, Fort Bragg,NC 28307
1 ATTN: Library
Director, U.S. Army Ballistic Research Laboratory, Aberdeen Proving Ground,MD 21005
1 ATTN: SLCBR-TSB-S (STINFO)
Commander, Dugway Proving Ground, Dugway, UT 840221 ATTN: Technical Library, Technical Information Division
Commander, Harry Diamond Laboratories, 2800 Powder Mill Road, Adelphi, MD 207831 ATTN: Technical Information Office
Director, Benet Weapons Laboratory, LCWSL, USA AMCCOM, Watervliet, NY 121891 ATTN: AMSMC-LCB-TL1 AMSMC-LCB-RI AMSMC-LCB-RMI AMSMC-LCB-RP
Commander, U.S. Army Foreign Science and Technology Center, 220 7th Street, N.E.,Charlottesvilie, VA 22901-5396
3 ATTN: AIFRTC, Applied Technologies Branch, Gerald Schlesinger
No. ofCopies To
Commander, U.S. Army Aeromedical Research Unit, P.O. Box 577, Fort Rucker,AL 36360
1 ATTN: Technical Library
Commander, U.S. Army Aviation Systems Command, Aviation Research and TechnologyActivity, Aviation Applied Technology Directorate, Fort Eustis, VA 23604-5577
1 ATTN: SAVDL-E-MOS
U.S. Army Aviation Training Library, Fort Rucker, AL 363601 ATTN: Building 5906-5907
Commander, U.S. Army Agency for Aviation Safety, Fort Rucker, AL 363621 ATTN: Technical Library
Commander, USACDC Air Defense Agency, Fort Bliss, TX 799161 ATTN: Technical Library
Commander, U.S. Army Engineer School, Fort Belvoir, VA 220601 ATTN: Library
Commander, U.S. Army Engineer Waterways Experiment Station, P. 0. Box 631,Vicksburg, MS 39180
1 ATTN: Research Center Library
Commandant, U.S. Army Quartermaster School, Fort Lee, VA 238011 ATTN: Quartermaster SLool Library
Naval Research Laboratory, Washington, DC 203751 ATTN: Code 58302 Dr. G. R. Yoder - Code 6384
Chief of Naval Research, Arlington, VA 222171 ATTN: Code 471
1 Edward J. Morrissey, WRDC/MLTE, Wright-Patterson Air Force, Base, OH 45433-6523
Commander, U.S. Air Force Wright Research & Development Center,Wright-Patterson Air Force Base, OH 45433-6523
1 ATTN: WRDC/MLLP, M. Forney, Jr.1 WRDC/MLBC, Mr. Stanley Schulman
NASA - Marshall Space Flight Center, MSFC, AL 358121 ATTN: Mr. Paul Schuerer/EHc1
U.S. Department of Commerce, National Institute of Standards and Technology,Gaithersburg, MD 20899
1 ATTN: Stephen M. Hsu, Chief, Ceramics Division, Institute for MaterialsScience and Engineering
1 Committee on Marine Structures, Marine Board, National Research Council,2101 Constitution Ave., N.W., Washington, DC 20418
1 Librarian, Materials Sciences Corporation, 930 Harvest Drive, Suite 300,
Blue Bell, PA 19422
1 The Charles Stark Draper Laboratory, 68 Albany Street, Cambridge, MA 02139
Wyman-Gordon Company, Worcester, MA 016011 ATTN: Technical Library
Lockheed-Georgia Company, 86 South Cobb Drive, Marietta, GA 300631 ATTN: Materials and Processes Engineering Dept. 71-11, Zone 54
General Dynamics, Convair Aerospace Division, P.O. Box 748, Fort Worth,TX 76101
I ATTN: Mfg. Engineering Technical Library
I Prof. F. K. Chang, Department of Aeronautics and Astronautics, StanfordUniversity, Stanford, CA 94305
1 Dr. J. H. Crews, Jr., Mail Stop 188E, NASA Langley Research Center, Hampton,VA 23665-5225
No. ofCopies To
1 Prof. M. W. Hyer, Department of Engineering Science and Mechanics, VirginiaPolytechnic Institute and State University, Blacksburg, VA 24060-0219
1 Prof. F. L. Mathews, Department of Aeronautics, Imperial College of Science &Technology, Prince Consort Road, London SW7 2BY
1 Prof. J. Morton, Department of Engineering Science and Mechanics, VirginiaPolytechnic Institute and State University, Blacksburg, VA 24060-0219
1 Prof. R. E. Rowlands, Department of Engineering Mechanics, University ofWisconsin-Madison, Madison, WI 53706
1 Dr. J. R. Soderquist, Federal Aviation Administration, 800 Independence AvenueS.W., Washington, DC 20591
Director, U.S. Army Materials Technology Laboratory, Watertown, MA 02172-00012 ATTN: SLCMT-TML1 Author
ta- 1, e 0
300 Z 2-- a c3
0. 01-. 1C 3C2 - 0 c 0-
coo o-0 00 -16 -c.6 0 C~ U ~ .cc COC 00, OLUCO OO s-U0o O C .c -to0~~~~~ ~~~~ ~~~~ 00I0s0.i.-c0 ~ 0'C 0. 0 .-
OU Ctcc o0 -0-.c . ' 000 ~ t__ 2a c~~~~~ :Z, . ~ U 0C0
U0.0 0 0000 0 03 L~t C 0!-~ 000 L.0 C0.V~ t -COO O O Ocm 1.O00 J z 0 10, s-0- C ULt-C~ ~~ ~~~~~~~~ .2 s-'Z - ~C- 3 O05 0 O 0 0 c
I SC. OF 3 -2, % h -o.C s O 0... 0. 0 C 0 0 -.oo.'.o.-.0.C..
000 1 1 0 -6-1 tt
0
-- 8 a,.000 o -C
aC3~ c-- _c ;r 6 o 0000000 o N
-ots oc. 1 -. *o I' 0 - Z
Cot..z CU CI CA LL
00sC . 0 0 a
00-x - . '.1 I- 1-- -~o--~ 00 *c . . ± ' 0
0-c .-
- ~~ 1 1. 1 a CC0 000o0I I :,1.20 1.o1_-.-~~~~~ ~V Va~& 340 800,s c O000 0t0L
a~1 1 a * -j-. o - . oC-, c ~ 0 L 0 0 C
Os- 24 CC t00 0 0 2s 1 C3N.L5_ 05.00OL. -~ - C .j N 5L . 80.00 0L. EL. 0. -
t~~~ii~ i m- 0, I . n~oo0 Z: 4-W2 ;u.iI.1s usd-'I.-
s-C4C t~;sot~t~a:~.O~sC.,~ . .0LU 0 o -. O~ - - 0 Oosa -- -3t:30a01 - S 0 000 v;... 0... .. CCOO C 0.0 t -- 0.' 0
1w 0' 0 0 000 00 .1 :28- COO !
00-~~~~Z0-2 .L .0.30 3 0 0. ~ t 0 l . W0 .L -. 00000.. - - - .
~~33~~f33C2. 0
, o' - - - - - -t
0 0 00 0 0I C -C 0 C Oo 0U , o
''OO. wC-J 00Z EOCC O V.. S, .. L .- C0 . . . . 0.0. . 5-t--
a.~ ~~~~~~~~~ .0
t 0 : ; 1~. ' ~ O t~ - ---- C l -C tU C rO'3 C00C3,.,0.,Z~~0. O.O0O0 00 ,0C C.2.2~L C's'721 -
tdIOc cO0 --o J 0.00 - 0 0 0 N o . O. - tC0. sCO 0500 ,60 'CU..,00L.00 - O
33 ~ 3 L 0S ~ z
0 0 0- : : i ~ o - S a 0 0
I SC3COL. ~ &5,8 gzo~ s -T ;z. .. -0tC It-o 0 0 0 0 ~ L '
~-l-- ---- g- -- -- -- - -- ---v-
00 c0C 0 CS C' 0 I cc t
Ca s-C * o a 0 0
tf, -j0
* -- - - - - - - - - - - L .50- 21 ,3. I C o: M. C O 0 - a t - fC~~~ ~ ~'& - soCC 5 0 UCg0
~~~~~~~~t .O5 03 9 OOCCU U c~100 UC3 ~ - 4 O 3 S
8_05I.08
2z I., ZE 3C1s I
Eo- o-2. o I'
t i jt w ~ * JC - 1 0.0o .j 0 J 3- 0 .a~
.511-0Y1s-Oav Z0 ZJ.C a 5; s- oc Nt3 00 o oo - I O -1 -
O C Cc 0 0 cC0Is" 8SCI :-;I
5tEt ; 8*z Lc-xo:. I h C