Embed Size (px)
Citation preview

City of Cape Town Backpacking and Youth Tourism Investigative Study
Presented by: Prof Kamilla Swart
Date: 19 March 2010

Introduction And Methodological Approach

Introduction to Study
• Commissioned by CoCT to provide City with direction and recommendations into facilitating and developing sector
• To gain a better understanding of the backpacking market in Cape Town– To prepare an action plan to further promote, facilitate and develop
niche• Develop targeted strategies, initiatives and programmes to unlock
potential of market

• Define terms and concepts• Review secondary data at all levels• Conduct primary data collection at local level• Analyse data to establish trends, travel patterns & frequencies
– Conduct comparative analysis to establish differences and similarities across strata
– Conduct importance-performance analysis for those that have visited destination to establish destination’s strengths and weaknesses from tourists’ view point
– Conduct an impact analysis and forecasting to establish possible positive and negative impacts of further developing this niche sector
– Estimate future direction of the industry among others
• Develop an action plan that will be city’s ‘road map’ towards taking full advantage of and optimise returns from this niche sector
Research Methodology

Preview• Definition of concepts• Assessment of study requirements & needs• Gathering and review of documents including city TDF, Business plans, tourism white papers etc.
Secondary dataMainly at global & national levels and to a less extent at the local level to understand demand and supply side trends from already existing research data and information• Demand side trends such as volumes, yield, major origin markets, consumer travel patterns, demands, needs, requirements • Supply side trends such as major backpacking destination competition, availability and adequacy of resource and infrastructure supply
Research Methodology

Research Methodology
Primary data
Primary data will be used at both national and local levels
Supply side•Establish databases of suppliers at local level including: accommodation, tour operators, attractions and transport•Divide database into strata by supplier type to get a fair representation of each•Select 30 respondents under each strata•Administer questionnaire by means preferred by respondent (self, face-to-face, e-mail, phone or mail)
Demand side•Establish databases of previous visitors to South Africa and Cape Town•Divide database into two strata (international and domestic)•Further divide strata into two (those that have visited and those that haven’t visited Cape Town)•Select 100 ‘have visited’ and 50 ‘have not visited’ internationals•Select 70 ‘have visited’ and 30 ‘have not visited’ domestics•Administer questionnaire by e-mail or phone

Research Methodology
Action PlanDevelop action plan informed by research findings, including:• Specific and measurable goals and objectives, bound by time• Time and resources that should be committed to be successful• Areas that need improvement in destination to effectively attract and serve this
market and responsible parties and individuals • Identify possible problem areas such as negative impacts• Responsible parties and individuals for each component of action plan and
expected results• Industry liaison group to regularly monitor, track and evaluate progress
regarding performance of the niche sector according to action plan• Action plan to be finalised with industry stakeholders

Research MethodologyPartnership with BSA/ SAYTC
• BSA (1998) market SA globally as preferred destination • SAYTC (2007)
- Backpacking SA - Education Travel - Tours & transport - Volunteering SA

Targeted sample Actual sample
Supply side
Lodging 30 7
Attractions (language schools) 30 3
Tour Operators 30 4
Demand side
Have visited International 100 84
Domestic 70 4
Have not visited
International 50 5
Domestic 30
Data Collection

Data Collection
Challenges• Industry buy-in• Low response rates to e-mail surveys• Incorrect e-mail addresses• Considered spam• Low season for backpacking establishments• Very small domestic backpacking market

Data Collection
Interventions for challenges• Use of Survey Monkey• Banners and links on BSA website• Prizes offered for completion of surveys• Meetings held• Follow up e-mails and phone calls• Surveys left at backpacking establishments

Secondary Data – Key Findings

Secondary Data – Key Findings
Definitions and concepts• Old perceptions changing• Travel alone, young career professional, late 20’s, educated, middle class, single• Concerned with money and budgeting• Increasing disposable income – ‘flashpackers’• Increased older travellers – ‘denture venturers’• Prefer budget accommodation• Emphasis on meeting people during travels• Flexible travel schedule

Secondary Data – Key Findings
Definitions and concepts (cont.)• Prefer longer holidays• Prefer participatory holidays• Working holiday maker• Explorers, looking for a cultural experience• Backpacker plus – older person who is not tied down by responsibility• Travel off the beaten track• Average spend of US$3 000 on main trip• Study abroad• May have inappropriate behaviour that could offend locals

Secondary Data – Key Findings
Backpackers to South Africa• Most from Western Europe, well travelled, long haul travellers• Most from Germany, UK and Netherlands• Young men and women; ages 21 to 25• Usually employed in services industry• General budget of R10 000 or less• Main areas of spending: accommodation, restaurants, self-catering food supplies,
take-away meals, bar tabs, night clubs and general tourist activities• Websites used: SA Tourism, Lonely Planet, Greyhound, Alternative Route, about Cape
Town, Baz Bus and Coast to Coast• Small percentage on a gap year• Internet plays key role in planning for trip• Aim to interact with local South Africans and meet new people• SA seen as gateway to the rest of Africa and as a destination for humanitarian work• Spend much less time in South Africa than in other destinations such as Australia

Secondary Data – Key Findings
Major source countries for international backpackers visiting South Africa (Rogerson, 2007)

Secondary Data – Key Findings
Key features of South Africa visit• Average cost of return flight R6 821• Most common airlines used: British Airways, SAA, Qantas, KLM, Virgin and
Lufthansa• Most common entry point is Cape Town, followed by Johannesburg• Average length of stay: 42 days• All nights not spent in backpacker accommodation and volunteers stay in
accommodation organised by organisation• Facilities considered essential include clean bathrooms, clean beds, friendly staff,
self-catering facilities, Internet, travel information, lockers, laundry and a bar• Highest spend is on accommodation• Most popular activities are visiting natural sites, game viewing, visiting museums,
visiting historical sites, night clubbing and township tours

Secondary Data – Key Findings
Travel patterns within South Africa• Cape Town most popular destination followed by Kruger Park, Durban, Port
Elizabeth, Jeffrey’s Bay, Paarl, Stellenbosch, Knysna, Coffee Bay and Plettenberg Bay• Most not able to visit attractions that they would like because of a lack of marketing
and cost factors• High concern about safety and security• Most arrive in South Africa with a planned itinerary but often change it• Transport in South Africa is not flexible enough and places constraints on travel• Transportation services most commonly used: rental cars, domestic low cost airlines
(especially One Time and Kulula) and intercity busses (especially Greyhound, Inter Cape and Translux)

Secondary Data – Key Findings
Geographical distribution of suppliers of backpacker accommodation, by province(Rogerson, 2007)

Secondary Data – Key Findings
General backpacker needs and requirements• Require a developed infrastructure for travelling, especially in the forms of public
transport, information while travelling, Internet cafes, laundromats and accommodation
• Main information needed to plan a trip is through Internet and word of mouth• Backpacker destinations require fewer infrastructures than high-end tourists as
backpackers are less demanding• International Student Identity Card used for access and discountsGeneral backpacker travel motivations• Main motivation is to explore other cultures, followed by excitement and
increased knowledge• Like relaxation time• Younger travellers want more social activities

Secondary Data – Key Findings
Global transport and accommodation trends• Main transport used to reach a destination is air• Younger backpackers make more use of rail, coach, tour busses and hitchhiking
and walking• Higher disposable income and therefore often make use of hotel accommodation• Backpackers from Slovenia, UK, Canada and Mexico are more likely to make use of
backpacker hostels, while those from Hong Kong and South Africa use them less frequently
• South African backpackers are more likely to stay in hotels or with friends and family. Travellers from Czech Republic and Slovenia very rarely stay with friends and family.
• Choice of accommodation closely related to motivation for travel• Increase in quality and professionalism in youth travel accommodation due to new
markets and peer-to-peer reviews conducted online• Higher star rating means higher profit as higher rates can be charged• Hostels chosen based on location and price
Secondary Data – Key Findings
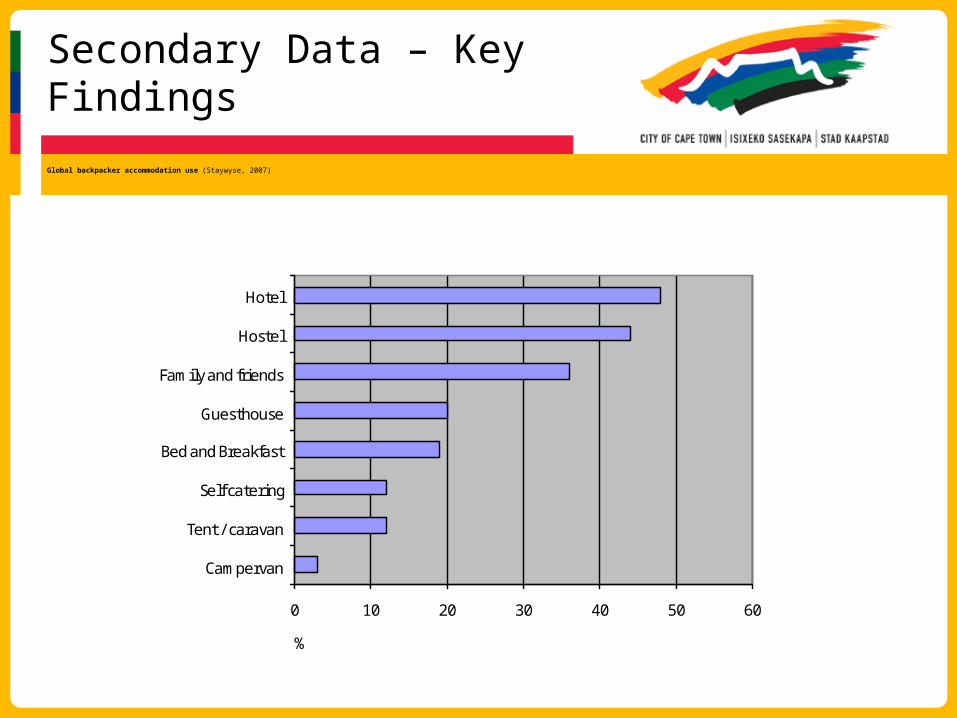
Global backpacker accommodation use (Staywyse, 2007)
0 10 20 30 40 50 60
Campervan
Tent / caravan
Self catering
Bed and Breakfast
Guesthouse
Family and friends
Hostel
Hotel
%
Secondary Data – Key Findings
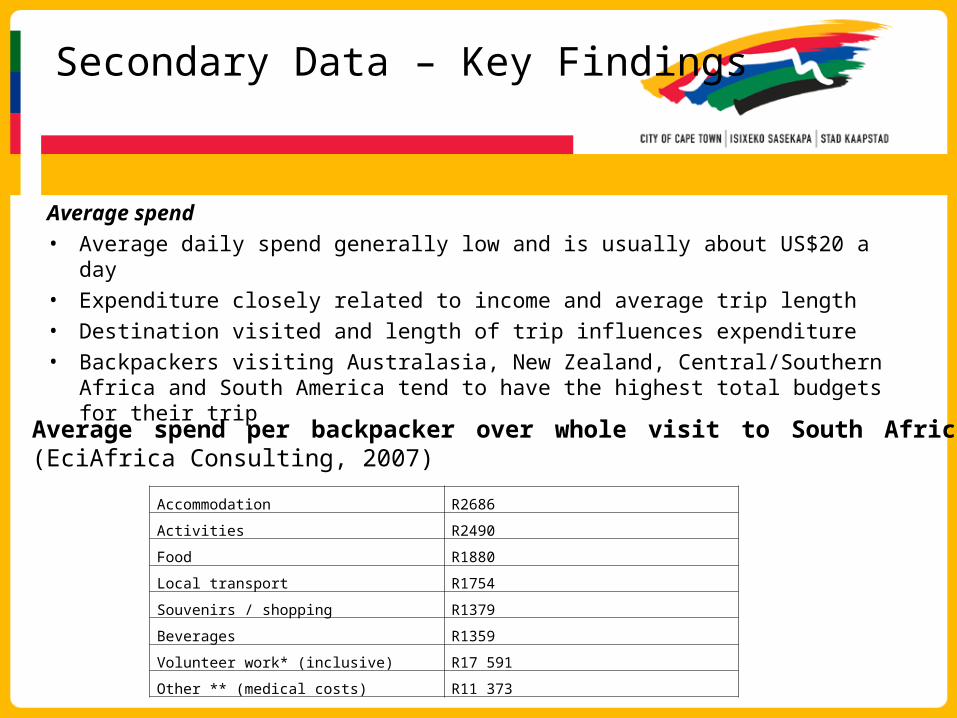
Average spend• Average daily spend generally low and is usually about US$20 a day• Expenditure closely related to income and average trip length• Destination visited and length of trip influences expenditure• Backpackers visiting Australasia, New Zealand, Central/Southern Africa and South
America tend to have the highest total budgets for their trip
Accommodation R2686
Activities R2490
Food R1880
Local transport R1754
Souvenirs / shopping R1379
Beverages R1359
Volunteer work* (inclusive) R17 591
Other ** (medical costs) R11 373
Average spend per backpacker over whole visit to South Africa (EciAfrica Consulting, 2007)

Secondary Data – Key Findings
Activities• Most popular activities include visiting historical sites and monuments, walking
and trekking, sitting in cafes and restaurants and shopping, while the least popular activities are academic study and learning a language.
• Undertake a wide range of activities• South African backpackers more likely to undertake academic study• In Cape Town, most popular activities include exploring Table Mountain, Green
Market Square, Cape Point, Robben Island and the Castle; a wine tour and a township tour
Length of stay• Average length of stay 63.5 days• Longest trips taken to Australasia, North America, Indian sub-continent • Shortest trips taken to Eastern Europe, North Africa, Southern Europe and
Central / Southern Africa

Secondary Data – Key Findings
Backpacking destinations• Europe popular because of availability of good public transport, large numbers of
hostels, budget accommodation and variety of work exchange programmes• Australia and New Zealand also popular destinations because of the range of
working holidays available• Destinations most popular: Southeast Asia, Australasia and South America • North America popular for older backpackers• Female backpackers more likely to travel to Western Europe, the Middle East and
Central/Southern Africa while males are more likely to travel to Eastern Europe, North, Central and South America.
• Least experienced backpackers visit more westernised areas of Europe, while seasoned travellers prefer more ‘challenging’ destinations such as South America, China/Japan and the Indian sub-continent
• Most backpackers follow popular routes which are set out in guidebooks

Secondary Data – Key Findings
Backpacker destinations in South Africa• Most establishments: Western Cape, Eastern Cape, Kwa-Zulu Natal, Gauteng and Mpumalanga • Limited accommodation in Free State, Northern Cape, North West and Limpopo• Significant clusters of backpacker accommodation establishments along Garden Route, Wild
Coast, Kwa-Zulu Natal coast, Hogsback and Nelspruit• Backpacking plays a large role in the economies of Coffee Bay, Jeffrey’s Bay, Mossel Bay and
Oudtshoorn
South African backpacker accommodation survey• Key issues are lack of international and domestic marketing of SA as a competitive destination,
lack of responsiveness at a provincial and municipal level to backpacking issues, a lack of regulations and new investments
• Other issues around linkages with other enterprises, involvement in associations and the effects of government measures on businesses
• Most common memberships with BSA, local and provincial tourism organisations and less frequently, organisations such as FTTSA

Secondary Data – Key Findings
Infrastructure• Needs infrastructure separate to, but parallel with mainstream tourism infrastructure• Requires inexpensive transportation system, low priced hotels, youth hostels, shops,
nightclubs and coffee housesYouth travel demand• Decline in demand for 2009• Increase in demand related to increased marketing and product diversity• New partnerships set to increase demandVolunteer tourism• South Africa most popular destination• Average length of placement: 1-3 months• Usually self-financed• Volunteers mainly drawn from USA

Secondary Data – Key Findings
Impacts of backpacker tourism• Backpackers may settle down and establish businesses in a region• Contributes to local economy as backpackers purchase local goods and services• Money spread to wider geographical area than with mainstream tourism• Pride and consideration for local communities and local development• May push locals out and gentrify an areaShortcoming for local development• Industry is predominantly white-owned and dominated• Developments continually taking place along already established tourist routesDemand side challenges• Lack of support from national and provincial government• Challenges for entrepreneurs with regard to marketing, financing and attracting new
tourists• Problems with zoning and regulations

Primary Data – Key Findings

Primary Data - Key Findings-Suppliers: Lodging
• Overall, business doing great for most: 71 % reported increasing business in past 5 years
• All were members of BSA and agree that backpacking associations are required to:– Maintain standards within industry– Assist with marketing– Assist with provision of information– Offer assistance to SMMEs– Provide networking platforms– Government lobbying

Primary Data - Key Findings-Suppliers: Lodging
Internet and word of mouth are main advertising channels
Advertising

Primary Data - Key Findings-Suppliers: Lodging
Summer - most popular backpacking season as shown by occupancy rates However all other seasons are not too bad
Seasonal occupancy rates

Primary Data - Key Findings-Suppliers: Lodging
Visitor characteristics • Short to medium length of stay 7-14 nights• Domestics have short advance booking times• African tourists book about 3 months in advance• Europeans & Americans about 3-6 months in advance• Europeans bring the most yield/per visit followed by North Americans and
domestics

Primary Data - Key Findings Suppliers: Lodging
Top five source markets with highest yield - 2008• UK• Germany• Domestic• USA• Netherlands

Primary Data - Key Findings-Suppliers: Lodging
Importance-performance of lodging facilities• Top most important lodging attributes to backpackers (supply):
– Friendly staff, safety and security and clean beds (score 4.71 each out of possible 5)
– Clean bathrooms (score 4.57 out of possible 5)– Friendly guests (score 4.43 out of possible 5)– Overall cleanliness (score 4.29)– Staff knowledge of local activities and attractions and advance booking
facilities (score 4.14 each)

Primary Data - Key Findings-Suppliers: Lodging
Challenges for growth and development in Cape Town• Minimal to lacking government commitment, • Lack of marketing domestic and international • Safety and security/crime• Lack of marketing support for SMMEs• Skills development and training • Lack of networking• Negative perceptions towards backpacking• Cape Town winter• Public misconception of industry

Primary Data - Key Findings-Suppliers: Lodging
What to do going forward • Working on changing perceptions about the sector and
improve the image• Provide marketing support to SMMEs• Improve safety and security• Standardise laws and regulations • Sector specific marketing campaigns• Provide government assistance• Establish skills development and training programmes • Improve communication and networking within sector

Primary Data - Key Findings-Suppliers: Tour Operators
Languages in which services are offered• German• Spanish• Afrikaans • Xhosa

Primary Data - Key Findings-Suppliers: Tour Operators
Challenges
• Need for grading system for shark and whale operators• Strict compliance with standards and high standards for
vessels• Assistance to small operators• Funding for trade shows• Sort out department of transport• Financial assistance from government• Reduction in crime and improvement of safety

Primary Data - Key Findings-Suppliers: Attractions
Language Schools• Mostly operate all year round• Operate at 90+ % capacity in summer• Operate at 70-90% capacity other seasons

Primary Data - Key Findings-Suppliers: Attractions
Land-based Water-based Other
Hiking Swimming Shopping (souvenirs)
Mountaineering Canoeing Equipment rental
Bicycling Cage diving Picnicking
Quad-biking Rafting Restaurant (dining)
Hunting Kayaking Events hosting
Wildlife viewing Boating
Bird watching
Camping
Bungi jumping
Activities offered

Primary Data - Key Findings-Suppliers: Attractions
Europe seems to be major source market followed by Africa and South America
Main sources of business

Primary Data - Key findings-Suppliers: Attractions
Challenges• Lack of awareness of their sector• Safety and security and crime • Negative South Africa reputation abroad• Competition from other destinations• Lack of government recognition and support• Visa regulations• No standard regulation as they currently self-regulate• Lack of exposure from SAT• Shortage of cheap accommodation options

Primary Data - Key Findings-Demand side: Demographics
Gender ratio: 40% male and 39% female25-29 age group was largest followed by 20-24
Gender & Age

Primary Data - Key Findings-Demand side: Demographics
Ethnicity & origin• Predominantly White (68.2%), with a few Asians (4.5%) and
Hispanics (3.4%) • Blacks and Pacific Islanders represented a small proportion of
2.3% each• Predominantly from Europe (64.7%), with a few from Asia and
Australasia (10.6%), and North and South America (8% each) • Domestics and Africans represented only 4.5% and 3.4% each
respectively. • UK was single largest source country (28.2%) followed by
Germany and Brazil with 7.1% each

Primary Data - Key Findings-Demand side: Demographics
Largest single group: undergraduate degree group then post graduate degree
Education

Primary Data - Key Findings-Demand side: Demographics
Largest income group: US$ 1 000-US$2 000
Monthly Income

Primary Data - Key Findings-Demand side: Travel patterns & characteristics
Most backpackers driven to take a trip by their desire to explore new places followed by need to learn about other places and cultures
Underlying Motive to Travel

Primary Data - Key Findings-Demand side: Travel patterns & characteristics
Main purpose of visit• Holiday (69.3%) • Visiting friends and family (11.4%) • volunteerism (10.2%) • Business (6.8%)• Attending a conference (4.5%)• Sport event (4.5%)• Shark diving (2.3%)• Study (4.5%)• Field-work and internship (1.1% each)

Primary Data - Key Findings-Demand side: Trip planning
Most people travel 6 months after they decide on destination, a few take 2-3 years planning their trip
Time between destination selection & travel

Primary Data - Key Findings-Demand side: Travel patterns & characteristics
How the tourists heard about Cape Town

Primary Data - Key Findings-Demand side: Within destination travel patterns
Origin region
Average number of times visited Cape Town in past five years
Europe 1.66
Asia & Australasia
1.67
South America
1.33
Domestic 4.50
North America
1.29
All 1.80
•Domestics had the highest repeat visitation rate. The rest had just about the same•Average travel group size was 5• 31% travelled alone•22% in couples
Repeat visitation and travel group size

Primary Data - Key Findings-Demand side: Within destination travel patterns
Mode of transport• Air transportation (61.4%) main mode of transportation to
Cape Town – followed by bus (20.5%) – personal car (11.4%)– 8% travelled to Cape Town by overland truck
• Within destination, most common mode of transport - rental car (73.9%),– followed by foot (44.3%)– public transport (31.8%)– metered taxi (29.6%) – tour buses (19.3%) – 3.3% of the respondents used friend’s car

Primary Data - Key Findings-Demand side: Within destination travel patterns
Accommodation choices• Majority (88.6%) used backpacker hostels for
accommodation during their trip to Cape Town • A few used friends and relatives (8%)• Hotels (5.7%), • Home-stays (6.8%) • Guest houses (4.5%) • Camping (4.5%)• B&B (1.1%)

Primary Data - Key Findings-Demand side: Within destination travel patterns
Reason for selecting accommodation type• Cost 75%• Accessible location (44.3%)• Community spirit (27.3%)• Youth dominated (22.7%)• Activity location (15.9%)• Informality (15.9%)

Primary Data - Key Findings-Demand side: Within destination travel patterns
Accommodation suburb

Primary data key findings-Demand side:Within destination travel pattern
Region of origin Length of Stay (number of nights)
Europe 11.7
Asia & Australasia
8.2
South America 11.5
Domestic 7.8
North America 8.0
All 10.7
•Overall average length of stay - 10.7 nights•Europe had largest (11.7 nights) length of stay
Length of stay

Primary Data - Key Findings-Demand side:Within destination travel pattern
Region of origin
Total Spend
Accommodation Food & Beverage
Within destination Transport
Entertainment Shopping
Europe 7 664.76
1 825.08 1 812.50 672.87 917.17 1 035.64
Asia & Australasia
6 500.00
644.25 852.86 262.57 808.57 1 530.86
All 7 737.27
1 474.60 1 544.28 634.94 987.72 1 148.94
•Average spend/trip was R7 737•Highest spending category was food & beverage (R1 544)*Note that categories don’t add up to total due to omission of some spending categories by respondents
Spend by origin and category (in Rands)

Primary Data - Key Findings-Demand side: Within destination travel pattern
Attractions visited
Primary Data - Key Findings-Demand side: Within destination travel patterns
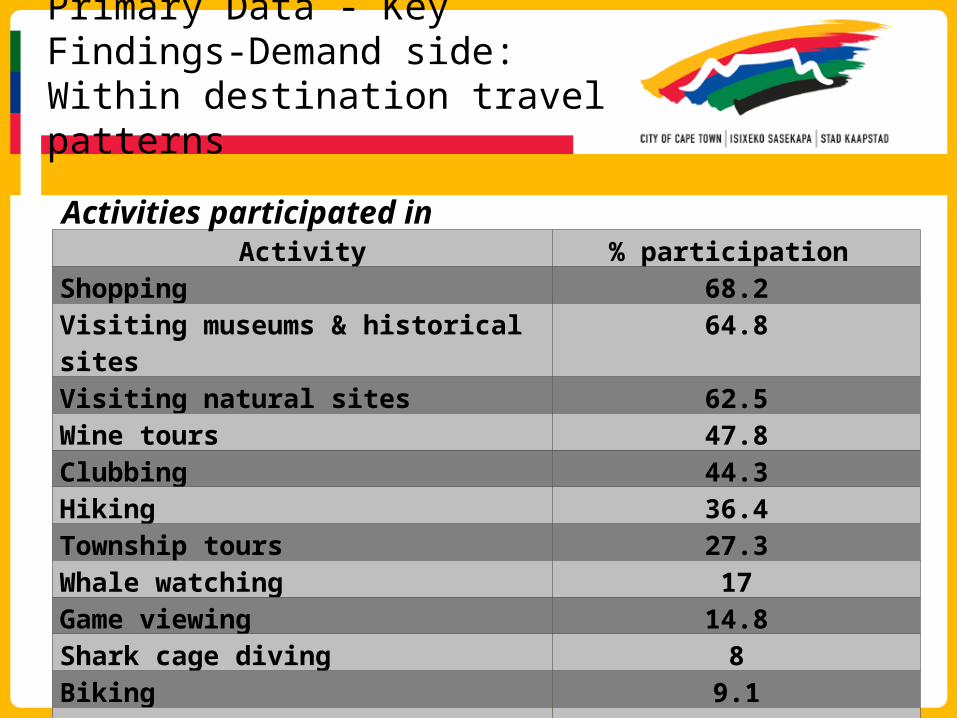
Activity % participation Shopping 68.2Visiting museums & historical sites 64.8Visiting natural sites 62.5Wine tours 47.8Clubbing 44.3Hiking 36.4Township tours 27.3Whale watching 17Game viewing 14.8Shark cage diving 8Biking 9.1Surfing 3.3
Activities participated in

Primary Data - Key Findings-Demand side: Competition
Other domestic destinations considered included:•Johannesburg (4.5%)•Garden Route (2.3%)•Mpumalanga, Limpopo and Port Elizabeth (1% each)
Other destinations considered before settling for Cape Town

Primary Data - Key Findings-Demand side:Perception and satisfaction rating
•Satisfaction always rated better than perception, implying destination far exceeds tourist expectations prior to visiting

Primary Data - Key Findings-Demand side:Importance-Performance
•On almost all (except 5) attributes destination’s performance exceeds tourist importance rating implying tourists requirements are met and exceeded•Poor performance areas include: cost, overall cleanliness, clean beds, clean bathrooms and safety & security
Tourists’ viewpoint

I-P grid for backpacking accommodation attributes: Tourists’ perspective
•Accommodation service providers perform above average on all attributes•However, they also concentrate too much and possibly waste resources on some attributes not important to tourists - attributes 8, 9, 19, 21 & 22

Comparison of supplier’s and tourists’ view of I-P of backpacking accommodation attributes
•Suppliers under-estimate both their performance on certain attributes and importance of some attributes to tourists•It is of particular importance for providers to understand what is important to their customers in order to satisfy them

Action Plan
• Stakeholder Input• Prioritise actions• Finalise Action Plan

Action Plan Review Process
Activity 11. Split into 4 groups (1 group per action)2. Discuss and respond to key group actions3. Consultant to record concerns, questions, new actions4. Overall discussion based on group summaries (and update action table, if
required)
Activity 21. Industry to rate actions as High, Medium and Low Importance (in groups)2. Industry to prioritise BIG 5 actions3. Consultant to record ratings4. Post workshop action plan adjustments and re-circulation

DEVELOPMENTAL ACTION PLANStakeholder Input
High priority actions
High priority area overall
No fill represents a low priority area
• Key colour codes:

Draft Action Plan
No. Action Designated Organisation
Evaluation
1 Establish a public-private sector backpacking working/ regulatory body (address zoning issues)
CoCT Tourism Department
• Success of the body•Periodic review of public-private sector relations
2 Hold biannual BP industry networking sessions/ workshops
CoCT Tourism Department
• Assessment of participation by industry stakeholders (public and private)
3 Establish a BP specific lodging grading and certification system based on a minimum standard approach
CoCT • Constantly evaluate number of graded facilities
Key Area 1: Industry organisation and government support

Draft Action Plan
No. Action Designated Organisation
Evaluation
4 Establish a BP SMME support assistance programme
CoCT Tourism Department in collaboration with marketing bodies
• Continual evaluation of BP trends and participation• Continual evaluation of SMME and niche sector growth
5 Develop a CoCT BP product development & growth plan
CoCT Tourism Department in collaboration with BP service providers
• Continuously assess and monitor BP product and experiences• Regularly update inventory• Continuously monitor progress of plan
Key Area 2: Development and growth
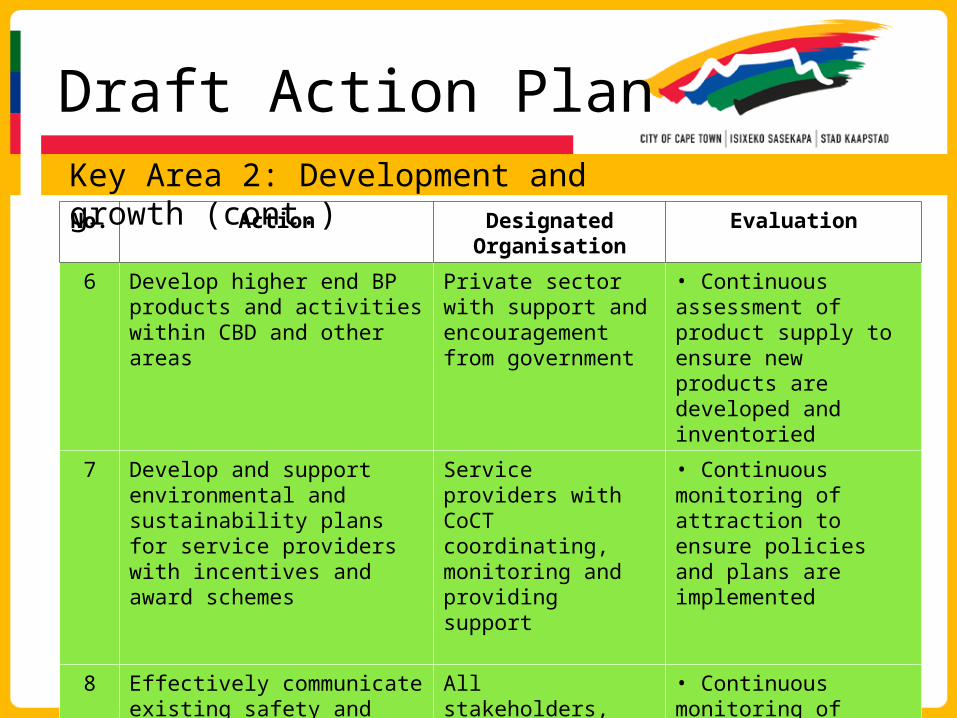
Draft Action Plan
No. Action Designated Organisation
Evaluation
6 Develop higher end BP products and activities within CBD and other areas
Private sector with support and encouragement from government
• Continuous assessment of product supply to ensure new products are developed and inventoried
7 Develop and support environmental and sustainability plans for service providers with incentives and award schemes
Service providers with CoCT coordinating, monitoring and providing support
• Continuous monitoring of attraction to ensure policies and plans are implemented
8 Effectively communicate existing safety and security programmes to tourists, BP industry and alert responsible departments
All stakeholders, CoCT, public safety dept. CoCT tourism dept. facilitating communication and action
• Continuous monitoring of tourists and stakeholder satisfaction and perceptions• Keep track and record incidences to establish trends in the long run
Key Area 2: Development and growth (cont.)

Draft Action Plan
No. Action Designated Organisation
Evaluation
9 Establish BP specific JMI’s with other African countries
CoCT destination marketing body and private sector partnerships
• Destination performance research to measure flow of BP traffic in and out of destination
10 In short-term, focus on already established markets eg. domestic, UK, Germany, Netherlands and USA
CoCT destination marketing body and private sector
• Destination performance awareness research • Continual tracking and monitoring of BP performance indicators such as hostel occupancy
11 Establish BP specific marketing programme for non-conventional CT markets and insert BP as a separate niche in all marketing toolsTarget Asian & S. American markets for language and educational tourism
CoCT destination marketing body and private sector
• Research and performance evaluation and monitoring of key indicators
Key Area 3: Marketing

Draft Action Plan
No. Action Designated Organisation
Evaluation
12 Develop and conduct trade and consumer oriented marketing programmes eg, trade shows, tour operator and agent workshops, consumer programmes, media hosting etc.
CoCT destination marketing body
• Assess success of programmes on a regular basis• Evaluate niche sector performance through performance research
13 Produce BP and youth tourism specific marketing collateral (review first to avoid overlap)Incorporate a BP specific visitor information system into existing one
CoCT destination marketing body and private sector
• Continuous evaluation and updating of collateral • Destination performance research to measure and track niche sector performance and return collateral investment
14 Support BP industry’s bid to host international conference in Cape Town in 2012
Private sector driven with CoCT support, in discussion with CTRU due to support supplied
• Successful bid
Key Area 3: Marketing (cont.)

Draft Action Plan
No. Action Designated Organisation
Evaluation
15 Participate on advisory boards of tourism departments of higher learning institutions in Cape Town
All tourism stakeholders (public and private)
• Continual assessment and participation in curricular development
16 Establish internship programmes
All tourism stakeholders, CoCT can promote and coordinate
• Assess impact of internship programme on a regular basis • Assess placement rates of interns by institutions
17 Encourage on-the-job training All tourism stakeholders (public and private)
• Continuous assessment of relevance of on-the-job training programmes
Key Area 4: Skills and human resources

THANK YOU and QUESTIONS?