Embed Size (px)
Citation preview
Independent Pricing and Regulatory Tribunal
Case study 6 — Stroke
Hospital costs and outcomes study for NSW Health
Other Industries
July 2010

Case study 6 – Stroke Hospital costs and outcomes study for NSW Health
Other Industries July 2010

ii IPART Case study 6 – Stroke
© Independent Pricing and Regulatory Tribunal of New South Wales 2010.
This work is copyright. The Copyright Act 1968 permits fair dealing for study, research, news reporting, criticism and review. Selected passages, tables or diagrams may be reproduced for such purposes provided acknowledgement of the source is included.
ISBN 978-1-921628-53-5 S9-52
The Tribunal members for this review are:
Mr James Cox, Acting Chairman and Chief Executive Officer
Ms Sibylle Krieger, Part Time Member
Inquiries regarding this document should be directed to a staff member:
Alison Milne (02) 9290 8443
Bee Thompson (02) 9290 8496
Independent Pricing and Regulatory Tribunal of New South Wales PO Box Q290, QVB Post Office NSW 1230 Level 8, 1 Market Street, Sydney NSW 2000
T (02) 9290 8400 F (02) 9290 2061
www.ipart.nsw.gov.au
Contents
Case study 6 – Stroke IPART iii
Contents
1 Introduction and executive summary 1 1.1 Why did we select stroke as one of the case studies? 4 1.2 What was the scope of the stroke case study? 4 1.3 What were the key findings of the stroke case study? 5 1.4 What are the key implications of these findings? 11 1.5 List of recommendations 12 1.6 What does the rest of this report cover? 13
2 Main types of stroke patient 14 2.1 What is a stroke and how common is it? 14 2.2 How have we categorised stroke patients for our analysis? 15 2.3 What are the main approaches for treatment of stroke? 16
3 Number and mix of patients across study hospitals 17 3.1 Number of stroke cases at each study hospital 17 3.2 Comparison of complexity of patient mix 19
4 Length of stay across study hospitals 23 4.1 Comparing lengths of stay for stroke patients 24 4.2 Patients with lengths of stay of more than 30 days 29
5 Costs of providing inpatient care 30 5.1 Cost of nursing staff in wards 30 5.2 Imaging costs 37 5.3 Pathology costs 40
6 Configurations of care 43 6.1 Stroke units 44 6.2 Rapid notification and bypass protocols with NSW Ambulance Service 44 6.3 Emergency departments 45 6.4 Use of Tissue Plasminogen Activator (tPA) 46 6.5 Clot retrieval 47 6.6 Rehabilitation 47
Contents
iv IPART Case study 6 – Stroke
7 Outcome, safety and quality indicators 49 7.1 How we developed a set of clinical indicators 49 7.2 Analysing indicators and risk-adjusting for patient characteristics 50 7.3 List of clinical indicators for stroke and their availability 52
Appendix 57 A Full list of recommendations from main report 59 B Risk-adjusted indicator provided by NSW Health 69
Glossary 70
1 Introduction and executive summary
Case study 6 – Stroke IPART 1
1 Introduction and executive summary
NSW Health is currently coordinating a project that ultimately aims to improve clinical practice and efficiency consistently across the NSW hospital system. The project involves 6 components, and is designed to enable development of a methodology that makes better use of available data to compare patient mix, costs, clinical practice and outcomes and which can then be applied across other hospitals to improve performance. (See Box 1.1 for more information.)
NSW Health asked the Independent Pricing and Regulatory Tribunal of NSW (IPART) to conduct a costs and outcomes study that encompasses 3 components of this larger project. The aim of the study was to provide information and analysis that can be used by clinical experts to better understand the variation in clinical practice in NSW hospitals, and the extent to which this variation can lead to differences in hospital costs and clinical outcomes.
IPART’s study involved comparing costs, configurations of care and outcomes in 5 selected NSW hospitals:
Royal Prince Alfred Hospital (RPAH)
Royal North Shore Hospital (RNSH)
John Hunter Hospital (JHH)
Bankstown-Lidcombe Hospital (BLH), and
Gosford Hospital (GH).
To do this, we analysed management practices at the hospital-wide level, and did detailed case studies of 11 specific clinical areas. As costs, configurations of care and relevant indicators of outcome vary significantly depending on the condition of the patient and/or the procedure undertaken, these case studies allowed us to compare the hospitals on a more like-with-like basis. This document discusses our findings in one of these 11 clinical areas – stroke. (See Box 1.2 for the full list of clinical areas we examined, how they were selected, and how we conducted the case studies.)
1 Introduction and executive summary
2 IPART Case study 6 – Stroke
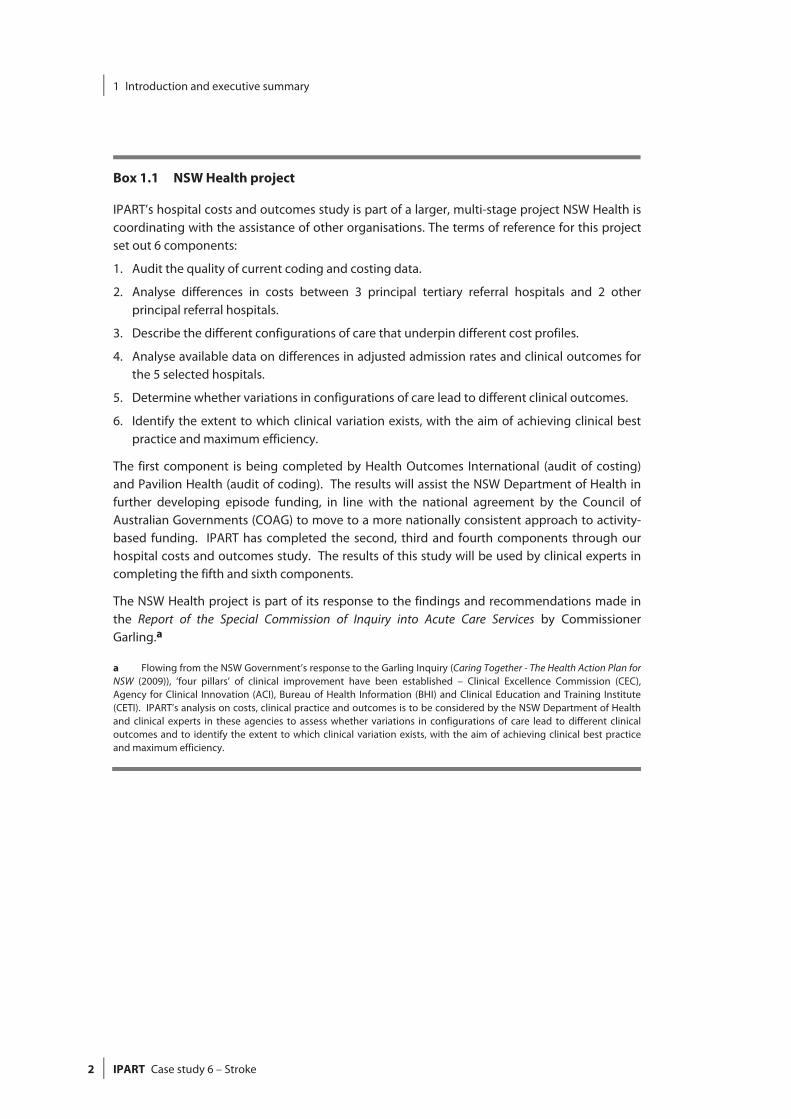
Box 1.1 NSW Health project
IPART’s hospital costs and outcomes study is part of a larger, multi-stage project NSW Health is coordinating with the assistance of other organisations. The terms of reference for this project set out 6 components:
1. Audit the quality of current coding and costing data.
2. Analyse differences in costs between 3 principal tertiary referral hospitals and 2 other principal referral hospitals.
3. Describe the different configurations of care that underpin different cost profiles.
4. Analyse available data on differences in adjusted admission rates and clinical outcomes for the 5 selected hospitals.
5. Determine whether variations in configurations of care lead to different clinical outcomes.
6. Identify the extent to which clinical variation exists, with the aim of achieving clinical bestpractice and maximum efficiency.
The first component is being completed by Health Outcomes International (audit of costing)and Pavilion Health (audit of coding). The results will assist the NSW Department of Health in further developing episode funding, in line with the national agreement by the Council of Australian Governments (COAG) to move to a more nationally consistent approach to activity-based funding. IPART has completed the second, third and fourth components through ourhospital costs and outcomes study. The results of this study will be used by clinical experts incompleting the fifth and sixth components.
The NSW Health project is part of its response to the findings and recommendations made in the Report of the Special Commission of Inquiry into Acute Care Services by Commissioner Garling.a
a Flowing from the NSW Government’s response to the Garling Inquiry (Caring Together - The Health Action Plan for NSW (2009)), ‘four pillars’ of clinical improvement have been established – Clinical Excellence Commission (CEC), Agency for Clinical Innovation (ACI), Bureau of Health Information (BHI) and Clinical Education and Training Institute (CETI). IPART’s analysis on costs, clinical practice and outcomes is to be considered by the NSW Department of Health and clinical experts in these agencies to assess whether variations in configurations of care lead to different clinicaloutcomes and to identify the extent to which clinical variation exists, with the aim of achieving clinical best practiceand maximum efficiency.
1 Introduction and executive summary
Case study 6 – Stroke IPART 3
Box 1.2 IPART’s case studies
To compare costs, configurations of care and outcomes in the 5 study hospitals, we focused on 11 specific conditions or procedures in detail (as well as undertaking a broad, hospital-wide analysis). These conditions/procedures are:
Hip joint replacement
Major chest procedures
Breast surgery
Cholecystectomy
Appendicectomy
Stroke
Cardiology – stents, pacemakers and defibrillators
Tracheostomy, or ventilation for greater than 95 hours
Cataract/lens procedures
Hysterectomy, and
Obstetric delivery.
In selecting these conditions/procedures, and the relevant indicators to compare for each, we were advised by a clinical consultant (Dr Paul Tridgell) and a clinical reference group (Professor Bruce Barraclough, Dr Anthony Burrell, Dr Patrick Cregan, Professor Phillip Harris, Professor Clifford Hughes, Professor Brian McCaughan, Professor Peter McClusky, Dr Michael Nicholl, Professor Ron Penny, Professor Carol Pollock and Dr Hunter Watt).
The case studies were selected to provide a range of surgical procedures and a range of medical conditions that met one or more of the following criteria:
high volumes
high reported costs
high variability in reported costs
apparent differences in clinical practice, or
a range of models of care.
To conduct the case studies, we visited each of the hospitals and spoke with a range of staff, including clinical, nursing, management, finance, coding and administrative staff. We also collected a range of clinical and financial data from NSW Health, relevant area health services and hospitals. By analysing the data and speaking with clinical experts, we established the most suitable data available for comparing hospitals on a like-with-like basis.
For further information on our methodology and broad findings on costs, outcomes and configurations of care, see our main report, NSW Health costs and outcomes study by IPART for selected NSW hospitals. Our detailed findings on the other case study areas can be found in our reports on each area.
1 Introduction and executive summary
4 IPART Case study 6 – Stroke
1.1 Why did we select stroke as one of the case studies?
Stroke was selected as one of the clinical areas for detailed study because:
It is an example of a high volume, acute medical service.1
It is a good example of different ways to count the length of stay. Hospitals differ in how they count episodes and record ‘type changes’ between the acute and rehabilitation stages.
Stroke patients have a significant impact on hospital occupancy (in terms of bed days more than admissions).
The timeliness and way that stroke is assessed and treated are critical determinants of stroke outcomes.
1.2 What was the scope of the stroke case study?
The stroke case study compared the length of stay, costs, configurations of care and outcomes related to treating stroke patients. We used diagnostic related groups (DRGs) to define the procedures and identify the data included in the scope of the case study (see Table 1.1).
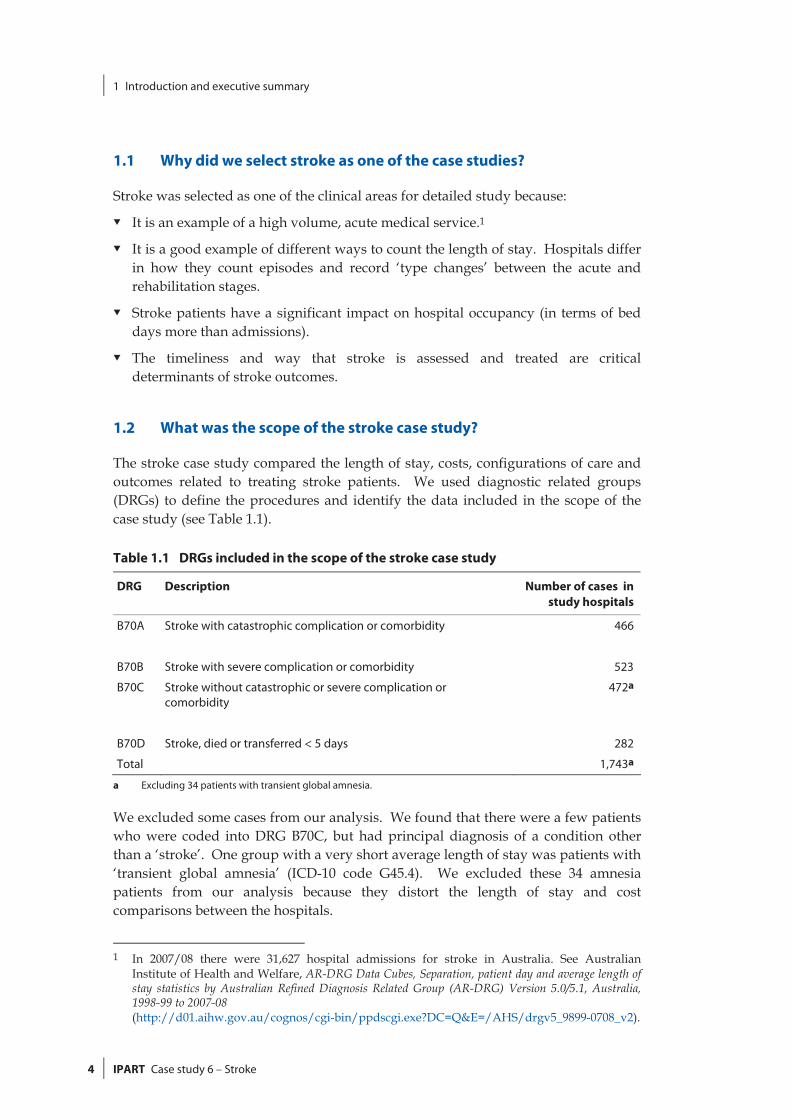
Table 1.1 DRGs included in the scope of the stroke case study
DRG Description Number of cases in study hospitals
B70A Stroke with catastrophic complication or comorbidity
466
B70B Stroke with severe complication or comorbidity 523
B70C Stroke without catastrophic or severe complication or comorbidity
472a
B70D Stroke, died or transferred < 5 days 282
Total 1,743a
a Excluding 34 patients with transient global amnesia.
We excluded some cases from our analysis. We found that there were a few patients who were coded into DRG B70C, but had principal diagnosis of a condition other than a ‘stroke’. One group with a very short average length of stay was patients with ‘transient global amnesia’ (ICD-10 code G45.4). We excluded these 34 amnesia patients from our analysis because they distort the length of stay and cost comparisons between the hospitals.
1 In 2007/08 there were 31,627 hospital admissions for stroke in Australia. See Australian
Institute of Health and Welfare, AR-DRG Data Cubes, Separation, patient day and average length of stay statistics by Australian Refined Diagnosis Related Group (AR-DRG) Version 5.0/5.1, Australia, 1998-99 to 2007-08 (http://d01.aihw.gov.au/cognos/cgi-bin/ppdscgi.exe?DC=Q&E=/AHS/drgv5_9899-0708_v2).
1 Introduction and executive summary
Case study 6 – Stroke IPART 5
For most of our analysis we also excluded 282 patients who died or were transferred to another hospital in less than 5 days (DRG B70D). We did this because some hospitals count (as admissions) patients who die soon after arriving at hospital with a stroke, while others don’t. Excluding DRG B70D avoids this counting issue.
Unless specified otherwise in this case study, the data we analysed related to the 12-month period from 1 July 2008 to 30 June 2009.
1.3 What were the key findings of the stroke case study?
To compare the costs, configurations of care and outcomes of treatment for stroke at the study hospitals, we collected, analysed and compared data on:
the type, number and mix of stroke patients at each hospital
the average length of stay for these patients at each hospital
selected costs, or major clinical resources used to provide acute inpatient care for these patients at each hospital
the configurations of care used to provide and manage stroke patient care at each hospital
indicators of outcome, safety and quality of care for stroke patients for each hospital.
Our key findings are summarised below.
1.3.1 Type, number and mix of patients
A stroke occurs where a blood vessel in the brain becomes blocked or bursts. There are 2 main types of strokes, namely ischaemic strokes (a blood clot in blood vessel) and haemorrhagic (a burst blood vessel). The distinction between the 2 types of strokes is important because treatment options are different for the 2 types of strokes.
We were unable to separately analyse ischaemic and haemorrhage strokes because the cause of the stroke was unspecified for about 25% of patients. Instead, we used the DRG system to compare costs and outcomes. The DRG system classifies patients according to the degree of complication or comorbidity (catastrophic, severe or not catastrophic/severe). However, we note that hospitals have significantly different proportions of patients in the different DRGs and we do not know to what extent coding practices contribute to this difference in distribution.
1 Introduction and executive summary
6 IPART Case study 6 – Stroke
In particular, we found that BLH had a significantly higher proportion of patients in the most complex DRG than any of the other hospitals. One possible reason for this is that stroke patients at BLH are on average older than at the other hospitals. Another possibility is that coding practices differ between the hospitals. A third possibility is that BLH uses less medication (tPA) or surgical intervention (ie, interventional radiology) to dissolve or remove clots than the other hospitals.2 We could not examine this possibility because tPA administration is not coded as a procedure in the hospital data set.
We found that the vast majority of stroke patients are admitted through the emergency department and between 4% and 15% of patients are transferred in from other hospitals. We also found that patients in the most complex DRG (B70A) were on average older than patients in the less complex categories.
1.3.2 Average length of stay
Our analysis indicates that the measure often used in the National Hospital Cost Data Collection (NHCDC) and DRG benchmarking – the average ‘acute episode length of stay’, which is the length of an acute episode – is not a consistent basis for comparing length of stay for stroke patients. This is because of differences in the way hospitals reclassify patients’ care from ‘acute’ to ‘rehabilitation’ care and because of differences in access to rehabilitation facilities. Our analysis indicates that for length of stay comparisons to be meaningful:
the length of stay needs to include all consecutive episodes (acute, rehabilitation and other) at the study hospital, plus the length of related stays at other hospitals, and
the main patient subgroups (ie, DRGs) need to be compared separately.
For our analysis, we have included three alternative measures of length of stay:
LOS1 – acute episode length of stay in study hospital
LOS2 – total stay in study hospital including acute episode and other consecutive episodes for stroke DRG
LOS3 – total stay in study hospital (LOS2) plus length of stay for one prior hospital stay (transfer in) and one subsequent hospital stay (transfer out).
For each DRG, we found that there was significant variation in the acute episode length of stay (LOS1), but far less variation in the length of stay when total hospitalisation is measured (LOS3). This was mainly because LOS3 includes rehabilitation care and the hospitals differ in the way they arrange rehabilitation care.
2 Only RNSH and RPAH remove clots surgically.
1 Introduction and executive summary
Case study 6 – Stroke IPART 7
We found that differences in the average ‘acute episode length of stay’ (LOS1) across the study hospitals are largely due to differences in the way the hospitals reclassify patients from acute to rehabilitation care, rather than differences in clinical practice. In particular, we found that BLH has a long episode length of stay (LOS1) because a significant amount of rehabilitation occurs in the acute ward and the type change to “rehabilitation” occurs only when a patient physically moves to a rehabilitation ward. We also found that differences in the hospital length of stay (LOS2) are largely due to whether rehabilitation occurs on-site or at other rehabilitation facilities.
1.3.3 Costs of inpatient care
To compare the costs related to the case study areas at the study hospitals, we examined the use of a selection of clinical resources used directly for patient care in that area. For stroke, the main clinical resources we examined were nursing staff in wards, imaging and pathology. We had aimed to also estimate medical staff costs and pharmacy costs for this case study, but were unable to obtain consistent comparisons within the timeframe for this review.3 We did not include allied health costs in our data collection or analysis.
Cost of nursing staff in wards
We estimated nursing costs for the acute episode only. Therefore results need to be interpreted taking into account differences in LOS1 and LOS3 for each hospital. This is particularly important for stroke for patients that require rehabilitation (mainly those in DRGs B70A4 and B70B5).
We calculated and compared the nursing cost for DRGs B70B and B70C.6 We excluded DRG B70A because of the complexity introduced into the analysis by time spent in Intensive Care Units (ICU) and the different structures for ICU and high dependency units at the different hospitals. These differences mean that we could not calculate comparable costs across the study hospitals for this DRG. We also excluded DRG B70D7, for the reasons discussed above.
We found that average length of stay and nursing hours per patient day (ie, the staff-to-patient ratio) are the main drivers for nursing costs at the study hospitals. Hospitals with shorter stays or lower staff-to-patient ratios had lower nursing costs. The proportions of Enrolled Nurses (ENs) and Assistants in Nursing (AINs) in their staffing mix had only a small impact on nursing costs. We found that JHH had the lowest staff-to-patient ratio and the lowest nursing cost per patient day, while RPAH had the highest staff-to-patient ratio and the highest nursing cost per patient day.
3 Medical staff costs and pharmacy are discussed in Chapters 9 and 14 of our main report, NSW
Health costs and outcomes study by IPART for selected NSW hospitals. 4 Stroke with catastrophic complication or comorbidity. 5 Stroke with severe complication or comorbidity. 6 Stroke without catastrophic or severe complication or comorbidity. We excluded patients with a
diagnosis of transient global amnesia. 7 Stroke patients died or were transferred within 5 days.
1 Introduction and executive summary
8 IPART Case study 6 – Stroke
The hospitals use inpatient fractions (IFRACs) to allocate staff time to acute care and other staff responsibilities. We found that nursing costs are highly sensitive to the IFRAC the hospitals apply to them. When all nursing costs are attributed to inpatient care (ie, IFRAC=1), RNSH’s costs increase the most because the IFRACs used at this hospital are the lowest.
Imaging and pathology costs
We found that imaging costs vary between the hospitals, with RNSH making the most use of imaging and BLH making the least use of imaging.8 We also found that imaging costs vary less than pathology costs by DRG because stroke patients all have CT scans or MRIs, regardless of their DRG classification.
We found that pathology costs are strongly related to the DRG of the patients, with expenditure significantly higher in the most complex DRG compared with the least complex DRG. However, we note that small coding differences between the hospitals could shift patients between the DRGs and change some of the measures of relative pathology use. We found that pathology costs are on average highest at BLH and lowest at JHH.
National Hospital Cost Data Collection
The NHCDC reports estimates of average hospital costs based on data it collects from hospitals around Australia.9 In this study, we had access to the study hospitals’ provisional de-identified patient-level data for 2008/09, as well as the overall averages publicly reported by the NHCDC for different hospital groupings in 2007/08.10 The final NHCDC estimates for study hospitals for 2008/09 became available towards the end of our study. We compared these to the provisional costs and found that some of the costs had changed substantially. Given the limited time available, we used the final costs only where these were substantially different from the provisional costs.
We were able to compare study hospitals’ NHCDC estimates with our estimates of nursing, pathology and imaging costs. For pathology we used the final NHCDC costs. We found that the direct nursing costs from the NHCDC are higher than our costs for all hospitals. The costs for GH and BLH are particularly high compared with our costs. We found a far higher degree of consistency in the hospitals’ use of pathology for diagnostic purposes than reflected in the NHCDC. In particular, the NHCDC pathology costs for RPAH and BLH are significantly higher than both our estimated pathology costs and the other hospitals’ NHCDC costs. We believe that
8 BLH does not currently have MRI facilities on-site, and must transport patient to Liverpool
Hospital if MRI scans are required for further diagnosis or treatment. However, we understand that there is a firm proposal for an MRI at BLH and planning is well underway.
9 In NSW, these cost estimates are often compiled by area health services, rather than individual hospitals.
10 Commonwealth Department of Health and Ageing, National Hospital Cost Data Collection, Round 12, 2007-2008, September 2009.
1 Introduction and executive summary
Case study 6 – Stroke IPART 9
our costs better reflect the different usage patterns of pathology because we have used a consistent methodology to calculate them, based on clinical information. The NHCDC imaging costs show less variation than our cost for the combined DRGs, but more variation between the DRGs.
1.3.4 Configurations of care
Strokes are medical emergencies. Two important objectives in stroke treatment are early diagnosis of the type of stroke as either an ischaemic stroke or a haemorrhagic stroke (often based on a CT scan) and early commencement of treatment. The treatment options and pathways for the 2 types of stroke are different.
We identified 5 major differences in the way the study hospitals managed and provided care for stroke patients, comprising differences in:
Arrangements with the NSW Ambulance Service to minimise delays.
How effectively the emergency departments worked to minimise delays.
The administration of clot-dissolving medication (tPA).
The use of surgery to remove clots.
The way rehabilitation is organised.
All the study hospitals have had specialised stroke units for acute stroke patient care since about 2003. However, they differ in size, opening hours and the care they provide.
Rapid notification and bypass protocols with NSW Ambulance Service
We found that JHH and GH have bypass arrangements with NSW Ambulance Service to deliver some stroke patients to the stroke unit with minimum delay. As a consequence of these arrangements, as well as less traffic congestion, JHH and GH have higher rates of tPA administration than any of the other study hospitals. (We note however that the use of tPA for stroke is not universally accepted because it carries a risk of complications due to bleeding.)
None of the other hospitals have rapid notification or emergency department bypass protocols with the NSW Ambulance Service, and delays occur in getting patients to the stroke units.
1 Introduction and executive summary
10 IPART Case study 6 – Stroke
Emergency departments
We found that the emergency departments at GH and, particularly, JHH work well with the stroke unit to minimise delays (for those patients who are eligible for bypass arrangements). At RNSH the stroke unit is notified immediately if a suspected stroke patient arrives during standard working hours, and staff members then go to the emergency department to do the assessment. RPAH has a very busy emergency department, and this may cause delays for stroke patients who might be eligible for tPA treatment. These delays arise mainly because ambulances are sometimes redirected to other hospitals when RPAH’s emergency department is too busy.
Use of tPA and clot retrieval
We understand that senior clinicians at BLH have differences of opinion regarding the risks and benefits of using tPA for stroke, and that this may be a factor limiting the use of this treatment option. We found that only RPAH and RNSH remove blood clots surgically.
Rehabilitation
We found that there were differences in the way hospitals arrange rehabilitation services for patients that need it. At BLH, almost all rehabilitation occurs on-site, beginning in the acute ward. The other hospitals transfer most or all their patients to other facilities for rehabilitation. Shortages of places in these rehabilitation facilities can lead to longer than necessary stays in acute wards. One specialist raised the possibility that a significant component of rehabilitation could be provided in the home, if resources were shifted to this setting.
1.3.5 Outcome, safety and quality indicators
The terms of reference for this study required us to analyse available data on differences in clinical outcomes across the 5 study hospitals. However, while there are a number of safety and quality indicators being collected locally, at the state level and through clinical registries, there are few clinically agreed outcome indicators. As such, we found that data on only a few indicators of clinical outcomes are collected consistently across hospitals, or on a state-wide (or national) basis. Therefore, we worked with clinical experts to establish a set of outcome, safety and quality indicators that are clinically relevant, and for which we could feasibly obtain data in the timeframe for our study.
We approached the National Stroke Research Institute (NSRI) to help us collect the data for these indicators. The NSRI confirmed that they had most of the required data. However, we needed permission from the National Stroke Foundation and the hospitals to gain access to the data and were unable to obtain the information in time for our review. We recommend that NSW Health pursue the collection of this data. We also note that indicators for stroke should be nationally standardised.
1 Introduction and executive summary
Case study 6 – Stroke IPART 11
We obtained one indicator from NSW Health, namely the 6-month survival rate for stroke patients adjusted for age, sex, comorbidity (using the Charlson index), and socio-economic status. In the 3-year period, 2005/06 to 2007/08, there were 5,408 hospital admissions for the 5 hospitals for stroke. The overall crude 6-month survival rate was 726.9 per 1,000. NSW Health calculated and provided risk-adjusted odds ratios for these rates. There were no statistically significant differences between the study hospitals’ risk-adjusted 6-month-survival rates.
1.4 What are the key implications of these findings?
Combining all stroke patients for comparison is misleading
Our analysis of patient data for the 4 DRGs indicates that there are wide variations in the severity of the stroke in the patient cohort, which impacts on costs and outcomes. Therefore, at a minimum, comparisons should be made at the individual DRG level.
Length of stay and cost analysis needs to include all episodes
This case study and some other case studies (eg, hips), demonstrate the need to link the episodes for each patient, so that the full patient journey is considered (including stays in other hospitals or facilities). The AIHW ‘linkage key’ can be used to consider the full journey of the patient from hospital to hospital. Ideally, a unique patient identifier could ultimately be used.
Improvements can be made to coding and classification practices
We identified three areas where improvements in diagnosis classification and coding practices could improve the quality of outcome information and the accuracy of episode-based cost comparisons and funding.
Firstly, we believe that it would be desirable for hospitals to reduce the proportion of stroke patients with a principal diagnosis of ’stroke, not specified as haemorrhage or infarction‘(ICD-10 code I64). Reducing the proportion of unclassified cases would allow ischaemic and haemorrhage strokes to be separately analysed.
Secondly, we believe the tPA administration should be coded as a procedure. This would help to monitor and evaluate the outcomes associated with the use of this medication and treatment for ischaemic strokes.
Thirdly, we believe that a consistent approach to ‘type changes’ would significantly improve the comparability of episode costs between hospitals. This is particularly important for episode based funding for hospitals.
1 Introduction and executive summary
12 IPART Case study 6 – Stroke
Improvements can be made to the configuration of care
We believe that there may be scope for the Sydney based hospitals to establish better protocols or arrangements with the NSW Ambulance Service to deliver suspected stroke patients to the most appropriate Stroke Unit with minimum delay. We also believe that it might be possible and useful to combine NSW Ambulance Service data on time of emergency call and response time with hospital patient data or imaging CT data. This could provide useful information on the time that has elapsed since an ischaemic stroke, which in some instances would influence the appropriate treatment for some patients (since some stroke treatment protocols depend on the time that has elapsed since a stroke occurred). It could also be used to monitor how the NSW Ambulance Service and hospitals are working together to minimise delays. It will also provide useful data for outcome indicators.
We also believe there may be scope for developing consistent guidelines for tPA use for stroke. We believe that the hospitals should code tPA administration as a procedure so that the rates of administration and the outcomes can be more accurately measured.
Given the shortage of rehabilitation places, we believe that NSW Health should investigate the costs and benefits of providing more rehabilitation care in the home setting.
1.5 List of recommendations
1 That NSW Health considers ways to reduce the proportion of stroke patients coded with a principal diagnosis of ’stroke, not specified as haemorrhage or infarction‘(ICD10 code I64). 15
2 That NSW Health arranges for appropriate clinical expert groups to consider developing consistent guidelines for the administration of tPA. 47
3 That NSW Health considers including tPA administration as a procedure in coding standards. 47
4 That NSW Health considers ways to improve transfers of suspected stroke patients to stroke units with minimum delay, including consultation with the Ambulance Service and Emergency Departments. 47
5 That NSW Health investigates whether it is useful and possible to combine Ambulance Service data on response time with hospital patient data to monitor time from call to ambulance to arrival at an appropriate hospital. 47
6 That NSW Health arranges for appropriate clinical expert groups to consider the costs and benefits of providing more rehabilitation care in the home. 48
1 Introduction and executive summary
Case study 6 – Stroke IPART 13
7 That NSW Health pursues the collection of the data on outcome indicators from the National Stroke Research Institute. 53
1.6 What does the rest of this report cover?
The rest of this report discusses the findings of the stroke case study in more detail:
Chapters 2 and 3 discuss the main types of stroke patients the study identified, and compare the number and mix of these types of patients at the study hospitals.
Chapter 4 compares the length of stay for the different types of stroke patients at the study hospitals, and describes the method we used to compare length of stay on a consistent basis.
Chapter 5 describes how we analysed the costs of care for stroke patients by identifying the main clinical resources used to provide inpatient care, then estimating and comparing the level of each resource used at the study hospitals. It also compares our cost estimates with estimates based on the provisional or final data reported to NSW Health as part of the NHCDC.
Chapter 6 compares the configurations of care for stroke patients at the study hospitals and highlights key differences.
Chapter 7 discusses the indicators of outcome, safety and quality for stroke we identified as clinically meaningful. It then compares the available data on these indicators across the study hospitals.
The appendices contain the complete list of recommendations for our hospital costs and outcomes study, more detailed information on the data sources for the risk-adjusted outcome indicators and a glossary.
2 Main types of stroke patient
14 IPART Case study 6 – Stroke
2 Main types of stroke patient
To meaningfully compare data on the costs, configurations of care and outcomes for a particular condition or procedure, the patients to which the data relate must be reasonably similar – to allow ‘like with like’ comparisons. As Chapter 1 discussed, we used the 4 DRGs to identify clinical and financial data related to patients who had been treated for stroke at the study hospitals. We found that the DRG classifications adequately capture like-with-like patients, after excluding some short stay patients from DRG B70C11. We also excluded DRG B70D12 from much or our analysis to avoid different counting practices when patients die soon after arrival at hospital.
The sections below discuss the different types of stroke and explain why and how we have used the DRG classifications to make like-with-like comparisons. We also discuss the main approaches to treatment for stroke.
2.1 What is a stroke and how common is it?
Stroke is the second leading cause of disability in Australia and the third leading cause of death13. In 2007/08 there were 31,627 hospital admissions for stroke in Australia.14
A stroke occurs where a blood vessel in the brain becomes blocked or bursts. Strokes mean that oxygen can no longer reach the brain cells in the damaged area. They can be fatal, but more commonly they are disabling. The effects of a stroke vary depending on which part of the brain is damaged. A stroke may cause weakness or numbness down one side of the body, difficulties in speaking and thinking clearly, emotional problems and partial loss of vision.
There are two main types of strokes:
1. Ischaemic – blood clot in blood vessel.
2. Haemorrhagic - burst blood vessel.
11 Stroke without catastrophic or severe complication or comorbidity. 12 Stroke patients died or were transferred within 5 days. 13 NSW Department of Health Website at http://www.health.nsw.gov.au/gmct/stroke/index.asp 14 Australian Institute of Health and Welfare (AIHW) Data Cubes,
(http://d01.aihw.gov.au/cognos/cgi-bin/ppdscgi.exe?DC=Q&E=/AHS/drgv5_9899-0708_v2).
2 Main types of stroke patient
Case study 6 – Stroke IPART 15
Stroke is a medical emergency. It is important for people who have had a stroke or who are suspected of having a stroke to get to a hospital as soon as possible. It is also important for clinicians to identify the type of stroke as soon as possible, because the immediate treatment options are different. Specifically, ischaemic stroke can be treated with medication to reduce clotting (eg, tPA, aspirin) or by surgically removing the clot.
2.2 How have we categorised stroke patients for our analysis?
We wanted to separately analyse patients with ischaemic and haemorrhagic strokes. However, we found that 25% of the patients in the stroke DRGs had a principal diagnosis of ’stroke, not specified as haemorrhage or infarction15‘ (ICD-10 code I64). This high percentage of unclassified cases means that we were unable to separately analyse ischaemic and haemorrhagic strokes.
Instead, we used the DRG system which classifies patients according to complication or comorbidity (catastrophic, severe or not catastrophic/severe). However, we note that hospitals have significantly different proportions of patients in the different DRGs and we do not know to what extent coding practices contribute to this difference in distribution.
We excluded some cases from our analysis. We found that there were a few patients who were coded into DRG B70C16, but had principal diagnosis of a condition other than a ‘stroke’. One group with a very short average length of stay was patients with ‘transient global amnesia’ (ICD-10 code G45.4). We excluded these 34 amnesia patients from our analysis because they distorted the length of stay and cost comparisons between the hospitals.17
For most of our analysis we also excluded 282 patients who died or were transferred to another hospital in less than 5 days (DRG B70D). We did this because some hospitals count (as admissions) patients who die soon after arriving at hospital with a stroke, while others don’t. If we had included this DRG we would have distorted the length of stay and cost comparisons between the hospitals, mainly because of the counting differences between the hospitals but also because of the short lengths of stay in this DRG.
Recommendation
1 That NSW Health considers ways to reduce the proportion of stroke patients coded with a principal diagnosis of ’stroke, not specified as haemorrhage or infarction‘(ICD10 code I64).
15 An infarction is the process of tissue death due to an interruption in the blood supply. 16 Stroke without catastrophic or severe complication or comorbidity. 17 The average length of stay for these patients varied between 1 day at RPAH and JHH and 3.4
days at GH. RNHS had the most cases (11) and BLH had the least (2).
2 Main types of stroke patient
16 IPART Case study 6 – Stroke
2.3 What are the main approaches for treatment of stroke?
For the majority of patients with a stroke, treatment is supportive care to prevent complications like aspiration (food into the lungs) and pressure sores.
For patients who have had an ischaemic stroke (due to a blood clot), roughly 10% to 15% arrive in time to use a drug to dissolve the clot (tPA). Other patients are put on medications to reduce clotting (Heparin, aspirin). For a very small number of these patients it may be appropriate to try to remove the clot surgically, by passing a wire into the clot through the blood vessels and pulling it out.
For the vast majority of patients with a haemorrhagic stroke, treatment is supportive care. For a small number it may be appropriate to perform surgery to reduce the pressure on the brain.
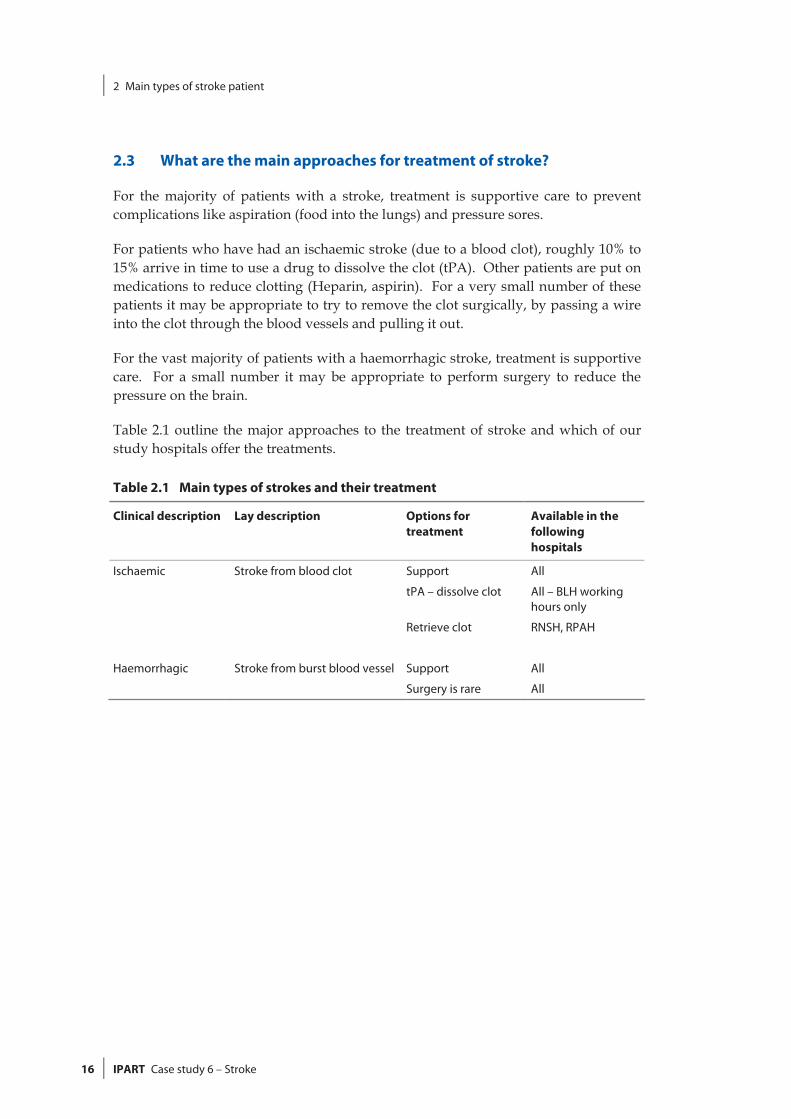
Table 2.1 outline the major approaches to the treatment of stroke and which of our study hospitals offer the treatments.
Table 2.1 Main types of strokes and their treatment
Clinical description Lay description Options for treatment
Available in the following hospitals
Ischaemic Stroke from blood clot Support All
tPA – dissolve clot All – BLH working hours only
Retrieve clot RNSH, RPAH
Haemorrhagic Stroke from burst blood vessel Support All
Surgery is rare All
3 Number and mix of patients across study hospitals
Case study 6 – Stroke IPART 17
3 Number and mix of patients across study hospitals
Once we had established that we could use the DRG classifications to make meaningful comparison of the costs, configurations of care and outcomes across the study hospitals, we identified the total number of stroke cases at each hospital during the study period, and compared the proportions of cases that fell into each DRG. We also compared emergency department admissions, transfers in from other hospitals and transfers out to other hospitals. Finally, we compared average patient age in each DRG.
We found that BLH had a significantly higher proportion of patients in the most complex DRG than any of the other hospitals. This is significant, given other findings (discussed in Chapters 3 and 4) that patients in this DRG were associated with longer average length of stay, greater nursing intensity and higher diagnostic costs at all hospitals.
The sections below discuss our analysis of patient numbers and mix in more detail.
3.1 Number of stroke cases at each study hospital
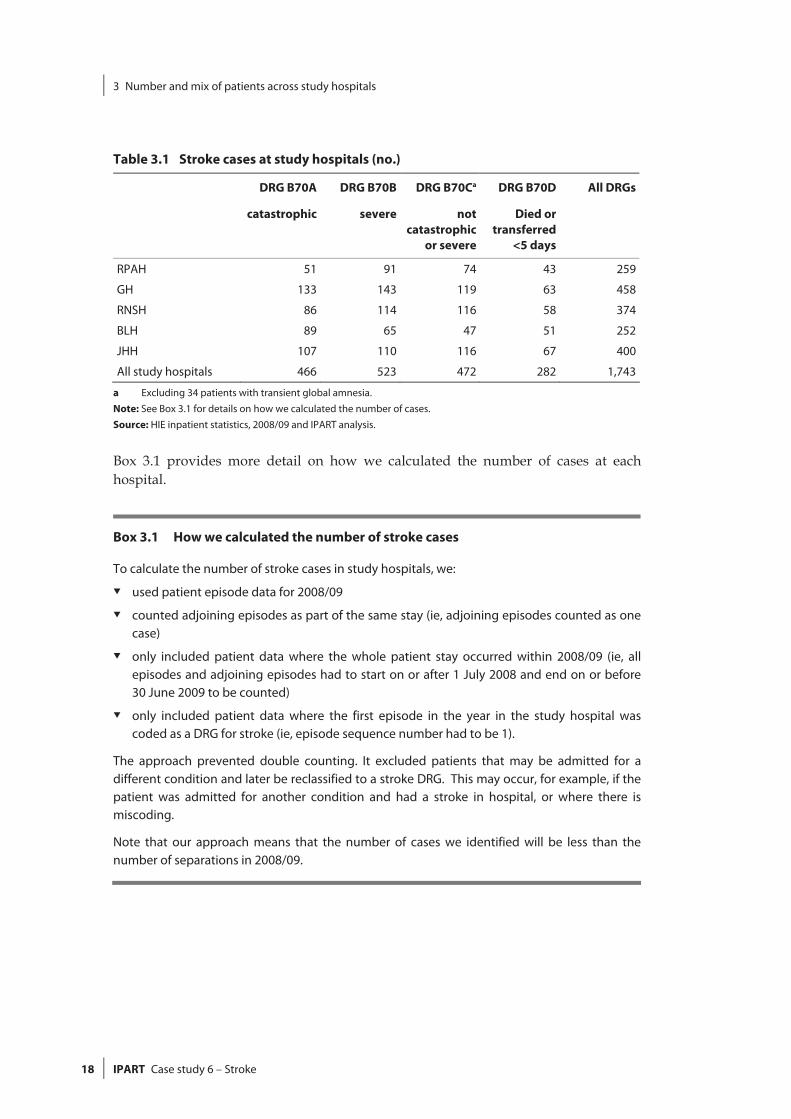
Our data indicate that the 5 study hospitals had a total of 1,743 stroke cases during the study period.18 They also show that each hospital treated a fairly large number of cases (see Table 3.1).
18 The total excludes 34 cases of transient global amnesia. All are in DRG B70C.
3 Number and mix of patients across study hospitals
18 IPART Case study 6 – Stroke
Table 3.1 Stroke cases at study hospitals (no.)
DRG B70A
catastrophic
DRG B70B
severe
DRG B70Ca
not catastrophic
or severe
DRG B70D
Died or transferred
<5 days
All DRGs
RPAH 51 91 74 43 259
GH 133 143 119 63 458
RNSH 86 114 116 58 374
BLH 89 65 47 51 252
JHH 107 110 116 67 400
All study hospitals 466 523 472 282 1,743
a Excluding 34 patients with transient global amnesia. Note: See Box 3.1 for details on how we calculated the number of cases.
Source: HIE inpatient statistics, 2008/09 and IPART analysis.
Box 3.1 provides more detail on how we calculated the number of cases at each hospital.
Box 3.1 How we calculated the number of stroke cases
To calculate the number of stroke cases in study hospitals, we:
used patient episode data for 2008/09
counted adjoining episodes as part of the same stay (ie, adjoining episodes counted as onecase)
only included patient data where the whole patient stay occurred within 2008/09 (ie, allepisodes and adjoining episodes had to start on or after 1 July 2008 and end on or before30 June 2009 to be counted)
only included patient data where the first episode in the year in the study hospital wascoded as a DRG for stroke (ie, episode sequence number had to be 1).
The approach prevented double counting. It excluded patients that may be admitted for adifferent condition and later be reclassified to a stroke DRG. This may occur, for example, if the patient was admitted for another condition and had a stroke in hospital, or where there is miscoding.
Note that our approach means that the number of cases we identified will be less than thenumber of separations in 2008/09.
3 Number and mix of patients across study hospitals
Case study 6 – Stroke IPART 19
3.2 Comparison of complexity of patient mix
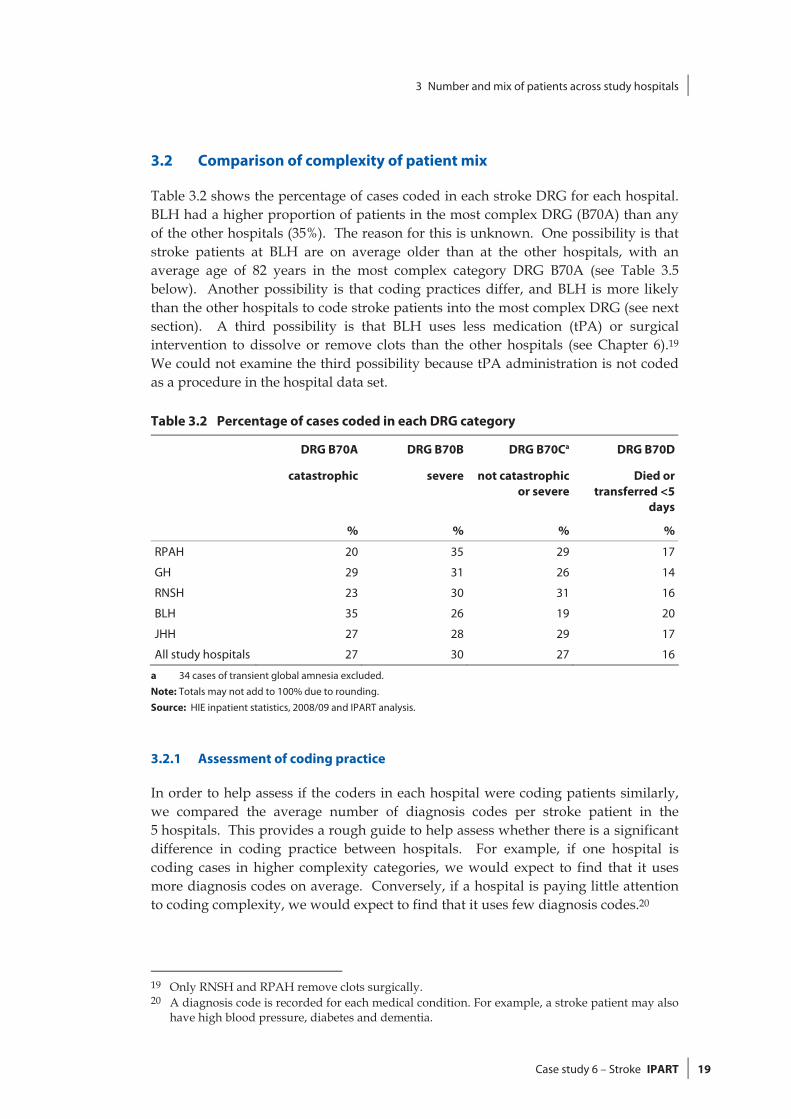
Table 3.2 shows the percentage of cases coded in each stroke DRG for each hospital. BLH had a higher proportion of patients in the most complex DRG (B70A) than any of the other hospitals (35%). The reason for this is unknown. One possibility is that stroke patients at BLH are on average older than at the other hospitals, with an average age of 82 years in the most complex category DRG B70A (see Table 3.5 below). Another possibility is that coding practices differ, and BLH is more likely than the other hospitals to code stroke patients into the most complex DRG (see next section). A third possibility is that BLH uses less medication (tPA) or surgical intervention to dissolve or remove clots than the other hospitals (see Chapter 6).19 We could not examine the third possibility because tPA administration is not coded as a procedure in the hospital data set.
Table 3.2 Percentage of cases coded in each DRG category
DRG B70A
catastrophic
DRG B70B
severe
DRG B70Ca
not catastrophic or severe
DRG B70D
Died or transferred <5
days
% % % %
RPAH 20 35 29 17
GH 29 31 26 14
RNSH 23 30 31 16
BLH 35 26 19 20
JHH 27 28 29 17
All study hospitals 27 30 27 16
a 34 cases of transient global amnesia excluded.
Note: Totals may not add to 100% due to rounding.
Source: HIE inpatient statistics, 2008/09 and IPART analysis.
3.2.1 Assessment of coding practice
In order to help assess if the coders in each hospital were coding patients similarly, we compared the average number of diagnosis codes per stroke patient in the 5 hospitals. This provides a rough guide to help assess whether there is a significant difference in coding practice between hospitals. For example, if one hospital is coding cases in higher complexity categories, we would expect to find that it uses more diagnosis codes on average. Conversely, if a hospital is paying little attention to coding complexity, we would expect to find that it uses few diagnosis codes.20
19 Only RNSH and RPAH remove clots surgically. 20 A diagnosis code is recorded for each medical condition. For example, a stroke patient may also
have high blood pressure, diabetes and dementia.
3 Number and mix of patients across study hospitals
20 IPART Case study 6 – Stroke
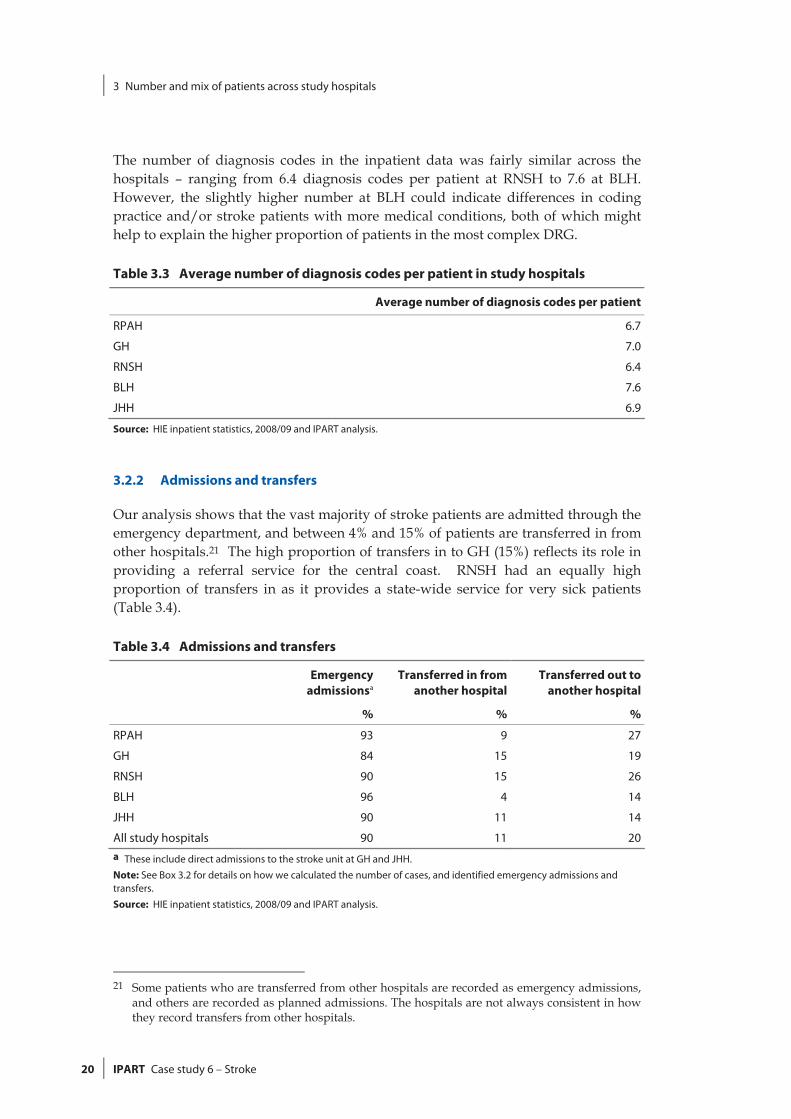
The number of diagnosis codes in the inpatient data was fairly similar across the hospitals – ranging from 6.4 diagnosis codes per patient at RNSH to 7.6 at BLH. However, the slightly higher number at BLH could indicate differences in coding practice and/or stroke patients with more medical conditions, both of which might help to explain the higher proportion of patients in the most complex DRG.
Table 3.3 Average number of diagnosis codes per patient in study hospitals
Average number of diagnosis codes per patient
RPAH 6.7
GH 7.0
RNSH 6.4
BLH 7.6
JHH 6.9
Source: HIE inpatient statistics, 2008/09 and IPART analysis.
3.2.2 Admissions and transfers
Our analysis shows that the vast majority of stroke patients are admitted through the emergency department, and between 4% and 15% of patients are transferred in from other hospitals.21 The high proportion of transfers in to GH (15%) reflects its role in providing a referral service for the central coast. RNSH had an equally high proportion of transfers in as it provides a state-wide service for very sick patients (Table 3.4).
Table 3.4 Admissions and transfers
Emergency
admissionsaTransferred in from
another hospitalTransferred out to
another hospital
% % %
RPAH 93 9 27
GH 84 15 19
RNSH 90 15 26
BLH 96 4 14
JHH 90 11 14
All study hospitals 90 11 20 a These include direct admissions to the stroke unit at GH and JHH.
Note: See Box 3.2 for details on how we calculated the number of cases, and identified emergency admissions and transfers.
Source: HIE inpatient statistics, 2008/09 and IPART analysis.
21 Some patients who are transferred from other hospitals are recorded as emergency admissions,
and others are recorded as planned admissions. The hospitals are not always consistent in how they record transfers from other hospitals.
3 Number and mix of patients across study hospitals
Case study 6 – Stroke IPART 21
The proportion of stroke patients transferred out to other hospitals for rehabilitation ranges from 14% at BLH and JHH to 27% at RPAH. Transfers out at RNSH, RPAH and GH are high because their rehabilitation facilities are located elsewhere. JHH and BLH do more on-site rehabilitation (discussed further in Chapter 4 and Chapter 6).
Box 3.2 describes the method we used to identify emergency admissions and transfers.
Box 3.2 How we identified emergency admissions and transfers
Emergency admissions were identified by linking emergency department attendance data withadmitted patient data where the time of arrival and departure in the emergency departmentmatched with the admission time. Note that some of the patients that are transferred in arenot included in the emergency figures.
Due to data quality issues with the transfer in and transfer out fields in the admitted patient data, transfers were calculated using a linkage key developed by the Australian Institute ofHealth and Welfare.
3.2.3 Age of patients
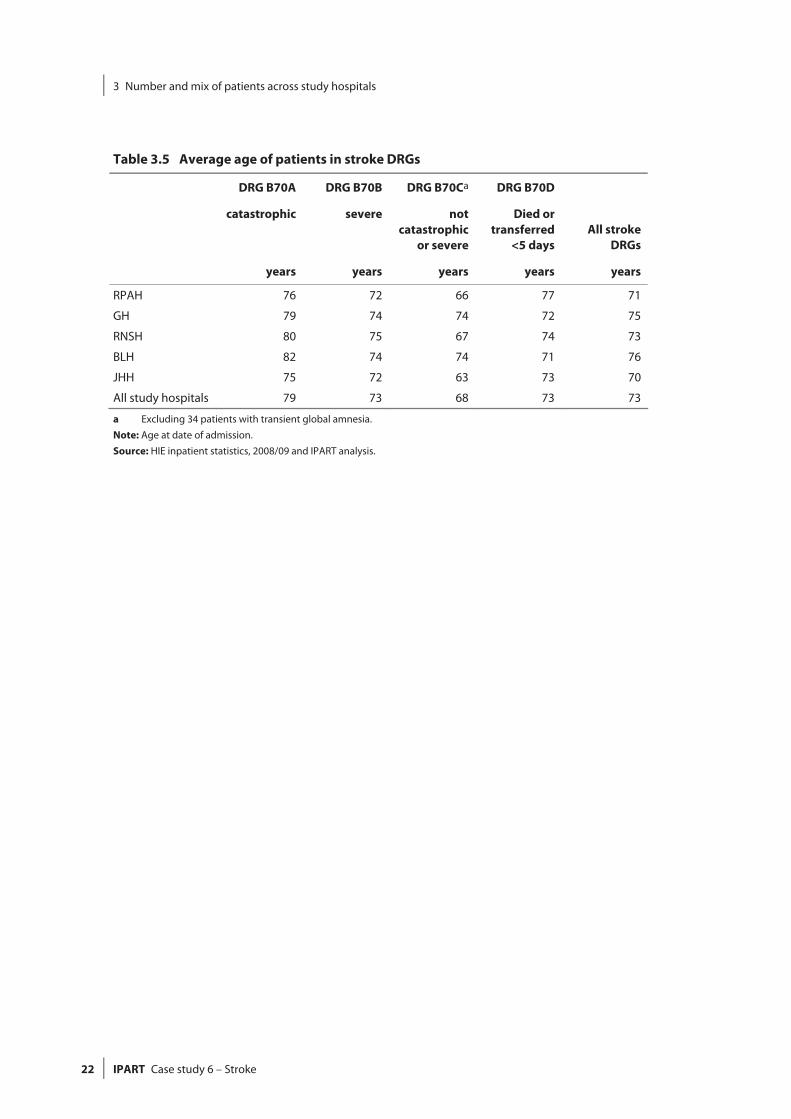
The average age of stroke patients in all hospitals was 73 years, ranging from an average of 70 years at JHH to 76 years at BLH. Patients in the most complex category (B70A) were on average older than patients in the less complex categories. Patients in the least complex category (B70C) were on average 11 years younger than those in the most complex category (Table 3.5).
3 Number and mix of patients across study hospitals
22 IPART Case study 6 – Stroke
Table 3.5 Average age of patients in stroke DRGs
DRG B70A
catastrophic
DRG B70B
severe
DRG B70Ca
not catastrophic
or severe
DRG B70D
Died or transferred
<5 days All stroke
DRGs
years years years years years
RPAH 76 72 66 77 71
GH 79 74 74 72 75
RNSH 80 75 67 74 73
BLH 82 74 74 71 76
JHH 75 72 63 73 70
All study hospitals 79 73 68 73 73
a Excluding 34 patients with transient global amnesia.
Note: Age at date of admission. Source: HIE inpatient statistics, 2008/09 and IPART analysis.
4 Length of stay across study hospitals
Case study 6 – Stroke IPART 23
4 Length of stay across study hospitals
We examined the average length of stay of stroke patients because it is one of the factors that influence the cost of an individual’s hospital care. This is because a large component of this cost is nursing care (and this cost increases with the length of stay). In addition, differences in length of stay can point to differences in casemix or clinical practice between hospitals.
We calculated the average length of stay across all study hospitals for stroke cases using 3 different measures:
episode length of stay in study hospital (LOS1)
total length of stay in study hospital (LOS2)
total length of stay in study hospital and 2 other hospitals – one transfer in and one transfer out (LOS3).
Box 4.1 provides more detail on these measures. The sections below set out our analysis of length of stay for all stroke cases, as well as for each stroke DRG.
We found that there was significant variation in the acute episode length of stay (LOS1) across the study hospitals, but that much of this difference was due to differences in the way the hospitals reclassify patients from acute to rehabilitation care, rather than differences in clinical practice. We also found that there is far less variation in the length of stay when total hospitalisation is measured (LOS3), mainly because LOS3 takes into account different arrangements for rehabilitation.
4 Length of stay across study hospitals
24 IPART Case study 6 – Stroke
Box 4.1 The 3 measures of length of stay we used for stroke patients
1. Episode length of stay in study hospital (LOS1)
This is the average number of days a patient stayed in the study hospital for a single acute episode. This measure is often used in NHCDC and DRG benchmarking analyses. We used this measure to enable comparisons to be made between our cost estimates and those included in the NHCDC (discussed in Chapter 5).
2. Total length of stay in study hospital (LOS2)
This is the total number of days a patient stayed in the study hospital from admission todischarge. It includes all consecutive episodes including acute, rehabilitation and any othertypes of care. However, for some conditions/procedures, patients can be:
transferred to the study hospital from another hospital, and/or
transferred from the study hospital to another.
LOS2 does not include the length of stay in such other hospitals, so does not provide a consistent basis for comparing average length of stay required to care for certainconditions/procedures.
3. Total length of stay in study hospital plus up to 2 other hospitals – one transfer in and one transfer out (LOS3)
The third measure is the total length of stay in the study hospital (ie, LOS2), plus the totallength of stay at 2 other hospitals – one ‘transfer in’, and one ‘transfer out’. Ideally all relatedhospital stays would be linked, but we have only added up to one additional hospital stay at either end of the stay in the study hospital. We used the linkage key developed by the Australian Institute of Health and Welfare (AIHW) for use between all public and private hospitals. This step is not routinely done in hospital comparisons.
We consider that LOS3 is a more consistent basis for comparing average length of stay forcertain conditions/procedures because it takes account of differences in hospital:
administrative practices for reclassifying patients between their acute care and other phasesof care (type changes)
access to rehabilitation facilities (transfers out)
patterns of referral from other hospitals (transfers in).
4.1 Comparing lengths of stay for stroke patients
We calculated lengths of stay both including and excluding patients in DRG B70D (ie, who died or were transferred to another hospital in less than 5 days) and those with a diagnosis of transient global amnesia. A few of these patients can significantly reduce the length of stay and distort comparisons of average lengths of stay.
4 Length of stay across study hospitals
Case study 6 – Stroke IPART 25
4.1.1 Impact of exclusions on average length of stay for combined DRGs
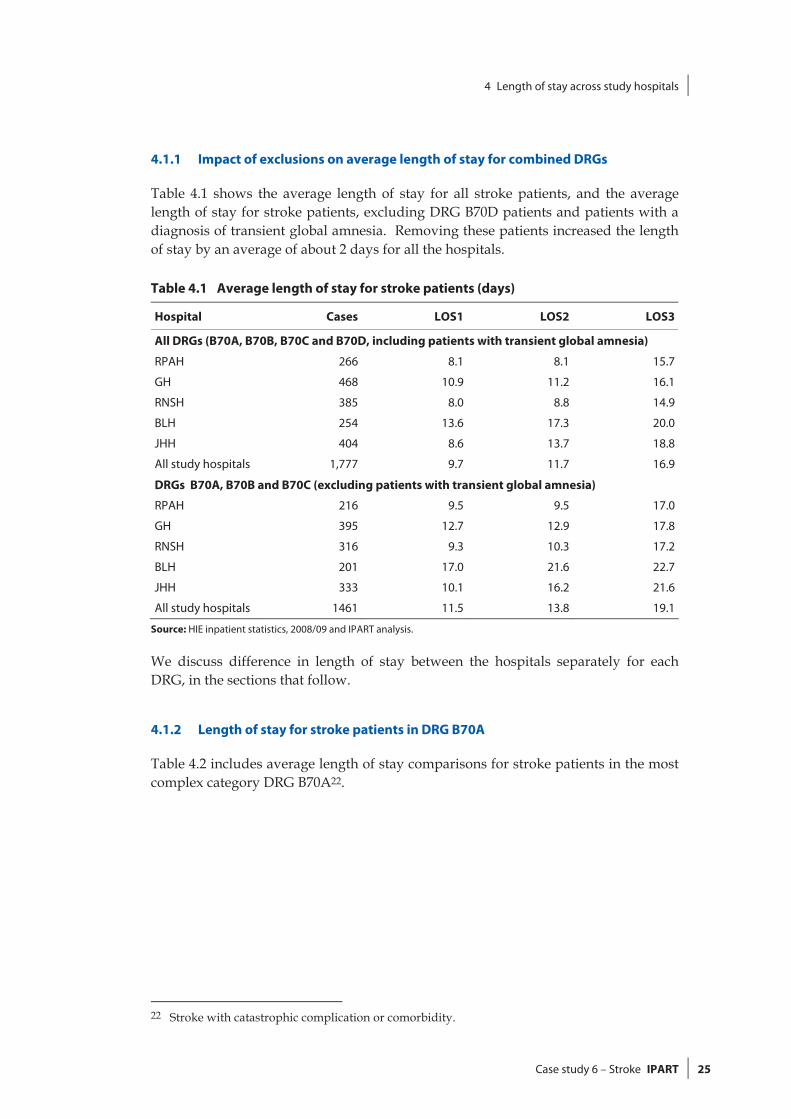
Table 4.1 shows the average length of stay for all stroke patients, and the average length of stay for stroke patients, excluding DRG B70D patients and patients with a diagnosis of transient global amnesia. Removing these patients increased the length of stay by an average of about 2 days for all the hospitals.
Table 4.1 Average length of stay for stroke patients (days)
Hospital Cases LOS1 LOS2 LOS3
All DRGs (B70A, B70B, B70C and B70D, including patients with transient global amnesia)
RPAH 266 8.1 8.1 15.7
GH 468 10.9 11.2 16.1
RNSH 385 8.0 8.8 14.9
BLH 254 13.6 17.3 20.0
JHH 404 8.6 13.7 18.8
All study hospitals 1,777 9.7 11.7 16.9
DRGs B70A, B70B and B70C (excluding patients with transient global amnesia)
RPAH 216 9.5 9.5 17.0
GH 395 12.7 12.9 17.8
RNSH 316 9.3 10.3 17.2
BLH 201 17.0 21.6 22.7
JHH 333 10.1 16.2 21.6
All study hospitals 1461 11.5 13.8 19.1
Source: HIE inpatient statistics, 2008/09 and IPART analysis.
We discuss difference in length of stay between the hospitals separately for each DRG, in the sections that follow.
4.1.2 Length of stay for stroke patients in DRG B70A
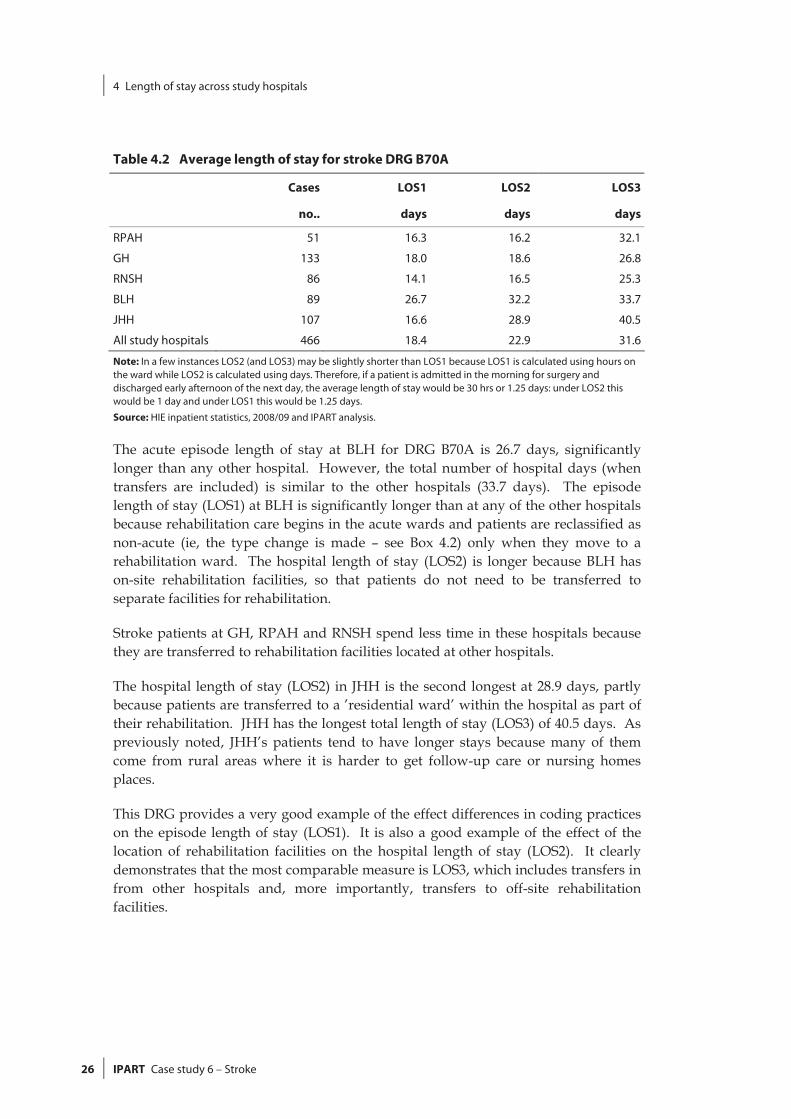
Table 4.2 includes average length of stay comparisons for stroke patients in the most complex category DRG B70A22.
22 Stroke with catastrophic complication or comorbidity.
4 Length of stay across study hospitals
26 IPART Case study 6 – Stroke
Table 4.2 Average length of stay for stroke DRG B70A
Cases LOS1 LOS2 LOS3
no.. days days days
RPAH 51 16.3 16.2 32.1
GH 133 18.0 18.6 26.8
RNSH 86 14.1 16.5 25.3
BLH 89 26.7 32.2 33.7
JHH 107 16.6 28.9 40.5
All study hospitals 466 18.4 22.9 31.6
Note: In a few instances LOS2 (and LOS3) may be slightly shorter than LOS1 because LOS1 is calculated using hours on the ward while LOS2 is calculated using days. Therefore, if a patient is admitted in the morning for surgery and discharged early afternoon of the next day, the average length of stay would be 30 hrs or 1.25 days: under LOS2 this would be 1 day and under LOS1 this would be 1.25 days. Source: HIE inpatient statistics, 2008/09 and IPART analysis.
The acute episode length of stay at BLH for DRG B70A is 26.7 days, significantly longer than any other hospital. However, the total number of hospital days (when transfers are included) is similar to the other hospitals (33.7 days). The episode length of stay (LOS1) at BLH is significantly longer than at any of the other hospitals because rehabilitation care begins in the acute wards and patients are reclassified as non-acute (ie, the type change is made – see Box 4.2) only when they move to a rehabilitation ward. The hospital length of stay (LOS2) is longer because BLH has on-site rehabilitation facilities, so that patients do not need to be transferred to separate facilities for rehabilitation.
Stroke patients at GH, RPAH and RNSH spend less time in these hospitals because they are transferred to rehabilitation facilities located at other hospitals.
The hospital length of stay (LOS2) in JHH is the second longest at 28.9 days, partly because patients are transferred to a ’residential ward’ within the hospital as part of their rehabilitation. JHH has the longest total length of stay (LOS3) of 40.5 days. As previously noted, JHH’s patients tend to have longer stays because many of them come from rural areas where it is harder to get follow-up care or nursing homes places.
This DRG provides a very good example of the effect differences in coding practices on the episode length of stay (LOS1). It is also a good example of the effect of the location of rehabilitation facilities on the hospital length of stay (LOS2). It clearly demonstrates that the most comparable measure is LOS3, which includes transfers in from other hospitals and, more importantly, transfers to off-site rehabilitation facilities.
4 Length of stay across study hospitals
Case study 6 – Stroke IPART 27
Box 4.2 Episode type changes
Consistent with approved practice, hospital stays can be administratively split, or ‘fragmented’, into a number of episodes reflecting changes in the type of care provided. The episode typesused in the HIE are:
1. Hospital Boarder
2. Acute Care
3. Rehabilitation Care
4. Palliative Care
5. Maintenance Care
6. Newborn Care
7. Other Admitted Patient Care
8. Geriatric Evaluation and Management
9. Psycho-geriatric
10. Organ Procurement.
For example, an elderly patient with a stroke may typically have two or more episodes – an ‘acute’ episode, a ‘rehabilitation’ episode and, perhaps, a ‘psycho-geriatric’ episode for a patient with confusion or dementia.
Hospital practices relating to episode type changes differ. For example, for stroke patientssome hospitals do the type change from ‘acute care’ to ‘rehabilitation care’ when the patient is ready for rehabilitation, while others do the type change only when the patient physicallymoves to a rehabilitation ward or facility.
4.1.3 Length of stay for stroke patient in DRG B70B
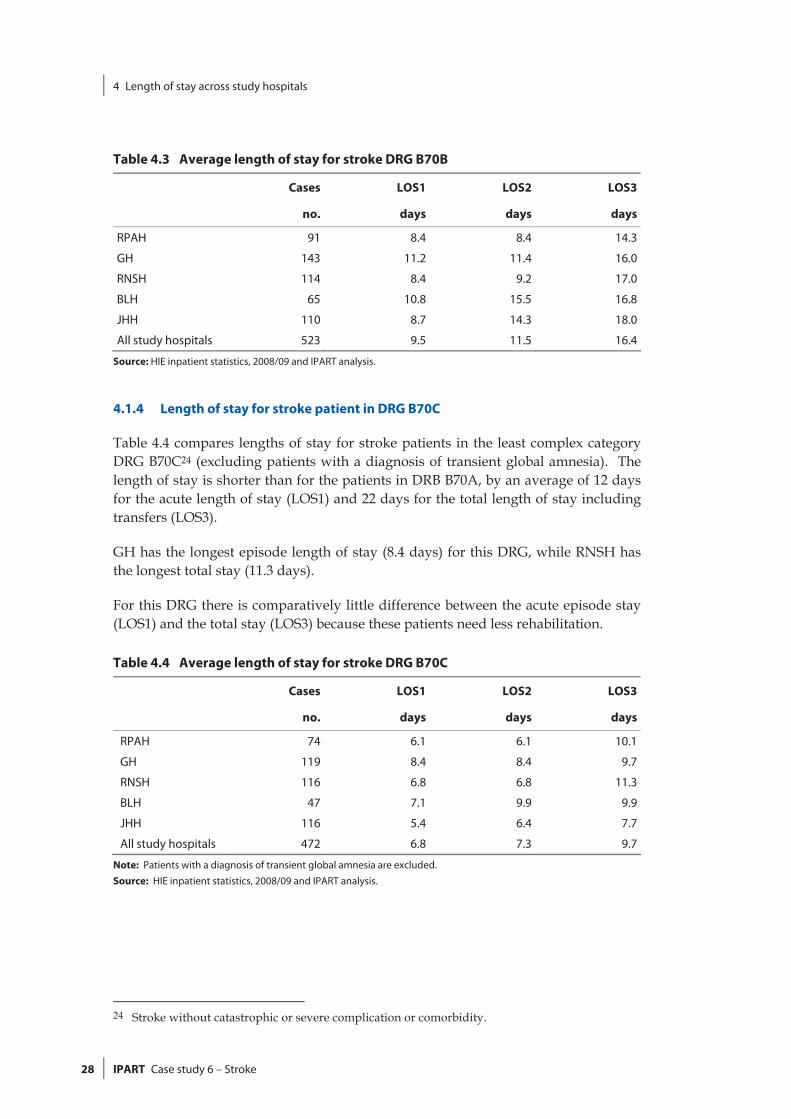
Table 4.3 provides average length of stay comparisons for stroke patients in the next most complex category DRG B70B23. The length of stay is shorter than for the patients in DRG B70A, by an average of 9 days for the acute length of stay (LOS1) and 15 days for the total length of stay including transfers (LOS3).
There is less variation between the hospitals in this DRG than in DRG B70A. GH (not BLH) has the longest episode length of stay (11.2 days) for this DRG, while JHH has the longest total stay (18.0 days).
Similar to our finding for DRG B70A, LOS3 is a more comparable measure of the length of stay between the study hospitals than either the episode length of stay (LOS1) or the hospital length of stay (LOS2).
23 Stroke with severe complication or comorbidity.
4 Length of stay across study hospitals
28 IPART Case study 6 – Stroke
Table 4.3 Average length of stay for stroke DRG B70B
Cases LOS1 LOS2 LOS3
no. days days days
RPAH 91 8.4 8.4 14.3
GH 143 11.2 11.4 16.0
RNSH 114 8.4 9.2 17.0
BLH 65 10.8 15.5 16.8
JHH 110 8.7 14.3 18.0
All study hospitals 523 9.5 11.5 16.4
Source: HIE inpatient statistics, 2008/09 and IPART analysis.
4.1.4 Length of stay for stroke patient in DRG B70C
Table 4.4 compares lengths of stay for stroke patients in the least complex category DRG B70C24 (excluding patients with a diagnosis of transient global amnesia). The length of stay is shorter than for the patients in DRB B70A, by an average of 12 days for the acute length of stay (LOS1) and 22 days for the total length of stay including transfers (LOS3).
GH has the longest episode length of stay (8.4 days) for this DRG, while RNSH has the longest total stay (11.3 days).
For this DRG there is comparatively little difference between the acute episode stay (LOS1) and the total stay (LOS3) because these patients need less rehabilitation.
Table 4.4 Average length of stay for stroke DRG B70C
Cases LOS1 LOS2 LOS3
no. days days days
RPAH 74 6.1 6.1 10.1
GH 119 8.4 8.4 9.7
RNSH 116 6.8 6.8 11.3
BLH 47 7.1 9.9 9.9
JHH 116 5.4 6.4 7.7
All study hospitals 472 6.8 7.3 9.7
Note: Patients with a diagnosis of transient global amnesia are excluded.
Source: HIE inpatient statistics, 2008/09 and IPART analysis.
24 Stroke without catastrophic or severe complication or comorbidity.
4 Length of stay across study hospitals
Case study 6 – Stroke IPART 29
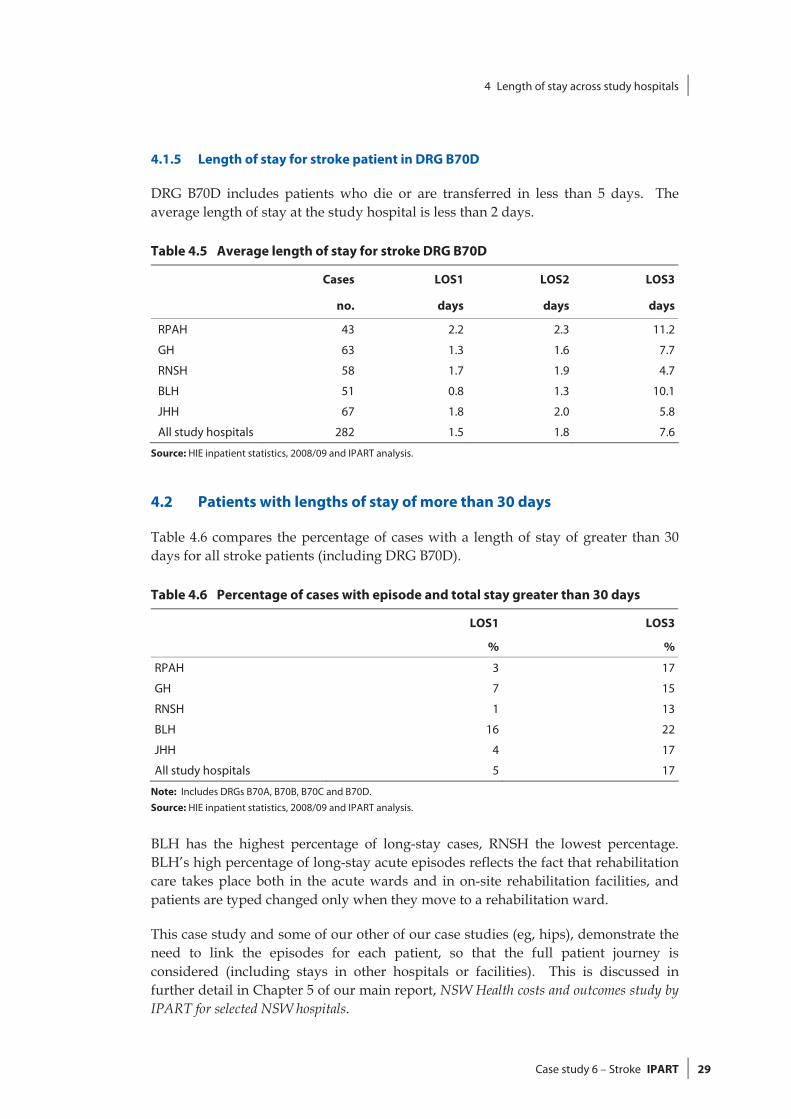
4.1.5 Length of stay for stroke patient in DRG B70D
DRG B70D includes patients who die or are transferred in less than 5 days. The average length of stay at the study hospital is less than 2 days.
Table 4.5 Average length of stay for stroke DRG B70D
Cases LOS1 LOS2 LOS3
no. days days days
RPAH 43 2.2 2.3 11.2
GH 63 1.3 1.6 7.7
RNSH 58 1.7 1.9 4.7
BLH 51 0.8 1.3 10.1
JHH 67 1.8 2.0 5.8
All study hospitals 282 1.5 1.8 7.6
Source: HIE inpatient statistics, 2008/09 and IPART analysis.
4.2 Patients with lengths of stay of more than 30 days
Table 4.6 compares the percentage of cases with a length of stay of greater than 30 days for all stroke patients (including DRG B70D).
Table 4.6 Percentage of cases with episode and total stay greater than 30 days
LOS1 LOS3
% %
RPAH 3 17
GH 7 15
RNSH 1 13
BLH 16 22
JHH 4 17
All study hospitals 5 17
Note: Includes DRGs B70A, B70B, B70C and B70D.
Source: HIE inpatient statistics, 2008/09 and IPART analysis.
BLH has the highest percentage of long-stay cases, RNSH the lowest percentage. BLH’s high percentage of long-stay acute episodes reflects the fact that rehabilitation care takes place both in the acute wards and in on-site rehabilitation facilities, and patients are typed changed only when they move to a rehabilitation ward.
This case study and some of our other of our case studies (eg, hips), demonstrate the need to link the episodes for each patient, so that the full patient journey is considered (including stays in other hospitals or facilities). This is discussed in further detail in Chapter 5 of our main report, NSW Health costs and outcomes study by IPART for selected NSW hospitals.
5 Costs of providing inpatient care
30 IPART Case study 6 – Stroke
5 Costs of providing inpatient care
To compare the costs of caring for stroke patients at the study hospitals we examined the major clinical resources used to provide inpatient care during their ‘acute episode’ (ie, using LOS1). The clinical resources we examined were:
nursing staff in wards
imaging
pathology.
The sections below discuss our analysis of the estimated costs for each of these resources across the study hospitals. They also compare our estimated costs with estimates based on provisional or final data reported to NSW Health by Area Health Services as part of the NHCDC.25
The care of stroke patients involves significant allied health costs such as speech pathology, occupational therapy and physiotherapy. We did not include these allied health costs in our data collection or analysis.
Note that given the scope of our task for this study, we were not able to undertake a full bottom-up costing of all the above resource categories. Instead, we used a range of approaches, based on the most reliable and consistent data we could obtain in the time available. The methodologies we used are outlined in the sections below, and discussed in more detail in our main report, NSW Health costs and outcomes study by IPART for selected NSW hospitals. Also note that while senior and junior medical staff are a major cost for stroke patients, we were not able to compare the use and management of these clinical resources due to the lack of consistent data.
5.1 Cost of nursing staff in wards
Nursing is one of the largest expenditure areas in hospital budgets and is a significant part of the cost of providing acute care to stroke patients.
25 Due to time constraints we used final NHCDC data only where these were substantially
different from the provisional data. For this case study we used final NHCDC data only for pathology costs.
5 Costs of providing inpatient care
Case study 6 – Stroke IPART 31
We calculated and compared the nursing cost per acute episode for DRGs B70B and B70C (excluding transient global amnesia patients). We excluded DRG B70A because of the complexity introduced into the analysis by time spent in ICU and the different structures for ICU and high dependency units at the different hospitals. These differences mean that we could not calculate comparable costs across the study hospitals for this DRG. We also excluded DRG B70D (patients who died or were transferred within 5 days), for the reasons previously explained.
5.1.1 Methodology
To analyse this cost and allow comparisons with the NHCDC, we focused on:
the cost of nursing staff in wards (ie, excluding those of nursing staff in operating theatres or senior nursing categories that provide area-wide or hospital-wide functions)
nursing costs for the acute episode only (ie, LOS1).
Our methodology for estimating nursing costs and its limitations are briefly described in Box 5.1 and in more detail in Chapter 8 of our main report.26 Further, these estimates should be considered in light of the discussion in Chapter 4 on the limitations of using LOS1 relative to LOS3 (the length of stay for the acute episode plus other episodes plus up to one transfer in and one transfer out).
5.1.2 Use of IFRACs
The hospitals use inpatient fractions (IFRACs) to allocate staff time to acute care and other staff responsibilities. We calculated two sets of inpatient nursing costs, the first using the hospitals’ IFRACs and the second setting all IFRACs to 1.27 We did this because we were concerned that IFRACs may not be consistently applied by the hospitals.28 IFRACs also underlie the NHCDC estimates of ward costs.
BLH has an IFRAC of 1, RPAH, GH and JHH have IFRACs of 0.90, while RNSH has an IFRAC of 0.77. These IFRACs may be valid, because ward nursing staff (except at BLH) may spend time on non-inpatient activities (eg, staffing outpatient clinics). However, the purpose of our analysis is to show how sensitive the nursing cost estimates are to IFRACs. IFRACs also underlie the NHCDC estimates of ward costs.
26 IPART, NSW Health costs and outcomes study by IPART for selected NSW hospitals, July 2010. 27 Setting IFRACs to 1 means that we allocated 100% of the nursing time to inpatient care. 28 IFRACs may differ between the hospitals for valid reasons, because the ward nursing staff in
some hospitals may spend more time on outpatient or administrative activities than those in other hospitals. The purpose of our analysis is to show how sensitive the nursing cost estimates are to IFRACs.
5 Costs of providing inpatient care
32 IPART Case study 6 – Stroke
5.1.3 Ward nursing costs for stroke patients
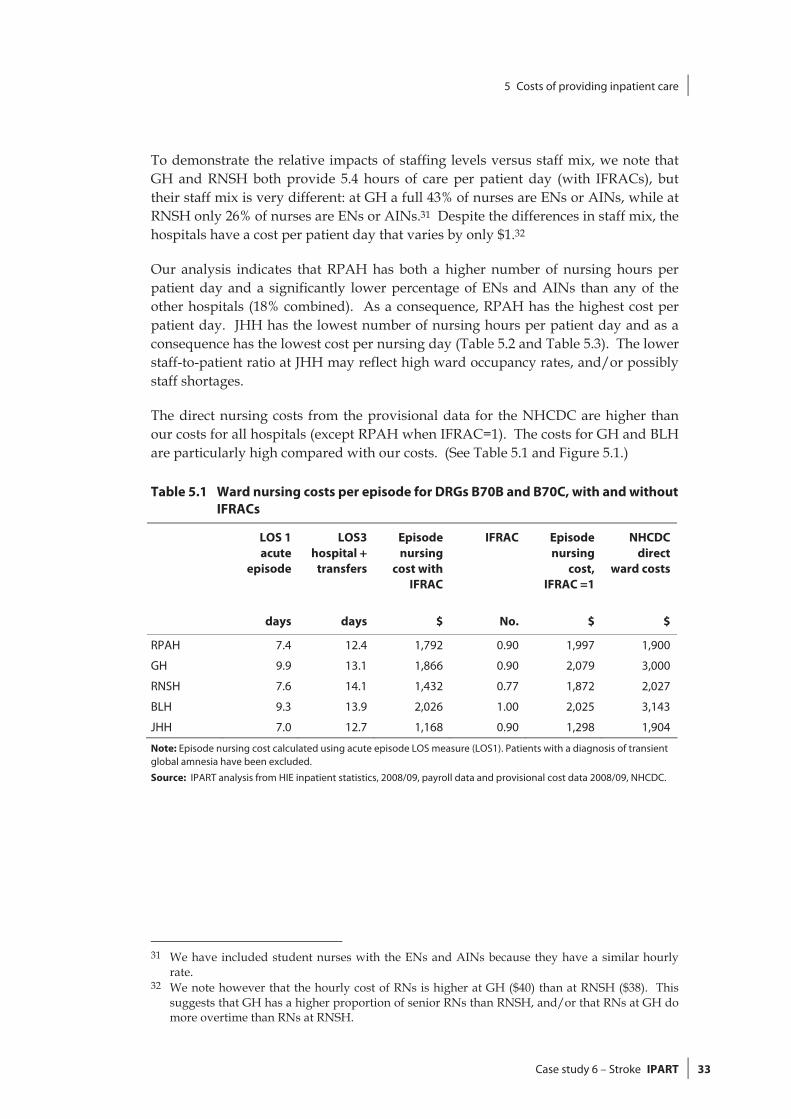
Table 5.1 shows our estimates of direct nursing costs for the study hospitals for DRGs B70B and B70C.29 The table also shows the direct nursing costs from the provisional data for the NHCDC, which we compare with our estimates of cost.
Our analysis indicates that the cost per episode is affected by four main factors:
IFRACs
length of stay
nursing hours per patient day (ie, staff-to-patient ratio)
nursing staff mix.
IFRACs affect both the nursing costs per episode and the nursing costs per patient day (see Table 5.1 and Table 5.2). Setting IFRACs to 1 increases the costs at all the hospitals except BLH, but has the biggest impact on RNSH because the IFRACs used at this hospital are the lowest.
We found that there is a strong relationship between the second factor, the length of stay, and episode costs. There is a straightforward relationship when IFRACs are set to 1: hospitals with a longer length of stay have higher cost per episode than hospitals with a shorter length of stay. For example, when IFRACs = 1 GH has the longest length of stay (9.9 days) and the highest cost per episode ($2,079), while JHH has the shortest length of stay (7.0 days) and the lowest cost per episode ($1,298).
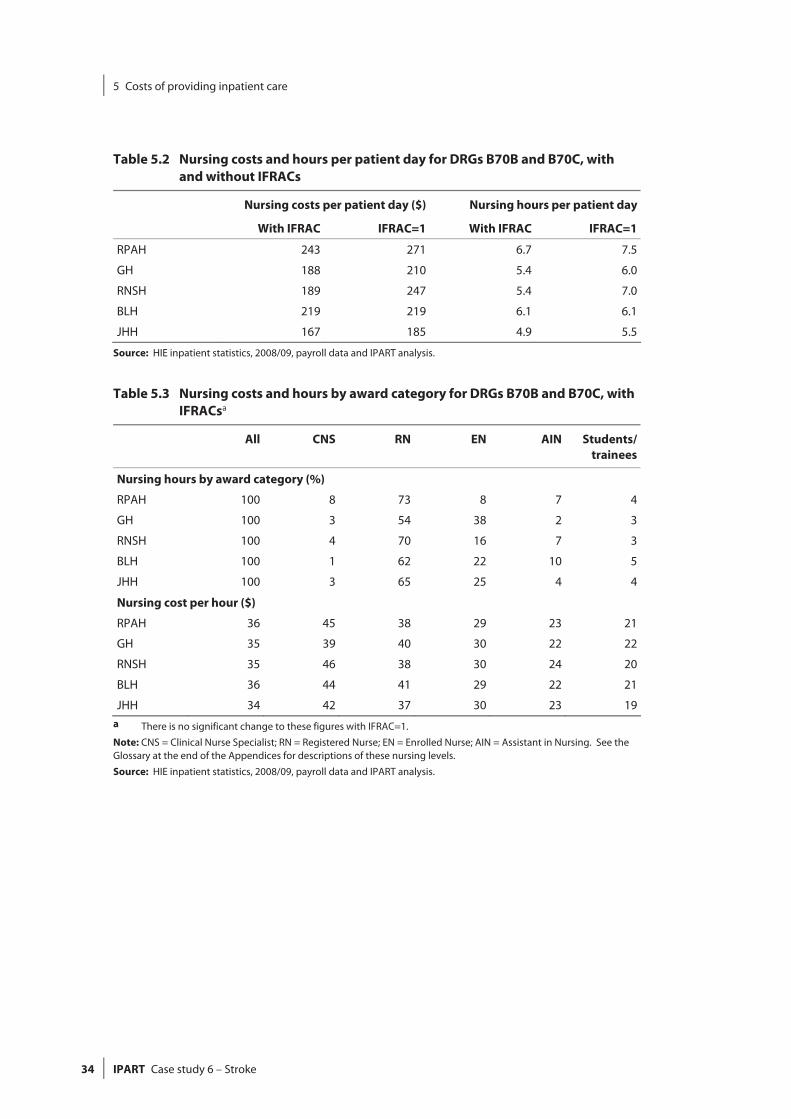
The number of nursing hours per patient day and the staff mix determine the nursing cost per patient day. In principle, a hospital with a high staff-to-patient ratio is likely to have higher costs per patient day than a hospital with a lower staff-to-patient ratio. But a higher number of hours per patient day can be offset by lower costs per nursing hour if there is a high proportion of Enrolled Nurses (ENs) and Assistants in Nursing (AINs) in the staff mix.30 However, our analysis suggests that the average cost per patient day at the different hospitals depends more on staffing levels than the staff mix. The staff mix results in only a small variation in the average cost per nursing hour, from $34 at JHH to $36 at RPAH and BLH (Table 5.3).
29 We combined the nursing costs for DRGs B70B and B70C because the only significant difference
between the DRGs was the length of stay. Combining the DRGs made it easier to compare the hospitals’ nursing costs, and did not compromise the analysis.
30 The nursing categories are explained in Chapter 8 of our main report, NSW Health costs and outcomes study by IPART for selected NSW hospitals.
5 Costs of providing inpatient care
Case study 6 – Stroke IPART 33
To demonstrate the relative impacts of staffing levels versus staff mix, we note that GH and RNSH both provide 5.4 hours of care per patient day (with IFRACs), but their staff mix is very different: at GH a full 43% of nurses are ENs or AINs, while at RNSH only 26% of nurses are ENs or AINs.31 Despite the differences in staff mix, the hospitals have a cost per patient day that varies by only $1.32
Our analysis indicates that RPAH has both a higher number of nursing hours per patient day and a significantly lower percentage of ENs and AINs than any of the other hospitals (18% combined). As a consequence, RPAH has the highest cost per patient day. JHH has the lowest number of nursing hours per patient day and as a consequence has the lowest cost per nursing day (Table 5.2 and Table 5.3). The lower staff-to-patient ratio at JHH may reflect high ward occupancy rates, and/or possibly staff shortages.
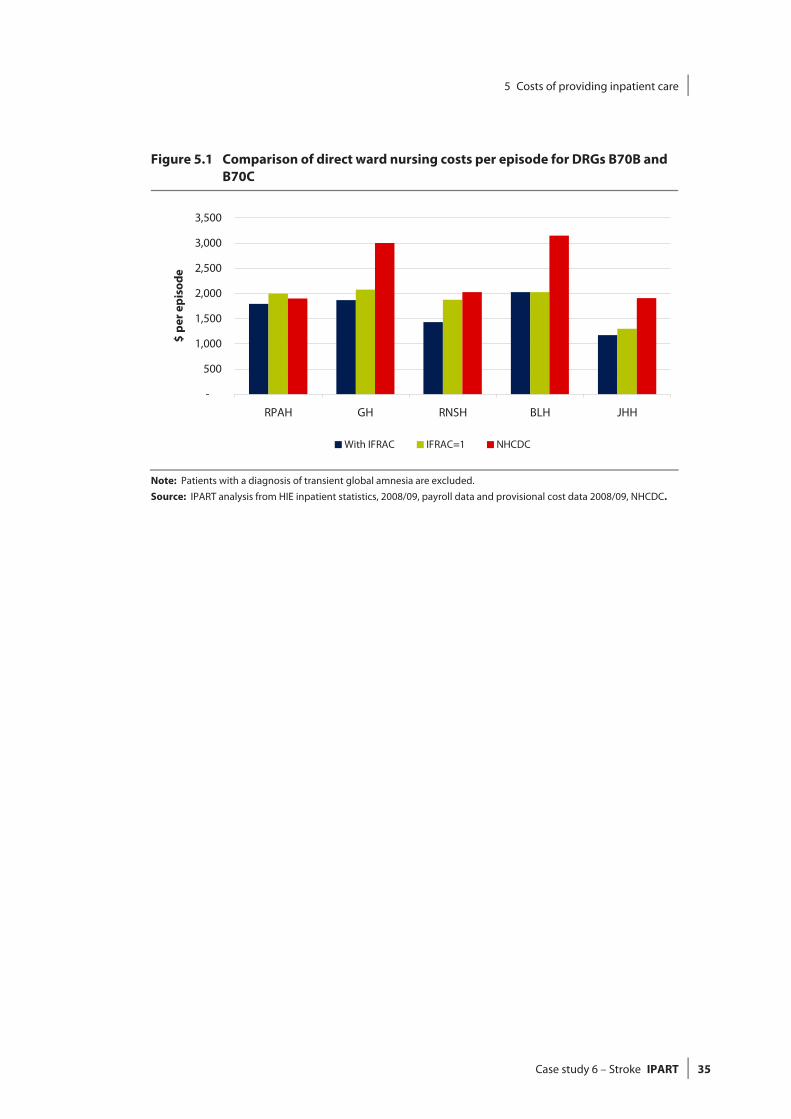
The direct nursing costs from the provisional data for the NHCDC are higher than our costs for all hospitals (except RPAH when IFRAC=1). The costs for GH and BLH are particularly high compared with our costs. (See Table 5.1 and Figure 5.1.)
Table 5.1 Ward nursing costs per episode for DRGs B70B and B70C, with and without IFRACs
LOS 1 acute
episode
LOS3 hospital +
transfers
Episode nursing
cost with IFRAC
IFRAC Episode nursing
cost, IFRAC =1
NHCDC direct
ward costs
days days $ No. $ $
RPAH 7.4 12.4 1,792 0.90 1,997 1,900
GH 9.9 13.1 1,866 0.90 2,079 3,000
RNSH 7.6 14.1 1,432 0.77 1,872 2,027
BLH 9.3 13.9 2,026 1.00 2,025 3,143
JHH 7.0 12.7 1,168 0.90 1,298 1,904
Note: Episode nursing cost calculated using acute episode LOS measure (LOS1). Patients with a diagnosis of transient global amnesia have been excluded.
Source: IPART analysis from HIE inpatient statistics, 2008/09, payroll data and provisional cost data 2008/09, NHCDC.
31 We have included student nurses with the ENs and AINs because they have a similar hourly
rate. 32 We note however that the hourly cost of RNs is higher at GH ($40) than at RNSH ($38). This
suggests that GH has a higher proportion of senior RNs than RNSH, and/or that RNs at GH do more overtime than RNs at RNSH.
5 Costs of providing inpatient care
34 IPART Case study 6 – Stroke
Table 5.2 Nursing costs and hours per patient day for DRGs B70B and B70C, with and without IFRACs
Nursing costs per patient day ($) Nursing hours per patient day
With IFRAC IFRAC=1 With IFRAC IFRAC=1
RPAH 243 271 6.7 7.5
GH 188 210 5.4 6.0
RNSH 189 247 5.4 7.0
BLH 219 219 6.1 6.1
JHH 167 185 4.9 5.5
Source: HIE inpatient statistics, 2008/09, payroll data and IPART analysis.
Table 5.3 Nursing costs and hours by award category for DRGs B70B and B70C, with IFRACsa
All CNS RN EN AIN Students/ trainees
Nursing hours by award category (%)
RPAH 100 8 73 8 7 4
GH 100 3 54 38 2 3
RNSH 100 4 70 16 7 3
BLH 100 1 62 22 10 5
JHH 100 3 65 25 4 4
Nursing cost per hour ($)
RPAH 36 45 38 29 23 21
GH 35 39 40 30 22 22
RNSH 35 46 38 30 24 20
BLH 36 44 41 29 22 21
JHH 34 42 37 30 23 19 a There is no significant change to these figures with IFRAC=1.
Note: CNS = Clinical Nurse Specialist; RN = Registered Nurse; EN = Enrolled Nurse; AIN = Assistant in Nursing. See the Glossary at the end of the Appendices for descriptions of these nursing levels.
Source: HIE inpatient statistics, 2008/09, payroll data and IPART analysis.
5 Costs of providing inpatient care
Case study 6 – Stroke IPART 35
Figure 5.1 Comparison of direct ward nursing costs per episode for DRGs B70B and B70C
-
500
1,000
1,500
2,000
2,500
3,000
3,500
RPAH GH RNSH BLH JHH
$ pe
r epi
sode
With IFRAC IFRAC=1 NHCDC
Note: Patients with a diagnosis of transient global amnesia are excluded.
Source: IPART analysis from HIE inpatient statistics, 2008/09, payroll data and provisional cost data 2008/09, NHCDC.
5 Costs of providing inpatient care
36 IPART Case study 6 – Stroke
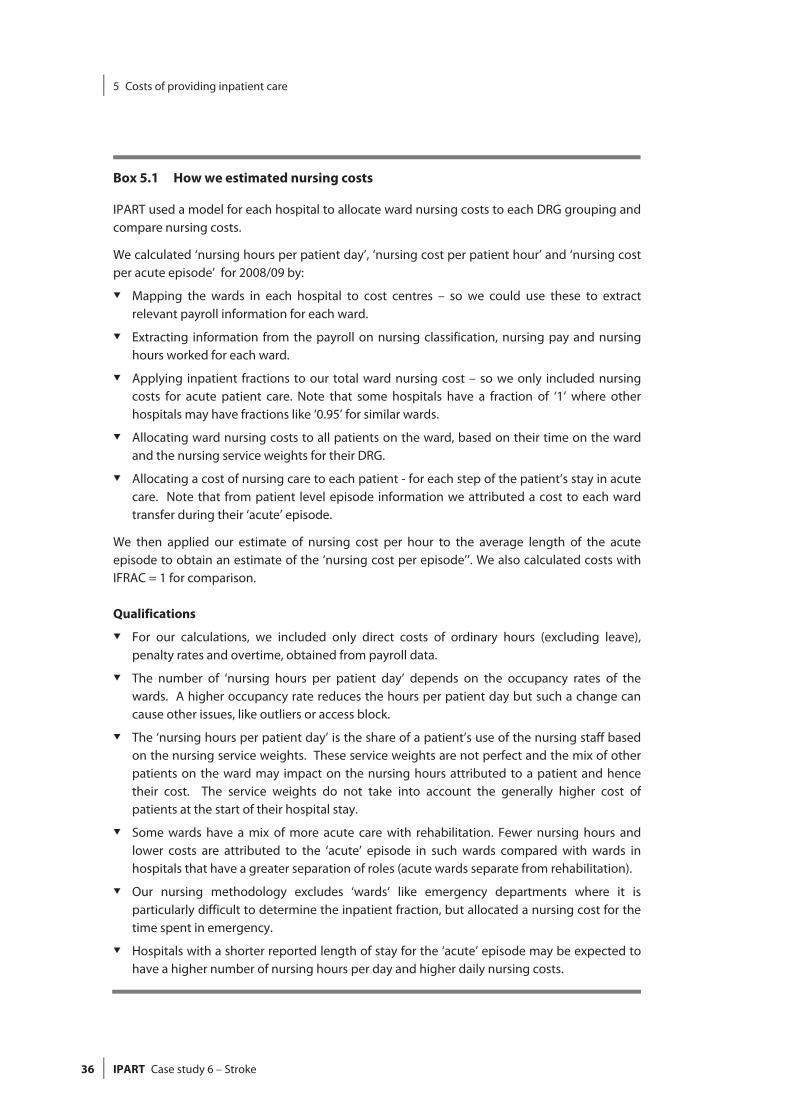
Box 5.1 How we estimated nursing costs
IPART used a model for each hospital to allocate ward nursing costs to each DRG grouping andcompare nursing costs.
We calculated ‘nursing hours per patient day’, ‘nursing cost per patient hour’ and ‘nursing costper acute episode’ for 2008/09 by:
Mapping the wards in each hospital to cost centres – so we could use these to extract relevant payroll information for each ward.
Extracting information from the payroll on nursing classification, nursing pay and nursinghours worked for each ward.
Applying inpatient fractions to our total ward nursing cost – so we only included nursing costs for acute patient care. Note that some hospitals have a fraction of ‘1’ where otherhospitals may have fractions like ‘0.95’ for similar wards.
Allocating ward nursing costs to all patients on the ward, based on their time on the wardand the nursing service weights for their DRG.
Allocating a cost of nursing care to each patient - for each step of the patient’s stay in acute care. Note that from patient level episode information we attributed a cost to each wardtransfer during their ‘acute’ episode.
We then applied our estimate of nursing cost per hour to the average length of the acuteepisode to obtain an estimate of the ‘nursing cost per episode’’. We also calculated costs withIFRAC = 1 for comparison.
Qualifications
For our calculations, we included only direct costs of ordinary hours (excluding leave), penalty rates and overtime, obtained from payroll data.
The number of ‘nursing hours per patient day’ depends on the occupancy rates of thewards. A higher occupancy rate reduces the hours per patient day but such a change can cause other issues, like outliers or access block.
The ‘nursing hours per patient day’ is the share of a patient’s use of the nursing staff basedon the nursing service weights. These service weights are not perfect and the mix of otherpatients on the ward may impact on the nursing hours attributed to a patient and hencetheir cost. The service weights do not take into account the generally higher cost ofpatients at the start of their hospital stay.
Some wards have a mix of more acute care with rehabilitation. Fewer nursing hours and lower costs are attributed to the ‘acute’ episode in such wards compared with wards inhospitals that have a greater separation of roles (acute wards separate from rehabilitation).
Our nursing methodology excludes ‘wards’ like emergency departments where it isparticularly difficult to determine the inpatient fraction, but allocated a nursing cost for the time spent in emergency.
Hospitals with a shorter reported length of stay for the ‘acute’ episode may be expected to have a higher number of nursing hours per day and higher daily nursing costs.
5 Costs of providing inpatient care
Case study 6 – Stroke IPART 37
5.2 Imaging costs
Table 5.4 sets out our calculations for the average cost of all imaging tests for stroke patients33, during their acute episode and on the day of their admission. It also sets out the average costs for selected high-cost tests (CT scans/MRIs, ultrasounds and fluoroscopy), as well as the direct and indirect imaging costs from the provisional data for the NHCDC. Our methodology for calculating these costs is explained in Box 5.2.
We found that imaging costs for the combined DRGs (for the whole acute episode) were highest at RNSH ($1,050) and lowest at BLH ($581). All the hospitals use CT scans and MRI, with RNSH making the most use of these tests ($705) and RPAH making the least use ($355). GH uses ultrasound more than any of the other hospitals. BLH does not currently have MRI facilities on-site, and must transport patient to Liverpool Hospital if MRI scans are required for further diagnosis or treatment. However, we understand that there is a firm proposal for an MRI at BLH and planning is well underway.
The NHCDC costs for the combined stroke DRGs (excluding B70D) fall within a narrower range than our costs – from $679 at RPAH to $944 at JHH. However, the rankings of hospitals are different between our estimates and the NHCDC estimates. Our analysis shows that RNSH has the highest cost by a significant margin, while BLH has the lowest cost. But according to the NHCDC, JHH has the highest cost and RPAH has the lowest cost. We believe that our costs are more reliable than those in the NHCDC because we have used a consistent method to calculate them based on clinical information.
33 Excluding patients with a diagnosis of transient global amnesia and patients who died or were
transferred in less than 5 days (DRG B70D).
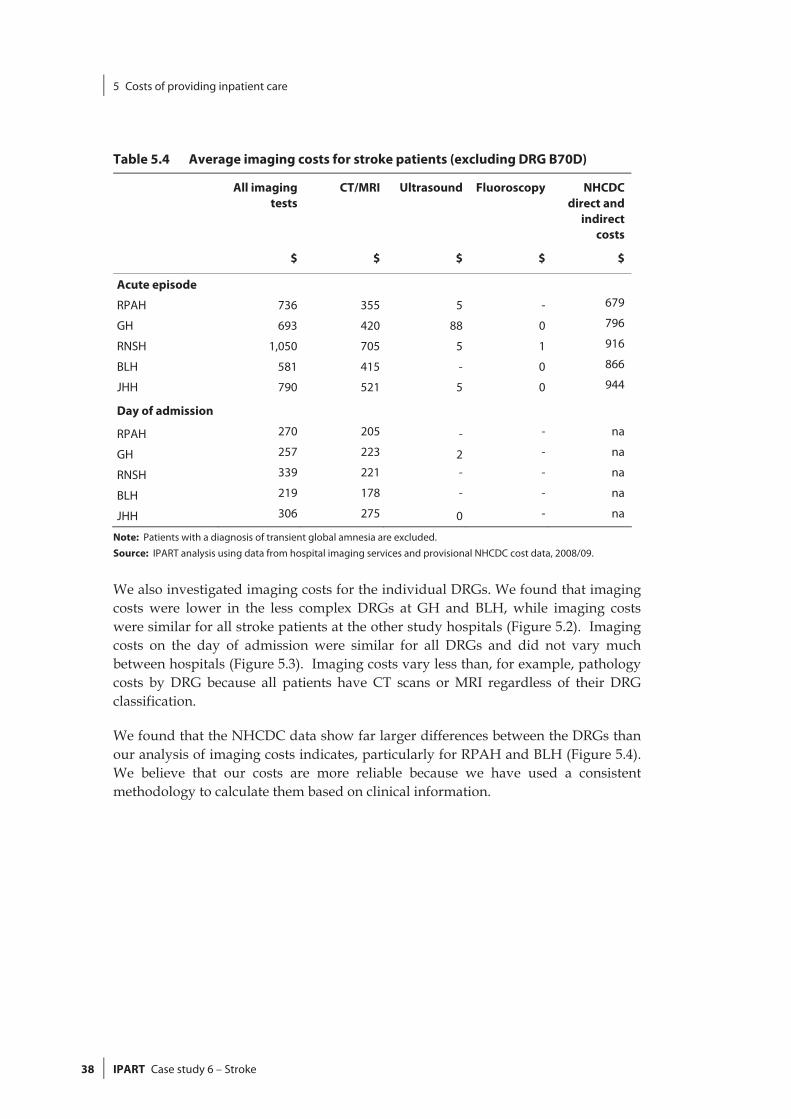
5 Costs of providing inpatient care
38 IPART Case study 6 – Stroke
Table 5.4 Average imaging costs for stroke patients (excluding DRG B70D)
All imaging tests
CT/MRI Ultrasound Fluoroscopy NHCDC direct and
indirect costs
$ $ $ $ $
Acute episode
RPAH 736 355 5 - 679
GH 693 420 88 0 796
RNSH 1,050 705 5 1 916
BLH 581 415 - 0 866
JHH 790 521 5 0 944
Day of admission
RPAH 270 205 - - na
GH 257 223 2 - na
RNSH 339 221 - - na
BLH 219 178 - - na
JHH 306 275 0 - na
Note: Patients with a diagnosis of transient global amnesia are excluded.
Source: IPART analysis using data from hospital imaging services and provisional NHCDC cost data, 2008/09.
We also investigated imaging costs for the individual DRGs. We found that imaging costs were lower in the less complex DRGs at GH and BLH, while imaging costs were similar for all stroke patients at the other study hospitals (Figure 5.2). Imaging costs on the day of admission were similar for all DRGs and did not vary much between hospitals (Figure 5.3). Imaging costs vary less than, for example, pathology costs by DRG because all patients have CT scans or MRI regardless of their DRG classification.
We found that the NHCDC data show far larger differences between the DRGs than our analysis of imaging costs indicates, particularly for RPAH and BLH (Figure 5.4). We believe that our costs are more reliable because we have used a consistent methodology to calculate them based on clinical information.
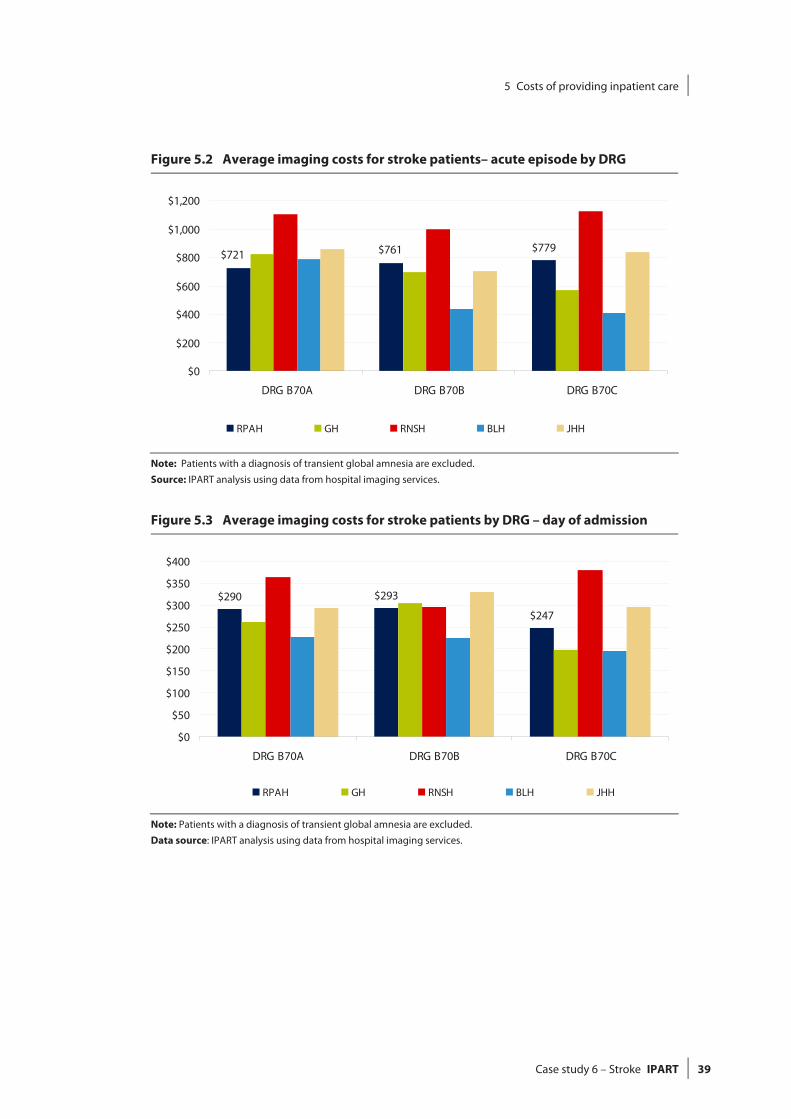
5 Costs of providing inpatient care
Case study 6 – Stroke IPART 39
Figure 5.2 Average imaging costs for stroke patients– acute episode by DRG
$779$761$721
$0
$200
$400
$600
$800
$1,000
$1,200
DRG B70A DRG B70B DRG B70C
RPAH GH RNSH BLH JHH
Note: Patients with a diagnosis of transient global amnesia are excluded.
Source: IPART analysis using data from hospital imaging services.
Figure 5.3 Average imaging costs for stroke patients by DRG – day of admission
$290 $293
$247
$0
$50
$100
$150
$200
$250
$300
$350
$400
DRG B70A DRG B70B DRG B70C
RPAH GH RNSH BLH JHH
Note: Patients with a diagnosis of transient global amnesia are excluded.
Data source: IPART analysis using data from hospital imaging services.
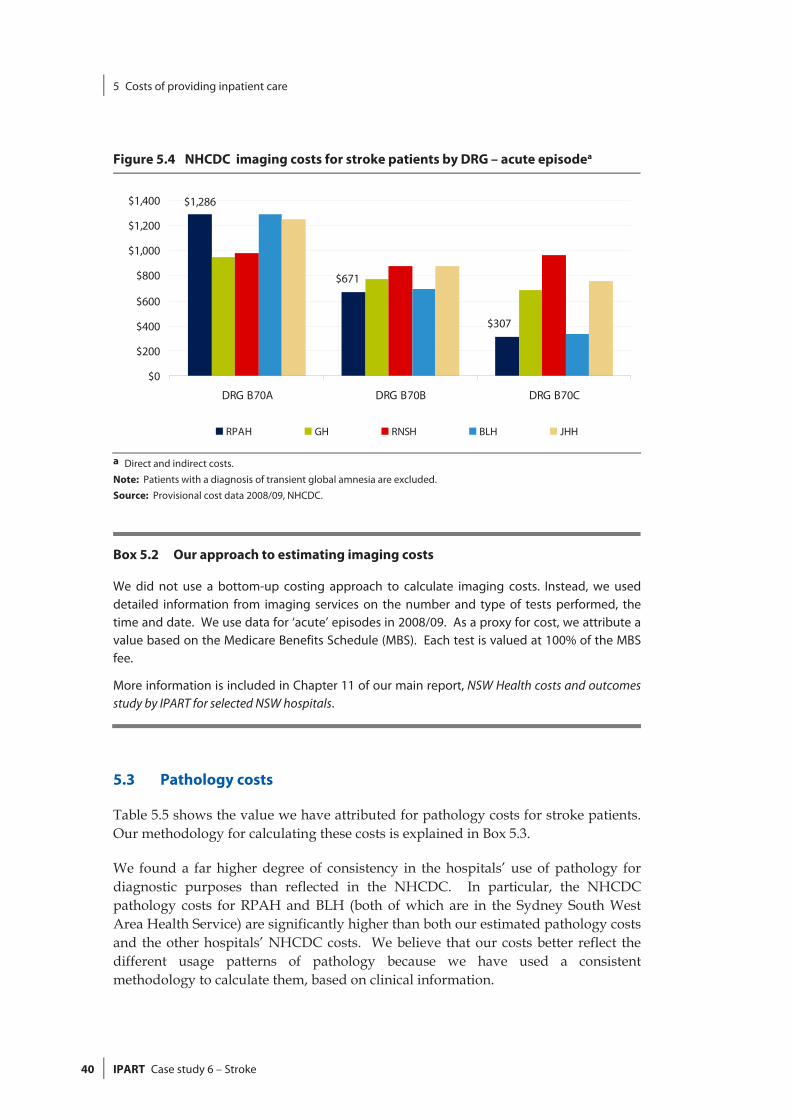
5 Costs of providing inpatient care
40 IPART Case study 6 – Stroke
Figure 5.4 NHCDC imaging costs for stroke patients by DRG – acute episodea
$1,286
$307
$671
$0
$200
$400
$600
$800
$1,000
$1,200
$1,400
DRG B70A DRG B70B DRG B70C
RPAH GH RNSH BLH JHH
a Direct and indirect costs.
Note: Patients with a diagnosis of transient global amnesia are excluded.
Source: Provisional cost data 2008/09, NHCDC.
Box 5.2 Our approach to estimating imaging costs
We did not use a bottom-up costing approach to calculate imaging costs. Instead, we useddetailed information from imaging services on the number and type of tests performed, thetime and date. We use data for ‘acute’ episodes in 2008/09. As a proxy for cost, we attribute avalue based on the Medicare Benefits Schedule (MBS). Each test is valued at 100% of the MBS fee.
More information is included in Chapter 11 of our main report, NSW Health costs and outcomes study by IPART for selected NSW hospitals.
5.3 Pathology costs
Table 5.5 shows the value we have attributed for pathology costs for stroke patients. Our methodology for calculating these costs is explained in Box 5.3.
We found a far higher degree of consistency in the hospitals’ use of pathology for diagnostic purposes than reflected in the NHCDC. In particular, the NHCDC pathology costs for RPAH and BLH (both of which are in the Sydney South West Area Health Service) are significantly higher than both our estimated pathology costs and the other hospitals’ NHCDC costs. We believe that our costs better reflect the different usage patterns of pathology because we have used a consistent methodology to calculate them, based on clinical information.
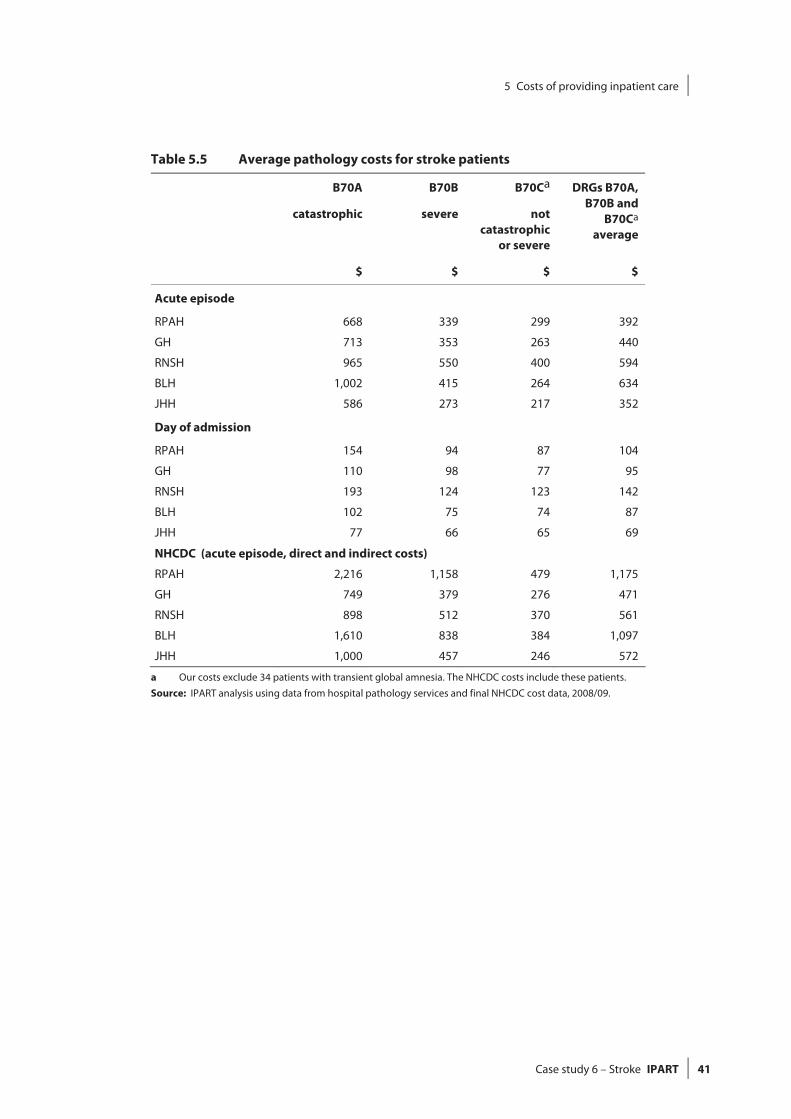
5 Costs of providing inpatient care
Case study 6 – Stroke IPART 41
Table 5.5 Average pathology costs for stroke patients
B70A
catastrophic
B70B
severe
B70Ca
not catastrophic
or severe
DRGs B70A, B70B and
B70Ca average
$ $ $ $
Acute episode
RPAH 668 339 299 392
GH 713 353 263 440
RNSH 965 550 400 594
BLH 1,002 415 264 634
JHH 586 273 217 352
Day of admission
RPAH 154 94 87 104
GH 110 98 77 95
RNSH 193 124 123 142
BLH 102 75 74 87
JHH 77 66 65 69
NHCDC (acute episode, direct and indirect costs)
RPAH 2,216 1,158 479 1,175
GH 749 379 276 471
RNSH 898 512 370 561
BLH 1,610 838 384 1,097
JHH 1,000 457 246 572
a Our costs exclude 34 patients with transient global amnesia. The NHCDC costs include these patients. Source: IPART analysis using data from hospital pathology services and final NHCDC cost data, 2008/09.
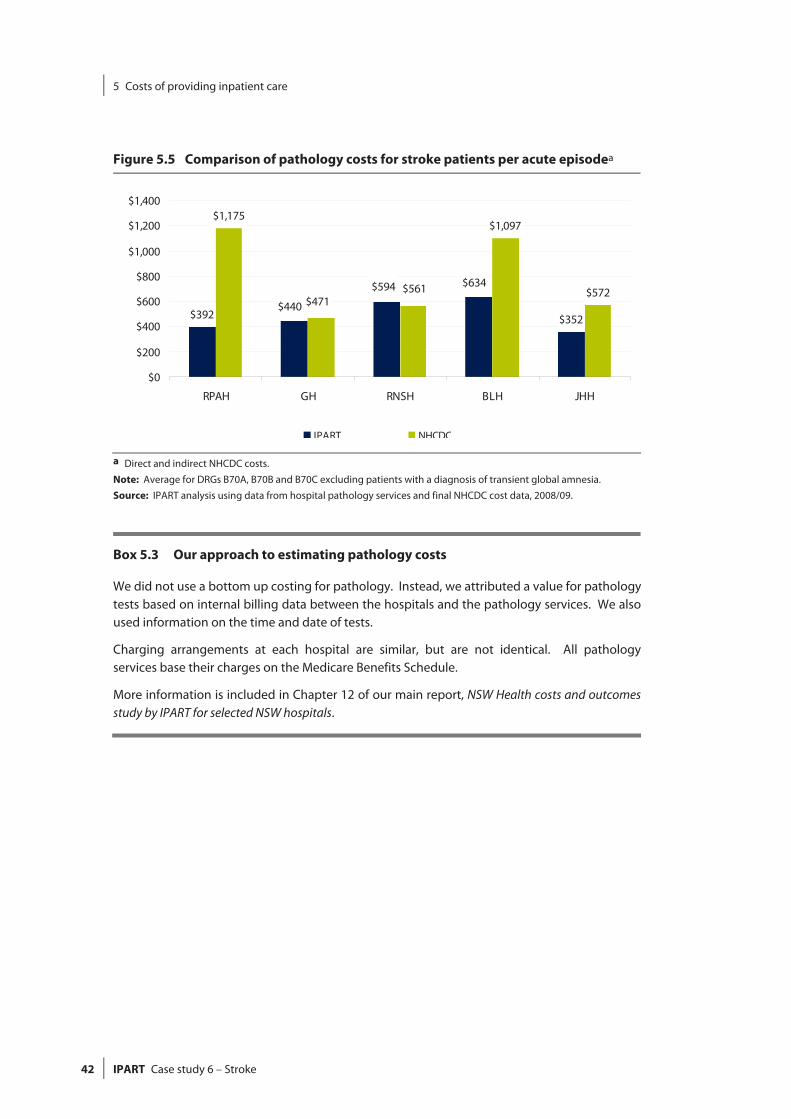
5 Costs of providing inpatient care
42 IPART Case study 6 – Stroke
Figure 5.5 Comparison of pathology costs for stroke patients per acute episodea
$392 $352
$1,175$1,097
$572$634$594
$440 $471$561
$0
$200
$400
$600
$800
$1,000
$1,200
$1,400
RPAH GH RNSH BLH JHH
IPART NHCDC a Direct and indirect NHCDC costs.
Note: Average for DRGs B70A, B70B and B70C excluding patients with a diagnosis of transient global amnesia.
Source: IPART analysis using data from hospital pathology services and final NHCDC cost data, 2008/09.
Box 5.3 Our approach to estimating pathology costs
We did not use a bottom up costing for pathology. Instead, we attributed a value for pathology tests based on internal billing data between the hospitals and the pathology services. We also used information on the time and date of tests.
Charging arrangements at each hospital are similar, but are not identical. All pathology services base their charges on the Medicare Benefits Schedule.
More information is included in Chapter 12 of our main report, NSW Health costs and outcomes study by IPART for selected NSW hospitals.
6 Configurations of care
Case study 6 – Stroke IPART 43
6 Configurations of care
The term ‘configurations of care’ refers to the way that hospitals choose to manage and provide patient care, including their clinical practices. The particular configurations of care within a hospital can be influenced by a complex array of factors, including national or state-wide guidelines or protocols, the culture, practices and controls of the individual hospital, the culture and practices of each clinical unit and its leadership and the preferences of each clinician. Differences in the way hospitals manage and provide patient care can also lead to differences in the costs and outcomes of that care.
During our hospital visits, we identified and obtained information on 5 major differences in the way the study hospitals managed and provided care for stroke patients. These comprise differences in:
Arrangements with the NSW Ambulance Service to minimise delays.
How effectively the emergency departments worked to minimise delays.
The administration of clot-dissolving medication (tPA).
The use of surgery to remove clots.
The way rehabilitation is organised.
We found that JHH and GH have bypass arrangements with NSW Ambulance Service to deliver some stroke patients to the stroke unit with minimum delay. The other hospitals do not have such arrangements.
We found that there may be delays in getting patients to the stroke unit at RPAH and RNSH due to the absence of protocols with NSW Ambulance Service for stroke patients, as well as road congestion. Also, the emergency department at RPAH is very busy.
JHH and GH have higher rates of tPA administration than any of the other study hospitals. The use of tPA for stroke is however a relatively new medical approach which is not universally accepted because it carries a risk of complications due to bleeding. Only RPAH and RNSH remove blood clots surgically.
6 Configurations of care
44 IPART Case study 6 – Stroke
Finally, we found that there were differences in the way hospitals arrange rehabilitation services for patients that need it. At BLH, almost all rehabilitation occurs on-site, beginning in the acute ward. The other hospitals transfer most or all their patients to other facilities for rehabilitation. Shortages of places in these rehabilitation facilities can lead to longer than necessary stays in acute wards.
The sections below discuss our findings on differences in configuration of care in more detail, after a brief discussion about the role and function of the stroke units.
6.1 Stroke units
Stroke units provide specialised clinical care to stroke patients in the acute phase of the disease. This care is provided by a combination of medical, nursing and allied health staff, such as physiotherapists, speech therapists and occupational therapists. NSW Health has established stroke units in a number of the major hospitals. There are currently 23 stroke units in NSW.34
Each of the study hospitals has a stroke unit. The stroke units at RPAH, JHH and GH are open at all hours, while the stroke units at RNSH and BLH are open only during working hours, Monday to Friday.
6.2 Rapid notification and bypass protocols with NSW Ambulance Service
Stroke is a medical emergency. It is important for people who have had a stroke or who are suspected of having a stroke to get to a hospital as soon as possible. Delays in getting to a hospital narrow the treatment options and result in more serious brain damage. The ambulance service plays a critical role in the care of stroke patients.
JHH and GH have introduced rapid notification protocols with the NSW Ambulance Service. When a patient is suspected of having had an ischaemic stroke less than 2 hours ago, the ambulance service notifies the stroke unit, bypasses local hospitals and the emergency department and takes the patient directly to the stroke unit. JHH and GH have also used the media to actively communicate to the community the need to get to hospital as soon as possible after a suspected stroke.
None of the other hospitals have rapid notification or emergency department bypass protocols with the NSW Ambulance Service, and delays occur in getting patients to the stroke units.
34 NSW Health, (http://www.health.nsw.gov.au/gmct/stroke/index.asp).
6 Configurations of care
Case study 6 – Stroke IPART 45
Clinicians at RPAH believe there is a lack of a system between the hospitals and the NSW Ambulance Service to coordinate the rapid transfer of stroke patients. They observed that ambulances often take suspected stroke patients to other hospitals instead of RPAH. Ambulances may be diverted to other hospitals due to congestion on the roads, or sometimes because RPAH’s emergency department is very busy. We understand that this type of networking arrangement has been established for patients with heart attacks that require emergency cardiac stenting.
We believe that there is scope for the Sydney based hospitals to make better arrangements with the NSW Ambulance Service to deliver suspected stroke patients to the Stroke Units with minimum delay.
6.3 Emergency departments
As discussed in Chapter 3, the vast majority of stroke patients are emergency admissions, and most of these patients are admitted through the emergency department.35 The hospitals differ in how well the emergency department works to minimise delays.
We found that the emergency department at JHH works particularly well with the stroke unit to minimise delays. The emergency department at GH also works well. As discussed above, some suspected stroke patients at both of these hospitals bypass the emergency department and are admitted directly to the stroke unit. This both saves time and reduces the possibility of communication breakdowns.
At RNSH the stroke team is notified immediately if a suspected stroke patient arrives during standard working hours. Stroke unit staff will then go to the emergency department to do the assessment.
RPAH has a very busy emergency department, and this may cause delays for stroke patients who might be eligible for tPA treatment. These delays arise mainly because ambulances are sometimes redirected to other hospitals when RPAH’s emergency department is too busy.
We understand that senior clinicians at BLH have differences of opinion regarding the risks and benefits of using tPA for stroke. This may be a factor limiting the use of this treatment option.
35 Some patients who are transferred from other hospitals are admitted as planned patients.
6 Configurations of care
46 IPART Case study 6 – Stroke
6.4 Use of Tissue Plasminogen Activator (tPA)
Tissue Plasminogen Activator (tPA) is a drug that is used to dissolve blood clots. It is used to treat ischaemic strokes (ie, strokes caused by blood clots), and must be intravenously administered within 3 hours of the onset of a stroke.36 It can significantly reduce the amount of damage to the brain, leading to an earlier discharge and less loss of function.37 However, treating stroke with tPA carries a risk of complications due to bleeding.38 Some clinicians consider that the potential benefits of tPA are outweighed by the risk of bleeding. The use of tPA requires careful management by specialist staff, and involves a series of protocols such as a CT scan to confirm type of stroke, knowing the amount of time that has elapsed since the onset of the stroke, and patient monitoring. The drug has been used to treat heart attacks for many years, but has only more recently been used to treat stroke.39
Treatment with tPA is not coded, so we did not have accurate data on the rate of tPA administration in the study hospitals. Instead, we relied on estimates provided by the hospitals.
JHH and GH provided tPA treatment to about 12% to 14% of stroke patients, compared with roughly 5% of patients at RPAH and RNSH. The high rate of tPA administration at JHH and GH was possible because more patients reached the stroke unit within the required time frame, partly as a result of the rapid notification and bypass protocols with NSW Ambulance Service. Less congested roads in these areas may also make it easier to get suspected stroke patients to hospital in time.
BLH had the lowest rate of tPA administration. One reason for this is that the treatment requires specialist staff to assess the patients and initiate treatment, and there was only 1 staff specialist willing and able to take on this role. We also found that there was not universal acceptance of tPA for stroke in the emergency department. In this context, it is interesting to note that BLH had the highest proportion of cases with the most severe complications or comorbidities (ie, in DRG B70A). As discussed in Chapter 3, it is possible that the rate of tPA administration is a factor in this but we could not examine this possibility because tPA administration is not coded as a procedure in the hospital data set.
Given the importance of timing in the administration of tPA, we believe that it might be worth investigating whether it is useful (and possible) to combine NSW Ambulance Service data on response time with hospital patient data. This will help to monitor how the NSW Ambulance Service and hospitals are working together to minimise delay. It will also provide useful data for outcome indicators. 36 Research is still being conducted on the exact timeframe for tPA administration. 37 American Heart Association, (http://www.americanheart.org/presenter.jhtml?identifier=4751)
and, National Stroke Foundation, Clinical Guidelines for Acute Stroke Management, 2007, pp 23 -23. 38 Medline Plus on Thrombolytic therapy,
(http://www.nlm.nih.gov/medlineplus/ency/article/007089.htm). 39 TPA was approved for ischemic strokes by the Food and Drug Administration (USA) in 1996
American Heart Association, (http://www.americanheart.org/presenter.jhtml?identifier=4751).
6 Configurations of care
Case study 6 – Stroke IPART 47
Recommendations
2 That NSW Health arranges for appropriate clinical expert groups to consider developing consistent guidelines for the administration of tPA.
3 That NSW Health considers including tPA administration as a procedure in coding standards.
4 That NSW Health considers ways to improve transfers of suspected stroke patients to stroke units with minimum delay, including consultation with the Ambulance Service and Emergency Departments.
5 That NSW Health investigates whether it is useful and possible to combine Ambulance Service data on response time with hospital patient data to monitor time from call to ambulance to arrival at an appropriate hospital.
6.5 Clot retrieval
Another treatment method is to remove the clot mechanically. This is done by passing a wire into the clot through the blood vessels and pulling it out, using imaging technology to guide the procedure (ie, interventional radiology). Clot retrieval is suitable for only a very small number of patients, depending on the size and severity of the stroke and how accessible the clot is. The window for treatment is longer than for tPA administration. However, there is a risk that this procedure could damage the blood vessel walls. It is also a more resource intensive procedure than administering tPA intravenously.40
Only RNSH and RPAH do clot retrieval. RNSH does more than any other stroke unit in NSW.
6.6 Rehabilitation
The hospitals have different arrangements for providing rehabilitation. BLH undertakes most rehabilitation on site, beginning in the acute ward as soon as possible after the stroke. Patients are later transferred to a rehabilitation ward within the hospital. JHH transfers some patients to a residential ward within the hospital as part of rehabilitation. The other hospitals transfer their patients to other facilities for rehabilitation. For example, RNSH transfers patients to Greenwich or Ryde Rehabilitation facility or private facilities; RPAH frequently transfers patients to Balmain Hospital and GH sends patients to rehabilitation beds at Wyong Hospital or transitional beds at Woy Woy.
40 For example, see ‘Does the Merci Retriever Work?’ Stroke, 37, 2006, pp 1340-1341, American
Heart Association, (http://stroke.ahajournals.org/cgi/content/full/strokeaha;37/5/1340), Mechanical Retrieval and Recanalization of Stroke Clots Using Embolectomy, ClinicalTrials.gov, a service of the US National Institutes of Health, (http://clinicaltrials.gov/ct2/show/NCT00389467) and National Stroke Foundation, Clinical Guidelines for Acute Stroke Management, 2007, p 24.
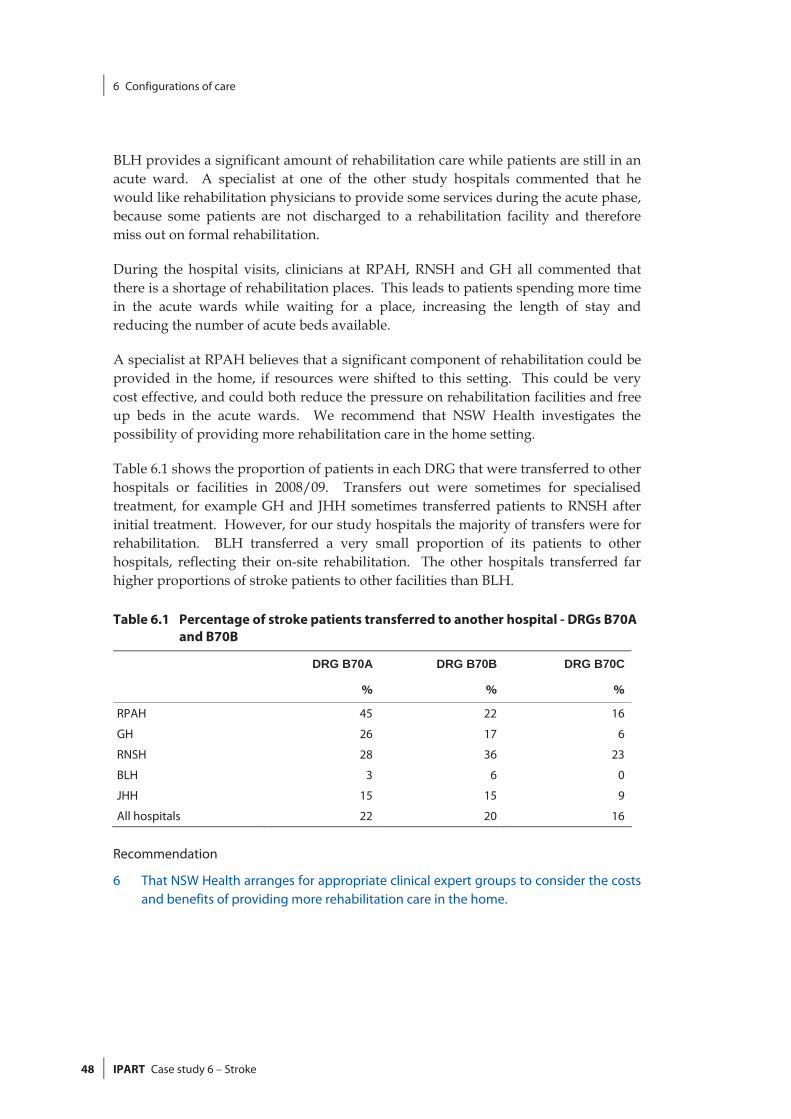
6 Configurations of care
48 IPART Case study 6 – Stroke
BLH provides a significant amount of rehabilitation care while patients are still in an acute ward. A specialist at one of the other study hospitals commented that he would like rehabilitation physicians to provide some services during the acute phase, because some patients are not discharged to a rehabilitation facility and therefore miss out on formal rehabilitation.
During the hospital visits, clinicians at RPAH, RNSH and GH all commented that there is a shortage of rehabilitation places. This leads to patients spending more time in the acute wards while waiting for a place, increasing the length of stay and reducing the number of acute beds available.
A specialist at RPAH believes that a significant component of rehabilitation could be provided in the home, if resources were shifted to this setting. This could be very cost effective, and could both reduce the pressure on rehabilitation facilities and free up beds in the acute wards. We recommend that NSW Health investigates the possibility of providing more rehabilitation care in the home setting.
Table 6.1 shows the proportion of patients in each DRG that were transferred to other hospitals or facilities in 2008/09. Transfers out were sometimes for specialised treatment, for example GH and JHH sometimes transferred patients to RNSH after initial treatment. However, for our study hospitals the majority of transfers were for rehabilitation. BLH transferred a very small proportion of its patients to other hospitals, reflecting their on-site rehabilitation. The other hospitals transferred far higher proportions of stroke patients to other facilities than BLH.
Table 6.1 Percentage of stroke patients transferred to another hospital - DRGs B70A and B70B
DRG B70A DRG B70B DRG B70C
% % %
RPAH 45 22 16
GH 26 17 6
RNSH 28 36 23
BLH 3 6 0
JHH 15 15 9
All hospitals 22 20 16
Recommendation
6 That NSW Health arranges for appropriate clinical expert groups to consider the costs and benefits of providing more rehabilitation care in the home.
7 Outcome, safety and quality indicators
Case study 6 – Stroke IPART 49
7 Outcome, safety and quality indicators
The terms of reference for this study required us to analyse available data on differences in clinical outcomes across the 5 study hospitals. However, while there are a number of safety and quality indicators being collected locally, at the state level and through clinical registries, there are few clinically agreed outcome indicators. As such, we found that data on only a few indicators of clinical outcomes are collected consistently across hospitals, or on a state-wide (or national) basis. Therefore, we worked with clinical experts to establish a set of outcome, safety and quality indicators that are clinically relevant, and for which we could feasibly obtain data in the timeframe for our study.
The sections below set out the clinical indicators we selected for stroke, discuss the indicator that we obtained from NSW Health (6-month survival rate), and show what data is available from the National Stroke Research Institute. We found that there were no statistically significant differences between the study hospitals’ risk-adjusted 6-month survival rates.
7.1 How we developed a set of clinical indicators
To identify the indicators we should focus on for this study, we worked with a number of eminent clinicians on our Clinical Reference Group41 to develop a set of outcome indicators. We also consulted clinicians in study hospitals and sought further advice from clinicians with specific expertise in the fields of interest, as well as other relevant organisations.
Essentially, we aimed to establish a list of indicators that were:
widely accepted as being clinically appropriate
likely to be available from NSW hospitals, the NSW Department of Health or other bodies, such as registries, and
feasible for IPART to collect or calculate.
41 In the early stages of the review, our Clinical Reference Group comprised Professor Bruce
Barraclough, Professor Clifford Hughes, Dr Michael Nicholl, Professor Ron Penny and Dr Hunter Watt. A number of other clinicians were consulted as part of this process.
7 Outcome, safety and quality indicators
50 IPART Case study 6 – Stroke
Following this clinical consultation, we established the set of indicators discussed in section 7.3 below. Some of these indicators are not true outcome indicators, but are safety and quality or process indicators. We were not able to obtain data for all of these indicators.
7.2 Analysing indicators and risk-adjusting for patient characteristics
It’s important to recognise that hospitals’ performance against many outcome indicators is not simple to interpret and, when considered in isolation, can be misleading. Therefore, this performance needs to be analysed within the appropriate context.
In addition, hospitals treat patients with different mixes of illnesses, which can influence the likelihood of adverse outcomes at the hospitals. To make meaningful and fair comparisons of the performance of the study hospitals on some outcome indicators, the analyses were risk-adjusted for factors outside the control of the hospitals (ie, differences in patient characteristics – see Box 7.1).
Appendix B provides further details for the risk-adjusted indicator provided by NSW Health, including the data sources used, the relevant time period for the data and the adjustment factors applied.
7 Outcome, safety and quality indicators
Case study 6 – Stroke IPART 51
Box 7.1 How data on indicators was risk-adjusted for differences in patient characteristics
To meaningfully compare the performance of the study hospitals on some outcome indicators, the hospitals’ data on these indicators needed to be risk-adjusted to account for differences in patient characteristics that can influence the likelihood of adverse outcomes. In particular, NSWHealth adjusted data on survival rates for the following patient characteristics:
age
sex
comorbidity, and
socio-economic status.a
To adjust for comorbidity, NSW Health used the Charlson index. This index simplifies the wide range of comorbidities that may affect patients. It groups clinical conditions together (using ICD 10), and assigns numerical weights (eg, 1, 2, 3) to them, based on the risk of dying associated with the condition.b Adding together the numerical weights for a patient’scomorbidities determines the patient’s combined Charlson index score, and therefore the severity of their comorbidities
To make these adjustments, NSW Health used logistic regression in SAS 9.2. Where there weresufficient numbers, it took repeated measures for the same person into account using multi-level modelling. Where the number of events was too low to allow the above adjustment to be carried out in full, the degree of adjustment was reduced and this was noted for each indicator.
a The ABS Index of Relative Socio-Economic Disadvantage (IRSD) was used to estimate socio-economic status. The IRSD was assigned at Local Government Area level and grouped into quintiles from least disadvantaged to mostdisadvantaged for analysis. b Australian Institute of Health and Welfare, D Ben-Tovim, R Woodman, J Harrison, S Pointer, P Hakendorf & G Henley, Measuring and reporting mortality in hospital patients, March 2009, p 18,(http://www.aihw.gov.au/publications/hse/hse-69-10729/hse-69-10729.pdf).
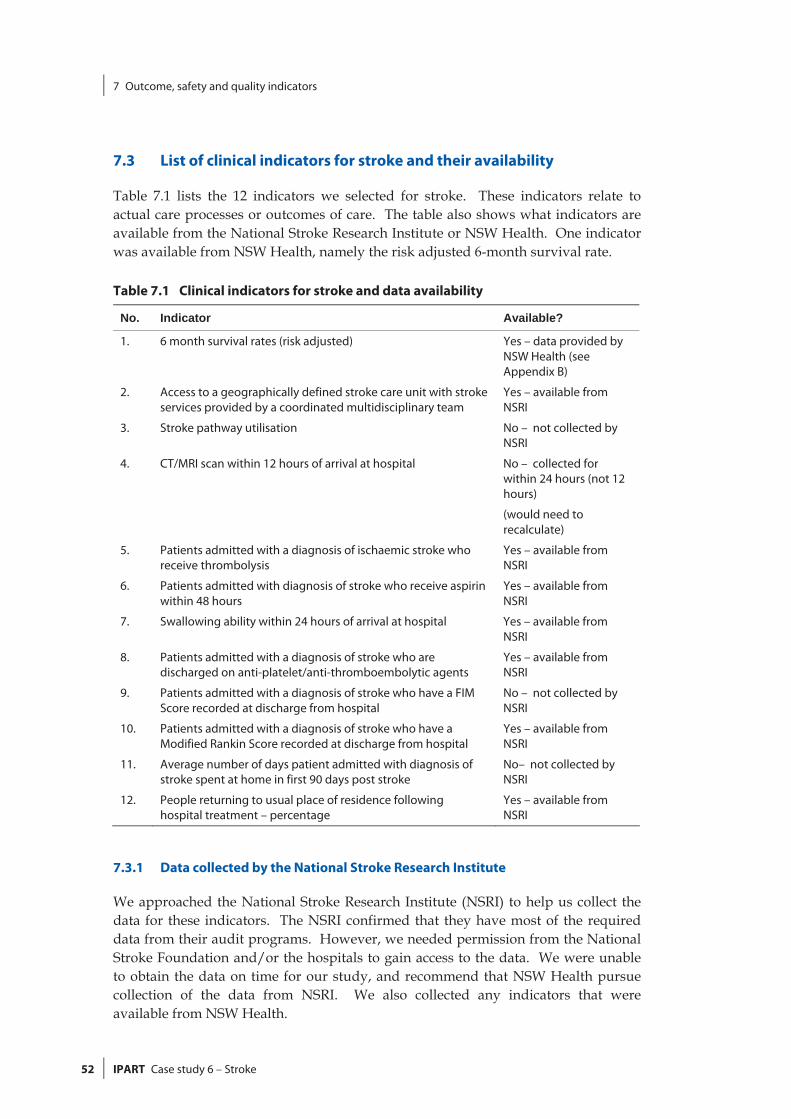
7 Outcome, safety and quality indicators
52 IPART Case study 6 – Stroke
7.3 List of clinical indicators for stroke and their availability
Table 7.1 lists the 12 indicators we selected for stroke. These indicators relate to actual care processes or outcomes of care. The table also shows what indicators are available from the National Stroke Research Institute or NSW Health. One indicator was available from NSW Health, namely the risk adjusted 6-month survival rate.
Table 7.1 Clinical indicators for stroke and data availability
No. Indicator Available?
1. 6 month survival rates (risk adjusted) Yes – data provided by NSW Health (see Appendix B)
2. Access to a geographically defined stroke care unit with stroke services provided by a coordinated multidisciplinary team
Yes – available from NSRI
3. Stroke pathway utilisation No – not collected by NSRI
4. CT/MRI scan within 12 hours of arrival at hospital No – collected for within 24 hours (not 12 hours)
(would need to recalculate)
5. Patients admitted with a diagnosis of ischaemic stroke who receive thrombolysis
Yes – available from NSRI
6. Patients admitted with diagnosis of stroke who receive aspirin within 48 hours
Yes – available from NSRI
7. Swallowing ability within 24 hours of arrival at hospital Yes – available from NSRI
8. Patients admitted with a diagnosis of stroke who are discharged on anti-platelet/anti-thromboembolytic agents
Yes – available from NSRI
9. Patients admitted with a diagnosis of stroke who have a FIM Score recorded at discharge from hospital
No – not collected by NSRI
10. Patients admitted with a diagnosis of stroke who have a Modified Rankin Score recorded at discharge from hospital
Yes – available from NSRI
11. Average number of days patient admitted with diagnosis of stroke spent at home in first 90 days post stroke
No– not collected by NSRI
12. People returning to usual place of residence following hospital treatment – percentage
Yes – available from NSRI
7.3.1 Data collected by the National Stroke Research Institute
We approached the National Stroke Research Institute (NSRI) to help us collect the data for these indicators. The NSRI confirmed that they have most of the required data from their audit programs. However, we needed permission from the National Stroke Foundation and/or the hospitals to gain access to the data. We were unable to obtain the data on time for our study, and recommend that NSW Health pursue collection of the data from NSRI. We also collected any indicators that were available from NSW Health.
7 Outcome, safety and quality indicators
Case study 6 – Stroke IPART 53
Recommendation:
7 That NSW Health pursues the collection of the data on outcome indicators from the National Stroke Research Institute.
7.3.2 6-month survival rates
This indicator measures the survival rate for patients within 6 months of a stroke.
NSW Health provided survival data and survival rates for stroke patients for the 5 hospitals and calculated and provided risk-adjusted odds ratios for these rates using the method set out in Box 7.2.
NSW Health risk-adjusted each hospital’s survival data for patient age, sex, comorbidities (using the Charlson index) and socio-economic status using the approach set out in Box 7.1.
In the 3-year period 2005/06 to 2007/08, there were 5,408 hospital admissions for the 5 hospitals for stroke. The overall crude 6-month survival rate was 726.9 per 1,000. There were no statistically significant differences in risk-adjusted survival rates between the 5 hospitals.
7 Outcome, safety and quality indicators
54 IPART Case study 6 – Stroke
Box 7.2 Calculating survival rates
The NSW Department of Health’s Centre for Epidemiology and Research calculated risk-adjusted odds ratios for survival for patients treated in each study hospital in the stroke case study area, using the methodology outlined below. We note that the NSW Department of Health does not usually undertake this type of analysis.
Data sources
The analysis for mortality and survival, apart from in-hospital mortality, was carried out using linked records of the NSW Admitted Patient Data Collection (APDC) and NSW Registry of Births, Deaths and Marriages death registration data. The analysis for in-hospital mortality was carried out using linked records of the APDC. In-hospital deaths and deaths from all causes were included for all relevant indicators.
Case-based analysis
As one person may have more than one admission for a specified condition, the analyses were‘case-based’, where a case represents a hospital admission for a specified condition. Thismeans that, for example, if a person died after 2 hospital admissions for a specified conditionand the death occurred within the period specified by the indicator, then the case andtherefore the death would be counted twice.
Adjusting for risk and comparing hospitals
Indicators were adjusted for patient age, sex, comorbidity and socio-economic status as described in Box 7.1.
Hospitals that were not significantly different in the adjustment model (at p<0.05) weregrouped.
7 Outcome, safety and quality indicators
Case study 6 – Stroke IPART 55
Box 7.3 Risk-adjusted odds ratios
Risk-adjusted odds ratios were calculated for hospitals in order to highlight differences in ratesbetween the hospitals.a The ‘odds ratio’ is the ratio of the odds of an event occurring at one hospital to the odds of it occurring at another hospital.b
If the odds ratio between two hospitals is:
1 – the event is equally likely to occur at both hospitals
>1 – the event is more likely to occur at the first hospital
<1 – the event is less likely to occur at the first hospital.
As an example, assume Hospital A has 15 infections and Hospital B has 10 infections, out of1,000 patients at each hospital. The odds of infection at Hospital A and Hospital B are 15/985and 10/990 respectively. The odds ratio of infection between Hospital A and Hospital B is(15/985) / (10/990) or 1.51. This odds ratio indicates that the odds of infection at Hospital A arearound 50% higher than at Hospital B.
a Odds ratios are widely used in medical literature to examine the effects of other variables on the relationship between two binary variables, using logistic regression (J Bland “The odds ratio”, British Medical Journal, 320, 2000, p 1468; S Simon “Understanding the Odds Ratio and the Relative Risk”, Journal of Andrology, 22 2001, p 533). The odds ratios were risk-adjusted for patient characteristics using the approach discussed in Box 7.1. b The ‘odds of an event occurring’ is equal to the probability that the event occurs divided by the probability that it does not occur.


7 Outcome, safety and quality indicators
Case study 6 – Stroke IPART 57
Appendix

7 Outcome, safety and quality indicators
58 IPART Case study 6 – Stroke
A Full list of recommendations from main report
Case study 6 – Stroke IPART 59
A Full list of recommendations from main report
Consistency of DRG groupings
Our recommendations in this area are mainly aimed at making users of hospital data aware of some of the limitations of using DRG groupings for hospital comparisons in certain clinical areas.
1 That users of hospital cost and outcome data note that DRGs may contain a range of patient types with varying clinical resource requirements, costs of care and expected clinical outcomes. Therefore DRGs may not always provide the optimal basis for comparing costs and outcomes among hospitals.
2 In light of Recommendation 1, that the NSW Department of Health, and other health research bodies at both the state and national level, consider whether DRGs are a suitable basis for determining funding and comparing performance among hospitals (for various different types of hospital activity). Where they are not suitable, continue research to develop better approaches for these areas.
Consistency of patient numbers
Our recommendations on patient numbers are aimed at making users of hospital data aware of differences in patient counting practices and patient datasets between hospitals that can affect hospital comparisons, to improve consistency of patient counting practices between hospitals and lead to better integration of patient datasets.
3 That users of hospital data note that there are differences in practices relating to counting of patients that can affect hospital patient numbers and average cost comparisons eg, counting differences relating to admission status, billing status, location of care and collaborative care arrangements.
4 In light of Recommendation 3, that NSW Health clarifies and standardises administrative procedures including guidelines for recording of non-inpatients of various types, as well as ‘collaborative care’ patients.
5 That NSW Health considers ways of better integrating patient information held locally by hospital clinical units (such as eye clinics and cardiac catheter labs) with the HIE data set.
A Full list of recommendations from main report
60 IPART Case study 6 – Stroke
Consistency of lengths of stay
Our recommendations aim to improve consistency between hospitals on length of stay measures, and to make users of hospital data aware of the limitations of measures based on ‘acute episodes’.
6 That NSW Health monitors hospital practices relating to the classification of episodes into care types and type-changing practices (eg, timing of type changes from acute to rehabilitation care) and provide clear and consistent guidelines to hospitals, so episode measures are more consistent among hospitals.
7 That users of hospital data note that 'acute episodes' often only represent a part of a patient's hospital stay. Therefore, comparisons among hospitals using acute length of stay measures or acute costs may produce misleading results. This is particularly important for conditions that involve both acute and sub-acute care and/or transfers between facilities.
Coding
We have made recommendations aimed at improving the quality of medical records documentation and clinical coding in hospitals to both improve the quality of data for clinical research as well as to more accurately reflect casemix complexity.
8 That NSW Health should continue to improve the quality of medical record documentation and the accuracy and consistency of coding.
9 That hospitals should encourage consistent education on coding and facilitate communication between clinical staff and coders regarding both the coding process and the documentation required to code common clinical conditions, diagnoses or complications, such as AMI, angina and chest pain.
10 Where pathology test information can be readily extracted (eg, Cerner sites), that systems be developed so this information can be used to validate coding and support work on variation in clinical practice and measuring clinical quality.
11 That NSW Health considers undertaking further analysis to identify pathology or imaging tests that can be used to help target audits of coding and support work on variation in clinical practice and measuring clinical quality – such as identifying types of pathology tests that correspond closely with diagnosis coding.
A Full list of recommendations from main report
Case study 6 – Stroke IPART 61
Clinical costing
Our recommendations are aimed at improving the quality and consistency of clinical costing data, and helping to ensure that quality costing data and clinical inputs to the costing process (such as data from prosthesis, pathology and imaging systems) can be used to inform hospital management about resource use, and clinicians about clinical practice.
12 That the NSW Department of Health works with the area health services and hospitals to apply a consistent set of rules for clinical costing covering cost centres and IFRACs so that data are consistent and comparable between the hospitals.
13 That NSW Health regularly audits the accuracy of cost centres and IFRACs used for clinical costing.
14 That NSW Health uses standard clinical data feeds (actual patient data) for clinical costing where this is feasible and useful.
15 That the data used for clinical costing purposes be available to hospitals and clinicians so they can undertake comparative analysis on clinical practices and performance.
Medical staff costs
Given our finding that there was a lack of consistency in the treatment of medical staff costs and the difficulty this created in estimating medical staff costs for our case study areas, we recommend:
16 That further work be undertaken to strengthen the quality and consistency of available information on medical staff costs.
Prosthesis costs
Our recommendations on prosthesis costs are aimed at improving prosthesis purchasing and making cost savings in this area. These should be considered in conjunction with our recommendation that clinical experts should review the appropriateness of clinical variation in prosthesis use and address this variation (see Recommendation 31).
17 That NSW Health notes the variation in prostheses use among the study hospitals including:
– drug-eluting stents versus bare metal stents
– single chamber pacemakers versus dual chamber pacemakers
– different types of components for hip replacement procedures.
18 That NSW Health notes the range of approaches to prosthesis controls and the variation in prices currently paid for prostheses, including for exactly the same models.
A Full list of recommendations from main report
62 IPART Case study 6 – Stroke
19 That NSW Health facilitates sharing of information on purchase prices for prostheses to assist price negotiations with suppliers.
20 That NSW Health optimises prosthesis cost savings through tenders, supplier price agreements and controlled approaches to prosthesis purchasing, noting that clinical consultation and cooperation is essential as is retaining some flexibility to allow for special orders when clinically indicated.
Imaging and pathology costs
Our recommendations are aimed at encouraging better use of imaging and pathology data, and consideration of whether there should be standard treatment of imaging and pathology within clinical costing and whether internal charges should reflect actual costs. These recommendations should be considered in conjunction with our clinical case studies, which include comparisons of imaging use, and Recommendation 31, relating to clinical variation in imaging use for diagnosing appendicitis.
21/25 That NSW Health notes that imaging and pathology data can be used to monitor changes in imaging use and inform clinical practice, and that:
– All hospitals obtain detailed reports from pathology and imaging services on their test ordering patterns, including the number of tests by major test type and the cost of these tests.
– Hospitals routinely provide data to heads of clinical units to help inform them on resource use and provision of care to improve patient outcomes and discuss trends at management meetings – for example, summary reports that include both the number of tests by test type, and the value (or preferably cost) of these tests.
– NSW Health develops reports comparing the use of imaging and pathology tests for clinical groupings and circulates these to area health services and hospitals.
22. That NSW Health considers whether, for clinical costing purposes, it is appropriate for hospitals and area health services to base the value of imaging tests on the MBS rate for these tests and, if so, what standard percentage of this rate is appropriate for use by all hospitals given the actual costs of providing the test.
23 That NSW Health seeks to obtain detailed information from the pathology services on the number and type of tests and the actual cost of undertaking a range of typical tests for future comparisons of pathology costs.
24 That NSW Health addresses issues that prevent the actual costs associated with specific pathology tests and ordering patterns being disclosed by pathology services.
26. That NSW Health considers whether the detailed cost estimates that pathology services prepare as part of the benchmarking pathology project could be used for more accurate pricing between pathology services and hospitals, to enable clinicians to consider the actual cost of their clinical decisions.
A Full list of recommendations from main report
Case study 6 – Stroke IPART 63
Operating theatre costs
Our recommendations in relation to operating theatres aim to facilitate improvements in theatre management arrangements, and the quality and consistency of theatre data.
27 That NSW Health notes the differences in approaches to theatre management among hospitals and consider if there is scope to share information about how the better theatre arrangements are organised.
28 That NSW Health notes the issues regarding theatre data and work with the hospitals to improve the completeness of datasheets and apply a consistent set of rules for recording operating theatre times.
29 That NSW Health considers routine auditing of the quality of data on returns to theatre and considers the best way for achieving accuracy and consistency in this indicator.
Pharmacy costs
As we were not able to undertake a detailed comparison of pharmacy services and costs, our recommendations focus on encouraging further analysis in this area.
30 That NSW Health:
– Notes the wide variation in the proportion of drugs dispensed versus held on imprest across the study hospitals.
– Monitors the value of expired pharmacy stock and compares this among hospitals.
– Considers standardised guidelines for the return of unused medication, principally to ensure patient safety but also to minimise wastage and reduce costs.
– Considers whether antimicrobial stewardship programs should be implemented at the major hospitals where such programs are not currently in place. The purpose of these programs would be to help prevent antimicrobial resistance and reduce costs by preventing inappropriate use of antimicrobials.
A Full list of recommendations from main report
64 IPART Case study 6 – Stroke
Configurations of care – Review of clinical variations during Stages 5 and 6 of the wider NSW Department of Health study
Our case studies identified a number of differences in the way care is provided among study hospitals in specific clinical areas. We recommend that clinical experts consider these clinical differences or clinical issues as part of Stages 5 and 6 of the wider health study. This recommendation should be dealt with in conjunction with Recommendation 36, relating to variation in indicators of safety, quality and outcomes.
31 That NSW Health arranges for appropriate clinical expert groups to consider the following clinical issues identified in our case studies; and that where appropriate, NSW Health and the expert groups take steps to address clinical differences.
– Hip joint replacement:
o Note that separation of planned and emergency cases may reduce lengths of stay for planned (arthritis) cases.
o Address the variation in the selection of hip prosthesis components (including press fit, cementless hip stems versus cemented hip stems and ceramic femoral heads versus metal femoral heads) among study hospitals.
– Major chest procedure:
o Note the different clinical pathways and high day of surgery admission rates for thoracic surgery patients at RPAH compared with other study hospitals.
o Consider whether aspects of the model of care at RPAH are suitable to be used in other hospitals.
– Breast surgery:
o Note the early discharge models at RNSH for breast surgery patients having mastectomies and
o Consider whether such models should be followed more widely in NSW hospitals and the types of patient cases they should be used for (eg, simpler, unilateral cases or younger patients).
– Cholecystectomy:
o Note the variation in the proportion of patients with cholelithiasis or cholecystitis who are operated on acutely as emergency admissions.
o Consider whether this variation has significant quality of care implications.
o Consider the relative costs and benefits of an emergency surgical services team model for ensuring early diagnosis and treatment of conditions like cholecystectomy and whether it should be more widely applied.
o Note that costing of cholecystectomy should take into account the costs of prior related emergency department attendances. A similar approach should be adopted for other clinical conditions that are likely to involve multiple prior emergency department attendances.
A Full list of recommendations from main report
Case study 6 – Stroke IPART 65
o Consider the relative costs and benefits of cholecystectomies with and without the use of fluoroscopy.
– Appendicectomy
o Note the variation in the use of imaging tests for diagnosing appendicitis.
o Consider establishing standard protocols for diagnosing appendicitis, indicating when it is appropriate to use CT scans, MRIs and ultrasounds.
o As part of establishing standard protocols for diagnosing appendicitis, consider whether CT scans, MRIs and ultrasounds should only be used for certain patient groups (eg, older patients who are more likely to be suffering from other conditions with symptoms similar to appendicitis).
o Consider the relative costs and benefits of laparoscopic versus open surgery for appendicitis.
– Stroke
o Consider ways to reduce the proportion of stroke patients coded with a principal diagnosis of 'stroke, not specified as haemorrhage or infarction' (ICD10 code I64).
o Consider developing consistent guidelines for the administration of tPA.
o Consider including tPA administration as a procedure in coding standards.
o Consider ways to improve transfers of suspected stroke patients to stroke units with minimum delay, including consultation with the Ambulance Service and Emergency Departments.
o Investigate whether it is useful and possible to combine Ambulance Service data on response time with hospital patient data to monitor time from call to ambulance to arrival at an appropriate hospital.
o Consider the costs and benefits of providing more rehabilitation care in the home.
o Pursue the collection of the data on outcome indicators from the National Stroke Research Institute.
– Cardiology – Stents, Pacemakers and Defibrillators:
o Address the variation in the use of drug-eluting stents versus bare metal stents among study hospitals.
o Address the variation in the types of pacemakers used among study hospitals.
o Investigate whether there are differences in treatment procedures, or waiting times between presentation and procedure, for patients who present to hospitals without a 24 hour cardiac catheter laboratory, compared to patients who present to hospitals with a 24 hour cardiac catheter laboratory, and whether any differences in procedure or waiting times have implications for clinical outcomes.
A Full list of recommendations from main report
66 IPART Case study 6 – Stroke
o Consider ways of better integrating information held in cardiac catheter laboratories with the HIE data set.
– Tracheostomy or ventilation greater than 95 hours:
o Note that at BLH, clinicians tend to perform surgical tracheostomies, whereas at the other hospitals, these are usually performed percutaneously.
– Cataract/lens procedure:
o Assess the costs and benefits of toric lenses and develop guidelines for their use in public hospitals.
– Hysterectomy:
o That any future studies of hysterectomy compare the costs and outcomes for hysterectomies with the costs and outcomes of other procedures such as endometrial ablation and uterine artery embolisation.
Improving outcome, safety and quality indicators
While current Commonwealth and State initiatives will improve outcomes data, we have made recommendations that will assist this process.
32 That NSW Health enhances understanding and use of mortality, survival, unplanned readmission and wound infection indicators and their risk adjustment by:
– continuing to contribute to the development of ACSQHC’s safety and quality standards for these indicators
– refining the methodology used for standardising or risk-adjusting these indicators
– continuing to consult with clinicians regarding the agreed presentation of mortality, survival unplanned readmission and wound infection information
– reporting this information on a more routine and regular basis consistent with ACSQHC data sets.
33 That NSW Health encourages hospitals to put in place systems to facilitate accurate coding of comorbidities and ensures that coding practices are consistent across hospitals.
34 That NSW Health works with ACSQHC to negotiate more streamlined arrangements for access to data held by third parties (such as clinical registries) for clinical analysis, and makes these data available to hospitals and clinicians.
35 That NSW Health explores the possibility of providing outcomes information to clinicians in a more systematic way as an aid to clinical improvement and a key indicator of performance.
A Full list of recommendations from main report
Case study 6 – Stroke IPART 67
Indicators of safety, quality or outcomes, - review of clinical variations during stages 5 and 6 of the wider NSW Department of Health project
We have also made a number of findings relating to variations in indicators of safety, quality or outcomes. Where we have observed apparent differences among hospitals, these should be considered by clinical expert groups in completing stages 5 and 6 of the Department of Health’s wider project. These differences should be considered in conjunction with differences in clinical practice (Recommendation 31).
36 That clinical expert groups consider the following clinical issues; and where appropriate, NSW Health and clinical expert groups take steps to address clinical variations as part of Stages 5 and 6 of the broader NSW Health review:
– Review the variations in outcome, safety and quality indicators among study hospitals, including their:
o unplanned readmission rates
o wound infection rates for selected surgical procedures.
– Review the variation in mortality and survival rates for all major chest surgery patients and consider whether to recommend changes to clinical practice or conduct further investigation involving:
o a larger sample of hospitals, and
o more detailed analyses for ‘like patients’ (ie, lung cancer, infection-related abscess/pyothorax and collapsed/punctured lung patients).
– Review the variation in the following clinical indicators for hip joint replacement surgery at the study hospitals:
o wound infection rates
o unplanned readmission rates.
– Review the variation in wound infection rates for appendicectomy and cholecystectomy surgery at the study hospitals.
– Note the variation in the following clinical indicators relating to obstetric delivery:
o caesarean section rates for ‘selected primipara’
o vaginal delivery rates following primary caesarean section
o caesarean section rates after induction of labour for ‘selected primipara’
o repeat caesarean section rates
o significant tear rates
and monitor changes arising from the implementation of the NSW Health policy directive, Maternity – Towards Normal Birth in NSW, to determine whether this policy effectively addresses the variation.
A Full list of recommendations from main report
68 IPART Case study 6 – Stroke
Additional outcome indicators
We made recommendations to consider the costs and benefits of collecting data for the following areas where indicators are not commonly used.
37 That NSW Health considers the costs and benefits of collecting data and monitoring performance against the following indicators:
– warfarin management
– visual outcomes for patients undergoing lens procedures.
We also made a recommendation to develop a set of standard indicators for measuring care and/or outcomes in ICUs.
38 That NSW Health undertakes further work to develop a set of standard indicators for measuring care and/or outcomes in ICUs.
Time Out audits
Finally, we made a recommendation to improve consistency in the number of cases audited as part of the Time Out process relative to the number of separations.
39 That NSW Health specifies the number or proportion of patient cases that should be audited as part of the Time Out process.
Next steps - wider application of this study
40 That NSW Health refines and develops useful aspects of this study for application more widely to other hospitals, other health settings and other clinical conditions.
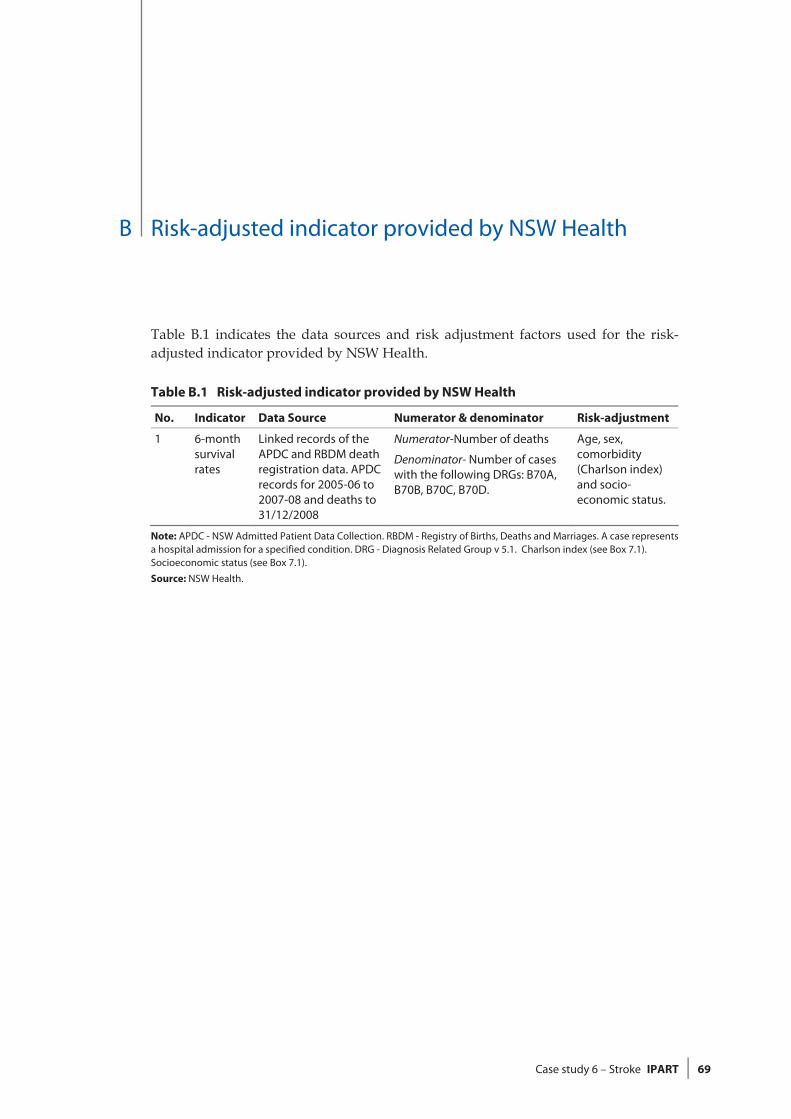
B Risk-adjusted indicator provided by NSW Health
Case study 6 – Stroke IPART 69
B Risk-adjusted indicator provided by NSW Health
Table B.1 indicates the data sources and risk adjustment factors used for the risk-adjusted indicator provided by NSW Health.
Table B.1 Risk-adjusted indicator provided by NSW Health
No. Indicator Data Source Numerator & denominator Risk-adjustment
1 6-month survival rates
Linked records of the APDC and RBDM death registration data. APDC records for 2005-06 to 2007-08 and deaths to 31/12/2008
Numerator-Number of deaths
Denominator- Number of cases with the following DRGs: B70A, B70B, B70C, B70D.
Age, sex, comorbidity (Charlson index) and socio-economic status.
Note: APDC - NSW Admitted Patient Data Collection. RBDM - Registry of Births, Deaths and Marriages. A case represents a hospital admission for a specified condition. DRG - Diagnosis Related Group v 5.1. Charlson index (see Box 7.1). Socioeconomic status (see Box 7.1).
Source: NSW Health.
Glossary
70 IPART Case study 6 – Stroke
Glossary
Term Abb. Definition
95% confidence interval
A statistical term describing a range of values within which we are 95% certain that the true population value lies.
Activity-based funding
ABF Funding that is based on the projected amount and type of work of a facility, where standard prices are set for similar work undertaken. This has also been referred to as casemix or episode funding.
Acute care Clinical services provided to admitted or non-admitted patients, including managing labour, curing illness or treating injury, performing surgery, relieving symptoms and/or reducing the severity of illness or injury, and performing diagnostic and therapeutic procedures. Most patients have acute or temporary ailments. The average length of stay is relatively short.
Admission The process by which a person commences a period of residential care in a health facility.
Admitted Patient Data Collection
APDC A database that covers all inpatient separations (discharges, transfers and deaths) from all Public (including Psychiatric), Private, and Repatriation Hospitals, Private Day Procedures Centres and Public Nursing Homes in NSW.
Agency for Clinical Innovation
ACI A board-governed statutory health corporation that reports to the NSW Minister for Health and the Director-General of NSW Health.
Amnesia A pathologic impairment of memory, usually the result of physical damage to areas of the brain.
Angiotensin-modifying medication
Medication that alters the blood pressure by changing the protein vessels (angiotensin) that causes increased blood pressure.
Antiplatelet medication
Medications that block the formation of blood clots by preventing the clumping of platelets.
Appendicectomy Surgical excision of the patient's appendix.
Assistant In Nursing AIN An employee that is not a registered nurse, enrolled nurse or trainee nurse, who assists the Enrolled Nurses and Registered Nurses by providing basic nursing care, working within a plan of care under the supervision and direction of a Registered Nurse.
Australian Council on Healthcare Standards
An independent organisation dedicated to improving the quality of health care through performance reviews, assessment and accreditation.
Glossary
Case study 6 – Stroke IPART 71
Term Abb. Definition
Average length of stay
ALOS The average number of days each admitted patient stays in hospital. This is calculated by dividing the total number of occupied bed days for the period by the number of actual separations in the period.
Bankstown-Lidcombe Hospital
BLH One of the study hospitals included in the review.
Bureau of Health Information
BHI An independent, board-governed organisation established by the NSW Government to be the leading source of information on the performance of the public health system in NSW.
Casemix The range and types of episodes of care of patients (the mix of cases) treated by a hospital. This provides a way of describing and comparing hospitals and other services for planning and managing health care. Casemix classifications put patients into DRGs with similar conditions that use similar health-care resources, so that the activity and cost-efficiency of different hospitals can be compared.
Casemix funding See Activity-based funding.
Cholecystectomy Excision of the gallbladder.
Clinical Excellence Commission
CEC A board-governed statutory health corporation with the CEO reporting directly to the NSW Minister for Health. A key role of the Clinical Excellence Commission is building capacity for quality and safety improvement in Health Services.
Clinical Nurse Specialist
CNS A Registered Nurse/Midwife who applies a high level of clinical nursing knowledge, experience and skills in providing complex nursing/midwifery care directed towards a specific area of practice, a defined population or defined service area, with minimum direct supervision.
Clopidogrel A drug that is used to prevent the formation of a blood clot in coronary artery disease.
Comorbidity When a person has two or more health problems at the same time.
Computed tomography
CT scan A non-invasive medical imaging method using X-rays and computer processing.
Diagnosis Related Group
DRG A system used to classify hospital admissions into groups with similar clinical conditions (related diagnoses) and similar resource usage (hospital services). There are approximately 500 coding classes. In Australian acute hospitals, Australian refined DRGs are used (AR-DRGs). The classification categorises episodes into groups with similar conditions and similar usage of hospital resources, using information in the hospital morbidity record such as the diagnoses, procedures and demographic characteristics.
Endothelial proliferation
The process that causes restenosis, a narrowing of the blood vessel leading to restricted blood flow.
Enrolled Nurse EN A person holding an Enrolled Nurse qualification who works under the supervision of a Registered Nurse to provide nursing care for patients in hospitals, nursing homes and a variety of other health care organisations.
Episode funding See Activity-based funding.
Glossary
72 IPART Case study 6 – Stroke
Term Abb. Definition
Fluoroscopy An imaging technique that provides real-time moving images of the internal structures of a patient through the use of a fluoroscope.
Gosford Hospital GH One of the study hospitals included in the review.
Haemorrhagic stroke
A stroke caused by lack of blood reaching the brain due to bleeding.
Health Information Exchange
HIE A database maintained by the NSW Department of Health that contains a range of financial, patient and clinical information from hospitals and area health services.
High dependency unit
HDU An area or environment in a hospital that provides a higher level of critical care and monitoring than is provided in a general ward, but a lower level of care provided by an intensive-care unit.
Hypotension Decrease of systolic and diastolic blood pressure below normal, ie low blood pressure.
Hysterectomy Surgical removal of the uterus.
Independent Pricing and Regulatory Tribunal of NSW
IPART The independent economic regulator for NSW that is undertaking this hospital study.
Inpatient fraction IFRAC A measure used in casemix costing. The proportion of total (or operating) costs that are attributed to admitted patients.
Intensive care unit ICU An area or environment in a hospital that provides the highest level of critical care and monitoring.
International Normalised Ratio
INR A comparative rating of a patient's prothrombin time (PT) ratio. It is used as a standard for monitoring the effects of the blood thinning drug warfarin.
Ischaemic stroke A type of stroke where blood supply to a part of the brain is decreased often due to atherosclerosis or a blood clot.
John Hunter Hospital
JHH One of the study hospitals included in the review.
Length of stay 1 LOS1 LOS1 is the episode length of stay in study hospital, ie, from the start of the episode to the end of the episode of care.
Length of stay 2 LOS2 LOS2 is the total length of stay in study hospital, ie, from admission to discharge at the study hospital.
Length of stay 3 LOS3 LOS3 is the total length of stay in study hospital plus up to 2 other hospitals - one transfer in and one transfer out.
Medical resonance imaging
MRI A medical imaging technique most commonly used in radiology to visualise detailed internal structures of the body using a magnetic field.
Medicare Benefits Schedule
MBS A listing of the Medicare services subsidised by the Australian government.
National Hospital Cost Data Collection
NHCDC The NHCDC contains component costs per DRG based on patient-costed and cost-modelled information. The NHCDC enables DRG Cost Weights and average costs for DRGs for acute in-patients to be produced.
Glossary
Case study 6 – Stroke IPART 73
Term Abb. Definition
NSW Health The broad term encompassing operational and other structures including the NSW Department of Health, Area Health Services, the Agency for Clinical Innovation, the Clinical Excellence Commission and a range of clinical taskforces.
Odds ratio OR The odds of an event occurring. This is equal to the probability that the event occurs divided by the probability that it does not occur.
Open Surgery An invasive medical procedure where an incision is required for direct surgical access to the organs.
Principal referral hospital
Hospital within peer group (principal referral hospitals 1b) classified as an acute hospital, treating 25,000 or more acute casemix weighted separations per annum, with an average cost weight greater than 1 and 1 or fewer specialty services.
Principal tertiary referral hospital
Hospital within peer group (principal referral hospitals 1a) classified as an acute hospital, treating 25,000 or more acute casemix weighted separations per annum, with an average cost weight greater than 1 and having more than 1 specialty service.
Prophylaxis Disease prevention, also called preventive treatment.
Registered nurse RN A qualified nurse who provides care for patients in a variety of healthcare settings. These include public and private hospitals, community and home-based services, nursing homes and industry.
Restenosis The reoccurrence of stenosis, a narrowing of a blood vessel, leading to restricted blood flow.
Royal North Shore Hospital
RNSH One of the study hospitals included in the review.
Royal Prince Alfred Hospital
RPAH One of the study hospitals included in the review.
Stenosis A narrowing of a blood vessel leading to restricted blood flow.
Stroke When an artery supplying blood to the brain suddenly becomes blocked or bleeds. Often causes paralysis of parts of the body normally controlled by that area of the brain, or speech problems and other symptoms.
Thrombolysis Dissolution of a stationary blood clot along the wall of a blood vessel, frequently causing vascular obstruction.
Thrombosis Clotting of blood, with the term usually applied to clotting within a blood vessel due to disease, as in a heart attack or stroke or as an unintended effect of surgery.
Tissue Plasminogen Activator
tPA A drug used to dissolve blood clots after a stroke so as to mitigate damage to the patient's brain.
Tracheostomy A surgical procedure to cut an opening into the trachea (windpipe) so that a tube can be inserted into the opening to assist breathing.
Transient global amnesia
A temporary episode of short-term memory loss without other neurological impairments.
Glossary
74 IPART Case study 6 – Stroke
Term Abb. Definition
Transient ischaemic attack
TIA A transient ischaemic attack (TIA) is a mini-stroke that warns of an impending stroke within hours, days, weeks or months. The symptoms of a TIA only last a short time, followed by a full recovery. A person who has had a TIA, or 'mini-stroke', is at greater risk of having a stroke or heart attack.
Venous Thrombo-embolism
VTE The process by which blood clots occur and travel through the veins. It is the collective term for deep vein thrombosis (the formation of a blood clot in one of the deep veins within the body, such as in the leg or pelvis) and pulmonary embolism (condition in which the arteries leading from the heart to the lungs becomes blocked).


![Case Study of Stroke[1]](https://img.pdfslide.us/doc/110x75/5512d1a14a7959c4028b4ac1/case-study-of-stroke1.jpg)