Embed Size (px)
Citation preview
Transforming health and social care in Kent and Medway is a partnership of all the NHS organisations in Kent and Medway, Kent County Council and Medway Council. We are working together to develop and deliver the Sustainability and Transformation Plan for our area.
Stroke Review Pre-Consultation Business Case
Appendix R
Financial Case
1
1
Overview of the Kent and Medway Stroke Review
Executive summary
Approach to financial modelling
Financial case
Appendix
Contents
2
Executive summaryOver 3,000 people whose nearest hospital is in Kent and Medway (K&M) have a stroke every year. Although hospital staff in K&M provide the best service they can, the way stroke services are set up currently, along with staff shortages, mean local hospitals do not consistently meet the national standards for clinical quality. Only one of the seven hospitals meets the national standard of regularly treating more than 500 stroke patients a year. Providers have struggled to meet the quality standards of the national Stroke Sentinel National Audit Programme (SSNAP); most scores are below average and although there have been some improvements since June 2014, this has been slow and is inconsistent. This data shows that at best, only 60% of patients are directly admitted to a stroke unit within four hours, and only 70% of patients are seen by a stroke consultant or stroke nurse within 24 hours.
In response to these challenges, the eight clinical commissioning groups (CCGs) in K&M (plus two CCGs outside K&M whose populations use stroke services in K&M) have been working together on the Stroke Review since late 2014. The ambition of the Stroke Review is to deliver clinically sustainable, high quality stroke services that are accessible to K&M residents 24 hours a day, seven days a week. The new model of care will:
• Deliver improved quality of care, patient experience and patient outcomes; • Fulfil the best practice recommendations as set out in the National Stroke Strategy 2007; and• Support the sustainability of K&M stroke services by consolidating hospital stroke care.
To deliver this ambition, CCGs are proposing the creation of hyper acute (HASU) and acute stroke units (ASU). A set of hurdle criteria was used to establish the optimal number of stroke units and concluded that three sites were needed. Three sites can deliver the activity requirements, meet an access standard of 60 minutes for 95% of the population, and are considered deliverable from a workforce perspective. A medium list of thirteen three-site options emerged from the hurdle process. The thirteen options were evaluated against a set of evaluation criteria developed by clinicians, professionals and the public. Five options have been short-listed and are proposed for consultation:
• Option A: Darent Valley Hospital, Medway Maritime Hospital, William Harvey Hospital• Option B: Darent Valley Hospital, Maidstone General Hospital, William Harvey Hospital• Option C: Maidstone General Hospital, Medway Maritime Hospital, William Harvey Hospital• Option D: Tunbridge Wells Hospital, Medway Maritime Hospital, William Harvey Hospital• Option E: Darent Valley Hospital, Tunbridge Wells Hospital, William Harvey Hospital
The current service is making a £7.8m loss each year. The new model of care will reduce that by £2.9m to £3.2m depending on options. To implement requires £30.6m to £37.9m capital. It will generate a benefit for commissioners of a minimum of £1.5m, rising to £5.8m each year after 10 years, based on the financial savings published by NHS England in their stroke configuration support guide (For prudence, 50% of the financial benefit stated in the 2013 report has been factored into the modelling for K&M). Every option generates a positive NPV compared to the “do minimum” at 10 and 20 years.
Source: https://www.england.nhs.uk/mids-east/wp-content/uploads/sites/7/2017/07/configuration-decision-support-guide-appendices-2.pdf
3
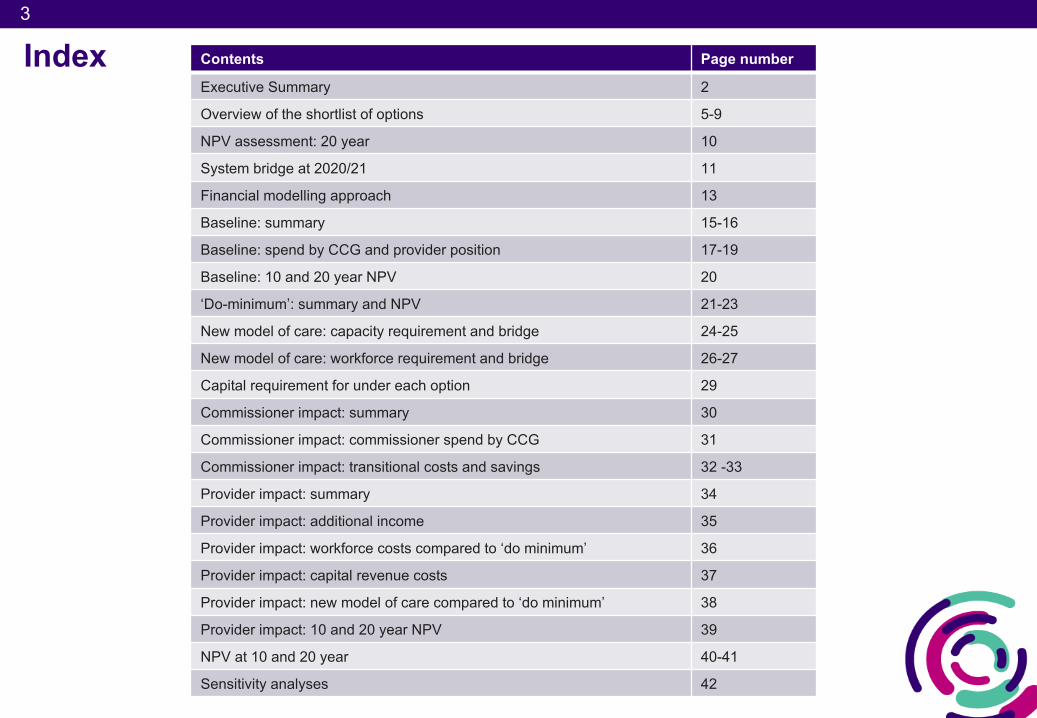
Index Contents Page number
Executive Summary 2
Overview of the shortlist of options 5-9
NPV assessment: 20 year 10
System bridge at 2020/21 11
Financial modelling approach 13
Baseline: summary 15-16
Baseline: spend by CCG and provider position 17-19
Baseline: 10 and 20 year NPV 20
‘Do-minimum’: summary and NPV 21-23
New model of care: capacity requirement and bridge 24-25
New model of care: workforce requirement and bridge 26-27
Capital requirement for under each option 29
Commissioner impact: summary 30
Commissioner impact: commissioner spend by CCG 31
Commissioner impact: transitional costs and savings 32 -33
Provider impact: summary 34
Provider impact: additional income 35
Provider impact: workforce costs compared to ‘do minimum’ 36
Provider impact: capital revenue costs 37
Provider impact: new model of care compared to ‘do minimum’ 38
Provider impact: 10 and 20 year NPV 39
NPV at 10 and 20 year 40-41
Sensitivity analyses 42
4
4
Overview of Kent and Medway Stroke Review
Executive summary
Approach to financial modelling
Financial case
Appendix
Contents
5
5
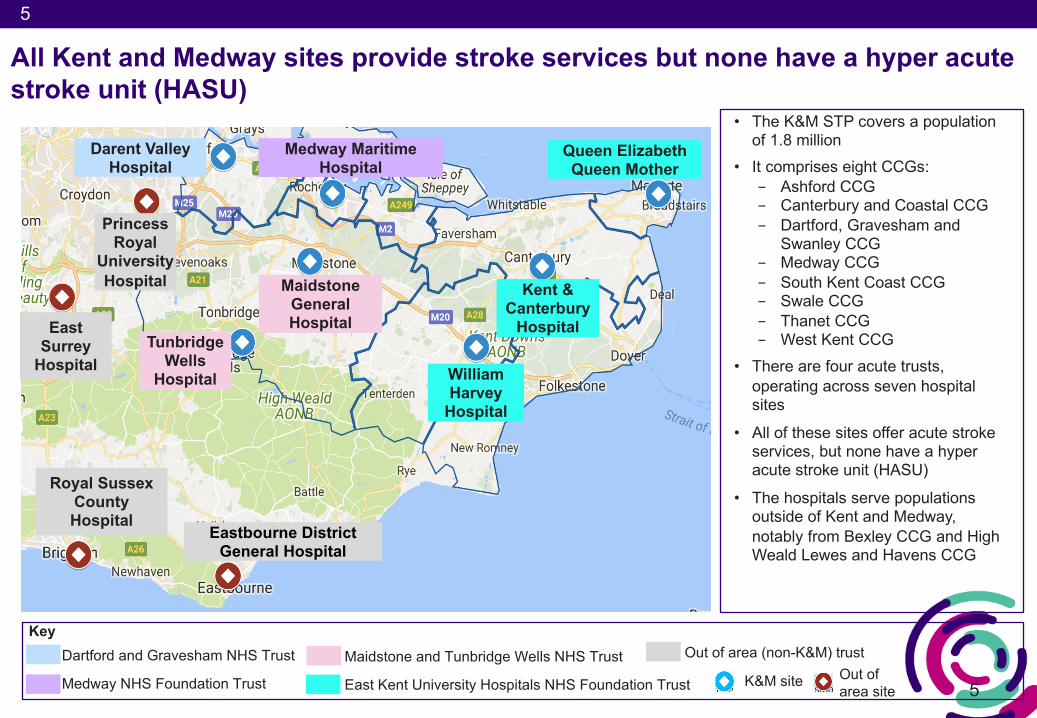
All Kent and Medway sites provide stroke services but none have a hyper acute stroke unit (HASU)
Darent Valley Hospital
Tunbridge Wells
Hospital
Maidstone General Hospital
Medway Maritime Hospital
William Harvey
Hospital
Kent & Canterbury
Hospital
Queen Elizabeth Queen Mother
Princess Royal
University Hospital
Eastbourne District General Hospital
Royal Sussex County Hospital
East Surrey
Hospital
• The K&M STP covers a population of 1.8 million
• It comprises eight CCGs:- Ashford CCG- Canterbury and Coastal CCG- Dartford, Gravesham and
Swanley CCG- Medway CCG- South Kent Coast CCG- Swale CCG- Thanet CCG- West Kent CCG
• There are four acute trusts, operating across seven hospital sites
• All of these sites offer acute stroke services, but none have a hyper acute stroke unit (HASU)
• The hospitals serve populations outside of Kent and Medway, notably from Bexley CCG and High Weald Lewes and Havens CCG
KeyDartford and Gravesham NHS Trust
Medway NHS Foundation Trust
Maidstone and Tunbridge Wells NHS Trust
East Kent University Hospitals NHS Foundation Trust
Out of area (non-K&M) trustOut of area site
K&M site
6
6
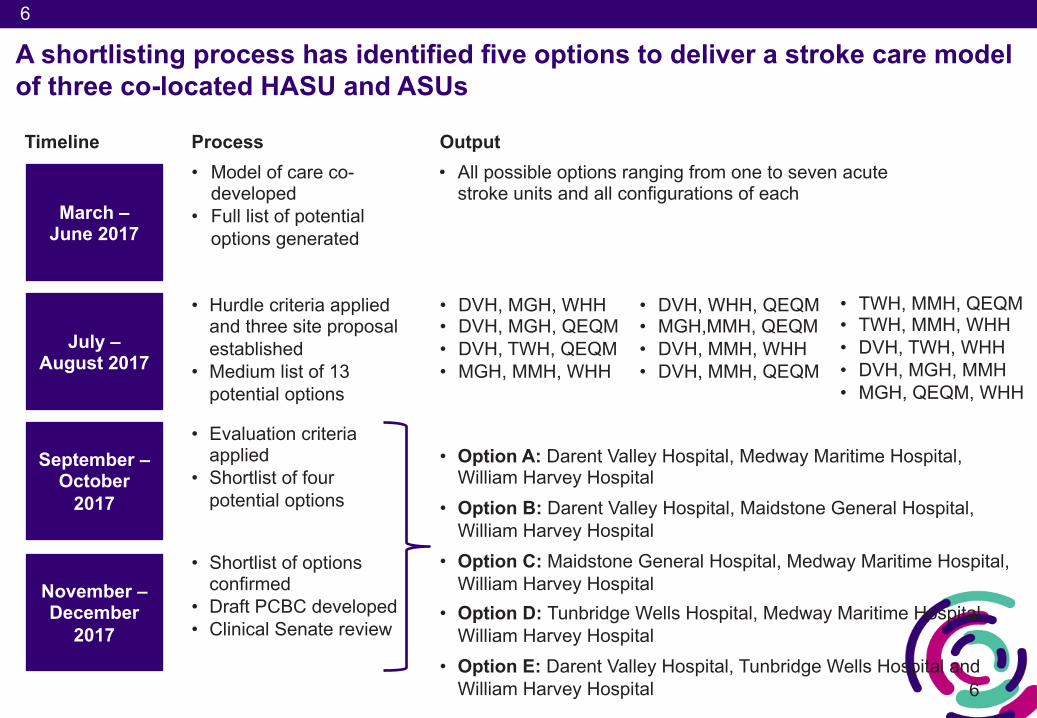
A shortlisting process has identified five options to deliver a stroke care model of three co-located HASU and ASUs
Timeline
March –June 2017
July –August 2017
September –October
2017
November –December
2017
• Model of care co-developed
• Full list of potential options generated
• Hurdle criteria applied and three site proposal established
• Medium list of 13 potential options
• DVH, WHH, QEQM• MGH,MMH, QEQM• DVH, MMH, WHH• DVH, MMH, QEQM
• DVH, MGH, WHH• DVH, MGH, QEQM• DVH, TWH, QEQM• MGH, MMH, WHH
• TWH, MMH, QEQM• TWH, MMH, WHH• DVH, TWH, WHH• DVH, MGH, MMH• MGH, QEQM, WHH
• Evaluation criteria applied
• Shortlist of four potential options
• Option A: Darent Valley Hospital, Medway Maritime Hospital, William Harvey Hospital
• Option B: Darent Valley Hospital, Maidstone General Hospital, William Harvey Hospital
• Option C: Maidstone General Hospital, Medway Maritime Hospital, William Harvey Hospital
• Option D: Tunbridge Wells Hospital, Medway Maritime Hospital, William Harvey Hospital
• Option E: Darent Valley Hospital, Tunbridge Wells Hospital and William Harvey Hospital
• Shortlist of options confirmed
• Draft PCBC developed• Clinical Senate review
Process Output• All possible options ranging from one to seven acute
stroke units and all configurations of each
7
7
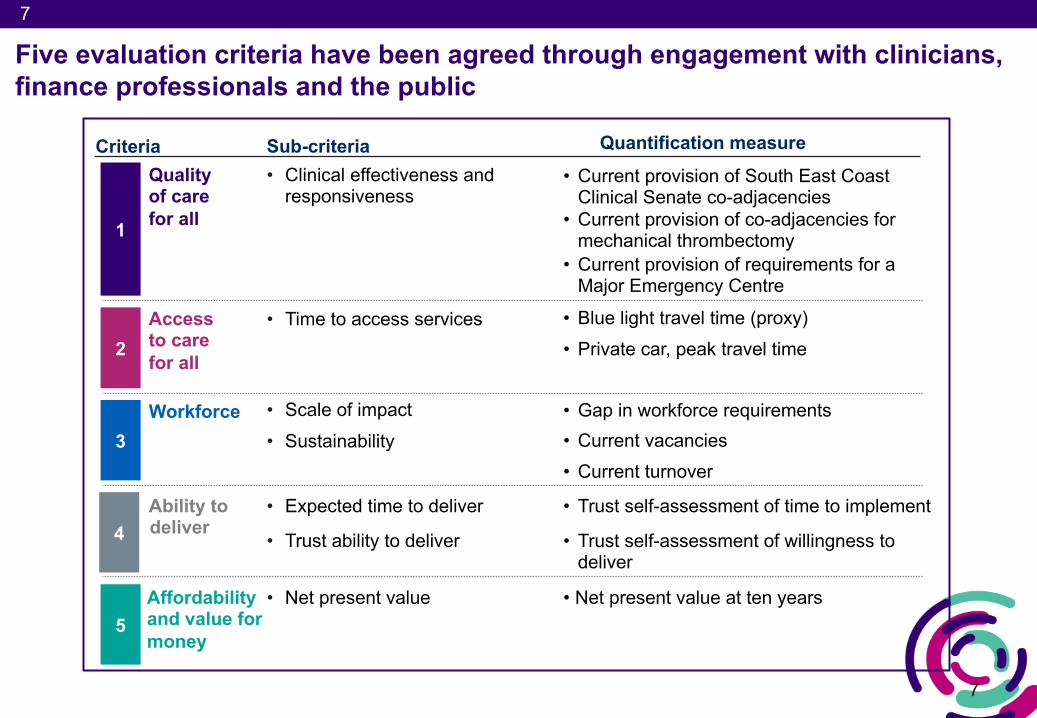
Five evaluation criteria have been agreed through engagement with clinicians, finance professionals and the public
Ability todeliver
Quality of care for all
Access to care for all
Criteria
1
2
3
4
Workforce
• Expected time to deliver
• Clinical effectiveness and responsiveness
• Time to access services
Sub-criteria
• Scale of impact• Sustainability
• Trust ability to deliver
Affordability and value for money
5• Net present value
Quantification measure• Current provision of South East Coast
Clinical Senate co-adjacencies• Current provision of co-adjacencies for
mechanical thrombectomy• Current provision of requirements for a
Major Emergency Centre
• Blue light travel time (proxy) • Private car, peak travel time
• Gap in workforce requirements• Current vacancies• Current turnover
• Trust self-assessment of time to implement
• Trust self-assessment of willingness to deliver
• Net present value at ten years
8
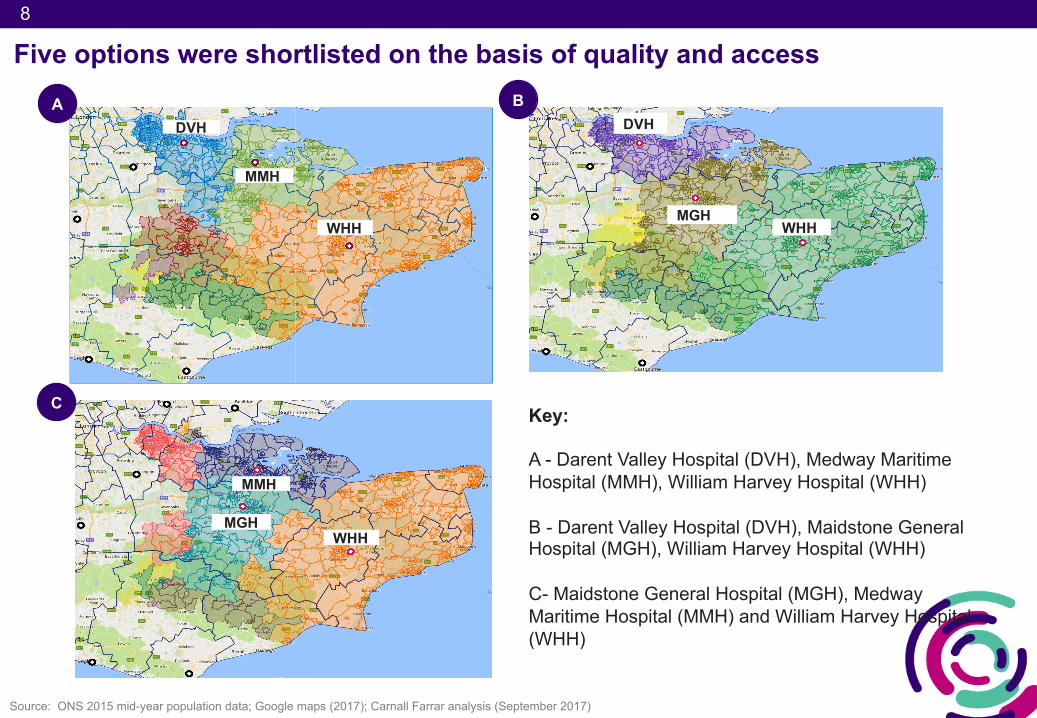
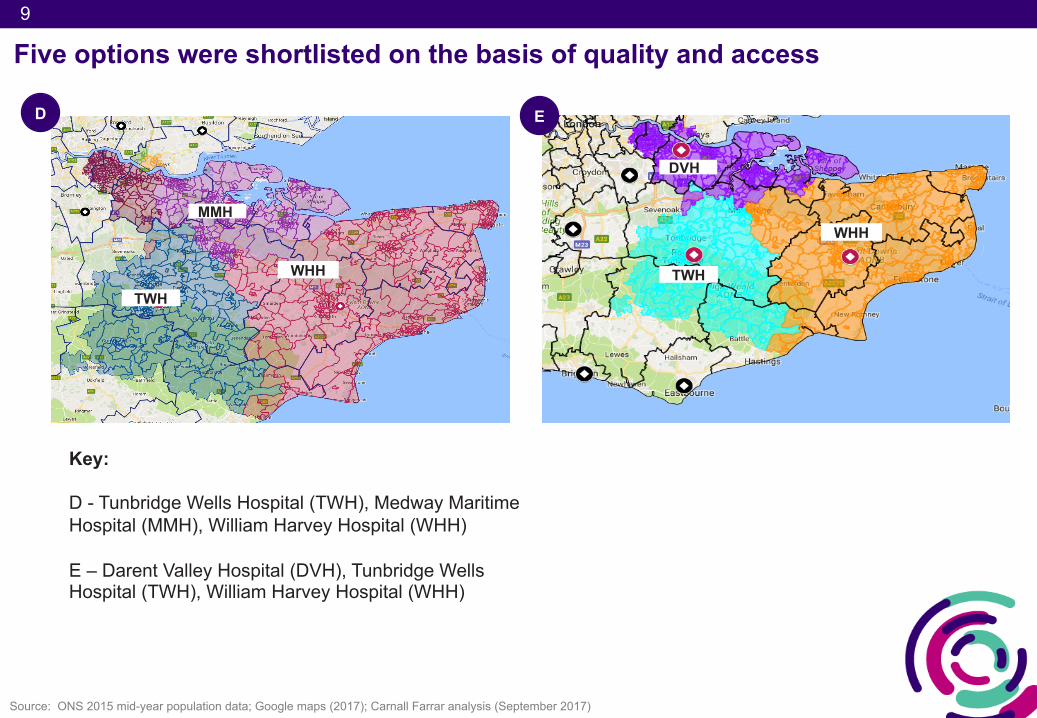
Five options were shortlisted on the basis of quality and access
DVH
MMH
WHHMGH
DVH
WHH
Key:
A - Darent Valley Hospital (DVH), Medway Maritime Hospital (MMH), William Harvey Hospital (WHH)
B - Darent Valley Hospital (DVH), Maidstone General Hospital (MGH), William Harvey Hospital (WHH)
C- Maidstone General Hospital (MGH), Medway Maritime Hospital (MMH) and William Harvey Hospital (WHH)
MGH
MMH
WHH
A B
C
Source: ONS 2015 mid-year population data; Google maps (2017); Carnall Farrar analysis (September 2017)
9
D
WHH
TWH
MMH
Five options were shortlisted on the basis of quality and access
Source: ONS 2015 mid-year population data; Google maps (2017); Carnall Farrar analysis (September 2017)
Key:
D - Tunbridge Wells Hospital (TWH), Medway Maritime Hospital (MMH), William Harvey Hospital (WHH)
E – Darent Valley Hospital (DVH), Tunbridge Wells Hospital (TWH), William Harvey Hospital (WHH)
E
WHH
TWH
DVH
10
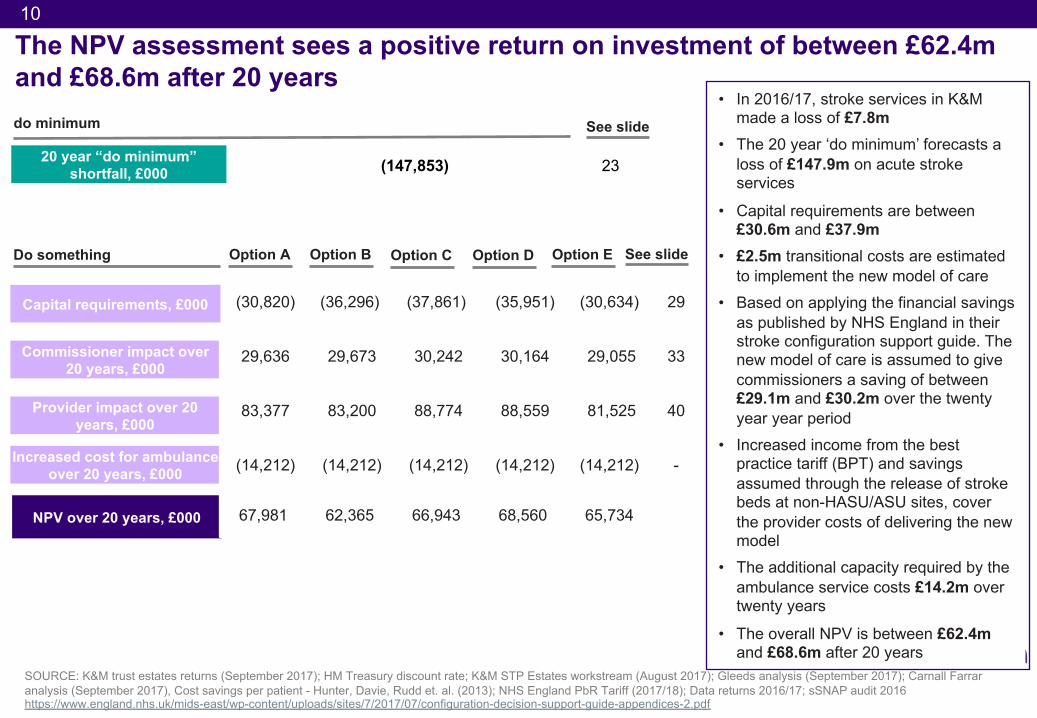
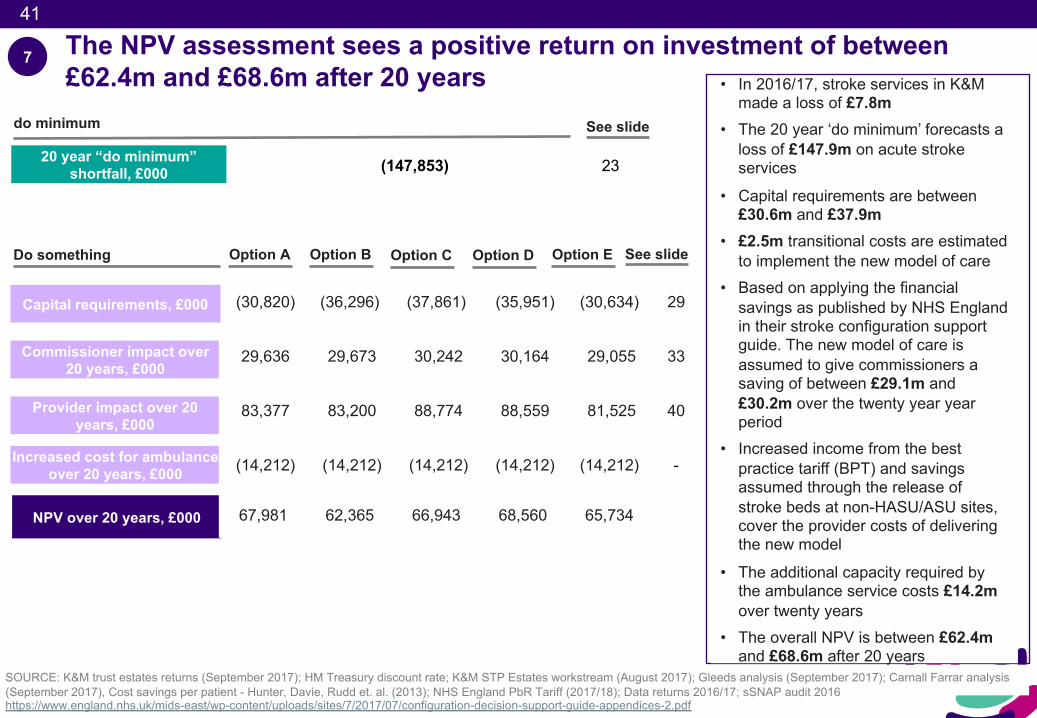
The NPV assessment sees a positive return on investment of between £62.4m and £68.6m after 20 years
SOURCE: K&M trust estates returns (September 2017); HM Treasury discount rate; K&M STP Estates workstream (August 2017); Gleeds analysis (September 2017); Carnall Farrar analysis (September 2017), Cost savings per patient - Hunter, Davie, Rudd et. al. (2013); NHS England PbR Tariff (2017/18); Data returns 2016/17; sSNAP audit 2016https://www.england.nhs.uk/mids-east/wp-content/uploads/sites/7/2017/07/configuration-decision-support-guide-appendices-2.pdf
Provider impact over 20 years, £000
NPV over 20 years, £000
Commissioner impact over 20 years, £000
20 year “do minimum” shortfall, £000
Increased cost for ambulance over 20 years, £000
• In 2016/17, stroke services in K&M made a loss of £7.8m
• The 20 year ‘do minimum’ forecasts a loss of £147.9m on acute stroke services
• Capital requirements are between £30.6m and £37.9m
• £2.5m transitional costs are estimated to implement the new model of care
• Based on applying the financial savings as published by NHS England in their stroke configuration support guide. The new model of care is assumed to give commissioners a saving of between £29.1m and £30.2m over the twenty year year period
• Increased income from the best practice tariff (BPT) and savings assumed through the release of stroke beds at non-HASU/ASU sites, cover the provider costs of delivering the new model
• The additional capacity required by the ambulance service costs £14.2m over twenty years
• The overall NPV is between £62.4m and £68.6m after 20 years
Option B Option C Option DOption A
(30,820) (36,296) (37,861) (35,951) (30,634) 29
29,636 29,673 30,242 30,164 29,055 33
83,377 83,200 88,774 88,559 81,525 40
(14,212) (14,212) (14,212) (14,212) (14,212) -
67,981 62,365 66,943 68,560 65,734
See slide
(147,853) 23
See slideDo something
do minimum
Capital requirements, £000
Option E
11
(10)
(5)
-
5
10
15
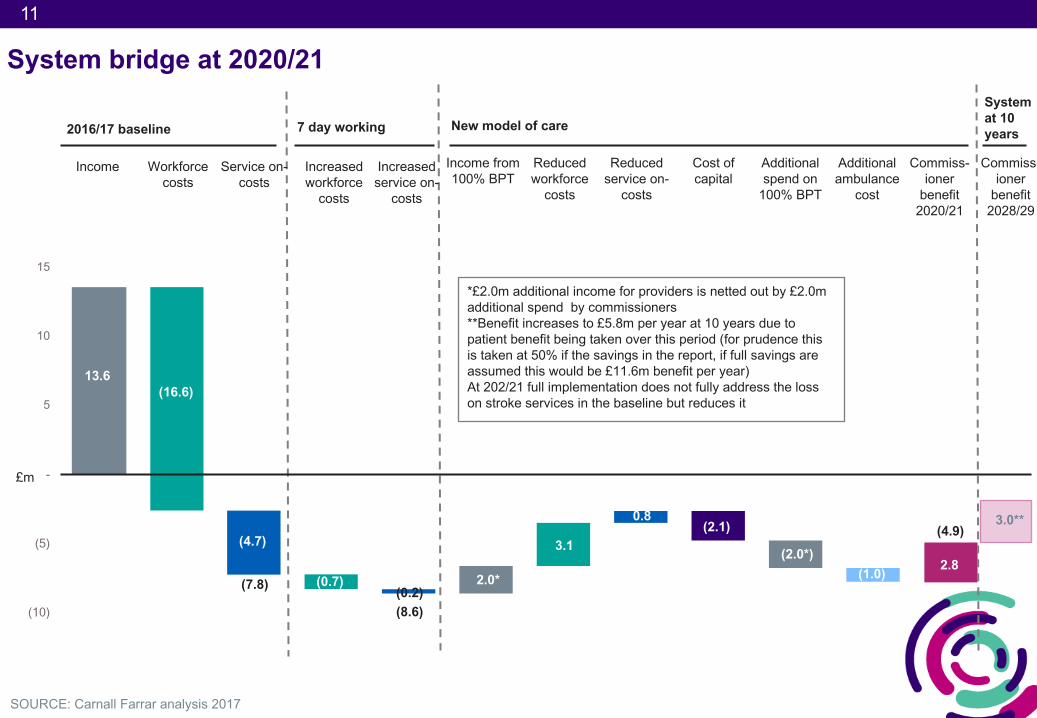
System bridge at 2020/21
SOURCE: Carnall Farrar analysis 2017
2016/17 baseline 7 day working New model of care
Income
13.6
Workforce costs
(16.6)
(4.7)
Service on-costs
Increased workforce
costs
Increased service on-
costs
Income from 100% BPT
Reduced workforce
costs
Reduced service on-
costs
Cost of capital
Commiss-ioner
benefit 2020/21
Additional ambulance
cost
Additional spend on
100% BPT
(0.7)(0.2)
2.0*
3.1
0.8(2.1)
(1.0)(2.0*)
5.6£m
*£2.0m additional income for providers is netted out by £2.0m additional spend by commissioners**Benefit increases to £5.8m per year at 10 years due to patient benefit being taken over this period (for prudence this is taken at 50% if the savings in the report, if full savings are assumed this would be £11.6m benefit per year)At 202/21 full implementation does not fully address the loss on stroke services in the baseline but reduces it
3.0**
2.8(7.8)
(8.6)
Commiss-ioner
benefit 2028/29
System at 10 years
(4.9)
12
12
Overview of Kent and Medway Stroke Review
Executive summary
Approach to financial modelling
Financial case
Appendix
Contents
13
13
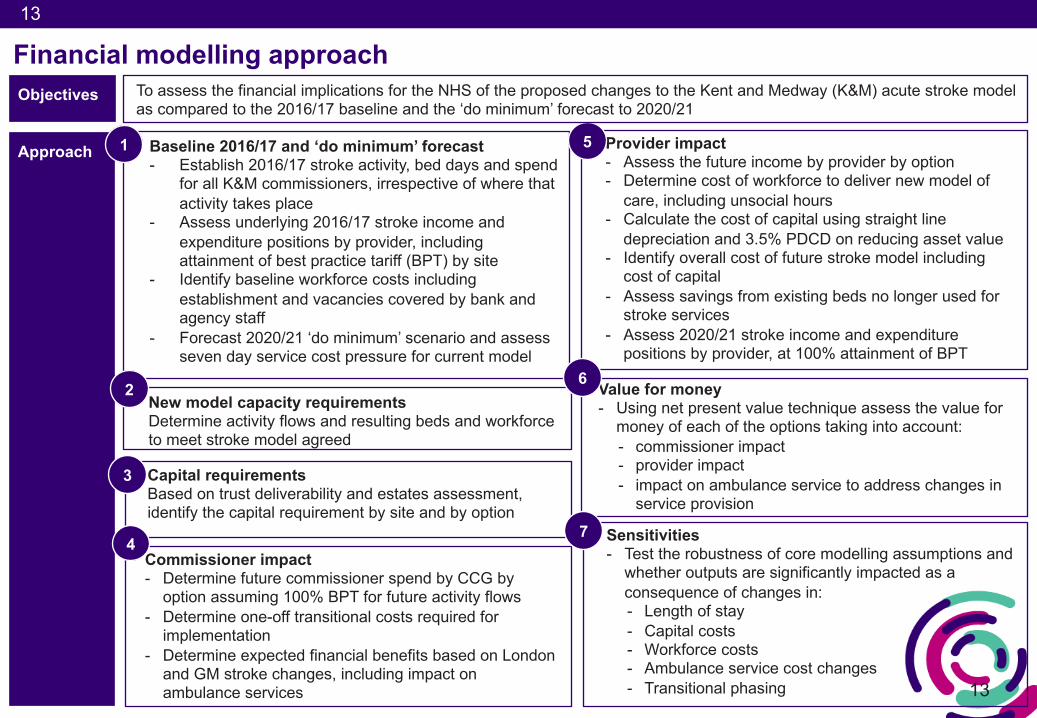
Financial modelling approach
Approach
Objectives To assess the financial implications for the NHS of the proposed changes to the Kent and Medway (K&M) acute stroke model as compared to the 2016/17 baseline and the ‘do minimum’ forecast to 2020/21
Baseline 2016/17 and ‘do minimum’ forecast- Establish 2016/17 stroke activity, bed days and spend
for all K&M commissioners, irrespective of where that activity takes place
- Assess underlying 2016/17 stroke income and expenditure positions by provider, including attainment of best practice tariff (BPT) by site
- Identify baseline workforce costs including establishment and vacancies covered by bank and agency staff
- Forecast 2020/21 ‘do minimum’ scenario and assess seven day service cost pressure for current model
1
New model capacity requirementsDetermine activity flows and resulting beds and workforce to meet stroke model agreed
2
Capital requirements Based on trust deliverability and estates assessment, identify the capital requirement by site and by option
3
Commissioner impact- Determine future commissioner spend by CCG by
option assuming 100% BPT for future activity flows- Determine one-off transitional costs required for
implementation- Determine expected financial benefits based on London
and GM stroke changes, including impact on ambulance services
Provider impact - Assess the future income by provider by option- Determine cost of workforce to deliver new model of
care, including unsocial hours- Calculate the cost of capital using straight line
depreciation and 3.5% PDCD on reducing asset value- Identify overall cost of future stroke model including
cost of capital- Assess savings from existing beds no longer used for
stroke services - Assess 2020/21 stroke income and expenditure
positions by provider, at 100% attainment of BPT
5
Value for money- Using net present value technique assess the value for
money of each of the options taking into account:- commissioner impact- provider impact- impact on ambulance service to address changes in
service provision
6
Sensitivities - Test the robustness of core modelling assumptions and
whether outputs are significantly impacted as a consequence of changes in:- Length of stay- Capital costs- Workforce costs- Ambulance service cost changes - Transitional phasing
74
14
14
Overview of Kent and Medway Stroke Review
Executive summary
Approach to financial modelling
Financial case
Appendix
Contents
15
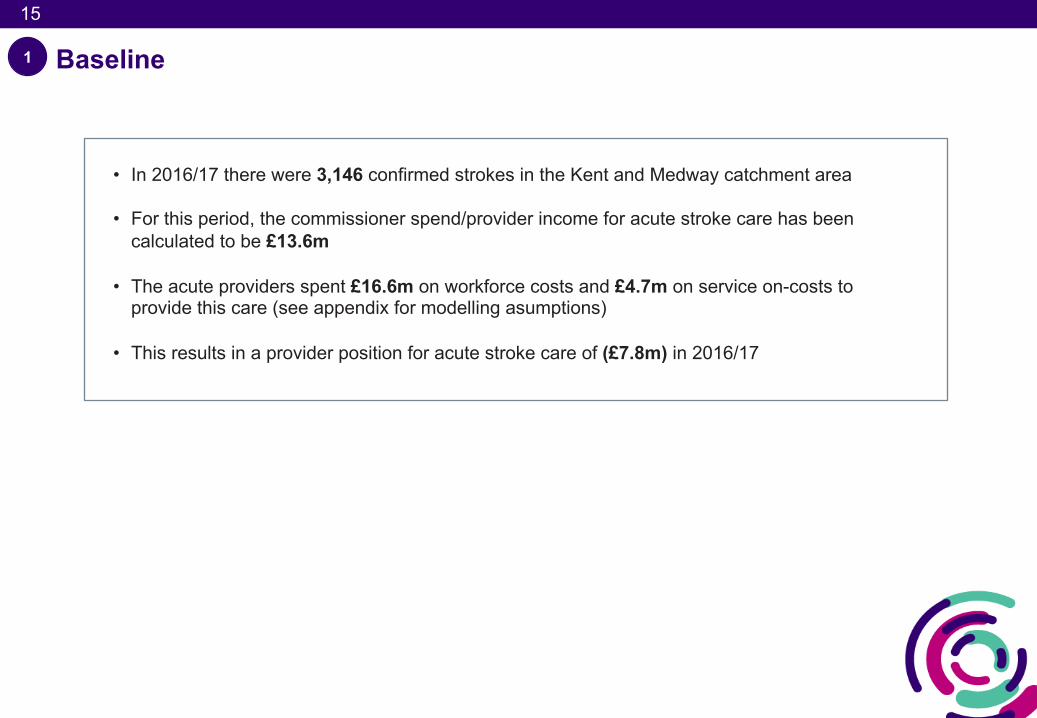
Baseline
• In 2016/17 there were 3,146 confirmed strokes in the Kent and Medway catchment area
• For this period, the commissioner spend/provider income for acute stroke care has been calculated to be £13.6m
• The acute providers spent £16.6m on workforce costs and £4.7m on service on-costs to provide this care (see appendix for modelling asumptions)
• This results in a provider position for acute stroke care of (£7.8m) in 2016/17
1
16
16
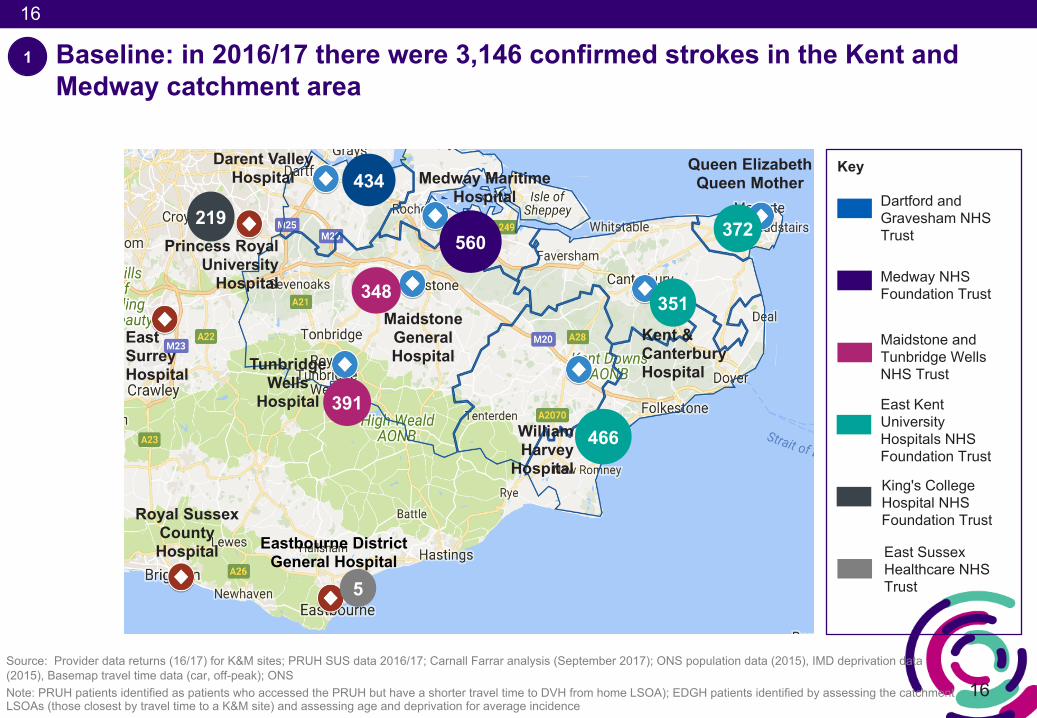
Baseline: in 2016/17 there were 3,146 confirmed strokes in the Kent and Medway catchment area
Darent Valley Hospital
Tunbridge Wells
Hospital
Maidstone General Hospital
Medway Maritime Hospital
William Harvey
Hospital
Kent & Canterbury Hospital
Queen Elizabeth Queen Mother
Princess Royal University
Hospital
Eastbourne District General Hospital
351
372
466
560
348
434
391
Source: Provider data returns (16/17) for K&M sites; PRUH SUS data 2016/17; Carnall Farrar analysis (September 2017); ONS population data (2015), IMD deprivation data (2015), Basemap travel time data (car, off-peak); ONS Note: PRUH patients identified as patients who accessed the PRUH but have a shorter travel time to DVH from home LSOA); EDGH patients identified by assessing the catchment LSOAs (those closest by travel time to a K&M site) and assessing age and deprivation for average incidence
219
5
Royal Sussex County Hospital
East Surrey Hospital
1
Key
Dartford and Gravesham NHS Trust
Medway NHS Foundation Trust
Maidstone and Tunbridge Wells NHS Trust
East Kent University Hospitals NHS Foundation Trust
King's College Hospital NHS Foundation Trust
East Sussex Healthcare NHS Trust
17
17
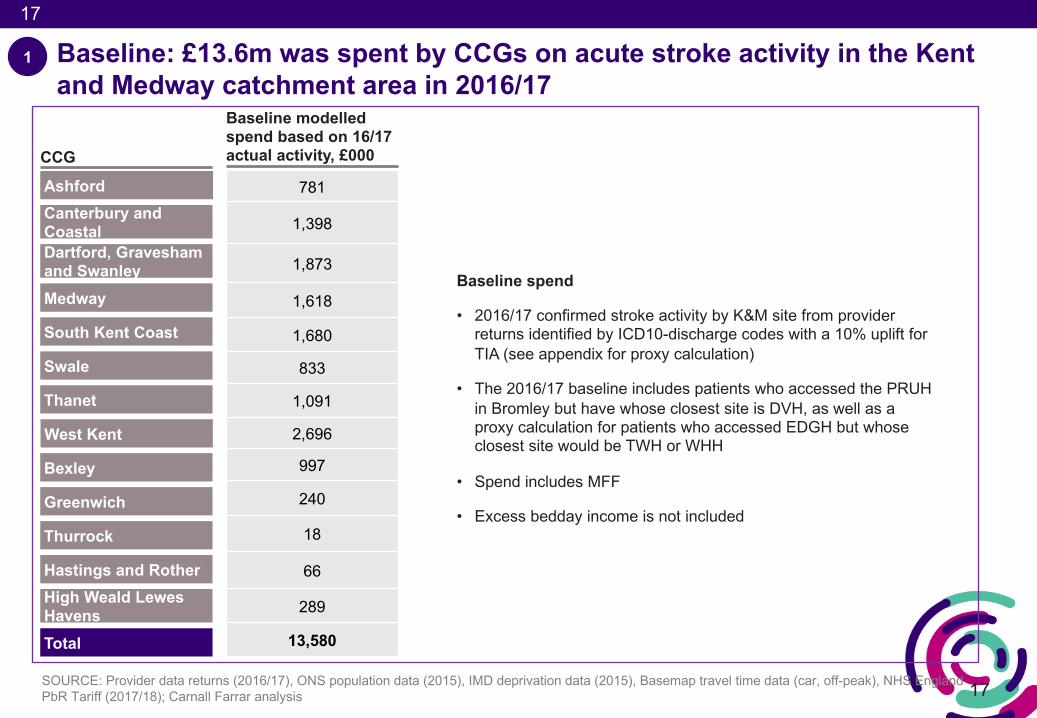
Baseline: £13.6m was spent by CCGs on acute stroke activity in the Kent and Medway catchment area in 2016/17
SOURCE: Provider data returns (2016/17), ONS population data (2015), IMD deprivation data (2015), Basemap travel time data (car, off-peak), NHS England PbR Tariff (2017/18); Carnall Farrar analysis
CCG
AshfordCanterbury and CoastalDartford, Gravesham and SwanleyMedway
South Kent Coast
Swale
Thanet
781
1,398
1,873
1,618
1,680
833
1,091
2,696
997
240
18
66
289
13,580
Baseline spend
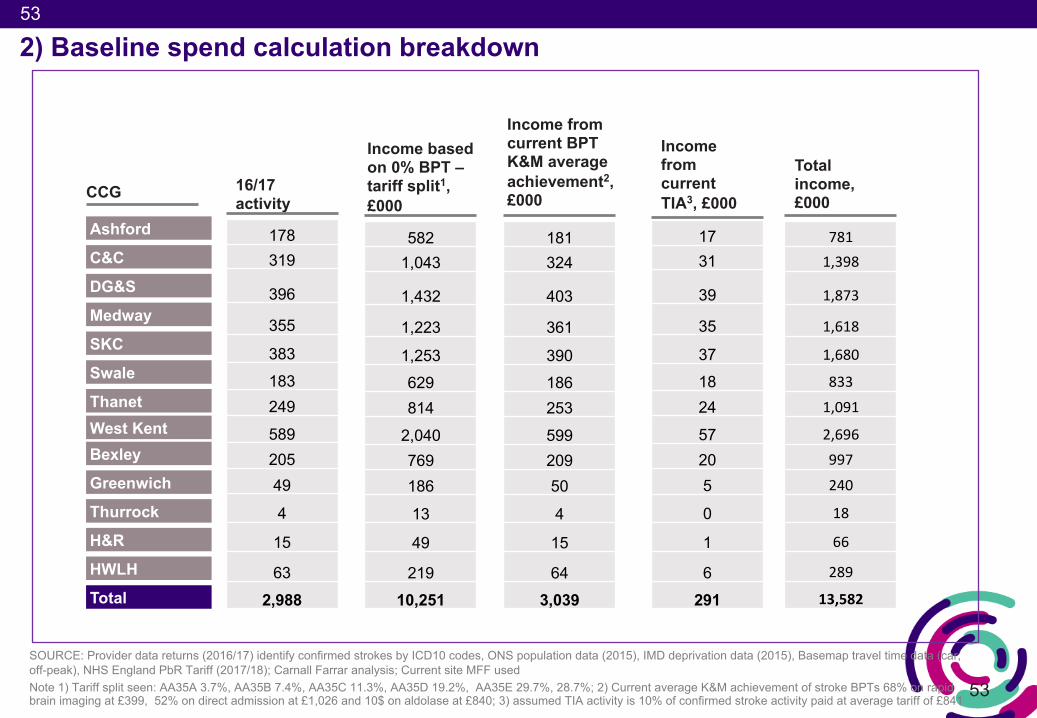
• 2016/17 confirmed stroke activity by K&M site from provider returns identified by ICD10-discharge codes with a 10% uplift for TIA (see appendix for proxy calculation)
• The 2016/17 baseline includes patients who accessed the PRUH in Bromley but have whose closest site is DVH, as well as a proxy calculation for patients who accessed EDGH but whose closest site would be TWH or WHH
• Spend includes MFF
• Excess bedday income is not included
Bexley
Greenwich
Thurrock
Hastings and RotherHigh Weald Lewes HavensTotal
1
West Kent
Baseline modelled spend based on 16/17 actual activity, £000
18
18
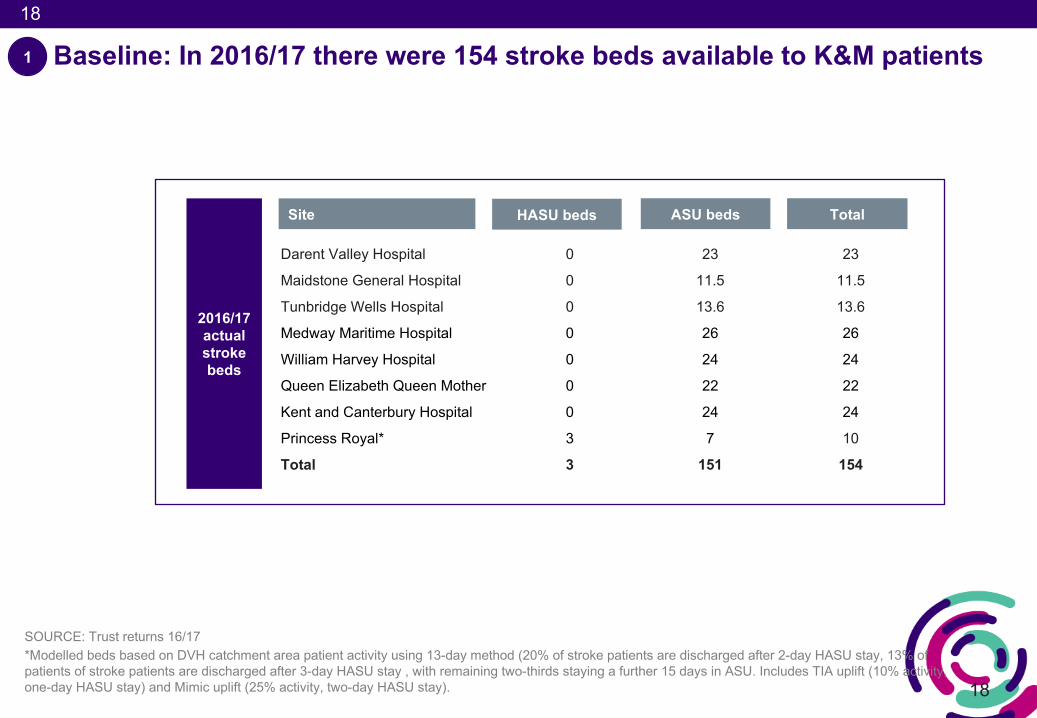
Baseline: In 2016/17 there were 154 stroke beds available to K&M patients
SOURCE: Trust returns 16/17*Modelled beds based on DVH catchment area patient activity using 13-day method (20% of stroke patients are discharged after 2-day HASU stay, 13% of patients of stroke patients are discharged after 3-day HASU stay , with remaining two-thirds staying a further 15 days in ASU. Includes TIA uplift (10% activity, one-day HASU stay) and Mimic uplift (25% activity, two-day HASU stay).
Site
Darent Valley Hospital 0 23 23
Maidstone General Hospital 0 11.5 11.5
Tunbridge Wells Hospital 0 13.6 13.6
Medway Maritime Hospital 0 26 26
William Harvey Hospital 0 24 24
Queen Elizabeth Queen Mother 0 22 22
Kent and Canterbury Hospital 0 24 24
Princess Royal* 3 7 10
Total 3 151 154
HASU beds ASU beds Total
2016/17 actual stroke beds
1
19
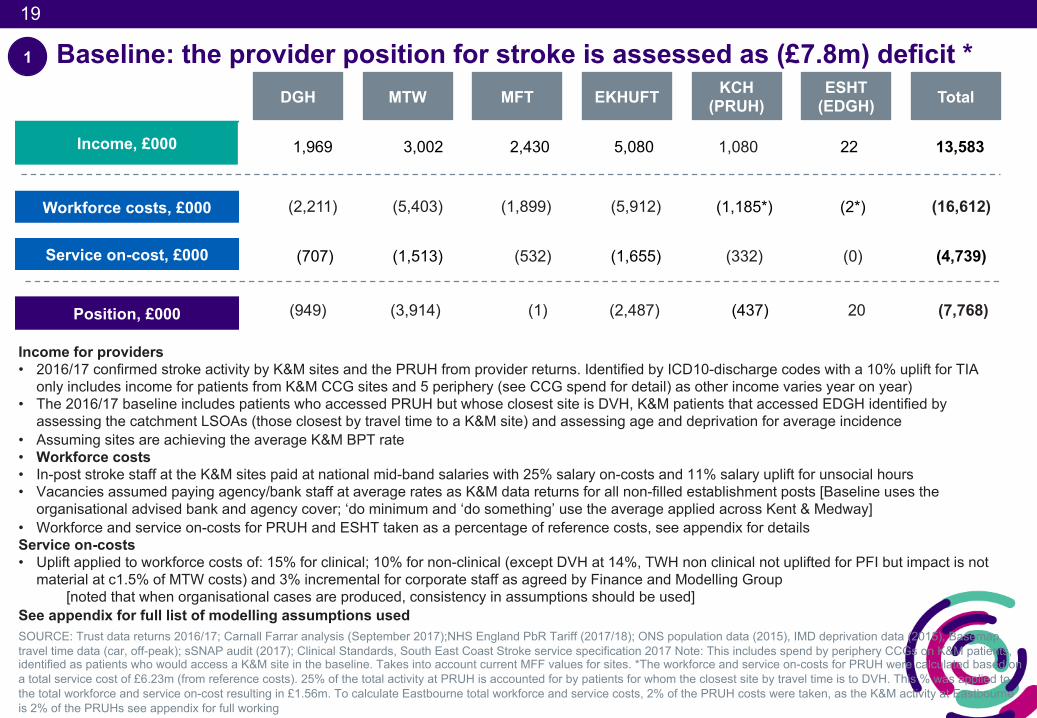
Baseline: the provider position for stroke is assessed as (£7.8m) deficit *
Income, £000
Position, £000
Workforce costs, £000
Service on-cost, £000
Income for providers• 2016/17 confirmed stroke activity by K&M sites and the PRUH from provider returns. Identified by ICD10-discharge codes with a 10% uplift for TIA
only includes income for patients from K&M CCG sites and 5 periphery (see CCG spend for detail) as other income varies year on year)• The 2016/17 baseline includes patients who accessed PRUH but whose closest site is DVH, K&M patients that accessed EDGH identified by
assessing the catchment LSOAs (those closest by travel time to a K&M site) and assessing age and deprivation for average incidence• Assuming sites are achieving the average K&M BPT rate • Workforce costs• In-post stroke staff at the K&M sites paid at national mid-band salaries with 25% salary on-costs and 11% salary uplift for unsocial hours• Vacancies assumed paying agency/bank staff at average rates as K&M data returns for all non-filled establishment posts [Baseline uses the
organisational advised bank and agency cover; ‘do minimum and ‘do something’ use the average applied across Kent & Medway] • Workforce and service on-costs for PRUH and ESHT taken as a percentage of reference costs, see appendix for detailsService on-costs• Uplift applied to workforce costs of: 15% for clinical; 10% for non-clinical (except DVH at 14%, TWH non clinical not uplifted for PFI but impact is not
material at c1.5% of MTW costs) and 3% incremental for corporate staff as agreed by Finance and Modelling Group[noted that when organisational cases are produced, consistency in assumptions should be used]
See appendix for full list of modelling assumptions used
DGH MTW MFT EKHUFT Total KCH(PRUH)
ESHT(EDGH)
1
1,969 3,002 2,430 5,080 1,080 22 13,583
(2,211) (5,403) (1,899) (5,912) (1,185*) (2*) (16,612)
(707) (1,513) (532) (1,655) (332) (0) (4,739)
(949) (3,914) (1) (2,487) (437) 20 (7,768)
SOURCE: Trust data returns 2016/17; Carnall Farrar analysis (September 2017);NHS England PbR Tariff (2017/18); ONS population data (2015), IMD deprivation data (2015), Basemaptravel time data (car, off-peak); sSNAP audit (2017); Clinical Standards, South East Coast Stroke service specification 2017 Note: This includes spend by periphery CCGs on K&M patients, identified as patients who would access a K&M site in the baseline. Takes into account current MFF values for sites. *The workforce and service on-costs for PRUH were calculated based on a total service cost of £6.23m (from reference costs). 25% of the total activity at PRUH is accounted for by patients for whom the closest site by travel time is to DVH. This % was applied to the total workforce and service on-cost resulting in £1.56m. To calculate Eastbourne total workforce and service costs, 2% of the PRUH costs were taken, as the K&M activity at Eastbourne is 2% of the PRUHs see appendix for full working
20
20
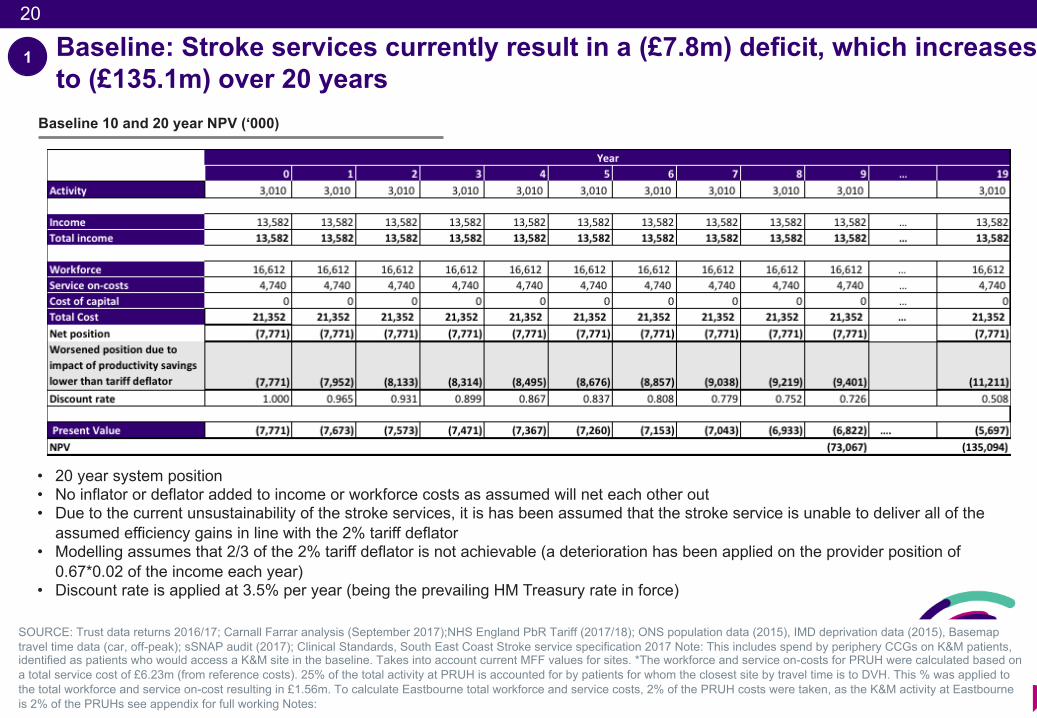
Baseline: Stroke services currently result in a (£7.8m) deficit, which increases to (£135.1m) over 20 years
1
Baseline 10 and 20 year NPV (‘000)
SOURCE: Trust data returns 2016/17; Carnall Farrar analysis (September 2017);NHS England PbR Tariff (2017/18); ONS population data (2015), IMD deprivation data (2015), Basemaptravel time data (car, off-peak); sSNAP audit (2017); Clinical Standards, South East Coast Stroke service specification 2017 Note: This includes spend by periphery CCGs on K&M patients, identified as patients who would access a K&M site in the baseline. Takes into account current MFF values for sites. *The workforce and service on-costs for PRUH were calculated based on a total service cost of £6.23m (from reference costs). 25% of the total activity at PRUH is accounted for by patients for whom the closest site by travel time is to DVH. This % was applied to the total workforce and service on-cost resulting in £1.56m. To calculate Eastbourne total workforce and service costs, 2% of the PRUH costs were taken, as the K&M activity at Eastbourne is 2% of the PRUHs see appendix for full working Notes:
• 20 year system position• No inflator or deflator added to income or workforce costs as assumed will net each other out• Due to the current unsustainability of the stroke services, it is has been assumed that the stroke service is unable to deliver all of the
assumed efficiency gains in line with the 2% tariff deflator• Modelling assumes that 2/3 of the 2% tariff deflator is not achievable (a deterioration has been applied on the provider position of
0.67*0.02 of the income each year)• Discount rate is applied at 3.5% per year (being the prevailing HM Treasury rate in force)
21
‘Do-minimum’
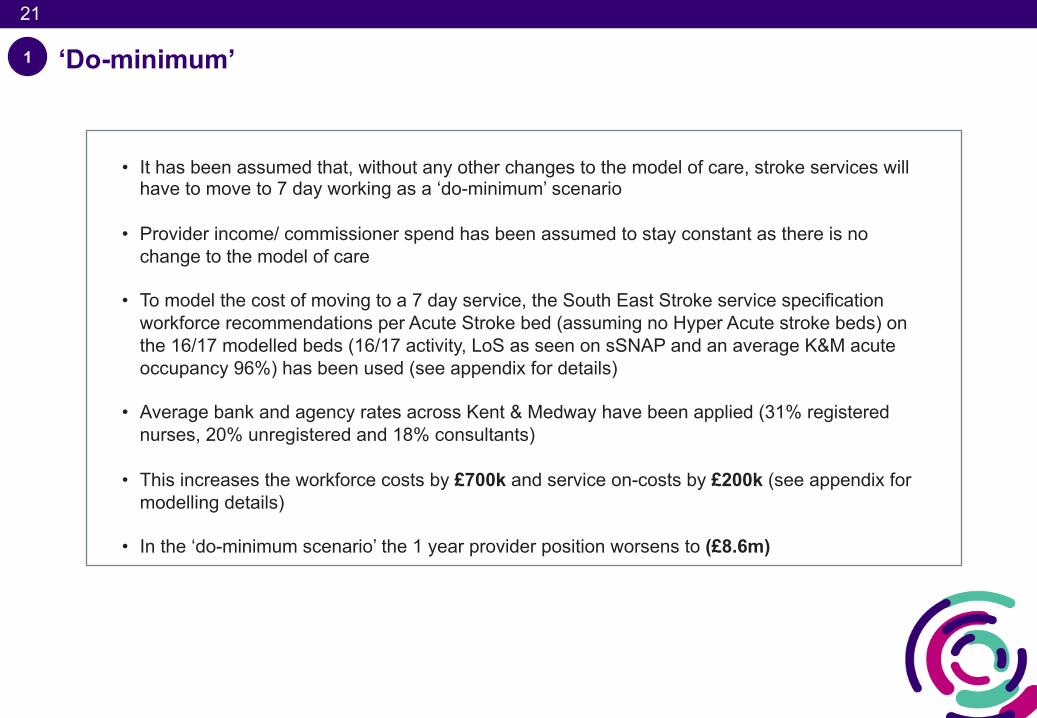
• It has been assumed that, without any other changes to the model of care, stroke services will have to move to 7 day working as a ‘do-minimum’ scenario
• Provider income/ commissioner spend has been assumed to stay constant as there is no change to the model of care
• To model the cost of moving to a 7 day service, the South East Stroke service specification workforce recommendations per Acute Stroke bed (assuming no Hyper Acute stroke beds) on the 16/17 modelled beds (16/17 activity, LoS as seen on sSNAP and an average K&M acute occupancy 96%) has been used (see appendix for details)
• Average bank and agency rates across Kent & Medway have been applied (31% registered nurses, 20% unregistered and 18% consultants)
• This increases the workforce costs by £700k and service on-costs by £200k (see appendix for modelling details)
• In the ‘do-minimum scenario’ the 1 year provider position worsens to (£8.6m)
1
22
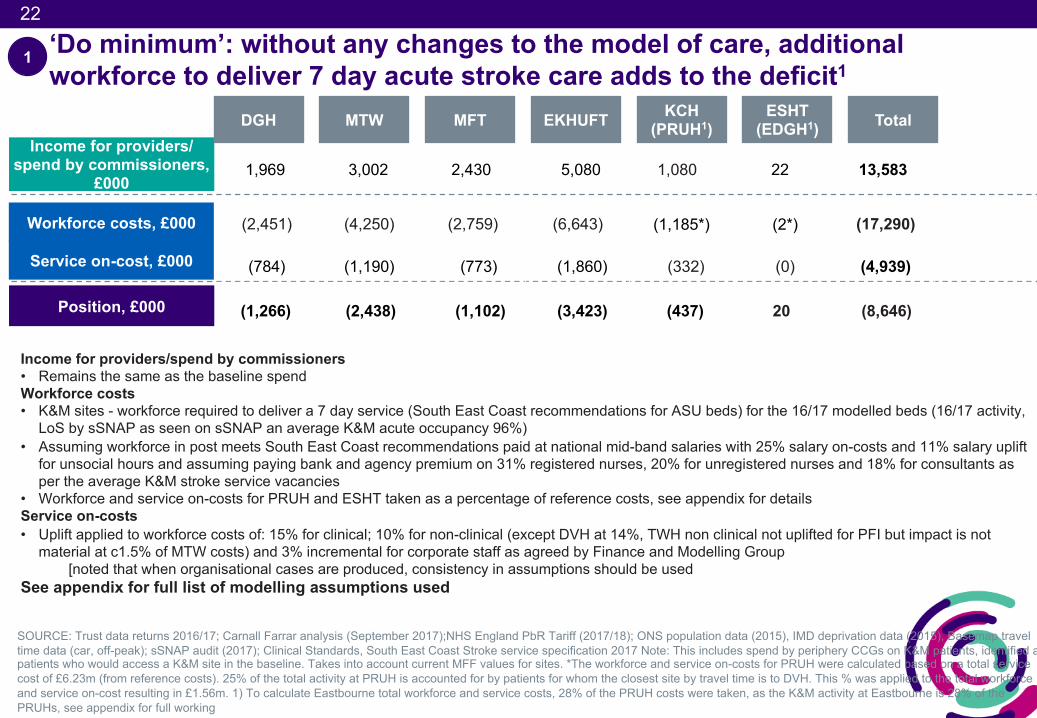
Position, £000 (1,266) (2,438) (1,102) (3,423) (437) 20 (8,646)
1,969 3,002 2,430 5,080 1,080 22 13,583
‘Do minimum’: without any changes to the model of care, additional workforce to deliver 7 day acute stroke care adds to the deficit1
SOURCE: Trust data returns 2016/17; Carnall Farrar analysis (September 2017);NHS England PbR Tariff (2017/18); ONS population data (2015), IMD deprivation data (2015), Basemap travel time data (car, off-peak); sSNAP audit (2017); Clinical Standards, South East Coast Stroke service specification 2017 Note: This includes spend by periphery CCGs on K&M patients, identified as patients who would access a K&M site in the baseline. Takes into account current MFF values for sites. *The workforce and service on-costs for PRUH were calculated based on a total service cost of £6.23m (from reference costs). 25% of the total activity at PRUH is accounted for by patients for whom the closest site by travel time is to DVH. This % was applied to the total workforce and service on-cost resulting in £1.56m. 1) To calculate Eastbourne total workforce and service costs, 28% of the PRUH costs were taken, as the K&M activity at Eastbourne is 28% of the PRUHs, see appendix for full working
Income for providers/spend by commissioners• Remains the same as the baseline spendWorkforce costs• K&M sites - workforce required to deliver a 7 day service (South East Coast recommendations for ASU beds) for the 16/17 modelled beds (16/17 activity,
LoS by sSNAP as seen on sSNAP an average K&M acute occupancy 96%)• Assuming workforce in post meets South East Coast recommendations paid at national mid-band salaries with 25% salary on-costs and 11% salary uplift
for unsocial hours and assuming paying bank and agency premium on 31% registered nurses, 20% for unregistered nurses and 18% for consultants as per the average K&M stroke service vacancies
• Workforce and service on-costs for PRUH and ESHT taken as a percentage of reference costs, see appendix for detailsService on-costs• Uplift applied to workforce costs of: 15% for clinical; 10% for non-clinical (except DVH at 14%, TWH non clinical not uplifted for PFI but impact is not
material at c1.5% of MTW costs) and 3% incremental for corporate staff as agreed by Finance and Modelling Group[noted that when organisational cases are produced, consistency in assumptions should be used
See appendix for full list of modelling assumptions used
Income for providers/ spend by commissioners,
£000
Workforce costs, £000
Service on-cost, £000
DGH MTW MFT EKHUFT Total KCH(PRUH1)
ESHT(EDGH1)
1
(2,451) (4,250) (2,759) (6,643) (1,185*) (2*) (17,290)
(784) (1,190) (773) (1,860) (332) (0) (4,939)
23
23
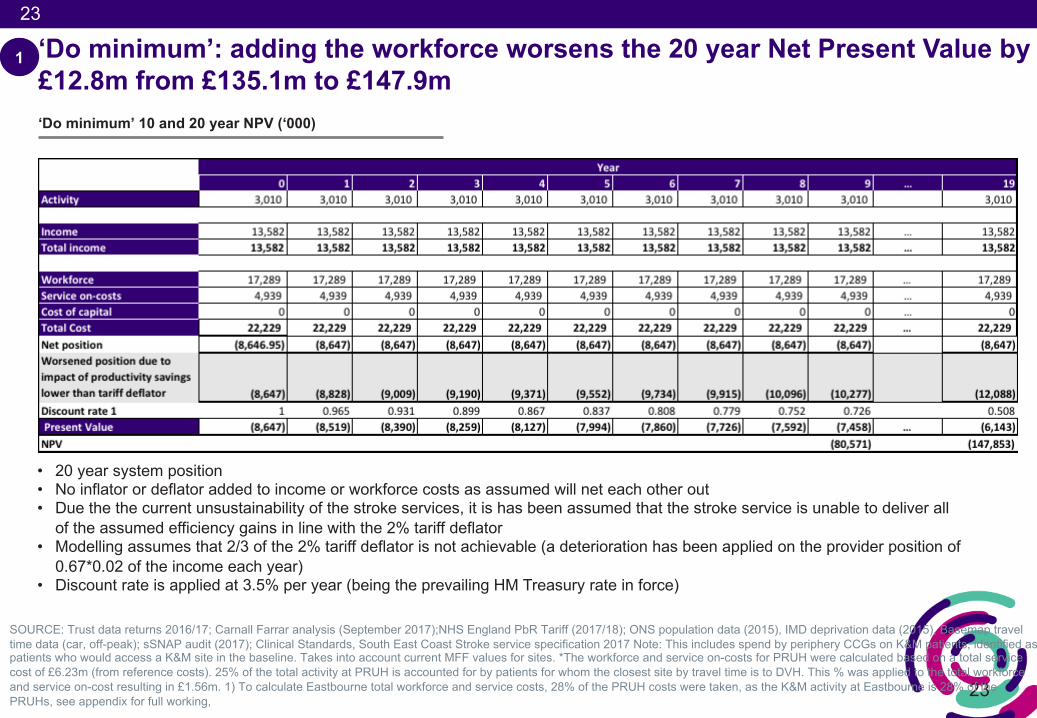
‘Do minimum’: adding the workforce worsens the 20 year Net Present Value by £12.8m from £135.1m to £147.9m
1
‘Do minimum’ 10 and 20 year NPV (‘000)
SOURCE: Trust data returns 2016/17; Carnall Farrar analysis (September 2017);NHS England PbR Tariff (2017/18); ONS population data (2015), IMD deprivation data (2015), Basemap travel time data (car, off-peak); sSNAP audit (2017); Clinical Standards, South East Coast Stroke service specification 2017 Note: This includes spend by periphery CCGs on K&M patients, identified as patients who would access a K&M site in the baseline. Takes into account current MFF values for sites. *The workforce and service on-costs for PRUH were calculated based on a total service cost of £6.23m (from reference costs). 25% of the total activity at PRUH is accounted for by patients for whom the closest site by travel time is to DVH. This % was applied to the total workforce and service on-cost resulting in £1.56m. 1) To calculate Eastbourne total workforce and service costs, 28% of the PRUH costs were taken, as the K&M activity at Eastbourne is 28% of the PRUHs, see appendix for full working,
• 20 year system position• No inflator or deflator added to income or workforce costs as assumed will net each other out• Due the the current unsustainability of the stroke services, it is has been assumed that the stroke service is unable to deliver all
of the assumed efficiency gains in line with the 2% tariff deflator• Modelling assumes that 2/3 of the 2% tariff deflator is not achievable (a deterioration has been applied on the provider position of
0.67*0.02 of the income each year)• Discount rate is applied at 3.5% per year (being the prevailing HM Treasury rate in force)
24
24
New model of care capacity requirements
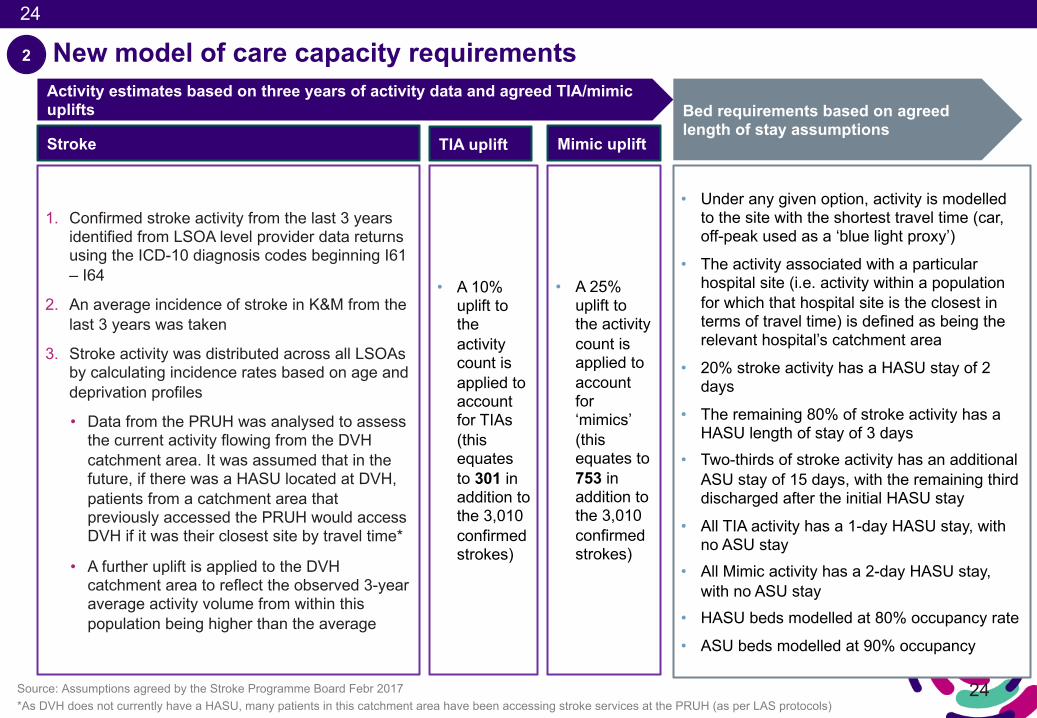
• A 10% uplift to the activity count is applied to account for TIAs (this equates to 301 in addition to the 3,010 confirmed strokes)
• A 25% uplift to the activity count is applied to account for ‘mimics’ (this equates to 753 in addition to the 3,010 confirmed strokes)
Activity estimates based on three years of activity data and agreed TIA/mimic uplifts Bed requirements based on agreed
length of stay assumptions
• Under any given option, activity is modelled to the site with the shortest travel time (car, off-peak used as a ‘blue light proxy’)
• The activity associated with a particular hospital site (i.e. activity within a population for which that hospital site is the closest in terms of travel time) is defined as being the relevant hospital’s catchment area
• 20% stroke activity has a HASU stay of 2 days
• The remaining 80% of stroke activity has a HASU length of stay of 3 days
• Two-thirds of stroke activity has an additional ASU stay of 15 days, with the remaining third discharged after the initial HASU stay
• All TIA activity has a 1-day HASU stay, with no ASU stay
• All Mimic activity has a 2-day HASU stay, with no ASU stay
• HASU beds modelled at 80% occupancy rate
• ASU beds modelled at 90% occupancy
Source: Assumptions agreed by the Stroke Programme Board Febr 2017*As DVH does not currently have a HASU, many patients in this catchment area have been accessing stroke services at the PRUH (as per LAS protocols)
TIA uplift Mimic uplift
1. Confirmed stroke activity from the last 3 years identified from LSOA level provider data returns using the ICD-10 diagnosis codes beginning I61 – I64
2. An average incidence of stroke in K&M from the last 3 years was taken
3. Stroke activity was distributed across all LSOAs by calculating incidence rates based on age and deprivation profiles
• Data from the PRUH was analysed to assess the current activity flowing from the DVH catchment area. It was assumed that in the future, if there was a HASU located at DVH, patients from a catchment area that previously accessed the PRUH would access DVH if it was their closest site by travel time*
• A further uplift is applied to the DVH catchment area to reflect the observed 3-year average activity volume from within this population being higher than the average
Stroke
2
25
25
2016/17 bed requirement
Activity growth ALOS (13 days) Bed occupancy (80% HASU; 90% ASU)
Total required beds
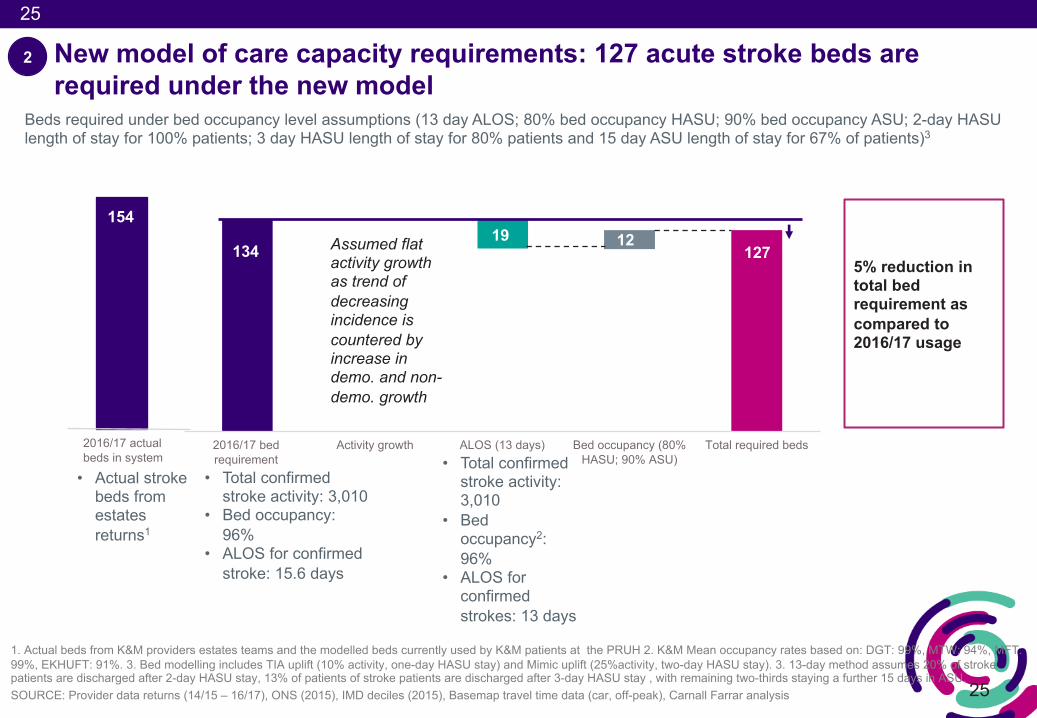
New model of care capacity requirements: 127 acute stroke beds are required under the new model
Beds required under bed occupancy level assumptions (13 day ALOS; 80% bed occupancy HASU; 90% bed occupancy ASU; 2-day HASU length of stay for 100% patients; 3 day HASU length of stay for 80% patients and 15 day ASU length of stay for 67% of patients)3
• Total confirmed stroke activity: 3,010
• Bed occupancy: 96%
• ALOS for confirmed stroke: 15.6 days
1345% reduction in total bed requirement as compared to 2016/17 usage
Assumed flat activity growth as trend of decreasing incidence is countered by increase in demo. and non-demo. growth
• Total confirmed stroke activity: 3,010
• Bed occupancy2: 96%
• ALOS for confirmed strokes: 13 days
1. Actual beds from K&M providers estates teams and the modelled beds currently used by K&M patients at the PRUH 2. K&M Mean occupancy rates based on: DGT: 99%, MTW: 94%, MFT: 99%, EKHUFT: 91%. 3. Bed modelling includes TIA uplift (10% activity, one-day HASU stay) and Mimic uplift (25%activity, two-day HASU stay). 3. 13-day method assumes 20% of stroke patients are discharged after 2-day HASU stay, 13% of patients of stroke patients are discharged after 3-day HASU stay , with remaining two-thirds staying a further 15 days in ASU. SOURCE: Provider data returns (14/15 – 16/17), ONS (2015), IMD deciles (2015), Basemap travel time data (car, off-peak), Carnall Farrar analysis
127
2
154
2016/17 actual beds in system
• Actual stroke beds from estates returns1
19 12
26
26
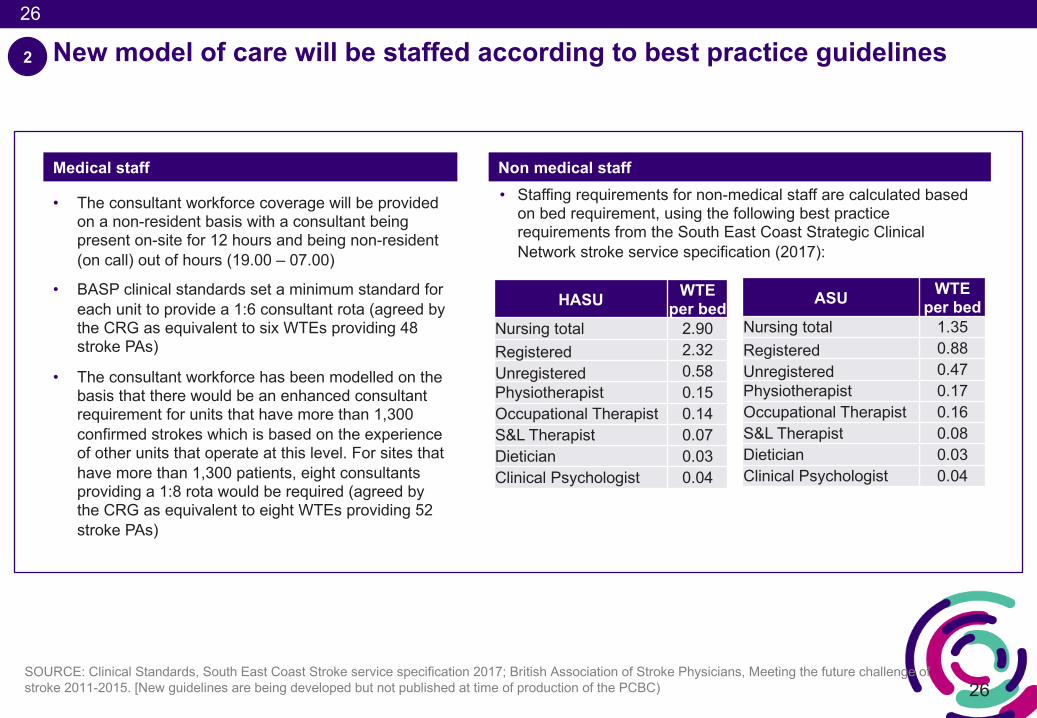
New model of care will be staffed according to best practice guidelines
SOURCE: Clinical Standards, South East Coast Stroke service specification 2017; British Association of Stroke Physicians, Meeting the future challenge of stroke 2011-2015. [New guidelines are being developed but not published at time of production of the PCBC)
HASU WTE per bed
Nursing total 2.90Registered 2.32Unregistered 0.58Physiotherapist 0.15Occupational Therapist 0.14S&L Therapist 0.07Dietician 0.03Clinical Psychologist 0.04
ASU WTE per bed
Nursing total 1.35Registered 0.88Unregistered 0.47Physiotherapist 0.17Occupational Therapist 0.16S&L Therapist 0.08Dietician 0.03Clinical Psychologist 0.04
• The consultant workforce coverage will be provided on a non-resident basis with a consultant being present on-site for 12 hours and being non-resident (on call) out of hours (19.00 – 07.00)
• BASP clinical standards set a minimum standard for each unit to provide a 1:6 consultant rota (agreed by the CRG as equivalent to six WTEs providing 48 stroke PAs)
• The consultant workforce has been modelled on the basis that there would be an enhanced consultant requirement for units that have more than 1,300 confirmed strokes which is based on the experience of other units that operate at this level. For sites that have more than 1,300 patients, eight consultants providing a 1:8 rota would be required (agreed by the CRG as equivalent to eight WTEs providing 52 stroke PAs)
• Staffing requirements for non-medical staff are calculated based on bed requirement, using the following best practice requirements from the South East Coast Strategic Clinical Network stroke service specification (2017):
Medical staff Non medical staff
2
27
Staff in post (WTE) Funded establishment
(WTE)
Additional requirement under
future model (WTE)
Total requirement under future model
(WTE)
Staff in post (WTE) Funded establishment
(WTE)
Additional requirement under
future model (WTE)
Total requirement under future model
(WTE)
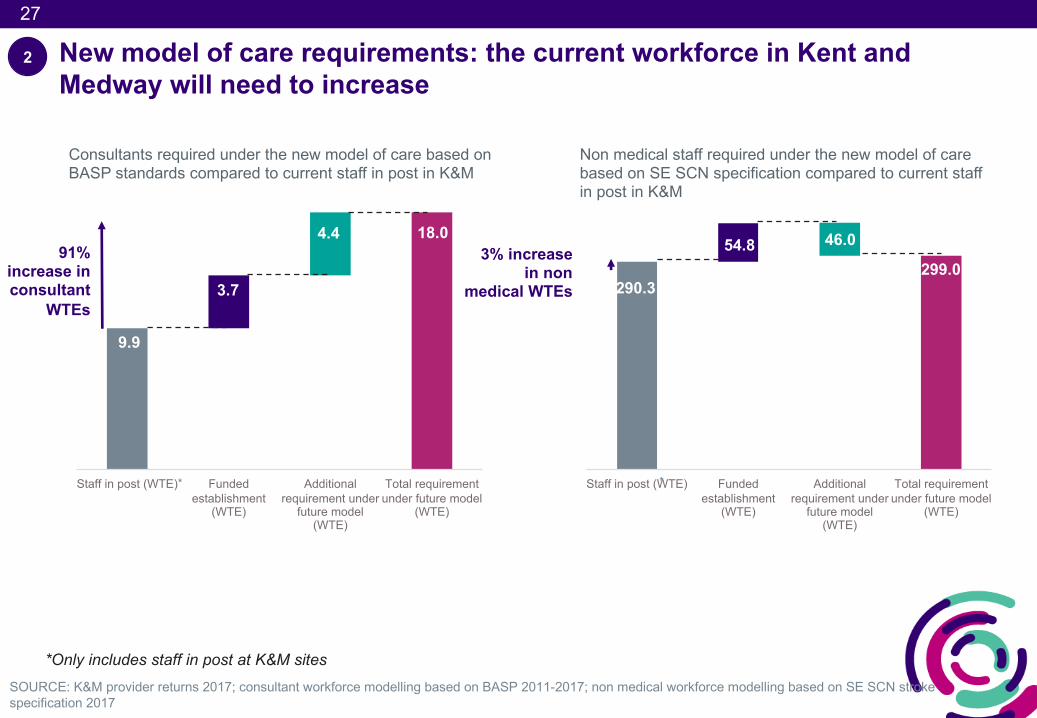
New model of care requirements: the current workforce in Kent and Medway will need to increase
SOURCE: K&M provider returns 2017; consultant workforce modelling based on BASP 2011-2017; non medical workforce modelling based on SE SCN stroke specification 2017
9.9
3.7
4.4 18.0
Consultants required under the new model of care based on BASP standards compared to current staff in post in K&M
91% increase in consultant
WTEs
Non medical staff required under the new model of care based on SE SCN specification compared to current staff in post in K&M
290.3
54.8 46.0
299.03% increase
in non medical WTEs
*Only includes staff in post at K&M sites
**
2
28
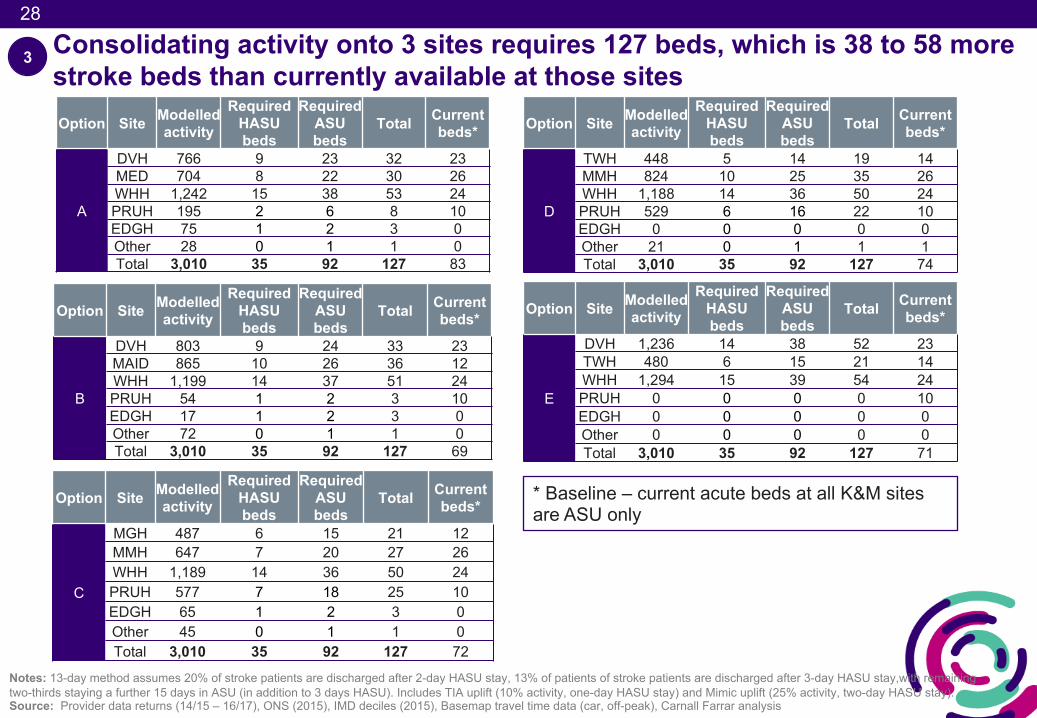
Consolidating activity onto 3 sites requires 127 beds, which is 38 to 58 more stroke beds than currently available at those sitesOption Site Modelled
activityRequired
HASU beds
RequiredASU beds
Total Currentbeds*
A
DVH 766 9 23 32 23MED 704 8 22 30 26WHH 1,242 15 38 53 24PRUH 195 2 6 8 10EDGH 75 1 2 3 0Other 28 0 1 1 0Total 3,010 35 92 127 83
3
* Baseline – current acute beds at all K&M sites are ASU only
Option Site Modelledactivity
RequiredHASU beds
RequiredASU beds
Total Currentbeds*
B
DVH 803 9 24 33 23MAID 865 10 26 36 12WHH 1,199 14 37 51 24PRUH 54 1 2 3 10EDGH 17 1 2 3 0Other 72 0 1 1 0Total 3,010 35 92 127 69
Notes: 13-day method assumes 20% of stroke patients are discharged after 2-day HASU stay, 13% of patients of stroke patients are discharged after 3-day HASU stay,with remaining two-thirds staying a further 15 days in ASU (in addition to 3 days HASU). Includes TIA uplift (10% activity, one-day HASU stay) and Mimic uplift (25% activity, two-day HASU stay). Source: Provider data returns (14/15 – 16/17), ONS (2015), IMD deciles (2015), Basemap travel time data (car, off-peak), Carnall Farrar analysis
Option Site Modelledactivity
RequiredHASU beds
RequiredASU beds
Total Currentbeds*
C
MGH 487 6 15 21 12MMH 647 7 20 27 26WHH 1,189 14 36 50 24PRUH 577 7 18 25 10EDGH 65 1 2 3 0Other 45 0 1 1 0Total 3,010 35 92 127 72
Option Site Modelledactivity
RequiredHASU beds
RequiredASU beds
Total Currentbeds*
D
TWH 448 5 14 19 14MMH 824 10 25 35 26WHH 1,188 14 36 50 24PRUH 529 6 16 22 10EDGH 0 0 0 0 0Other 21 0 1 1 1Total 3,010 35 92 127 74
Option Site Modelledactivity
RequiredHASU beds
RequiredASU beds
Total Currentbeds*
E
DVH 1,236 14 38 52 23TWH 480 6 15 21 14WHH 1,294 15 39 54 24PRUH 0 0 0 0 10EDGH 0 0 0 0 0Other 0 0 0 0 0Total 3,010 35 92 127 71
29
29
3
SOURCE: K&M Trust estates returns (2017); K&M STP Estates workstream (2017); Gleeds analysis (2017); Carnall Farrar analysis (2017)*£11m of which is cost for additional resus, space and CT scanners **Additional cost for decant is a revenue cost
Option A capital req. £000
Option B capital req. £000
Option Ccapital req. £000
Option Dcapital req. £000
741(refurb) N/A 5,318
(refurb)22,947*
(new build) N/A 1,360(new build)
454(new build) 30,820
741 (refurb)
11,550(new build) N/A 22,191*
(new build) N/A1,360
(new build) 454(new build) 36,296
N/A 4,460(new build)
5,318(refurb)
22,191*(new build)
3,625(new build)
1,360(new build)
907(new build) 37,861
N/A 5,269(new build)
5,318(refurb)
22,191*(new build)
2,719(new build) N/A 454
(new build) 35,951
741(refurb)**
6,190(new build) N/A 23,703*
(new build) N/A N/A N/A 30,634
Option
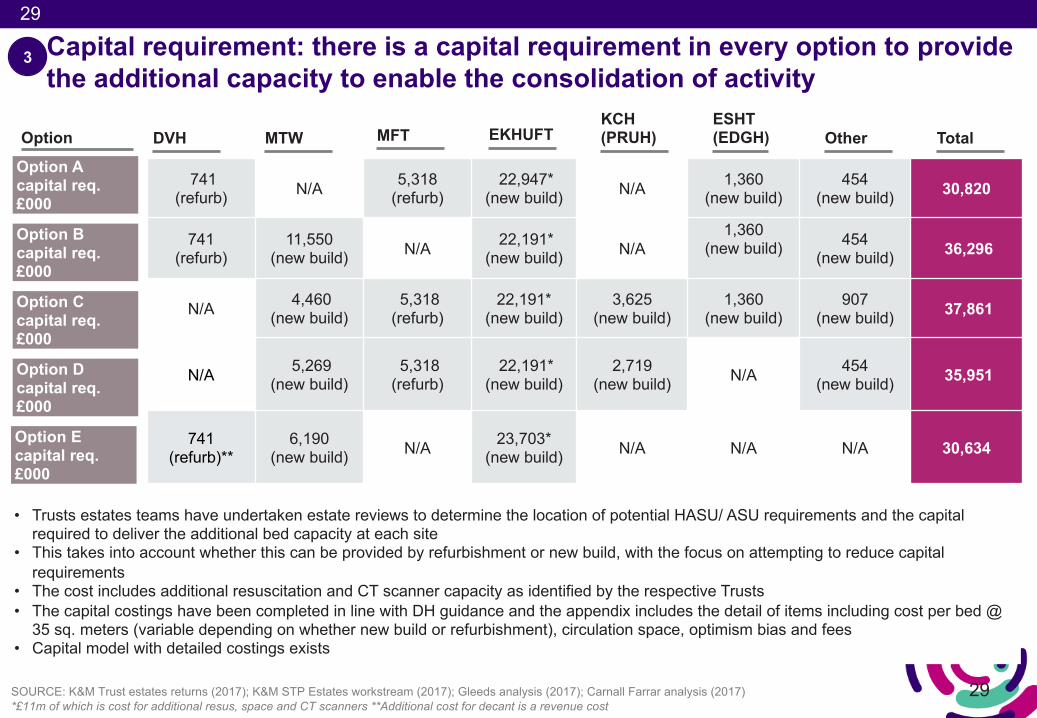
• Trusts estates teams have undertaken estate reviews to determine the location of potential HASU/ ASU requirements and the capital required to deliver the additional bed capacity at each site
• This takes into account whether this can be provided by refurbishment or new build, with the focus on attempting to reduce capital requirements
• The cost includes additional resuscitation and CT scanner capacity as identified by the respective Trusts• The capital costings have been completed in line with DH guidance and the appendix includes the detail of items including cost per bed @
35 sq. meters (variable depending on whether new build or refurbishment), circulation space, optimism bias and fees• Capital model with detailed costings exists
Capital requirement: there is a capital requirement in every option to provide the additional capacity to enable the consolidation of activity
DVH MTW MFT EKHUFTKCH (PRUH) Total
ESHT (EDGH) Other
Option Ecapital req. £000
30
30
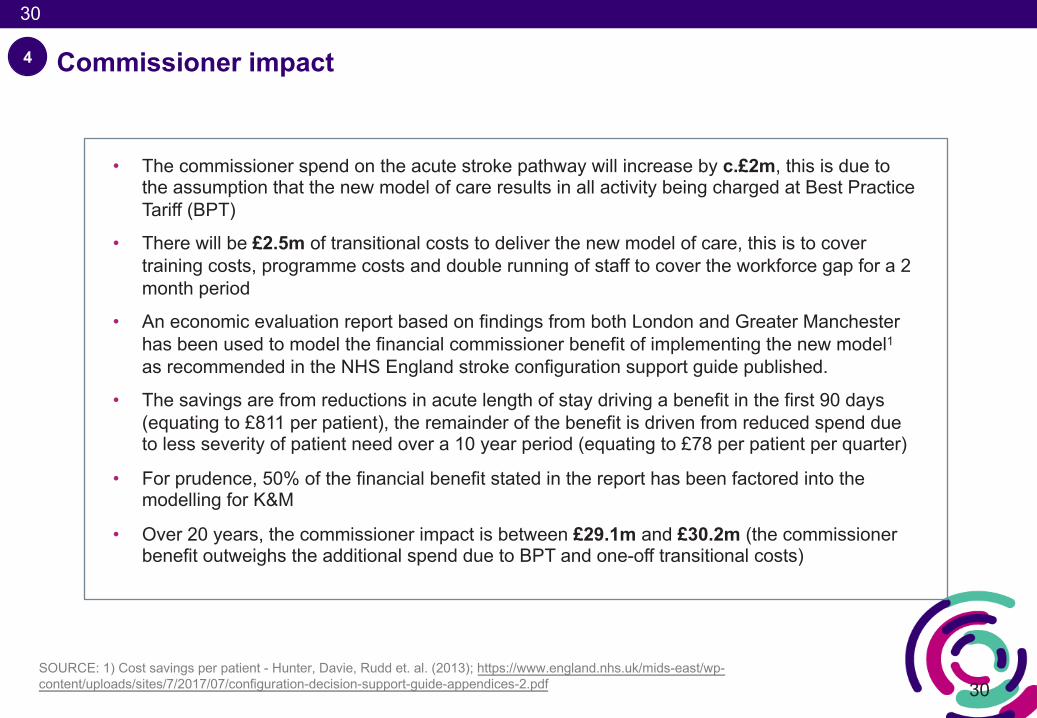
• The commissioner spend on the acute stroke pathway will increase by c.£2m, this is due to the assumption that the new model of care results in all activity being charged at Best Practice Tariff (BPT)
• There will be £2.5m of transitional costs to deliver the new model of care, this is to cover training costs, programme costs and double running of staff to cover the workforce gap for a 2 month period
• An economic evaluation report based on findings from both London and Greater Manchester has been used to model the financial commissioner benefit of implementing the new model1as recommended in the NHS England stroke configuration support guide published.
• The savings are from reductions in acute length of stay driving a benefit in the first 90 days (equating to £811 per patient), the remainder of the benefit is driven from reduced spend due to less severity of patient need over a 10 year period (equating to £78 per patient per quarter)
• For prudence, 50% of the financial benefit stated in the report has been factored into the modelling for K&M
• Over 20 years, the commissioner impact is between £29.1m and £30.2m (the commissioner benefit outweighs the additional spend due to BPT and one-off transitional costs)
Commissioner impact 4
SOURCE: 1) Cost savings per patient - Hunter, Davie, Rudd et. al. (2013); https://www.england.nhs.uk/mids-east/wp-content/uploads/sites/7/2017/07/configuration-decision-support-guide-appendices-2.pdf
31
31
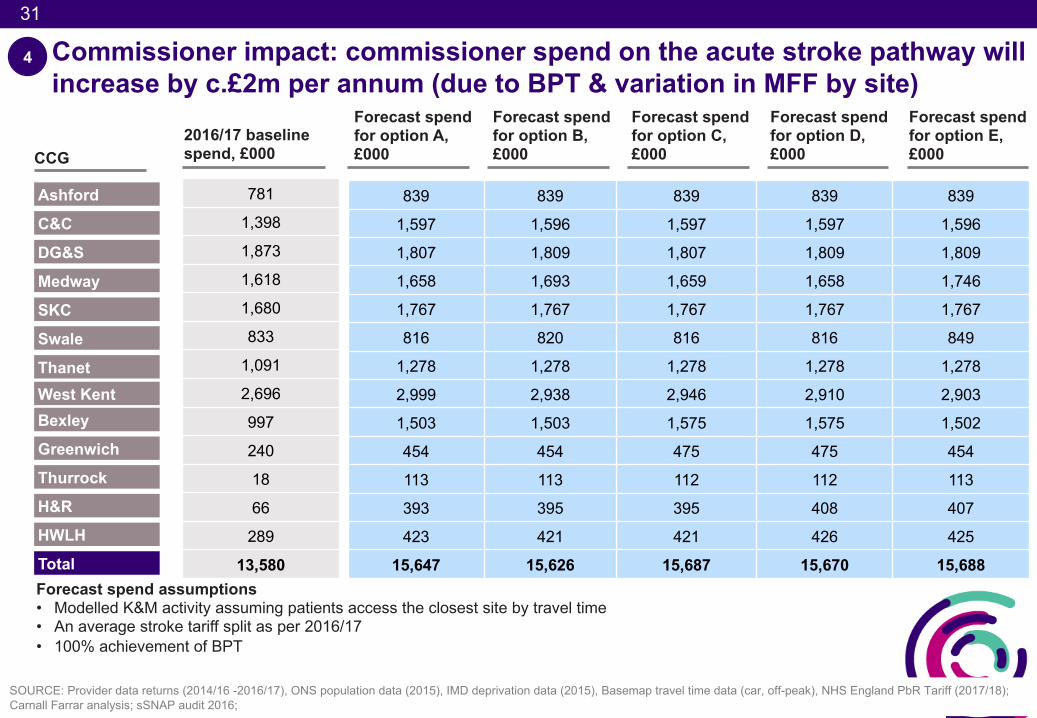
Commissioner impact: commissioner spend on the acute stroke pathway will increase by c.£2m per annum (due to BPT & variation in MFF by site)
SOURCE: Provider data returns (2014/16 -2016/17), ONS population data (2015), IMD deprivation data (2015), Basemap travel time data (car, off-peak), NHS England PbR Tariff (2017/18); Carnall Farrar analysis; sSNAP audit 2016;
Forecast spend for option A, £000
Forecast spend for option B, £000
Forecast spend for option C, £000
Forecast spend for option D, £000
839 839 839 839 839
1,597 1,596 1,597 1,597 1,596
1,807 1,809 1,807 1,809 1,809
1,658 1,693 1,659 1,658 1,746
1,767 1,767 1,767 1,767 1,767
816 820 816 816 849
1,278 1,278 1,278 1,278 1,278
2,999 2,938 2,946 2,910 2,903
1,503 1,503 1,575 1,575 1,502
454 454 475 475 454
113 113 112 112 113
393 395 395 408 407
423 421 421 426 425
15,647 15,626 15,687 15,670 15,688Forecast spend assumptions• Modelled K&M activity assuming patients access the closest site by travel time • An average stroke tariff split as per 2016/17• 100% achievement of BPT
2016/17 baseline spend, £000CCG
Ashford
C&C
DG&S
Medway
SKC
Swale
Thanet
781
1,398
1,873
1,618
1,680
833
1,091
2,696
997
240
18
66
289
13,580
Bexley
Greenwich
Thurrock
H&R
HWLH
Total
4
West Kent
Forecast spend for option E, £000
32
32
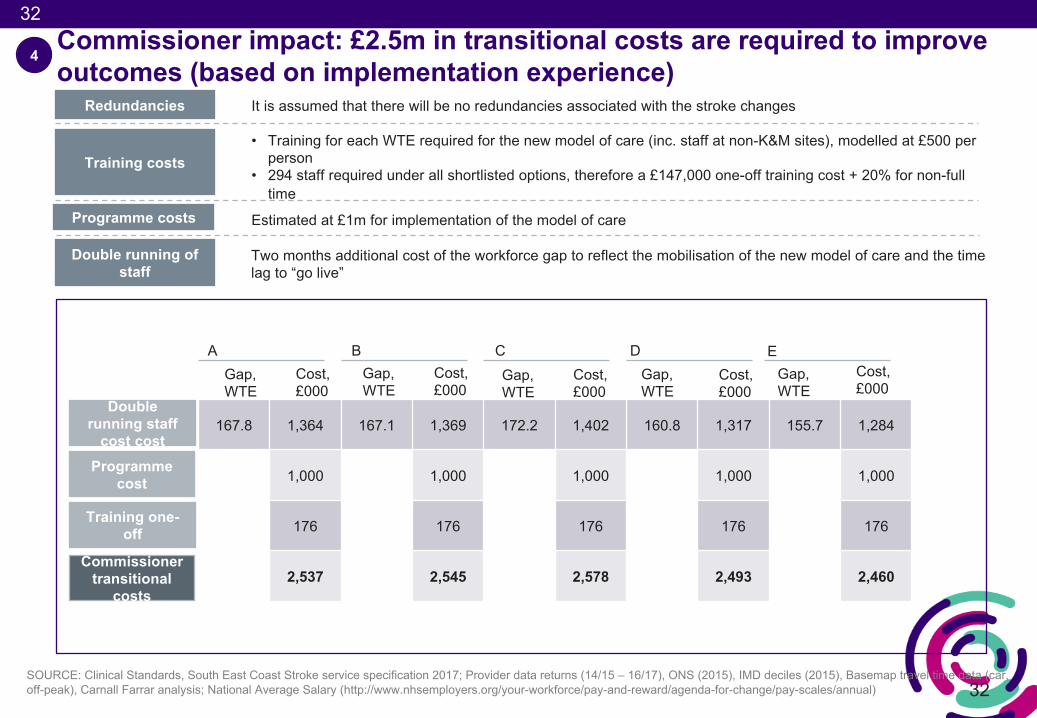
Commissioner impact: £2.5m in transitional costs are required to improve outcomes (based on implementation experience)
167.8 1,364 167.1 1,369 172.2 1,402 160.8 1,317 155.7 1,284
1,000 1,000 1,000 1,000 1,000
176 176 176 176 176
2,537 2,545 2,578 2,493 2,460
Redundancies It is assumed that there will be no redundancies associated with the stroke changes
Training costs • Training for each WTE required for the new model of care (inc. staff at non-K&M sites), modelled at £500 per
person• 294 staff required under all shortlisted options, therefore a £147,000 one-off training cost + 20% for non-full
timeProgramme costs Estimated at £1m for implementation of the model of care
Double running of staff
Two months additional cost of the workforce gap to reflect the mobilisation of the new model of care and the time lag to “go live”
AGap, WTE
Cost, £000
Gap, WTE
Cost, £000
Gap, WTE
Cost, £000
Gap, WTE
Cost, £000
B C D
Double running staff
cost cost
4
Programme cost
Training one-off
Commissioner transitional
costs
SOURCE: Clinical Standards, South East Coast Stroke service specification 2017; Provider data returns (14/15 – 16/17), ONS (2015), IMD deciles (2015), Basemap travel time data (car, off-peak), Carnall Farrar analysis; National Average Salary (http://www.nhsemployers.org/your-workforce/pay-and-reward/agenda-for-change/pay-scales/annual)
Gap, WTE
Cost, £000
E
33
33SOURCE: K&M Trust estates returns (September 2017); HM Treasury discount rate; K&M STP Estates workstream (August 2017); Gleeds analysis (September 2017); Carnall Farrar analysis (September 2017), Cost savings per patient - Hunter, Davie, Rudd et. al. (2013); NHS England PbR Tariff (2017/18); 3.5% discount factor taken on all recurrent costs and income. https://www.england.nhs.uk/mids-east/wp-content/uploads/sites/7/2017/07/configuration-decision-support-guide-appendices-2.pdf*Sensitivity analysis assessing impact if not all of this benefit is realised is included in the appendix
4
Option
A
B
C
D
Non-recurrent transitional costs, £000
Commissioner impact over 20 years, £000
(2,537) (23,430) 55,603 29,636
(2,545) (23,453) 55,671 29,673
(2,578) (23,790) 56,610 30,242
(2,493) (23,703) 56,360 30,164
(2,460) (23,017) 54,532 29,055
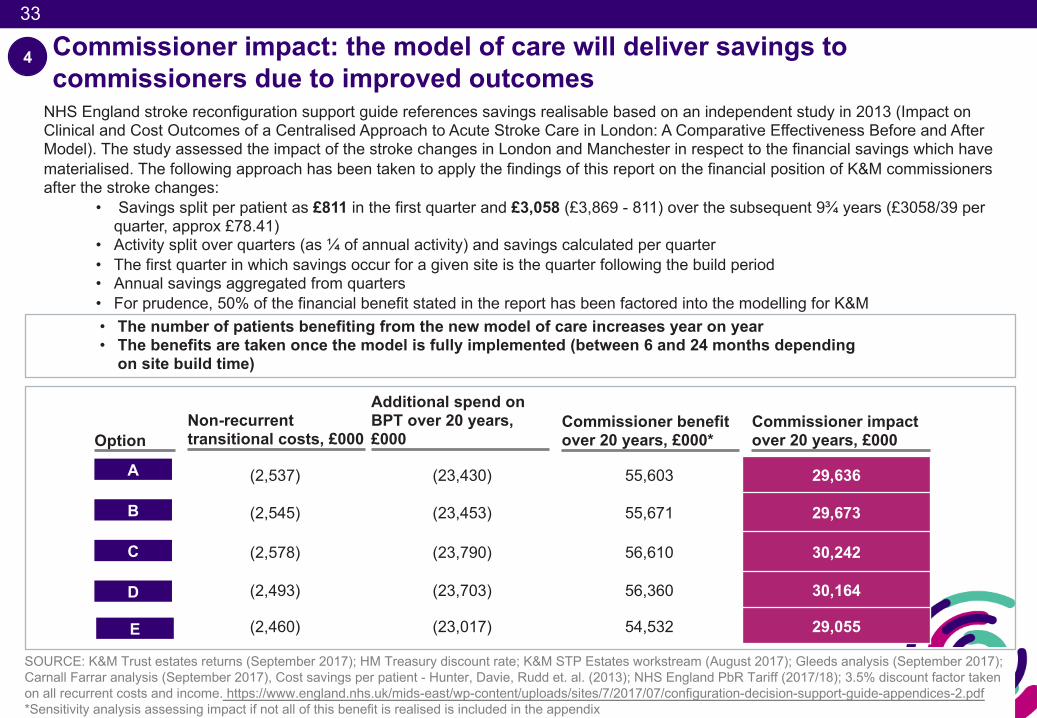
Commissioner impact: the model of care will deliver savings to commissioners due to improved outcomes
Additional spend on BPT over 20 years, £000
Commissioner benefit over 20 years, £000*
NHS England stroke reconfiguration support guide references savings realisable based on an independent study in 2013 (Impact on Clinical and Cost Outcomes of a Centralised Approach to Acute Stroke Care in London: A Comparative Effectiveness Before and After Model). The study assessed the impact of the stroke changes in London and Manchester in respect to the financial savings which have materialised. The following approach has been taken to apply the findings of this report on the financial position of K&M commissioners after the stroke changes:
• Savings split per patient as £811 in the first quarter and £3,058 (£3,869 - 811) over the subsequent 9¾ years (£3058/39 per quarter, approx £78.41)
• Activity split over quarters (as ¼ of annual activity) and savings calculated per quarter• The first quarter in which savings occur for a given site is the quarter following the build period• Annual savings aggregated from quarters• For prudence, 50% of the financial benefit stated in the report has been factored into the modelling for K&M• The number of patients benefiting from the new model of care increases year on year• The benefits are taken once the model is fully implemented (between 6 and 24 months depending
on site build time)
E
34
34
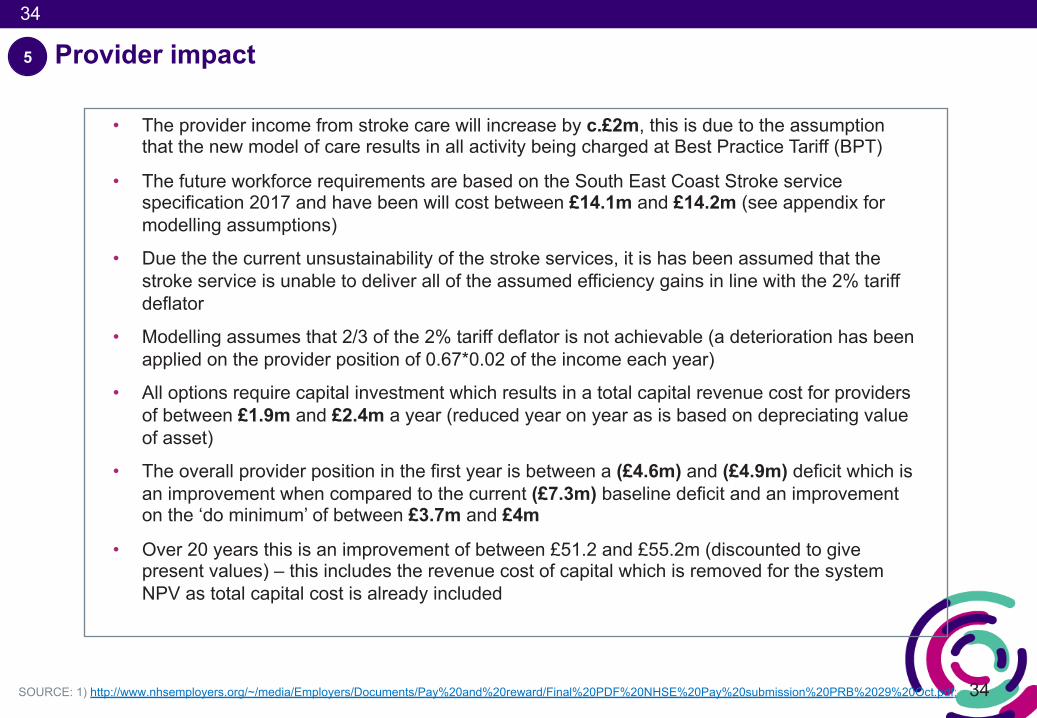
Provider impact
• The provider income from stroke care will increase by c.£2m, this is due to the assumption that the new model of care results in all activity being charged at Best Practice Tariff (BPT)
• The future workforce requirements are based on the South East Coast Stroke service specification 2017 and have been will cost between £14.1m and £14.2m (see appendix for modelling assumptions)
• Due the the current unsustainability of the stroke services, it is has been assumed that the stroke service is unable to deliver all of the assumed efficiency gains in line with the 2% tariff deflator
• Modelling assumes that 2/3 of the 2% tariff deflator is not achievable (a deterioration has been applied on the provider position of 0.67*0.02 of the income each year)
• All options require capital investment which results in a total capital revenue cost for providers of between £1.9m and £2.4m a year (reduced year on year as is based on depreciating value of asset)
• The overall provider position in the first year is between a (£4.6m) and (£4.9m) deficit which is an improvement when compared to the current (£7.3m) baseline deficit and an improvement on the ‘do minimum’ of between £3.7m and £4m
• Over 20 years this is an improvement of between £51.2 and £55.2m (discounted to give present values) – this includes the revenue cost of capital which is removed for the system NPV as total capital cost is already included
5
SOURCE: 1) http://www.nhsemployers.org/~/media/Employers/Documents/Pay%20and%20reward/Final%20PDF%20NHSE%20Pay%20submission%20PRB%2029%20Oct.pdf;
35
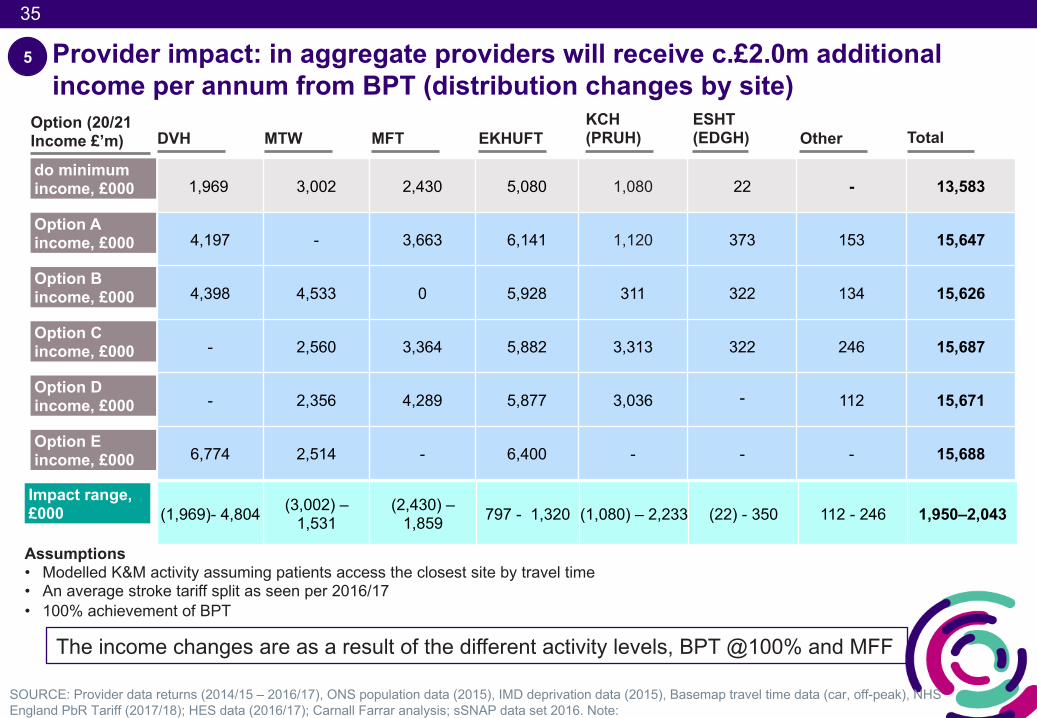
Provider impact: in aggregate providers will receive c.£2.0m additional income per annum from BPT (distribution changes by site)
SOURCE: Provider data returns (2014/15 – 2016/17), ONS population data (2015), IMD deprivation data (2015), Basemap travel time data (car, off-peak), NHS England PbR Tariff (2017/18); HES data (2016/17); Carnall Farrar analysis; sSNAP data set 2016. Note:
Option A income, £000
Option B income, £000
Option C income, £000
Option D income, £000
1,969 3,002 2,430 5,080 1,080 22 - 13,583
4,197 - 3,663 6,141 1,120 373 153 15,647
4,398 4,533 0 5,928 311 322 134 15,626
- 2,560 3,364 5,882 3,313 322 246 15,687
- 2,356 4,289 5,877 3,036 - 112 15,671
6,774 2,514 - 6,400 - - - 15,688
Option (20/21 Income £’m)
do minimum income, £000
Assumptions• Modelled K&M activity assuming patients access the closest site by travel time • An average stroke tariff split as seen per 2016/17• 100% achievement of BPT
Impact range, £000 (1,969)- 4,804 (3,002) –
1,531(2,430) –
1,859 797 - 1,320 (1,080) – 2,233 (22) - 350 112 - 246 1,950–2,043
5
The income changes are as a result of the different activity levels, BPT @100% and MFF
DVH MTW MFT EKHUFTKCH (PRUH) Total
ESHT (EDGH) Other
Option E income, £000
36
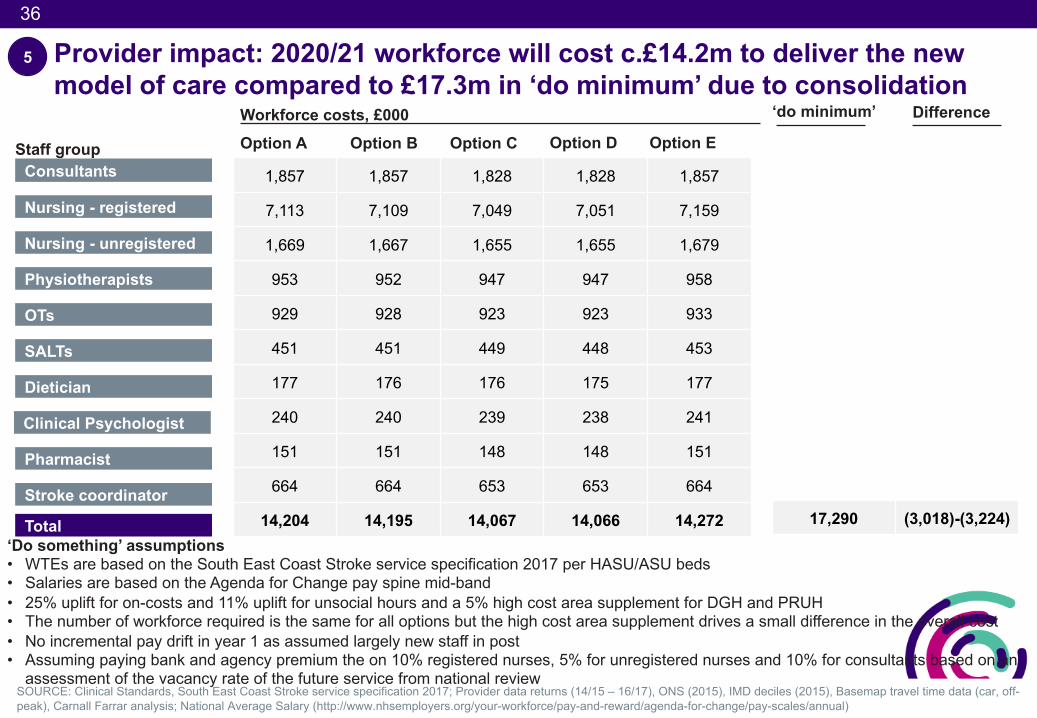
Provider impact: 2020/21 workforce will cost c.£14.2m to deliver the new model of care compared to £17.3m in ‘do minimum’ due to consolidation
SOURCE: Clinical Standards, South East Coast Stroke service specification 2017; Provider data returns (14/15 – 16/17), ONS (2015), IMD deciles (2015), Basemap travel time data (car, off-peak), Carnall Farrar analysis; National Average Salary (http://www.nhsemployers.org/your-workforce/pay-and-reward/agenda-for-change/pay-scales/annual)
‘Do something’ assumptions• WTEs are based on the South East Coast Stroke service specification 2017 per HASU/ASU beds• Salaries are based on the Agenda for Change pay spine mid-band • 25% uplift for on-costs and 11% uplift for unsocial hours and a 5% high cost area supplement for DGH and PRUH • The number of workforce required is the same for all options but the high cost area supplement drives a small difference in the overall cost• No incremental pay drift in year 1 as assumed largely new staff in post • Assuming paying bank and agency premium the on 10% registered nurses, 5% for unregistered nurses and 10% for consultants based on an
assessment of the vacancy rate of the future service from national review
Staff group Consultants
Nursing - registered
Nursing - unregistered
Physiotherapists
OTs
SALTs
Dietician
Total
Pharmacist
Stroke coordinator
Clinical Psychologist
1,857 1,857 1,828 1,828 1,857
7,113 7,109 7,049 7,051 7,159
1,669 1,667 1,655 1,655 1,679
953 952 947 947 958
929 928 923 923 933
451 451 449 448 453
177 176 176 175 177
240 240 239 238 241
151 151 148 148 151
664 664 653 653 664
14,204 14,195 14,067 14,066 14,272
Workforce costs, £000Option A Option B Option C Option D
5
17,290 (3,018)-(3,224)
‘do minimum’ Difference
Option E
37
37
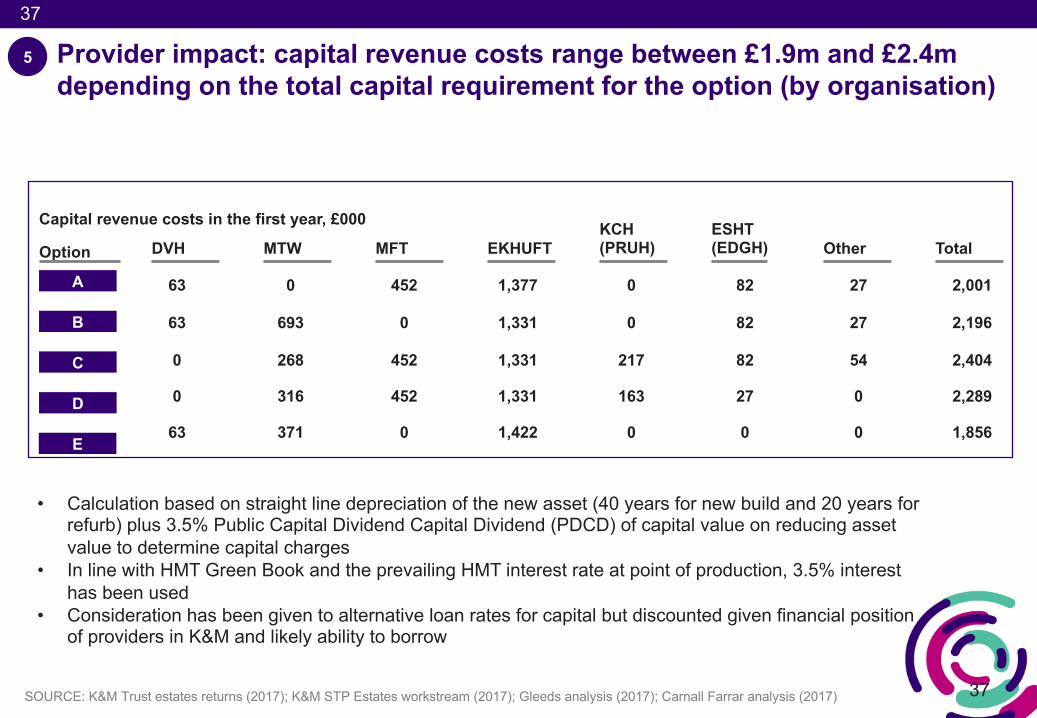
Provider impact: capital revenue costs range between £1.9m and £2.4m depending on the total capital requirement for the option (by organisation)
SOURCE: K&M Trust estates returns (2017); K&M STP Estates workstream (2017); Gleeds analysis (2017); Carnall Farrar analysis (2017)
Option
A
B
C
D
63 0 452 1,377 0 82 27 2,001
63 693 0 1,331 0 82 27 2,196
0 268 452 1,331 217 82 54 2,404
0 316 452 1,331 163 27 0 2,289
63 371 0 1,422 0 0 0 1,856
Capital revenue costs in the first year, £000
DVH MTW MFT EKHUFTKCH (PRUH) Total
ESHT (EDGH) Other
5
• Calculation based on straight line depreciation of the new asset (40 years for new build and 20 years for refurb) plus 3.5% Public Capital Dividend Capital Dividend (PDCD) of capital value on reducing asset value to determine capital charges
• In line with HMT Green Book and the prevailing HMT interest rate at point of production, 3.5% interest has been used
• Consideration has been given to alternative loan rates for capital but discounted given financial position of providers in K&M and likely ability to borrow
E
38
38
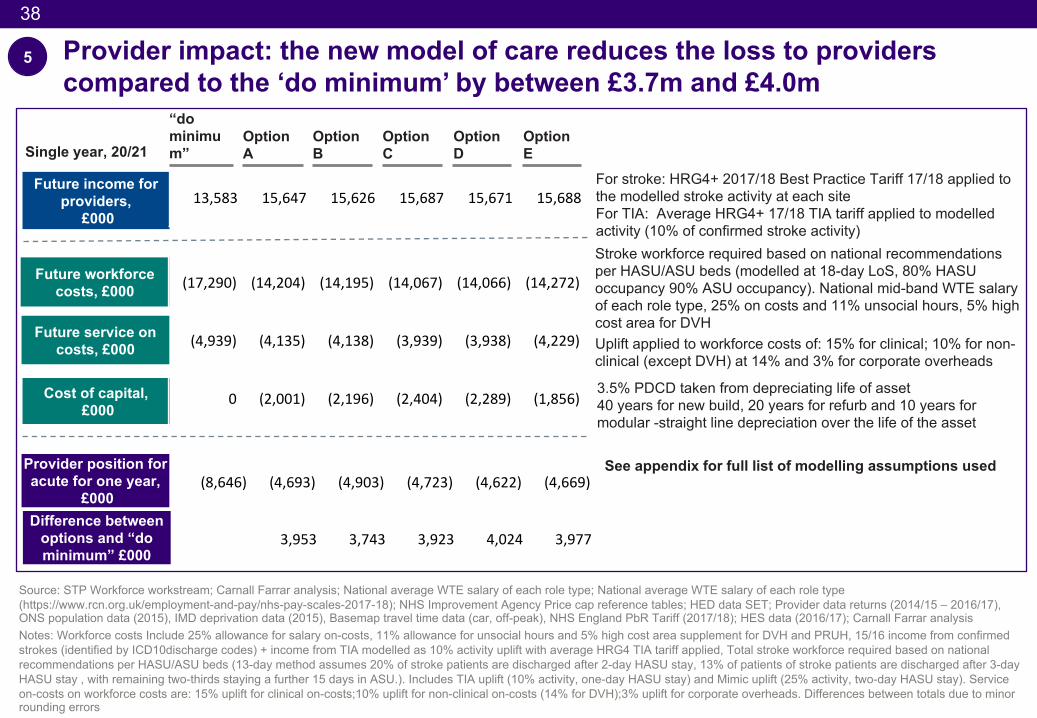
Provider impact: the new model of care reduces the loss to providers compared to the ‘do minimum’ by between £3.7m and £4.0m
Option B
Option C
Option D
Option A
Future workforce costs, £000
Future income for providers,
£000
Provider position for acute for one year,
£000
Cost of capital, £000
(17,290) (14,204) (14,195) (14,067) (14,066) (14,272)
(4,939) (4,135) (4,138) (3,939) (3,938) (4,229)
0 (2,001) (2,196) (2,404) (2,289) (1,856)
Future service on costs, £000
13,583 15,647 15,626 15,687 15,671 15,688
‘
For stroke: HRG4+ 2017/18 Best Practice Tariff 17/18 applied to the modelled stroke activity at each siteFor TIA: Average HRG4+ 17/18 TIA tariff applied to modelled activity (10% of confirmed stroke activity)Stroke workforce required based on national recommendations per HASU/ASU beds (modelled at 18-day LoS, 80% HASU occupancy 90% ASU occupancy). National mid-band WTE salary of each role type, 25% on costs and 11% unsocial hours, 5% high cost area for DVHUplift applied to workforce costs of: 15% for clinical; 10% for non-clinical (except DVH) at 14% and 3% for corporate overheads
3.5% PDCD taken from depreciating life of asset40 years for new build, 20 years for refurb and 10 years for modular -straight line depreciation over the life of the asset
Source: STP Workforce workstream; Carnall Farrar analysis; National average WTE salary of each role type; National average WTE salary of each role type (https://www.rcn.org.uk/employment-and-pay/nhs-pay-scales-2017-18); NHS Improvement Agency Price cap reference tables; HED data SET; Provider data returns (2014/15 – 2016/17), ONS population data (2015), IMD deprivation data (2015), Basemap travel time data (car, off-peak), NHS England PbR Tariff (2017/18); HES data (2016/17); Carnall Farrar analysisNotes: Workforce costs Include 25% allowance for salary on-costs, 11% allowance for unsocial hours and 5% high cost area supplement for DVH and PRUH, 15/16 income from confirmed strokes (identified by ICD10discharge codes) + income from TIA modelled as 10% activity uplift with average HRG4 TIA tariff applied, Total stroke workforce required based on national recommendations per HASU/ASU beds (13-day method assumes 20% of stroke patients are discharged after 2-day HASU stay, 13% of patients of stroke patients are discharged after 3-day HASU stay , with remaining two-thirds staying a further 15 days in ASU.). Includes TIA uplift (10% activity, one-day HASU stay) and Mimic uplift (25% activity, two-day HASU stay). Service on-costs on workforce costs are: 15% uplift for clinical on-costs;10% uplift for non-clinical on-costs (14% for DVH);3% uplift for corporate overheads. Differences between totals due to minor rounding errors
“do minimum”
Option E
(8,646) (4,693) (4,903) (4,723) (4,622) (4,669)
Difference between options and “do minimum” £000
3,953 3,743 3,923 4,024 3,977
See appendix for full list of modelling assumptions used
Single year, 20/21
5
39
39SOURCE: Carnall Farrar analysis (2017)
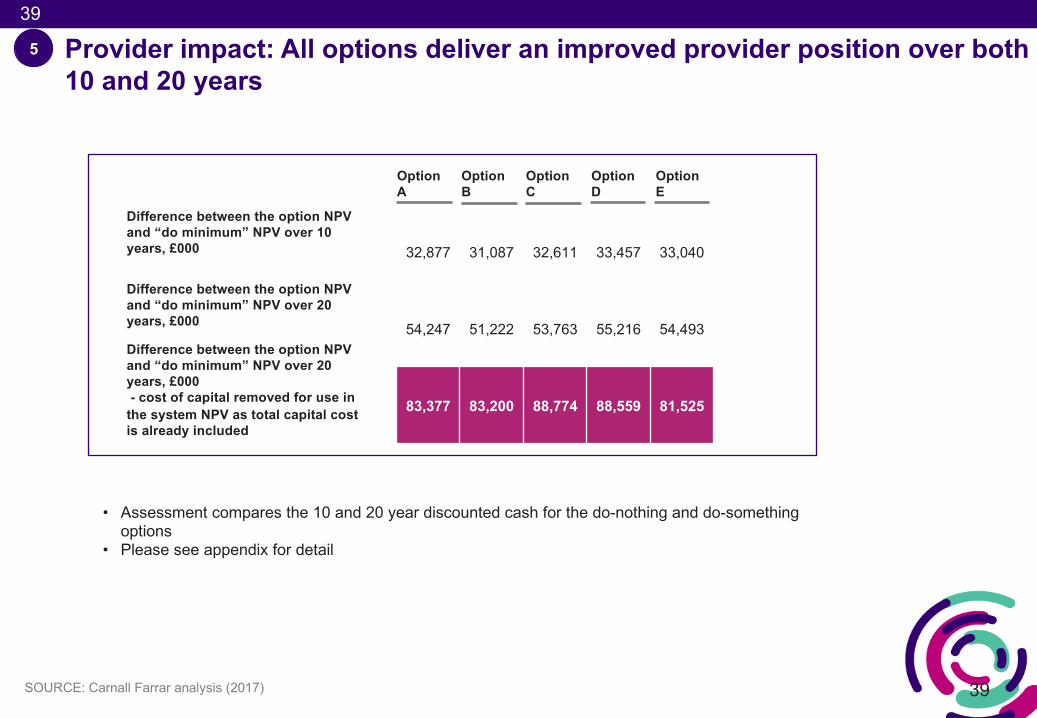
Provider impact: All options deliver an improved provider position over both 10 and 20 years
5
• Assessment compares the 10 and 20 year discounted cash for the do-nothing and do-something options
• Please see appendix for detail
Option B
Option C
Option D
Option A
Option E
Difference between the option NPV and “do minimum” NPV over 10 years, £000
Difference between the option NPV and “do minimum” NPV over 20 years, £000
32,877 31,087 32,611 33,457 33,040
54,247 51,222 53,763 55,216 54,493
83,377 83,200 88,774 88,559 81,525
Difference between the option NPV and “do minimum” NPV over 20 years, £000 - cost of capital removed for use in
the system NPV as total capital cost is already included
40
40
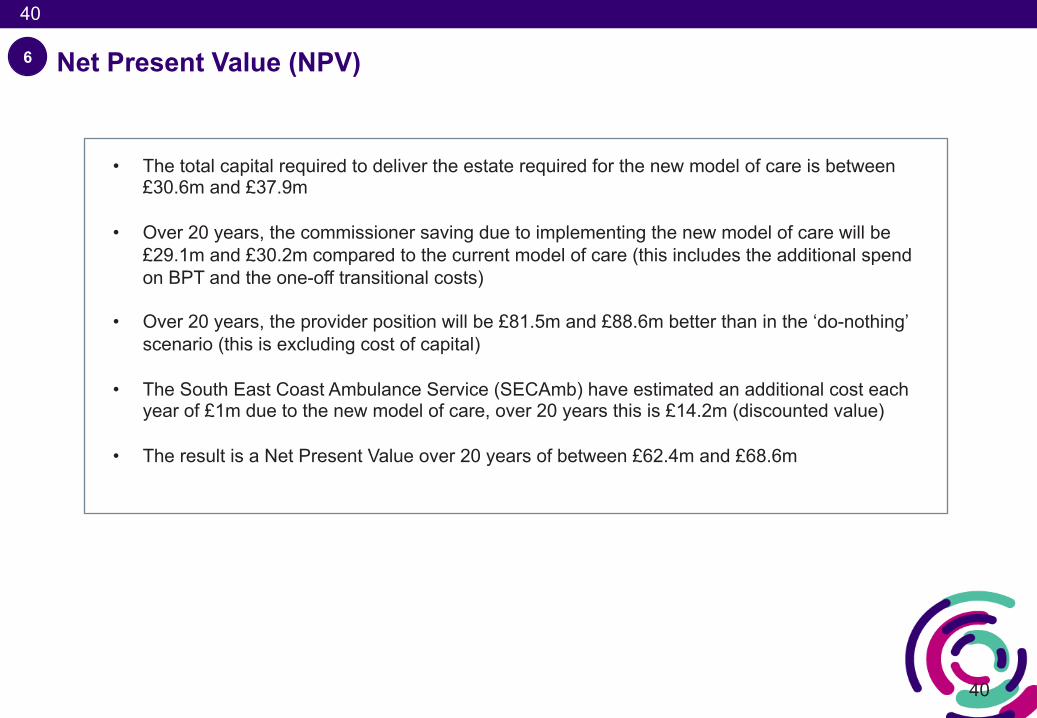
• The total capital required to deliver the estate required for the new model of care is between £30.6m and £37.9m
• Over 20 years, the commissioner saving due to implementing the new model of care will be £29.1m and £30.2m compared to the current model of care (this includes the additional spend on BPT and the one-off transitional costs)
• Over 20 years, the provider position will be £81.5m and £88.6m better than in the ‘do-nothing’ scenario (this is excluding cost of capital)
• The South East Coast Ambulance Service (SECAmb) have estimated an additional cost each year of £1m due to the new model of care, over 20 years this is £14.2m (discounted value)
• The result is a Net Present Value over 20 years of between £62.4m and £68.6m
Net Present Value (NPV)6
41
The NPV assessment sees a positive return on investment of between £62.4m and £68.6m after 20 years
SOURCE: K&M trust estates returns (September 2017); HM Treasury discount rate; K&M STP Estates workstream (August 2017); Gleeds analysis (September 2017); Carnall Farrar analysis (September 2017), Cost savings per patient - Hunter, Davie, Rudd et. al. (2013); NHS England PbR Tariff (2017/18); Data returns 2016/17; sSNAP audit 2016https://www.england.nhs.uk/mids-east/wp-content/uploads/sites/7/2017/07/configuration-decision-support-guide-appendices-2.pdf
Provider impact over 20 years, £000
NPV over 20 years, £000
Commissioner impact over 20 years, £000
20 year “do minimum” shortfall, £000
Increased cost for ambulance over 20 years, £000
• In 2016/17, stroke services in K&M made a loss of £7.8m
• The 20 year ‘do minimum’ forecasts a loss of £147.9m on acute stroke services
• Capital requirements are between £30.6m and £37.9m
• £2.5m transitional costs are estimated to implement the new model of care
• Based on applying the financial savings as published by NHS England in their stroke configuration support guide. The new model of care is assumed to give commissioners a saving of between £29.1m and £30.2m over the twenty year year period
• Increased income from the best practice tariff (BPT) and savings assumed through the release of stroke beds at non-HASU/ASU sites, cover the provider costs of delivering the new model
• The additional capacity required by the ambulance service costs £14.2m over twenty years
• The overall NPV is between £62.4m and £68.6m after 20 years
Option B Option C Option DOption A
(30,820) (36,296) (37,861) (35,951) (30,634) 29
29,636 29,673 30,242 30,164 29,055 33
83,377 83,200 88,774 88,559 81,525 40
(14,212) (14,212) (14,212) (14,212) (14,212) -
67,981 62,365 66,943 68,560 65,734
See slide
(147,853) 23
See slideDo something
do minimum
Capital requirements, £000
Option E
7
42
42
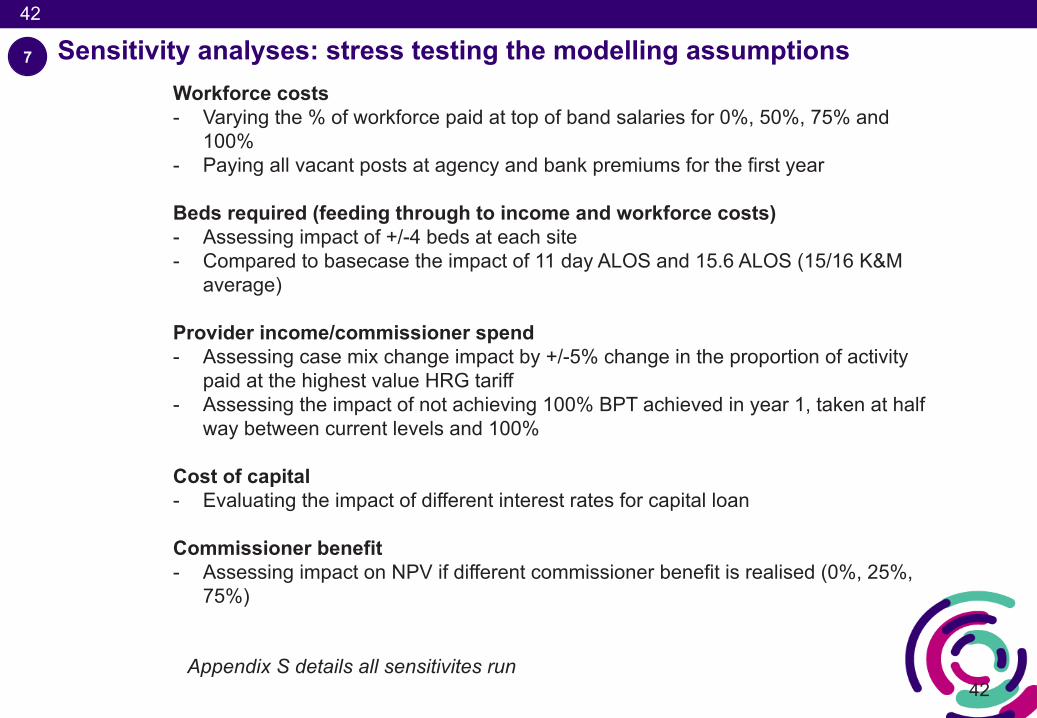
Sensitivity analyses: stress testing the modelling assumptions 7
Workforce costs- Varying the % of workforce paid at top of band salaries for 0%, 50%, 75% and
100%- Paying all vacant posts at agency and bank premiums for the first year
Beds required (feeding through to income and workforce costs)- Assessing impact of +/-4 beds at each site - Compared to basecase the impact of 11 day ALOS and 15.6 ALOS (15/16 K&M
average)
Provider income/commissioner spend- Assessing case mix change impact by +/-5% change in the proportion of activity
paid at the highest value HRG tariff - Assessing the impact of not achieving 100% BPT achieved in year 1, taken at half
way between current levels and 100%
Cost of capital- Evaluating the impact of different interest rates for capital loan
Commissioner benefit- Assessing impact on NPV if different commissioner benefit is realised (0%, 25%,
75%)
Appendix S details all sensitivites run
43
43
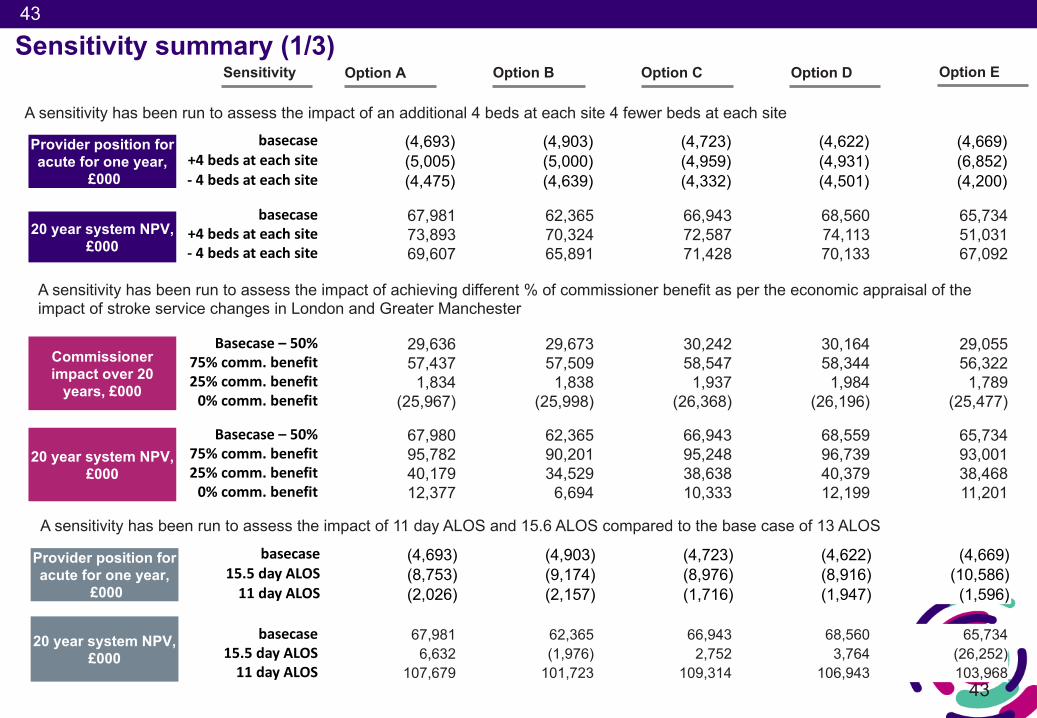
Sensitivity summary (1/3) Option B Option C Option DOption A Option E
basecase (4,693) (4,903) (4,723) (4,622) (4,669)+4bedsateachsite (5,005) (5,000) (4,959) (4,931) (6,852)- 4bedsateachsite (4,475) (4,639) (4,332) (4,501) (4,200)
Provider position for acute for one year,
£000
Sensitivity
20 year system NPV, £000
basecase 67,981 62,365 66,943 68,560 65,734+4bedsateachsite 73,893 70,324 72,587 74,113 51,031 - 4bedsateachsite 69,607 65,891 71,428 70,133 67,092
Commissioner impact over 20
years, £000
Basecase– 50% 29,636 29,673 30,242 30,164 29,05575%comm.benefit 57,437 57,509 58,547 58,344 56,32225%comm.benefit 1,834 1,838 1,937 1,984 1,7890%comm.benefit (25,967) (25,998) (26,368) (26,196) (25,477)
basecase (4,693) (4,903) (4,723) (4,622) (4,669)15.5dayALOS (8,753) (9,174) (8,976) (8,916) (10,586)11 dayALOS (2,026) (2,157) (1,716) (1,947) (1,596)
Provider position for acute for one year,
£000
A sensitivity has been run to assess the impact of an additional 4 beds at each site 4 fewer beds at each site
A sensitivity has been run to assess the impact of achieving different % of commissioner benefit as per the economic appraisal of the impact of stroke service changes in London and Greater Manchester
A sensitivity has been run to assess the impact of 11 day ALOS and 15.6 ALOS compared to the base case of 13 ALOS
Basecase– 50% 67,980 62,365 66,943 68,559 65,734 75%comm.benefit 95,782 90,201 95,248 96,739 93,001 25%comm.benefit 40,179 34,529 38,638 40,379 38,468 0%comm.benefit 12,377 6,694 10,333 12,199 11,201
20 year system NPV, £000
basecase 67,981 62,365 66,943 68,560 65,73415.5dayALOS 6,632 (1,976) 2,752 3,764 (26,252)11 dayALOS 107,679 101,723 109,314 106,943 103,968
20 year system NPV, £000
44
44
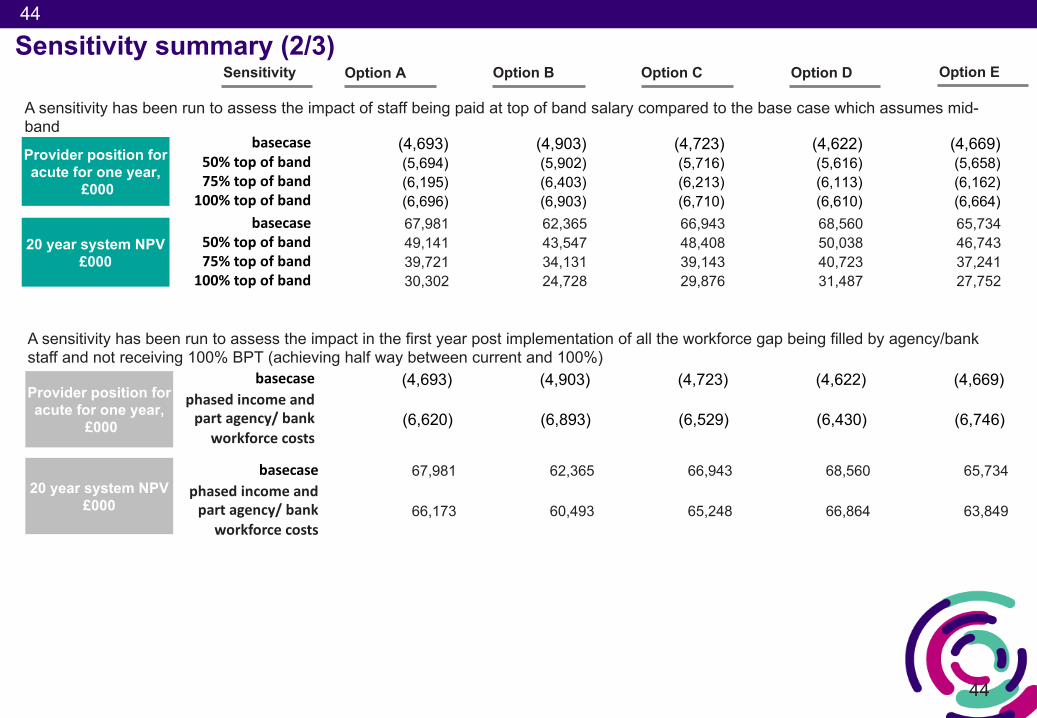
Sensitivity summary (2/3) Option B Option C Option DOption A Option ESensitivity
basecase (4,693) (4,903) (4,723) (4,622) (4,669)phasedincomeandpartagency/bank
workforcecosts(6,620) (6,893) (6,529) (6,430) (6,746)
Provider position for acute for one year,
£000
A sensitivity has been run to assess the impact in the first year post implementation of all the workforce gap being filled by agency/bank staff and not receiving 100% BPT (achieving half way between current and 100%)
basecase (4,693) (4,903) (4,723) (4,622) (4,669)50%topof band (5,694) (5,902) (5,716) (5,616) (5,658)75%top ofband (6,195) (6,403) (6,213) (6,113) (6,162)
100%topofband (6,696) (6,903) (6,710) (6,610) (6,664)
Provider position for acute for one year,
£000
A sensitivity has been run to assess the impact of staff being paid at top of band salary compared to the base case which assumes mid-band
20 year system NPV £000
basecase 67,981 62,365 66,943 68,560 65,73450%topof band 49,141 43,547 48,408 50,038 46,743 75%top ofband 39,721 34,131 39,143 40,723 37,241
100%topofband 30,302 24,728 29,876 31,487 27,752
20 year system NPV £000
basecase 67,981 62,365 66,943 68,560 65,734phasedincomeandpartagency/bank
workforcecosts66,173 60,493 65,248 66,864 63,849
45
45
Sensitivity summary (3/3) Option B Option C Option DOption A Option E
Provider position for acute for one year,
£000
Sensitivity
Cost of capital over 20 years,
£000
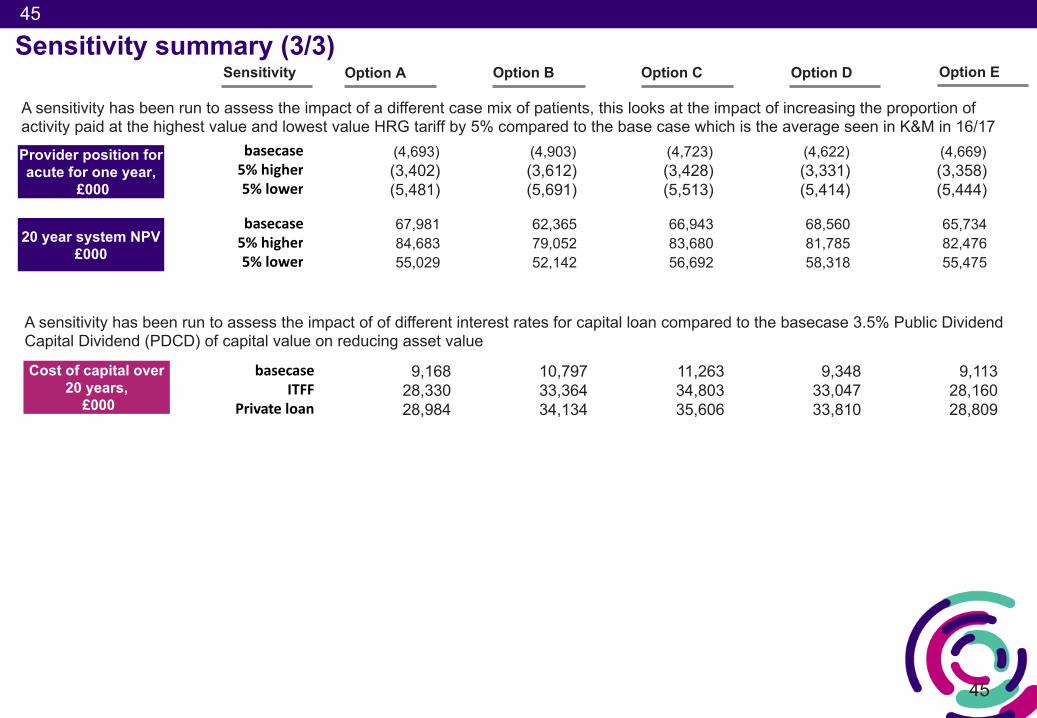
basecase 9,168 10,797 11,263 9,348 9,113ITFF 28,330 33,364 34,803 33,047 28,160
Private loan 28,984 34,134 35,606 33,810 28,809
basecase (4,693) (4,903) (4,723) (4,622) (4,669)5%higher (3,402) (3,612) (3,428) (3,331) (3,358)5%lower (5,481) (5,691) (5,513) (5,414) (5,444)
A sensitivity has been run to assess the impact of a different case mix of patients, this looks at the impact of increasing the proportion of activity paid at the highest value and lowest value HRG tariff by 5% compared to the base case which is the average seen in K&M in 16/17
A sensitivity has been run to assess the impact of of different interest rates for capital loan compared to the basecase 3.5% Public Dividend Capital Dividend (PDCD) of capital value on reducing asset value
20 year system NPV £000
basecase 67,981 62,365 66,943 68,560 65,7345%higher 84,683 79,052 83,680 81,785 82,476 5%lower 55,029 52,142 56,692 58,318 55,475
46
46
Overview of Kent and Medway stroke review
Executive summary
Approach to financial modelling
Financial case
Appendix
Contents
47
47
1. Background and assumptions2. Detailed calculations3. Provider impact 4. NPV for medium list of options5. Full evaluation matrix
Appendix contents
48
48
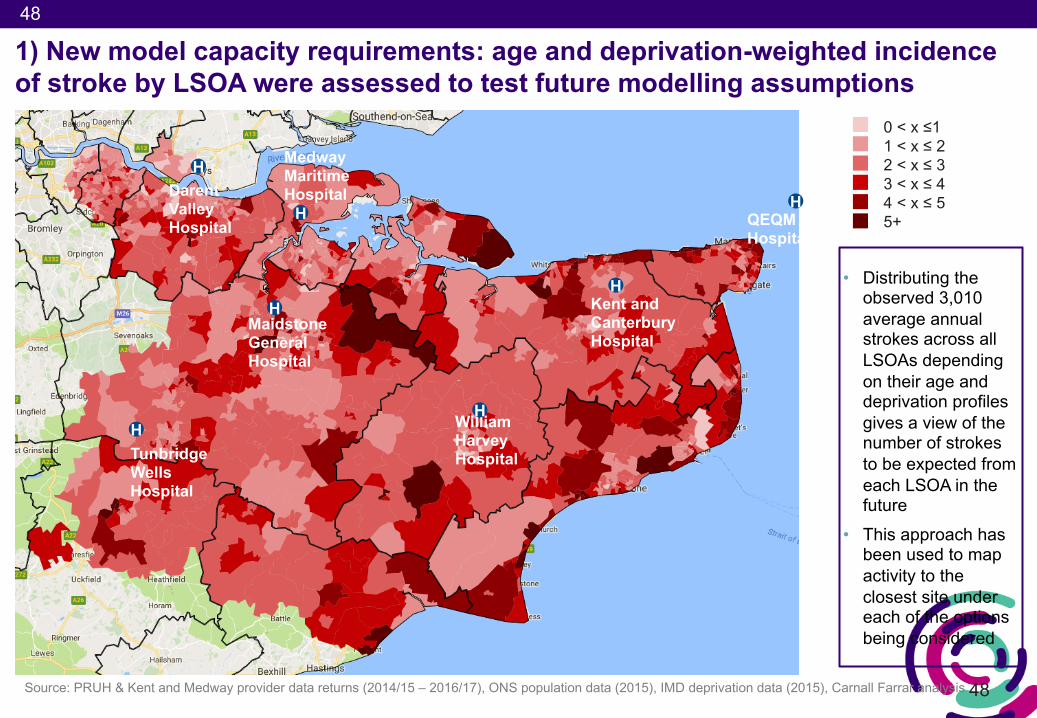
1) New model capacity requirements: age and deprivation-weighted incidence of stroke by LSOA were assessed to test future modelling assumptions
Source: PRUH & Kent and Medway provider data returns (2014/15 – 2016/17), ONS population data (2015), IMD deprivation data (2015), Carnall Farrar analysis
0 < x ≤11 < x ≤ 22 < x ≤ 33 < x ≤ 44 < x ≤ 55+
• Distributing the observed 3,010 average annual strokes across all LSOAs depending on their age and deprivation profiles gives a view of the number of strokes to be expected from each LSOA in the future
• This approach has been used to map activity to the closest site under each of the options being considered
DarentValley Hospital
Medway Maritime Hospital
QEQM Hospital
William Harvey HospitalTunbridge
Wells Hospital
MaidstoneGeneral Hospital
Kent and Canterbury Hospital
H
H
HH
H
H
H
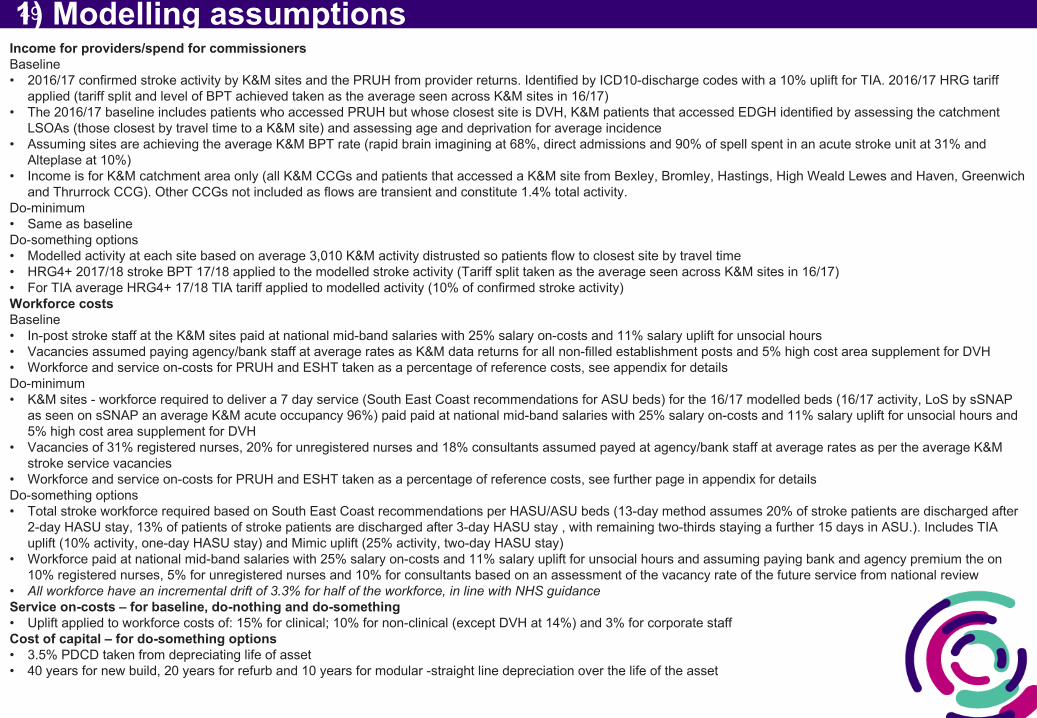
491) Modelling assumptionsIncome for providers/spend for commissionersBaseline• 2016/17 confirmed stroke activity by K&M sites and the PRUH from provider returns. Identified by ICD10-discharge codes with a 10% uplift for TIA. 2016/17 HRG tariff
applied (tariff split and level of BPT achieved taken as the average seen across K&M sites in 16/17)• The 2016/17 baseline includes patients who accessed PRUH but whose closest site is DVH, K&M patients that accessed EDGH identified by assessing the catchment
LSOAs (those closest by travel time to a K&M site) and assessing age and deprivation for average incidence• Assuming sites are achieving the average K&M BPT rate (rapid brain imagining at 68%, direct admissions and 90% of spell spent in an acute stroke unit at 31% and
Alteplase at 10%) • Income is for K&M catchment area only (all K&M CCGs and patients that accessed a K&M site from Bexley, Bromley, Hastings, High Weald Lewes and Haven, Greenwich
and Thrurrock CCG). Other CCGs not included as flows are transient and constitute 1.4% total activity. Do-minimum• Same as baselineDo-something options• Modelled activity at each site based on average 3,010 K&M activity distrusted so patients flow to closest site by travel time• HRG4+ 2017/18 stroke BPT 17/18 applied to the modelled stroke activity (Tariff split taken as the average seen across K&M sites in 16/17)• For TIA average HRG4+ 17/18 TIA tariff applied to modelled activity (10% of confirmed stroke activity)Workforce costsBaseline• In-post stroke staff at the K&M sites paid at national mid-band salaries with 25% salary on-costs and 11% salary uplift for unsocial hours• Vacancies assumed paying agency/bank staff at average rates as K&M data returns for all non-filled establishment posts and 5% high cost area supplement for DVH • Workforce and service on-costs for PRUH and ESHT taken as a percentage of reference costs, see appendix for detailsDo-minimum• K&M sites - workforce required to deliver a 7 day service (South East Coast recommendations for ASU beds) for the 16/17 modelled beds (16/17 activity, LoS by sSNAP
as seen on sSNAP an average K&M acute occupancy 96%) paid paid at national mid-band salaries with 25% salary on-costs and 11% salary uplift for unsocial hours and 5% high cost area supplement for DVH
• Vacancies of 31% registered nurses, 20% for unregistered nurses and 18% consultants assumed payed at agency/bank staff at average rates as per the average K&M stroke service vacancies
• Workforce and service on-costs for PRUH and ESHT taken as a percentage of reference costs, see further page in appendix for detailsDo-something options• Total stroke workforce required based on South East Coast recommendations per HASU/ASU beds (13-day method assumes 20% of stroke patients are discharged after
2-day HASU stay, 13% of patients of stroke patients are discharged after 3-day HASU stay , with remaining two-thirds staying a further 15 days in ASU.). Includes TIA uplift (10% activity, one-day HASU stay) and Mimic uplift (25% activity, two-day HASU stay)
• Workforce paid at national mid-band salaries with 25% salary on-costs and 11% salary uplift for unsocial hours and assuming paying bank and agency premium the on 10% registered nurses, 5% for unregistered nurses and 10% for consultants based on an assessment of the vacancy rate of the future service from national review
• All workforce have an incremental drift of 3.3% for half of the workforce, in line with NHS guidanceService on-costs – for baseline, do-nothing and do-something• Uplift applied to workforce costs of: 15% for clinical; 10% for non-clinical (except DVH at 14%) and 3% for corporate staffCost of capital – for do-something options• 3.5% PDCD taken from depreciating life of asset• 40 years for new build, 20 years for refurb and 10 years for modular -straight line depreciation over the life of the asset
50
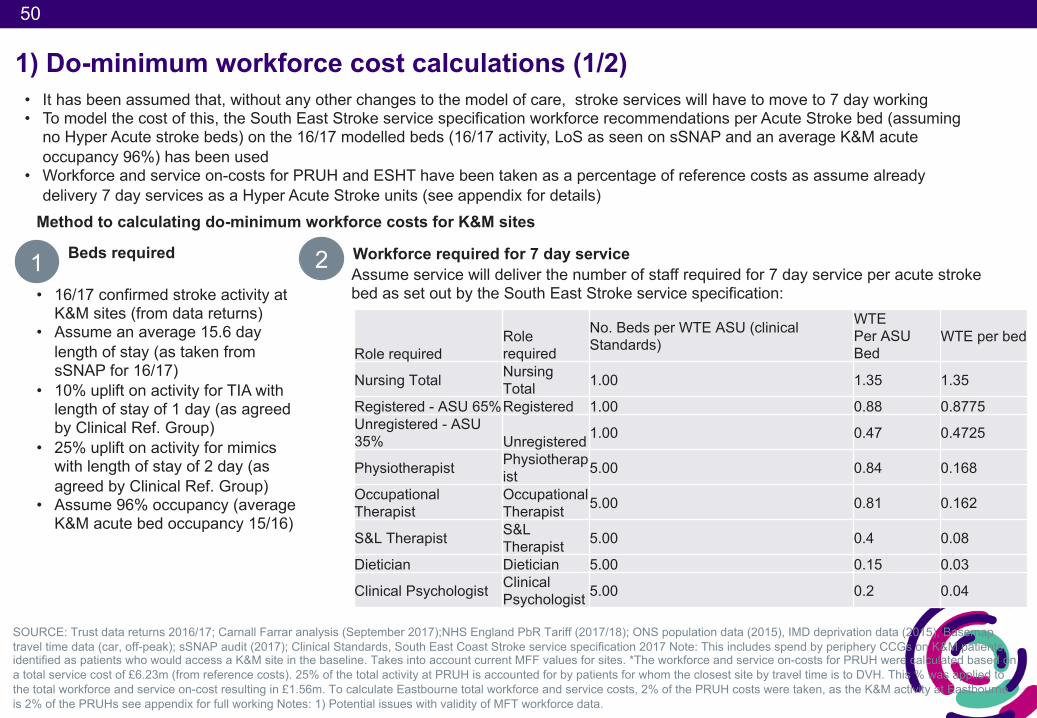
1) Do-minimum workforce cost calculations (1/2)• It has been assumed that, without any other changes to the model of care, stroke services will have to move to 7 day working• To model the cost of this, the South East Stroke service specification workforce recommendations per Acute Stroke bed (assuming
no Hyper Acute stroke beds) on the 16/17 modelled beds (16/17 activity, LoS as seen on sSNAP and an average K&M acute occupancy 96%) has been used
• Workforce and service on-costs for PRUH and ESHT have been taken as a percentage of reference costs as assume already delivery 7 day services as a Hyper Acute Stroke units (see appendix for details)
SOURCE: Trust data returns 2016/17; Carnall Farrar analysis (September 2017);NHS England PbR Tariff (2017/18); ONS population data (2015), IMD deprivation data (2015), Basemaptravel time data (car, off-peak); sSNAP audit (2017); Clinical Standards, South East Coast Stroke service specification 2017 Note: This includes spend by periphery CCGs on K&M patients, identified as patients who would access a K&M site in the baseline. Takes into account current MFF values for sites. *The workforce and service on-costs for PRUH were calculated based on a total service cost of £6.23m (from reference costs). 25% of the total activity at PRUH is accounted for by patients for whom the closest site by travel time is to DVH. This % was applied to the total workforce and service on-cost resulting in £1.56m. To calculate Eastbourne total workforce and service costs, 2% of the PRUH costs were taken, as the K&M activity at Eastbourne is 2% of the PRUHs see appendix for full working Notes: 1) Potential issues with validity of MFT workforce data.
1 Beds required
Method to calculating do-minimum workforce costs for K&M sites
• 16/17 confirmed stroke activity at K&M sites (from data returns)
• Assume an average 15.6 day length of stay (as taken from sSNAP for 16/17)
• 10% uplift on activity for TIA with length of stay of 1 day (as agreed by Clinical Ref. Group)
• 25% uplift on activity for mimics with length of stay of 2 day (as agreed by Clinical Ref. Group)
• Assume 96% occupancy (average K&M acute bed occupancy 15/16)
2 Workforce required for 7 day service Assume service will deliver the number of staff required for 7 day service per acute stroke bed as set out by the South East Stroke service specification:
Role requiredRole required
No. Beds per WTE ASU (clinical Standards)
WTEPer ASU Bed
WTE per bed
Nursing Total Nursing Total 1.00 1.35 1.35
Registered - ASU 65%Registered 1.00 0.88 0.8775Unregistered - ASU 35% Unregistered 1.00 0.47 0.4725
Physiotherapist Physiotherapist 5.00 0.84 0.168
Occupational Therapist
Occupational Therapist 5.00 0.81 0.162
S&L Therapist S&L Therapist 5.00 0.4 0.08
Dietician Dietician 5.00 0.15 0.03
Clinical Psychologist Clinical Psychologist 5.00 0.2 0.04
51
1) Do-minimum workforce cost calculations (2/2)
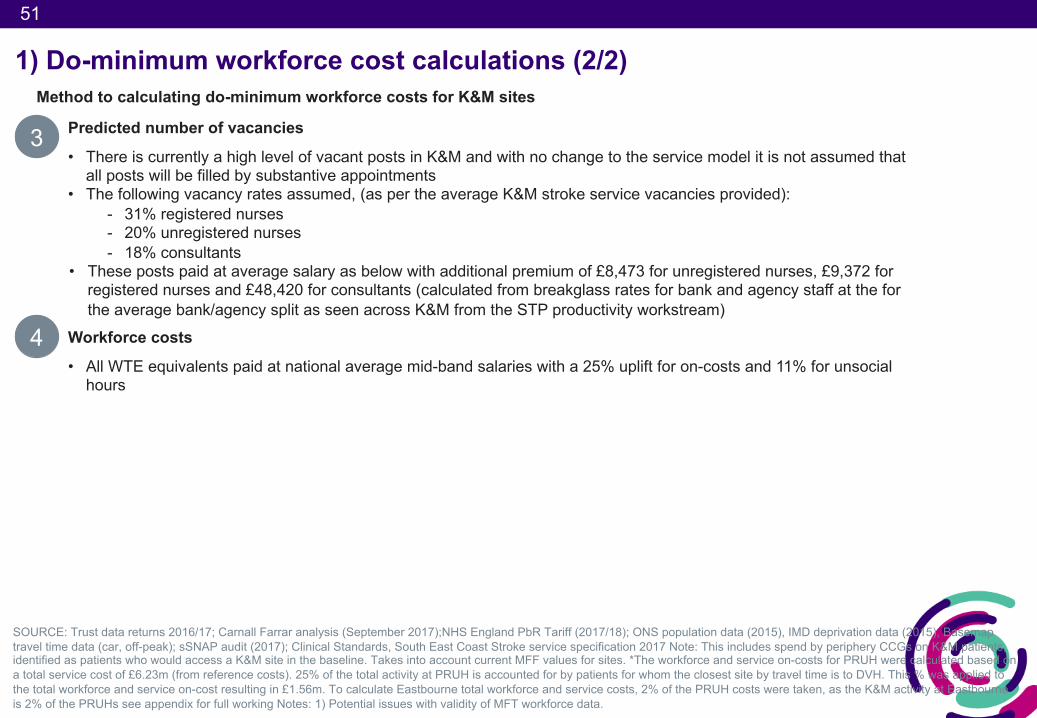
3 Predicted number of vacancies
Method to calculating do-minimum workforce costs for K&M sites
• There is currently a high level of vacant posts in K&M and with no change to the service model it is not assumed that all posts will be filled by substantive appointments
• The following vacancy rates assumed, (as per the average K&M stroke service vacancies provided):- 31% registered nurses- 20% unregistered nurses- 18% consultants
• These posts paid at average salary as below with additional premium of £8,473 for unregistered nurses, £9,372 for registered nurses and £48,420 for consultants (calculated from breakglass rates for bank and agency staff at the for the average bank/agency split as seen across K&M from the STP productivity workstream)
SOURCE: Trust data returns 2016/17; Carnall Farrar analysis (September 2017);NHS England PbR Tariff (2017/18); ONS population data (2015), IMD deprivation data (2015), Basemaptravel time data (car, off-peak); sSNAP audit (2017); Clinical Standards, South East Coast Stroke service specification 2017 Note: This includes spend by periphery CCGs on K&M patients, identified as patients who would access a K&M site in the baseline. Takes into account current MFF values for sites. *The workforce and service on-costs for PRUH were calculated based on a total service cost of £6.23m (from reference costs). 25% of the total activity at PRUH is accounted for by patients for whom the closest site by travel time is to DVH. This % was applied to the total workforce and service on-cost resulting in £1.56m. To calculate Eastbourne total workforce and service costs, 2% of the PRUH costs were taken, as the K&M activity at Eastbourne is 2% of the PRUHs see appendix for full working Notes: 1) Potential issues with validity of MFT workforce data.
4 Workforce costs
• All WTE equivalents paid at national average mid-band salaries with a 25% uplift for on-costs and 11% for unsocial hours
52
52
Background• The aim of introducing Best Practice Tariff (BPT) for stroke was to replace the London Quality Premium for stroke,
whilst being cost neutral• NHS Improvement’s pricing team have advised that stroke BPT reflects key policy drivers for changes in quality and
outcome measures• The BPT is not set to ensure the full costs of the recommended model of care are covered, but instead is a lever to
incentivise change and performance improvement• The BPT is linked to the overall cost of stroke, current attainment of metrics set and target levels
Emerging findings• This analysis identifies a shortfall between income based on 100% BPT and modelled provider costs• Comparison with existing HASU/ ASU sites supports this finding and also identifies a shortfall against the full 100%
BPT which is due to a variety of reasons, potentially including:- The cost of treating mimics included as part of stroke costs, but the corresponding income is attributable to
other service lines- Nationally, the available pool of resource is limited and so increased payment at BPT has to be funded from
reduction elsewhere within the tariff (either stroke base HRGs or other service lines)
Next steps• NHS Improvement and NHS England national pricing teams are currently reviewing the BPT for stroke as a result of
the initial outputs from this work• It is suggested that senior clinical engagement is required to ensure that tariff setting for stroke is reflective of the
full costs of the clinical model
1) Exploring the implications for Best Practice Tariff
Meeting with NHS I Pricing 11 December 2017
53
53
2) Baseline spend calculation breakdown
SOURCE: Provider data returns (2016/17) identify confirmed strokes by ICD10 codes, ONS population data (2015), IMD deprivation data (2015), Basemap travel time data (car, off-peak), NHS England PbR Tariff (2017/18); Carnall Farrar analysis; Current site MFF used Note 1) Tariff split seen: AA35A 3.7%, AA35B 7.4%, AA35C 11.3%, AA35D 19.2%, AA35E 29.7%, 28.7%; 2) Current average K&M achievement of stroke BPTs 68% on rapid brain imaging at £399, 52% on direct admission at £1,026 and 10$ on aldolase at £840; 3) assumed TIA activity is 10% of confirmed stroke activity paid at average tariff of £841
16/17 activity
178319
396
355
383
183249
58920549
4
15
63
2,988
Income based on 0% BPT –tariff split1, £000
5821,043
1,432
1,223
1,253629814
2,040769186
13
49
21910,251
Income from current BPT K&M average achievement2, £000
181324
403
361
390186253
59920950
4
15
643,039
Income from current TIA3, £000
1731
39
35
371824
57205
0
1
6291
Total income, £000
7811,398
1,873
1,618
1,680
8331,091
2,696997240
18
66
289
13,582
CCG
Ashford
C&C
DG&S
Medway
SKC
Swale
Thanet
Bexley
Greenwich
Thurrock
H&R
HWLH
Total
West Kent
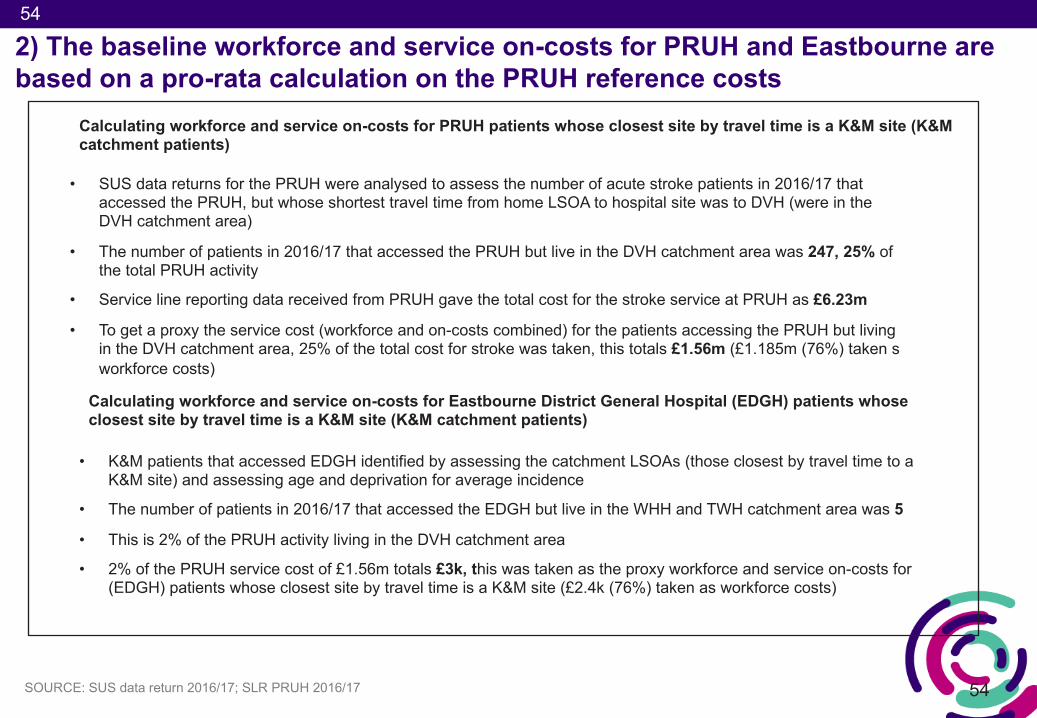
54
54
• SUS data returns for the PRUH were analysed to assess the number of acute stroke patients in 2016/17 that accessed the PRUH, but whose shortest travel time from home LSOA to hospital site was to DVH (were in the DVH catchment area)
• The number of patients in 2016/17 that accessed the PRUH but live in the DVH catchment area was 247, 25% of the total PRUH activity
• Service line reporting data received from PRUH gave the total cost for the stroke service at PRUH as £6.23m
• To get a proxy the service cost (workforce and on-costs combined) for the patients accessing the PRUH but living in the DVH catchment area, 25% of the total cost for stroke was taken, this totals £1.56m (£1.185m (76%) taken s workforce costs)
2) The baseline workforce and service on-costs for PRUH and Eastbourne are based on a pro-rata calculation on the PRUH reference costs
SOURCE: SUS data return 2016/17; SLR PRUH 2016/17
Calculating workforce and service on-costs for PRUH patients whose closest site by travel time is a K&M site (K&M catchment patients)
• K&M patients that accessed EDGH identified by assessing the catchment LSOAs (those closest by travel time to a K&M site) and assessing age and deprivation for average incidence
• The number of patients in 2016/17 that accessed the EDGH but live in the WHH and TWH catchment area was 5
• This is 2% of the PRUH activity living in the DVH catchment area
• 2% of the PRUH service cost of £1.56m totals £3k, this was taken as the proxy workforce and service on-costs for (EDGH) patients whose closest site by travel time is a K&M site (£2.4k (76%) taken as workforce costs)
Calculating workforce and service on-costs for Eastbourne District General Hospital (EDGH) patients whose closest site by travel time is a K&M site (K&M catchment patients)
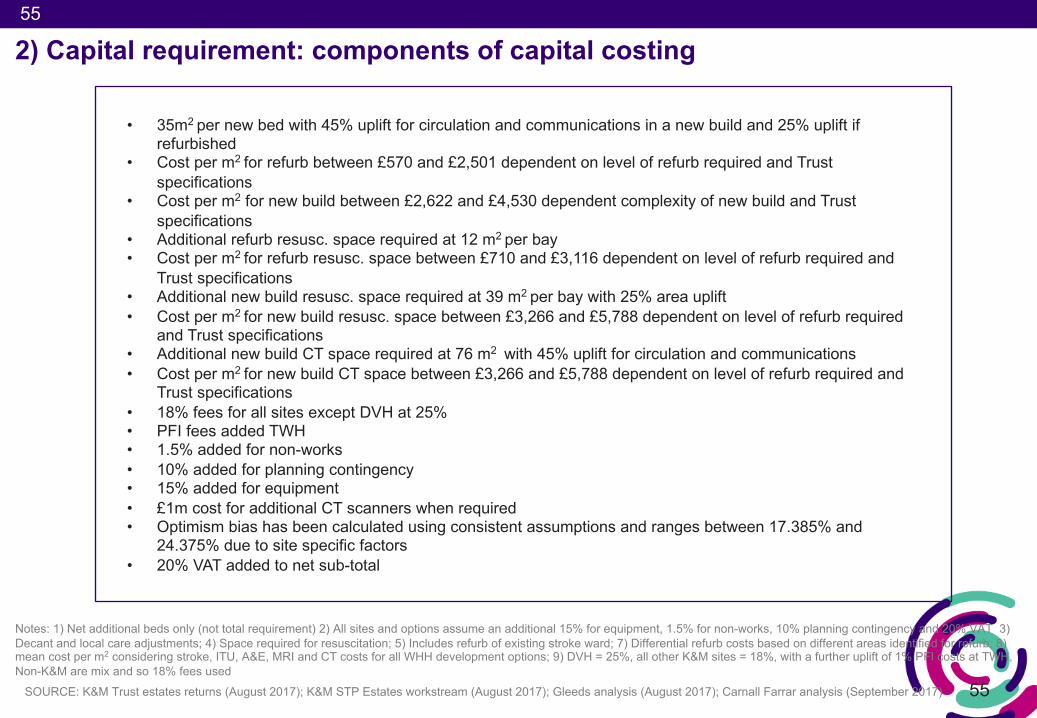
55
55
2) Capital requirement: components of capital costing
Notes: 1) Net additional beds only (not total requirement) 2) All sites and options assume an additional 15% for equipment, 1.5% for non-works, 10% planning contingency and 20% VAT 3) Decant and local care adjustments; 4) Space required for resuscitation; 5) Includes refurb of existing stroke ward; 7) Differential refurb costs based on different areas identified for refurb; 8) mean cost per m2 considering stroke, ITU, A&E, MRI and CT costs for all WHH development options; 9) DVH = 25%, all other K&M sites = 18%, with a further uplift of 1% PFI costs at TWH, Non-K&M are mix and so 18% fees used
SOURCE: K&M Trust estates returns (August 2017); K&M STP Estates workstream (August 2017); Gleeds analysis (August 2017); Carnall Farrar analysis (September 2017)
• 35m2 per new bed with 45% uplift for circulation and communications in a new build and 25% uplift if refurbished
• Cost per m2 for refurb between £570 and £2,501 dependent on level of refurb required and Trust specifications
• Cost per m2 for new build between £2,622 and £4,530 dependent complexity of new build and Trust specifications
• Additional refurb resusc. space required at 12 m2 per bay • Cost per m2 for refurb resusc. space between £710 and £3,116 dependent on level of refurb required and
Trust specifications• Additional new build resusc. space required at 39 m2 per bay with 25% area uplift• Cost per m2 for new build resusc. space between £3,266 and £5,788 dependent on level of refurb required
and Trust specifications• Additional new build CT space required at 76 m2 with 45% uplift for circulation and communications • Cost per m2 for new build CT space between £3,266 and £5,788 dependent on level of refurb required and
Trust specifications• 18% fees for all sites except DVH at 25%• PFI fees added TWH• 1.5% added for non-works• 10% added for planning contingency • 15% added for equipment• £1m cost for additional CT scanners when required • Optimism bias has been calculated using consistent assumptions and ranges between 17.385% and
24.375% due to site specific factors • 20% VAT added to net sub-total
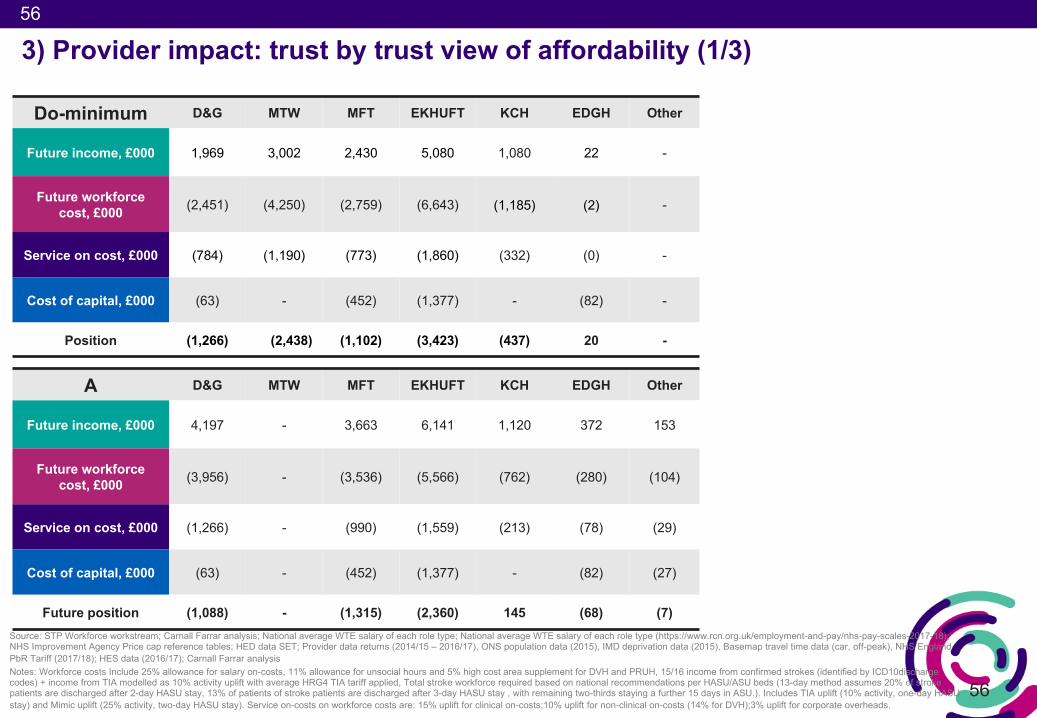
56
56
3) Provider impact: trust by trust view of affordability (1/3)
A D&G MTW MFT EKHUFT KCH EDGH Other
Future income, £000 4,197 - 3,663 6,141 1,120 372 153
Future workforce cost, £000 (3,956) - (3,536) (5,566) (762) (280) (104)
Service on cost, £000 (1,266) - (990) (1,559) (213) (78) (29)
Cost of capital, £000 (63) - (452) (1,377) - (82) (27)
Future position (1,088) - (1,315) (2,360) 145 (68) (7)Source: STP Workforce workstream; Carnall Farrar analysis; National average WTE salary of each role type; National average WTE salary of each role type (https://www.rcn.org.uk/employment-and-pay/nhs-pay-scales-2017-18); NHS Improvement Agency Price cap reference tables; HED data SET; Provider data returns (2014/15 – 2016/17), ONS population data (2015), IMD deprivation data (2015), Basemap travel time data (car, off-peak), NHS England PbR Tariff (2017/18); HES data (2016/17); Carnall Farrar analysisNotes: Workforce costs Include 25% allowance for salary on-costs, 11% allowance for unsocial hours and 5% high cost area supplement for DVH and PRUH, 15/16 income from confirmed strokes (identified by ICD10discharge codes) + income from TIA modelled as 10% activity uplift with average HRG4 TIA tariff applied, Total stroke workforce required based on national recommendations per HASU/ASU beds (13-day method assumes 20% of stroke patients are discharged after 2-day HASU stay, 13% of patients of stroke patients are discharged after 3-day HASU stay , with remaining two-thirds staying a further 15 days in ASU.). Includes TIA uplift (10% activity, one-day HASU stay) and Mimic uplift (25% activity, two-day HASU stay). Service on-costs on workforce costs are: 15% uplift for clinical on-costs;10% uplift for non-clinical on-costs (14% for DVH);3% uplift for corporate overheads.
Do-minimum D&G MTW MFT EKHUFT KCH EDGH Other
Future income, £000 1,969 3,002 2,430 5,080 1,080 22 -
Future workforce cost, £000 (2,451) (4,250) (2,759) (6,643) (1,185) (2) -
Service on cost, £000 (784) (1,190) (773) (1,860) (332) (0) -
Cost of capital, £000 (63) - (452) (1,377) - (82) -
Position (1,266) (2,438) (1,102) (3,423) (437) 20 -
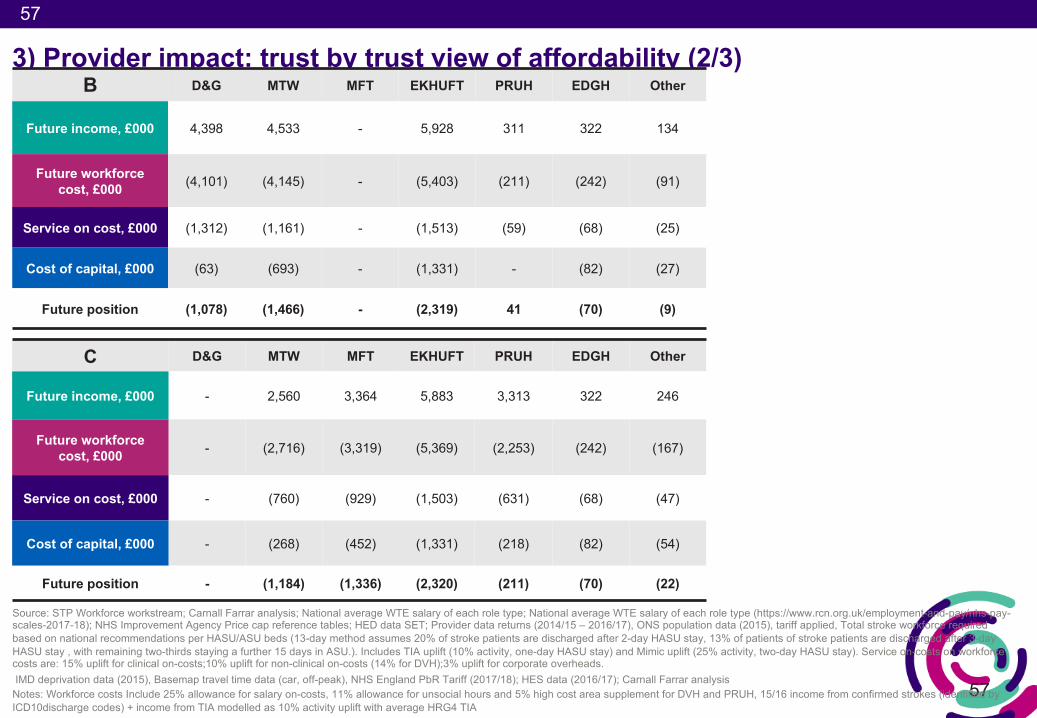
57
57
3) Provider impact: trust by trust view of affordability (2/3)
Source: STP Workforce workstream; Carnall Farrar analysis; National average WTE salary of each role type; National average WTE salary of each role type (https://www.rcn.org.uk/employment-and-pay/nhs-pay-scales-2017-18); NHS Improvement Agency Price cap reference tables; HED data SET; Provider data returns (2014/15 – 2016/17), ONS population data (2015), tariff applied, Total stroke workforce required based on national recommendations per HASU/ASU beds (13-day method assumes 20% of stroke patients are discharged after 2-day HASU stay, 13% of patients of stroke patients are discharged after 3-day HASU stay , with remaining two-thirds staying a further 15 days in ASU.). Includes TIA uplift (10% activity, one-day HASU stay) and Mimic uplift (25% activity, two-day HASU stay). Service on-costs on workforce costs are: 15% uplift for clinical on-costs;10% uplift for non-clinical on-costs (14% for DVH);3% uplift for corporate overheads. IMD deprivation data (2015), Basemap travel time data (car, off-peak), NHS England PbR Tariff (2017/18); HES data (2016/17); Carnall Farrar analysis
Notes: Workforce costs Include 25% allowance for salary on-costs, 11% allowance for unsocial hours and 5% high cost area supplement for DVH and PRUH, 15/16 income from confirmed strokes (identified by ICD10discharge codes) + income from TIA modelled as 10% activity uplift with average HRG4 TIA
C D&G MTW MFT EKHUFT PRUH EDGH Other
Future income, £000 - 2,560 3,364 5,883 3,313 322 246
Future workforce cost, £000 - (2,716) (3,319) (5,369) (2,253) (242) (167)
Service on cost, £000 - (760) (929) (1,503) (631) (68) (47)
Cost of capital, £000 - (268) (452) (1,331) (218) (82) (54)
Future position - (1,184) (1,336) (2,320) (211) (70) (22)
B D&G MTW MFT EKHUFT PRUH EDGH Other
Future income, £000 4,398 4,533 - 5,928 311 322 134
Future workforce cost, £000 (4,101) (4,145) - (5,403) (211) (242) (91)
Service on cost, £000 (1,312) (1,161) - (1,513) (59) (68) (25)
Cost of capital, £000 (63) (693) - (1,331) - (82) (27)
Future position (1,078) (1,466) - (2,319) 41 (70) (9)
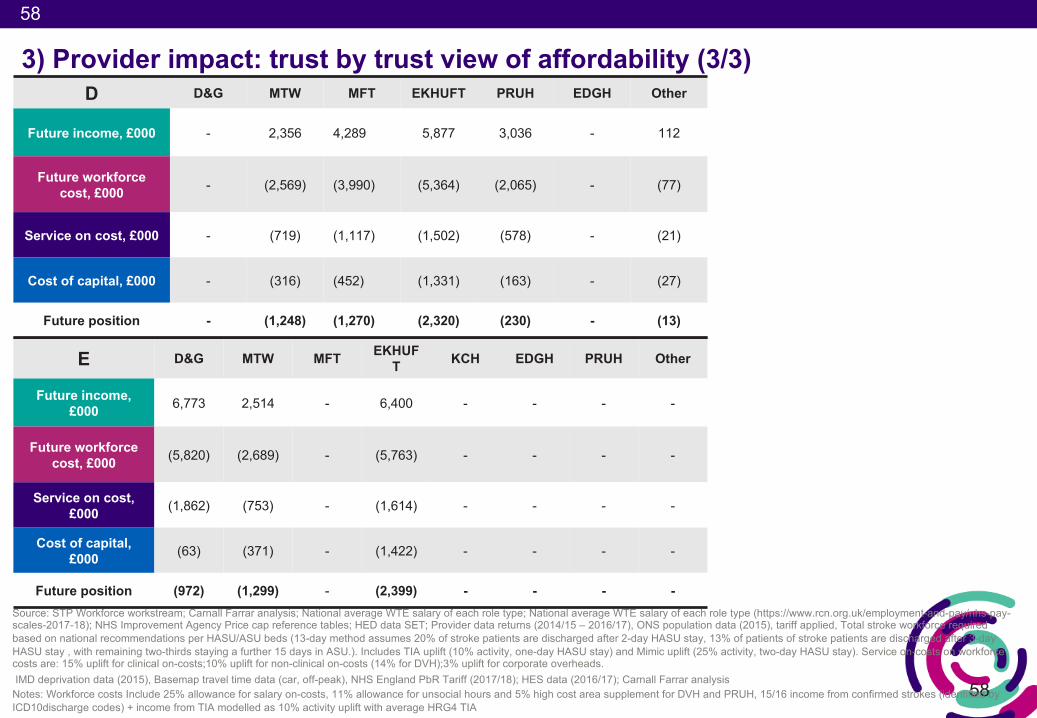
58
58
3) Provider impact: trust by trust view of affordability (3/3)
Source: STP Workforce workstream; Carnall Farrar analysis; National average WTE salary of each role type; National average WTE salary of each role type (https://www.rcn.org.uk/employment-and-pay/nhs-pay-scales-2017-18); NHS Improvement Agency Price cap reference tables; HED data SET; Provider data returns (2014/15 – 2016/17), ONS population data (2015), tariff applied, Total stroke workforce required based on national recommendations per HASU/ASU beds (13-day method assumes 20% of stroke patients are discharged after 2-day HASU stay, 13% of patients of stroke patients are discharged after 3-day HASU stay , with remaining two-thirds staying a further 15 days in ASU.). Includes TIA uplift (10% activity, one-day HASU stay) and Mimic uplift (25% activity, two-day HASU stay). Service on-costs on workforce costs are: 15% uplift for clinical on-costs;10% uplift for non-clinical on-costs (14% for DVH);3% uplift for corporate overheads. IMD deprivation data (2015), Basemap travel time data (car, off-peak), NHS England PbR Tariff (2017/18); HES data (2016/17); Carnall Farrar analysis
Notes: Workforce costs Include 25% allowance for salary on-costs, 11% allowance for unsocial hours and 5% high cost area supplement for DVH and PRUH, 15/16 income from confirmed strokes (identified by ICD10discharge codes) + income from TIA modelled as 10% activity uplift with average HRG4 TIA
E D&G MTW MFT EKHUFT KCH EDGH PRUH Other
Future income, £000 6,773 2,514 - 6,400 - - - -
Future workforce cost, £000 (5,820) (2,689) - (5,763) - - - -
Service on cost, £000 (1,862) (753) - (1,614) - - - -
Cost of capital,£000 (63) (371) - (1,422) - - - -
Future position (972) (1,299) - (2,399) - - - -
D D&G MTW MFT EKHUFT PRUH EDGH Other
Future income, £000 - 2,356 4,289 5,877 3,036 - 112
Future workforce cost, £000 - (2,569) (3,990) (5,364) (2,065) - (77)
Service on cost, £000 - (719) (1,117) (1,502) (578) - (21)
Cost of capital, £000 - (316) (452) (1,331) (163) - (27)
Future position - (1,248) (1,270) (2,320) (230) - (13)
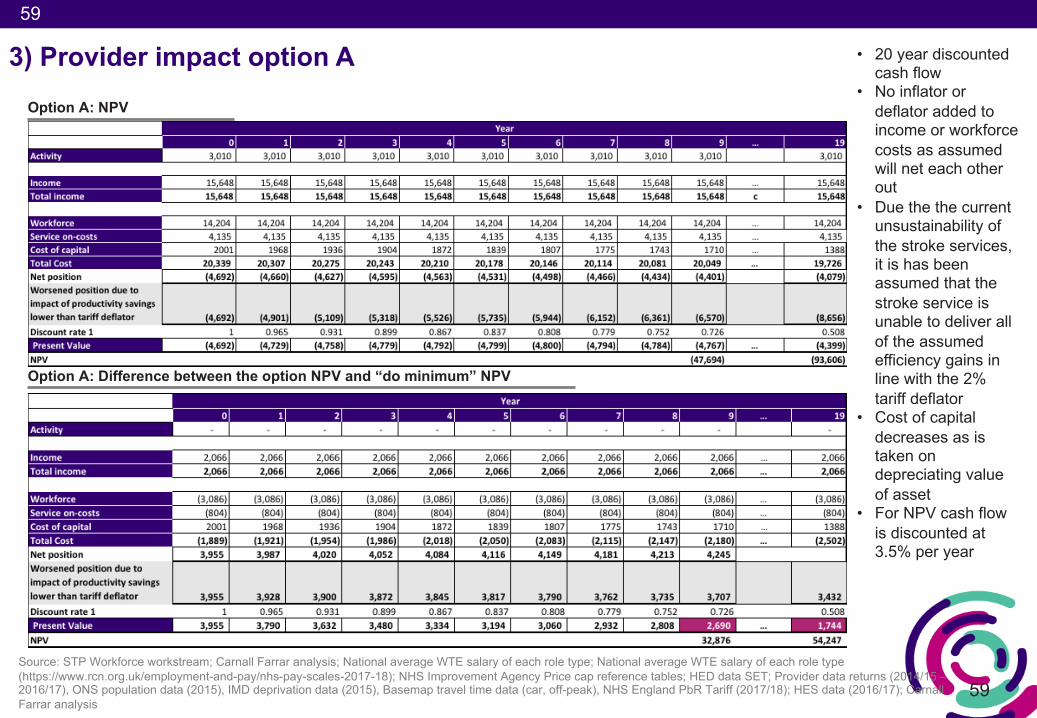
59
59
3) Provider impact option AOption A: NPV
Option A: Difference between the option NPV and “do minimum” NPV
Source: STP Workforce workstream; Carnall Farrar analysis; National average WTE salary of each role type; National average WTE salary of each role type (https://www.rcn.org.uk/employment-and-pay/nhs-pay-scales-2017-18); NHS Improvement Agency Price cap reference tables; HED data SET; Provider data returns (2014/15 –2016/17), ONS population data (2015), IMD deprivation data (2015), Basemap travel time data (car, off-peak), NHS England PbR Tariff (2017/18); HES data (2016/17); Carnall Farrar analysis
• 20 year discounted cash flow
• No inflator or deflator added to income or workforce costs as assumed will net each other out
• Due the the current unsustainability of the stroke services, it is has been assumed that the stroke service is unable to deliver all of the assumed efficiency gains in line with the 2% tariff deflator
• Cost of capital decreases as is taken on depreciating value of asset
• For NPV cash flow is discounted at 3.5% per year
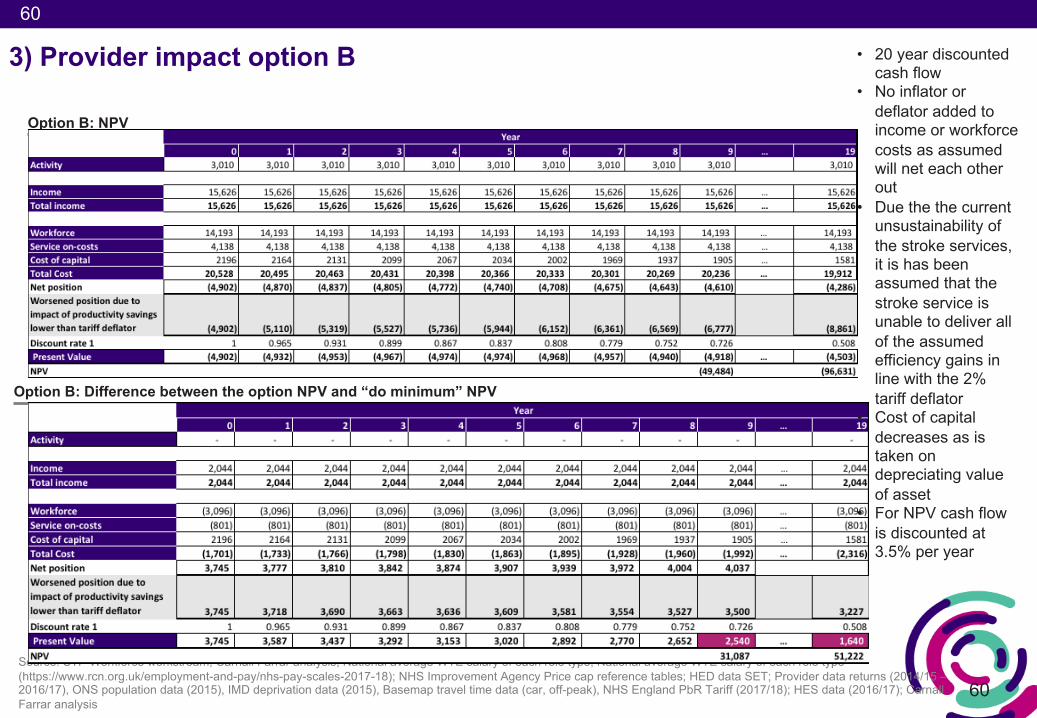
60
60
Option B: NPV
Option B: Difference between the option NPV and “do minimum” NPV
Source: STP Workforce workstream; Carnall Farrar analysis; National average WTE salary of each role type; National average WTE salary of each role type (https://www.rcn.org.uk/employment-and-pay/nhs-pay-scales-2017-18); NHS Improvement Agency Price cap reference tables; HED data SET; Provider data returns (2014/15 –2016/17), ONS population data (2015), IMD deprivation data (2015), Basemap travel time data (car, off-peak), NHS England PbR Tariff (2017/18); HES data (2016/17); Carnall Farrar analysis
3) Provider impact option B • 20 year discounted cash flow
• No inflator or deflator added to income or workforce costs as assumed will net each other out
• Due the the current unsustainability of the stroke services, it is has been assumed that the stroke service is unable to deliver all of the assumed efficiency gains in line with the 2% tariff deflator
• Cost of capital decreases as is taken on depreciating value of asset
• For NPV cash flow is discounted at 3.5% per year
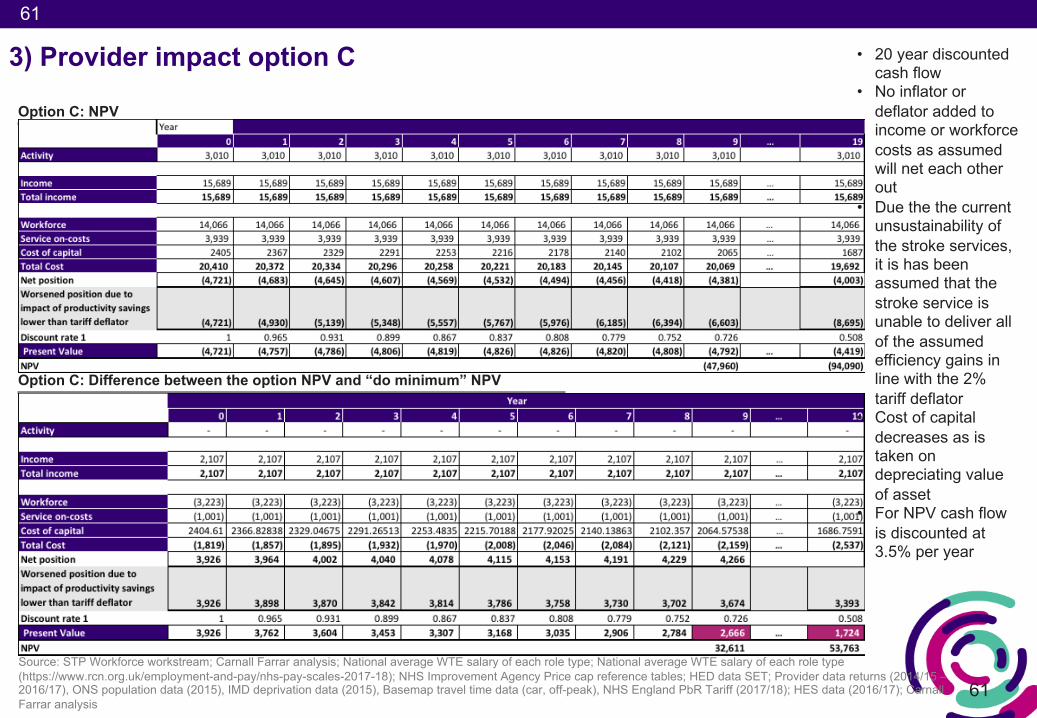
61
61
Option C: NPV
Option C: Difference between the option NPV and “do minimum” NPV
Source: STP Workforce workstream; Carnall Farrar analysis; National average WTE salary of each role type; National average WTE salary of each role type (https://www.rcn.org.uk/employment-and-pay/nhs-pay-scales-2017-18); NHS Improvement Agency Price cap reference tables; HED data SET; Provider data returns (2014/15 –2016/17), ONS population data (2015), IMD deprivation data (2015), Basemap travel time data (car, off-peak), NHS England PbR Tariff (2017/18); HES data (2016/17); Carnall Farrar analysis
3) Provider impact option C • 20 year discounted cash flow
• No inflator or deflator added to income or workforce costs as assumed will net each other out
• Due the the current unsustainability of the stroke services, it is has been assumed that the stroke service is unable to deliver all of the assumed efficiency gains in line with the 2% tariff deflator
• Cost of capital decreases as is taken on depreciating value of asset
• For NPV cash flow is discounted at 3.5% per year
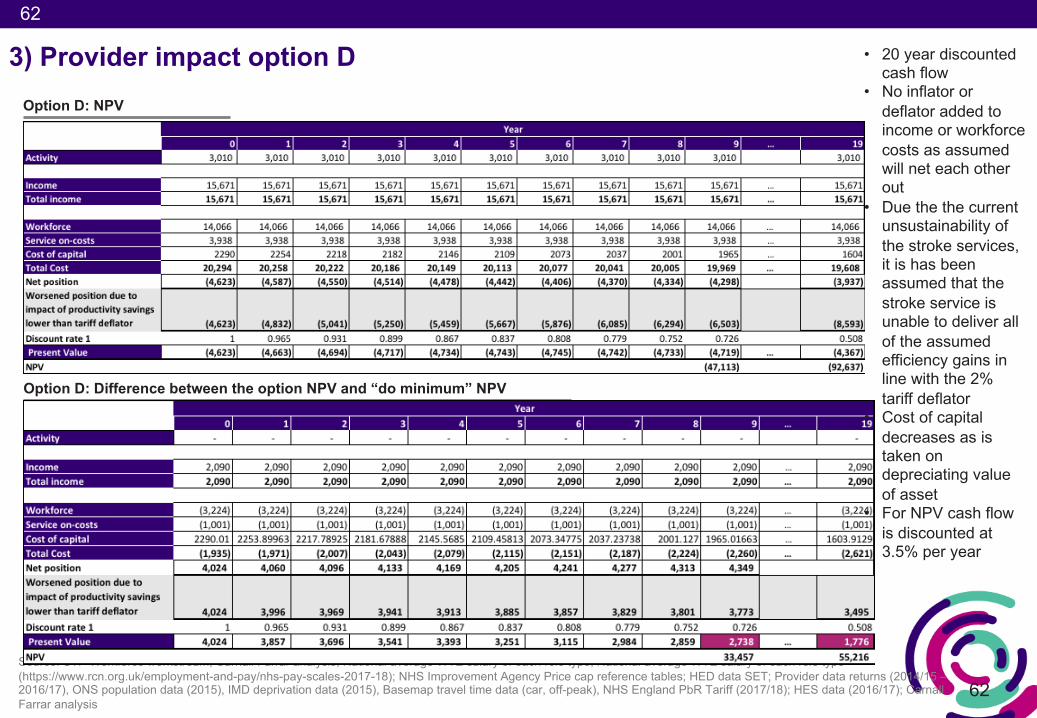
62
62
Option D: NPV
Option D: Difference between the option NPV and “do minimum” NPV
Source: STP Workforce workstream; Carnall Farrar analysis; National average WTE salary of each role type; National average WTE salary of each role type (https://www.rcn.org.uk/employment-and-pay/nhs-pay-scales-2017-18); NHS Improvement Agency Price cap reference tables; HED data SET; Provider data returns (2014/15 –2016/17), ONS population data (2015), IMD deprivation data (2015), Basemap travel time data (car, off-peak), NHS England PbR Tariff (2017/18); HES data (2016/17); Carnall Farrar analysis
3) Provider impact option D • 20 year discounted cash flow
• No inflator or deflator added to income or workforce costs as assumed will net each other out
• Due the the current unsustainability of the stroke services, it is has been assumed that the stroke service is unable to deliver all of the assumed efficiency gains in line with the 2% tariff deflator
• Cost of capital decreases as is taken on depreciating value of asset
• For NPV cash flow is discounted at 3.5% per year
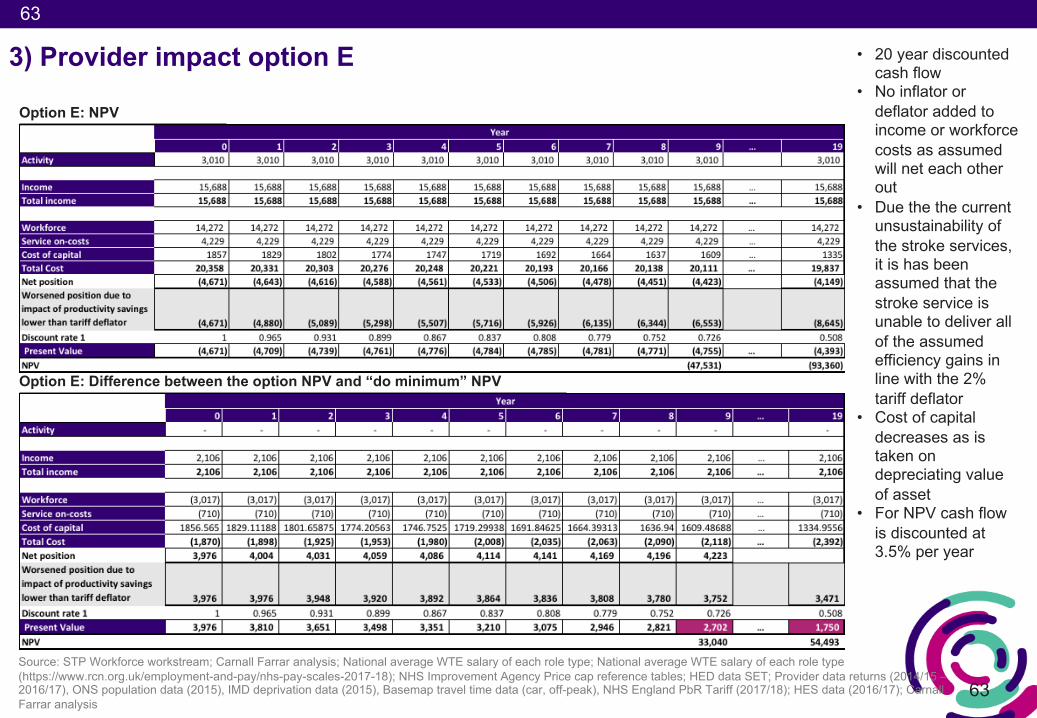
63
63
Option E: NPV
Option E: Difference between the option NPV and “do minimum” NPV
Source: STP Workforce workstream; Carnall Farrar analysis; National average WTE salary of each role type; National average WTE salary of each role type (https://www.rcn.org.uk/employment-and-pay/nhs-pay-scales-2017-18); NHS Improvement Agency Price cap reference tables; HED data SET; Provider data returns (2014/15 –2016/17), ONS population data (2015), IMD deprivation data (2015), Basemap travel time data (car, off-peak), NHS England PbR Tariff (2017/18); HES data (2016/17); Carnall Farrar analysis
3) Provider impact option E • 20 year discounted cash flow
• No inflator or deflator added to income or workforce costs as assumed will net each other out
• Due the the current unsustainability of the stroke services, it is has been assumed that the stroke service is unable to deliver all of the assumed efficiency gains in line with the 2% tariff deflator
• Cost of capital decreases as is taken on depreciating value of asset
• For NPV cash flow is discounted at 3.5% per year
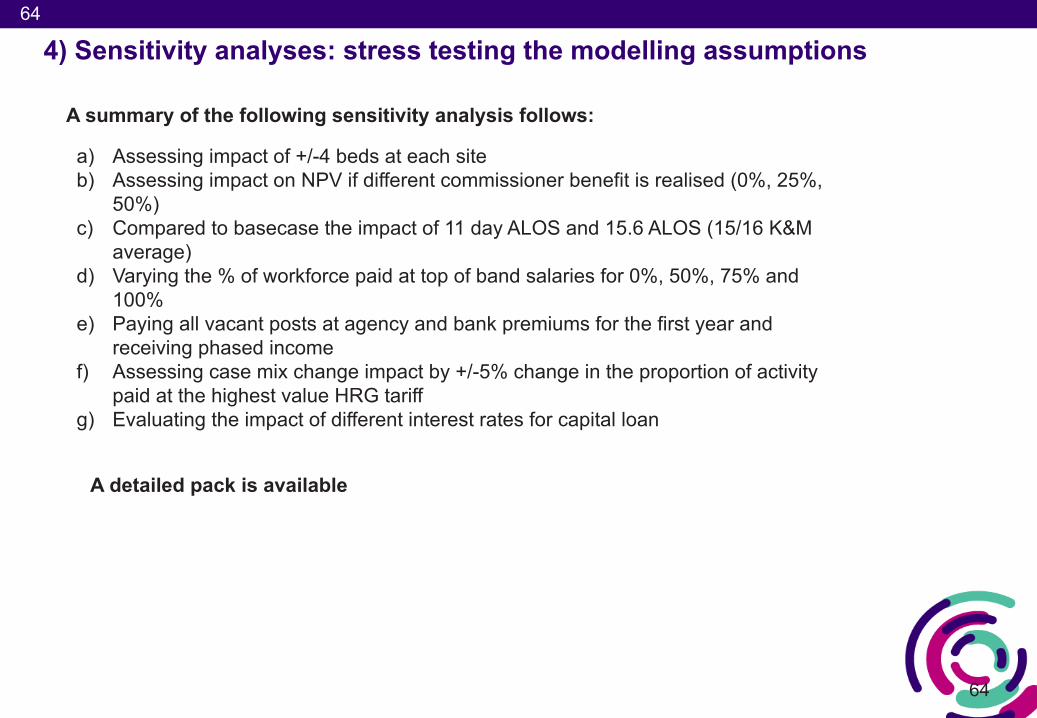
64
64
4) Sensitivity analyses: stress testing the modelling assumptions
a) Assessing impact of +/-4 beds at each site b) Assessing impact on NPV if different commissioner benefit is realised (0%, 25%,
50%)c) Compared to basecase the impact of 11 day ALOS and 15.6 ALOS (15/16 K&M
average)d) Varying the % of workforce paid at top of band salaries for 0%, 50%, 75% and
100%e) Paying all vacant posts at agency and bank premiums for the first year and
receiving phased incomef) Assessing case mix change impact by +/-5% change in the proportion of activity
paid at the highest value HRG tariff g) Evaluating the impact of different interest rates for capital loan
A summary of the following sensitivity analysis follows:
A detailed pack is available
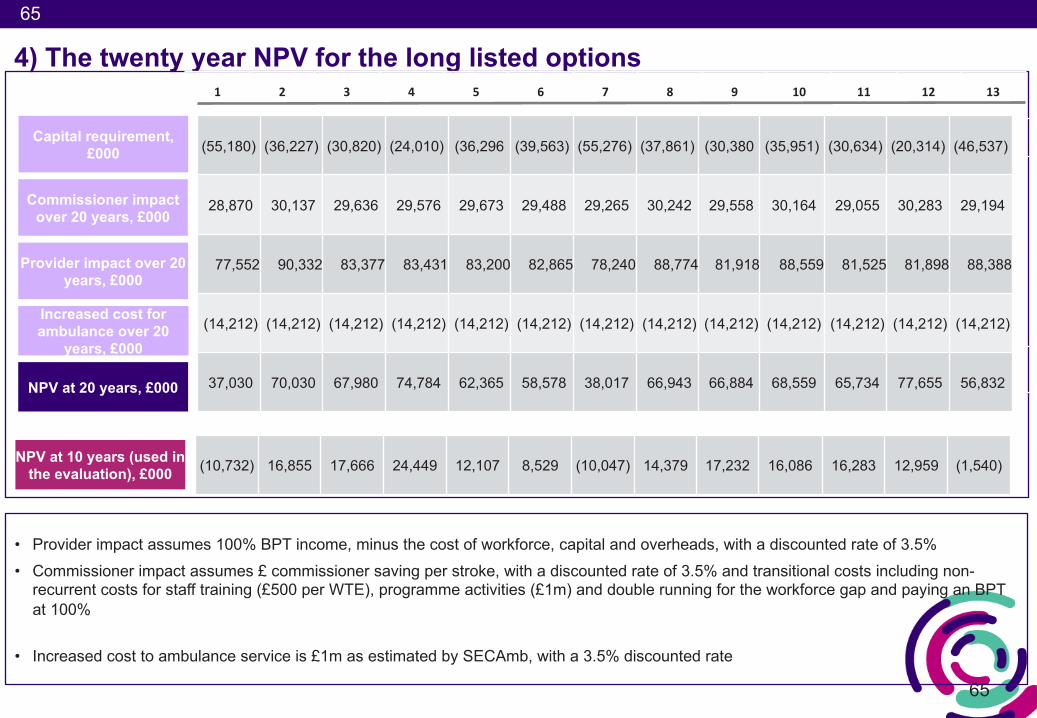
65
65
4) The twenty year NPV for the long listed options
• Provider impact assumes 100% BPT income, minus the cost of workforce, capital and overheads, with a discounted rate of 3.5%• Commissioner impact assumes £ commissioner saving per stroke, with a discounted rate of 3.5% and transitional costs including non-
recurrent costs for staff training (£500 per WTE), programme activities (£1m) and double running for the workforce gap and paying an BPT at 100%
• Increased cost to ambulance service is £1m as estimated by SECAmb, with a 3.5% discounted rate
1 2 3 4 5 6 7 8 9 10 11 12 13
Provider impact over 20 years, £000
NPV at 20 years, £000
Commissioner impact over 20 years, £000
Increased cost for ambulance over 20
years, £000
Capital requirement, £000 (55,180) (36,227) (30,820) (24,010) (36,296 (39,563) (55,276) (37,861) (30,380 (35,951) (30,634) (20,314) (46,537)
28,870 30,137 29,636 29,576 29,673 29,488 29,265 30,242 29,558 30,164 29,055 30,283 29,194
77,552 90,332 83,377 83,431 83,200 82,865 78,240 88,774 81,918 88,559 81,525 81,898 88,388
(14,212) (14,212) (14,212) (14,212) (14,212) (14,212) (14,212) (14,212) (14,212) (14,212) (14,212) (14,212) (14,212)
37,030 70,030 67,980 74,784 62,365 58,578 38,017 66,943 66,884 68,559 65,734 77,655 56,832
NPV at 10 years (used in the evaluation), £000 (10,732) 16,855 17,666 24,449 12,107 8,529 (10,047) 14,379 17,232 16,086 16,283 12,959 (1,540)
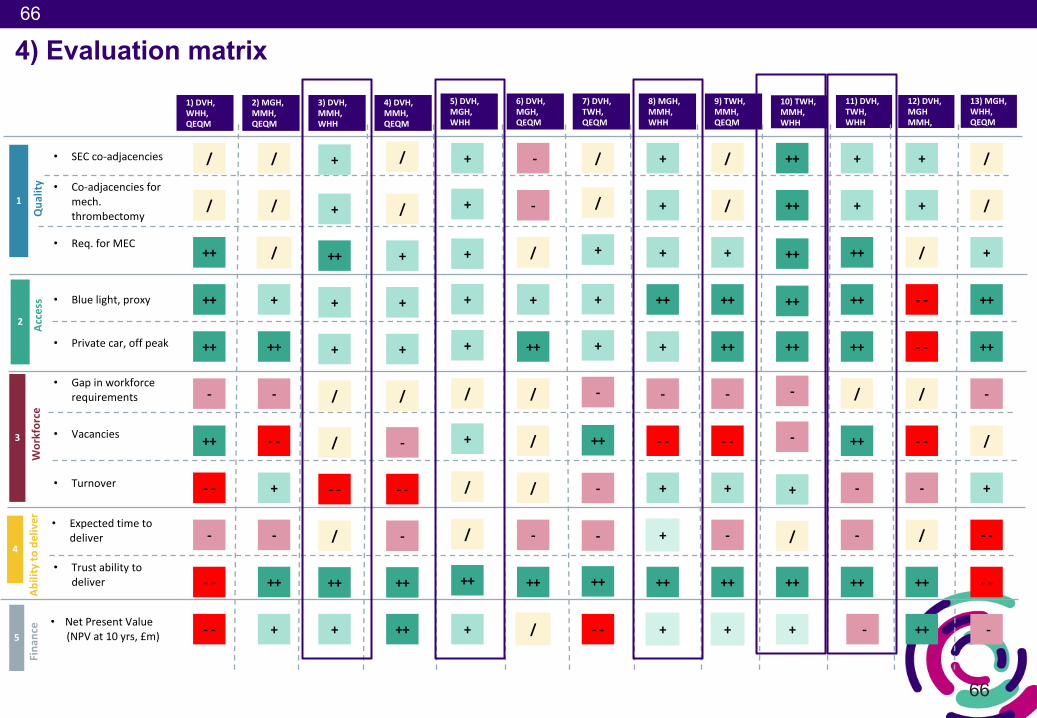
66
66
4) Evaluation matrix1)DVH,WHH,QEQM
2)MGH,MMH,QEQM
3)DVH,MMH,WHH
4)DVH,MMH,QEQM
5)DVH,MGH,WHH
6)DVH,MGH,QEQM
7)DVH,TWH,QEQM
8)MGH,MMH,WHH
9)TWH,MMH,QEQM
10)TWH,MMH,WHH
11)DVH,TWH,WHH
12)DVH,MGHMMH,
13)MGH,WHH,QEQM
1
2
3
4
5
Qua
lity
Access
Workforce
Fina
nce
Abilityto
deliver
• SECco-adjacencies
• Co-adjacenciesformech.thrombectomy
• Req.forMEC
• Bluelight,proxy
• Privatecar,offpeak
• Gapinworkforcerequirements
• Vacancies
• Turnover
• Expectedtimetodeliver
• Trustabilitytodeliver
/
++
++
++
-
++
- -
- -
- -
-
/
/
/
+
++
-
- -
+
++
+
-
/
+
++
/
/
- -
++
+
+
+
/
+
/
+
+
+
/
-
- -
++
++
-
/
+
+
+
+
/
+
/
++
+
/
+
-
/
+
++
/
/
/
++
/
-
-
/
+
+
+
-
++
-
++
- -
-
/
+
+
++
+
-
- -
+
++
+
+
+
/
+
++
++
-
- -
+
++
+
-
/
++
++
++
++
-
-
+
++
+
/
++
+
++
++
++
++
-
++
-
-
+
+
/
- -
- -
++
/
-
- -
++
/
+
/
+
++
++
- -
-
/
+
- -
/
• NetPresentValue(NPVat10yrs,£m) -
/


![Case Study of Stroke[1]](https://img.pdfslide.us/doc/110x75/5512d1a14a7959c4028b4ac1/case-study-of-stroke1.jpg)