Embed Size (px)
Citation preview
1
Building America
Affordable Window Retrofit Solutions
Panelists: Katherine Cort – Pacific Northwest National Laboratory Thomas Culp – Birch Point Consulting Sarah Widder – Pacific Northwest National Laboratory
2015 ACI National Conference Envelope Track May 5, 2015 PNNL-SA-109988

2
Today’s Speakers
• Katherine Cort is an economist with PNNL and team lead of Building America’s Window Retrofit Solutions program. She has over 15 years of experience analyzing energy-efficiency programs, technologies, and research and provides technical support for the Department of Energy's (DOE) Building Technologies Program.
• Thomas Culp is the owner of Birch Point Consulting, LLC which provides engineering and strategic consulting services in the areas of energy efficient window performance, building code development, glass performance, and glass coatings.
• Sarah Widder is an engineer with PNNL. Her work focuses on sustainable design, energy efficiency, and green house gas management. Ms. Widder is currently involved in using whole building performance metrics to analyze the impact and effectiveness of current sustainable design trends.
3
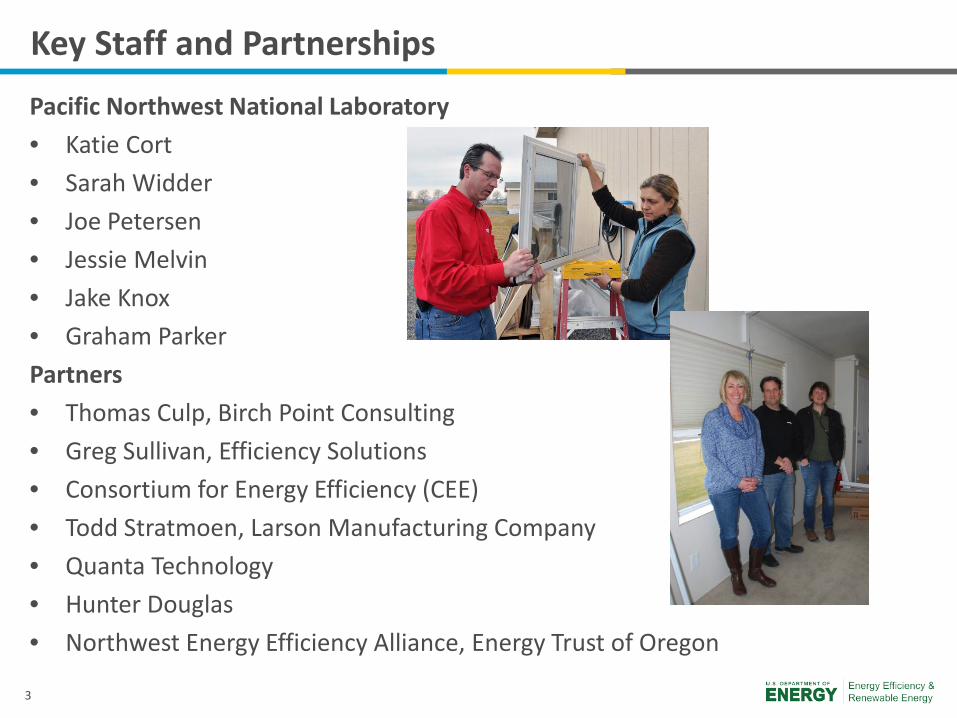
Key Staff and Partnerships
Pacific Northwest National Laboratory • Katie Cort • Sarah Widder • Joe Petersen • Jessie Melvin • Jake Knox • Graham Parker Partners • Thomas Culp, Birch Point Consulting • Greg Sullivan, Efficiency Solutions • Consortium for Energy Efficiency (CEE) • Todd Stratmoen, Larson Manufacturing Company • Quanta Technology • Hunter Douglas • Northwest Energy Efficiency Alliance, Energy Trust of Oregon
5
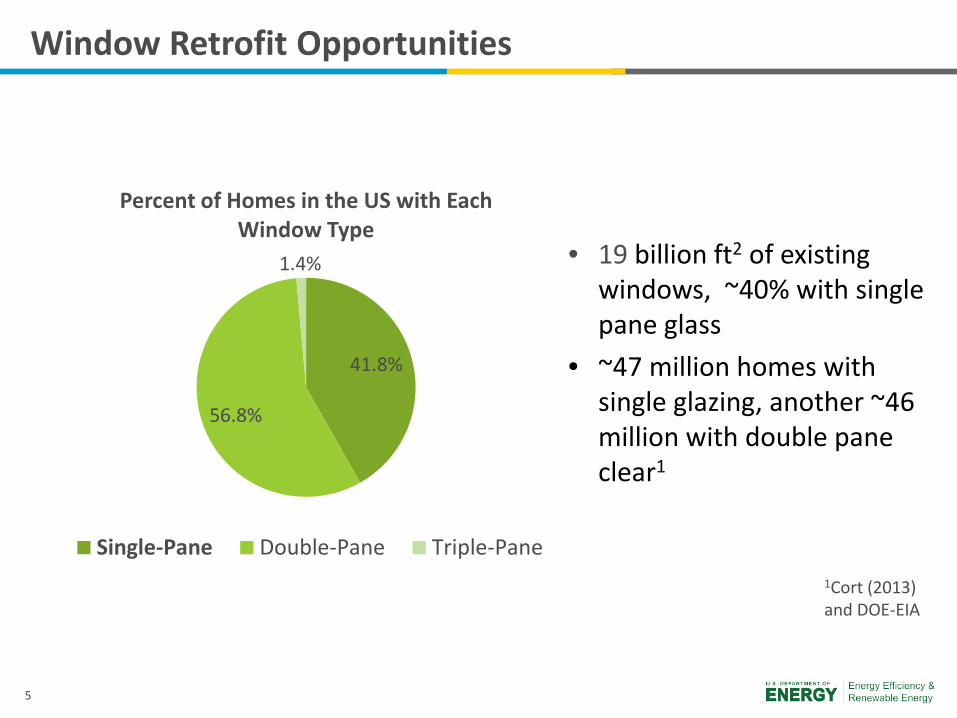
Window Retrofit Opportunities
• 19 billion ft2 of existing windows, ~40% with single pane glass
• ~47 million homes with single glazing, another ~46 million with double pane clear1
1Cort (2013) and DOE-EIA
41.8%
56.8%
1.4%
Percent of Homes in the US with Each Window Type
Single-Pane Double-Pane Triple-Pane
6
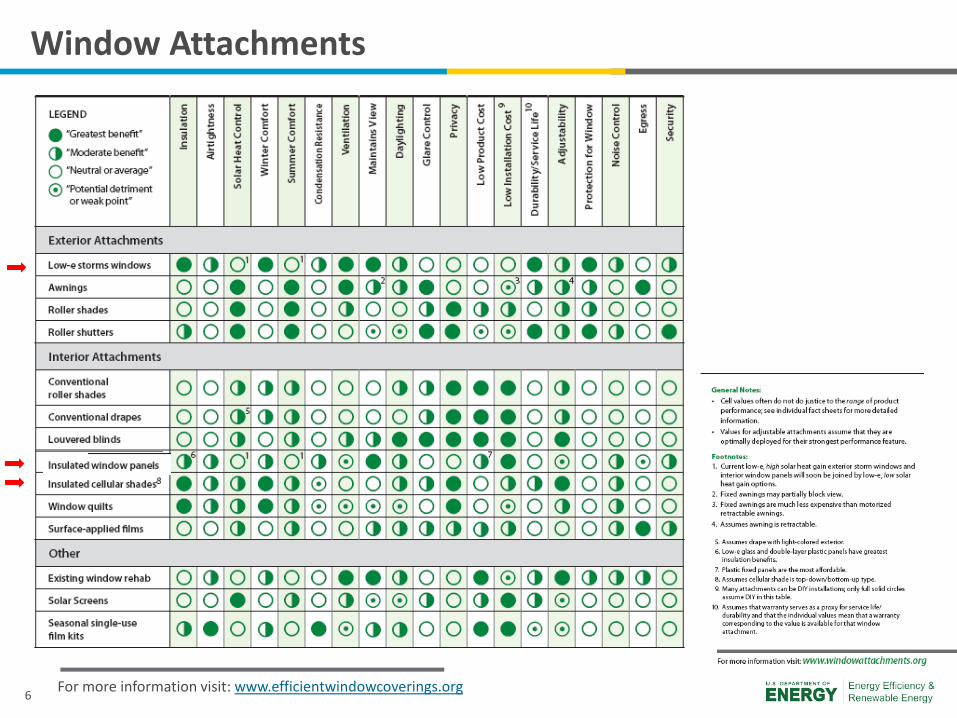
Window Attachments
For more information visit: www.efficientwindowcoverings.org
7
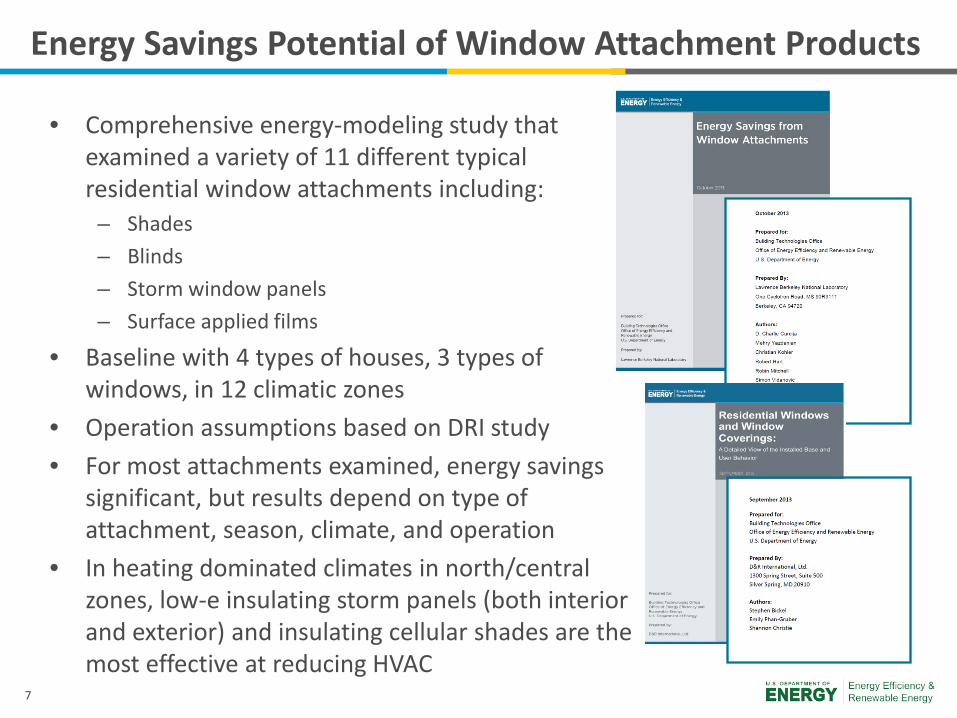
Energy Savings Potential of Window Attachment Products
• Comprehensive energy-modeling study that examined a variety of 11 different typical residential window attachments including: – Shades – Blinds – Storm window panels – Surface applied films
• Baseline with 4 types of houses, 3 types of windows, in 12 climatic zones
• Operation assumptions based on DRI study • For most attachments examined, energy savings
significant, but results depend on type of attachment, season, climate, and operation
• In heating dominated climates in north/central zones, low-e insulating storm panels (both interior and exterior) and insulating cellular shades are the most effective at reducing HVAC
8
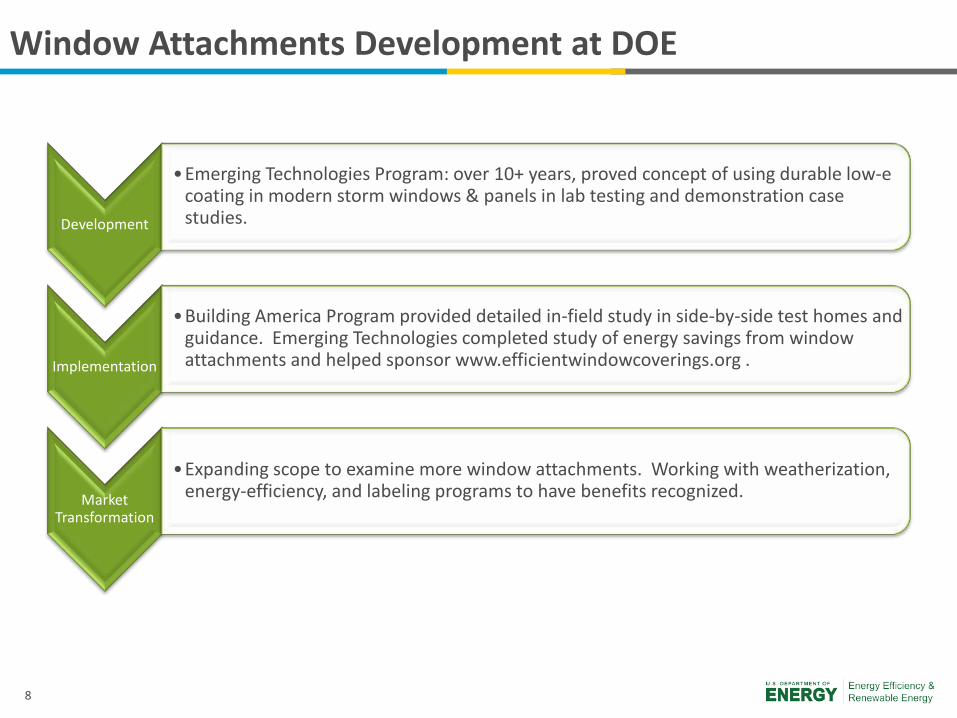
Window Attachments Development at DOE
Development
•Emerging Technologies Program: over 10+ years, proved concept of using durable low-e coating in modern storm windows & panels in lab testing and demonstration case studies.
Implementation
•Building America Program provided detailed in-field study in side-by-side test homes and guidance. Emerging Technologies completed study of energy savings from window attachments and helped sponsor www.efficientwindowcoverings.org .
Market Transformation
•Expanding scope to examine more window attachments. Working with weatherization, energy-efficiency, and labeling programs to have benefits recognized.
9
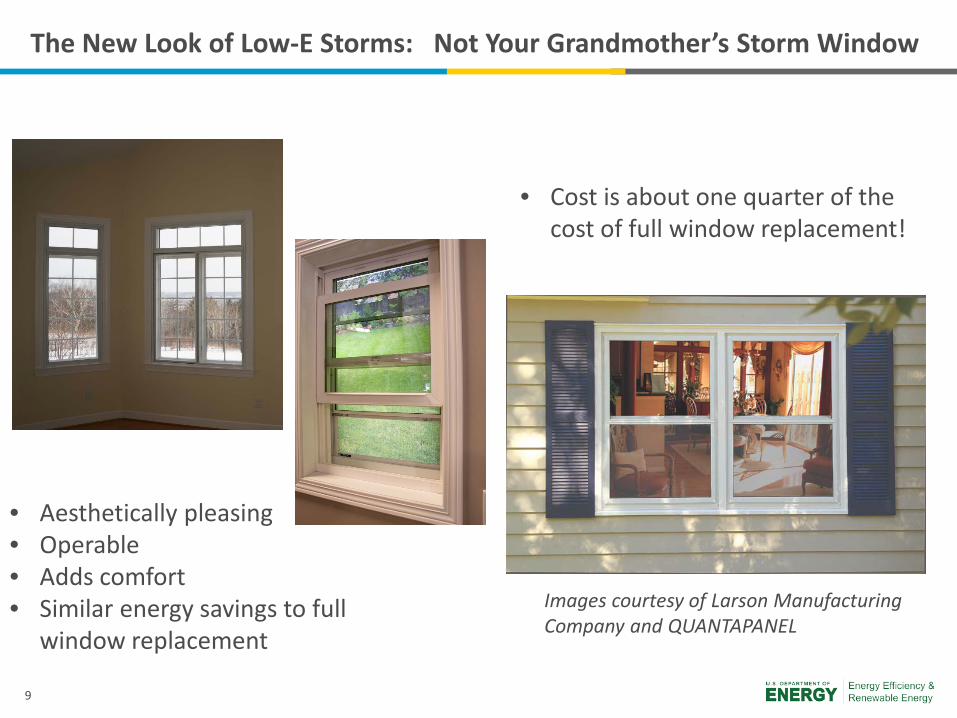
The New Look of Low-E Storms: Not Your Grandmother’s Storm Window
• Aesthetically pleasing • Operable • Adds comfort • Similar energy savings to full
window replacement
• Cost is about one quarter of the cost of full window replacement!
Images courtesy of Larson Manufacturing Company and QUANTAPANEL
10
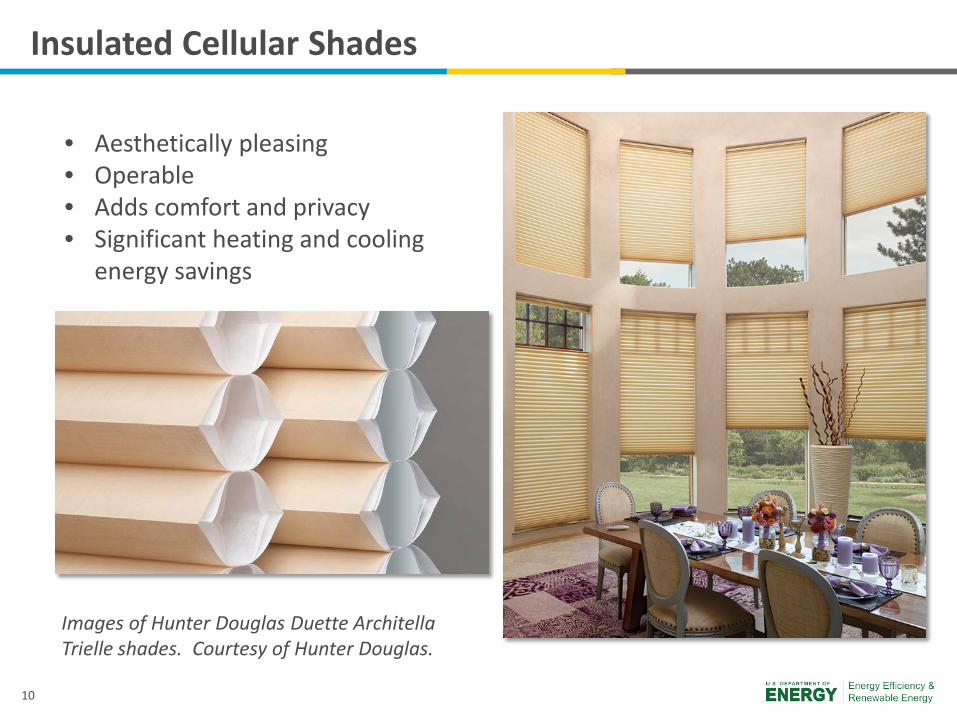
Insulated Cellular Shades
Images of Hunter Douglas Duette Architella Trielle shades. Courtesy of Hunter Douglas.
• Aesthetically pleasing • Operable • Adds comfort and privacy • Significant heating and cooling
energy savings
11
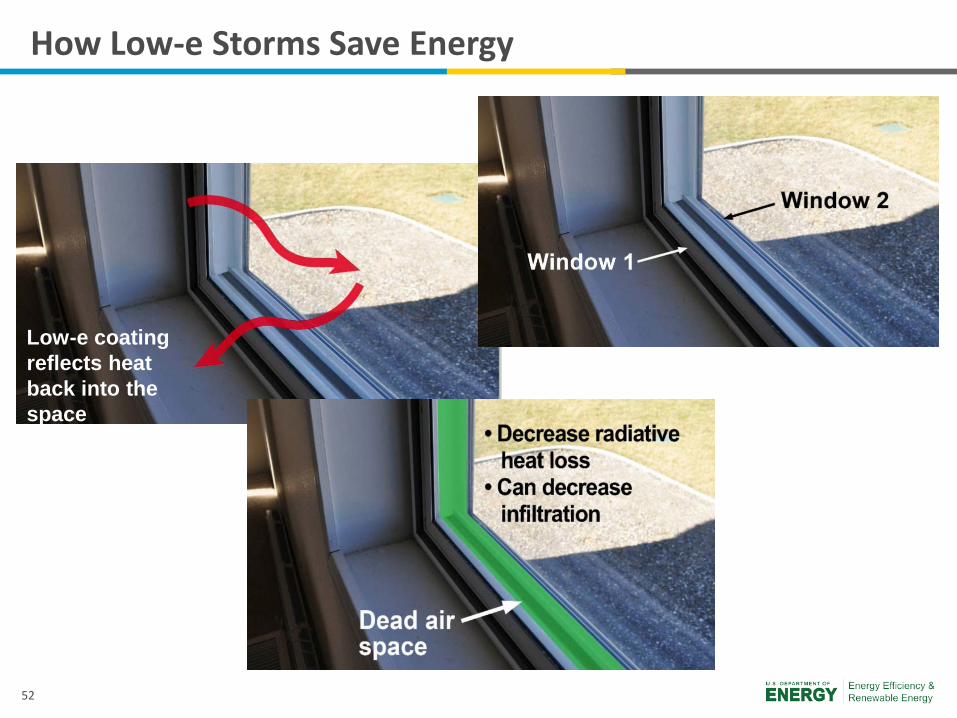
Low-E Storm Windows: Concept
In late 90’s, LBNL suggested that low-e storm windows could be a cost effective insulating and sealing measure for existing windows:
• Air Sealing of Prime Window – Case studies show 10% reduction in overall home air leakage
• Creation of “Dead Air Space” – Reduce Conduction and Convective losses across prime window
• Reflection of Radiant Heat: Low-E Glass – 35% increased performance over clear glass
12
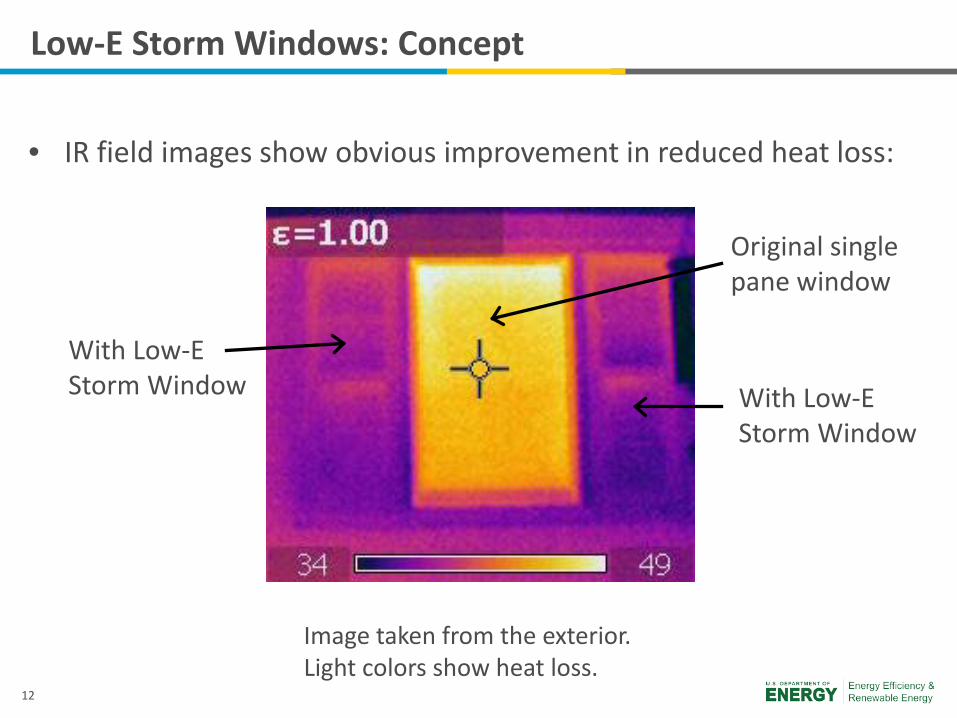
Low-E Storm Windows: Concept
• IR field images show obvious improvement in reduced heat loss:
With Low-E Storm Window
With Low-E Storm Window
Original single pane window
Image taken from the exterior. Light colors show heat loss.
13
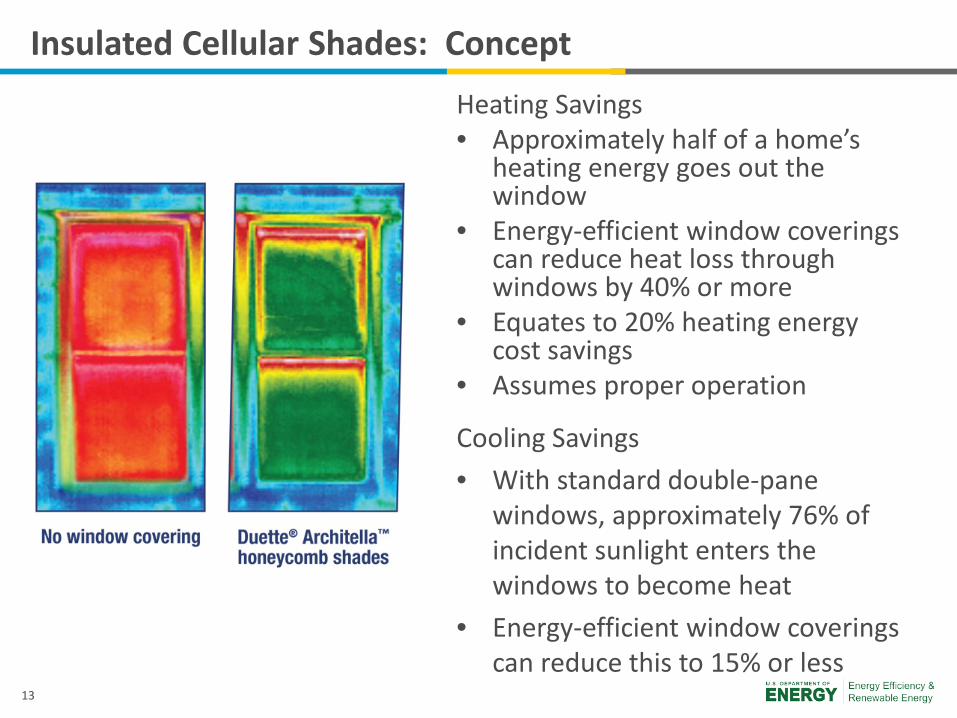
Insulated Cellular Shades: Concept Heating Savings • Approximately half of a home’s
heating energy goes out the window
• Energy-efficient window coverings can reduce heat loss through windows by 40% or more
• Equates to 20% heating energy cost savings
• Assumes proper operation
Cooling Savings • With standard double-pane
windows, approximately 76% of incident sunlight enters the windows to become heat
• Energy-efficient window coverings can reduce this to 15% or less
14
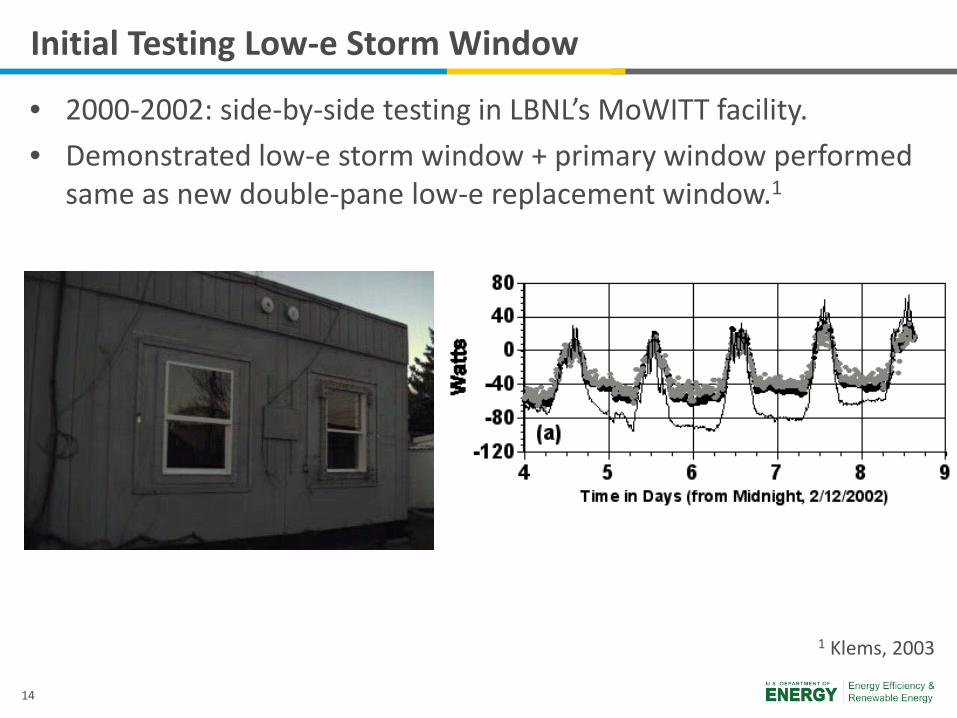
Initial Testing Low-e Storm Window
• 2000-2002: side-by-side testing in LBNL’s MoWITT facility. • Demonstrated low-e storm window + primary window performed
same as new double-pane low-e replacement window.1
1 Klems, 2003
15
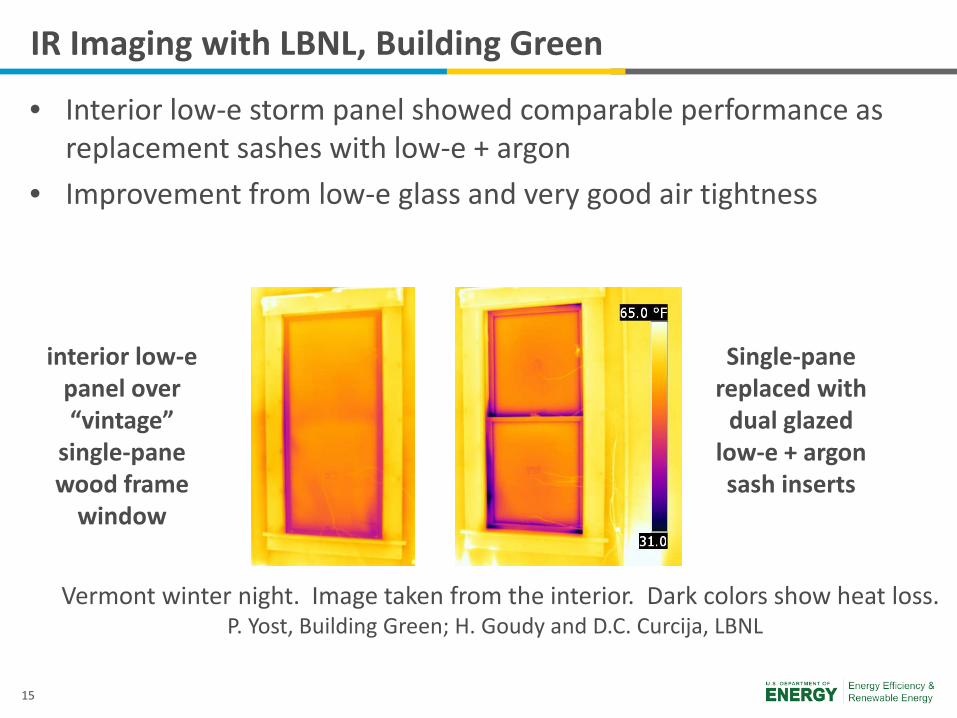
IR Imaging with LBNL, Building Green
• Interior low-e storm panel showed comparable performance as replacement sashes with low-e + argon
• Improvement from low-e glass and very good air tightness
interior low-e panel over “vintage”
single-pane wood frame
window
Single-pane replaced with
dual glazed low-e + argon sash inserts
Vermont winter night. Image taken from the interior. Dark colors show heat loss. P. Yost, Building Green; H. Goudy and D.C. Curcija, LBNL
16
Demonstration Case Studies
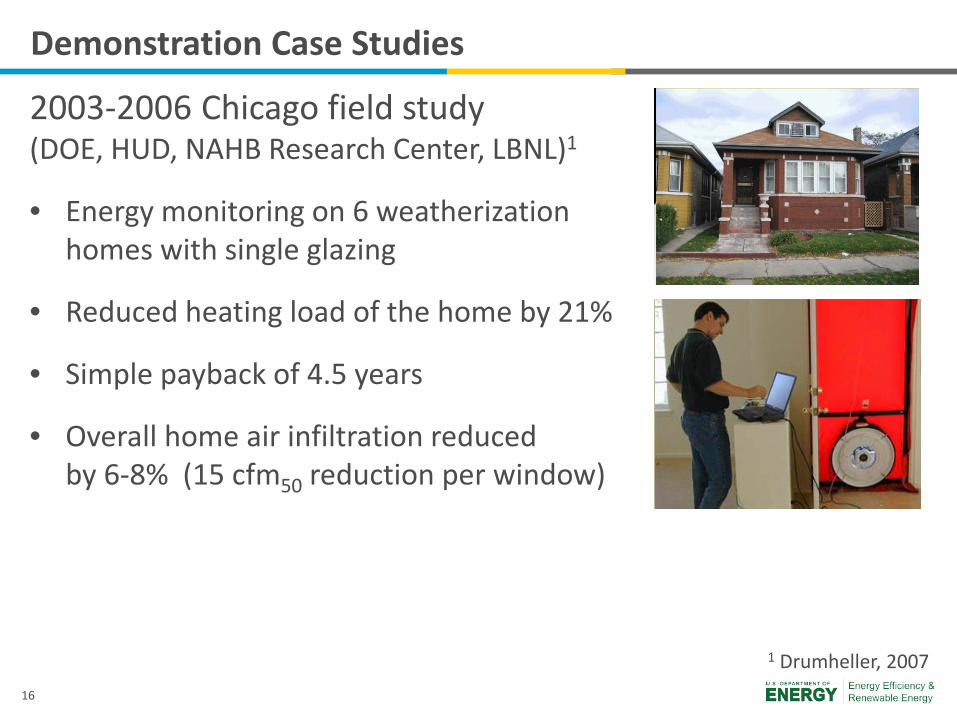
2003-2006 Chicago field study (DOE, HUD, NAHB Research Center, LBNL)1
• Energy monitoring on 6 weatherization homes with single glazing
• Reduced heating load of the home by 21%
• Simple payback of 4.5 years
• Overall home air infiltration reduced by 6-8% (15 cfm50 reduction per window)
1 Drumheller, 2007
17
Demonstration Case Studies
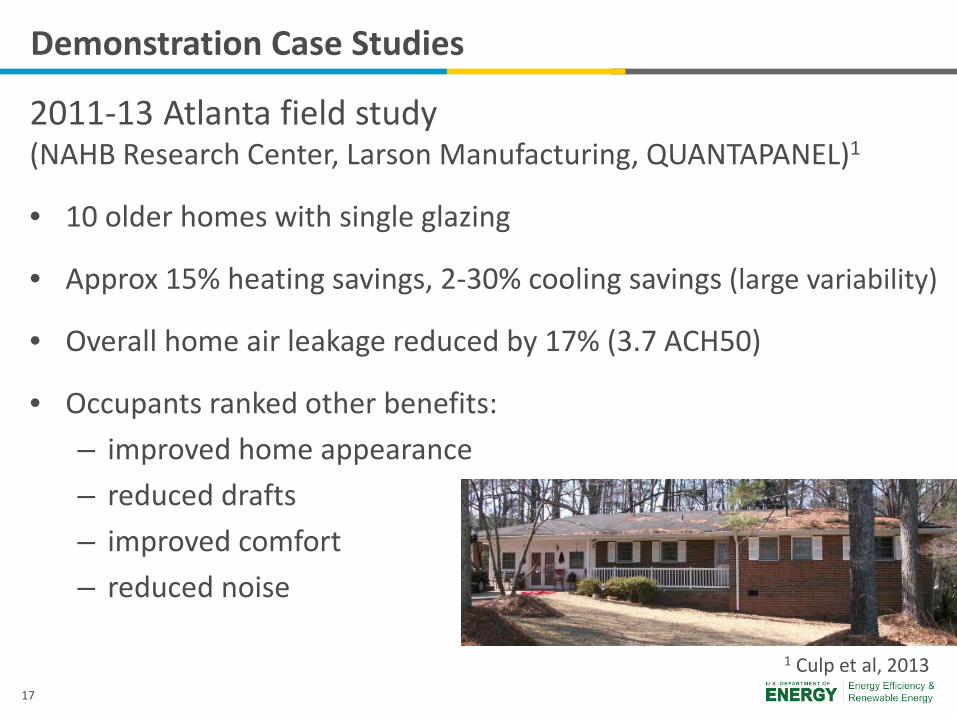
2011-13 Atlanta field study (NAHB Research Center, Larson Manufacturing, QUANTAPANEL)1
• 10 older homes with single glazing
• Approx 15% heating savings, 2-30% cooling savings (large variability)
• Overall home air leakage reduced by 17% (3.7 ACH50)
• Occupants ranked other benefits: – improved home appearance – reduced drafts – improved comfort – reduced noise
1 Culp et al, 2013
18
Demonstration Case Studies
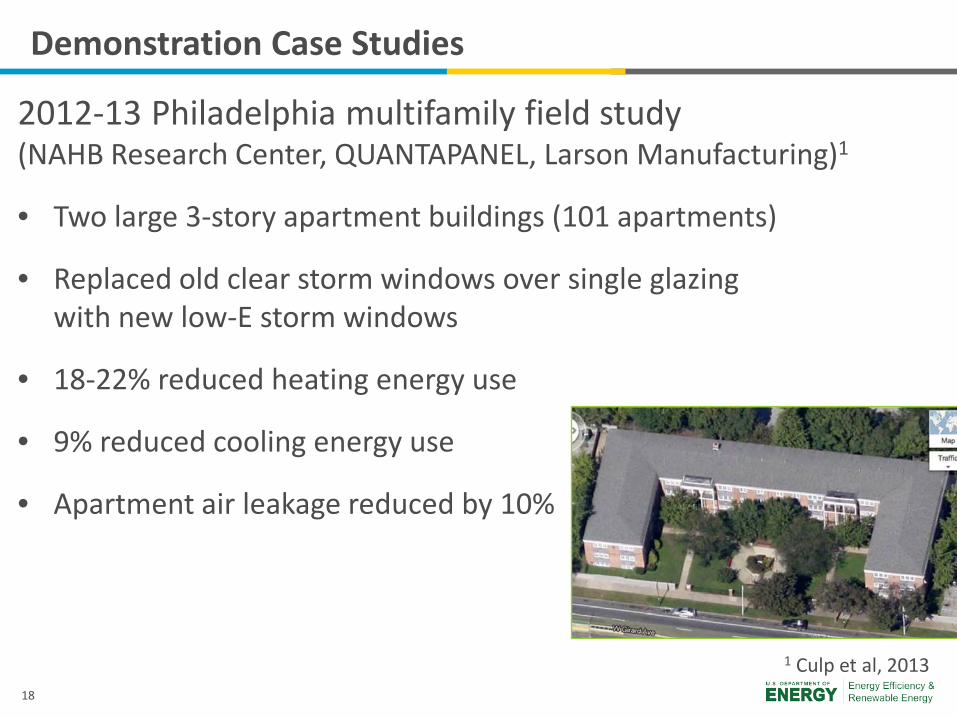
2012-13 Philadelphia multifamily field study (NAHB Research Center, QUANTAPANEL, Larson Manufacturing)1
• Two large 3-story apartment buildings (101 apartments)
• Replaced old clear storm windows over single glazing with new low-E storm windows
• 18-22% reduced heating energy use
• 9% reduced cooling energy use
• Apartment air leakage reduced by 10%
1 Culp et al, 2013
19
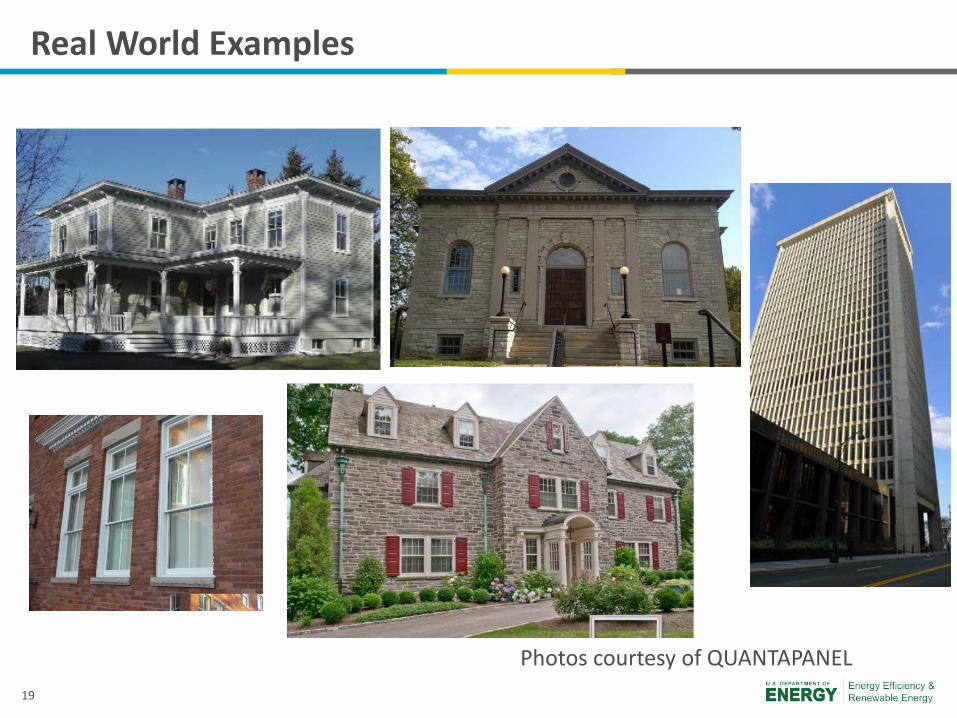
Photos courtesy of QUANTAPANEL
Real World Examples
20
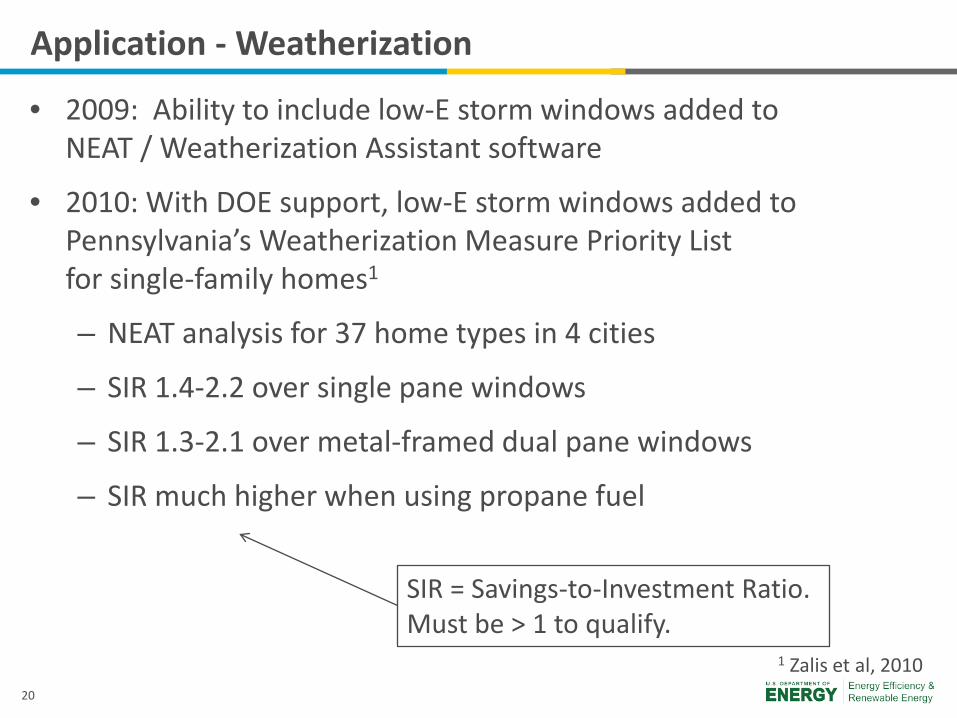
Application - Weatherization
• 2009: Ability to include low-E storm windows added to NEAT / Weatherization Assistant software
• 2010: With DOE support, low-E storm windows added to Pennsylvania’s Weatherization Measure Priority List for single-family homes1
– NEAT analysis for 37 home types in 4 cities
– SIR 1.4-2.2 over single pane windows
– SIR 1.3-2.1 over metal-framed dual pane windows
– SIR much higher when using propane fuel
SIR = Savings-to-Investment Ratio. Must be > 1 to qualify.
1 Zalis et al, 2010
21
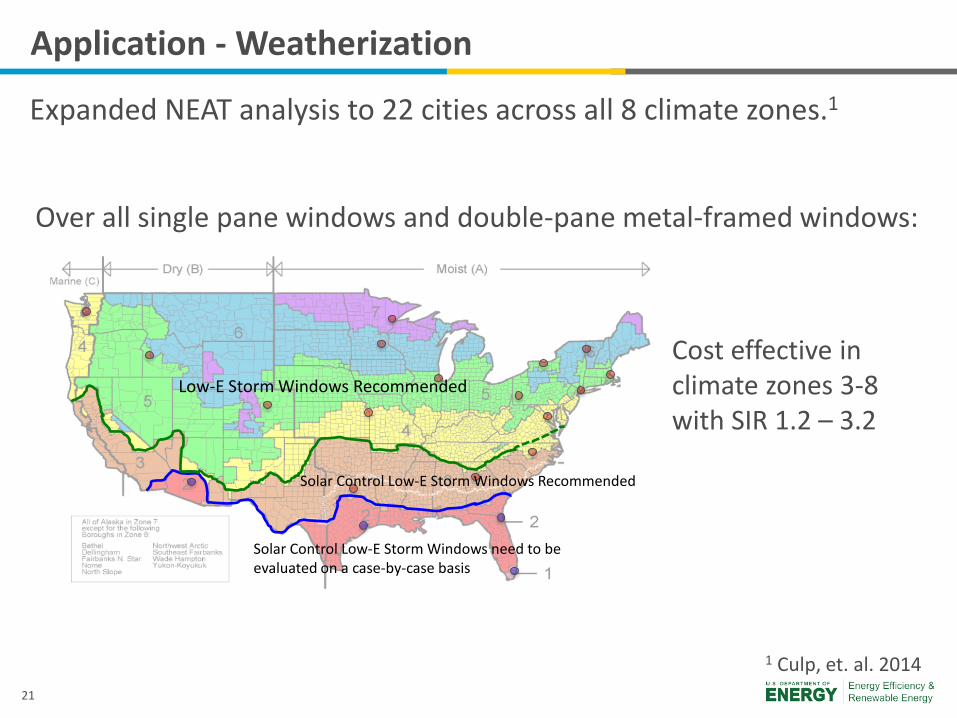
Application - Weatherization
Expanded NEAT analysis to 22 cities across all 8 climate zones.1
1 Culp, et. al. 2014
Low-E Storm Windows Recommended
Solar Control Low-E Storm Windows Recommended
Solar Control Low-E Storm Windows need to be evaluated on a case-by-case basis
Cost effective in climate zones 3-8 with SIR 1.2 – 3.2
Over all single pane windows and double-pane metal-framed windows:
22
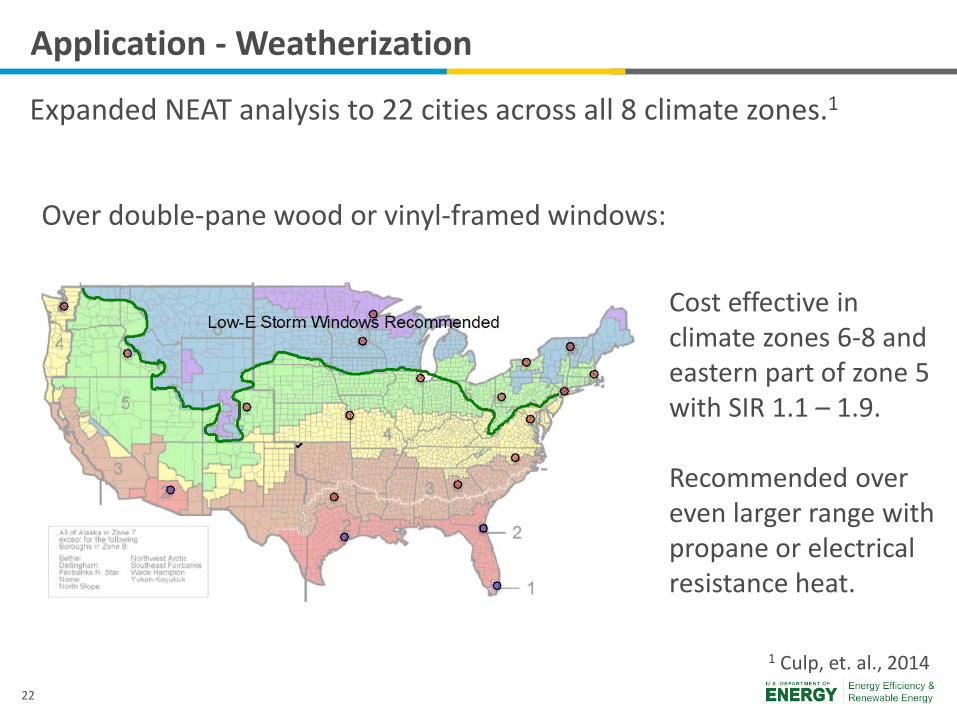
Application - Weatherization
Expanded NEAT analysis to 22 cities across all 8 climate zones.1
1 Culp, et. al., 2014
Cost effective in climate zones 6-8 and eastern part of zone 5 with SIR 1.1 – 1.9. Recommended over even larger range with propane or electrical resistance heat.
Over double-pane wood or vinyl-framed windows:
23
Code Compliance: Low-e Storm Windows
• What are the code requirements? – Storm windows are already exempted from the energy code. – Generally, structural, wind load, and fire resistance requirements are met
by the primary window. – Check if any storm windows will be in hazardous locations defined by the
building code (e.g. interior panels near a bathtub) that require tempered safety glazing.
• Do I have to file for a permit? – Generally, most jurisdictions will not require a permit to install low-e storm
windows, but always check with the local building department.
• Should I check with my homeowners association before installing? – Yes, just like any other modifications to the exterior of the home. – They should approve if looking at modern low-e storm windows.
In fact, low-e storm windows are often preferred in historic preservation over replacement windows.
– Can also consider interior panels.
24
Code Compliance: Window Coverings/Attachments
• Are there code compliance issues related to other window attachments?
• Generally not for interior blinds, shades.
• For exterior attachments (rolling shutters, sun screens, etc.):
– Check whether a permit is required, or if there are special requirements. (e.g. rolling shutters may have certain requirements regarding attachment.)
– Check for approval by homeowners association or for historic applications.
25
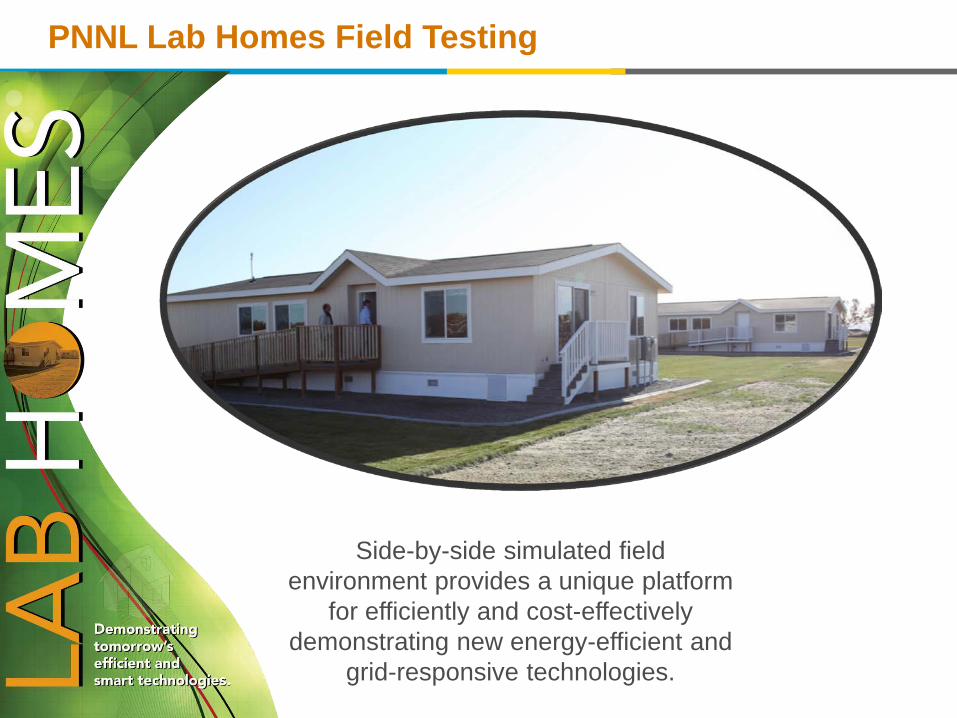
PNNL Lab Homes Field Testing
Side-by-side simulated field environment provides a unique platform
for efficiently and cost-effectively demonstrating new energy-efficient and
grid-responsive technologies.
26
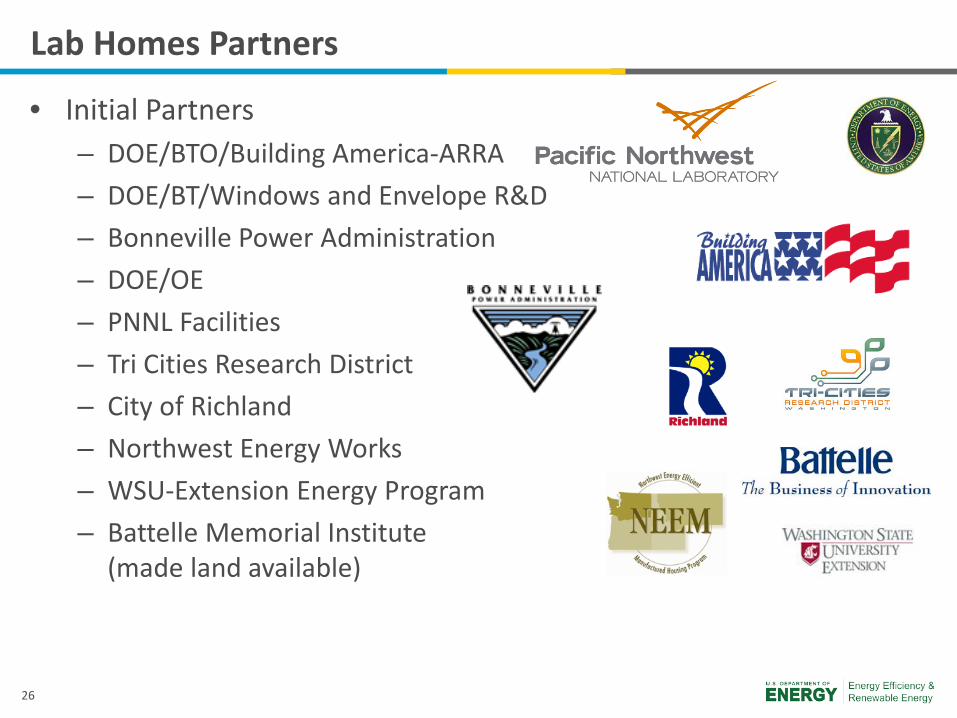
Lab Homes Partners
• Initial Partners – DOE/BTO/Building America-ARRA – DOE/BT/Windows and Envelope R&D – Bonneville Power Administration – DOE/OE – PNNL Facilities – Tri Cities Research District – City of Richland – Northwest Energy Works – WSU-Extension Energy Program – Battelle Memorial Institute
(made land available)
27
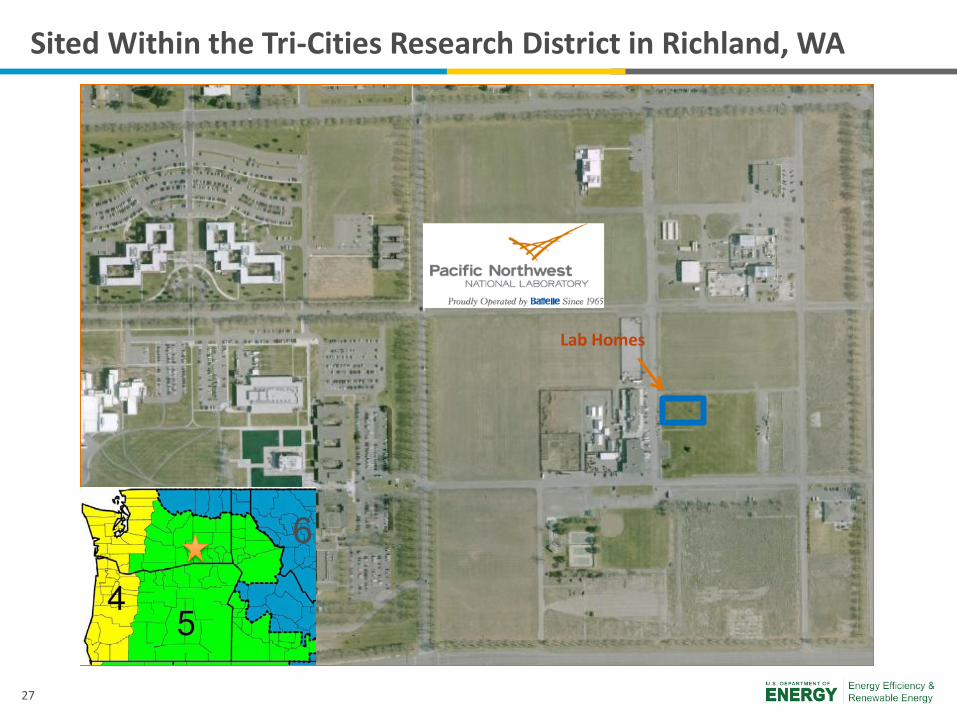
Sited Within the Tri-Cities Research District in Richland, WA
Lab Homes
6
28
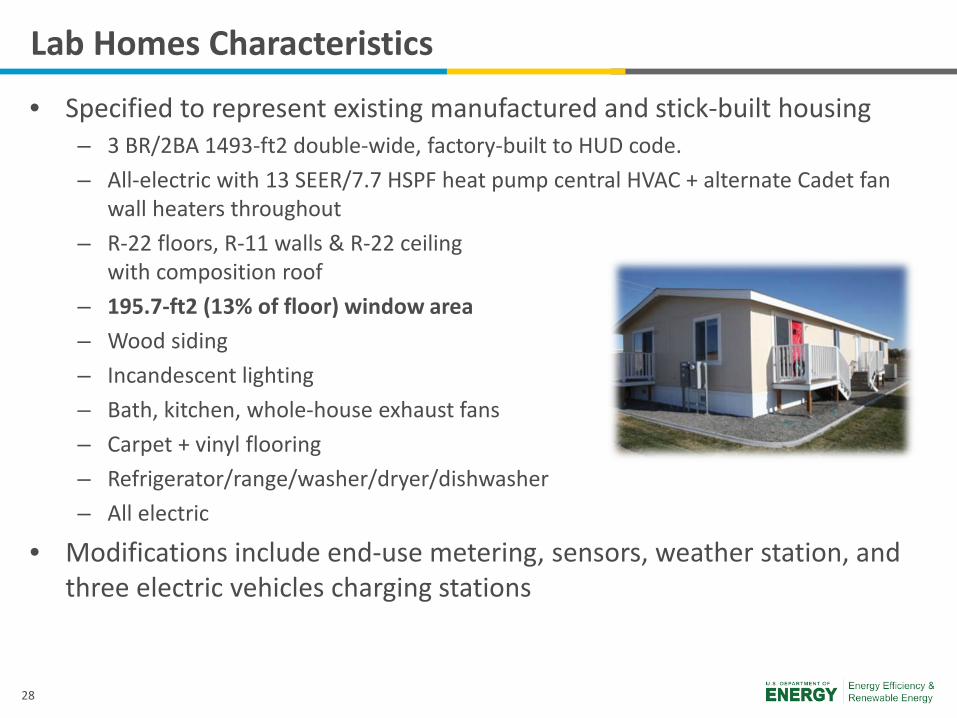
Lab Homes Characteristics
• Specified to represent existing manufactured and stick-built housing – 3 BR/2BA 1493-ft2 double-wide, factory-built to HUD code. – All-electric with 13 SEER/7.7 HSPF heat pump central HVAC + alternate Cadet fan
wall heaters throughout – R-22 floors, R-11 walls & R-22 ceiling
with composition roof – 195.7-ft2 (13% of floor) window area – Wood siding – Incandescent lighting – Bath, kitchen, whole-house exhaust fans – Carpet + vinyl flooring – Refrigerator/range/washer/dryer/dishwasher – All electric
• Modifications include end-use metering, sensors, weather station, and three electric vehicles charging stations
29
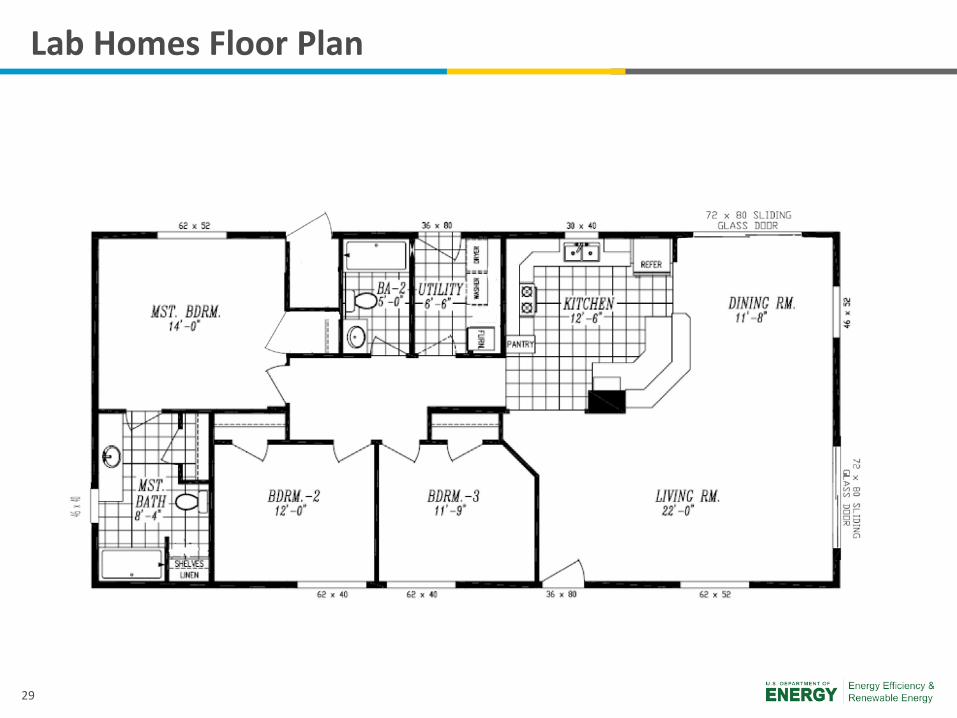
Lab Homes Floor Plan
30
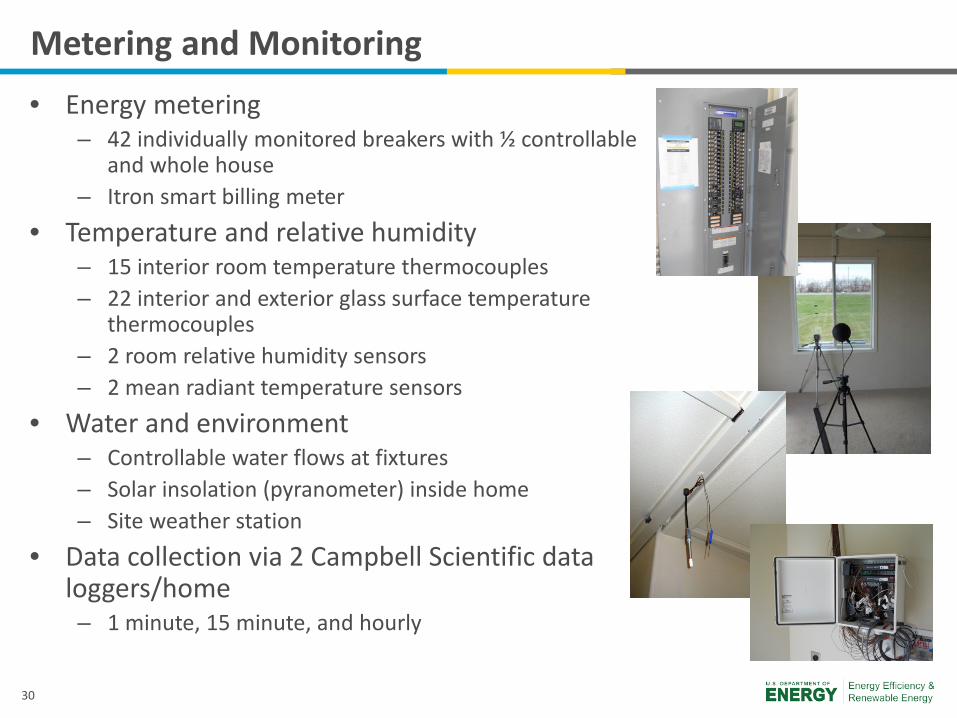
Metering and Monitoring
• Energy metering – 42 individually monitored breakers with ½ controllable
and whole house – Itron smart billing meter
• Temperature and relative humidity – 15 interior room temperature thermocouples – 22 interior and exterior glass surface temperature
thermocouples – 2 room relative humidity sensors – 2 mean radiant temperature sensors
• Water and environment – Controllable water flows at fixtures – Solar insolation (pyranometer) inside home – Site weather station
• Data collection via 2 Campbell Scientific data loggers/home – 1 minute, 15 minute, and hourly
31
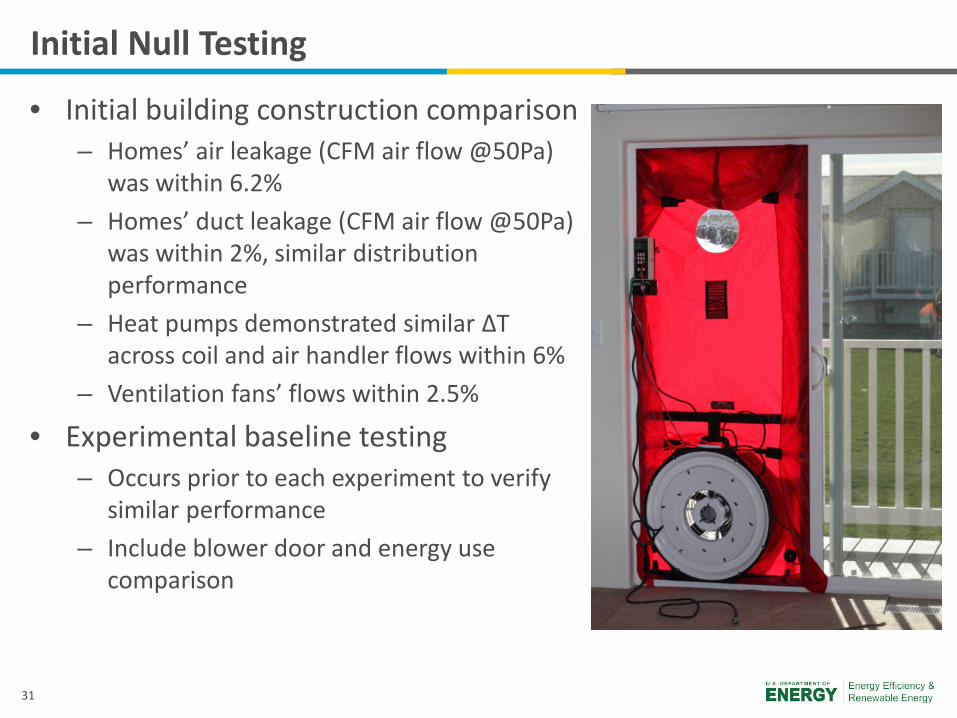
Initial Null Testing
• Initial building construction comparison – Homes’ air leakage (CFM air flow @50Pa)
was within 6.2% – Homes’ duct leakage (CFM air flow @50Pa)
was within 2%, similar distribution performance
– Heat pumps demonstrated similar ΔT across coil and air handler flows within 6%
– Ventilation fans’ flows within 2.5%
• Experimental baseline testing – Occurs prior to each experiment to verify
similar performance – Include blower door and energy use
comparison
32
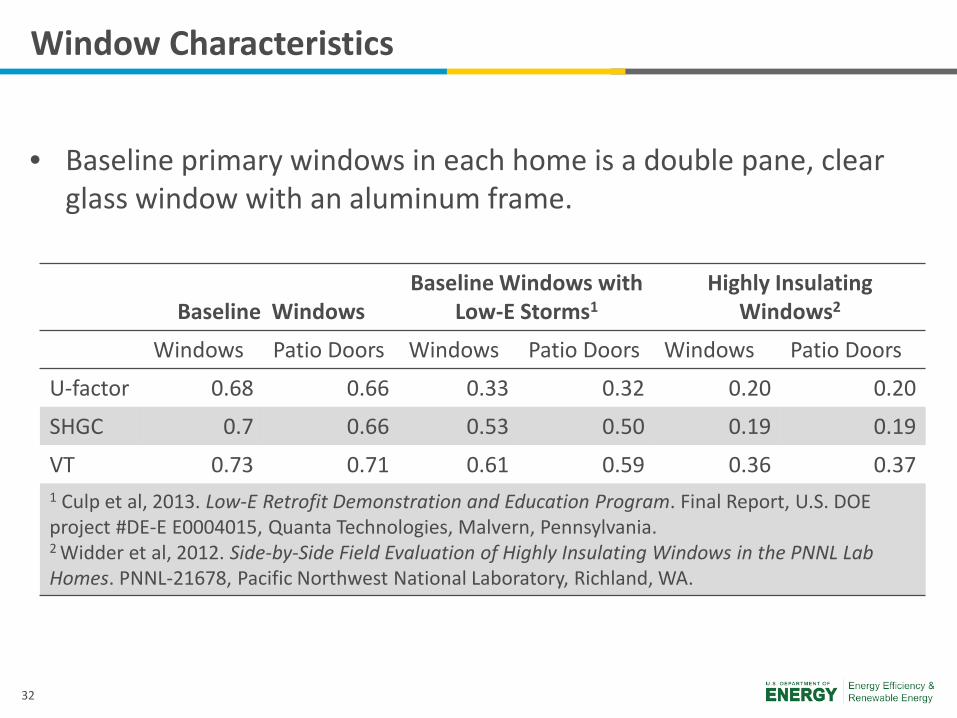
Window Characteristics
• Baseline primary windows in each home is a double pane, clear glass window with an aluminum frame.
Baseline Windows Baseline Windows with
Low-E Storms1 Highly Insulating
Windows2
Windows Patio Doors Windows Patio Doors Windows Patio Doors
U-factor 0.68 0.66 0.33 0.32 0.20 0.20
SHGC 0.7 0.66 0.53 0.50 0.19 0.19
VT 0.73 0.71 0.61 0.59 0.36 0.37 1 Culp et al, 2013. Low-E Retrofit Demonstration and Education Program. Final Report, U.S. DOE project #DE-E E0004015, Quanta Technologies, Malvern, Pennsylvania. 2 Widder et al, 2012. Side-by-Side Field Evaluation of Highly Insulating Windows in the PNNL Lab Homes. PNNL-21678, Pacific Northwest National Laboratory, Richland, WA.
33
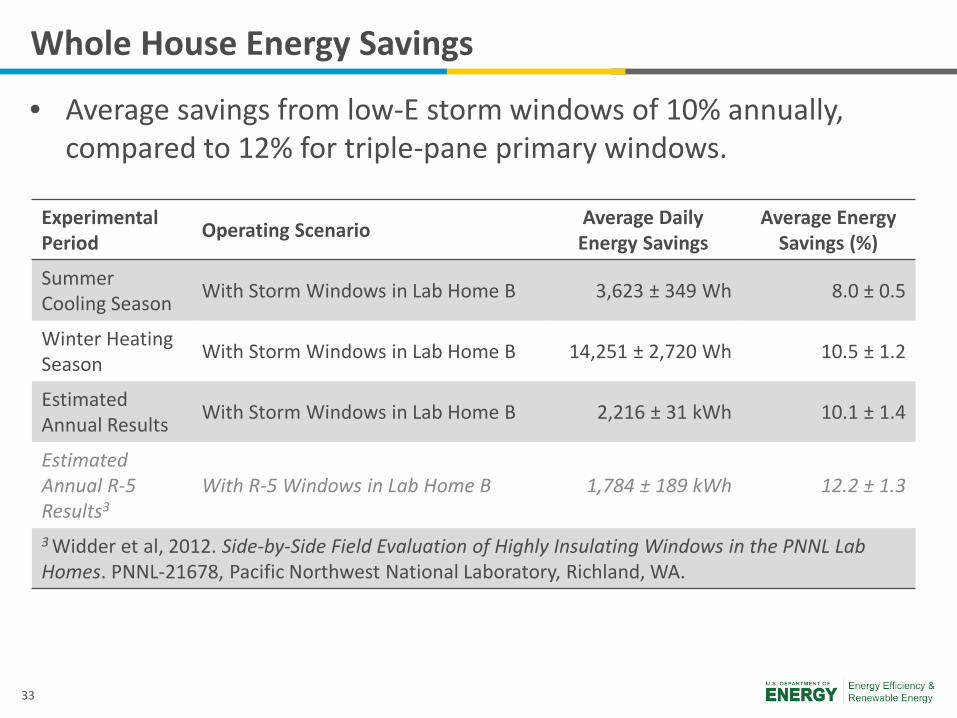
Whole House Energy Savings
• Average savings from low-E storm windows of 10% annually, compared to 12% for triple-pane primary windows.
Experimental Period Operating Scenario Average Daily
Energy Savings Average Energy
Savings (%)
Summer Cooling Season With Storm Windows in Lab Home B 3,623 ± 349 Wh 8.0 ± 0.5
Winter Heating Season With Storm Windows in Lab Home B 14,251 ± 2,720 Wh 10.5 ± 1.2
Estimated Annual Results With Storm Windows in Lab Home B 2,216 ± 31 kWh 10.1 ± 1.4
Estimated Annual R-5 Results3
With R-5 Windows in Lab Home B 1,784 ± 189 kWh 12.2 ± 1.3
3 Widder et al, 2012. Side-by-Side Field Evaluation of Highly Insulating Windows in the PNNL Lab Homes. PNNL-21678, Pacific Northwest National Laboratory, Richland, WA.
34
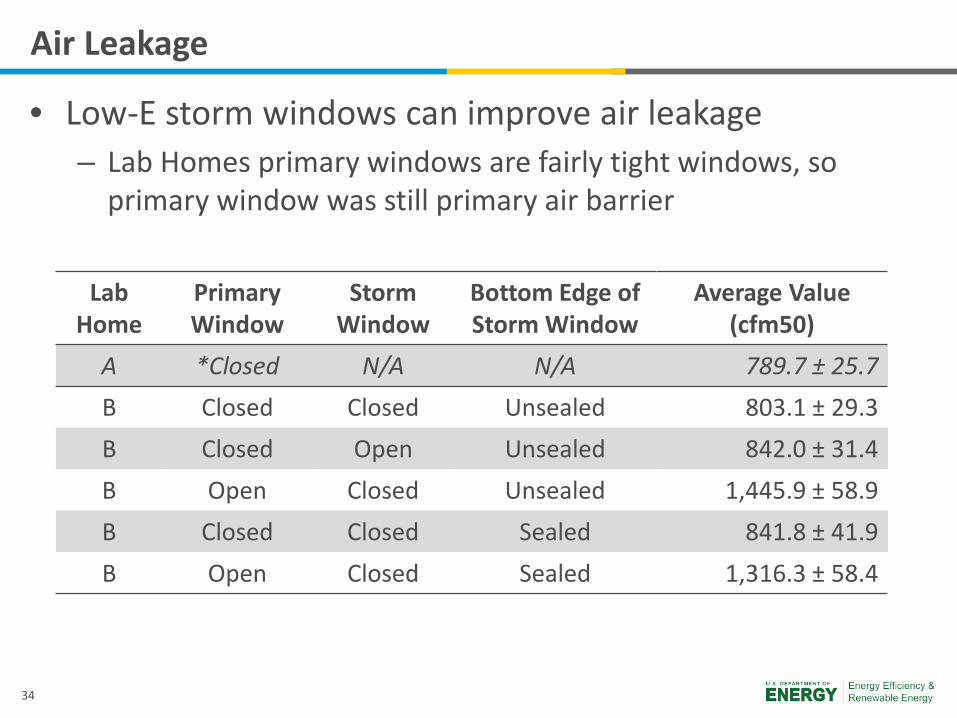
Air Leakage
• Low-E storm windows can improve air leakage – Lab Homes primary windows are fairly tight windows, so
primary window was still primary air barrier
Lab Home
Primary Window
Storm Window
Bottom Edge of Storm Window
Average Value (cfm50)
A *Closed N/A N/A 789.7 ± 25.7 B Closed Closed Unsealed 803.1 ± 29.3 B Closed Open Unsealed 842.0 ± 31.4 B Open Closed Unsealed 1,445.9 ± 58.9 B Closed Closed Sealed 841.8 ± 41.9 B Open Closed Sealed 1,316.3 ± 58.4
35
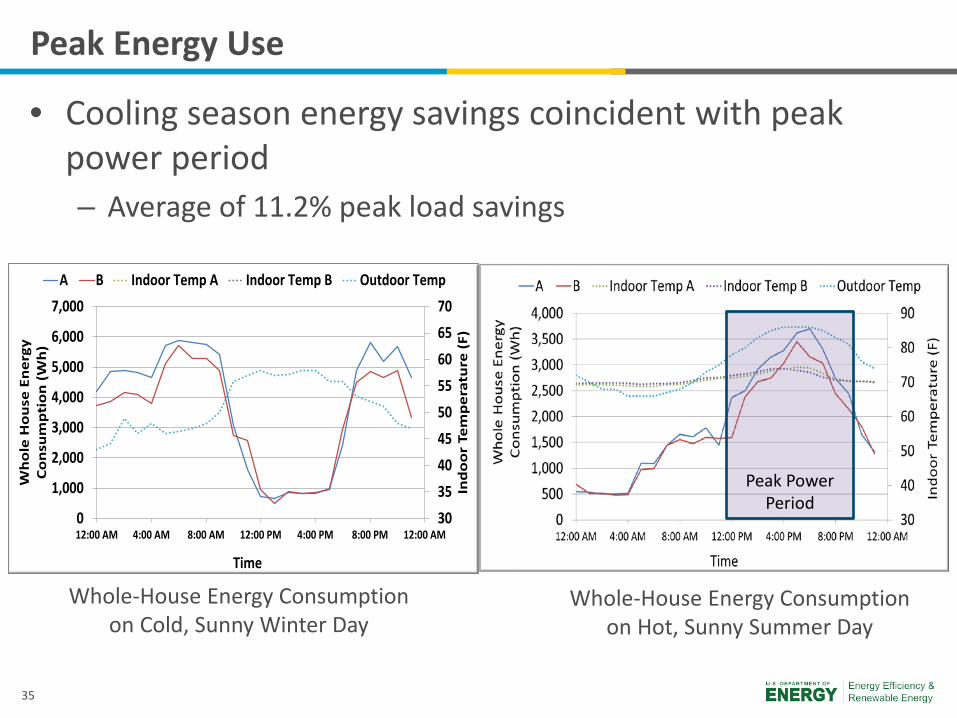
Peak Energy Use
• Cooling season energy savings coincident with peak power period – Average of 11.2% peak load savings
303540455055606570
0
1,000
2,000
3,000
4,000
5,000
6,000
7,000
12:00 AM 4:00 AM 8:00 AM 12:00 PM 4:00 PM 8:00 PM 12:00 AM
Ind
oo
r Te
mp
erat
ure
(F)
Wh
ole
Ho
use
En
ergy
C
on
sum
pti
on
(W
h)
Time
A B Indoor Temp A Indoor Temp B Outdoor Temp
Whole-House Energy Consumption on Cold, Sunny Winter Day
Whole-House Energy Consumption on Hot, Sunny Summer Day
Peak Power Period
36
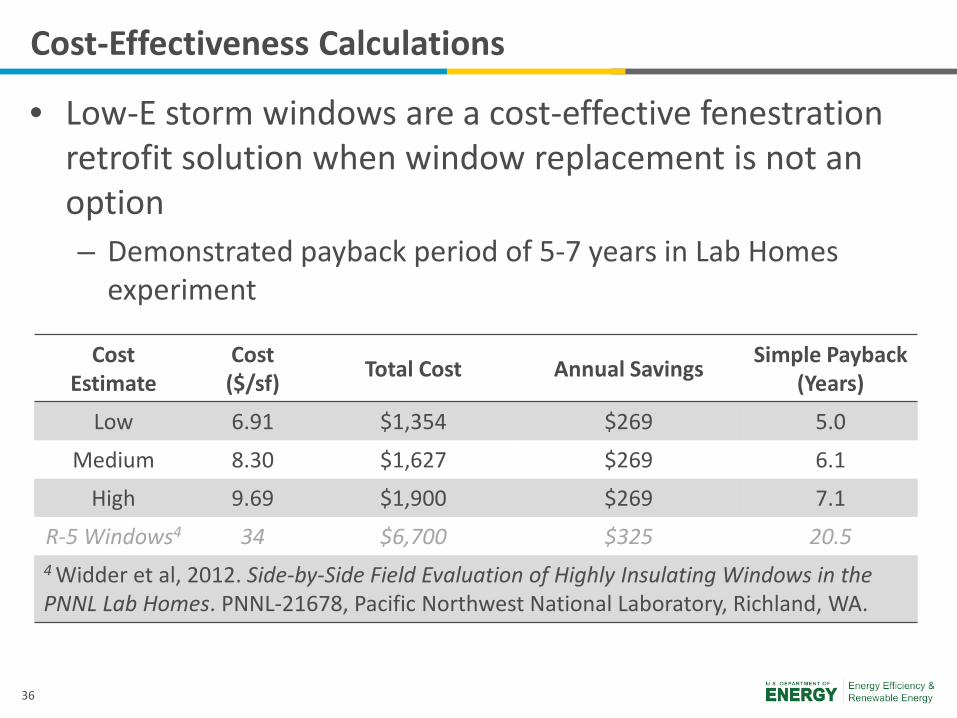
Cost-Effectiveness Calculations
• Low-E storm windows are a cost-effective fenestration retrofit solution when window replacement is not an option – Demonstrated payback period of 5-7 years in Lab Homes
experiment
Cost Estimate
Cost ($/sf) Total Cost Annual Savings Simple Payback
(Years)
Low 6.91 $1,354 $269 5.0
Medium 8.30 $1,627 $269 6.1
High 9.69 $1,900 $269 7.1
R-5 Windows4 34 $6,700 $325 20.5 4 Widder et al, 2012. Side-by-Side Field Evaluation of Highly Insulating Windows in the PNNL Lab Homes. PNNL-21678, Pacific Northwest National Laboratory, Richland, WA.
37
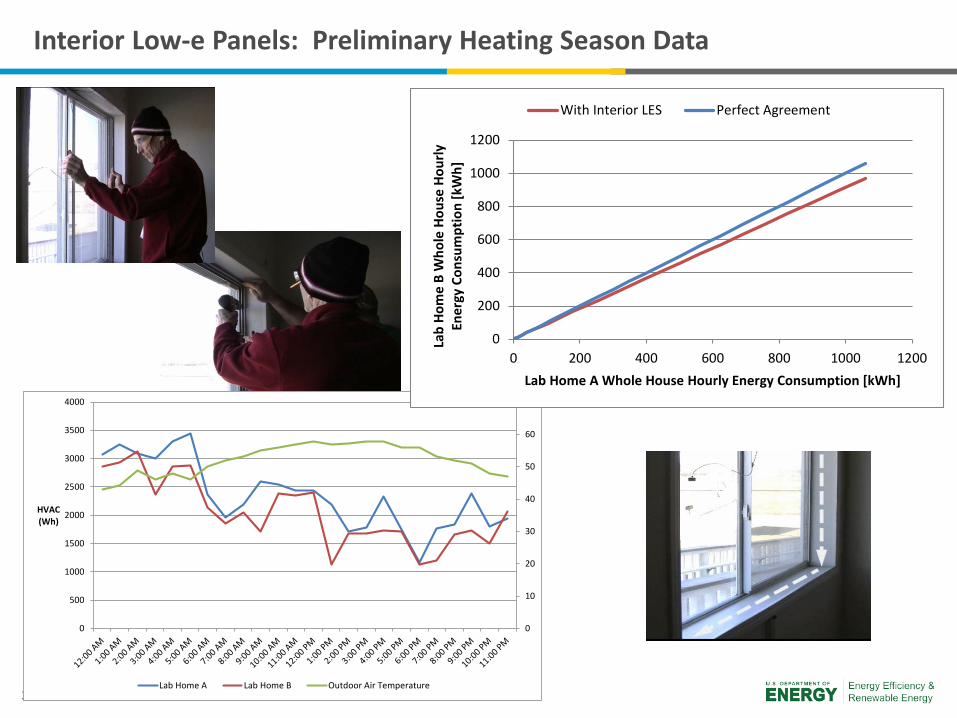
Interior Low-e Panels: Preliminary Heating Season Data
0
10
20
30
40
50
60
70
0
500
1000
1500
2000
2500
3000
3500
4000
HVAC(Wh)
Lab Home A Lab Home B Outdoor Air Temperature
0
200
400
600
800
1000
1200
0 200 400 600 800 1000 1200
Lab
Hom
e B
Who
le H
ouse
Hou
rly
Ener
gy C
onsu
mpt
ion
[kW
h]
Lab Home A Whole House Hourly Energy Consumption [kWh]
With Interior LES Perfect Agreement
38
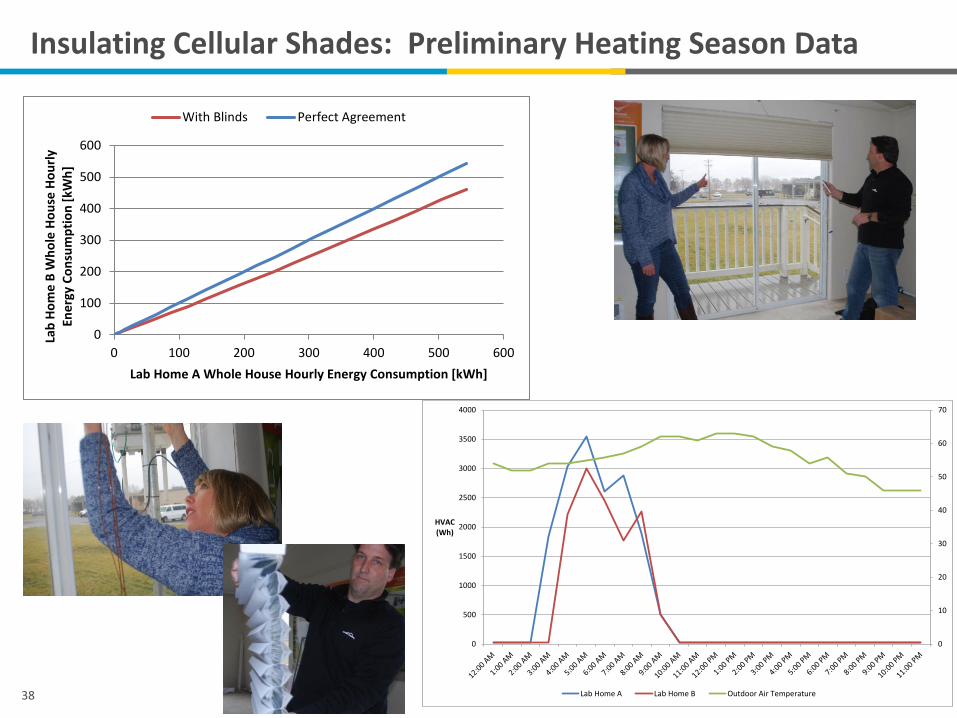
Insulating Cellular Shades: Preliminary Heating Season Data
0
10
20
30
40
50
60
70
0
500
1000
1500
2000
2500
3000
3500
4000
HVAC(Wh)
Lab Home A Lab Home B Outdoor Air Temperature
0
100
200
300
400
500
600
0 100 200 300 400 500 600
Lab
Hom
e B
Who
le H
ouse
Hou
rly
Ener
gy C
onsu
mpt
ion
[kW
h]
Lab Home A Whole House Hourly Energy Consumption [kWh]
With Blinds Perfect Agreement
39
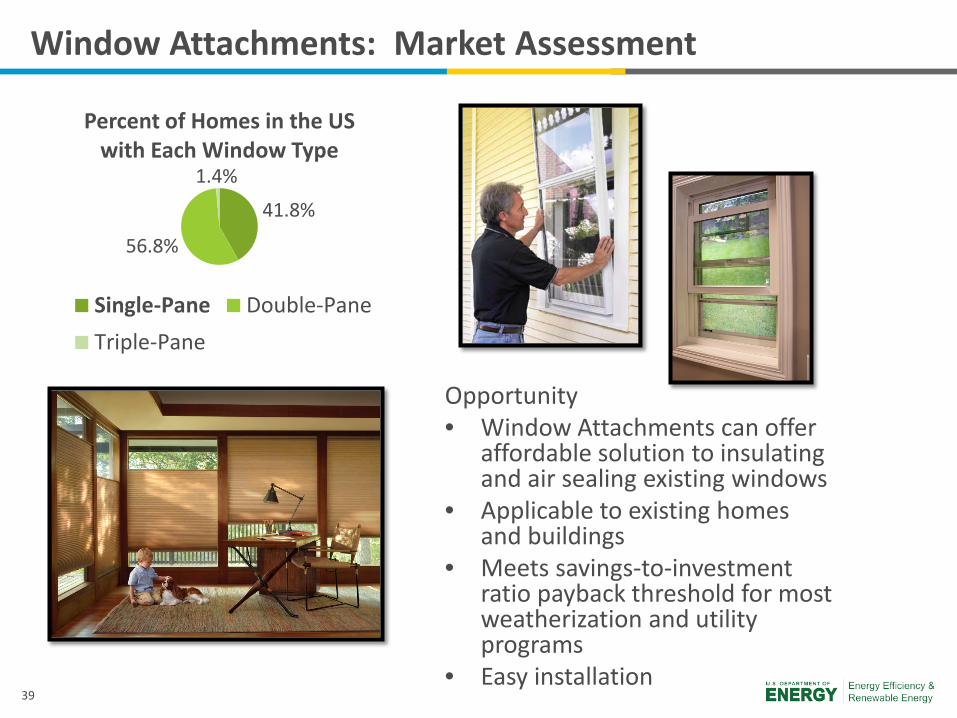
Window Attachments: Market Assessment
Opportunity • Window Attachments can offer
affordable solution to insulating and air sealing existing windows
• Applicable to existing homes and buildings
• Meets savings-to-investment ratio payback threshold for most weatherization and utility programs
• Easy installation
41.8%
56.8%
1.4%
Percent of Homes in the US with Each Window Type
Single-Pane Double-PaneTriple-Pane
40
An Installation Guide to Low-e Storm Windows
• Video Available
41
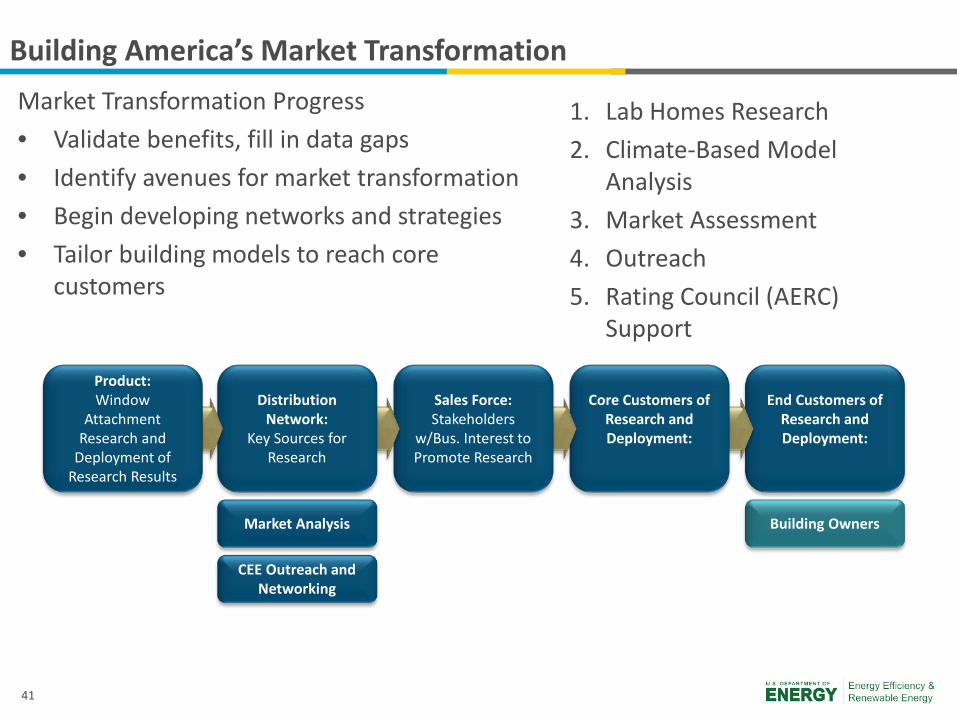
Building America’s Market Transformation
End Customers of Research and Deployment:
Core Customers of Research and Deployment:
Sales Force: Stakeholders
w/Bus. Interest to Promote Research
Distribution Network:
Key Sources for Research
Product: Window
Attachment Research and
Deployment of Research Results
Market Analysis Building Owners
CEE Outreach and Networking
1. Lab Homes Research 2. Climate-Based Model
Analysis 3. Market Assessment 4. Outreach 5. Rating Council (AERC)
Support
Market Transformation Progress • Validate benefits, fill in data gaps • Identify avenues for market transformation • Begin developing networks and strategies • Tailor building models to reach core
customers
42
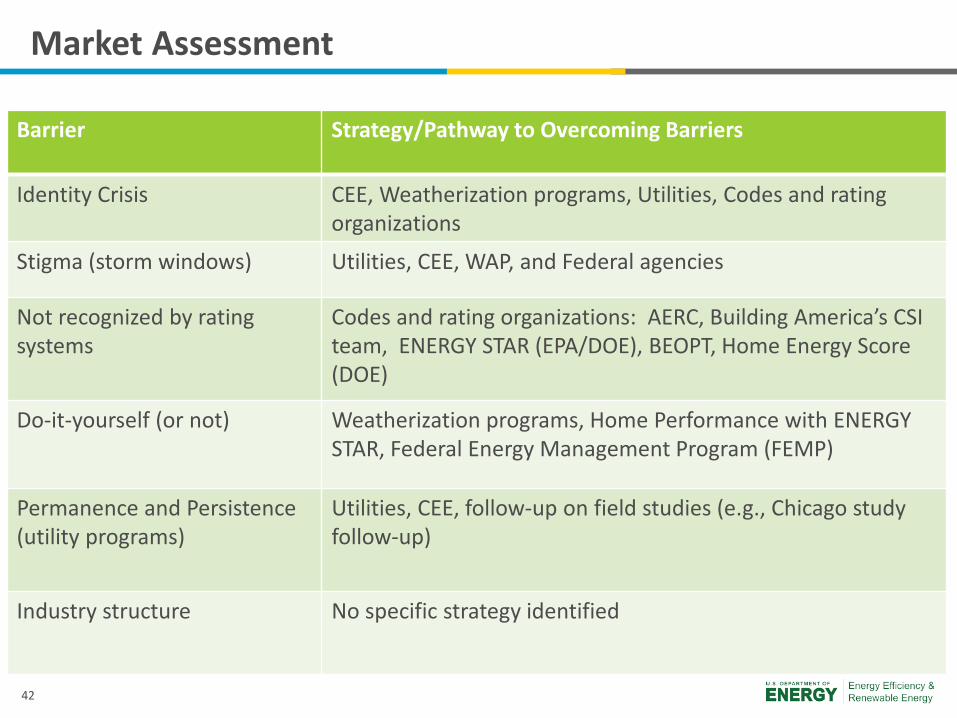
Market Assessment
Barrier Strategy/Pathway to Overcoming Barriers
Identity Crisis CEE, Weatherization programs, Utilities, Codes and rating organizations
Stigma (storm windows) Utilities, CEE, WAP, and Federal agencies
Not recognized by rating systems
Codes and rating organizations: AERC, Building America’s CSI team, ENERGY STAR (EPA/DOE), BEOPT, Home Energy Score (DOE)
Do-it-yourself (or not) Weatherization programs, Home Performance with ENERGY STAR, Federal Energy Management Program (FEMP)
Permanence and Persistence (utility programs)
Utilities, CEE, follow-up on field studies (e.g., Chicago study follow-up)
Industry structure
No specific strategy identified
43
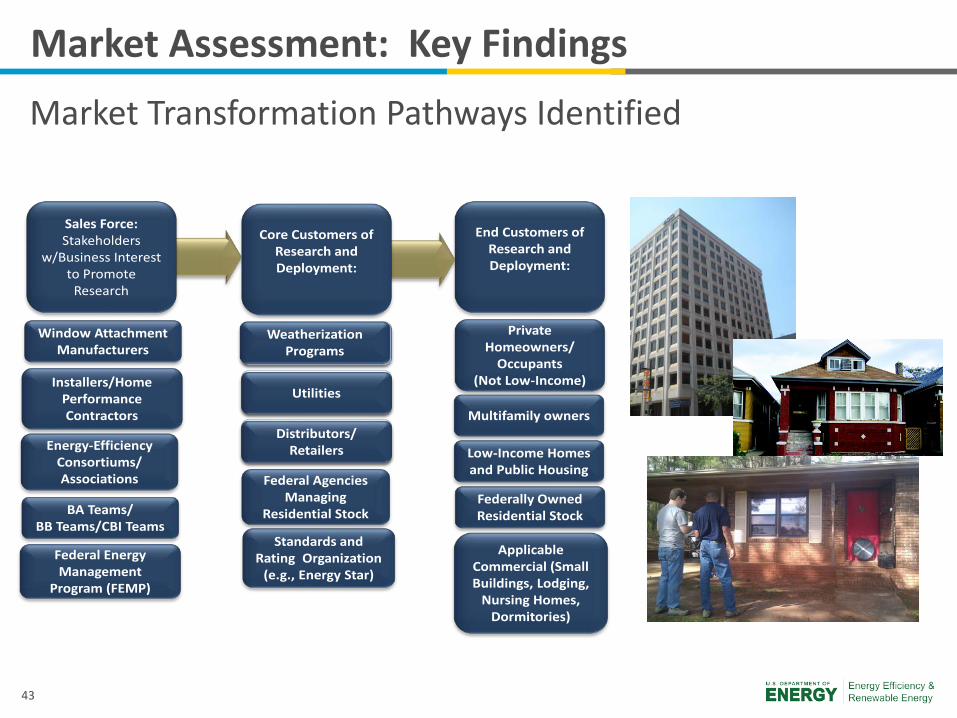
Market Assessment: Key Findings
Market Transformation Pathways Identified End Customers of
Research and Deployment:
Core Customers of Research and Deployment:
Sales Force:Stakeholders
w/Business Interest to Promote
Research
Private Homeowners/
Occupants (Not Low-Income)
Multifamily owners
Applicable Commercial (Small Buildings, Lodging,
Nursing Homes, Dormitories)
Weatherization Programs
Utilities
Distributors/ RetailersEnergy-Efficiency
Consortiums/ Associations
Weatherization Programs
Utilities
Distributors/ Retailers
Window AttachmentManufacturers
Installers/Home Performance Contractors
BA Teams/ BB Teams/CBI Teams
Weatherization Programs
Utilities
Distributors/ Retailers
Federal Agencies Managing
Residential Stock
Standards and Rating Organization
(e.g., Energy Star)Federal Energy Management
Program (FEMP)
Federally Owned Residential Stock
Low-Income Homes and Public Housing
44
Addressing Market Barriers – Consortium for Energy Efficiency
• Windows working group of CEE members (energy efficiency program administrators) and industry stakeholders is working to advance the uptake of efficient fenestration products and practices across the US and Canada
• CEE Window Product Overviews — Feb, 2014 – Developed from 2010-2014 – Resource for EE Program Managers – Vetted through consensus process
• Subgroup Projects — Current – Window Attachments Subgroup – Summary Resource Table and Inputs Database
45
Addressing Market Barriers
• Low-e storm windows integrated in FEDS model (supports most Federal building energy audits). BEOPT next.
• Supporting DOE’s Attachment Energy Rating Council (AERC) effort to help develop fenestration attachment rating system.
• Working with CEE to develop tools and resources related to efficient window attachments for energy-efficiency programs.
• Working directly with utility and weatherization programs to provide technical assistance.
46
Remaining Research Questions
• Operation and Automation – Optimal operation? Likely operation? Value of
automation? • Optimizing Return on Investment
– Minimizing costs while maximizing benefits • Combinations of Attachments • Assessing Durability and any Unintended
Consequences and – Impacts of heat build-up – Condensation
47
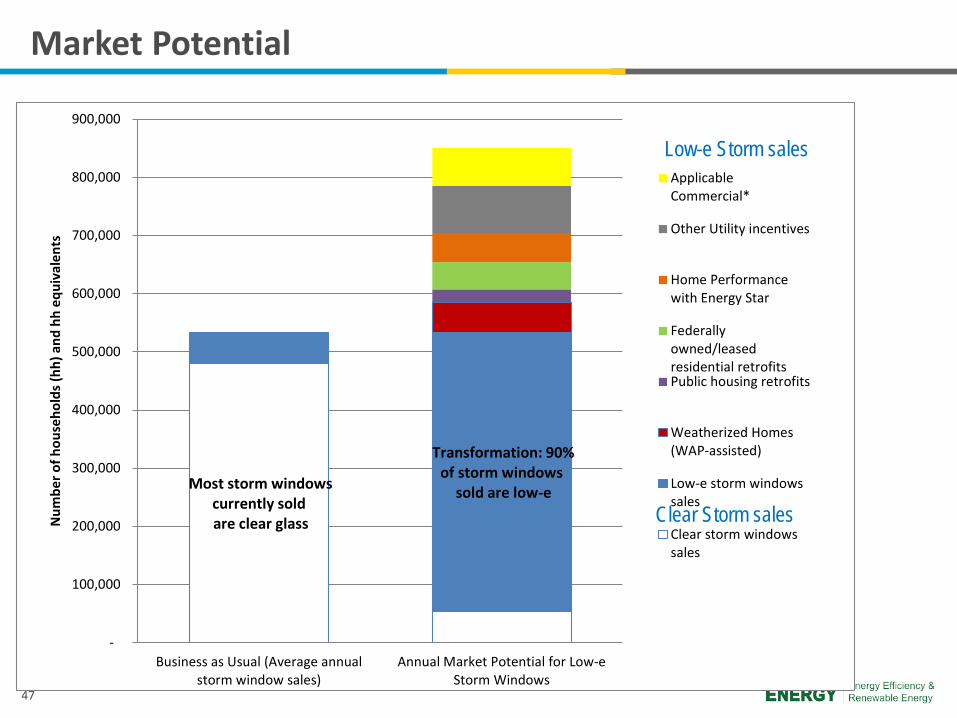
Most storm windows currently soldare clear glass
Transformation: 90% of storm windows
sold are low-e
-
100,000
200,000
300,000
400,000
500,000
600,000
700,000
800,000
900,000
Business as Usual (Average annualstorm window sales)
Annual Market Potential for Low-eStorm Windows
Num
ber o
f hou
seho
lds (
hh) a
nd h
h eq
uiva
lent
s
ApplicableCommercial*
Other Utility incentives
Home Performancewith Energy Star
Federallyowned/leasedresidential retrofitsPublic housing retrofits
Weatherized Homes(WAP-assisted)
Low-e storm windowssales
Clear storm windowssales
Market Potential
Low-e Storm sales
Clear Storm sales
48
Thank you!
49
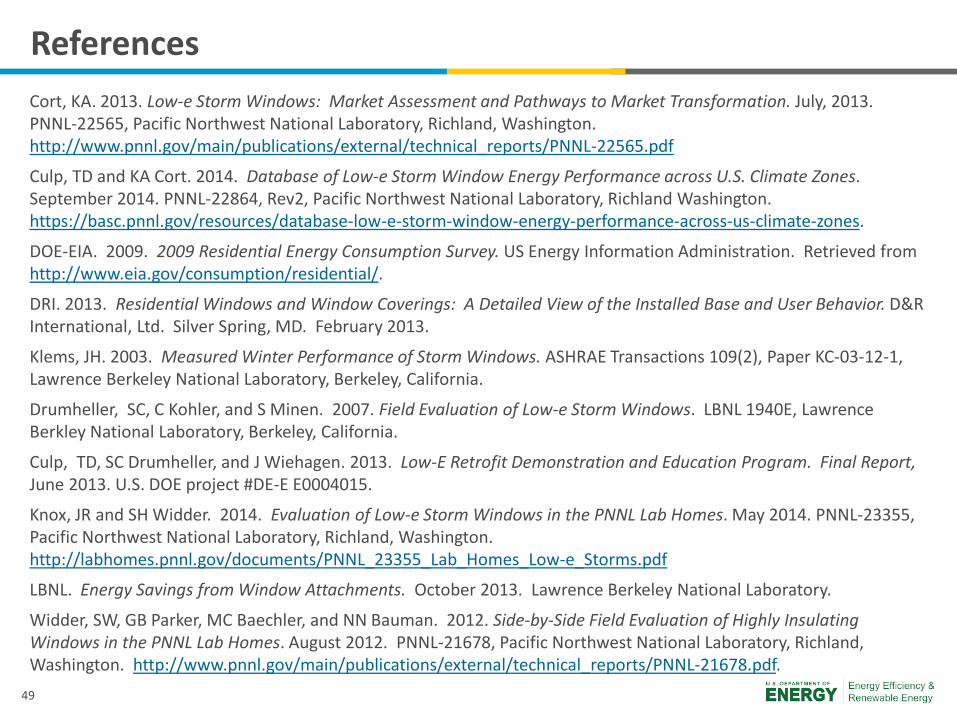
References Cort, KA. 2013. Low-e Storm Windows: Market Assessment and Pathways to Market Transformation. July, 2013. PNNL-22565, Pacific Northwest National Laboratory, Richland, Washington. http://www.pnnl.gov/main/publications/external/technical_reports/PNNL-22565.pdf
Culp, TD and KA Cort. 2014. Database of Low-e Storm Window Energy Performance across U.S. Climate Zones. September 2014. PNNL-22864, Rev2, Pacific Northwest National Laboratory, Richland Washington. https://basc.pnnl.gov/resources/database-low-e-storm-window-energy-performance-across-us-climate-zones.
DOE-EIA. 2009. 2009 Residential Energy Consumption Survey. US Energy Information Administration. Retrieved from http://www.eia.gov/consumption/residential/.
DRI. 2013. Residential Windows and Window Coverings: A Detailed View of the Installed Base and User Behavior. D&R International, Ltd. Silver Spring, MD. February 2013.
Klems, JH. 2003. Measured Winter Performance of Storm Windows. ASHRAE Transactions 109(2), Paper KC-03-12-1, Lawrence Berkeley National Laboratory, Berkeley, California.
Drumheller, SC, C Kohler, and S Minen. 2007. Field Evaluation of Low-e Storm Windows. LBNL 1940E, Lawrence Berkley National Laboratory, Berkeley, California.
Culp, TD, SC Drumheller, and J Wiehagen. 2013. Low-E Retrofit Demonstration and Education Program. Final Report, June 2013. U.S. DOE project #DE-E E0004015.
Knox, JR and SH Widder. 2014. Evaluation of Low-e Storm Windows in the PNNL Lab Homes. May 2014. PNNL-23355, Pacific Northwest National Laboratory, Richland, Washington. http://labhomes.pnnl.gov/documents/PNNL_23355_Lab_Homes_Low-e_Storms.pdf
LBNL. Energy Savings from Window Attachments. October 2013. Lawrence Berkeley National Laboratory.
Widder, SW, GB Parker, MC Baechler, and NN Bauman. 2012. Side-by-Side Field Evaluation of Highly Insulating Windows in the PNNL Lab Homes. August 2012. PNNL-21678, Pacific Northwest National Laboratory, Richland, Washington. http://www.pnnl.gov/main/publications/external/technical_reports/PNNL-21678.pdf.
50
Time for Q&A
Lab-Home Study and Results Sarah Widder [email protected]
Field Implementation Success Stories Tom Culp
Window Attachments Program at PNNL Katie Cort
51
****************Extra Slides*****************
52
How Low-e Storms Save Energy
Low-e coating reflects heat back into the space
53
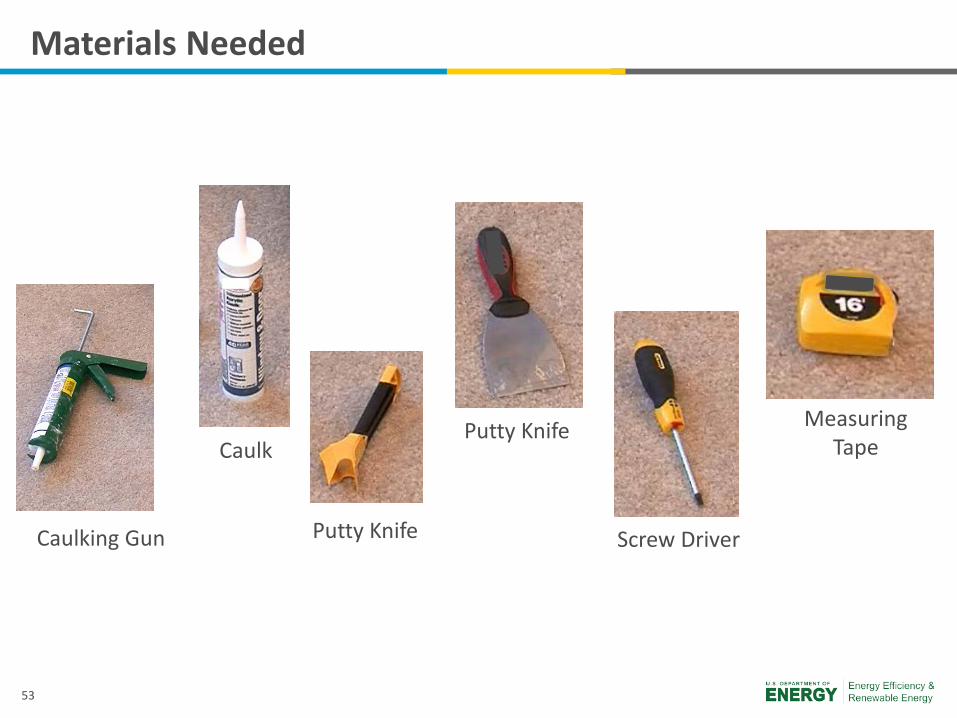
Materials Needed
Caulking Gun
Caulk Putty Knife
Screw Driver
Measuring Tape
Putty Knife
54
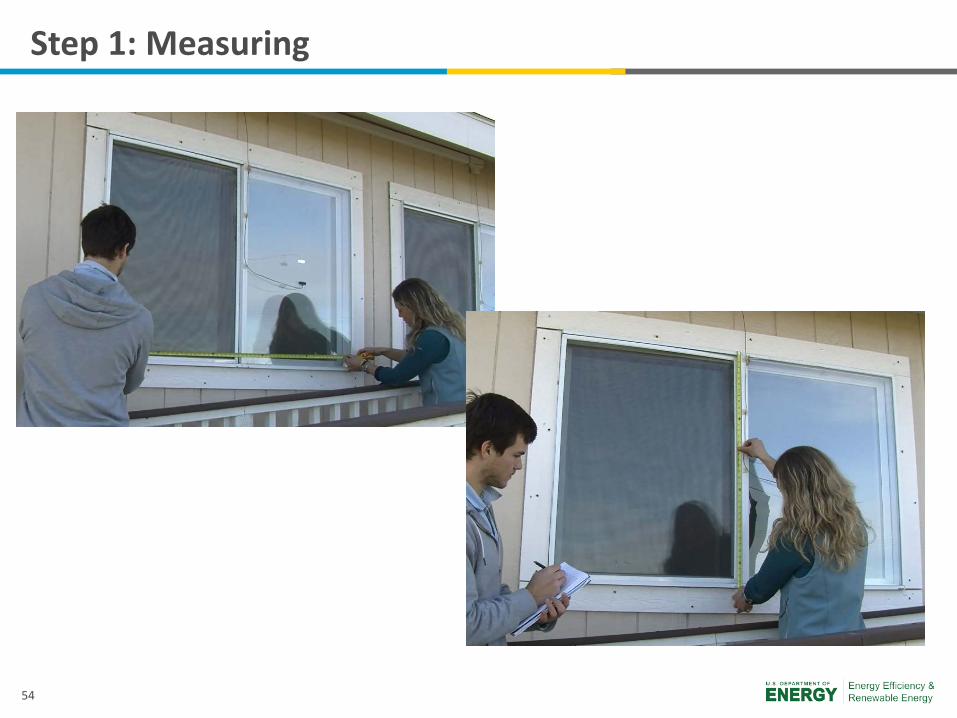
Step 1: Measuring
55
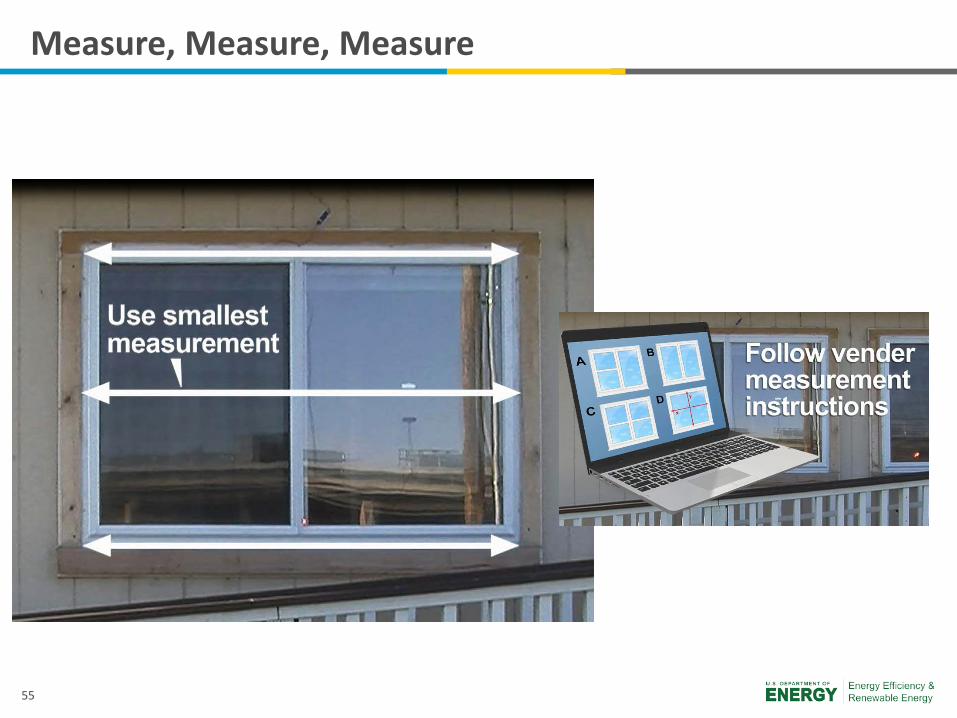
Measure, Measure, Measure
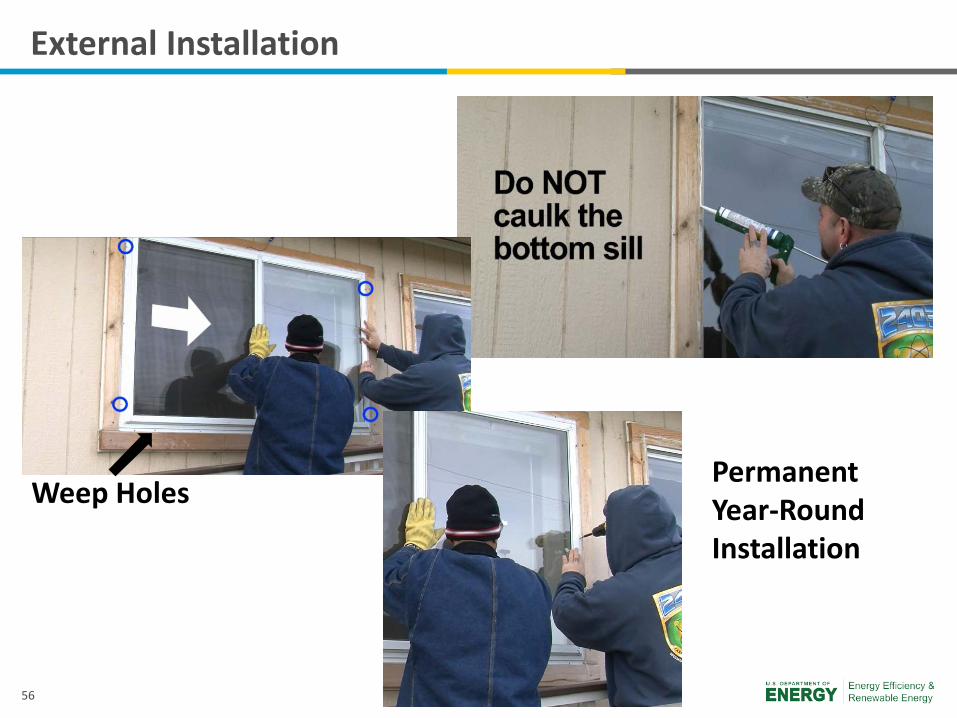
56
Weep Holes Permanent Year-Round Installation
External Installation
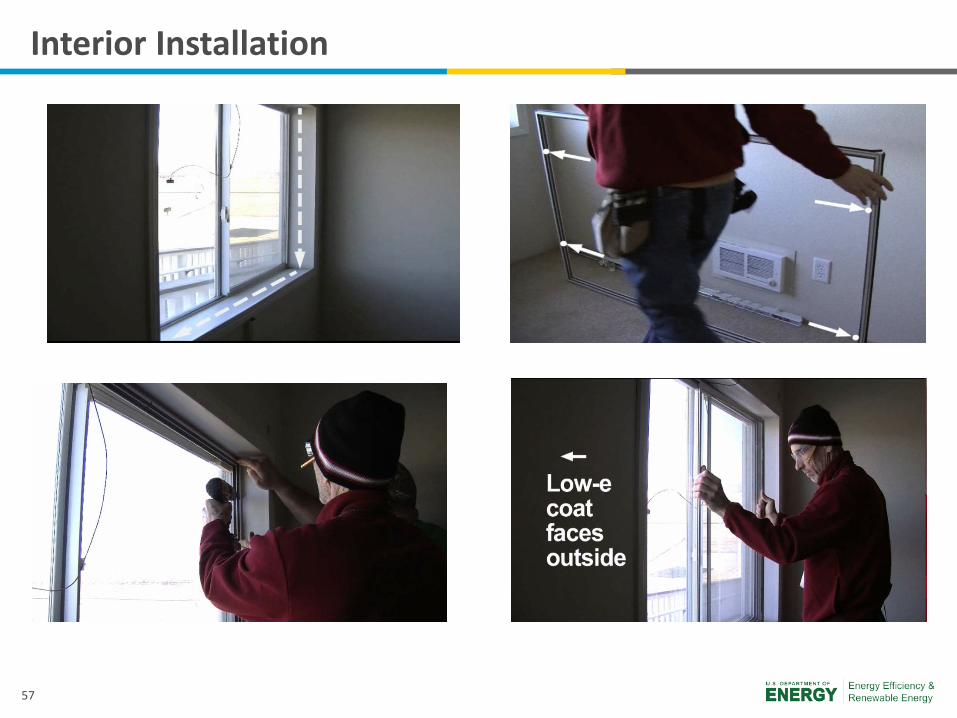
57
Interior Installation
58
More Installation Information
• Video instructions for low-e storm window installation found at: http://youtu.be/DeU6wn0psrU.
• More detailed instructions also found on Building America Solutions Center: https://basc.pnnl.gov/resource-guides/
• Product overviews and information about window coverings: http://www.efficientwindowcoverings.org/