Embed Size (px)
Citation preview
Betting Against Beta
Prepared for the Fiduciary Investors Symposium, Beijing 2011
Lasse H. Pedersen
New York University, Copenhagen Business School, CEPR, NBER, and
AQR Capital Management
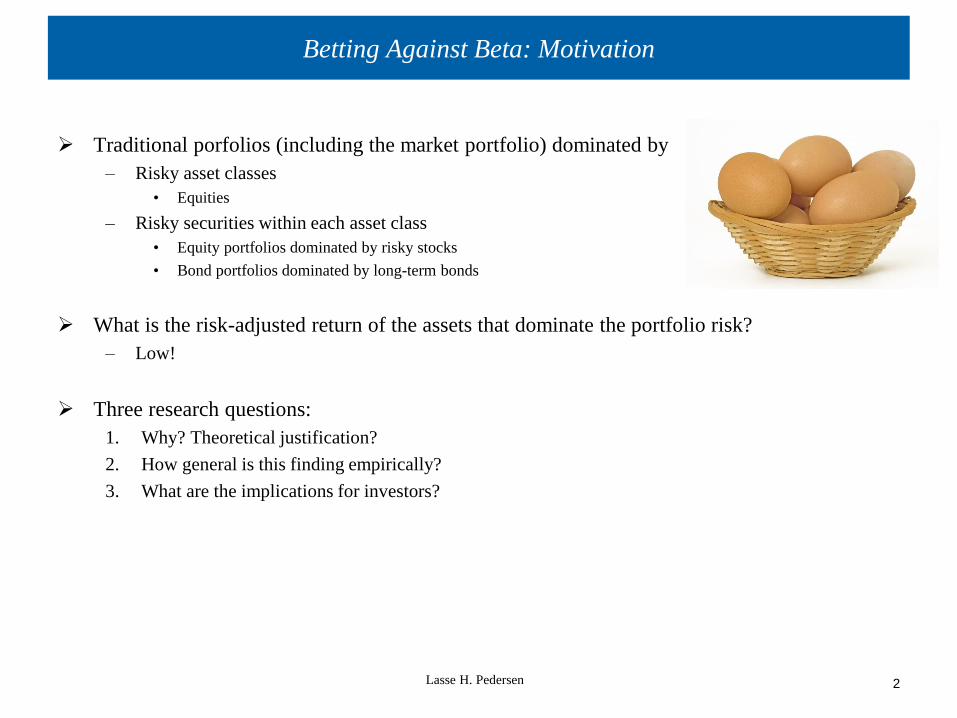
Betting Against Beta: Motivation
Traditional porfolios (including the market portfolio) dominated by
– Risky asset classes
• Equities
– Risky securities within each asset class
• Equity portfolios dominated by risky stocks
• Bond portfolios dominated by long-term bonds
What is the risk-adjusted return of the assets that dominate the portfolio risk?
– Low!
Three research questions:
1. Why? Theoretical justification?
2. How general is this finding empirically?
3. What are the implications for investors?
Lasse H. Pedersen
2
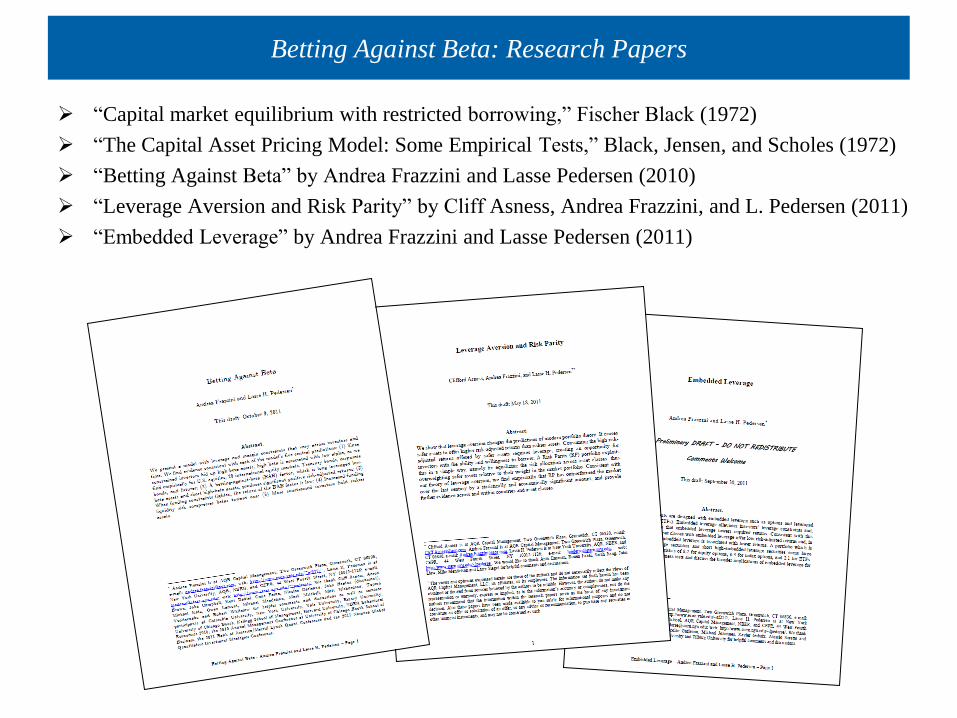
Betting Against Beta: Research Papers
“Capital market equilibrium with restricted borrowing,” Fischer Black (1972)
“The Capital Asset Pricing Model: Some Empirical Tests,” Black, Jensen, and Scholes (1972)
“Betting Against Beta” by Andrea Frazzini and Lasse Pedersen (2010)
“Leverage Aversion and Risk Parity” by Cliff Asness, Andrea Frazzini, and L. Pedersen (2011)
“Embedded Leverage” by Andrea Frazzini and Lasse Pedersen (2011)
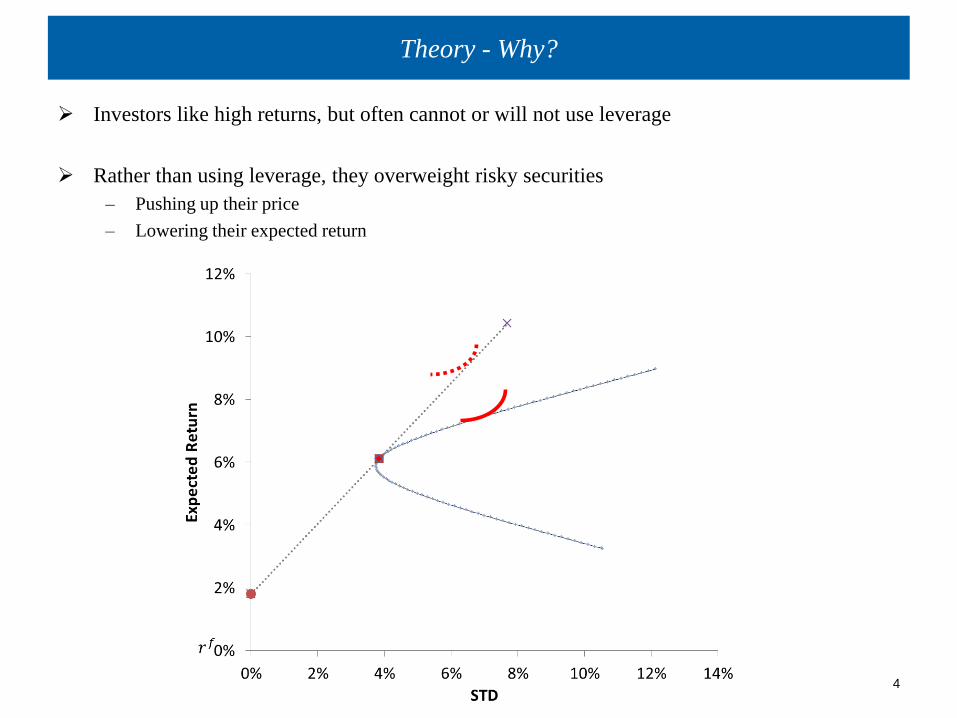
Theory - Why?
Investors like high returns, but often cannot or will not use leverage
Rather than using leverage, they overweight risky securities
– Pushing up their price
– Lowering their expected return
Lasse H. Pedersen
4

Theory: High Beta is Low Alpha
Proposition. [Black-Frazzini-Pedersen] When some investors face leverage constraints, the
required return is:
where the risk premium is , and ψ is the average Lagrange multiplier measuring
the tightness of funding constraints. A security’s alpha with respect to the market decreases in the
security’s market beta:
Sources: Fischer Black (1972), and Andrea Frazzini and Lasse H. Pedersen (2010) “Betting Against Beta”
5
1
s f s
t t t t tE r r
1
M f
t t t tE r r
(1 )s s
t t t
Expected
return
β
Standard
CAPM
Margin
CAPM
rf
α
α

Evidence on High Beta is Low Alpha: The Original Evidence
Theoretical and empirical security market lines: beta-sorted U.S. equity portfolios, 1931-1965
Source: Black, Jensen, and Scholes (1972)
6
6.0%
8.0%
10.0%
12.0%
14.0%
16.0%
18.0%
20.0%
22.0%
6.0% 8.0% 10.0% 12.0% 14.0% 16.0% 18.0% 20.0% 22.0%
Ave
rag
e E
xc
es
s R
etu
rn (
An
nu
alize
d)
Beta * Average Market Excess Return
Fischer Black

Evidence on High Beta is Low Alpha: Updated Equity Sample
Theoretical and empirical security market lines: beta-sorted U.S. equity portfolios, 1926-2010
Source: Andrea Frazzini and Lasse H. Pedersen (2010)
7
4.0%
5.0%
6.0%
7.0%
8.0%
9.0%
10.0%
11.0%
12.0%
13.0%
14.0%
4.0% 5.0% 6.0% 7.0% 8.0% 9.0% 10.0% 11.0% 12.0% 13.0% 14.0%
Ave
rag
e E
xc
es
s R
etu
rn (
An
nu
alize
d)
Beta * Average Market Excess Return
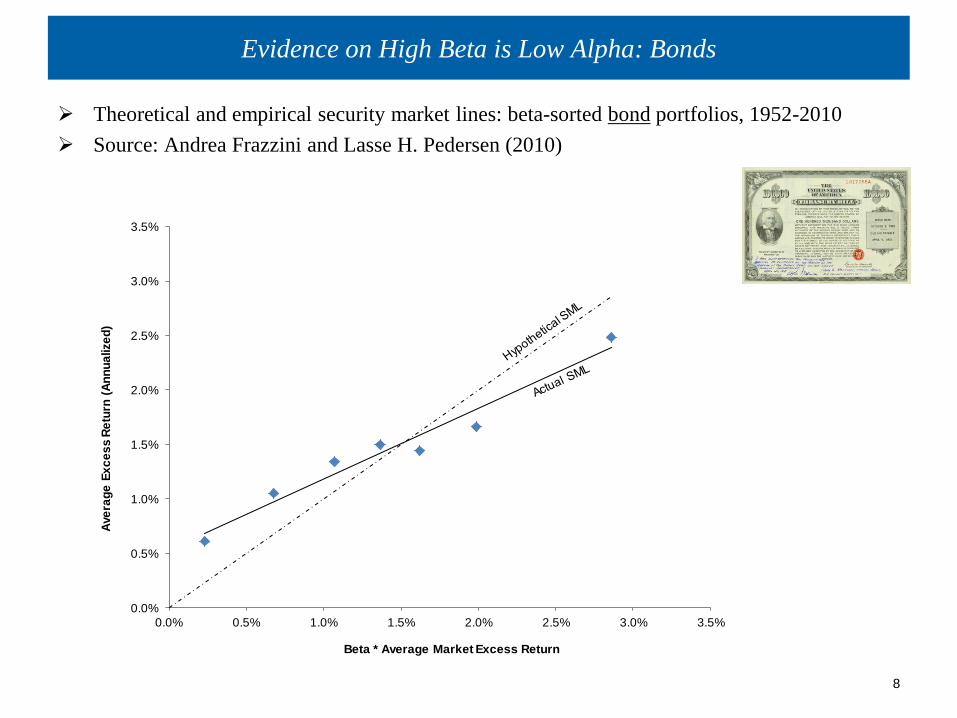
Evidence on High Beta is Low Alpha: Bonds
Theoretical and empirical security market lines: beta-sorted bond portfolios, 1952-2010
Source: Andrea Frazzini and Lasse H. Pedersen (2010)
8
0.0%
0.5%
1.0%
1.5%
2.0%
2.5%
3.0%
3.5%
0.0% 0.5% 1.0% 1.5% 2.0% 2.5% 3.0% 3.5%
Ave
rag
e E
xc
es
s R
etu
rn (
An
nu
alize
d)
Beta * Average Market Excess Return

Evidence on High Beta is Low Alpha: Across Asset Classes
9
Theoretical and empirical security market lines: Evidence across asset classes
Source: Cliff Asness, Andrea Frazzini, and Lasse H. Pedersen (2011)
“Leverage Aversion and Risk Parity”
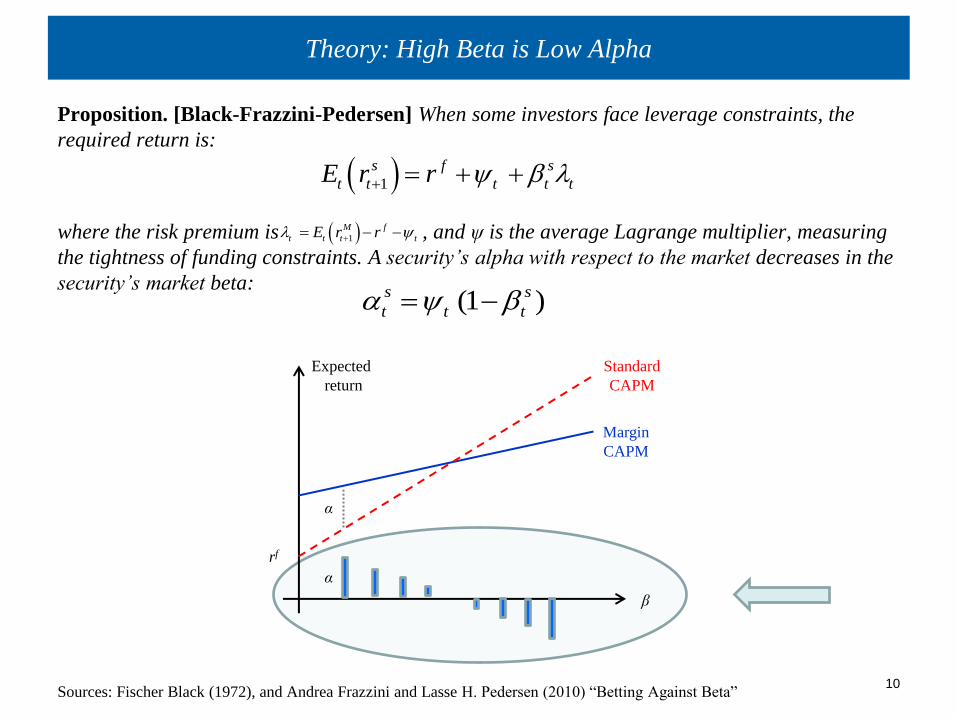
Theory: High Beta is Low Alpha
Proposition. [Black-Frazzini-Pedersen] When some investors face leverage constraints, the
required return is:
where the risk premium is , and ψ is the average Lagrange multiplier, measuring
the tightness of funding constraints. A security’s alpha with respect to the market decreases in the
security’s market beta:
Sources: Fischer Black (1972), and Andrea Frazzini and Lasse H. Pedersen (2010) “Betting Against Beta”
10
1
s f s
t t t t tE r r
1
M f
t t t tE r r
(1 )s s
t t t
Expected
return
β
Standard
CAPM
Margin
CAPM
rf
α
α

Evidence on High Beta is Low Alpha: All Asset Classes
Source: “Betting Against Beta,” Andrea Frazzini and Lasse Heje Pedersen (2010)
11
-0.40
-0.30
-0.20
-0.10
0.00
0.10
0.20
0.30
0.40
0.50
P1(low
beta)
P2 P3 P4 P5 P6 P7 P8 P9 P10(high
beta)
Alp
ha
US Stocks
-0.70
-0.60
-0.50
-0.40
-0.30
-0.20
-0.10
0.00
0.10
0.20
0.30
P1(low
beta)
P2 P3 P4 P5 P6 P7 P8 P9 P10(high
beta)
Alp
ha
International Stocks
-0.08
-0.06
-0.04
-0.02
0.00
0.02
0.04
1 to 12months
13 to24
25 to36
37 to48
49 to60
61 to120
> 120
Alp
ha
Treasury
-0.08
-0.06
-0.04
-0.02
0.00
0.02
0.04
0.06
1-3 years 3-5 year 5-10 years 7-10 years
Alp
ha
Credit Indices
-0.05
-0.04
-0.03
-0.02
-0.01
0.00
0.01
0.02
0.03
0.04
1-3 years 3-5 year 5-10 years 7-10 yearsA
lph
a
Credit - CDS
-1.20
-1.00
-0.80
-0.60
-0.40
-0.20
0.00
0.20
0.40
Alp
ha
Credit - Corporate
-0.05
0.00
0.05
0.10
0.15
0.20
0.25
0.30
0.35
Low beta High beta
Alp
ha
Equity Indices
-0.05
0.00
0.05
0.10
0.15
0.20
0.25
0.30
0.35
Low beta High beta
Alp
ha
Commodities
0.00
0.02
0.04
0.06
0.08
0.10
0.12
0.14
0.16
0.18
0.20
Low beta High beta
Alp
ha
FX
-0.01
-0.01
0.00
0.01
0.01
0.02
0.02
0.03
0.03
Low beta High beta
Alp
ha
Country Bonds

Theory: Betting Against Beta
Define a betting against beta portfolio as:
Proposition. [Frazzini and Pedersen, Prop. 2] The expected return of a betting against beta
portfolio is positive:
12
1 1 1
1 1BAB L f H f
t t tL H
t t
r r r r r
1 0H L
BAB t tt t tL H
t t
E r
Expected
return
β
Long
Short
rf
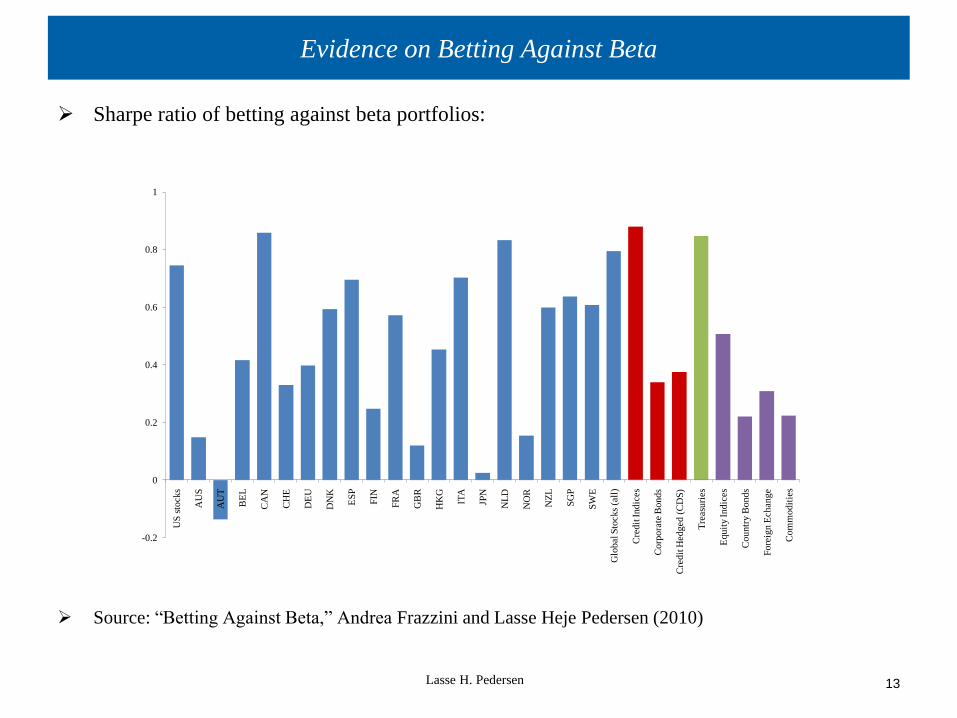
Evidence on Betting Against Beta
Lasse H. Pedersen
13
-0.2
0
0.2
0.4
0.6
0.8
1
US
sto
cks
AU
S
AU
T
BE
L
CA
N
CH
E
DE
U
DN
K
ES
P
FIN
FR
A
GB
R
HK
G
ITA
JPN
NL
D
NO
R
NZ
L
SG
P
SW
E
Glo
bal S
tocks
(all
)
Cre
dit
Ind
ices
Corp
ora
te B
onds
Cre
dit
Hedged (
CD
S)
Tre
asu
ries
Equit
y Indic
es
Cou
ntr
y B
on
ds
Fore
ign E
change
Com
modit
ies
Sharpe ratio of betting against beta portfolios:
Source: “Betting Against Beta,” Andrea Frazzini and Lasse Heje Pedersen (2010)

Returns to Betting Against Beta Vary over Time
Proposition. [Frazzini and Pedersen, Prop. 2(ii).] Tighter portfolio constraints lead to
contemporaneous loss for the BAB factor
Evidence:
– 3-year annualized return of the BAB factor for US stocks (left scale) and
– 3-year rolling average of the negative of the TED spread (right scale)
Lasse H. Pedersen
14 -1.20%
-1.00%
-0.80%
-0.60%
-0.40%
-0.20%
0.00%
-30%
-20%
-10%
0%
10%
20%
30%
40%
50%
05/0
1/8
7
05
/01
/88
05
/01
/89
05/0
1/9
0
05
/01
/91
05
/01
/92
05
/01
/93
05/0
1/9
4
05
/01
/95
05
/01
/96
05/0
1/9
7
05
/01
/98
05
/01
/99
05/0
1/0
0
05
/01
/01
05
/01
/02
05/0
1/0
3
05/0
1/0
4
05
/01
/05
05
/01
/06
05/0
1/0
7
05
/01
/08
05
/01
/09
Min
us T
ed sp
read
BA
B r
etu
rn (
annuali
zed)
US Stocks BAB Return (3-year rolling average) minus Ted spread (3-year rolling average)
0BAB
t
k
t
r
m
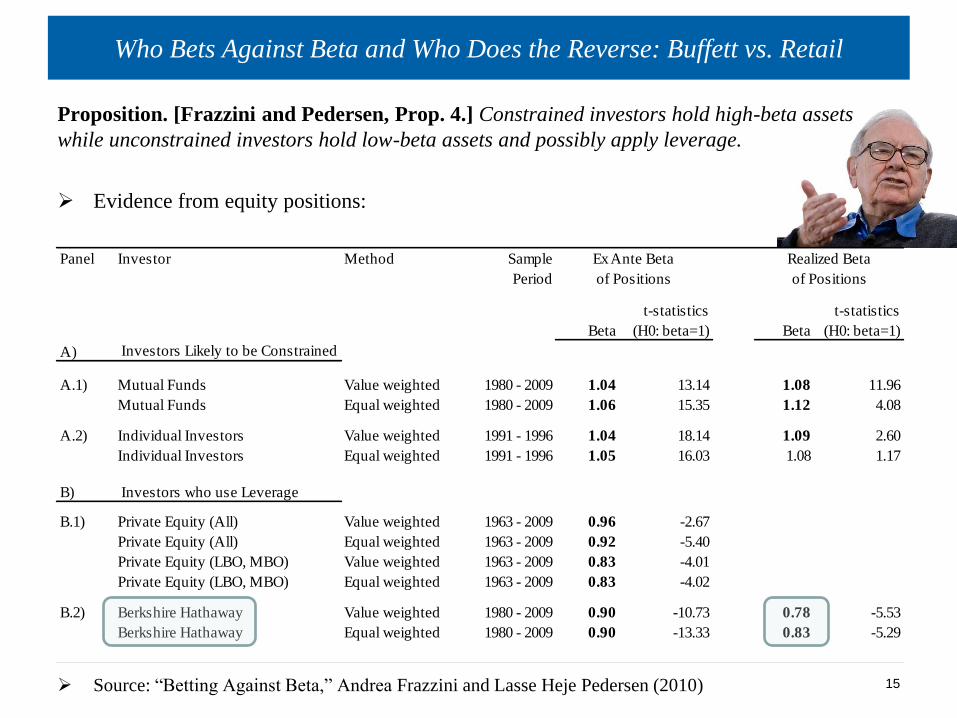
Who Bets Against Beta and Who Does the Reverse: Buffett vs. Retail
Proposition. [Frazzini and Pedersen, Prop. 4.] Constrained investors hold high-beta assets
while unconstrained investors hold low-beta assets and possibly apply leverage.
Evidence from equity positions:
Source: “Betting Against Beta,” Andrea Frazzini and Lasse Heje Pedersen (2010)
15
Panel Investor Method
Beta
t-statistics
(H0: beta=1) Beta
t-statistics
(H0: beta=1)
A) Investors Likely to be Constrained
A.1) Mutual Funds Value weighted 1980 - 2009 1.04 13.14 1.08 11.96
Mutual Funds Equal weighted 1980 - 2009 1.06 15.35 1.12 4.08
A.2) Individual Investors Value weighted 1991 - 1996 1.04 18.14 1.09 2.60
Individual Investors Equal weighted 1991 - 1996 1.05 16.03 1.08 1.17
B) Investors who use Leverage
B.1) Private Equity (All) Value weighted 1963 - 2009 0.96 -2.67
Private Equity (All) Equal weighted 1963 - 2009 0.92 -5.40
Private Equity (LBO, MBO) Value weighted 1963 - 2009 0.83 -4.01
Private Equity (LBO, MBO) Equal weighted 1963 - 2009 0.83 -4.02
B.2) Berkshire Hathaway Value weighted 1980 - 2009 0.90 -10.73 0.78 -5.53
Berkshire Hathaway Equal weighted 1980 - 2009 0.90 -13.33 0.83 -5.29
Sample
Period
Ex Ante Beta
of Positions
Realized Beta
of Positions

Conclusion: Implications for Investors
Low beta = high alpha: Investors can exploit this to get a higher Sharpe ratio
– Without leverage if the return target is modest
– With high expected return if they are willing to use leverage
– But remember that leverage requires dynamic trading and may have other risks
Implications for asset allocation:
• Overweight safer asset classes
• Consider a risk-parity approach:
• Diversify by risk: Allocate capital to equalize risk contribution across asset classes
Implications for equity investment:
• Defensive equity:
• Overweight low-beta stocks
• Overweight quality stocks
• Betting against beta:
• Long low-beta stocks, short high-beta stocks
Lasse H. Pedersen