Embed Size (px)
Citation preview

BP Team – Betting Report
Betting-previews.com – Your number one betting source
2016 - 2018 | By: BP Team
Table of Contents INTRODUCTION – Betting-Previews ....................................................................................................... 1
Odds Recording & Proofing .................................................................................................................... 2
Proofing & Verification ....................................................................................................................... 2
SBC and Tipstrr profiles .................................................................................................................. 2
Odds availability & Odds recording ............................................................................................... 2
SOCCER - EU ........................................................................................................................................ 3
Year 2016 ........................................................................................................................................ 4
Year 2017 ........................................................................................................................................ 5
Year 2018 ........................................................................................................................................ 6
SOCCER; NON-EU ................................................................................................................................ 7
Year 2016 ........................................................................................................................................ 8
Year 2017 ........................................................................................................................................ 9
Year 2018 ...................................................................................................................................... 11
USA SPORTS (NFL, NBA, NCAAF, NCAAB, WNBA) ............................................................................ 12
Year 2016 ...................................................................................................................................... 14
Year 2017 ...................................................................................................................................... 15
Year 2018 ...................................................................................................................................... 16
2018 Season .................................................................................................................................. 17
GOLF .................................................................................................................................................. 17
Year 2017 ...................................................................................................................................... 19
Year 2018 ...................................................................................................................................... 20
TENNIS ............................................................................................................................................... 22
Year 2017 ...................................................................................................................................... 24
Year 2018 ...................................................................................................................................... 24
CYCLING ............................................................................................................................................. 26
HORSE RACING .................................................................................................................................. 28
Year 2017 ...................................................................................................................................... 29
Year 2018 ...................................................................................................................................... 30
eSports - CS: GO ................................................................................................................................ 31
BASKETBALL – EUROBASKET ............................................................................................................ 33
WORLD CUP 2018 ............................................................................................................................. 33
SNOOKER ........................................................................................................................................... 34
RECOMMENDED BOOKMAKERS....................................................................................................... 35
Contact .............................................................................................................................................. 35
1
INTRODUCTION – Betting-Previews
Betting-Previews (previously known as Betting Monsters) is a betting-oriented website established in
2015 by a team of betting industry experts, professional betting tipsters and former bookmakers.
The vision behind this newly formed company was to provide only the best services to our fellow
bettors and even those who have just entered the world of professional betting.
Our services include everything from betting tips to providing customer’s websites with betting
articles and guides (such as "how to bet on...") which can help those who are new in the betting
world, and to some extent even the veterans in this industry.
We pride ourselves on providing only the best services and betting predictions from a wide range of
different sports but keeping our focus on sports that are considered the most popular in the betting
industry. From time to time we also cover the less popular sports and miscellaneous events, but we
only do so if we find it suitable for our way of betting.
Our main goal is not only providing positive results at the end of the season but keeping our
customers satisfied. That is why we provide uniquely written previews for most of our predictions.
The mentioned previews of matches/events consist of crucial data regarding the match/even itself as
well as our thoughts about it, and final conclusion which states the reasoning behind our decision on
the prediction.
In addition to that, we have decided to send out monthly betting reports. Those include all the bets,
advised odds and final results along with a short review and some words about future events we plan
to bet on. We do so as we believe keeping track of your bets is one of the crucial aspects of
approaching betting the right and profitable way.
In this betting report we will be analysing our results, categorised by different sports and leagues.
The report will include everything from number of predictions sent for each sport, as well as the
results of those events, with profits, win rates and ROI by year and month.
2
Odds Recording & Proofing
Proofing & Verification All tips from 2016 onwards were proofed by SmartBettingClub (formerly known as
SecretBettingClub). We also have a couple of verification profiles on Tipstrr platform, for sports such
as NFL, NCAAF, NBA, NCAAB and WTA tennis.
SBC and Tipstrr profiles The Smart Betting Club is an independent and honest, established reviewer and assessor of tipster
services, systems and strategies. They are well known in the betting industry as they are on the scene
for more than 10 years. Their proofing profiles are not publicly available, but you can check their
website here: smartbettingclub.com
Tipstrr is a betting platform available for sports bettors and tipsters looking to track and improve
their sports betting. Their website is easy to use and although they have some problems with getting
the latest odds, we feel like they are still better than their competition as they offer multiple
accounts functionality for different sports. We currently have three different profiles (we also plan to
open another one for Golf, but currently they don’t have any odds for golf event) on their platform;
American Football: tipstrr.com/tipster/american-football
USA Basketball: tipstrr.com/tipster/usa-basketball
WTA Tennis: tipstrr.com/tipster/wta-tips
Odds availability & Odds recording Odds for major sport leagues like Premier League, NBA, NFL… are easy to catch and if you take into
consideration that we record odds only from Pinnacle, Matchbook, SBOBET, 5Dimes (only for USA
sports) and Dafabet/12bet, you can easily get better odds if you have access to a betting broker like
Asianconnect88 or Sportmarket.
Horse Racing and Golf, selections are sent with odds from soft bookies (5Dimes and Bet365), as well
as betting exchanges (Betfair and Matchbook). From our experience, those odds are usually not too
hard to catch, thus you will be able to get great odds each time. If you have access to other soft
books, you will be able to bet on much better odds, thus achieving better profits. For the eSports, we
currently only cover LAN tournaments for Counter Strike: Global Offensive. We use a different
subdomain and we have a limited number of user available to purchase subscription for the service,
so if you can use bookmakers like Pinnacle, SBOBET, Dafabet and for some betting markets Bet365,
you will have no problems getting the advised odds.
As mentioned previously, we use odds from Pinnacle, SBOBET, Dafabet, Matchbook, Betfair and
Bet365 (only for Horse racing and golf). If you have access to a betting broker or a lot of accounts
with soft books, you will have no problems getting better odds than advised and thus achieving
better profits.
3
SOCCER - EU
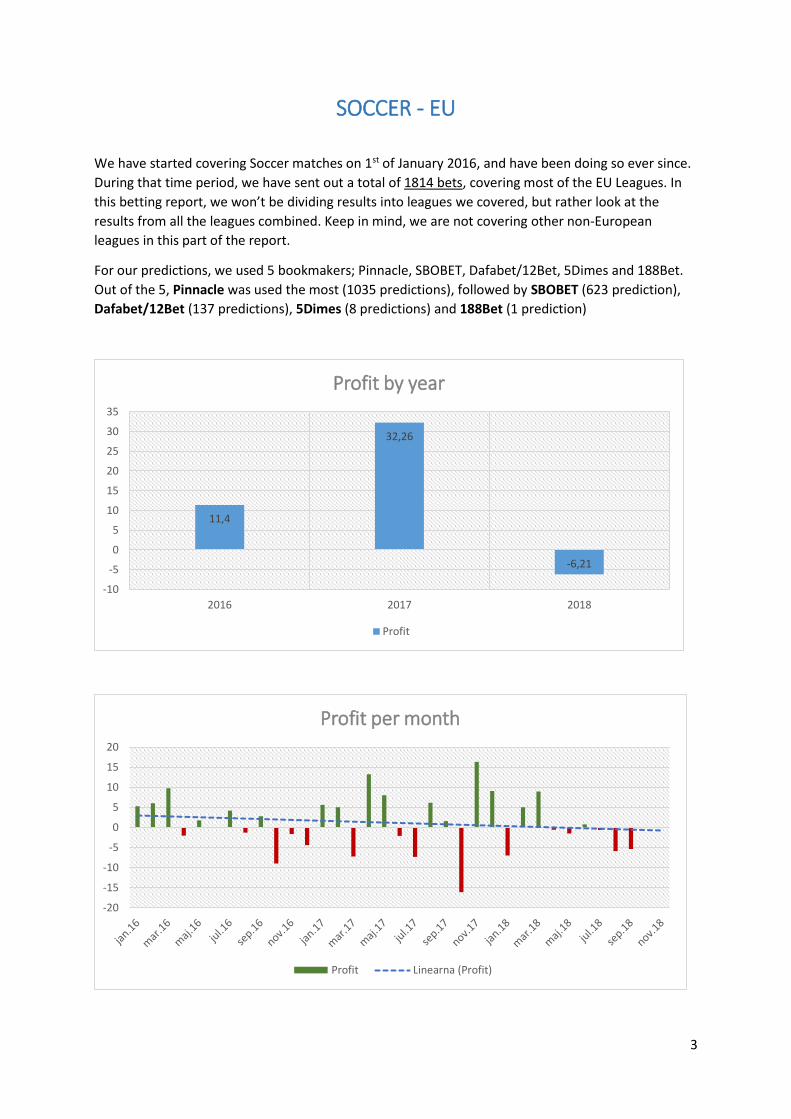
We have started covering Soccer matches on 1st of January 2016, and have been doing so ever since.
During that time period, we have sent out a total of 1814 bets, covering most of the EU Leagues. In
this betting report, we won’t be dividing results into leagues we covered, but rather look at the
results from all the leagues combined. Keep in mind, we are not covering other non-European
leagues in this part of the report.
For our predictions, we used 5 bookmakers; Pinnacle, SBOBET, Dafabet/12Bet, 5Dimes and 188Bet.
Out of the 5, Pinnacle was used the most (1035 predictions), followed by SBOBET (623 prediction),
Dafabet/12Bet (137 predictions), 5Dimes (8 predictions) and 188Bet (1 prediction)
11,4
32,26
-6,21
-10
-5
0
5
10
15
20
25
30
35
2016 2017 2018
Profit by year
Profit
-20
-15
-10
-5
0
5
10
15
20
Profit per month
Profit Linearna (Profit)
4
As of now, November 2017 was the most profitable month, with 16,29 units of profit. The 2nd most
profitable month was April 2017 with 13.26 units of profit. December 17, February 16, March 18 and
16 all ended with about 9 units of profit. As for other months the profit was lower than 9 units.
On the other hand, October 2017 was by far the least profitable month, with 16.09 units in red.
October 2016 was the 2nd worst month so far with 8.99 units lost. March 2017 and July 2017 both
ended with about 7.3 units in red.
In total, combining all the predictions up until now, our predictions ended with:
50.9% win rate, 37.45 units of profit and 1.9 % ROI.
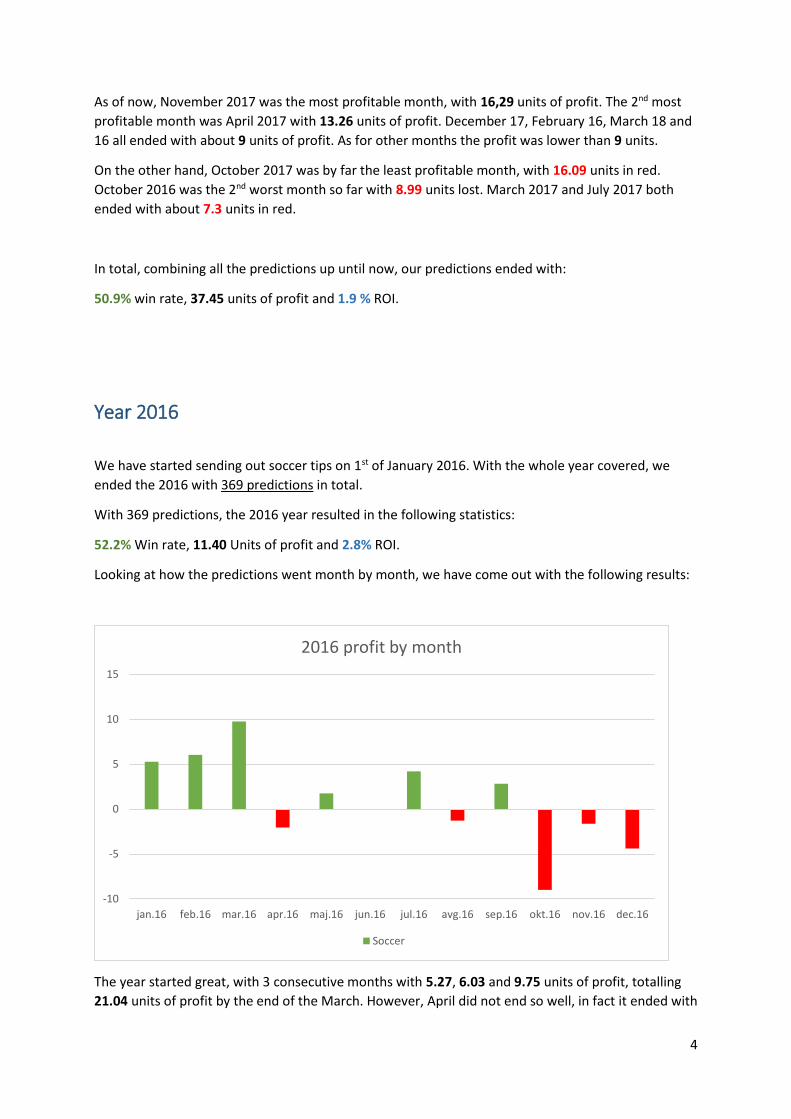
Year 2016
We have started sending out soccer tips on 1st of January 2016. With the whole year covered, we
ended the 2016 with 369 predictions in total.
With 369 predictions, the 2016 year resulted in the following statistics:
52.2% Win rate, 11.40 Units of profit and 2.8% ROI.
Looking at how the predictions went month by month, we have come out with the following results:
The year started great, with 3 consecutive months with 5.27, 6.03 and 9.75 units of profit, totalling
21.04 units of profit by the end of the March. However, April did not end so well, in fact it ended with
-10
-5
0
5
10
15
jan.16 feb.16 mar.16 apr.16 maj.16 jun.16 jul.16 avg.16 sep.16 okt.16 nov.16 dec.16
2016 profit by month
Soccer
5
2.05 units lost. May saw a small profit of 1.75 units, which almost compensated for poor
performance in April. June ended with a 0.07 in red, which was not as bad, but we were hoping to
continue with a profitable run. July was the 4th most profitable month of 2016, with 4.2 units.
Last 4 months ended badly (with exception of September, which ended with 2.82 units of profit), as
they combined -16.30 units lost. Despite the poor run in the last couple of months we still ended
2016 with a reasonable profit of 11.4 units.
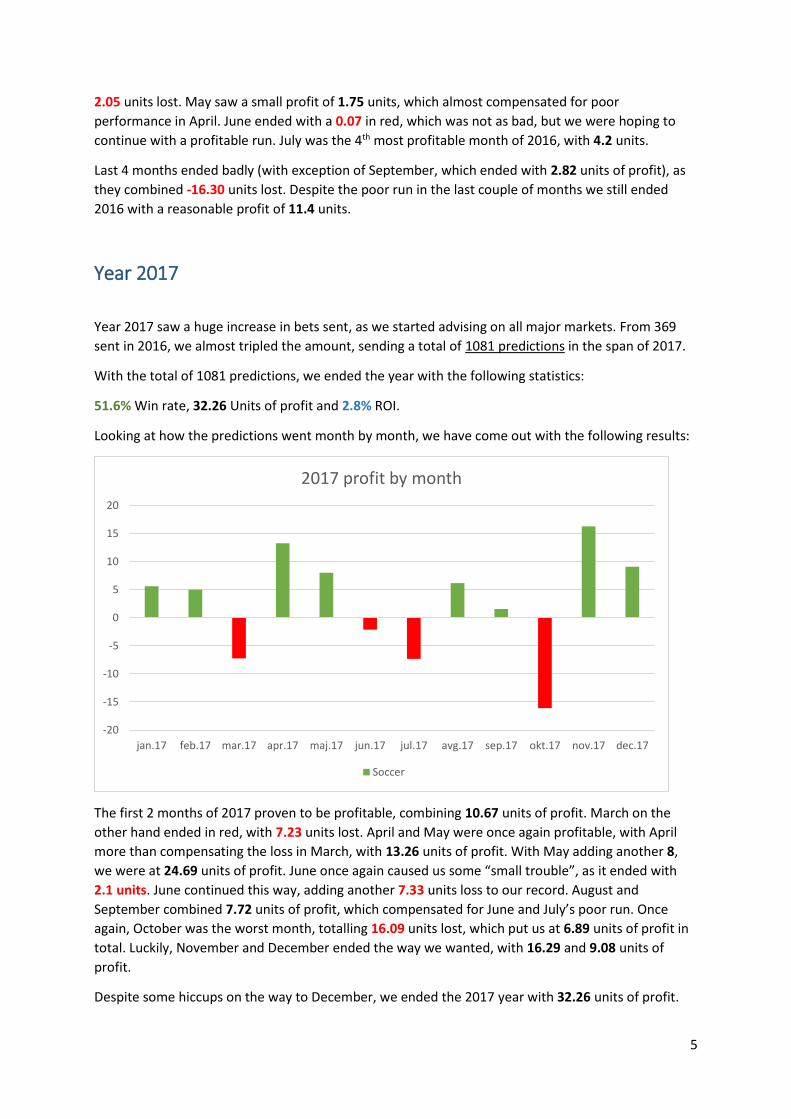
Year 2017
Year 2017 saw a huge increase in bets sent, as we started advising on all major markets. From 369
sent in 2016, we almost tripled the amount, sending a total of 1081 predictions in the span of 2017.
With the total of 1081 predictions, we ended the year with the following statistics:
51.6% Win rate, 32.26 Units of profit and 2.8% ROI.
Looking at how the predictions went month by month, we have come out with the following results:
The first 2 months of 2017 proven to be profitable, combining 10.67 units of profit. March on the
other hand ended in red, with 7.23 units lost. April and May were once again profitable, with April
more than compensating the loss in March, with 13.26 units of profit. With May adding another 8,
we were at 24.69 units of profit. June once again caused us some “small trouble”, as it ended with 2.1 units. June continued this way, adding another 7.33 units loss to our record. August and
September combined 7.72 units of profit, which compensated for June and July’s poor run. Once again, October was the worst month, totalling 16.09 units lost, which put us at 6.89 units of profit in
total. Luckily, November and December ended the way we wanted, with 16.29 and 9.08 units of
profit.
Despite some hiccups on the way to December, we ended the 2017 year with 32.26 units of profit.
-20
-15
-10
-5
0
5
10
15
20
jan.17 feb.17 mar.17 apr.17 maj.17 jun.17 jul.17 avg.17 sep.17 okt.17 nov.17 dec.17
2017 profit by month
Soccer
6
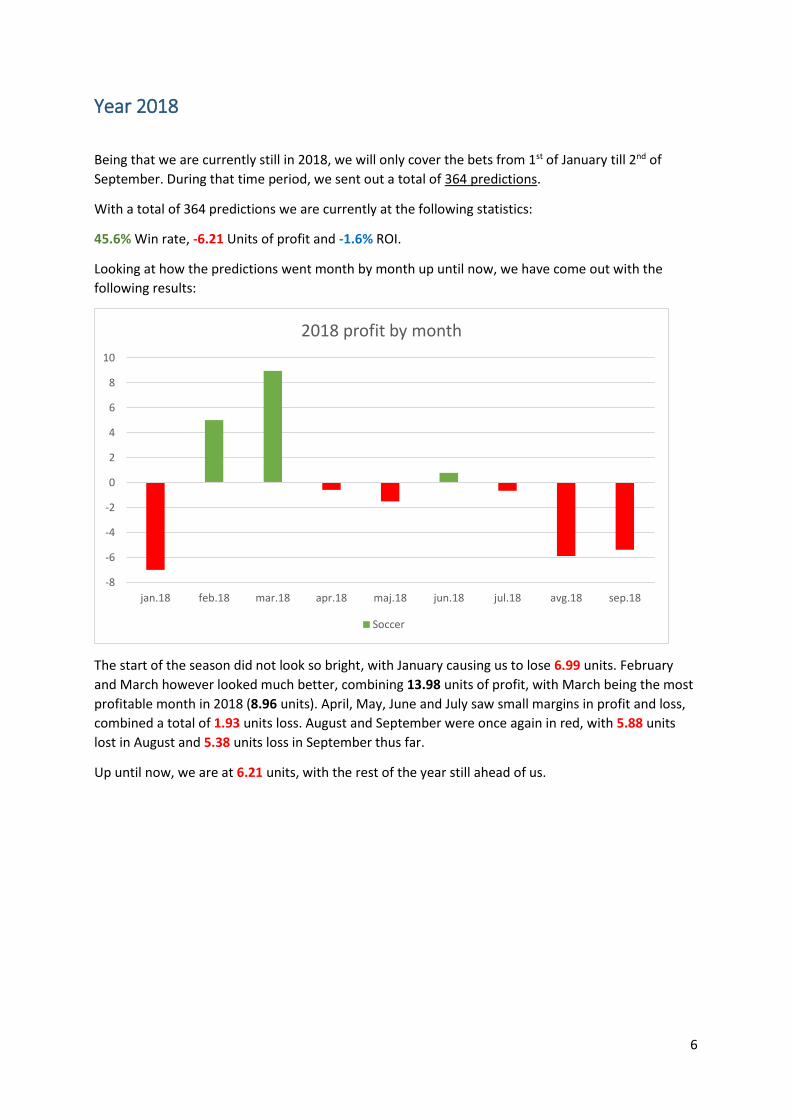
Year 2018
Being that we are currently still in 2018, we will only cover the bets from 1st of January till 2nd of
September. During that time period, we sent out a total of 364 predictions.
With a total of 364 predictions we are currently at the following statistics:
45.6% Win rate, -6.21 Units of profit and -1.6% ROI.
Looking at how the predictions went month by month up until now, we have come out with the
following results:
The start of the season did not look so bright, with January causing us to lose 6.99 units. February
and March however looked much better, combining 13.98 units of profit, with March being the most
profitable month in 2018 (8.96 units). April, May, June and July saw small margins in profit and loss,
combined a total of 1.93 units loss. August and September were once again in red, with 5.88 units
lost in August and 5.38 units loss in September thus far.
Up until now, we are at 6.21 units, with the rest of the year still ahead of us.
-8
-6
-4
-2
0
2
4
6
8
10
jan.18 feb.18 mar.18 apr.18 maj.18 jun.18 jul.18 avg.18 sep.18
2018 profit by month
Soccer
7
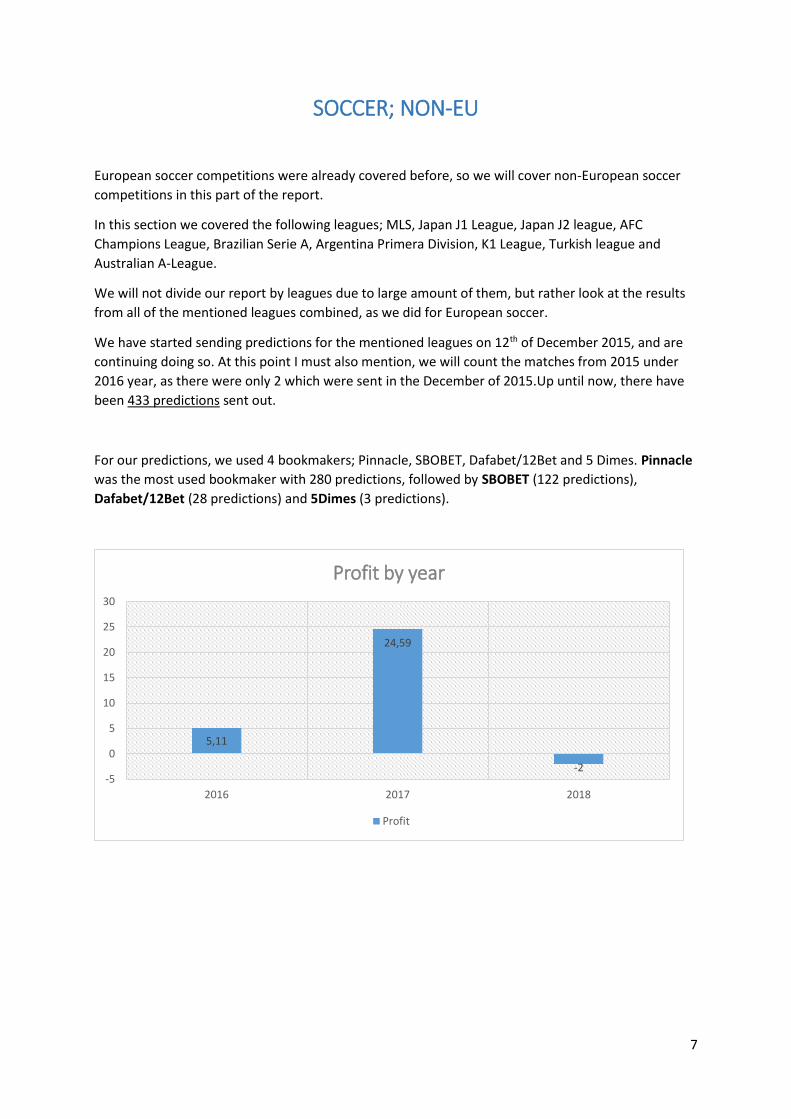
SOCCER; NON-EU
European soccer competitions were already covered before, so we will cover non-European soccer
competitions in this part of the report.
In this section we covered the following leagues; MLS, Japan J1 League, Japan J2 league, AFC
Champions League, Brazilian Serie A, Argentina Primera Division, K1 League, Turkish league and
Australian A-League.
We will not divide our report by leagues due to large amount of them, but rather look at the results
from all of the mentioned leagues combined, as we did for European soccer.
We have started sending predictions for the mentioned leagues on 12th of December 2015, and are
continuing doing so. At this point I must also mention, we will count the matches from 2015 under
2016 year, as there were only 2 which were sent in the December of 2015.Up until now, there have
been 433 predictions sent out.
For our predictions, we used 4 bookmakers; Pinnacle, SBOBET, Dafabet/12Bet and 5 Dimes. Pinnacle
was the most used bookmaker with 280 predictions, followed by SBOBET (122 predictions),
Dafabet/12Bet (28 predictions) and 5Dimes (3 predictions).
5,11
24,59
-2-5
0
5
10
15
20
25
30
2016 2017 2018
Profit by year
Profit
8
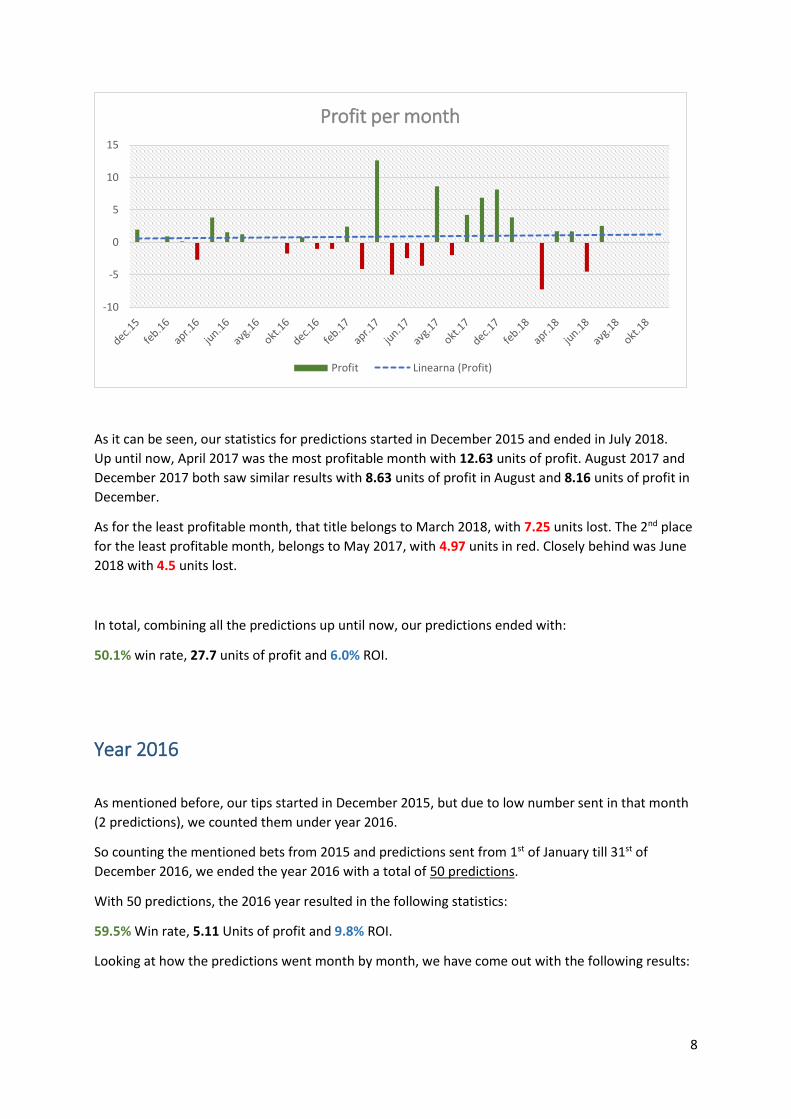
As it can be seen, our statistics for predictions started in December 2015 and ended in July 2018.
Up until now, April 2017 was the most profitable month with 12.63 units of profit. August 2017 and
December 2017 both saw similar results with 8.63 units of profit in August and 8.16 units of profit in
December.
As for the least profitable month, that title belongs to March 2018, with 7.25 units lost. The 2nd place
for the least profitable month, belongs to May 2017, with 4.97 units in red. Closely behind was June
2018 with 4.5 units lost.
In total, combining all the predictions up until now, our predictions ended with:
50.1% win rate, 27.7 units of profit and 6.0% ROI.
Year 2016
As mentioned before, our tips started in December 2015, but due to low number sent in that month
(2 predictions), we counted them under year 2016.
So counting the mentioned bets from 2015 and predictions sent from 1st of January till 31st of
December 2016, we ended the year 2016 with a total of 50 predictions.
With 50 predictions, the 2016 year resulted in the following statistics:
59.5% Win rate, 5.11 Units of profit and 9.8% ROI.
Looking at how the predictions went month by month, we have come out with the following results:
-10
-5
0
5
10
15
Profit per month
Profit Linearna (Profit)
9
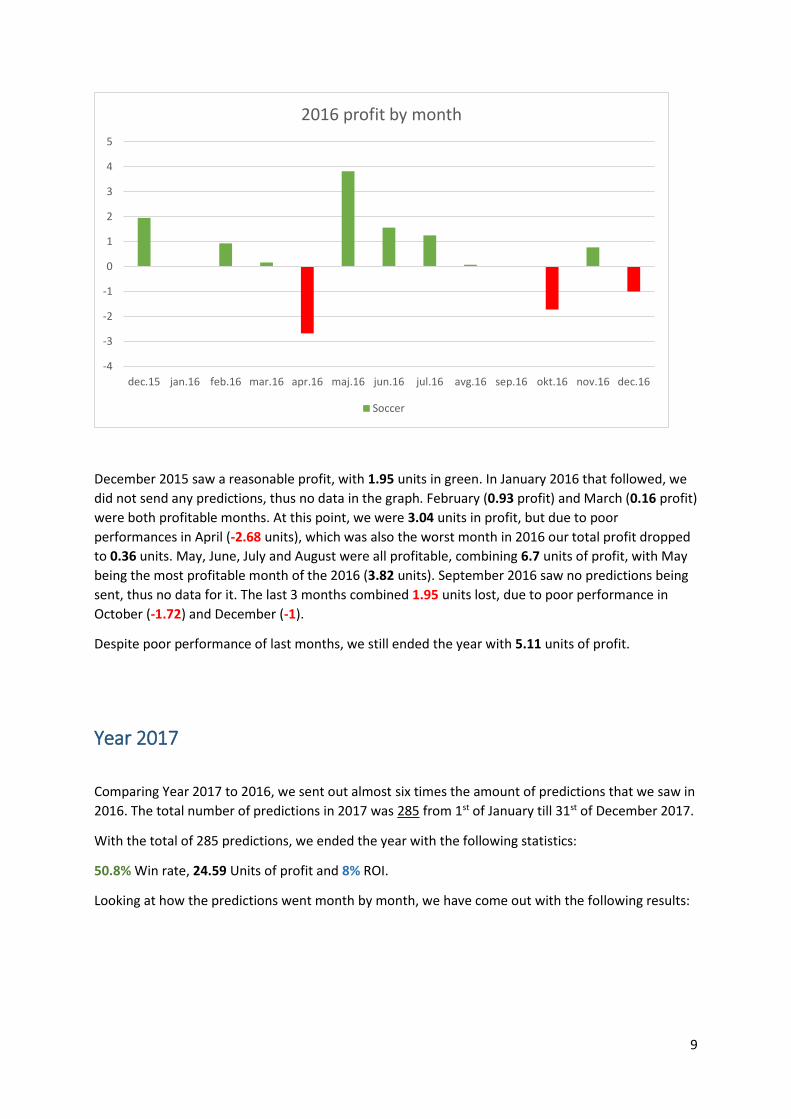
December 2015 saw a reasonable profit, with 1.95 units in green. In January 2016 that followed, we
did not send any predictions, thus no data in the graph. February (0.93 profit) and March (0.16 profit)
were both profitable months. At this point, we were 3.04 units in profit, but due to poor
performances in April (-2.68 units), which was also the worst month in 2016 our total profit dropped
to 0.36 units. May, June, July and August were all profitable, combining 6.7 units of profit, with May
being the most profitable month of the 2016 (3.82 units). September 2016 saw no predictions being
sent, thus no data for it. The last 3 months combined 1.95 units lost, due to poor performance in
October (-1.72) and December (-1).
Despite poor performance of last months, we still ended the year with 5.11 units of profit.
Year 2017
Comparing Year 2017 to 2016, we sent out almost six times the amount of predictions that we saw in
2016. The total number of predictions in 2017 was 285 from 1st of January till 31st of December 2017.
With the total of 285 predictions, we ended the year with the following statistics:
50.8% Win rate, 24.59 Units of profit and 8% ROI.
Looking at how the predictions went month by month, we have come out with the following results:
-4
-3
-2
-1
0
1
2
3
4
5
dec.15 jan.16 feb.16 mar.16 apr.16 maj.16 jun.16 jul.16 avg.16 sep.16 okt.16 nov.16 dec.16
2016 profit by month
Soccer
10
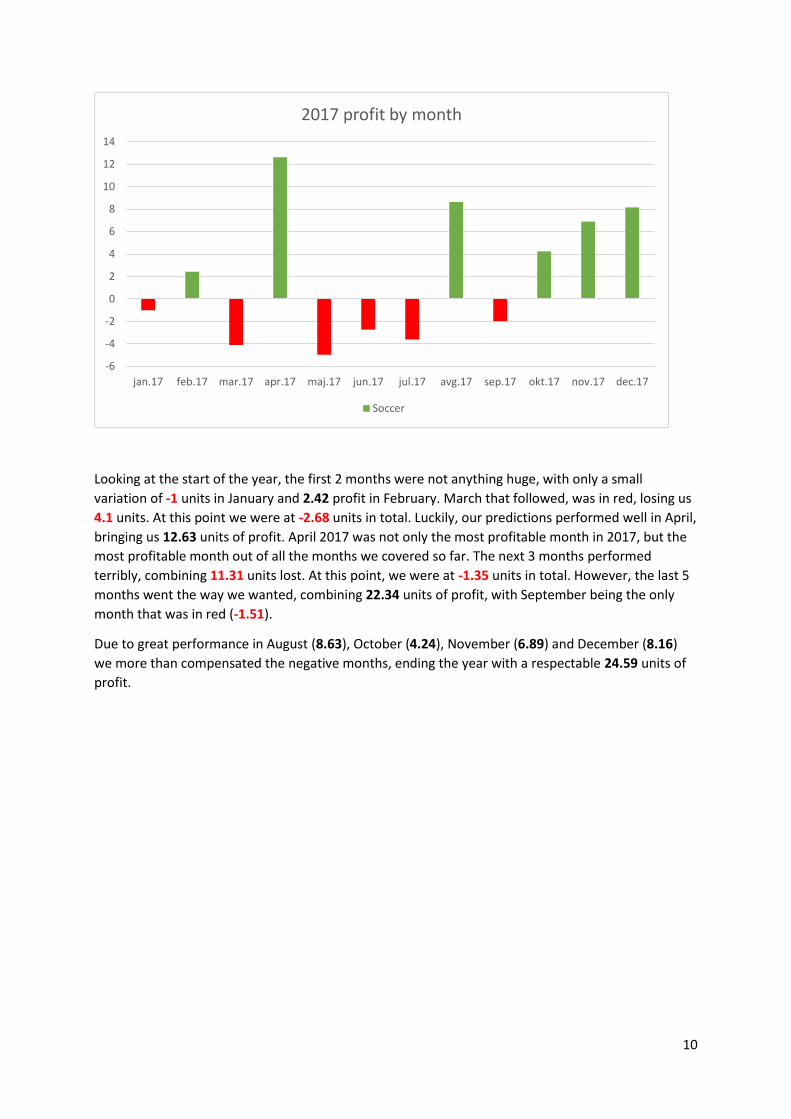
Looking at the start of the year, the first 2 months were not anything huge, with only a small
variation of -1 units in January and 2.42 profit in February. March that followed, was in red, losing us
4.1 units. At this point we were at -2.68 units in total. Luckily, our predictions performed well in April,
bringing us 12.63 units of profit. April 2017 was not only the most profitable month in 2017, but the
most profitable month out of all the months we covered so far. The next 3 months performed
terribly, combining 11.31 units lost. At this point, we were at -1.35 units in total. However, the last 5
months went the way we wanted, combining 22.34 units of profit, with September being the only
month that was in red (-1.51).
Due to great performance in August (8.63), October (4.24), November (6.89) and December (8.16)
we more than compensated the negative months, ending the year with a respectable 24.59 units of
profit.
-6
-4
-2
0
2
4
6
8
10
12
14
jan.17 feb.17 mar.17 apr.17 maj.17 jun.17 jul.17 avg.17 sep.17 okt.17 nov.17 dec.17
2017 profit by month
Soccer
11
Year 2018
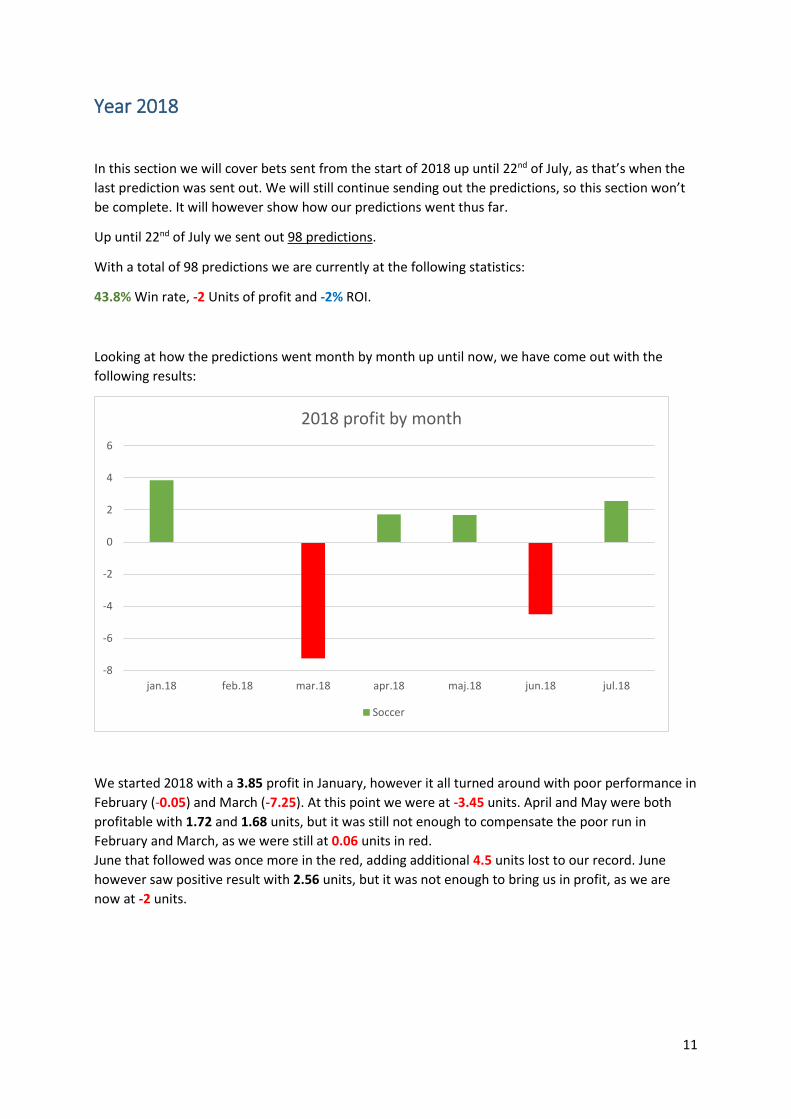
In this section we will cover bets sent from the start of 2018 up until 22nd of July, as that’s when the last prediction was sent out. We will still continue sending out the predictions, so this section won’t be complete. It will however show how our predictions went thus far.
Up until 22nd of July we sent out 98 predictions.
With a total of 98 predictions we are currently at the following statistics:
43.8% Win rate, -2 Units of profit and -2% ROI.
Looking at how the predictions went month by month up until now, we have come out with the
following results:
We started 2018 with a 3.85 profit in January, however it all turned around with poor performance in
February (-0.05) and March (-7.25). At this point we were at -3.45 units. April and May were both
profitable with 1.72 and 1.68 units, but it was still not enough to compensate the poor run in
February and March, as we were still at 0.06 units in red.
June that followed was once more in the red, adding additional 4.5 units lost to our record. June
however saw positive result with 2.56 units, but it was not enough to bring us in profit, as we are
now at -2 units.
-8
-6
-4
-2
0
2
4
6
jan.18 feb.18 mar.18 apr.18 maj.18 jun.18 jul.18
2018 profit by month
Soccer
12
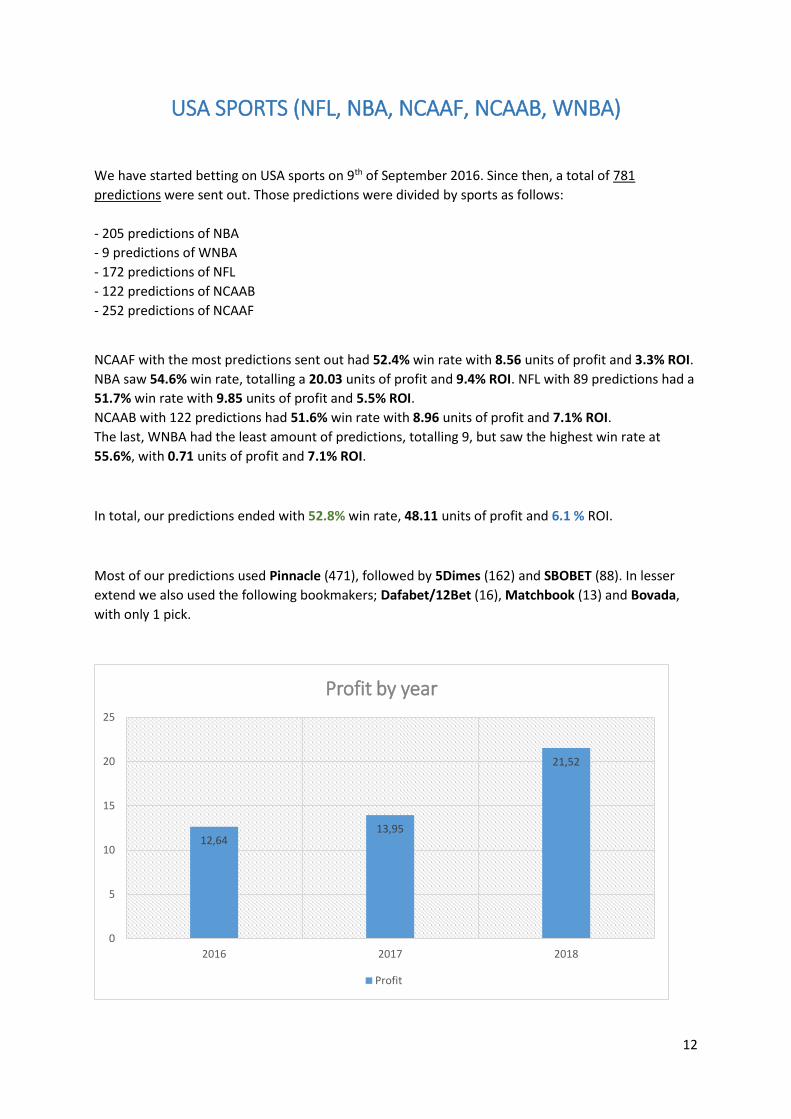
USA SPORTS (NFL, NBA, NCAAF, NCAAB, WNBA)
We have started betting on USA sports on 9th of September 2016. Since then, a total of 781
predictions were sent out. Those predictions were divided by sports as follows:
- 205 predictions of NBA
- 9 predictions of WNBA
- 172 predictions of NFL
- 122 predictions of NCAAB
- 252 predictions of NCAAF
NCAAF with the most predictions sent out had 52.4% win rate with 8.56 units of profit and 3.3% ROI.
NBA saw 54.6% win rate, totalling a 20.03 units of profit and 9.4% ROI. NFL with 89 predictions had a
51.7% win rate with 9.85 units of profit and 5.5% ROI.
NCAAB with 122 predictions had 51.6% win rate with 8.96 units of profit and 7.1% ROI.
The last, WNBA had the least amount of predictions, totalling 9, but saw the highest win rate at
55.6%, with 0.71 units of profit and 7.1% ROI.
In total, our predictions ended with 52.8% win rate, 48.11 units of profit and 6.1 % ROI.
Most of our predictions used Pinnacle (471), followed by 5Dimes (162) and SBOBET (88). In lesser
extend we also used the following bookmakers; Dafabet/12Bet (16), Matchbook (13) and Bovada,
with only 1 pick.
12,6413,95
21,52
0
5
10
15
20
25
2016 2017 2018
Profit by year
Profit
13
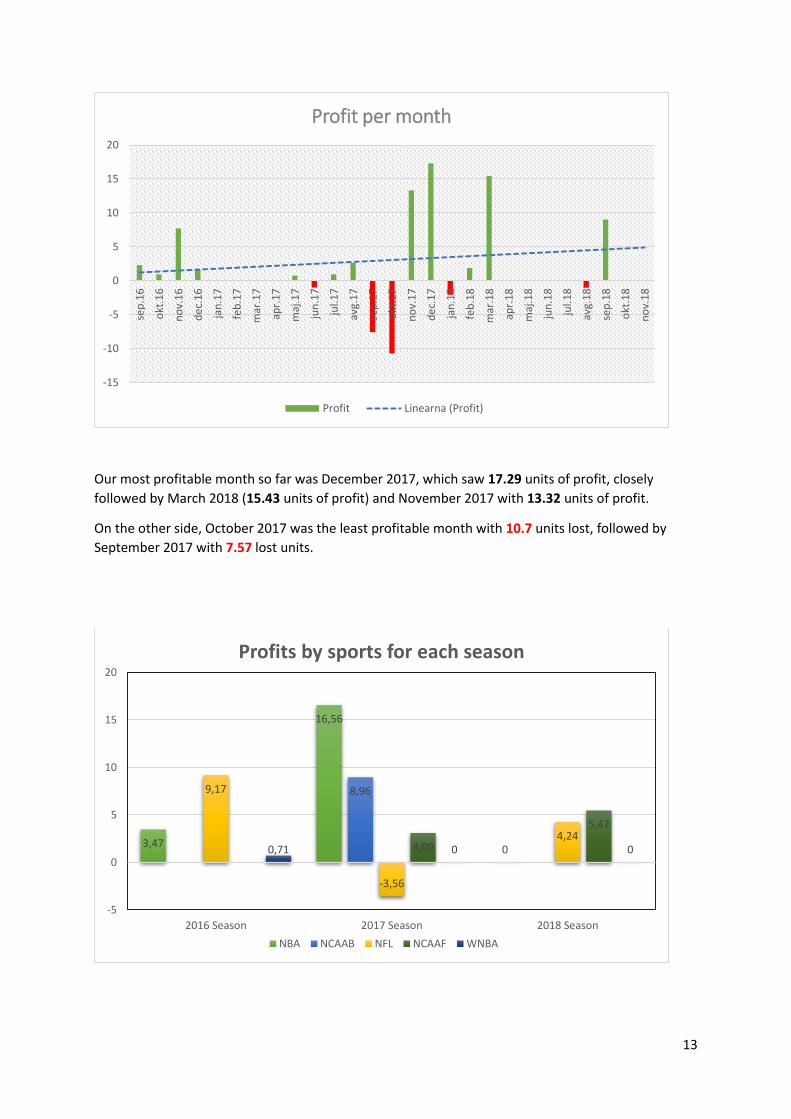
Our most profitable month so far was December 2017, which saw 17.29 units of profit, closely
followed by March 2018 (15.43 units of profit) and November 2017 with 13.32 units of profit.
On the other side, October 2017 was the least profitable month with 10.7 units lost, followed by
September 2017 with 7.57 lost units.
-15
-10
-5
0
5
10
15
20se
p.1
6
ok
t.1
6
no
v.1
6
de
c.1
6
jan
.17
feb
.17
ma
r.1
7
ap
r.1
7
ma
j.1
7
jun
.17
jul.
17
avg
.17
sep
.17
ok
t.1
7
no
v.1
7
de
c.1
7
jan
.18
feb
.18
ma
r.1
8
ap
r.1
8
ma
j.1
8
jun
.18
jul.
18
avg
.18
sep
.18
ok
t.1
8
no
v.1
8
Profit per month
Profit Linearna (Profit)
3,47
16,56
0
8,969,17
-3,56
4,243,09
5,47
0,71 0 0
-5
0
5
10
15
20
2016 Season 2017 Season 2018 Season
Profits by sports for each season
NBA NCAAB NFL NCAAF WNBA
14
Out of all the US sports we cover, NBA proven to be the most profitable; with 20.03 units of profit.
Thus far it also holds the highest profit per season out of all the sports, with 16.56 units in 2017/18
season. The 2nd most profitable sport is NFL with 9.85 units of profit thus far, with the most profitable
season being 2016/17 season (9.17 units). It is also the only sport that saw a negative result. We had
a 3.56 unit loss in 2017/18 season.
Year 2016
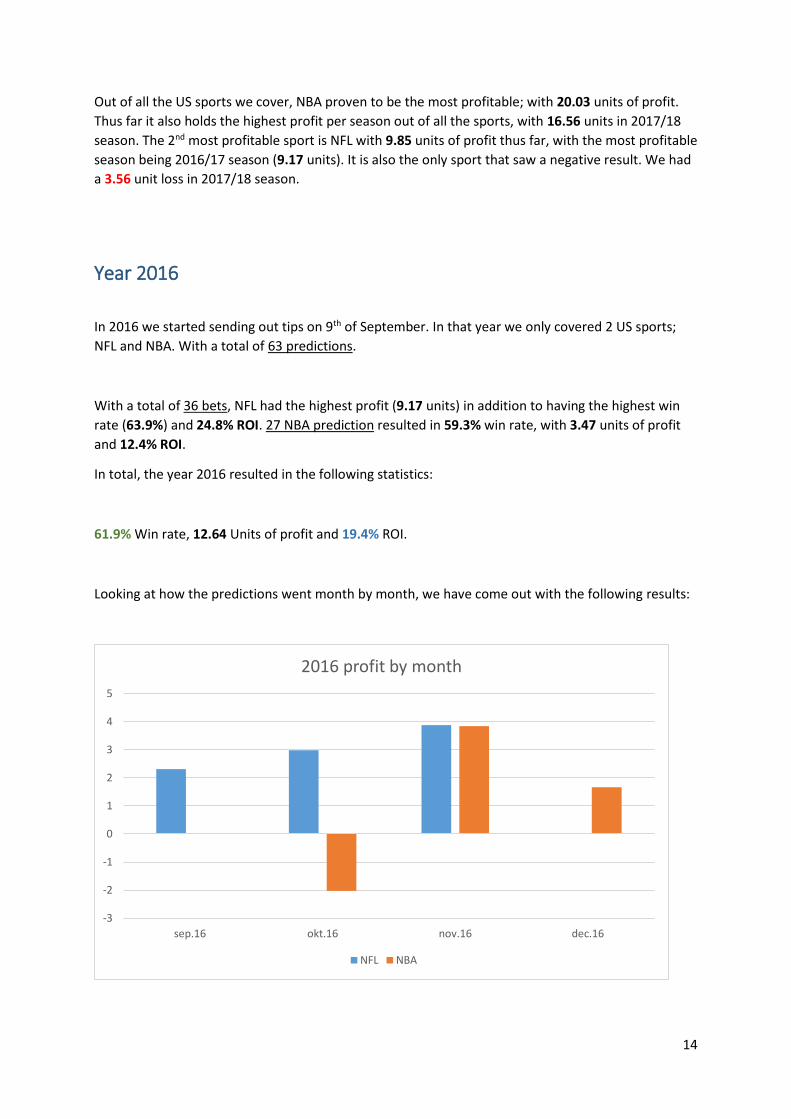
In 2016 we started sending out tips on 9th of September. In that year we only covered 2 US sports;
NFL and NBA. With a total of 63 predictions.
With a total of 36 bets, NFL had the highest profit (9.17 units) in addition to having the highest win
rate (63.9%) and 24.8% ROI. 27 NBA prediction resulted in 59.3% win rate, with 3.47 units of profit
and 12.4% ROI.
In total, the year 2016 resulted in the following statistics:
61.9% Win rate, 12.64 Units of profit and 19.4% ROI.
Looking at how the predictions went month by month, we have come out with the following results:
-3
-2
-1
0
1
2
3
4
5
sep.16 okt.16 nov.16 dec.16
2016 profit by month
NFL NBA
15
As it can be seen, November was by far the most profitable month, totalling 7.72 units of profit, with
both sports seeing close to 4 units of profit each. On the other side, October proven to be the worst
performing month, with only 0.95 units of profit.
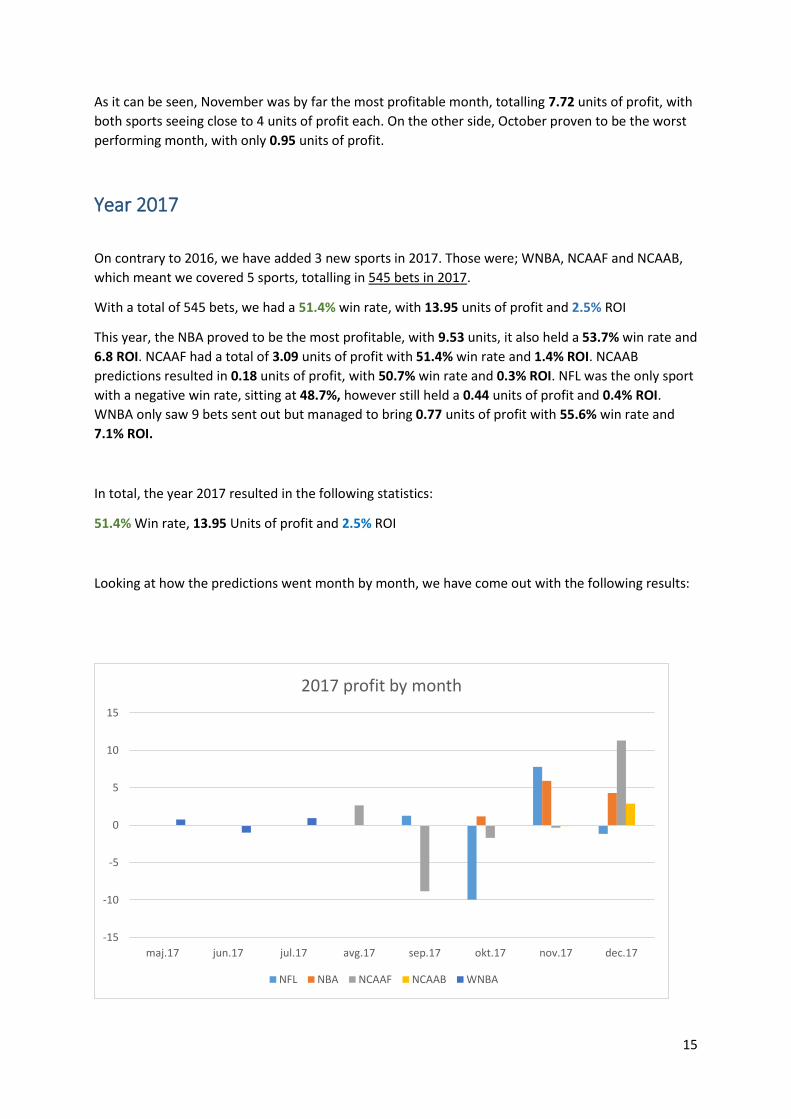
Year 2017
On contrary to 2016, we have added 3 new sports in 2017. Those were; WNBA, NCAAF and NCAAB,
which meant we covered 5 sports, totalling in 545 bets in 2017.
With a total of 545 bets, we had a 51.4% win rate, with 13.95 units of profit and 2.5% ROI
This year, the NBA proved to be the most profitable, with 9.53 units, it also held a 53.7% win rate and
6.8 ROI. NCAAF had a total of 3.09 units of profit with 51.4% win rate and 1.4% ROI. NCAAB
predictions resulted in 0.18 units of profit, with 50.7% win rate and 0.3% ROI. NFL was the only sport
with a negative win rate, sitting at 48.7%, however still held a 0.44 units of profit and 0.4% ROI.
WNBA only saw 9 bets sent out but managed to bring 0.77 units of profit with 55.6% win rate and
7.1% ROI.
In total, the year 2017 resulted in the following statistics:
51.4% Win rate, 13.95 Units of profit and 2.5% ROI
Looking at how the predictions went month by month, we have come out with the following results:
-15
-10
-5
0
5
10
15
maj.17 jun.17 jul.17 avg.17 sep.17 okt.17 nov.17 dec.17
2017 profit by month
NFL NBA NCAAF NCAAB WNBA
16
Keep in mind, US bets started from May 2017 and not January 2017.
From our graph, it can be seen December was the most profitable month, totalling 17.29 units of
profit. It was closely followed by November, which had 13.32 units of profit. Once again, October was
the least profitable month, losing 10.07 units, with September closely behind, resulting in 7.57 lost
units.
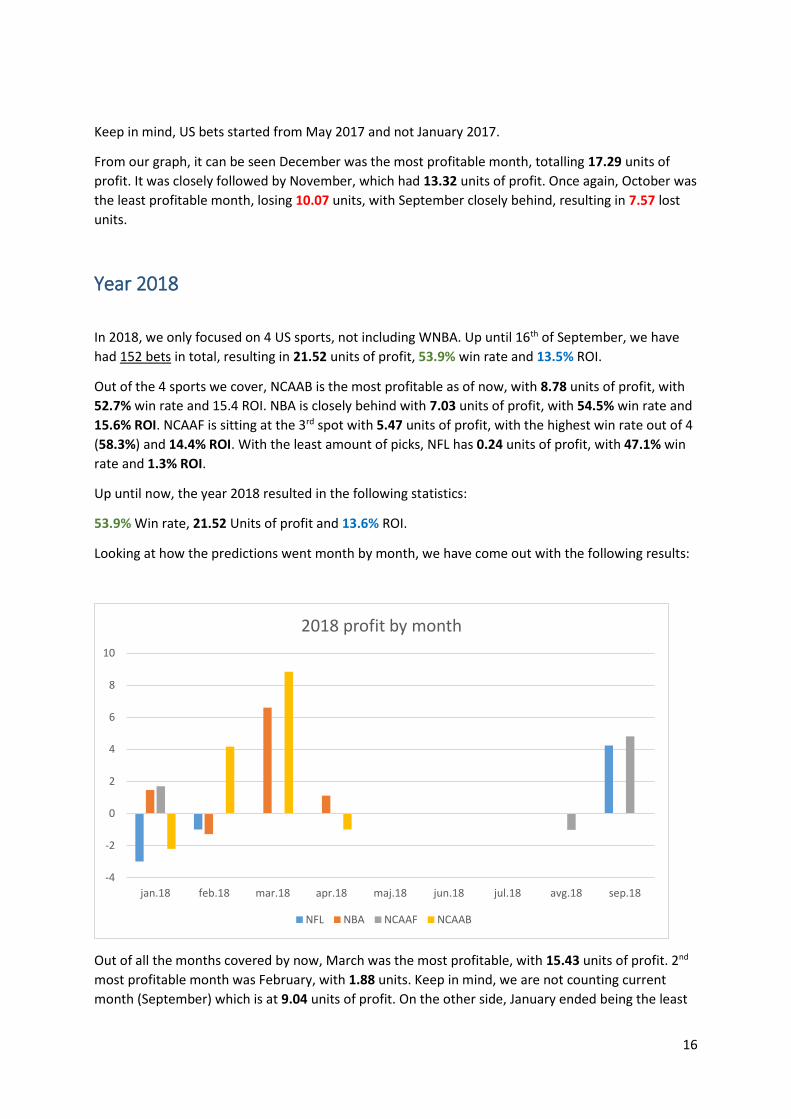
Year 2018
In 2018, we only focused on 4 US sports, not including WNBA. Up until 16th of September, we have
had 152 bets in total, resulting in 21.52 units of profit, 53.9% win rate and 13.5% ROI.
Out of the 4 sports we cover, NCAAB is the most profitable as of now, with 8.78 units of profit, with
52.7% win rate and 15.4 ROI. NBA is closely behind with 7.03 units of profit, with 54.5% win rate and
15.6% ROI. NCAAF is sitting at the 3rd spot with 5.47 units of profit, with the highest win rate out of 4
(58.3%) and 14.4% ROI. With the least amount of picks, NFL has 0.24 units of profit, with 47.1% win
rate and 1.3% ROI.
Up until now, the year 2018 resulted in the following statistics:
53.9% Win rate, 21.52 Units of profit and 13.6% ROI.
Looking at how the predictions went month by month, we have come out with the following results:
Out of all the months covered by now, March was the most profitable, with 15.43 units of profit. 2nd
most profitable month was February, with 1.88 units. Keep in mind, we are not counting current
month (September) which is at 9.04 units of profit. On the other side, January ended being the least
-4
-2
0
2
4
6
8
10
jan.18 feb.18 mar.18 apr.18 maj.18 jun.18 jul.18 avg.18 sep.18
2018 profit by month
NFL NBA NCAAF NCAAB
17
profitable month, with 2.05 units lost. The 2nd worst month profit wise, was April which saw only 0.11
units of profit.
As it can be seen, we did not cover any events in June and July, thus no data in the chart for the
mentioned months.
2018 Season
Being that we are currently in 2018 Season of betting on US sports, we will briefly mention the sports
we are covering as of now. Keep in mind 2018 season is not the same as year 2018 (which was
calculated from 1st of January to 16th of September), but it counts from 30th of August 2018 up until
16th of September.
In 2018 Season, we are currently only betting on NCAAF and NFL, as other sports have yet begun. Up
until now we are seeing the following results.
NFL with 13 picks saw 4.24 units of profit, with 61.5% win rate and 30.3% ROI.
NCAAB with 19 picks saw 3.77 units of profit with 55.9% win rate and 10.8% ROI.
In total (for 2018 Season) the results are as follows;
47 picks, 8.01 units of profit with 57.4% win rate and 16.3% ROI.
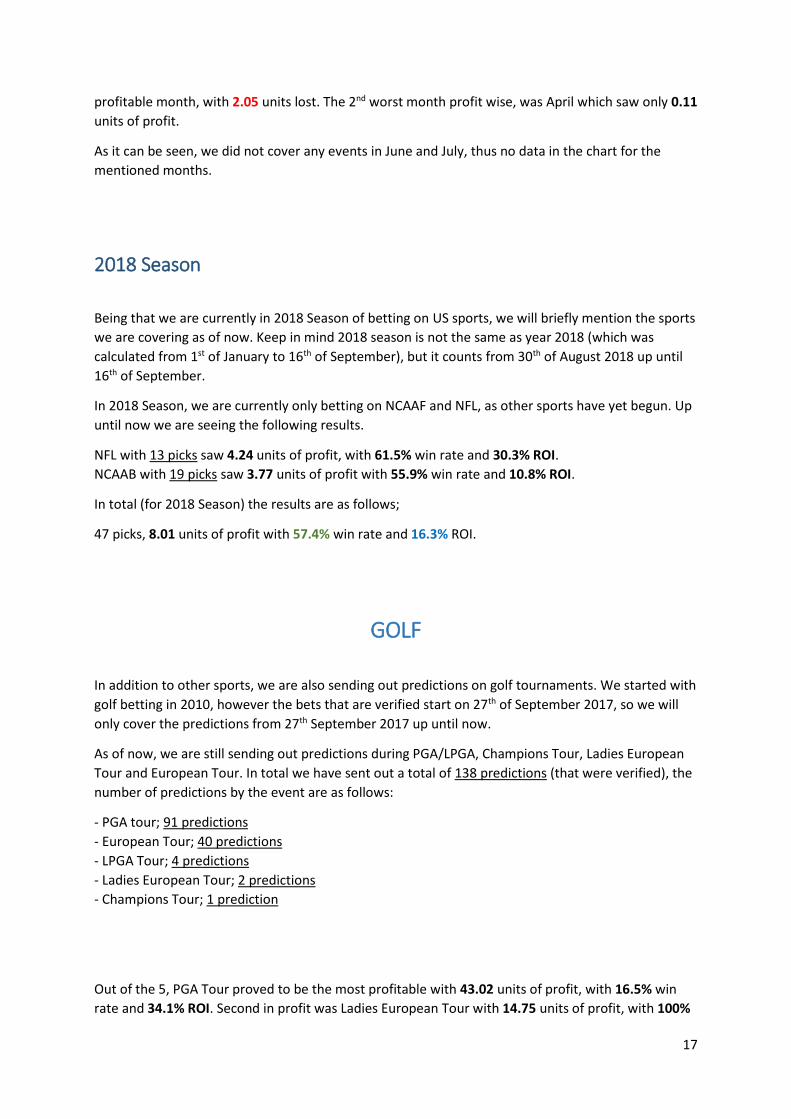
GOLF
In addition to other sports, we are also sending out predictions on golf tournaments. We started with
golf betting in 2010, however the bets that are verified start on 27th of September 2017, so we will
only cover the predictions from 27th September 2017 up until now.
As of now, we are still sending out predictions during PGA/LPGA, Champions Tour, Ladies European
Tour and European Tour. In total we have sent out a total of 138 predictions (that were verified), the
number of predictions by the event are as follows:
- PGA tour; 91 predictions
- European Tour; 40 predictions
- LPGA Tour; 4 predictions
- Ladies European Tour; 2 predictions
- Champions Tour; 1 prediction
Out of the 5, PGA Tour proved to be the most profitable with 43.02 units of profit, with 16.5% win
rate and 34.1% ROI. Second in profit was Ladies European Tour with 14.75 units of profit, with 100%
18
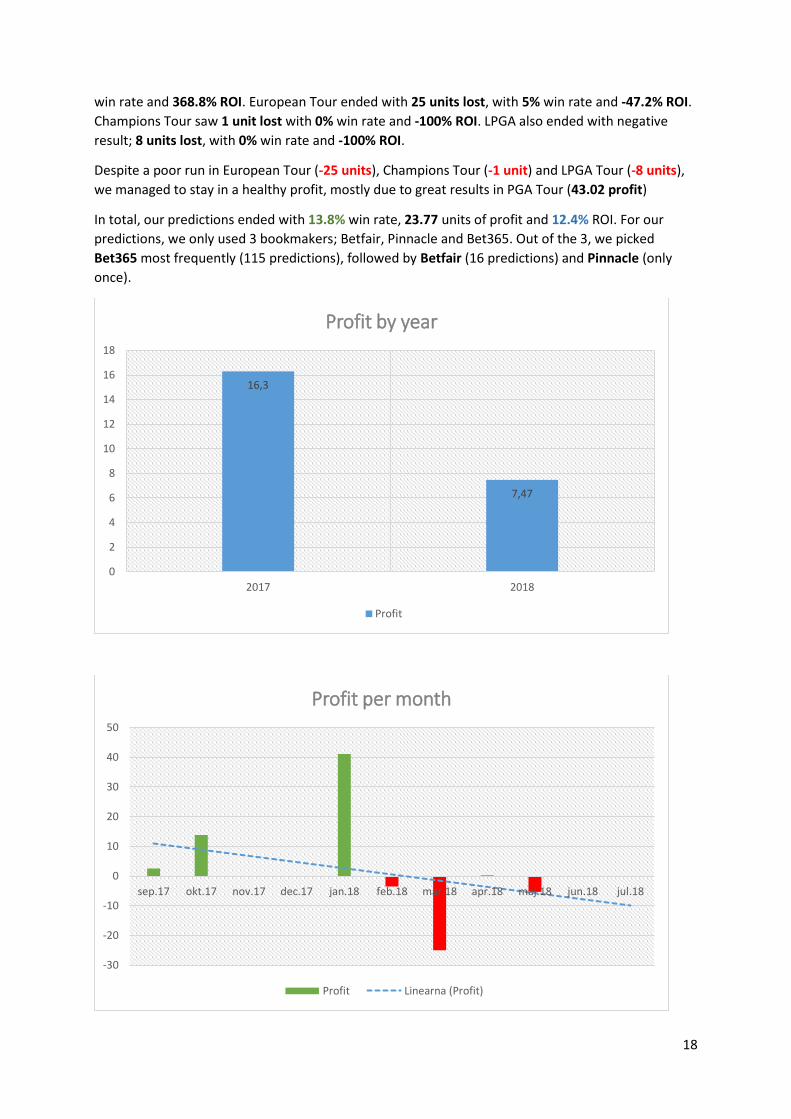
win rate and 368.8% ROI. European Tour ended with 25 units lost, with 5% win rate and -47.2% ROI.
Champions Tour saw 1 unit lost with 0% win rate and -100% ROI. LPGA also ended with negative
result; 8 units lost, with 0% win rate and -100% ROI.
Despite a poor run in European Tour (-25 units), Champions Tour (-1 unit) and LPGA Tour (-8 units),
we managed to stay in a healthy profit, mostly due to great results in PGA Tour (43.02 profit)
In total, our predictions ended with 13.8% win rate, 23.77 units of profit and 12.4% ROI. For our
predictions, we only used 3 bookmakers; Betfair, Pinnacle and Bet365. Out of the 3, we picked
Bet365 most frequently (115 predictions), followed by Betfair (16 predictions) and Pinnacle (only
once).
16,3
7,47
0
2
4
6
8
10
12
14
16
18
2017 2018
Profit by year
Profit
-30
-20
-10
0
10
20
30
40
50
sep.17 okt.17 nov.17 dec.17 jan.18 feb.18 mar.18 apr.18 maj.18 jun.18 jul.18
Profit per month
Profit Linearna (Profit)
19
Our most profitable month so far was January 2018, which saw 41.1 units of profit, followed by
October 2017 (13.8 units of profit)
On the other side, March 2018 was the least profitable month with 25 units lost, followed by
February 2018 with 19.54 lost units.
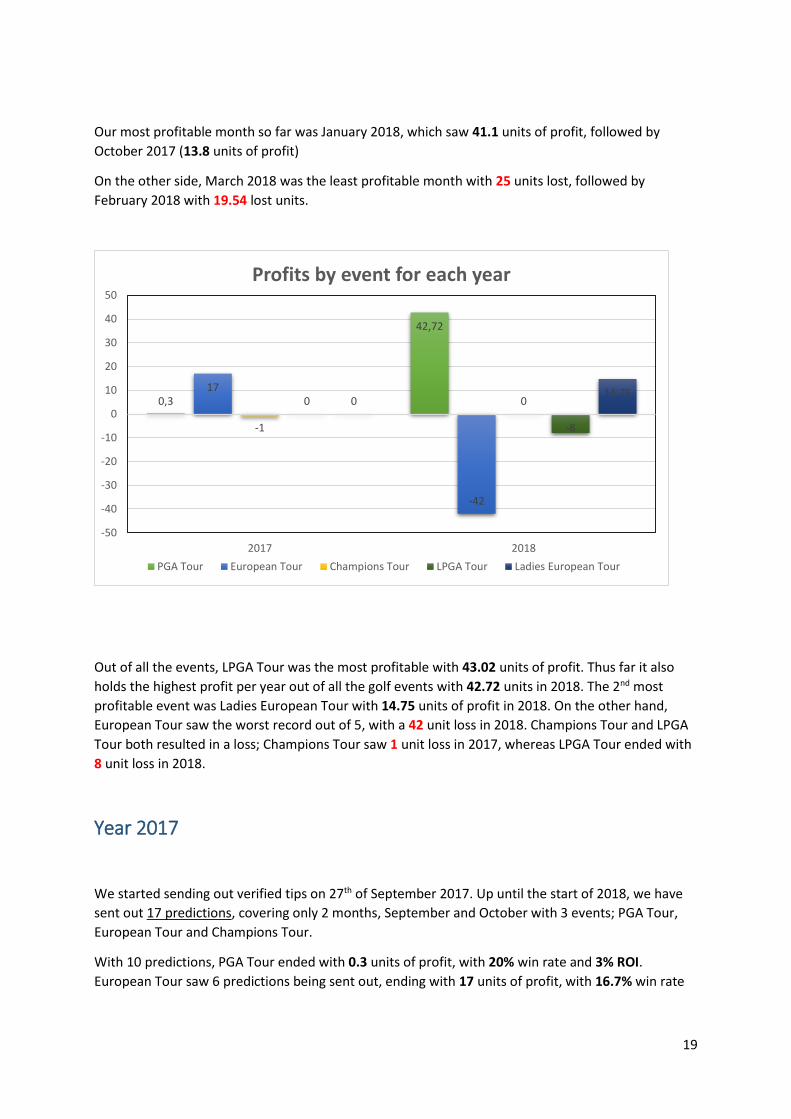
Out of all the events, LPGA Tour was the most profitable with 43.02 units of profit. Thus far it also
holds the highest profit per year out of all the golf events with 42.72 units in 2018. The 2nd most
profitable event was Ladies European Tour with 14.75 units of profit in 2018. On the other hand,
European Tour saw the worst record out of 5, with a 42 unit loss in 2018. Champions Tour and LPGA
Tour both resulted in a loss; Champions Tour saw 1 unit loss in 2017, whereas LPGA Tour ended with
8 unit loss in 2018.
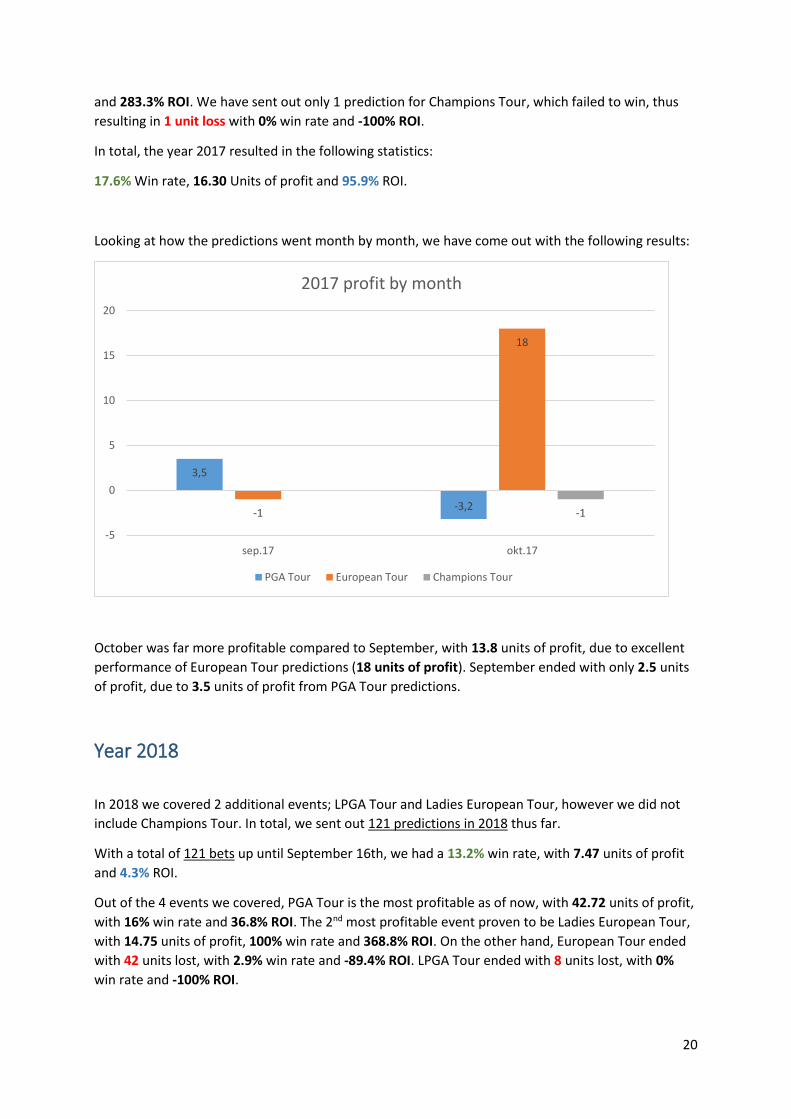
Year 2017
We started sending out verified tips on 27th of September 2017. Up until the start of 2018, we have
sent out 17 predictions, covering only 2 months, September and October with 3 events; PGA Tour,
European Tour and Champions Tour.
With 10 predictions, PGA Tour ended with 0.3 units of profit, with 20% win rate and 3% ROI.
European Tour saw 6 predictions being sent out, ending with 17 units of profit, with 16.7% win rate
0,3
42,72
17
-42
-1
00
-8
014,75
-50
-40
-30
-20
-10
0
10
20
30
40
50
2017 2018
Profits by event for each year
PGA Tour European Tour Champions Tour LPGA Tour Ladies European Tour
20
and 283.3% ROI. We have sent out only 1 prediction for Champions Tour, which failed to win, thus
resulting in 1 unit loss with 0% win rate and -100% ROI.
In total, the year 2017 resulted in the following statistics:
17.6% Win rate, 16.30 Units of profit and 95.9% ROI.
Looking at how the predictions went month by month, we have come out with the following results:
October was far more profitable compared to September, with 13.8 units of profit, due to excellent
performance of European Tour predictions (18 units of profit). September ended with only 2.5 units
of profit, due to 3.5 units of profit from PGA Tour predictions.
Year 2018
In 2018 we covered 2 additional events; LPGA Tour and Ladies European Tour, however we did not
include Champions Tour. In total, we sent out 121 predictions in 2018 thus far.
With a total of 121 bets up until September 16th, we had a 13.2% win rate, with 7.47 units of profit
and 4.3% ROI.
Out of the 4 events we covered, PGA Tour is the most profitable as of now, with 42.72 units of profit,
with 16% win rate and 36.8% ROI. The 2nd most profitable event proven to be Ladies European Tour,
with 14.75 units of profit, 100% win rate and 368.8% ROI. On the other hand, European Tour ended
with 42 units lost, with 2.9% win rate and -89.4% ROI. LPGA Tour ended with 8 units lost, with 0%
win rate and -100% ROI.
3,5
-3,2-1
18
-1
-5
0
5
10
15
20
sep.17 okt.17
2017 profit by month
PGA Tour European Tour Champions Tour
21
Up until now, the year 2018 resulted in the following statistics:
13.2% Win rate, 7.47 Units of profit and 4.3% ROI.
Looking at how the predictions went month by month, we have come out with the following results:
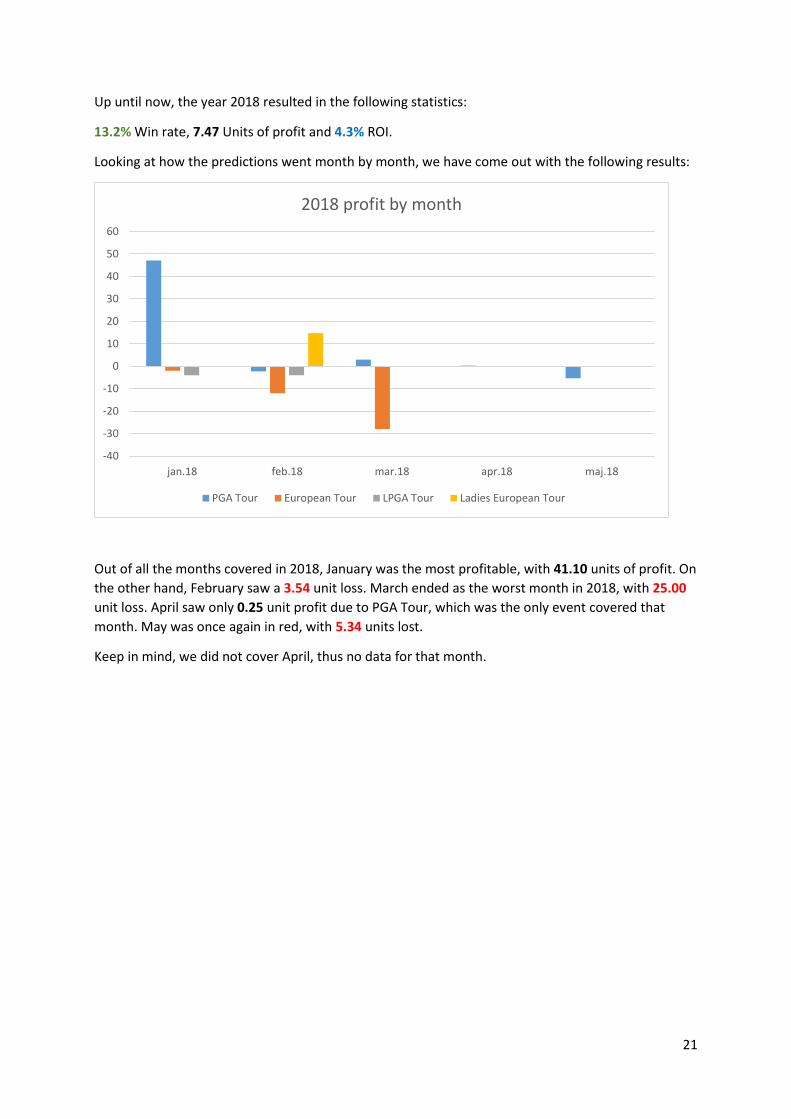
Out of all the months covered in 2018, January was the most profitable, with 41.10 units of profit. On
the other hand, February saw a 3.54 unit loss. March ended as the worst month in 2018, with 25.00
unit loss. April saw only 0.25 unit profit due to PGA Tour, which was the only event covered that
month. May was once again in red, with 5.34 units lost.
Keep in mind, we did not cover April, thus no data for that month.
-40
-30
-20
-10
0
10
20
30
40
50
60
jan.18 feb.18 mar.18 apr.18 maj.18
2018 profit by month
PGA Tour European Tour LPGA Tour Ladies European Tour
22
TENNIS
We have started sending out Tennis tips in 2016, however up until the end of 2017/start of 2018, the
sample size of verified tips is too small for it to be relevant for us to cover here. So, we will focus on
tips starting on 29th of December 2017 up until July 2018.
At this point I must also mention, we have a very selective approach when it comes to picking tennis
predictions, thus we do not send out as many predictions as we could.
As of now, we are covering ATP and WTA tournaments. In the time period from December 2017 till
July 2018, we have sent out 141 predictions, the number of predictions by the event are as follows:
- ATP; 16 predictions
- WTA; 125 predictions
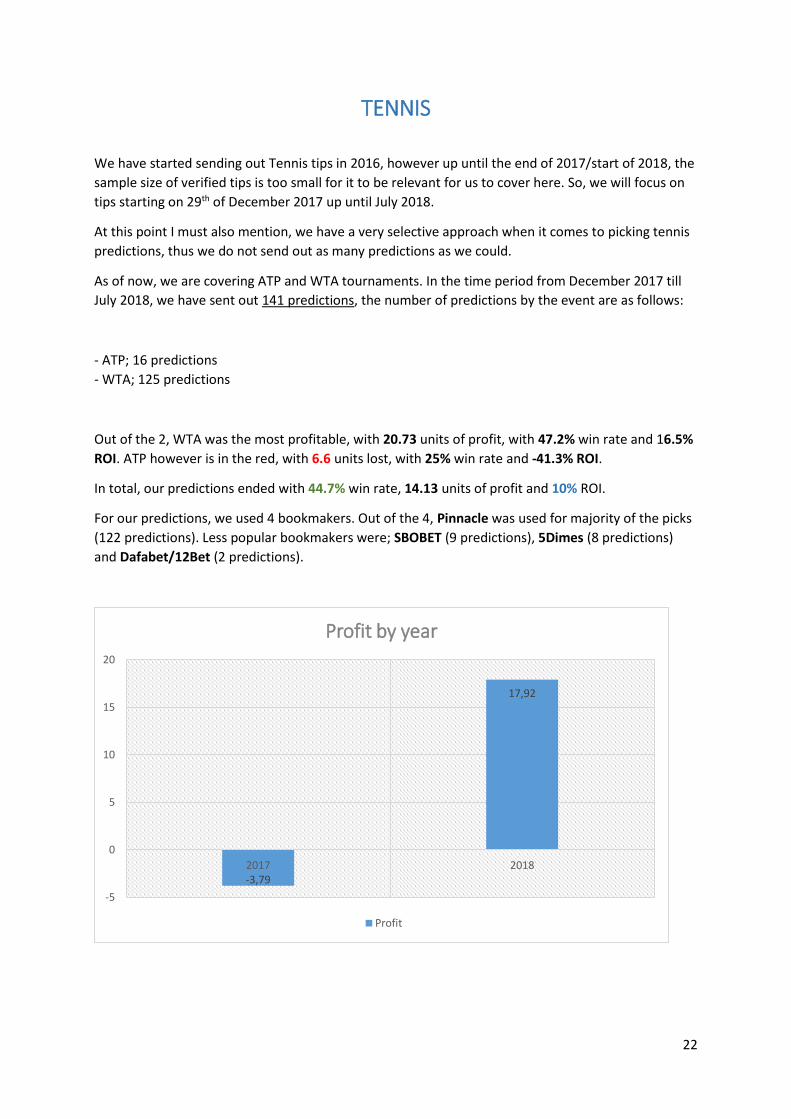
Out of the 2, WTA was the most profitable, with 20.73 units of profit, with 47.2% win rate and 16.5%
ROI. ATP however is in the red, with 6.6 units lost, with 25% win rate and -41.3% ROI.
In total, our predictions ended with 44.7% win rate, 14.13 units of profit and 10% ROI.
For our predictions, we used 4 bookmakers. Out of the 4, Pinnacle was used for majority of the picks
(122 predictions). Less popular bookmakers were; SBOBET (9 predictions), 5Dimes (8 predictions)
and Dafabet/12Bet (2 predictions).
-3,79
17,92
-5
0
5
10
15
20
2017 2018
Profit by year
Profit
23
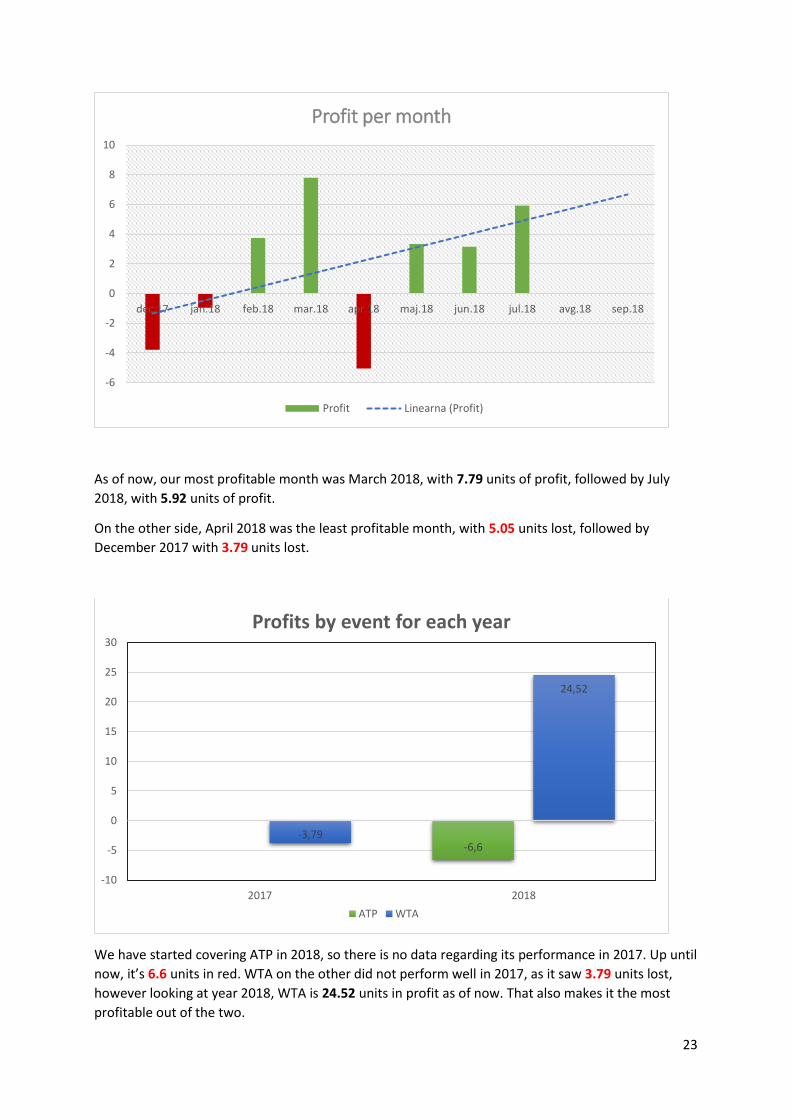
As of now, our most profitable month was March 2018, with 7.79 units of profit, followed by July
2018, with 5.92 units of profit.
On the other side, April 2018 was the least profitable month, with 5.05 units lost, followed by
December 2017 with 3.79 units lost.
We have started covering ATP in 2018, so there is no data regarding its performance in 2017. Up until
now, it’s 6.6 units in red. WTA on the other did not perform well in 2017, as it saw 3.79 units lost,
however looking at year 2018, WTA is 24.52 units in profit as of now. That also makes it the most
profitable out of the two.
-6
-4
-2
0
2
4
6
8
10
dec.17 jan.18 feb.18 mar.18 apr.18 maj.18 jun.18 jul.18 avg.18 sep.18
Profit per month
Profit Linearna (Profit)
-6,6-3,79
24,52
-10
-5
0
5
10
15
20
25
30
2017 2018
Profits by event for each year
ATP WTA
24
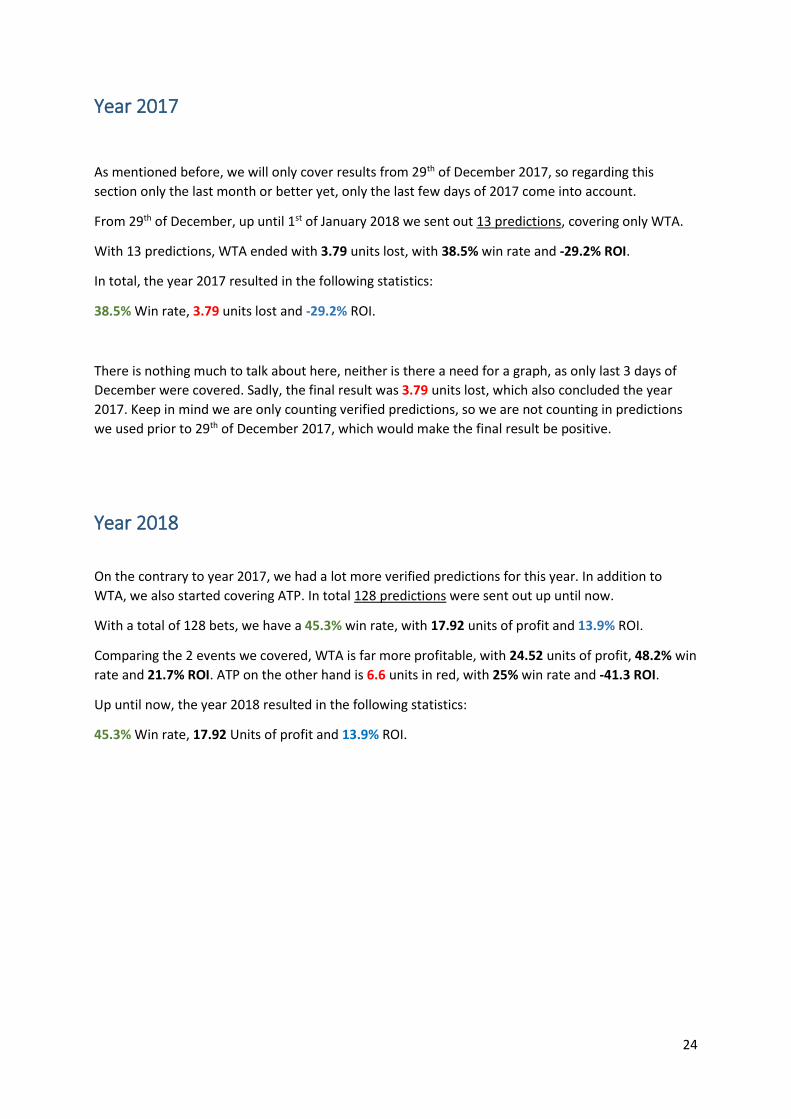
Year 2017
As mentioned before, we will only cover results from 29th of December 2017, so regarding this
section only the last month or better yet, only the last few days of 2017 come into account.
From 29th of December, up until 1st of January 2018 we sent out 13 predictions, covering only WTA.
With 13 predictions, WTA ended with 3.79 units lost, with 38.5% win rate and -29.2% ROI.
In total, the year 2017 resulted in the following statistics:
38.5% Win rate, 3.79 units lost and -29.2% ROI.
There is nothing much to talk about here, neither is there a need for a graph, as only last 3 days of
December were covered. Sadly, the final result was 3.79 units lost, which also concluded the year
2017. Keep in mind we are only counting verified predictions, so we are not counting in predictions
we used prior to 29th of December 2017, which would make the final result be positive.
Year 2018
On the contrary to year 2017, we had a lot more verified predictions for this year. In addition to
WTA, we also started covering ATP. In total 128 predictions were sent out up until now.
With a total of 128 bets, we have a 45.3% win rate, with 17.92 units of profit and 13.9% ROI.
Comparing the 2 events we covered, WTA is far more profitable, with 24.52 units of profit, 48.2% win
rate and 21.7% ROI. ATP on the other hand is 6.6 units in red, with 25% win rate and -41.3 ROI.
Up until now, the year 2018 resulted in the following statistics:
45.3% Win rate, 17.92 Units of profit and 13.9% ROI.
25
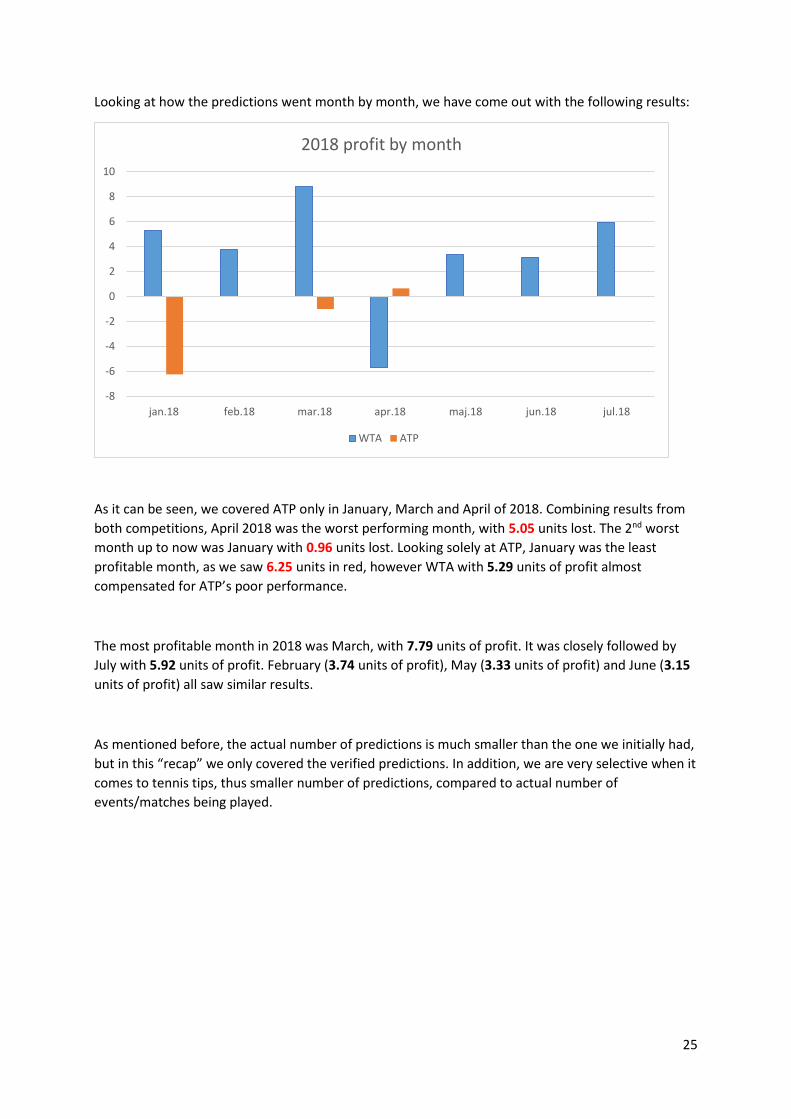
Looking at how the predictions went month by month, we have come out with the following results:
As it can be seen, we covered ATP only in January, March and April of 2018. Combining results from
both competitions, April 2018 was the worst performing month, with 5.05 units lost. The 2nd worst
month up to now was January with 0.96 units lost. Looking solely at ATP, January was the least
profitable month, as we saw 6.25 units in red, however WTA with 5.29 units of profit almost
compensated for ATP’s poor performance.
The most profitable month in 2018 was March, with 7.79 units of profit. It was closely followed by
July with 5.92 units of profit. February (3.74 units of profit), May (3.33 units of profit) and June (3.15
units of profit) all saw similar results.
As mentioned before, the actual number of predictions is much smaller than the one we initially had,
but in this “recap” we only covered the verified predictions. In addition, we are very selective when it comes to tennis tips, thus smaller number of predictions, compared to actual number of
events/matches being played.
-8
-6
-4
-2
0
2
4
6
8
10
jan.18 feb.18 mar.18 apr.18 maj.18 jun.18 jul.18
2018 profit by month
WTA ATP
26
CYCLING
As far as cycling betting goes, we have only covered Tour de France 2018. Looking forward, we might
cover more events, but being that we do not offer separate subscription for cycling due to low
demand, we currently have no plans on doing so. Anyhow, if we decide to cover more cycling events,
we will inform our customers regarding our decision.
Keep in mind, we will be covering Tour de France 2019, as it’s a well-known and widely popular event
in sports world.
As mentioned, we will only focus on Tour de France 2018 race, as it’s the only cycling event we
covered thus far. During Tour de France, we sent out 68 predictions, which were divided into;
- 67 stage predictions
- 1 outright prediction
Out of all the predictions, we saw the most success in 14th Stage of the race, with 23 units of profit,
with 33.3% win rate and 575% ROI. Closely behind was the 9th Stage, with 20 units of profit, 20% win
rate and 400% ROI. The least profitable stage was the 6th Stage, with 6.5 units in red, with 0% win
rate and -100% ROI.
Despite most of the Stage bets being in red, we more than compensated the loss with 14th and 9th
stage (43 units of profit combined).
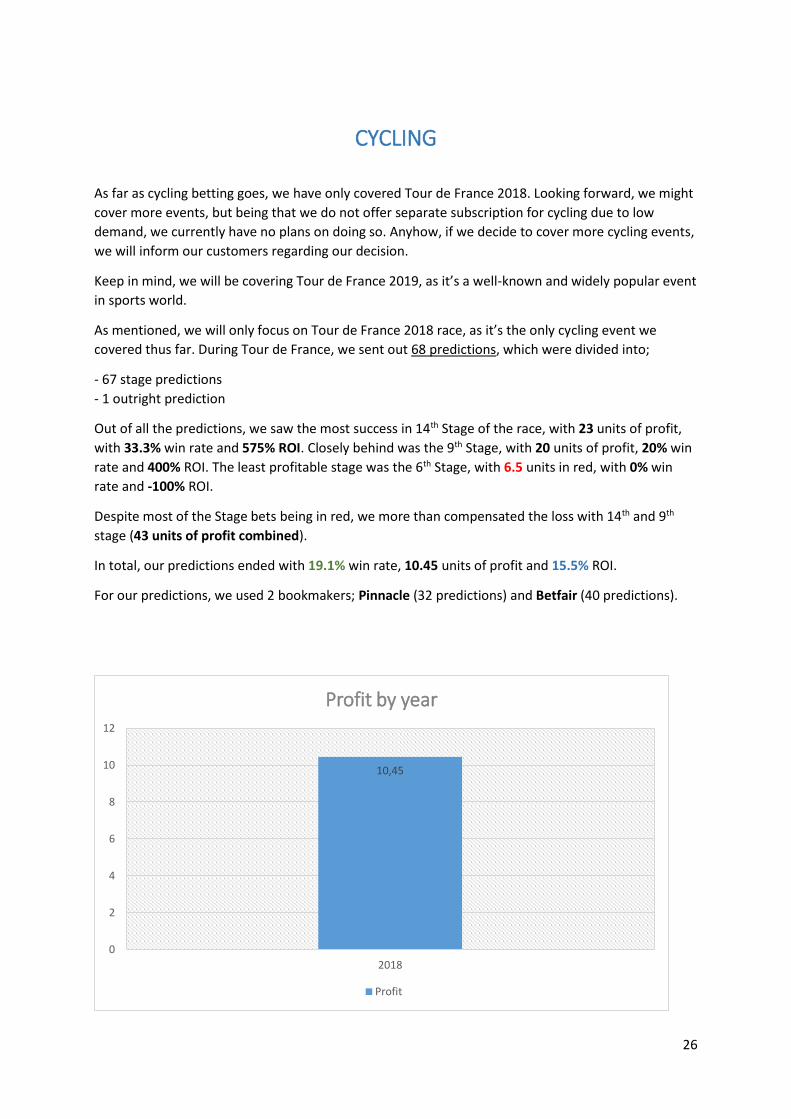
In total, our predictions ended with 19.1% win rate, 10.45 units of profit and 15.5% ROI.
For our predictions, we used 2 bookmakers; Pinnacle (32 predictions) and Betfair (40 predictions).
10,45
0
2
4
6
8
10
12
2018
Profit by year
Profit
27
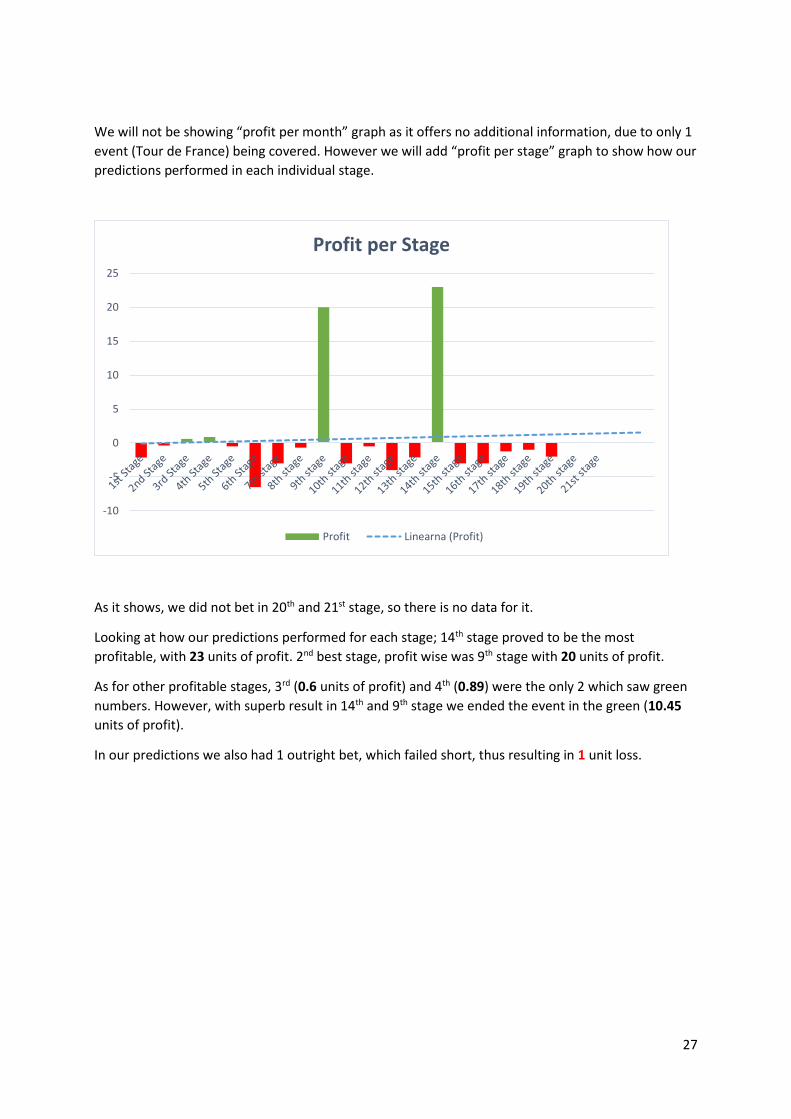
We will not be showing “profit per month” graph as it offers no additional information, due to only 1 event (Tour de France) being covered. However we will add “profit per stage” graph to show how our predictions performed in each individual stage.
As it shows, we did not bet in 20th and 21st stage, so there is no data for it.
Looking at how our predictions performed for each stage; 14th stage proved to be the most
profitable, with 23 units of profit. 2nd best stage, profit wise was 9th stage with 20 units of profit.
As for other profitable stages, 3rd (0.6 units of profit) and 4th (0.89) were the only 2 which saw green
numbers. However, with superb result in 14th and 9th stage we ended the event in the green (10.45
units of profit).
In our predictions we also had 1 outright bet, which failed short, thus resulting in 1 unit loss.
-10
-5
0
5
10
15
20
25
Profit per Stage
Profit Linearna (Profit)
28
HORSE RACING
Horse racing is another sport we cover separately. Much like golf, we have started betting on horse
racing way back, but our bets are verified only since 15th of September 2017. So, in that regard we
will only talk about bets sent out from 15th of September 2017 till 16th of September 2018.
As of now, we have covered a wide range of horse racing events, from UK, IRE and a few from US.
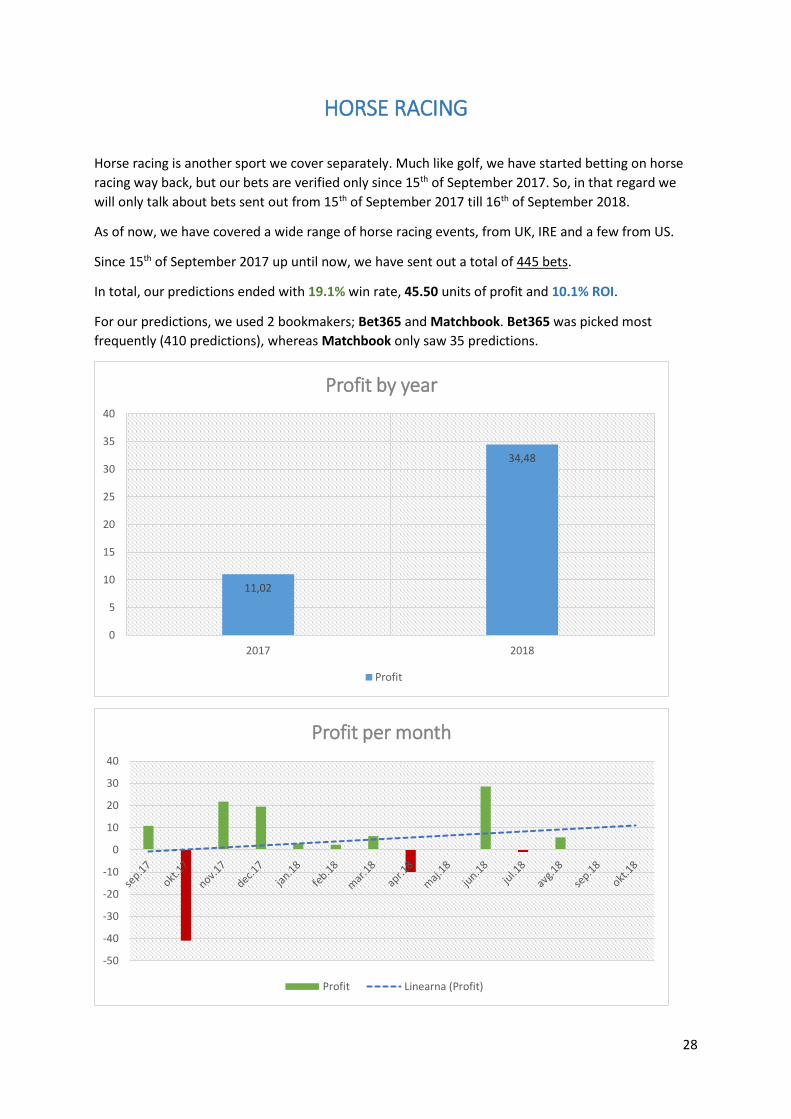
Since 15th of September 2017 up until now, we have sent out a total of 445 bets.
In total, our predictions ended with 19.1% win rate, 45.50 units of profit and 10.1% ROI.
For our predictions, we used 2 bookmakers; Bet365 and Matchbook. Bet365 was picked most
frequently (410 predictions), whereas Matchbook only saw 35 predictions.
11,02
34,48
0
5
10
15
20
25
30
35
40
2017 2018
Profit by year
Profit
-50
-40
-30
-20
-10
0
10
20
30
40
Profit per month
Profit Linearna (Profit)
29
Our most profitable month so far was June 2018, with 28.53 units of profit. The 2nd most profitable
month was November 2017 (21.7 units of profit), closely followed by December 2017 (19.5 units of
profit).
On the other side, October was by far the least profitable month, as we lost 40.93 units. April 2018
was in the red as well, but in a much lesser extend (10 units lost).
We did not divide our statistics by the event, so showing profits by comparing different races/events
as we did for previous sports won’t come into account here.
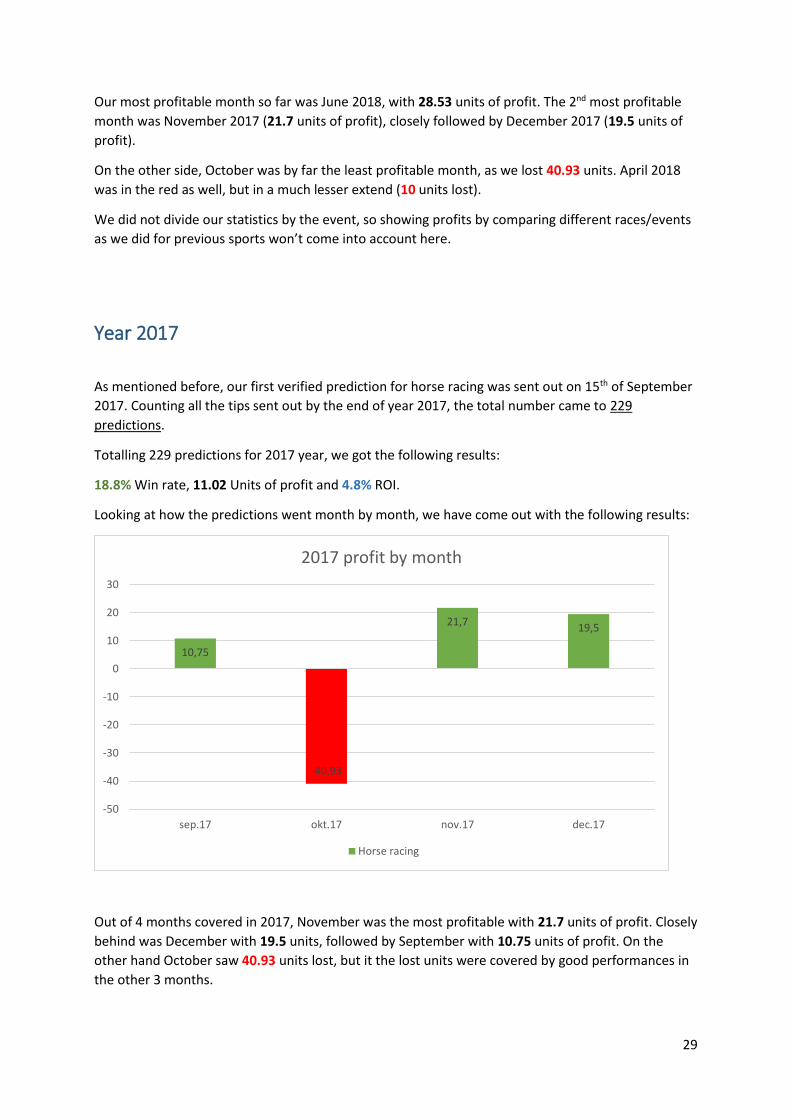
Year 2017
As mentioned before, our first verified prediction for horse racing was sent out on 15th of September
2017. Counting all the tips sent out by the end of year 2017, the total number came to 229
predictions.
Totalling 229 predictions for 2017 year, we got the following results:
18.8% Win rate, 11.02 Units of profit and 4.8% ROI.
Looking at how the predictions went month by month, we have come out with the following results:
Out of 4 months covered in 2017, November was the most profitable with 21.7 units of profit. Closely
behind was December with 19.5 units, followed by September with 10.75 units of profit. On the
other hand October saw 40.93 units lost, but it the lost units were covered by good performances in
the other 3 months.
10,75
-40,93
21,719,5
-50
-40
-30
-20
-10
0
10
20
30
sep.17 okt.17 nov.17 dec.17
2017 profit by month
Horse racing
30
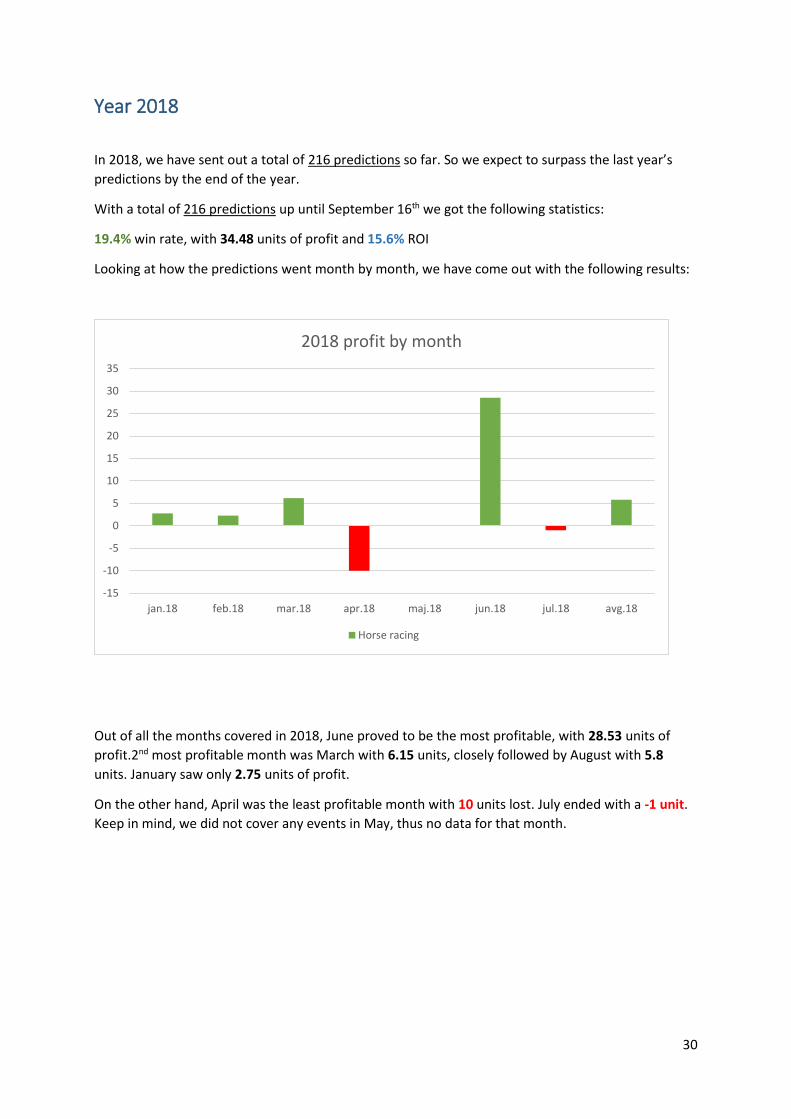
Year 2018
In 2018, we have sent out a total of 216 predictions so far. So we expect to surpass the last year’s predictions by the end of the year.
With a total of 216 predictions up until September 16th we got the following statistics:
19.4% win rate, with 34.48 units of profit and 15.6% ROI
Looking at how the predictions went month by month, we have come out with the following results:
Out of all the months covered in 2018, June proved to be the most profitable, with 28.53 units of
profit.2nd most profitable month was March with 6.15 units, closely followed by August with 5.8
units. January saw only 2.75 units of profit.
On the other hand, April was the least profitable month with 10 units lost. July ended with a -1 unit.
Keep in mind, we did not cover any events in May, thus no data for that month.
-15
-10
-5
0
5
10
15
20
25
30
35
jan.18 feb.18 mar.18 apr.18 maj.18 jun.18 jul.18 avg.18
2018 profit by month
Horse racing
31
eSports - CS: GO
As a part of eSports, CS:GO is one of the most popular sports in the industry. With its popularity
amongst players, bettors like us also saw an opportunity to specialize in CS: GO betting, due to a
fairly large market for it.
We, as BP Team have started sending out tips for CS: GO back in March 2016. Since then, we sent out
a total of 139 predictions, covering a wide range of events, but we focus only on major ones, which
take place approximately 2 times a year;
- MLG Major Championship (16 predictions)
- ESL One Cologne 2016 (7 predictions)
- ELEAGUE Major Atlanta 2017 (11 predictions)
- Clash for Cash: The Rematch of Atlanta 2017 Finals (1 prediction)
- PGL Major Kraków 2017 (12 predictions)
- ELEAGUE Major: Boston 2018 (44 predictions)
- FACEIT Major: London 2018 (48 predictions)
At this point I must mention, why there is only 1 prediction for Clash for Cash. This event is not like
others, in a way, this is only 1 match-event. As the name suggests, it’s only a rematch of last year’s finals, thus only 1 match occurs.
Comparing all the events covered up until now, the most profitable was the most recent one, FACEIT
Major: London 2018, with 11.32 units of profit, 64.6% win rate and 23.6% ROI. The 2nd most
profitable event was ELEAGUE Major: Boston 2018 with 5.57 units of profit, 52.3% win rate and
11.8% ROI. We have been extremely happy with how our most recent events went, as they proven to
also be the most profitable. We will hope to continue this way in the future.
In total, looking at all the predictions from 2016- 23rd of September 2018, we ended with;
60.4% win rate, 27.05 units of profit and 19.3% ROI.
For our predictions, we used 4 different bookmakers, with majority of odds picked from Pinnacle;
Pinnacle (124 predictions), Bet365 (8 predictions), SBOBET (4 predictions), Dafabet/12Bet (3
predictions).
32
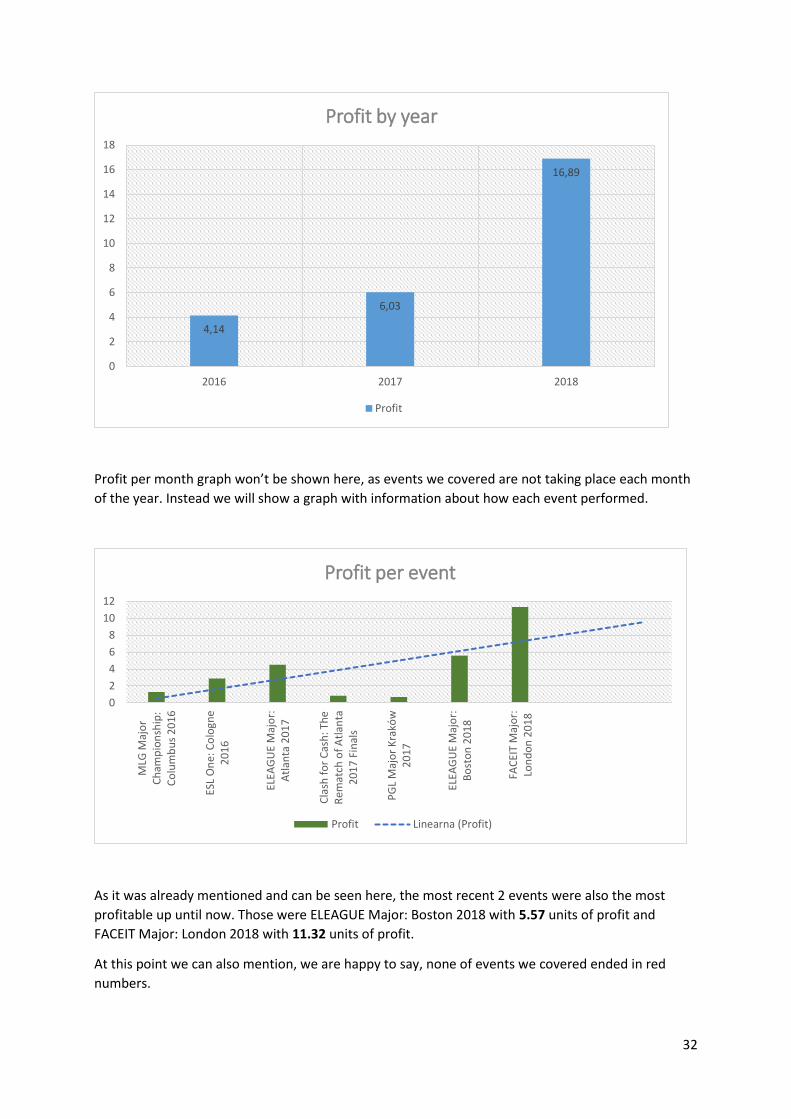
Profit per month graph won’t be shown here, as events we covered are not taking place each month of the year. Instead we will show a graph with information about how each event performed.
As it was already mentioned and can be seen here, the most recent 2 events were also the most
profitable up until now. Those were ELEAGUE Major: Boston 2018 with 5.57 units of profit and
FACEIT Major: London 2018 with 11.32 units of profit.
At this point we can also mention, we are happy to say, none of events we covered ended in red
numbers.
4,14
6,03
16,89
0
2
4
6
8
10
12
14
16
18
2016 2017 2018
Profit by year
Profit
0
2
4
6
8
10
12
MLG
Ma
jor
Ch
am
pio
nsh
ip:
Co
lum
bu
s 2
01
6
ESL
On
e:
Co
log
ne
20
16
ELE
AG
UE
Ma
jor:
Atl
an
ta 2
01
7
Cla
sh f
or
Ca
sh:
Th
e
Re
ma
tch
of
Atl
an
ta
20
17
Fin
als
PGL M
ajor
Kra
ków
20
17
ELE
AG
UE
Ma
jor:
Bo
sto
n 2
01
8
FA
CE
IT M
ajo
r:
Lon
do
n 2
01
8
Profit per event
Profit Linearna (Profit)
33
BASKETBALL – EUROBASKET
With our team covering 2017 EuroBasket tournament, we have decided to show the performance of
it separately instead of implementing the results under “basketball” section.
During the tournament we sent out 15 predictions.
In total, our predictions ended with 60% win rate, 1.88 units of profit and 11.8% ROI.
For our predictions, we used 2 bookmakers; Pinnacle (13 predictions) and in lesser extend SBOBET (2
predictions).
We won’t be showing results in graphs, as we don’t find it necessary for adding any additional information to the statistics we showed above; win rate, profit and ROI. The fact that the tournament
lasted during 1 month (September) it would be pointless to “divide” our performances in different months. Same goes for showing statistical performance per year.
WORLD CUP 2018
During the World cup 2018, we have sent out 26 predictions. 8 of those were outright (golden boot)
predictions, whereas the other 18 covered the matches.
We did not cover those results in our soccer section, but rather decided to cover World cup
predictions separately.
In total, our predictions ended with 57.7% win rate, 25.24 units of profit and 81.4% ROI.
For our predictions, we used 4 bookmakers; Pinnacle (9 predictions), Bet365 (8 predictions), SBOBET
(7 predictions), and Dafabet/12Bet (2 predictions).
Same as with EuroBasket, we won’t be showing the results in graphs, as it wouldn’t add any additional information. Much like EuroBasket tournament, even monthly performance is not
relevant, as the tournament as a whole did not last a prolonged time period.
34
SNOOKER
We have been covering Snooker for several seasons, however we will only cover 2018 season up to
12th of October in this report. Looking at 2018 seasons, the first prediction was sent on 2nd of July.
Up until 12th of October we sent out 77 predictions, covering 8 events. For our predictions we used 3
bookmakers; Pinnacle, Matchbook and Dafabet. Out of the 3, Dafabet was used most frequently (46
predictions), followed by Pinnacle (30 predictions) and Matchbook (1 prediction).
Out of 10 events, European Masters 2018 proved to be the most profitable with 5.28 units of profit,
followed by International Championship 2018 with 3.44 units of profit. Indian Open 2018 ended with
2.87 units of profit, Riga Masters 2018 was close behind with 2.02 units of profit. Shanghai Masters
2018 ended with 1.27 units of profit and World Open with 0.78 units of profit. On the other hand,
China Championship 2018 and Paul Hunter Classic 2018 ended in red, with -1.36 and -3.18 units,
combining 4.54 units lost.
Despite a poor run in China Championship 2018 and Paul Hunter Classic 2018 we are still sitting at
11.12 units of profit so far in this season.
In total, with 67 predictions, our results are as follows;
54.5% win rate, 11.12 units of profit and 14.5% ROI.
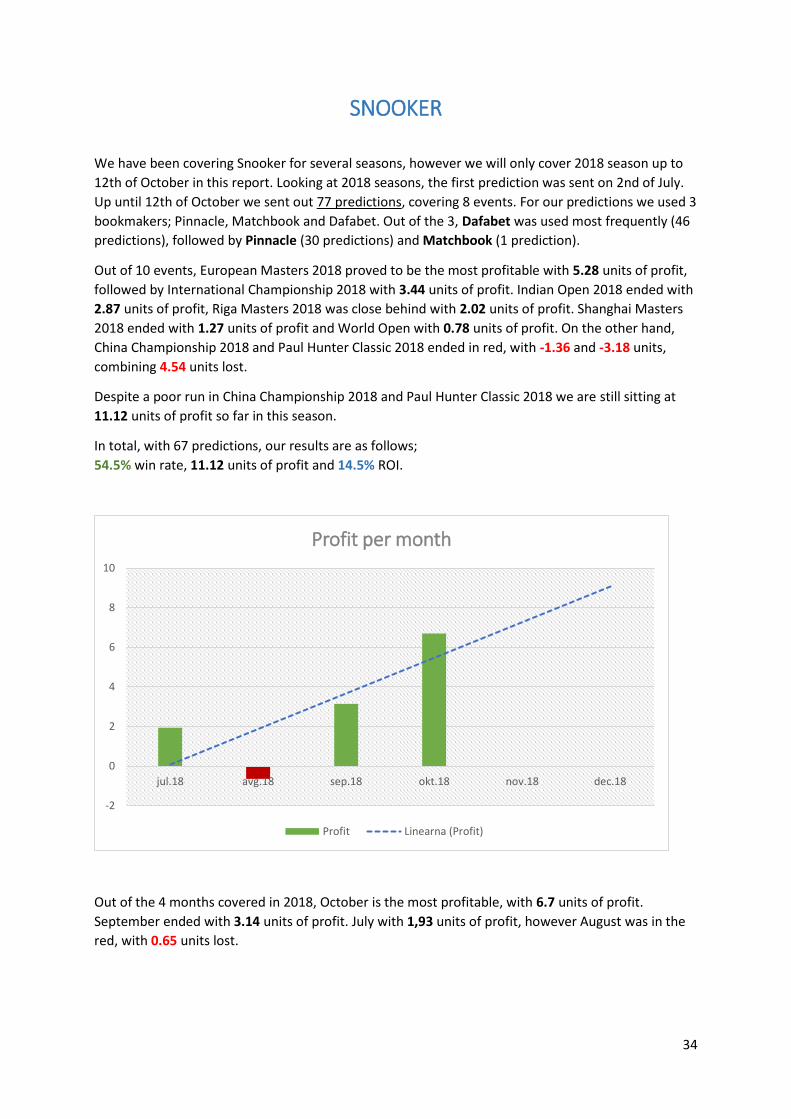
Out of the 4 months covered in 2018, October is the most profitable, with 6.7 units of profit.
September ended with 3.14 units of profit. July with 1,93 units of profit, however August was in the
red, with 0.65 units lost.
-2
0
2
4
6
8
10
jul.18 avg.18 sep.18 okt.18 nov.18 dec.18
Profit per month
Profit Linearna (Profit)

35
RECOMMENDED BOOKMAKERS
Sport Recommended Bookmakers Minimum
Soccer Betting Broker Pinnacle, SBOBET, Dafabet
Tennis Betting Broker, 5Dimes Pinnacle, SBOBET, Dafabet
USA Sports Betting Broker, 5Dimes, BetCRIS, Heritage… Pinnacle, SBOBET, Matchbook
Golf Betting Exchanges, Pinnacle, Mustardbet… Betting Exchanges
Cycling Betting Exchanges, Pinnacle, Normal Bookmakers Betting Exchanges
eSports Pinnacle, SBOBET, Dafabet, Normal Bookmakers Pinnacle
Basketball Betting Broker, 5Dimes Pinnacle, Matchbook
Horse Racing Betting Exchanges, Normal Bookmakers Matchbook
Snooker Pinnacle, Dafabet, Normal Bookmakers Dafabet
Most of the bets can be placed via Betting Brokers or any other reputable bookmaker/betting
exchange, such as Pinnacle, SBOBET, Matchbook, Dafabet... However, if you have a chance to get
better odds on any other soft bookmaker you should take advantage of that.
For CS: GO you can check odds on eSports-oriented bookmakers, but be careful, as most of them are
known to quickly limit the winning players.
Contact
If you wish to contact us, you can do so via;
SKYPE: betting.previews
DISCORD: prezlus#0704
EMAIL: [email protected]
We are open to any partnership with other betting-oriented websites and individuals in the betting
industry. We can offer to create content such as uniquely written previews on sports matches,
betting articles, software reviews… In addition, we offer to be a country manager and provide
advices from our experts to help new betting start-ups.