Embed Size (px)
Citation preview
IntroductionData, Variables, and Sample
Empirical ResultsConclusion
Betting against Beta or Demand for Lottery
Turan G. Bali1 Stephen J. Brown2
Scott Murray3 Yi Tang4
1McDonough School of Business, Georgetown University
2Stern School of Business, New York University
3College of Business Administration, University of Nebraska - Lincoln
4School of Business, Fordham University
March 30, 2015
Turan G. Bali, Stephen J. Brown, Scott Murray, and Yi Tang Betting against Beta or Demand for Lottery
IntroductionData, Variables, and Sample
Empirical ResultsConclusion
BackgroundAlternative Explanation - Lottery DemandResults
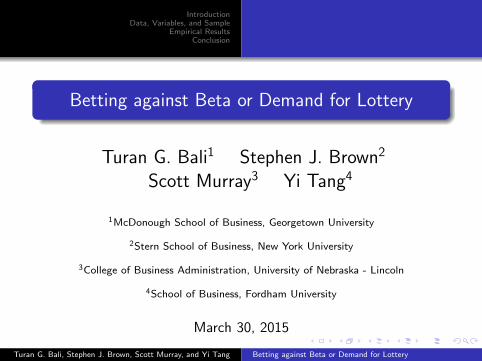
Most Persistent Anomaly
Security Market Line is Too Flat
High β stocks generate negative abnormal returns
Low β stocks generate positive abnormal returns
Anomaly has persisted for more than 40 years
Black, Jensen, and Scholes (1972)Blume and Friend (1973)Fama and MacBeth (1973)
Betting Against Beta: Frazzini and PedersenLong low-β, short high-β portfolio generates abnormal returns
Explanation: Leverage constrained investors buy high β
Only way to increase expected return (can’t use leverage)Pension funds, mutual funds
Turan G. Bali, Stephen J. Brown, Scott Murray, and Yi Tang Betting against Beta or Demand for Lottery
IntroductionData, Variables, and Sample
Empirical ResultsConclusion
BackgroundAlternative Explanation - Lottery DemandResults
Alternative Explanation - Lottery Demand
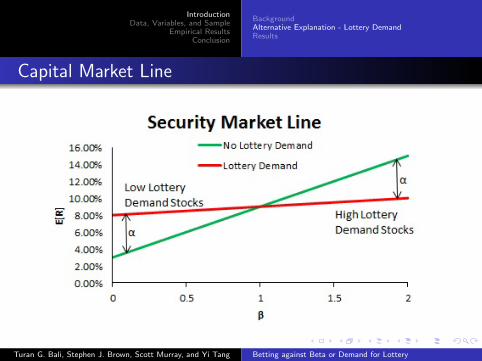
We propose that lottery demand causesbetting against beta phenomenon
Lottery investors want high probability of large up move
Up moves partially driven by market sensitivity
Lottery demanders likely to invest in high-β stocks
Upward (downward) price pressure on high-β (low-β) stocks
Future returns of high-β (low-β) stocks depressed (increased)
Lottery demand strong in equity marketsBali, Cakici, and Whitelaw (2011)
Kumar (2009)
Turan G. Bali, Stephen J. Brown, Scott Murray, and Yi Tang Betting against Beta or Demand for Lottery
IntroductionData, Variables, and Sample
Empirical ResultsConclusion
BackgroundAlternative Explanation - Lottery DemandResults
Capital Market Line
Turan G. Bali, Stephen J. Brown, Scott Murray, and Yi Tang Betting against Beta or Demand for Lottery

IntroductionData, Variables, and Sample
Empirical ResultsConclusion
BackgroundAlternative Explanation - Lottery DemandResults
Results
Lottery Demand Explains Phenomenon
Lottery demand proxied by MAX
Average of top 5 daily returns in month
Bivariate portfolio analysis
Controlling for MAX , betting against beta disappears
No other variable explains betting against beta
Fama and MacBeth (1973) Regressions
β positively related to returns when MAX included
Orthogonal Component of β to MAX
Does not generate betting against beta phenomenon
Turan G. Bali, Stephen J. Brown, Scott Murray, and Yi Tang Betting against Beta or Demand for Lottery
IntroductionData, Variables, and Sample
Empirical ResultsConclusion
BackgroundAlternative Explanation - Lottery DemandResults
Results
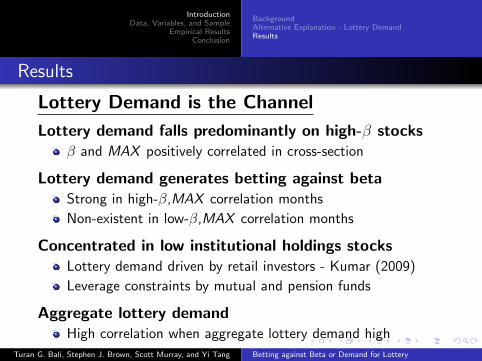
Lottery Demand is the Channel
Lottery demand falls predominantly on high-β stocksβ and MAX positively correlated in cross-section
Lottery demand generates betting against betaStrong in high-β,MAX correlation months
Non-existent in low-β,MAX correlation months
Concentrated in low institutional holdings stocksLottery demand driven by retail investors - Kumar (2009)
Leverage constraints by mutual and pension funds
Aggregate lottery demandHigh correlation when aggregate lottery demand high
Turan G. Bali, Stephen J. Brown, Scott Murray, and Yi Tang Betting against Beta or Demand for Lottery

IntroductionData, Variables, and Sample
Empirical ResultsConclusion
BackgroundAlternative Explanation - Lottery DemandResults
Results
Lottery Demand Factor (FMAX)
Long High-MAX Stocks, Short Low-MAX Stocks
Proxies for returns associated with lottery investing
FMAX explains betting against beta phenomenon
Alpha of high-low β portfolio is zero when FMAX included
FMAX explains alpha of FP’s BAB factor
Alpha of BAB is zero when FMAX included in model
BAB factor cannot explain FMAX
Alpha of FMAX large and significant when BAB in model
Turan G. Bali, Stephen J. Brown, Scott Murray, and Yi Tang Betting against Beta or Demand for Lottery

IntroductionData, Variables, and Sample
Empirical ResultsConclusion
Data SourcesVariablesSample
Data Sources
CRSP
Daily and monthly stock data
Compustat
Balance sheet data
Kenneth French’s Data Library
Daily and monthly factor returns
Global Insight
LIBOR and U.S. Treasury bill yields
Pastor and Stambaugh (2003) Liquidity Factor
Lubos Pastor’s website
Institutional Holdings Data
Thomson-Reuters Institutional Holdings (13F) database
Turan G. Bali, Stephen J. Brown, Scott Murray, and Yi Tang Betting against Beta or Demand for Lottery

IntroductionData, Variables, and Sample
Empirical ResultsConclusion
Data SourcesVariablesSample
Variables - Beta, Lottery Demand, Returns
Beta, Lottery Demand, and Returns
Beta (β)
One-factor market model regression
12-month’s of daily return data
Require minimum of 200 daily return observations
Lottery demand (MAX )
Average of 5 highest daily returns in past month
Monthly stock excess returns
Adjusted for delisting following Shumway (1997)
Turan G. Bali, Stephen J. Brown, Scott Murray, and Yi Tang Betting against Beta or Demand for Lottery
IntroductionData, Variables, and Sample
Empirical ResultsConclusion
Data SourcesVariablesSample
Variables - Firm Characteristics
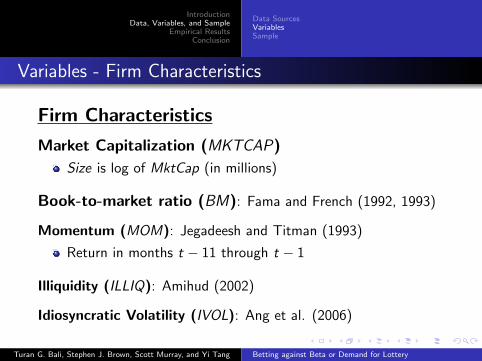
Firm Characteristics
Market Capitalization (MKTCAP)
Size is log of MktCap (in millions)
Book-to-market ratio (BM): Fama and French (1992, 1993)
Momentum (MOM): Jegadeesh and Titman (1993)
Return in months t − 11 through t − 1
Illiquidity (ILLIQ): Amihud (2002)
Idiosyncratic Volatility (IVOL): Ang et al. (2006)
Turan G. Bali, Stephen J. Brown, Scott Murray, and Yi Tang Betting against Beta or Demand for Lottery

IntroductionData, Variables, and Sample
Empirical ResultsConclusion
Data SourcesVariablesSample
Variables - Risk Measures
Risk Measures
Co-skewness (COSKEW ): Following Harvey and Siddique (2000)
Total skewness (TSKEW ): Skewness of daily returns in past year
Downside beta (DRISK): Ang, Chen, Xing (2006)
Stock beta on days when market return is below average
Tail beta (TRISK): Kelly, Jiang (2013), Ruenzi, Weigert (2013)
Stock beta on days in bottom 10% of market returns
We require minimum of 200 daily return observations in past yearfor each of the risk variables
Turan G. Bali, Stephen J. Brown, Scott Murray, and Yi Tang Betting against Beta or Demand for Lottery

IntroductionData, Variables, and Sample
Empirical ResultsConclusion
Data SourcesVariablesSample
Variables - Funding Liquidity Measures
Funding Liquidity Measures
TED spread sensitivity (βTED)
TED spread is three-month LIBOR rate - 3-month T-bill rate
Sensitivity to TED spread volatility (βVOLTED , 1979-2012)
VOLTED is standard deviation of daily TED spreads in month
T-bill rate sensitivity (βTBILL)
TBILL is 3-month T-bill rate
Financial sector leverage sensitivity (βFLEV )
FLEV is financial sector total assets / market value of equity
Calculated using 5 years of monthly data (minimum 24 months)Turan G. Bali, Stephen J. Brown, Scott Murray, and Yi Tang Betting against Beta or Demand for Lottery

IntroductionData, Variables, and Sample
Empirical ResultsConclusion
Data SourcesVariablesSample
Sample
Monthly Sample, Aug. 1963 - Dec. 2012
593 months
U.S. based common stocks
Traded on NYSE/AMEX/Nasdaq
Price at end of previous month ≥ $5
Turan G. Bali, Stephen J. Brown, Scott Murray, and Yi Tang Betting against Beta or Demand for Lottery

IntroductionData, Variables, and Sample
Empirical ResultsConclusion
β and Stock ReturnsMAX and Stock Returnsβ, MAX , and Stock ReturnsLottery Demand as the ChannelFMAX FactorMAX is Lottery Demand
Univariate Portfolios Sorted on β
Excess Returns and 4-Factor Alphas
Portfolios Sorted on β
1 10(Low) 2 3 4 5 6 7 8 9 (High) High-Low
β -0.00 0.25 0.42 0.56 0.70 0.84 1.00 1.19 1.46 2.02
R 0.69 0.78 0.78 0.77 0.81 0.73 0.71 0.65 0.51 0.35 -0.35(3.74) (3.90) (3.74) (3.54) (3.42) (2.90) (2.66) (2.26) (1.58) (0.89) (-1.13)
FFC4 α 0.22 0.24 0.16 0.11 0.10 -0.02 -0.05 -0.11 -0.18 -0.29 -0.51(2.22) (2.77) (2.31) (1.59) (1.69) (-0.30) (-0.80) (-1.83) (-2.20) (-2.22) (-2.50)
High-Low β portfolio generates negative alpha
-0.51% per month
Similar to FP (0.55% per month)
Both high and low β portfolios generate significant alpha
Turan G. Bali, Stephen J. Brown, Scott Murray, and Yi Tang Betting against Beta or Demand for Lottery
IntroductionData, Variables, and Sample
Empirical ResultsConclusion
β and Stock ReturnsMAX and Stock Returnsβ, MAX , and Stock ReturnsLottery Demand as the ChannelFMAX FactorMAX is Lottery Demand
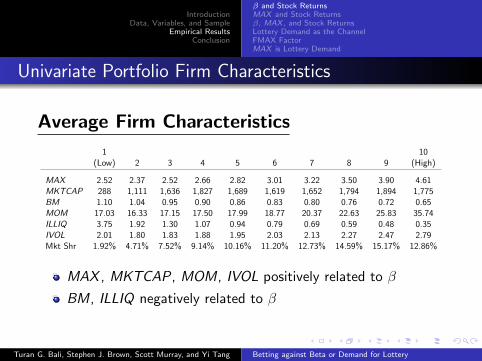
Univariate Portfolio Firm Characteristics
Average Firm Characteristics
1 10(Low) 2 3 4 5 6 7 8 9 (High)
MAX 2.52 2.37 2.52 2.66 2.82 3.01 3.22 3.50 3.90 4.61MKTCAP 288 1,111 1,636 1,827 1,689 1,619 1,652 1,794 1,894 1,775BM 1.10 1.04 0.95 0.90 0.86 0.83 0.80 0.76 0.72 0.65MOM 17.03 16.33 17.15 17.50 17.99 18.77 20.37 22.63 25.83 35.74ILLIQ 3.75 1.92 1.30 1.07 0.94 0.79 0.69 0.59 0.48 0.35IVOL 2.01 1.80 1.83 1.88 1.95 2.03 2.13 2.27 2.47 2.79Mkt Shr 1.92% 4.71% 7.52% 9.14% 10.16% 11.20% 12.73% 14.59% 15.17% 12.86%
MAX , MKTCAP, MOM, IVOL positively related to β
BM, ILLIQ negatively related to β
Turan G. Bali, Stephen J. Brown, Scott Murray, and Yi Tang Betting against Beta or Demand for Lottery

IntroductionData, Variables, and Sample
Empirical ResultsConclusion
β and Stock ReturnsMAX and Stock Returnsβ, MAX , and Stock ReturnsLottery Demand as the ChannelFMAX FactorMAX is Lottery Demand
Univariate Portfolio Risk Measures
Average Risk Measures
1 10(Low) 2 3 4 5 6 7 8 9 (High)
COSKEW -4.75 -5.02 -5.34 -5.30 -5.22 -5.03 -4.89 -4.82 -4.52 -1.96TSKEW 0.86 0.67 0.57 0.51 0.47 0.45 0.44 0.44 0.44 0.47DRISK 0.09 0.35 0.52 0.67 0.81 0.95 1.11 1.31 1.58 2.10TRISK 0.13 0.41 0.60 0.74 0.87 1.02 1.18 1.38 1.65 2.15
COSKEW , DRISK , TRISK positively related to β
TSKEW negatively related to β
Turan G. Bali, Stephen J. Brown, Scott Murray, and Yi Tang Betting against Beta or Demand for Lottery

IntroductionData, Variables, and Sample
Empirical ResultsConclusion
β and Stock ReturnsMAX and Stock Returnsβ, MAX , and Stock ReturnsLottery Demand as the ChannelFMAX FactorMAX is Lottery Demand
Univariate Portfolio Funding Liquidity Measures
Average Funding Liquidity Measures
1 10(Low) 2 3 4 5 6 7 8 9 (High)
βTED -2.10 -1.88 -1.60 -1.56 -1.52 -1.54 -1.53 -1.35 -0.99 -0.10βVOLTED -11.41 -10.25 -7.82 -6.23 -5.32 -5.54 -4.89 -4.64 -3.77 -1.19βTBILL -0.51 -0.54 -0.55 -0.56 -0.58 -0.60 -0.64 -0.71 -0.79 -0.94βFLEV -0.54 -0.61 -0.68 -0.72 -0.76 -0.80 -0.83 -0.87 -0.88 -0.91
βTED and βVOLTED positively related to β
βTBILL and βFLEV negatively related to β
Turan G. Bali, Stephen J. Brown, Scott Murray, and Yi Tang Betting against Beta or Demand for Lottery
IntroductionData, Variables, and Sample
Empirical ResultsConclusion
β and Stock ReturnsMAX and Stock Returnsβ, MAX , and Stock ReturnsLottery Demand as the ChannelFMAX FactorMAX is Lottery Demand
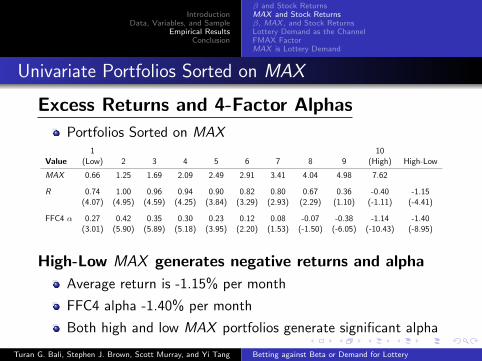
Univariate Portfolios Sorted on MAX
Excess Returns and 4-Factor Alphas
Portfolios Sorted on MAX1 10
Value (Low) 2 3 4 5 6 7 8 9 (High) High-Low
MAX 0.66 1.25 1.69 2.09 2.49 2.91 3.41 4.04 4.98 7.62
R 0.74 1.00 0.96 0.94 0.90 0.82 0.80 0.67 0.36 -0.40 -1.15(4.07) (4.95) (4.59) (4.25) (3.84) (3.29) (2.93) (2.29) (1.10) (-1.11) (-4.41)
FFC4 α 0.27 0.42 0.35 0.30 0.23 0.12 0.08 -0.07 -0.38 -1.14 -1.40(3.01) (5.90) (5.89) (5.18) (3.95) (2.20) (1.53) (-1.50) (-6.05) (-10.43) (-8.95)
High-Low MAX generates negative returns and alpha
Average return is -1.15% per month
FFC4 alpha -1.40% per month
Both high and low MAX portfolios generate significant alpha
Turan G. Bali, Stephen J. Brown, Scott Murray, and Yi Tang Betting against Beta or Demand for Lottery
IntroductionData, Variables, and Sample
Empirical ResultsConclusion
β and Stock ReturnsMAX and Stock Returnsβ, MAX , and Stock ReturnsLottery Demand as the ChannelFMAX FactorMAX is Lottery Demand
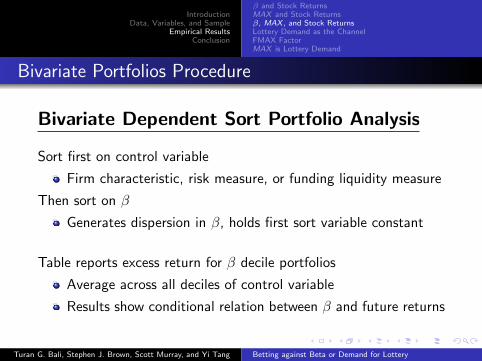
Bivariate Portfolios Procedure
Bivariate Dependent Sort Portfolio Analysis
Sort first on control variable
Firm characteristic, risk measure, or funding liquidity measure
Then sort on β
Generates dispersion in β, holds first sort variable constant
Table reports excess return for β decile portfolios
Average across all deciles of control variable
Results show conditional relation between β and future returns
Turan G. Bali, Stephen J. Brown, Scott Murray, and Yi Tang Betting against Beta or Demand for Lottery
IntroductionData, Variables, and Sample
Empirical ResultsConclusion
β and Stock ReturnsMAX and Stock Returnsβ, MAX , and Stock ReturnsLottery Demand as the ChannelFMAX FactorMAX is Lottery Demand
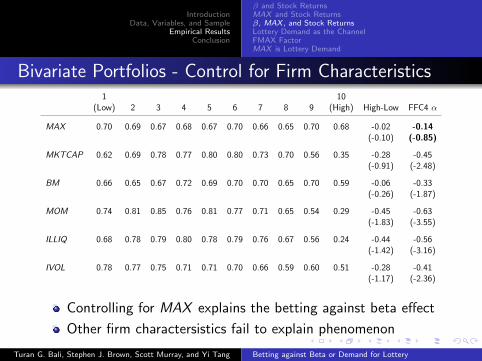
Bivariate Portfolios - Control for Firm Characteristics1 10
(Low) 2 3 4 5 6 7 8 9 (High) High-Low FFC4 α
MAX 0.70 0.69 0.67 0.68 0.67 0.70 0.66 0.65 0.70 0.68 -0.02 -0.14(-0.10) (-0.85)
MKTCAP 0.62 0.69 0.78 0.77 0.80 0.80 0.73 0.70 0.56 0.35 -0.28 -0.45(-0.91) (-2.48)
BM 0.66 0.65 0.67 0.72 0.69 0.70 0.70 0.65 0.70 0.59 -0.06 -0.33(-0.26) (-1.87)
MOM 0.74 0.81 0.85 0.76 0.81 0.77 0.71 0.65 0.54 0.29 -0.45 -0.63(-1.83) (-3.55)
ILLIQ 0.68 0.78 0.79 0.80 0.78 0.79 0.76 0.67 0.56 0.24 -0.44 -0.56(-1.42) (-3.16)
IVOL 0.78 0.77 0.75 0.71 0.71 0.70 0.66 0.59 0.60 0.51 -0.28 -0.41(-1.17) (-2.36)
Controlling for MAX explains the betting against beta effect
Other firm charactersistics fail to explain phenomenon
Turan G. Bali, Stephen J. Brown, Scott Murray, and Yi Tang Betting against Beta or Demand for Lottery

IntroductionData, Variables, and Sample
Empirical ResultsConclusion
β and Stock ReturnsMAX and Stock Returnsβ, MAX , and Stock ReturnsLottery Demand as the ChannelFMAX FactorMAX is Lottery Demand
Bivariate Portfolios - Control for Risk
1 10(Low) 2 3 4 5 6 7 8 9 (High) High-Low FFC4 α
COSKEW 0.72 0.77 0.75 0.78 0.70 0.74 0.68 0.67 0.60 0.37 -0.35 -0.50(-1.23) (-2.60)
TSKEW 0.69 0.75 0.78 0.79 0.77 0.75 0.71 0.66 0.56 0.32 -0.37 -0.52(-1.24) (-2.63)
DRISK 0.77 0.76 0.73 0.79 0.72 0.71 0.67 0.60 0.62 0.42 -0.35 -0.36(-2.36) (-2.97)
TRISK 0.75 0.75 0.79 0.75 0.72 0.67 0.73 0.65 0.59 0.37 -0.38 -0.45(-1.46) (-2.63)
Risk fails to explain betting against beta phenomenon
Turan G. Bali, Stephen J. Brown, Scott Murray, and Yi Tang Betting against Beta or Demand for Lottery

IntroductionData, Variables, and Sample
Empirical ResultsConclusion
β and Stock ReturnsMAX and Stock Returnsβ, MAX , and Stock ReturnsLottery Demand as the ChannelFMAX FactorMAX is Lottery Demand
Bivariate Portfolios - Control for Funding Liquidity
1 10(Low) 2 3 4 5 6 7 8 9 (High) High-Low FFC4 α
βTED 0.70 0.79 0.74 0.78 0.70 0.72 0.64 0.57 0.50 0.31 -0.40 -0.54(-1.58) (-2.88)
βVOLTED 0.80 0.89 0.85 0.82 0.81 0.81 0.75 0.73 0.64 0.40 -0.40 -0.59(-1.18) (-2.22)
βTBILL 0.76 0.80 0.85 0.80 0.77 0.79 0.72 0.71 0.61 0.45 -0.43 -0.57(-1.57) (-3.02)
βFLEV 0.74 0.81 0.85 0.76 0.81 0.77 0.71 0.65 0.54 0.29 -0.34 -0.52(-1.32) (-2.82)
Funding liquidity sensitivity fails to explain betting againstbeta phenomenon
Turan G. Bali, Stephen J. Brown, Scott Murray, and Yi Tang Betting against Beta or Demand for Lottery

IntroductionData, Variables, and Sample
Empirical ResultsConclusion
β and Stock ReturnsMAX and Stock Returnsβ, MAX , and Stock ReturnsLottery Demand as the ChannelFMAX FactorMAX is Lottery Demand
Fama-MacBeth (1973) Regressions
Regressions with and without MAX
Specification indicated at bottom
Full results on next slide
Regressions without MAX Regressions with MAX
(1) (2) (3) (4) (5) (6)
β 0.060 0.174 0.263 0.265 0.427 0.470(0.44) (0.97) (1.08) (1.93) (2.34) (1.90)
MAX -0.355 -0.358 -0.223(-8.43) (-8.49) (-6.16)
Firm Chars Yes Yes Yes Yes Yes YesRisk No Yes Yes No Yes YesFund Liq No No Yes No No Yes
MAX included → β positively related to future stock returns
Turan G. Bali, Stephen J. Brown, Scott Murray, and Yi Tang Betting against Beta or Demand for Lottery
IntroductionData, Variables, and Sample
Empirical ResultsConclusion
β and Stock ReturnsMAX and Stock Returnsβ, MAX , and Stock ReturnsLottery Demand as the ChannelFMAX FactorMAX is Lottery Demand
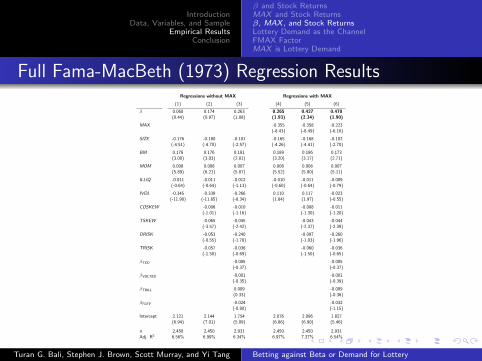
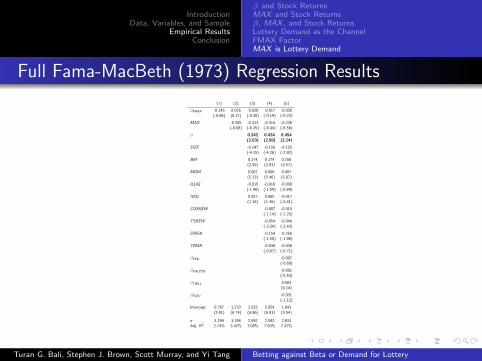
Full Fama-MacBeth (1973) Regression ResultsRegressions without MAX Regressions with MAX
(1) (2) (3) (4) (5) (6)
β 0.060 0.174 0.263 0.265 0.427 0.470(0.44) (0.97) (1.08) (1.93) (2.34) (1.90)
MAX -0.355 -0.358 -0.223(-8.43) (-8.49) (-6.16)
SIZE -0.176 -0.180 -0.101 -0.165 -0.168 -0.102(-4.51) (-4.70) (-2.57) (-4.26) (-4.41) (-2.70)
BM 0.176 0.176 0.181 0.189 0.186 0.173(3.00) (3.03) (2.81) (3.20) (3.17) (2.71)
MOM 0.008 0.008 0.007 0.008 0.008 0.007(5.89) (6.21) (5.87) (5.52) (5.80) (5.11)
ILLIQ -0.011 -0.011 -0.012 -0.010 -0.011 -0.009(-0.64) (-0.64) (-1.13) (-0.60) (-0.64) (-0.79)
IVOL -0.345 -0.339 -0.266 0.110 0.117 -0.023(-11.90) (-11.85) (-8.34) (1.84) (1.97) (-0.55)
COSKEW -0.006 -0.010 -0.008 -0.011(-1.01) (-1.16) (-1.30) (-1.20)
TSKEW -0.065 -0.045 -0.043 -0.044(-3.57) (-2.42) (-2.37) (-2.39)
DRISK -0.053 -0.240 -0.097 -0.260(-0.55) (-1.78) (-1.03) (-1.96)
TRISK -0.057 -0.036 -0.060 -0.036(-1.50) (-0.69) (-1.50) (-0.65)
βTED -0.005 -0.005(-0.37) (-0.37)
βVOLTED -0.001 -0.001(-0.35) (-0.39)
βTBILL 0.009 -0.009(0.33) (-0.36)
βFLEV -0.024 -0.032(-0.80) (-1.15)
Intercept 2.121 2.144 1.754 2.076 2.096 1.827(6.94) (7.01) (5.09) (6.86) (6.90) (5.46)
n 2,450 2,450 2,931 2,450 2,450 2,931Adj. R2 6.56% 6.99% 6.34% 6.97% 7.37% 6.54%
Turan G. Bali, Stephen J. Brown, Scott Murray, and Yi Tang Betting against Beta or Demand for Lottery

IntroductionData, Variables, and Sample
Empirical ResultsConclusion
β and Stock ReturnsMAX and Stock Returnsβ, MAX , and Stock ReturnsLottery Demand as the ChannelFMAX FactorMAX is Lottery Demand
Bivariate Independent Sort Portfolios
Sort Independently on β and MAXHigh-Low β portfolio gives returns driven by β
Conditional on MAX
High-Low MAX portfolio gives returns driven by MAX
Conditional on β
Results on next slide
ResultsMAX explains betting against beta effect
High-Low β portfolios have insignificant alphas
Lottery demand effect persists after controlling for β
High-Low MAX portfolios have large and significant alphas
Turan G. Bali, Stephen J. Brown, Scott Murray, and Yi Tang Betting against Beta or Demand for Lottery

IntroductionData, Variables, and Sample
Empirical ResultsConclusion
β and Stock ReturnsMAX and Stock Returnsβ, MAX , and Stock ReturnsLottery Demand as the ChannelFMAX FactorMAX is Lottery Demand
Bivariate Independent Sort Portfolio Returns
MAX
1
MAX
2
MAX
3
MAX
4
MAX
5
MAX
6
MAX
7
MAX
8
MAX
9
MAX
10
Hig
h-
Low
FF
C4α
β 1 (Low) 0.61 0.94 0.94 1.05 0.96 0.93 0.86 0.71 0.66 -0.20 -0.81 -1.31(-2.75) (-5.43)
β 2 0.71 1.00 0.95 0.92 0.77 0.97 1.00 0.68 0.47 -0.20 -0.92 -1.23(-3.98) (-5.95)
β 3 0.77 0.94 1.00 0.92 0.83 0.88 0.78 0.85 0.44 -0.55 -1.32 -1.57(-5.41) (-6.97)
β 4 0.92 1.03 0.92 0.88 1.00 0.75 0.65 0.75 0.24 -0.37 -1.28 -1.60(-5.60) (-7.43)
β 5 1.00 0.98 1.04 1.08 0.95 0.73 0.79 0.66 0.34 -0.26 -1.26 -1.48(-4.68) (-5.91)
β 6 1.10 1.04 1.00 0.93 0.96 0.78 0.70 0.59 0.24 -0.43 -1.50 -1.82(-5.74) (-6.93)
β 7 0.90 1.14 0.95 0.77 0.89 0.88 0.87 0.56 0.35 -0.22 -1.19 -1.48(-3.82) (-5.29)
β 8 1.38 1.10 0.94 0.82 0.85 0.81 0.85 0.72 0.41 -0.40 -1.75 -2.20(-5.54) (-6.39)
β 9 1.45 0.87 0.97 0.88 0.84 0.73 0.80 0.54 0.22 -0.45 -1.94 -2.11(-4.36) (-5.05)
β 10 (High) 0.33 1.36 1.32 1.25 0.93 0.78 0.66 0.79 0.28 -0.65 -1.05 -1.58(-1.83) (-2.70)
High-Low -0.19 0.40 0.36 0.16 -0.05 -0.16 -0.20 0.07 -0.38 -0.42(-0.35) (1.05) (0.94) (0.47) (-0.15) (-0.51) (-0.60) (0.23) (-1.15) (-1.09)
FFC4 α 0.00 -0.03 0.02 0.05 -0.29 -0.30 -0.30 0.02 -0.38 -0.31(0.00) (-0.08) (0.04) (0.16) (-0.96) (-1.12) (-1.18) (0.06) (-1.61) (-1.02)
Turan G. Bali, Stephen J. Brown, Scott Murray, and Yi Tang Betting against Beta or Demand for Lottery

IntroductionData, Variables, and Sample
Empirical ResultsConclusion
β and Stock ReturnsMAX and Stock Returnsβ, MAX , and Stock ReturnsLottery Demand as the ChannelFMAX FactorMAX is Lottery Demand
Univariate β⊥MAX Portfolio Excess Returns
β⊥MAX is portion of β that is orthogonal to MAX
Run cross-sectional regression of β on MAX
β⊥MAX is intercept plus residual
1 10Value (Low) 2 3 4 5 6 7 8 9 (High) High-Low
β⊥MAX -0.02 0.31 0.47 0.60 0.73 0.85 0.99 1.16 1.40 1.90
R 0.45 0.70 0.71 0.71 0.74 0.79 0.77 0.73 0.61 0.58 0.13(2.01) (3.43) (3.36) (3.21) (3.17) (3.21) (2.99) (2.66) (2.00) (1.56) (0.50)
FFC4 α -0.11 0.16 0.11 0.05 0.05 0.07 0.02 -0.03 -0.09 -0.06 0.05(-1.12) (2.11) (1.58) (0.90) (0.91) (1.23) (0.40) (-0.56) (-1.17) (-0.49) (0.25)
β⊥MAX unrelated to returns
High-Low alpha of 0.05% small and insignificant
MAX explains betting against beta phenomenon
Turan G. Bali, Stephen J. Brown, Scott Murray, and Yi Tang Betting against Beta or Demand for Lottery

IntroductionData, Variables, and Sample
Empirical ResultsConclusion
β and Stock ReturnsMAX and Stock Returnsβ, MAX , and Stock ReturnsLottery Demand as the ChannelFMAX FactorMAX is Lottery Demand
Univariate MAX⊥β Portfolio Excess Returns
MAX⊥β is portion of MAX that is orthogonal to βRun cross-sectional regression of MAX on β
MAX⊥β is intercept plus residual
1 10Value (Low) 2 3 4 5 6 7 8 9 (High) High-Low
Max⊥β -0.03 0.57 0.91 1.24 1.57 1.94 2.38 2.94 3.81 6.44
R 0.90 0.91 0.89 0.85 0.90 0.82 0.77 0.61 0.43 -0.29 -1.19(3.75) (4.21) (4.19) (3.83) (3.92) (3.36) (3.00) (2.24) (1.49) (-0.88) (-6.72)
FFC4 α 0.35 0.34 0.31 0.25 0.27 0.14 0.07 -0.11 -0.33 -1.09 -1.44(3.85) (5.77) (5.68) (4.92) (5.19) (2.97) (1.41) (-2.22) (-6.11) (-11.99) (-10.62)
MAX⊥β negatively related to returnsHigh-Low alpha of -1.44% large and significant
Similar to unconditional result (FFC4 α = -1.40%)
β fails to explain lottery demand phenomenon
Turan G. Bali, Stephen J. Brown, Scott Murray, and Yi Tang Betting against Beta or Demand for Lottery

IntroductionData, Variables, and Sample
Empirical ResultsConclusion
β and Stock ReturnsMAX and Stock Returnsβ, MAX , and Stock ReturnsLottery Demand as the ChannelFMAX FactorMAX is Lottery Demand
High and Low β, MAX Correlation Months
Univariate Portfolios for Months with High and LowCorrelation Between β and MAX : ρβ,MAX
Median cross-sectional correlation is 0.29
Low correlation months: correlation < median
High correlation months: correlation > median
Correlation measured during portfolio formation month
Returns from month after measured correlation
Turan G. Bali, Stephen J. Brown, Scott Murray, and Yi Tang Betting against Beta or Demand for Lottery
IntroductionData, Variables, and Sample
Empirical ResultsConclusion
β and Stock ReturnsMAX and Stock Returnsβ, MAX , and Stock ReturnsLottery Demand as the ChannelFMAX FactorMAX is Lottery Demand
High and Low β, MAX Correlation - β Portfolios
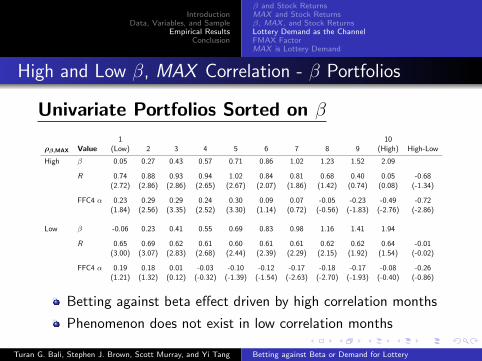
Univariate Portfolios Sorted on β
1 10ρβ,MAX Value (Low) 2 3 4 5 6 7 8 9 (High) High-Low
High β 0.05 0.27 0.43 0.57 0.71 0.86 1.02 1.23 1.52 2.09
R 0.74 0.88 0.93 0.94 1.02 0.84 0.81 0.68 0.40 0.05 -0.68(2.72) (2.86) (2.86) (2.65) (2.67) (2.07) (1.86) (1.42) (0.74) (0.08) (-1.34)
FFC4 α 0.23 0.29 0.29 0.24 0.30 0.09 0.07 -0.05 -0.23 -0.49 -0.72(1.84) (2.56) (3.35) (2.52) (3.30) (1.14) (0.72) (-0.56) (-1.83) (-2.76) (-2.86)
Low β -0.06 0.23 0.41 0.55 0.69 0.83 0.98 1.16 1.41 1.94
R 0.65 0.69 0.62 0.61 0.60 0.61 0.61 0.62 0.62 0.64 -0.01(3.00) (3.07) (2.83) (2.68) (2.44) (2.39) (2.29) (2.15) (1.92) (1.54) (-0.02)
FFC4 α 0.19 0.18 0.01 -0.03 -0.10 -0.12 -0.17 -0.18 -0.17 -0.08 -0.26(1.21) (1.32) (0.12) (-0.32) (-1.39) (-1.54) (-2.63) (-2.70) (-1.93) (-0.40) (-0.86)
Betting against beta effect driven by high correlation months
Phenomenon does not exist in low correlation months
Turan G. Bali, Stephen J. Brown, Scott Murray, and Yi Tang Betting against Beta or Demand for Lottery
IntroductionData, Variables, and Sample
Empirical ResultsConclusion
β and Stock ReturnsMAX and Stock Returnsβ, MAX , and Stock ReturnsLottery Demand as the ChannelFMAX FactorMAX is Lottery Demand
High and Low β, MAX Correlation - MAX Portfolios
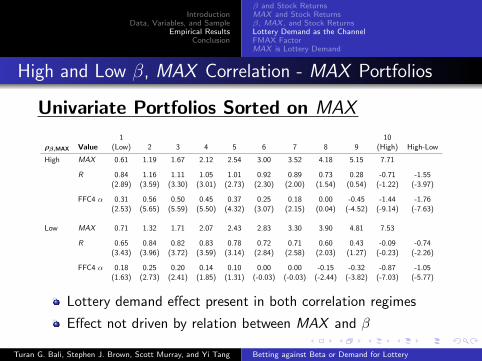
Univariate Portfolios Sorted on MAX
1 10ρβ,MAX Value (Low) 2 3 4 5 6 7 8 9 (High) High-Low
High MAX 0.61 1.19 1.67 2.12 2.54 3.00 3.52 4.18 5.15 7.71
R 0.84 1.16 1.11 1.05 1.01 0.92 0.89 0.73 0.28 -0.71 -1.55(2.89) (3.59) (3.30) (3.01) (2.73) (2.30) (2.00) (1.54) (0.54) (-1.22) (-3.97)
FFC4 α 0.31 0.56 0.50 0.45 0.37 0.25 0.18 0.00 -0.45 -1.44 -1.76(2.53) (5.65) (5.59) (5.50) (4.32) (3.07) (2.15) (0.04) (-4.52) (-9.14) (-7.63)
Low MAX 0.71 1.32 1.71 2.07 2.43 2.83 3.30 3.90 4.81 7.53
R 0.65 0.84 0.82 0.83 0.78 0.72 0.71 0.60 0.43 -0.09 -0.74(3.43) (3.96) (3.72) (3.59) (3.14) (2.84) (2.58) (2.03) (1.27) (-0.23) (-2.26)
FFC4 α 0.18 0.25 0.20 0.14 0.10 0.00 0.00 -0.15 -0.32 -0.87 -1.05(1.63) (2.73) (2.41) (1.85) (1.31) (-0.03) (-0.03) (-2.44) (-3.82) (-7.03) (-5.77)
Lottery demand effect present in both correlation regimes
Effect not driven by relation between MAX and β
Turan G. Bali, Stephen J. Brown, Scott Murray, and Yi Tang Betting against Beta or Demand for Lottery

IntroductionData, Variables, and Sample
Empirical ResultsConclusion
β and Stock ReturnsMAX and Stock Returnsβ, MAX , and Stock ReturnsLottery Demand as the ChannelFMAX FactorMAX is Lottery Demand
Institutional Holdings and Betting against Beta
Bivariate Portfolios Sorted on INST then β
INST
1
INST
2
INST
3
INST
4
INST
5
INST
6
INST
7
INST
8
INST
9
INST
10
β 1 (Low) 0.45 0.93 0.85 0.82 0.85 0.74 0.68 0.86 0.76 0.75β 2 0.59 1.08 0.94 0.82 0.91 0.77 0.90 0.74 0.78 0.84β 3 0.72 0.75 0.80 0.91 0.82 0.78 0.83 0.84 0.90 0.67β 4 0.67 0.86 0.91 0.76 0.81 0.87 0.92 0.88 0.84 0.99β 5 0.76 0.76 0.78 0.88 0.95 0.76 0.85 0.89 0.91 0.90β 6 0.61 0.47 0.63 0.59 0.66 0.64 0.95 0.72 0.81 0.94β 7 0.45 0.47 0.45 0.71 0.70 0.68 0.74 0.92 0.95 1.03β 8 0.37 0.24 0.37 0.50 0.50 0.60 1.02 0.98 0.93 1.05β 9 -0.30 -0.27 0.17 0.20 0.24 0.58 0.65 0.77 0.92 1.21β 10 (High) -1.16 -0.87 -0.44 -0.31 -0.06 0.10 0.50 0.81 0.88 1.18
High-Low -1.61 -1.80 -1.29 -1.13 -0.91 -0.64 -0.18 -0.05 0.12 0.43(-4.42) (-4.10) (-2.87) (-2.44) (-1.98) (-1.43) (-0.43) (-0.12) (0.29) (1.02)
FFC4 α -1.91 -1.91 -1.31 -1.22 -1.01 -0.75 -0.18 -0.03 0.11 0.41(-6.88) (-6.00) (-3.59) (-3.15) (-3.07) (-2.77) (-0.64) (-0.10) (0.31) (1.17)
Betting against beta only works in low INST stocks
Not held by mutual funds, pension funds, etc.
Turan G. Bali, Stephen J. Brown, Scott Murray, and Yi Tang Betting against Beta or Demand for Lottery
IntroductionData, Variables, and Sample
Empirical ResultsConclusion
β and Stock ReturnsMAX and Stock Returnsβ, MAX , and Stock ReturnsLottery Demand as the ChannelFMAX FactorMAX is Lottery Demand
Institutional Holdings and Lottery Demand
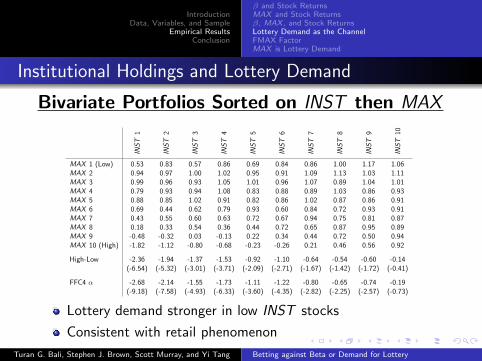
Bivariate Portfolios Sorted on INST then MAX
INST
1
INST
2
INST
3
INST
4
INST
5
INST
6
INST
7
INST
8
INST
9
INST
10
MAX 1 (Low) 0.53 0.83 0.57 0.86 0.69 0.84 0.86 1.00 1.17 1.06MAX 2 0.94 0.97 1.00 1.02 0.95 0.91 1.09 1.13 1.03 1.11MAX 3 0.99 0.96 0.93 1.05 1.01 0.96 1.07 0.89 1.04 1.01MAX 4 0.79 0.93 0.94 1.08 0.83 0.88 0.89 1.03 0.86 0.93MAX 5 0.88 0.85 1.02 0.91 0.82 0.86 1.02 0.87 0.86 0.91MAX 6 0.69 0.44 0.62 0.79 0.93 0.60 0.84 0.72 0.93 0.91MAX 7 0.43 0.55 0.60 0.63 0.72 0.67 0.94 0.75 0.81 0.87MAX 8 0.18 0.33 0.54 0.36 0.44 0.72 0.65 0.87 0.95 0.89MAX 9 -0.48 -0.32 0.03 -0.13 0.22 0.34 0.44 0.72 0.50 0.94MAX 10 (High) -1.82 -1.12 -0.80 -0.68 -0.23 -0.26 0.21 0.46 0.56 0.92
High-Low -2.36 -1.94 -1.37 -1.53 -0.92 -1.10 -0.64 -0.54 -0.60 -0.14(-6.54) (-5.32) (-3.01) (-3.71) (-2.09) (-2.71) (-1.67) (-1.42) (-1.72) (-0.41)
FFC4 α -2.68 -2.14 -1.55 -1.73 -1.11 -1.22 -0.80 -0.65 -0.74 -0.19(-9.18) (-7.58) (-4.93) (-6.33) (-3.60) (-4.35) (-2.82) (-2.25) (-2.57) (-0.73)
Lottery demand stronger in low INST stocks
Consistent with retail phenomenon
Turan G. Bali, Stephen J. Brown, Scott Murray, and Yi Tang Betting against Beta or Demand for Lottery
IntroductionData, Variables, and Sample
Empirical ResultsConclusion
β and Stock ReturnsMAX and Stock Returnsβ, MAX , and Stock ReturnsLottery Demand as the ChannelFMAX FactorMAX is Lottery Demand
Lottery Demand Factor
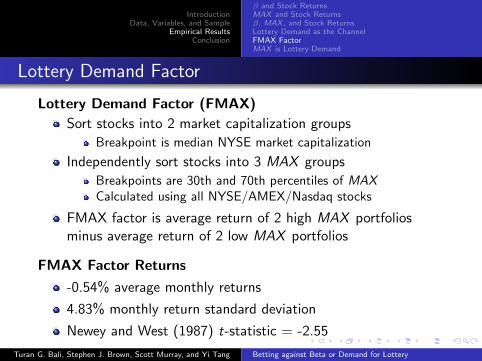
Lottery Demand Factor (FMAX)
Sort stocks into 2 market capitalization groups
Breakpoint is median NYSE market capitalization
Independently sort stocks into 3 MAX groups
Breakpoints are 30th and 70th percentiles of MAXCalculated using all NYSE/AMEX/Nasdaq stocks
FMAX factor is average return of 2 high MAX portfoliosminus average return of 2 low MAX portfolios
FMAX Factor Returns
-0.54% average monthly returns
4.83% monthly return standard deviation
Newey and West (1987) t-statistic = -2.55
Turan G. Bali, Stephen J. Brown, Scott Murray, and Yi Tang Betting against Beta or Demand for Lottery

IntroductionData, Variables, and Sample
Empirical ResultsConclusion
β and Stock ReturnsMAX and Stock Returnsβ, MAX , and Stock ReturnsLottery Demand as the ChannelFMAX FactorMAX is Lottery Demand
Factor Analysis of High-Low β Portfolio
Factor Sensitivities Using 4 Different Factor Models
PS is Pastor and Stambaugh (2003) liquidity factor
Only available 1968 - 2011
α βMKTRF βSMB βHML βUMD βPS βFMAX N Adj. R2
FFC4 -0.51 0.98 0.58 -0.74 -0.21 593 73.43%(-2.50) (13.46) (8.26) (-6.36) (-2.68)
FFC4+PS -0.49 0.98 0.53 -0.77 -0.24 -0.09 540 74.58%(-2.26) (13.17) (7.34) (-6.60) (-3.05) (-1.35)
FFC4+FMAX 0.06 0.61 0.09 -0.30 -0.19 0.85 593 84.79%(0.35) (10.31) (1.12) (-4.69) (-4.11) (12.49)
FFC4+PS+FMAX 0.04 0.63 0.07 -0.32 -0.21 -0.03 0.82 540 85.06%(0.22) (10.50) (0.92) (-4.79) (-4.21) (-0.75) (11.72)
Lottery demand factor explains alpha of High-Low β portfolio
Turan G. Bali, Stephen J. Brown, Scott Murray, and Yi Tang Betting against Beta or Demand for Lottery
IntroductionData, Variables, and Sample
Empirical ResultsConclusion
β and Stock ReturnsMAX and Stock Returnsβ, MAX , and Stock ReturnsLottery Demand as the ChannelFMAX FactorMAX is Lottery Demand
β Decile Portfolio Alphas
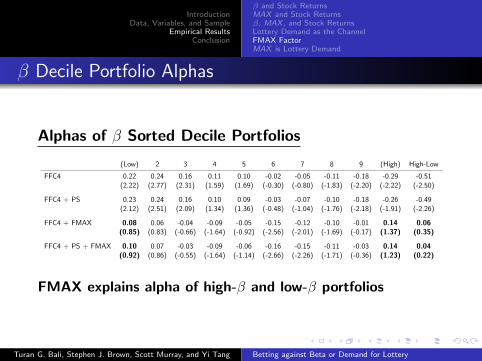
Alphas of β Sorted Decile Portfolios
(Low) 2 3 4 5 6 7 8 9 (High) High-Low
FFC4 0.22 0.24 0.16 0.11 0.10 -0.02 -0.05 -0.11 -0.18 -0.29 -0.51(2.22) (2.77) (2.31) (1.59) (1.69) (-0.30) (-0.80) (-1.83) (-2.20) (-2.22) (-2.50)
FFC4 + PS 0.23 0.24 0.16 0.10 0.09 -0.03 -0.07 -0.10 -0.18 -0.26 -0.49(2.12) (2.51) (2.09) (1.34) (1.36) (-0.48) (-1.04) (-1.76) (-2.18) (-1.91) (-2.26)
FFC4 + FMAX 0.08 0.06 -0.04 -0.09 -0.05 -0.15 -0.12 -0.10 -0.01 0.14 0.06(0.85) (0.83) (-0.66) (-1.64) (-0.92) (-2.56) (-2.01) (-1.69) (-0.17) (1.37) (0.35)
FFC4 + PS + FMAX 0.10 0.07 -0.03 -0.09 -0.06 -0.16 -0.15 -0.11 -0.03 0.14 0.04(0.92) (0.86) (-0.55) (-1.64) (-1.14) (-2.66) (-2.26) (-1.71) (-0.36) (1.23) (0.22)
FMAX explains alpha of high-β and low-β portfolios
Turan G. Bali, Stephen J. Brown, Scott Murray, and Yi Tang Betting against Beta or Demand for Lottery
IntroductionData, Variables, and Sample
Empirical ResultsConclusion
β and Stock ReturnsMAX and Stock Returnsβ, MAX , and Stock ReturnsLottery Demand as the ChannelFMAX FactorMAX is Lottery Demand
BAB Factor
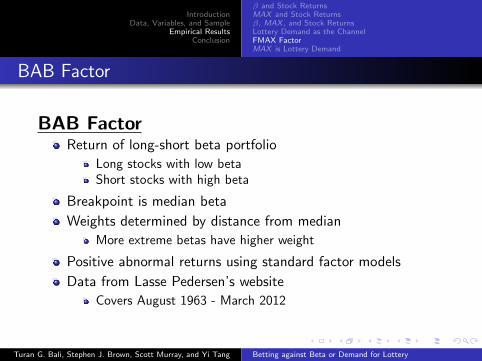
BAB FactorReturn of long-short beta portfolio
Long stocks with low betaShort stocks with high beta
Breakpoint is median beta
Weights determined by distance from median
More extreme betas have higher weight
Positive abnormal returns using standard factor models
Data from Lasse Pedersen’s website
Covers August 1963 - March 2012
Turan G. Bali, Stephen J. Brown, Scott Murray, and Yi Tang Betting against Beta or Demand for Lottery

IntroductionData, Variables, and Sample
Empirical ResultsConclusion
β and Stock ReturnsMAX and Stock Returnsβ, MAX , and Stock ReturnsLottery Demand as the ChannelFMAX FactorMAX is Lottery Demand
BAB Factor Sensitivities
Factor Analysis of BAB Factor Returns
Specification α βMKTRF βSMB βHML βUMD βPS βFMAX N Adj. R2
FFC4 0.54 0.05 -0.01 0.51 0.18 584 21.03%(3.38) (1.06) (-0.09) (5.01) (2.87)
FFC4+PS 0.57 0.06 0.02 0.53 0.20 0.06 531 23.44%(3.34) (1.23) (0.30) (5.18) (3.13) (0.96)
FFC4+FMAX 0.17 0.29 0.31 0.21 0.17 -0.55 584 46.95%(1.23) (8.22) (5.46) (3.49) (4.39) (-11.84)
FFC4+PS+FMAX 0.22 0.29 0.32 0.24 0.19 0.03 -0.54 531 47.38%(1.39) (7.96) (5.29) (3.72) (4.43) (0.63) (-11.11)
FMAX factor explains returns of BAB factor
Turan G. Bali, Stephen J. Brown, Scott Murray, and Yi Tang Betting against Beta or Demand for Lottery

IntroductionData, Variables, and Sample
Empirical ResultsConclusion
β and Stock ReturnsMAX and Stock Returnsβ, MAX , and Stock ReturnsLottery Demand as the ChannelFMAX FactorMAX is Lottery Demand
FMAX Factor Sensitivities
Factor Analysis of FMAX Factor Returns
Specification α βMKTRF βSMB βHML βUMD βPS βBAB N Adj. R2
FFC4 -0.67 0.43 0.58 -0.53 -0.01 584 62.24%(-5.12) (8.36) (6.39) (-4.59) (-0.19)
FFC4+PS -0.65 0.42 0.56 -0.54 -0.03 -0.06 540 62.36%(-4.60) (8.17) (5.51) (-4.72) (-0.41) (-1.00)
FFC4+BAB -0.35 0.46 0.58 -0.23 0.09 -0.60 584 74.64%(-2.88) (13.06) (8.22) (-3.09) (1.67) (-11.44)
FFC4+PS+BAB -0.32 0.46 0.57 -0.24 0.09 -0.02 -0.59 531 74.20%(-2.32) (12.66) (7.35) (-3.11) (1.46) (-0.55) (-10.90)
FMAX factor returns not explained by BAB factor
Turan G. Bali, Stephen J. Brown, Scott Murray, and Yi Tang Betting against Beta or Demand for Lottery

IntroductionData, Variables, and Sample
Empirical ResultsConclusion
β and Stock ReturnsMAX and Stock Returnsβ, MAX , and Stock ReturnsLottery Demand as the ChannelFMAX FactorMAX is Lottery Demand
Proxy for Risk-Factor Sensitivity?
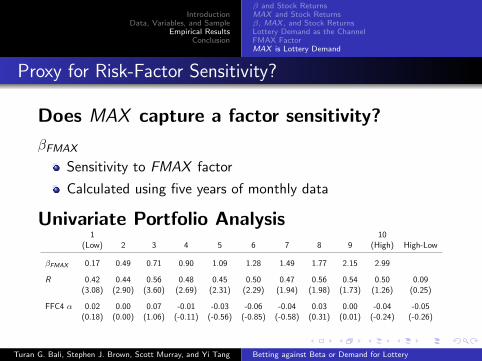
Does MAX capture a factor sensitivity?
βFMAX
Sensitivity to FMAX factor
Calculated using five years of monthly data
Univariate Portfolio Analysis1 10
(Low) 2 3 4 5 6 7 8 9 (High) High-Low
βFMAX 0.17 0.49 0.71 0.90 1.09 1.28 1.49 1.77 2.15 2.99
R 0.42 0.44 0.56 0.48 0.45 0.50 0.47 0.56 0.54 0.50 0.09(3.08) (2.90) (3.60) (2.69) (2.31) (2.29) (1.94) (1.98) (1.73) (1.26) (0.25)
FFC4 α 0.02 0.00 0.07 -0.01 -0.03 -0.06 -0.04 0.03 0.00 -0.04 -0.05(0.18) (0.00) (1.06) (-0.11) (-0.56) (-0.85) (-0.58) (0.31) (0.01) (-0.24) (-0.26)
Turan G. Bali, Stephen J. Brown, Scott Murray, and Yi Tang Betting against Beta or Demand for Lottery
IntroductionData, Variables, and Sample
Empirical ResultsConclusion
β and Stock ReturnsMAX and Stock Returnsβ, MAX , and Stock ReturnsLottery Demand as the ChannelFMAX FactorMAX is Lottery Demand
Proxy for Risk-Factor Sensitivity?
Does MAX capture a factor sensitivity?
βFMAX
Sensitivity to FMAX factor
Calculated using five years of monthly data
Univariate Portfolio Analysis1 10
(Low) 2 3 4 5 6 7 8 9 (High) High-Low
βFMAX 0.17 0.49 0.71 0.90 1.09 1.28 1.49 1.77 2.15 2.99
R 0.42 0.44 0.56 0.48 0.45 0.50 0.47 0.56 0.54 0.50 0.09(3.08) (2.90) (3.60) (2.69) (2.31) (2.29) (1.94) (1.98) (1.73) (1.26) (0.25)
FFC4 α 0.02 0.00 0.07 -0.01 -0.03 -0.06 -0.04 0.03 0.00 -0.04 -0.05(0.18) (0.00) (1.06) (-0.11) (-0.56) (-0.85) (-0.58) (0.31) (0.01) (-0.24) (-0.26)
Turan G. Bali, Stephen J. Brown, Scott Murray, and Yi Tang Betting against Beta or Demand for Lottery

IntroductionData, Variables, and Sample
Empirical ResultsConclusion
β and Stock ReturnsMAX and Stock Returnsβ, MAX , and Stock ReturnsLottery Demand as the ChannelFMAX FactorMAX is Lottery Demand
Fama-MacBeth (1973) Regressions
Regressions with and without MAX
Full results on next slide
(1) (2) (3) (4) (5)
βFMAX -0.145 0.035 -0.028 -0.017 -0.026(-0.96) (0.27) (-0.30) (-0.19) (-0.23)
MAX -0.205 -0.313 -0.314 -0.226(-9.08) (-8.35) (-8.44) (-6.56)
β 0.242 0.434 0.454(2.03) (2.50) (2.14)
Firm Chars No No Yes Yes YesRisk No No No Yes YesFund Liq No No No No Yes
βFMAX has no relation with future stock returns
β remains positively related to future stock returns
MAX remains negatively related to future stock returns
Turan G. Bali, Stephen J. Brown, Scott Murray, and Yi Tang Betting against Beta or Demand for Lottery
IntroductionData, Variables, and Sample
Empirical ResultsConclusion
β and Stock ReturnsMAX and Stock Returnsβ, MAX , and Stock ReturnsLottery Demand as the ChannelFMAX FactorMAX is Lottery Demand
Full Fama-MacBeth (1973) Regression Results
(1) (2) (3) (4) (5)
βFMAX -0.145 0.035 -0.028 -0.017 -0.026(-0.96) (0.27) (-0.30) (-0.19) (-0.23)
MAX -0.205 -0.313 -0.314 -0.226(-9.08) (-8.35) (-8.44) (-6.56)
β 0.242 0.434 0.454(2.03) (2.50) (2.14)
SIZE -0.147 -0.150 -0.103(-4.15) (-4.26) (-2.92)
BM 0.174 0.174 0.156(2.92) (2.93) (2.57)
MOM 0.007 0.008 0.007(5.13) (5.46) (5.07)
ILLIQ -0.015 -0.016 -0.009(-1.48) (-1.54) (-0.89)
IVOL 0.057 0.065 -0.017(1.18) (1.36) (-0.41)
COSKEW -0.007 -0.010(-1.14) (-1.23)
TSKEW -0.054 -0.044(-3.24) (-2.43)
DRISK -0.154 -0.256(-1.50) (-1.96)
TRISK -0.038 -0.036(-0.87) (-0.71)
βTED -0.007(-0.60)
βVOLTED -0.001(-0.53)
βTBILL 0.003(0.14)
βFLEV -0.031(-1.12)
Intercept 0.767 1.233 2.032 2.054 1.843(3.81) (6.74) (6.86) (6.83) (5.54)
n 3,194 3,194 2,592 2,592 2,931Adj. R2 2.74% 3.42% 7.00% 7.50% 7.47%
Turan G. Bali, Stephen J. Brown, Scott Murray, and Yi Tang Betting against Beta or Demand for Lottery

IntroductionData, Variables, and Sample
Empirical ResultsConclusion
β and Stock ReturnsMAX and Stock Returnsβ, MAX , and Stock ReturnsLottery Demand as the ChannelFMAX FactorMAX is Lottery Demand
Characteristics of high-MAX and low-MAX stocks
Lottery stocks characterizations - Kumar (2009)
Low prices, high idiosyncratic vol, high idiosyncratic skew
Contemporaneous Characteristics1 10
Value (Low) 2 3 4 5 6 7 8 9 (High) High-Low t-stat
MAX 0.66 1.25 1.69 2.09 2.49 2.91 3.41 4.04 4.98 7.62 6.96 40.99PRICE 70.76 49.56 41.76 34.49 28.79 28.40 23.30 20.25 18.41 14.99 -55.77 -5.90IVOL 0.94 1.20 1.37 1.52 1.71 1.94 2.22 2.57 3.08 4.58 3.64 33.64ISKEW -0.17 0.04 0.07 0.09 0.14 0.19 0.25 0.33 0.43 0.69 0.86 33.67
Future Characteristics1 10
Value (Low) 2 3 4 5 6 7 8 9 (High) High-Low t-stat
MAX 1.65 2.06 2.33 2.55 2.79 3.06 3.35 3.68 4.09 4.83 3.17 31.39PRICE 72.27 50.01 42.26 34.87 29.13 28.62 23.57 20.52 18.76 15.38 -56.89 -5.89IVOL 1.35 1.48 1.60 1.71 1.86 2.04 2.24 2.46 2.75 3.31 1.96 33.41ISKEW 0.21 0.19 0.17 0.17 0.18 0.19 0.20 0.22 0.23 0.26 0.05 3.51
MAX captures lottery qualities of stocks
Turan G. Bali, Stephen J. Brown, Scott Murray, and Yi Tang Betting against Beta or Demand for Lottery

IntroductionData, Variables, and Sample
Empirical ResultsConclusion
Conclusion
Conclusion
Conclusions
Betting against beta phenomenon is driven by demandfor lottery-like assets
Portfolio, regression, and factor analyses all indicate thatlottery demand explains returns of High-Low beta portfolio
Phenomenon exists only when lottery price pressure exertedpredominantly on high-β stocks
Both phenomena driven by low institutional holdings stocksConsistent with lottery demand (retail investors)Inconsistent with leverage constraints (mutual funds, pensions)
Lottery-demand not explained by betting against beta
After controlling for beta, the lottery demand effect persists
Turan G. Bali, Stephen J. Brown, Scott Murray, and Yi Tang Betting against Beta or Demand for Lottery


![APPLICATION FORM FOR 17 UNION ARBITRAGE FUND · 2020-05-08 · Gaming / Gambling / Lottery Services [eg. casinos, betting syndicates] Any other information [Please specify]: ... Give](https://img.pdfslide.us/doc/110x75/5f2df32b940e5d29ab108029/application-form-for-17-union-arbitrage-fund-2020-05-08-gaming-gambling-lottery.jpg)