Embed Size (px)
Citation preview
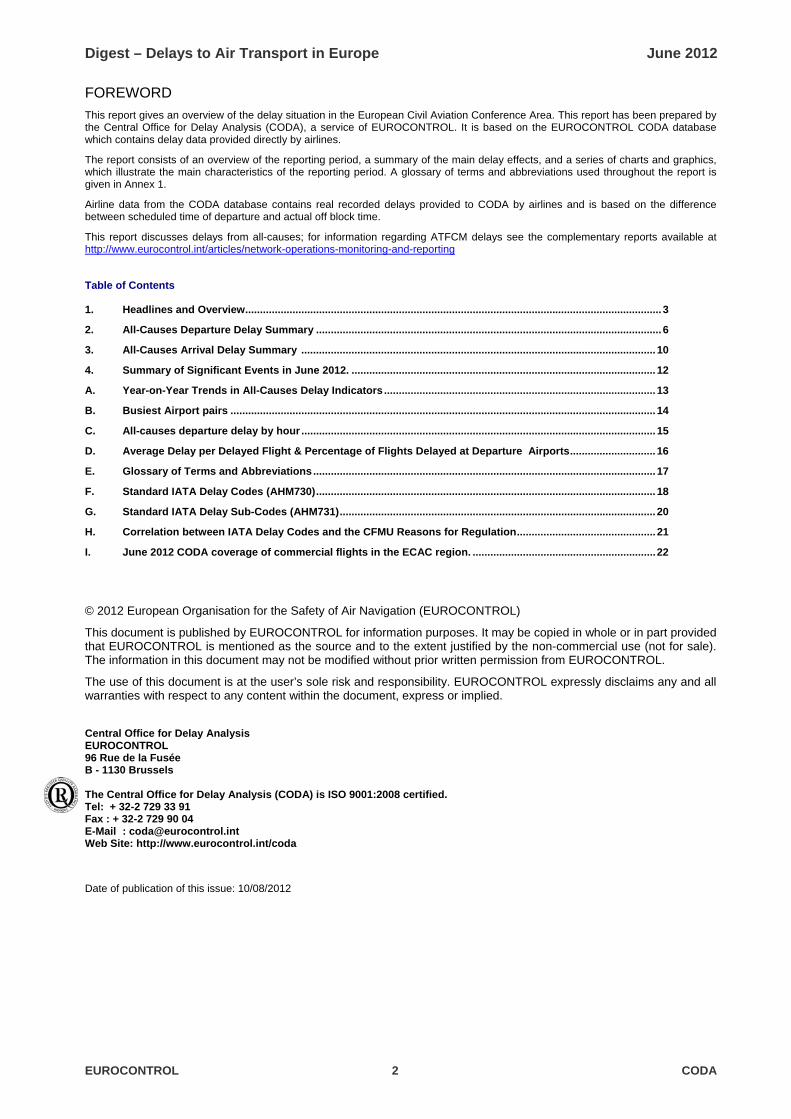
Delays decreased in June 2012, with airline delay data for all causes showing an average delay per delayed flight of 25 minutes, this was a decrease of 14% in comparison to the delays observed in June 2011. This was the best June punctuality of recent years.
Delays decreased in June 2012, with airline delay data for all causes showing an average delay per delayed flight of 25 minutes, this was a decrease of 14% in comparison to the delays observed in June 2011. This was the best June punctuality of recent years.
Digest – Delays to Air Transport in Europe June 2012
FOREWORD
This report gives an overview of the delay situation in the European Civil Aviation Conference Area. This report has been prepared by the Central Office for Delay Analysis (CODA), a service of EUROCONTROL. It is based on the EUROCONTROL CODA database which contains delay data provided directly by airlines.
The report consists of an overview of the reporting period, a summary of the main delay effects, and a series of charts and graphics, which illustrate the main characteristics of the reporting period. A glossary of terms and abbreviations used throughout the report is given in Annex 1.
Airline data from the CODA database contains real recorded delays provided to CODA by airlines and is based on the difference between scheduled time of departure and actual off block time.
This report discusses delays from all-causes; for information regarding ATFCM delays see the complementary reports available at http://www.eurocontrol.int/articles/network-operations-monitoring-and-reporting
Table of Contents
1. Headlines and Overview............................................................................................................................................. 3 2. All-Causes Departure Delay Summary ..................................................................................................................... 6 3. All-Causes Arrival Delay Summary ........................................................................................................................ 10 4. Summary of Significant Events in June 2012. ....................................................................................................... 12 A. Year-on-Year Trends in All-Causes Delay Indicators ............................................................................................ 13 B. Busiest Airport pairs ................................................................................................................................................ 14 C. All-causes departure delay by hour ........................................................................................................................ 15 D. Average Delay per Delayed Flight & Percentage of Flights Delayed at Departure Airports............................. 16 E. Glossary of Terms and Abbreviations.................................................................................................................... 17 F. Standard IATA Delay Codes (AHM730)................................................................................................................... 18 G. Standard IATA Delay Sub-Codes (AHM731)........................................................................................................... 20 H. Correlation between IATA Delay Codes and the CFMU Reasons for Regulation............................................... 21 I. June 2012 CODA coverage of commercial flights in the ECAC region. ..............................................................22
© 2012 European Organisation for the Safety of Air Navigation (EUROCONTROL)
This document is published by EUROCONTROL for information purposes. It may be copied in whole or in part provided that EUROCONTROL is mentioned as the source and to the extent justified by the non-commercial use (not for sale). The information in this document may not be modified without prior written permission from EUROCONTROL.
The use of this document is at the user’s sole risk and responsibility. EUROCONTROL expressly disclaims any and all warranties with respect to any content within the document, express or implied.
Central Office for Delay Analysis EUROCONTROL 96 Rue de la Fusée B - 1130 Brussels
The Central Office for Delay Analysis (CODA) is ISO 9001:2008 certified. Tel: + 32-2 729 33 91 Fax : + 32-2 729 90 04 E-Mail : [email protected] Web Site: http://www.eurocontrol.int/coda
Date of publication of this issue: 10/08/2012
EUROCONTROL 2 CODA
Digest – Delays to Air Transport in Europe June 2012
1. Headlines and Overview.
June 2012 saw a significant reduction in all causes of delay when compared to June 2011. EURO 2012 took place in Poland and Ukraine. Despite the increases in traffic at airports in these countries delays remained at a stable level in Poland with Ukraine seeing a small increase to its average delay per flight. Thunderstorms, heavy rain and low visibility affected operations in Heathrow, Frankfurt, Munich, Brussels, Amsterdam, Zurich and Vienna particularly on the 21st and 29th June. Istanbul Ataturk continues to experience delays due to airport capacity.
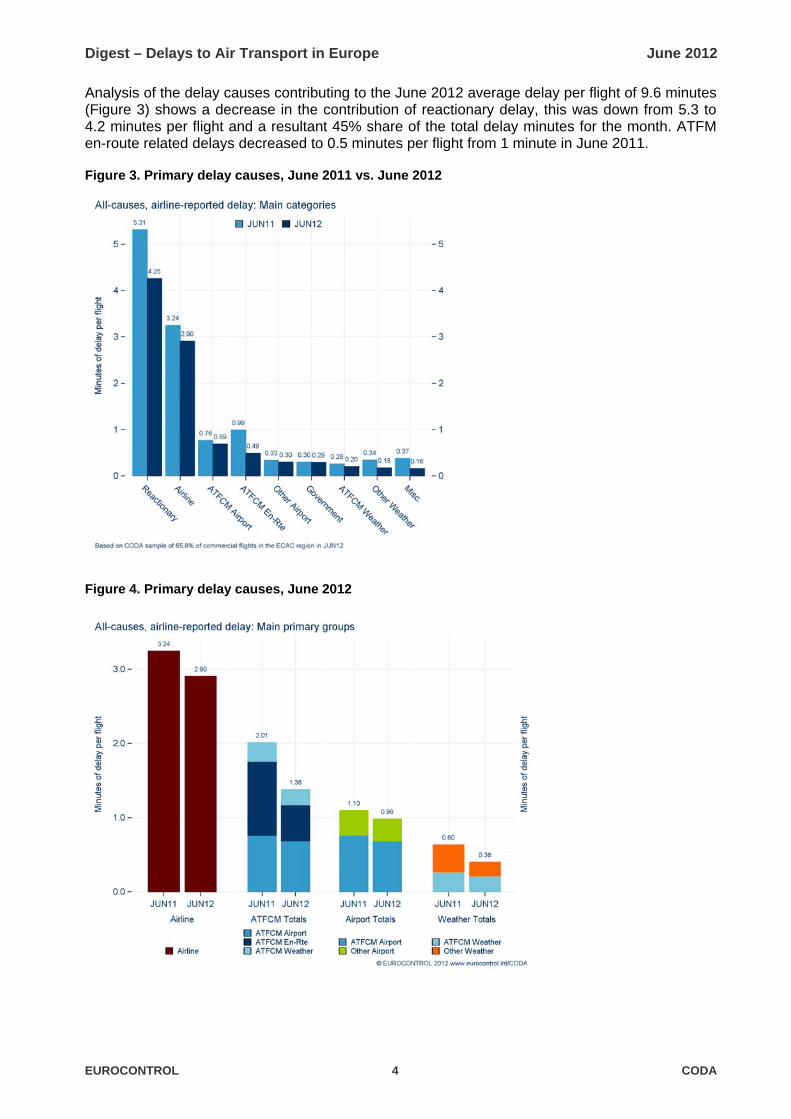
The average delay per delayed flight (ADD) for departure traffic from all-causes of delay was 25 minutes, this was a decrease of 14%.
The percentage of flights delayed (by 5 minutes or more) decreased by 4 percentage points to 38% in comparison to June 2011.
The percentage of flights delayed by more than 15 minutes on departure decreased by 4 percentage points to 17%.
The average delay per delayed flight for arrival traffic from all-causes of delay was 26 minutes, this was a decrease of 14%.
The percentage of flights delayed on arrival (by 5 minutes or more) decreased by 4 percentage points to 36% in comparison to June 2011.
Figure 1. Average Delay per Delayed Departure and Percentage of Delayed Departures Comparison
Figure 2. Average Delay per Delayed Arrival and Percentage of Delayed Arrivals Comparison
EUROCONTROL 3 CODA
Digest – Delays to Air Transport in Europe June 2012
Analysis of the delay causes contributing to the June 2012 average delay per flight of 9.6 minutes (Figure 3) shows a decrease in the contribution of reactionary delay, this was down from 5.3 to 4.2 minutes per flight and a resultant 45% share of the total delay minutes for the month. ATFM en-route related delays decreased to 0.5 minutes per flight from 1 minute in June 2011.
Figure 3. Primary delay causes, June 2011 vs. June 2012
Figure 4. Primary delay causes, June 2012
EUROCONTROL 4 CODA
Digest – Delays to Air Transport in Europe June 2012
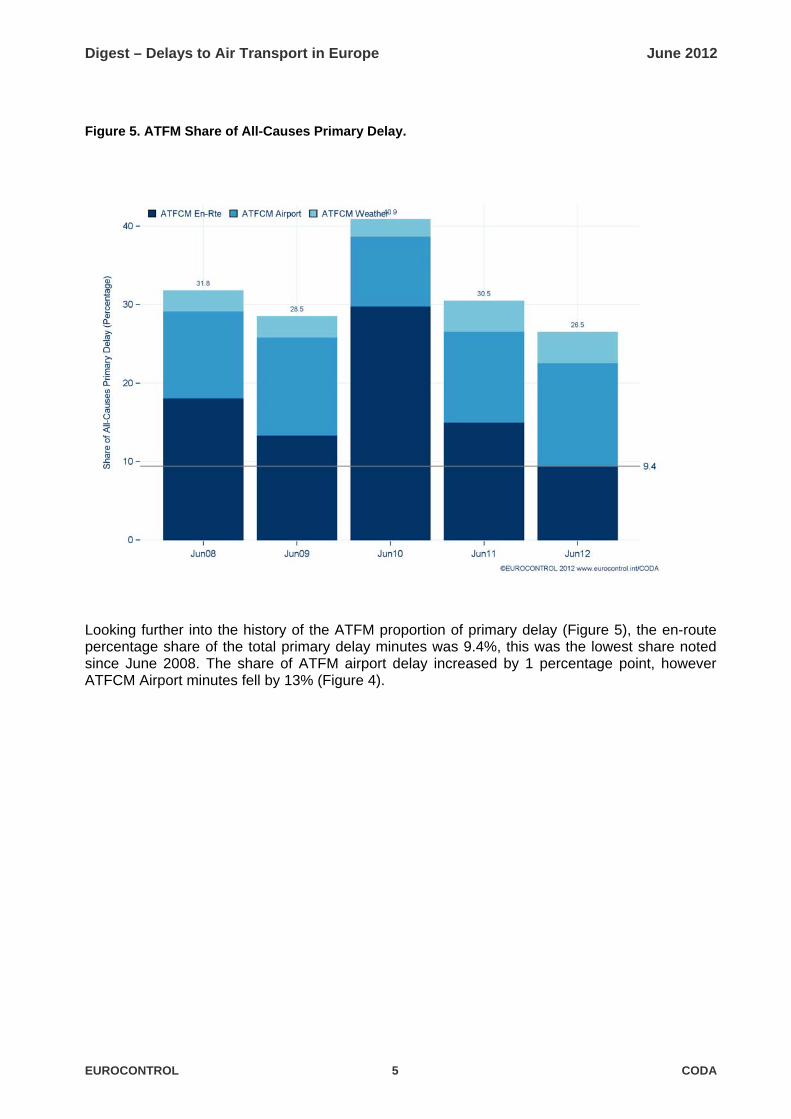
Figure 5. ATFM Share of All-Causes Primary Delay.
Looking further into the history of the ATFM proportion of primary delay (Figure 5), the en-route percentage share of the total primary delay minutes was 9.4%, this was the lowest share noted since June 2008. The share of ATFM airport delay increased by 1 percentage point, however ATFCM Airport minutes fell by 13% (Figure 4).
EUROCONTROL 5 CODA
Digest – Delays to Air Transport in Europe June 2012
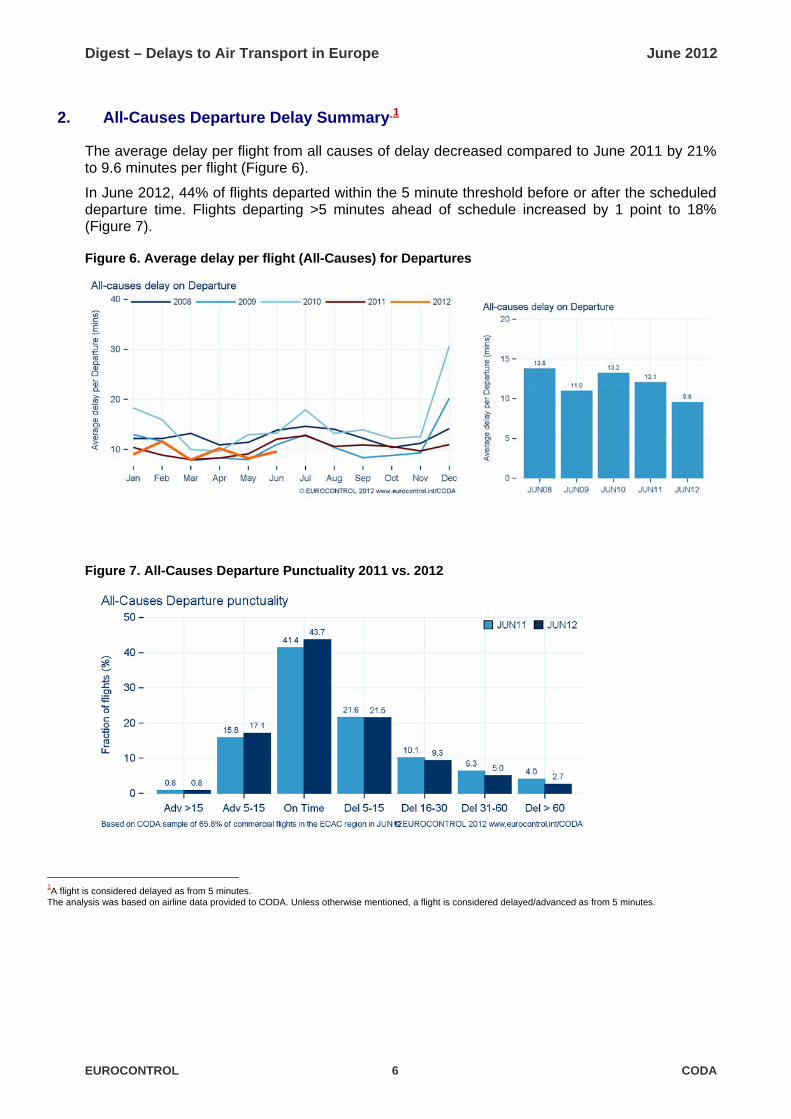
2. All-Causes Departure Delay Summary 1
The average delay per flight from all causes of delay decreased compared to June 2011 by 21% to 9.6 minutes per flight (Figure 6).
In June 2012, 44% of flights departed within the 5 minute threshold before or after the scheduled departure time. Flights departing >5 minutes ahead of schedule increased by 1 point to 18% (Figure 7).
Figure 6. Average delay per flight (All-Causes) for Departures
Figure 7. All-Causes Departure Punctuality 2011 vs. 2012
1A flight is considered delayed as from 5 minutes.
The analysis was based on airline data provided to CODA. Unless otherwise mentioned, a flight is considered delayed/advanced as from 5 minutes.
EUROCONTROL 6 CODA
Digest – Delays to Air Transport in Europe June 2012
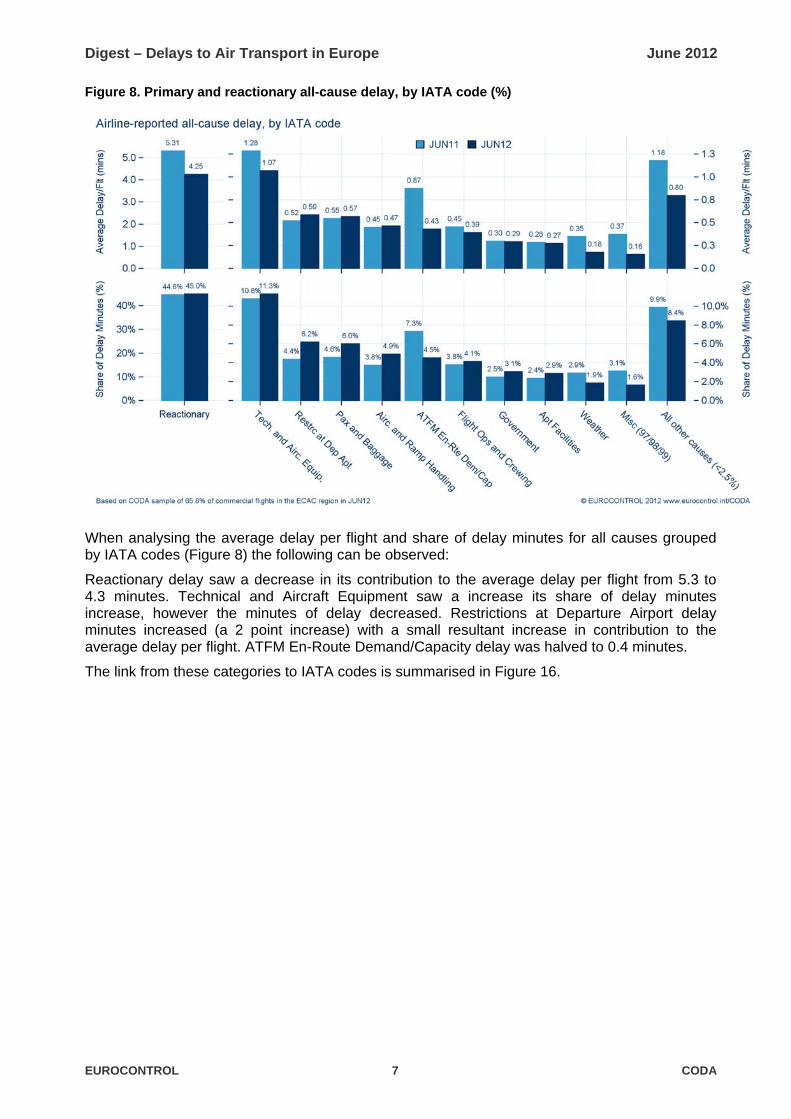
Figure 8. Primary and reactionary all-cause delay, by IATA code (%)
When analysing the average delay per flight and share of delay minutes for all causes grouped by IATA codes (Figure 8) the following can be observed:
Reactionary delay saw a decrease in its contribution to the average delay per flight from 5.3 to 4.3 minutes. Technical and Aircraft Equipment saw a increase its share of delay minutes increase, however the minutes of delay decreased. Restrictions at Departure Airport delay minutes increased (a 2 point increase) with a small resultant increase in contribution to the average delay per flight. ATFM En-Route Demand/Capacity delay was halved to 0.4 minutes.
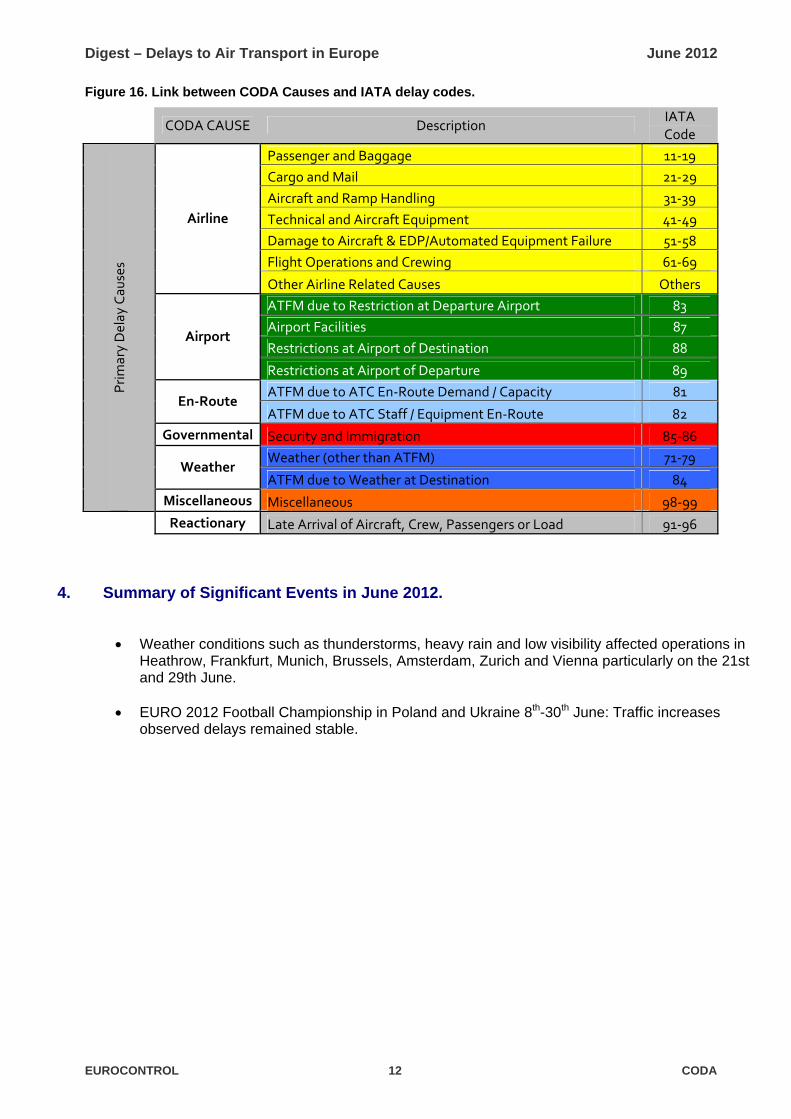
The link from these categories to IATA codes is summarised in Figure 16.
EUROCONTROL 7 CODA
Digest – Delays to Air Transport in Europe June 2012
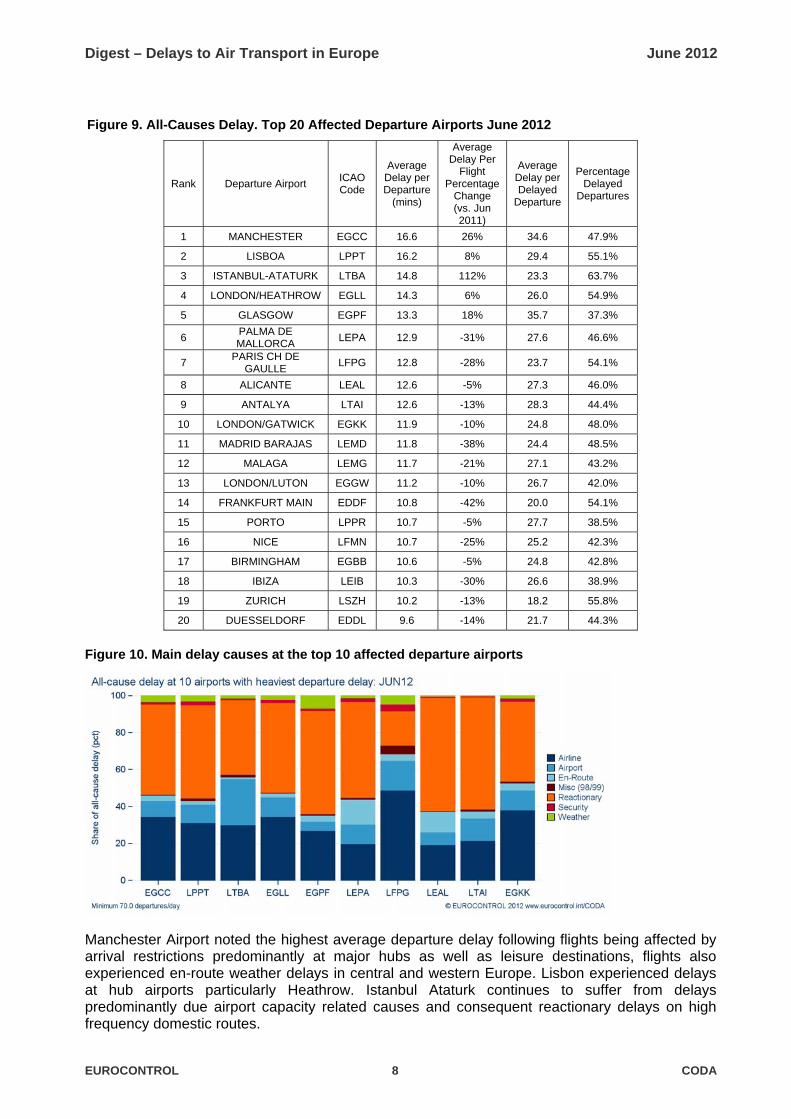
Figure 9. All-Causes Delay. Top 20 Affected Departure Airports June 2012
Rank Departure Airport ICAO Code
Average Delay per Departure
(mins)
Average Delay Per
Flight Percentage
Change (vs. Jun 2011)
Average Delay per Delayed
Departure
Percentage Delayed
Departures
1 MANCHESTER EGCC 16.6 26% 34.6 47.9%
2 LISBOA LPPT 16.2 8% 29.4 55.1%
3 ISTANBUL-ATATURK LTBA 14.8 112% 23.3 63.7%
4 LONDON/HEATHROW EGLL 14.3 6% 26.0 54.9%
5 GLASGOW EGPF 13.3 18% 35.7 37.3%
6 PALMA DE MALLORCA
LEPA 12.9 -31% 27.6 46.6%
7 PARIS CH DE
GAULLE LFPG 12.8 -28% 23.7 54.1%
8 ALICANTE LEAL 12.6 -5% 27.3 46.0%
9 ANTALYA LTAI 12.6 -13% 28.3 44.4%
10 LONDON/GATWICK EGKK 11.9 -10% 24.8 48.0%
11 MADRID BARAJAS LEMD 11.8 -38% 24.4 48.5%
12 MALAGA LEMG 11.7 -21% 27.1 43.2%
13 LONDON/LUTON EGGW 11.2 -10% 26.7 42.0%
14 FRANKFURT MAIN EDDF 10.8 -42% 20.0 54.1%
15 PORTO LPPR 10.7 -5% 27.7 38.5%
16 NICE LFMN 10.7 -25% 25.2 42.3%
17 BIRMINGHAM EGBB 10.6 -5% 24.8 42.8%
18 IBIZA LEIB 10.3 -30% 26.6 38.9%
19 ZURICH LSZH 10.2 -13% 18.2 55.8%
20 DUESSELDORF EDDL 9.6 -14% 21.7 44.3%
Figure 10. Main delay causes at the top 10 affected departure airports
Manchester Airport noted the highest average departure delay following flights being affected by arrival restrictions predominantly at major hubs as well as leisure destinations, flights also experienced en-route weather delays in central and western Europe. Lisbon experienced delays at hub airports particularly Heathrow. Istanbul Ataturk continues to suffer from delays predominantly due airport capacity related causes and consequent reactionary delays on high frequency domestic routes.
EUROCONTROL 8 CODA
Digest – Delays to Air Transport in Europe June 2012
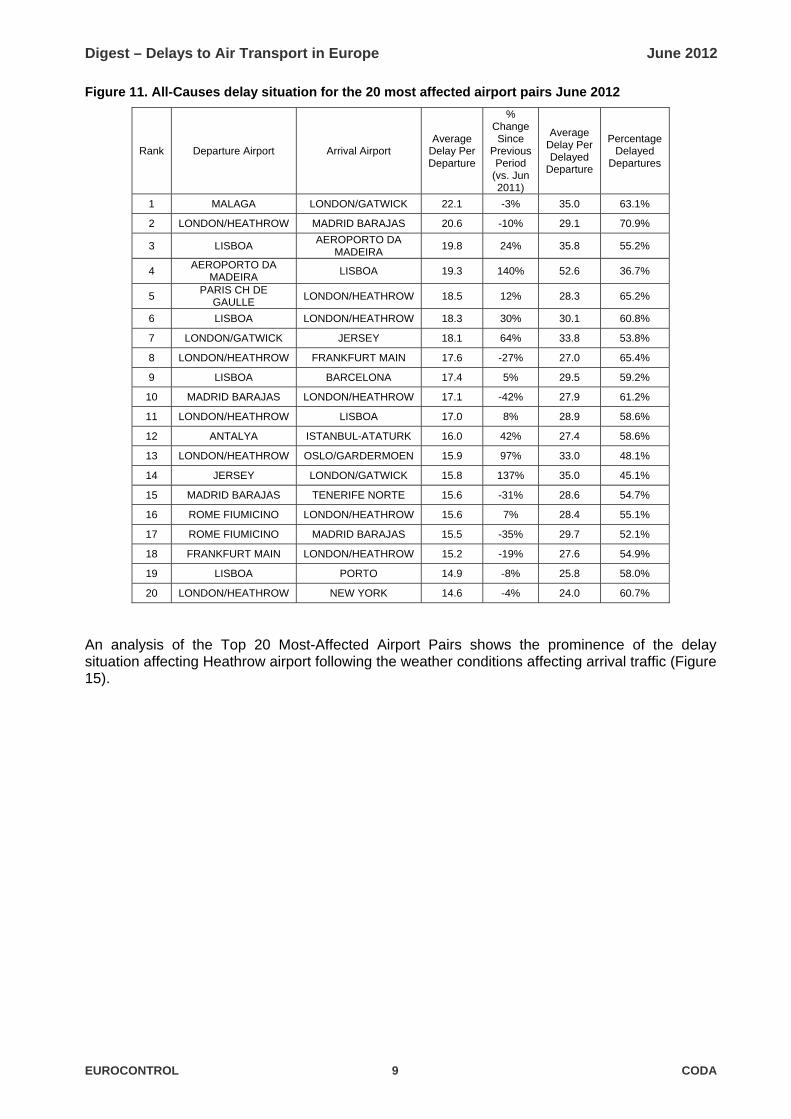
Figure 11. All-Causes delay situation for the 20 most affected airport pairs June 2012
Rank Departure Airport Arrival Airport Average
Delay Per Departure
% Change Since
Previous Period
(vs. Jun 2011)
Average Delay Per Delayed
Departure
Percentage Delayed
Departures
1 MALAGA LONDON/GATWICK 22.1 -3% 35.0 63.1%
2 LONDON/HEATHROW MADRID BARAJAS 20.6 -10% 29.1 70.9%
3 LISBOA AEROPORTO DA
MADEIRA 19.8 24% 35.8 55.2%
4 AEROPORTO DA
MADEIRA LISBOA 19.3 140% 52.6 36.7%
5 PARIS CH DE
GAULLE LONDON/HEATHROW 18.5 12% 28.3 65.2%
6 LISBOA LONDON/HEATHROW 18.3 30% 30.1 60.8%
7 LONDON/GATWICK JERSEY 18.1 64% 33.8 53.8%
8 LONDON/HEATHROW FRANKFURT MAIN 17.6 -27% 27.0 65.4%
9 LISBOA BARCELONA 17.4 5% 29.5 59.2%
10 MADRID BARAJAS LONDON/HEATHROW 17.1 -42% 27.9 61.2%
11 LONDON/HEATHROW LISBOA 17.0 8% 28.9 58.6%
12 ANTALYA ISTANBUL-ATATURK 16.0 42% 27.4 58.6%
13 LONDON/HEATHROW OSLO/GARDERMOEN 15.9 97% 33.0 48.1%
14 JERSEY LONDON/GATWICK 15.8 137% 35.0 45.1%
15 MADRID BARAJAS TENERIFE NORTE 15.6 -31% 28.6 54.7%
16 ROME FIUMICINO LONDON/HEATHROW 15.6 7% 28.4 55.1%
17 ROME FIUMICINO MADRID BARAJAS 15.5 -35% 29.7 52.1%
18 FRANKFURT MAIN LONDON/HEATHROW 15.2 -19% 27.6 54.9%
19 LISBOA PORTO 14.9 -8% 25.8 58.0%
20 LONDON/HEATHROW NEW YORK 14.6 -4% 24.0 60.7%
An analysis of the Top 20 Most-Affected Airport Pairs shows the prominence of the delay situation affecting Heathrow airport following the weather conditions affecting arrival traffic (Figure 15).
EUROCONTROL 9 CODA
Digest – Delays to Air Transport in Europe June 2012
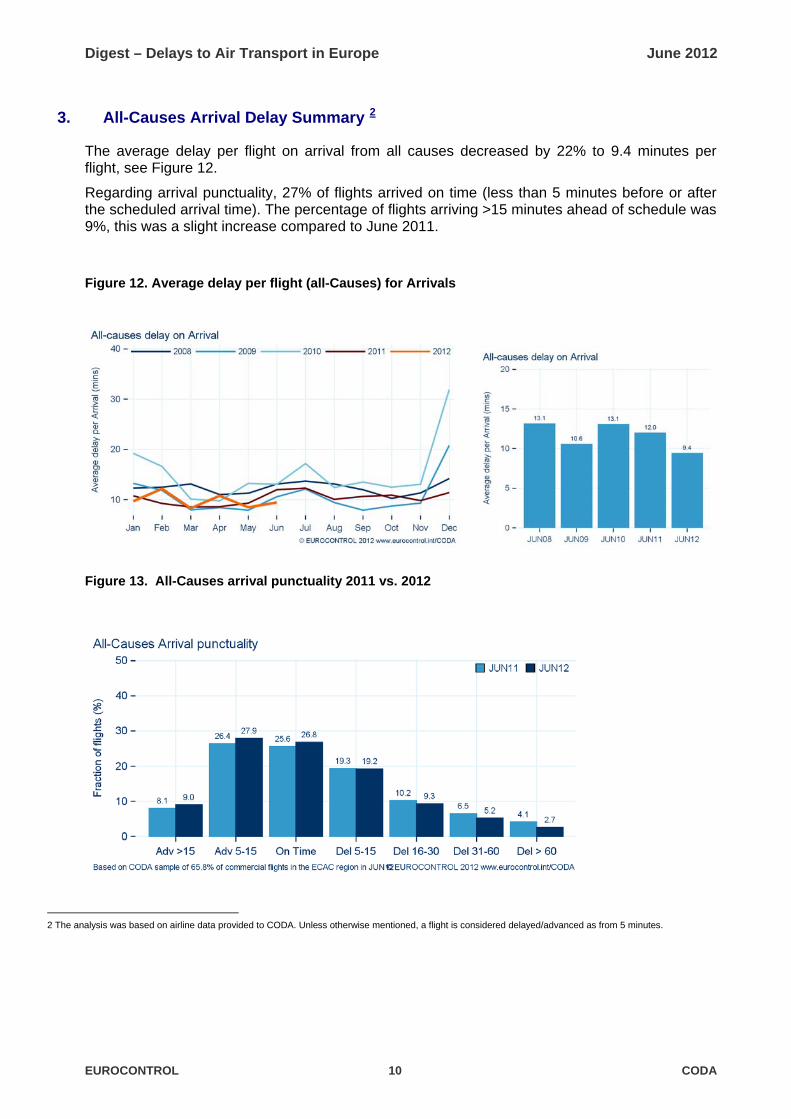
3. All-Causes Arrival Delay Summary 2
The average delay per flight on arrival from all causes decreased by 22% to 9.4 minutes per flight, see Figure 12.
Regarding arrival punctuality, 27% of flights arrived on time (less than 5 minutes before or after the scheduled arrival time). The percentage of flights arriving >15 minutes ahead of schedule was 9%, this was a slight increase compared to June 2011.
Figure 12. Average delay per flight (all-Causes) for Arrivals
Figure 13. All-Causes arrival punctuality 2011 vs. 2012
2 The analysis was based on airline data provided to CODA. Unless otherwise mentioned, a flight is considered delayed/advanced as from 5 minutes.
EUROCONTROL 10 CODA
Digest – Delays to Air Transport in Europe June 2012
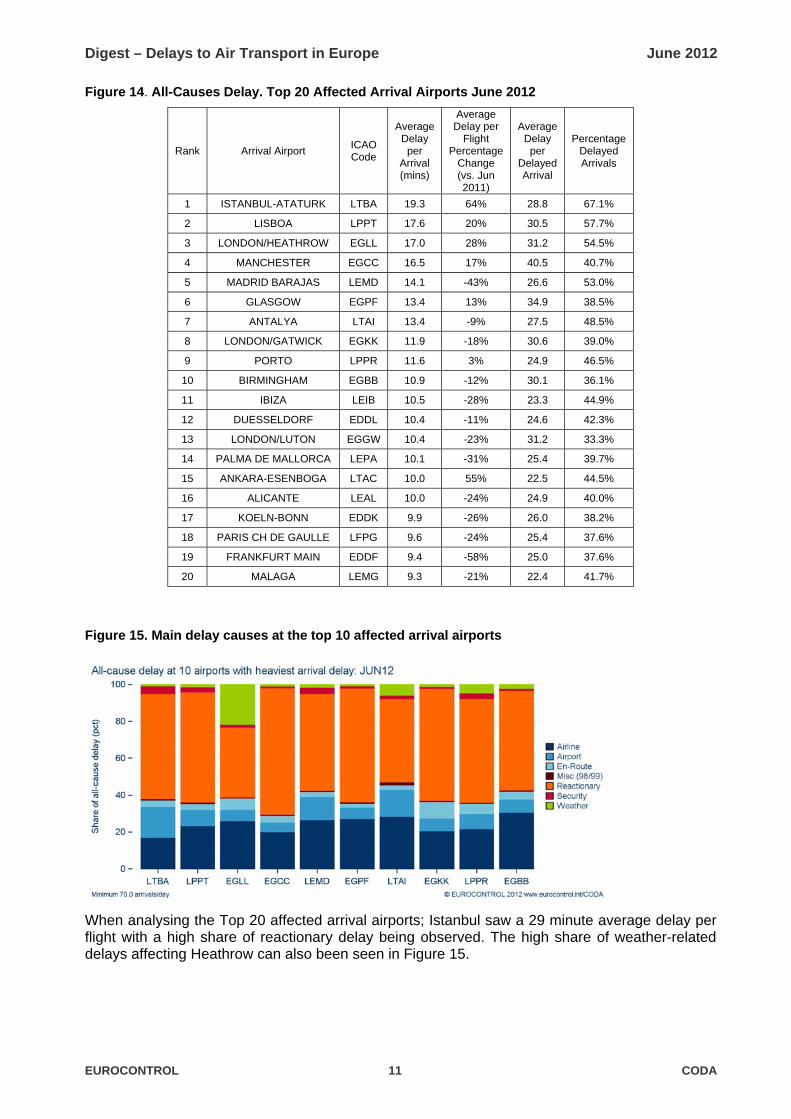
Figure 14. All-Causes Delay. Top 20 Affected Arrival Airports June 2012
Rank Arrival Airport ICAO Code
Average Delay per
Arrival (mins)
Average Delay per
Flight Percentage
Change (vs. Jun 2011)
Average Delay per
Delayed Arrival
Percentage Delayed Arrivals
1 ISTANBUL-ATATURK LTBA 19.3 64% 28.8 67.1%
2 LISBOA LPPT 17.6 20% 30.5 57.7%
3 LONDON/HEATHROW EGLL 17.0 28% 31.2 54.5%
4 MANCHESTER EGCC 16.5 17% 40.5 40.7%
5 MADRID BARAJAS LEMD 14.1 -43% 26.6 53.0%
6 GLASGOW EGPF 13.4 13% 34.9 38.5%
7 ANTALYA LTAI 13.4 -9% 27.5 48.5%
8 LONDON/GATWICK EGKK 11.9 -18% 30.6 39.0%
9 PORTO LPPR 11.6 3% 24.9 46.5%
10 BIRMINGHAM EGBB 10.9 -12% 30.1 36.1%
11 IBIZA LEIB 10.5 -28% 23.3 44.9%
12 DUESSELDORF EDDL 10.4 -11% 24.6 42.3%
13 LONDON/LUTON EGGW 10.4 -23% 31.2 33.3%
14 PALMA DE MALLORCA LEPA 10.1 -31% 25.4 39.7%
15 ANKARA-ESENBOGA LTAC 10.0 55% 22.5 44.5%
16 ALICANTE LEAL 10.0 -24% 24.9 40.0%
17 KOELN-BONN EDDK 9.9 -26% 26.0 38.2%
18 PARIS CH DE GAULLE LFPG 9.6 -24% 25.4 37.6%
19 FRANKFURT MAIN EDDF 9.4 -58% 25.0 37.6%
20 MALAGA LEMG 9.3 -21% 22.4 41.7%
Figure 15. Main delay causes at the top 10 affected arrival airports
When analysing the Top 20 affected arrival airports; Istanbul saw a 29 minute average delay per flight with a high share of reactionary delay being observed. The high share of weather-related delays affecting Heathrow can also been seen in Figure 15.
EUROCONTROL 11 CODA
Digest – Delays to Air Transport in Europe June 2012
Figure 16. Link between CODA Causes and IATA delay codes.
CODA CAUSE Description
IATA Code
Passenger and Baggage 11‐19
Cargo and Mail 21‐29
Aircraft and Ramp Handling 31‐39
Technical and Aircraft Equipment 41‐49
Damage to Aircraft & EDP/Automated Equipment Failure 51‐58
Flight Operations and Crewing 61‐69
Airline
Other Airline Related Causes Others
ATFM due to Restriction at Departure Airport 83
Airport Facilities 87
Restrictions at Airport of Destination 88 Airport
Restrictions at Airport of Departure 89
ATFM due to ATC En‐Route Demand / Capacity 81 En‐Route
ATFM due to ATC Staff / Equipment En‐Route 82
Governmental Security and Immigration 85‐86
Weather (other than ATFM) 71‐79 Weather
ATFM due to Weather at Destination 84
Primary Delay Cau
ses
Miscellaneous Miscellaneous 98‐99
Reactionary Late Arrival of Aircraft, Crew, Passengers or Load 91‐96
4. Summary of Significant Events in June 2012.
Weather conditions such as thunderstorms, heavy rain and low visibility affected operations in
Heathrow, Frankfurt, Munich, Brussels, Amsterdam, Zurich and Vienna particularly on the 21st and 29th June.
EURO 2012 Football Championship in Poland and Ukraine 8th-30th June: Traffic increases
observed delays remained stable.
EUROCONTROL 12 CODA
Digest – Delays to Air Transport in Europe June 2012
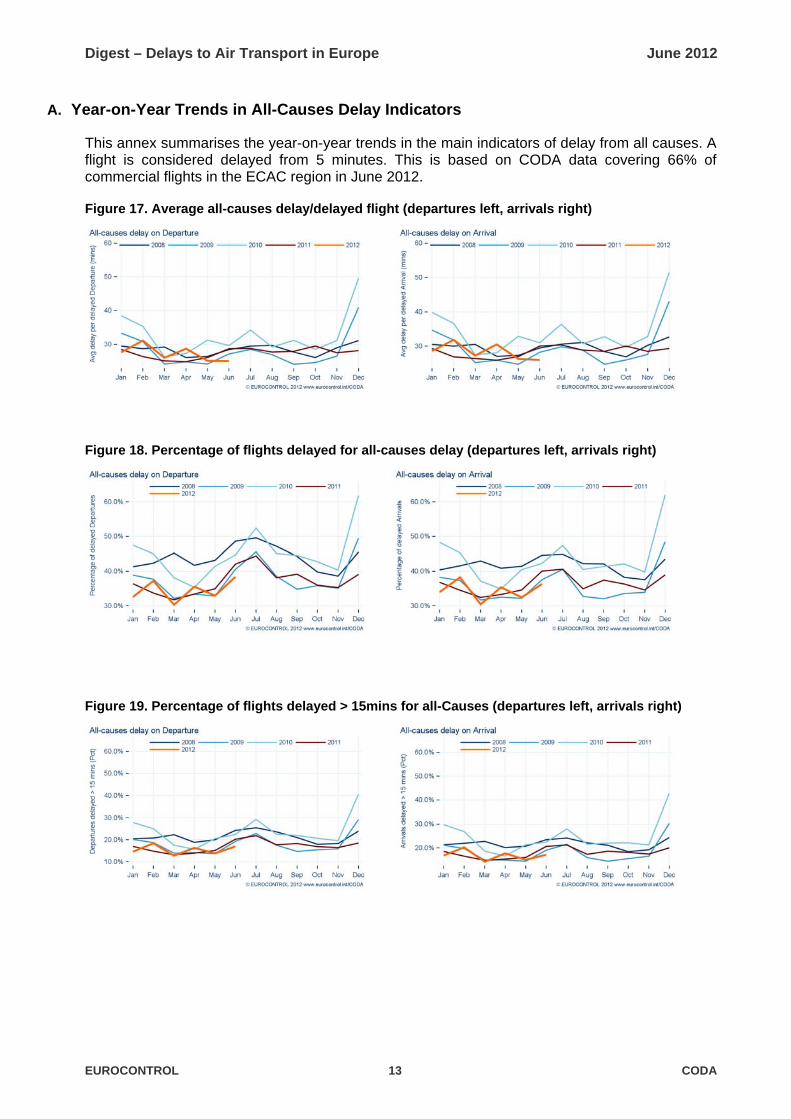
A. Year-on-Year Trends in All-Causes Delay Indicators
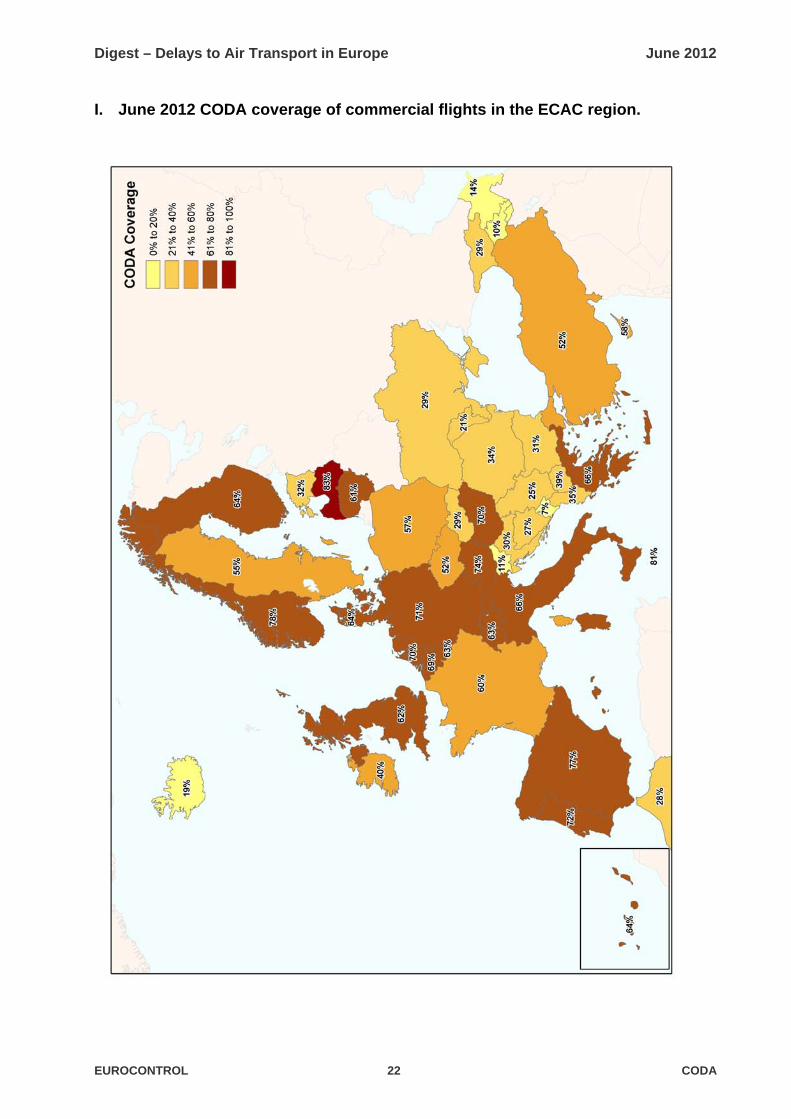
This annex summarises the year-on-year trends in the main indicators of delay from all causes. A flight is considered delayed from 5 minutes. This is based on CODA data covering 66% of commercial flights in the ECAC region in June 2012.
Figure 17. Average all-causes delay/delayed flight (departures left, arrivals right)
Figure 18. Percentage of flights delayed for all-causes delay (departures left, arrivals right)
Figure 19. Percentage of flights delayed > 15mins for all-Causes (departures left, arrivals right)
EUROCONTROL 13 CODA
Digest – Delays to Air Transport in Europe June 2012
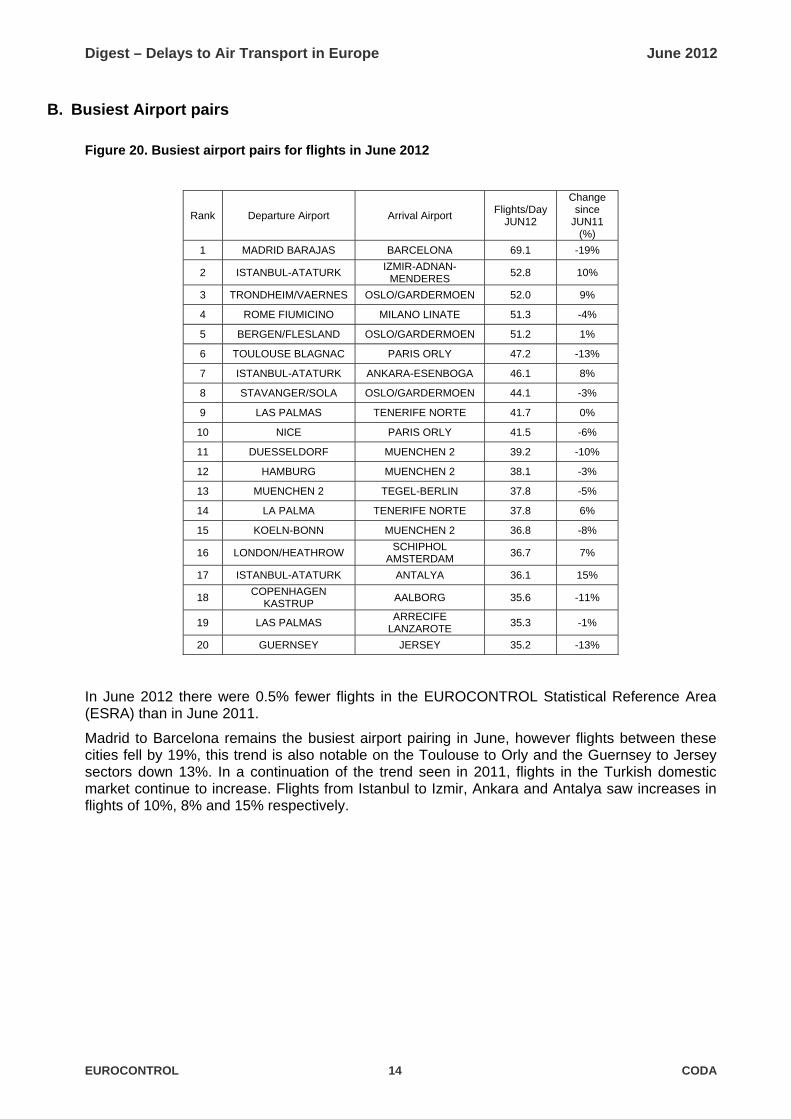
B. Busiest Airport pairs
Figure 20. Busiest airport pairs for flights in June 2012
Rank Departure Airport Arrival Airport Flights/Day
JUN12
Change since
JUN11 (%)
1 MADRID BARAJAS BARCELONA 69.1 -19%
2 ISTANBUL-ATATURK IZMIR-ADNAN-
MENDERES 52.8 10%
3 TRONDHEIM/VAERNES OSLO/GARDERMOEN 52.0 9%
4 ROME FIUMICINO MILANO LINATE 51.3 -4%
5 BERGEN/FLESLAND OSLO/GARDERMOEN 51.2 1%
6 TOULOUSE BLAGNAC PARIS ORLY 47.2 -13%
7 ISTANBUL-ATATURK ANKARA-ESENBOGA 46.1 8%
8 STAVANGER/SOLA OSLO/GARDERMOEN 44.1 -3%
9 LAS PALMAS TENERIFE NORTE 41.7 0%
10 NICE PARIS ORLY 41.5 -6%
11 DUESSELDORF MUENCHEN 2 39.2 -10%
12 HAMBURG MUENCHEN 2 38.1 -3%
13 MUENCHEN 2 TEGEL-BERLIN 37.8 -5%
14 LA PALMA TENERIFE NORTE 37.8 6%
15 KOELN-BONN MUENCHEN 2 36.8 -8%
16 LONDON/HEATHROW SCHIPHOL
AMSTERDAM 36.7 7%
17 ISTANBUL-ATATURK ANTALYA 36.1 15%
18 COPENHAGEN
KASTRUP AALBORG 35.6 -11%
19 LAS PALMAS ARRECIFE
LANZAROTE 35.3 -1%
20 GUERNSEY JERSEY 35.2 -13%
In June 2012 there were 0.5% fewer flights in the EUROCONTROL Statistical Reference Area (ESRA) than in June 2011.
Madrid to Barcelona remains the busiest airport pairing in June, however flights between these cities fell by 19%, this trend is also notable on the Toulouse to Orly and the Guernsey to Jersey sectors down 13%. In a continuation of the trend seen in 2011, flights in the Turkish domestic market continue to increase. Flights from Istanbul to Izmir, Ankara and Antalya saw increases in flights of 10%, 8% and 15% respectively.
EUROCONTROL 14 CODA
Digest – Delays to Air Transport in Europe June 2012
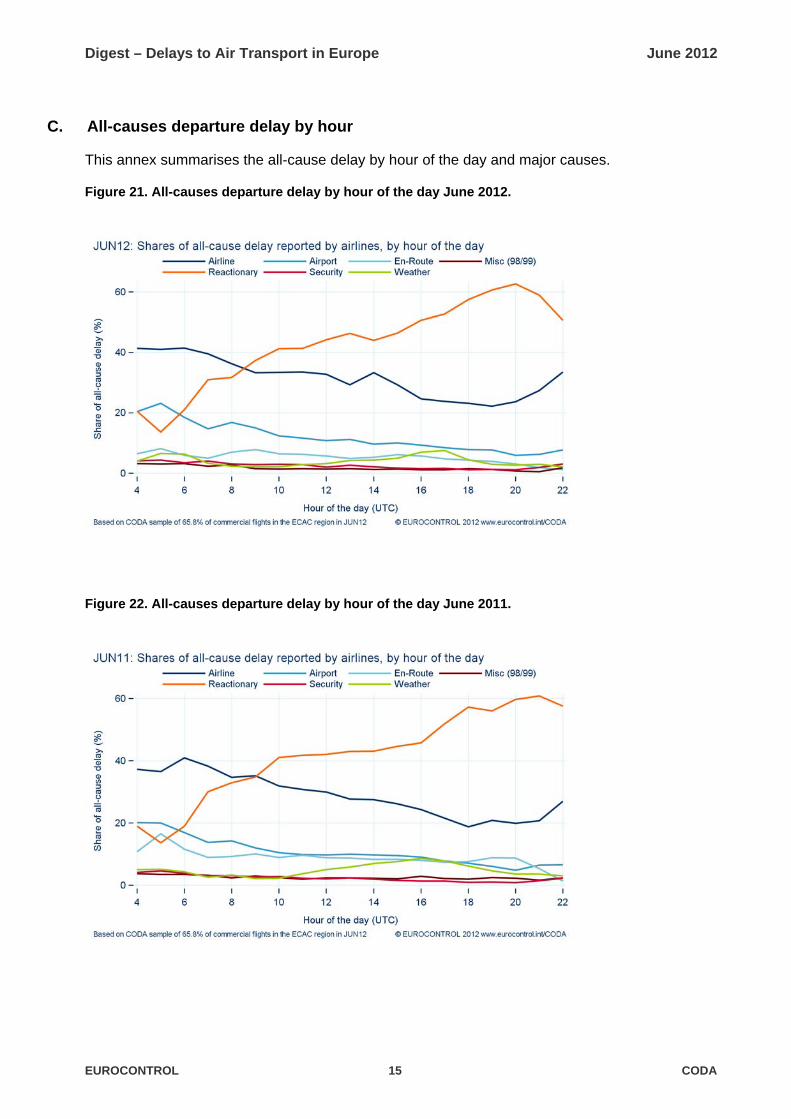
C. All-causes departure delay by hour
This annex summarises the all-cause delay by hour of the day and major causes.
Figure 21. All-causes departure delay by hour of the day June 2012.
Figure 22. All-causes departure delay by hour of the day June 2011.
EUROCONTROL 15 CODA
Digest – Delays to Air Transport in Europe June 2012
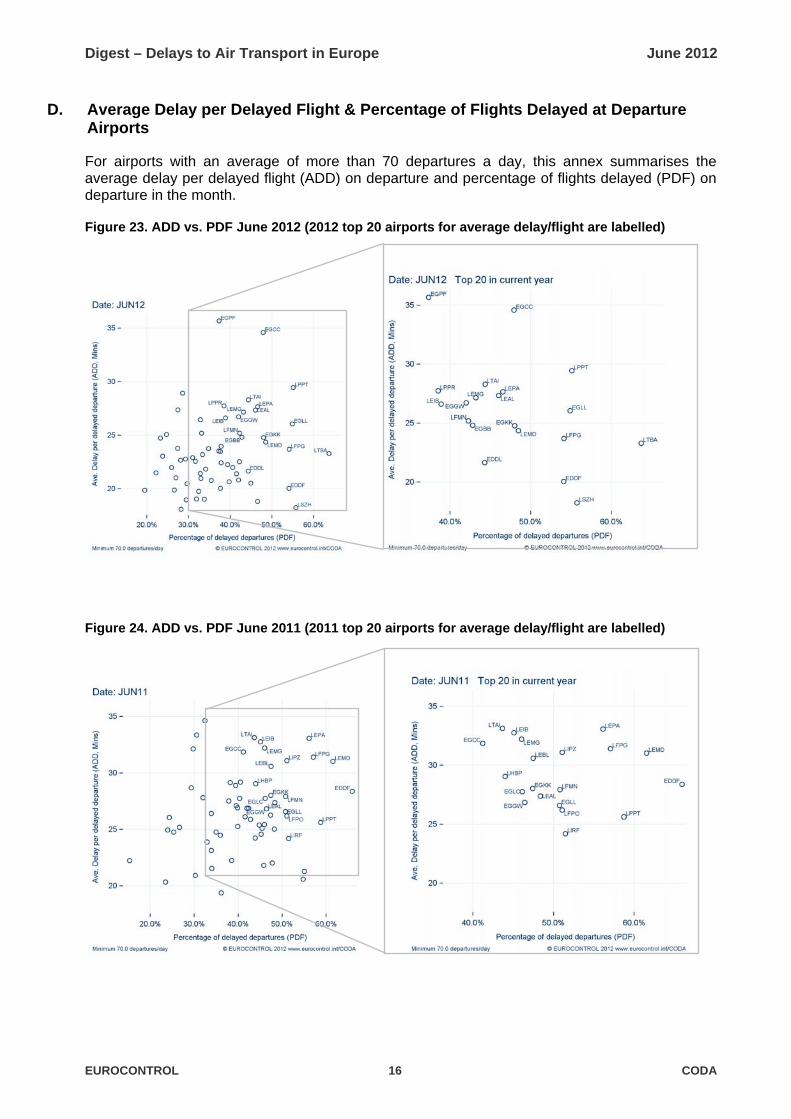
D. Average Delay per Delayed Flight & Percentage of Flights Delayed at Departure Airports
For airports with an average of more than 70 departures a day, this annex summarises the average delay per delayed flight (ADD) on departure and percentage of flights delayed (PDF) on departure in the month.
Figure 23. ADD vs. PDF June 2012 (2012 top 20 airports for average delay/flight are labelled)
Figure 24. ADD vs. PDF June 2011 (2011 top 20 airports for average delay/flight are labelled)
EUROCONTROL 16 CODA
Digest – Delays to Air Transport in Europe June 2012
EUROCONTROL 17 CODA
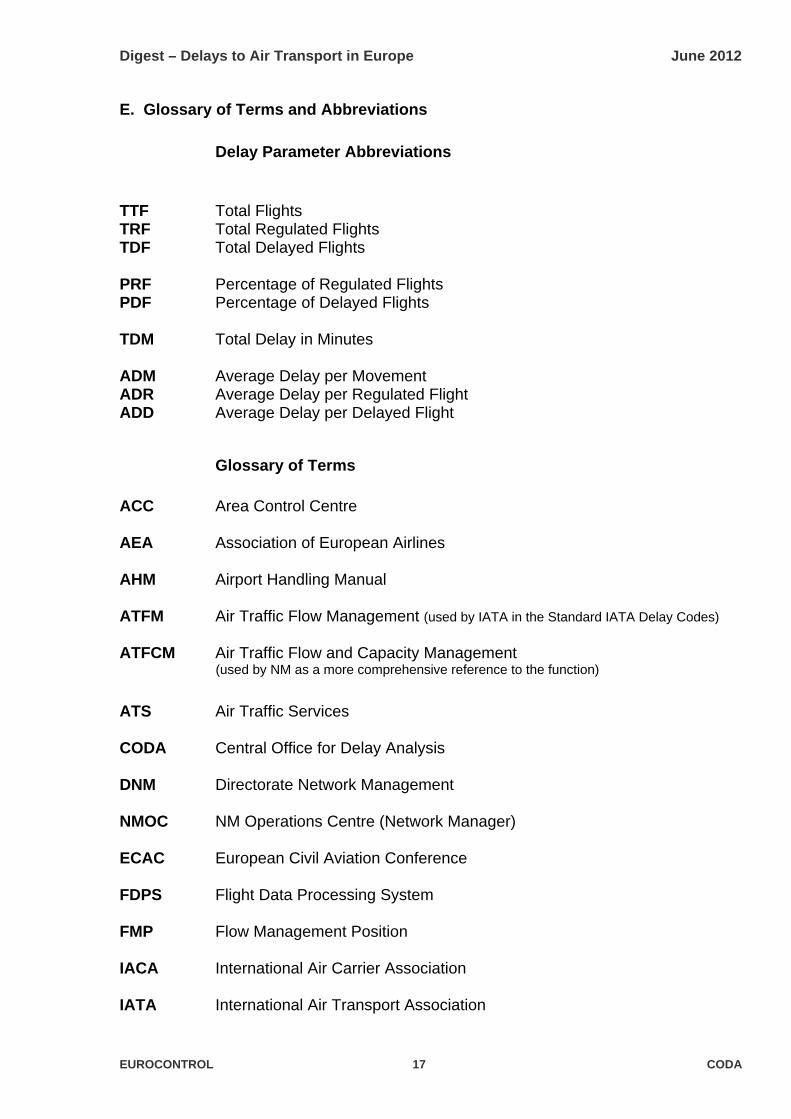
E. Glossary of Terms and Abbreviations
Delay Parameter Abbreviations
TTF Total Flights TRF Total Regulated Flights TDF Total Delayed Flights PRF Percentage of Regulated Flights PDF Percentage of Delayed Flights TDM Total Delay in Minutes ADM Average Delay per Movement ADR Average Delay per Regulated Flight ADD Average Delay per Delayed Flight
Glossary of Terms ACC Area Control Centre AEA Association of European Airlines AHM Airport Handling Manual ATFM Air Traffic Flow Management (used by IATA in the Standard IATA Delay Codes) ATFCM Air Traffic Flow and Capacity Management (used by NM as a more comprehensive reference to the function)
ATS Air Traffic Services CODA Central Office for Delay Analysis DNM Directorate Network Management NMOC NM Operations Centre (Network Manager) ECAC European Civil Aviation Conference FDPS Flight Data Processing System FMP Flow Management Position IACA International Air Carrier Association IATA International Air Transport Association
Digest – Delays to Air Transport in Europe June 2012
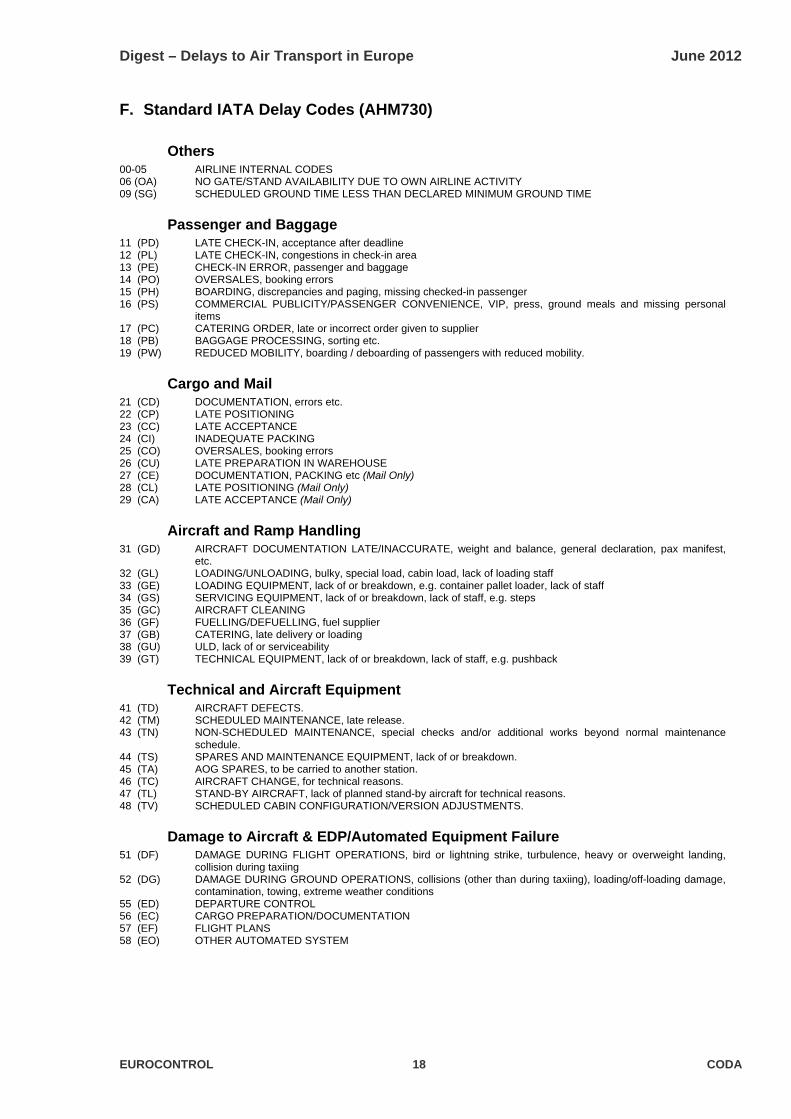
F. Standard IATA Delay Codes (AHM730)
Others 00-05 AIRLINE INTERNAL CODES 06 (OA) NO GATE/STAND AVAILABILITY DUE TO OWN AIRLINE ACTIVITY 09 (SG) SCHEDULED GROUND TIME LESS THAN DECLARED MINIMUM GROUND TIME
Passenger and Baggage 11 (PD) LATE CHECK-IN, acceptance after deadline 12 (PL) LATE CHECK-IN, congestions in check-in area 13 (PE) CHECK-IN ERROR, passenger and baggage 14 (PO) OVERSALES, booking errors 15 (PH) BOARDING, discrepancies and paging, missing checked-in passenger 16 (PS) COMMERCIAL PUBLICITY/PASSENGER CONVENIENCE, VIP, press, ground meals and missing personal
items 17 (PC) CATERING ORDER, late or incorrect order given to supplier 18 (PB) BAGGAGE PROCESSING, sorting etc. 19 (PW) REDUCED MOBILITY, boarding / deboarding of passengers with reduced mobility.
Cargo and Mail 21 (CD) DOCUMENTATION, errors etc. 22 (CP) LATE POSITIONING 23 (CC) LATE ACCEPTANCE 24 (CI) INADEQUATE PACKING 25 (CO) OVERSALES, booking errors 26 (CU) LATE PREPARATION IN WAREHOUSE 27 (CE) DOCUMENTATION, PACKING etc (Mail Only) 28 (CL) LATE POSITIONING (Mail Only) 29 (CA) LATE ACCEPTANCE (Mail Only)
Aircraft and Ramp Handling 31 (GD) AIRCRAFT DOCUMENTATION LATE/INACCURATE, weight and balance, general declaration, pax manifest,
etc. 32 (GL) LOADING/UNLOADING, bulky, special load, cabin load, lack of loading staff 33 (GE) LOADING EQUIPMENT, lack of or breakdown, e.g. container pallet loader, lack of staff 34 (GS) SERVICING EQUIPMENT, lack of or breakdown, lack of staff, e.g. steps 35 (GC) AIRCRAFT CLEANING 36 (GF) FUELLING/DEFUELLING, fuel supplier 37 (GB) CATERING, late delivery or loading 38 (GU) ULD, lack of or serviceability 39 (GT) TECHNICAL EQUIPMENT, lack of or breakdown, lack of staff, e.g. pushback
Technical and Aircraft Equipment 41 (TD) AIRCRAFT DEFECTS. 42 (TM) SCHEDULED MAINTENANCE, late release. 43 (TN) NON-SCHEDULED MAINTENANCE, special checks and/or additional works beyond normal maintenance
schedule. 44 (TS) SPARES AND MAINTENANCE EQUIPMENT, lack of or breakdown. 45 (TA) AOG SPARES, to be carried to another station. 46 (TC) AIRCRAFT CHANGE, for technical reasons. 47 (TL) STAND-BY AIRCRAFT, lack of planned stand-by aircraft for technical reasons. 48 (TV) SCHEDULED CABIN CONFIGURATION/VERSION ADJUSTMENTS.
Damage to Aircraft & EDP/Automated Equipment Failure 51 (DF) DAMAGE DURING FLIGHT OPERATIONS, bird or lightning strike, turbulence, heavy or overweight landing,
collision during taxiing 52 (DG) DAMAGE DURING GROUND OPERATIONS, collisions (other than during taxiing), loading/off-loading damage,
contamination, towing, extreme weather conditions 55 (ED) DEPARTURE CONTROL 56 (EC) CARGO PREPARATION/DOCUMENTATION 57 (EF) FLIGHT PLANS 58 (EO) OTHER AUTOMATED SYSTEM
EUROCONTROL 18 CODA
Digest – Delays to Air Transport in Europe June 2012
EUROCONTROL 19 CODA
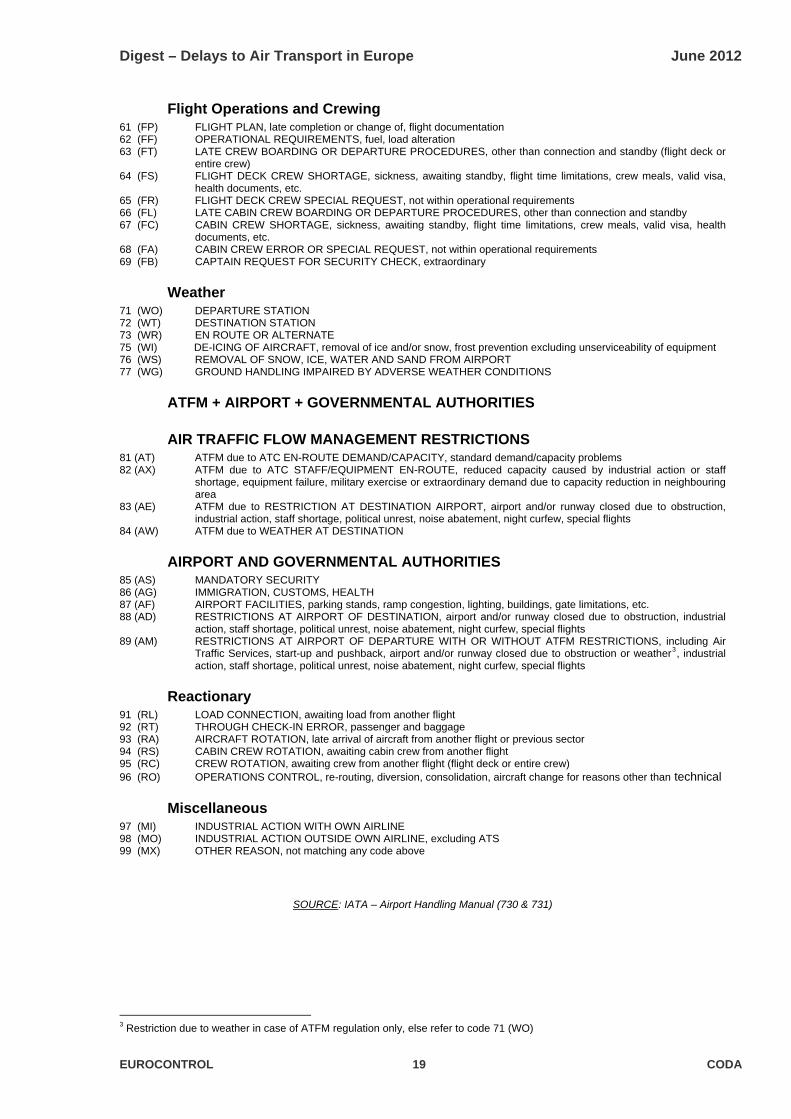
Flight Operations and Crewing 61 (FP) FLIGHT PLAN, late completion or change of, flight documentation 62 (FF) OPERATIONAL REQUIREMENTS, fuel, load alteration 63 (FT) LATE CREW BOARDING OR DEPARTURE PROCEDURES, other than connection and standby (flight deck or
entire crew) 64 (FS) FLIGHT DECK CREW SHORTAGE, sickness, awaiting standby, flight time limitations, crew meals, valid visa,
health documents, etc. 65 (FR) FLIGHT DECK CREW SPECIAL REQUEST, not within operational requirements 66 (FL) LATE CABIN CREW BOARDING OR DEPARTURE PROCEDURES, other than connection and standby 67 (FC) CABIN CREW SHORTAGE, sickness, awaiting standby, flight time limitations, crew meals, valid visa, health
documents, etc. 68 (FA) CABIN CREW ERROR OR SPECIAL REQUEST, not within operational requirements 69 (FB) CAPTAIN REQUEST FOR SECURITY CHECK, extraordinary
Weather 71 (WO) DEPARTURE STATION 72 (WT) DESTINATION STATION 73 (WR) EN ROUTE OR ALTERNATE 75 (WI) DE-ICING OF AIRCRAFT, removal of ice and/or snow, frost prevention excluding unserviceability of equipment 76 (WS) REMOVAL OF SNOW, ICE, WATER AND SAND FROM AIRPORT 77 (WG) GROUND HANDLING IMPAIRED BY ADVERSE WEATHER CONDITIONS
ATFM + AIRPORT + GOVERNMENTAL AUTHORITIES
AIR TRAFFIC FLOW MANAGEMENT RESTRICTIONS 81 (AT) ATFM due to ATC EN-ROUTE DEMAND/CAPACITY, standard demand/capacity problems 82 (AX) ATFM due to ATC STAFF/EQUIPMENT EN-ROUTE, reduced capacity caused by industrial action or staff
shortage, equipment failure, military exercise or extraordinary demand due to capacity reduction in neighbouring area
83 (AE) ATFM due to RESTRICTION AT DESTINATION AIRPORT, airport and/or runway closed due to obstruction, industrial action, staff shortage, political unrest, noise abatement, night curfew, special flights
84 (AW) ATFM due to WEATHER AT DESTINATION
AIRPORT AND GOVERNMENTAL AUTHORITIES 85 (AS) MANDATORY SECURITY 86 (AG) IMMIGRATION, CUSTOMS, HEALTH 87 (AF) AIRPORT FACILITIES, parking stands, ramp congestion, lighting, buildings, gate limitations, etc. 88 (AD) RESTRICTIONS AT AIRPORT OF DESTINATION, airport and/or runway closed due to obstruction, industrial
action, staff shortage, political unrest, noise abatement, night curfew, special flights 89 (AM) RESTRICTIONS AT AIRPORT OF DEPARTURE WITH OR WITHOUT ATFM RESTRICTIONS, including Air
Traffic Services, start-up and pushback, airport and/or runway closed due to obstruction or weather3, industrial action, staff shortage, political unrest, noise abatement, night curfew, special flights
Reactionary 91 (RL) LOAD CONNECTION, awaiting load from another flight 92 (RT) THROUGH CHECK-IN ERROR, passenger and baggage 93 (RA) AIRCRAFT ROTATION, late arrival of aircraft from another flight or previous sector 94 (RS) CABIN CREW ROTATION, awaiting cabin crew from another flight 95 (RC) CREW ROTATION, awaiting crew from another flight (flight deck or entire crew) 96 (RO) OPERATIONS CONTROL, re-routing, diversion, consolidation, aircraft change for reasons other than technical
Miscellaneous 97 (MI) INDUSTRIAL ACTION WITH OWN AIRLINE 98 (MO) INDUSTRIAL ACTION OUTSIDE OWN AIRLINE, excluding ATS 99 (MX) OTHER REASON, not matching any code above
SOURCE: IATA – Airport Handling Manual (730 & 731)
3 Restriction due to weather in case of ATFM regulation only, else refer to code 71 (WO)
Digest – Delays to Air Transport in Europe June 2012
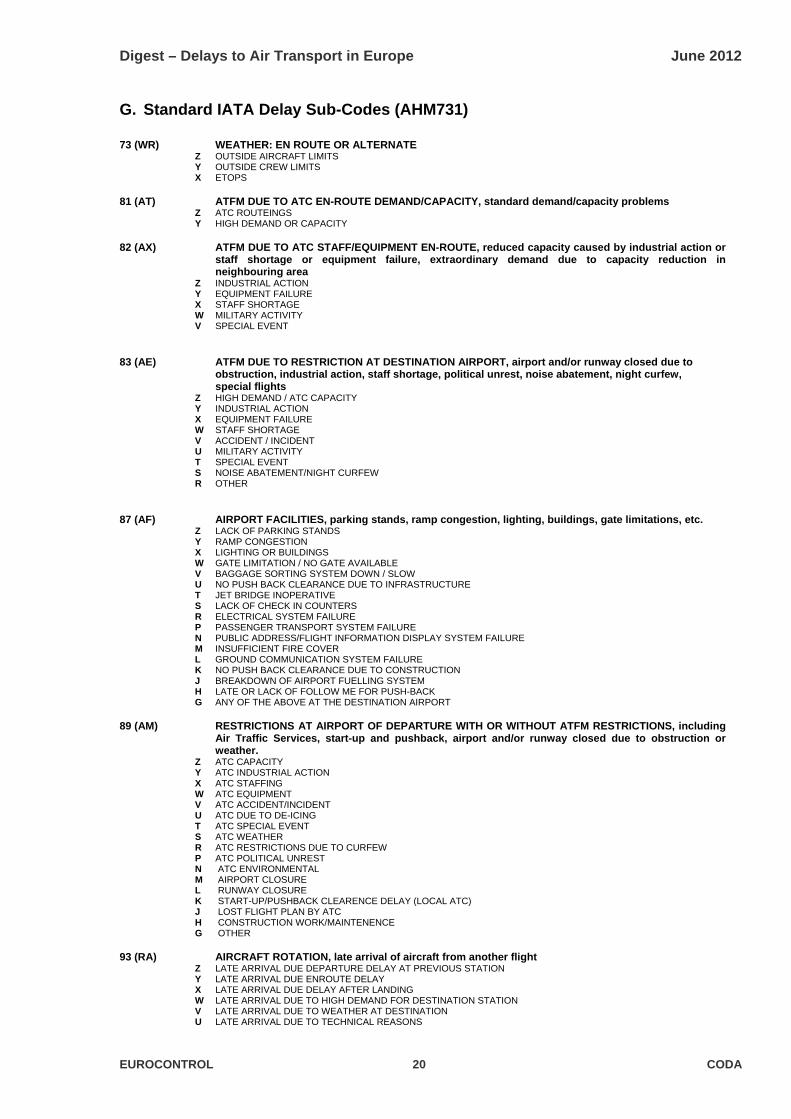
G. Standard IATA Delay Sub-Codes (AHM731)
73 (WR) WEATHER: EN ROUTE OR ALTERNATE Z OUTSIDE AIRCRAFT LIMITS Y OUTSIDE CREW LIMITS X ETOPS 81 (AT) ATFM DUE TO ATC EN-ROUTE DEMAND/CAPACITY, standard demand/capacity problems Z ATC ROUTEINGS Y HIGH DEMAND OR CAPACITY 82 (AX) ATFM DUE TO ATC STAFF/EQUIPMENT EN-ROUTE, reduced capacity caused by industrial action or
staff shortage or equipment failure, extraordinary demand due to capacity reduction in neighbouring area
Z INDUSTRIAL ACTION Y EQUIPMENT FAILURE X STAFF SHORTAGE W MILITARY ACTIVITY V SPECIAL EVENT 83 (AE) ATFM DUE TO RESTRICTION AT DESTINATION AIRPORT, airport and/or runway closed due to
obstruction, industrial action, staff shortage, political unrest, noise abatement, night curfew, special flights
Z HIGH DEMAND / ATC CAPACITY Y INDUSTRIAL ACTION X EQUIPMENT FAILURE W STAFF SHORTAGE V ACCIDENT / INCIDENT U MILITARY ACTIVITY T SPECIAL EVENT S NOISE ABATEMENT/NIGHT CURFEW R OTHER 87 (AF) AIRPORT FACILITIES, parking stands, ramp congestion, lighting, buildings, gate limitations, etc. Z LACK OF PARKING STANDS Y RAMP CONGESTION X LIGHTING OR BUILDINGS W GATE LIMITATION / NO GATE AVAILABLE V BAGGAGE SORTING SYSTEM DOWN / SLOW U NO PUSH BACK CLEARANCE DUE TO INFRASTRUCTURE T JET BRIDGE INOPERATIVE S LACK OF CHECK IN COUNTERS R ELECTRICAL SYSTEM FAILURE P PASSENGER TRANSPORT SYSTEM FAILURE N PUBLIC ADDRESS/FLIGHT INFORMATION DISPLAY SYSTEM FAILURE M INSUFFICIENT FIRE COVER L GROUND COMMUNICATION SYSTEM FAILURE K NO PUSH BACK CLEARANCE DUE TO CONSTRUCTION J BREAKDOWN OF AIRPORT FUELLING SYSTEM H LATE OR LACK OF FOLLOW ME FOR PUSH-BACK G ANY OF THE ABOVE AT THE DESTINATION AIRPORT 89 (AM) RESTRICTIONS AT AIRPORT OF DEPARTURE WITH OR WITHOUT ATFM RESTRICTIONS, including
Air Traffic Services, start-up and pushback, airport and/or runway closed due to obstruction or weather.
Z ATC CAPACITY Y ATC INDUSTRIAL ACTION X ATC STAFFING W ATC EQUIPMENT V ATC ACCIDENT/INCIDENT U ATC DUE TO DE-ICING T ATC SPECIAL EVENT S ATC WEATHER R ATC RESTRICTIONS DUE TO CURFEW P ATC POLITICAL UNREST N ATC ENVIRONMENTAL M AIRPORT CLOSURE L RUNWAY CLOSURE K START-UP/PUSHBACK CLEARENCE DELAY (LOCAL ATC) J LOST FLIGHT PLAN BY ATC H CONSTRUCTION WORK/MAINTENENCE G OTHER 93 (RA) AIRCRAFT ROTATION, late arrival of aircraft from another flight Z LATE ARRIVAL DUE DEPARTURE DELAY AT PREVIOUS STATION Y LATE ARRIVAL DUE ENROUTE DELAY X LATE ARRIVAL DUE DELAY AFTER LANDING W LATE ARRIVAL DUE TO HIGH DEMAND FOR DESTINATION STATION V LATE ARRIVAL DUE TO WEATHER AT DESTINATION U LATE ARRIVAL DUE TO TECHNICAL REASONS
EUROCONTROL 20 CODA
Digest – Delays to Air Transport in Europe June 2012
EUROCONTROL 21 CODA
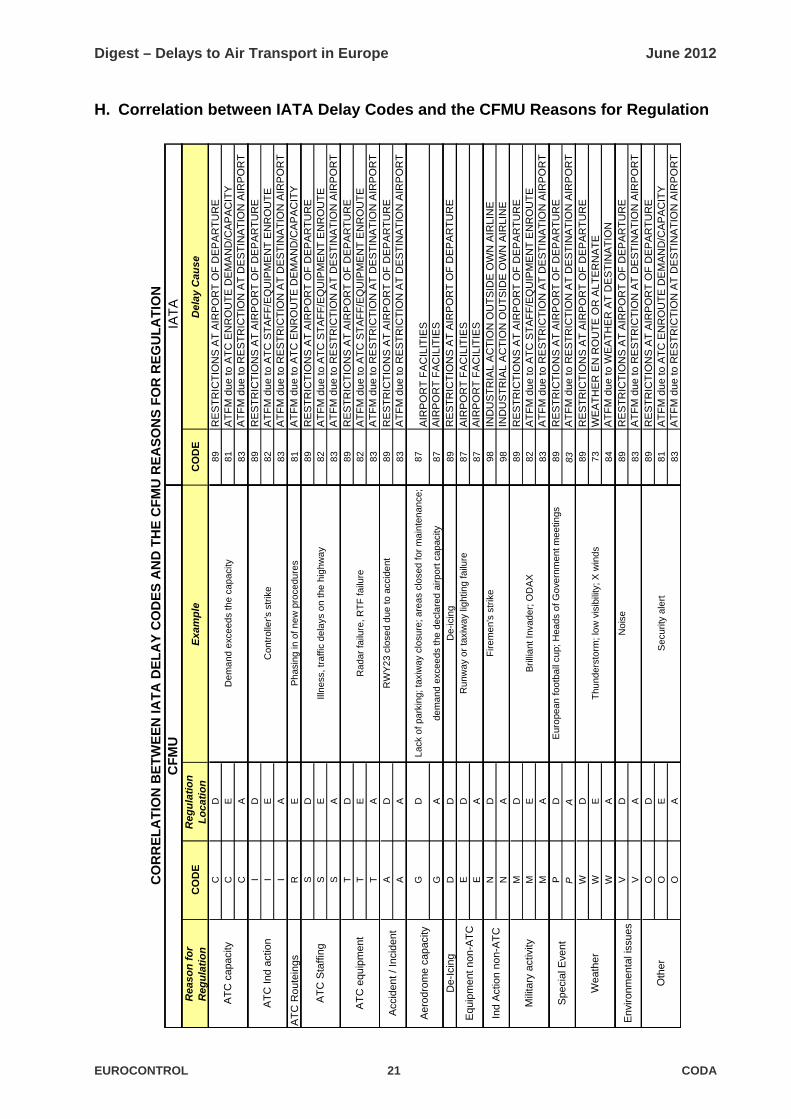
H. Correlation between IATA Delay Codes and the CFMU Reasons for Regulation
Rea
son
fo
r R
egu
lati
on
CO
DE
Reg
ula
tio
n
Lo
cati
on
Exa
mp
leC
OD
ED
elay
Cau
se
CD
89
RE
ST
RIC
TIO
NS
AT
AIR
PO
RT
OF
DE
PA
RT
UR
EC
ED
em
and
exc
eed
s th
e c
apac
ity8
1A
TF
M d
ue to
AT
C E
NR
OU
TE
DE
MA
ND
/CA
PA
CIT
YC
A8
3A
TF
M d
ue to
RE
ST
RIC
TIO
N A
T D
ES
TIN
AT
ION
AIR
PO
RT
ID
89
RE
ST
RIC
TIO
NS
AT
AIR
PO
RT
OF
DE
PA
RT
UR
EI
EC
ontr
olle
r's s
trik
e8
2A
TF
M d
ue to
AT
C S
TA
FF
/EQ
UIP
ME
NT
EN
RO
UT
EI
A8
3A
TF
M d
ue to
RE
ST
RIC
TIO
N A
T D
ES
TIN
AT
ION
AIR
PO
RT
AT
C R
oute
ings
RE
Ph
asin
g in
of n
ew
pro
cedu
res
81
AT
FM
due
to A
TC
EN
RO
UT
E D
EM
AN
D/C
AP
AC
ITY
SD
89
RE
ST
RIC
TIO
NS
AT
AIR
PO
RT
OF
DE
PA
RT
UR
ES
EIll
nes
s, tr
affi
c de
lays
on
the
hig
hw
ay
82
AT
FM
due
to A
TC
ST
AF
F/E
QU
IPM
EN
T E
NR
OU
TE
SA
83
AT
FM
due
to R
ES
TR
ICT
ION
AT
DE
ST
INA
TIO
N A
IRP
OR
TT
D8
9R
ES
TR
ICT
ION
S A
T A
IRP
OR
T O
F D
EP
AR
TU
RE
TE
Ra
dar
failu
re, R
TF
failu
re8
2A
TF
M d
ue to
AT
C S
TA
FF
/EQ
UIP
ME
NT
EN
RO
UT
ET
A8
3A
TF
M d
ue to
RE
ST
RIC
TIO
N A
T D
ES
TIN
AT
ION
AIR
PO
RT
AD
RW
Y2
3 cl
ose
d d
ue to
acc
ide
nt8
9R
ES
TR
ICT
ION
S A
T A
IRP
OR
T O
F D
EP
AR
TU
RE
AA
83
AT
FM
due
to R
ES
TR
ICT
ION
AT
DE
ST
INA
TIO
N A
IRP
OR
T
GD
Lac
k o
f pa
rkin
g; ta
xiw
ay c
losu
re; a
rea
s cl
ose
d fo
r m
ain
ten
ance
; 8
7A
IRP
OR
T F
AC
ILIT
IES
GA
dem
and
exc
eeds
the
de
cla
red
airp
ort
cap
acity
87
AIR
PO
RT
FA
CIL
ITIE
SD
e-Ic
ing
DD
De-
icin
g8
9R
ES
TR
ICT
ION
S A
T A
IRP
OR
T O
F D
EP
AR
TU
RE
ED
Ru
nway
or
taxi
way
lig
htin
g fa
ilure
87
AIR
PO
RT
FA
CIL
ITIE
SE
A8
7A
IRP
OR
T F
AC
ILIT
IES
ND
Fir
eme
n's
stri
ke98
IND
US
TR
IAL
AC
TIO
N O
UT
SID
E O
WN
AIR
LIN
EN
A9
8IN
DU
ST
RIA
L A
CT
ION
OU
TS
IDE
OW
N A
IRLI
NE
MD
89
RE
ST
RIC
TIO
NS
AT
AIR
PO
RT
OF
DE
PA
RT
UR
EM
EB
rilli
ant
Inva
der
; OD
AX
82
AT
FM
due
to A
TC
ST
AF
F/E
QU
IPM
EN
T E
NR
OU
TE
MA
83
AT
FM
due
to R
ES
TR
ICT
ION
AT
DE
ST
INA
TIO
N A
IRP
OR
TP
DE
uro
pean
foo
tbal
l cu
p; H
eads
of G
ove
rnm
ent m
eetin
gs8
9R
ES
TR
ICT
ION
S A
T A
IRP
OR
T O
F D
EP
AR
TU
RE
PA
83A
TF
M d
ue to
RE
ST
RIC
TIO
N A
T D
ES
TIN
AT
ION
AIR
PO
RT
WD
89
RE
ST
RIC
TIO
NS
AT
AIR
PO
RT
OF
DE
PA
RT
UR
EW
ET
hund
erst
orm
; lo
w v
isib
ility
; X w
ind
s7
3W
EA
TH
ER
EN
RO
UT
E O
R A
LTE
RN
AT
EW
A8
4A
TF
M d
ue to
WE
AT
HE
R A
T D
ES
TIN
AT
ION
VD
No
ise
89
RE
ST
RIC
TIO
NS
AT
AIR
PO
RT
OF
DE
PA
RT
UR
EV
A8
3A
TF
M d
ue to
RE
ST
RIC
TIO
N A
T D
ES
TIN
AT
ION
AIR
PO
RT
OD
89
RE
ST
RIC
TIO
NS
AT
AIR
PO
RT
OF
DE
PA
RT
UR
EO
ES
ecu
rity
aler
t8
1A
TF
M d
ue to
AT
C E
NR
OU
TE
DE
MA
ND
/CA
PA
CIT
YO
A8
3A
TF
M d
ue to
RE
ST
RIC
TIO
N A
T D
ES
TIN
AT
ION
AIR
PO
RT
IAT
AC
OR
RE
LA
TIO
N B
ET
WE
EN
IA
TA
DE
LA
Y C
OD
ES
AN
D T
HE
CF
MU
RE
AS
ON
S F
OR
RE
GU
LA
TIO
N
AT
C I
nd a
ctio
n
Acc
iden
t /
Inci
dent
AT
C c
apa
city
CF
MU
Oth
er
Spe
cial
Eve
nt
Equ
ipm
ent
non-
AT
C
Aer
odro
me
capa
city
Wea
ther
AT
C S
taff
ing
AT
C e
quip
men
t
Env
ironm
enta
l iss
ues
Mili
tary
act
ivity
Ind
Act
ion
non-
AT
C
Digest – Delays to Air Transport in Europe June 2012
I. June 2012 CODA coverage of commercial flights in the ECAC region.
EUROCONTROL 22 CODA