Embed Size (px)
DESCRIPTION
Cooling Tower Design ASHRAE Symposium Paper
Citation preview
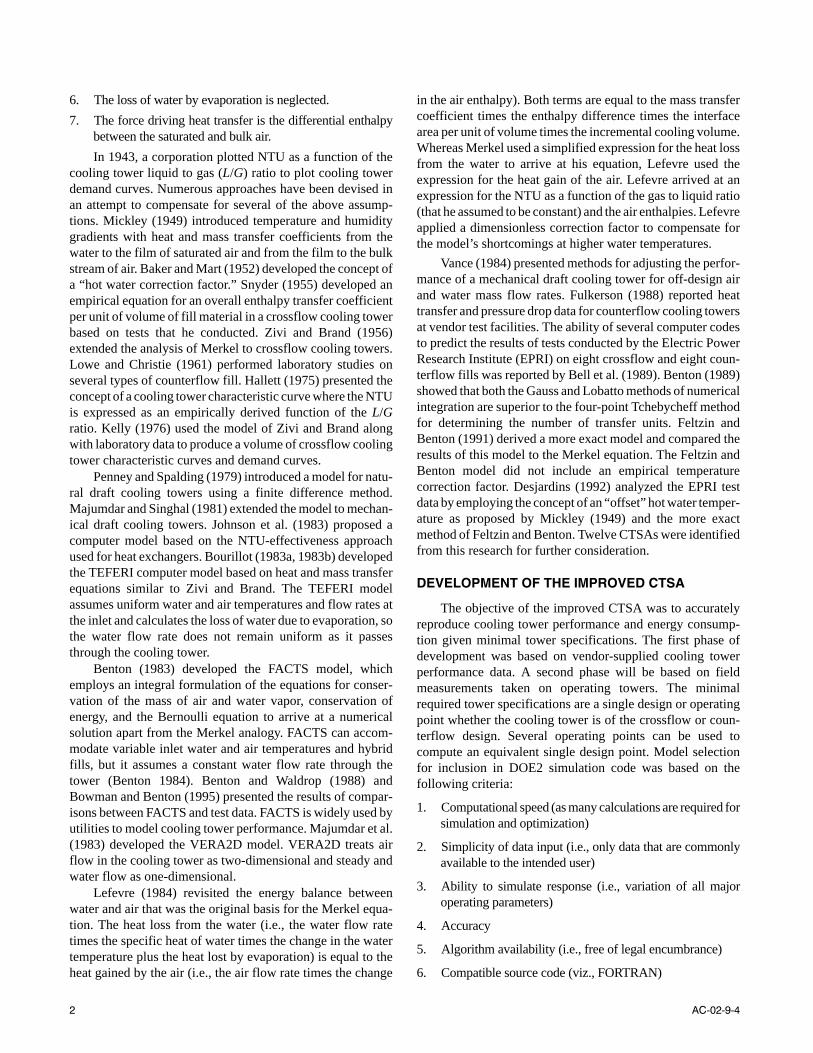
An Improved Cooling Tower Algorithm for the CoolToolsTM Simulation Model
Dudley J. Benton, Ph.D. Charles F. Bowman
Mark Hydeman Paul MillerMember ASHRAE
AC-02-9-4
ABSTRACT
An improved cooling tower simulation algorithm wasdeveloped for the CoolTools simulation model to support theoptimal design of chilled water systems. The new algorithmwas developed to predict more quickly and more accurately thethermal performance and energy consumption of a coolingtower. An array of previously known analytical and empiricalalgorithms and the newly developed empirical algorithm wereevaluated on the basis of accuracy and computational effi-ciency. The accuracy of each algorithm was determined for agiven set of operating conditions by a comparison between thecomputed approach to the inlet wet-bulb temperature(approach) and that determined from vendor-supplied perfor-mance curves. The results of the evaluation indicate that theempirical algorithms require considerably less computationaltime and provide more consistent results than do the analyticalalgorithms. The new empirical algorithm was found to be moreaccurate and more efficient than the previously existing algo-rithms.
INTRODUCTION
The CoolTools simulation model employing the DOE2simulation code is used for building energy analyses and opti-mizations. An important component of this model is thechilled water system that utilizes “package” type evaporativecooling towers. The expected performance of these evapora-tive cooling towers is based on cooling tower simulation algo-rithms (CTSAs). A literature review was conducted to identifythe existing CTSAs. An improved CTSA was developed andcompared with the existing CTSAs for speed and accuracy todetermine the best CTSA to be used by the DOE2 simulation
code. The accuracy of each CTSA was determined for a givenset of operating conditions by a comparison between thecomputed approach and that determined from vendor-supplied performance curves for an array of cooling towersthat have been certified by the Cooling Tower Institute.
In 1925, Dr. Fredrick Merkel (1925) proposed a theoryrelating evaporation and sensible heat transfer where there iscounterflow contact of water and air, such as in coolingtowers. Merkel made several simplifying assumptions thatreduce the governing relationships for a counterflow coolingtower to a single separable ordinary differential equation.Several authors have presented the derivation of the Merkelequation (Lefevre 1984; Feltzin and Benton 1991; Bowmanand Benton 1996). This equation expresses the number oftransfer units (NTU) as a function of the integral of the temper-ature difference divided by the enthalpy gradient in a coolingtower. Since the boundary conditions are known, the integralmay be integrated. Merkel used the four-point Tchebycheffmethod. Merkel posited that the bulk water in contact with astream of air is surrounded by a film of saturated air and thatthe saturated air is surrounded by a bulk stream of air. He madethe following assumptions:
1. The saturated air film is at the temperature of the bulk water.
2. The saturated air film offers no resistance to heat transfer.
3. The vapor content of the air is proportional to the partialpressure of the water vapor.
4. The heat transferred from the air to the film by convectionis proportional to the heat transferred from the film to theambient air by evaporation.
5. The specific heat of the air-water vapor mixture and the heatof vaporization are constant.
THIS PREPRINT IS FOR DISCUSSION PURPOSES ONLY, FOR INCLUSION IN ASHRAE TRANSACTIONS 2002, V. 108, Pt. 1. Not to be reprinted in whole or inpart without written permission of the American Society of Heating, Refrigerating and Air-Conditioning Engineers, Inc., 1791 Tullie Circle, NE, Atlanta, GA 30329.Opinions, findings, conclusions, or recommendations expressed in this paper are those of the author(s) and do not necessarily reflect the views of ASHRAE. Writtenquestions and comments regarding this paper should be received at ASHRAE no later than January 25, 2002.
Dudley J. Benton and Charles F. Bowman are with Chuck Bowman Associates, Inc., Knoxville, Tenn. Mark Hydeman is with Taylor Engi-neering, Alameda, Calif. Paul Miller is with Pacific Gas and Electric Company, San Ramon, Calif.
6. The loss of water by evaporation is neglected.
7. The force driving heat transfer is the differential enthalpybetween the saturated and bulk air.
In 1943, a corporation plotted NTU as a function of thecooling tower liquid to gas (L/G) ratio to plot cooling towerdemand curves. Numerous approaches have been devised inan attempt to compensate for several of the above assump-tions. Mickley (1949) introduced temperature and humiditygradients with heat and mass transfer coefficients from thewater to the film of saturated air and from the film to the bulkstream of air. Baker and Mart (1952) developed the concept ofa “hot water correction factor.” Snyder (1955) developed anempirical equation for an overall enthalpy transfer coefficientper unit of volume of fill material in a crossflow cooling towerbased on tests that he conducted. Zivi and Brand (1956)extended the analysis of Merkel to crossflow cooling towers.Lowe and Christie (1961) performed laboratory studies onseveral types of counterflow fill. Hallett (1975) presented theconcept of a cooling tower characteristic curve where the NTUis expressed as an empirically derived function of the L/Gratio. Kelly (1976) used the model of Zivi and Brand alongwith laboratory data to produce a volume of crossflow coolingtower characteristic curves and demand curves.
Penney and Spalding (1979) introduced a model for natu-ral draft cooling towers using a finite difference method.Majumdar and Singhal (1981) extended the model to mechan-ical draft cooling towers. Johnson et al. (1983) proposed acomputer model based on the NTU-effectiveness approachused for heat exchangers. Bourillot (1983a, 1983b) developedthe TEFERI computer model based on heat and mass transferequations similar to Zivi and Brand. The TEFERI modelassumes uniform water and air temperatures and flow rates atthe inlet and calculates the loss of water due to evaporation, sothe water flow rate does not remain uniform as it passesthrough the cooling tower.
Benton (1983) developed the FACTS model, whichemploys an integral formulation of the equations for conser-vation of the mass of air and water vapor, conservation ofenergy, and the Bernoulli equation to arrive at a numericalsolution apart from the Merkel analogy. FACTS can accom-modate variable inlet water and air temperatures and hybridfills, but it assumes a constant water flow rate through thetower (Benton 1984). Benton and Waldrop (1988) andBowman and Benton (1995) presented the results of compar-isons between FACTS and test data. FACTS is widely used byutilities to model cooling tower performance. Majumdar et al.(1983) developed the VERA2D model. VERA2D treats airflow in the cooling tower as two-dimensional and steady andwater flow as one-dimensional.
Lefevre (1984) revisited the energy balance betweenwater and air that was the original basis for the Merkel equa-tion. The heat loss from the water (i.e., the water flow ratetimes the specific heat of water times the change in the watertemperature plus the heat lost by evaporation) is equal to theheat gained by the air (i.e., the air flow rate times the change
in the air enthalpy). Both terms are equal to the mass transfercoefficient times the enthalpy difference times the interfacearea per unit of volume times the incremental cooling volume.Whereas Merkel used a simplified expression for the heat lossfrom the water to arrive at his equation, Lefevre used theexpression for the heat gain of the air. Lefevre arrived at anexpression for the NTU as a function of the gas to liquid ratio(that he assumed to be constant) and the air enthalpies. Lefevreapplied a dimensionless correction factor to compensate forthe model’s shortcomings at higher water temperatures.
Vance (1984) presented methods for adjusting the perfor-mance of a mechanical draft cooling tower for off-design airand water mass flow rates. Fulkerson (1988) reported heattransfer and pressure drop data for counterflow cooling towersat vendor test facilities. The ability of several computer codesto predict the results of tests conducted by the Electric PowerResearch Institute (EPRI) on eight crossflow and eight coun-terflow fills was reported by Bell et al. (1989). Benton (1989)showed that both the Gauss and Lobatto methods of numericalintegration are superior to the four-point Tchebycheff methodfor determining the number of transfer units. Feltzin andBenton (1991) derived a more exact model and compared theresults of this model to the Merkel equation. The Feltzin andBenton model did not include an empirical temperaturecorrection factor. Desjardins (1992) analyzed the EPRI testdata by employing the concept of an “offset” hot water temper-ature as proposed by Mickley (1949) and the more exactmethod of Feltzin and Benton. Twelve CTSAs were identifiedfrom this research for further consideration.
DEVELOPMENT OF THE IMPROVED CTSA
The objective of the improved CTSA was to accuratelyreproduce cooling tower performance and energy consump-tion given minimal tower specifications. The first phase ofdevelopment was based on vendor-supplied cooling towerperformance data. A second phase will be based on fieldmeasurements taken on operating towers. The minimalrequired tower specifications are a single design or operatingpoint whether the cooling tower is of the crossflow or coun-terflow design. Several operating points can be used tocompute an equivalent single design point. Model selectionfor inclusion in DOE2 simulation code was based on thefollowing criteria:
1. Computational speed (as many calculations are required forsimulation and optimization)
2. Simplicity of data input (i.e., only data that are commonlyavailable to the intended user)
3. Ability to simulate response (i.e., variation of all majoroperating parameters)
4. Accuracy
5. Algorithm availability (i.e., free of legal encumbrance)
6. Compatible source code (viz., FORTRAN)
2 AC-02-9-4
7. Completeness (i.e., not dependent on excessive auxiliaryfunctions or extensive libraries)
8. Compactness (i.e., small enough to be included as an inter-nal function of a larger code)
9. Computational stability (i.e., not producing sporadic run-time errors, such as division by zero or square-root of anegative number)
10. Robustness (i.e., consistently convergent with meaningfuloutput for meaningful input)
11. Range of applicability (viz., must cover the normal range ofoperation for package type towers)
Three of the CTSAs identified in the backgroundresearch, the TEFERI, FACTS, and VERA2D models, werediscarded because they failed to meet criteria 1, 2, 6, 8, and/or10 above. The following CTSAs were encoded and tested:DOE2 version 2.1D, DOE2 version 2.1E, DOE2 version 2.2,the Merkel method, LeFevre method, Benton and Feltzinimplementation of the LeFevre version, the “more nearlyexact” (exact) method, the LMTD method, and the NTU-effectiveness method. Of these CTSAs, which represent amixture of empirical and simple analytical algorithms, thefollowing were selected for further investigation:
1. The DOE2 version 2.2, a 12-parameter multi-variablecurve fit.
2. The Merkel method with the four-point Tchebycheff inte-gration method.
3. The Benton and Feltzin implementation of the LeFevremethod using the Lobatto quadrature instead of theRomberg numerical integration method.
4. The Benton and Feltzin exact method, a set of simultaneousnonlinear ordinary differential equations using the Runge-Kutta method of integration.
5. The NTU-effectiveness method, a modified version of theCTSA developed by the Environmental Protection Agency(EPA).
The accuracy of each CTSA was measured by computingapproach temperature as a function of wet-bulb temperature,cooling range, water flow rate, and fan power, based on asingle design point and by comparing this temperature tovendor-supplied data. None of the identified existing CTSAscompute approach directly from these other parameters;rather, the approach is required as input. As the accuracy wasmeasured by the computed approach, the most logical way toachieve the greatest accuracy was to develop a CTSA thatprovides approach directly. For a fixed complexity, this wouldalso be the most efficient way to compute tower performancewhen it is expressed as an approach temperature. Preliminarytesting of the existing models described above indicated thatan empirical algorithm would best meet the current objectives.Therefore, the improved algorithm is a regression modelbased on the approach. Separate correlation coefficients weredeveloped based on crossflow and counterflow data sets.
The task of generating this empirical expression for theimproved CTSA is basically one of multi-variable regression.Here, the dependent variable is approach and the independentvariables are wet bulb, range, water flow, and fan power. Manydevelopers have tackled this problem for empirically comput-ing cooling tower performance. The previous efforts identi-fied have grouped the independent variables and developedsequential regression models for the dependent variable orsome intermediate parameter used to compute the dependentvariable. All previous versions of the DOE2 CTSAs use someform of sequential regression on grouped parameters. Thisapproach treats each additional independent variable or groupof independent variables as a correction. Grouping the inde-pendent variables presumes significant interrelationshipswithin the groups. Separating the parameters presumes negli-gible interrelationships among the groups. Overlapping thegroups (i.e., one or more independent variables appearing inmore than one group) increases the regression error, as eachsequential regression must also minimize the systematic resid-uals left over from the previous regression. This regressionproblem is evidenced by an increasing number of coefficientswithout significant reduction in error.
Simultaneous regression on all the independent variablesis the best approach to minimize the error over an entire dataset. Linear least-squares regression was used. A power expan-sion involving all the independent variables is the simplestform, allowing interaction among all of the variables. A zero-order expansion yields a single term and coefficient. A first-order expansion of four independent variables yields fiveterms and coefficients. A second-order expansion, includingevery possible combination up to a power of two, yields 15terms. A third-order expansion yields 35 terms and so on. Athird-order expansion proved to be the most satisfactory forthe present development, yielding the highest regression coef-ficient. The new CTSA is basically a higher-order, multi-parameter enhancement of the DOE2 rating functions basedon approach rather than rating.
Two problems arose in practical applications of such aregression involving so many terms. The first problem was aresult of finite digital accuracy. The least-squares matrixbecomes increasingly graded as the number of termsincreases. A graded matrix is one having very large and verysmall terms that are all significant. With finite-precision calcu-lations, the small terms are lost, and the resulting agreement ispoor. In order to minimize this problem, 80-bit precision wasused throughout, along with maximal preconditioning of theregression matrix. Intel 80-bit floating-point numbers have arange of 10±4092 and provide approximately 18 significantfigures. The second problem that arose was that of erraticbehavior. A high-order regression may fit the data points quitewell yet produce unreasonable results between and outside thedata points (i.e., interpolation and extrapolation). Data pointweighting was used to control erratic behavior. Erratic behav-ior is most pronounced at extreme values of the independentvariables (e.g., at very high range or very low wet bulb). Multi-
AC-02-9-4 3
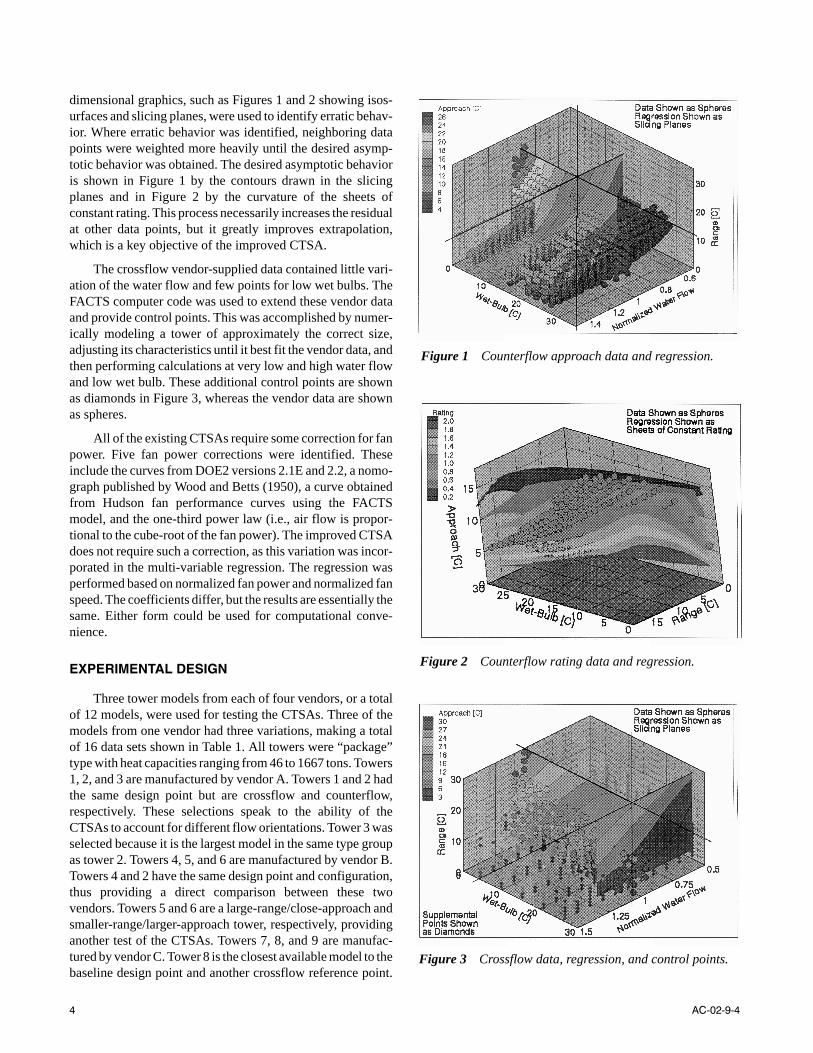
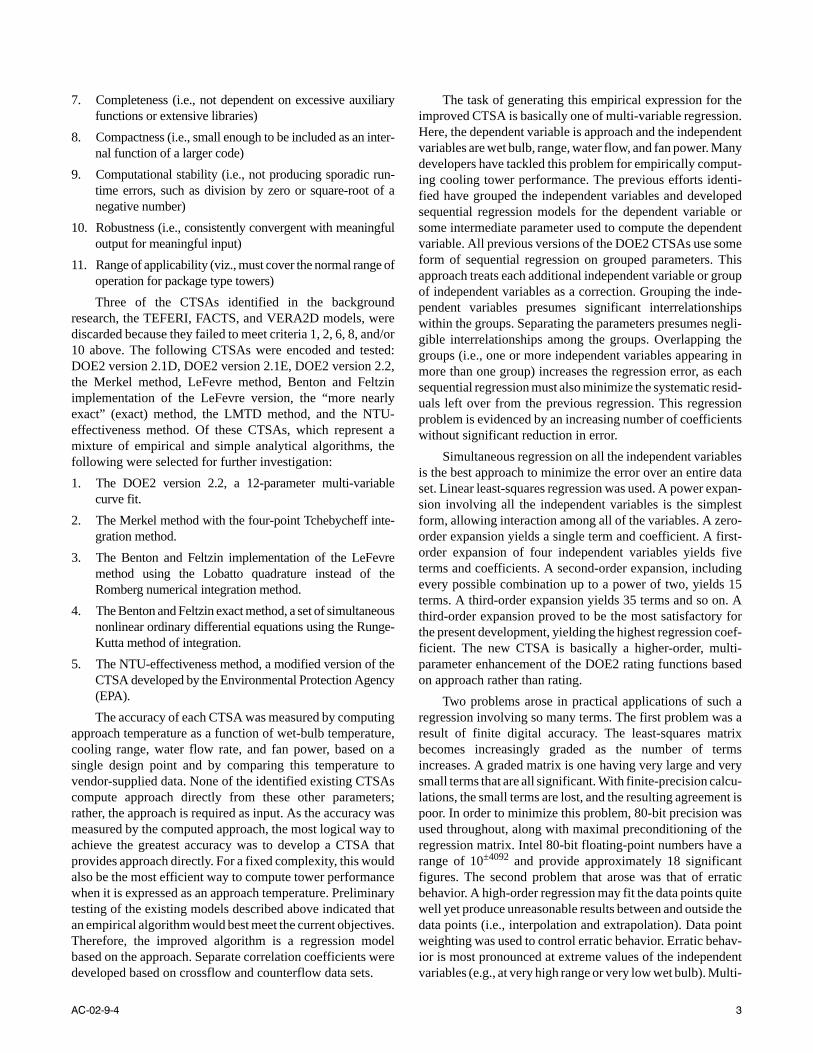
dimensional graphics, such as Figures 1 and 2 showing isos-urfaces and slicing planes, were used to identify erratic behav-ior. Where erratic behavior was identified, neighboring datapoints were weighted more heavily until the desired asymp-totic behavior was obtained. The desired asymptotic behavioris shown in Figure 1 by the contours drawn in the slicingplanes and in Figure 2 by the curvature of the sheets ofconstant rating. This process necessarily increases the residualat other data points, but it greatly improves extrapolation,which is a key objective of the improved CTSA.
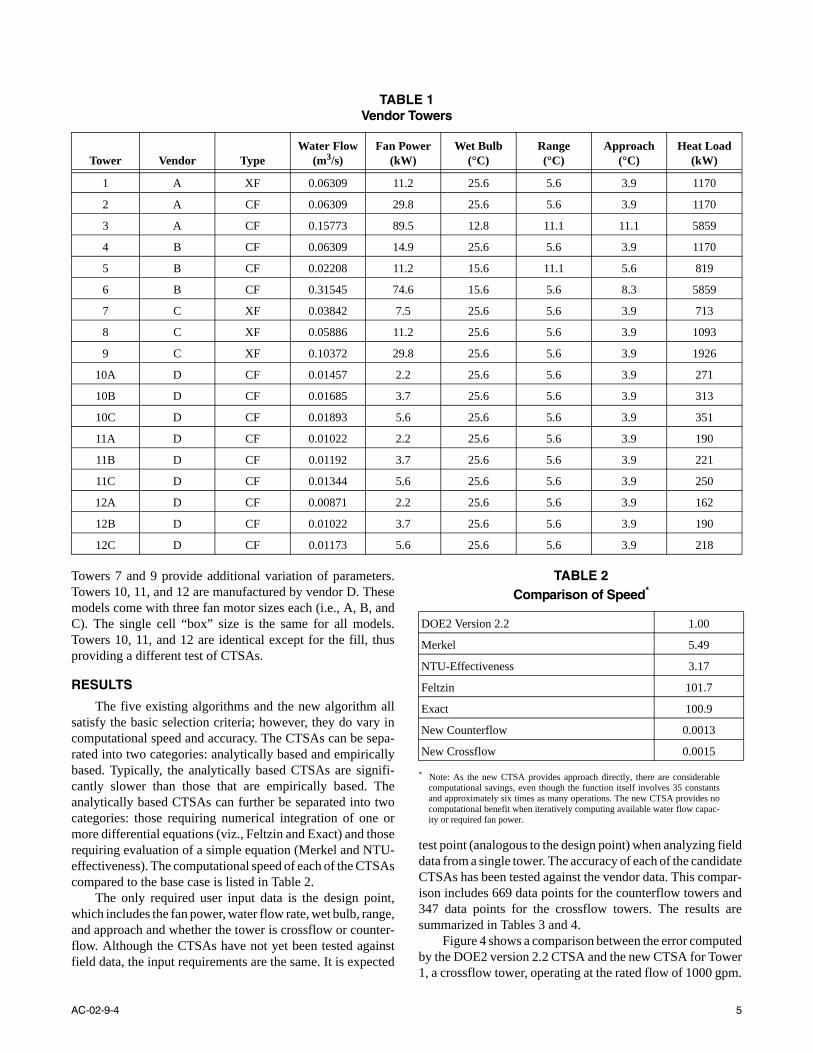
The crossflow vendor-supplied data contained little vari-ation of the water flow and few points for low wet bulbs. TheFACTS computer code was used to extend these vendor dataand provide control points. This was accomplished by numer-ically modeling a tower of approximately the correct size,adjusting its characteristics until it best fit the vendor data, andthen performing calculations at very low and high water flowand low wet bulb. These additional control points are shownas diamonds in Figure 3, whereas the vendor data are shownas spheres.
All of the existing CTSAs require some correction for fanpower. Five fan power corrections were identified. Theseinclude the curves from DOE2 versions 2.1E and 2.2, a nomo-graph published by Wood and Betts (1950), a curve obtainedfrom Hudson fan performance curves using the FACTSmodel, and the one-third power law (i.e., air flow is propor-tional to the cube-root of the fan power). The improved CTSAdoes not require such a correction, as this variation was incor-porated in the multi-variable regression. The regression wasperformed based on normalized fan power and normalized fanspeed. The coefficients differ, but the results are essentially thesame. Either form could be used for computational conve-nience.
EXPERIMENTAL DESIGN
Three tower models from each of four vendors, or a totalof 12 models, were used for testing the CTSAs. Three of themodels from one vendor had three variations, making a totalof 16 data sets shown in Table 1. All towers were “package”type with heat capacities ranging from 46 to 1667 tons. Towers1, 2, and 3 are manufactured by vendor A. Towers 1 and 2 hadthe same design point but are crossflow and counterflow,respectively. These selections speak to the ability of theCTSAs to account for different flow orientations. Tower 3 wasselected because it is the largest model in the same type groupas tower 2. Towers 4, 5, and 6 are manufactured by vendor B.Towers 4 and 2 have the same design point and configuration,thus providing a direct comparison between these twovendors. Towers 5 and 6 are a large-range/close-approach andsmaller-range/larger-approach tower, respectively, providinganother test of the CTSAs. Towers 7, 8, and 9 are manufac-tured by vendor C. Tower 8 is the closest available model to thebaseline design point and another crossflow reference point.
Figure 1 Counterflow approach data and regression.
Figure 2 Counterflow rating data and regression.
Figure 3 Crossflow data, regression, and control points.
4 AC-02-9-4
Towers 7 and 9 provide additional variation of parameters.Towers 10, 11, and 12 are manufactured by vendor D. Thesemodels come with three fan motor sizes each (i.e., A, B, andC). The single cell “box” size is the same for all models.Towers 10, 11, and 12 are identical except for the fill, thusproviding a different test of CTSAs.
RESULTS
The five existing algorithms and the new algorithm allsatisfy the basic selection criteria; however, they do vary incomputational speed and accuracy. The CTSAs can be sepa-rated into two categories: analytically based and empiricallybased. Typically, the analytically based CTSAs are signifi-cantly slower than those that are empirically based. Theanalytically based CTSAs can further be separated into twocategories: those requiring numerical integration of one ormore differential equations (viz., Feltzin and Exact) and thoserequiring evaluation of a simple equation (Merkel and NTU-effectiveness). The computational speed of each of the CTSAscompared to the base case is listed in Table 2.
The only required user input data is the design point,which includes the fan power, water flow rate, wet bulb, range,and approach and whether the tower is crossflow or counter-flow. Although the CTSAs have not yet been tested againstfield data, the input requirements are the same. It is expected
test point (analogous to the design point) when analyzing fielddata from a single tower. The accuracy of each of the candidateCTSAs has been tested against the vendor data. This compar-ison includes 669 data points for the counterflow towers and347 data points for the crossflow towers. The results aresummarized in Tables 3 and 4.
Figure 4 shows a comparison between the error computedby the DOE2 version 2.2 CTSA and the new CTSA for Tower1, a crossflow tower, operating at the rated flow of 1000 gpm.
TABLE 1 Vendor Towers
Tower Vendor TypeWater Flow
(m3/s)Fan Power
(kW)Wet Bulb
(°C)Range (°C)
Approach (°C)
Heat Load (kW)
1 A XF 0.06309 11.2 25.6 5.6 3.9 1170
2 A CF 0.06309 29.8 25.6 5.6 3.9 1170
3 A CF 0.15773 89.5 12.8 11.1 11.1 5859
4 B CF 0.06309 14.9 25.6 5.6 3.9 1170
5 B CF 0.02208 11.2 15.6 11.1 5.6 819
6 B CF 0.31545 74.6 15.6 5.6 8.3 5859
7 C XF 0.03842 7.5 25.6 5.6 3.9 713
8 C XF 0.05886 11.2 25.6 5.6 3.9 1093
9 C XF 0.10372 29.8 25.6 5.6 3.9 1926
10A D CF 0.01457 2.2 25.6 5.6 3.9 271
10B D CF 0.01685 3.7 25.6 5.6 3.9 313
10C D CF 0.01893 5.6 25.6 5.6 3.9 351
11A D CF 0.01022 2.2 25.6 5.6 3.9 190
11B D CF 0.01192 3.7 25.6 5.6 3.9 221
11C D CF 0.01344 5.6 25.6 5.6 3.9 250
12A D CF 0.00871 2.2 25.6 5.6 3.9 162
12B D CF 0.01022 3.7 25.6 5.6 3.9 190
12C D CF 0.01173 5.6 25.6 5.6 3.9 218
TABLE 2 Comparison of Speed*
DOE2 Version 2.2 1.00
Merkel 5.49
NTU-Effectiveness 3.17
Feltzin 101.7
Exact 100.9
New Counterflow 0.0013
New Crossflow 0.0015
* Note: As the new CTSA provides approach directly, there are considerablecomputational savings, even though the function itself involves 35 constantsand approximately six times as many operations. The new CTSA provides nocomputational benefit when iteratively computing available water flow capac-ity or required fan power.
AC-02-9-4 5
The error is the difference between the cold water temperaturepredicted by the CTSA and that predicted by the cooling towervendor. For this cooling tower, the new CTSA is well behavedin comparison with DOE2 version 2.2. The 95% confidenceinterval is approximately half that of DOE2 version 2.2 (0.19vs. 0.36).
A comparison may be made between towers 1 and 2,which have the same design point but are crossflow and coun-terflow, respectively. This comparison, shown in Table 5, indi-cates that all of the CTSAs, including the new CTSA, moreaccurately predict the performance of the crossflow tower thanthe counterflow tower. These results include 96 data points.
TABLE 3 CTSA Accuracy for Counterflow Cooling Towers (°C)
CTSA DOE2 V2.2 Merkel NTU-Effectiveness Feltzin Exact Cnew
Average Error 0.0 0.1 0.2 0.1 0.1 0.0
Maximum Error 1.7 1.6 3.9 1.4 1.4 0.9
Standard Deviation 0.4 0.4 1.0 0.4 0.4 0.3
95% Confidence Interval* 0.8 0.9 2.0 0.8 0.8 0.5
* Note: The 95% confidence interval is a revealing statistical measure of the CTSA’s accuracy because it takes into account the deviation and the sample size. The 95% con-fidence interval for the new CTSA is approximately two-thirds that of DOE2 version 2.2.
TABLE 4 CTSA Accuracy for Crossflow Cooling Towers (°C)
CTSA DOE2 V2.2 Merkel NTU-Effectiveness Feltzin Exact Cnew
Average Error –0.2 0.2 –0.4 0.2 0.2 0.1
Maximum Error 2.2 1.4 2.3 1.4 1.4 1.2
Standard Deviation 0.4 0.3 0.6 0.3 0.3 0.3
95% Confidence Interval* 0.8 0.6 1.2 0.6 0.6 0.6
* Note: The 95% confidence interval is a revealing statistical measure of the CTSA’s accuracy because it takes into account the deviation and the sample size. The 95% con-fidence interval for the new CTSA is approximately two-thirds that of DOE2 version 2.2.
TABLE 5 CTSA Accuracy for Crossflow and Counterflow Cooling Towers (°C)
CTSA DOE2 V2.2 Merkel NTU-Effectiveness Feltzin Exact Cnew
Tower 1 (XF) Std. Dev. 0.20 0.16 0.49 0.13 0.13 0.11
Tower 2 (CF) Std. Dev. 0.29 0.39 0.54 0.36 0.36 0.26
Figure 4 DOE2 version 2.2 CTSA vs. tower 1 data. Figure 5 Improved CTSA vs. tower 1 data.
6 AC-02-9-4
Figures 4 and 5 show the computed error as a function of the
wet-bulb temperature for an array of cooling ranges for DOE2
version 2.2 and the new CTSAs. These results show that for
the counterflow tower, the error computed by the new CTSA
increases with increasing range as do the other CTSAs (see
Figure 5). For the case of tower 2, the new CTSA is not as well
behaved as the DOE2 version 2.2 CTSA at higher ranges.
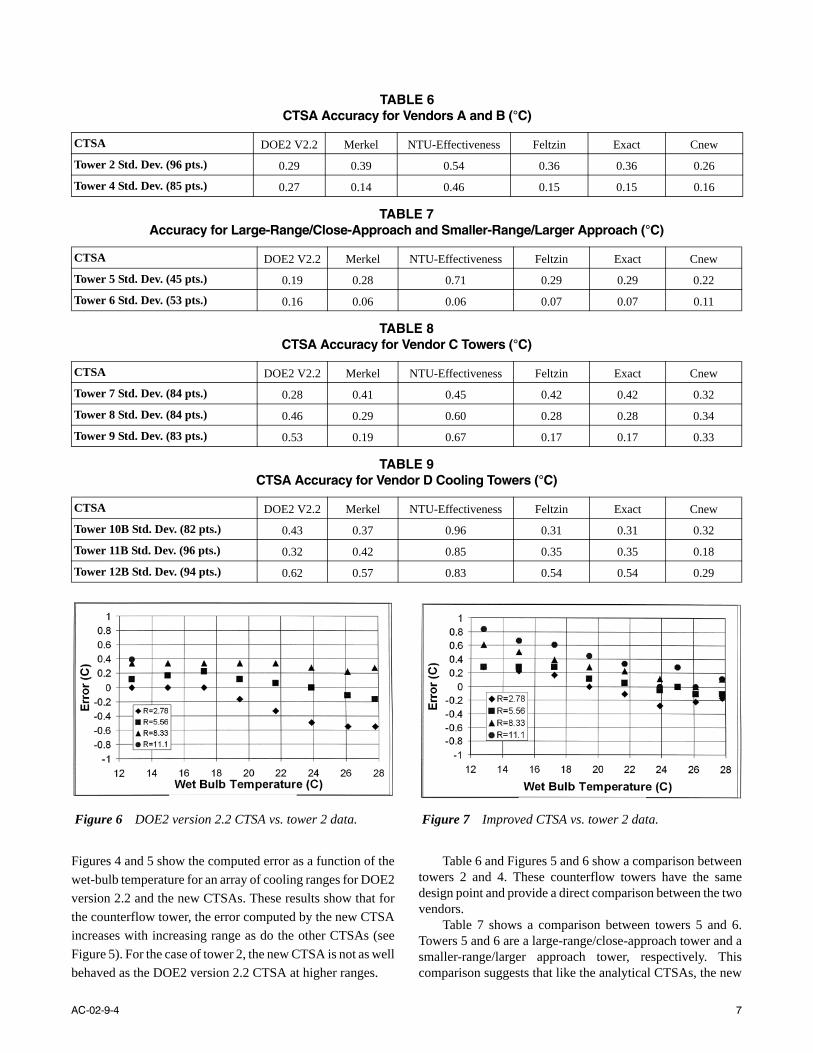
Table 6 and Figures 5 and 6 show a comparison betweentowers 2 and 4. These counterflow towers have the samedesign point and provide a direct comparison between the twovendors.
Table 7 shows a comparison between towers 5 and 6.Towers 5 and 6 are a large-range/close-approach tower and asmaller-range/larger approach tower, respectively. Thiscomparison suggests that like the analytical CTSAs, the new
TABLE 6 CTSA Accuracy for Vendors A and B (°C)
CTSA DOE2 V2.2 Merkel NTU-Effectiveness Feltzin Exact Cnew
Tower 2 Std. Dev. (96 pts.) 0.29 0.39 0.54 0.36 0.36 0.26
Tower 4 Std. Dev. (85 pts.) 0.27 0.14 0.46 0.15 0.15 0.16
TABLE 7 Accuracy for Large-Range/Close-Approach and Smaller-Range/Larger Approach (°C)
CTSA DOE2 V2.2 Merkel NTU-Effectiveness Feltzin Exact Cnew
Tower 5 Std. Dev. (45 pts.) 0.19 0.28 0.71 0.29 0.29 0.22
Tower 6 Std. Dev. (53 pts.) 0.16 0.06 0.06 0.07 0.07 0.11
TABLE 8 CTSA Accuracy for Vendor C Towers (°C)
CTSA DOE2 V2.2 Merkel NTU-Effectiveness Feltzin Exact Cnew
Tower 7 Std. Dev. (84 pts.) 0.28 0.41 0.45 0.42 0.42 0.32
Tower 8 Std. Dev. (84 pts.) 0.46 0.29 0.60 0.28 0.28 0.34
Tower 9 Std. Dev. (83 pts.) 0.53 0.19 0.67 0.17 0.17 0.33
TABLE 9 CTSA Accuracy for Vendor D Cooling Towers (°C)
CTSA DOE2 V2.2 Merkel NTU-Effectiveness Feltzin Exact Cnew
Tower 10B Std. Dev. (82 pts.) 0.43 0.37 0.96 0.31 0.31 0.32
Tower 11B Std. Dev. (96 pts.) 0.32 0.42 0.85 0.35 0.35 0.18
Tower 12B Std. Dev. (94 pts.) 0.62 0.57 0.83 0.54 0.54 0.29
Figure 6 DOE2 version 2.2 CTSA vs. tower 2 data. Figure 7 Improved CTSA vs. tower 2 data.
AC-02-9-4 7
CTSA does a better job of predicting the performance of thesmall-range/large approach tower than the large-range/close-approach tower.
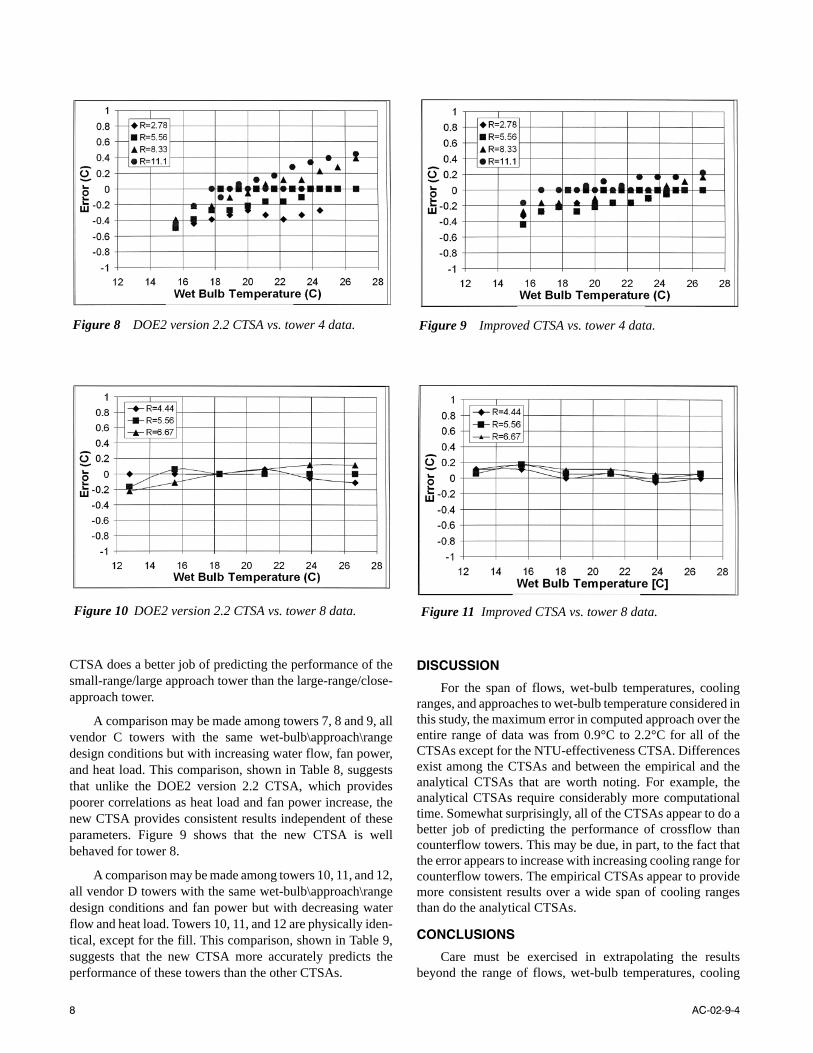
A comparison may be made among towers 7, 8 and 9, allvendor C towers with the same wet-bulb\approach\rangedesign conditions but with increasing water flow, fan power,and heat load. This comparison, shown in Table 8, suggeststhat unlike the DOE2 version 2.2 CTSA, which providespoorer correlations as heat load and fan power increase, thenew CTSA provides consistent results independent of theseparameters. Figure 9 shows that the new CTSA is wellbehaved for tower 8.
A comparison may be made among towers 10, 11, and 12,all vendor D towers with the same wet-bulb\approach\rangedesign conditions and fan power but with decreasing waterflow and heat load. Towers 10, 11, and 12 are physically iden-tical, except for the fill. This comparison, shown in Table 9,suggests that the new CTSA more accurately predicts theperformance of these towers than the other CTSAs.
DISCUSSION
For the span of flows, wet-bulb temperatures, coolingranges, and approaches to wet-bulb temperature considered inthis study, the maximum error in computed approach over theentire range of data was from 0.9°C to 2.2°C for all of theCTSAs except for the NTU-effectiveness CTSA. Differencesexist among the CTSAs and between the empirical and theanalytical CTSAs that are worth noting. For example, theanalytical CTSAs require considerably more computationaltime. Somewhat surprisingly, all of the CTSAs appear to do abetter job of predicting the performance of crossflow thancounterflow towers. This may be due, in part, to the fact thatthe error appears to increase with increasing cooling range forcounterflow towers. The empirical CTSAs appear to providemore consistent results over a wide span of cooling rangesthan do the analytical CTSAs.
CONCLUSIONS
Care must be exercised in extrapolating the resultsbeyond the range of flows, wet-bulb temperatures, cooling
Figure 8 DOE2 version 2.2 CTSA vs. tower 4 data.
Figure 10 DOE2 version 2.2 CTSA vs. tower 8 data.
Figure 9 Improved CTSA vs. tower 4 data.
Figure 11 Improved CTSA vs. tower 8 data.
8 AC-02-9-4
ranges, and approaches considered. Neither the empirical northe analytical models considered appear to exhibit any partic-ular advantage in extrapolating results beyond the range ofavailable data.
The purely empirical CTSAs were shown to provideaccuracy comparable to the analytical ones. In general, thenew CTSAs are more accurate and better behaved than DOE2version 2.2. This conclusion applies to both crossflow andcounterflow cooling towers and to all of the cooling towervendors. There are a few exceptions to this conclusion. Forexample, the error for the new CTSA is slightly higher thanthat of DOE2 version 2.2 for tower 5, and the new CTSA is notwell behaved for tower 2. However, overall, the error for thenew CTSA is approximately two-thirds that of DOE2 version2.2.
ACKNOWLEDGMENTS
The authors acknowledge the financial support of PacificGas and Electric Corporation in making this presentationpossible. The authors also express appreciation for thevendors who provided the performance data.
REFERENCES
Baker, R., and L.T. Mart. 1952. Refrigeration Engineering,p. 965.
Bell, D.M., B.M. Johnson, and E.V. Werry. 1989. Coolingtower performance prediction and improvement, EPRIGS-6370. Palo Alto, Calif.: Electric Power ResearchInstitute.
Benton, D.J. 1983. A numerical simulation of heat transfer inevaporative cooling towers. Report WR28-1-900-110.Knoxville, Tenn.: Tennessee Valley Authority.
Benton, D.J. 1984. Computer simulation of hybrid fill incrossflow mechanical-induced-draft cooling towers.Winter Annual Meeting, ASME, New York.
Benton, D.J., and W.R.Waldrop. 1988. Computer simulationof transport phenomena in evaporative cooling towers.Journal of Engineering for Gas Turbines and Power110: 190.
Benton, D.J. 1989. Letter to CTI Non-Merkel CommitteeMembers, July 24.
Bourillot, C. 1983a. On the hypotheses of calculating thewater flow rate evaporated in a wet cooling tower, EPRICS-3144-SR. Palo Alto, Calif.: Electric Power ResearchInstitute.
Bourillot, C. 1983b. TEFERI, Numerical model for calculat-ing the performance of an evaporative cooling tower,EPRI CS-3212-SR. Palo Alto, Calif.: Electric PowerResearch Institute.
Bowman, C.F., and D.J. Benton. 1995. Cooling tower perfor-mance. Thermal Performance Improvement Seminar.Palo Alto, Calif.: Electric Power Research Institute.
Bowman, C.F., and D.J. Benton. 1996. Oriented spray-assisted cooling tower. Houston, Tex.: Cooling TowerInstitute.
FWC. 1943. Cooling tower performance, Bulletin CT-43-2,Foster Wheeler Corporation.
Desjardins, R.J. 1992. Using the EPRI test data to verify amore accurate method of predicting cooling tower per-formance. Houston, Tex.: Cooling Tower Institute.
Feltzin, A.E., and D.J. Benton. 1991. A more nearly exactrepresentation of cooling tower theory. Houston, Tex.:Cooling Tower Institute.
Fulkerson, R.D. 1988. Comparative evaluation of counter-flow cooling tower fills. Houston, Tex.: Cooling TowerInstitute.
Hallett, G.F. 1975. Performance curves for mechanical draftcooling towers. Journal of Engineering for Power, p.503.
Johnson, B.M., D.K. Kreid, and S.G. Hanson. 1983. Amethod of comparing performance of extended-surfaceheat exchangers. Heat Transfer Engineering 4(1).
Kelly, N.W. 1976. Kelly's handbook of crossflow coolingtower performance. Kansas City, Missouri: Neil W.Kelly and Associates.
Lefevre, M.R. 1984. Eliminating the Merkel theory approxi-mations—Can it replace the empirical “temperature cor-rection factor”? Houston, Tex.: Cooling Tower Institute.
Lowe, H.J., and D.G. Christie. 1961. Heat transfer and pres-sure drop in cooling tower packing and model studies ofthe resistance of natural-draft towers to airflow. Interna-tional Division of Heat Transfer, part V, p. 933. NewYork: ASME.
Merkel, F. 1925. Verduftungskuhlung. VDI Forschungsarbe-iten, no. 275, Berlin.
Mickley, H.S. 1949. Chemical Engineering Progress 45:739.
Majumdar, A.K., and A.K. Singhal. 1981. VERA2D—A com-puter program for two-dimensional analysis of flow,heat and mass transfer in evaporative cooling towers,vol. II—User’s manual. Palo Alto, Calif.: ElectricPower Research Institute.
Majumdar, A.K., A.K. Singhal, and D.B. Spalding. 1983.VERA2D: Program for 2-d analysis of flow, heat, andmass transfer in evaporative cooling towers—Volume 1:Mathematical formulation, solution procedure, andapplications, EPRI CS-2923. Palo Alto, Calif.: ElectricPower Research Institute.
Penney, T.R., and D.B. Spalding. 1979. Validation of coolingtower analyzer (VERA), vols. 1 and 2, EPRI ReportFP-1279. Palo Alto, Calif.: Electric Power ResearchInstitute.
AC-02-9-4 9

Snyder, N.W. 1955. Effect of air rate, water rate, tempera-ture, and packing density in a cross-flow cooling tower.Chemical Engineering Progress 52(18): 61.
Vance, J.M. 1984. Determination of fan flow and water rateadjustment for off-design cooling tower tests. Houston,Tex.: Cooling Tower Institute.
Woods and Betts. 1950. Engineer 189: 337.
Zivi, S. M., and B.B. Brand. 1956. An analysis of the cross-flow cooling tower. Refrigeration Engineering.
10 AC-02-9-4