Embed Size (px)
Citation preview
Are Consumers Aware of Top-Bottom but not of Left-Right Inferences?
Implications for Shelf Space Positions
Abstract
We propose that the horizontal and vertical position of an item on a display is a source of
information that individuals use to make judgments. Six experiments, using 1x5 or 5 x 5 displays, show
that consumers judge that products placed at the bottom (vs. top) and on the left (vs. middle and right)
hand side of a display are less expensive and of lower quality (Study 1a using a bar display, S1b using
wine, and S1c using swatches). Results support the claim that verticality effects (top-‐bottom) are
attenuated when participants are less involved with the decision task (Study 2 using swatches and
chocolates), and when they are exposed to information that questions the diagnosticity of using vertical
position as a cue (Study 3 using wine). However, the horizontality (left-‐right) effect is robust to both
these manipulations. Horizontality effects are exacerbated for participants primed with a number line
(Study 4 also using wine), suggesting that exposure to the number line (where higher numbers are on
the right) is a possible antecedent of the horizontality effect. The verticality effects may, on the other
hand, reflect people’s retail experience of seeing higher priced products on higher shelves, which leads
to their forming a similar expectation. The paper concludes with a discussion of theoretical implications
for visual information processing, as well as practical implications for retail management.
Key Words: Inferences, in-‐store displays, position schemas, choice preferences.
1
Imagine a beautiful day in Istanbul. You are visiting friends and decide to bring a bottle of wine. At
the nearest store, you realize that you have no idea about what Turkish wines are like, that the store
does not have clear price tags, and no one is immediately available to answer questions. Which
contextual cues would you use to make a decision when individuating product information is not
available? In this paper, we propose that i) the position a product holds in an in-‐store display is a source
of information that consumers use to make price and quality inferences, ii) lower rows are perceived to
hold less expensive and lower quality products than higher rows: a verticality inference; iii) left positions
are perceived to hold lower quality and less expensive products than middle and right hand side
positions: a horizontality inference; iv) the route through which position is used as a source of
information is different: verticality inferences use position as a diagnostic cue based on prior beliefs
about shelf displays, whereas horizontality inferences are due to exposure to the number line (where
higher numbers are on the right) and operate outside of conscious awareness.
This paper adds to prior research that has provided evidence in the marketing literature that
shelf positions are considered informative. For example, Bemmaor and Mochoux (1991) showed that
point of purchase (POP) signage multiplied the effect of price reduction and augmented sales. Inman,
McAlister and Hoyer (1990) found that consumers believe that products placed at the end of the aisle as
a promotion are offered at a discount, even when they are not. In terms of array-‐based position effects,
Nisbett and Wilson (1977) documented that stockings placed on the right were perceived to be of
superior quality but did not clearly explain why. Valenzuela and Raghubir (2009) showed that items in a
horizontal center position were not only perceived to be the most popular but also enjoyed a choice
advantage due to a “center stage” effect, and Chandon, Hutchinson, Bradlow, and Young (2009) and
Atalay, Bodur, and Rasolofoarison (2012) found that items in the center attracted more attention (with
the left side being the lowest visual lift region). Finally, Valenzuela, Raghubir, and Mitakakis (2013)
2
reported support for consumer lay theories about the organization of displays within a store. For
example, central items in a display tend to be popular items, end of aisle items tend to be on sale, and
expensive items tend to be on top shelves, which are all part of a larger set of shelf space schemas.
Valenzuela et al. (2013) confirmed through multiple store audits of several consumer good categories
that the vertical ordering rule of placing expensive items in top shelves is consistent across store formats
(small and large supermarkets as well as convenience stores), regional markets (East and West Coast)
and product categories (toothpaste, soda drinks, pasta sauce and cookies).
In sum, prior literature shows that the position products hold in a retail environment drives
attention and is often used by consumers to make inferences, which influence consumer choices. The
marketing literature provides support for order-‐based inferences in the case of products placed in an
end of aisle, central and top position. This paper tests these order-‐based position effects within a
broader framework and proposes that i) people use position as a source of information to make
judgments about products in the same way as they have been shown to do with people (Raghubir &
Valenzuela, 2006; Taylor & Fiske, 1975); ii) verticality inferences reflect beliefs that higher price and
quality products are on top (vs. bottom) shelves (Valenzuela et al., 2013); iii) horizontality inferences are
due to the implicit use of a number line (Dehaene, Piazza, Pinel, & Cohen, 2003) and reflect that lower
price and quality products are on the left hand side.
The paper contributes to the literature on position effects by determining that these two sets of
judgments follow different inferential processes and have different boundary conditions. When
consumers make judgments and choice decisions based on limited information, product attribute
information may be inferred from whatever information cues are available (Kardes, Posavac, & Cronley,
2004). We investigate whether the two separate sets of cues underlying the extraction of meaning from
vertical and horizontal positions in a shelf store display are differentially expected, presumably due to
consumers’ experience with retail displays, and, as a result, lead to different inferential processes.
3
We propose that there may be differences in the level of awareness consumers have as to
whether they extract meaning from vertical and horizontal positions in shelf displays, even if both sets
of inferences reflect heuristic processing (Chaiken & Maheswaran, 1994), and that these differences
determine how malleable these inferences are. Correlation based inferences take place when individuals
use given information about a specific cue (e.g., height of placement) to draw conclusions about a
general property (e.g., quality or price). Correlation-‐based inferences tend to be memory-‐based since
prior expectations about the correlation between specific cues and product attributes guide the
inferential process. As a consequence, a certain level of awareness and exposure to the diagnostic value
of the cue is necessary for correlation-‐based inferences to occur (Lee & Olshavsky, 1997). We predict
that verticality inferences are of this nature. On the other hand, it is sometimes the case that consumers
know the result of a cognitive process but do not know how the cognitive process operates (Nisbett &
Wilson, 1977). That is, consumers may not always be aware of the belief system that serves as an
antecedent to inference-‐making. We propose that horizontality inferences fall into this category.
We propose and test that verticality inferences follow a type of inferential process that is nested
in explicit lay beliefs. This is because consumers explicitly agree that products in higher rows have higher
prices and better quality since retailers often follow this practice (Valenzuela et al., 2013). However,
horizontality inferences represent a different case. Given the lack of evidence that retailers follow any
such rules, there is, understandably, low awareness of any left-‐right rule for horizontal placement
(Valenzuela et al., 2013). Accordingly, if consumers’ inferences reflect a left-‐right pattern, it is unlikely
that they would be formed via a process that recognizes position as a diagnostic cue. In line with this
reasoning, Dehaene et al.’s (2003) research suggests that horizontality effects can exist via spontaneous
inferences made outside of awareness and may be contingent on exposure to the number line where
higher numbers are on the right hand side.
4
Following a literature review, six studies are described. The paper concludes with a discussion of
theoretical implications for visual information processing and inference formation, as well as practical
implications for retail management. We now briefly discuss prior literature on position based effects.
Position-‐Based Inferences
Verticality-‐Hypothesis
The metaphoric usage of “verticality” is reflected in language that describes people’s shared
beliefs (Lakoff & Johnson, 1980). Phrases such as “climbing to the top of the organizational ladder,”
“scaling heights,” “pinnacle of success,” “on top of things,” “high point,” versus “hitting rock bottom,”
“sinking to one’s level,” “down and out,” use a vertical top-‐bottom analogy to reflect that it is better to
be on top than on the bottom in a normative sense. The common use of prefixes such as “over” versus
“under,” “up” versus “down,” “high” versus “low” also reflect spatial undertones consistent with the
view: “Higher is better.” These beliefs may also be reflected in gestures with the origin of these
metaphors being spatial as “defying gravity takes strength” (Tversky, 2011, pp 30).
Two articles examine the effects of verticality in a spatial setting and find evidence supporting
the meta-‐belief that “higher is better” (Meier & Robinson, 2004; Schubert, 2005). Meier and Robinson
(2004) document that the vertical position of two words differing in terms of valence affects the speed
with which they are recognized: Positive words are recognized faster when placed at the top of a
computer screen, and negative words are recognized faster when placed at the bottom of the screen.
Schubert (2005) suggests that the origin of verticality inferences is the strongly held meta-‐belief
that higher is better, which is learned and reinforced by daily exposure throughout peoples’ lives (Chiao,
Bordeaux, & Ambadi, 2004). Specifically, Schubert (2005) studies the notion that vertical spatial
positions are associated with power. He finds that people possess a shared spatial metaphor for power:
those in higher physical positions are perceived to be more powerful and relationships between a pair of
5
occupations (e.g., student/professor) are categorized faster when the more powerful profession is at the
top of the display and the less powerful one at the bottom. These effects extend to domains other than
people, such as animals. Schubert’s findings further show that embodiment effects are due to the
mental simulation process and conditional on the judgment that has to be made.
A vertical dimension in space is probably part of many different representations of abstract
concepts besides power and valence. For example, in the marketing domain, Nelson and Simmons
(2009) developed an application to evaluations of service quality based on cardinal north-‐south
direction; and Deng and Kahn (2009) demonstrated that the position of a product image on a package
can also affect perceptions of weight: Heavier locations are on the bottom-‐right versus top-‐left.
Valenzuela et al. (2013) reported that consumers believe that higher priced items are placed in
top (versus bottom rows), and that there is evidence that retailers follow this practice. As consumers
infer quality from high prices, higher price inferences for items on the top (versus bottom) of displays
will translate into perceptions of quality (Rao & Monroe, 1989). On this basis, we propose that
consumers infer that higher price and quality items are placed on higher shelves. We test:
H1: Products are perceived to be more expensive and of higher quality when placed in higher
positions in a vertical shelf display.
Horizontality-‐Hypothesis
Researchers have recently begun investigating the meaning behind left-‐right ordering. In the
political arena, left is associated with being more liberal, while right is associated with being more
conservative. In the physiological arena, the usage of left and right are based on the hemispheric view of
the brain, which controls different functions (Sperry, 1961). However, language and metaphorical use
implicitly associate “right” with being normatively better than “left.” This value could be due to the fact
that “right” is a homonym that also means “correct,” or “entitlement,” both positive connotations. In
6
contrast, “left” is a homonym that means “remaining.” Further, the origins of the English word “left”
imply poor quality, and the translation of left from other languages also has a negative connotation. The
French “gauche” (left), for instance, is used in the English language to imply awkward, the word
“sinister” in English derives from the Latin word for left, whereas the word “dexterity” derives from the
Latin word for “right” (Tversky, 2011).
Furthermore, the mechanism behind reading and writing should lead to a motor advantage for an
individuals’ right side (for right handed individuals). Vaid (2011) delineates four possible sources of a
right directionality effect: laterality (primarily biological), script directionality (based on culturally
determined language), biomechanical or chiral (neuromuscular in origin), and chiral/ scriptal (an
interaction of reading and writing habits that lead to motoric influences); and finds evidence consistent
with this fourth explanation (see also Chokron, Kazandjian, & De Agostini, 2011; McManus & Bryden,
1992). Tversky (2011) also noted that, as the majority of people are right-‐handed, left-‐right effects
could have physiological antecedents. Building on this argument, Casasanto (2009) showed that left-‐
handers placed things they liked on the left, whereas right-‐handers placed them on the right.
The psychology literature has found left-‐right effects in domains such as time (Boroditsky, 2000),
sequences of events (Santiago et al., 2007), dynamic action (Freyd, 1983), momentum (Halpern & Kelly,
1993), aesthetic judgments (Christman & Dietsch, 1995), drawings (Vaid, 2011), and “agency” with the
agent appearing on the left (Suitner & McManus, 2011). The left-‐right effect has been tested in the
domain of the direction of portraits (Chatterjee, 2002, 2011) and attributed to the joint influence of two
mechanisms: the embodiment of script direction and the order in which subject and object are
mentioned (Maass, Suitner, & Nadhmi, 2014).
In a different stream of literature, Dehaene (1999) posits that horizontality inferences are based
on spontaneous associations of numbers with space. Building on this, Dehaene et al. (2003) suggest that
7
people use a number line that increases from left to right to make a variety of judgments, an effect that
has been named the Spatial Numerical Association of Response Codes (or SNARC; see also Dehaene,
Dehaene-‐Lambertz, & Cohen, 1998; for a review see Gevers & Lammertyn, 2005).
Thus, there appears to be strong evidence that due to biological, cultural, contextual, and learned
reasons, there may be a left-‐right effect, the origins of which could be determined by multiple factors.
Based on this literature, we suggest that consumers infer that positions that are to the right in a
horizontal shelf space array have higher prices, which translates into perceptions of higher quality (Rao
and Monroe, 1989). Operationally, we test the Horizontality Hypothesis:
H2: Products are perceived to be more expensive and of higher quality, the more to the right they
are placed in a horizontal shelf display.
Differences in the Inferential Process
As hypothesized, horizontality and verticality inferences may show similar patterns. However,
we propose that they are the result of processes that have different antecedents. Others have also
suggested differential antecedents of the verticality and horizontality effects. For example, Tversky
(2011) posits that horizontal asymmetries are contingent on cultural artifacts (writing direction), but
vertical asymmetries are aligned with the powerful forces of gravity.
We now propose that verticality inferences are based on correlations with diagnostic cues learnt
through retail experience, whereas horizontality inferences are based on implicit associations with the
location of the product in space. Note that both types of effects reflect heuristic processing rather than
systematic processing connected to intrinsic attributes of the products being judged (Chaiken &
Maheswaran, 1994). However, the difference resides in the individual’s level of consciousness about the
use of the cue used to make the judgment (Bargh, 1989; Fitzsimons et al., 2002). That is, although
8
verticality and horizontality inferences are based on a linear array, they differ in terms of the content
and properties behind those antecedents (Suitner & Maass, 2011). If there are two differential
processes in place, boundary conditions should also differ between verticality and horizontality
inferences. We propose cue awareness and diagnosticity will moderate verticality effects, whereas
horizontality effects will be contingent on number line exposure. These arguments are developed below.
Role of Cue Awareness. Correlation-‐based inferential processes require a certain level of cue
awareness for associative patterns to take place (Kardes et al., 2004). In fact, several metaphors
involving directionality can co-‐exist in memory and be selected differentially depending on their relative
salience, which is, in turn, contextually determined (Schubert, 2005; Torralbo et al., 2006).
We first ran a store wine audit which replicated Valenzuela et al.’s (2013) results in the categories
of cookies, soda, pasta sauce and toothpaste, that retailers place higher priced products on top rows
(wine is used as stimuli in Studies 1b, 3 and 4).i Also replicating Valenzuela et al.’s (2013) results, we
found no systematic left-‐right retail ordering based on price. We then conducted a pre-‐test to confirm
that consumers are aware of the meaning behind vertical position as an associative cue, but not of
horizontal position.ii Over 48% agreed with the statement “Higher priced brands are placed on top
shelves,” but less than 6% of all participants agreed with the statement “Higher priced brands are placed
in lower shelves,” suggesting awareness of verticality schema. There was no evidence of any awareness
of a horizontality schema with 40% disagreeing with statements that “Lower priced brands are placed
on the right hand side” and a similar number disagreeing with the reverse of the same statement
“Lower priced brands are placed on the right hand side.” Based on this evidence, we propose that
verticality inferences should be contingent on people’s belief in the diagnosticity of the top-‐bottom
verticality cue, while horizontality inferences need not. We propose:
9
H3: Verticality inferences are mediated by awareness of beliefs regarding placement, but
horizontality inferences are not.
Role of Cue Diagnosticity. Correlation-‐based inferential processes require an understanding of
the diagnostic value of the cue used as the basis for a judgment (Lee & Olshavsky, 1997). Increasing the
level of involvement in the decision-‐making process should make consumers pay greater attention to
the quality of the cues they use as evaluation criteria (Feldman & Lynch, 1988). As a consequence,
involvement should moderate the use of vertical shelf position as a cue, with the direction of the
moderation shedding light on the underlying diagnostic value assigned to that cue. That is, greater
attention to the judgment behind the use of shelf space as a meaningful cue may lead to an
intensification of the effect (if consumers believe it is highly diagnostic), an attenuation (if they believe it
is weakly diagnostic), or a change in direction (if they use other information along with the cue). Given
prior results that people do not have strong beliefs regarding left-‐right placement, it is unlikely that the
perceived diagnosticity of left-‐right shelf positions as a cue would moderate its use. Thus, we propose:
H4: Involvement moderates verticality inferences to a greater extent than horizontality
inferences.
If verticality inferences are moderated by involvement and mediated by awareness, this implies
that consumers apply the verticality schema to the extent that it is diagnostic. At the same time,
consumers may infer prices from horizontal order irrespective of its diagnosticity and based on its mere
accessibility (Menon & Raghubir, 2003). In that case, if consumers were to experience a disconnect
between actual retailer practices and their expectations regarding those practices, then, they would
have to put their meta-‐beliefs into question (Friestad & Wright, 1994). This skepticism would only affect
10
the use of meta-‐beliefs that consumers have consciously learned and are aware of, as in the case of
those relating to vertical positions, but not horizontal positions. Again, we expect that horizontality
inferences will be less dependent than verticality-‐based inferences on new information altering the
diagnosticity associated with shelf space cues. We propose the following hypothesis:
H5: Contextual information inconsistent with shelf space schemas will lead to a greater
attenuation of verticality inferences versus horizontality inferences.
Role of the Number Line. Since there is no evidence that consumers explicitly hold a schema
associated with left-‐right ordering, and there is no evidence that retailers follow any set of left-‐right
rules in their ordering of products on a shelf (wine audit, pretest, Valenzuela et al., 2013), it is unlikely
that left-‐right associations are due to learned correlations. It is, however, plausible that the horizontality
inference could operate as an implicit process via number line exposure (Dehaene et al., 1998, 2003).
Dehaene (1999) showed that people perform better with large numbers if they hold their
response key in their right hand, and they do better with small numbers if they hold the response key in
their left hand, but the effect is reversed when participants cross their hands. Dehaene concludes that it
is the horizontal right-‐left location that the participants associate with larger and smaller numbers
respectively that matters; an association that is deeply seated in the brain.iii Interestingly, Wood and
Fischer (2008) suggest that the SNARC may originate with finger counting, which is ubiquitous and
inherently spatial: a “manumerical” cognition explanation of how space and numbers are associated. In
particular, Schwarz and Keuss (2004) examine two possible antecedents of the SNARC effect: a mental
number line and over-‐learned motor associations between numbers and manual responses, and find
greater support for the number line explanation.
11
The SNARC effect has not always been reliably obtained, its presence and sign being contingent
on whether the numbers are presented in the context of positive or negative numbers, and in a spatially
congruent (e.g., -‐4, -‐1) or incongruent (e.g., -‐1, -‐4) manner (Fischer, 2003a; Fischer & Rottmann, 2005;
for a review see Shaki & Petrusic, 2005). The SNARC effect has been successfully reversed with an
exposure to a clock face (where higher numbers are on the left hand side), with faster left reactions to
larger numbers and right reactions to smaller numbers (Bächtold, Baűmuller, & Brugger, 1998; Galfano,
Rusconi, & Umilta, 2006; Ristic, Wright, & Kingstone, 2006). Recent work by Cai, Shen, and Hui (2012) in
a marketing domain found that consumers estimated higher price for an item placed on the right as
compared to the left when they were exposed to the number line (similar to SNARC), but that the
effects reversed when they were exposed to a clock face (reverse SNARC). Evaluations were not affected
by their manipulations.
Suggesting that left-‐right horizontality effects may be determined by multiple factors,
individuating factors moderate the SNARC effect, with the effect reversing for writers of left-‐right
languages (e.g., Tversky, Kugelmass, & Winter, 1991), handedness (Cassanto, 2009), and gender as
determinants of power in a relationship (Hegarty, Lemeiux, & McQueen, 2010); and not being seen for
illiterates (Zebian, 2005) or bicultural individuals who are equally exposed to left-‐right and right-‐left
writing order (such as Hebrew and English speakers in Israel; Dehaene, Bossini, & Giraux, 1993). Cultural
reading direction (left-‐right or right-‐left) also moderates the “agency” effect found in portraits in art
(Chatterjee, 2001), as well as the way people graph data (Hegarty et al., 2010). We propose:
H6: Exposure to number line consistent primes will exacerbate the horizontality effect.
Studies 1a, 1b and 1c examine the evidence for verticality and horizontality inferences (H1 and
H2) using different products categories, populations and array lengths. Study 2 examines the effect of
strength of position beliefs and involvement on verticality and on horizontality inferences to test H3 and
12
H4. Study 3 examines the implications of priming position beliefs (in a direction consistent or
inconsistent with consumers’ judgments) on verticality and horizontality inferences, testing H5 and
addressing boundary conditions. Study 4 examines whether horizontality effects exist via spontaneous
inferences based on number line exposure to test H6. The studies are now described.
Study 1a: Exercise in setting up a bar display
Method
Participants. Study participants were graduate business school students in India who completed
the exercise on a voluntary basis (n = 55).
Procedure. Participants were asked to imagine that a bar was being set up on campus and the
university needed students’ input to help design the layout of 25 drinks that would be stocked. They
were then provided a list of 25 drinks, 17 of which were non-‐alcoholic and all of which were familiar
brands and had a wide range of prices (see supplementary materials). Their task was to arrange these 25
items in a 5 x 5 planogram.
Results
The price of each item for each slot was analysed using a 5 × 5 ANOVA with the vertical and
horizontal positions (five levels each) as repeated measures.iv There were main effects of position both
for verticality (F(4, 216) = 2.71, p < .05, η2 = .048) and horizontality (F(4, 216) = 2.77, p < .05, η2 = .049),
as well as an interaction effect (F(16, 864) = 2.00, p < .05, η2 = .036). Both vertical and horizontal linear
contrasts were significant, as expected, with average prices reducing from the top to bottom positions
(FLinear contrast(1, 54) = 4.52, p < .05, η2 = .077, see Figure 1a) and increasing from the left to the right
positions (FLinear contrast(1, 54) = 6.81, p < .001, η2 = .112, see Figure 1b). The interaction was not predicted
and suggests that the effect of horizontality (left-‐right) is stronger for top-‐most (vs. bottom-‐most)
positions, whereas the effect of verticality (top-‐bottom) is strongest for the left-‐most three positions.
13
-‐-‐ Insert Figures 1a and 1b around here. -‐-‐
To summarize, Study 1a shows that respondents used a left-‐right and top-‐bottom price ordering
when they designed a shelf display. Study 1b’s objective is to extend Study 1a’s findings by examining
price and quality inferences of products placed in a display and test H1 and H2.
Study 1b: Consumers’ Inferences in a Wine Display
Method
Participants. Study participants were undergraduate business school students from two US
campuses who completed the exercise for partial course credit (n = 181). The split between male and
female respondents was roughly equal (50.8% vs. 49.2%, respectively). The largest ethnic groups in the
sample were Asians (49.4%) and Caucasians (35.6%). Only 5.3% of the participants had previously
traveled to Turkey (the location used in the vignette). Due to partial non-‐response, some analyses reflect
lower degrees of freedom.
Design. We manipulated position at five levels (labeled A1, A2, A3, A4, and A5) within subjects,
and layout at two levels between-‐subjects (horizontal n = 80 and vertical n = 111). In the horizontal
layout condition, all labels were placed from left (A1) to right (A5) on the same row, and in the vertical
layout condition they were all placed from top (A1) to bottom (A5) in the same column.
Procedure. Participants were asked to imagine that they were on vacation in Turkey and planning
to purchase a bottle of red wine.
Participants were given a brief description of wines in Turkey (see supplementary materials) and
then given the following scenario:
“You are running late so you walk into the food store around the corner from your hotel. You go to the wine aisle and they have only five different brands of red wine, with no description in English on them and no price tags on them either. You know that the prices of different wines differ and that the taxes on them can make that difference quite important. However, you are in a hurry, there is a long line at the cashier’s, and no one to ask for advice in the little corner store, so you need to quickly choose a bottle from the five available.
14
The five brands of wine are arranged in five different columns as follows: A1 A2 A3 A4 A5 “
Next, participants were asked to choose from an array of Turkish wines (depicted as five empty
boxes labeled A1, A2, A3, A, and A5, with no photos or brand names) that followed either a horizontal
(see example above) or vertical layout. Participants rated the quality (1 = not at all/7 = very good),
popularity (1 = unpopular/7 = popular) and price perceptions (1 = Cheap/7 = Expensive) of all five
options. Finally, participants rated their levels of motivation (M = 3.75, SD= 1.57), task difficulty (M =
3.48, SD= 1.57), and purchase frequency of wine (M = 2.14, SD= 1.68) using seven-‐point scales (1 = Not
at all/7= Very), which showed reasonable values and did not vary across conditions.
Results
Price Perceptions. A 2 (orientation: vertical/ horizontal) × 5 (position) mixed ANOVA on price
perceptions showed a significant position by orientation interaction (F(4, 708) = 18.87, p < .001, η2 =
.096): Price ratings reduced as position moved from top to bottom (F(4, 416) = 4.54, p < .01, η2 = .042;
FLinear contrast (1, 104) = 5.33, p < .05, η2 = .049; figure 2a); and increased as position moved from left to
right (F(4, 292) = 17.30, p < .001, η2 = .191; FLinear contrast (1, 73) = 22.53, p < .001, η2 = .236; figure 2b).
Thus, both verticality and horizontality hypotheses (H1 and H2) were supported for price judgments.
-‐-‐ Insert figures 2a-‐2d about here. –
Quality perceptions. A similar ANOVA on quality perceptions showed that quality perceptions
tracked those of price perceptions (position by orientation interaction: F(4, 704) = 13.71, p < .001, η2 =
.072), supporting H1 and H2. In the vertical layout, as position moved from top to bottom, perceived
quality was higher for the top three as compared to the bottom two positions (F(4, 416) = 1.96, p < .10,
η2 = .018; FLinear contrast (1, 104) = 1.71, p = .19, η2 = .016; figure 2a). In the horizontal layout, as position
moved from left to right, perceived quality also increased (F(4, 288) = 17.17, p < .001, η2 = .193; FLinear
contrast (1, 72) = 24.75, p < .001, η2 = .256; Figure 2b).
15
Popularity Perceptions and Preferences. A 5 (position) x 2 (orientation) ANOVA on popularity
perceptions that showed that the center position was perceived to be the most popular in both the
vertical orientation (F(4, 416) = 17.36, p < .001, η2 = .143; FQuadratic contrast (1, 104) = 53.64, p < .001, η2 =
.340; figure 1c) as well as in the horizontal orientation (Overall F(4, 288) = 5.25, p < .001, η2 = .068;
FQuadratic contrast (1, 72) = 17.67, p < .001, η2 = .197; figure 1d), replicating Valenzuela and Raghubir (2009).
To examine whether position affects consumer preferences, we examined the percentage of
people choosing each of the five brands in both orientation conditions. The distribution of preferences
across the five different positions was similar irrespective of whether the assortment was arranged
vertically or horizontally (χ23 = 5.47, p = .24 for the position by orientation interaction). In the vertical
layout, products placed in the 2nd and 3rd positions were preferred to those placed in the other positions
(Choice = 16.04%, 31.13%, 27.36%, 9.43% and 16.04% from 1st to 5th, χ24 = 17.02, p < .01). In the
horizontal layout, the center position was preferred to the extreme left or right ones (Choice = 14.67%,
22.67%, 38.67%, 14.67% and 9.33% from left to right respectively, χ24 = 19.73, p < .001). Follow up
analyses confirmed that the path to preference was mediated by popularity perceptions.v
Discussion
Study 1b´s findings replicate Study 1a’s results, in terms of a left-‐right and top-‐bottom price
inference, and support H1 and H2: Consumers infer that products on the top (vs. bottom) and on the
right (vs. left) are more expensive and extend these findings to the domain of quality perceptions. They
also replicate Valenzuela and Raghubir’s (2009) findings that brands in the middle are more likely to be
chosen because they are perceived to be most popular.
Study 1c: Replication using a Consumer Panel –Swatch Watches
Method
16
The study was administered by Qualtrics using a general population sample (> 18 years) who
received $10 for responding to a larger survey (n = 345). Twenty-‐six respondents did not complete all
questions, leaving a usable sample of 319.
The design used five horizontal (n = 142) or five vertical (n = 177) positions, in a between-‐
subjects design, for five different designs of black and white Swatch watches (within-‐subject) that were
counter-‐balanced so that every type of watch appeared in every position (see supplementary materials).
Quality was again elicited using a 7-‐point scale anchored at “Not at all good” to “Very Good” and price
perceptions using a 7-‐point scale anchored at “Cheap” to “Expensive.” As with prior studies, participants
were asked to rate familiarity with the category (M = 4.93, SD = 1.89), motivation (M = 4.84, SD = 1.85)
and interest (M = 4.12, SD = 1.92) also using a 7-‐point scale.
Results
We conducted a 5 (position) repeated measures ANOVA on respondent’s quality perceptions
that revealed a main effect of position (F(4, 1268) = 4.46, p < .05, η2 = .015) and position by orientation
interaction (F(4, 1268) = 2.37, p = .051, η2 = .007). Analysis of means by position shows that quality
perceptions were significantly lower for Swatch watches placed on the left vs. right hand side (Flinear
contrast(1,141) = 10.20, p < .001, η2 = .067). However, this pattern was flat for Swatch watches placed on
the top (vs. bottom) of the array (Flinear contrast(1,176) = 2.18, p > .10). Results are provided in figure 3.
-‐-‐ Insert figure 3 around here. -‐-‐
A similar 5 (position) repeated measures ANOVA on respondent’s price perceptions revealed a
main effect of position (F(4, 1220) = 5.08, p < .001, η2 = .016) and a marginal position by orientation
interaction (F(4, 1220) = 1.86, p=0.1, η2 = .006). Analysis of means by position shows a similar pattern as
with quality perceptions: Lower prices for watches places on the left hand side (Flinear contrast(1,127) =
11.50, p < .001, η2 = .061) and flat prices for those placed on the top vs. bottom of the array (Flinear
contrast(1,178) = 1.81, p > .10). Thus, we found evidence in the general population supporting a different
17
pattern of inferences for horizontal and vertical positions. It replicated the left-‐right effect using an
adult sample, and counter-‐balancing all choice options for a new product category but did not find a
top-‐bottom effect. This could reflect heterogeneity of beliefs in the verticality position schema. Study 2
goes on to examine the differential role of cue awareness (H3) and involvement (H4) in the formation of
verticality and horizontality inferences.
Given the non-‐significant effect of verticality inferences in this study, we conducted a mini meta-‐
analysis of the main effects in Study 1, using the method suggested by Rosenthal (1978) for combining
the results of independent studies. Across Studies 1a, 1b, and 1c the horizontality effect for price
inferences (z = 2.85, p < .005), and quality inferences (z = 2.44, p < .01) is significant, as is the verticality
effect for price inferences (z = 2.50, p < .01), and quality inferences (z = 1.86, p < .05 one-‐sided).vi
Study 2: Involvement Signals Different Awareness of Vertical and Horizontal Cues
Method
This study used a different set of product categories and experimental procedures to further test
whether the pattern of horizontality and verticality effects is generalizable.
Participants (n = 81 undergraduates who participated for partial course credit) were told that they
had to design a duty-‐free store and design the shelf space for 25 items in the categories of chocolates
and Swatches. They were given 25 options (each a color printed sticker with the brand name, visual, and
price of the product, which they received in a sealed envelope to examine by themselves (see
supplementary materials) that they had to place on the 5 x 5 empty display (a paper frame with 5 x 5
boxes). Thus, the primary dependent variable was the price of the item that was placed in each position
of the 5 x 5 display. Involvement was then manipulated between-‐subjects.
Participants were assigned at random to the higher (n = 49) or lower (n = 32) involvement
conditions. Operationally, we manipulated participants’ involvement by informing them that:

18
1. Their input was going to be used to design an actual duty free store based on the responses of
either 100 students (competing with only 100 students from their own campus) or 10,000 students
(themselves pooled with students from 100 other campuses nationwide).
2. The best five responses would receive an honorarium of $100 each (5/100 vs. 5/10,000 probability
of winning if they were to put some effort)
The manipulation of task involvement was examined by asking respondents how motivated they
were, how important it was to make the best judgments, how difficult and effortful the shelf space
allocation task was, and how much time and thought it took (all elicited on 1-7 scales with higher
numbers reflecting greater use of resources; 6-item involvement scale α = .81).
To examine process, we asked participants: “To what extent do you believe that price influenced
your choice of which item to place” i) on TOP and which items to place at the BOTTOM and ii) at the
LEFT and which item to place on the RIGHT; separately for the two categories (using a seven-‐point scale:
1 = No Influence at all/A Large Influence). Agreement with these assessments correlated across
categories (rs = .56 and .61 for top-‐bottom and left-‐right respectively, ps < .01 for both) and was
averaged into two indices.
All participants responded to how frequently they purchased the two products (Chocolates M=
4.6, SD= 1.80; Swatches M= 2.2, SD= 1.25), how knowledgeable they were (Chocolates M= 4.4, SD=
1.65; Swatches M= 3.5, SD=1.66), and how much price variation (Chocolates M= 4.5, SD=1.52; Swatches
M= 5.4; SD=1.26) and quality variation (Chocolates M= 4.8, SD= 1.65; Swatches M= 5.4, SD=1.28 ) they
believed to exist within the category (all seven-‐point scales: 1 = Not at all/Very Little; 7 = Very/A lot).
Results
Manipulation Check. As desired, an ANOVA on the six-‐item involvement scale showed that people
were more involved in the decision when they were informed that their chances of winning were 5/100
(M = 5.11, SD= 1.05) versus 5/10,000 (M = 4.52, SD= .91; F(1, 79) = 7.17, p < .01, η2 = .083).
19
Price Estimates. We conducted a 5 (vertical) x 5 (horizontal) x 2 (involvement) x 2 (categories)
ANOVA on the price of the products assigned to the different positions, with the first two factors within-‐
subjects, the involvement factor between-‐subjects, and the product category factor a random within-‐
subjects replicate. This analysis revealed significant effects of vertical and horizontal position (F(4, 320) =
15.92 and 3.58, ps< .01, η2 = .166 and .043), replicating earlier effects for verticality (FLinear contrast(1, 80) =
26.95, p < .001, η2 = .246), and horizontality (FLinear contrast(1, 80) = 3.71, p < .05, η2 = .045).
-‐-‐-‐ Insert figure 4 around here. -‐-‐-‐
The analysis also revealed a two-‐way interaction between verticality and involvement (F(4, 320) =
2.48, p < .05, η2 = .030) but no interaction between horizontality and involvement, suggesting that the
horizontal effect was robust to levels of involvement. The only other significant effects in this overall
analysis were those involving category.vii The pattern of the interaction between verticality and
involvement showed that under higher involvement, higher prices were associated with higher positions
(see figure 4a for means and confidence intervals). However, under lower involvement, participants
placed the highest priced products in the middle position: an inverted U-‐shaped pattern, suggesting that
they used different information in the lower involvement condition to make their judgments.
Unlike verticality judgments, the effect of horizontality remained robust despite the manipulation
of involvement. Both lower involvement and higher involvement (figure 4b), respondents placed items
with lower prices on the left.
Mediation analysis to examine role of awareness. To directly examine whether awareness of the
rules that people used to make product placements in the two categories mediated verticality and
horizontality effects, we repeated the same 5 (vertical) x 5 (horizontal) x 2 (involvement) x 2 (categories)
ANOVA on the price of the products assigned to the different positions incorporating people’s
awareness of price being an influence in their choice of top-‐bottom and right-‐left placement as
covariates. This analysis revealed that the effect of verticality was no longer significant (F< 1), while the
20
effect of horizontality remained significant (F(4, 336) = 2.64, p < .05, η2 = .028), with the vertical by
horizontal interaction being also significant (F(16, 1344) = 1.84, p < .05, η2 = .022). Most importantly, the
effect of the covariate “top-‐bottom influence in the shelf placement decision” was significant (F(1, 80) =
4.74, p < .05, η2 = .046), while the effect of “right-‐left influence” was not (p > .15). This pattern suggests
that people’s awareness of their use of vertical position as a price cue mediates the verticality effect,
whereas their awareness of using horizontal position as a price cue does not, supporting H3.
Discussion
Study 2 replicated results of verticality and horizontality price inferences documented in Study 1
using different product categories and a different task. It extended prior results to show that while
verticality inferences are moderated by involvement (H4) and mediated by awareness (H3) of the use of
price as a cue to order shelf displays, horizontality inferences are robust and unaffected by schematic
beliefs regarding left-‐right placement. This implies that consumers apply the verticality cue to the extent
that they believe it is diagnostic, but may infer prices from horizontal order irrespective of its
diagnosticity and merely based on its accessibility (Menon & Raghubir, 2003). It is interesting to note
that when involvement is low and the assessment of the diagnostic value of cues not as important,
participants’ verticality decisions reflect an inverted U-‐shaped pattern denoting a “center is better” rule
as default. The prevalent role of the center position has already been established in the literature
(Chandon et al., 2009; Valenzuela & Raghubir, 2009). The next study further examines process-‐related
implications behind horizontality and verticality inferences and tests H5.
Study 3: Diagnosticity Conditions the Use of Position Cues
Method
Study 3 (n = 113 undergraduate students of a West coast university for partial course credit) tests
the effect of providing contextual retail information that is either consistent (higher prices on top and on
21
the right) or inconsistent (lower prices on the top and on the right) with schematic beliefs about shelf
positions on consumer judgments. The overall design was a 2 (information: consistent or inconsistent) x
2 (orientation: horizontal, vertical) x 5 (position) mixed design with the first two factors manipulated
between-‐subjects and position a repeated measure. Respondents were assigned at random to one of
the four between-‐subjects conditions (Horizontal-‐consistent = 28; Vertical consistent = 28; Horizontal-‐
inconsistent = 29; and Vertical consistent = 28).
The procedure was similar to Study 1b. That is, participants were given a brief description of wines
in Turkey. We manipulated belief consistency by changing the shelf display provided in the description
as an example of a typical wine display participants could find in Turkey (see supplementary materials).
In the consistent condition, wines that were more expensive were on the top-‐right (French Burgundy
Reserve) and those that were less expensive were on the bottom-‐left (Turkish Tekel White). In the
inconsistent condition, the display was rotated to reverse these positions. As a manipulation check, we
elicited open-‐ended price estimates (“In your opinion, what is the average price of each of the following
wines (in US$)”) of seven of the wines in the example display to ensure that the wines used to represent
higher priced wines were perceived as more expensive than those used to represent lower priced wines.
At that point participants were given the same choice scenario as in Study 1b. Quality perceptions,
popularity perceptions, and preferences were measured using the same scales as in Study 1b and price
estimates were measured using ordinal response categories (1 = < $6.00, 2 = $6.00-‐$7.99, 3 = $8.00-‐
$9.99, 4 = $10-‐ $11.99, 5 = $12-‐ $13.99, 6 = $14+) that were treated as an interval measure for ease of
analysis. Response order was changed to Popularity-‐Quality-‐Price.
Results
Manipulation Check. The prices of the seven wines differed in the direction expected (French
Burgundy Reserve = $21.24 (SD = 13.25), Italian Pinot Grigio= $19.09 (SD = 37.77), Australian
Chardonnay = $15.83 (SD = 33.01), Spanish Rosé = $18.47 (SD = 27.66), Dikmen Red = $11.35 (SD =
22
10.30), Kavaklidere White = $11.21 (SD = 7.27) and Tekel White = $10.36 (SD = 5.82); F(6, 654) = 11.38,
p < .001, η2 = .090) and was not contingent on other factors (p’s > .10).
Price Estimates. A 2 (information consistency) x 2 (orientation) x 5 (position) ANOVA on price
estimates revealed a significant three-‐way interaction (F(4, 432) = 4.72, p < .01, η2 = .042), as well as a
position x orientation interaction (F(4, 432) = 23.11, p < .001, η2 = .175).
Separate analyses of the position effect in both orientations showed that in the consistent
conditions verticality and horizontality inferences replicated. There was a main effect of vertical
orientation (F(4, 108) = 18.84, p < .001, η2 = .411), reflecting prices reducing from top to bottom (FLinear
contrast (1, 27) = 26.90, p < .001, η2 = .499) and horizontal orientation (F(4, 104) = 13.77, p < .001, η2 =
.346), reflecting prices increasing from left to right (FLinear contrast (1, 26) = 19.42, p < .001, η2 = .428).
Results are presented in figure 5.
As H5 predicted, both effects were attenuated in the inconsistent condition. But, while the
verticality effect was no longer significant (F < 1), the horizontality effect remained for the first three
positions and then leveled out; a pattern that replicates that of Study 2 (F (4, 112) = 4.91, p < .001, η2 =
.149; FLinear contrast (1, 28) = 6.47, p < .02, η2 = .188, see figure 5).
-‐-‐ Insert figure 5 around here. -‐-‐
Quality perceptions. The 2 x 2 x 5 ANOVA on quality perceptions revealed a significant position x
orientation interaction (F(4, 436) = 16.92, p < .001, η2 = .134), which was further contingent on
information consistency (F(4, 436) = 3.66, p < .01, , η2 = .032). Separate one-‐way ANOVAs on the position
effect showed that in the consistent conditions, both vertical (F(4, 108) = 19.89, p < .001, η2 = .424) and
horizontal (F(4, 108) = 7.38, p < .001, η2 = .215) main effects were significant, reflecting linear trends
(FLinear contrast (1, 27) = 31.55 and 10.23 for vertical and horizontal respectively, both ps< .001, η2 = .539
and .275 respectively). The means displayed the same pattern as price estimates, reducing from top to
bottom and increasing from left to right, replicating results from previous studies. In the inconsistent
23
condition, the verticality effect was entirely attenuated (F < 1), while the horizontality effect was not,
remaining for the first three positions as for price perceptions (F(4, 112) = 2.71, p < .05, , η2 = .088, FLinear
contrast (1, 28)= 2.70 p < .1, η2 = .088). Results are presented in figure 5.
Popularity Perceptions and Preferences. An analysis of popularity perceptions showed a
significant effect of position: The center position was perceived to be the most popular (F(4, 436) = 8.62,
p < .001, η2 = .073, F Quadratic contrast (1, 109) = 15.03, p < .001, η2 = .121, see figure 5). This effect was not
contingent on either between-‐subject factor.
In the horizontal orientation, the center position was preferred to the extreme left or right ones
(Choice = 13.21%, 5.66%, 58.49%, 9.43% and 13.21% from left to right, χ24 = 10.12, p < .05), irrespective
of whether the information was consistent (4%, 8%, 60%, 8% and 20% from left to right, χ24 = 26.80, p <
.001) or inconsistent (21%, 4%, 57%, 11% and 7% from left to right, χ24 = 26.64, p < .001).
In the vertical orientation, preferences were skewed toward higher positions (Choice = 26.92%,
32.69%, 17.30%, 7.69% and 15.38% for top to bottom; χ24 = 24.40, p < .001). Whereas higher positions
were preferred in the consistent condition (31%, 46%, 15%, 4% and 4% for top to bottom; χ24 = 17.46, p
<.001), there was no preference for any position in the inconsistent condition (23%, 19.2%, 19.2%,
11.5%, 27%, χ24 = 1.69, p > .80).
Discussion
Study 3 demonstrated that changing the meaning of an existing set of retail-‐based schematic
beliefs eliminates price and quality inferences based on vertical positions. Since consumers do not hold
meta-‐beliefs about horizontal positions, horizontality inferences are not as dependent on new
information that alters the diagnosticity associated with them. The attenuation of position-‐based
inferences leads to an elimination of the centrality effect on choice in the vertical orientation, but the
centrality effect remains robust in the horizontal orientation. We had argued earlier that horizontality
24
effects might not be easy to rule out since they are the result of spontaneous inferences, which could
possibly rely on number line exposure (Dehaene et al., 2003). The next experiment examines this.
Study 4: Manipulating Associations with the Number line to Alter the Use of Horizontal Cues
In this study we test whether horizontality inferences are based on basic number line ordering
of high and low numbers. If they are, then when consumers are exposed to different number line
orientations of large and small numbers, horizontality-‐based inferences should change depending on
whether the number line has a horizontal or a vertical orientation.
Method
Study participants at a large private north-‐eastern university (n = 107) participated in the study
for partial course credit, of who 105 completed the survey. The overall design was a 2 (number line
prime orientation: horizontal/ vertical) x 2 (display orientation: horizontal/ vertical) between subjects
design, with five positions (within-‐subject). Participants were assigned at random to one of the four
between-‐subjects conditions (horizontal prime-‐horizontal display = 27; horizontal prime-‐vertical display
= 27; vertical prime-‐horizontal display = 28; vertical prime-‐vertical display = 23).
Prime was manipulated through a series of three pictures of standard rulers that were
presented either horizontally (larger numbers on the right) or vertically (larger numbers on the top). The
cover story used for this task was that we were interested in students’ preferences for stationery
products. They were asked to choose their favorite of the three rulers, to make the guise believable.
Subsequent to this, all participants were provided the same “tourist scenario” information about
buying wines in Turkey, manipulating display orientation, and measuring quality and price perceptions
on a 7-‐point scale as in Study 1b.
Results
25
Quality Inferences. A 2 (prime: horizontal/ vertical) x 2 (orientation: horizontal/ vertical) x 5
(position: repeated measure) analysis on the quality ratings revealed a three way interaction (F(4, 400) =
3.52, p < .05, η2 = .034). The main effect of position (F(4, 400) = 5.20, p < .01, η2 = .049), and a position x
display orientation interaction (F(4, 400) = 3.05, p < .05, η2 = .030) were also significant.
We conducted follow up analyses to examine the effect of prime separately for the horizontal
orientation and vertical orientation. When the orientation was horizontal, the 2 (prime) x 5 (position)
ANOVA revealed a significant main effects of position (F(4, 208) = 8.61, p < .05, η2 = .142), and a
directional position x prime interaction (F(4, 208) = 1.82, p = .13, η2 = .034). Means show that the
horizontal prime exacerbates the left-‐right effect (F(4, 100) = 9.32, p < .001, η2 = .272) compared to the
vertical prime (F(4, 108) = 1.45, p = .22, η2 = .051). See figure 6 for means by condition.
In the vertical orientation, the position x prime interaction was marginal (F(4, 192) = 2.23, p <
.07, η2 = .044). The horizontal prime weakly replicated the verticality effect (F(4, 104) = 1.06, p > .05, η2 =
.039), and the vertical prime directionally reversed it (F(4, 88) = 1.63, p = .17, η2 = .069, see discussion).
-‐-‐ Insert figure 6 around here. –
Price Inferences. A 2 (prime: horizontal/ vertical) x 2 (orientation: horizontal/ vertical) x 5
(position: repeated measure) analysis on the price ratings revealed a three way interaction (F(4, 404) =
2.78, p < .05, η2 = .027). The main effect of position (F(4, 404) = 6.15, p < .01, η2 = .057), and a position x
display orientation interaction (F(4, 404) = 6.93, p < .01, η2 = .064) were also significant.
As with quality inferences, we conducted follow up analyses to examine the effect of prime
separately for the horizontal orientation and vertical orientation. When the orientation was horizontal,
the 2 (prime) x 5 (position) ANOVA revealed a significant main effects of position (F(4, 212) = 15.34, p <
.01, η2 = .224), and a significant position x prime interaction (F(4, 212) = 2.60, p < .05, η2 = .047). Means
show that the horizontal prime exacerbates the left-‐right effect (F(4, 104) = 15.54, p < .001, η2 = .374)
26
compared to the vertical prime (F(4, 108) = 2.98, p < .05, η2 = .099). In the vertical orientation, no effects
were significant (see discussion).
Preferences. In the horizontal orientation, when participants were primed with a ruler in the
vertical orientation, we replicated the center effect in choices (15%, 11%, 56%, 11%, and 7% from left to
right). However, when participants were primed with a ruler in the horizontal orientation their
preferences shifted to items on the right (4%, 11%, 33%, 52%, 0%; choice by position χ224 = 12.42, p <
.05). In the vertical orientation, priming did not affect preferences that, overall were higher for the 2nd
and 3rd vertical position (8%, 35%, 27%, 15%, 15% for horizontal and 13%, 26%, 29%, 13%, 9% for
vertical prime; χ224 = 1.68, p > .80).
Discussion
Study 4’s results support our hypothesis that priming with a number line exacerbates the
horizontality effect. However, we found an unexpected effect of number line priming on the vertical
orientation as well. We found evidence that number line priming interfered with inferences drawn from
vertical arrays. The orientation of a number line should not affect verticality inferences if verticality
inferences are solely due to people’s schematic beliefs (based on retail experience). If, however, they
are multiply determined, then verticality inferences may also be affected by number line primes. In fact,
there is evidence that spatial representations are not limited to a single horizontal direction but may
extend to vertical orientations as well (Dehaene, 1999; Schwarz & Keuss, 2004). For example, Schwarz
and Keuss (2004) used saccadic eye movement to support an association between numerical
magnitudes and response codes with vertical orientations. They propose that individuals’ mental
organization is that of a number map, instead of a line, in which the lower left (upper right) quadrant is
most associated with smaller (larger) numbers. Further investigation is necessary to disentangle the
effect of the number line on information displayed using vertical orientation.
27
General Discussion
This paper investigated whether, how, and when consumers extract meaning from the position
of products in both horizontal and vertical shelf space arrays, and how these inferences translate into
preferences. The tactical value of specific shelf positions is conventional wisdom for practitioners and
their effect on exposure and attention paid to a product is widely understood (Gladson, 1989). However,
shelf positions may also have an influence in subjective consumer assessments of product
characteristics, such as perceived quality and price. We tested two basic hypotheses: Consumers believe
products are placed in decreasing order of price from top to bottom (H1: verticality) and from right to
left (H2: horizontality). Study 1a and 1b find support for the verticality and horizontality hypotheses and
study 1c replicates the effects with a general population.
Further, we proposed that both types of inferential processes reflect heuristic processing rather
than systematic processing about the intrinsic attributes of the products being judged (Chaiken &
Maheswaran, 1994). However, the difference between horizontality and verticality inferences resides in
whether individuals are conscious of the meaning behind verticality and horizontality cues used to make
price and quality judgments (Bargh, 1989; Fitzsimons et al., 2002). We propose that the use of verticality
cues is based on consumers’ expectations and are within awareness, whereas the use of horizontality
cues is outside awareness and based on implicit knowledge. Consistent with this reasoning, we show
that horizontality and verticality inferences, despite showing similar patterns, have different
antecedents. A pre-‐test and wine store price audit show that consumers’ shared shelf layout beliefs
regarding verticality are confirmed in retail practice, making them diagnostic cues to use in correlational
inferential processes, whereas the same is not true for horizontal order since consumer beliefs are not
clear and retail shelf layouts are not consistent (replicating Valenzuela et al., 2013).
28
We argued that consistent exposure to vertical order as a cue of quality leads to consumers
making verticality inferences (H3: Study 2). Mediation analyses demonstrated that verticality inferences
are perfectly mediated by awareness of position as a diagnostic cue, while horizontality inferences are
not. At the same time, consumers infer prices from horizontal displays even in the absence of a clear
horizontal belief about the meaning of left-‐right price ordering. Given that verticality and horizontality
inferences differ in their association with diagnostic cues, involvement was proposed and shown to
moderate the verticality effect but not the horizontality effect (H4: Study 2). Additionally, we argued
and showed that horizontality inferences were robust even when the diagnosticity of the cue was
questioned, whereas verticality inferences were attenuated (H5: Study 3).
The boundary conditions of the horizontality effects were different. Study 4 shows that
associations priming a number line (where higher numbers are on the right) exacerbates the
horizontality effect (Dehaene et al., 2003). These results are consistent with the idea that implicit
associations with the number line, that are not consciously brought to mind as diagnostic for product
price and quality judgments, are an antecedent to the horizontality effect, and as such, adds to the prior
literature on left-‐right effects (Casasanto 2009; Chokron at al., 2011; McManus & Bryden, 1992; Tversky,
2011; Vaid, 2011).
To examine the strength and robustness of the verticality and horizontality effects, we
conducted the same mini meta-‐analysis as conducted for Study 1, across all conditions in all studies,
even when the effect was expected to attenuate, using the same formula and method suggested by
Rosenthal (1978). Across all studies the horizontality effect for price inferences (z = 5.05, p < .001), and
quality inferences (z = 3.85, p < .001) is significant, as is the verticality effect for price inferences (z =
1.92, p < .05 one-‐sided), and quality inferences (z = 1.71, p < .05 one-‐sided).viii
Unlike earlier studies that explain order effects in terms of attention (e.g. Taylor & Fiske, 1975;
Valenzuela & Raghubir, 2009), this paper develops a belief-‐based explanation for order effects, which is
29
inference-‐based. Given the increasing interest in applying visual information to marketing domains, this
paper adds to the evidence that visual product information is not only used to make cognitive
judgments but also affects inferences and preferences, over and above an attention based process as
would be predicted by the results of eye-‐tracking research (Atalay et al., 2012; Wedel & Pieters, 2008).
In addition, this paper adds to the literature on inference-‐making by identifying two differential
location-‐based processes behind price and quality estimates (Kardes, Posavac, & Cronley, 2004). The
disparity between consumers’ experience in terms of retailer practice and, as a consequence, their
awareness of vertical (but not horizontal) position as a diagnostic cue is identified as the main factor
behind the asymmetric boundary conditions for horizontality and verticality inferences. However, it is
true that even after validating the role of an experience-‐based vertical price-‐position correlation, this
does not preclude the influence of other unconscious biases as well, such as the very well-‐documented
(implicit) association between vertical space and positive valence, which could be at work here
(expensive = "high" quality = positive valence). Conceptual metaphor research (Lakoff & Johnson, 1999)
validates the idea that unconscious cross-‐domain mappings (particularly spatial mappings) may shape
people's thoughts and behaviors. This may partially be the reason why the verticality pattern was not
robustly replicated in every experiment. Another reason could be differential exposure to retail
environments. Thus, the verticality effect, being based on environmental exposure and learning, may
vary across individuals and product categories. It should also vary depending on the motivation and
opportunity associated with the task (Schubert 2005).
Finally, these findings highlight an important reason for product brand managers to pay
premiums for shelf space, and for retailers to charge premiums for specific positions: the fact that
consumers extract meaning from horizontal and vertical shelf space positions. This is particularly
relevant in the case of product positions on Web displays in online stores since space allocation is rarely
an issue and limited eye movements are usually enough to scan the entire display (Breugelmans,
30
Campo, & Gijsbrechts, 2007). The issue of aisle length is particularly important for horizontal orientation
(the decision maker is exposed to the array only when standing in front of a section in the aisle), since
height is usually "self-‐contained." The position advantage identified by these findings could be very
relevant in fragmented markets and when consumers have little information about brands.
Limitations and Future Research
A key limitation of our studies pertains to external validity. The studies are stylized laboratory
experiments aimed at theory development. Additional research should examine the robustness of the
theory proposed in this paper in the marketplace. A more typical choice environment with prices
included may interfere with position effects. Accordingly, it would be interesting to test whether
position effects apply in a situation where attribute information is available. It would also be useful to
examine whether position effects distort the processing and memory of available attribute information
when the attribute information is inconsistent with the expected ordering of the products.
Further, shelf position is only one of the many cues that shoppers use to guide their purchase.
They may infer popularity based on the amount of space assigned to a product on the shelf or on the
stock level of various brands (lower inventory may imply better buys, van Herpen, Pieters, & Zeelenberg,
2009). We do not introduce any competition for visual attention in the studies reported. Finally, there
could be further research done concerning arm reach. For example, stores put better alcohol at the top
of a shelf so that it is out of reach of clumsy shoppers. These are interesting areas for future research.
Multiple studies we documented an interaction effect between the verticality and horizontality
effect. The pattern of means show that the linear effect of horizontality is stronger for the top most and
bottom most positions and the effect of verticality is strongest for the three left most positions. This
pattern needs further investigation. It is possible that the results are driven by the regions to the left
being areas of low visual lift region (Chandon et al., 2009).
31
Individual differences in left and right-‐handedness could also moderate the horizontality effect
(Casasanto 2009). Casasanto’s research on motor fluency (Casasanto, 2009, Casasanto & Chrysikou,
2011) suggests that items on the right may have implicit associations with “good” for right-‐handed
people, as the right side is their dominant side. Specifically, Casasanto (2009) finds that right-‐ (versus
left-‐) handers chose items on the right when asked to decide which of two products to buy, which of two
job applicants to hire, or which of two alien creatures looks more trustworthy, whereas the left-‐handers
chose items on the left, a pattern that persisted even for oral judgments. Casasanto and Chrysikou
(2011) suggest that the individual’s experience of interacting more fluidly with the physical environment
from their dominant side leads to the formation of these implicit associations in memory. Nisbett and
Wilson’s (1977) classic “stockings” study is consistent with this idea since people believed that items on
the right were of superior quality. In this case, items on the right hand side may be associated with
higher quality due to non-‐deliberative inferences based on mere feelings of fluency, and this inference
may translate into higher prices, through the price-‐implies-‐quality route (Rao & Monroe, 1989). There
could also be an interaction with the physiological aspects of lower and higher shelf spaces, such as
physiological ease of reaching. There are several other factors that should be taken into consideration.
For example, the effect of low involvement on placing the most expensive products in middle positions
is interesting. This systematic shift in ordering due to involvement (versus ordering products randomly in
low involvement) deserves more attention. The temporal sequence of presentation of the different
choice options may also affect position effects. It is possible that extremity prevails for choices
containing sequentially presented options, whereas centrality rules for choices based on simultaneously
presented options. Consumers may also infer information other than price and quality, such as
categorical classifications, from product positions. Future research could examine the conditions
favoring primacy and recency effects in shelf layout presentation.
32
References
Atalay, A. Selin, Bodur, H. O., & Rasolofoarison, D. (2012). Shining in the center: Central gaze cascade effect on product choice. Journal of Consumer Research, 39(4), 848-‐866.
Bächtold, D., Baumüller, M., & Brugger, P. (1998). Stimulus-‐response compatibility in representational space. Neuropsychologia, 36(8), 731-‐735.
Bargh, J. A. (1989). Conditional automaticity: Varieties of automatic influence in social perception and
cognition. Unintended Thought, 3, 51-‐69.
Bemmaor, A. C., & Mouchoux, D. (1991). Measuring the short-‐term effect of in-‐store promotion and retail advertising on brand sales: A factorial experiment. Journal of Marketing Research, 202-‐214.
Boroditsky, L. (2000). Metaphoric structuring: Understanding time through spatial metaphors. Cognition, 75(1), 1-‐28.
Breugelmans, E., Campo, K., & Gijsbrechts, E. (2007). Shelf sequence and proximity effects on online
grocery choices. Marketing Letters, 18(1-‐2), 117-‐133.
Cai, F., Shen, H., & Hui, M. K. (2012). The effect of location on price estimation: understanding number-‐location and number-‐order associations. Journal of Marketing Research, 49(5), 718-‐724.
Casasanto, D. (2009). Embodiment of abstract concepts: good and bad in right-‐and left-‐handers. Journal of Experimental Psychology: General, 138(3), 351-‐367.
Casasanto, D., & Chrysikou, E. G. (2011). When left is “right” motor fluency shapes abstract concepts. Psychological Science, 22(4), 419-‐422.
Chaiken, S., & Maheswaran, D. (1994). Heuristic processing can bias systematic processing: effects of source credibility, argument ambiguity, and task importance on attitude judgment. Journal of Personality and Social Psychology, 66(3), 460.
Chandon, P., Hutchinson, J. W., Bradlow, E. T., & Young, S. H. (2009). Does in-‐store marketing work? Effects of the number and position of shelf facings on brand attention and evaluation at the point of purchase. Journal of Marketing, 73(6), 1-‐17.
Chatterjee, A. (2001). Language and space: Some interactions. Trends in cognitive sciences, 5(2), 55-‐61.
Chatterjee, A. (2002). Portrait profiles and the notion of agency. Empirical Studies of the Arts, 20(1), 33-‐41.
Chatterjee, A. (2011). Neuroaesthetics: a coming of age story. Journal of Cognitive Neuroscience, 23(1), 53-‐62.
Chiao, J. Y., Bordeaux, A. R., & Ambady, N. (2004). Mental representations of social status. Cognition, 93(2), B49-‐B57.
33
Chokron, S., Kazandjian, S., & De Agostini, M. (2011). Cultural and biological interaction in visuospatial organization. In Schubert, T. W., & Maass, A. (Eds.). Spatial dimensions of social thought (Vol. 18). Berlin: Walter de Gruyter, 257-‐276.
Christman, S. D., & Dietsch, C. (1995). Left-‐handers exhibit greater preference for symmetric organization in aesthetic judgments. In 23rd Annual Meeting of the International Neuropsychological Society, Seattle, USA.
Dehaene, S. (1999). The Number Sense: How the Mind Creates Mathematics:" Where did numbers come from?" Science Spectra, 16, 74-‐75.
Dehaene, S., Bossini, S., & Giraux, P. (1993). The mental representation of parity and number magnitude. Journal of Experimental Psychology: General, 122(3), 371-‐396.
Dehaene, S., Dehaene-‐Lambertz, G., & Cohen, L. (1998). Abstract representations of numbers in the animal and human brain. Trends in Neurosciences, 21(8), 355-‐361.
Dehaene, S., Piazza, M., Pinel, P., & Cohen, L. (2003). Three parietal circuits for number processing. Cognitive Neuropsychology, 20(3-‐6), 487-‐506.
Dehaene, S., Spelke, E., Pinel, P., Stanescu, R., & Tsivkin, S. (1999). Sources of mathematical thinking: Behavioral and brain-‐imaging evidence. Science, 284(5416), 970-‐974.
Deng, X., & Kahn, B. E. (2009). Is your product on the right side? The “location effect” on perceived product heaviness and package evaluation. Journal of Marketing Research, 46(6), 725-‐738.
Feldman, J. M., & Lynch, J. G. (1988). Self-‐generated validity and other effects of measurement on belief, attitude, intention, and behavior. Journal of Applied Psychology, 73(3), 421-‐435.
Fischer, M. H. (2003a). Cognitive representation of negative numbers. Psychological Science, 14(3), 278-‐282.
Fischer, M. H., & Rottmann, J. (2005). Do negative numbers have a place on the mental number line. Psychology Science, 47(1), 22-‐32.
Fitzsimons, G. J., Hutchinson, J. W., Williams, P., Alba, J. W., Chartrand, T. L., Huber, J., ... & Tavassoli, N. T. (2002). Non-‐conscious influences on consumer choice. Marketing Letters, 13(3), 269-‐269.
Freyd, J. J. (1983). The mental representation of movement when static stimuli are viewed. Perception & Psychophysics, 33(6), 575-‐581.
Friestad, M., & Wright, P. (1994). The persuasion knowledge model: How people cope with persuasion attempts. Journal of Consumer Research, 21(1), 1-‐31.
Galfano, G., Rusconi, E., & Umiltà, C. (2006). Number magnitude orients attention, but not against one’s will. Psychonomic Bulletin & Review, 13(5), 869-‐874.
Gevers, W., & Lammertyn, J. (2005). The hunt for SNARC. Psychology Science, 47(1), 10-‐21.
34
Gladson, T. R. (1989). Retail Shelf Space Management. The Nielsen Researcher, 2(1), 20-‐24.
Halpern, A. R., & Kelly, M. H. (1993). Memory biases in left versus right implied motion. Journal of Experimental Psychology: Learning, Memory, and Cognition, 19(2), 471.
Hegarty, P., Lemieux, A. F., & McQueen, G. (2010). Graphing the order of the sexes: constructing, recalling, interpreting, and putting the self in gender difference graphs. Journal of Personality and Social Psychology, 98(3), 375.
Inman, J. J., McAlister, L., & Hoyer, W. D. (1990). Promotion signal: proxy for a price cut? Journal of Consumer Research, 74-‐81.
Kable, J., Lease-‐Spellmeyer, J., & Chatterjee, A. (2002). Neural substrates of action event knowledge. Journal of Cognitive Neuroscience, 14(5), 795-‐805.
Kardes, F. R., Posavac, S. S., & Cronley, M. L. (2004). Consumer inference: A review of processes, bases, and judgment contexts. Journal of Consumer Psychology, 14(3), 230-‐256.
Lakoff, G., & Johnson, M. (1980). Metaphors we live by. Chicago: U of Chicago Press.
Lakoff, G., & Johnson, M. (1999). Philosophy in the flesh: The embodied mind and its challenge to western thought. New York: Basic Books.
Lee, D. H., & Olshavsky, R. W. (1997). Consumers' use of alternative information sources in inference generation: A replication study. Journal of Business Research, 39(3), 257-‐269.
Loftus, G.R., & Masson, M.E. (1994). Using Confidence Intervals in Within-‐Subjects Designs. Psychonomic Bulletin and Review, 1, 476-‐490.
Maass, A., Suitner, C., & Deconchy, J. (2014). Living in an asymmetrical world: How writing direction affects thought and action. Portland, OR: Psychology Press.
Maass, A., Suitner, C., & Nadhmi, F. (2014). What drives the spatial agency bias? An Italian–Malagasy–Arabic comparison study. Journal of Experimental Psychology: General, 143(3), 991-‐996.
McManus, I. C., & Bryden, M. P. (1992). The genetics of handedness, cerebral dominance, and lateralization. Handbook of Neuropsychology, 6, 115-‐115.
Meier, B. P., & Robinson, M. D. (2004). Why the sunny side is up associations between affect and vertical position. Psychological Science, 15(4), 243-‐247.
Menon, G., & Raghubir, P. (2003). Ease-‐of-‐Retrieval as an Automatic Input in Judgments: A Mere-‐Accessibility Framework? Journal of Consumer Research, 30(2), 230-‐243.
Nelson, L. D., & Simmons, J. P. (2009). On southbound ease and northbound fees: Literal consequences of the metaphoric link between vertical position and cardinal direction. Journal of Marketing Research, 46(6), 715-‐724.
35
Nisbett, R. E., & Wilson, T. D. (1977). Telling more than we can know: Verbal reports on mental processes. Psychological Review, 84(3), 231.
Oppenheimer, D. M., Meyvis, T., & Davidenko, N. (2009). Instructional manipulation checks: Detecting satisficing to increase statistical power. Journal of Experimental Social Psychology, 45(4), 867-‐872.
Raghubir, P., & Valenzuela, A. (2006). Center-‐of-‐inattention: Position biases in decision-‐making. Organizational Behavior and Human Decision Processes, 99(1), 66-‐80.
Rao, A. R., & Monroe, K. B. (1989). The effect of price, brand name, and store name on buyers' perceptions of product quality: An integrative review. Journal of Marketing Research, 351-‐357.
Ristic, J., Wright, A., & Kingstone, A. (2006). The number line effect reflects top-‐down control. Psychonomic Bulletin & Review, 13(5), 862-‐868.
Rosenthal, R. (1978). Combining results of independent studies. Psychological Bulletin, 85(1), 185.
Santiago, J., Lupáñez, J., Pérez, E., & Funes, M. J. (2007). Time (also) flies from left to right. Psychonomic Bulletin & Review, 14(3), 512-‐516.
Schubert, T. W. (2005). Your highness: vertical positions as perceptual symbols of power. Journal of Personality and Social Psychology, 89(1), 1-‐21.
Schwarz, W., & Keuss, I. M. (2004). Moving the eyes along the mental number line: Comparing SNARC effects with saccadic and manual responses. Perception & Psychophysics, 66(4), 651-‐664.
Shaki, S., & Petrusic, W. M. (2005). On the mental representation of negative numbers: Context-‐dependent SNARC effects with comparative judgments. Psychonomic Bulletin & Review, 12(5), 931-‐937.
Sperry, R. W. (1961). Cerebral organization and behavior. Science, 133(3466), 1749-‐1757.
Suitner, C., & Maass, A. (2011). Writing direction, agency and gender stereotyping: An embodied connection. In Schubert, T. W., & Maass, A. (Eds.). Spatial dimensions of social thought (Vol. 18). Berlin: Walter de Gruyter, 303-‐323.
Suitner, C., & McManus, C. (2011). Aesthetic asymmetries, spatial agency, and art history: A social psychological perspective. In Schubert, T. W., & Maass, A. (Eds.). Spatial dimensions of social thought (Vol. 18). Berlin: Walter de Gruyter, 277-‐302.
Taylor, S. E., & Fiske, S. T. (1975). Point of view and perceptions of causality. Journal of Personality and Social Psychology, 32(3), 439.
Torralbo, A., Santiago, J., & Lupiáñez, J. (2006). Flexible conceptual projection of time onto spatial frames of reference. Cognitive Science, 30(4), 745-‐757.
Tversky, B. (2011). Spatial thought, social thought. In Schubert, T. W., & Maass, A. (Eds.). Spatial dimensions of social thought (Vol. 18). Berlin: Walter de Gruyter, 17-‐38.
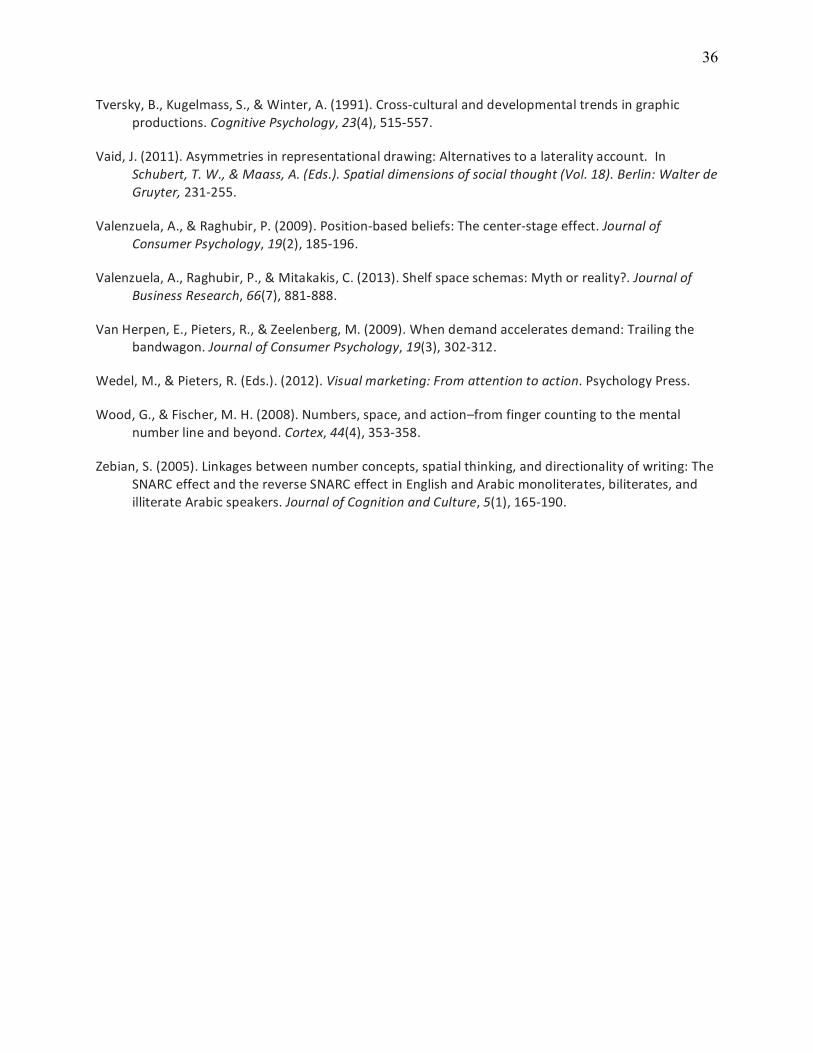
36
Tversky, B., Kugelmass, S., & Winter, A. (1991). Cross-‐cultural and developmental trends in graphic productions. Cognitive Psychology, 23(4), 515-‐557.
Vaid, J. (2011). Asymmetries in representational drawing: Alternatives to a laterality account. In Schubert, T. W., & Maass, A. (Eds.). Spatial dimensions of social thought (Vol. 18). Berlin: Walter de Gruyter, 231-‐255.
Valenzuela, A., & Raghubir, P. (2009). Position-‐based beliefs: The center-‐stage effect. Journal of Consumer Psychology, 19(2), 185-‐196.
Valenzuela, A., Raghubir, P., & Mitakakis, C. (2013). Shelf space schemas: Myth or reality?. Journal of Business Research, 66(7), 881-‐888.
Van Herpen, E., Pieters, R., & Zeelenberg, M. (2009). When demand accelerates demand: Trailing the bandwagon. Journal of Consumer Psychology, 19(3), 302-‐312.
Wedel, M., & Pieters, R. (Eds.). (2012). Visual marketing: From attention to action. Psychology Press.
Wood, G., & Fischer, M. H. (2008). Numbers, space, and action–from finger counting to the mental number line and beyond. Cortex, 44(4), 353-‐358.
Zebian, S. (2005). Linkages between number concepts, spatial thinking, and directionality of writing: The SNARC effect and the reverse SNARC effect in English and Arabic monoliterates, biliterates, and illiterate Arabic speakers. Journal of Cognition and Culture, 5(1), 165-‐190.
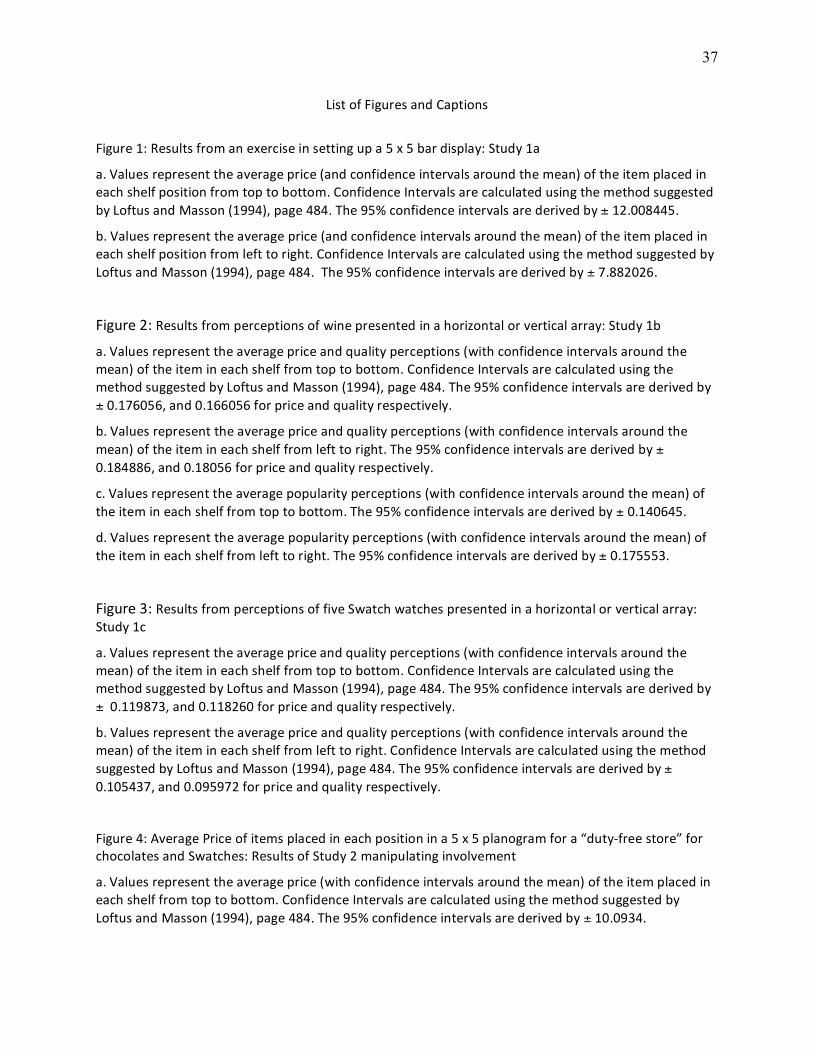
37
List of Figures and Captions
Figure 1: Results from an exercise in setting up a 5 x 5 bar display: Study 1a
a. Values represent the average price (and confidence intervals around the mean) of the item placed in each shelf position from top to bottom. Confidence Intervals are calculated using the method suggested by Loftus and Masson (1994), page 484. The 95% confidence intervals are derived by ± 12.008445.
b. Values represent the average price (and confidence intervals around the mean) of the item placed in each shelf position from left to right. Confidence Intervals are calculated using the method suggested by Loftus and Masson (1994), page 484. The 95% confidence intervals are derived by ± 7.882026.
Figure 2: Results from perceptions of wine presented in a horizontal or vertical array: Study 1b
a. Values represent the average price and quality perceptions (with confidence intervals around the mean) of the item in each shelf from top to bottom. Confidence Intervals are calculated using the method suggested by Loftus and Masson (1994), page 484. The 95% confidence intervals are derived by ± 0.176056, and 0.166056 for price and quality respectively.
b. Values represent the average price and quality perceptions (with confidence intervals around the mean) of the item in each shelf from left to right. The 95% confidence intervals are derived by ± 0.184886, and 0.18056 for price and quality respectively.
c. Values represent the average popularity perceptions (with confidence intervals around the mean) of the item in each shelf from top to bottom. The 95% confidence intervals are derived by ± 0.140645.
d. Values represent the average popularity perceptions (with confidence intervals around the mean) of the item in each shelf from left to right. The 95% confidence intervals are derived by ± 0.175553.
Figure 3: Results from perceptions of five Swatch watches presented in a horizontal or vertical array: Study 1c
a. Values represent the average price and quality perceptions (with confidence intervals around the mean) of the item in each shelf from top to bottom. Confidence Intervals are calculated using the method suggested by Loftus and Masson (1994), page 484. The 95% confidence intervals are derived by ± 0.119873, and 0.118260 for price and quality respectively.
b. Values represent the average price and quality perceptions (with confidence intervals around the mean) of the item in each shelf from left to right. Confidence Intervals are calculated using the method suggested by Loftus and Masson (1994), page 484. The 95% confidence intervals are derived by ± 0.105437, and 0.095972 for price and quality respectively.
Figure 4: Average Price of items placed in each position in a 5 x 5 planogram for a “duty-‐free store” for chocolates and Swatches: Results of Study 2 manipulating involvement
a. Values represent the average price (with confidence intervals around the mean) of the item placed in each shelf from top to bottom. Confidence Intervals are calculated using the method suggested by Loftus and Masson (1994), page 484. The 95% confidence intervals are derived by ± 10.0934.

38
b. Values represent the average price (with confidence intervals around the mean) of the item placed in each shelf from left to right. The 95% confidence intervals are derived by ± 4.6021.
Figure 5: Results of Study 3 manipulating schema consistency
a. Values represent the price perceptions (with confidence intervals around the mean) of wines in each shelf from top to bottom. Confidence Intervals are calculated using the method suggested by Loftus and Masson (1994), page 484. The 95% confidence intervals are derived by ± 0.215555097, and 0.292690963 in the consistent and inconsistent conditions respectively.
b. Values represent the price perceptions (with confidence intervals around the mean) of wines in each shelf from left to right. The 95% confidence intervals are derived by ± 0.209111306 and 0.257005329 in the consistent and inconsistent conditions respectively.
c. Values represent the quality perceptions (with confidence intervals around the mean) of wines in each shelf from top to bottom. The 95% confidence intervals are derived by ± 0.211388978 and 0.301909424 in the consistent and inconsistent conditions respectively.
d. Values represent the quality perceptions (with confidence intervals around the mean) of wines in each shelf from left to right. The 95% confidence intervals are derived by ± 0.273628652 for all means irrespective of condition, given the absence of significant interactions. e. Values represent the popularity perceptions (with confidence intervals around the mean) of wines in each shelf from top to bottom. The 95% confidence intervals are derived by ± 0.146902 for all means irrespective of condition, given the absence of significant interactions.
f. Values represent the popularity perceptions (with confidence intervals around the mean) of wines in each shelf from left to right. The 95% confidence intervals are derived by ± 0.146902 for all means irrespective of condition, given the absence of significant interactions.
Figure 6: Results of manipulating exposure to a horizontal or vertical number line: Study 4
a. Values represent price perceptions (with confidence intervals around the mean) of wines in each shelf from top to bottom. Confidence Intervals are calculated using the method suggested by Loftus and Masson (1994), page 484. The 95% confidence intervals are derived by ± 0.2068 across conditions, given the absence of significant interactions.
b. Values represent price perceptions (with confidence intervals around the mean) of wines in each shelf from left to right. The 95% confidence intervals are derived by ± 0.2360, and 0.2463 in the horizontal prime and vertical prime conditions respectively.
c. Values represent quality perceptions (with confidence intervals around the mean) of wines in each shelf from top to bottom. The 95% confidence intervals are derived by ± 0.3032, and 0.3235 in the horizontal prime and vertical prime conditions respectively.
d. Values represent quality perceptions (with confidence intervals around the mean) of wines in each shelf from left to right. The 95% confidence intervals are derived by ± 0.2750, and 0.2848 in the horizontal prime and vertical prime conditions respectively.
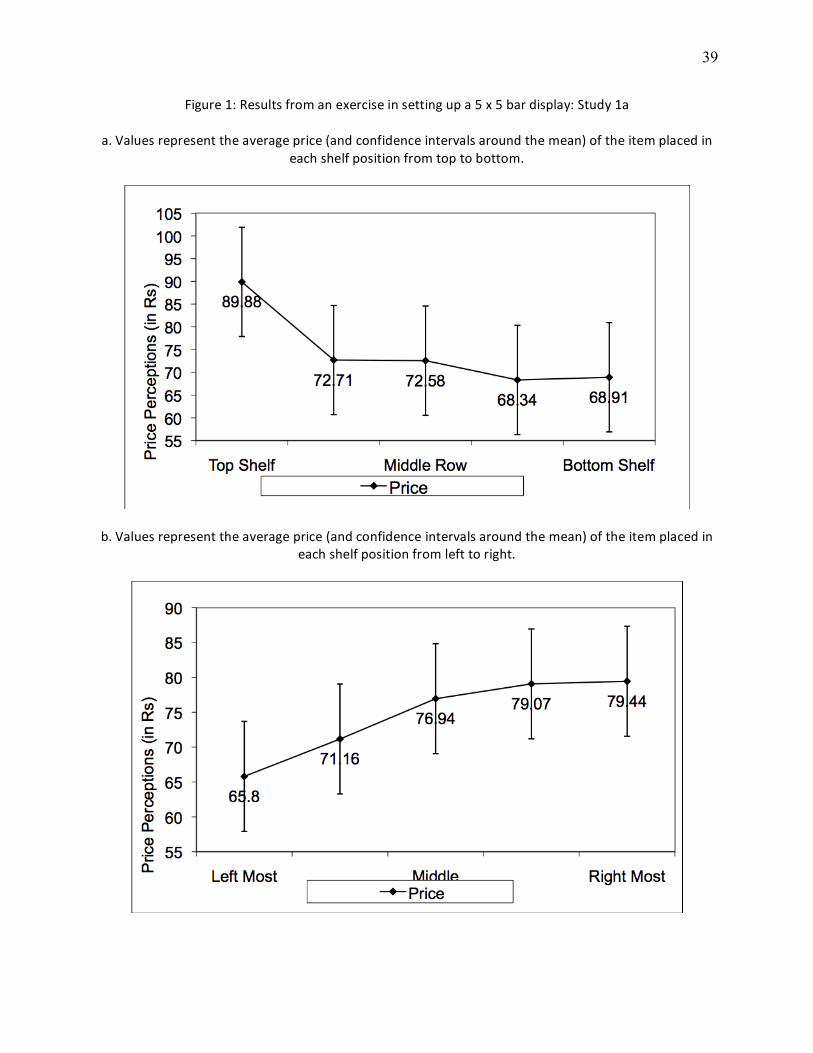
39
Figure 1: Results from an exercise in setting up a 5 x 5 bar display: Study 1a a. Values represent the average price (and confidence intervals around the mean) of the item placed in
each shelf position from top to bottom.
b. Values represent the average price (and confidence intervals around the mean) of the item placed in
each shelf position from left to right.
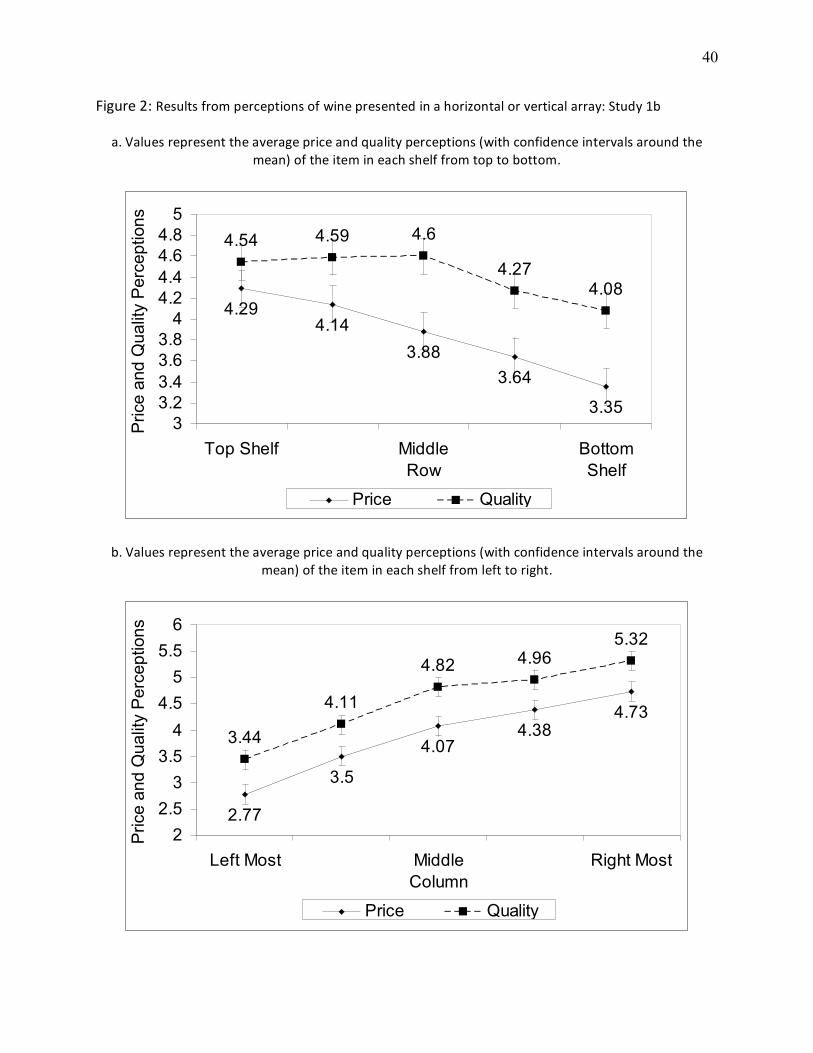
40
Figure 2: Results from perceptions of wine presented in a horizontal or vertical array: Study 1b
a. Values represent the average price and quality perceptions (with confidence intervals around the mean) of the item in each shelf from top to bottom.
4.294.14
3.883.64
3.35
4.54 4.59 4.6
4.274.08
33.23.43.63.8
44.24.44.64.8
5
Top Shelf MiddleRow
BottomShelf
Pric
e an
d Q
ualit
y P
erce
ptio
ns
Price Quality
b. Values represent the average price and quality perceptions (with confidence intervals around the
mean) of the item in each shelf from left to right.
2.77
3.5
4.074.38
4.733.44
4.11
4.82 4.965.32
22.5
33.5
4
4.55
5.56
Left Most MiddleColumn
Right Most
Pric
e an
d Q
ualit
y P
erce
ptio
ns
Price Quality
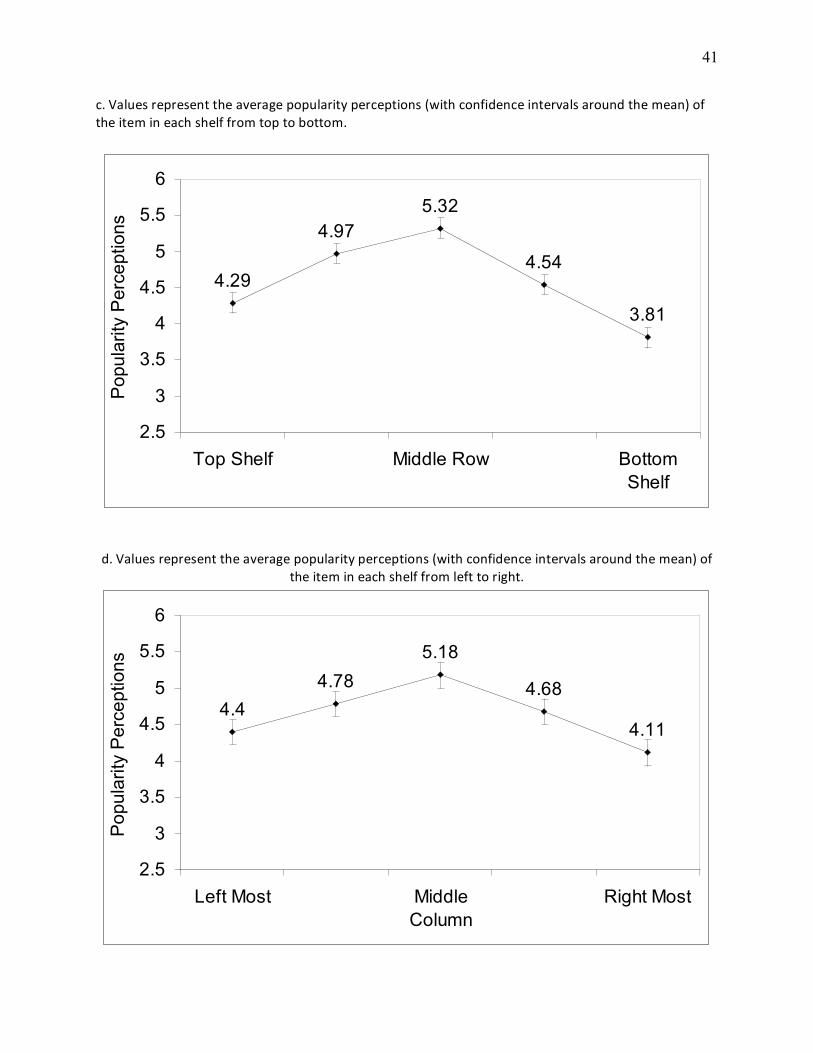
41
c. Values represent the average popularity perceptions (with confidence intervals around the mean) of the item in each shelf from top to bottom.
4.29
4.975.32
4.54
3.81
2.5
3
3.5
4
4.5
5
5.5
6
Top Shelf Middle Row BottomShelf
Pop
ular
ity P
erce
ptio
ns
d. Values represent the average popularity perceptions (with confidence intervals around the mean) of the item in each shelf from left to right.
4.44.78
5.18
4.68
4.11
2.5
3
3.5
4
4.5
5
5.5
6
Left Most MiddleColumn
Right Most
Pop
ular
ity P
erce
ptio
ns
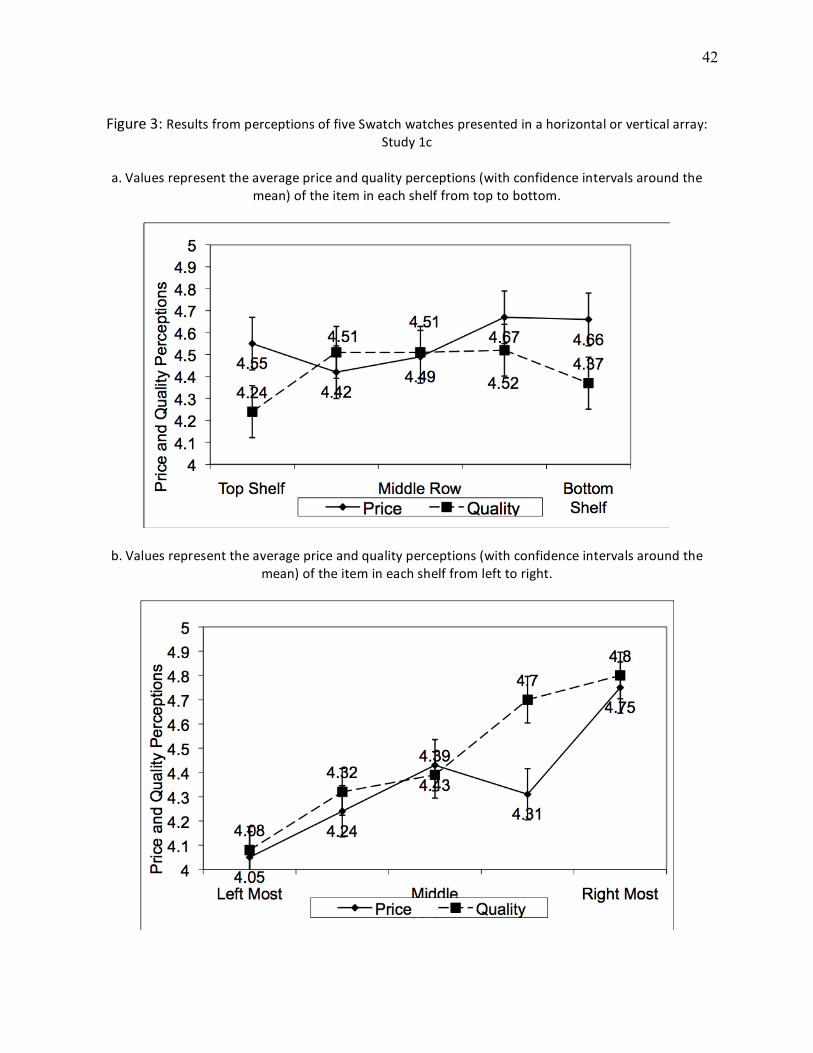
42
Figure 3: Results from perceptions of five Swatch watches presented in a horizontal or vertical array:
Study 1c
a. Values represent the average price and quality perceptions (with confidence intervals around the mean) of the item in each shelf from top to bottom.
b. Values represent the average price and quality perceptions (with confidence intervals around the mean) of the item in each shelf from left to right.
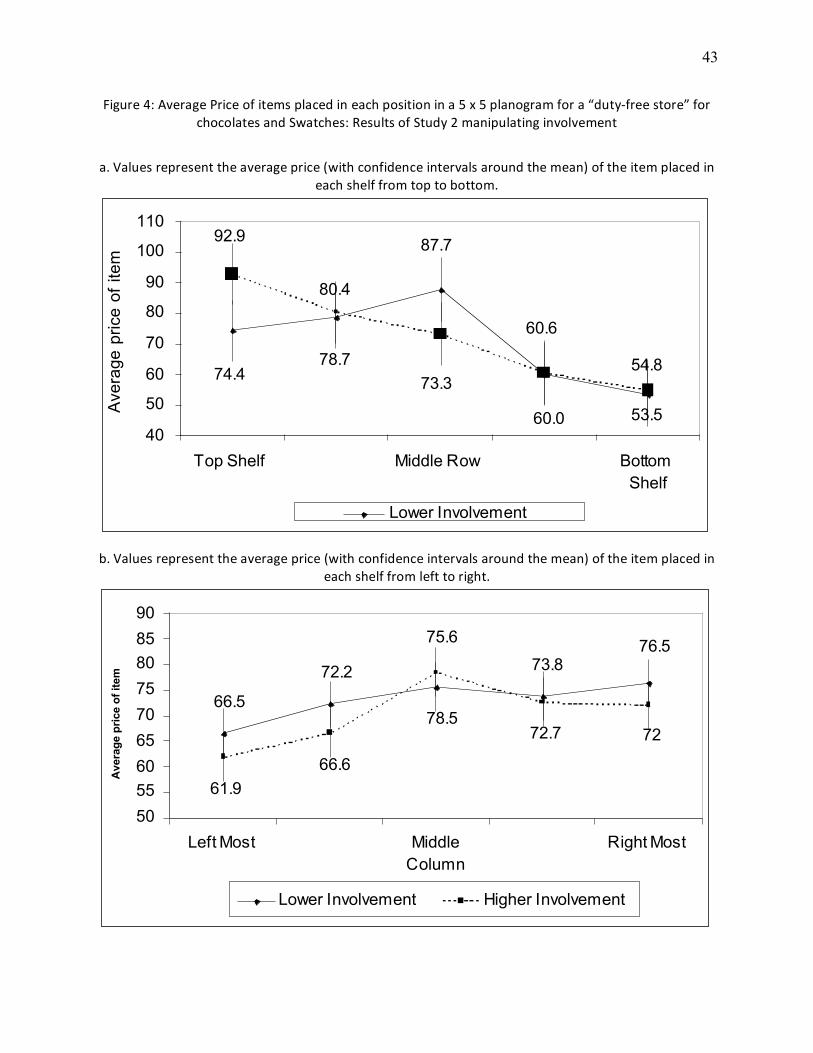
43
Figure 4: Average Price of items placed in each position in a 5 x 5 planogram for a “duty-‐free store” for chocolates and Swatches: Results of Study 2 manipulating involvement
a. Values represent the average price (with confidence intervals around the mean) of the item placed in each shelf from top to bottom.
53.5
80.4
54.8
60.0
74.478.7
87.7
60.6
92.9
73.3
40
50
60
70
80
90
100
110
Top Shelf Middle Row BottomShelf
Ave
rage
pric
e of
item
Lower InvolvementHigher Involvement
b. Values represent the average price (with confidence intervals around the mean) of the item placed in each shelf from left to right.
76.573.872.2
75.6
66.578.5
7272.7
66.661.9
505560657075808590
Left Most MiddleColumn
Right Most
Ave
rage
pri
ce o
f ite
m
Lower Involvement Higher Involvement
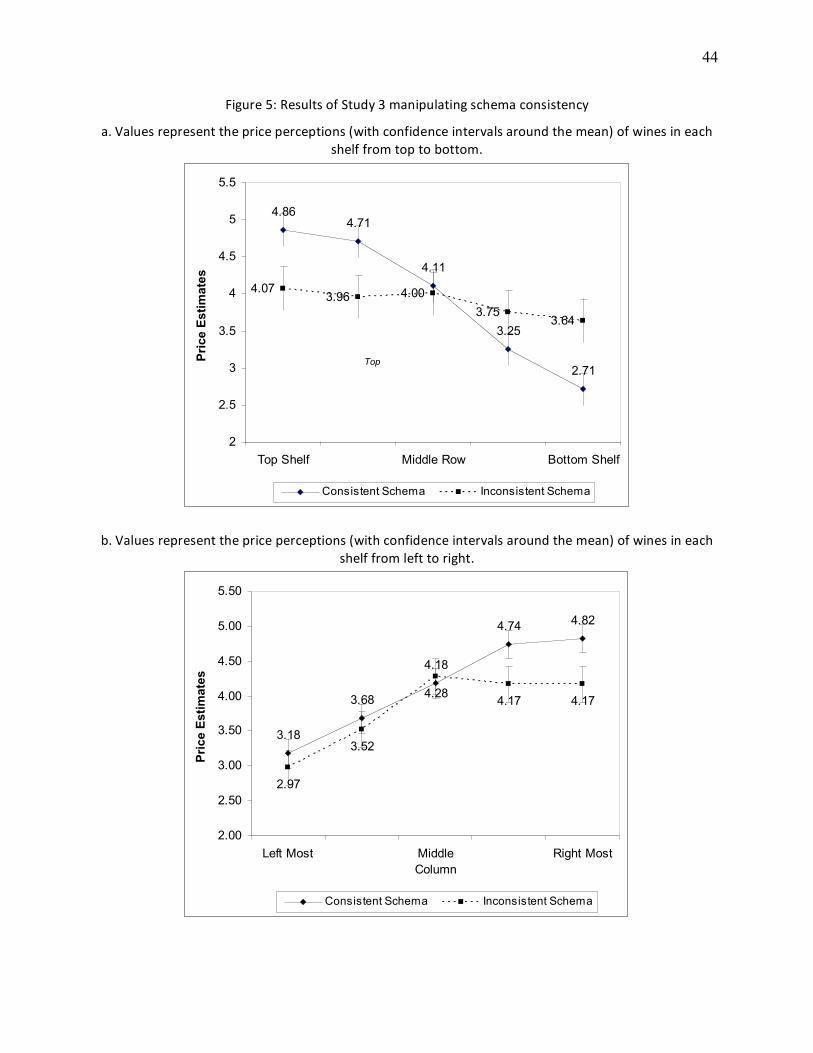
44
Figure 5: Results of Study 3 manipulating schema consistency
a. Values represent the price perceptions (with confidence intervals around the mean) of wines in each shelf from top to bottom.
4.864.71
4.11
3.25
2.71
4.073.96 4.00
3.753.64
2
2.5
3
3.5
4
4.5
5
5.5
Top Shelf Middle Row Bottom Shelf
Pric
e Es
timat
es
Consistent Schema Inconsistent Schema
b. Values represent the price perceptions (with confidence intervals around the mean) of wines in each shelf from left to right.
3.18
3.68
4.18
4.74 4.82
2.97
3.52
4.28 4.17 4.17
2.00
2.50
3.00
3.50
4.00
4.50
5.00
5.50
Left Most MiddleColumn
Right Most
Pric
e Es
timat
es
Consistent Schema Inconsistent Schema
Top
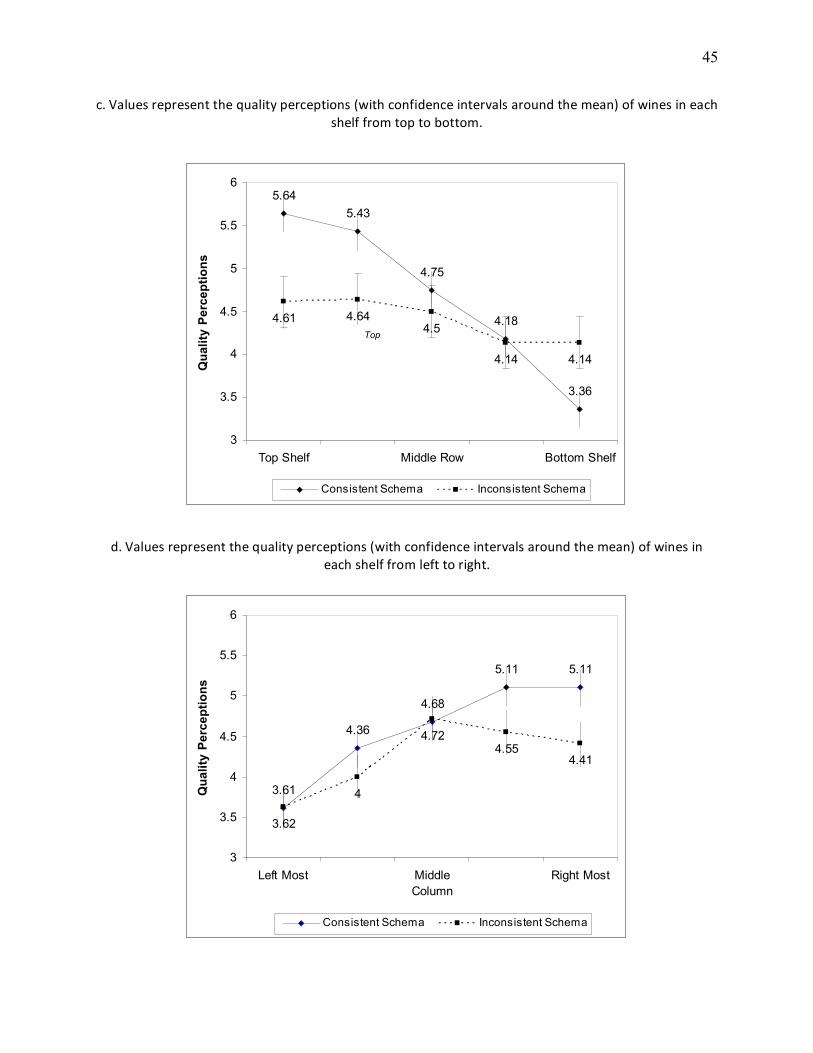
45
c. Values represent the quality perceptions (with confidence intervals around the mean) of wines in each shelf from top to bottom.
5.645.43
4.75
4.18
3.36
4.61 4.644.5
4.14 4.14
3
3.5
4
4.5
5
5.5
6
Top Shelf Middle Row Bottom Shelf
Qua
lity
Per
cept
ions
Consistent Schema Inconsistent Schema
d. Values represent the quality perceptions (with confidence intervals around the mean) of wines in each shelf from left to right.
3.61
4.36
4.68
5.11 5.11
3.62
4
4.724.55
4.41
3
3.5
4
4.5
5
5.5
6
Left Most MiddleColumn
Right Most
Qua
lity
Per
cept
ions
Consistent Schema Inconsistent Schema
Top
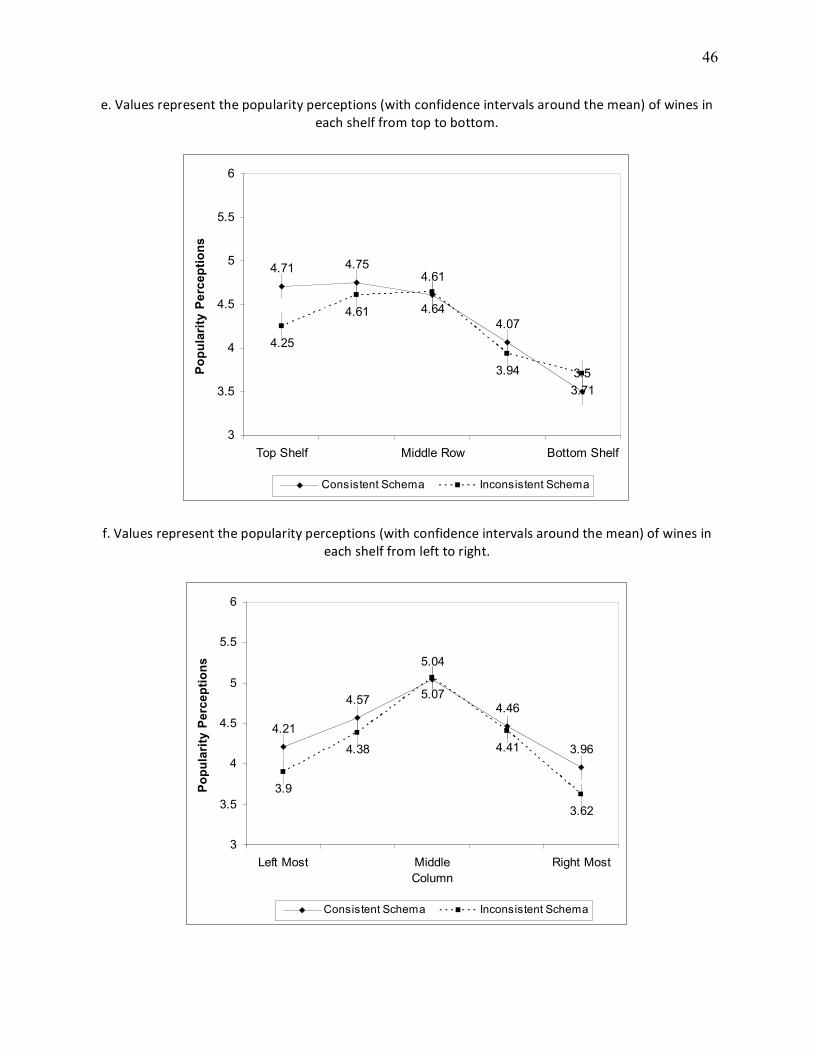
46
e. Values represent the popularity perceptions (with confidence intervals around the mean) of wines in each shelf from top to bottom.
4.71 4.754.61
4.07
3.5
4.25
4.61 4.64
3.94
3.71
3
3.5
4
4.5
5
5.5
6
Top Shelf Middle Row Bottom Shelf
Pop
ular
ity P
erce
ptio
ns
Consistent Schema Inconsistent Schema
f. Values represent the popularity perceptions (with confidence intervals around the mean) of wines in each shelf from left to right.
4.21
4.57
5.04
4.46
3.96
3.9
4.38
5.07
4.41
3.62
3
3.5
4
4.5
5
5.5
6
Left Most MiddleColumn
Right Most
Pop
ular
ity P
erce
ptio
ns
Consistent Schema Inconsistent Schema
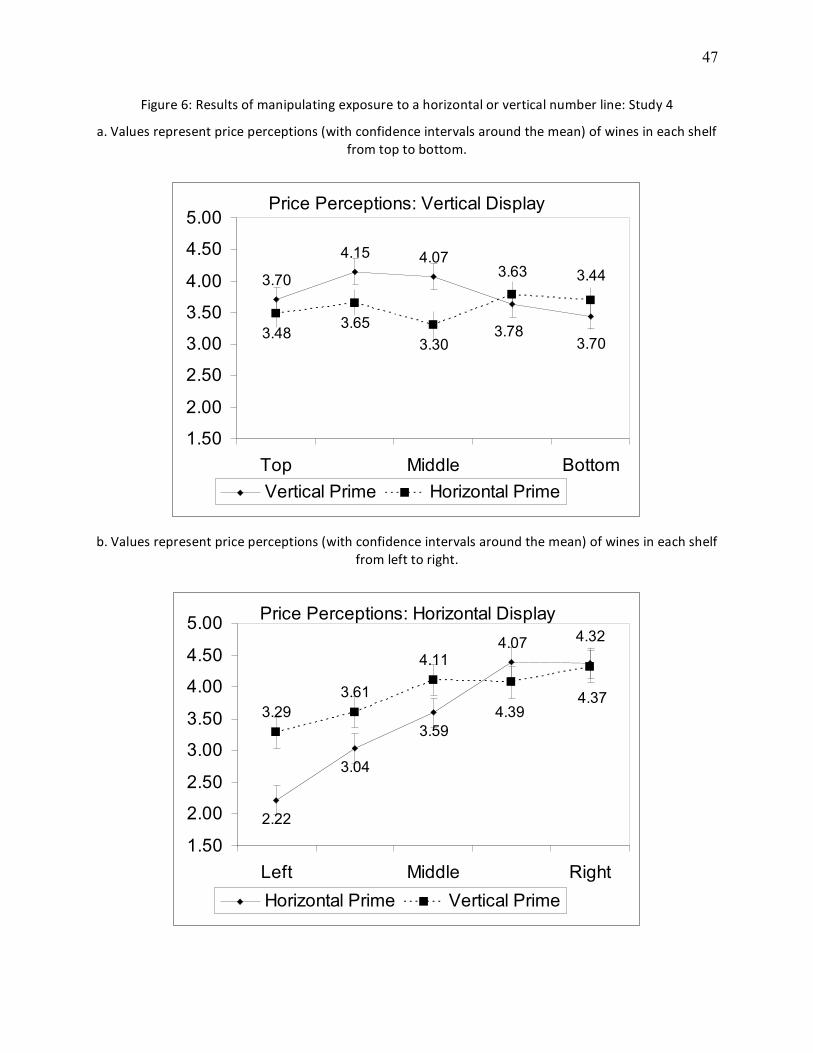
47
Figure 6: Results of manipulating exposure to a horizontal or vertical number line: Study 4
a. Values represent price perceptions (with confidence intervals around the mean) of wines in each shelf from top to bottom.
Price Perceptions: Vertical Display
3.70
4.15 4.07
3.483.65
3.30
3.63 3.44
3.703.78
1.50
2.00
2.50
3.00
3.50
4.00
4.50
5.00
Top Middle BottomVertical Prime Horizontal Prime
b. Values represent price perceptions (with confidence intervals around the mean) of wines in each shelf
from left to right.
Price Perceptions: Horizontal Display
2.22
3.04
3.593.29
3.61
4.11
4.374.39
4.324.07
1.50
2.00
2.50
3.00
3.50
4.00
4.50
5.00
Left Middle RightHorizontal Prime Vertical Prime
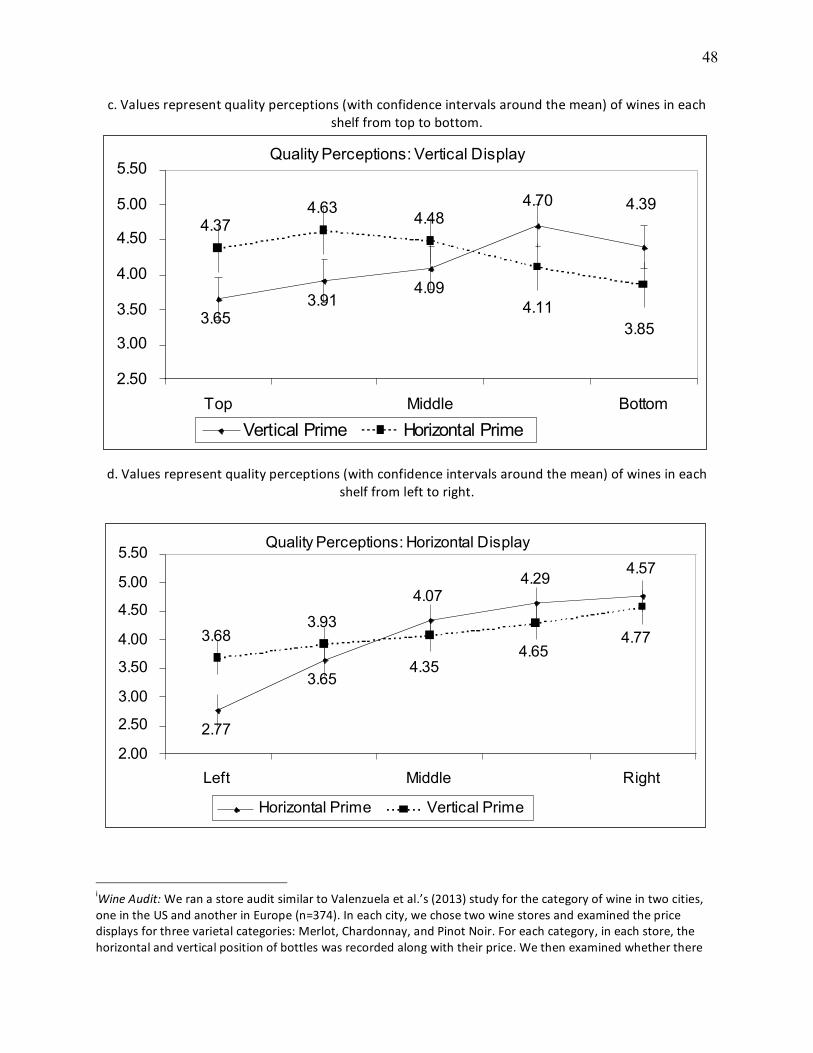
48
c. Values represent quality perceptions (with confidence intervals around the mean) of wines in each shelf from top to bottom.
Quality Perceptions: Vertical Display
3.653.91
4.09
4.374.63
4.484.394.70
4.113.85
2.50
3.00
3.50
4.00
4.50
5.00
5.50
Top Middle Bottom
Vertical Prime Horizontal Prime
d. Values represent quality perceptions (with confidence intervals around the mean) of wines in each shelf from left to right.
Quality Perceptions: Horizontal Display
2.77
3.65
3.683.93
4.774.65
4.35
4.574.29
4.07
2.00
2.50
3.00
3.50
4.00
4.50
5.00
5.50
Left Middle Right
Horizontal Prime Vertical Prime
iWine Audit: We ran a store audit similar to Valenzuela et al.’s (2013) study for the category of wine in two cities, one in the US and another in Europe (n=374). In each city, we chose two wine stores and examined the price displays for three varietal categories: Merlot, Chardonnay, and Pinot Noir. For each category, in each store, the horizontal and vertical position of bottles was recorded along with their price. We then examined whether there
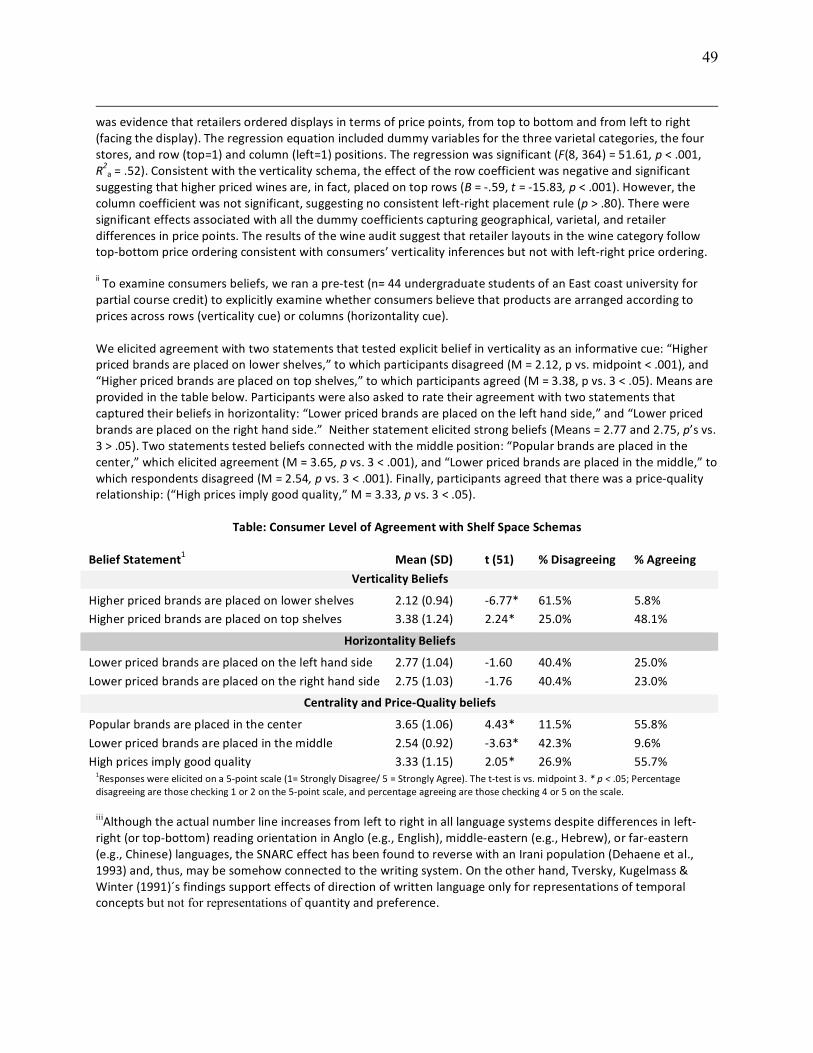
49
was evidence that retailers ordered displays in terms of price points, from top to bottom and from left to right (facing the display). The regression equation included dummy variables for the three varietal categories, the four stores, and row (top=1) and column (left=1) positions. The regression was significant (F(8, 364) = 51.61, p < .001, R2a = .52). Consistent with the verticality schema, the effect of the row coefficient was negative and significant suggesting that higher priced wines are, in fact, placed on top rows (B = -‐.59, t = -‐15.83, p < .001). However, the column coefficient was not significant, suggesting no consistent left-‐right placement rule (p > .80). There were significant effects associated with all the dummy coefficients capturing geographical, varietal, and retailer differences in price points. The results of the wine audit suggest that retailer layouts in the wine category follow top-‐bottom price ordering consistent with consumers’ verticality inferences but not with left-‐right price ordering. ii To examine consumers beliefs, we ran a pre-‐test (n= 44 undergraduate students of an East coast university for partial course credit) to explicitly examine whether consumers believe that products are arranged according to prices across rows (verticality cue) or columns (horizontality cue). We elicited agreement with two statements that tested explicit belief in verticality as an informative cue: “Higher priced brands are placed on lower shelves,” to which participants disagreed (M = 2.12, p vs. midpoint < .001), and “Higher priced brands are placed on top shelves,” to which participants agreed (M = 3.38, p vs. 3 < .05). Means are provided in the table below. Participants were also asked to rate their agreement with two statements that captured their beliefs in horizontality: “Lower priced brands are placed on the left hand side,” and “Lower priced brands are placed on the right hand side.” Neither statement elicited strong beliefs (Means = 2.77 and 2.75, p’s vs. 3 > .05). Two statements tested beliefs connected with the middle position: “Popular brands are placed in the center,” which elicited agreement (M = 3.65, p vs. 3 < .001), and “Lower priced brands are placed in the middle,” to which respondents disagreed (M = 2.54, p vs. 3 < .001). Finally, participants agreed that there was a price-‐quality relationship: (“High prices imply good quality,” M = 3.33, p vs. 3 < .05).
Table: Consumer Level of Agreement with Shelf Space Schemas
Belief Statement1 Mean (SD) t (51) % Disagreeing % Agreeing
Verticality Beliefs
Higher priced brands are placed on lower shelves 2.12 (0.94) -‐6.77* 61.5% 5.8% Higher priced brands are placed on top shelves 3.38 (1.24) 2.24* 25.0% 48.1%
Horizontality Beliefs
Lower priced brands are placed on the left hand side 2.77 (1.04) -‐1.60 40.4% 25.0%
Lower priced brands are placed on the right hand side 2.75 (1.03) -‐1.76 40.4% 23.0%
Centrality and Price-‐Quality beliefs
Popular brands are placed in the center 3.65 (1.06) 4.43* 11.5% 55.8%
Lower priced brands are placed in the middle 2.54 (0.92) -‐3.63* 42.3% 9.6% High prices imply good quality 3.33 (1.15) 2.05* 26.9% 55.7%
1Responses were elicited on a 5-‐point scale (1= Strongly Disagree/ 5 = Strongly Agree). The t-‐test is vs. midpoint 3. * p < .05; Percentage disagreeing are those checking 1 or 2 on the 5-‐point scale, and percentage agreeing are those checking 4 or 5 on the scale. iiiAlthough the actual number line increases from left to right in all language systems despite differences in left-‐right (or top-‐bottom) reading orientation in Anglo (e.g., English), middle-‐eastern (e.g., Hebrew), or far-‐eastern (e.g., Chinese) languages, the SNARC effect has been found to reverse with an Irani population (Dehaene et al., 1993) and, thus, may be somehow connected to the writing system. On the other hand, Tversky, Kugelmass & Winter (1991)´s findings support effects of direction of written language only for representations of temporal concepts but not for representations of quantity and preference.
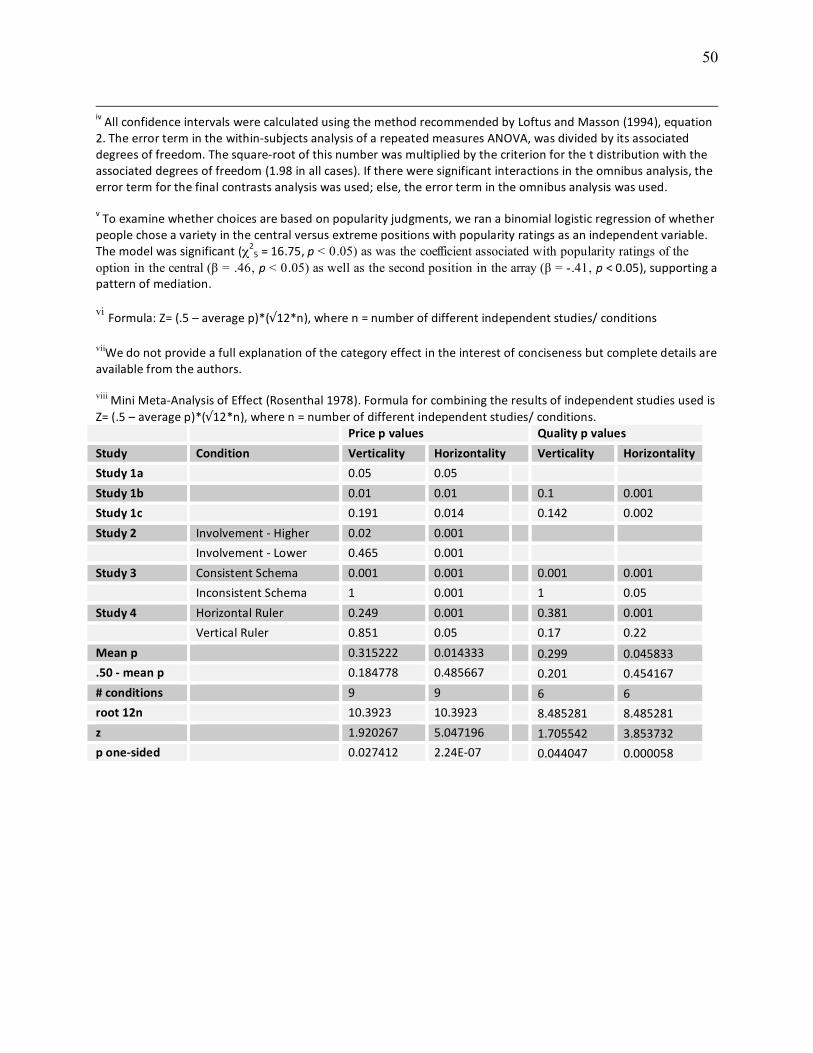
50
iv All confidence intervals were calculated using the method recommended by Loftus and Masson (1994), equation 2. The error term in the within-‐subjects analysis of a repeated measures ANOVA, was divided by its associated degrees of freedom. The square-‐root of this number was multiplied by the criterion for the t distribution with the associated degrees of freedom (1.98 in all cases). If there were significant interactions in the omnibus analysis, the error term for the final contrasts analysis was used; else, the error term in the omnibus analysis was used. v To examine whether choices are based on popularity judgments, we ran a binomial logistic regression of whether people chose a variety in the central versus extreme positions with popularity ratings as an independent variable. The model was significant (χ25 = 16.75, p < 0.05) as was the coefficient associated with popularity ratings of the option in the central (β = .46, p < 0.05) as well as the second position in the array (β = -.41, p < 0.05), supporting a pattern of mediation. vi Formula: Z= (.5 – average p)*(√12*n), where n = number of different independent studies/ conditions viiWe do not provide a full explanation of the category effect in the interest of conciseness but complete details are available from the authors. viii Mini Meta-‐Analysis of Effect (Rosenthal 1978). Formula for combining the results of independent studies used is Z= (.5 – average p)*(√12*n), where n = number of different independent studies/ conditions. Price p values Quality p values
Study Condition Verticality Horizontality Verticality Horizontality
Study 1a 0.05 0.05
Study 1b 0.01 0.01 0.1 0.001
Study 1c 0.191 0.014 0.142 0.002
Study 2 Involvement -‐ Higher 0.02 0.001
Involvement -‐ Lower 0.465 0.001
Study 3 Consistent Schema 0.001 0.001 0.001 0.001
Inconsistent Schema 1 0.001 1 0.05
Study 4 Horizontal Ruler 0.249 0.001 0.381 0.001
Vertical Ruler 0.851 0.05 0.17 0.22
Mean p 0.315222 0.014333 0.299 0.045833
.50 -‐ mean p 0.184778 0.485667 0.201 0.454167
# conditions 9 9 6 6
root 12n 10.3923 10.3923 8.485281 8.485281
z 1.920267 5.047196 1.705542 3.853732
p one-‐sided 0.027412 2.24E-‐07 0.044047 0.000058