Embed Size (px)
Citation preview

ABN 75 122 574 583
AnnuAl RepoRt 2011
Well positioned for Strong Growth
HiGHliGHtS 1 CHAiRmAn’S RepoRt 2 CHief exeCutive offiCeR’S RepoRt 4 BoARd of diReCtoRS 6 exeCutive mAnAGement teAm 8 opeRAtionAl RepoRt 10 ouR people 12 finAnCiAl RepoRt 14 CoRpoRAte diReCtoRy IBC
FlexiGroup is a diversified financial services group providing no interest ever, leasing, vendor programs and other payment solutions to consumers and businesses.
Through its network of 11,000 merchant, vendor and retail partners the Group has extensive access to three key markets; Business to Consumer, Business to Business and Retail to consumers and small business customers.
FlexiGroup operates in Australia, New Zealand and Ireland through its four business units Flexirent, Certegy, FlexiCommercial and Blink mobile broadband.
ContentS
1
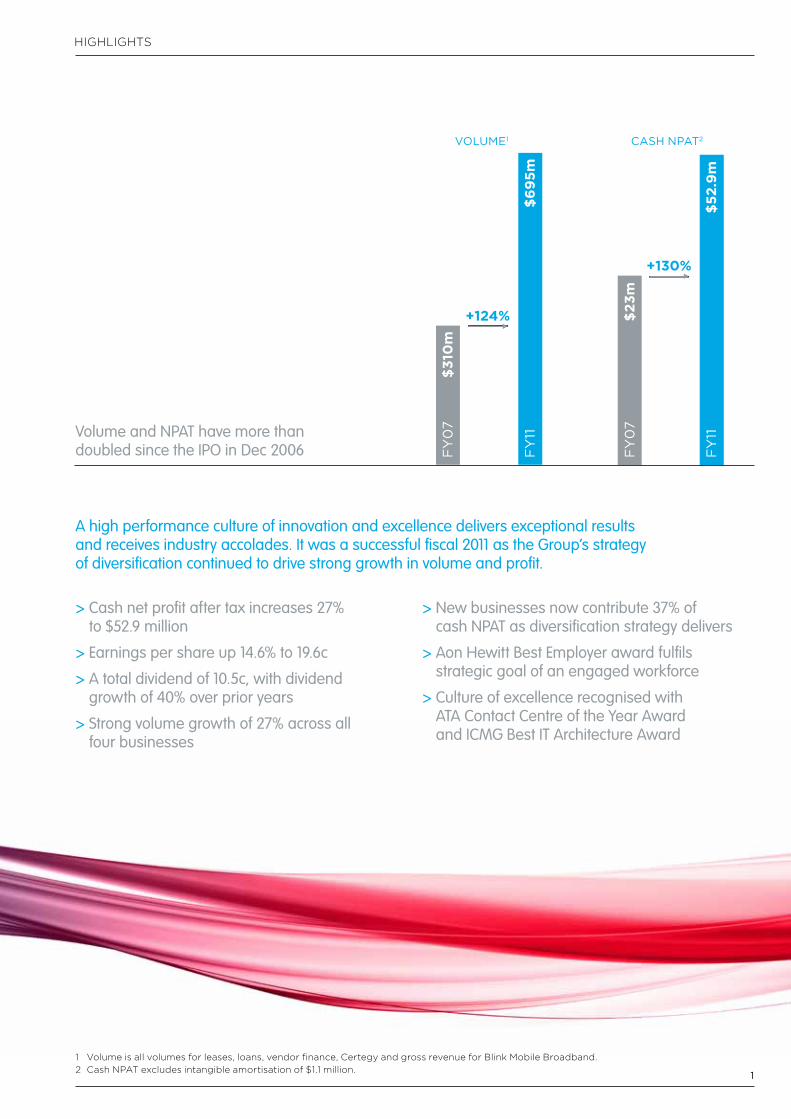
A high performance culture of innovation and excellence delivers exceptional results and receives industry accolades. It was a successful fiscal 2011 as the Group’s strategy of diversification continued to drive strong growth in volume and profit.
Volume1
$310
mFY07
$695m
FY11
+124%
Cash NPaT2
$23m
$52.9m
FY07
FY11
$695m
FY07
FY11
+130%
HigHligHts
> Cash net profit after tax increases 27% to $52.9 million
> Earnings per share up 14.6% to 19.6c
> A total dividend of 10.5c, with dividend growth of 40% over prior years
> Strong volume growth of 27% across all four businesses
> New businesses now contribute 37% of cash NPAT as diversification strategy delivers
> Aon Hewitt Best Employer award fulfils strategic goal of an engaged workforce
> Culture of excellence recognised with ATA Contact Centre of the Year Award and ICMG Best IT Architecture Award
1 Volume is all volumes for leases, loans, vendor finance, Certegy and gross revenue for Blink Mobile Broadband.2 Cash NPAt excludes intangible amortisation of $1.1 million.
Volume and NPAT have more than doubled since the IPO in Dec 2006

2
Diversity delivers strong resultsIt is a great pleasure to report fiscal 2011 was another year of success for FlexiGroup, with double-digit revenue and profit results.
CHAirMAN’s rePort
3
Dear shareholder,
it is a great pleasure to report fiscal 2011 was another year of success for Flexigroup, with double-digit revenue and profit results.
Flexigroup’s cash net profit after tax1 for the year ended 30 June 2011 was $52.9 million, representing a 27% increase on the prior year, while volumes2 also grew 27% to $695 million.
the cash net profit result was 12% above the guidance provided a year ago.
DiVersifiCaTioN sTraTegy DeliVersAs many shareholders are aware, Flexigroup has significantly evolved from its initial public offering just five years ago. What was then a single business unit, notably dependent on volumes from key retailers, has become a diversified financial services group with four strong business units.
in my view, the tremendous change and success at Flexigroup can be attributed primarily to three things: diversification, a high performance culture of excellence across the workforce, and a prudent approach to risk.
three years ago, Flexigroup embarked on a strategy of diversification. that strategy was vindicated in fiscal 2011, with strong results achieved in a challenging economic retail environment.
the diversification at Flexigroup has protected you, our shareholders, by broadening our revenue sources and expanding our customer base beyond the retail sector.
While the financial results achieved by Flexigroup’s employees spoke volumes for the culture of high performance, the awards from respected organisations are a further endorsement of the quality of the Flexigroup team.
Value for shareholDerssince our iPo in 2006, Flexigroup has more than doubled net profit after tax and volumes. in fiscal 2011 the group ranked eighth for total shareholder return among s&P/AsX300 non-mining companies. over the past two years the group has been in the top 20% for earnings per share growth and the top 10% for dividend per share growth.
the fully franked final dividend of 5.5 cents per share (which was paid on october 13), when combined with the interim dividend of 5 cents, represents annual dividend growth of 40%.
PosiTiVe ouTlookFor fiscal 2012, the group has committed funding facilities and a strong balance sheet to support growth, as well as to provide capacity to consider any value accretive acquisition opportunities that might arise.
Finally, on behalf of the Board of Directors, i would like to thank all of Flexigroup’s customers, partners, funders and shareholders for their continuing support. i especially wish to thank the entire team at Flexigroup for their ongoing dedication and excellence.
margareT JaCksoNChairmaN
the original Flexirent business has developed new growth opportunities, and all businesses in the group contributed to the 27% volume growth. Most pleasing was the increasing contribution of the three newer businesses (interest Free, Mobile Broadband and Vendor Finance).
in fiscal 2011, these three businesses accounted for 66% of volume. Moreover, thanks to Certegy interest Free and Blink Mobile Broadband, almost 60% of our revenue base is now non-interest income.
it is worth singling out the success of Certegy as an example of what can be achieved when management and employees are aligned to build a business – cash profit rose 80% to $13.7 million, or 26% of the group total. since acquisition, Certegy’s net profit after tax has more than trebled and is on track to repay the $31 million acquisition cost in a little over three years.
CulTure of exCelleNCeWhile broadening our business base has been an essential element of Flexigroup’s strategy and success, the group has been just as committed to developing an engaged workforce capable of delivering outstanding results for shareholders. Fostering a culture of excellence at the group is crucial to maximising shareholder returns for the long term.
the Board is proud that Flexigroup’s focus on excellence, led by Chief executive John Delano, was recognised by the receipt of three prestigious awards during the past year. the awards included being recognised as one of Australia’s Best employers, Australia’s Best Contact Centre, and for Best it Architecture Worldwide.
1 Cash NPAt excludes intangible amortisation of $1.1 million.2 Volume is all volumes for leases, loans, vendor finance, Certegy and gross revenue for Blink Mobile Broadband.
Diversity delivers strong results

4
CHieF eXeCutiVe oFFiCer’s rePort
sound strategy, well executed
DiVersifiCaTioN aND ProDuCT iNNoVaTioN DriViNg growThour fiscal 2011 results show that the diversification strategy set out three years ago is driving growth and delivering value to shareholders.
in a difficult retail environment, the group achieved 27% growth in volume2 and cash net profit after tax,1 an exceptional result that involved strong performances from all four business units. importantly, the three businesses we have acquired or grown organically since october 2008 – Certegy interest Free, Flexi Commercial Vendor Finance and Blink Mobile Broadband – comprise 47% of receivables and contribute 37% of cash NPAt.1
Our fiscal 2011 results show that the diversification strategy set out three years ago is driving growth and delivering value to shareholders.
the strong contribution from these new businesses meant Flexigroup not only withstood the challenging retail conditions, but was able to prosper as it found new opportunities for growth. our ability to develop and deliver innovative products, and our “too easy” culture helped us continue to deliver a high level of performance.
our balance sheet management remains strong. We have a strong capital position and highly diversified funding with committed facilities from Australian and international financial institutions to support our growth.
5
Blink Mobile Broadband (February 2009 organic start-up) the Blink business, which provides fast and reliable mobile broadband plans, increased its active customer base by 37% to 74,000 and now has more than 35% market share in key retail channels. NPAt improved $4 million to 6% of the group’s total.
the rollout of the Blink Mobile Broadband tablet Plan in key retailers across the country was a highlight during the year. this unique product offers consumers an alternative to paying by cash or credit for a tablet device. under Blink’s innovative model, consumers receive the device for $0 upfront when they take out a Blink mobile broadband plan. We expect growth to continue as tablet stock in retail stores becomes more freely available in fiscal 2012 in a market estimated at one million units.
Flexirent the group’s original point of sale leasing business again outperformed in a challenging retail environment, delivering a 6% increase in sales volumes to $238 million. Diversification into the non-retail commercial sector provided growth opportunities and led to higher average transaction amounts. growth accelerated in the fourth quarter, with the volume contribution of the non-retail commercial sector increasing from 15% to 29%.
furTher imProVemeNT iN CreDiT meTriCsour ongoing prudent approach to risk underpinned the net impairment result. losses in fiscal 2011 declined to 3.8% of average net receivables, down from 4.4% in fiscal 2010, despite 19% growth in receivables. the result reflects the efforts of our award-winning collections team, combined with continued investment in new technology platforms. the experience gained from more than 20 years providing consumer and business credit is embedded in Flexigroup’s credit scoring systems.
All four of our business units assisted our strong fiscal 2011 performance. the highlights were:
Certegy Interest Free (October 2008 acquisition) Certegy, our no interest ever payment plan provider, delivered a standout performance in fiscal 2011, particularly in the home improvement, fitness and solar energy sectors. since its acquisition in 2008, Certegy has had strong volume and net profit after tax growth. in fiscal 2011 volumes increased 30% to $375 million. Cash profit rose 80% to $13.7 million, which was 26% of the group’s total cash profit.
the Lay-Buy Express processing service was successfully introduced in a number of retail stores, including the toys-r-us group in Australia. the new product offers the traditional features of lay-by but allows consumers to self-manage their repayments and removes operational and administrative costs for retailers. Customer take-up of the service has exceeded expectations with Lay-Buy Express contributing more than 10% of Certegy’s June transaction volume. its contribution is expected to increase in fiscal 2012.
Flexi Commercial Vendor Finance (December 2009 organic start-up) Flexi Commercial Vendor Finance, a two-year old business that provides commercial equipment financing and vendor programs, delivered a strong result. the result was underpinned by the signing of formal program agreements with 11 new vendors, maturing vendor relationships and the conversion of business development activity. Volumes increased an impressive 221% to $61 million. Net Profit after tax (NPAt) for Vendor Finance doubled to $2.6 million.
CoNTiNueD growThin fiscal 2012 we anticipate continued strong growth as we leverage our core capabilities, develop innovative products and systems, and capitalise on new opportunities. growth in fiscal 2012 will be assisted by:
• afull-yearvolumecontributionfrom Lay-Buy Express – Certegy;
• increasingcontributiontosmallticket leasing from non-retail segments – Flexirent;
• afull-yearperformancefromVendor Finance new partner programs – FlexiCommercial;
• furthersigningofnewCertegyinterest Free retailers – Certegy;
• developmentofaproducttopenetrate the significant market opportunities for deferred internet payment processing – online; and
• acontinuedfocusonvalueaccretive acquisition opportunities.
CaPabiliTy To DeliVerour energetic and dedicated team has embraced the significant change experienced by the group over the past few years to deliver impressive results in fiscal 2011. i would like to thank them for their ongoing support and effort and also congratulate our award-winning Contact Centre, Collections and it teams.
one of our goals is to make Flexigroup the best place our people have ever worked. therefore it is extremely pleasing that we were recognised this year as one of Aon Hewitt’s Best employers. our Board and senior management believe that companies with engaged, committed people achieve strong financial performance, and our results in fiscal 2011 support that view. We recruit the best talent, and that strategy continues to drive superior results for our workforce, customers, partners and shareholders.
JohN DelaNomaNagiNg DireCTor aND Ceo
1 Cash NPAt excludes intangible amortisation of $1.1 million.2 Volume is all volumes for leases, loans, vendor finance, Certegy and gross revenue for Blink Mobile Broadband.
6
BoArD oF DireCtors
Value to shareholdersThe Board is committed to maintaining FlexiGroup’s strong track record of growth and delivering shareholder value.

7
margareT JaCksoN, aC ChairmaN, iNDePeNDeNT, NoN-exeCuTiVebec, mba, hon llD (monash), fCa
Margaret was appointed a Director of the Company in November 2006. Margaret is also a Director of Billabong international limited, President of Australian Volunteers international and Chairman of the Advisory Board for the salvation Army southern territory.
JohN DelaNo NoN-iNDePeNDeNT, exeCuTiVe, Chief exeCuTiVe offiCerba
John has been Chief executive officer and Managing Director of the Company since september 2003.
aNDrew aberCrombiefouNDiNg DireCTor NoN-iNDePeNDeNT, NoN-exeCuTiVe bec, llb, mba
Andrew became a Director of the original Flexirent business in 1991. He was appointed a Director of the Company in November 2006. Andrew is an experienced commercial and tax lawyer.
r JohN skiPPeNiNDePeNDeNT, NoN-exeCuTiVeaCa
John was appointed a Director of the Company in November 2006. John was previously the Finance Director and Chief Financial officer of Harvey Norman Holdings limited for 12 years.
raJeeV DhawaNiNDePeNDeNT, NoN-exeCuTiVebCom, aCa, mba
rajeev represented Colonial First state Private equity (“CFsPe”) on the Board of Flexirent Holdings Pty limited from February 2003 to December 2004. upon CFsPe’s exit he continued in an advisory capacity and was appointed a Director of the company in November 2006.

8
eXeCutiVe MANAgeMeNt teAM
A talented teamThe talent and diversity of experience of the executive management team is a key driver of the Group’s success.

9
Neil roberTsheaD of NaTioNal sales aND busiNess DeVeloPmeNT
DaViD sTeVeNsfiNaNCial CoNTroller aND ComPaNy seCreTary
miChelle PombarT heaD of humaN resourCes
aNThoNy roberTs heaD of sales – VeNDor fiNaNCe
graCe silVio heaD of learNiNg aND DeVeloPmeNT
JohN DelaNo maNagiNg DireCTor aND Chief exeCuTiVe offiCer
garry mCleNNaN Chief fiNaNCial offiCer
Pearl laughToN Chief iNformaTioN offiCer
DoC kloTZ heaD of oPeraTioNs
marilyN CoNyerheaD of markeTiNg
oPPosiTe lefT To righT
below lefT To righT
10
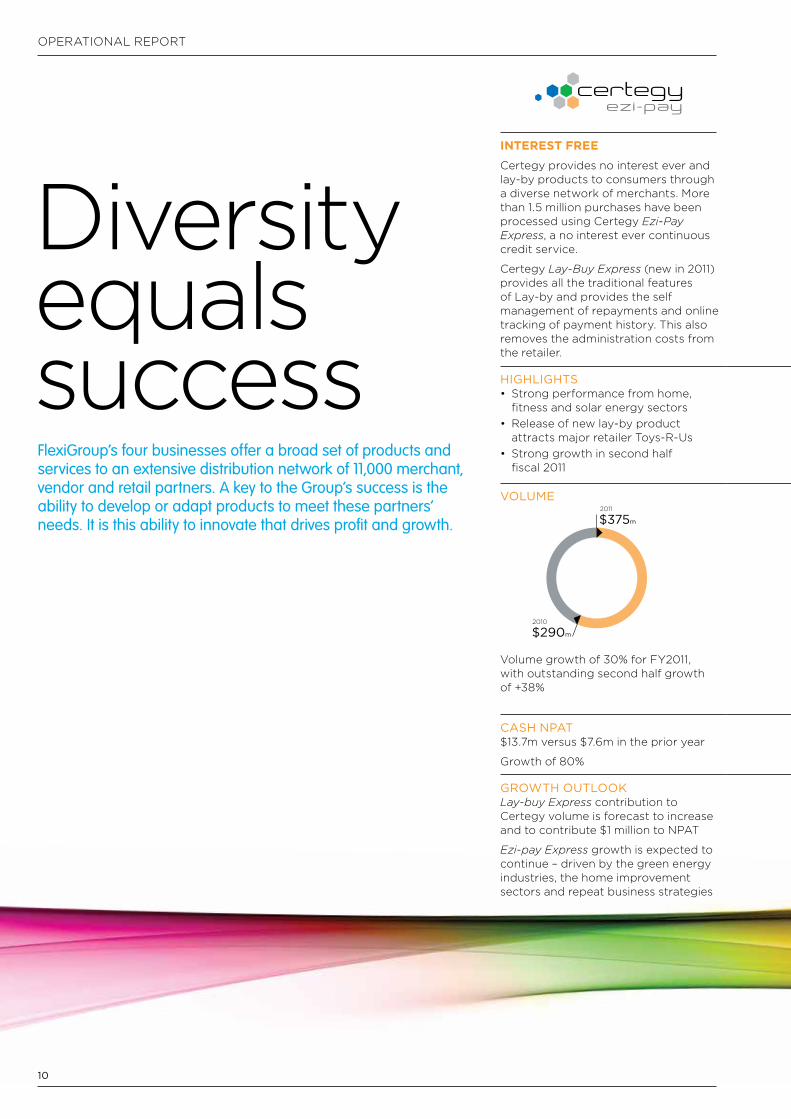
interest free Certegy provides no interest ever and lay-by products to consumers through a diverse network of merchants. More than 1.5 million purchases have been processed using Certegy Ezi-Pay Express, a no interest ever continuous credit service.
Certegy Lay-Buy Express (new in 2011) provides all the traditional features of lay-by and provides the self management of repayments and online tracking of payment history. this also removes the administration costs from the retailer.
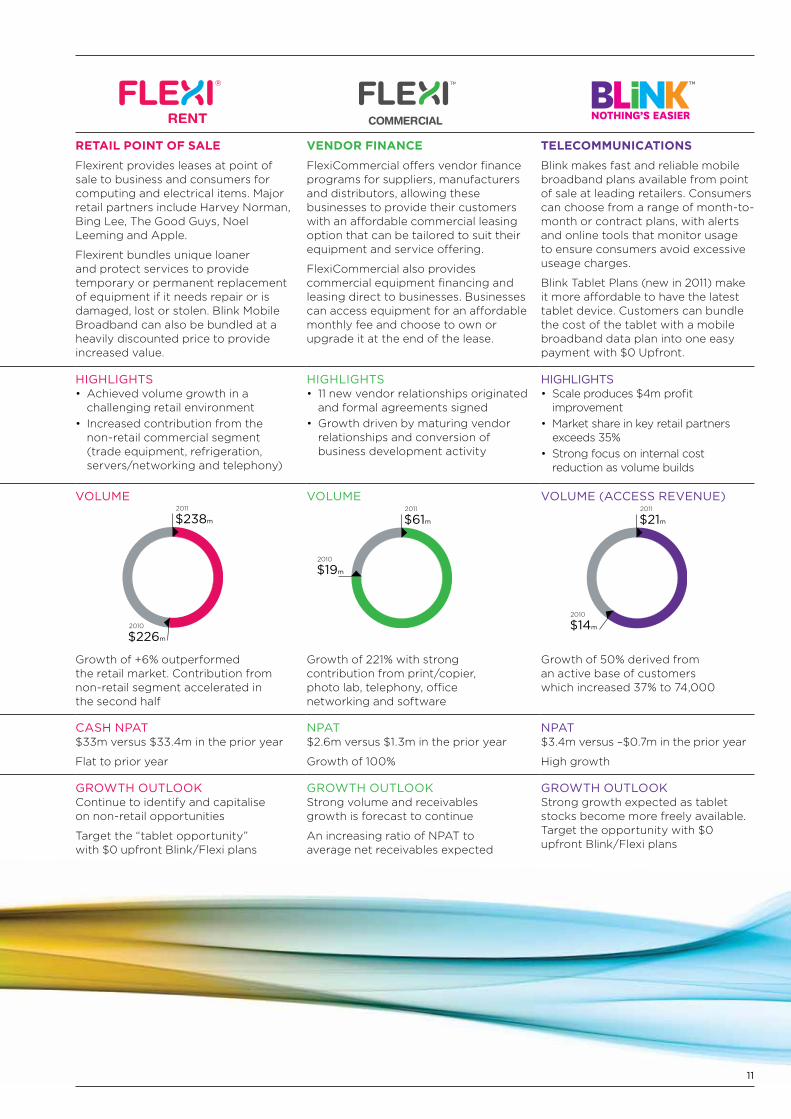
retail Point of saleFlexirent provides leases at point of sale to business and consumers for computing and electrical items. Major retail partners include Harvey Norman, Bing lee, the good guys, Noel leeming and Apple.
Flexirent bundles unique loaner and protect services to provide temporary or permanent replacement of equipment if it needs repair or is damaged, lost or stolen. Blink Mobile Broadband can also be bundled at a heavily discounted price to provide increased value.
Vendor financeFlexiCommercial offers vendor finance programs for suppliers, manufacturers and distributors, allowing these businesses to provide their customers with an affordable commercial leasing option that can be tailored to suit their equipment and service offering.
FlexiCommercial also provides commercial equipment financing and leasing direct to businesses. Businesses can access equipment for an affordable monthly fee and choose to own or upgrade it at the end of the lease.
telecommunicationsBlink makes fast and reliable mobile broadband plans available from point of sale at leading retailers. Consumers can choose from a range of month-to-month or contract plans, with alerts and online tools that monitor usage to ensure consumers avoid excessive useage charges.
Blink tablet Plans (new in 2011) make it more affordable to have the latest tablet device. Customers can bundle the cost of the tablet with a mobile broadband data plan into one easy payment with $0 upfront.
highlighTs• Strongperformancefromhome,
fitness and solar energy sectors• Releaseofnewlay-byproduct
attracts major retailer toys-r-us • Stronggrowthinsecondhalf
fiscal 2011
highlighTs• Achievedvolumegrowthina
challenging retail environment • Increasedcontributionfromthe
non-retail commercial segment (trade equipment, refrigeration, servers/networking and telephony)
highlighTs• 11newvendorrelationshipsoriginated
and formal agreements signed • Growthdrivenbymaturingvendor
relationships and conversion of business development activity
highlighTs• Scaleproduces$4mprofit
improvement• Marketshareinkeyretailpartners
exceeds 35%• Strongfocusoninternalcost
reduction as volume builds
Volume
$375m
$290m
2010
2011
Volume
$238m
2011
$226m
2010
Volume 2011
$61m
$19m
2010
Volume (aCCess reVeNue)2011
$21m
$14m
2010
Volume growth of 30% for FY2011, with outstanding second half growth of +38%
growth of +6% outperformed the retail market. Contribution from non-retail segment accelerated in the second half
growth of 221% with strong contribution from print/copier, photo lab, telephony, office networking and software
growth of 50% derived from an active base of customers which increased 37% to 74,000
Cash NPaT $13.7m versus $7.6m in the prior year
growth of 80%
Cash NPaT $33m versus $33.4m in the prior year
Flat to prior year
NPaT $2.6m versus $1.3m in the prior year
growth of 100%
NPaT $3.4m versus –$0.7m in the prior year
High growth
growTh ouTlookLay-buy Express contribution to Certegy volume is forecast to increase and to contribute $1 million to NPAt
Ezi-pay Express growth is expected to continue – driven by the green energy industries, the home improvement sectors and repeat business strategies
growTh ouTlookContinue to identify and capitalise on non-retail opportunities
target the “tablet opportunity” with $0 upfront Blink/Flexi plans
growTh ouTlookstrong volume and receivables growth is forecast to continue
An increasing ratio of NPAt to average net receivables expected
growTh ouTlookstrong growth expected as tablet stocks become more freely available. target the opportunity with $0 upfront Blink/Flexi plans
certegyezi-pay
Diversity equals success
oPerAtioNAl rePort
FlexiGroup’s four businesses offer a broad set of products and services to an extensive distribution network of 11,000 merchant, vendor and retail partners. A key to the Group’s success is the ability to develop or adapt products to meet these partners’ needs. It is this ability to innovate that drives profit and growth.
11
interest free Certegy provides no interest ever and lay-by products to consumers through a diverse network of merchants. More than 1.5 million purchases have been processed using Certegy Ezi-Pay Express, a no interest ever continuous credit service.
Certegy Lay-Buy Express (new in 2011) provides all the traditional features of lay-by and provides the self management of repayments and online tracking of payment history. this also removes the administration costs from the retailer.
retail Point of saleFlexirent provides leases at point of sale to business and consumers for computing and electrical items. Major retail partners include Harvey Norman, Bing lee, the good guys, Noel leeming and Apple.
Flexirent bundles unique loaner and protect services to provide temporary or permanent replacement of equipment if it needs repair or is damaged, lost or stolen. Blink Mobile Broadband can also be bundled at a heavily discounted price to provide increased value.
Vendor financeFlexiCommercial offers vendor finance programs for suppliers, manufacturers and distributors, allowing these businesses to provide their customers with an affordable commercial leasing option that can be tailored to suit their equipment and service offering.
FlexiCommercial also provides commercial equipment financing and leasing direct to businesses. Businesses can access equipment for an affordable monthly fee and choose to own or upgrade it at the end of the lease.
telecommunicationsBlink makes fast and reliable mobile broadband plans available from point of sale at leading retailers. Consumers can choose from a range of month-to-month or contract plans, with alerts and online tools that monitor usage to ensure consumers avoid excessive useage charges.
Blink tablet Plans (new in 2011) make it more affordable to have the latest tablet device. Customers can bundle the cost of the tablet with a mobile broadband data plan into one easy payment with $0 upfront.
highlighTs• Strongperformancefromhome,
fitness and solar energy sectors• Releaseofnewlay-byproduct
attracts major retailer toys-r-us • Stronggrowthinsecondhalf
fiscal 2011
highlighTs• Achievedvolumegrowthina
challenging retail environment • Increasedcontributionfromthe
non-retail commercial segment (trade equipment, refrigeration, servers/networking and telephony)
highlighTs• 11newvendorrelationshipsoriginated
and formal agreements signed • Growthdrivenbymaturingvendor
relationships and conversion of business development activity
highlighTs• Scaleproduces$4mprofit
improvement• Marketshareinkeyretailpartners
exceeds 35%• Strongfocusoninternalcost
reduction as volume builds
Volume
$375m
$290m
2010
2011
Volume
$238m
2011
$226m
2010
Volume 2011
$61m
$19m
2010
Volume (aCCess reVeNue)2011
$21m
$14m
2010
Volume growth of 30% for FY2011, with outstanding second half growth of +38%
growth of +6% outperformed the retail market. Contribution from non-retail segment accelerated in the second half
growth of 221% with strong contribution from print/copier, photo lab, telephony, office networking and software
growth of 50% derived from an active base of customers which increased 37% to 74,000
Cash NPaT $13.7m versus $7.6m in the prior year
growth of 80%
Cash NPaT $33m versus $33.4m in the prior year
Flat to prior year
NPaT $2.6m versus $1.3m in the prior year
growth of 100%
NPaT $3.4m versus –$0.7m in the prior year
High growth
growTh ouTlookLay-buy Express contribution to Certegy volume is forecast to increase and to contribute $1 million to NPAt
Ezi-pay Express growth is expected to continue – driven by the green energy industries, the home improvement sectors and repeat business strategies
growTh ouTlookContinue to identify and capitalise on non-retail opportunities
target the “tablet opportunity” with $0 upfront Blink/Flexi plans
growTh ouTlookstrong volume and receivables growth is forecast to continue
An increasing ratio of NPAt to average net receivables expected
growTh ouTlookstrong growth expected as tablet stocks become more freely available. target the opportunity with $0 upfront Blink/Flexi plans
12
our PeoPle
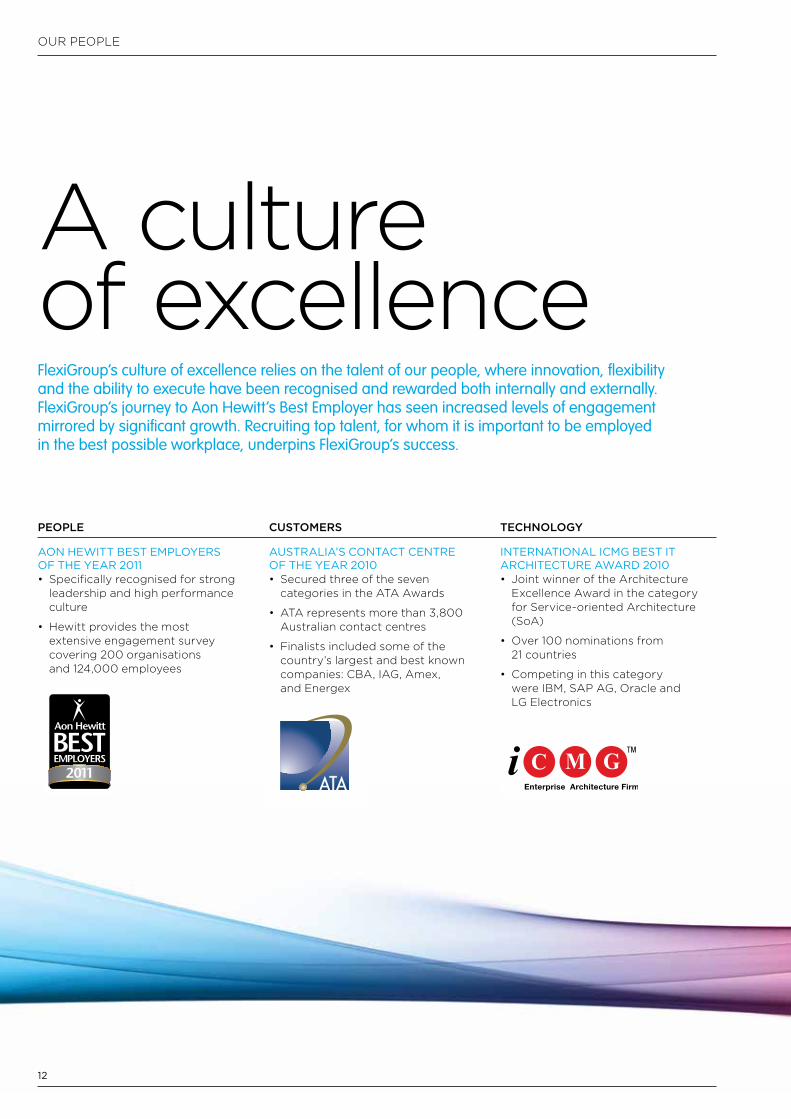
A culture of excellenceFlexiGroup’s culture of excellence relies on the talent of our people, where innovation, flexibility and the ability to execute have been recognised and rewarded both internally and externally. FlexiGroup’s journey to Aon Hewitt’s Best Employer has seen increased levels of engagement mirrored by significant growth. Recruiting top talent, for whom it is important to be employed in the best possible workplace, underpins FlexiGroup’s success.
PEOPLE
aoN hewiTT besT emPloyers of The year 2011• Specificallyrecognisedforstrong
leadership and high performance culture
• Hewittprovidesthemostextensive engagement survey covering 200 organisations and 124,000 employees
CustOMErs
ausTralia’s CoNTaCT CeNTre of The year 2010• Securedthreeoftheseven
categories in the AtA Awards
• ATArepresentsmorethan3,800Australian contact centres
• Finalistsincludedsomeofthecountry’s largest and best known companies: CBA, iAg, Amex, and energex
tECHNOLOGY
iNTerNaTioNal iCmg besT iT arChiTeCTure awarD 2010• JointwinneroftheArchitecture
excellence Award in the category for service-oriented Architecture (soA)
• Over100nominationsfrom21 countries
• Competinginthiscategorywere iBM, sAP Ag, oracle and lg electronics

13
Community spirited“ I am proud of our people and the way they have embraced the opportunities provided by our partners through the Flexi Connects program. Using their skills to give back is significantly contributing to building sustainable community partnerships”. JohN DelaNo Ceo
flexi CoNNeCTsWe recognise that community organisations need monetary donations and fundraisers. As welcome as that financial assistance is, Flexigroup believes the establishment of genuine partnerships between community organisations and businesses are vital. it was a desire to create effective and long lasting links with the community that led to the creation of Flexi Connects, a program that focuses on skilled volunteering. We wanted to share our knowledge, skills, resources and systems to deliver exciting and sustainable outcomes for our community partners.
Flexigroup is delighted to have established partnerships with organisations including the starlight Children’s Foundation, tour de Cure, Fair Business, rozelle Neighbourhood Centre and the salvation Army.
Flexigroup has made a difference in the community through long-term projects involving specialised and cross functional teams, individual pro bono work as well as individual secondments. the outcomes have been beneficial for both our partners and Flexigroup’s employees.
Highlights from Flexi Connects include:
• providingTourdeCurewiththeexpertise of Flexigroup’s 10-person marketing team and its specialist agencies;
• aFlexiGroupfinanceemployeeseconded two days a week to assist Fair Business; and
• settingup,housingandprovidingoperational support for starlight Children’s Foundation as it launched its first call centre. the centre continues to operate from Flexigroup’s head office.
PassioN Daysone of our goals is to make Flexigroup the best place our people have ever worked. We actively encourage our people to participate in our Passion Day community support program. this initiative provides two additional days of paid annual leave for employees to volunteer their time and assist our partners. We have completed more than 3,000 hours of community work since the program launched late last year. By establishing true partnerships we receive a return on our investment, valuable new skills are bought back to our business and these unique career experiences drive higher levels of staff engagement.

14
As At 30 JuNe 2011
Financial report
15
FleXigrouP liMiteD FiNANCiAl rePort 2011
contents Page
Directors’ report 16
Auditor’s independence Declaration 39
Corporate governance statement 40
Financial statements 44
Notes to the Financial statements 50
Directors’ Declaration 97
independent Audit report 98
shareholder information 100
Corporate Directory iBC
As At 30 JuNe 2011
16
Your Directors present their report on the consolidated entity (referred to hereafter as the group) consisting of Flexigroup limited and the entities it controlled at the end of, or during, the year ended 30 June 2011.
Directors
the following persons were Directors of Flexigroup limited during the year and up to the date of this report:Margaret JacksonJohn DelanoAndrew Abercrombierajeev Dhawanr John skippen
Company secretary
David stevens
Principal activities
the principal activities during the year continued to be the provision of:• lease and rental financing services for office, technology
and related equipment• interest-free loans• mobile broadband products and plans
No significant change in the nature of these activities occurred during the year.
Dividends
Dividends paid to members during the financial year were as follows:
Final ordinary dividend of 4.5 cents (2010: 3 cents) per fully paid share was paid on 15 october 2010. the total amount paid was $12,396,267.
interim ordinary dividend for the year ended 30 June 2011 of 5 cents (2010: 3 cents) per fully paid share paid on 15 April 2011. total amount paid was $13,783,125.
the Directors declare a final ordinary dividend of 5.5 cents (2010: 4.5 cents) per fully paid ordinary share on 5 August 2011. this dividend has a record date of 14 september 2011 and is expected to be paid on 13 october 2011.
review of operations
the group’s net profit after tax for the year ended 30 June 2011 was $51.8m (2010: $58.9m), a decrease of $7.1m over the prior year. this decrease is the result of the recognition of a one-off tax credit in the 2010 year as detailed in the prior year statutory accounts. excluding this one-off tax credit net profit after tax increased in 2011 by $11.3m (28%) over the prior year.
this increase in profit continues to result from the group’s focus on growth of the leasing, interest-free, vendor finance and Blink businesses.
the group is to continue to grow these areas in the future as it aims to takes advantage of the parts of the market currently under serviced.
Flexigroup continues to be well placed to take advantage of such opportunities with $247.2m of unused funding facilities as at 30 June 2011 (refer to note 22).
significant changes in state of affairs
there were no significant changes in the Company’s state of affairs in the year.
matters subsequent to end of the financial year
there were no matters subsequent to the end of the financial year.
likely developments and expected results of operation
information on likely developments in the operations of the consolidated entity and the expected results of operations have not been included in this report because the Directors believe it would be likely to result in unreasonable prejudice to the consolidated entity.
environmental regulation
the group’s operations are not regulated by any significant environmental regulation under a law of the Commonwealth or of a state or territory.
Directors’ report
17
FLEXIGROUP LIMITED FInancIaL REPORT 2011
Information on Directors
Margaret Jackson, AC (Age 58)
Chairman, Independent, Non-Executive
BEc, MBA, Hon LLD (Monash), FCA
ExperienceMargaret was appointed a Director of the company in november 2006. Margaret is also a Director of Billabong International Limited.
Margaret is also President of australian Volunteers International and chairman of the advisory Board for the Salvation army Southern Territory.
Before beginning her career as a full time company Director in 1992, Margaret was a Partner of KPMG Peat Marwick’s Management consulting Division.
Other current directorshipsBillabong International Limited
Former directorships in last three yearsaustralia and new Zealand Banking Group Limited
Special responsibilitiesMember of Remuneration committee, nomination committee and audit & Risk committee.
Interests in shares and options3,126,012 ordinary shares in FlexiGroup Limited
John Delano (Age 51)
Non-Independent, Executive, Chief Executive Officer
BA
ExperienceJohn has been chief Executive Officer of the company since December 2006, and was appointed a Director of the company in november 2006. John has been chief Executive Officer of Flexirent Holdings Pty Limited since September 2003. John started his career with avis Inc. in the United States before progressing to the position of Managing Director of avis australia. John was subsequently involved as Senior Vice President of Operations with Travel Services International, a naSDaQ listed company which successfully completed a roll-up of 23 leisure travel companies.
Other current directorshipsnone
Former directorships in last three yearsnone
Special responsibilities chief Executive Officer
Interests in shares and optionsShares4,028,461 ordinary shares in FlexiGroup Limited
Options, performance rights and deferred shares4,250,395 performance options in FlexiGroup Limited (detailed description on page 24)
7,046,753 performance options in FlexiGroup Limited (detailed description on page 25)
455,314 performance rights in FlexiGroup Limited (detailed description on page 26)
7,500,000 deferred shares in FlexiGroup Limited (detailed description on page 28)
Andrew Abercrombie(Age 55)
Founding Director Non-Independent, Non-Executive
BEc, LLB, MBA
Experienceandrew became a Director of the original Flexirent business in 1991. He was appointed a Director of the company in november 2006. andrew is an experienced commercial and tax lawyer and was a founding partner in a legal firm operating in both Sydney and Melbourne. Following several years in property investment and tax consulting, he became involved in the Flexirent business in 1991 and until 2003 was chief Executive Officer.
Other current directorshipsnone
Former directorships in last three yearsnone
Special responsibilitieschair of nomination committee and Member of Remuneration committee
Interests in shares and options81,263,302 ordinary shares in FlexiGroup Limited
aS aT 30 JUnE 2011
18
Directors’ Report (continued)
Rajeev Dhawan(Age 45)
Independent, Non-Executive
BCom, ACA, MBA
ExperienceRajeev represented colonial First State Private Equity managed funds (“cFSPE”) on the Board of Flexirent Holdings Pty Limited from February 2003 to December 2004. Upon cFSPE’s exit from Flexirent Holdings in December 2004, Rajeev continued in an advisory capacity to the Flexirent business. currently a partner of Equity Partners, Rajeev has 18 years’ venture capital and private equity experience and has been a Director of a number of listed and unlisted portfolio companies.
Other current directorshipsnone
Former directorships in last three yearsSnowball Group Limited
Traffic Technologies Limited
Portland Orthopaedics Limited (alternate director)
Special responsibilitieschair of Remuneration committee, Member of audit & Risk committee and nomination committee.
Interests in shares and options889,099 ordinary shares in FlexiGroup Limited
R John Skippen(Age 63)
Independent, Non-Executive
ACA
ExperienceJohn was appointed a Director of the company in november 2006. John was the Finance Director and chief Financial Officer of Harvey norman Holdings Limited for 12 years. John was involved in the establishment of the original agreement between Flexirent Holdings Pty Limited and Harvey norman in 1995. John has over 30 years’ experience as a chartered accountant.
Other current directorshipsEmerging leaders Investment Limited
Briscoe Group Limited (new Zealand)
Super Retail Group Limited
Slater & Gordon Limited
Former directorships in last three yearsMint Wireless Ltd
Special responsibilitieschair of audit & Risk committee, Member of Remuneration committee and nomination committee
Interests in shares and options410,078 ordinary shares in FlexiGroup Limited
19
FLEXIGROUP LIMITED FInancIaL REPORT 2011
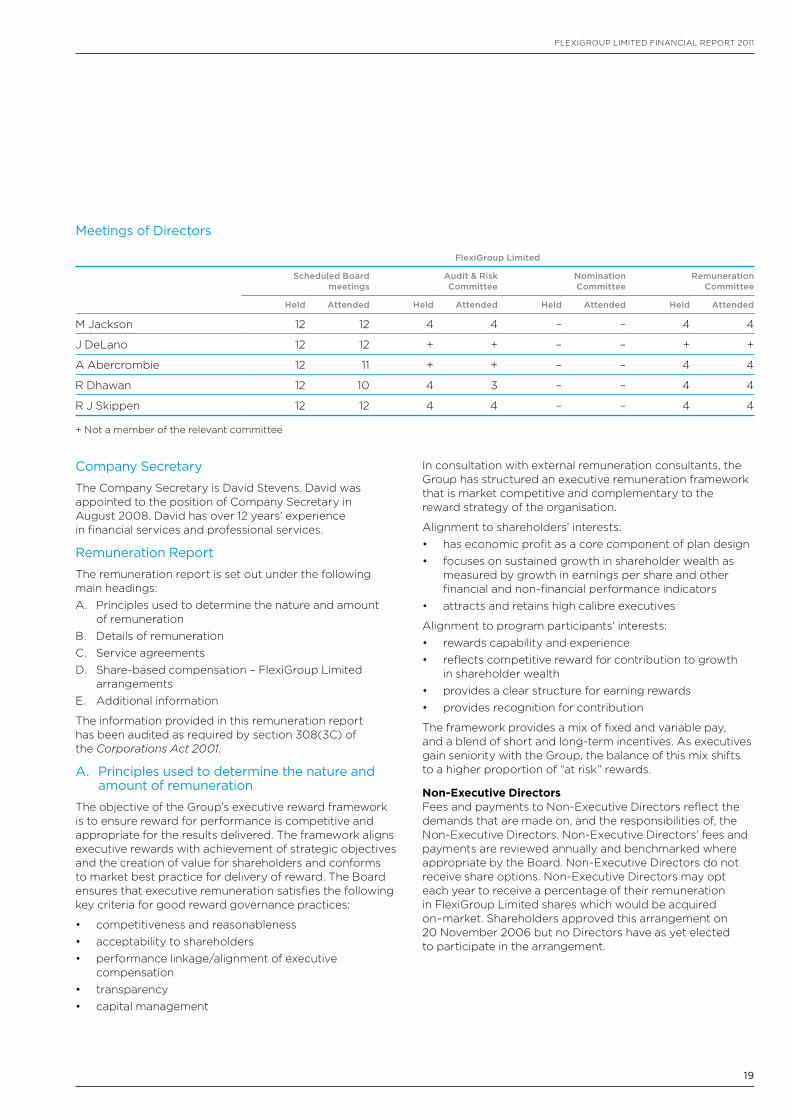
Meetings of Directors
FlexiGroup Limited
Scheduled Board meetings
Audit & Risk Committee
Nomination Committee
Remuneration Committee
Held Attended Held Attended Held Attended Held Attended
M Jackson 12 12 4 4 – – 4 4
J DeLano 12 12 + + – – + +
a abercrombie 12 11 + + – – 4 4
R Dhawan 12 10 4 3 – – 4 4
R J Skippen 12 12 4 4 – – 4 4
+ not a member of the relevant committee
Company Secretary
The company Secretary is David Stevens. David was appointed to the position of company Secretary in august 2008. David has over 12 years’ experience in financial services and professional services.
Remuneration Report
The remuneration report is set out under the following main headings:a. Principles used to determine the nature and amount
of remunerationB. Details of remunerationc. Service agreementsD. Share-based compensation – FlexiGroup Limited
arrangementsE. additional information
The information provided in this remuneration report has been audited as required by section 308(3c) of the Corporations Act 2001.
A. Principles used to determine the nature and amount of remuneration
The objective of the Group’s executive reward framework is to ensure reward for performance is competitive and appropriate for the results delivered. The framework aligns executive rewards with achievement of strategic objectives and the creation of value for shareholders and conforms to market best practice for delivery of reward. The Board ensures that executive remuneration satisfies the following key criteria for good reward governance practices:
• competitiveness and reasonableness• acceptability to shareholders• performance linkage/alignment of executive
compensation• transparency• capital management
In consultation with external remuneration consultants, the Group has structured an executive remuneration framework that is market competitive and complementary to the reward strategy of the organisation.
alignment to shareholders’ interests:• has economic profit as a core component of plan design• focuses on sustained growth in shareholder wealth as
measured by growth in earnings per share and other financial and non-financial performance indicators
• attracts and retains high calibre executives
alignment to program participants’ interests:• rewards capability and experience• reflects competitive reward for contribution to growth
in shareholder wealth• provides a clear structure for earning rewards• provides recognition for contribution
The framework provides a mix of fixed and variable pay, and a blend of short and long-term incentives. as executives gain seniority with the Group, the balance of this mix shifts to a higher proportion of “at risk” rewards.
Non-Executive DirectorsFees and payments to non-Executive Directors reflect the demands that are made on, and the responsibilities of, the non-Executive Directors. non-Executive Directors’ fees and payments are reviewed annually and benchmarked where appropriate by the Board. non-Executive Directors do not receive share options. non-Executive Directors may opt each year to receive a percentage of their remuneration in FlexiGroup Limited shares which would be acquired on–market. Shareholders approved this arrangement on 20 november 2006 but no Directors have as yet elected to participate in the arrangement.
aS aT 30 JUnE 2011
20
Directors’ Report (continued)
Non-Executive Directors’ feesThe current base remuneration was set when the company listed on 12 December 2006. non-Executive Directors’ fees are determined within an aggregate Directors’ fee pool limit of $1.2 million.
The following fee structure has applied since listing:Base fees (per annum)
M Jackson (chairman) $150,000
a abercrombie $120,000
Other non-Executive Directors $80,000
Additional fees (per annum)
audit & Risk committee – chairman $10,000
nomination committee – chairman $10,000
Remuneration committee – chairman $10,000
On 20 July 2011, the Board approved the first increase in 5 years to the non-Executive Directors fees, to apply from 1 July 2011 as follows:Base fees (per annum)
M Jackson (chairman) $250,000
a abercrombie $160,000
Other non-Executive Directors $120,000
Additional fees (per annum)
audit & Risk committee – chairman $25,000
Remuneration committee – chairman $25,000
These increased Director fees from 1 July 2011 remain within the aggregate Directors’ fee pool limit of $1.2 million.
In addition to the above fees, Directors also receive superannuation contributions required under government legislation.
a Director is entitled to reimbursement for reasonable travelling, accommodation and other expenses in attending meetings and carrying out their duties.
Under clause 10.11 of the company’s constitution, subject to the Listing Rules and corporations act, the company may pay a former Director, or the personal representatives of a Director who dies in office, a retirement benefit in recognition of past services of an amount determined by the Directors. The company may also enter into a contract with a Director providing for payment of the retiring benefit. no such contracts have been entered into to date. Despite having this clause in the company’s constitution, the company does not intend to pay such benefits to Directors.
Executive payThe executive pay and reward framework has four components:• base pay and benefits• short-term performance incentives• long-term incentives through participation in
the FlexiGroup Long Term Incentive Plan, and• other remuneration such as superannuation
The combination of these comprises the executive’s total remuneration.
Base payExecutives are offered a competitive salary that comprises the components of base pay and benefits. Base pay for senior executives is reviewed annually by the Remuneration committee to ensure the executive’s pay is competitive with the market. an executive’s pay is also reviewed on promotion.
SuperannuationSuperannuation is provided to employees under the terms of the current federal government legislation.
Short-term performance incentivesShort-term performance incentives (“STIs”) vary according to individual contracts; however for senior executives they are broadly based as follows:• a component of the STI is linked to the individual
performance of the executive (this is based on a number of factors, including performance against budgets, achievement of Key Performance Indicators (“KPIs”) and other personal objectives).
• a component of the STI is linked to the financial performance of the business or measured against budgets determined at the beginning of each financial year.
all STI payments to senior executives are approved by the Remuneration committee and are usually paid in late august or early September of the following financial year.
Using various profit performance targets and personal performance objectives assessed against KPIs, the company ensures variable reward is only paid when value has been created for shareholders.
For middle and lower level management, total STIs are linked to individual performance measures and also to the financial performance of the business.
The short-term bonus payments may be adjusted up or down in line with under or over achievement against the target performance levels. This is at the discretion of the Remuneration committee.
The STI target annual payment is reviewed annually.
Long-term incentivesLong-term incentives to the chief Executive Officer and certain senior employees are provided via the FlexiGroup Long Term Incentive Plan (“LTIP”). Information on the plan is detailed in Section D of this report.
21
FLEXIGROUP LIMITED FInancIaL REPORT 2011
B. Details of remuneration
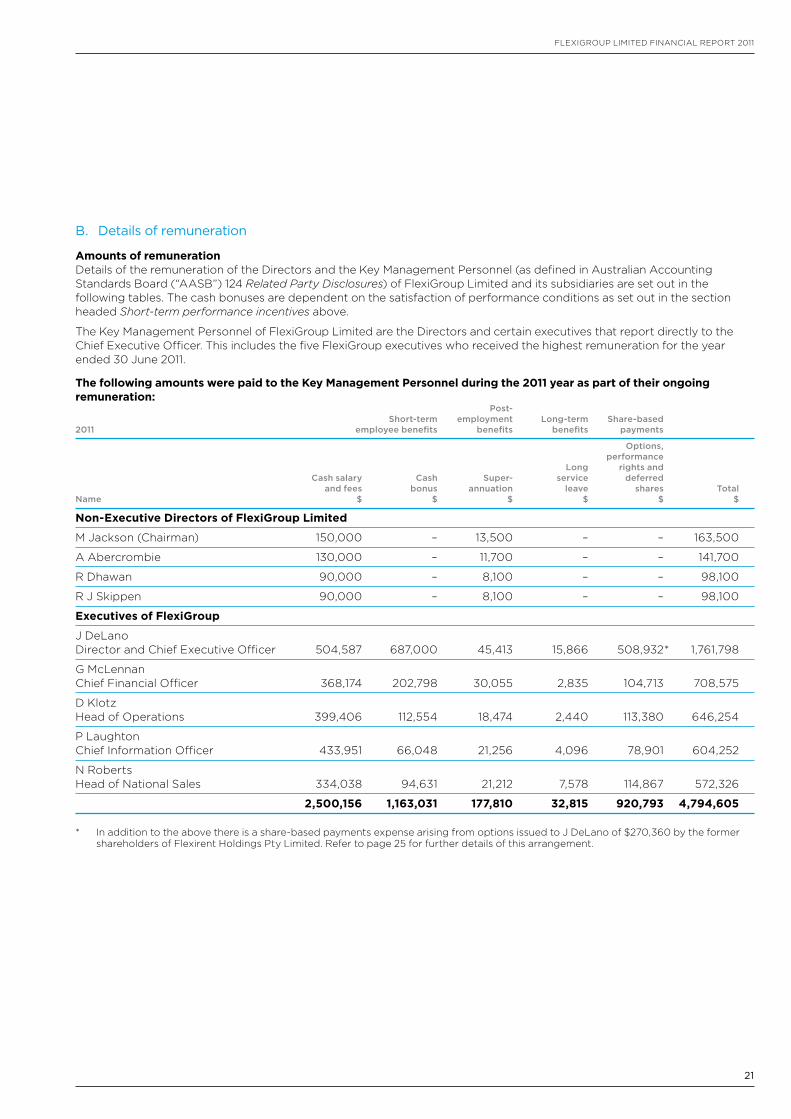
Amounts of remunerationDetails of the remuneration of the Directors and the Key Management Personnel (as defined in australian accounting Standards Board (“aaSB”) 124 Related Party Disclosures) of FlexiGroup Limited and its subsidiaries are set out in the following tables. The cash bonuses are dependent on the satisfaction of performance conditions as set out in the section headed Short-term performance incentives above.
The Key Management Personnel of FlexiGroup Limited are the Directors and certain executives that report directly to the chief Executive Officer. This includes the five FlexiGroup executives who received the highest remuneration for the year ended 30 June 2011.
The following amounts were paid to the Key Management Personnel during the 2011 year as part of their ongoing remuneration: Post- Short-term employment Long-term Share-based 2011 employee benefits benefits benefits payments
Options, performance Long rights and Cash salary Cash Super- service deferred and fees bonus annuation leave shares Total Name $ $ $ $ $ $
Non-Executive Directors of FlexiGroup Limited
M Jackson (chairman) 150,000 – 13,500 – – 163,500
a abercrombie 130,000 – 11,700 – – 141,700
R Dhawan 90,000 – 8,100 – – 98,100
R J Skippen 90,000 – 8,100 – – 98,100
Executives of FlexiGroup
J DeLano Director and chief Executive Officer 504,587 687,000 45,413 15,866 508,932 * 1,761,798
G McLennan chief Financial Officer 368,174 202,798 30,055 2,835 104,713 708,575
D Klotz Head of Operations 399,406 112,554 18,474 2,440 113,380 646,254
P Laughton chief Information Officer 433,951 66,048 21,256 4,096 78,901 604,252
n Roberts Head of national Sales 334,038 94,631 21,212 7,578 114,867 572,326
2,500,156 1,163,031 177,810 32,815 920,793 4,794,605
* In addition to the above there is a share-based payments expense arising from options issued to J DeLano of $270,360 by the former shareholders of Flexirent Holdings Pty Limited. Refer to page 25 for further details of this arrangement.
aS aT 30 JUnE 2011
22
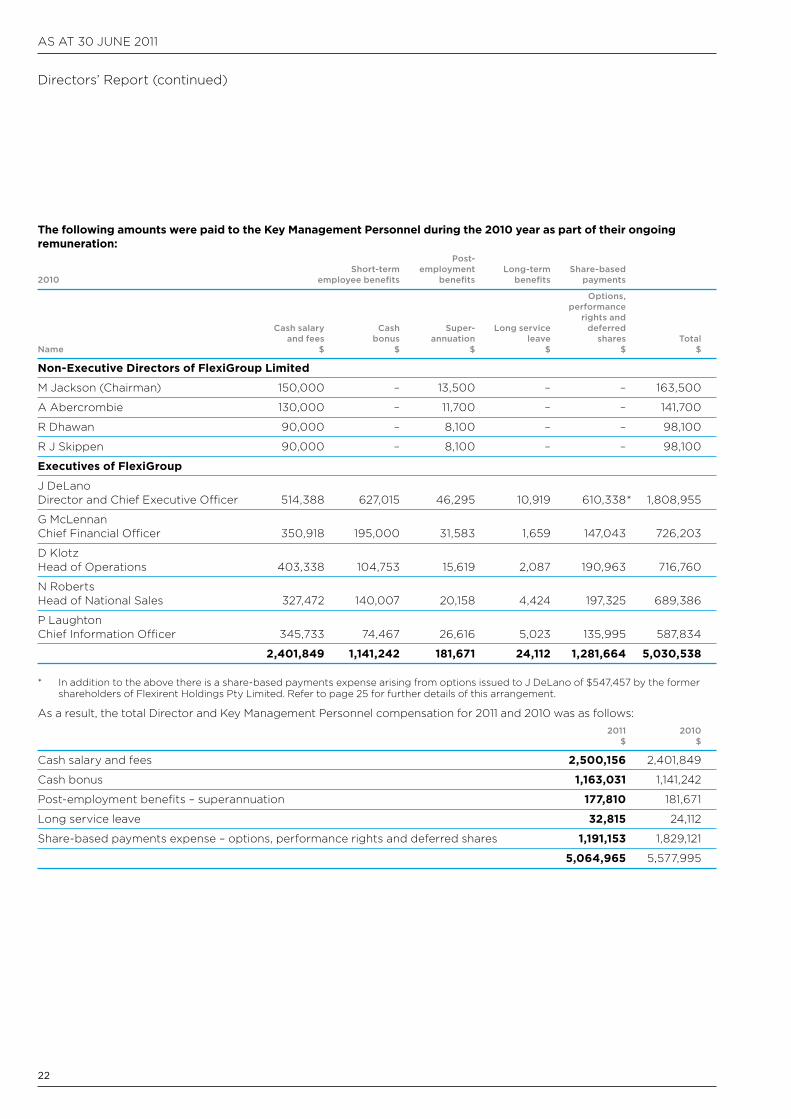
The following amounts were paid to the Key Management Personnel during the 2010 year as part of their ongoing remuneration: Post- Short-term employment Long-term Share-based 2010 employee benefits benefits benefits payments
Options, performance rights and Cash salary Cash Super- Long service deferred and fees bonus annuation leave shares Total Name $ $ $ $ $ $
Non-Executive Directors of FlexiGroup Limited
M Jackson (chairman) 150,000 – 13,500 – – 163,500
a abercrombie 130,000 – 11,700 – – 141,700
R Dhawan 90,000 – 8,100 – – 98,100
R J Skippen 90,000 – 8,100 – – 98,100
Executives of FlexiGroup
J DeLano Director and chief Executive Officer 514,388 627,015 46,295 10,919 610,338 * 1,808,955
G McLennan chief Financial Officer 350,918 195,000 31,583 1,659 147,043 726,203
D Klotz Head of Operations 403,338 104,753 15,619 2,087 190,963 716,760
n Roberts Head of national Sales 327,472 140,007 20,158 4,424 197,325 689,386
P Laughton chief Information Officer 345,733 74,467 26,616 5,023 135,995 587,834
2,401,849 1,141,242 181,671 24,112 1,281,664 5,030,538
* In addition to the above there is a share-based payments expense arising from options issued to J DeLano of $547,457 by the former shareholders of Flexirent Holdings Pty Limited. Refer to page 25 for further details of this arrangement.
as a result, the total Director and Key Management Personnel compensation for 2011 and 2010 was as follows: 2011 2010 $ $
cash salary and fees 2,500,156 2,401,849
cash bonus 1,163,031 1,141,242
Post-employment benefits – superannuation 177,810 181,671
Long service leave 32,815 24,112
Share-based payments expense – options, performance rights and deferred shares 1,191,153 1,829,121
5,064,965 5,577,995
Directors’ Report (continued)
23
FLEXIGROUP LIMITED FInancIaL REPORT 2011
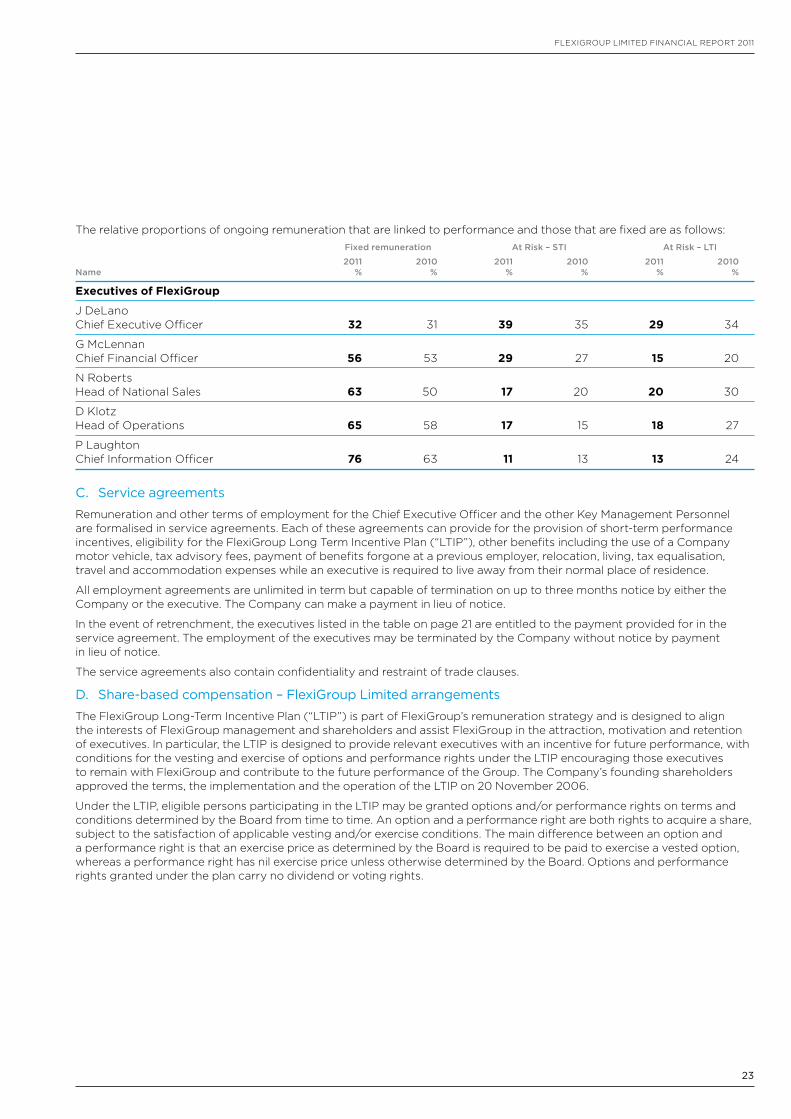
The relative proportions of ongoing remuneration that are linked to performance and those that are fixed are as follows: Fixed remuneration At Risk – STI At Risk – LTI
2011 2010 2011 2010 2011 2010 Name % % % % % %
Executives of FlexiGroup
J DeLano chief Executive Officer 32 31 39 35 29 34
G McLennan chief Financial Officer 56 53 29 27 15 20
n Roberts Head of national Sales 63 50 17 20 20 30
D Klotz Head of Operations 65 58 17 15 18 27
P Laughton chief Information Officer 76 63 11 13 13 24
C. Service agreements
Remuneration and other terms of employment for the chief Executive Officer and the other Key Management Personnel are formalised in service agreements. Each of these agreements can provide for the provision of short-term performance incentives, eligibility for the FlexiGroup Long Term Incentive Plan (“LTIP”), other benefits including the use of a company motor vehicle, tax advisory fees, payment of benefits forgone at a previous employer, relocation, living, tax equalisation, travel and accommodation expenses while an executive is required to live away from their normal place of residence.
all employment agreements are unlimited in term but capable of termination on up to three months notice by either the company or the executive. The company can make a payment in lieu of notice.
In the event of retrenchment, the executives listed in the table on page 21 are entitled to the payment provided for in the service agreement. The employment of the executives may be terminated by the company without notice by payment in lieu of notice.
The service agreements also contain confidentiality and restraint of trade clauses.
D. Share-based compensation – FlexiGroup Limited arrangements
The FlexiGroup Long-Term Incentive Plan (“LTIP”) is part of FlexiGroup’s remuneration strategy and is designed to align the interests of FlexiGroup management and shareholders and assist FlexiGroup in the attraction, motivation and retention of executives. In particular, the LTIP is designed to provide relevant executives with an incentive for future performance, with conditions for the vesting and exercise of options and performance rights under the LTIP encouraging those executives to remain with FlexiGroup and contribute to the future performance of the Group. The company’s founding shareholders approved the terms, the implementation and the operation of the LTIP on 20 november 2006.
Under the LTIP, eligible persons participating in the LTIP may be granted options and/or performance rights on terms and conditions determined by the Board from time to time. an option and a performance right are both rights to acquire a share, subject to the satisfaction of applicable vesting and/or exercise conditions. The main difference between an option and a performance right is that an exercise price as determined by the Board is required to be paid to exercise a vested option, whereas a performance right has nil exercise price unless otherwise determined by the Board. Options and performance rights granted under the plan carry no dividend or voting rights.
aS aT 30 JUnE 2011
24
The Board is responsible for administering the LTIP in accordance with the LTIP Rules and the terms and conditions of specific grants of options and/or performance rights to participants in the LTIP.
The Board may determine which persons will be eligible to participate in the LTIP from time to time. Eligible persons may be invited to apply to participate in the LTIP. The Board may in its discretion accept such applications.
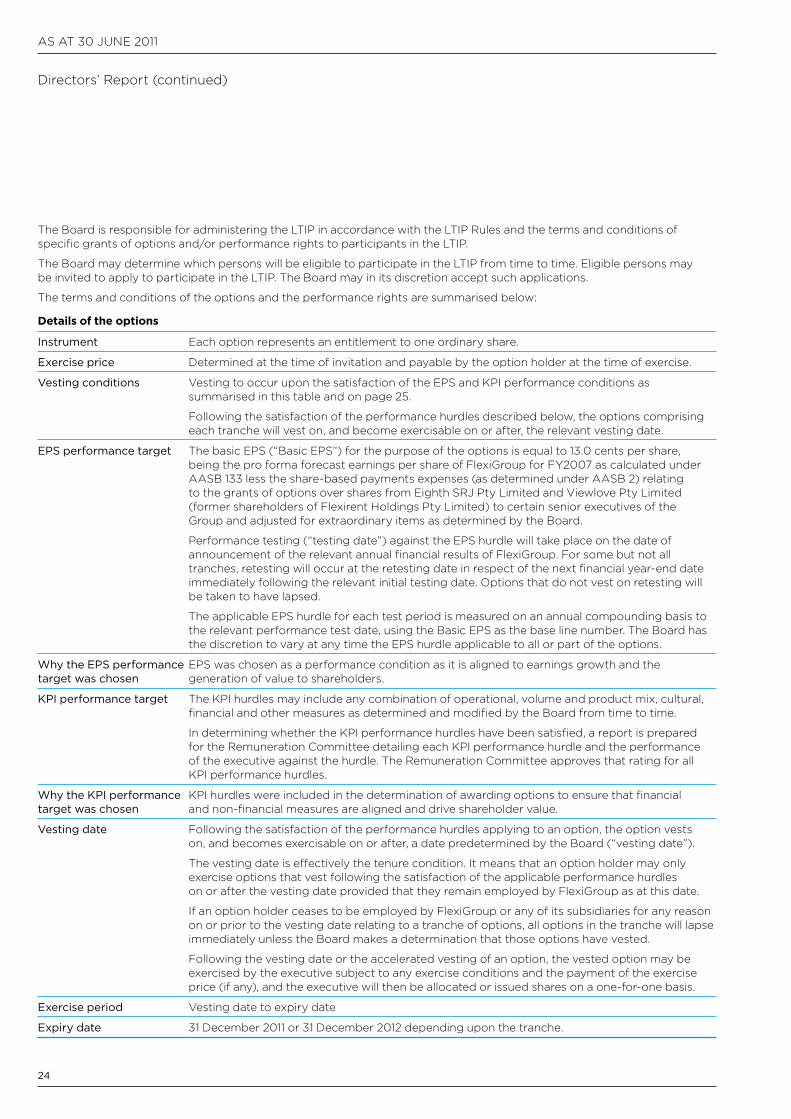
The terms and conditions of the options and the performance rights are summarised below:
Details of the options
Instrument Each option represents an entitlement to one ordinary share.
Exercise price Determined at the time of invitation and payable by the option holder at the time of exercise.
Vesting conditions Vesting to occur upon the satisfaction of the EPS and KPI performance conditions as summarised in this table and on page 25.
Following the satisfaction of the performance hurdles described below, the options comprising each tranche will vest on, and become exercisable on or after, the relevant vesting date.
EPS performance target The basic EPS (“Basic EPS”) for the purpose of the options is equal to 13.0 cents per share, being the pro forma forecast earnings per share of FlexiGroup for FY2007 as calculated under aaSB 133 less the share-based payments expenses (as determined under aaSB 2) relating to the grants of options over shares from Eighth SRJ Pty Limited and Viewlove Pty Limited (former shareholders of Flexirent Holdings Pty Limited) to certain senior executives of the Group and adjusted for extraordinary items as determined by the Board.
Performance testing (“testing date”) against the EPS hurdle will take place on the date of announcement of the relevant annual financial results of FlexiGroup. For some but not all tranches, retesting will occur at the retesting date in respect of the next financial year-end date immediately following the relevant initial testing date. Options that do not vest on retesting will be taken to have lapsed.
The applicable EPS hurdle for each test period is measured on an annual compounding basis to the relevant performance test date, using the Basic EPS as the base line number. The Board has the discretion to vary at any time the EPS hurdle applicable to all or part of the options.
Why the EPS performance target was chosen
EPS was chosen as a performance condition as it is aligned to earnings growth and the generation of value to shareholders.
KPI performance target The KPI hurdles may include any combination of operational, volume and product mix, cultural, financial and other measures as determined and modified by the Board from time to time.
In determining whether the KPI performance hurdles have been satisfied, a report is prepared for the Remuneration committee detailing each KPI performance hurdle and the performance of the executive against the hurdle. The Remuneration committee approves that rating for all KPI performance hurdles.
Why the KPI performance target was chosen
KPI hurdles were included in the determination of awarding options to ensure that financial and non-financial measures are aligned and drive shareholder value.
Vesting date Following the satisfaction of the performance hurdles applying to an option, the option vests on, and becomes exercisable on or after, a date predetermined by the Board (“vesting date”).
The vesting date is effectively the tenure condition. It means that an option holder may only exercise options that vest following the satisfaction of the applicable performance hurdles on or after the vesting date provided that they remain employed by FlexiGroup as at this date.
If an option holder ceases to be employed by FlexiGroup or any of its subsidiaries for any reason on or prior to the vesting date relating to a tranche of options, all options in the tranche will lapse immediately unless the Board makes a determination that those options have vested.
Following the vesting date or the accelerated vesting of an option, the vested option may be exercised by the executive subject to any exercise conditions and the payment of the exercise price (if any), and the executive will then be allocated or issued shares on a one-for-one basis.
Exercise period Vesting date to expiry date
Expiry date 31 December 2011 or 31 December 2012 depending upon the tranche.
Directors’ Report (continued)
25
FLEXIGROUP LIMITED FInancIaL REPORT 2011
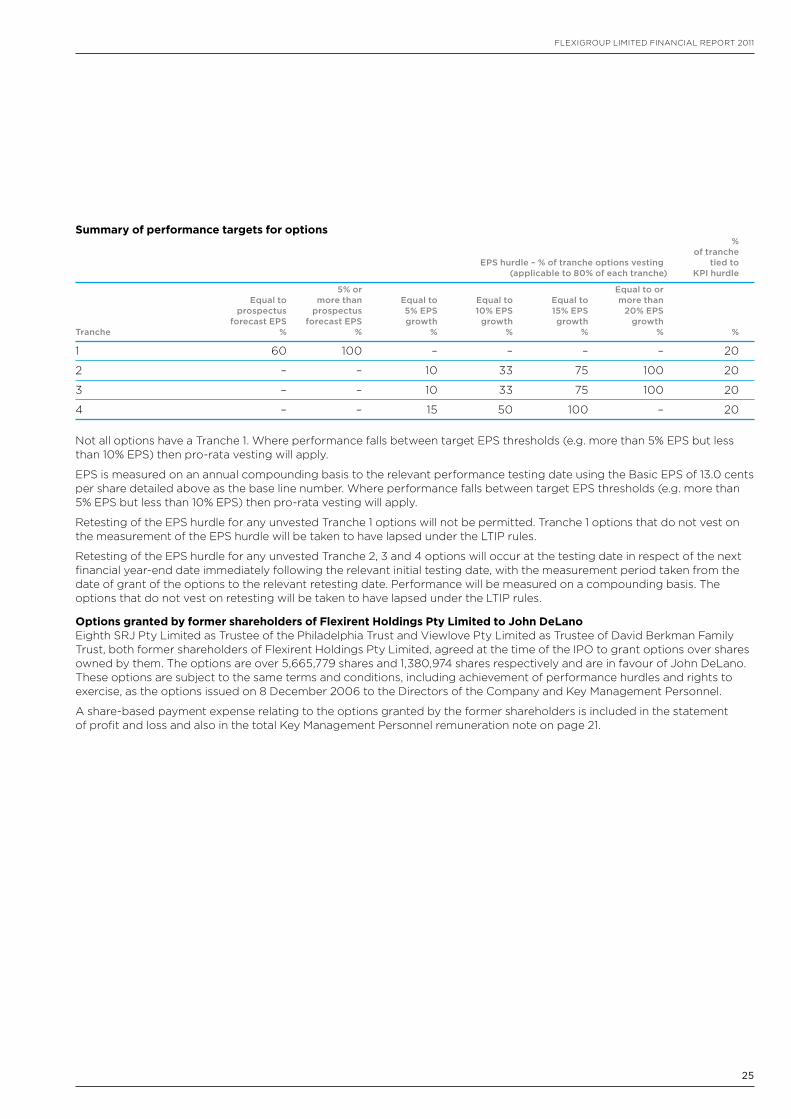
Summary of performance targets for options % of tranche EPS hurdle – % of tranche options vesting tied to (applicable to 80% of each tranche) KPI hurdle
5% or Equal to or Equal to more than Equal to Equal to Equal to more than prospectus prospectus 5% EPS 10% EPS 15% EPS 20% EPS forecast EPS forecast EPS growth growth growth growth Tranche % % % % % % %
1 60 100 – – – – 20
2 – – 10 33 75 100 20
3 – – 10 33 75 100 20
4 – – 15 50 100 – 20
not all options have a Tranche 1. Where performance falls between target EPS thresholds (e.g. more than 5% EPS but less than 10% EPS) then pro-rata vesting will apply.
EPS is measured on an annual compounding basis to the relevant performance testing date using the Basic EPS of 13.0 cents per share detailed above as the base line number. Where performance falls between target EPS thresholds (e.g. more than 5% EPS but less than 10% EPS) then pro-rata vesting will apply.
Retesting of the EPS hurdle for any unvested Tranche 1 options will not be permitted. Tranche 1 options that do not vest on the measurement of the EPS hurdle will be taken to have lapsed under the LTIP rules.
Retesting of the EPS hurdle for any unvested Tranche 2, 3 and 4 options will occur at the testing date in respect of the next financial year-end date immediately following the relevant initial testing date, with the measurement period taken from the date of grant of the options to the relevant retesting date. Performance will be measured on a compounding basis. The options that do not vest on retesting will be taken to have lapsed under the LTIP rules.
Options granted by former shareholders of Flexirent Holdings Pty Limited to John DeLanoEighth SRJ Pty Limited as Trustee of the Philadelphia Trust and Viewlove Pty Limited as Trustee of David Berkman Family Trust, both former shareholders of Flexirent Holdings Pty Limited, agreed at the time of the IPO to grant options over shares owned by them. The options are over 5,665,779 shares and 1,380,974 shares respectively and are in favour of John DeLano. These options are subject to the same terms and conditions, including achievement of performance hurdles and rights to exercise, as the options issued on 8 December 2006 to the Directors of the company and Key Management Personnel.
a share-based payment expense relating to the options granted by the former shareholders is included in the statement of profit and loss and also in the total Key Management Personnel remuneration note on page 21.
aS aT 30 JUnE 2011
26
Directors’ Report (continued)
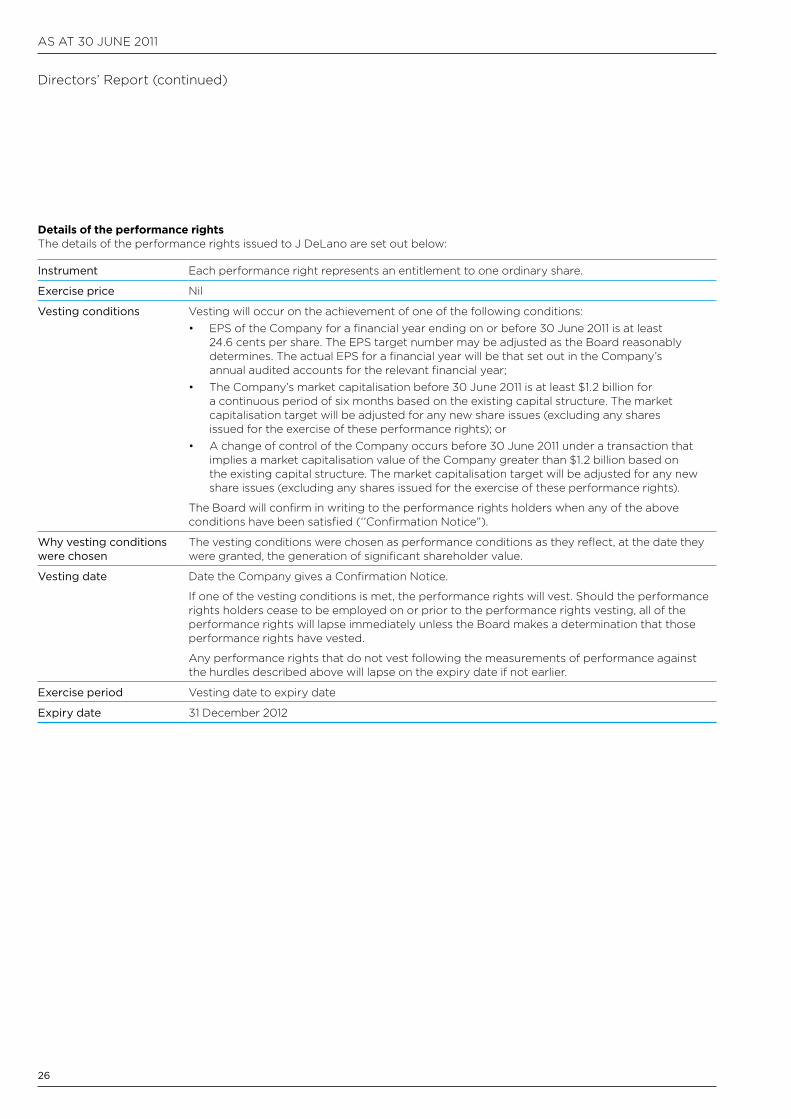
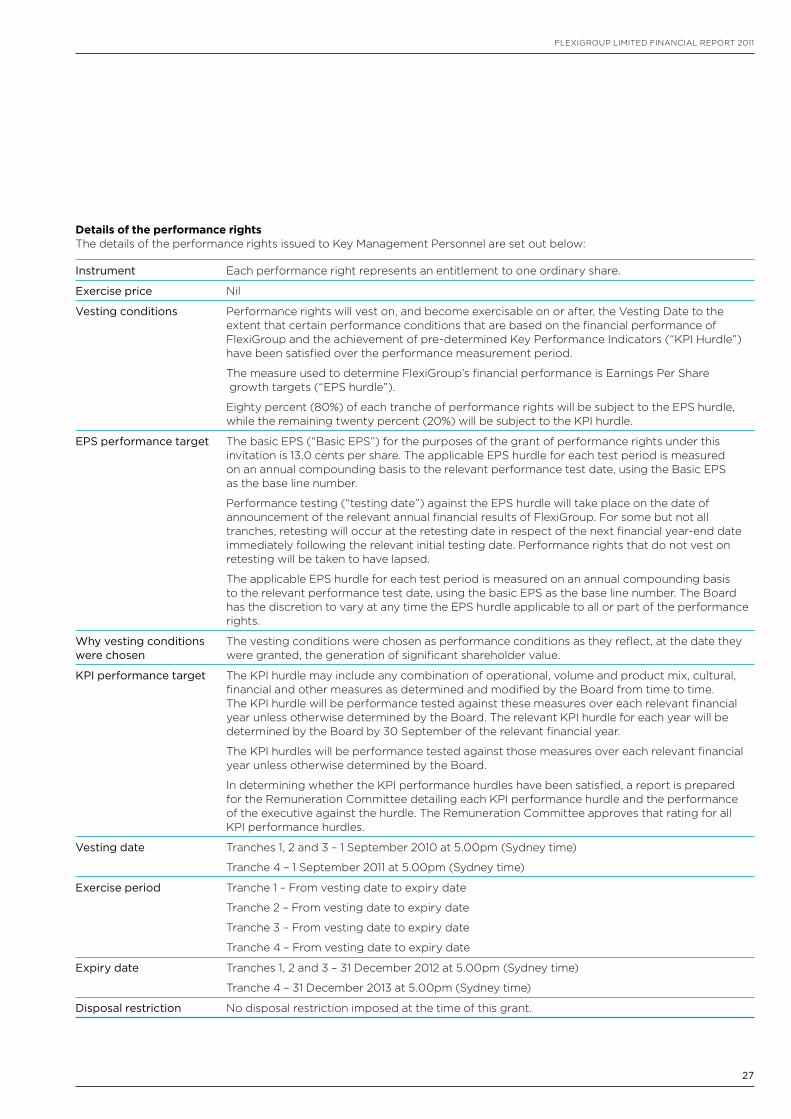
Details of the performance rightsThe details of the performance rights issued to J DeLano are set out below:
Instrument Each performance right represents an entitlement to one ordinary share.
Exercise price nil
Vesting conditions Vesting will occur on the achievement of one of the following conditions:• EPS of the company for a financial year ending on or before 30 June 2011 is at least
24.6 cents per share. The EPS target number may be adjusted as the Board reasonably determines. The actual EPS for a financial year will be that set out in the company’s annual audited accounts for the relevant financial year;
• The company’s market capitalisation before 30 June 2011 is at least $1.2 billion for a continuous period of six months based on the existing capital structure. The market capitalisation target will be adjusted for any new share issues (excluding any shares issued for the exercise of these performance rights); or
• a change of control of the company occurs before 30 June 2011 under a transaction that implies a market capitalisation value of the company greater than $1.2 billion based on the existing capital structure. The market capitalisation target will be adjusted for any new share issues (excluding any shares issued for the exercise of these performance rights).
The Board will confirm in writing to the performance rights holders when any of the above conditions have been satisfied (‘’confirmation notice”).
Why vesting conditions were chosen
The vesting conditions were chosen as performance conditions as they reflect, at the date they were granted, the generation of significant shareholder value.
Vesting date Date the company gives a confirmation notice.
If one of the vesting conditions is met, the performance rights will vest. Should the performance rights holders cease to be employed on or prior to the performance rights vesting, all of the performance rights will lapse immediately unless the Board makes a determination that those performance rights have vested.
any performance rights that do not vest following the measurements of performance against the hurdles described above will lapse on the expiry date if not earlier.
Exercise period Vesting date to expiry date
Expiry date 31 December 2012
27
FLEXIGROUP LIMITED FInancIaL REPORT 2011
Details of the performance rightsThe details of the performance rights issued to Key Management Personnel are set out below:
Instrument Each performance right represents an entitlement to one ordinary share.
Exercise price nil
Vesting conditions Performance rights will vest on, and become exercisable on or after, the Vesting Date to the extent that certain performance conditions that are based on the financial performance of FlexiGroup and the achievement of pre-determined Key Performance Indicators (“KPI Hurdle”) have been satisfied over the performance measurement period.
The measure used to determine FlexiGroup’s financial performance is Earnings Per Share growth targets (“EPS hurdle”).
Eighty percent (80%) of each tranche of performance rights will be subject to the EPS hurdle, while the remaining twenty percent (20%) will be subject to the KPI hurdle.
EPS performance target The basic EPS (“Basic EPS”) for the purposes of the grant of performance rights under this invitation is 13.0 cents per share. The applicable EPS hurdle for each test period is measured on an annual compounding basis to the relevant performance test date, using the Basic EPS as the base line number.
Performance testing (“testing date”) against the EPS hurdle will take place on the date of announcement of the relevant annual financial results of FlexiGroup. For some but not all tranches, retesting will occur at the retesting date in respect of the next financial year-end date immediately following the relevant initial testing date. Performance rights that do not vest on retesting will be taken to have lapsed.
The applicable EPS hurdle for each test period is measured on an annual compounding basis to the relevant performance test date, using the basic EPS as the base line number. The Board has the discretion to vary at any time the EPS hurdle applicable to all or part of the performance rights.
Why vesting conditions were chosen
The vesting conditions were chosen as performance conditions as they reflect, at the date they were granted, the generation of significant shareholder value.
KPI performance target The KPI hurdle may include any combination of operational, volume and product mix, cultural, financial and other measures as determined and modified by the Board from time to time. The KPI hurdle will be performance tested against these measures over each relevant financial year unless otherwise determined by the Board. The relevant KPI hurdle for each year will be determined by the Board by 30 September of the relevant financial year.
The KPI hurdles will be performance tested against those measures over each relevant financial year unless otherwise determined by the Board.
In determining whether the KPI performance hurdles have been satisfied, a report is prepared for the Remuneration committee detailing each KPI performance hurdle and the performance of the executive against the hurdle. The Remuneration committee approves that rating for all KPI performance hurdles.
Vesting date Tranches 1, 2 and 3 – 1 September 2010 at 5.00pm (Sydney time)
Tranche 4 – 1 September 2011 at 5.00pm (Sydney time)
Exercise period Tranche 1 – From vesting date to expiry date
Tranche 2 – From vesting date to expiry date
Tranche 3 – From vesting date to expiry date
Tranche 4 – From vesting date to expiry date
Expiry date Tranches 1, 2 and 3 – 31 December 2012 at 5.00pm (Sydney time)
Tranche 4 – 31 December 2013 at 5.00pm (Sydney time)
Disposal restriction no disposal restriction imposed at the time of this grant.
aS aT 30 JUnE 2011
28
Directors’ Report (continued)
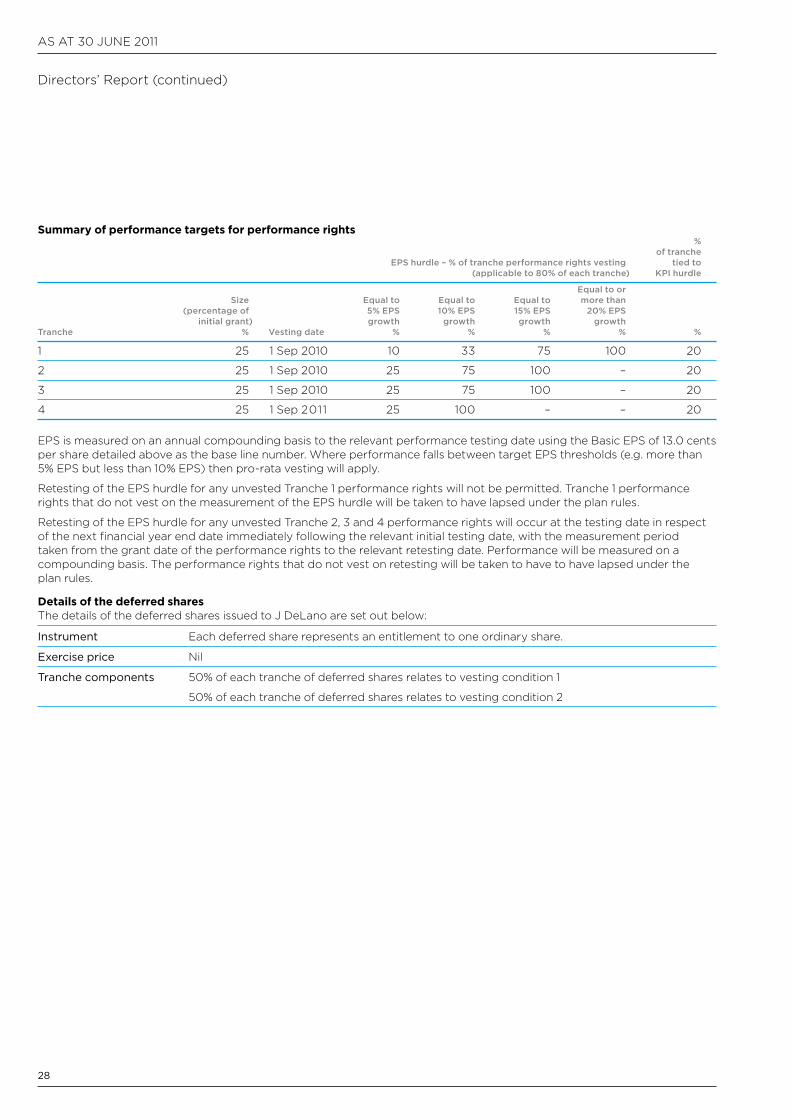
Summary of performance targets for performance rights % of tranche EPS hurdle – % of tranche performance rights vesting tied to (applicable to 80% of each tranche) KPI hurdle
Equal to or Size Equal to Equal to Equal to more than (percentage of 5% EPS 10% EPS 15% EPS 20% EPS initial grant) growth growth growth growth Tranche % Vesting date % % % % %
1 25 1 Sep 2010 10 33 75 100 20
2 25 1 Sep 2010 25 75 100 – 20
3 25 1 Sep 2010 25 75 100 – 20
4 25 1 Sep 2011 25 100 – – 20
EPS is measured on an annual compounding basis to the relevant performance testing date using the Basic EPS of 13.0 cents per share detailed above as the base line number. Where performance falls between target EPS thresholds (e.g. more than 5% EPS but less than 10% EPS) then pro-rata vesting will apply.
Retesting of the EPS hurdle for any unvested Tranche 1 performance rights will not be permitted. Tranche 1 performance rights that do not vest on the measurement of the EPS hurdle will be taken to have lapsed under the plan rules.
Retesting of the EPS hurdle for any unvested Tranche 2, 3 and 4 performance rights will occur at the testing date in respect of the next financial year end date immediately following the relevant initial testing date, with the measurement period taken from the grant date of the performance rights to the relevant retesting date. Performance will be measured on a compounding basis. The performance rights that do not vest on retesting will be taken to have to have lapsed under the plan rules.
Details of the deferred sharesThe details of the deferred shares issued to J DeLano are set out below:
Instrument Each deferred share represents an entitlement to one ordinary share.
Exercise price nil
Tranche components 50% of each tranche of deferred shares relates to vesting condition 1
50% of each tranche of deferred shares relates to vesting condition 2
29
FLEXIGROUP LIMITED FInancIaL REPORT 2011
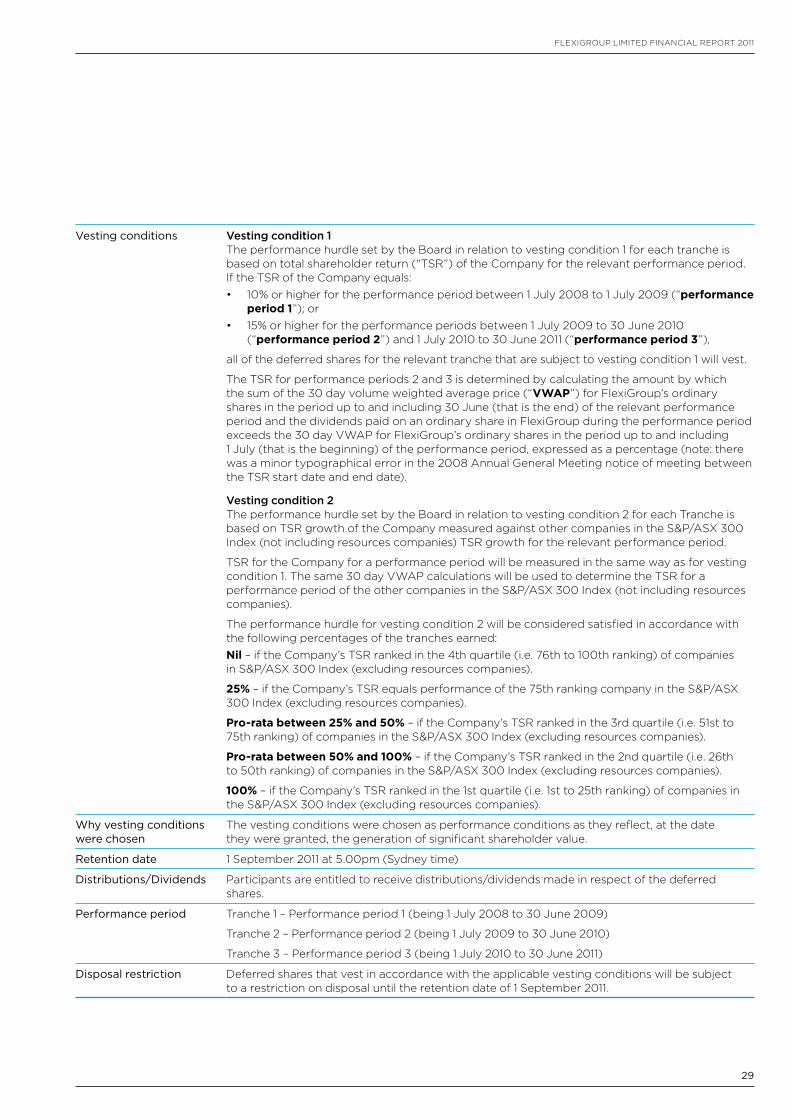
Vesting conditions Vesting condition 1The performance hurdle set by the Board in relation to vesting condition 1 for each tranche is based on total shareholder return (“TSR”) of the company for the relevant performance period. If the TSR of the company equals:• 10% or higher for the performance period between 1 July 2008 to 1 July 2009 (“performance
period 1”); or• 15% or higher for the performance periods between 1 July 2009 to 30 June 2010
(“performance period 2”) and 1 July 2010 to 30 June 2011 (“performance period 3”),
all of the deferred shares for the relevant tranche that are subject to vesting condition 1 will vest.
The TSR for performance periods 2 and 3 is determined by calculating the amount by which the sum of the 30 day volume weighted average price (“VWAP”) for FlexiGroup’s ordinary shares in the period up to and including 30 June (that is the end) of the relevant performance period and the dividends paid on an ordinary share in FlexiGroup during the performance period exceeds the 30 day VWaP for FlexiGroup’s ordinary shares in the period up to and including 1 July (that is the beginning) of the performance period, expressed as a percentage (note: there was a minor typographical error in the 2008 annual General Meeting notice of meeting between the TSR start date and end date).
Vesting condition 2The performance hurdle set by the Board in relation to vesting condition 2 for each Tranche is based on TSR growth of the company measured against other companies in the S&P/aSX 300 Index (not including resources companies) TSR growth for the relevant performance period.
TSR for the company for a performance period will be measured in the same way as for vesting condition 1. The same 30 day VWaP calculations will be used to determine the TSR for a performance period of the other companies in the S&P/aSX 300 Index (not including resources companies).
The performance hurdle for vesting condition 2 will be considered satisfied in accordance with the following percentages of the tranches earned:Nil – if the company’s TSR ranked in the 4th quartile (i.e. 76th to 100th ranking) of companies in S&P/aSX 300 Index (excluding resources companies).
25% – if the company’s TSR equals performance of the 75th ranking company in the S&P/aSX 300 Index (excluding resources companies).
Pro-rata between 25% and 50% – if the company’s TSR ranked in the 3rd quartile (i.e. 51st to 75th ranking) of companies in the S&P/aSX 300 Index (excluding resources companies).
Pro-rata between 50% and 100% – if the company’s TSR ranked in the 2nd quartile (i.e. 26th to 50th ranking) of companies in the S&P/aSX 300 Index (excluding resources companies).
100% – if the company’s TSR ranked in the 1st quartile (i.e. 1st to 25th ranking) of companies in the S&P/aSX 300 Index (excluding resources companies).
Why vesting conditions were chosen
The vesting conditions were chosen as performance conditions as they reflect, at the date they were granted, the generation of significant shareholder value.
Retention date 1 September 2011 at 5.00pm (Sydney time)
Distributions/Dividends Participants are entitled to receive distributions/dividends made in respect of the deferred shares.
Performance period Tranche 1 – Performance period 1 (being 1 July 2008 to 30 June 2009)
Tranche 2 – Performance period 2 (being 1 July 2009 to 30 June 2010)
Tranche 3 – Performance period 3 (being 1 July 2010 to 30 June 2011)
Disposal restriction Deferred shares that vest in accordance with the applicable vesting conditions will be subject to a restriction on disposal until the retention date of 1 September 2011.
aS aT 30 JUnE 2011
30
Directors’ Report (continued)
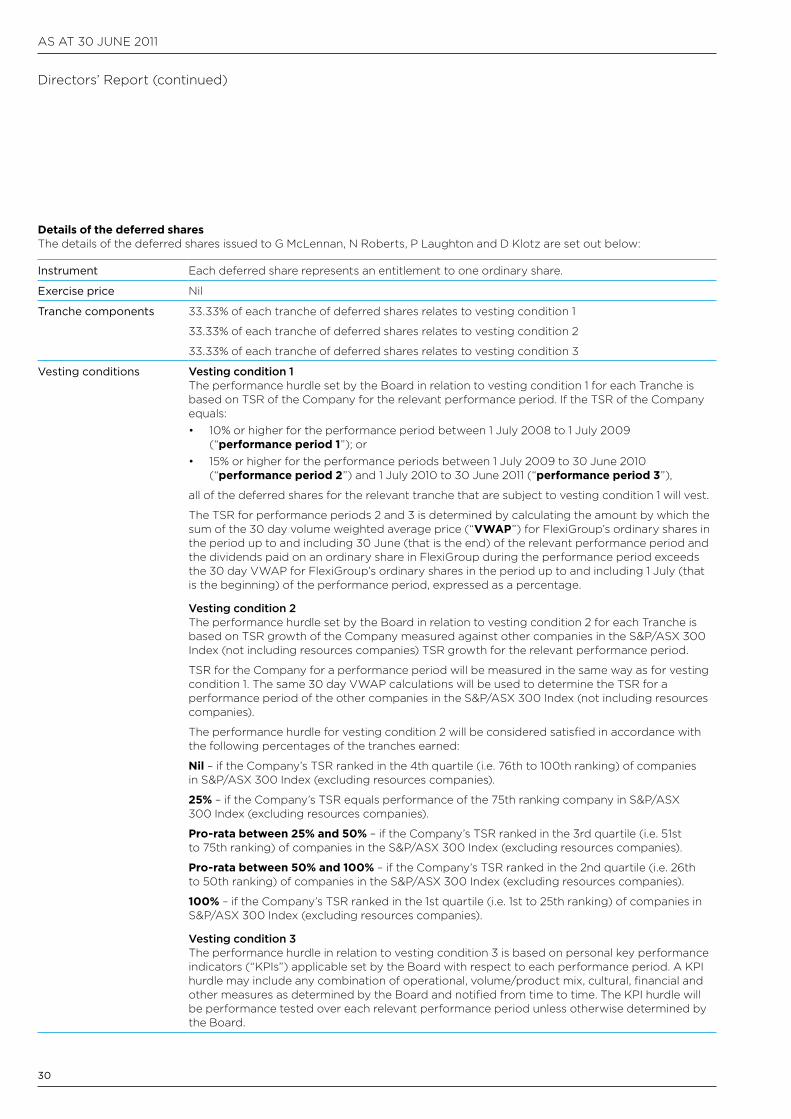
Details of the deferred sharesThe details of the deferred shares issued to G McLennan, n Roberts, P Laughton and D Klotz are set out below:
Instrument Each deferred share represents an entitlement to one ordinary share.
Exercise price nil
Tranche components 33.33% of each tranche of deferred shares relates to vesting condition 1
33.33% of each tranche of deferred shares relates to vesting condition 2
33.33% of each tranche of deferred shares relates to vesting condition 3
Vesting conditions Vesting condition 1The performance hurdle set by the Board in relation to vesting condition 1 for each Tranche is based on TSR of the company for the relevant performance period. If the TSR of the company equals:• 10% or higher for the performance period between 1 July 2008 to 1 July 2009
(“performance period 1”); or• 15% or higher for the performance periods between 1 July 2009 to 30 June 2010
(“performance period 2”) and 1 July 2010 to 30 June 2011 (“performance period 3”),
all of the deferred shares for the relevant tranche that are subject to vesting condition 1 will vest.
The TSR for performance periods 2 and 3 is determined by calculating the amount by which the sum of the 30 day volume weighted average price (“VWAP”) for FlexiGroup’s ordinary shares in the period up to and including 30 June (that is the end) of the relevant performance period and the dividends paid on an ordinary share in FlexiGroup during the performance period exceeds the 30 day VWaP for FlexiGroup’s ordinary shares in the period up to and including 1 July (that is the beginning) of the performance period, expressed as a percentage.
Vesting condition 2The performance hurdle set by the Board in relation to vesting condition 2 for each Tranche is based on TSR growth of the company measured against other companies in the S&P/aSX 300 Index (not including resources companies) TSR growth for the relevant performance period.
TSR for the company for a performance period will be measured in the same way as for vesting condition 1. The same 30 day VWaP calculations will be used to determine the TSR for a performance period of the other companies in the S&P/aSX 300 Index (not including resources companies).
The performance hurdle for vesting condition 2 will be considered satisfied in accordance with the following percentages of the tranches earned:
Nil – if the company’s TSR ranked in the 4th quartile (i.e. 76th to 100th ranking) of companies in S&P/aSX 300 Index (excluding resources companies).
25% – if the company’s TSR equals performance of the 75th ranking company in S&P/aSX 300 Index (excluding resources companies).
Pro-rata between 25% and 50% – if the company’s TSR ranked in the 3rd quartile (i.e. 51st to 75th ranking) of companies in the S&P/aSX 300 Index (excluding resources companies).
Pro-rata between 50% and 100% – if the company’s TSR ranked in the 2nd quartile (i.e. 26th to 50th ranking) of companies in the S&P/aSX 300 Index (excluding resources companies).
100% – if the company’s TSR ranked in the 1st quartile (i.e. 1st to 25th ranking) of companies in S&P/aSX 300 Index (excluding resources companies).
Vesting condition 3The performance hurdle in relation to vesting condition 3 is based on personal key performance indicators (“KPIs”) applicable set by the Board with respect to each performance period. a KPI hurdle may include any combination of operational, volume/product mix, cultural, financial and other measures as determined by the Board and notified from time to time. The KPI hurdle will be performance tested over each relevant performance period unless otherwise determined by the Board.
31
FLEXIGROUP LIMITED FInancIaL REPORT 2011
Why vesting conditions were chosen
The vesting conditions were chosen as performance conditions as they reflect, at the date they were granted, the generation of significant shareholder value.
Retention date 1 September 2011 at 5.00pm (Sydney time)
Distributions/Dividends Participants are entitled to receive distributions/dividends made in respect of the deferred shares.
Performance period Tranche 1 – Performance period 1 (being 1 July 2008 to 30 June 2009)
Tranche 2 – Performance period 2 (being 1 July 2009 to 30 June 2010)
Tranche 3 – Performance period 3 (being 1 July 2010 to 30 June 2011)
Disposal restriction Deferred shares that vest in accordance with the applicable vesting conditions will be subject to a restriction on disposal until the retention date of 1 September 2011.
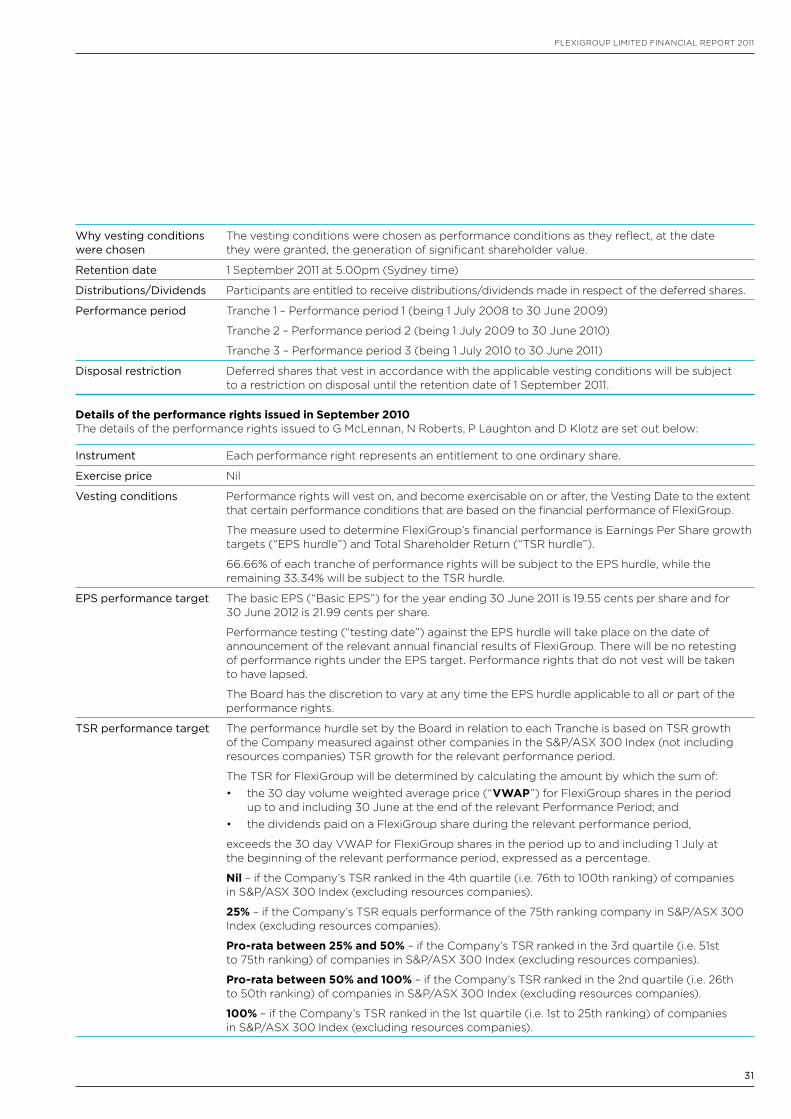
Details of the performance rights issued in September 2010The details of the performance rights issued to G McLennan, n Roberts, P Laughton and D Klotz are set out below:
Instrument Each performance right represents an entitlement to one ordinary share.
Exercise price nil
Vesting conditions Performance rights will vest on, and become exercisable on or after, the Vesting Date to the extent that certain performance conditions that are based on the financial performance of FlexiGroup.
The measure used to determine FlexiGroup’s financial performance is Earnings Per Share growth targets (“EPS hurdle”) and Total Shareholder Return (“TSR hurdle”).
66.66% of each tranche of performance rights will be subject to the EPS hurdle, while the remaining 33.34% will be subject to the TSR hurdle.
EPS performance target The basic EPS (“Basic EPS”) for the year ending 30 June 2011 is 19.55 cents per share and for 30 June 2012 is 21.99 cents per share.
Performance testing (“testing date”) against the EPS hurdle will take place on the date of announcement of the relevant annual financial results of FlexiGroup. There will be no retesting of performance rights under the EPS target. Performance rights that do not vest will be taken to have lapsed.
The Board has the discretion to vary at any time the EPS hurdle applicable to all or part of the performance rights.
TSR performance target The performance hurdle set by the Board in relation to each Tranche is based on TSR growth of the company measured against other companies in the S&P/aSX 300 Index (not including resources companies) TSR growth for the relevant performance period.
The TSR for FlexiGroup will be determined by calculating the amount by which the sum of:• the 30 day volume weighted average price (“VWAP”) for FlexiGroup shares in the period
up to and including 30 June at the end of the relevant Performance Period; and• the dividends paid on a FlexiGroup share during the relevant performance period,
exceeds the 30 day VWaP for FlexiGroup shares in the period up to and including 1 July at the beginning of the relevant performance period, expressed as a percentage.
Nil – if the company’s TSR ranked in the 4th quartile (i.e. 76th to 100th ranking) of companies in S&P/aSX 300 Index (excluding resources companies).
25% – if the company’s TSR equals performance of the 75th ranking company in S&P/aSX 300 Index (excluding resources companies).
Pro-rata between 25% and 50% – if the company’s TSR ranked in the 3rd quartile (i.e. 51st to 75th ranking) of companies in S&P/aSX 300 Index (excluding resources companies).
Pro-rata between 50% and 100% – if the company’s TSR ranked in the 2nd quartile (i.e. 26th to 50th ranking) of companies in S&P/aSX 300 Index (excluding resources companies).
100% – if the company’s TSR ranked in the 1st quartile (i.e. 1st to 25th ranking) of companies in S&P/aSX 300 Index (excluding resources companies).
aS aT 30 JUnE 2011
32
Directors’ Report (continued)
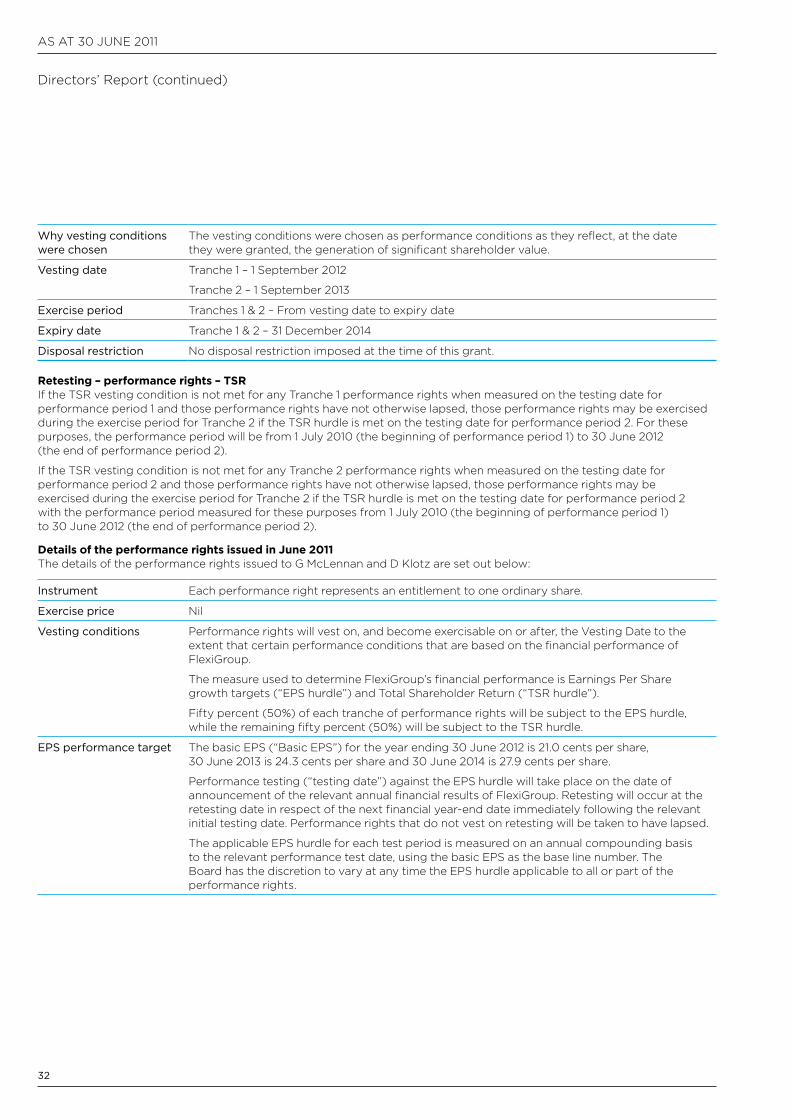
Why vesting conditions were chosen
The vesting conditions were chosen as performance conditions as they reflect, at the date they were granted, the generation of significant shareholder value.
Vesting date Tranche 1 – 1 September 2012
Tranche 2 – 1 September 2013
Exercise period Tranches 1 & 2 – From vesting date to expiry date
Expiry date Tranche 1 & 2 – 31 December 2014
Disposal restriction no disposal restriction imposed at the time of this grant.
Retesting – performance rights – TSRIf the TSR vesting condition is not met for any Tranche 1 performance rights when measured on the testing date for performance period 1 and those performance rights have not otherwise lapsed, those performance rights may be exercised during the exercise period for Tranche 2 if the TSR hurdle is met on the testing date for performance period 2. For these purposes, the performance period will be from 1 July 2010 (the beginning of performance period 1) to 30 June 2012 (the end of performance period 2).
If the TSR vesting condition is not met for any Tranche 2 performance rights when measured on the testing date for performance period 2 and those performance rights have not otherwise lapsed, those performance rights may be exercised during the exercise period for Tranche 2 if the TSR hurdle is met on the testing date for performance period 2 with the performance period measured for these purposes from 1 July 2010 (the beginning of performance period 1) to 30 June 2012 (the end of performance period 2).
Details of the performance rights issued in June 2011The details of the performance rights issued to G McLennan and D Klotz are set out below:
Instrument Each performance right represents an entitlement to one ordinary share.
Exercise price nil
Vesting conditions Performance rights will vest on, and become exercisable on or after, the Vesting Date to the extent that certain performance conditions that are based on the financial performance of FlexiGroup.
The measure used to determine FlexiGroup’s financial performance is Earnings Per Share growth targets (“EPS hurdle”) and Total Shareholder Return (“TSR hurdle”).
Fifty percent (50%) of each tranche of performance rights will be subject to the EPS hurdle, while the remaining fifty percent (50%) will be subject to the TSR hurdle.
EPS performance target The basic EPS (“Basic EPS”) for the year ending 30 June 2012 is 21.0 cents per share, 30 June 2013 is 24.3 cents per share and 30 June 2014 is 27.9 cents per share.
Performance testing (“testing date”) against the EPS hurdle will take place on the date of announcement of the relevant annual financial results of FlexiGroup. Retesting will occur at the retesting date in respect of the next financial year-end date immediately following the relevant initial testing date. Performance rights that do not vest on retesting will be taken to have lapsed.
The applicable EPS hurdle for each test period is measured on an annual compounding basis to the relevant performance test date, using the basic EPS as the base line number. The Board has the discretion to vary at any time the EPS hurdle applicable to all or part of the performance rights.
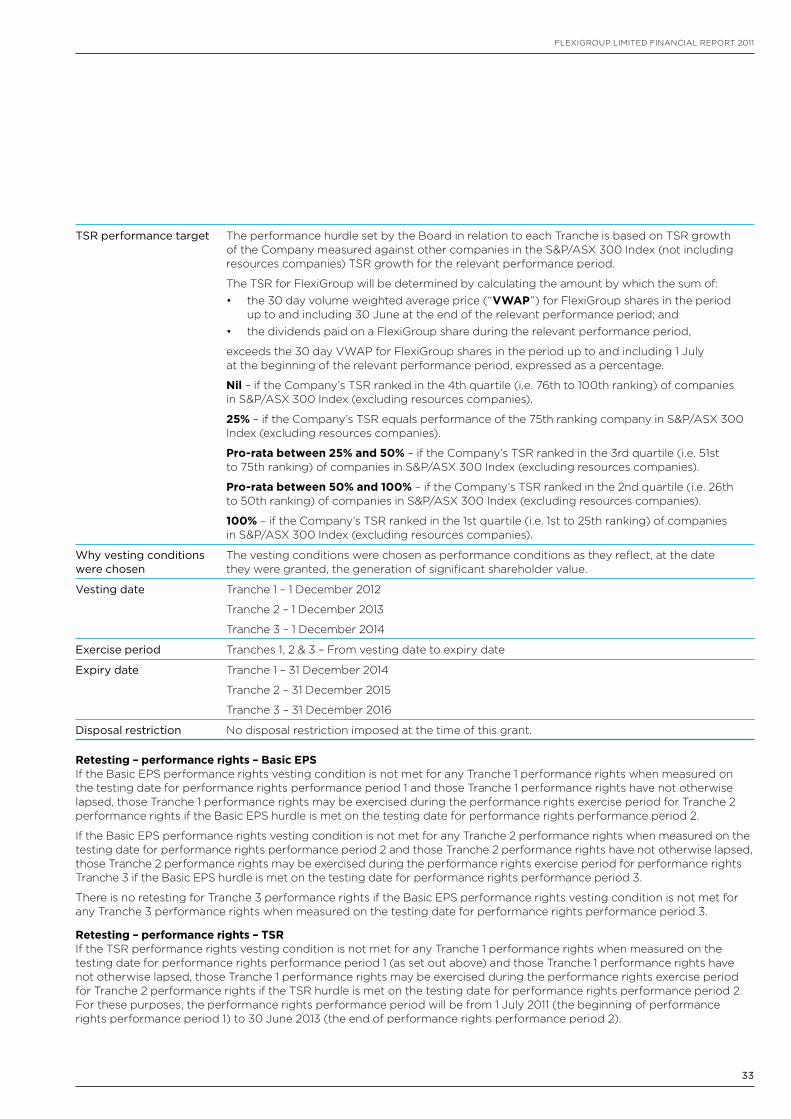
33
FLEXIGROUP LIMITED FInancIaL REPORT 2011
TSR performance target The performance hurdle set by the Board in relation to each Tranche is based on TSR growth of the company measured against other companies in the S&P/aSX 300 Index (not including resources companies) TSR growth for the relevant performance period.
The TSR for FlexiGroup will be determined by calculating the amount by which the sum of:• the 30 day volume weighted average price (“VWAP”) for FlexiGroup shares in the period
up to and including 30 June at the end of the relevant performance period; and• the dividends paid on a FlexiGroup share during the relevant performance period,
exceeds the 30 day VWaP for FlexiGroup shares in the period up to and including 1 July at the beginning of the relevant performance period, expressed as a percentage.
Nil – if the company’s TSR ranked in the 4th quartile (i.e. 76th to 100th ranking) of companies in S&P/aSX 300 Index (excluding resources companies).
25% – if the company’s TSR equals performance of the 75th ranking company in S&P/aSX 300 Index (excluding resources companies).
Pro-rata between 25% and 50% – if the company’s TSR ranked in the 3rd quartile (i.e. 51st to 75th ranking) of companies in S&P/aSX 300 Index (excluding resources companies).
Pro-rata between 50% and 100% – if the company’s TSR ranked in the 2nd quartile (i.e. 26th to 50th ranking) of companies in S&P/aSX 300 Index (excluding resources companies).
100% – if the company’s TSR ranked in the 1st quartile (i.e. 1st to 25th ranking) of companies in S&P/aSX 300 Index (excluding resources companies).
Why vesting conditions were chosen
The vesting conditions were chosen as performance conditions as they reflect, at the date they were granted, the generation of significant shareholder value.
Vesting date Tranche 1 – 1 December 2012
Tranche 2 – 1 December 2013
Tranche 3 – 1 December 2014
Exercise period Tranches 1, 2 & 3 – From vesting date to expiry date
Expiry date Tranche 1 – 31 December 2014
Tranche 2 – 31 December 2015
Tranche 3 – 31 December 2016
Disposal restriction no disposal restriction imposed at the time of this grant.
Retesting – performance rights – Basic EPSIf the Basic EPS performance rights vesting condition is not met for any Tranche 1 performance rights when measured on the testing date for performance rights performance period 1 and those Tranche 1 performance rights have not otherwise lapsed, those Tranche 1 performance rights may be exercised during the performance rights exercise period for Tranche 2 performance rights if the Basic EPS hurdle is met on the testing date for performance rights performance period 2.
If the Basic EPS performance rights vesting condition is not met for any Tranche 2 performance rights when measured on the testing date for performance rights performance period 2 and those Tranche 2 performance rights have not otherwise lapsed, those Tranche 2 performance rights may be exercised during the performance rights exercise period for performance rights Tranche 3 if the Basic EPS hurdle is met on the testing date for performance rights performance period 3.
There is no retesting for Tranche 3 performance rights if the Basic EPS performance rights vesting condition is not met for any Tranche 3 performance rights when measured on the testing date for performance rights performance period 3.
Retesting – performance rights – TSRIf the TSR performance rights vesting condition is not met for any Tranche 1 performance rights when measured on the testing date for performance rights performance period 1 (as set out above) and those Tranche 1 performance rights have not otherwise lapsed, those Tranche 1 performance rights may be exercised during the performance rights exercise period for Tranche 2 performance rights if the TSR hurdle is met on the testing date for performance rights performance period 2. For these purposes, the performance rights performance period will be from 1 July 2011 (the beginning of performance rights performance period 1) to 30 June 2013 (the end of performance rights performance period 2).
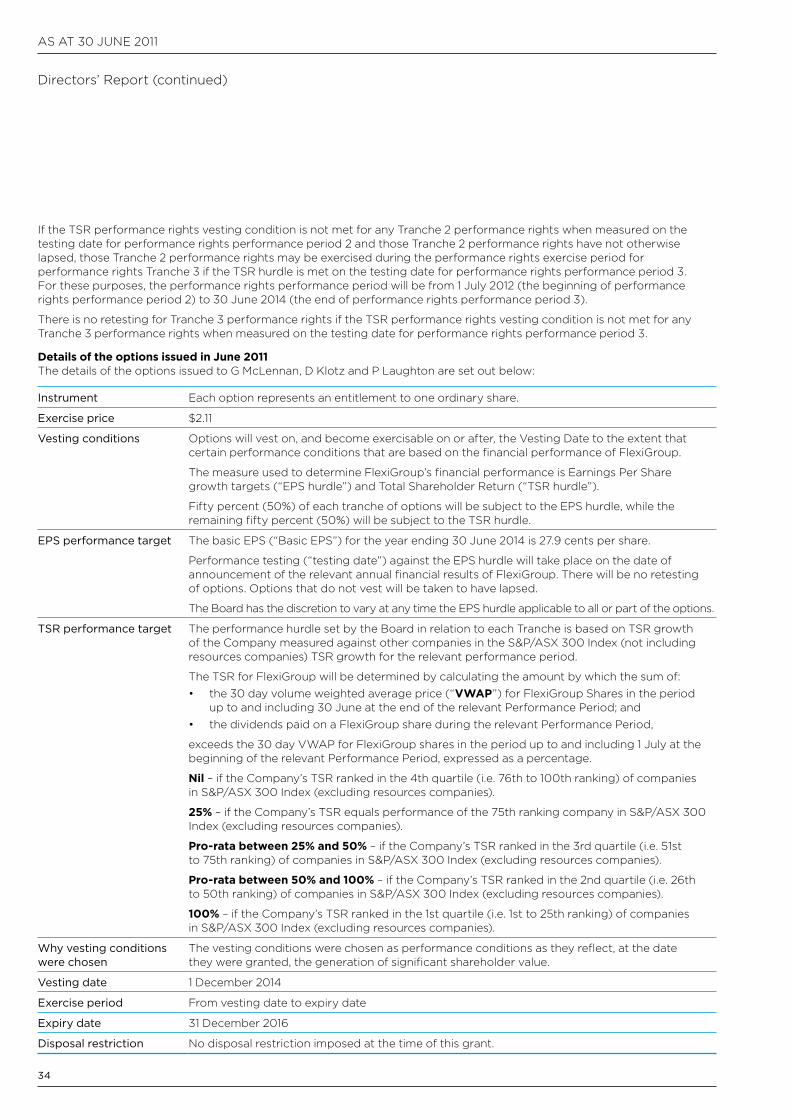
aS aT 30 JUnE 2011
34
Directors’ Report (continued)
If the TSR performance rights vesting condition is not met for any Tranche 2 performance rights when measured on the testing date for performance rights performance period 2 and those Tranche 2 performance rights have not otherwise lapsed, those Tranche 2 performance rights may be exercised during the performance rights exercise period for performance rights Tranche 3 if the TSR hurdle is met on the testing date for performance rights performance period 3. For these purposes, the performance rights performance period will be from 1 July 2012 (the beginning of performance rights performance period 2) to 30 June 2014 (the end of performance rights performance period 3).
There is no retesting for Tranche 3 performance rights if the TSR performance rights vesting condition is not met for any Tranche 3 performance rights when measured on the testing date for performance rights performance period 3.
Details of the options issued in June 2011The details of the options issued to G McLennan, D Klotz and P Laughton are set out below:
Instrument Each option represents an entitlement to one ordinary share.
Exercise price $2.11
Vesting conditions Options will vest on, and become exercisable on or after, the Vesting Date to the extent that certain performance conditions that are based on the financial performance of FlexiGroup.
The measure used to determine FlexiGroup’s financial performance is Earnings Per Share growth targets (“EPS hurdle”) and Total Shareholder Return (“TSR hurdle”).
Fifty percent (50%) of each tranche of options will be subject to the EPS hurdle, while the remaining fifty percent (50%) will be subject to the TSR hurdle.
EPS performance target The basic EPS (“Basic EPS”) for the year ending 30 June 2014 is 27.9 cents per share.
Performance testing (“testing date”) against the EPS hurdle will take place on the date of announcement of the relevant annual financial results of FlexiGroup. There will be no retesting of options. Options that do not vest will be taken to have lapsed.
The Board has the discretion to vary at any time the EPS hurdle applicable to all or part of the options.
TSR performance target The performance hurdle set by the Board in relation to each Tranche is based on TSR growth of the company measured against other companies in the S&P/aSX 300 Index (not including resources companies) TSR growth for the relevant performance period.
The TSR for FlexiGroup will be determined by calculating the amount by which the sum of:• the 30 day volume weighted average price (“VWAP”) for FlexiGroup Shares in the period
up to and including 30 June at the end of the relevant Performance Period; and• the dividends paid on a FlexiGroup share during the relevant Performance Period,
exceeds the 30 day VWaP for FlexiGroup shares in the period up to and including 1 July at the beginning of the relevant Performance Period, expressed as a percentage.
Nil – if the company’s TSR ranked in the 4th quartile (i.e. 76th to 100th ranking) of companies in S&P/aSX 300 Index (excluding resources companies).
25% – if the company’s TSR equals performance of the 75th ranking company in S&P/aSX 300 Index (excluding resources companies).
Pro-rata between 25% and 50% – if the company’s TSR ranked in the 3rd quartile (i.e. 51st to 75th ranking) of companies in S&P/aSX 300 Index (excluding resources companies).
Pro-rata between 50% and 100% – if the company’s TSR ranked in the 2nd quartile (i.e. 26th to 50th ranking) of companies in S&P/aSX 300 Index (excluding resources companies).
100% – if the company’s TSR ranked in the 1st quartile (i.e. 1st to 25th ranking) of companies in S&P/aSX 300 Index (excluding resources companies).
Why vesting conditions were chosen
The vesting conditions were chosen as performance conditions as they reflect, at the date they were granted, the generation of significant shareholder value.
Vesting date 1 December 2014
Exercise period From vesting date to expiry date
Expiry date 31 December 2016
Disposal restriction no disposal restriction imposed at the time of this grant.
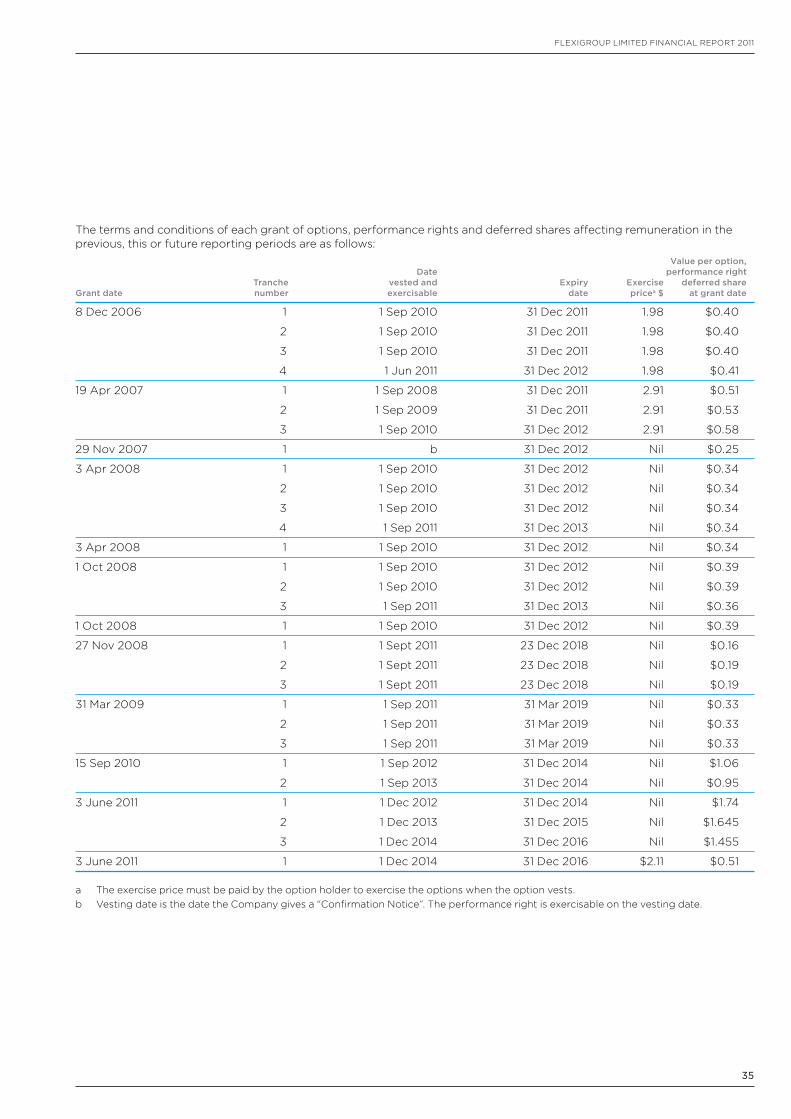
35
FLEXIGROUP LIMITED FInancIaL REPORT 2011
The terms and conditions of each grant of options, performance rights and deferred shares affecting remuneration in the previous, this or future reporting periods are as follows: Value per option, Date performance right Tranche vested and Expiry Exercise deferred share Grant date number exercisable date pricea $ at grant date
8 Dec 2006 1 1 Sep 2010 31 Dec 2011 1.98 $0.40
2 1 Sep 2010 31 Dec 2011 1.98 $0.40
3 1 Sep 2010 31 Dec 2011 1.98 $0.40
4 1 Jun 2011 31 Dec 2012 1.98 $0.41
19 apr 2007 1 1 Sep 2008 31 Dec 2011 2.91 $0.51
2 1 Sep 2009 31 Dec 2011 2.91 $0.53
3 1 Sep 2010 31 Dec 2012 2.91 $0.58
29 nov 2007 1 b 31 Dec 2012 nil $0.25
3 apr 2008 1 1 Sep 2010 31 Dec 2012 nil $0.34
2 1 Sep 2010 31 Dec 2012 nil $0.34
3 1 Sep 2010 31 Dec 2012 nil $0.34
4 1 Sep 2011 31 Dec 2013 nil $0.34
3 apr 2008 1 1 Sep 2010 31 Dec 2012 nil $0.34
1 Oct 2008 1 1 Sep 2010 31 Dec 2012 nil $0.39
2 1 Sep 2010 31 Dec 2012 nil $0.39
3 1 Sep 2011 31 Dec 2013 nil $0.36
1 Oct 2008 1 1 Sep 2010 31 Dec 2012 nil $0.39
27 nov 2008 1 1 Sept 2011 23 Dec 2018 nil $0.16
2 1 Sept 2011 23 Dec 2018 nil $0.19
3 1 Sept 2011 23 Dec 2018 nil $0.19
31 Mar 2009 1 1 Sep 2011 31 Mar 2019 nil $0.33
2 1 Sep 2011 31 Mar 2019 nil $0.33
3 1 Sep 2011 31 Mar 2019 nil $0.33
15 Sep 2010 1 1 Sep 2012 31 Dec 2014 nil $1.06
2 1 Sep 2013 31 Dec 2014 nil $0.95
3 June 2011 1 1 Dec 2012 31 Dec 2014 nil $1.74
2 1 Dec 2013 31 Dec 2015 nil $1.645
3 1 Dec 2014 31 Dec 2016 nil $1.455
3 June 2011 1 1 Dec 2014 31 Dec 2016 $2.11 $0.51
a The exercise price must be paid by the option holder to exercise the options when the option vests. b Vesting date is the date the company gives a “confirmation notice”. The performance right is exercisable on the vesting date.
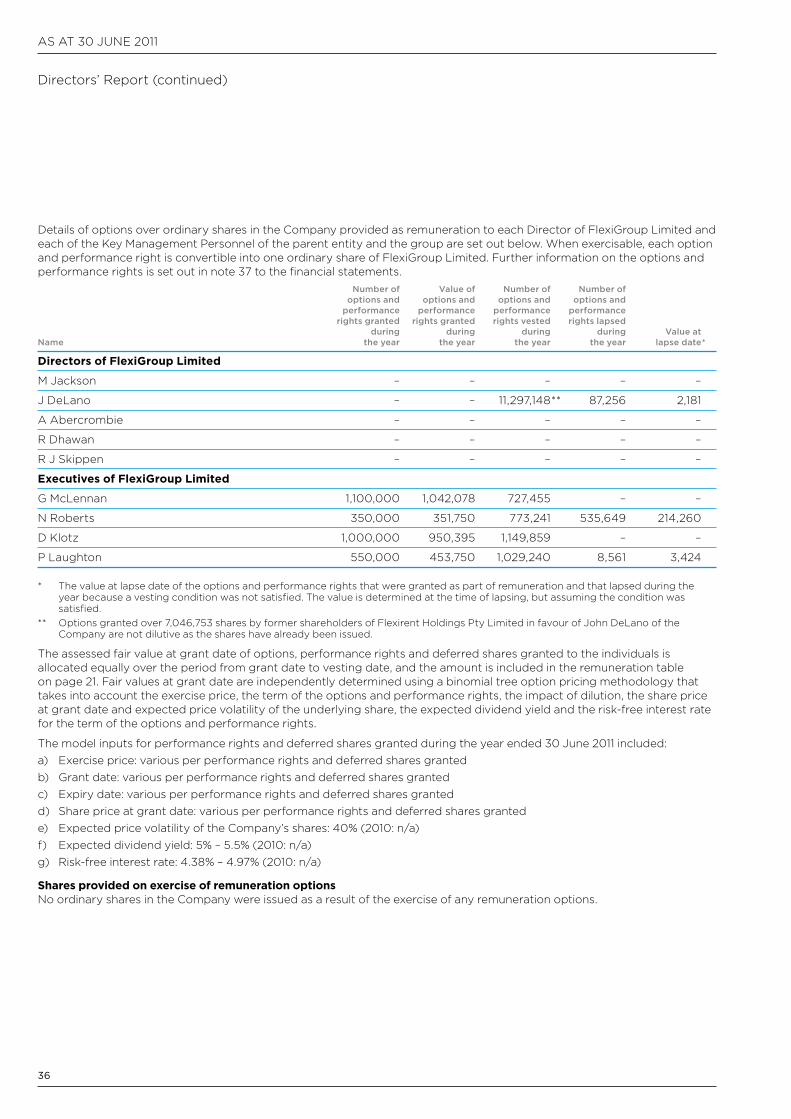
aS aT 30 JUnE 2011
36
Directors’ Report (continued)
Details of options over ordinary shares in the company provided as remuneration to each Director of FlexiGroup Limited and each of the Key Management Personnel of the parent entity and the group are set out below. When exercisable, each option and performance right is convertible into one ordinary share of FlexiGroup Limited. Further information on the options and performance rights is set out in note 37 to the financial statements. Number of Value of Number of Number of options and options and options and options and performance performance performance performance rights granted rights granted rights vested rights lapsed during during during during Value at Name the year the year the year the year lapse date *
Directors of FlexiGroup Limited
M Jackson – – – – –
J DeLano – – 11,297,148 ** 87,256 2,181
a abercrombie – – – – –
R Dhawan – – – – –
R J Skippen – – – – –
Executives of FlexiGroup Limited
G McLennan 1,100,000 1,042,078 727,455 – –
n Roberts 350,000 351,750 773,241 535,649 214,260
D Klotz 1,000,000 950,395 1,149,859 – –
P Laughton 550,000 453,750 1,029,240 8,561 3,424
* The value at lapse date of the options and performance rights that were granted as part of remuneration and that lapsed during the year because a vesting condition was not satisfied. The value is determined at the time of lapsing, but assuming the condition was satisfied.
** Options granted over 7,046,753 shares by former shareholders of Flexirent Holdings Pty Limited in favour of John DeLano of the company are not dilutive as the shares have already been issued.
The assessed fair value at grant date of options, performance rights and deferred shares granted to the individuals is allocated equally over the period from grant date to vesting date, and the amount is included in the remuneration table on page 21. Fair values at grant date are independently determined using a binomial tree option pricing methodology that takes into account the exercise price, the term of the options and performance rights, the impact of dilution, the share price at grant date and expected price volatility of the underlying share, the expected dividend yield and the risk-free interest rate for the term of the options and performance rights.
The model inputs for performance rights and deferred shares granted during the year ended 30 June 2011 included:a) Exercise price: various per performance rights and deferred shares grantedb) Grant date: various per performance rights and deferred shares grantedc) Expiry date: various per performance rights and deferred shares grantedd) Share price at grant date: various per performance rights and deferred shares grantede) Expected price volatility of the company’s shares: 40% (2010: n/a)f) Expected dividend yield: 5% – 5.5% (2010: n/a)g) Risk-free interest rate: 4.38% – 4.97% (2010: n/a)
Shares provided on exercise of remuneration optionsno ordinary shares in the company were issued as a result of the exercise of any remuneration options.
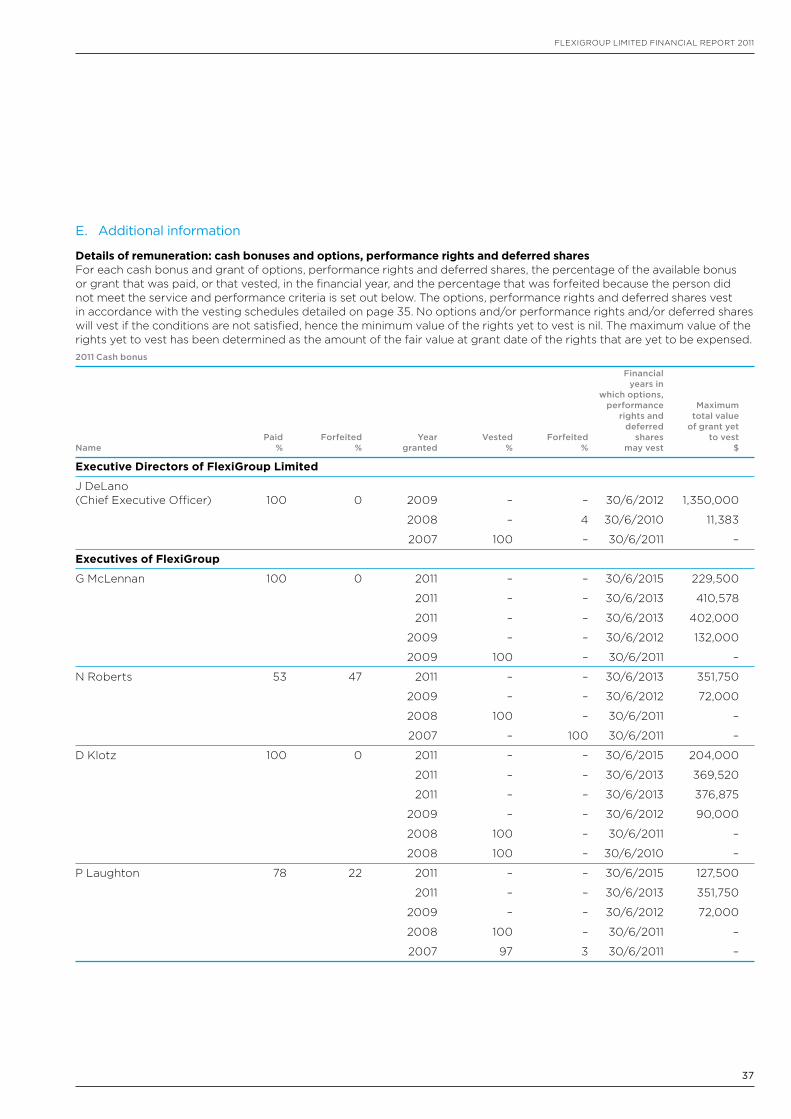
37
FLEXIGROUP LIMITED FInancIaL REPORT 2011
E. Additional information
Details of remuneration: cash bonuses and options, performance rights and deferred sharesFor each cash bonus and grant of options, performance rights and deferred shares, the percentage of the available bonus or grant that was paid, or that vested, in the financial year, and the percentage that was forfeited because the person did not meet the service and performance criteria is set out below. The options, performance rights and deferred shares vest in accordance with the vesting schedules detailed on page 35. no options and/or performance rights and/or deferred shares will vest if the conditions are not satisfied, hence the minimum value of the rights yet to vest is nil. The maximum value of the rights yet to vest has been determined as the amount of the fair value at grant date of the rights that are yet to be expensed.2011 Cash bonus
Financial years in which options, performance Maximum rights and total value deferred of grant yet Paid Forfeited Year Vested Forfeited shares to vest Name % % granted % % may vest $
Executive Directors of FlexiGroup Limited
J DeLano (chief Executive Officer) 100 0 2009 – – 30/6/2012 1,350,000
2008 – 4 30/6/2010 11,383
2007 100 – 30/6/2011 –
Executives of FlexiGroup
G McLennan 100 0 2011 – – 30/6/2015 229,500
2011 – – 30/6/2013 410,578
2011 – – 30/6/2013 402,000
2009 – – 30/6/2012 132,000
2009 100 – 30/6/2011 –
n Roberts 53 47 2011 – – 30/6/2013 351,750
2009 – – 30/6/2012 72,000
2008 100 – 30/6/2011 –
2007 – 100 30/6/2011 –
D Klotz 100 0 2011 – – 30/6/2015 204,000
2011 – – 30/6/2013 369,520
2011 – – 30/6/2013 376,875
2009 – – 30/6/2012 90,000
2008 100 – 30/6/2011 –
2008 100 – 30/6/2010 –
P Laughton 78 22 2011 – – 30/6/2015 127,500
2011 – – 30/6/2013 351,750
2009 – – 30/6/2012 72,000
2008 100 – 30/6/2011 –
2007 97 3 30/6/2011 –
aS aT 30 JUnE 2011
38
Shares under options, performance rights and deferred shares
as at the date of this report, there were 17,455,888 unissued ordinary shares of FlexiGroup Limited subject to options or performance rights. Of those unissued ordinary shares, 9,684,842 are subject to option with expiry dates between 31 December 2011 and 31 December 2016 and exercise prices between $1.57 – $2.91, with a weighted average exercise price of $2.11. The remaining 7,771,046 unissued ordinary shares are the subject of performance rights with expiry dates between 31 December 2012 and 31 December 2016.
Options granted over 7,046,753 shares by former shareholders of Flexirent Holdings Pty Limited in favour of John DeLano of the company are not included in this calculation as the shares have already been issued.
at the date of this report, there are also 11,912,000 deferred shares which are held by the FlexiGroup Tax Deferred Employee Share Plan (note 37 (b) for further information).
no option holder has any right under the option to participate in any other share issues of the company or any other entity.
Directors’ indemnification
During the year ended 30 June 2011, the company paid insurance premiums in respect of a Directors’ and Officers’ Liability insurance contract. Disclosure of the total amount of the premium and the nature of the liabilities in respect of such insurance is prohibited by the policy.
Indemnity of auditors
The company has indemnified its auditors against any liability (including legal costs) that the auditors incur in connection with any claim by a third party arising from the company’s breach of its agreement with its auditors.
Proceedings on behalf of the Company
no person has applied for leave of court to bring proceedings on behalf of the company or intervene in any proceedings to which the company is a party for the purpose of taking responsibility on behalf of the company for all or any part or those proceedings. The company was not a party to any such proceedings during the year.
no proceedings have been brought or intervened in on behalf of the company with leave of the court under section 237 of the Corporations Act 2001.
Non-audit services
The company may decide to employ the auditor on assignments additional to their statutory audit duties where the auditor’s expertise and experience with the company and/or the Group are important.
Details of the amounts paid or payable to the auditor (Pricewaterhousecoopers) for audit and non-audit services provided during the year are set out in note 34 (b) of the financial statements.
The Board of Directors has considered the position and, in accordance with advice received from the audit & Risk committee, is satisfied that the provision of the non-audit services is compatible with the general standard of independence for auditors imposed by the Corporations Act 2001. The Directors are satisfied that the provisions of non-audit services by the auditor, as set out below, did not compromise the auditor independence requirement of the Corporations Act 2001 for the following reasons:• all non-audit services have been reviewed by the audit
& Risk committee to ensure they do not impact the impartiality and objectivity of the auditor
• none of the services undermine the general principle relating to auditor independence as set out in aPES 110 code of Ethics for Professional accountants.
Declaration of interests
Other than as disclosed in the financial statements, no Director of the company has received or become entitled to receive a benefit other than remuneration by reason of a contract made by the company or a related corporation with a Director or with a firm of which he is a member, or with a company in which he has a substantial financial interest except that Flexirent capital Pty Limited has rented premises in Melbourne owned by a company associated with Mr a abercrombie. The lease is on standard market terms.
Rounding of amounts
The company is of a kind referred to in class Order 98/100, issued by the australian Securities and Investments commission, relating to the “rounding off” of amounts in the Directors’ Report. amounts in the Directors’ Report have been rounded off in accordance with that class Order to the nearest thousand dollars, or in certain cases, to the nearest dollar.
Auditor’s independence declaration
a copy of the auditor’s independence declaration as required under section 307c of the Corporations Act 2001 is set out on page 39 and forms part of this report.
Auditor
Pricewaterhousecoopers continues in office in accordance with section 327 of the Corporations Act 2001.
This report is made in accordance with a resolution of Directors.
Margaret Jackson chairman
Sydney 5 august 2011
Directors’ Report (continued)
39
FLEXIGROUP LIMITED FInancIaL REPORT 2011
auditor’s Independence Declaration
FlexiGroup Limited and its controlled entitiesAuditors’ Independence Declaration
30 June 2011
Liability limited by a scheme approved under Professional Standards Legislation
32
PricewaterhouseCoopersABN 52 780 433 757
Darling Park Tower 2201 Sussex StreetGPO BOX 2650SYDNEY NSW 1171DX 77 SydneyAustraliaTelephone +61 2 8266 0000Facsimile +61 2 8266 9999
Auditor’s Independence Declaration
As lead auditor for the audit of FlexiGroup Limited for the year ended 30 June 2011, I declare that to thebest of my knowledge and belief, there have been:
a) no contraventions of the auditor independence requirements of the Corporations Act 2001 in relation tothe audit; and
b) no contraventions of any applicable code of professional conduct in relation to the audit.
This declaration is in respect of FlexiGroup Limited and the entities it controlled during the period.
Rob Spring SydneyPartner 5 August 2011PricewaterhouseCoopers
aS aT 30 JUnE 2011
40
Composition of the Board
at the date of this statement, the Board comprises four non-Executive Directors, three of whom are independent and one Executive Director (chief Executive Officer). The names of the Directors, including details of their qualifications and experience, are set out in the “Information on Directors” section of the 2011 FlexiGroup Limited annual Report.
Role of the Board
The role of the Board is to provide overall strategic guidance for the company and effective oversight of management.
The primary responsibilities of the Board include:• overseeing the development of the company’s corporate
strategy including reviewing and approving strategic plans and performance objectives of the company
• the appointment of the chief Executive Officer and senior executives, monitoring senior management’s performance and approving senior management remuneration policies and practices
• effective communication with shareholders including reporting to shareholders and ensuring that all regulatory requirements are met
• establishing and monitoring policies governing the company’s relationship with other stakeholders and the broader community, including establishing and maintaining environmental, employment, occupation, health and safety policies
• actively promoting ethical and responsible decision making
• reviewing and approving annual and half yearly financial statements, monitoring financial results on an ongoing basis, overseeing the company’s accounting and financial management systems, approving and monitoring major capital expenditure, capital management, major acquisition, divestitures and restructures, and determining dividend policy
• establishing and overseeing the company’s controls and systems for identifying, assessing, monitoring and reviewing material risks
Independent professional advice
Following consultation with the chairman, Directors may seek independent professional advice at the company’s expense. Generally, this advice will be available to all Directors.
Performance assessment
The Board undertakes an annual self assessment of its collective performance, the performance of the chairman and of its committees. The chairman meets privately with each Director to discuss individual and collective performance of Directors.
Re-election of Directors
at each annual General Meeting of the company there must be an election of Directors. The Directors who must retire from office (but are eligible to stand for re-election) at the general meeting are as follows:(a) each Director who has held office without re-election i. beyond the third annual General Meeting following
the Director’s appointment or last election; or ii. for at least three years, which ever is the longer
period(b) each Director who was appointed by the Directors
under article 10.7 of the constitution(c) if none of (a) or (b) is applicable, the Director who has
served in office longest without re-election. If there are two or more such Directors who have been in office an equal length of time, then in default of agreement, the Director to retire will be determined by lot
Conflicts of interest
Directors are required to keep the Board advised, on an ongoing basis, of any interest that could potentially conflict with those of the company. Where the Board believes that a significant conflict may exist, the Director concerned does not receive the relevant Board papers and is not present at the meeting while the item is considered. additionally, Directors are required to advise the Board of any Board or executive appointments to other companies and any related party transactions including financial transactions with the Group.
Financial reporting
The chief Executive Officer and chief Financial Officer have certified to the Board that the company’s financial statements are complete and present a true and fair view, in all material respects, of the financial condition and operational results of the company and are in accordance with relevant accounting standards. The Board receives monthly reports from management on the financial and operational performance of the Group.
corporate Governance
41
FLEXIGROUP LIMITED FInancIaL REPORT 2011
Board committees
The Board may delegate responsibility to committees to consider certain issues in further detail and then report back to and advise the Board.
committees established by the Board have adopted charters setting out the authority, responsibilities, membership and operation of the committee.
There are currently three committees:audit & Risk committee, nomination committee and Remuneration committee.
The Board charter is available on the FlexiGroup website.
Audit & Risk Committee
The role of the committee is to assist the Board in carrying out its accounting, auditing and financial reporting responsibilities, including oversight of:(a) the integrity of the company’s external financial
reporting and financial statements(b) the appointment, remuneration, independence and
competence of the company’s external auditors (c) the performance of the external audit function and
review of its audits(d) the effectiveness of the company’s system of risk
management and internal controls and(e) the company’s systems and procedures for compliance
with applicable legal and regulatory requirements
The audit & Risk committee provides advice to the Board and reports on the status and management of the risks to the company. The purpose of the committee’s risk management process is to ensure that risks are identified, assessed and appropriately managed.
The Board has adopted a policy regarding the services that the company may obtain from its external auditor. It is the policy of the company that its:• external auditor firm must be independent of the
company, the Directors and senior executives. To ensure this, the Group will require a formal confirmation for independence from its external auditor on an annual basis, and
• external auditor may not provide services to the company that are perceived to be materially in conflict with the role of the external auditor. Services which involve the external auditor acting in a managerial or decision-making capacity, or processing or originating transactions, are not appropriate. However, the external auditor may be permitted to provide additional services, which are not perceived to be materially in conflict with the role of the external auditor, if the Board or audit & Risk committee has approved those additional services, or they fall within the terms of any approved policy. Such additional services may include financial audits, audits or reviews undertaken for regulatory purposes, completion audits, tax compliance, advice on accounting standards, and due diligence on certain acquisition or sale transactions.
The committee must comprise at least three Directors, all of whom must be non-Executive Directors and a majority of whom must be independent. The chairman of the committee must be an independent non-Executive Director who is not the chairman of the Board.
The committee will meet as often as is required to undertake its role effectively. The chief Executive Officer and chief Financial Officer are expected to attend each scheduled meeting of the committee and a standing invitation will be issued to the external auditors. The committee chairperson may also invite Directors who are not members of the committee, other senior managers and external advisors to attend meetings of the committee. The committee may request management and/or others to provide such input and advice as is required. The committee will regularly report to the Board about committee activities, issues and related recommendations.
The audit & Risk committee charter is available on the FlexiGroup website.
The committee comprises R John Skippen (chair), Margaret Jackson and Rajeev Dhawan.
aS aT 30 JUnE 2011
42
corporate Governance (continued)
Remuneration Committee
The role of the Remuneration committee is to review and make recommendations to the Board on remuneration packages and policies related to the Directors, the chief Executive Officer and senior executives and to ensure that the remuneration policies and practices are consistent with the company’s strategic goals and human resource objectives and comply with relevant legal requirements.
The committee will consist of at least three members. The company will endeavour to ensure that a majority of the members are independent, non-Executive Directors.
The committee will meet as often as is required to perform its functions.
The Remuneration committee charter is available on the FlexiGroup website.
The committee comprises Rajeev Dhawan (chair), Margaret Jackson, R John Skippen and andrew abercrombie.
Nomination Committee
The committee assists and advises the Board on(a) Director selection and appointment practices(b) Director performance evaluation processes and criteria(c) Board composition(d) Succession planning for the Board and senior
management
The committee also ensures that the Board is of size and composition conducive to making decisions expediently, with the benefit of a variety of perspectives and skills, and in the best interests of the company as a whole.
The committee will consist of at least three members. The company will endeavour to ensure that a majority of the committee members are independent, non-Executive Directors.
The nomination committee charter is available on the FlexiGroup website.
The committee comprises andrew abercrombie (chair), Margaret Jackson, R John Skippen and Rajeev Dhawan.
Code of Conduct
The company has adopted a code of conduct. The code of conduct (“code”) sets out the ethical standards and rules of the company and provides a framework for how the company will operate its business in a manner that will protect its stakeholders.
The code applies to all Directors, officers, employees, contractors, consultants and associates of the company.
The code specifically covers conflicts of interest, corporate opportunities and other benefits, confidentiality, privacy, fair dealing, discrimination, protection of and use of the company’s assets and property, compliance with laws and regulations, approach to disclosure and financial reporting, insider trading and whistleblower protection.
The code of conduct is available on the FlexiGroup website.
Communications with Shareholders
The company communicates with shareholders through the company’s annual reports, annual General Meeting, half–year and full-year results and company website. all announcements are made available on the website.
During periods of particular sensitivity, the company’s policy is to avoid any discussion with shareholders, media, analysts or other market operators for thirty days prior to the close of the half and full-year accounting periods to the time of the half and full-year profit announcements. This policy is subordinate to the aSX requirements of continuous disclosure.
Continuous disclosure
The company Secretary has been nominated as the person responsible for communication with the australian Securities Exchange (“aSX”). This role includes responsibility for ensuring compliance with the continuous disclosure requirements in the aSX Listing Rules and overseeing and co-ordinating information disclosure to the aSX, analysts, brokers, shareholders, the media and the public. When analysts are briefed following half-year and full-year results announcements, the material used in the presentations is released to the aSX prior to the commencement of the briefing. The company ensures that if any price sensitive information is inadvertently disclosed, this information is also immediately released to the market. The company is committed to ensuring that all stakeholders and the market are provided with relevant and accurate information regarding its activities in a timely manner.
43
FLEXIGROUP LIMITED FInancIaL REPORT 2011
Directors and senior management dealings in Company securities
The company’s constitution permits Directors to acquire securities in the company. However, the Board has adopted a Share Trading Policy that prohibits Directors, senior management and staff from dealing in the company’s securities at any time whilst in possession of price sensitive information which is not generally available to the marketplace.
The following approvals must also be obtained before a Director or designated person can deal in the company’s securities:
Person Approval required from
Chairman chairman of the audit & Risk committee and chief Executive Officer
Managing Director or Chief Executive Officer
chairman
Directors (except Chairman) chairman
Chief Financial Officer or Company Secretary
chief Executive Officer
Direct reports to Chief Executive Officer and other designated persons nominated by the Board
chief Financial Officer or company Secretary
The share dealing policy also extends to dealing in a financial product which operates to limit the economic risk of a holding in the company’s securities. Dealing in those types of products is not permitted.
The granting of approval to deal in the company’s securities is co-ordinated by the company Secretary who is also responsible for reporting to the Board all transactions by Directors, senior managers and designated persons.
In accordance with the provisions of the Corporations Act 2001 and the aSX Listing Rules, the company advises the aSX of any transaction conducted by Directors in securities in the company.
The Share Trading Policy is made available to employees through the company’s internal compliance and governance intranet sites and is also included in the offer of employment to new employees.
The Share Trading Policy is also on the FlexiGroup website.
External auditors
Pricewaterhousecoopers was appointed as the external auditor in 2005. It is Pricewaterhousecoopers’ policy to rotate audit engagement partners on listed companies at least every five years. The performance of the external auditor is reviewed annually. an analysis of fees paid to the external auditor, including a break down of fees for the non-audit services, is provided in the notes to the full financial statements. It is the policy of the external auditor to provide an annual declaration of independence to the audit & Risk committee. The external auditors are required to attend the annual General Meeting and be available to answer shareholder questions about the conduct of the audit and the preparation and content of the audit report.
Indemnification
The constitution of the company provides an indemnity (to the maximum extent permitted by law) in favour of current and past Directors, company Secretaries, and all other past and present executive officers when acting in their capacities in respect of:(a) all liabilities to another person (other than the company
or related entities) if the relevant officers have acted in good faith, and
(b) the costs and expenses of successfully defending legal proceedings
Under Deeds of access and Indemnity, the company has agreed to indemnify each current Director and each company Secretary for all liabilities that may arise as a result of the Directors or company Secretary acting in that capacity to the full extent permitted by law. The deed stipulates that the company will meet the full amount of any such liabilities including legal costs.
44
30 JUnE 2011
annual Financial Statements
These financial statements are the consolidated financial statements of the consolidated entity consisting of FlexiGroup Limited and its subsidiaries. The financial statements are presented in australian currency.
FlexiGroup Limited is a company limited by shares, incorporated and domiciled in australia. Its registered office and principal place of business is:
Level 8, The Forum201 Pacific HighwaySt Leonards nSW 2065
a description of the nature of the consolidated entity’s operations and its principal activities is included in the review of operations and activities in the Directors’ Report on page 16, which is not part of these financial statements.
The financial statements were authorised for issue by the Directors on 5 august 2011. The Directors have the power to amend and reissue these financial statements.
Through the use of the internet, we have ensured that our corporate reporting is timely, complete, and available globally at a minimum cost to the company. all press releases, financial statements and other information are available at Investor Information on our website: www.flexigroup.com.au
Contents Page
Financial Statements 44
consolidated Income Statement 45
consolidated Statement of comprehensive Income 46
consolidated Balance Sheet 47
consolidated Statement of changes in Equity 48
consolidated Statement of cash Flows 49
notes to the consolidated Financial Statements 50
Directors’ Declaration 97
Independent auditor’s Report to the members 98
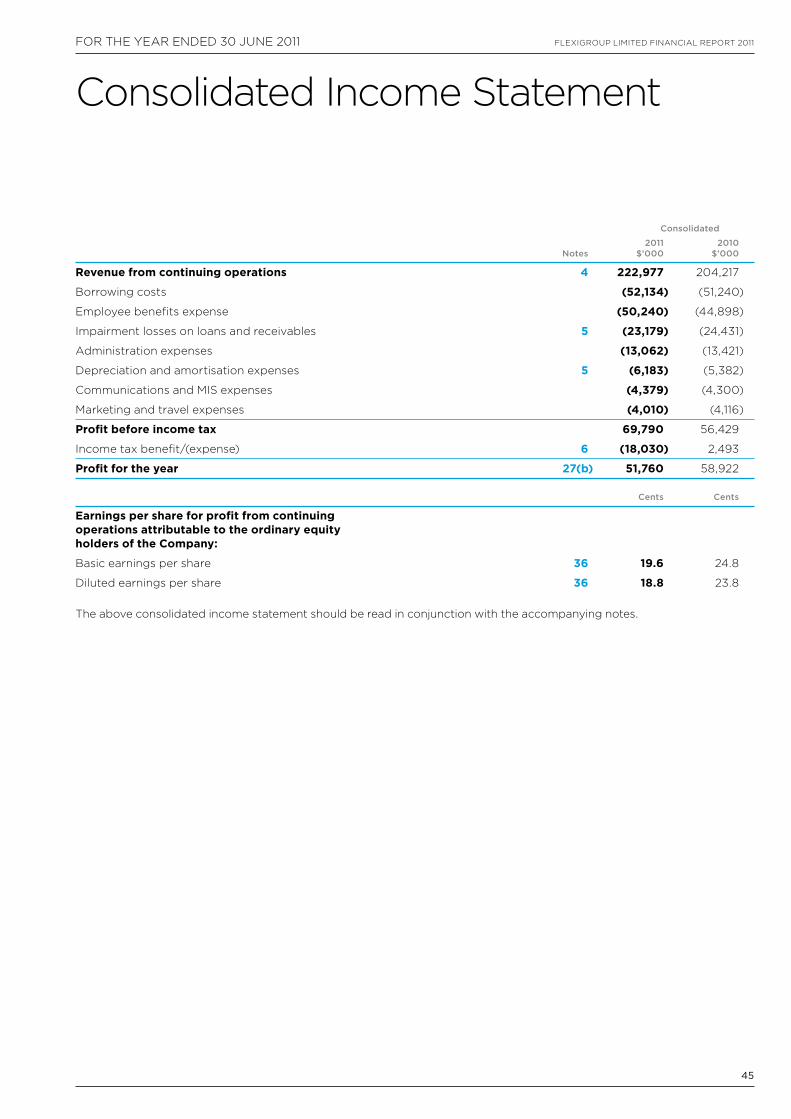
45
FLEXIGROUP LIMITED FInancIaL REPORT 2011FOR THE YEaR EnDED 30 JUnE 2011
Consolidated
2011 2010 Notes $’000 $’000
Revenue from continuing operations 4 222,977 204,217
Borrowing costs (52,134) (51,240)
Employee benefits expense (50,240) (44,898)
Impairment losses on loans and receivables 5 (23,179) (24,431)
administration expenses (13,062) (13,421)
Depreciation and amortisation expenses 5 (6,183) (5,382)
communications and MIS expenses (4,379) (4,300)
Marketing and travel expenses (4,010) (4,116)
Profit before income tax 69,790 56,429
Income tax benefit/(expense) 6 (18,030) 2,493
Profit for the year 27(b) 51,760 58,922
Cents Cents
Earnings per share for profit from continuing operations attributable to the ordinary equity holders of the Company:
Basic earnings per share 36 19.6 24.8
Diluted earnings per share 36 18.8 23.8
The above consolidated income statement should be read in conjunction with the accompanying notes.
consolidated Income Statement
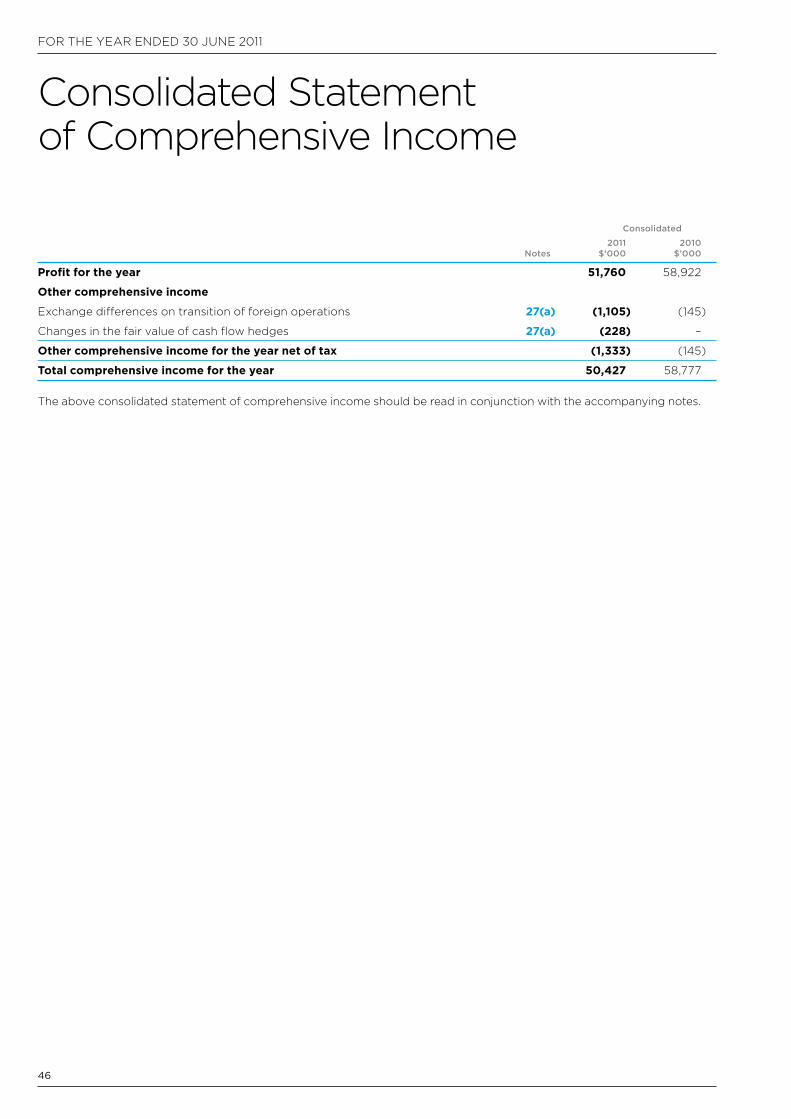
46
FOR THE YEaR EnDED 30 JUnE 2011
consolidated Statement of comprehensive Income
Consolidated
2011 2010 Notes $’000 $’000
Profit for the year 51,760 58,922
Other comprehensive income
Exchange differences on transition of foreign operations 27(a) (1,105) (145)
changes in the fair value of cash flow hedges 27(a) (228) –
Other comprehensive income for the year net of tax (1,333) (145)
Total comprehensive income for the year 50,427 58,777
The above consolidated statement of comprehensive income should be read in conjunction with the accompanying notes.
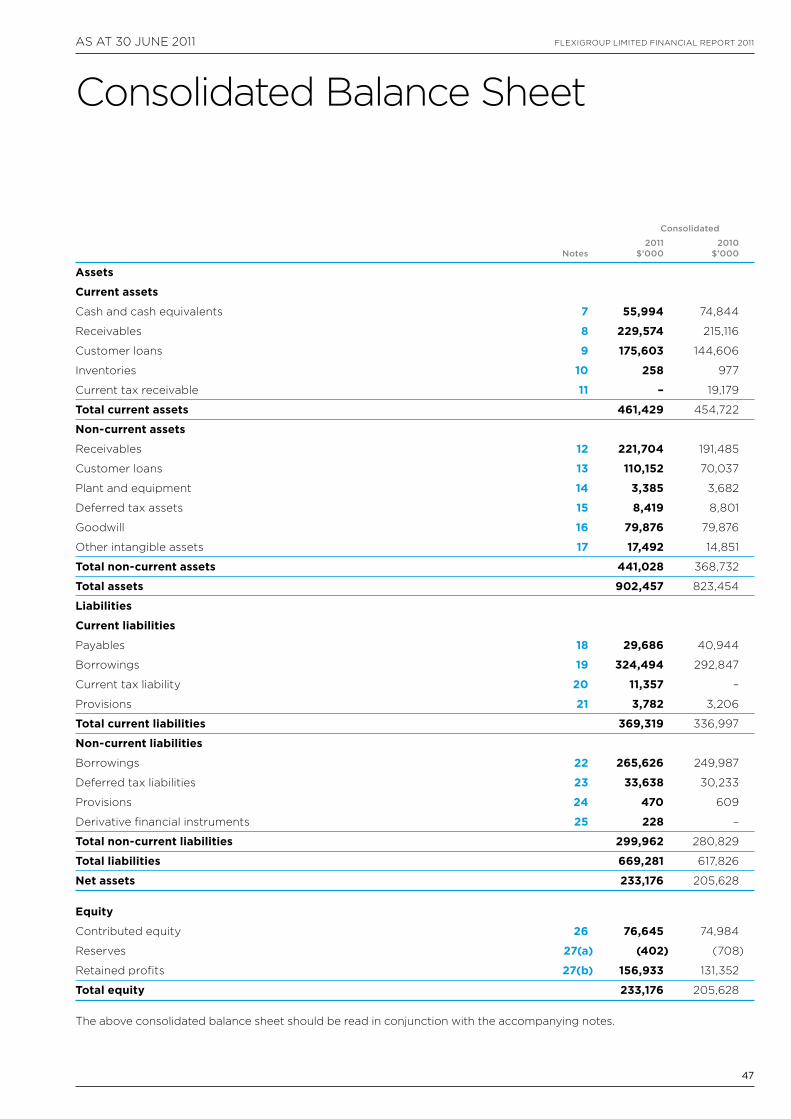
47
FLEXIGROUP LIMITED FInancIaL REPORT 2011aS aT 30 JUnE 2011
consolidated Balance Sheet
Consolidated
2011 2010 Notes $’000 $’000
Assets
Current assets
cash and cash equivalents 7 55,994 74,844
Receivables 8 229,574 215,116
customer loans 9 175,603 144,606
Inventories 10 258 977
current tax receivable 11 – 19,179
Total current assets 461,429 454,722
Non-current assets
Receivables 12 221,704 191,485
customer loans 13 110,152 70,037
Plant and equipment 14 3,385 3,682
Deferred tax assets 15 8,419 8,801
Goodwill 16 79,876 79,876
Other intangible assets 17 17,492 14,851
Total non-current assets 441,028 368,732
Total assets 902,457 823,454
Liabilities
Current liabilities
Payables 18 29,686 40,944
Borrowings 19 324,494 292,847
current tax liability 20 11,357 –
Provisions 21 3,782 3,206
Total current liabilities 369,319 336,997
Non-current liabilities
Borrowings 22 265,626 249,987
Deferred tax liabilities 23 33,638 30,233
Provisions 24 470 609
Derivative financial instruments 25 228 –
Total non-current liabilities 299,962 280,829
Total liabilities 669,281 617,826
Net assets 233,176 205,628
Equity
contributed equity 26 76,645 74,984
Reserves 27(a) (402) (708)
Retained profits 27(b) 156,933 131,352
Total equity 233,176 205,628
The above consolidated balance sheet should be read in conjunction with the accompanying notes.
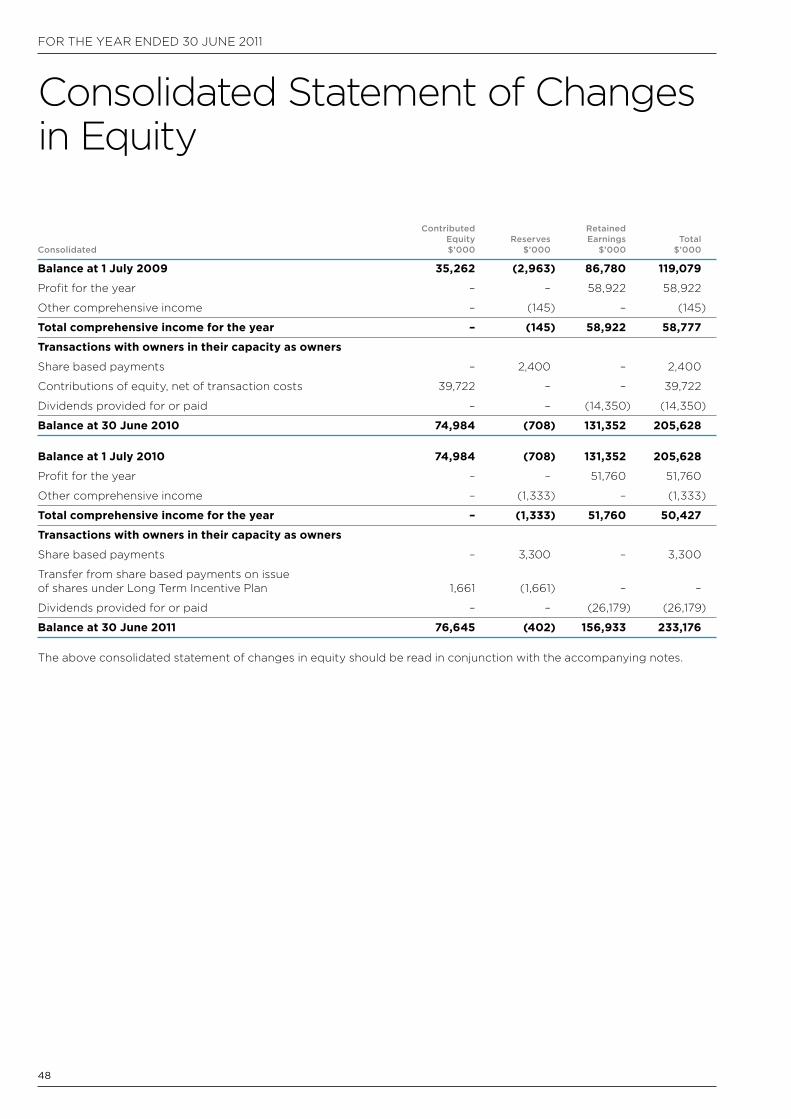
48
FOR THE YEaR EnDED 30 JUnE 2011
consolidated Statement of changes in Equity
Contributed Retained Equity Reserves Earnings Total Consolidated $’000 $’000 $’000 $’000
Balance at 1 July 2009 35,262 (2,963) 86,780 119,079
Profit for the year – – 58,922 58,922
Other comprehensive income – (145) – (145)
Total comprehensive income for the year – (145) 58,922 58,777
Transactions with owners in their capacity as owners
Share based payments – 2,400 – 2,400
contributions of equity, net of transaction costs 39,722 – – 39,722
Dividends provided for or paid – – (14,350) (14,350)
Balance at 30 June 2010 74,984 (708) 131,352 205,628
Balance at 1 July 2010 74,984 (708) 131,352 205,628
Profit for the year – – 51,760 51,760
Other comprehensive income – (1,333) – (1,333)
Total comprehensive income for the year – (1,333) 51,760 50,427
Transactions with owners in their capacity as owners
Share based payments – 3,300 – 3,300
Transfer from share based payments on issue of shares under Long Term Incentive Plan 1,661 (1,661) – –
Dividends provided for or paid – – (26,179) (26,179)
Balance at 30 June 2011 76,645 (402) 156,933 233,176
The above consolidated statement of changes in equity should be read in conjunction with the accompanying notes.
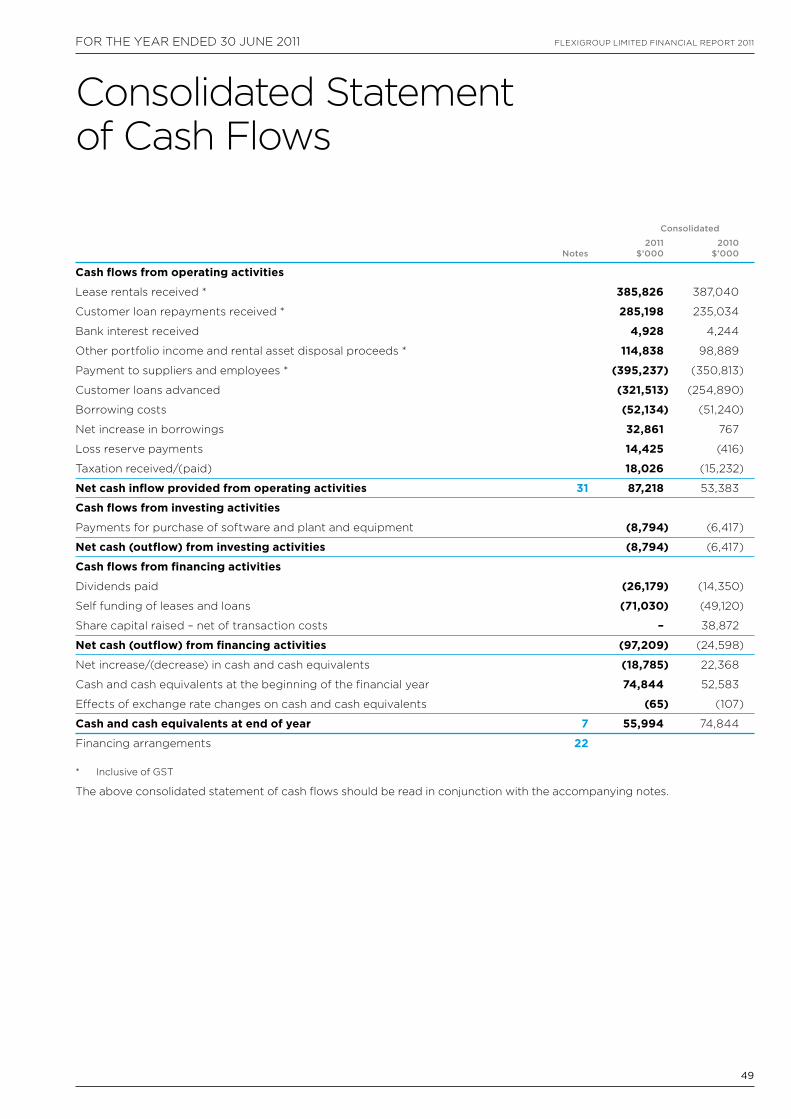
49
FLEXIGROUP LIMITED FInancIaL REPORT 2011FOR THE YEaR EnDED 30 JUnE 2011
consolidated Statement of cash Flows
Consolidated
2011 2010 Notes $’000 $’000
Cash flows from operating activities
Lease rentals received * 385,826 387,040
customer loan repayments received * 285,198 235,034
Bank interest received 4,928 4,244
Other portfolio income and rental asset disposal proceeds * 114,838 98,889
Payment to suppliers and employees * (395,237) (350,813)
customer loans advanced (321,513) (254,890)
Borrowing costs (52,134) (51,240)
net increase in borrowings 32,861 767
Loss reserve payments 14,425 (416)
Taxation received/(paid) 18,026 (15,232)
Net cash inflow provided from operating activities 31 87,218 53,383
Cash flows from investing activities
Payments for purchase of software and plant and equipment (8,794) (6,417)
Net cash (outflow) from investing activities (8,794) (6,417)
Cash flows from financing activities
Dividends paid (26,179) (14,350)
Self funding of leases and loans (71,030) (49,120)
Share capital raised – net of transaction costs – 38,872
Net cash (outflow) from financing activities (97,209) (24,598)
net increase/(decrease) in cash and cash equivalents (18,785) 22,368
cash and cash equivalents at the beginning of the financial year 74,844 52,583
Effects of exchange rate changes on cash and cash equivalents (65) (107)
Cash and cash equivalents at end of year 7 55,994 74,844
Financing arrangements 22
* Inclusive of GST
The above consolidated statement of cash flows should be read in conjunction with the accompanying notes.
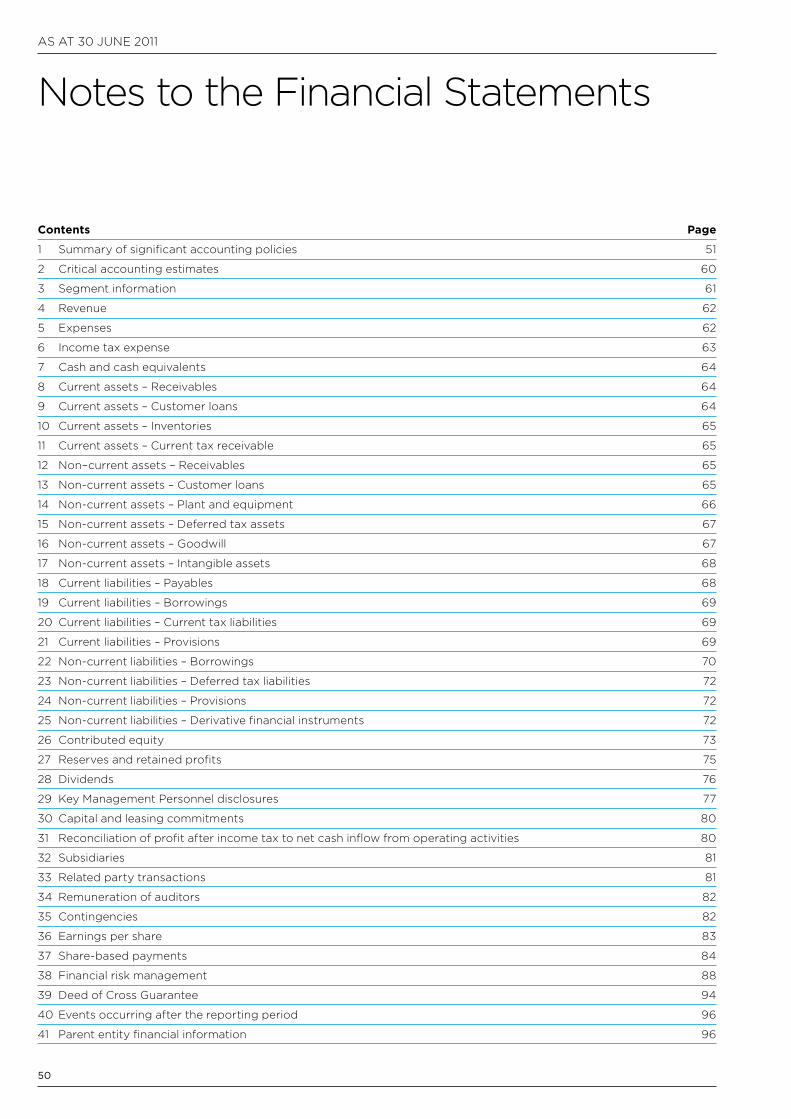
aS aT 30 JUnE 2011
50
Contents Page
1 Summary of significant accounting policies 51
2 critical accounting estimates 60
3 Segment information 61
4 Revenue 62
5 Expenses 62
6 Income tax expense 63
7 cash and cash equivalents 64
8 current assets – Receivables 64
9 current assets – customer loans 64
10 current assets – Inventories 65
11 current assets – current tax receivable 65
12 non–current assets – Receivables 65
13 non-current assets – customer loans 65
14 non-current assets – Plant and equipment 66
15 non-current assets – Deferred tax assets 67
16 non-current assets – Goodwill 67
17 non-current assets – Intangible assets 68
18 current liabilities – Payables 68
19 current liabilities – Borrowings 69
20 current liabilities – current tax liabilities 69
21 current liabilities – Provisions 69
22 non-current liabilities – Borrowings 70
23 non-current liabilities – Deferred tax liabilities 72
24 non-current liabilities – Provisions 72
25 non-current liabilities – Derivative financial instruments 72
26 contributed equity 73
27 Reserves and retained profits 75
28 Dividends 76
29 Key Management Personnel disclosures 77
30 capital and leasing commitments 80
31 Reconciliation of profit after income tax to net cash inflow from operating activities 80
32 Subsidiaries 81
33 Related party transactions 81
34 Remuneration of auditors 82
35 contingencies 82
36 Earnings per share 83
37 Share-based payments 84
38 Financial risk management 88
39 Deed of cross Guarantee 94
40 Events occurring after the reporting period 96
41 Parent entity financial information 96
notes to the Financial Statements
51
FLEXIGROUP LIMITED FInancIaL REPORT 2011
1. Summary of significant accounting policiesThe principal accounting policies adopted in the preparation of these consolidated financial statements are set out below. These policies have been consistently applied to all the years presented, unless otherwise stated. The financial statements are for the consolidated entity consisting of FlexiGroup Limited and its subsidiaries.
a. Basis of preparationThese general purpose financial statements have been prepared in accordance with australian accounting Standards, other authoritative pronouncements of the australian accounting Standards Board, Urgent Issues Group (UIG) interpretations and the Corporations Act 2001.
Compliance with IFRSThe consolidated financial statements of FlexiGroup Limited also comply with International Financial Reporting Standards (IFRS) as issued by the International accounting Standards Board (IaSB).
Historical cost convention These financial statements have been prepared under the historical cost convention, as modified by the revaluation of available-for-sale financial assets, financial assets and liabilities (including derivative instruments) at fair value through profit or loss, certain classes of property plant and equipment and investment property.
Critical accounting estimatesThe preparation of financial statements requires the use of certain critical accounting estimates. It also requires management to exercise its judgement in the process of applying the Group’s accounting policies. The areas involving a higher degree of judgement of complexity, or areas where assumptions and estimates are significant to the financial statements, are disclosed in note 2.
b. Principles of consolidationi. SubsidiariesThe consolidated financial statements incorporate the assets and liabilities of all subsidiaries of FlexiGroup Limited (“company” or “parent entity”) as at 30 June 2011 and the results of all the subsidiaries for the year then ended. FlexiGroup Limited and its subsidiaries together are referred to in these financial statements as the Group or the consolidated entity.
Subsidiaries are all those entities (including special purpose entities) over which the Group has the power to govern the financial and operational policies, generally accompanying a shareholding of more than one-half of the voting rights. The existence and effect of potential voting rights that are currently exercisable or convertible are considered when assessing whether the Group controls another entity.
Subsidiaries are fully consolidated from the date on which control is transferred to the Group. They are de-consolidated from the date that control ceases.
The acquisition method of accounting is used to account for the acquisition of subsidiaries by the Group (refer to note 1(h)).
Intercompany transactions, balances and unrealised gains on transactions between Group companies are eliminated. Unrealised losses are also eliminated unless the transaction provides evidence of the impairment of the asset transferred. accounting policies of subsidiaries have been changed where necessary to ensure consistency with the policies adopted by the Group.
Investments in subsidiaries are accounted for at cost in the individual financial statements of FlexiGroup Limited.
ii. Employee Share TrustThe consolidated entity utilises a trust to administer the consolidated entities employee share scheme. The trust is consolidated into the consolidated entity.
c. Segment reportingOperating segments are reported in a manner consistent with the internal reporting provided to the chief operating decision maker. The chief operating decision maker, who is responsible for allocating resources and assessing performance of the operating segments, has been identified as the executive management committee.
d. Foreign currency translationi. Functional and presentation currencyItems included in the financial statements of each of the Group’s entities are measured using the currency of the primary economic environment in which the entity operates (‘’the functional currency”). The consolidated financial statements are presented in australian dollars, which is FlexiGroup Limited’s functional and presentation currency.
ii. Transactions and balancesForeign currency transactions are translated into the functional currency using the exchange rates prevailing at the dates of the transactions. Foreign exchange gains and losses resulting from the settlement of such transactions and from the translation at year-end exchange rates of monetary assets and liabilities denominated in foreign currencies are recognised in the income statement, except when they are deferred in equity as qualifying cash flow hedges and qualifying net investment hedges or are attributable to part of the net investments in foreign operations.
Foreign exchange gains and losses that relate to borrowings are presented in the income statement, within finance costs. all other foreign exchange gains and losses are presented in the income statement on a net basis within other income or other expenses.
aS aT 30 JUnE 2011
52
notes to the Financial Statements (continued)
1. Summary of significant accounting policies (continued)
non-monetary items that are measured at fair value in a foreign currency are translated using the exchange rates at the date when the fair value was determined. Translation differences on assets and liabilities carried at fair value are reported as part of the fair value gain or loss. For example, translation differences on non-monetary assets and liabilities such as equities held at fair value through profit or loss are recognised in profit or loss as part of the fair value gain or loss and translation differences on non-monetary assets such as equities classified as available-for-sale financial assets are recognised in other comprehensive income.
iii. Group companiesThe results and financial position of all the Group entities (none of which has the currency of a hyperinflationary economy) that have a functional currency different from the presentation currency are translated into the presentation currency as follows:• assets and liabilities for each balance sheet presented
are translated at the closing rate at the date of the balance sheet
• income and expenses for each income statement and statement of comprehensive income are translated at average exchange rates (unless this is not a reasonable approximation of the cumulative effect of the rates prevailing on the transaction dates, in which case income and expenses are translated at the dates of the transactions), and
• all resulting exchange differences are recognised in other comprehensive income
On consolidation, exchange differences arising from the translation of any net investment in foreign entities, and of borrowings and other financial instruments designated as hedges of such investments, are recognised in other comprehensive income. When a foreign operation is sold or any borrowings forming part of the net investment are repaid, a proportionate share of such exchange difference is recognised in the income statement, as part of the gain or loss on sale where applicable.
Goodwill and fair value adjustments arising on the acquisition of a foreign entity are treated as assets and liabilities of the foreign entities and translated at the closing rate.
e. Revenue recognitionRevenue is measured at the fair value of the consideration received or receivable. amounts disclosed as revenue are net of returns, trade allowances and amounts collected on behalf of third parties.
Revenue is recognised for the major business activities as follows:
i. Lease finance interest revenueLease finance interest revenue is recognised by applying discount rates implicit in the leases to lease balances receivable at the beginning of each payment period.
Secondary lease income, including rental income on extended rental assets is recognised when it is due on an accruals basis. Proceeds from the sale of rental assets are recognised upon disposal of the relevant assets.
ii. Interest income on customer loansInterest income on loans is recognised in the income statement using the effective interest method.
The effective interest method is a method of calculating the amortised cost of a financial asset and of allocation of the interest income over the relevant period. The effective interest rate is the rate that exactly discounts estimated future cash payments or receipts through the expected life of the financial instrument or, when appropriate, a shorter period to the net carrying amount of the financial asset or financial liability. When calculating the effective interest rate, the Group estimates cash flows considering all contractual terms of the financial instrument but does not consider future credit losses.
iii. Equipment protection plan revenueThe Group operates an equipment protection and debt waiver plan entitled Protect Plan. Protect Plan revenue is recognised in the month it is due on an accruals basis. a provision for outstanding expected claims is recognised in the balance sheet for the cost of Protect Plan claims which have been incurred at year end, but have not yet been notified to the Group, or which have been notified to the Group but not yet paid.
iv. Mobile broadband revenue
Revenue relating to the sale of modems is recognised when the Group entity has delivered the goods to the dealer. Delivery does not occur until the products have been shipped to the specified location, the risks of obsolescence and loss have transferred to the dealer and the dealer has accepted the products. Revenue relating to the broadband contracts is recognised on an accruals basis over the life of the contract.
v. Cheque guarantee revenueRevenue is recognised when the service associated with the guarantee has been provided on an accruals basis. all monthly fees are recognised in revenue in the month to which they relate.
vi. Interest income – bank accounts/loss reservesInterest income on bank and loss reserve balances is recognised on an accruals basis.
53
FLEXIGROUP LIMITED FInancIaL REPORT 2011
f. Government grantsGrants from the government are recognised at their fair value where there is reasonable assurance that the grant will be received and the Group will comply with all the attached conditions.
Government grants relating to costs are deferred and recognised in the income statement over the period necessary to match them with the costs that they are intended to compensate.
Government grants relating to the purchase of property, plant and equipment are included in current liabilities as other payables and are credited to the income statement on a straight-line basis over the expected lives of the related assets.
g. Income taxThe income tax expense or revenue for the period is the tax payable on the current period’s taxable income based on the national income tax rate for each jurisdiction adjusted by changes in deferred tax assets and liabilities attributable to temporary differences and to unused tax losses.
The current income tax charge is calculated on the basis of the tax laws enacted or substantively enacted at the end of the reporting period in the countries where the company’s subsidiaries and associates operate and generate taxable income. Management periodically evaluates positions taken in tax returns with respect to situations in which applicable tax regulation is subject to interpretation. It establishes provisions where appropriate on the basis of amounts expected to be paid to the tax authorities.
Deferred tax assets and liabilities are recognised for temporary differences at the tax rates expected to apply when the assets are recovered or liabilities are settled, based on those tax rates which are enacted or substantively enacted for each jurisdiction. The relevant tax rates are applied to the cumulative amounts of deductible and taxable temporary differences to measure the deferred tax asset or liability. an exception is made for certain temporary differences arising from the initial recognition of an asset or a liability. no deferred tax asset or liability is recognised in relation to these temporary differences if they arose in a transaction, other than a business combination, that at the time of the transaction did not affect either accounting or taxable profit or loss.
Deferred tax assets are recognised for deductible temporary differences and unused tax losses only if it is probable that future taxable amounts will be available to utilise those temporary differences and losses.
Deferred tax liabilities and assets are not recognised for temporary differences between the carrying amount and tax bases of investments in controlled entities where the parent entity is able to control the timing of the reversal of the temporary differences and it is probable that the differences will not reverse in the foreseeable future.
current and deferred tax balances attributable to amounts recognised directly in equity are also recognised directly in equity.
Tax consolidation legislationFlexiGroup Limited and its wholly-owned australian controlled entities have implemented the tax consolidation legislation.
The head entity, FlexiGroup Limited, and the controlled entities in the tax consolidated group, account for their own current and deferred tax accounts. These tax amounts are measured as if each entity in the tax consolidation was a stand-alone taxpayer in its own right.
In addition to its own current and deferred tax amounts, FlexiGroup Limited also recognises the current tax liabilities (assets) and the deferred tax assets arising from unused tax losses and unused tax credits assumed from controlled entities in the tax consolidation group.
assets or liabilities arising under tax funding agreements with the tax consolidated entities are recognised as amounts receivable from or payable to other entities in the Group. Details about the tax funding agreement are disclosed in note 6. any difference between the amounts assumed and amounts receivable or payable under the tax funding agreement are recognised as a contribution to (or distribution from) wholly-owned tax consolidation entities.
h. Business combinationsThe acquisition method of accounting is used to account for all business combinations, regardless of whether equity instruments or other assets are acquired. The consideration transferred for the acquisition of a subsidiary comprises the fair values of the assets transferred, the liabilities incurred and the equity interests issued by the Group. The consideration transferred also includes the fair value of any asset or liability resulting from a contingent consideration arrangement and the fair value of any pre-existing equity interest in the subsidiary. acquisition-related costs are expensed as incurred. Identifiable assets acquired and liabilities and contingent liabilities assumed in a business combination are, with limited exceptions, measured initially at their fair values at the acquisition date. On an acquisition-by-acquisition basis, the Group recognises any non-controlling interest in the acquiree either at fair value or at the non-controlling interest’s proportionate share of the acquiree’s net identifiable assets.
aS aT 30 JUnE 2011
54
notes to the Financial Statements (continued)
1. Summary of significant accounting policies (continued)
The excess of the consideration transferred, the amount of any non-controlling interest in the acquiree and the acquisition-date fair value of any previous equity interest in the acquiree over the fair value of the Group’s share of the net identifiable assets acquired is recorded as goodwill. If those amounts are less than the fair value of the net identifiable assets of the subsidiary acquired and the measurement of all amounts has been reviewed, the difference is recognised directly in profit or loss as a bargain purchase.
Where settlement of any part of cash consideration is deferred, the amounts payable in the future are discounted to their present value as at the date of exchange. The discount rate used is the entity’s incremental borrowing rate, being the rate at which a similar borrowing could be obtained from an independent financier under comparable terms and conditions.
contingent consideration is classified either as equity or a financial liability. amounts classified as a financial liability are subsequently remeasured to fair value with changes in fair value recognised in profit or loss.
i. Lease receivables – Group is lessorThe Group has classified its leases as finance leases for accounting purposes. Under a finance lease, substantially all the risks and benefits incidental to the ownership of the leased asset are transferred by the lessor to the lessee. The Group recognises at the beginning of the lease term an asset at an amount equal to the aggregate of the present value (discounted at the interest rate implicit in the lease) of the minimum lease payments and an estimate of the value of any unguaranteed residual value expected to accrue to the benefit of the Group at the end of the lease term.
i. Unearned interestUnearned interest on leases and other receivables is brought to account over the life of the lease contract based on the interest rate implicit in the lease.
ii. Initial direct transaction costsInitial direct costs (leases) or transaction costs (loans) incurred in the origination of leases and loans are included as part of receivables in the balance sheet and are amortised in the calculation of lease income and interest income.
j. Loan receivablesLoan receivables are non-derivative financial assets with fixed or determinable payments that are not quoted in an active market. They arise when the Group provides loans to customers via products such as personal loans and certegy Ezi-pay.
k. Allowance for lossesThe collectability of lease and loan receivables is assessed on an ongoing basis. a provision is made for losses based on historical roll rates of arrears and the current delinquency position of the portfolio.
l. Trade receivablesTrade receivables are recognised initially at fair value and subsequently measured at amortised cost, using the effective interest rate method, less provision for impairment. Trade receivables are generally due for settlement within 30 days. They are presented as current assets unless collection is not expected for more than 12 months after the reporting date.
collectability of trade receivables is reviewed on an ongoing basis. Debts which are known to be uncollectible are written off by reducing the carrying amount directly. an allowance account (provision for impairment of trade receivables) is used when there is objective evidence that the Group will not be able to collect all amounts due according to the original terms of the receivables. Significant financial difficulties of the debtor, probability that the debtor will enter bankruptcy or financial reorganisation, and default or delinquency in payments (more than 60 days overdue) are considered indicators that the trade receivable is impaired. The amount of the impairment allowance is the difference between the asset’s carrying amount and the present value of estimated future cash flows, discounted at the original effective interest rate. cash flows relating to short-term receivables are not discounted if the effect of discounting is immaterial.
The amount of the impairment loss is recognised in the income statement. When a trade receivable for which an impairment allowance had been recognised becomes uncollectible in a subsequent period, it is written off against the allowance account.
m. Leases – used by the GroupLeases of property, plant and equipment where the Group has substantially all the risks and rewards of ownership are classified as finance leases. Finance leases are capitalised at the lease’s inception at the lower of the fair value of the leased property or the present value of the minimum lease payments. The corresponding rental obligations, net of finance charges, are included in other long-term payables. Each lease payment is allocated between the liability and finance cost. The finance cost is charged to the income statement over the lease period so as to produce a constant periodic rate of interest on the remaining balance of the liability for each period. The property, plant and equipment acquired under finance leases are depreciated over the shorter of the asset’s useful life and the lease term.
55
FLEXIGROUP LIMITED FInancIaL REPORT 2011
Leases in which a significant portion of the risks and rewards of ownership are retained by the lessor are classified as operating leases (note 30). Payments made under operating leases (net of any incentives received from the lessor) are charged to the income statement on a straight-line basis over the period of the lease.
In the event of the Group sub-leasing any of its operating leases, the lease income is recognised on a straight-line basis over the lease term.
n. Cash and cash equivalentsFor statement of cash flows presentation purposes, cash and cash equivalents includes cash on hand, deposits held at call with financial institutions, other short-term, highly liquid investments with original maturities of three months or less that are readily convertible to known amounts of cash and which are subject to an insignificant risk of changes in value, and bank overdrafts. Bank overdrafts are shown within borrowings in current liabilities on the balance sheet.
o. InvestmentsThe Group classifies its investments in the following categories: financial assets at fair value through profit or loss, loans and receivables, held-to-maturity investments, and available-for-sale financial assets. The classification depends on the purpose for which the investments were acquired. Management determines the classification of its investments at initial recognition and, in the case of assets classified as held-to-maturity, re-evaluates this designation at the end of each reporting period.
i. Financial assets at fair value through profit or lossFinancial assets at fair value through profit or loss are financial assets held for trading which are acquired principally for the purpose of selling in the short term with the intention of making a profit. Derivatives are also categorised as held for trading unless they are designated as hedges. assets in this category are classified as current assets if they are expected to be settled within 12 months; otherwise they are classified as non-current.
The Group had no assets in this category at 30 June 2011.
ii. Loans and receivablesLoans and receivables are non-derivative financial assets with fixed or determinable payments that are not quoted in an active market. They arise when the Group provides money, goods or services directly to a debtor with no intention of selling the receivables. They are included in current assets, except for those with maturities greater than 12 months after the balance sheet date (notes 8, 9, 12 and 13).
iii. Held-to-maturity investmentsHeld-to-maturity investments are non-derivative financial assets with fixed or determinable payments and fixed maturities that the Group’s management has the positive intention and ability to hold to maturity.
The Group had no assets in this category at 30 June 2011.
iv. Available-for-sale financial assetsavailable-for-sale financial assets, comprising principally marketable equity securities, are non derivatives that are either designated in this category or not classified in any of the other categories. They are included in non-current assets unless the investment matures or management intends to dispose of the investment within 12 months of the end of the reporting period. Investments are designated as available for sale if they do not have fixed maturities and fixed or determinable payments and management intends to hold them for the medium to long term.
The Group had no assets in this category at 30 June 2011.
p. Derivatives and hedging activitiesDerivatives are initially recognised at fair value on the date a derivative contract is entered into and are subsequently remeasured to their fair value at the end of each reporting period. The accounting for subsequent changes in fair value depends on whether the derivative is designated as a hedging instrument, and if so, the nature of the item being hedged.
The Group designates all derivatives held as at 30 June 2011 as hedges of a particular risk associated with the cash flows of recognised assets and liabilities and highly probable forecast transactions (cash flow hedges).
The Group documents at the inception of the hedging transaction the relationship between hedging instruments and hedged items, as well as its risk management objective and strategy for undertaking various hedge transactions. The Group also documents its assessment, both at hedge inception and on an ongoing basis, of whether the derivatives that are used in hedging transactions have been, and will continue to be, highly effective in offsetting changes in fair values or cash flows of hedged items.
The fair values of various derivative financial instruments used for hedging purposes are disclosed in note 25. Movements in the hedging reserve in shareholders’ equity are shown in note 27. The full fair value of a hedging derivative is classified as a non-current asset or liability when the remaining maturity of the hedged item is more than 12 months; it is classified as a current asset or liability when the remaining maturity of the hedged item is less than 12 months. Trading derivatives are classified as a current asset or liability.
aS aT 30 JUnE 2011
56
notes to the Financial Statements (continued)
1. Summary of significant accounting policies (continued)
The effective portion of changes in the fair value of derivatives that are designated and qualify as cash flow hedges is recognised in other comprehensive income and accumulated in reserves in equity. The gain or loss relating to the ineffective portion is recognised immediately in profit or loss within other income or other expense.
amounts accumulated in equity are reclassified to profit or loss in the periods when the hedged item affects profit or loss (for instance when the forecast sale that is hedged takes place). The gain or loss relating to the effective portion of interest rate swaps hedging variable rate borrowings is recognised in profit or loss within “finance costs”. However, when the forecast transaction that is hedged results in the recognition of a non-financial asset (for example, inventory or fixed assets) the gains and losses previously deferred in equity are reclassified from equity and included in the initial measurement of the cost of the asset. The deferred amounts are ultimately recognised in profit or loss as cost of goods sold in the case of inventory, or as depreciation or impairment in the case of fixed assets.
When a hedging instrument expires or is sold or terminated, or when a hedge no longer meets the criteria for hedge accounting, any cumulative gain or loss existing in equity at that time remains in equity and is recognised when the forecast transaction is ultimately recognised in profit or loss. When a forecast transaction is no longer expected to occur, the cumulative gain or loss that was reported in equity is immediately reclassified to profit or loss.
q. Inventoriesi. Rental equipment
Rental equipment is carried at the lower of cost and net realisable value and comprises returned rental equipment and items remaining on rental after the end of the contractual rental period.
ii. Mobile broadband stockMobile broadband stock is stated at the lower of cost and net realisable value.
r. Plant and equipmentPlant and equipment is stated at historical cost less depreciation. Historical cost includes expenditure that is directly attributable to the acquisition of the items. cost may also include transfers from equity of any gains/losses on qualifying cash flow hedges of foreign currency purchases of plant and equipment.
Subsequent costs are included in the asset’s carrying amount or recognised as a separate asset, as appropriate, only when it is probable that future economic benefits associated with the item will flow to the Group and the cost of the item can be measured reliably. all repairs and maintenance are charged to the income statement during the reporting period in which they are incurred.
Depreciation is calculated using the diminishing value method to allocate their cost or revalue amounts, net of their residual values, over their estimated useful lives, as follows:Depreciable assets Depreciation rate
Plant and equipment 20–40%
The assets’ residual values and useful lives are reviewed, and adjusted if appropriate, at each balance sheet date.
an asset’s carrying amount is written down immediately to its recoverable amount if the asset’s carrying amount is greater than its estimated recoverable amount.
Gains and losses on disposals are determined by comparing proceeds with the carrying amount of the asset disposed. These are included in the income statement.
s. Intangiblesi. GoodwillGoodwill represents the excess of the cost of an acquisition over the fair value of the Group’s share of the net identifiable assets of the acquired subsidiary at the date of acquisition. Goodwill on acquisitions of subsidiaries is included in intangible assets. Goodwill is not amortised. Instead, goodwill is tested for impairment annually or more frequently if events or changes in circumstances indicate that it might be impaired, and is carried at cost less accumulated impairment losses. Gains and losses on the disposal of an entity include the carrying amount of goodwill relating to the entity sold.
ii. Software costs incurred on software development projects (relating to the design and testing of new or improved software products) are recognised as intangible assets when it is probable that the project will be a success, considering its commercial and technical feasibility, and its costs can be measured reliably. The expenditure capitalised comprises all directly attributable costs, including direct labour. Other development expenditures that do not meet these criteria are recognised as an expense as incurred. capitalised development costs are recorded as an intangible asset and amortised from the point at which the asset is ready for use over its useful life, which is assessed at 2.5 to 5 years.
57
FLEXIGROUP LIMITED FInancIaL REPORT 2011
iii. Contractual payments for access rightsPayments to dealers or dealer groups that result in the Group acquiring a preference to supply services are capitalised as intangible assets, and amortisation commences from the start of the supply service period. The carrying value is tested for impairment annually or more frequently if events or changes in circumstances indicate it might be impaired. The amount disclosed as the balance of access rights in note 17 is amortised over the period from april 2011 to april 2015.
iv. Merchant relationshipsMerchant relationships acquired as part of a business combination are recognised separately from goodwill. The assets are measured at fair value at the date of acquisition less accumulated amortisation and impairment losses. amortisation is calculated based on the timing of the projected cash flows of the relationships, generally 5 years.
v. Credit softwarecredit software assets acquired as part of a business combination represent software to assist in the assessment of the credit worthiness of customers. The assets are measured at fair value at the date of acquisition less accumulated amortisation and impairment losses. amortisation is calculated based on the expected useful life of the software, generally 4 years.
t. Impairment of assetsGoodwill and intangible assets that have an indefinite useful life are not subject to amortisation and are tested annually for impairment, or more frequently if events or changes in circumstances indicate that they might be impaired. Other assets are reviewed for impairment whenever events or changes in circumstances indicate that the carrying amount may not be recoverable. an impairment loss is recognised for the amount by which the asset’s carrying amount exceeds its recoverable amount. The recoverable amount is the higher of an asset’s fair value less costs to sell and value in use. For the purpose of assessing impairment, assets are grouped at the lowest levels for which there are separately identifiable cash inflows which are largely independent of the cash inflows from other assets or groups of assets (cash generating units). non-financial assets other than goodwill that suffered an impairment are reviewed for possible reversal of the impairment at each reporting date.
u. Trade and other payablesThese amounts represent liabilities for goods and services provided to the Group prior to the financial year which are unpaid. The amounts are unsecured and are usually paid within 30 days of recognition. Trade and other payables are presented as current liabilities unless payment is not due within 12 months from the reporting date. They are recognised initially at their fair value and subsequently measured at amortised cost using the effective interest method.
v. BorrowingsBorrowings are initially recognised at fair value, net of transaction costs incurred. Borrowings are subsequently measured at amortised cost. any difference between the proceeds (net of transaction costs) and the redemption amount is recognised in the income statement over the period of the borrowings using the effective interest method. Fees paid on the establishment of loan facilities, which are not an incremental cost relating to the actual draw-down of the facility, are recognised as prepayments and amortised on a straight-line basis over the term of the facility.
Borrowings are removed from the balance sheet when the obligation specified in the contract is discharged, cancelled or expired. The difference between the carrying amount of a financial liability that has been extinguished or transferred to another party and the consideration paid, including any non-cash assets transferred or liabilities assumed, is recognised in other income or other expenses.
Where the terms of a financial liability are renegotiated and the entity issues equity instruments to a creditor to extinguish all or part of the liability (debt for equity swap), a gain or loss is recognised in profit or loss, which is measured as the difference between the carrying amount of the financial liability and the fair value of the equity instruments issued.
Borrowings are classified as current liabilities unless the Group has an unconditional right to defer settlement of the liability for at least 12 months after the balance sheet date.
w. Borrowing costsBorrowing costs are expensed.
x. ProvisionsProvisions for legal claims and service warranties are recognised when the Group has a present legal or constructive obligation as a result of past events if it is probable that an outflow of resources will be required to settle the obligation, and the amount has been reliably estimated. Provisions are not recognised for future operating losses.
Where there are a number of similar obligations, the likelihood that an outflow will be required in settlement is determined by considering the class of obligations as a whole. a provision is recognised even if the likelihood of an outflow with respect to any one item included in the same class of obligations may be small.
Provisions are measured at the present value of management’s best estimate of the expenditure required to settle the present obligation at the balance sheet date. The discount rate used to determine the present value reflects current market assessments of the value of money and the risks specific to the liability. The increase in the provision due to the passage of time is recognised as interest expense.
aS aT 30 JUnE 2011
58
notes to the Financial Statements (continued)
1. Summary of significant accounting policies (continued)
y. Employee benefitsi. Wages and salaries, annual leave and sick leaveLiabilities for wages and salaries, including non-monetary benefits, annual leave and accumulating vesting sick leave expected to be settled within 12 months of the reporting date are recognised in other payables in respect of employees’ services up to the reporting date and are measured at the amounts expected to be paid when the liabilities are settled.
ii. Long service leaveThe liability for long service leave is recognised in the provision for employee benefits and measured as the present value of expected future payments to be made in respect of services provided by employees up to the reporting date using the projected unit credit method. consideration is given to expected future wage and salary levels, experience of employee departures and periods of service. Expected future payments are discounted using market yields at the reporting date on national government bonds with terms to maturity and currency that match as closely as possible the estimated future cash outflows.
iii. Profit-sharing and bonus plansThe Group recognises a provision where contractually obliged or where there is a past practice that has created a constructive obligation.
iv. Share-based paymentsShare-based compensation benefits are provided to certain employees. Information relating to these schemes is set out in note 37.
The fair value of such instruments is recognised as an expense with a corresponding increase in equity. The fair value is measured at grant date and recognised over the period during which the relevant party becomes unconditionally entitled to the instruments.
Fair values at grant date are independently determined using a binomial tree option pricing methodology that takes into account the exercise price, the term of the options, the impact of dilution, the share price at grant date and expected price volatility of the underlying share, the expected dividend yield and the risk-free interest rate for the term of the options.
The fair value of the instruments granted is adjusted to reflect market vesting conditions, but excludes the impact of any non-market vesting conditions (for example, profitability and sales growth targets). non-market vesting conditions are included in assumptions about the number and value of instruments that are expected to become exercisable. The share-based payment expense recognised each period takes into account the most recent estimate.
Upon the exercise of instruments, the balance of the share-based payments reserve relating to those instruments is transferred to share capital and the proceeds received (if any), net of any directly attributable transaction costs, are credited to share capital.
z. Contributed equityOrdinary shares are classified as equity.
Incremental costs directly attributable to the issue of new shares or options are shown in equity as a deduction, net of tax, from the proceeds.
Where any Group company purchases the company’s equity instruments, for example as the result of a share buy-back or a share-based payment plan, the consideration paid, including any directly attributable incremental costs (net of income taxes) is deducted from equity attributable to the owners of FlexiGroup Limited as treasury shares until the shares are cancelled or reissued. Where such ordinary shares are subsequently reissued, any consideration received, net of any directly attributable incremental transaction costs and the related income tax effects, is included in equity attributable to the owners of FlexiGroup Limited.
aa. DividendsProvision is made for the amount of any dividend declared, being appropriately authorised and no longer at the discretion of the entity, on or before the end of the financial year but not distributed at balance date.
ab. Earnings Per Sharei. Basic earnings per shareBasic earnings per share is calculated by dividing the profit attributable to equity holders of the company, excluding any costs of servicing equity other than ordinary shares, by the weighted average number of ordinary shares outstanding during the financial year, adjusted for bonus elements in ordinary shares issued during the year.
ii. Diluted earnings per shareDiluted earnings per share adjusts the figures used in the determination of basic earnings per share to take into account the after income tax effect of interest and other financing costs associated with dilutive potential ordinary shares and the weighted average number of shares assumed to have been used for no consideration in relation to dilutive potential ordinary shares.
59
FLEXIGROUP LIMITED FInancIaL REPORT 2011
ac. Goods and Services Tax (GST)Revenues, expenses and assets are recognised net of the amount of associated GST, unless the GST incurred is not recoverable from taxation authorities. In this case it is recognised as part of the cost of acquisition of the asset or as part of the expense.
In the balance sheets receivables and payables are stated inclusive of the amount of GST receivable or payable, with the exception of lease receivables, which are shown net of GST on the rentals not yet due. The net amount of GST recoverable from, or payable to, the taxation authority is included with other receivables or payables in the balance sheet.
cash flows are presented on a gross basis. The GST components of cash flows arising from investing or financing activities which are recoverable from, or payable, to the taxation authority are presented as operating cash flows.
ad. Rounding of amountsThe company is of a kind referred to in class Order 98/100, issued by the australian Securities and Investments commission, relating to the “rounding off” of amounts in the financial statements. amounts in the financial statements have been rounded off in accordance with that class Order to the nearest thousand dollars.
ae. Parent entity financial informationThe financial information for the parent entity, FlexiGroup Limited, disclosed in note 41 has been prepared on the same basis as the consolidated financial statements, except as set out below.
i Investments in subsidiariesInvestments in subsidiaries are accounted for at cost less allowance for impairment in the financial statements of FlexiGroup Limited.
ii Tax consolidation legislationFlexiGroup Limited and its wholly owned australian controlled entities have implemented the tax consolidation legislation.
The head entity, FlexiGroup Limited, and the controlled entities in the tax consolidated group account for their own current and deferred tax amounts. These tax amounts are measured as if each entity in the tax consolidated group continues to be a stand alone taxpayer in its own right.
In addition to its own current and deferred tax amounts, FlexiGroup Limited also recognises the current tax liabilities (or assets) and the deferred tax assets arising from unused tax losses and unused tax credits assumed from controlled entities in the tax consolidated group.
The entities have also entered into a tax funding agreement as detailed in note 6 (c).
af. New accounting standards certain new accounting standards have been published that are not mandatory for 30 June 2011 reporting periods. The Group’s assessment of the impact of these new standards and interpretations is set out below.
(i) AASB 9 Financial Instruments, AASB 2009–11 Amendments to Australian Accounting Standards arising from AASB 9 and AASB 2010–7 Amendments to Australian Accounting Standards arising from AASB 9 (December 2010) (effective from 1 January 2013)aaSB 9 Financial Instruments addresses the classification, measurement and derecognition of financial assets and financial liabilities. The standard is not applicable until 1 January 2013 but is available for early adoption.
There will be no impact on the Group’s accounting for financial liabilities, as the new requirements only affect the accounting for financial liabilities that are designated as at fair value through profit or loss and the Group does not have any such liabilities.
(ii) Revised AASB 124 Related Party Disclosures and AASB 2009–12 Amendments to Australian Accounting Standards (effective for annual reporting periods beginning on or after 1 January 2011)In December 2009 the aaSB issued a revised aaSB 124 Related Party Disclosures. It is effective for accounting periods beginning on or after 1 January 2011 and must be applied retrospectively. The amendment clarifies and simplifies the definition of a related party. The Group will apply the amended standard from 1 July 2011. It is not expected to have any effect on the Group’s or the parent entity’s related party disclosures.
(iii) AASB 1053 Application of Tiers of Australian Accounting Standards and AASB 2010–2 Amendments to Australian Accounting Standards arising from Reduced Disclosure Requirements (effective from 1 July 2013)On 30 June 2010 the aaSB officially introduced a revised differential reporting framework in australia. Under this framework, a two-tier differential reporting regime applies to all entities that prepare general purpose financial statements. FlexiGroup Limited is listed on the aSX and is therefore not eligible to adopt the new australian accounting Standards – Reduced Disclosure Requirements. as a consequence, the two standards will therefore have no impact on the financial statements of the Group.
aS aT 30 JUnE 2011
60
notes to the Financial Statements (continued)
1. Summary of significant accounting policies (continued)
(iv) AASB 2010–3 Amendments to Australian Accounting Standards arising from the Annual Improvements Project and AASB 2010–4 Further Amendments to Australian Accounting Standards arising from the Annual Improvements Project (effective for annual periods beginning on or after 1 July 2010/1 January 2011)In June 2010, the aaSB made a number of amendments to australian accounting Standards as a result of the IaSB’s annual improvements project. The Group does not expect that any material adjustments will be necessary as the result of applying the revised rules.
(v) IFRS 13 Fair Value Measurement (effective 1 January 2013)IFRS 13 was released in May 2011. The aaSB is expected to issue an equivalent australian standard shortly. IFRS 13 explains how to measure fair value and aims to enhance fair value disclosures. The Group does not use fair value measurements extensively. It is therefore unlikely that the new rules will have a significant impact on any of the amounts recognised in the financial statements. However, application of the new standard will impact the type of information disclosed in the notes to the financial statements. at this stage, the Group does not intend to adopt the new standard before its operative date, which means that it would be first applied in the annual reporting period ending 30 June 2014.
(vi) Revised IAS 1 Presentation of Financial Statements (effective 1 July 2012)In June 2011, the IaSB made an amendment to IaS 1 Presentation of Financial Statements. The aaSB is expected to make equivalent changes to aaSB 101 shortly. The amendment requires entities to separate items presented in other comprehensive income into two groups, based on whether they may be recycled to profit or loss in the future. It will not affect the measurement of any of the items recognised in the balance sheet or the profit or loss in the current period. The Group intends to adopt the new standard from 1 July 2012.
(vii) AASB 2011–4 Amendments to Australian Accounting Standards to Remove Individual Key Management Personnel Disclosure Requirements (effective 1 July 2013)In July 2011 the aaSB decided to remove the individual key management personnel (KMP) disclosure requirements from aaSB 124 Related Party Disclosures, to achieve consistency with the international equivalent standard and remove a duplication of the requirements with the corporations act 2001. While this will reduce the disclosures that are currently required in the notes to the financial statements, it will not affect any of the amounts recognised in the financial statements. The amendments apply from 1 July 2013 and cannot be adopted early. The corporations act requirements in relation to remuneration reports will remain unchanged for now, but these requirements are currently subject to review and may also be revised in the near future.
2. Critical accounting estimates
Estimates and judgements are continually evaluated and are based on historical experience and other factors, including expectations of future events that may have a financial impact on the entity and that are believed to be reasonable under the circumstances.
Critical accounting estimates and assumptionsThe Group makes estimates and assumptions concerning the future. The resulting accounting estimates will, by definition, seldom equal the related actual results. The estimates and assumptions that have a significant risk of causing a material adjustment to the carrying amount of assets and liabilities within the next financial year are discussed below.
i. Estimation of unguaranteed residuals on leasesThe Group estimates the value of unguaranteed lease residuals based on its prior experience for similar contracts.
ii. Allowance for lossesThe Group estimates losses incurred on its loans and lease receivables in accordance with the policy set out in note 1(k).
iii. Assessment of impairment of goodwill and investment in subsidiariesUnder the accounting standards, the Group is required to perform an annual assessment as to whether there has been any impairment of its goodwill. In addition, the Group is required to perform an impairment assessment of other assets in the event it identifies an indicator of impairment. Details of the basis of performance of the assessment is set out in note 16.
iv. Fair value of financial instrumentsall derivatives are recognised and measured at fair value. The derivatives are valued using valuation techniques that utilize observable market inputs. The fair value of financial instruments is included within note 25.
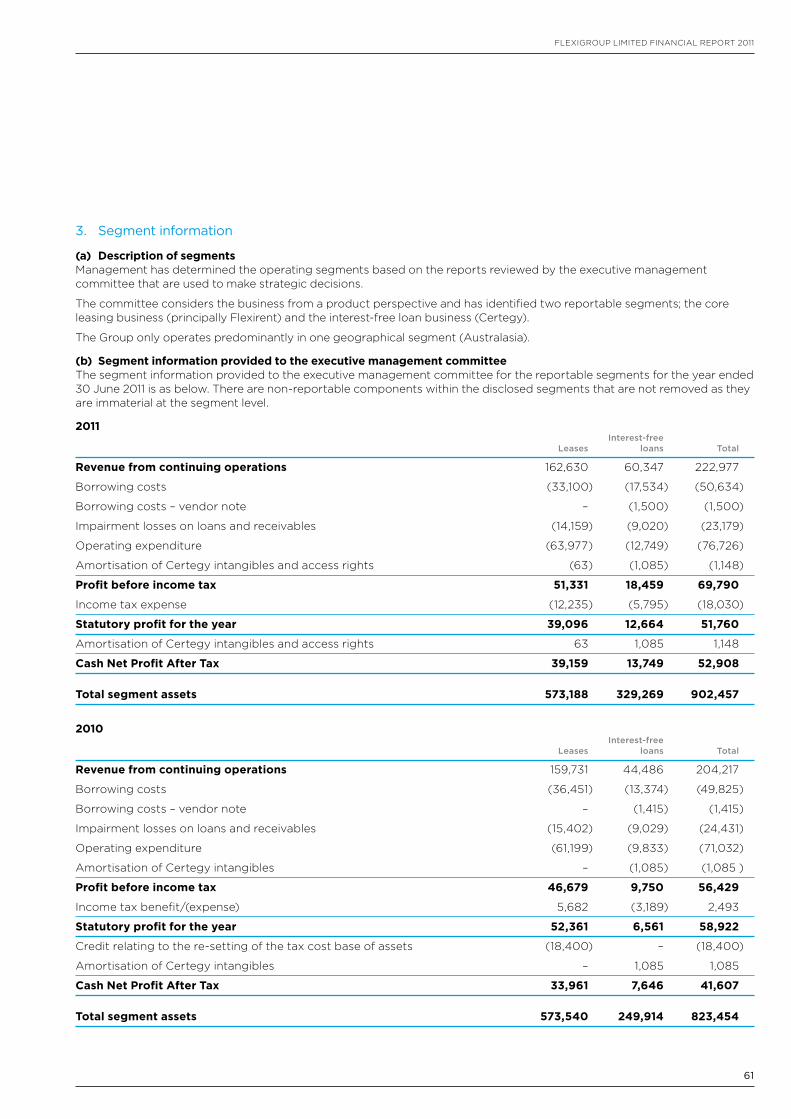
61
FLEXIGROUP LIMITED FInancIaL REPORT 2011
3. Segment information
(a) Description of segmentsManagement has determined the operating segments based on the reports reviewed by the executive management committee that are used to make strategic decisions.
The committee considers the business from a product perspective and has identified two reportable segments; the core leasing business (principally Flexirent) and the interest-free loan business (certegy).
The Group only operates predominantly in one geographical segment (australasia).
(b) Segment information provided to the executive management committeeThe segment information provided to the executive management committee for the reportable segments for the year ended 30 June 2011 is as below. There are non-reportable components within the disclosed segments that are not removed as they are immaterial at the segment level.
2011 Interest-free Leases loans Total
Revenue from continuing operations 162,630 60,347 222,977
Borrowing costs (33,100) (17,534) (50,634)
Borrowing costs – vendor note – (1,500) (1,500)
Impairment losses on loans and receivables (14,159) (9,020) (23,179)
Operating expenditure (63,977) (12,749) (76,726)
amortisation of certegy intangibles and access rights (63) (1,085) (1,148)
Profit before income tax 51,331 18,459 69,790
Income tax expense (12,235) (5,795) (18,030)
Statutory profit for the year 39,096 12,664 51,760
amortisation of certegy intangibles and access rights 63 1,085 1,148
Cash Net Profit After Tax 39,159 13,749 52,908
Total segment assets 573,188 329,269 902,457
2010 Interest-free Leases loans Total
Revenue from continuing operations 159,731 44,486 204,217
Borrowing costs (36,451) (13,374) (49,825)
Borrowing costs – vendor note – (1,415) (1,415)
Impairment losses on loans and receivables (15,402) (9,029) (24,431)
Operating expenditure (61,199) (9,833) (71,032)
amortisation of certegy intangibles – (1,085) (1,085 )
Profit before income tax 46,679 9,750 56,429
Income tax benefit/(expense) 5,682 (3,189) 2,493
Statutory profit for the year 52,361 6,561 58,922
credit relating to the re-setting of the tax cost base of assets (18,400) – (18,400)
amortisation of certegy intangibles – 1,085 1,085
Cash Net Profit After Tax 33,961 7,646 41,607
Total segment assets 573,540 249,914 823,454
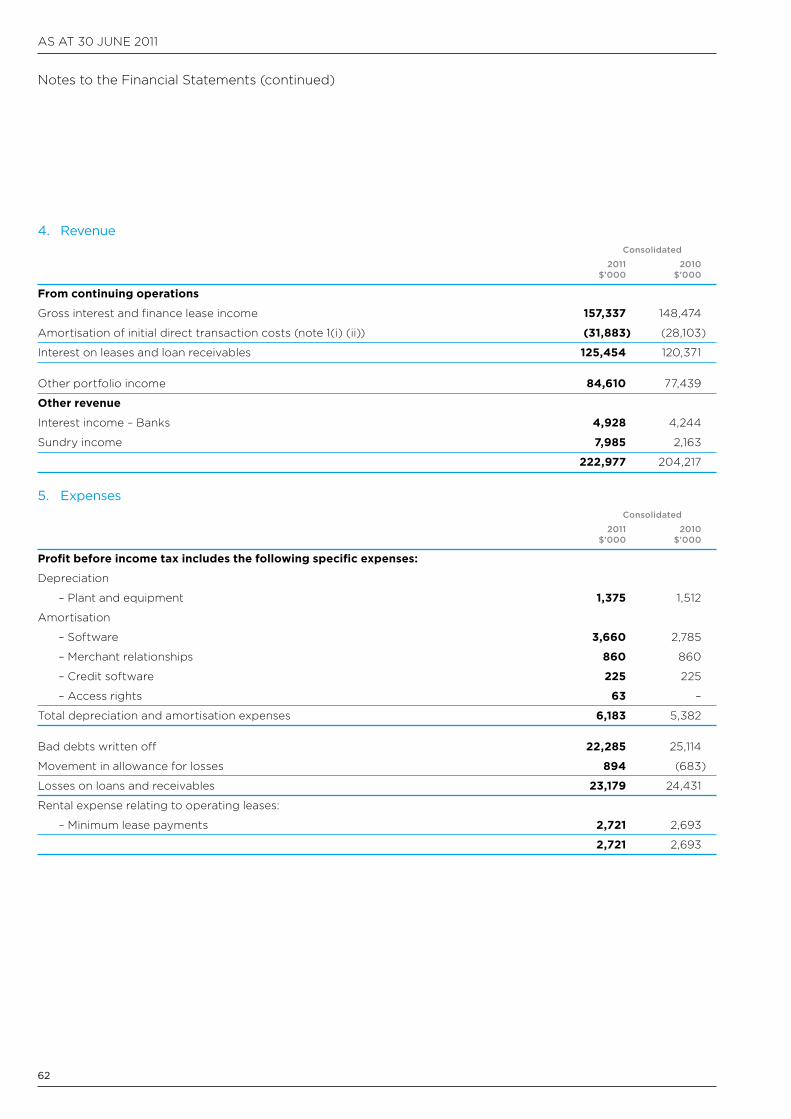
aS aT 30 JUnE 2011
62
notes to the Financial Statements (continued)
4. Revenue Consolidated
2011 2010 $’000 $’000
From continuing operations
Gross interest and finance lease income 157,337 148,474
amortisation of initial direct transaction costs (note 1(i) (ii)) (31,883) (28,103)
Interest on leases and loan receivables 125,454 120,371
Other portfolio income 84,610 77,439
Other revenue
Interest income – Banks 4,928 4,244
Sundry income 7,985 2,163
222,977 204,217
5. Expenses Consolidated
2011 2010 $’000 $’000
Profit before income tax includes the following specific expenses:
Depreciation
– Plant and equipment 1,375 1,512
amortisation
– Software 3,660 2,785
– Merchant relationships 860 860
– credit software 225 225
– access rights 63 –
Total depreciation and amortisation expenses 6,183 5,382
Bad debts written off 22,285 25,114
Movement in allowance for losses 894 (683)
Losses on loans and receivables 23,179 24,431
Rental expense relating to operating leases:
– Minimum lease payments 2,721 2,693
2,721 2,693
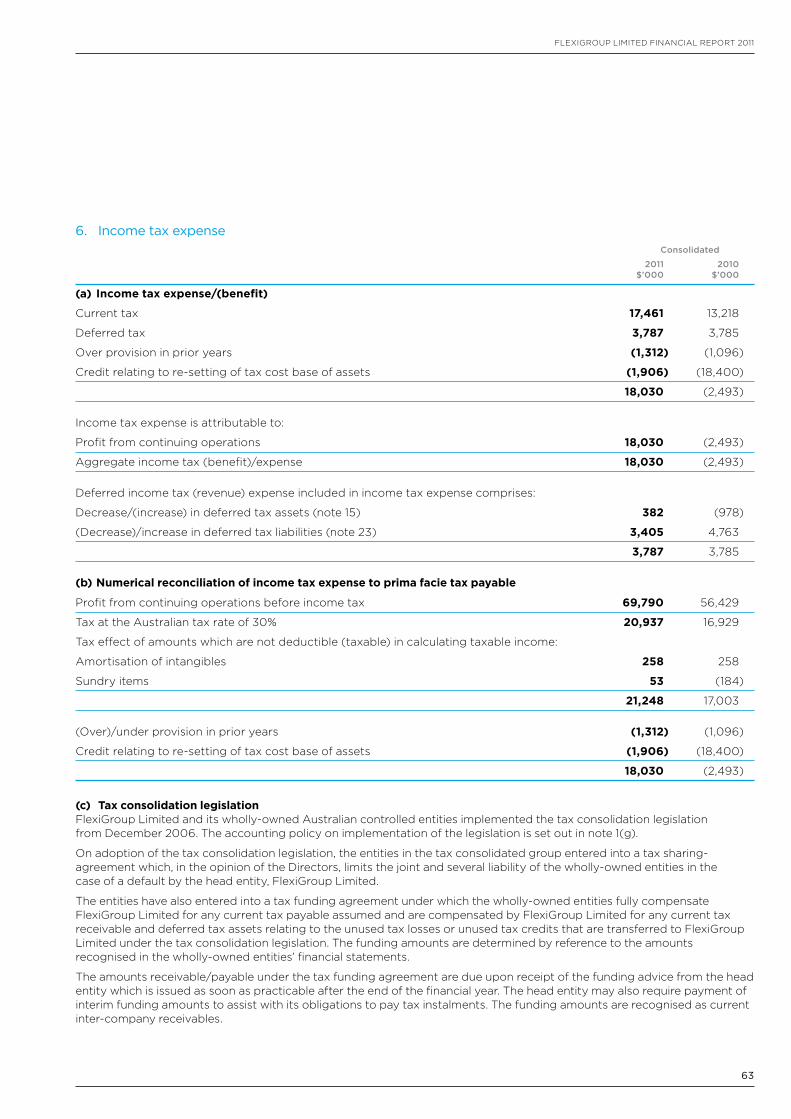
63
FLEXIGROUP LIMITED FInancIaL REPORT 2011
6. Income tax expense Consolidated
2011 2010 $’000 $’000
(a) Income tax expense/(benefit)
current tax 17,461 13,218
Deferred tax 3,787 3,785
Over provision in prior years (1,312) (1,096)
credit relating to re-setting of tax cost base of assets (1,906) (18,400)
18,030 (2,493)
Income tax expense is attributable to:
Profit from continuing operations 18,030 (2,493)
aggregate income tax (benefit)/expense 18,030 (2,493)
Deferred income tax (revenue) expense included in income tax expense comprises:
Decrease/(increase) in deferred tax assets (note 15) 382 (978)
(Decrease)/increase in deferred tax liabilities (note 23) 3,405 4,763
3,787 3,785
(b) Numerical reconciliation of income tax expense to prima facie tax payable
Profit from continuing operations before income tax 69,790 56,429
Tax at the australian tax rate of 30% 20,937 16,929
Tax effect of amounts which are not deductible (taxable) in calculating taxable income:
amortisation of intangibles 258 258
Sundry items 53 (184)
21,248 17,003
(Over)/under provision in prior years (1,312) (1,096)
credit relating to re-setting of tax cost base of assets (1,906) (18,400)
18,030 (2,493)
(c) Tax consolidation legislationFlexiGroup Limited and its wholly-owned australian controlled entities implemented the tax consolidation legislation from December 2006. The accounting policy on implementation of the legislation is set out in note 1(g).
On adoption of the tax consolidation legislation, the entities in the tax consolidated group entered into a tax sharing-agreement which, in the opinion of the Directors, limits the joint and several liability of the wholly-owned entities in the case of a default by the head entity, FlexiGroup Limited.
The entities have also entered into a tax funding agreement under which the wholly-owned entities fully compensate FlexiGroup Limited for any current tax payable assumed and are compensated by FlexiGroup Limited for any current tax receivable and deferred tax assets relating to the unused tax losses or unused tax credits that are transferred to FlexiGroup Limited under the tax consolidation legislation. The funding amounts are determined by reference to the amounts recognised in the wholly-owned entities’ financial statements.
The amounts receivable/payable under the tax funding agreement are due upon receipt of the funding advice from the head entity which is issued as soon as practicable after the end of the financial year. The head entity may also require payment of interim funding amounts to assist with its obligations to pay tax instalments. The funding amounts are recognised as current inter-company receivables.
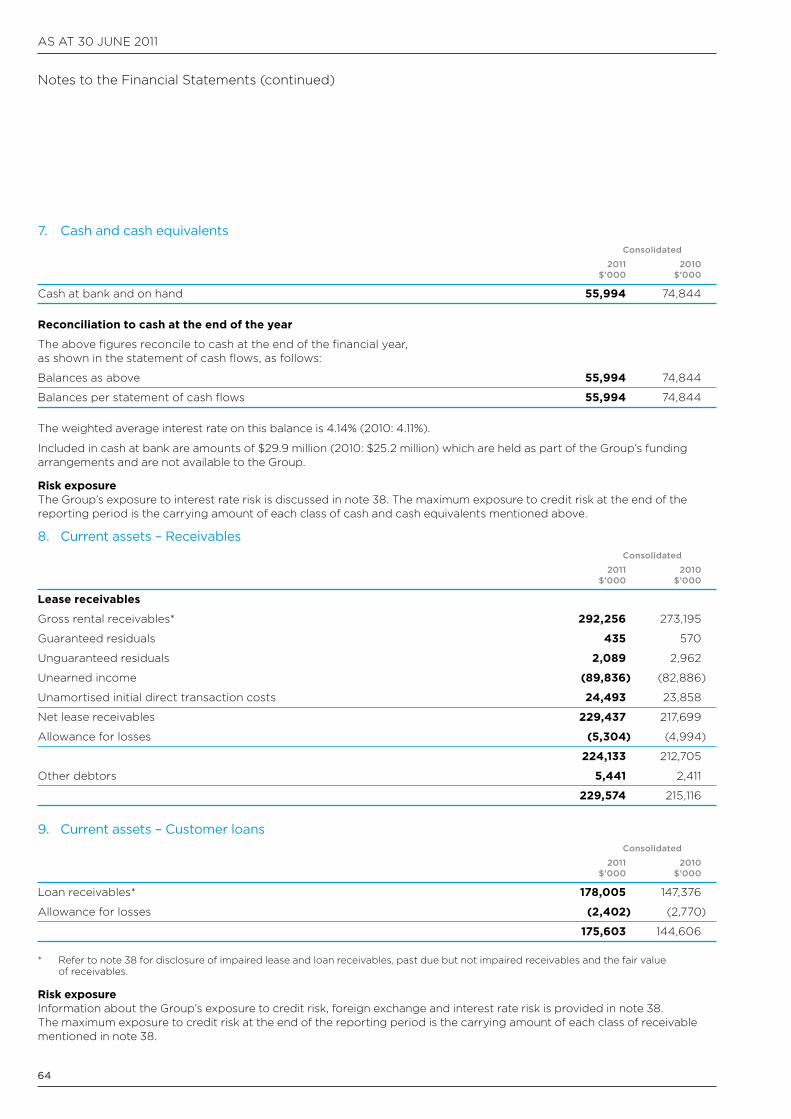
aS aT 30 JUnE 2011
64
7. Cash and cash equivalents Consolidated
2011 2010 $’000 $’000
cash at bank and on hand 55,994 74,844
Reconciliation to cash at the end of the year
The above figures reconcile to cash at the end of the financial year, as shown in the statement of cash flows, as follows:
Balances as above 55,994 74,844
Balances per statement of cash flows 55,994 74,844
The weighted average interest rate on this balance is 4.14% (2010: 4.11%).
Included in cash at bank are amounts of $29.9 million (2010: $25.2 million) which are held as part of the Group’s funding arrangements and are not available to the Group.
Risk exposureThe Group’s exposure to interest rate risk is discussed in note 38. The maximum exposure to credit risk at the end of the reporting period is the carrying amount of each class of cash and cash equivalents mentioned above.
8. Current assets – Receivables Consolidated
2011 2010 $’000 $’000
Lease receivables
Gross rental receivables* 292,256 273,195
Guaranteed residuals 435 570
Unguaranteed residuals 2,089 2,962
Unearned income (89,836) (82,886)
Unamortised initial direct transaction costs 24,493 23,858
net lease receivables 229,437 217,699
allowance for losses (5,304) (4,994)
224,133 212,705
Other debtors 5,441 2,411
229,574 215,116
9. Current assets – Customer loans Consolidated
2011 2010 $’000 $’000
Loan receivables* 178,005 147,376
allowance for losses (2,402) (2,770)
175,603 144,606
* Refer to note 38 for disclosure of impaired lease and loan receivables, past due but not impaired receivables and the fair value of receivables.
Risk exposureInformation about the Group’s exposure to credit risk, foreign exchange and interest rate risk is provided in note 38. The maximum exposure to credit risk at the end of the reporting period is the carrying amount of each class of receivable mentioned in note 38.
notes to the Financial Statements (continued)
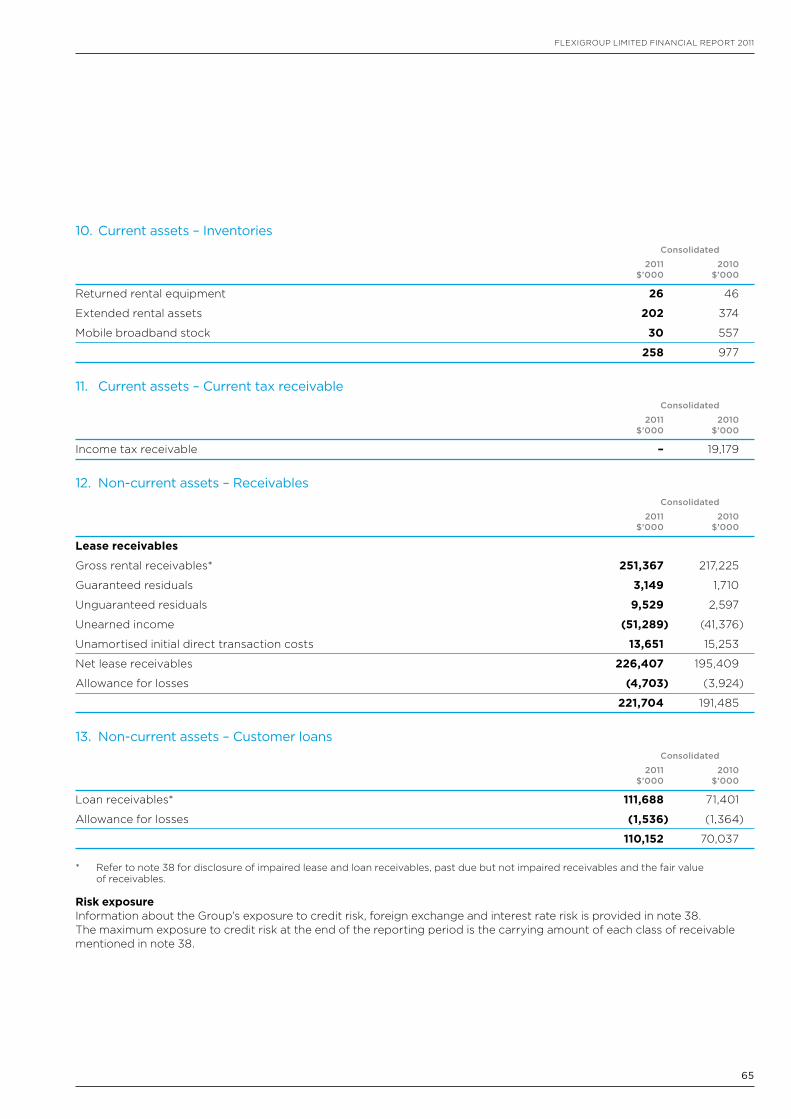
65
FLEXIGROUP LIMITED FInancIaL REPORT 2011
10. Current assets – Inventories Consolidated
2011 2010 $’000 $’000
Returned rental equipment 26 46
Extended rental assets 202 374
Mobile broadband stock 30 557
258 977
11. Current assets – Current tax receivable Consolidated
2011 2010 $’000 $’000
Income tax receivable – 19,179
12. Non-current assets – Receivables Consolidated
2011 2010 $’000 $’000
Lease receivables
Gross rental receivables* 251,367 217,225
Guaranteed residuals 3,149 1,710
Unguaranteed residuals 9,529 2,597
Unearned income (51,289) (41,376)
Unamortised initial direct transaction costs 13,651 15,253
net lease receivables 226,407 195,409
allowance for losses (4,703) (3,924)
221,704 191,485
13. Non-current assets – Customer loans Consolidated
2011 2010 $’000 $’000
Loan receivables* 111,688 71,401
allowance for losses (1,536) (1,364)
110,152 70,037
* Refer to note 38 for disclosure of impaired lease and loan receivables, past due but not impaired receivables and the fair value of receivables.
Risk exposureInformation about the Group’s exposure to credit risk, foreign exchange and interest rate risk is provided in note 38. The maximum exposure to credit risk at the end of the reporting period is the carrying amount of each class of receivable mentioned in note 38.
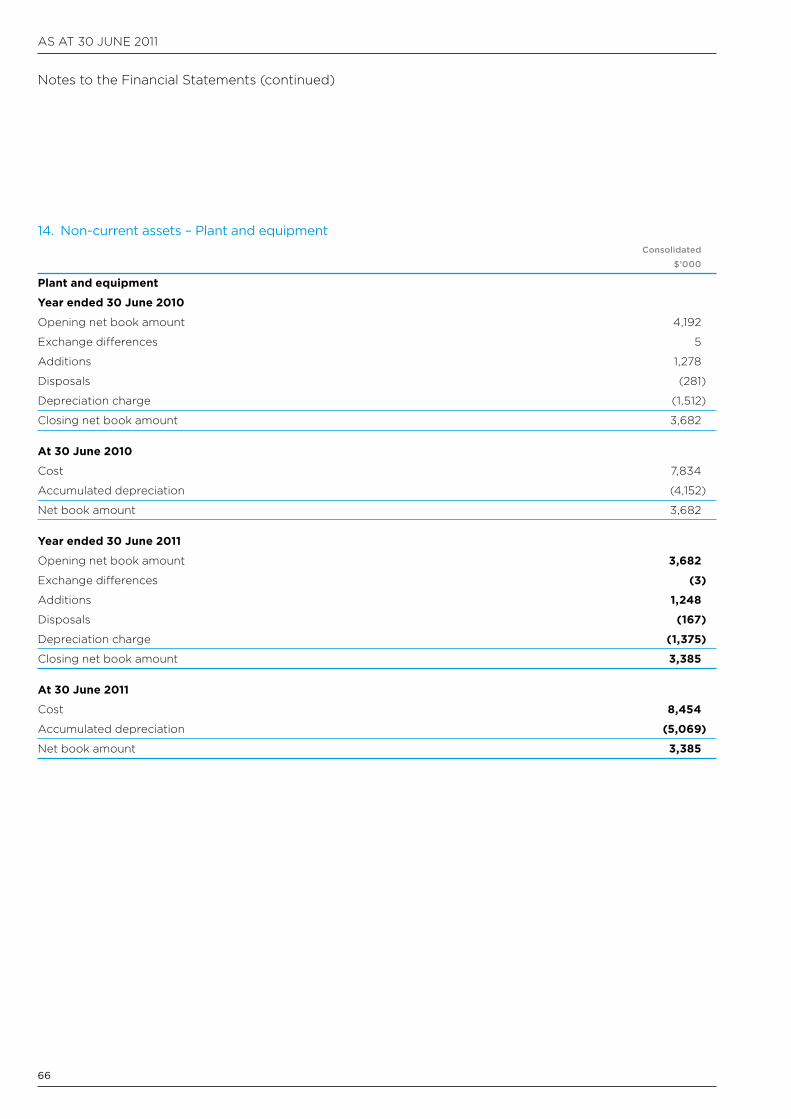
aS aT 30 JUnE 2011
66
14. Non-current assets – Plant and equipment Consolidated
$’000
Plant and equipment
Year ended 30 June 2010
Opening net book amount 4,192
Exchange differences 5
additions 1,278
Disposals (281)
Depreciation charge (1,512)
closing net book amount 3,682
At 30 June 2010
cost 7,834
accumulated depreciation (4,152)
net book amount 3,682
Year ended 30 June 2011
Opening net book amount 3,682
Exchange differences (3)
additions 1,248
Disposals (167)
Depreciation charge (1,375)
closing net book amount 3,385
At 30 June 2011
cost 8,454
accumulated depreciation (5,069)
net book amount 3,385
notes to the Financial Statements (continued)
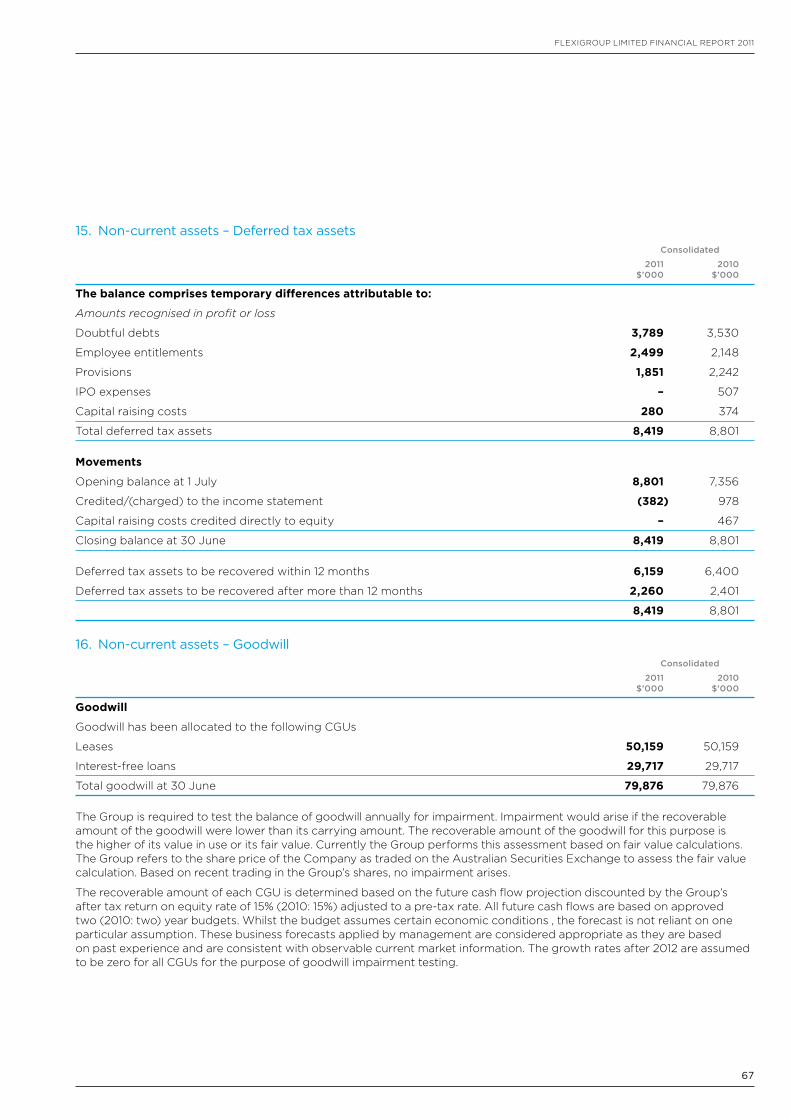
67
FLEXIGROUP LIMITED FInancIaL REPORT 2011
15. Non-current assets – Deferred tax assets Consolidated
2011 2010 $’000 $’000
The balance comprises temporary differences attributable to:
Amounts recognised in profit or loss
Doubtful debts 3,789 3,530
Employee entitlements 2,499 2,148
Provisions 1,851 2,242
IPO expenses – 507
capital raising costs 280 374
Total deferred tax assets 8,419 8,801
Movements
Opening balance at 1 July 8,801 7,356
credited/(charged) to the income statement (382) 978
capital raising costs credited directly to equity – 467
closing balance at 30 June 8,419 8,801
Deferred tax assets to be recovered within 12 months 6,159 6,400
Deferred tax assets to be recovered after more than 12 months 2,260 2,401
8,419 8,801
16. Non-current assets – Goodwill Consolidated
2011 2010 $’000 $’000
Goodwill
Goodwill has been allocated to the following cGUs
Leases 50,159 50,159
Interest-free loans 29,717 29,717
Total goodwill at 30 June 79,876 79,876
The Group is required to test the balance of goodwill annually for impairment. Impairment would arise if the recoverable amount of the goodwill were lower than its carrying amount. The recoverable amount of the goodwill for this purpose is the higher of its value in use or its fair value. currently the Group performs this assessment based on fair value calculations. The Group refers to the share price of the company as traded on the australian Securities Exchange to assess the fair value calculation. Based on recent trading in the Group’s shares, no impairment arises.
The recoverable amount of each cGU is determined based on the future cash flow projection discounted by the Group’s after tax return on equity rate of 15% (2010: 15%) adjusted to a pre-tax rate. all future cash flows are based on approved two (2010: two) year budgets. Whilst the budget assumes certain economic conditions , the forecast is not reliant on one particular assumption. These business forecasts applied by management are considered appropriate as they are based on past experience and are consistent with observable current market information. The growth rates after 2012 are assumed to be zero for all cGUs for the purpose of goodwill impairment testing.
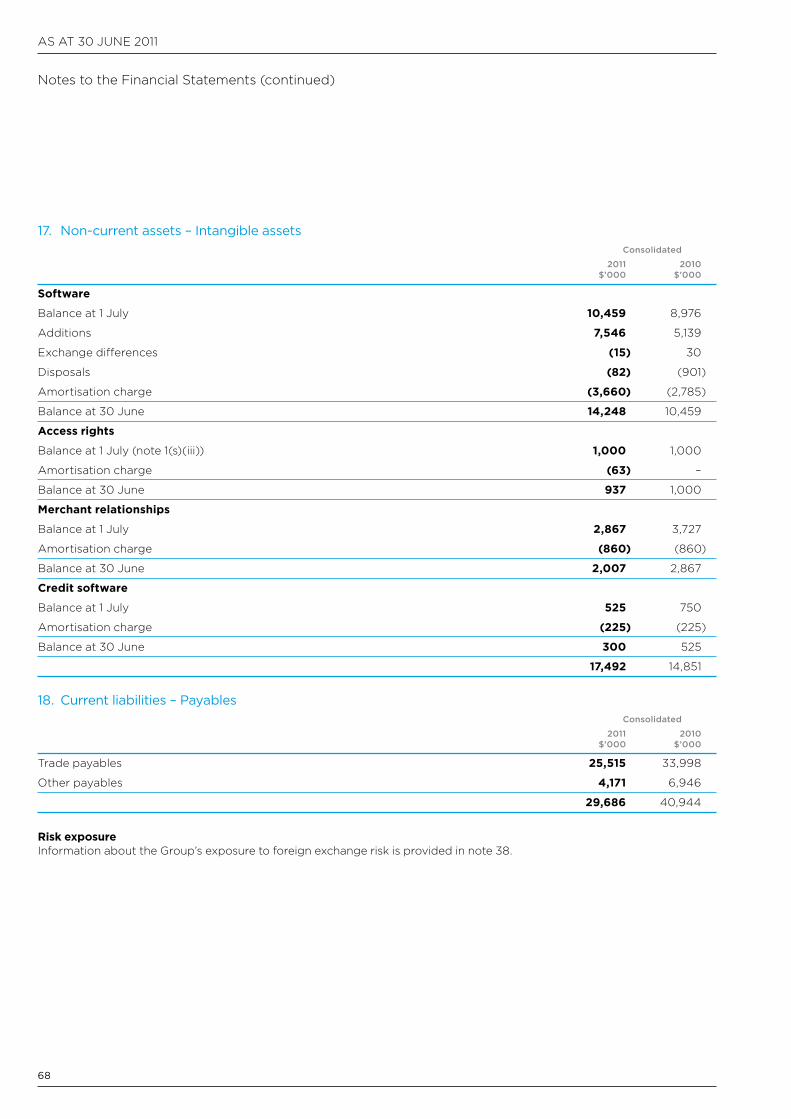
aS aT 30 JUnE 2011
68
notes to the Financial Statements (continued)
17. Non-current assets – Intangible assets Consolidated
2011 2010 $’000 $’000
Software
Balance at 1 July 10,459 8,976
additions 7,546 5,139
Exchange differences (15) 30
Disposals (82) (901)
amortisation charge (3,660) (2,785)
Balance at 30 June 14,248 10,459
Access rights
Balance at 1 July (note 1(s)(iii)) 1,000 1,000
amortisation charge (63) –
Balance at 30 June 937 1,000
Merchant relationships
Balance at 1 July 2,867 3,727
amortisation charge (860) (860)
Balance at 30 June 2,007 2,867
Credit software
Balance at 1 July 525 750
amortisation charge (225) (225)
Balance at 30 June 300 525
17,492 14,851
18. Current liabilities – Payables Consolidated
2011 2010 $’000 $’000
Trade payables 25,515 33,998
Other payables 4,171 6,946
29,686 40,944
Risk exposureInformation about the Group’s exposure to foreign exchange risk is provided in note 38.
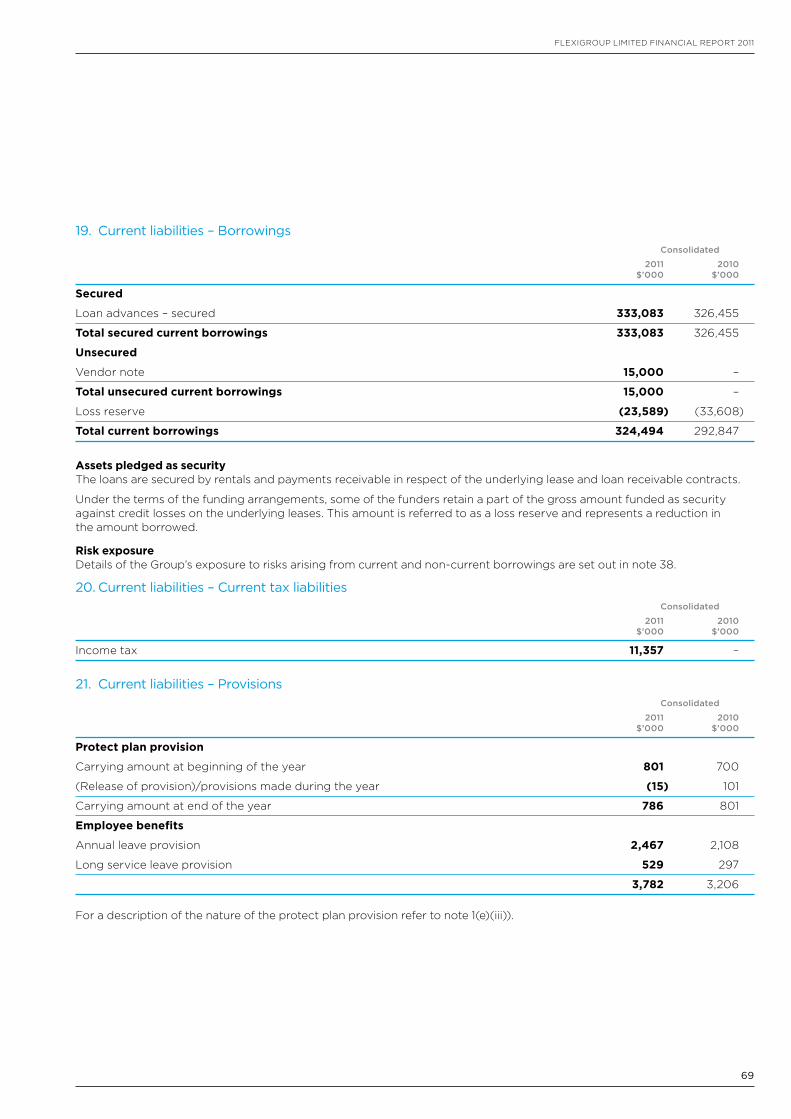
69
FLEXIGROUP LIMITED FInancIaL REPORT 2011
19. Current liabilities – Borrowings Consolidated
2011 2010 $’000 $’000
Secured
Loan advances – secured 333,083 326,455
Total secured current borrowings 333,083 326,455
Unsecured
Vendor note 15,000 –
Total unsecured current borrowings 15,000 –
Loss reserve (23,589) (33,608)
Total current borrowings 324,494 292,847
Assets pledged as securityThe loans are secured by rentals and payments receivable in respect of the underlying lease and loan receivable contracts.
Under the terms of the funding arrangements, some of the funders retain a part of the gross amount funded as security against credit losses on the underlying leases. This amount is referred to as a loss reserve and represents a reduction in the amount borrowed.
Risk exposureDetails of the Group’s exposure to risks arising from current and non-current borrowings are set out in note 38.
20. Current liabilities – Current tax liabilities Consolidated
2011 2010 $’000 $’000
Income tax 11,357 –
21. Current liabilities – Provisions Consolidated
2011 2010 $’000 $’000
Protect plan provision
carrying amount at beginning of the year 801 700
(Release of provision)/provisions made during the year (15) 101
carrying amount at end of the year 786 801
Employee benefits
annual leave provision 2,467 2,108
Long service leave provision 529 297
3,782 3,206
For a description of the nature of the protect plan provision refer to note 1(e)(iii)).
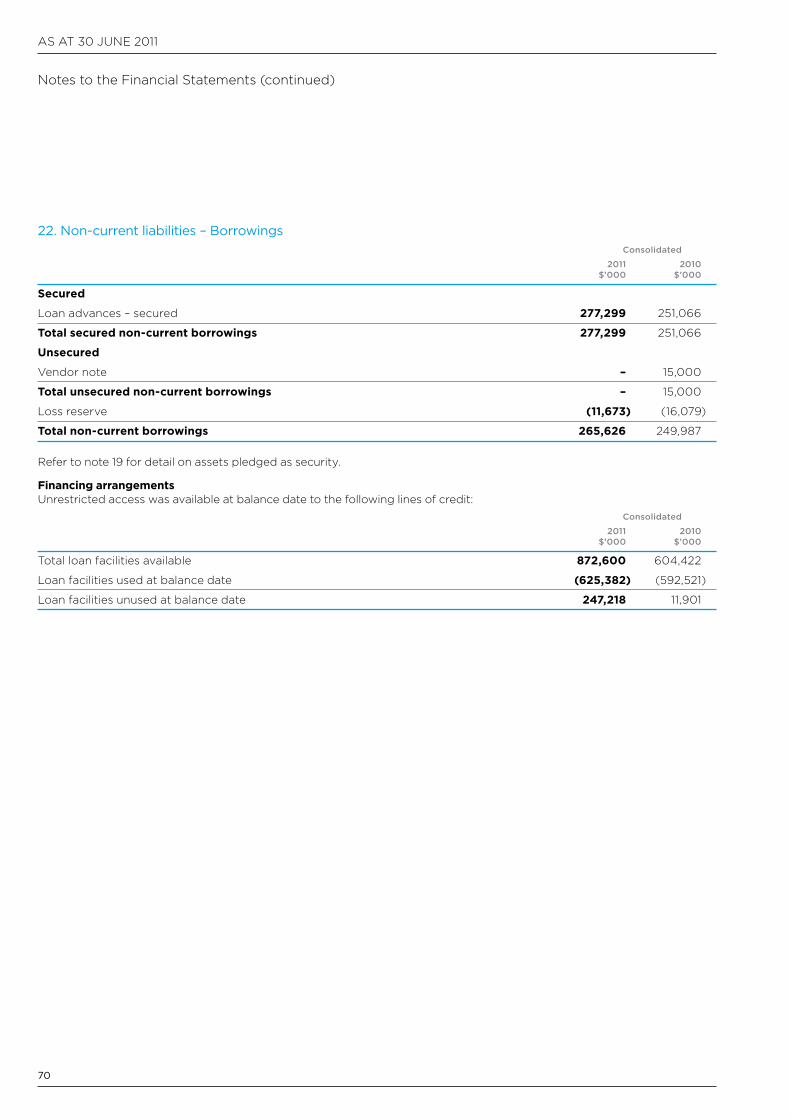
aS aT 30 JUnE 2011
70
notes to the Financial Statements (continued)
22. Non-current liabilities – Borrowings Consolidated
2011 2010 $’000 $’000
Secured
Loan advances – secured 277,299 251,066
Total secured non-current borrowings 277,299 251,066
Unsecured
Vendor note – 15,000
Total unsecured non-current borrowings – 15,000
Loss reserve (11,673) (16,079)
Total non-current borrowings 265,626 249,987
Refer to note 19 for detail on assets pledged as security.
Financing arrangementsUnrestricted access was available at balance date to the following lines of credit: Consolidated
2011 2010 $’000 $’000
Total loan facilities available 872,600 604,422
Loan facilities used at balance date (625,382) (592,521)
Loan facilities unused at balance date 247,218 11,901
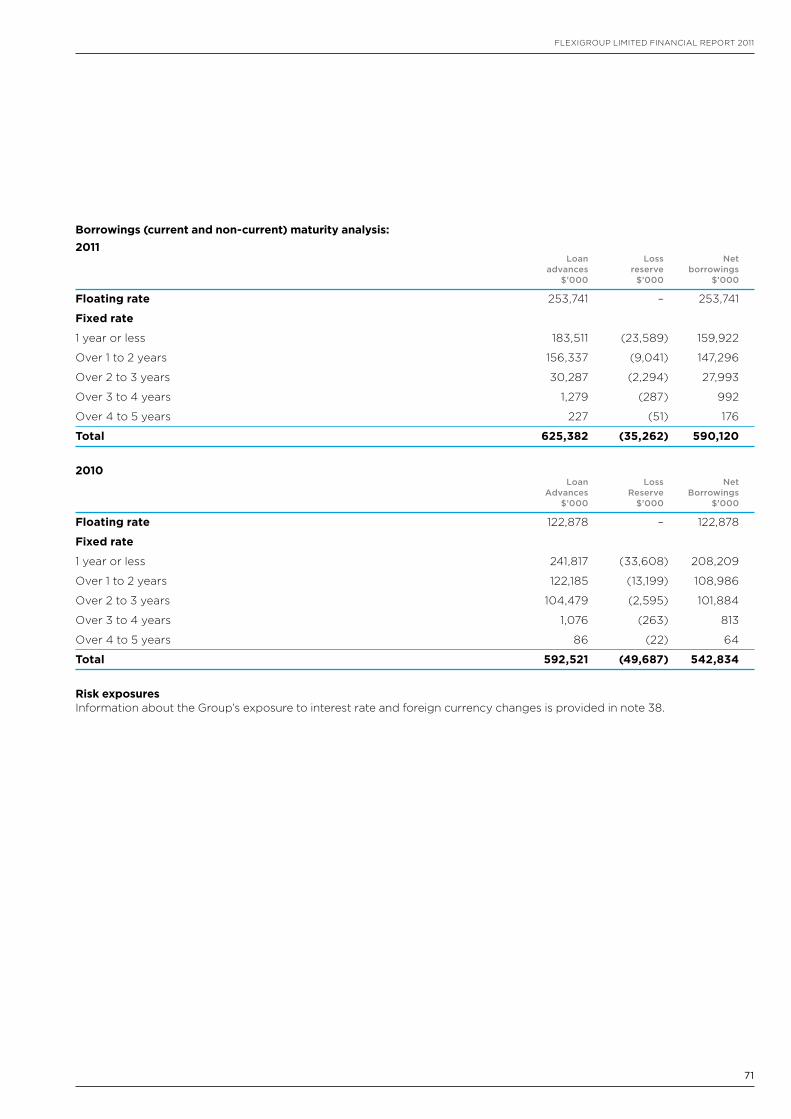
71
FLEXIGROUP LIMITED FInancIaL REPORT 2011
Borrowings (current and non-current) maturity analysis:2011 Loan Loss Net advances reserve borrowings $’000 $’000 $’000
Floating rate 253,741 – 253,741
Fixed rate
1 year or less 183,511 (23,589) 159,922
Over 1 to 2 years 156,337 (9,041) 147,296
Over 2 to 3 years 30,287 (2,294) 27,993
Over 3 to 4 years 1,279 (287) 992
Over 4 to 5 years 227 (51) 176
Total 625,382 (35,262) 590,120
2010 Loan Loss Net Advances Reserve Borrowings $’000 $’000 $’000
Floating rate 122,878 – 122,878
Fixed rate
1 year or less 241,817 (33,608) 208,209
Over 1 to 2 years 122,185 (13,199) 108,986
Over 2 to 3 years 104,479 (2,595) 101,884
Over 3 to 4 years 1,076 (263) 813
Over 4 to 5 years 86 (22) 64
Total 592,521 (49,687) 542,834
Risk exposuresInformation about the Group’s exposure to interest rate and foreign currency changes is provided in note 38.
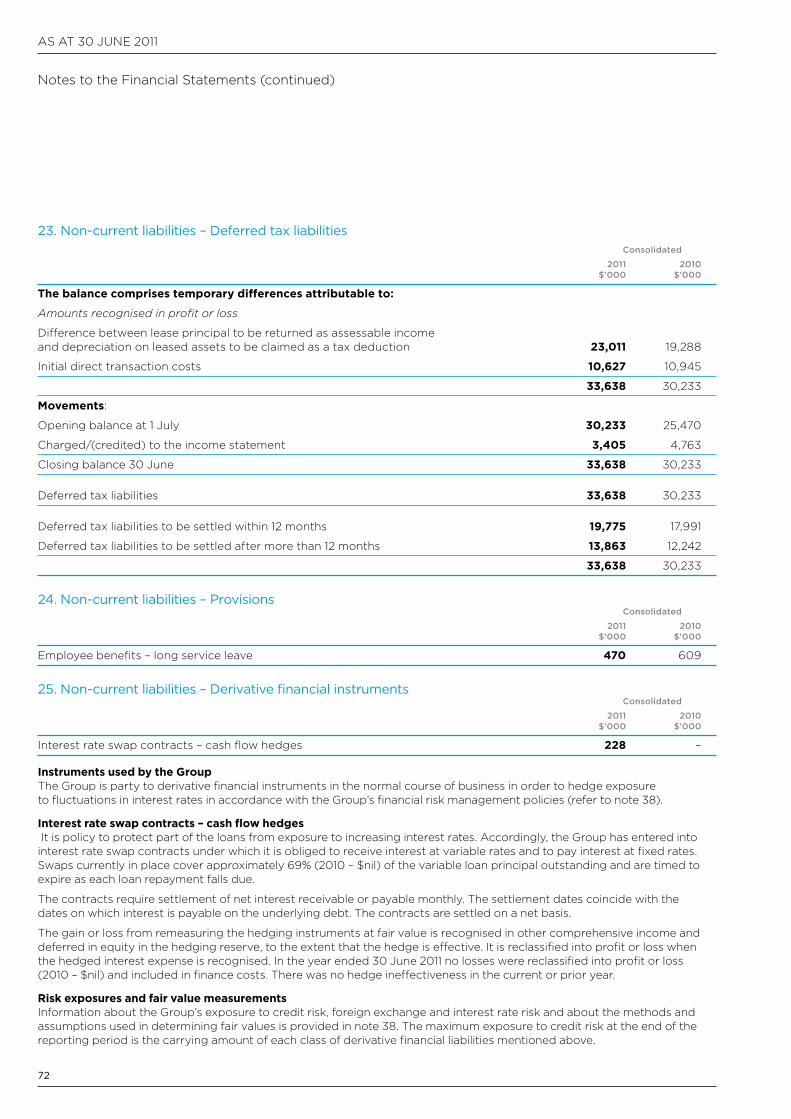
aS aT 30 JUnE 2011
72
notes to the Financial Statements (continued)
23. Non-current liabilities – Deferred tax liabilities Consolidated
2011 2010 $’000 $’000
The balance comprises temporary differences attributable to:
Amounts recognised in profit or loss
Difference between lease principal to be returned as assessable income and depreciation on leased assets to be claimed as a tax deduction 23,011 19,288
Initial direct transaction costs 10,627 10,945
33,638 30,233
Movements:
Opening balance at 1 July 30,233 25,470
charged/(credited) to the income statement 3,405 4,763
closing balance 30 June 33,638 30,233
Deferred tax liabilities 33,638 30,233
Deferred tax liabilities to be settled within 12 months 19,775 17,991
Deferred tax liabilities to be settled after more than 12 months 13,863 12,242
33,638 30,233
24. Non-current liabilities – Provisions Consolidated
2011 2010 $’000 $’000
Employee benefits – long service leave 470 609
25. Non-current liabilities – Derivative financial instruments Consolidated
2011 2010 $’000 $’000
Interest rate swap contracts – cash flow hedges 228 –
Instruments used by the GroupThe Group is party to derivative financial instruments in the normal course of business in order to hedge exposure to fluctuations in interest rates in accordance with the Group’s financial risk management policies (refer to note 38).
Interest rate swap contracts – cash flow hedges It is policy to protect part of the loans from exposure to increasing interest rates. accordingly, the Group has entered into interest rate swap contracts under which it is obliged to receive interest at variable rates and to pay interest at fixed rates. Swaps currently in place cover approximately 69% (2010 – $nil) of the variable loan principal outstanding and are timed to expire as each loan repayment falls due.
The contracts require settlement of net interest receivable or payable monthly. The settlement dates coincide with the dates on which interest is payable on the underlying debt. The contracts are settled on a net basis.
The gain or loss from remeasuring the hedging instruments at fair value is recognised in other comprehensive income and deferred in equity in the hedging reserve, to the extent that the hedge is effective. It is reclassified into profit or loss when the hedged interest expense is recognised. In the year ended 30 June 2011 no losses were reclassified into profit or loss (2010 – $nil) and included in finance costs. There was no hedge ineffectiveness in the current or prior year.
Risk exposures and fair value measurementsInformation about the Group’s exposure to credit risk, foreign exchange and interest rate risk and about the methods and assumptions used in determining fair values is provided in note 38. The maximum exposure to credit risk at the end of the reporting period is the carrying amount of each class of derivative financial liabilities mentioned above.
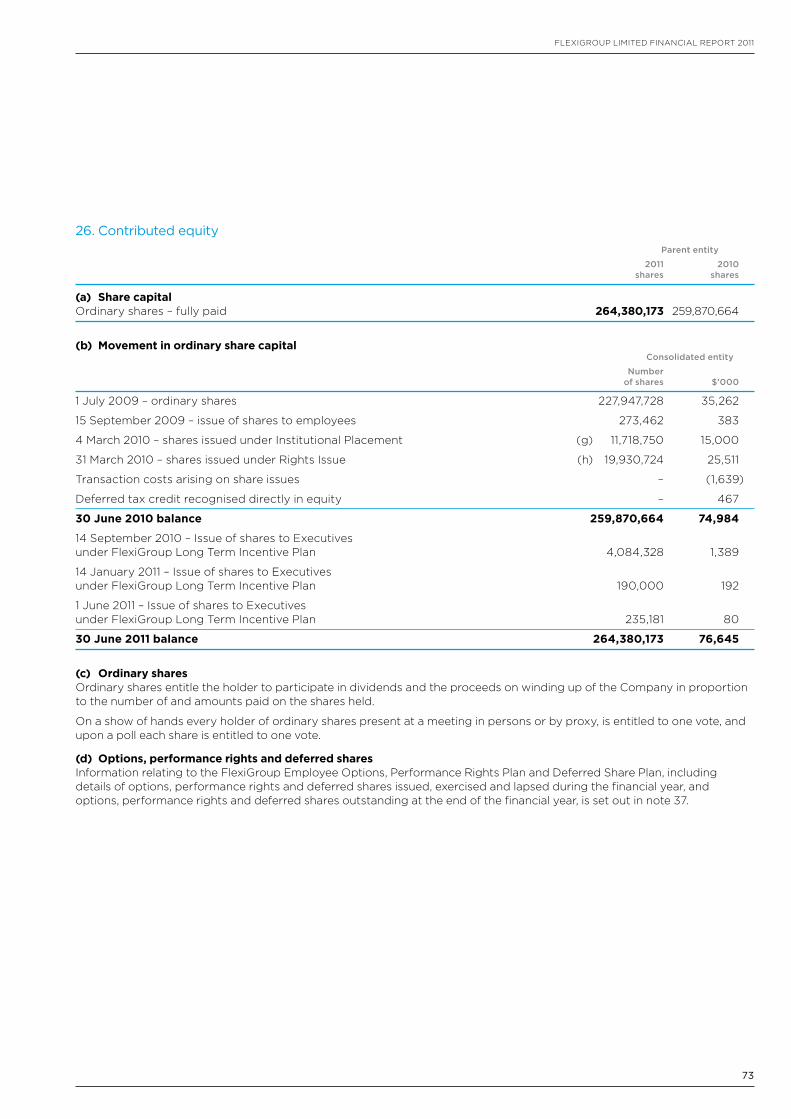
73
FLEXIGROUP LIMITED FInancIaL REPORT 2011
26. Contributed equity Parent entity
2011 2010 shares shares
(a) Share capitalOrdinary shares – fully paid 264,380,173 259,870,664
(b) Movement in ordinary share capital Consolidated entity
Number of shares $’000
1 July 2009 – ordinary shares 227,947,728 35,262
15 September 2009 – issue of shares to employees 273,462 383
4 March 2010 – shares issued under Institutional Placement (g) 11,718,750 15,000
31 March 2010 – shares issued under Rights Issue (h) 19,930,724 25,511
Transaction costs arising on share issues – (1,639)
Deferred tax credit recognised directly in equity – 467
30 June 2010 balance 259,870,664 74,984
14 September 2010 – Issue of shares to Executives under FlexiGroup Long Term Incentive Plan 4,084,328 1,389
14 January 2011 – Issue of shares to Executives under FlexiGroup Long Term Incentive Plan 190,000 192
1 June 2011 – Issue of shares to Executives under FlexiGroup Long Term Incentive Plan 235,181 80
30 June 2011 balance 264,380,173 76,645
(c) Ordinary sharesOrdinary shares entitle the holder to participate in dividends and the proceeds on winding up of the company in proportion to the number of and amounts paid on the shares held.
On a show of hands every holder of ordinary shares present at a meeting in persons or by proxy, is entitled to one vote, and upon a poll each share is entitled to one vote.
(d) Options, performance rights and deferred sharesInformation relating to the FlexiGroup Employee Options, Performance Rights Plan and Deferred Share Plan, including details of options, performance rights and deferred shares issued, exercised and lapsed during the financial year, and options, performance rights and deferred shares outstanding at the end of the financial year, is set out in note 37.
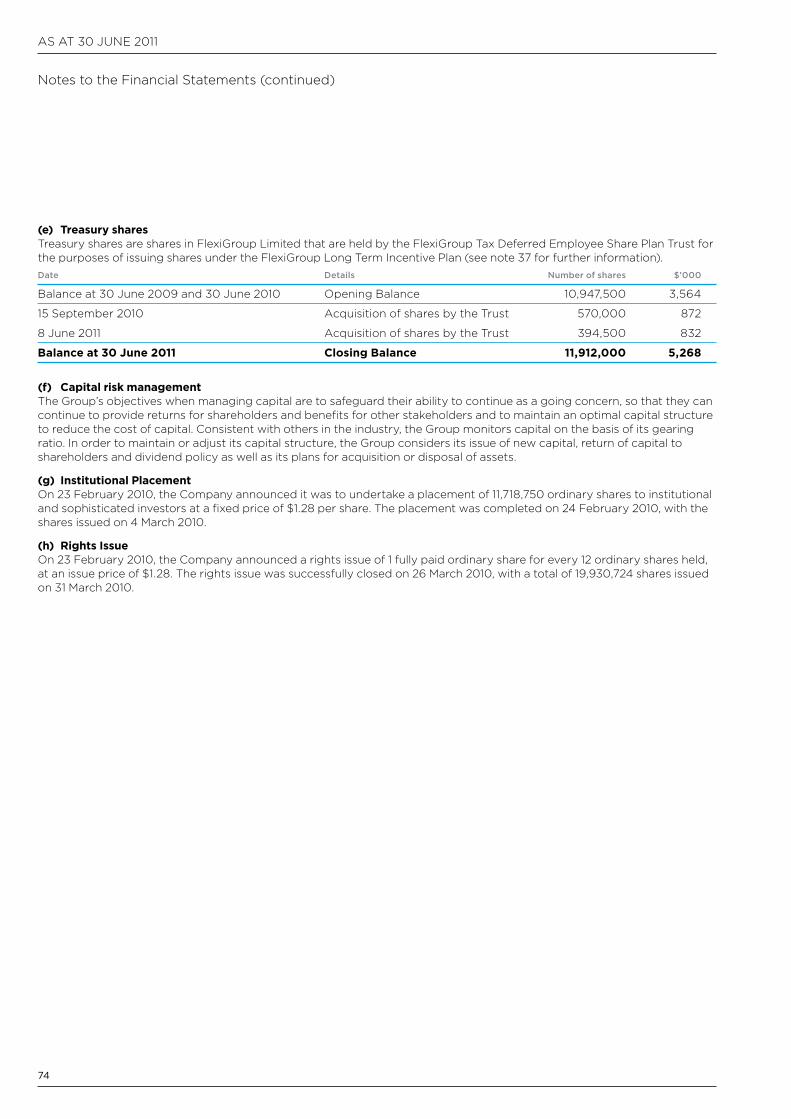
aS aT 30 JUnE 2011
74
notes to the Financial Statements (continued)
(e) Treasury sharesTreasury shares are shares in FlexiGroup Limited that are held by the FlexiGroup Tax Deferred Employee Share Plan Trust for the purposes of issuing shares under the FlexiGroup Long Term Incentive Plan (see note 37 for further information). Date Details Number of shares $’000
Balance at 30 June 2009 and 30 June 2010 Opening Balance 10,947,500 3,564
15 September 2010 acquisition of shares by the Trust 570,000 872
8 June 2011 acquisition of shares by the Trust 394,500 832
Balance at 30 June 2011 Closing Balance 11,912,000 5,268
(f) Capital risk managementThe Group’s objectives when managing capital are to safeguard their ability to continue as a going concern, so that they can continue to provide returns for shareholders and benefits for other stakeholders and to maintain an optimal capital structure to reduce the cost of capital. consistent with others in the industry, the Group monitors capital on the basis of its gearing ratio. In order to maintain or adjust its capital structure, the Group considers its issue of new capital, return of capital to shareholders and dividend policy as well as its plans for acquisition or disposal of assets.
(g) Institutional PlacementOn 23 February 2010, the company announced it was to undertake a placement of 11,718,750 ordinary shares to institutional and sophisticated investors at a fixed price of $1.28 per share. The placement was completed on 24 February 2010, with the shares issued on 4 March 2010.
(h) Rights IssueOn 23 February 2010, the company announced a rights issue of 1 fully paid ordinary share for every 12 ordinary shares held, at an issue price of $1.28. The rights issue was successfully closed on 26 March 2010, with a total of 19,930,724 shares issued on 31 March 2010.
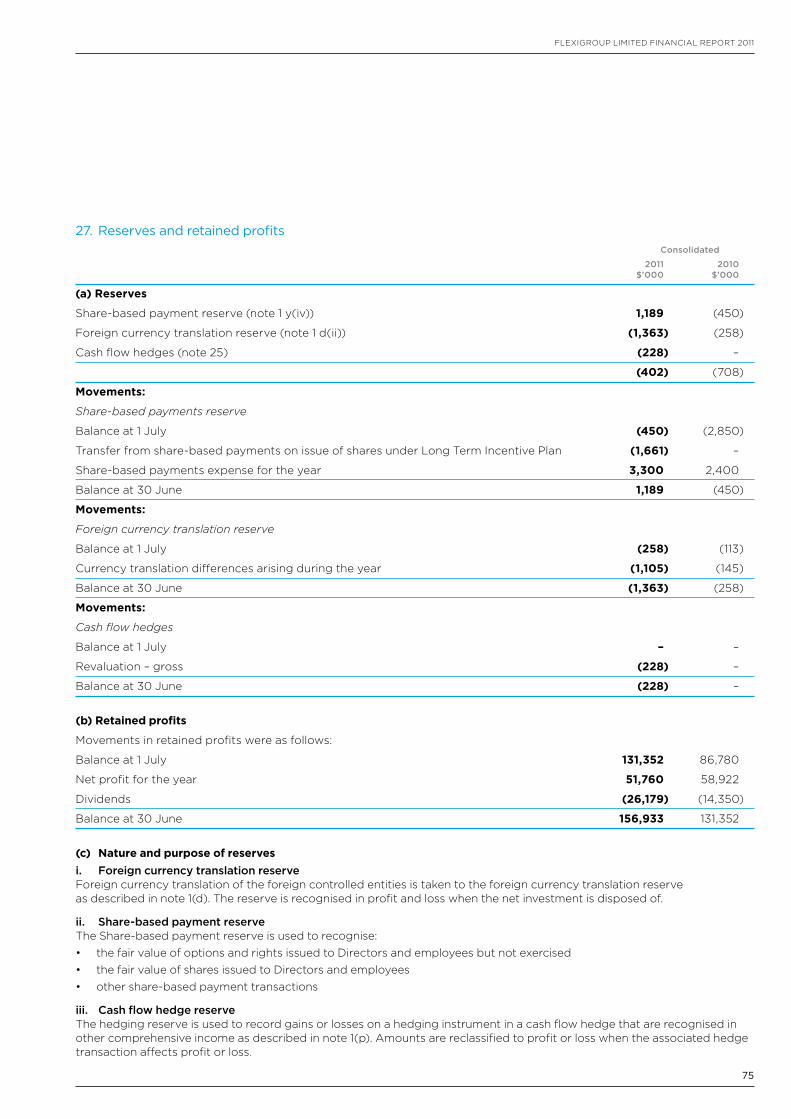
75
FLEXIGROUP LIMITED FInancIaL REPORT 2011
27. Reserves and retained profits Consolidated
2011 2010 $’000 $’000
(a) Reserves
Share-based payment reserve (note 1 y(iv)) 1,189 (450)
Foreign currency translation reserve (note 1 d(ii)) (1,363) (258)
cash flow hedges (note 25) (228) –
(402) (708)
Movements:
Share-based payments reserve
Balance at 1 July (450) (2,850)
Transfer from share-based payments on issue of shares under Long Term Incentive Plan (1,661) –
Share-based payments expense for the year 3,300 2,400
Balance at 30 June 1,189 (450)
Movements:
Foreign currency translation reserve
Balance at 1 July (258) (113)
currency translation differences arising during the year (1,105) (145)
Balance at 30 June (1,363) (258)
Movements:
Cash flow hedges
Balance at 1 July – –
Revaluation – gross (228) –
Balance at 30 June (228) –
(b) Retained profits
Movements in retained profits were as follows:
Balance at 1 July 131,352 86,780
net profit for the year 51,760 58,922
Dividends (26,179) (14,350)
Balance at 30 June 156,933 131,352
(c) Nature and purpose of reservesi. Foreign currency translation reserveForeign currency translation of the foreign controlled entities is taken to the foreign currency translation reserve as described in note 1(d). The reserve is recognised in profit and loss when the net investment is disposed of.
ii. Share-based payment reserveThe Share-based payment reserve is used to recognise:• the fair value of options and rights issued to Directors and employees but not exercised• the fair value of shares issued to Directors and employees• other share-based payment transactions
iii. Cash flow hedge reserveThe hedging reserve is used to record gains or losses on a hedging instrument in a cash flow hedge that are recognised in other comprehensive income as described in note 1(p). amounts are reclassified to profit or loss when the associated hedge transaction affects profit or loss.
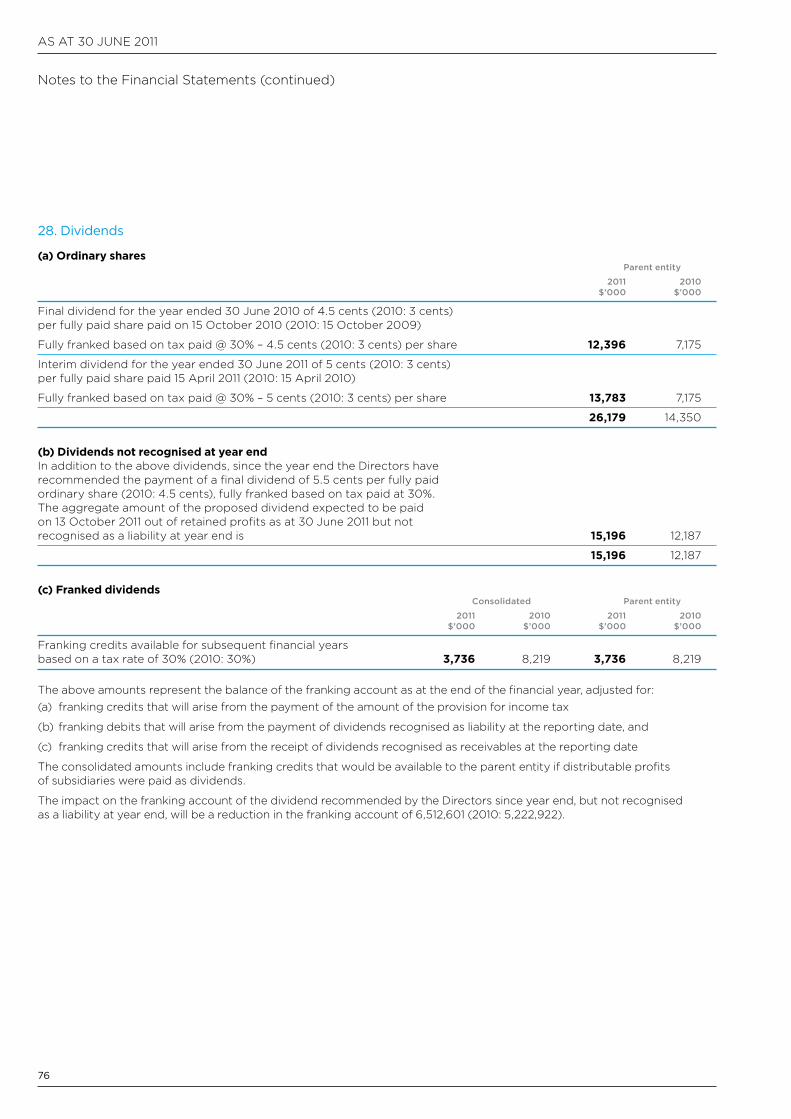
aS aT 30 JUnE 2011
76
28. Dividends
(a) Ordinary shares Parent entity
2011 2010 $’000 $’000
Final dividend for the year ended 30 June 2010 of 4.5 cents (2010: 3 cents) per fully paid share paid on 15 October 2010 (2010: 15 October 2009)
Fully franked based on tax paid @ 30% – 4.5 cents (2010: 3 cents) per share 12,396 7,175
Interim dividend for the year ended 30 June 2011 of 5 cents (2010: 3 cents) per fully paid share paid 15 april 2011 (2010: 15 april 2010)
Fully franked based on tax paid @ 30% – 5 cents (2010: 3 cents) per share 13,783 7,175
26,179 14,350
(b) Dividends not recognised at year endIn addition to the above dividends, since the year end the Directors have recommended the payment of a final dividend of 5.5 cents per fully paid ordinary share (2010: 4.5 cents), fully franked based on tax paid at 30%. The aggregate amount of the proposed dividend expected to be paid on 13 October 2011 out of retained profits as at 30 June 2011 but not recognised as a liability at year end is 15,196 12,187
15,196 12,187
(c) Franked dividends Consolidated Parent entity
2011 2010 2011 2010 $’000 $’000 $’000 $’000
Franking credits available for subsequent financial years based on a tax rate of 30% (2010: 30%) 3,736 8,219 3,736 8,219
The above amounts represent the balance of the franking account as at the end of the financial year, adjusted for:(a) franking credits that will arise from the payment of the amount of the provision for income tax
(b) franking debits that will arise from the payment of dividends recognised as liability at the reporting date, and
(c) franking credits that will arise from the receipt of dividends recognised as receivables at the reporting date
The consolidated amounts include franking credits that would be available to the parent entity if distributable profits of subsidiaries were paid as dividends.
The impact on the franking account of the dividend recommended by the Directors since year end, but not recognised as a liability at year end, will be a reduction in the franking account of 6,512,601 (2010: 5,222,922).
notes to the Financial Statements (continued)
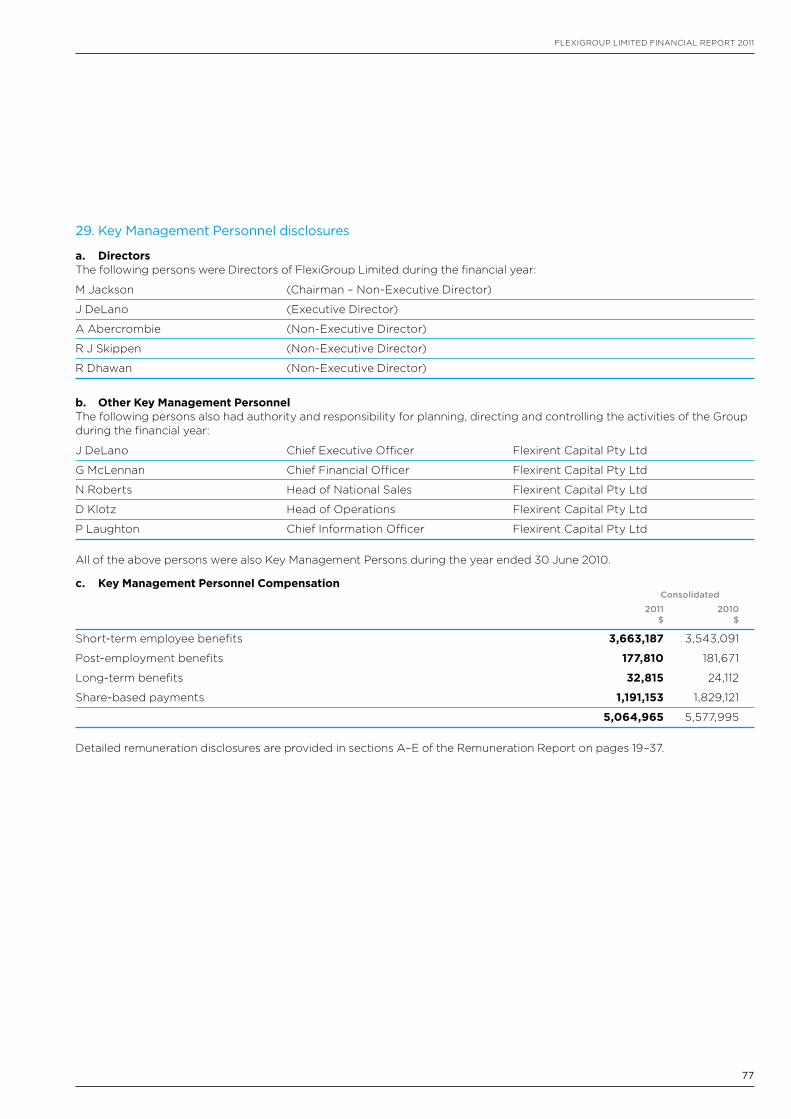
77
FLEXIGROUP LIMITED FInancIaL REPORT 2011
29. Key Management Personnel disclosures
a. DirectorsThe following persons were Directors of FlexiGroup Limited during the financial year:
M Jackson (chairman – non-Executive Director)
J DeLano (Executive Director)
a abercrombie (non-Executive Director)
R J Skippen (non-Executive Director)
R Dhawan (non-Executive Director)
b. Other Key Management PersonnelThe following persons also had authority and responsibility for planning, directing and controlling the activities of the Group during the financial year:
J DeLano chief Executive Officer Flexirent capital Pty Ltd
G McLennan chief Financial Officer Flexirent capital Pty Ltd
n Roberts Head of national Sales Flexirent capital Pty Ltd
D Klotz Head of Operations Flexirent capital Pty Ltd
P Laughton chief Information Officer Flexirent capital Pty Ltd
all of the above persons were also Key Management Persons during the year ended 30 June 2010.
c. Key Management Personnel Compensation Consolidated
2011 2010 $ $
Short-term employee benefits 3,663,187 3,543,091
Post-employment benefits 177,810 181,671
Long-term benefits 32,815 24,112
Share-based payments 1,191,153 1,829,121
5,064,965 5,577,995
Detailed remuneration disclosures are provided in sections a–E of the Remuneration Report on pages 19–37.
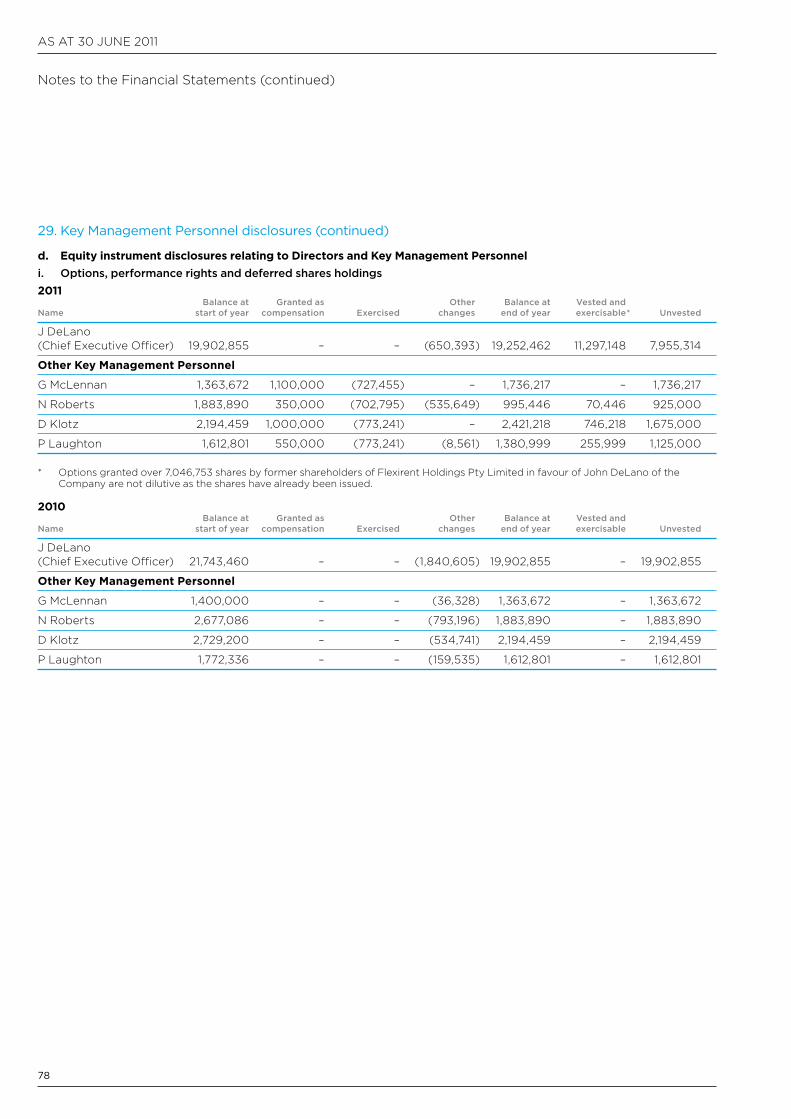
aS aT 30 JUnE 2011
78
29. Key Management Personnel disclosures (continued)
d. Equity instrument disclosures relating to Directors and Key Management Personneli. Options, performance rights and deferred shares holdings2011 Balance at Granted as Other Balance at Vested and Name start of year compensation Exercised changes end of year exercisable * Unvested
J DeLano (chief Executive Officer) 19,902,855 – – (650,393) 19,252,462 11,297,148 7,955,314
Other Key Management Personnel
G McLennan 1,363,672 1,100,000 (727,455) – 1,736,217 – 1,736,217
n Roberts 1,883,890 350,000 (702,795) (535,649) 995,446 70,446 925,000
D Klotz 2,194,459 1,000,000 (773,241) – 2,421,218 746,218 1,675,000
P Laughton 1,612,801 550,000 (773,241) (8,561) 1,380,999 255,999 1,125,000
* Options granted over 7,046,753 shares by former shareholders of Flexirent Holdings Pty Limited in favour of John DeLano of the company are not dilutive as the shares have already been issued.
2010 Balance at Granted as Other Balance at Vested and Name start of year compensation Exercised changes end of year exercisable Unvested
J DeLano (chief Executive Officer) 21,743,460 – – (1,840,605) 19,902,855 – 19,902,855
Other Key Management Personnel
G McLennan 1,400,000 – – (36,328) 1,363,672 – 1,363,672
n Roberts 2,677,086 – – (793,196) 1,883,890 – 1,883,890
D Klotz 2,729,200 – – (534,741) 2,194,459 – 2,194,459
P Laughton 1,772,336 – – (159,535) 1,612,801 – 1,612,801
notes to the Financial Statements (continued)
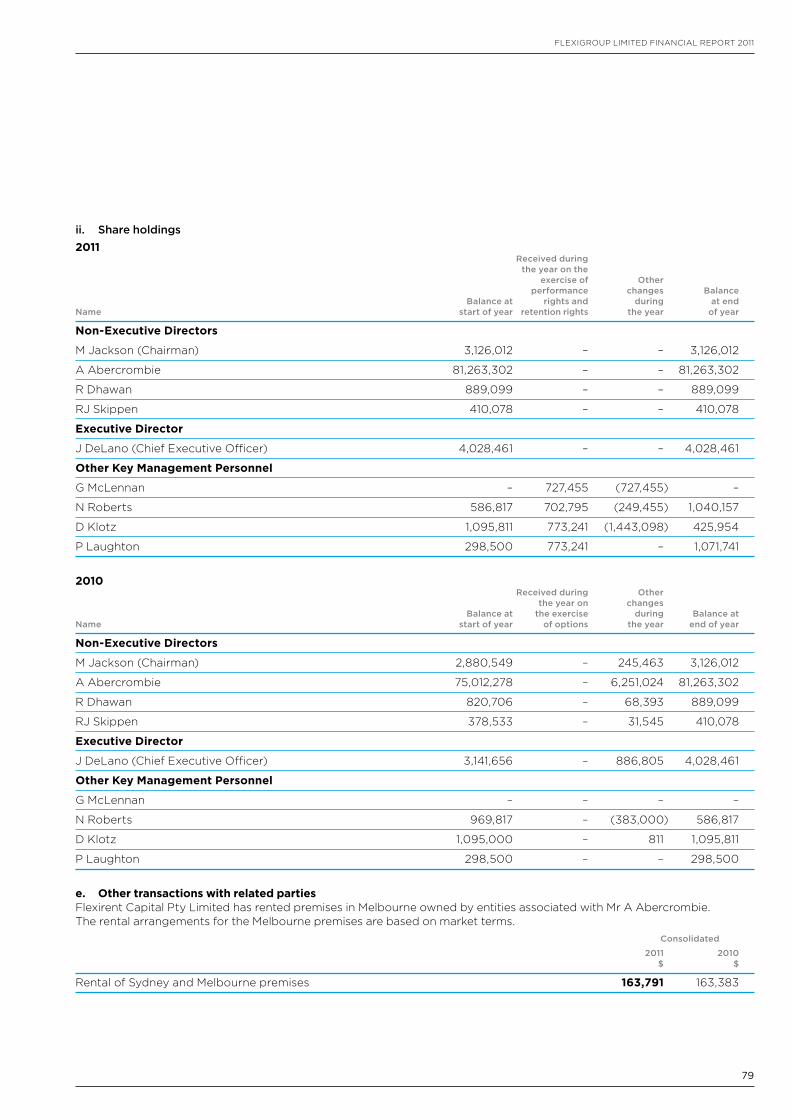
79
FLEXIGROUP LIMITED FInancIaL REPORT 2011
ii. Share holdings2011 Received during the year on the exercise of Other performance changes Balance Balance at rights and during at end Name start of year retention rights the year of year
Non-Executive Directors
M Jackson (chairman) 3,126,012 – – 3,126,012
a abercrombie 81,263,302 – – 81,263,302
R Dhawan 889,099 – – 889,099
RJ Skippen 410,078 – – 410,078
Executive Director
J DeLano (chief Executive Officer) 4,028,461 – – 4,028,461
Other Key Management Personnel
G McLennan – 727,455 (727,455) –
n Roberts 586,817 702,795 (249,455) 1,040,157
D Klotz 1,095,811 773,241 (1,443,098) 425,954
P Laughton 298,500 773,241 – 1,071,741
2010 Received during Other the year on changes Balance at the exercise during Balance at Name start of year of options the year end of year
Non-Executive Directors
M Jackson (chairman) 2,880,549 – 245,463 3,126,012
a abercrombie 75,012,278 – 6,251,024 81,263,302
R Dhawan 820,706 – 68,393 889,099
RJ Skippen 378,533 – 31,545 410,078
Executive Director
J DeLano (chief Executive Officer) 3,141,656 – 886,805 4,028,461
Other Key Management Personnel
G McLennan – – – –
n Roberts 969,817 – (383,000) 586,817
D Klotz 1,095,000 – 811 1,095,811
P Laughton 298,500 – – 298,500
e. Other transactions with related partiesFlexirent capital Pty Limited has rented premises in Melbourne owned by entities associated with Mr a abercrombie. The rental arrangements for the Melbourne premises are based on market terms. Consolidated
2011 2010 $ $
Rental of Sydney and Melbourne premises 163,791 163,383
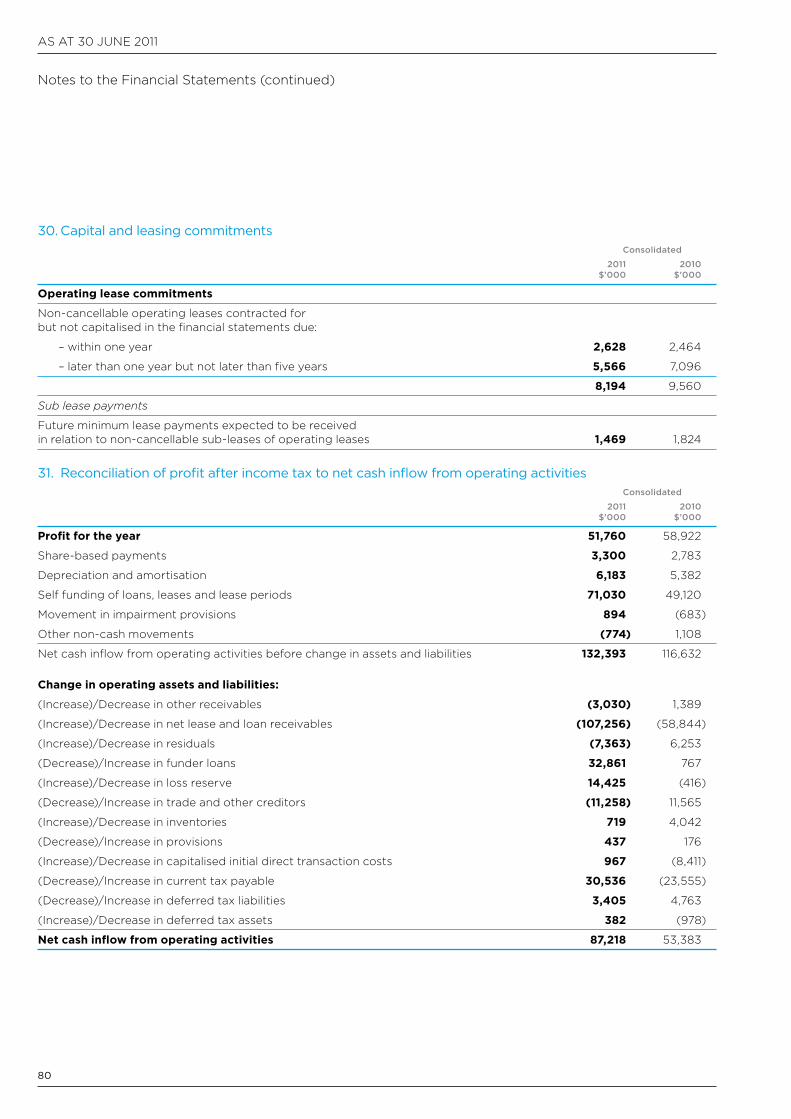
aS aT 30 JUnE 2011
80
30. Capital and leasing commitments Consolidated
2011 2010 $’000 $’000
Operating lease commitments
non-cancellable operating leases contracted for but not capitalised in the financial statements due:
– within one year 2,628 2,464
– later than one year but not later than five years 5,566 7,096
8,194 9,560
Sub lease payments
Future minimum lease payments expected to be received in relation to non-cancellable sub-leases of operating leases 1,469 1,824
31. Reconciliation of profit after income tax to net cash inflow from operating activities Consolidated
2011 2010 $’000 $’000
Profit for the year 51,760 58,922
Share-based payments 3,300 2,783
Depreciation and amortisation 6,183 5,382
Self funding of loans, leases and lease periods 71,030 49,120
Movement in impairment provisions 894 (683)
Other non-cash movements (774) 1,108
net cash inflow from operating activities before change in assets and liabilities 132,393 116,632
Change in operating assets and liabilities:
(Increase)/Decrease in other receivables (3,030) 1,389
(Increase)/Decrease in net lease and loan receivables (107,256) (58,844)
(Increase)/Decrease in residuals (7,363) 6,253
(Decrease)/Increase in funder loans 32,861 767
(Increase)/Decrease in loss reserve 14,425 (416)
(Decrease)/Increase in trade and other creditors (11,258) 11,565
(Increase)/Decrease in inventories 719 4,042
(Decrease)/Increase in provisions 437 176
(Increase)/Decrease in capitalised initial direct transaction costs 967 (8,411)
(Decrease)/Increase in current tax payable 30,536 (23,555)
(Decrease)/Increase in deferred tax liabilities 3,405 4,763
(Increase)/Decrease in deferred tax assets 382 (978)
Net cash inflow from operating activities 87,218 53,383
notes to the Financial Statements (continued)
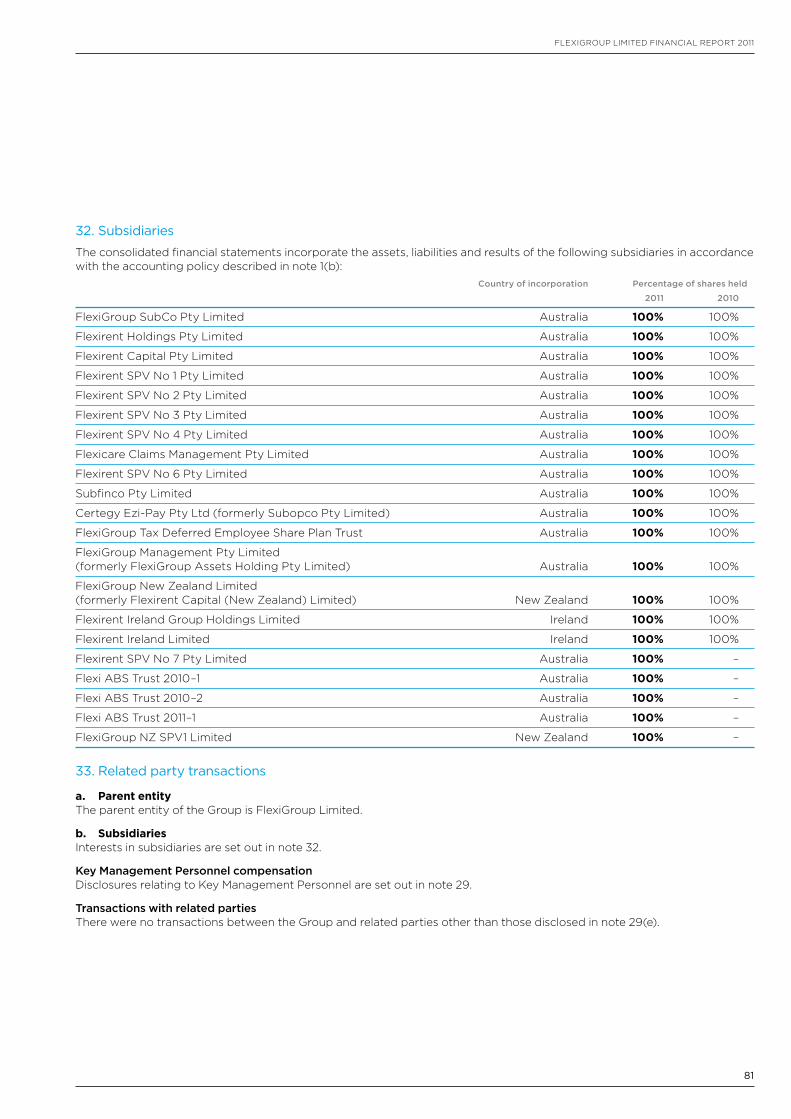
81
FLEXIGROUP LIMITED FInancIaL REPORT 2011
32. Subsidiaries
The consolidated financial statements incorporate the assets, liabilities and results of the following subsidiaries in accordance with the accounting policy described in note 1(b): Country of incorporation Percentage of shares held
2011 2010
FlexiGroup Subco Pty Limited australia 100% 100%
Flexirent Holdings Pty Limited australia 100% 100%
Flexirent capital Pty Limited australia 100% 100%
Flexirent SPV no 1 Pty Limited australia 100% 100%
Flexirent SPV no 2 Pty Limited australia 100% 100%
Flexirent SPV no 3 Pty Limited australia 100% 100%
Flexirent SPV no 4 Pty Limited australia 100% 100%
Flexicare claims Management Pty Limited australia 100% 100%
Flexirent SPV no 6 Pty Limited australia 100% 100%
Subfinco Pty Limited australia 100% 100%
certegy Ezi-Pay Pty Ltd (formerly Subopco Pty Limited) australia 100% 100%
FlexiGroup Tax Deferred Employee Share Plan Trust australia 100% 100%
FlexiGroup Management Pty Limited (formerly FlexiGroup assets Holding Pty Limited) australia 100% 100%
FlexiGroup new Zealand Limited (formerly Flexirent capital (new Zealand) Limited) new Zealand 100% 100%
Flexirent Ireland Group Holdings Limited Ireland 100% 100%
Flexirent Ireland Limited Ireland 100% 100%
Flexirent SPV no 7 Pty Limited australia 100% –
Flexi aBS Trust 2010–1 australia 100% –
Flexi aBS Trust 2010–2 australia 100% –
Flexi aBS Trust 2011–1 australia 100% –
FlexiGroup nZ SPV1 Limited new Zealand 100% –
33. Related party transactions
a. Parent entityThe parent entity of the Group is FlexiGroup Limited.
b. SubsidiariesInterests in subsidiaries are set out in note 32.
Key Management Personnel compensationDisclosures relating to Key Management Personnel are set out in note 29.
Transactions with related partiesThere were no transactions between the Group and related parties other than those disclosed in note 29(e).
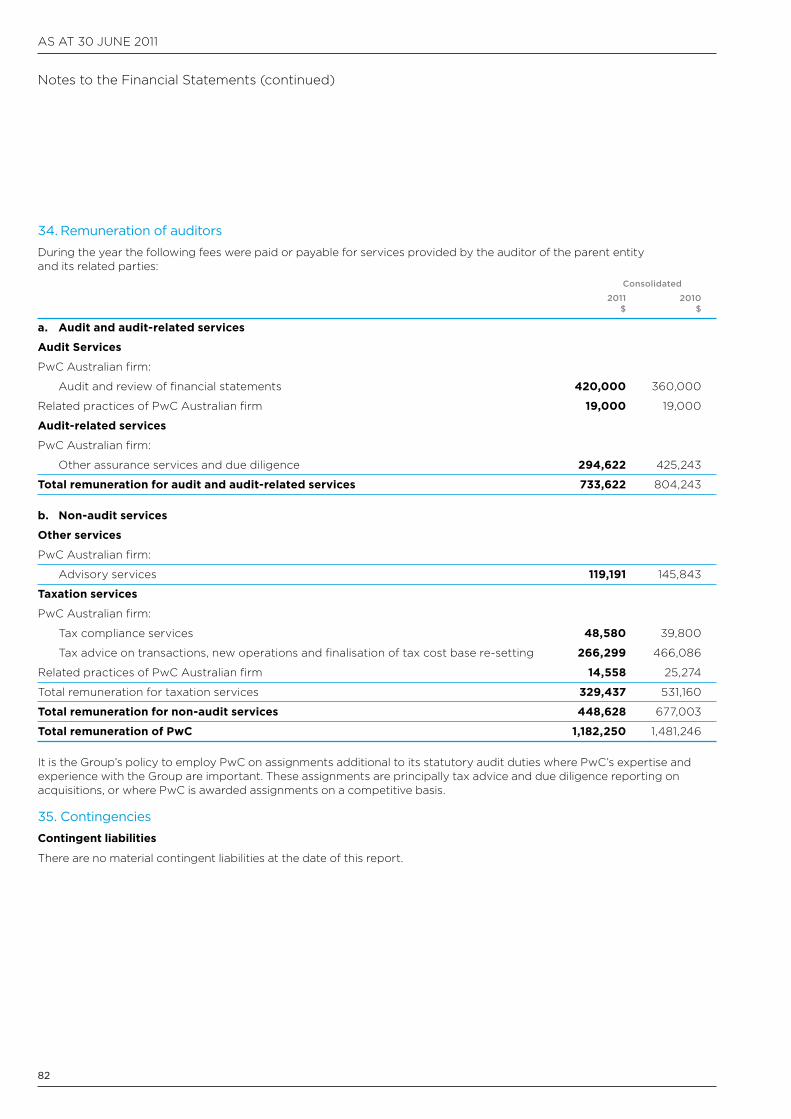
aS aT 30 JUnE 2011
82
notes to the Financial Statements (continued)
34. Remuneration of auditors
During the year the following fees were paid or payable for services provided by the auditor of the parent entity and its related parties: Consolidated
2011 2010 $ $
a. Audit and audit-related services
Audit Services
Pwc australian firm:
audit and review of financial statements 420,000 360,000
Related practices of Pwc australian firm 19,000 19,000
Audit-related services
Pwc australian firm:
Other assurance services and due diligence 294,622 425,243
Total remuneration for audit and audit-related services 733,622 804,243
b. Non-audit services
Other services
Pwc australian firm:
advisory services 119,191 145,843
Taxation services
Pwc australian firm:
Tax compliance services 48,580 39,800
Tax advice on transactions, new operations and finalisation of tax cost base re-setting 266,299 466,086
Related practices of Pwc australian firm 14,558 25,274
Total remuneration for taxation services 329,437 531,160
Total remuneration for non-audit services 448,628 677,003
Total remuneration of PwC 1,182,250 1,481,246
It is the Group’s policy to employ Pwc on assignments additional to its statutory audit duties where Pwc’s expertise and experience with the Group are important. These assignments are principally tax advice and due diligence reporting on acquisitions, or where Pwc is awarded assignments on a competitive basis.
35. Contingencies
Contingent liabilities
There are no material contingent liabilities at the date of this report.
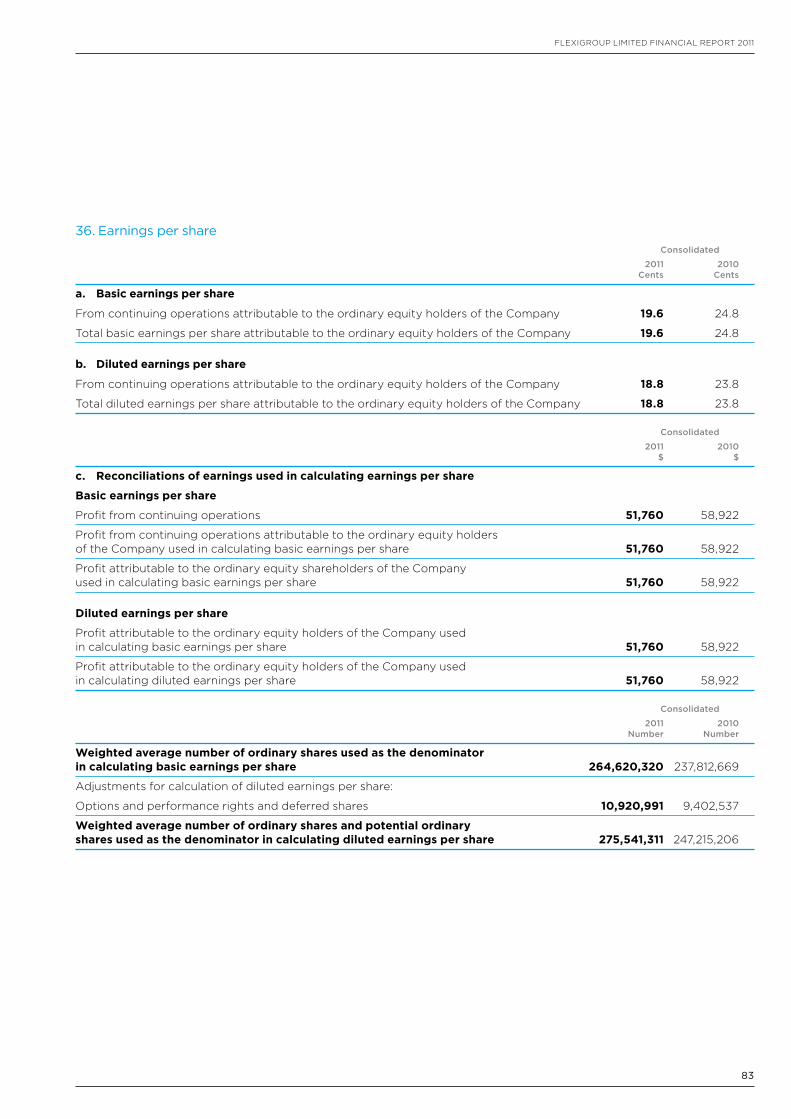
83
FLEXIGROUP LIMITED FInancIaL REPORT 2011
36. Earnings per share Consolidated
2011 2010 Cents Cents
a. Basic earnings per share
From continuing operations attributable to the ordinary equity holders of the company 19.6 24.8
Total basic earnings per share attributable to the ordinary equity holders of the company 19.6 24.8
b. Diluted earnings per share
From continuing operations attributable to the ordinary equity holders of the company 18.8 23.8
Total diluted earnings per share attributable to the ordinary equity holders of the company 18.8 23.8
Consolidated
2011 2010 $ $
c. Reconciliations of earnings used in calculating earnings per share
Basic earnings per share
Profit from continuing operations 51,760 58,922
Profit from continuing operations attributable to the ordinary equity holders of the company used in calculating basic earnings per share 51,760 58,922
Profit attributable to the ordinary equity shareholders of the company used in calculating basic earnings per share 51,760 58,922
Diluted earnings per share
Profit attributable to the ordinary equity holders of the company used in calculating basic earnings per share 51,760 58,922
Profit attributable to the ordinary equity holders of the company used in calculating diluted earnings per share 51,760 58,922
Consolidated
2011 2010 Number Number
Weighted average number of ordinary shares used as the denominator in calculating basic earnings per share 264,620,320 237,812,669
adjustments for calculation of diluted earnings per share:
Options and performance rights and deferred shares 10,920,991 9,402,537
Weighted average number of ordinary shares and potential ordinary shares used as the denominator in calculating diluted earnings per share 275,541,311 247,215,206
aS aT 30 JUnE 2011
84
36. Earnings per share (continued)
Information concerning the classification of securitiesOptionsOptions, performance rights and deferred (treasury) shares granted to employees under the FlexiGroup Tax Deferred Employee Share Plan Trust are considered to be potential ordinary shares and have been included in the determination of diluted earnings per share to the extent to which they are dilutive. The options, performance rights and deferred (treasury) shares have not been included in the determination of basic earnings per share. Details relating to the options, performance rights and deferred (treasury) shares, are set out in note 37.
37. Share-based payments
a. Long Term Incentive PlanThe establishment of the FlexiGroup Long Term Incentive Plan (“LTIP”) was approved by the founding shareholders on 20 november 2006. The LTIP is designed to provide relevant employees with an incentive for future performance, with conditions for the vesting and exercise of options, performance rights and deferred shares under the LTIP, encouraging those executives to remain with FlexiGroup and contribute to the future performance of the company. Under the plan, participants are granted either an option, right or deferred shares which only vests if certain performance standards are met.
The Board may determine which persons will be eligible to participate in the LTIP from time to time. Eligible persons may be invited to apply to participate in the LTIP. The Board may in its discretion accept such applications.
notes to the Financial Statements (continued)
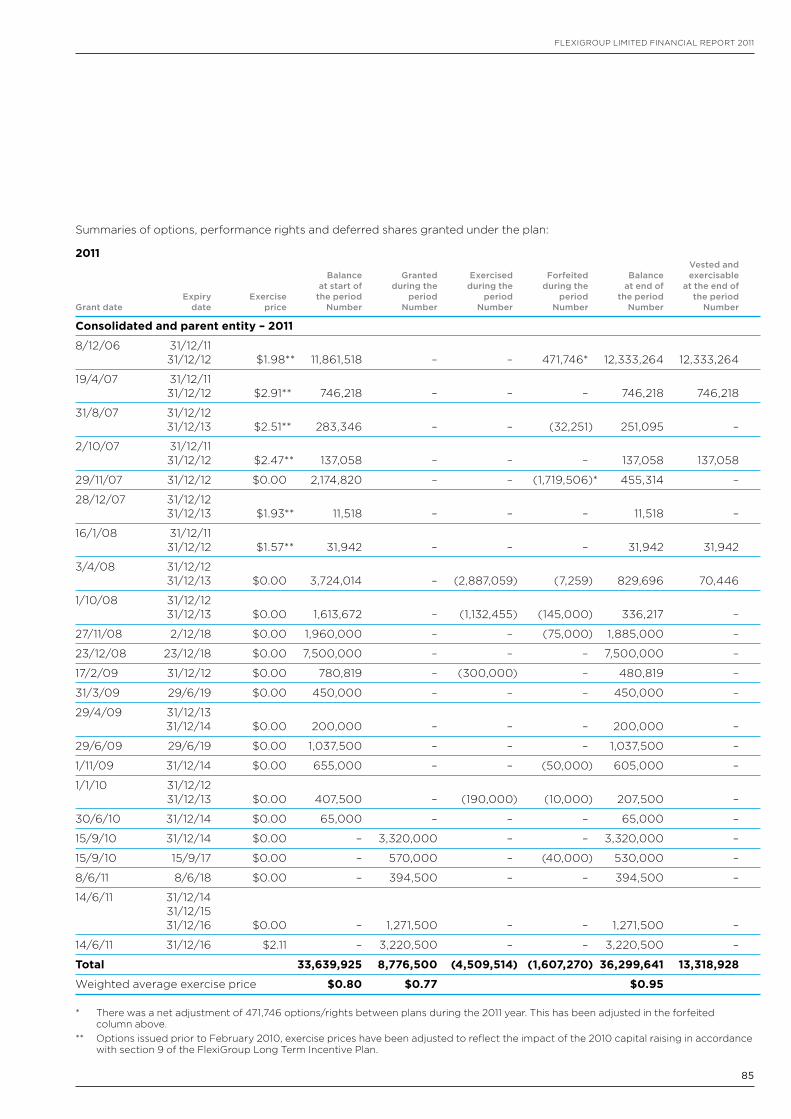
85
FLEXIGROUP LIMITED FInancIaL REPORT 2011
Summaries of options, performance rights and deferred shares granted under the plan:
2011 Vested and Balance Granted Exercised Forfeited Balance exercisable at start of during the during the during the at end of at the end of Expiry Exercise the period period period period the period the period Grant date date price Number Number Number Number Number Number
Consolidated and parent entity – 2011
8/12/06 31/12/11 31/12/12 $1.98** 11,861,518 – – 471,746* 12,333,264 12,333,264
19/4/07 31/12/11 31/12/12 $2.91** 746,218 – – – 746,218 746,218
31/8/07 31/12/12 31/12/13 $2.51** 283,346 – – (32,251) 251,095 –
2/10/07 31/12/11 31/12/12 $2.47** 137,058 – – – 137,058 137,058
29/11/07 31/12/12 $0.00 2,174,820 – – (1,719,506)* 455,314 –
28/12/07 31/12/12 31/12/13 $1.93** 11,518 – – – 11,518 –
16/1/08 31/12/11 31/12/12 $1.57** 31,942 – – – 31,942 31,942
3/4/08 31/12/12 31/12/13 $0.00 3,724,014 – (2,887,059) (7,259) 829,696 70,446
1/10/08 31/12/12 31/12/13 $0.00 1,613,672 – (1,132,455) (145,000) 336,217 –
27/11/08 2/12/18 $0.00 1,960,000 – – (75,000) 1,885,000 –
23/12/08 23/12/18 $0.00 7,500,000 – – – 7,500,000 –
17/2/09 31/12/12 $0.00 780,819 – (300,000) – 480,819 –
31/3/09 29/6/19 $0.00 450,000 – – – 450,000 –
29/4/09 31/12/13 31/12/14 $0.00 200,000 – – – 200,000 –
29/6/09 29/6/19 $0.00 1,037,500 – – – 1,037,500 –
1/11/09 31/12/14 $0.00 655,000 – – (50,000) 605,000 –
1/1/10 31/12/12 31/12/13 $0.00 407,500 – (190,000) (10,000) 207,500 –
30/6/10 31/12/14 $0.00 65,000 – – – 65,000 –
15/9/10 31/12/14 $0.00 – 3,320,000 – – 3,320,000 –
15/9/10 15/9/17 $0.00 – 570,000 – (40,000) 530,000 –
8/6/11 8/6/18 $0.00 – 394,500 – – 394,500 –
14/6/11 31/12/14 31/12/15 31/12/16 $0.00 – 1,271,500 – – 1,271,500 –
14/6/11 31/12/16 $2.11 – 3,220,500 – – 3,220,500 –
Total 33,639,925 8,776,500 (4,509,514) (1,607,270) 36,299,641 13,318,928
Weighted average exercise price $0.80 $0.77 $0.95
* There was a net adjustment of 471,746 options/rights between plans during the 2011 year. This has been adjusted in the forfeited column above.
** Options issued prior to February 2010, exercise prices have been adjusted to reflect the impact of the 2010 capital raising in accordance with section 9 of the FlexiGroup Long Term Incentive Plan.
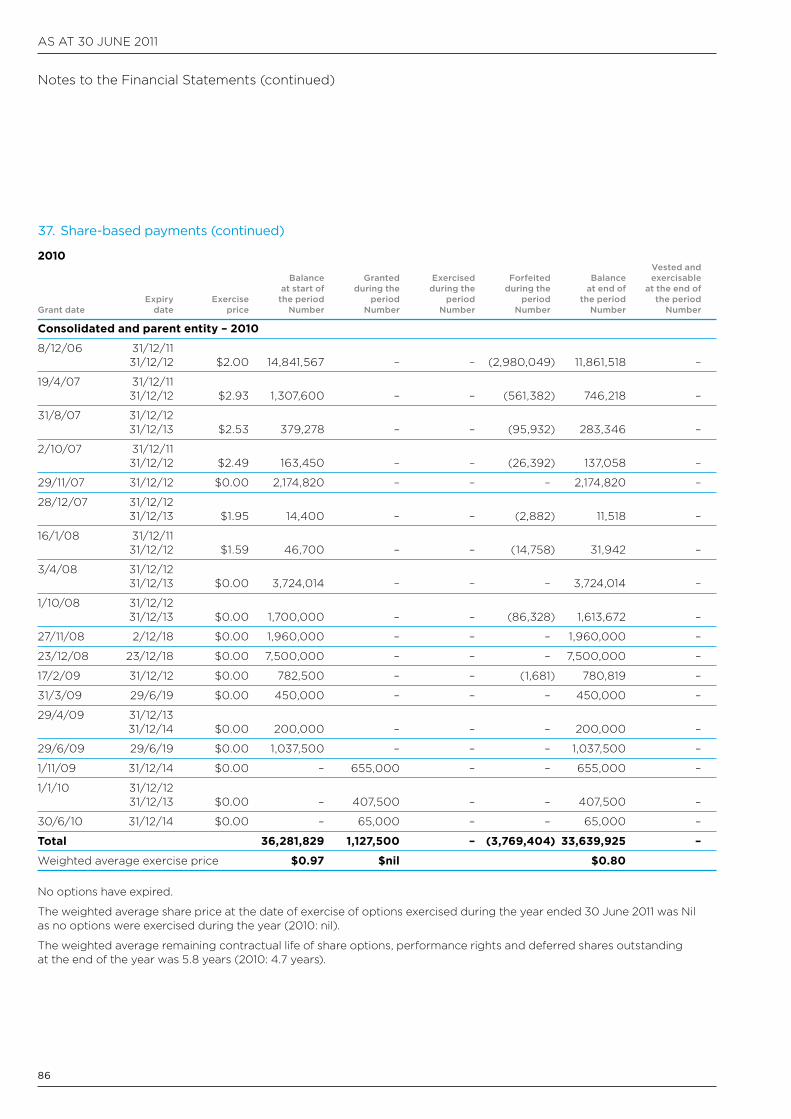
aS aT 30 JUnE 2011
86
notes to the Financial Statements (continued)
37. Share-based payments (continued)
2010 Vested and Balance Granted Exercised Forfeited Balance exercisable at start of during the during the during the at end of at the end of Expiry Exercise the period period period period the period the period Grant date date price Number Number Number Number Number Number
Consolidated and parent entity – 2010
8/12/06 31/12/11 31/12/12 $2.00 14,841,567 – – (2,980,049) 11,861,518 –
19/4/07 31/12/11 31/12/12 $2.93 1,307,600 – – (561,382) 746,218 –
31/8/07 31/12/12 31/12/13 $2.53 379,278 – – (95,932) 283,346 –
2/10/07 31/12/11 31/12/12 $2.49 163,450 – – (26,392) 137,058 –
29/11/07 31/12/12 $0.00 2,174,820 – – – 2,174,820 –
28/12/07 31/12/12 31/12/13 $1.95 14,400 – – (2,882) 11,518 –
16/1/08 31/12/11 31/12/12 $1.59 46,700 – – (14,758) 31,942 –
3/4/08 31/12/12 31/12/13 $0.00 3,724,014 – – – 3,724,014 –
1/10/08 31/12/12 31/12/13 $0.00 1,700,000 – – (86,328) 1,613,672 –
27/11/08 2/12/18 $0.00 1,960,000 – – – 1,960,000 –
23/12/08 23/12/18 $0.00 7,500,000 – – – 7,500,000 –
17/2/09 31/12/12 $0.00 782,500 – – (1,681) 780,819 –
31/3/09 29/6/19 $0.00 450,000 – – – 450,000 –
29/4/09 31/12/13 31/12/14 $0.00 200,000 – – – 200,000 –
29/6/09 29/6/19 $0.00 1,037,500 – – – 1,037,500 –
1/11/09 31/12/14 $0.00 – 655,000 – – 655,000 –
1/1/10 31/12/12 31/12/13 $0.00 – 407,500 – – 407,500 –
30/6/10 31/12/14 $0.00 – 65,000 – – 65,000 –
Total 36,281,829 1,127,500 – (3,769,404) 33,639,925 –
Weighted average exercise price $0.97 $nil $0.80
no options have expired.
The weighted average share price at the date of exercise of options exercised during the year ended 30 June 2011 was nil as no options were exercised during the year (2010: nil).
The weighted average remaining contractual life of share options, performance rights and deferred shares outstanding at the end of the year was 5.8 years (2010: 4.7 years).
87
FLEXIGROUP LIMITED FInancIaL REPORT 2011
Fair value of options, performance rights and deferred shares grantedFair values at grant date are independently determined using a binomial tree option pricing methodology that takes into account the exercise price, the term of the options, performance rights and deferred shares, the impact of dilution, the share price at grant date and expected price volatility of the underlying share, the expected dividend yield and the risk-free interest rate for the term of the options.
The model inputs for performance rights and deferred shares granted during the year ended 30 June 2011 included:a) Exercise price: various per performance rights and deferred shares granted
b) Grant date: various per performance rights and deferred shares granted
c) Expiry date: various per performance rights and deferred shares granted
d) Share price at grant date: various per performance rights and deferred shares granted
e) Expected price volatility of the company’s shares: 40% (2010: 60%)
f) Expected dividend yield: 5.0% – 5.5% (2010: 5.0%)
g) Risk-free interest rate: 4.38% – 4.97% (2010: 5.03%)
Shares provided on exercise of remuneration optionsno ordinary shares in the company were issued as a result of the exercise of any remuneration options.
b. Employee share plan The Employee Share acquisition (Tax Exempt) Plan (“ESaP”) is a general employee share plan pursuant to which grants of shares may be offered to employees of FlexiGroup on terms and conditions as determined by the Board from time to time.
The Board is responsible for administering the ESaP in accordance with the ESaP Rules and the terms and conditions of specific grants of shares to participants in the ESaP. The ESaP Rules include the following provisions:
EligibilityThe Board may determine which persons will be eligible to be offered the opportunity to participate in the ESaP from time to time. The Board may make offers to eligible persons for participation in the ESaP.
Terms of offerThe Board has the discretion to determine the specific terms and conditions applying to each offer, provided that:
The terms of the offer do not vary the disposal restrictions imposed on shares under the ESaP Rules under which shares acquired under the ESaP cannot be transferred, sold or otherwise disposed of until the earlier of:• The time when the participant is no longer employed by FlexiGroup or by the company that was the employer of the
participant as at the time the shares were acquired, or• The third anniversary of the date on which the shares were acquired, and• The offer does not include any provisions for forfeiture of shares acquired under the ESaP in any circumstances
It is intended that the ESaP will satisfy the requirements of Division 13a of the relevant australian Tax Legislation.
Consideration for grant The Board may determine the price at which the shares will be offered to an employee. Shares may be granted at no cost to the employee or the Board may determine that market value or some other price is appropriate.
Allocation of sharesShares allocated under the ESaP may be existing shares or newly issued shares. allocated shares must be held in the name of the employee. any shares that are issued under the ESaP will rank equally with those traded on the aSX at the time of issue.
a participant under the ESaP is entitled to receive distributions/dividends made in respect of, and exercise voting rights attaching to, shares held under the ESaP (whether or not the shares are subject to disposal restrictions).
Restrictions on sharesShares acquired under the ESaP will be subject to the disposal restrictions described above. FlexiGroup will implement such arrangements (including a holding lock) as it determines are necessary to enforce this restriction.
Once the restriction is removed, and subject to FlexiGroup’s Share Trading Policy, shares acquired under the ESaP may be dealt with freely. Details of FlexiGroup’s Share Trading Policy are in the corporate Governance Statement.
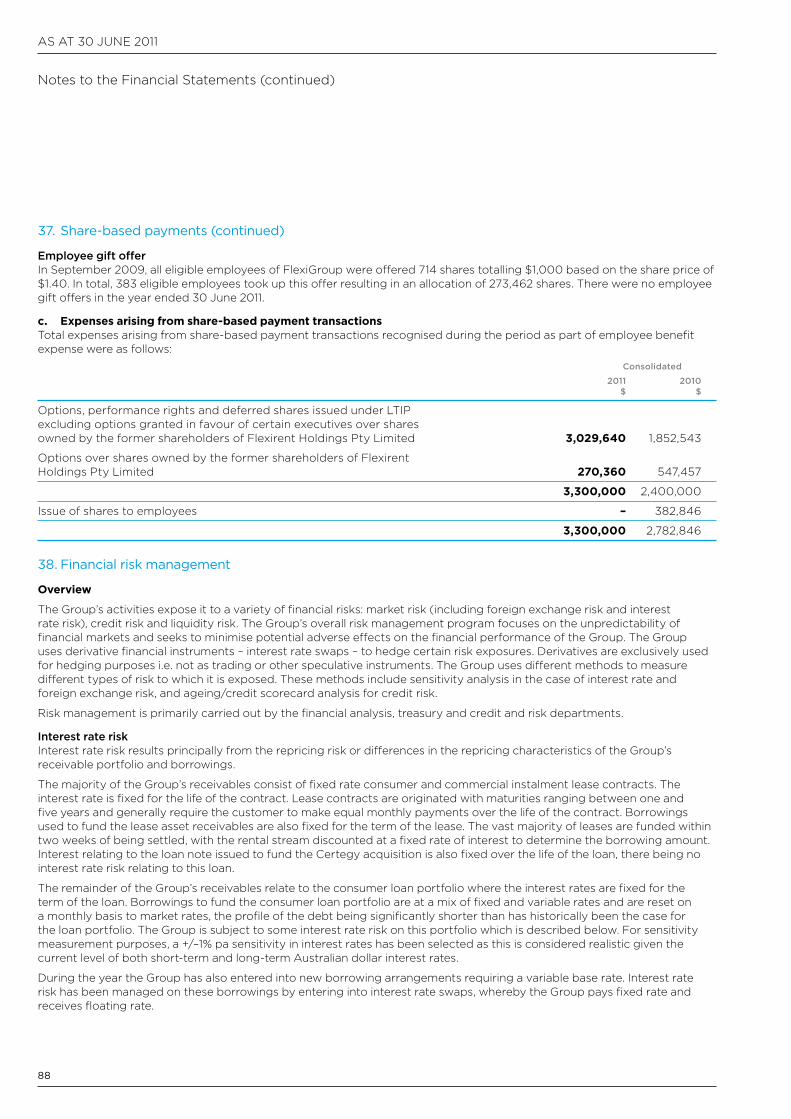
aS aT 30 JUnE 2011
88
notes to the Financial Statements (continued)
37. Share-based payments (continued)
Employee gift offerIn September 2009, all eligible employees of FlexiGroup were offered 714 shares totalling $1,000 based on the share price of $1.40. In total, 383 eligible employees took up this offer resulting in an allocation of 273,462 shares. There were no employee gift offers in the year ended 30 June 2011.
c. Expenses arising from share-based payment transactionsTotal expenses arising from share-based payment transactions recognised during the period as part of employee benefit expense were as follows: Consolidated
2011 2010 $ $
Options, performance rights and deferred shares issued under LTIP excluding options granted in favour of certain executives over shares owned by the former shareholders of Flexirent Holdings Pty Limited 3,029,640 1,852,543
Options over shares owned by the former shareholders of Flexirent Holdings Pty Limited 270,360 547,457
3,300,000 2,400,000
Issue of shares to employees – 382,846
3,300,000 2,782,846
38. Financial risk management
Overview
The Group’s activities expose it to a variety of financial risks: market risk (including foreign exchange risk and interest rate risk), credit risk and liquidity risk. The Group’s overall risk management program focuses on the unpredictability of financial markets and seeks to minimise potential adverse effects on the financial performance of the Group. The Group uses derivative financial instruments – interest rate swaps – to hedge certain risk exposures. Derivatives are exclusively used for hedging purposes i.e. not as trading or other speculative instruments. The Group uses different methods to measure different types of risk to which it is exposed. These methods include sensitivity analysis in the case of interest rate and foreign exchange risk, and ageing/credit scorecard analysis for credit risk.
Risk management is primarily carried out by the financial analysis, treasury and credit and risk departments.
Interest rate risk Interest rate risk results principally from the repricing risk or differences in the repricing characteristics of the Group’s receivable portfolio and borrowings.
The majority of the Group’s receivables consist of fixed rate consumer and commercial instalment lease contracts. The interest rate is fixed for the life of the contract. Lease contracts are originated with maturities ranging between one and five years and generally require the customer to make equal monthly payments over the life of the contract. Borrowings used to fund the lease asset receivables are also fixed for the term of the lease. The vast majority of leases are funded within two weeks of being settled, with the rental stream discounted at a fixed rate of interest to determine the borrowing amount. Interest relating to the loan note issued to fund the certegy acquisition is also fixed over the life of the loan, there being no interest rate risk relating to this loan.
The remainder of the Group’s receivables relate to the consumer loan portfolio where the interest rates are fixed for the term of the loan. Borrowings to fund the consumer loan portfolio are at a mix of fixed and variable rates and are reset on a monthly basis to market rates, the profile of the debt being significantly shorter than has historically been the case for the loan portfolio. The Group is subject to some interest rate risk on this portfolio which is described below. For sensitivity measurement purposes, a +/–1% pa sensitivity in interest rates has been selected as this is considered realistic given the current level of both short-term and long-term australian dollar interest rates.
During the year the Group has also entered into new borrowing arrangements requiring a variable base rate. Interest rate risk has been managed on these borrowings by entering into interest rate swaps, whereby the Group pays fixed rate and receives floating rate.
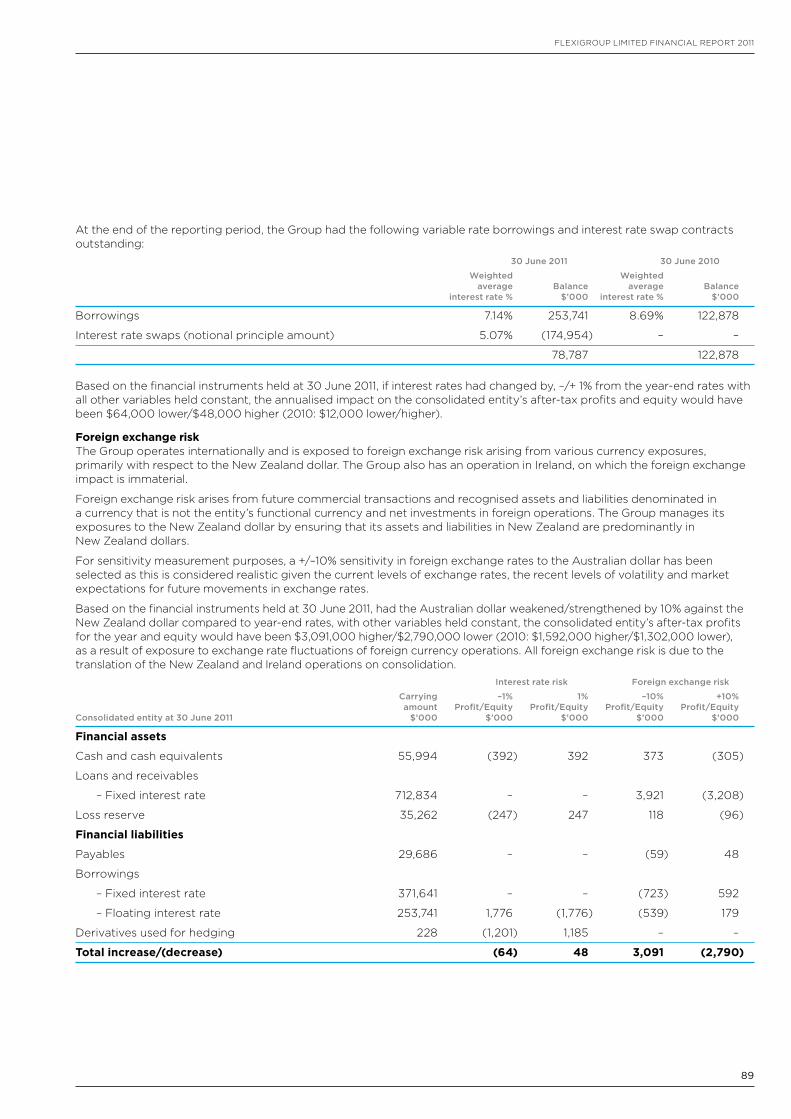
89
FLEXIGROUP LIMITED FInancIaL REPORT 2011
at the end of the reporting period, the Group had the following variable rate borrowings and interest rate swap contracts outstanding: 30 June 2011 30 June 2010
Weighted Weighted average Balance average Balance interest rate % $’000 interest rate % $’000
Borrowings 7.14% 253,741 8.69% 122,878
Interest rate swaps (notional principle amount) 5.07% (174,954) – –
78,787 122,878
Based on the financial instruments held at 30 June 2011, if interest rates had changed by, –/+ 1% from the year-end rates with all other variables held constant, the annualised impact on the consolidated entity’s after-tax profits and equity would have been $64,000 lower/$48,000 higher (2010: $12,000 lower/higher).
Foreign exchange riskThe Group operates internationally and is exposed to foreign exchange risk arising from various currency exposures, primarily with respect to the new Zealand dollar. The Group also has an operation in Ireland, on which the foreign exchange impact is immaterial.
Foreign exchange risk arises from future commercial transactions and recognised assets and liabilities denominated in a currency that is not the entity’s functional currency and net investments in foreign operations. The Group manages its exposures to the new Zealand dollar by ensuring that its assets and liabilities in new Zealand are predominantly in new Zealand dollars.
For sensitivity measurement purposes, a +/–10% sensitivity in foreign exchange rates to the australian dollar has been selected as this is considered realistic given the current levels of exchange rates, the recent levels of volatility and market expectations for future movements in exchange rates.
Based on the financial instruments held at 30 June 2011, had the australian dollar weakened/strengthened by 10% against the new Zealand dollar compared to year-end rates, with other variables held constant, the consolidated entity’s after-tax profits for the year and equity would have been $3,091,000 higher/$2,790,000 lower (2010: $1,592,000 higher/$1,302,000 lower), as a result of exposure to exchange rate fluctuations of foreign currency operations. all foreign exchange risk is due to the translation of the new Zealand and Ireland operations on consolidation. Interest rate risk Foreign exchange risk
Carrying –1% 1% –10% +10% amount Profit/Equity Profit/Equity Profit/Equity Profit/Equity Consolidated entity at 30 June 2011 $’000 $’000 $’000 $’000 $’000
Financial assets
cash and cash equivalents 55,994 (392) 392 373 (305)
Loans and receivables
– Fixed interest rate 712,834 – – 3,921 (3,208)
Loss reserve 35,262 (247) 247 118 (96)
Financial liabilities
Payables 29,686 – – (59) 48
Borrowings
– Fixed interest rate 371,641 – – (723) 592
– Floating interest rate 253,741 1,776 (1,776) (539) 179
Derivatives used for hedging 228 (1,201) 1,185 – –
Total increase/(decrease) (64) 48 3,091 (2,790)
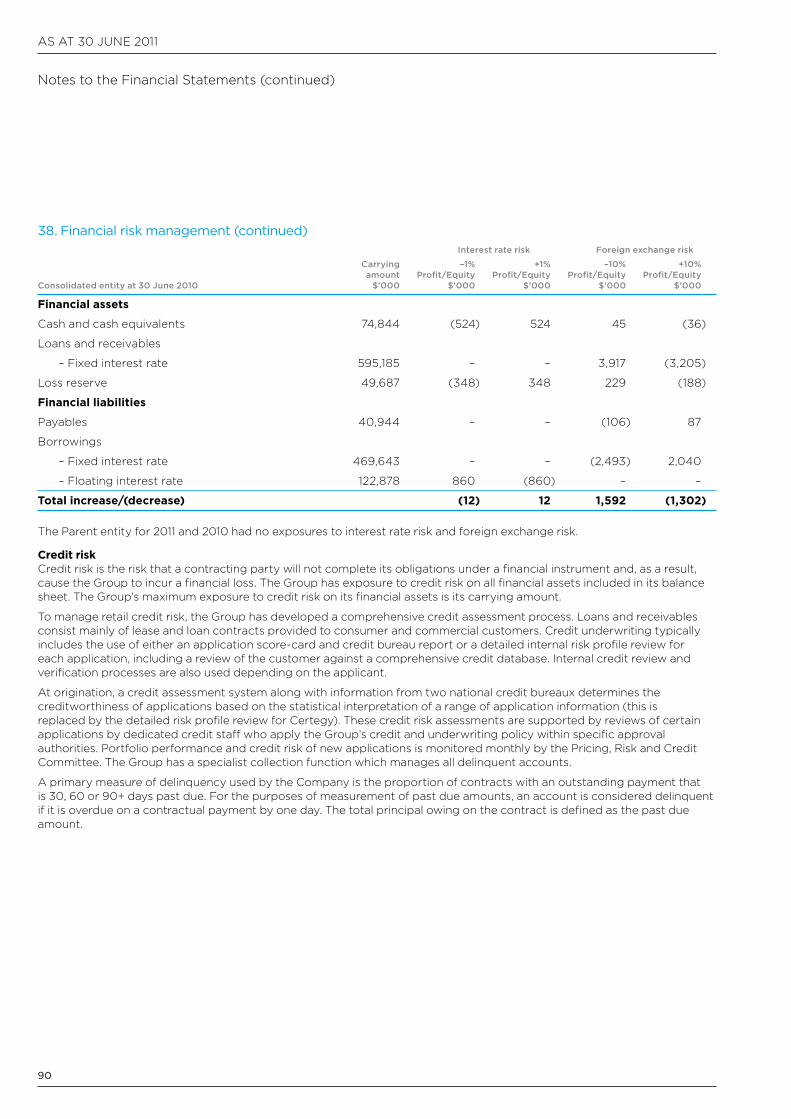
aS aT 30 JUnE 2011
90
38. Financial risk management (continued) Interest rate risk Foreign exchange risk
Carrying –1% +1% –10% +10% amount Profit/Equity Profit/Equity Profit/Equity Profit/Equity Consolidated entity at 30 June 2010 $’000 $’000 $’000 $’000 $’000
Financial assets
cash and cash equivalents 74,844 (524) 524 45 (36)
Loans and receivables
– Fixed interest rate 595,185 – – 3,917 (3,205)
Loss reserve 49,687 (348) 348 229 (188)
Financial liabilities
Payables 40,944 – – (106) 87
Borrowings
– Fixed interest rate 469,643 – – (2,493) 2,040
– Floating interest rate 122,878 860 (860) – –
Total increase/(decrease) (12) 12 1,592 (1,302)
The Parent entity for 2011 and 2010 had no exposures to interest rate risk and foreign exchange risk.
Credit riskcredit risk is the risk that a contracting party will not complete its obligations under a financial instrument and, as a result, cause the Group to incur a financial loss. The Group has exposure to credit risk on all financial assets included in its balance sheet. The Group’s maximum exposure to credit risk on its financial assets is its carrying amount.
To manage retail credit risk, the Group has developed a comprehensive credit assessment process. Loans and receivables consist mainly of lease and loan contracts provided to consumer and commercial customers. credit underwriting typically includes the use of either an application score-card and credit bureau report or a detailed internal risk profile review for each application, including a review of the customer against a comprehensive credit database. Internal credit review and verification processes are also used depending on the applicant.
at origination, a credit assessment system along with information from two national credit bureaux determines the creditworthiness of applications based on the statistical interpretation of a range of application information (this is replaced by the detailed risk profile review for certegy). These credit risk assessments are supported by reviews of certain applications by dedicated credit staff who apply the Group’s credit and underwriting policy within specific approval authorities. Portfolio performance and credit risk of new applications is monitored monthly by the Pricing, Risk and credit committee. The Group has a specialist collection function which manages all delinquent accounts.
a primary measure of delinquency used by the company is the proportion of contracts with an outstanding payment that is 30, 60 or 90+ days past due. For the purposes of measurement of past due amounts, an account is considered delinquent if it is overdue on a contractual payment by one day. The total principal owing on the contract is defined as the past due amount.
notes to the Financial Statements (continued)
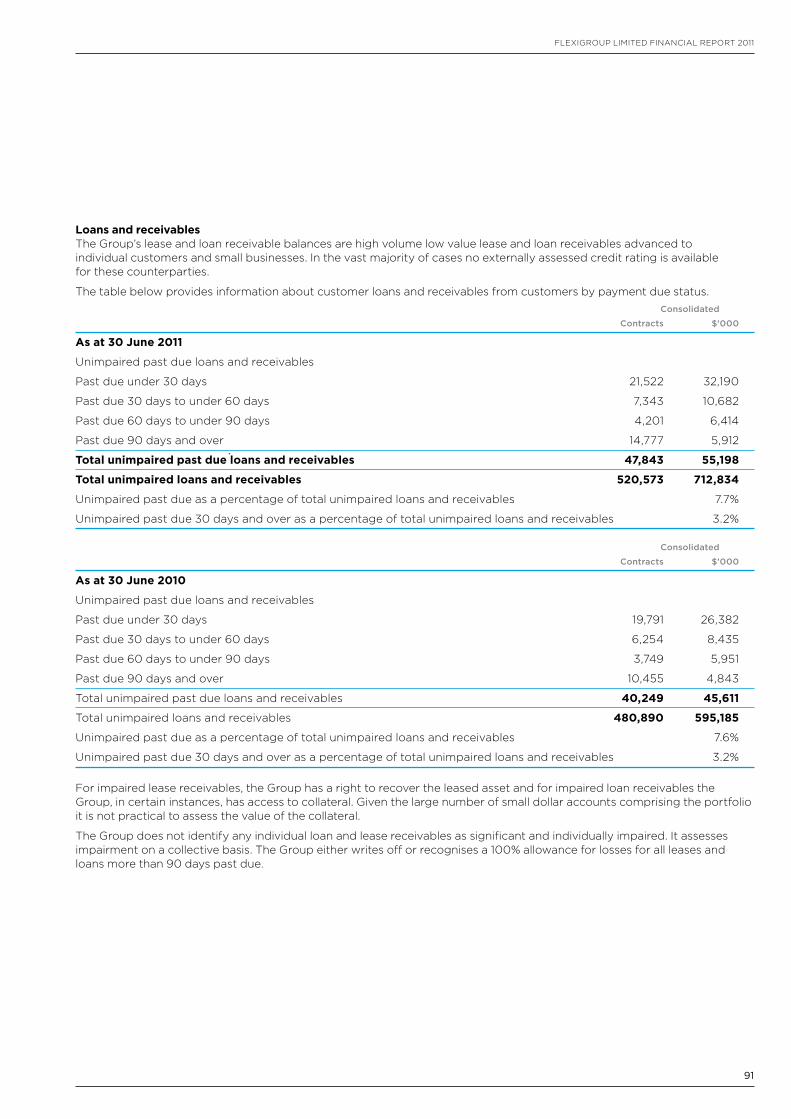
91
FLEXIGROUP LIMITED FInancIaL REPORT 2011
Loans and receivablesThe Group’s lease and loan receivable balances are high volume low value lease and loan receivables advanced to individual customers and small businesses. In the vast majority of cases no externally assessed credit rating is available for these counterparties.
The table below provides information about customer loans and receivables from customers by payment due status. Consolidated
Contracts $’000
As at 30 June 2011
Unimpaired past due loans and receivables
Past due under 30 days 21,522 32,190
Past due 30 days to under 60 days 7,343 10,682
Past due 60 days to under 90 days 4,201 6,414
Past due 90 days and over 14,777 5,912
Total unimpaired past due loans and receivables 47,843 55,198
Total unimpaired loans and receivables 520,573 712,834
Unimpaired past due as a percentage of total unimpaired loans and receivables 7.7%
Unimpaired past due 30 days and over as a percentage of total unimpaired loans and receivables 3.2%
Consolidated
Contracts $’000
As at 30 June 2010
Unimpaired past due loans and receivables
Past due under 30 days 19,791 26,382
Past due 30 days to under 60 days 6,254 8,435
Past due 60 days to under 90 days 3,749 5,951
Past due 90 days and over 10,455 4,843
Total unimpaired past due loans and receivables 40,249 45,611
Total unimpaired loans and receivables 480,890 595,185
Unimpaired past due as a percentage of total unimpaired loans and receivables 7.6%
Unimpaired past due 30 days and over as a percentage of total unimpaired loans and receivables 3.2%
For impaired lease receivables, the Group has a right to recover the leased asset and for impaired loan receivables the Group, in certain instances, has access to collateral. Given the large number of small dollar accounts comprising the portfolio it is not practical to assess the value of the collateral.
The Group does not identify any individual loan and lease receivables as significant and individually impaired. It assesses impairment on a collective basis. The Group either writes off or recognises a 100% allowance for losses for all leases and loans more than 90 days past due.
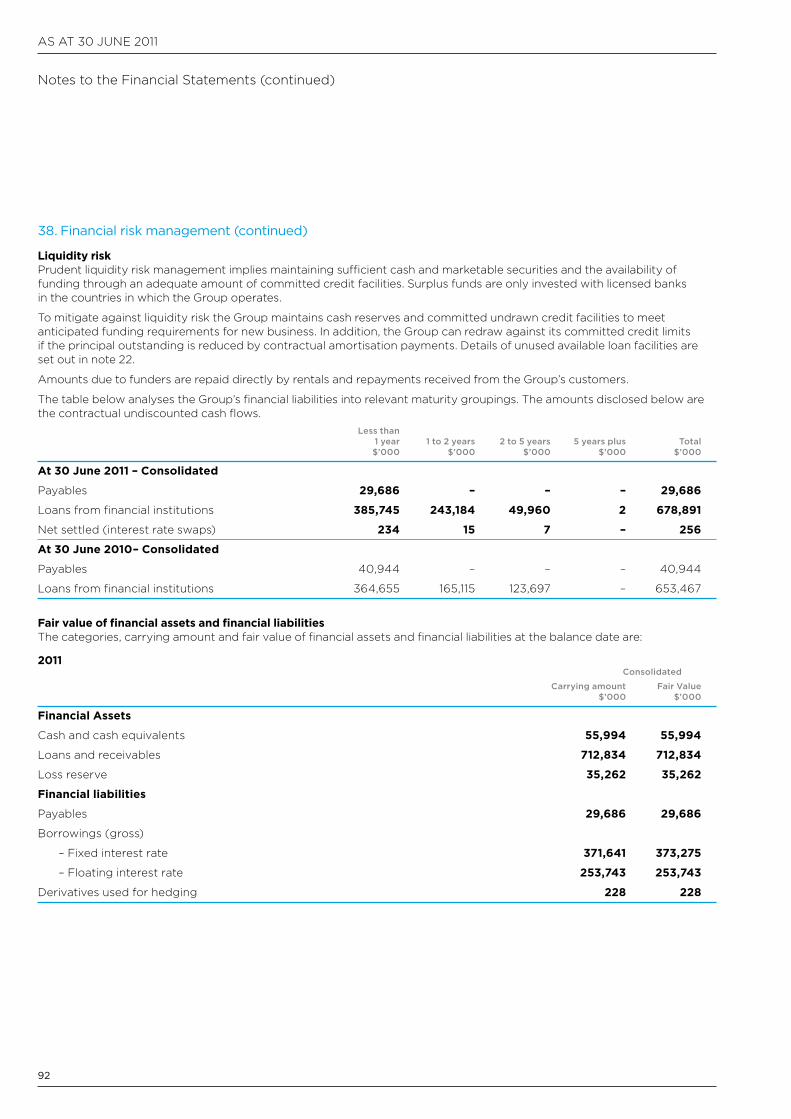
aS aT 30 JUnE 2011
92
notes to the Financial Statements (continued)
38. Financial risk management (continued)
Liquidity riskPrudent liquidity risk management implies maintaining sufficient cash and marketable securities and the availability of funding through an adequate amount of committed credit facilities. Surplus funds are only invested with licensed banks in the countries in which the Group operates.
To mitigate against liquidity risk the Group maintains cash reserves and committed undrawn credit facilities to meet anticipated funding requirements for new business. In addition, the Group can redraw against its committed credit limits if the principal outstanding is reduced by contractual amortisation payments. Details of unused available loan facilities are set out in note 22.
amounts due to funders are repaid directly by rentals and repayments received from the Group’s customers.
The table below analyses the Group’s financial liabilities into relevant maturity groupings. The amounts disclosed below are the contractual undiscounted cash flows. Less than 1 year 1 to 2 years 2 to 5 years 5 years plus Total $’000 $’000 $’000 $’000 $’000
At 30 June 2011 – Consolidated
Payables 29,686 – – – 29,686
Loans from financial institutions 385,745 243,184 49,960 2 678,891
net settled (interest rate swaps) 234 15 7 – 256
At 30 June 2010– Consolidated
Payables 40,944 – – – 40,944
Loans from financial institutions 364,655 165,115 123,697 – 653,467
Fair value of financial assets and financial liabilitiesThe categories, carrying amount and fair value of financial assets and financial liabilities at the balance date are:
2011 Consolidated
Carrying amount Fair Value $’000 $’000
Financial Assets
cash and cash equivalents 55,994 55,994
Loans and receivables 712,834 712,834
Loss reserve 35,262 35,262
Financial liabilities
Payables 29,686 29,686
Borrowings (gross)
– Fixed interest rate 371,641 373,275
– Floating interest rate 253,743 253,743
Derivatives used for hedging 228 228
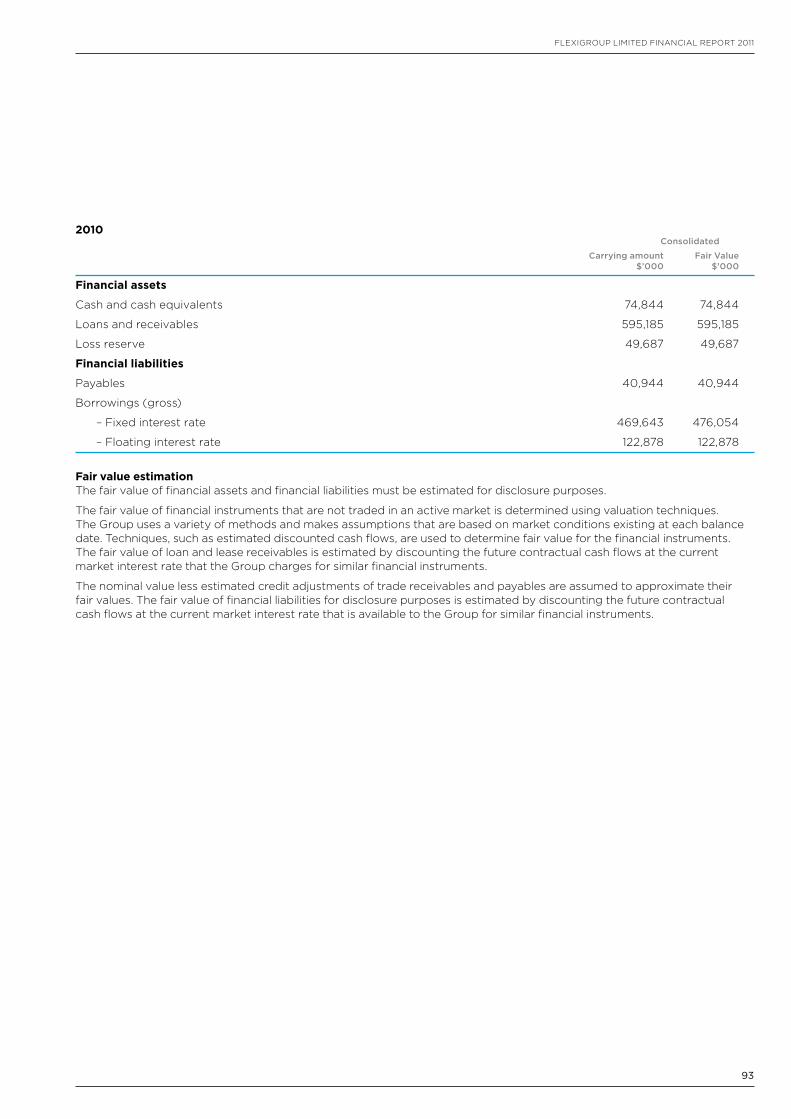
93
FLEXIGROUP LIMITED FInancIaL REPORT 2011
2010 Consolidated
Carrying amount Fair Value $’000 $’000
Financial assets
cash and cash equivalents 74,844 74,844
Loans and receivables 595,185 595,185
Loss reserve 49,687 49,687
Financial liabilities
Payables 40,944 40,944
Borrowings (gross)
– Fixed interest rate 469,643 476,054
– Floating interest rate 122,878 122,878
Fair value estimation The fair value of financial assets and financial liabilities must be estimated for disclosure purposes.
The fair value of financial instruments that are not traded in an active market is determined using valuation techniques. The Group uses a variety of methods and makes assumptions that are based on market conditions existing at each balance date. Techniques, such as estimated discounted cash flows, are used to determine fair value for the financial instruments. The fair value of loan and lease receivables is estimated by discounting the future contractual cash flows at the current market interest rate that the Group charges for similar financial instruments.
The nominal value less estimated credit adjustments of trade receivables and payables are assumed to approximate their fair values. The fair value of financial liabilities for disclosure purposes is estimated by discounting the future contractual cash flows at the current market interest rate that is available to the Group for similar financial instruments.
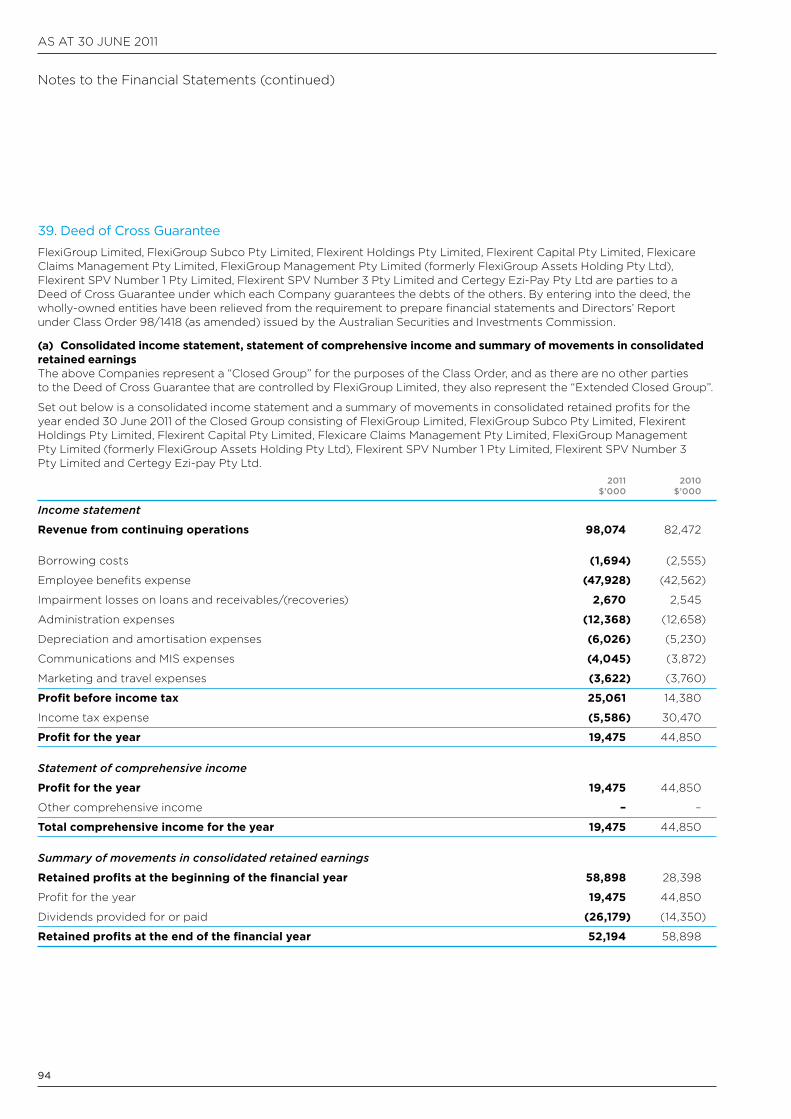
aS aT 30 JUnE 2011
94
notes to the Financial Statements (continued)
39. Deed of Cross Guarantee
FlexiGroup Limited, FlexiGroup Subco Pty Limited, Flexirent Holdings Pty Limited, Flexirent capital Pty Limited, Flexicare claims Management Pty Limited, FlexiGroup Management Pty Limited (formerly FlexiGroup assets Holding Pty Ltd), Flexirent SPV number 1 Pty Limited, Flexirent SPV number 3 Pty Limited and certegy Ezi-Pay Pty Ltd are parties to a Deed of cross Guarantee under which each company guarantees the debts of the others. By entering into the deed, the wholly-owned entities have been relieved from the requirement to prepare financial statements and Directors’ Report under class Order 98/1418 (as amended) issued by the australian Securities and Investments commission.
(a) Consolidated income statement, statement of comprehensive income and summary of movements in consolidated retained earningsThe above companies represent a “closed Group” for the purposes of the class Order, and as there are no other parties to the Deed of cross Guarantee that are controlled by FlexiGroup Limited, they also represent the “Extended closed Group”.
Set out below is a consolidated income statement and a summary of movements in consolidated retained profits for the year ended 30 June 2011 of the closed Group consisting of FlexiGroup Limited, FlexiGroup Subco Pty Limited, Flexirent Holdings Pty Limited, Flexirent capital Pty Limited, Flexicare claims Management Pty Limited, FlexiGroup Management Pty Limited (formerly FlexiGroup assets Holding Pty Ltd), Flexirent SPV number 1 Pty Limited, Flexirent SPV number 3 Pty Limited and certegy Ezi-pay Pty Ltd. 2011 2010 $’000 $’000
Income statement
Revenue from continuing operations 98,074 82,472
Borrowing costs (1,694) (2,555)
Employee benefits expense (47,928) (42,562)
Impairment losses on loans and receivables/(recoveries) 2,670 2,545
administration expenses (12,368) (12,658)
Depreciation and amortisation expenses (6,026) (5,230)
communications and MIS expenses (4,045) (3,872)
Marketing and travel expenses (3,622) (3,760)
Profit before income tax 25,061 14,380
Income tax expense (5,586) 30,470
Profit for the year 19,475 44,850
Statement of comprehensive income
Profit for the year 19,475 44,850
Other comprehensive income – –
Total comprehensive income for the year 19,475 44,850
Summary of movements in consolidated retained earnings
Retained profits at the beginning of the financial year 58,898 28,398
Profit for the year 19,475 44,850
Dividends provided for or paid (26,179) (14,350)
Retained profits at the end of the financial year 52,194 58,898
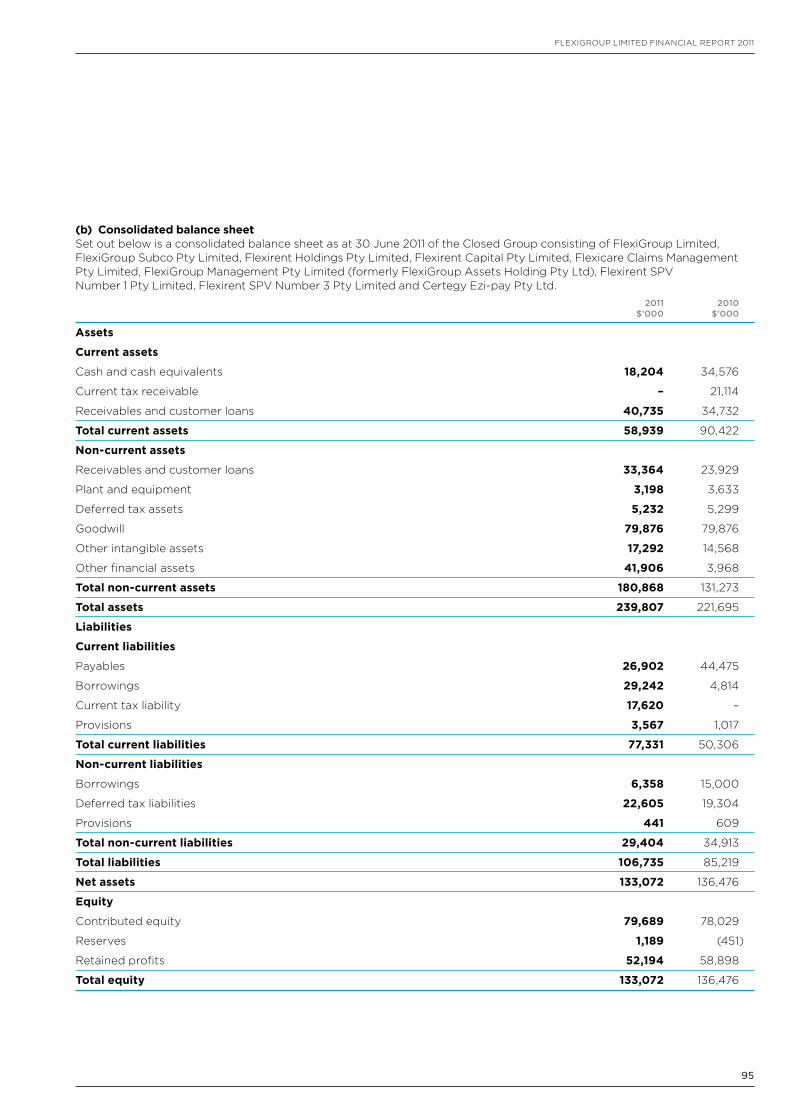
95
FLEXIGROUP LIMITED FInancIaL REPORT 2011
(b) Consolidated balance sheetSet out below is a consolidated balance sheet as at 30 June 2011 of the closed Group consisting of FlexiGroup Limited, FlexiGroup Subco Pty Limited, Flexirent Holdings Pty Limited, Flexirent capital Pty Limited, Flexicare claims Management Pty Limited, FlexiGroup Management Pty Limited (formerly FlexiGroup assets Holding Pty Ltd), Flexirent SPV number 1 Pty Limited, Flexirent SPV number 3 Pty Limited and certegy Ezi-pay Pty Ltd. 2011 2010 $’000 $’000
Assets
Current assets
cash and cash equivalents 18,204 34,576
current tax receivable – 21,114
Receivables and customer loans 40,735 34,732
Total current assets 58,939 90,422
Non-current assets
Receivables and customer loans 33,364 23,929
Plant and equipment 3,198 3,633
Deferred tax assets 5,232 5,299
Goodwill 79,876 79,876
Other intangible assets 17,292 14,568
Other financial assets 41,906 3,968
Total non-current assets 180,868 131,273
Total assets 239,807 221,695
Liabilities
Current liabilities
Payables 26,902 44,475
Borrowings 29,242 4,814
current tax liability 17,620 –
Provisions 3,567 1,017
Total current liabilities 77,331 50,306
Non-current liabilities
Borrowings 6,358 15,000
Deferred tax liabilities 22,605 19,304
Provisions 441 609
Total non-current liabilities 29,404 34,913
Total liabilities 106,735 85,219
Net assets 133,072 136,476
Equity
contributed equity 79,689 78,029
Reserves 1,189 (451)
Retained profits 52,194 58,898
Total equity 133,072 136,476
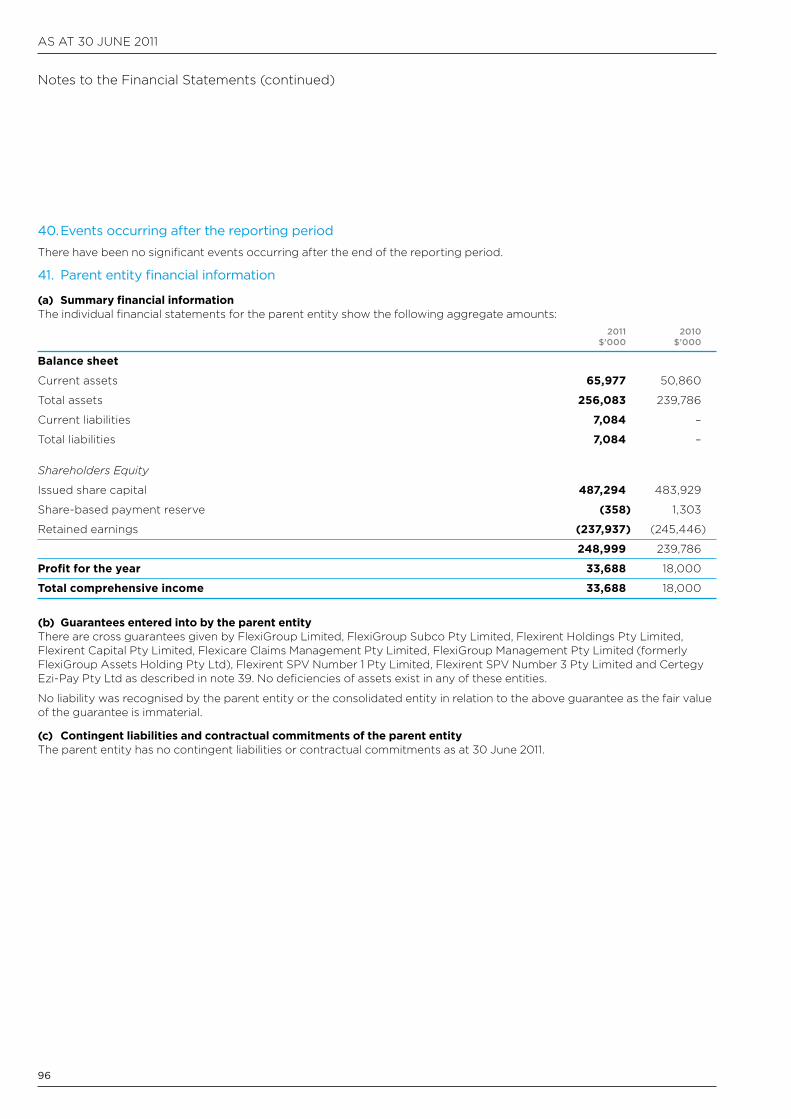
aS aT 30 JUnE 2011
96
notes to the Financial Statements (continued)
40. Events occurring after the reporting period
There have been no significant events occurring after the end of the reporting period.
41. Parent entity financial information
(a) Summary financial informationThe individual financial statements for the parent entity show the following aggregate amounts: 2011 2010 $’000 $’000
Balance sheet
current assets 65,977 50,860
Total assets 256,083 239,786
current liabilities 7,084 –
Total liabilities 7,084 –
Shareholders Equity
Issued share capital 487,294 483,929
Share-based payment reserve (358) 1,303
Retained earnings (237,937) (245,446)
248,999 239,786
Profit for the year 33,688 18,000
Total comprehensive income 33,688 18,000
(b) Guarantees entered into by the parent entityThere are cross guarantees given by FlexiGroup Limited, FlexiGroup Subco Pty Limited, Flexirent Holdings Pty Limited, Flexirent capital Pty Limited, Flexicare claims Management Pty Limited, FlexiGroup Management Pty Limited (formerly FlexiGroup assets Holding Pty Ltd), Flexirent SPV number 1 Pty Limited, Flexirent SPV number 3 Pty Limited and certegy Ezi-Pay Pty Ltd as described in note 39. no deficiencies of assets exist in any of these entities.
no liability was recognised by the parent entity or the consolidated entity in relation to the above guarantee as the fair value of the guarantee is immaterial.
(c) Contingent liabilities and contractual commitments of the parent entityThe parent entity has no contingent liabilities or contractual commitments as at 30 June 2011.
97
FLEXIGROUP LIMITED FInancIaL REPORT 201130 JUnE 2011
Directors’ Declaration
Directors’ Declaration 30 June 2011
In the Directors’ opinion:
(a) the financial statements and notes set out on pages 44 to 96 are in accordance with the Corporations Act 2001, including:
(i) complying with accounting Standards, the Corporations Regulations 2001 and other mandatory professional reporting requirements, and
(ii) giving a true and fair view of the consolidated entity’s financial position as at 30 June 2011 and of its performance for the financial year ended on that date, and
(b) there are reasonable grounds to believe that the company will be able to pay its debts as and when they become due and payable, and
(c) at the date of this declaration, there are reasonable grounds to believe that the members of the Extended closed Group identified in note 39 will be able to meet any obligations or liabilities to which they are, or may become, subject by virtue to the Deed of cross Guarantee in note 39.
note 1(a) confirms that the financial statements also comply with International Financial Reporting Standards as issued by the International accounting Standards Board.
The Directors have been given the declarations by the chief Executive Officer and chief Financial Officer required by section 295a of the Corporations Act 2001.
This declaration is made in accordance with a resolution of the Directors.
Margaret Jackson chairman
Sydney 5 august 2011
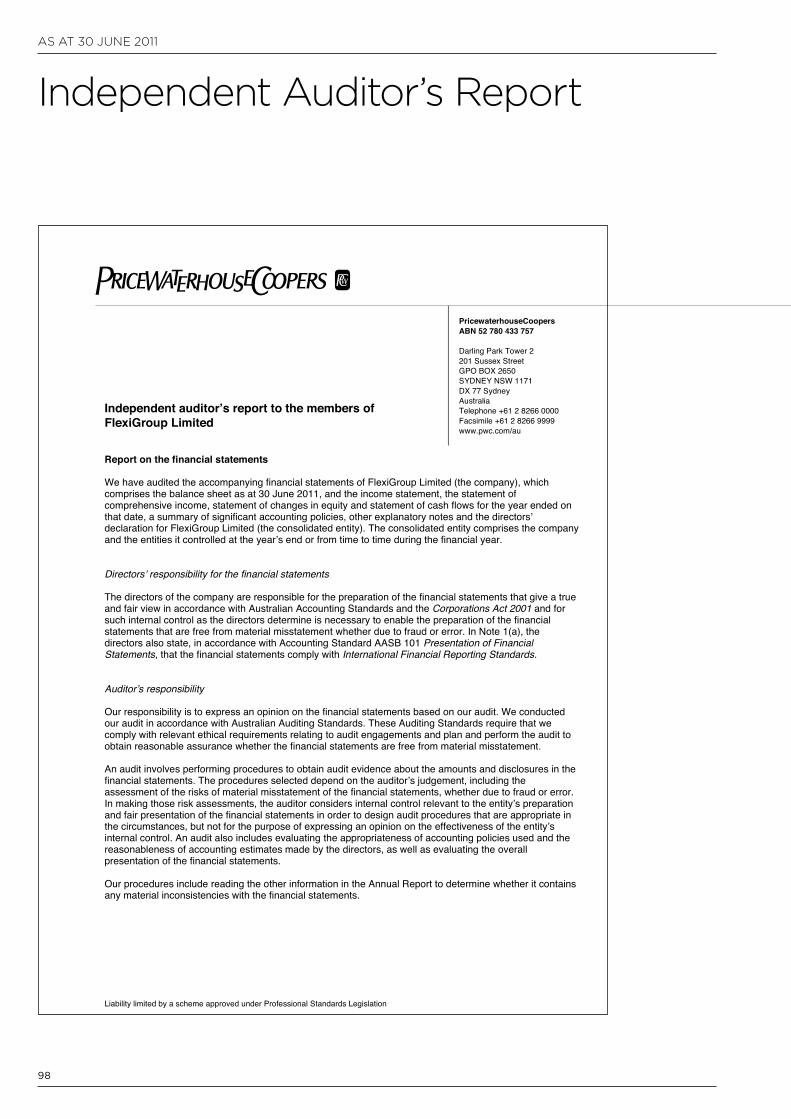
aS aT 30 JUnE 2011
98
Independent auditor’s Report
FlexiGroup Limited and its controlled entitiesIndependent Auditor’s report
30 June 2011
Liability limited by a scheme approved under Professional Standards Legislation
97
PricewaterhouseCoopersABN 52 780 433 757
Darling Park Tower 2201 Sussex StreetGPO BOX 2650SYDNEY NSW 1171DX 77 SydneyAustraliaTelephone +61 2 8266 0000Facsimile +61 2 8266 9999www.pwc.com/au
Independent auditor’s report to the members ofFlexiGroup Limited
Report on the financial statements
We have audited the accompanying financial statements of FlexiGroup Limited (the company), whichcomprises the balance sheet as at 30 June 2011, and the income statement, the statement ofcomprehensive income, statement of changes in equity and statement of cash flows for the year ended onthat date, a summary of significant accounting policies, other explanatory notes and the directors’declaration for FlexiGroup Limited (the consolidated entity). The consolidated entity comprises the companyand the entities it controlled at the year’s end or from time to time during the financial year.
Directors’ responsibility for the financial statements
The directors of the company are responsible for the preparation of the financial statements that give a trueand fair view in accordance with Australian Accounting Standards and the Corporations Act 2001 and forsuch internal control as the directors determine is necessary to enable the preparation of the financialstatements that are free from material misstatement whether due to fraud or error. In Note 1(a), thedirectors also state, in accordance with Accounting Standard AASB 101 Presentation of FinancialStatements, that the financial statements comply with International Financial Reporting Standards.
Auditor’s responsibility
Our responsibility is to express an opinion on the financial statements based on our audit. We conductedour audit in accordance with Australian Auditing Standards. These Auditing Standards require that wecomply with relevant ethical requirements relating to audit engagements and plan and perform the audit toobtain reasonable assurance whether the financial statements are free from material misstatement.
An audit involves performing procedures to obtain audit evidence about the amounts and disclosures in thefinancial statements. The procedures selected depend on the auditor’s judgement, including theassessment of the risks of material misstatement of the financial statements, whether due to fraud or error.In making those risk assessments, the auditor considers internal control relevant to the entity’s preparationand fair presentation of the financial statements in order to design audit procedures that are appropriate inthe circumstances, but not for the purpose of expressing an opinion on the effectiveness of the entity’sinternal control. An audit also includes evaluating the appropriateness of accounting policies used and thereasonableness of accounting estimates made by the directors, as well as evaluating the overallpresentation of the financial statements.
Our procedures include reading the other information in the Annual Report to determine whether it containsany material inconsistencies with the financial statements.
99
FLEXIGROUP LIMITED FInancIaL REPORT 2011
FlexiGroup Limited and its controlled entitiesIndependent Auditor’s report
30 June 2011
Liability limited by a scheme approved under Professional Standards Legislation
98
We believe that the audit evidence we have obtained is sufficient and appropriate to provide a basis for ouraudit opinions.
Independence
In conducting our audit, we have complied with the independence requirements of the Corporations Act2001.
Auditor’s opinion
In our opinion:
(a) the financial statements of FlexiGroup Limited are in accordance with the Corporations Act 2001,including:
(i) giving a true and fair view of the consolidated entity’s financial position as at 30 June 2011and of its performance for the year ended on that date; and
(ii) complying with Australian Accounting Standards (including the Australian AccountingInterpretations) and the Corporations Regulations 2001; and
(b) the financial statements and notes also comply with International Financial Reporting Standards asdisclosed in Note 1(a).
Report on the Remuneration Report
We have audited the remuneration report included in the directors’ report for the year ended 30 June 2011.The directors of the company are responsible for the preparation and presentation of the remunerationreport in accordance with section 300A of the Corporations Act 2001. Our responsibility is to express anopinion on the remuneration report, based on our audit conducted in accordance with Australian AuditingStandards.
Auditor’s opinion
In our opinion, the remuneration report of FlexiGroup Limited for the year ended 30 June 2011, complieswith section 300A of the Corporations Act 2001.
PricewaterhouseCoopers
Rob Spring SydneyPartner 5 August 2011
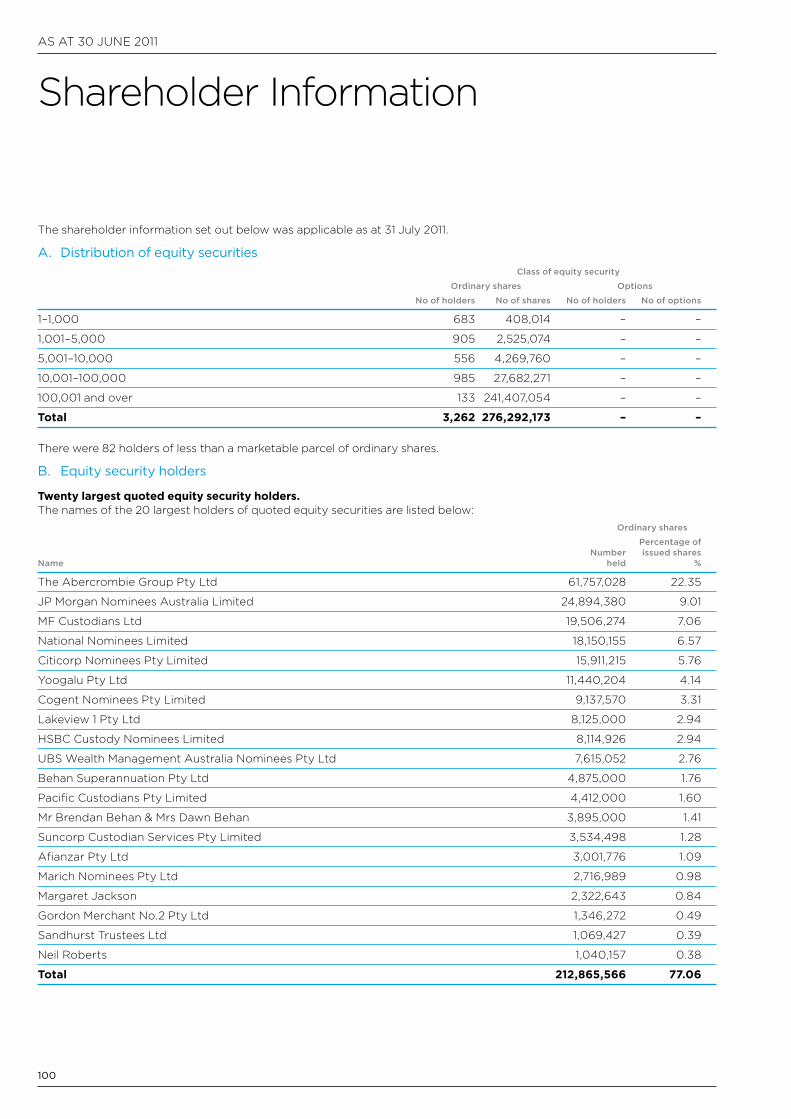
aS aT 30 JUnE 2011
100
The shareholder information set out below was applicable as at 31 July 2011.
A. Distribution of equity securities Class of equity security
Ordinary shares Options
No of holders No of shares No of holders No of options
1–1,000 683 408,014 – –
1,001–5,000 905 2,525,074 – –
5,001–10,000 556 4,269,760 – –
10,001–100,000 985 27,682,271 – –
100,001 and over 133 241,407,054 – –
Total 3,262 276,292,173 – –
There were 82 holders of less than a marketable parcel of ordinary shares.
B. Equity security holders
Twenty largest quoted equity security holders.The names of the 20 largest holders of quoted equity securities are listed below: Ordinary shares
Percentage of Number issued shares Name held %
The abercrombie Group Pty Ltd 61,757,028 22.35
JP Morgan nominees australia Limited 24,894,380 9.01
MF custodians Ltd 19,506,274 7.06
national nominees Limited 18,150,155 6.57
citicorp nominees Pty Limited 15,911,215 5.76
Yoogalu Pty Ltd 11,440,204 4.14
cogent nominees Pty Limited 9,137,570 3.31
Lakeview 1 Pty Ltd 8,125,000 2.94
HSBc custody nominees Limited 8,114,926 2.94
UBS Wealth Management australia nominees Pty Ltd 7,615,052 2.76
Behan Superannuation Pty Ltd 4,875,000 1.76
Pacific custodians Pty Limited 4,412,000 1.60
Mr Brendan Behan & Mrs Dawn Behan 3,895,000 1.41
Suncorp custodian Services Pty Limited 3,534,498 1.28
afianzar Pty Ltd 3,001,776 1.09
Marich nominees Pty Ltd 2,716,989 0.98
Margaret Jackson 2,322,643 0.84
Gordon Merchant no.2 Pty Ltd 1,346,272 0.49
Sandhurst Trustees Ltd 1,069,427 0.39
neil Roberts 1,040,157 0.38
Total 212,865,566 77.06
Shareholder Information
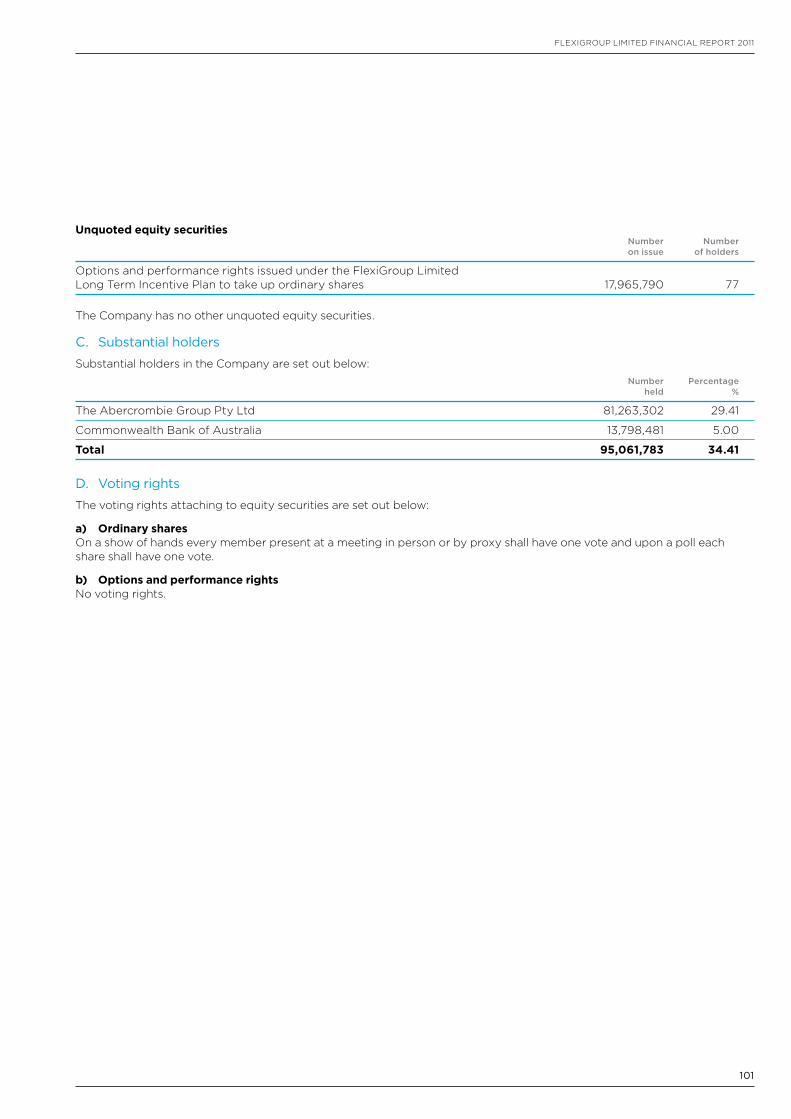
101
FLEXIGROUP LIMITED FInancIaL REPORT 2011
Unquoted equity securities Number Number on issue of holders
Options and performance rights issued under the FlexiGroup Limited Long Term Incentive Plan to take up ordinary shares 17,965,790 77
The company has no other unquoted equity securities.
C. Substantial holders
Substantial holders in the company are set out below: Number Percentage held %
The abercrombie Group Pty Ltd 81,263,302 29.41
commonwealth Bank of australia 13,798,481 5.00
Total 95,061,783 34.41
D. Voting rights
The voting rights attaching to equity securities are set out below:
a) Ordinary sharesOn a show of hands every member present at a meeting in person or by proxy shall have one vote and upon a poll each share shall have one vote.
b) Options and performance rightsno voting rights.

102
This page has been intentionally left blank.

103
FLEXIGROUP LIMITED FInancIaL REPORT 2011
This page has been intentionally left blank.

aS aT 30 JUnE 2011
104
This page has been intentionally left blank.
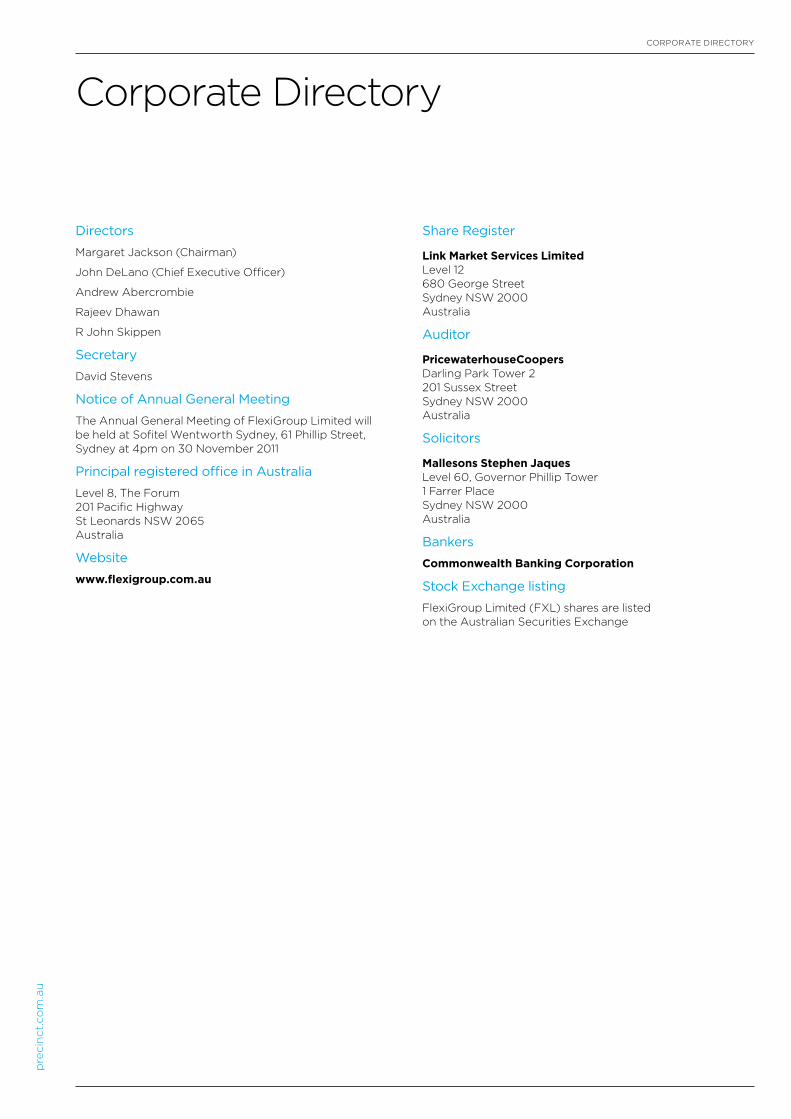
CoRpoRAte diReCtoRy
Corporate directory
Directors
margaret Jackson (Chairman)
John delano (Chief executive officer)
Andrew Abercrombie
Rajeev dhawan
R John Skippen
Secretary
david Stevens
Notice of Annual General Meeting
the Annual General meeting of flexiGroup limited will be held at Sofitel Wentworth Sydney, 61 phillip Street, Sydney at 4pm on 30 november 2011
Principal registered office in Australia
level 8, the forum201 pacific Highway St leonards nSW 2065Australia
Website
www.flexigroup.com.au
Share Register
Link Market Services Limitedlevel 12680 George StreetSydney nSW 2000Australia
Auditor
PricewaterhouseCoopersdarling park tower 2201 Sussex StreetSydney nSW 2000Australia
Solicitors
Mallesons Stephen Jaqueslevel 60, Governor phillip tower1 farrer placeSydney nSW 2000Australia
Bankers
Commonwealth Banking Corporation
Stock Exchange listing
flexiGroup limited (fxl) shares are listed on the Australian Securities exchange
pre
cin
ct.c
om
.au