Embed Size (px)
Citation preview

A N INVESTIGATION OF TWO VARIATIONS OF THE GAS GENERATOR METHOD TO CALCULATE THE THRUST OF THE AFTERBURNING TURBOFAN ENGINES INSTALLED I N A N F-11IA AIRPLANE
by Frank W. Bnrcham, Jr.

TECH LIBRARY KAFB, NM
~
1. Report No.
NASA TN D-6297 4. Title and Subtitle
AN INVESTIGATION OF TWO VARIATIONS OF THE GAS GENERATOR METHODTOCALCULATE THE THRUSTOFTHE AFTERBURNING TURBOFAN ENGINES INSTALLED IN AN F-111A AIRPLANE
7. Author(s)
Frank W. Burcham, Jr.
-
I 2. Government Accession No.
~
. .
9. Performing Organization Name and Address
NASA Flight Research Center P. 0. Box 273 Edwards, California 93523
2. Sponsoring Agency Name and Address
National Aeronautics and Space Administration Washington, D. C. 20546
5. Supplementary Notes
6. Abstract "
3. Recipient's Catalog No. ~~
5. Report Date April 1971
6. Performing Organization Code
8. Performing Organization Report No.
H -643 10. Work Unit No.
126-15-0242-24 -
11. Contract or Grant No.
13. Type of Report and Period Covered
Technical Note 14. Sponsoring Agency Code
The NASA Flight Research Center investigated two variations of the gas generator method for calculating the net thrust of the afterburning turbofan engines installed in a n F-111A airplane. An influence coefficient study and two ground thrust tests were performed. It was found that the gas generator method can be successfully applied to an afterburning turbofan engine. A t static conditions with two engines operating, i2 percent accuracy can be achieved for most power settings using either the method based primarily on nozzle total pressure and area (PTA) o r the method based primarily on nozzle total temperature and weight flow (TTW). For in-flight conditions the influence coefficient results indicated that the accuracy of the TTW method was about k3 percent, whereas the accuracy of the PTA method was about *5 percent for a military power setting. With either calculation method, additional errors in calculated thrust of *2 percent could result from high inlet flow distortion. If accurate thrust values are required, both thrust calculation methods should be used.
7. Key Words (Suggested by Author(s)) ~~ -
Thrust measurement Afterburning turbofan engine Gas generator method F-111A airplane
18. Distribution Statement
Unclassified - Unlimited
For sale by the National Technical Information Service, Springfield, Virginia 22151
I

._ . _. . .. . - . . " - .. . . .
AN INVESTIGATION OF TWO VARIATIONS OF THE GAS GENERATOR METHOD
TO CALCULATE THE THRUST O F THE AFTERBURNING TURBOFAN
ENGINES INSTALLED IN AN F-111A AIRPLANE
Frank W. Burcham, Jr. Flight Research Center
INTRODUCTION
Many high-performance aircraft capable of efficient operation at subsonic and supersonic speeds are powered by afterburning turbofan engines. It is important to be able to accurately determine the thrust of these engines in flight so that installation losses and aircraft drag characterist ics may be determined. A recent study (ref. 1) showed that the "swinging rake" method of thrust calculation is unsatisfactory for an afterburning turbofan engine because of the large gradients in pressure and temperature at the nozzle exit. Fixed exhaust sampling probes such as those used in the tests de- scribed in references 2 and 3 would undoubtedly be even less satisfactory. The gas generator method of thrust calculation offers promise for application to a turbofan engine because it does not require exhaust plane flow measurements. This method was used successfully for the afterburning turbojet engines of the XB-70A airplane (refs. 4 and 5). Two variations of the method exist: one is based primarily on exhaust nozzle total pressure and area, and the other on exhaust nozzle total temperature and weight flow.
This study was undertaken to determine the feasibility of applying the gas generator method to an afterburning turbofan engine and to compare the results of the two cal- culation procedures. The NASA Flight Research Center's F-111A airplane, which is powered by two TF30 afterburning turbofan engines, was instrumented to obtain the measurements required for the two variations of the method. The actual installed engine thrust was measured in two separate tests on a ground thrust calibration facility and compared with the calculated thrust values. Comparisons are presented for the full range of power settings for one and two engines operating.
An influence coefficient study was made to compare the two calculation methods. The results of this study are presented for ground static conditions and for flight con- ditions. A se r i e s of runs was also made with the inlet geometry positioned to generate high inlet flow velocities. These runs were used to evaluate the effects of distortion on thrust calculation accuracy. Other objectives of these runs were to obtain high response inlet pressure measurements prior to stall and to evaluate compressor noise attenuation due to inlet choking.
This report concerns only the calculation of net engine thrust. Calculation of air- craft net propulsive effort requires, in addition to net engine thrust, the propulsion

system drag terms, such as inlet additive drag, boundary-layer bleed drag, and ex - haust nozzle/airframe interaction effects. These latter t e r m s are not discussed.
SYMBOLS
The units for the physical quantities defined in this report are given in the Inter- national System of Units (SI) and parenthetically in U. s. Customary Units. Measure- ments were taken in U. s. Customary Units. Factors relating the two systems are presented in reference 6.
geometric area, m2 (ft2)
gross thrust coefficient
influence coefficient (See appendix. )
local speed of sound, m/sec (ft/sec)
relative distortion (See appendix. )
Fn, calc - Fn, meas error in calculated net thrust , x 100, percent
Fn, meas
gross thrust , N (lb)
net thrust , N (lb)
c:Llculated net thrust , N (lb)
net thrust measured by the thrust platforms, N (lb)
ram drag , N (lb)
conversion factor, 1 N-sec2/kg-m (32 . 17 ft-lb/lb-sec2)
distortion factor (See appendix. )
Mach number
pt. 10
PC0 nozzle pressure ratio, ___
engine low-pressure compressor speed, r p m

N2
P
Pt
R
T
Tt
V
W
Y
Apt , AB
Subscripts :
AB
av
e
f
i
max
PTA
TTW
t
a3
engine high-pressure compressor speed, rpm
static pressure, N/m2 (lb/ft2)
total pressure, N/m2 (lb/ft2)
gas constant, 286 J/kg-OK (53.34 ft-lb/lb-OR)
temperature, OK (“R) or “C (“F)
total temperature, OK (“R)
velocity, m/sec (ft/sec)
weight flow, kg/sec (lb/sec)
ratio of specific heats
difference between afterburner inlet and exit total pressure, Pt , 7m - Pt, 10
combustion efficiency
afterburner
average value
engine
fuel flow
ideal
maximum
total pressure and area thrust calculation method
total temperature and weight flow thrust calculation method
total
f ree s t ream
Engine station numbers (fig. 1):
2 compressor face
3
I
2 . 6
3
4
5
7m
10
11
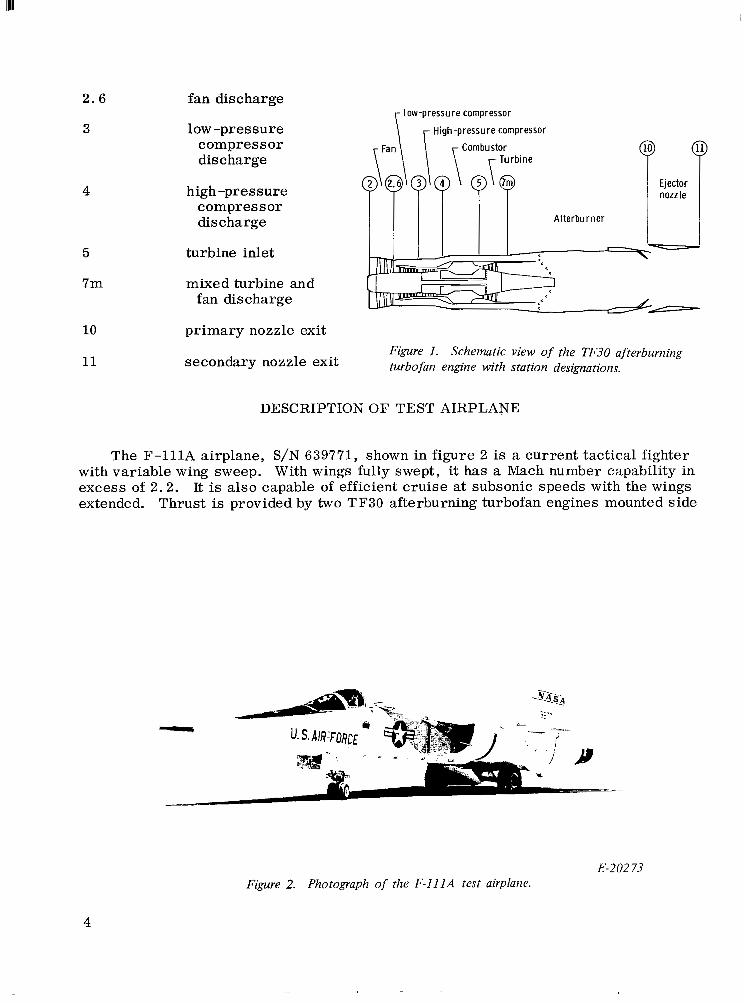
fan discharge
low-pressure High-pressure compressor
Low-pressure compressor
compressor Combustor ( discharge
high-pressure nozzle compressor discharge Afterburner
turbine inlet
mixed turbine and fan discharge
primary nozzle exit Figure 1. Schematic view of the TF30 afterburning
secondary nozzle exit turbofan engine with station designations.
DESCRIPTION OF TEST AIHPLANE
The F-111A airplane, S/N 639771, shown in figure 2 is a current tactical fighter with variable wing sweep. With wings fully swept, it has a Mach number capability in excess of 2.2. It is also capable of efficient cruise at subsonic speeds with the wings extended. Thrust is provided by two TF30 afterburning turbofan engines mounted side
E-202 7-? Figure 2. Photograph of the F - l l l A test airplane.
4

by side in the aft fuselage. The air inlets, shown in figure 3, are one-quarter circle, external compression types mounted under the wing root. Inlet geometry can be varied by moving the compression spike forward and rearward, changing the angle of the second conical ramp, and opening the translating cowl slot.
The normal inlet configuration for static and low-speed operation is shown in fig- ure 3(a). The second conical ramp is fully collapsed, and the translating cowl slot is open. For high inlet distortion tests, the inlet was operated off design by closing the translating cowl slot and by expanding the second conical ramp, as shown in figure 3(b).
cow I
I,
slot open-
(a) Translating cowl slot open; variable conical ramp collapsed. E-21 3 75
C o m p r e s s i o n s p i k e
r V a r i a b l e conical ramp (expanded) ._
f~
,? 3
E-21 3 77 ( b ) Translating cowl slot closed; variable conical ramp expanded.
Figure 3. Photographs of the left air inlet of the F- I I IA test airplane. b
5

Two variations in the shape of the cowl lip were tested: A blunt lip cowl (fig. 3) , was used for the first ground test, and a sharper cowl lip was installed for the second ground test.
DESCRIPTION OF ENGINE
The engines installed in the F-111A test airplane were Pratt & Whitney TF30-P-1 engines equipped with blow -in door ejector nozzles. The TF30 engine is in the 80,000 - newton (18,000 -pound) thrust class. It is a low bypass ratio engine and was the first turbofan engine to be equipped with an afterburner. Figure 1 (page 4) shows a cutaway view of the engine. A three-stage fan and a six-stage low-pressure compressor are driven at N 1 speed. A seven-stage high-pressure compressor is driven by a separate shaft at N2 speed. Combustion takes place in an eight-chamber combustor. The turbine section consists of a single-stage turbine to drive the high-pressure compressor at N2 speed and a three-stage turbine to drive the fan and low-pressure compressor at N 1 speed.
A fully modulating afterburner with five zones arranged in annular rings is located downstream of the turbine at the point where the core and fan streams merge. The primary nozzle at the end of the afterburner is fully closed for all nonafterburning power settings except idle. The nozzle area is variable for intermediate afterburning conditions and is fully open for maximum afterburner and idle.
An aerodynamically actuated blow-in door ejector is installed on the engine. The blow-in doors and secondary nozzle segments are positioned by pressure differential to maintain the proper expansion of the gas stream. At static conditions all six blow- in doors are in the full open position and the secondary nozzle is fully closed. More details concerning the blow-in door ejector nozzle are presented in reference 7.
The two engine exhaust nozzles are located close together at the rear end of the airplane, as shown in figure 4. During static operation, the nozzle and exhaust flows
/- lnterfairing
L.
6-1 680 7 Figure 4. Photograph of the engine nozzle installation on the F-1IIA test airplane.
6

reduce the pressures on the aft airplane surfaces, particularly on the interfairing be- tween the engines. This effect requires a correction to the measured thrust , as discussed later.
Figure 5 shows the relationship between the power lever angle and the measured static engine thrust in percent of the maximum thrust, Fn, m a . The Fn, m a varied
from engine to engine and from the first ground test to the second ground test, aver- aging about 65,000 newtons (14,500 pounds). Installation losses and the test altitude account for the reduced thrust. Thrust varies linearly with power lever angle up to military power. The figure also shows the five zones of afterburning power settings.
0 1 10
I Nonafferburning power settings I Afterburning power settings
lldlel Zone Zone Maxi-
4 5 mum
I I I - . l "-1 ~ 1 20 30 40 50 60 70 80 90 100 110 120
Power lever angle, deg
Figure 5. Relationship between power lever angle and static thrust for the TF30 engine in the F- I I IA test airplane.
TESTS
The thrust measurement data were obtained in two separate tests. The first test was made about 3 months before the second test. The following tabulation shows the significant differences between the two tests:
I I I temperature, "C ( O F ) I Ground test Cowl lip configuration Ambient air
1 . .
Blunt 4 (40) Sharp
27 (80)
Both tests were made during the early morning hours when winds were calm and tem- perature changes small. Each test was completed in about 3 hours.
The test airplane was attached to the Edwards A i r Force Base static-thrust cali- bration facility. This facility, described in reference 5, consists of four platforms
7

each of which measures applied force. For these tests, the airplane was positioned with both main landing gear wheels on the center platform and the nose gear on the for- ward platform.
Because of the limited instrumentation in the right engine , the runs were conducted to make left and right engine conditions similar for all runs in which both engines were
operating. Engine pressure ratios, - Pt 7m , were matched for nonafterburning power
settings, and primary nozzle areas were matched during afterburning runs. Cowls were open for all stabil ized runs. Thrust and rpm were stabil ized for 1 minute at each power setting, then a 15-second data burst was taken. Data were obtained at power lever angles of idle, 20" , 30" , 40" , 50" , 60°, military, and in each of the five zones of afterburning operation with both engines operating. Runs were also made at decreasing as well as increasing thrust levels. A s imi la r series of runs was then conducted with the right engine shut down.
Pty 2av
A t the completion of these stabilized power runs, a se r i e s of runs with gradually increasing rpm wtis made with the translating cowl closed. For some of thew runs . the inlet spike and cone were positioned to further reduce the inlet flow area. These test conditions were used to generate high inlet distortion, inlet choking. and com- pressor stalls.
THRUST CALCULATION
Ideal Gross Thrust Calculation
The two thrust calculation procedures used in this study--the total temperature and weight flow (TTW) and the total pressure and area (PTA) --differ mainly in the method used to calculate the ideal gross thrust. In both methods the ideal gross thrust is defined as the thrust obtained when the flow at the primary nozzle is isentropically expanded to free -stream static pressure, that is
The ideal velocity, Vi , is used in both methods,
V. = Mic 1
P t . 10
I,, The ideal Mach number, Mi . i s a function of nozzle pressure ratio, ___ . and
the ratio of specific heats. y ,
8

and the local speed of sound, c, is defined by the expression
c =d-yRTg
T t (9) Converting T to Tt by using - = (%) and simplifying, the ideal velocity
becomes T
The ideal thrust for the TTW method is obtained by multiplying the ideal velocity by the exhaust mass flow as follows:
Pr imary input parameters are airflow, total temperature, and nozzle pressure ratio.
To obtain the PTA equation, the continuity equation is used at the primary nozzle exit:
For choked conditions where M10 = 1 .00 , substituting this expression into the TTW
equation, rearranging, and simplifying results in the equation
Primary inputs are pt, , A10 , and nozzle pressure ratio, NPR. The last factor in
9

both the TTW and PTA thrust equations is the same square root of the function of nozzle pressure ratio,
I - / v - 1 \
and the next to last factor in both equations is a function only of y , o r y and R. Therefore, the two equations can be written as follows:
For unchoked flow, the PTA ideal thrust can be simplified because the ideal velocity is achieved at the primary nozzle.
The nozzle pressure ratio factor is to the first power for the unchoked condition.
G ~ o s s Thrust Coefficients
Ideal thrust is converted to actual thrust by using a. gross thrust coefficient. C , Fg which is determined from engine test cell runs and model tests. The gross thrust
coefficient at stittic conditions is determined in a test facility by measuring the actual thrust, calculating the ideal thrust, and lumping a11 the differences into the gross thrust coefficient:
This term accounts for such factors as blow-in door and ejector forces, nonisentropic expansion. friction, nonnxial flow , nozzle leakage. and differences between geometric :1nd effective flow ;lreas. For flight conditions, scale models are used to account for external flow effects. Isolated ejector tests and small-scale complete model tests are used. .A more complete description of this coefficient is included in reference 7. For the PTA method. the gross thrust coefficient includes :L discharge coefficient to relate the measured geometric nozzle a rea to the effective flow area.. The TTW method does not require this term, hoLvever. The actual gross thrust equations for
10
I I I

the two methods are as follows:
Ram Drag and Net Thrust
Fo r both methods ram drag is calculated from airflow and free-stream velocity by using the expression
The final equations for net thrust are (for choked conditions) as follows:
One important fact should be noted. Weight flow appears in both the gross thrust and the ram drag terms of the TTW equation, thus e r r o r s due to weight flow measurement inaccuracies should be partially canceled.
Calculation Procedures
The PTA calculation procedure is described in detail in reference 7 . Also described are many of the engine characteristics, such as airflow versus corrected rpm, afterburner pressure drop, and nozzle gross thrust coefficients, which are used in both calculation procedures.
The TTW calculation procedure is similar to that described in references 4 and 5 and is based on an energy balance through the engine. Available energy is increased by the burning of fuel and is decreased because of horsepower extraction, bleed air extraction, and inefficiencies in the compressors, burners, and nozzle. Extensive data defining the performance characteristics of the various components of the engine, such as compression and combustion efficiencies and pressure losses, are required to perform the TTW calculation. Some of the data were available from the PTA method, and some were obtained from TF30 engine tests performed in an altitude
11

facility at the NASA Lewis Research Center. Most of these engine test data are pre- sented in references 8 and 9. Combustion efficiency data were not available for either the main burner o r the afterburner, so available data from a different engine, an af ter- burning turbojet, were used. Discharge coefficient data required to modify the gross thrust coefficient for the TTW method were obtained from full-scale tests for nonafter- burning operation and from model data adjusted to full scale for afterburning power settings.
Calculations for both methods were performed by a digital computer program. The program performed the calculations for the PTA method as described in reference 7. The main portion of the program consisted of tables representing engine performance parameters. The TTW calculation used some of the PTA calculation results to deter- mine the gross thrust. The TTW calculation was also used to calculate fan and core exhaust velocities and temperatures for engine exhaust noise calculations.
The boattail and interfairing pressure measurements were used to calculate a base drag term, which was included as a correction to the measured thrust. The correction was less than 1 percent of the measured thrust.
INSTRUMENTATION
In a thrust determination program, instrumentation becomes extremely important. Accurate measurement of many parameters is essential if accurate results are to be obtained. Close attention must be paid to calibration procedures and temperature effects.
Figure 6 shows the instrumentation used in the thrust determination, and table 1 defines the measurement ranges and accuracies of the measurements. Compressor
[ J Measured on left engine only 0 Measured on both engines statics ~
Figure 6. Propulsion system instrumentation used in thrust calculations.
12

TABLE 1. -PARAMETERS, RANGES, AND ACCURACIES OF THRUST DETERMINATION MEASUREMENTS
Number of measurements
1
2
2
20
8
8
1
1
1
2 2
2
2
2
2
2
2
4
2
2
2
20
Range
5 to 100 kN/m2 (100 to 2100 lb/ft2)
220 to 480" K (400 to 860" R)
0 t o 200 kN/m2 (0 t o 4320 lb/ft2)
i 70 kN/m2 (*1440 lb/ft2)
k40 kN/mZ (5860 lb/ft2)
34 to 345 kN/m2 (720 to 7200 lb/ft2)
34 to 345 kN/m2 (720 to 7200 lb/ft2)
34 to 1100 kN/m2 (720 to 23,000 lb/ft2)
0 t o 3450 kN/m2 (0 to 72,000 lb/ft2)
0 t o 120" 0 t o i1,OOO rpm
0 to 17,000 rpm
0 to 1G00" K (0 to 2880" R)
0 to 170 kN/m2 (0 to 3600 lb/ft2)
0 t o 275 kN/mB (0 to 5760 lb/ft2)
0 .45 to 7 .5 - (120 to 1980 &) m 3 h r h r
4 .5 to 34 h7; (1200 to 9000 fg m 3
0 t o 350" K (0 to GOO" R)
59 to 135 sn (130 to 960 min) lb
0 .35 to 0. G G m2 (3.76 to 7.05 ft2)
I 70 kN/m2 ( f 1440 lb/ft2)
170 kN/m2 (11440 lb/ft2)
Percent of full-scale accuracy
*O . 3
f. 5
*2
+.2 *2
1 2
*2
*2
t 2
*2 i1
*1
-t 2
*1
*l
+2
t 2
*2
*2
2 2
* 2
* 2
aDifferent ia l pressures; reference pressure accuracy approximately io. 5 percent.
face total pressure, pt, 2av , was measured on the left engine with 20 probes. Four
compressor face rakes, each with five probes positioned to sample equal areas, were used. Eight compressor face static pressures were also measured. Low and high compressor rotor speeds (N1. and N2) were measured on both engines by tachometers.
Fuel flow measurement is important, particularly for the TTW method. Two types of fuel flow measurements were made successfully on the F-111 airplane. The airplane had the production mass fuel flow measurement system which measures the total fuel flow to the engine and afterburner. A volumetric measuring system was added to both engines. One meter measured the total flow to both the engine and the afterburner, and another measured the flow only to the engine. The meters were each calibrated in a flow calibration facility before they were installed in the airplane. The volumetric total flowmeters were calibrated with the aircraft fuel lines upstream of the meter to simulate the aircraft installation. The volumetric meters also required a fuel temperature measurement to permit a conversion to mass flow. The total fuel flow meters operated below their calibrated range for most nonafterburning power settings; hence, the volumetric engine fuel flow reading was used exclusively. For
13
higher fuel flows, both the volumetric and mass total fuel flows agreed so well that either measurement could be used.
Turbine discharge pressure, pt, 7m7 is an important engine measurement. The
test engine is equipped with a production pt, 7m system (ref. 7) consisting of six rakes. These rakes sample the fan stream and the core stream with an integrating rake, and all six integrated rake pressures are manifolded. This mixed average pres- s u r e is measured by two pressure transducers, one ranged for low pressures and another for higher pressures. Transducer temperatures were also measured to per- mit transducer temperature compensation.
Primary nozzle area, A10, is determined by a production system (ref. 7) which is
calibrated in terms of a nozzle actuator stroke position. Temperature effects are minimized by use of temperature-compensated cables in the measurement system. The nozzle itself is constructed in such a manner that temperature changes do not change the flow area significantly. This measurement system was calibrated twice and gives reasonably accurate results.
A large number of pressure and position measurements were made on the blow-in door ejector nozzle. Of primary importance to the thrust calculation was the measure- ment of the base pressure acting on the primary nozzle. Surface static pressures were also measured on the airplane interfairing and boattail region.
Ambient free -stream pressure and temperature measurements were made with the calibrated F-111 airspeed system. Power lever angle was also measured. Several other measured parameters, such as pt, 2. 6, p2. 61 p3, p4, T t , 5, and p2,
were used in the TTW calculation procedure only for comparison with the calculated values.
Data from the various measurements were digitally recorded by a pulse code modulation system. Before the data were reduced, pre-test and post-test zero cor- rections and power supply voltage corrections were made. Data for the stabilized thrust settings were obtained by averaging several data. samples for each parameter.
ACCURACY
In a thrust calculation the overall accuracy of the final result is of great impor- tance and is usually difficult to determine. One useful technique for assessing the accuracy of the calculation is to compute influence coefficients €or important param- eters. The influence coefficient of a parameter can then be multiplied by the estimated accuracy of that parameter to determine its effect on the overall thrust. By combining all the important parameters in this manner, using a root-sum-square technique, an estimate of the overall accuracy is obtained.
Influence coefficients were calculated by increasing a given parameter in the computer program by 1 percent and calculating the percentage change in the net engine thrust. These influence coefficients were calculated for the ground thrust
14

measurement conditions, and, by using measured flight data, were calculated for representative flight conditions from M, = 0.5 to 2.2. It was found that in-flight
influence coefficients were nearly independent of flight conditions if extreme conditions such as very low power settings at supersonic speeds were not included.
In addition to the obvious engine measurements, there are other important param- eters in thrust calculation. The engine characteristics defined in the computer pro- gram are subject to some error and represent an average engine. Their influence coefficients must therefore be considered in an assessment of overall thrust accuracy. Influence coefficients for free-stream parameters such as Mach number, static pres- sure, and total temperature must also be considered.
The accuracy of the important input parameters to the thrust program must also be determined. Table 2 shows the estimated accuracies of the three important types
TABLE 2. -ESTIMATED ACCURACY OF KEY INPUT PARAMETERS TO THE THRUST CALCULATION PROGRAM FOR STATIC AND FLIGHT CONDITIONS
Type of p a r a m e t e r
Eng ine measu remen t s
Eng ine cha rac t e r i s t i c s
F r e e - s t r e a m m e a s u r e m e n t s
P a r a m e t e r
P t , 7 m
Pt , 2,
u' fe
f t AIO(maximum o r minimum)
AlO(intermediate)
'ce 'c, AB
w2
'pt, A B C
Fg
Ttca
p'x
Mca
T E s t i m a t e d a c c u r a c y , p e r c e n t
Stat ic
0 . 5 1 . 0 1 .0
1 . 0
.5 2 . 0
1 . 0
2 . 0
2 . 0
2 . 0
1 . 0
0 . 2 5
. 5
0
In flight
1 . 0 2 . 0
1 . 0
1 . 0
.5
2 . 0
1 . 0
2 . 0
2 . 0
2 . 0
1 . 0
0 . 5 0
1 . 0
1 . 0
of input parameters for ground thrust run conditions and flight conditions. The measured engine parameter accuracies were obtained from the values in tabie 1, in some instances modified to account for repeatability, temperature compensation, redundant measurements, o r special knowledge of the measurement. Accuracy of the engine characteristics is based primarily on scatter in the TF30 test cell data and experience with other engines. Free -stream parameter accuracies were determined f rom a previously obtained airspeed calibration. Certain parameters were more accurately known for the ground runs than for the flight conditions because of the stabilized and well -known environmental conditions.
15

The accuracy of the thrust stand force measurements must also be considered. Reference 5 specifies an accuracy of k450 newtons (3~100 pounds) for asymmetric load- ing. However, for the nearly symmetric loading applied by the F-111A airplane, and from thrust stand zero shifts , the accuracy for these tests is believed to be &225 new- tons (&50 pounds). This error is nearly negligible for power lever angles above about 30", but is as much as 18 percent of the single-engine idle thrust. Errors in the data at power settings below 30" may be due in part to the thrust stand errors.
RESULTS AND DISCUSSION
Influence Coefficients
Influence coefficients calculated by determining the percent change in net thrust for a 1-percent increase in important parameters in both methods of calculation are shown in figures 7 , 8, and 9 for ground static and flight conditions.
Measurede~ngineparameter. -Figure 7 shows the influence coefficients for im- portant measured engine parameters plotted as a function of power lever angle for
- PTA method "- TTW method
'"""" -2 I l l
Power lever angle, deg
(a ) Static conditions ( M , = 0).
2 \ "
I I 1 7 1 1 "
0 20 40 60 80 100 120 Power lever angle, deg
( h ) Flight corlditiorls (M, = 0.5 to 2.2).
16

both the PTA and TTW calculation methods. A discontinuity in the fuel flow influence coefficients occurs between afterburning and nonafterburning power settings. In most instances, these parameters are increasingly sensitive as power lever angle is re- duced, particularly the turbine discharge pressure. At static conditions (fig. 7(a)), the TTW method is more sensitive to pt, 2 wfe, and wft, and the PTA method is
more sensitive to pt, 7m and A10. For flight conditions, the influence coefficients
are generally somewhat larger than for the static conditions fo r both calculation methods, except for pt,2 . For pt , 2, the PTA method sensitivity increases
markedly, but the TTW sensitivity is sharply reduced. This reduction in TTW sen- sitivity to p in flight is attributed to the ram drag effect shown in equation (4).
There is a direct relationship between pt 2 and engine airflow. An e r r o r which
increases the calculated airflow causes an increase in calculated TTW gross thrust and a partially compensating increase in calculated ram drag. The net thrust, then, is only slightly affected by an airflow error. The gross thrust in the PTA method is
drag and thus the net thrust. The favorable reduction of t h rus t e r ro r s due to airflow er rors in the TTW method does not occur at static conditions because the ram drag is zero.
av ’
av
t, 2av
7 av
1 only slightly affected by airflow, but an error in airflow measurement affects the ram
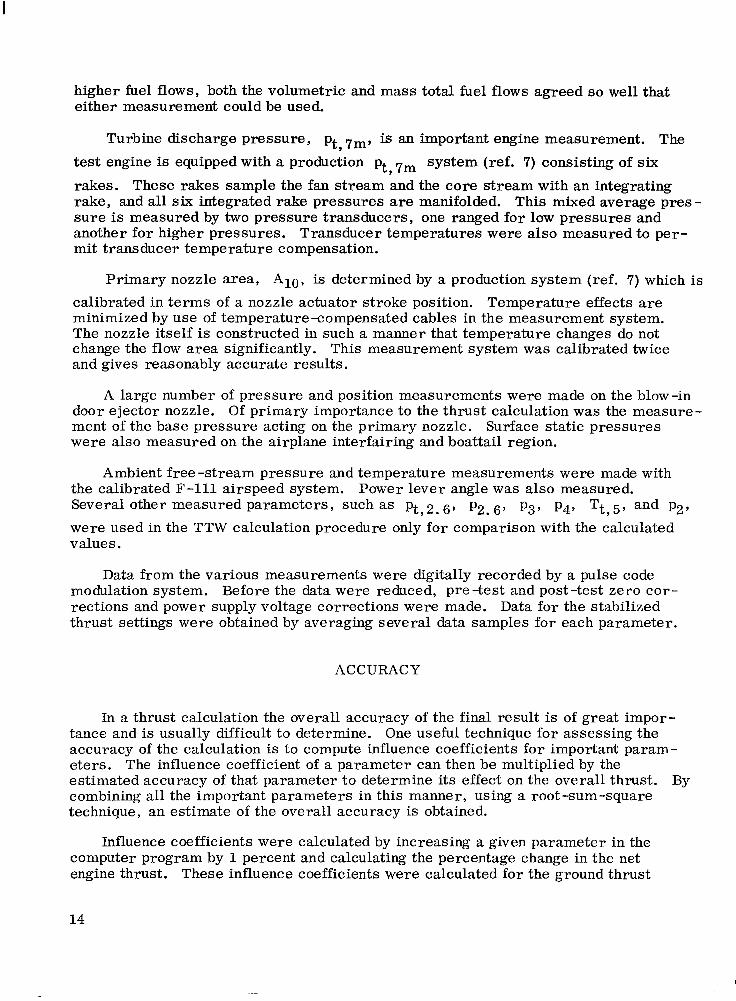
Engine characteristics. - Several important engine characteristics are needed to calculate the net thrust. These characteristics are determined in ground facility tests with instrumented engines o r test rigs and are representative of an average engine which may not accurately represent a particular engine because of normal engine-to- engine tolerances. Therefore, it is necessary to consider errors in parameters such as engine airflow, main and afterburner combustion efficiency, afterburner pressure loss, and nozzle gross thrust coefficient. Influence coefficients for these parameters are shown in figure 8. For static conditions (fig. 8(a)) the PTA method is more sen- s i t ive to af terburner pressure drop errors , and the TTW method is more sensitive to airflow and main burner and afterburner combustion efficiency. Gross thrust coef- f icient errors affect both methods equally.
F o r flight conditions (fig. 8(b)) the trends are all similar except for airflow, where again the ram drag effect makes the TTW method less sensitive to airflow errors than the PTA method. The influence coefficient for CF is large. Accurate
determination of C may be difficult for configurations such as that of the F-111
airplane in which the propulsion system interacts strongly with the airframe. It is obvious that relatively small C errors can make large net thrust errors , par-
ticularly at lower power settings.
g
Fg
Fg
Free -stream parameters. - Errors in measurement of certain free-stream parameters such as static pressure, total temperature, and Mach number can have a significant effect on calculated net thrust, as shown in figure 9. Static pressure influence coefficients become very large at low power settings because of their effect
17
I
- PTA method rrW method "-
4
ci (cFg) k-:- 0
-2 1 J -2
Power lever angle, deg
(a) Static conditions (M, = 0). ( b ) Flight conditions (M, = 0.5 to 2.2).
Figure 8. Effect of a ]-percent increase in important engine characteristics on net thrust.
- PTA method "- TTW method
-8 - 6 L l 0 20 40 60 80 1 100 I 120 I
Power lever angle, deg
ci(p,)
0
-6
-8 0 20 40 60 80 100 120
Power lever angle, d q
( a ) Static conditions (M, = 0). ( b ) Flight conditions ( M , = 0.5 to 2.2).
Figtrc 9. Effect of a I-percent increase in inportant nleasrrred free-stream parameters on net thrust.
18

on nozzle pressure ratio, pt’ - lo , at both static (fig. 9(a)) and flight (fig. 9(b)) condi-
tions. Total temperature errors are significant because increasing total temperature decreases calculated airflow. Airplane Mach number is also an important parameter in flight, primarily because of its effect on ram drag. A careful calibration of the airspeed system is essential for good thrust measurements.
pca
Calculated Thrust Accuracy
By using the influence coefficients in figures 7 , 8 , and 9 and the estimated param- eter accuracies from table 2 , it is possible to estimate the overall thrust calculation accuracy, based on a root-sum-square combination of all the variables. Figure 10 shows this estimate. The results for the static conditions (fig. lO(a)) show that the PTA and TTW methods are approximately equal in overall accuracy, with the TTW method somewhat better at low power settings and the PTA method better at the highest power settings. Accuracy for either method approaches -+2 percent for the higher power settings.
The data for the flight conditions (fig. 10(b)) show a clear superiority for the TTW method, primarily because of the favorable airflow error effects mentioned previously. The flight results are less accurate than the ground test results. F o r military power, the accuracy of the TTW method is approximately -+3 percent, whereas the accuracy
a
Estimated root-sum-square 1 ,L-# Intermediate positions
e r ro r in calculated net thrust, 4 percent
2 ”-
0 20 40 ~ -20 Power lever angle, deg
(a) Static conditiom ( M , = 0). PTA method TW method “_
Estimated root-sum-square e r ro r in calculated net thrust,
percent
10
4 :i 2
\ \\\1 \ . “”””
19

of the PTA method is approximately *5 percent. These flight estimates are based on a rt l-percent error in C F ~ . L a r g e r e r r o r s in CF would cause a corresponding in-
crease in the error in calculated thrust . g
Ground Run Results
The errors between the calculated and the measured net thrust for the two ground tests are compared in figures 11 and 12. For ground test 1 with both engines operating (fig. ll(a)), the thrust calculated by the PTA method is considerably higher than measured thrust at low power settings. A s power sett ing increases, the error or dif- ference between the calculated and measured thrust decreases to less than 1 percent at military power and becomes negative with further increases in thrust, reaching a -3 percent error at maximum afterburner. The TTW method shows about the same trend in reverse except that the error at maximum afterburner is less than 2 percent. Maximum scatter for either method is about i l percent.
When only the left engine is operating (fig. l l (b) ) , the t rends are similar to the results for the two engines except that scatter and error increase, particularly for the TTW method at afterburning power levels, where the error approaches 4 percent.
E, percent 0
-A
-8 0 20 40 60 80 100 120
Power lever angle, d q
( a ) Both engines operatitla. - PTA method
TI" method "_
-8 0 20 40 60 80 100 120
Figure 12 shows the same types of data for ground test 2. The results are similnr to the data from ground test 1, except that the calculated thrust is about 1 percent higher for ground test 2 for both methods.
20

E, percent 4
-.F -8
0
Y O / -
I l l 20 40 60 810 lbo l!!O
Power lever angle, deg
(a) Both engines operating. - PTA method
TTW method "-
-a 0 20 40 60 80 100 120
Power lever angle, deg
( b ) I,c>,ft cwgirw opwztinK.
Figure 1-3. Ejycct of power lever arlglc, 011 error i n cu1crrlatc.d net tllnrst. Ground test 2.
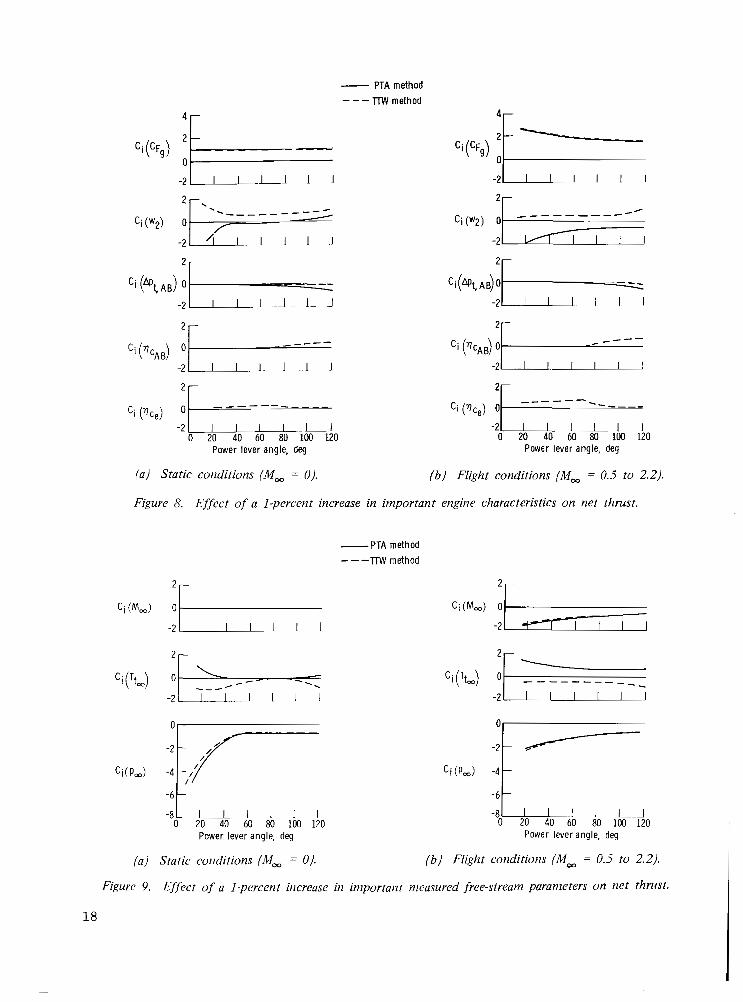
Figure 13 compares faired data from ground tests 1 and 2 . The trends for the two tests are the same, and the trends for the two calculation procedures are almost opposite. The error in thrust is less than *4 percent fo r each method for power lever angles above 40". For both engines operating, at military power, the accuracy is about *2 percent for both calculation methods. The calculation error is most re- peatable in the intermediate power range, particularly for the TTW method. Repeat- ability is reduced for both methods for afterburning thrust levels.
The differences in the data for ground tests 1 and 2 are probably caused by deterioration of the left engine between the two tests, although the large ambient air temperature difference between tests could also be a factor. The left engine was re- moved shortly after the second ground test because of reduced compressor stall margin. The change of the cowl lip shape between tests caused only minor changes in compressor face recovery and distortion and is not believed to be a significant factor.
The consistency of the calculated thrust error indicates that bias errors, not random errors, make the largest contribution to the overall calculation error. This indicates a need for better engine characteristics data and more instrumentation. The opposite nature of the errors in the two methods introduces the possibility of identifying the probable error sources by looking for influence coefficients that cause opposite errors in the two methods. Er rors in pt o r airflow at low power settings cause
opposite and nearly equal errors similar to those in figure 13. This may explain the increase in error as power setting is reduced toward idle.
' av
2 1
8
4
E, percent 0
-4
- 8 1 . . 1 I 1 I I 0 20 40 60 80 100 120
Power lever angle, deg
(a) PTA method.
engines } Ground test 1
- "_ engines } G r o u n d test 2
""_ Left engine
Left engme -"
4
E, percent 0
-4
0 20 40 60 80 1W 120 Power lever angle, deg
(6) TTW method.
Fisrc 13. Effect of power lever angle and number of engines operating on faired values of calculated thrust error. Ground tests I and 2.
The increase in the thrust error in the TTW method for afterburning power is likely caused by an error in the assumed afterburner combustion efficiency. A s noted previously, the combustion efficiency data were not available for the TF30 engine, so available data from a different engine, an afterburning turbojet, were used.
The increasing negative error in the thrust calculated by the PTA method at maxi- mum power is probably caused by a parameter which has only slight effect on the TTW thrus t e r ror . Such a parameter could be A10, Apt, AB, o r pt, 7m.
It is of interest to compare the es t imated thrust error f rom the influence coef- ficients (shaded area in fig. 13) with the actual measured errors. For the PTA method (fig. 13(a)) the measured errors are generally within the estimated error band except at low power settings and maximum thrust. The TTW method measured results (.fig. 13(b)) are generally within the estimated error band except for the left engine intermediate afterburning thrust levels. These results indicate the usefulness of estimated thrust accuracies based on influence coefficients and estimated parameter accuracies.
Several thrust calculations were performed during periods of nonstabilized engine operation. The results from these calculations showed little deviation from the sta- bilized operation results. However, the rates of change of thrust were not rapid.
22

Effect of Inlet Flow Distortion on Thrust Calculation Accuracy
As mentioned in the TESTS section, a se r i e s of runs was made with the inlet translating cowl closed. Cowl lip rake measurements showed high flow velocities at the inlet cowl lip and local separation. This separation caused large increases in steady-state distortion at the compressor face. With the inlet cone expanded (fig. 3(b)), sonic o r near-sonic flow existed at the inlet throat and distortion increased further. Numerous compressor stalls occurred as a result of these conditions. It is of interest to investigate the effects of these highly distorted inlet conditions on the thrust calcu- lation accuracy, particularly because in-flight distortion levels in the F-111A airplane are relatively high at some flight conditions.
Thrust calculations were performed for 21 off-design inlet situations, including 11 in which thrust data were obtained immediately before a compressor stall. Power lever angles ranged between 30" and 70". Distortion parameter values for these condi- tions are plotted in figure 14 against the corrected engine airflow. Also shown is a KD band that covers the data for the cowl-open, stabilized engine operation. The KD
values which caused compressor stall were about twice as high as the cowl-open KD
values. Intermediate KD values between the cowl-open and compressor stall regions
were obtained with various intermediate settings of the inlet geometry.
100 120 140 160 180 200 220 240 Corrected engine airf low, lblsec
I l l I I I 1 I loo0 -
Engine stall l ine, - 900 -
800 -
700 -
600 -
Range of KD, cowl open, ground tests 1 and 2
0 Off -des ign in le t po ints where thrust was calculated
stal l Solid symbols - calculated just prior to
100 -
0 I 1 I I I I I 40 50 60 70 80 90 100 110
Corrected engine airf low, kg/sec
Figure 14. Effect of corrected engine airflow on distortion for off-design inlet conditions for which thrust was calculated.
23
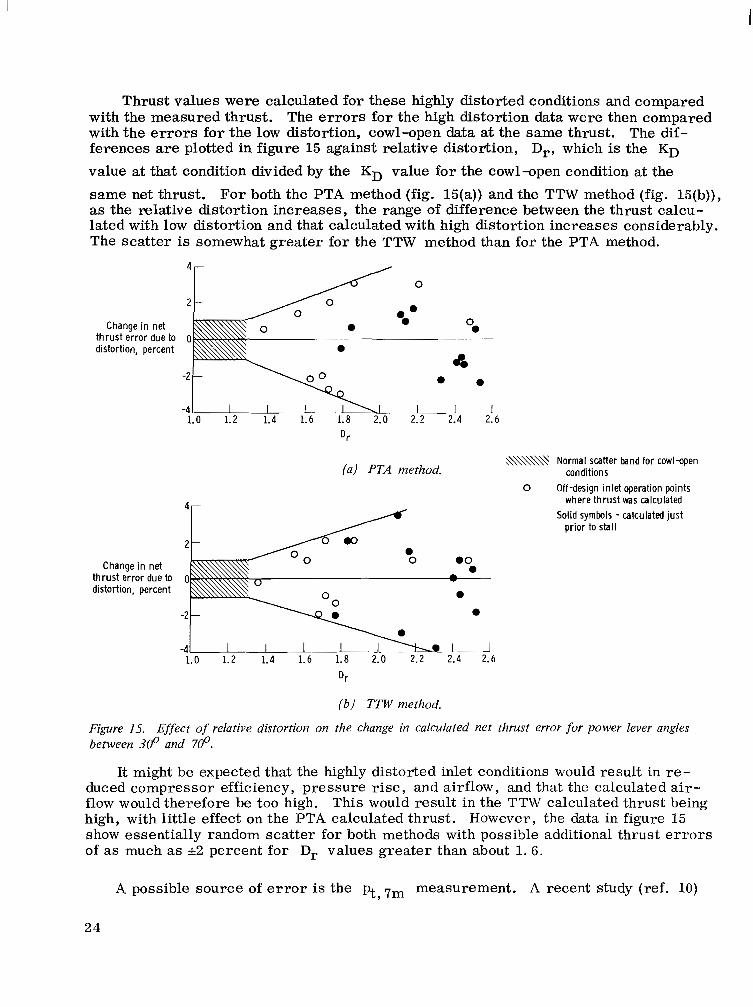
Thrust values were calculated for these highly distorted conditions and compared with the measured thrust. The errors for the high distortion data were then compared with the errors for the low distortion, cowl-open data at the same thrust. The dif- ferences are plotted in figure 15 against relative distortion, Dry which is the KD
value at that condition divided by the KD value for the cowl-open condition at the
same net thrust. For both the PTA method (fig. 15(a)) and the TTW method (fig. 15(b)), as the relative distortion increases, the range of difference between the thrust calcu- lated with low distortion and that calculated with high distortion increases considerably. The scatter is somewhat greater for the TTW method than for the PTA method.
4
0
2
Change in net 0 0
thrust error due to 0
4 distortion, percent
Change in net thrust error due to distortion, percent
Dr
(a ) PTA method. conditions &\\\\\\y Normal scatter band for cowl-open
0 Off-design inlet operation points
4 where thrust was calculated Solid symbols - calculated just
prior to stall
2
0 0
-2
-4 1.0 1.2 1.4 1.6 1.8 2.0 2.2 2.4 2.6
Dr
( b ) TTW method.
15. Effect of relative distortion on the change in calculated net thrust error for power lever angles between 30' and 700.
It might be expected that the highly distorted inlet conditions would result in re- duced compressor efficiency, pressure rise, and airflow, and that the calculated air- flow would therefore be too high. This would result in the TTW calculated thrust being high, with little effect on the PTA calculated thrust. However, the data in figure 15 show essentially random scatter for both methods with possible additional thrust errors of as much as &2 percent for Dr values greater than about 1 . 6 .
A possible source of e r r o r is the pt, 7m measurement. A recent study (ref. 10)
24
on a nonafterburning version of the TF30 engine has shown that ra ther severe radial and circumferential pressure gradients exist at the turbine discharge station, even with no inlet flow distortion. The distortion effects could cause significant changes in these pressure gradients with result ing changes in the pt, 7m measurement. The
study also showed that, at some conditions, the integrating rake does not indicate the mixed average total pressure of the f a n and core streams.
Additional Considerations
Aside from the analytical considerations discussed in this report, other factors must be considered in the use of the TTW and PTA methods. For instance, the fuel flow measurements that are of great importance to the TTW method may be difficult to make accurately. In the F-111A tests, the fuel flow meters were calibrated care- fully, using the actual aircraft fuel lines, and the redundant total fuel flow meters were used to assure accurate fuel flow measurements. However, similar techniques were used with the XB-70 airplane (ref. 5) , but fuel flow accuracy problems were never completely resolved. Fuel flow measurement accuracy on the F-111A airplane may be p.articularly easy to achieve.
Primary nozzle area measurement, critical to the PTA method, is another ex- ample of a problem that may vary widely in difficulty from one engine to another. In the YJ93 engine installed in the XB-70 airplane, primary nozzle area was measured by both an actuator stroke position and a pucker string length. Neither system was particularly accurate, probably because of the difficult environment. Errors in ex- cess of &2 percent were common. In addition, the primary nozzle was generally not on the physical stops of maximum o r minimum area. In the TF30 engine, however, the nozzle is either fully open or fully closed for all power settings except intermediate afterburning, and the nozzle area measurement proved to be considerably more accurate than that for the YJ93 engine. The decision on which calculation method is more accurate depends on the particular engine and aircraft for which it is used. However, in a test program in which accurate results are required, both methods should be used to minimize the effects of instrumentation errors and to provide a check calculation.
CONCLUSIONS
An investigation of two variations of the gas generator method for calculating the thrust of the afterburning turbofan engines installed in the F-111A airplane yielded the following conclusions :
1. The gas generator method can be successfully applied to an afterburning turbofan engine. Based on two ground calibration tests, with two engines operating, net thrust accuracies of &2 percent can be achieved for most po;wer settings.
2. An influence coefficient study showed that the overall accuracy of the calcu- lation method based on nozzle total temperature and weight flow (TTW) was about equal to the accuracy of the method based on nozzle total pressure and area (PTA) at static conditions and was superior for in-flight conditions where, for military power,
25
I

estimated engine net thrust accuracy was approximately +3 percent for the TTW method and approximately +5 percent for the PTA method.
3. With either calculation method, additional errors in calculated thrust of as much as +2 percent could result from high inlet flow distortion.
4. The PTA method and the TTW method should both be used to calculate the thrust of an afterburning turbofan engine if accurate results are required.
Flight Research Center, National Aeronautics and Space Administration,
Edwards, Calif., January 5, 1971.
26
APPENDIX
DE FINITION O F PARAMETERS
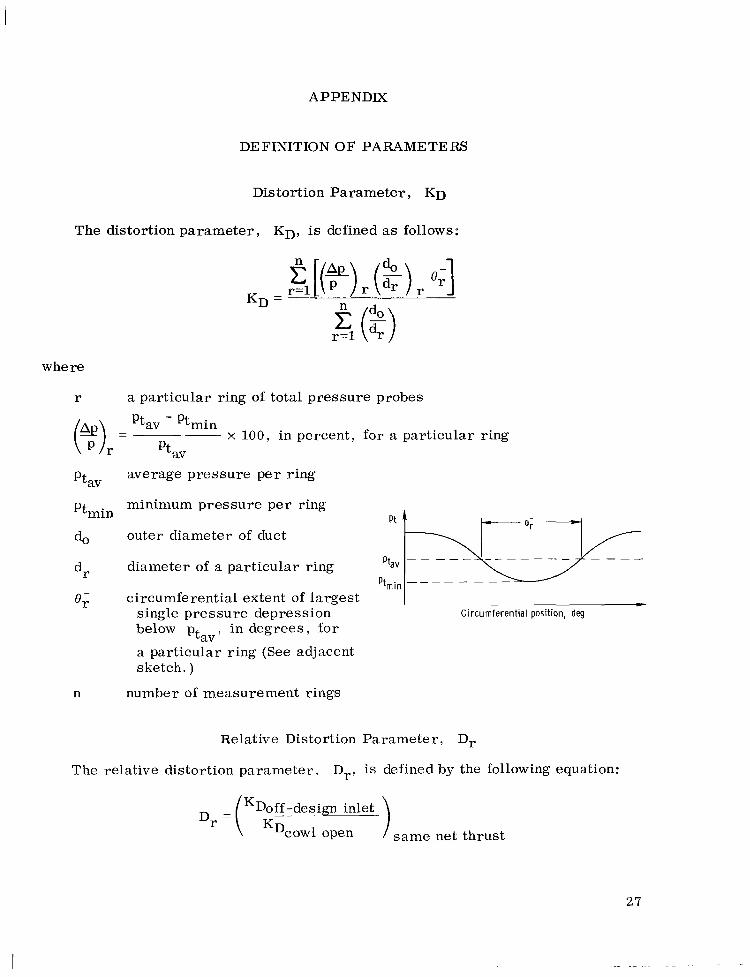
Distortion Parameter, KD
The distortion parameter, Kn, is defined as follows:
where
r a particular ring of total pressure probes
'tav Ptmin e)r = Ptav
- x 100, in percent, for a particular ring
'tav average pressure per r ing
'tmin minimum pressure per r ing
e; circumferential extent of largest I s ingle pressure depression Circumferent ia l posi t ion, deg below pt , in degrees, for
a particular ring (See adjacent sketch. )
av
n number of measurement rings
Relative Distortion Parameter, Dr
The relative distortion parameter. D,, is defined by the following equation:
Dr =( KDoff-design ~ inlet K ~ c o w l open same net thrust

I
APPENDIX
Influence Coefficient, Ci
The influence coefficient, C i , is defined as follows:
Ci(parameter) - \ Fn x loo),, percent A(parameter) ”
28

REFERENCES
1. Waters, Mark H. ; and Graham, Philip A. : Evaluation of an Exhaust Nozzle Traversing Rake System as an In-Flight Thrust Measuring Device for an After- burning Turbofan Engine. NAPTC-ATD-150, Naval A i r Propulsion Test Center (Trenton, N. J. ), Nov. 1968.
2. Beeler, De E. ; Bellman, Donald R. ; and Saltzman, Edwin J. : Flight Techniques for Determining Airplane Drag at High Mach Numbers. NACA TN 3821, 1956.
3. Nugent, Jack: Lift and Drag of a Swept-Wing Fighter Airplane at Transonic and Supersonic Speeds. NASA Memo 10-1-58H, 1959.
4. Beaulieu, Warren; Campbell, Ralph; and Burcham, William: Measurement of XB"70A Propulsion Performance Incorporating the Gas Generator Method. J. Aircraft, vol. 6 , no. 4, July-Aug. 1969, pp. 312-317.
5. Arnaiz, Henry H. ; and Schweikhard, William G. : Validation of the Gas Generator Method of Calculating Jet-Engine Thrust and Evaluation of XB-70 -1 Airplane Engine Performance at Ground Static Conditions. NASA TN D-7028, 1970.
6. Mechtly, E. A. : The International System of Un i t s - Physical Constants and Con- version Factors. NASA SP-7012, 1969.
7. Humphrey, J. R. , Jr. ; and Fallon, J. F . , Jr. : In-Flight Performance Deter- mination for TF30-P-3 Engine. Rep. PWA-3106, Pratt & Whitney Aircraft, Sept. 1968.
8. Braithwaite, Willis M. ; and Vollmar, William R. : Performance and Stall Limits of a YTF30-P-1 Turbofan Engine With Uniform Inlet Flow. NASA TM X-1803, 1969.
9. Werner, Roger A. ; Abdelwahab, Mahmood; and Braithwaite, Willis M. : Perform- ance and Stall Limits of an Afterburner-Equipped Turbofan Engine With and Without Inlet Flow Distortion. NASA TM X-1947, 1970.
10. Boytos, Joseph F. ; and Pasela, Walter L. : Exhaust Nozzle Characteristics of a Pratt & Whitney Aircraft TF30-P-8 Turbofan Engine at Simulated Flight Condi- tions. NAPTC-ATD-186, Naval A i r Propulsion Test Center (Trenton, N. J . ) , May 1970.
VASA-Langley, 1971 - 28 H-643 29
NATIONAL AERONAUTICS AND SPACE ADMINISTRAX ION
WASHINGTON, D. C. 20546 OFFICIAL BUSINESS
PENALTY FOR PRIVATE USE $300
FIRST CLASS MAIL
VATIONAL AERONAUTICS AN POSTAGE AND FEES PAID
SPACE ADMINISTRATION
1 3 U 001 53 51 3DS 71088 00903 A I R FORCE WEAPONS L A B O R A T O R Y /WLOL/ K I R T L A N O AF89 NEW M E X I C O 87117
A T T E . L O U ECdPANg C H I E F 9 T E C h - L I B R A R Y
POSTMASTER: If Undeliverable (Section 158 Postal Manual) Do Not Rerun
" T h e aeronantical and space actiuities of the United States shall be condncted so as to contribute . . . to the expansion of hnman knotul- edge of phenonrena in the atmosphere and space. The Administrntion shall provide fo r the widest practicable and appvopriate dissenzination of information concerning its actil4ties and the vesnlts thereof."
-NATIONAL AERONAUTICS A N D SPACE ACT OF 1958
NASA SCIENTIFIC AND TECHNICAL PUBLICATIONS
TECHNICAL REPORTS: Scientific and technical information considered important, complete, and n lasting contribution to existing, knowledge.
TECHNICAL NOTES: Information less broad in scope but nevertheless of importance as n contribution to existing knowledge.
TECHNICAL MEMORANDUMS: Information receiving limited distribution because of preliminary data, security classifica- tion, or other reasons.
TECHNICAL TRANSLATIONS: Information published in a foreign language considered to merit NASA distribution in English.
SPECIAL PUBLICATIONS: Information derived from or of value to NASA activicies. Publications include conference proceedings, monographs, data compilations, handbooks, sourcebooks, and special bibliographies.
TECHNOLOGY UTILIZATION PUBLICATIONS: Information on technology used by NASA that may be of particular
CONTRACTOR REPORTS: Scientific and technical information generated under a NASA Tccl,nology utilization R~~~~~~ and contract or grant and considered an important contribution to existing knowledge.
interest in commercial and other non-aerospace npplicationr. Publications include Tech Briefs,
Technology Surveys.
Details on the availability of these publications may be obtained from:
SCIENTIFIC AND TEC!iNICAL INFORMATION OFFICE
.NATIONAL AERONAUTICS AND SPACE ADMINISTRATION Washington, D.C. PO546