Embed Size (px)
Citation preview
Annals of Glaciology 10 1988 @ International Glaciological Society
ATMOSPHERIC TRACE-GAS VARIATIONS AS REVEALED BY AIR
TRAPPED IN AN ICE CORE FROM LAW DOME. ANTARCTICA
by
D.M. Etheridge
(Antarctic Division, Department of Science, Channel Highway, Kingston, Tasmania 7150, Australia)
and
G.!. Pearman and F. de Silva
(Division of Atmospheric Research, CSIRO, Private Bag No. I, Mordialloc, Victoria 3195, Australia)
ABSTRACT A technique for extracting and analysing large air
samples from bubbles occluded in an Antarctic ice core is discussed . Core samples of up to 1400 g were milled to release approximately 120 cms of air, which was dried, collected in a cold finger and then analysed by gas chromatography. The concentrations of atmospheric carbon dioxide (C02), methane (CH.) and nitrous oxide (N20) over the past 450 years have thus been revealed. Measurements of a chlorofluorocarbon (CCI2F2) in the ice-core air were used to check core quality and the air-occlusion process.
The ice core, designated BHD, was thermally drilled from the summit of Law Dome, Antarctica, where the average accumulation rate is 0.65 m a-I water equivalent and the annual average temperature is -22 ·C. Ice dating was achieved by counting annual cycles of oxygen - isotope ratio and d.c. conductivity, and air dating was deduced from the density profile.
The results show the pre-industrial concentrations of the gases to be 288 ± 5 ppm volume for CO2, 800 ± 50 ppb volume for CH. and 285 ± 10 ppb volume for N20.
INTRODUCTION Analysis of air occluded as bubbles in polar ice
provides the most promlslflg method of accurately reconstructing the concentration history of atmospheric trace gases (WMO 1983, Wolff and Peel 1985). Some of these gases are of interest because they absorb thermal radiation and thus affect global climate, and their concentrations are at present increasing. Carbon dioxide (C02) is the best-known "greenhouse" gas but methane (CH.), nitrous oxide (N20) and some chlorofluorocarbons (e.g. CCI3F and CCI2F 2) are of increasing concern (Dickinson and Cicerone 1986). To understand how the global atmosphere-oceanbiosphere system responds to the release of these gases, their concentrations need to be known from pre-industrial/ agricultural times (i.e. before about A.D . 1750) to when accurate direct measurements began, i.e. in 1958 for CO2 and during the last decade for other trace gases. Natural variations over longer periods are also of interest to climatologists.
Both wet and dry extraction techniques have been developed for the analysis of the occluded air. The former
Connection LABORATORY COLD ROOM Connection to to vacuum
28
test gas gauge head ----+ -26 ·C
To Flexible vacuum coupling pump I
I I I I Inner perforated I cylinder
Pump vapour Water vapour I trap -196·C trap -100·C I
Cold I finger I
I I
® vacuum valve I
Liquid helium I 'V needle valve cryostat I Indium 5·4l s.s.
o-ring seal I wire seals milling flask connection I
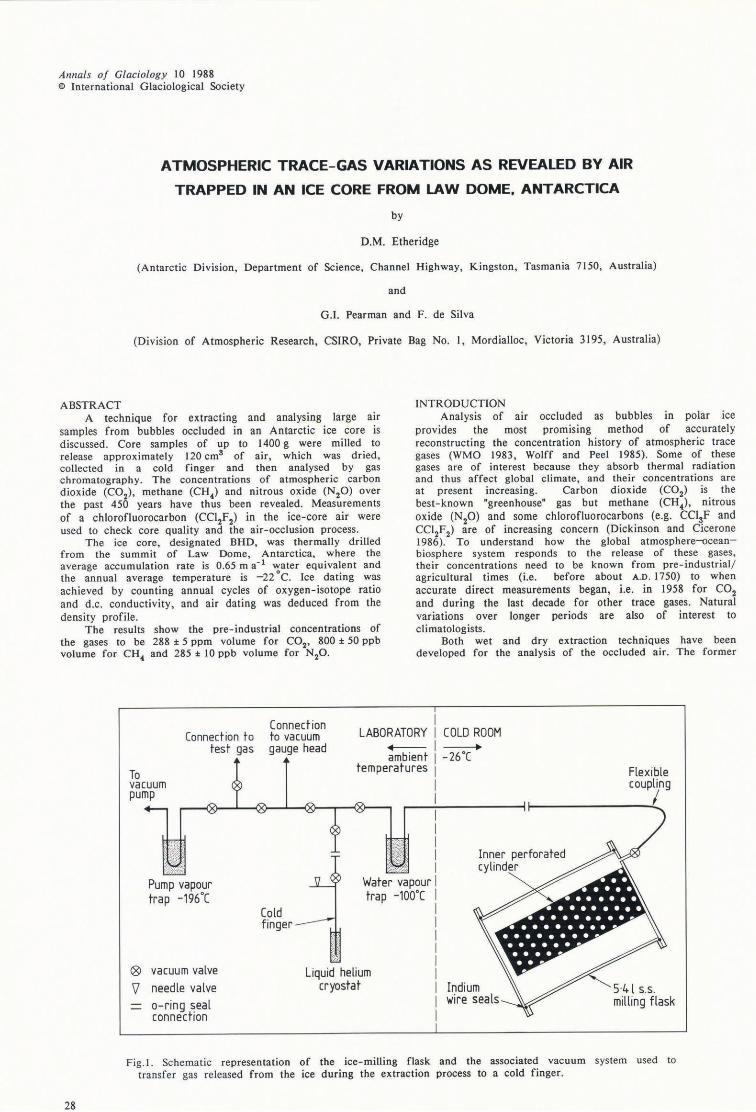
Fig .1. Schematic representation of the ice-milling flask and the associated vacuum system used to transfer gas released from the ice during the extraction process to a cold finger.
are useful for relatively insoluble gases such as CH. (Rasmussen and others 1982), whereas the latter are essential for the study of water-soluble gases, e.g. CO2 (Raynaud and others 1982, Barnola and others 1983, Lorius and Raynaud 1983, Moor and Stauffer 1984). The system described here (shown schematically in Figure I) was designed to extract and analyse the air in Antarctic ice cores, with the following factors in mind:
(i) For polar ice to contain air that is representative of the atmosphere with respect to soluble gases such as CO2 , it must have been formed at a cold location (mean annual temperature <-20°C) by the dry sintering of firn, without the water entering the liquid phase at any stage. This excludes the possibility of aqueous reactions of particulates or salts in the firn changing the gaseous composition. For the same reason the extraction of the air for analysis must also occur without melting, requiring a technique that opens the bubbles mechanically.
(ii) A key issue in the study of the CO2 increase is the relative roles of fossil-fuel combustion and man-made perturbations of the global biosphere . The change in the 13C/ 12C ratio of the CO
2 in the extracted air and of the
atmospheric oxygen concentration provides important information in establishing the total amount of CO2 released into the atmosphere. Both these measurements require more than 100 cm3 of air, so the extraction system must be able to handle relatively large ice samples. Air samples of this size also allow for the accurate measurement of all the above trace gases from a single extraction and this is the basis of the present paper. 13C/ 12C ratio and oxygenconcentration measurements will be reported at a later date .
(iii) There is a risk of the concentrations of CO2 and other gases being modified by absorption to and desorption from the materials of the extraction system and the fresh surfaces of the crushed ice. These processes are strongly temperature-dependent (Klinger and Ocampo 1978). By minimizing the time for extraction and the temperature of the ice sample and milling device, these effects were reduced .
(iv) It has been observed that abrasion between metal surfaces under vacuum can produce CH. in concentrations comparable to those being measured (Stauffer and others 1985 , Pearman and others 1986). It was advantageous, therefore, that the gas-extraction apparatus had no moving parts in contact with the ice sample.
(v) Once the air is released from the ice it must be dried and compressed into a usable volume at high pressure. The vacuum system must not modify the composition in doing so.
The above requirements were met by a design described below (see Fig. l) which has revealed CO2, CH. and N20 concentrations back to A.D. 1500, using an ice core from Law Dome, Antarctica.
THE GAS-EXTRACTION DEVICE The milling flask consisted of a vacuum cylinder with
two end-caps, one of which supported an internal cylinder. The latter resembled an inside-out cheese grater: 11 mm diameter holes pressed inward produced many raised cutting edges. The ice sample was placed inside the internal cylinder and the end-caps affixed. Indium wire was used for a vacuum seal. A metal-bellows valve completed the flask. All flask components were electro-polished 316 stainless steel. To extract the air bubbles, the flask was oscillated on a machine, forcing the cutting edges against the ice sample. The chips fell through the holes into the lower part of the flask, so that the cutting edges remained exposed. Ice samples up to 1400 g could be reduced to small chips in 4 min. There were no internal moving parts, thus reducing the possiblity of in-situ methane production, local warming or leaks due to unreliable mechanical vacuum seals. The oscillator imparted a lateral motion of amplitude 6.25 mm and a radial motion of amplitude 15 ° at a frequency of 11 Hz. It operated in a cold-room at -26°C. The ice samples were cooled to -80 °c before milling, to reduce their water-vapour pressure.
The ice cores contained an average of about 100 cm3
of air per kg ice. For a typical gas extraction from 900 g of ice over 4 min the extraction efficiency (volume of air
Etheridge and others: Atmospheric trace-gas variations
100 r------r----.----r---r----,-----.-----,
80
~B 60
III
'" C\
b
Ili 40 BHD 102 :>
~ (176 m) 600g
20
0 100 200 300
Milling time (s)
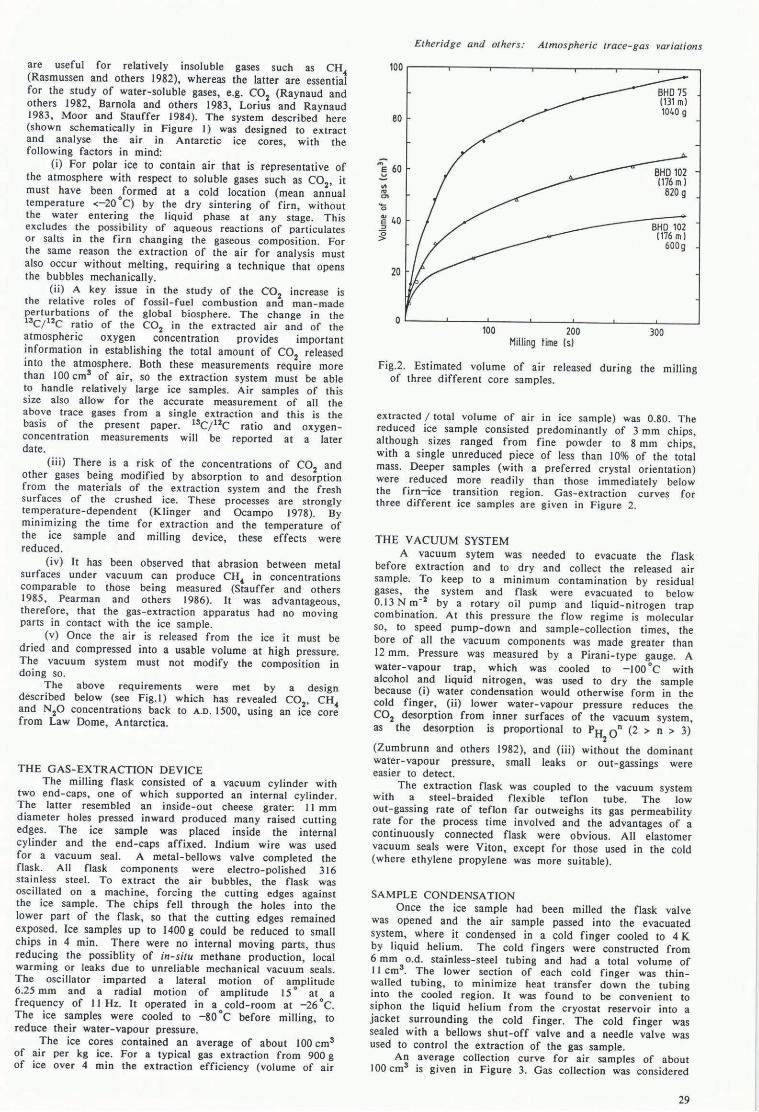
Fig.2. Estimated volume of air released during the milling of three different core samples.
extracted I total volume of air in ice sample) was 0.80. The reduced ice sample consisted predominantly of 3 mm chips, although sizes ranged from fine powder to 8 mm chips, with a single unreduced piece of less than 10% of the total mass. Deeper samples (with a preferred crystal orientation) were reduced more readily than those immediately below the firn-ice transitIOn region. Gas-extraction curves for three different ice samples are given in Figure 2.
THE VACUUM SYSTEM A vacuum sytem was needed to evacuate the flask
before extraction and to dry and collect the released air sample. To keep to a minimum contamination by residual gases, the system and flask were evacuated to below 0.13 N m-2 by a rotary oil pump and liquid-nitrogen trap combination. At this pressure the flow regime is molecular so, to speed pump-down and sample-collection times, the bore of all the vacuum components was made greater than 12 mm. Pressure was measured by a Pirani-type gauge. A water-vapour trap, which was cooled to -100°C with alcohol and liquid nitrogen, was used to dry the sample because (i) water condensation would otherwise form in the cold finger, (ii) lower water-vapour pressure reduces the CO2 desorption from inner surfaces of the vacuum system, as the desorption is proportional to PH On (2 > n > 3)
2
(Zumbrunn and others 1982), and (iii) without the dominant water-vapour pressure, small leaks or out-gassings were easier to detect.
The extraction flask was coupled to the vacuum system with a steel-braided flexible teflon tube. The low out-gassing rate of teflon far outweighs its gas permeability rate for the process time involved and the advantages of a continuously connected flask were obvious. All elastomer vacuum seals were Viton, except for those used in the cold (where ethylene propylene was more suitable).
SAMPLE CONDENSA TlON Once the ice sample had been milled the flask valve
was opened and the air sample passed into the evacuated system, where it condensed in a cold finger cooled to 4 K by liquid helium. The cold fingers were constructed from 6 mm o.d. stainless-steel tubing and had a total volume of 1I cm3• The lower section of each cold finger was thinwalled tubing, to minimize heat transfer down the tubing into the cooled region. It was found to be convenient to siphon the liquid helium from the cryostat reservoir into a jacket surrounding the cold finger. The cold finger was sealed with a bellows shut-off valve and a needle valve was used to control the extraction of the gas sample.
An average collection curve for air samples of about 100 cm3 is given in Figure 3. Gas collection was considered
29
Etheridge and others: Atmospheric trace-gas variations
100------~------~----~
'" E 10 ~
VI ro Cl
'+o Q)
E :J
~ lO
0·1 1-..------'--------'---------'
o 100 200 300 Time (s)
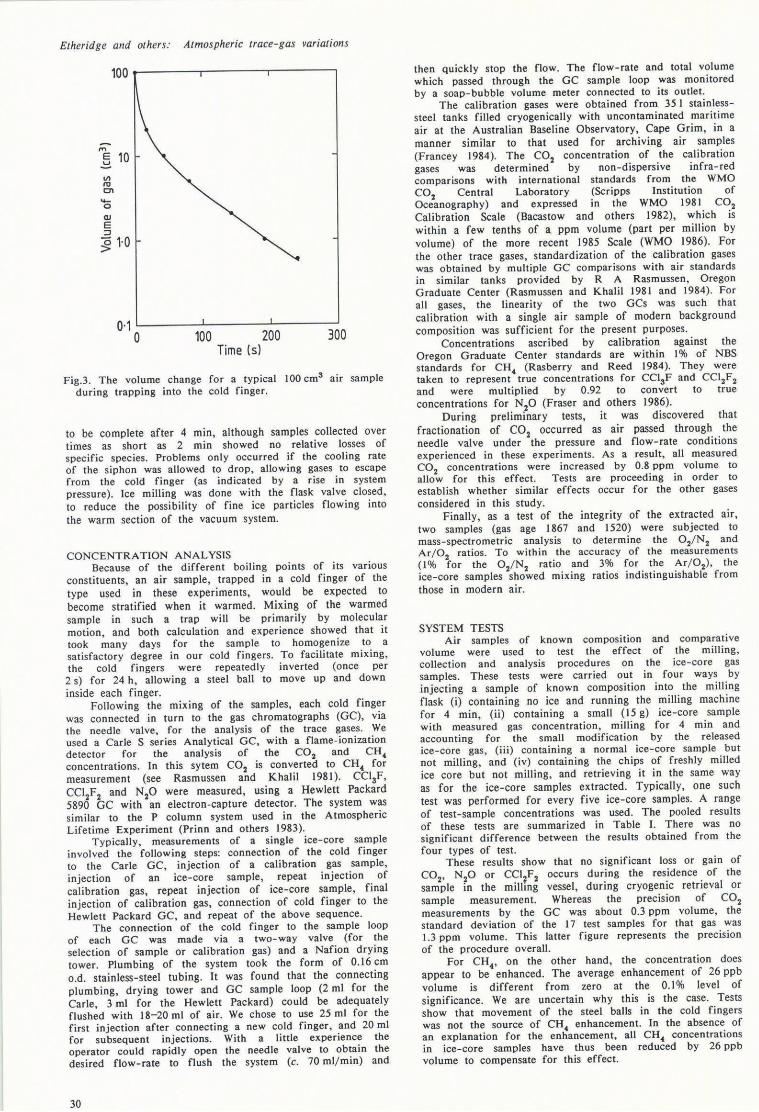
Fig.3. The volume change for a typical 100 cms air sample during trapping into the cold finger.
to be complete after 4 min, although samples collected over times as short as 2 min showed no relative losses of specific species. Problems only occurred if the cooling rate of the siphon was allowed to drop, allowing gases to escape from the cold finger (as indicated by a rise in system pressure). Ice milling was done with the flask valve closed, to reduce the possibility of fine ice particles flowing into the warm section of the vacuum system.
CONCENTRATION ANALYSIS Because of the different boiling points of its various
constituents, an air sample, trapped in a cold finger of the type used in these experiments, would be expected to become stratified when it warmed. Mixing of the warmed sample in such a trap will be primarily by molecular motion, and both calculation and experience showed that it took many days for the sample to homogenize to a satisfactory degree in our cold fingers. To facilitate mixing, the cold fingers were repeatedly inverted (once per 2 s) for 24 h, allowing a steel ball to move up and down inside each finger.
Following the mixing of the samples, each cold finger was connected in turn to the gas chromatographs (GC), via the needle valve, for the analysis of the trace gases. We used a Carle S series Analytical GC, with a flame -ionization detector for the analysis of the CO2 and CH. concentrations. In this sytem CO2 is converted to CH. for measurement (see Rasmussen and Khalil 1981). CCI3F, CCI2F 2 and N20 were measured, using a Hewlett Packard 5890 GC with an electron-capture detector. The system was similar to the P column system used in the Atmospheric Lifetime Experiment (Prinn and others 1983).
Typically, measurements of a single ice-core sample involved the following steps: connection of the cold finger to the Carle GC, injection of a calibration gas sample, Injection of an ice-core sample, repeat injection of calibration gas, repeat injection of ice-core sample, final injection of calibration gas, connection of cold finger to the Hewlett Packard GC, and repeat of the above sequence.
The connection of the cold f inger to the sample loop of each GC was made via a two-way valve (for the selection of sample or calibration gas) and a Nafion drying tower. Plumbing of the system took the form of 0.16 cm o.d. stainless-steel tubing. It was found that the connecting plumbing, drying tower and GC sample loop (2 ml for the Carle, 3 ml for the Hewlett Packard) could be adequately flushed with 18-20 ml of air . We chose to use 25 ml for the first injection after connecting a new cold finger , and 20 ml for subsequent Injections. With a little experience the operator could rapidly open the needle valve to obtain the desired flow-rate to flush the system (c. 70 ml/min) and
30
then quickly stop the flow . The flow-rate and total volume which passed through the GC sample loop was monitored by a soap-bubble volume meter connected to its outlet.
The calibration gases were obtained from 35 I stainlesssteel tanks filled cryogenically with uncontaminated maritime air at the Australian Baseline Observatory, Cape Grim, in a manner similar to that used for archiving air samples (Francey 1984). The CO2 concentration of the calibration gases was determined by non-dispersive infra-red comparisons with international standards from the WMO CO2 Central Laboratory (Scripps Institution of Oceanography) and expressed in the WMO 1981 C~2
Calibration Scale (Bacastow and others 1982), which IS
within a few tenths of a ppm volume (part per million by volume) of the more recent 1985 Scale (WMO 1986). For the other trace gases, standardization of the calibration gases was obtained by multiple GC comparisons with air standards in similar tanks provided by R A Rasmussen, Oregon Graduate Center (Rasmussen and Khalil 1981 and 1984). For all gases, the linearity of the two GCs was such that calibration with a single air sample of modern background composition was sufficient for the present purposes.
Concentrations ascribed by calibration against the Oregon Graduate Center standards are within I % of NBS standards for CH. (Rasberry and Reed 1984). They were taken to represent true concentrations for CClsF and CCI2F2 and were multiplied by 0.92 to convert to true concentrations for N20 (Fraser and others 1986).
During preliminary tests, it was discovered that fractionation of CO2 occurred as air passed through the needle valve under the pressure and flow-rate conditions experienced in these experiments. As a result, all measured CO2 concentrations were increased by 0.8 ppm volume to allow for this effect. Tests are proceeding in order to establish whether similar effects occur for the other gases considered in this study.
Finally, as a test of the integrity of the extracted air, two samples (gas age 1867 and 1520) were subjected to mass-spectrometric analysis to determine the 02/ N2 and Ar/ 0 2 ratios. To within the accuracy of the measurements (1 % for the 02/ N2 ratio and 3% for the Ar/ 0 2), the ice-core samples showed mixing ratios indistinguishable from those in modern air.
SYSTEM TESTS Air samples of known composition and comparative
volume were used to test the effect of the milling, collection and analysis procedures on the ice-core gas samples. These tests were carried out in four ways by injecting a sample of known composition into the milling flask (i) containing no ice and running the milling machine for 4 min, (ii) containing a small (15 g) ice-core sample with measured gas concentration , milling for 4 min and accounting for the small modification by the released ice-core gas, (iii) containing a normal ice-core sample but not milling, and (iv) containing the chips of freshly milled ice core but not milling, and retrieving it in the same way as for the ice-core samples extracted. Typically, one such test was performed for every five ice-core samples. A range of test-sample concentrations was used . The pooled results of these tests are summarized in Table I. There was no significant difference between the results obtained from the four types of test .
These results show that no significant loss or gain of CO2, N20 or CCI2F2 occurs during the residence of the sample in the milling vessel, during cryogenic retrieval or sample measurement. Whereas the preClSJon of CO2 measurements by the GC was about 0.3 ppm volume, the standard deviation of the 17 test samples for that gas was 1.3 ppm volume. This latter figure represents the precision of the procedure overall.
For CH., on the other hand , the concentration does appear to be enhanced. The average enhancement of 26 ppb volume is different from zero at the 0.1 % level of significance. We are uncertain why this is the case. Tests show that movement of the steel balls in the cold fingers was not the source of CH. enhancement. In the absence of an explanation for the enhancement, all CH. concentrations in ice-core samples have thus been reduced by 26 ppb volume to compensate for this effect.
TABLE 1. RESULTS OF SYSTEM TESTS. The integrity of the air - extraction apparatus and subsequent analysis procedures were tested by filling the milling flask with air of known concentration, with or without the presence of an ice sample and/ or shaking the flask, and then trapping and analysing that air using the same procedures as for ice-core samples. This table summarizes the degree of concentration enhancement which occurs during the complete process. Data for all treatments are pooled.
CO2 CH. N20 CCI2F2 CCI3F (pp m v) (ppb v) (ppb v) (ppt v) (ppt v)
Mean enhancement -0 .5 +26 +3.7 +26 +171
Standard deviation 1.3 19 8.6 60 198
Number of tests 17 16 11 12 15
Significance *** *.
** 1% *** 0.1 %
The tests clearly show the variable concentrations of chlorofluorocarbons in recovered test gases, although on average the enhancement of CCI2F 2 is not significantly different from zero. For CCI3F, both the variability and enhancement are greater, the latter being significant at the 1% level.
ICE CORE BHD The ice core investigated, designated BHD, was drilled
from the summit of Law Dome, Antarctica (66 °43 , S, 112°50'E; 1375 m a.s .l.) by the 1977 Australian National Antarctic Research Expedition. The thermal drill reached a
TABLE H. TRACE-GAS CONCENTRATIONS AS MEASURED IN ICE CORE BHD.
Gas Date Gas concentrations: age measured CO2 CH. N20 (A.D.) (ppmv) (ppbv) (ppbv)
1966 19/ 06/ 85 316.6 298 .9 1966 19/ 06/ 85 321 .0 322.9 1966 28/ 06/ 85 312.0 1966 28/ 06/ 85 324.0 1965 18/ 12/ 85 322.2 1965 18/ 12/ 85 320.1 1964 16/ 07/ 85 324.1 304.8 1964 16/ 07/ 85 322.6 305.3 1963 16/ 04/ 86 309.3 1195.0 1948 03/ 09/ 86 313.3 1100.5 1947 24/ 09/ 86 310.4 1109.5 289 .5 1937 07/ 10/ 86 300.0 1008 .8 301.4 1930 07/ 08/ 85 304.8 1929 09/ 07/ 85 298.8 1929 03/ 07/ 85 300.8 1929 05/ 07/ 85 292.4 1916 16/ 04/ 86 300.4 972.0 1914 18/ 12/ 85 300.2 1100.6 1913 07/ 08/ 85 294.9 307.3 1912 07/ 08/ 85 298 .3 296.2 1912 12/ 07/ 85 298 .5 1912 12/ 07/ 85 298 .1 285 .7 1911 18/ 12/ 85 305 .7 966.0 1901 24/ 07/ 85 279 .2 309.0 1901 24/ 07/ 85 287.4 305.7 1890 12/ 06/ 85 293.4 290.7 1890 12/ 06/ 85 289.1 294.1 1888 07/ 06/ 85 287.3 1888 07/ 06/ 85 276 .9 1878 28/ 06/ 85 292.4 1878 03/ 07/ 85 292 .3 287.3 1878 16/ 04/ 86 297 .7 906.0 1875 24/ 07/ 85 289.7 1870 24/ 07/ 85 312.9 1865 12/ 07/ 85 296.6 1865 16/ 07/ 85 290.0 1860 09/ 07/ 85 284.5
Etheridge and others: Atmospheric trace-gas variations
depth of 473 m, about 40% of the total ice thickness. The age of the ice at this depth is deduced to be 2000 a (Morgan 1985). The Law Dome summit is considered an ideal location for gas-composition studies. Law Dome has been separated from the main Antarctic ice sheet for about 10 ka and thus, in the upper layers in the summit region, the flow is essentially vertical (Gao and Jacka , in preparation). The distortion of the annual layers due to ice flow is thus minimal , as shown by the oxygen-isotope record in BHD (Morgan 1985). Analysis of the annual cycles of oxygen isotopes and d .c. conductivity gives the average accumulation rate as 0.65 m a-I water equivalent, and an age-depth scale with an accuracy of 1850 ± 6 a at 102 m and A.D. 1450 ± 20 at 254 m. No melt layers have been observed in BHD, as would be expected from the low annual average temperature of -22°C.
The air-occlusion process occurs some time after the snow is laid down, depending on the densification rate . Using the relation between density and air occlusion reported by Schwander and Stauffer (1984) and the measured density curve of BHD, the occluded air was found to be an average of 70 a younger than the ice, and 80% was occluded over a span of 17 a. A core from Siple Station (Neftel and others 1985) has the next shortest age difference and occlusion span (85 and 22 a respectively) of any ice core under similar investigation.
RESULTS Three physical aspects of the ice cores made careful
sample selection important. First, only ice below the airocclusion zone (70 m in BHD) can be expected to retain its original gas composition. Above this depth the ice is still porous . Secondly, ice from 190 m and deeper exhibits regions of micro-fracturing (wafer-like stress cracks from drilling and pressure release), which both release air and
1856 19/ 07/ 85 282 .4 1844 03/ 07/ 85 284 .8 1844 03/ 07/ 85 281.2 1844 19/ 07/ 85 285 .3 1844 19/ 07/ 85 288.4 1826 03/ 09/ 86 291.7 1826 03/ 09/ 86 294.5 1826 24/ 09/ 86 290 .3 1808 28/ 06/ 85 276 .7 1808 03/ 07/ 85 285.5 1796 06/ 08/ 86 285 .9 1796 06/ 08/ 86 289.6 1796 24/ 09/ 86 283 .5 1770 07/ 10/ 86 1735 07/ 10/ 86 278.5 1735 23/ 10/ 86 281 .2 1735 01 / 10/ 86 282.5 1730 09/ 07/ 85 282 .0 1730 21 / 06/ 85 273.1 1730 21 / 06/ 85 282 .2 1729 19/ 06/ 85 1728 03/ 09/ 86 289 .4 1728 24/ 09/ 86 1718 07/ 10/ 86 278.5 1718 07/ 10/ 86 279 .2 1714 26/ 06/ 85 266 .6 1714 26/ 06/ 85 280 .6 1712 12/ 06/ 85 1712 19/ 06/ 85 1712 05/ 07/ 85 283.0 1702 01 / 10/ 86 271.4 1686 23/ 10/ 86 278 .6 1686 23/ 10/ 86 275.0 1682 19/ 07/ 85 286.4 1662 09/ 07/ 85 1654 06/ 08/ 86 283.3 1654 06/ 08/ 86 284 .8 1610 07/ 08/ 85 284 .9 1608 19/ 12/ 85 291 .1 1606 12/ 07/ 85 283 .6 1606 16/ 07/ 85 288 .5 1602 24/ 09/ 86 288.0 1602 03/ 09/ 86 290.4 1520 01 / 10/ 86 289 .9 1520 01 / 10/ 86 289.1
830.3 803.3 856.7 308.2
803 .9 781.7
301 .1
806.9 299.4 707.5 939.1 281.7 722.8 296.6 859.6 302.6
707.1 724 .9
302.8
272.2
910.8 289.9 713.3 281.8
284.4 296.7 299.9
815.9 283 .9 709.6 718.2 290 .6
708 .2 724.5
845.7
284 .1
282.3
284.5 283.5
826.6 329.8 735 .7 818 .2 328.3
1010.8 303.2
31
Etheridge and others: Atmospheric trace-gas variations
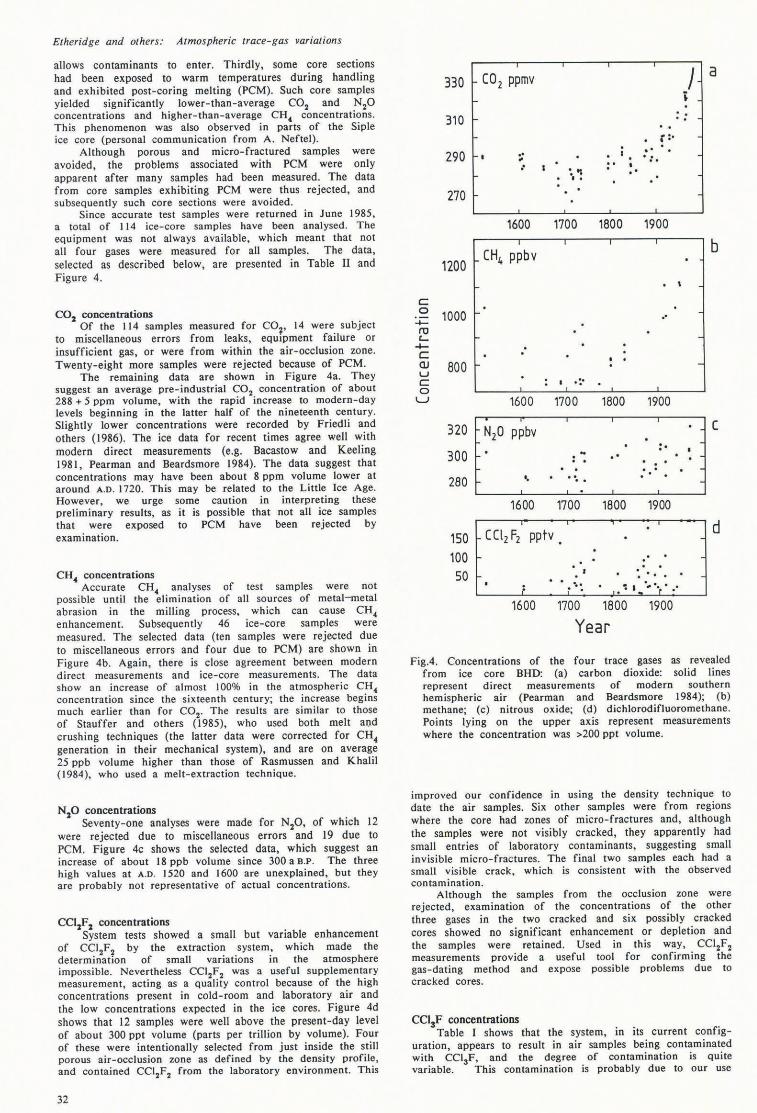
allows contaminants to enter. Thirdly, some core sections had been exposed to warm temperatures during handling and exhibited post-coring melting (PCM). Such core samples yielded significantly lower-than-average CO
2 and N
20
concentrations and higher-than-average CH" concentrations. This phenomenon was also observed in parts of the Siple ice core (personal communication from A. Neftel).
Although porous and micro-fractured samples were avoided, the problems associated with PCM were only apparent after many samples had been measured. The data from core samples exhibiting PCM were thus rejected, and subsequently such core sections were avoided.
Since accurate test samples were returned in June 1985, a total of 114 ice-core samples have been analysed. The equipment was not always available, which meant that not all four gases were measured for all samples. The data, selected as described below, are presented in Table II and Figure 4.
CO2 concentrations Of the 114 samples measured for CO
2, 14 were subject
to miscellaneous errors from leaks, equipment failure or insufficient gas, or were from within the air-occlusion zone. Twenty-eight more samples were rejected because of PCM.
The remaining data are shown in Figure 4a. They suggest an average pre-industrial CO2 concentration of about 288 + 5 ppm volume, with the rapid increase to modern-day levels beginning in the latter half of the nineteenth century. Slightly lower concentrations were recorded by Friedli and others (1986). The ice data for recent times agree well with modern direct measurements (e.g. Bacastow and Keeling 198 I, Pearman and Beardsmore 1984). The data suggest that concentrations may have been about 8 ppm volume lower at around A.D. 1720. This may be related to the Little Ice Age. However, we urge some caution in interpreting these preliminary results, as it is possible that not all ice samples that were exposed to PCM have been rejected by examination .
CH" concentrations Accurate CH4 analyses of test samples were not
possible until the elimination of all sources of metal-metal abrasion in the milling process, which can cause CH4 enhancement. Subsequently 46 ice-core samples were measured. The selected data (ten samples were rejected due to miscellaneous errors and four due to PCM) are shown in Figure 4b. Again, there is close agreement between modern direct measurements and ice-core measurements. The data show an increase of almost 100% in the atmospheric CH4 concentration since the sixteenth century; the increase begins much earlier than for CO2, The results are similar to those of Stauffer and others (1985), who used both melt aQd crushing techniques (the latter data were corrected for CH" generation in their mechanical system), and are on average 25 ppb volume higher than those of Rasmussen and Khalil (1984), who used a melt-extraction technique.
N20 concentrations Seventy-one analyses were made for N20, of which 12
were rejected due to miscellaneous errors and 19 due to PCM. Figure 4c shows the selected data, which suggest an increase of about 18 ppb volume since 300 a B.P. The three high values at A.D. 1520 and 1600 are unexplained, but they are probably not representative of actual concentrations.
CCI2F 2 concentrations System tests showed a small but variable enhancement
of CCI2F2 by the extraction ·system, which made the determination of small vanattons in the atmosphere impossible. Nevertheless CCl2F2 was a useful supplementary measurement, acting as a quality control because of the high concentrations present in cold-room and laboratory air and the low concentrations expected in the ice cores. Figure 4d shows that 12 samples were well above the present-day level of about 300 ppt volume (parts per trillion by volume). Four of these were intentionally selected from just inside the still porous air-occlusion zone as defined by the density profile, and contained CCl2F 2 from the laboratory environment. This
32
c: o 4-ru '-4-C OJ u c: o
LJ
330
310
290
270
1200
1000
800
320
300
280
150 100 50
CO 2 ppmv
.' , ..
1600
CH4 ppbv
~ t: .. 1700
" '.
1600 1700
" , , .. 1600 1700
t :. .. . :. • .'
1800 1900
.'
. , 1800 1900
: ' "
1800 1900
" " , .... ~ I .. " "r' "
1600 1700 1800 1900
Year
I a i
..
b
(
d
Fig.4. Concentrations of the four trace gases as revealed from ice core BHD: (a) carbon dioxide: solid lines represent direct measurements of modern southern hemispheric air (Pearman and Beardsmore 1984); (b) methane; (c) nitrous oxide; (d) dichlorodifluoromethane. Points lying on the upper axis represent measurements where the concentration was >200 ppt volume.
improved our confidence in using the density technique to date the air samples. Six other samples were from regions where the core had zones of micro-fractures and, although the samples were not visibly cracked, they apparently had small entries of laboratory contaminants, suggesting small invisible micro-fractures. The final two samples each had a small visible crack, which is consistent with the observed contamination.
Although the samples from the occlusion zone were rejected, examination of the concentrations of the other three gases in the two cracked and six possibly cracked cores showed no significant enhancement or depletion and the samples were retained . Used in this way, CCl2F2 measurements provide a useful tool for confirming the gas-dating method and expose possible problems due to cracked cores.
CCI3F concentrations Table I shows that the system, in its current config
uration, appears to result in air samples being contaminated with CCI3F, and the degree of contamination is quite variable. This contamination is probably due to our use
of Vi ton O-ring seals in the vacuum system and so far thwarts efforts to use historical trends of CCl3 F to validate our gas-dating techniques.
FUTURE ANALYSIS The data presented have shown the value of ice cores
in preserving the history of atmospheric trace-gas concentrations. In addition, the importance of core quality and the nature of the drill site is emphasized. From this we make the following recommendations for future work:
(i) Ice cores destined for gas-composition analysis should be drilled with minimal heating (in the case of thermal drills) and never allowed to warm significantly during handling or analysis. A full temperature record of the core history should be kept. We believe that thermal effects on the core present the most serious cause of variability and uncertainty for the measurements we have made for CO2, CH4 and N20.
(ii) The drill site is intrinsic to the type and quality of gas-composition data that can be extracted from the core. The accumulation rate determines the effective age difference and resolution of the enclosed air. For studies of the fine structure of trace-gas variations over the past 150 a, and to allow a more meaningful calibration of the ice-core gas with modern direct measurements, a core from a cold high-accumulation rate site is necessary. Such a site exists on Law Dome, east of BHD, where the accumulation rate of about 1.3 m a-I suggests an air-age resolution of only 7 a. A core from this site was recently drilled and will soon be analysed.
ACKNOWLEDGEMENTS Special thanks are expressed to those involved in all
phases of this study. They include the drilling teams of the Australian National Antarctic Research Expeditions for obtaining the core, the workshop staff of CSIRO and the Antarctic Division Glaciology Section, Messrs R Horan, K Hall (Monash University), R Kemp (CSIRO) and Professor Opat (University of Melbourne) for the supply of and advice on the use of liquid helium, Drs P J Fraser, I Weeks (CSIRO) and R A Rasmussen (Oregon Graduate Center) for advice on the chromatography, for technical assistance and for the use of GCs, and our colleagues Professor W F Budd (University of Melbourne), Dr I G Enting (CSJRO), and Messrs I Allison, D Jones, V I Morgan, E R Wishart and C Wookey (Antarctic Division Glaciology Section) for their long-term support and advice on various aspects of the study.
REFERENCES Bacastow R B, Keeling C D 1981 Atmospheric carbon
dioxide concentration and the observed airborne fraction . In Bolin B (ed) Carbon cycle modelling. Scope 16. Chichester, John Wiley: 103-112
Bacastow R B, Keeling C D, Guenther P R, Moss D J Unpublished CO2 reference gas system. Report of the Scripps Institution of Oceanography, La Jolla, California, 1982
Barnola J M, Raynaud D, Neftel A, Oeschger H 1983 Comparison of CO2 measurements by two laboratories on air from bubbles in polar ice. Nature 303(5916): 410-413
Dickinson R E, Cicerone R J 1986 Future global warming from atmospheric trace gases. Nature 319(6049): 109-115
Francey R J (ed) 1984 Baseline Atmospheric Program (Australia ) 1981-82. Canberra, Canberra Publishing and Printing Company
Fraser P J and 6 others 1986 Intercomparison of halocarbon and nitrous oxide measurements, 1976-1984. In Francey R J, Forgan B W (eds) Baseline Atmospheric Program (Australia) 1983-1984. Canberra, Canberra Publishing and Printing Company: 17 -26
Friedli H, Lotscher H, Oeschger H, B 1986 Ice core record of atmospheric CO2 in the past 324(6094): 237-238
Siegenthaler U, Stauffer the ISC/ l2C ratio of two centuries. Nature
Klinger J, Ocampo J 1978 Proceedings of the International Conference on Evolution of Planetary Atmospheres and
Etheridge and others: Atmospheric trace-gas variations
Climatology 0/ the Earth , Nice. Paris, Centre National d'Etudes Spatiales: 95-106
Lorius C, Raynaud D 1983 Record of past atmospheric CO2 from tree-ring and ice core studies. In Back W, Crane A J, Berger A L, Longhetto A (eds) Carbon dioxide: current views and developments in energy/ climate research . Dordrecht, D. Reidel Publishing Co: 145-176
Moor E, Stauffer B 1984 A new dry extraction system for gases in ice. Journal 0/ Glaciology 30{l06): 358-361
Morgan V I 1985 An oxygen isotope-climate record from Law Dome, Antarctica. Climatic Change 7(4): 415-426
Neftel A, Moor E, Oeschger H, Stauffer B 1985 Evidence from polar ice cores for the increase in atmospheric CO2 in the past two centuries. Nature 315(6014): 45-47
Pearman G I, Beardsmore D J 1984 Atmospheric carbon dioxide measurements in the A ustralian region: ten years of aircraft data. Tellus 36B: 1-24
Pearman G I, Etheridge D, Silva F de, Fraser P J 1986 Evidence of changing concentrations of atmospheric CO2,
N20 and CH4 from air bubbles in Antarctic ice. Nature 320(6059~ 248-250
Prinn R G and 9 others 1983 The Atmospheric Lifetime Experiment. I . Introduction, instrumentation and overview. Journal 0/ Geophysical Research 88(C13): 8353-8367
Rasberry S D, Reed W P 1984 Reference materials and environmental analysis. Environment International 10: 87-90
Rasmussen R A, Khalil M A K 1981 Atmospheric methane (CH4): trends and seasonal cycles. Journal of Geophysical Research 86(C I 0): 9826-9832
Rasmussen R A, Khalil M A K 1984 Atmospheric methane in the recent and ancient atmospheres: concentrations, trends and interhemispheric gradient. Journal 0/ Geophysical Research 89(D7): 11599-11605
Rasmussen R A, Khalil M A, Hoyt S D 1982 Trace gases in snow and rain. In Pruppacher H R, Semonin R G, Slinn W G (eds) Precipitation scavenging, dry deposition and resuspension . Volume 2. Dry deposition and resuspension . New York, Elsevier: 1301-1314
Raynaud D, Delmas R, Ascencio J M, Legrand M 1982 Gas extraction from polar ice cores: a critical issue for studying the evolution of atmospheric CO2 and ice-sheet surface elevation. Annals of Glaciology 3: 265-268
Schwander J, Stauffer B 1984 Age difference between polar ice and the air trapped in its bubbles. Nature 311(5981): 45-47
Stauffer B, Fischer G, Neftel A, Oeschger H 1985 Increase of atmospheric methane recorded in Antarctic ice core. Science 229(4720): 1386-1388
Wolff E W, Peel D A 1985 The record of global pollution in polar snow and ice. Nature 313(6003): 535-540
WMO 1983 Report of the WMO (CAS) meeting 0/ experts on the CO2 concentration from preindustrial times to the I.G.Y .. Boulder, Colorado . June /983. Geneva, World Meteorological Organisation
WMO 1986 Report 0/ the Third WMO Expert Meeting on Atmospheric Carbon Dioxide Measurement Techniques, Lake Arrowhead, California. Geneva, World Meteorological Organisation (Environmental Pollution Monitoring and Research Programme Report No. 39)
Zumbrunn R, Neftel A, Oeschger H 1982 CO2 measurements on I-cms ice samples with an IR laserspectrometer (IRLS) combined with a new dry extraction device. Earth and Planetary Science Lellers 60(2): 318-324
33


![Genome-wide association study of milk and reproductive traits in … · [22]. A few selection signature studies revealed several gen-etic variations in both dairy and beef cattle](https://img.pdfslide.us/doc/110x75/5f665badf2ff31485a0a458f/genome-wide-association-study-of-milk-and-reproductive-traits-in-22-a-few-selection.jpg)
![SEASONAL VARIATIONS OF TRACE METAL ...1].S. Yogesh Kumar.pdfReceived: 15th May-2012 Revised: 17th May-2012 Accepted: 21st May-2012 Research article SEASONAL VARIATIONS OF TRACE METAL](https://img.pdfslide.us/doc/110x75/5ad0e8f37f8b9ad24f8e32b5/seasonal-variations-of-trace-metal-1s-yogesh-kumarpdfreceived-15th-may-2012.jpg)