Embed Size (px)
Citation preview

i
DEGREE PROJECT IN TECHNOLOGY,
SECOND CYCLE, 30 CREDITS
STOCKHOLM, SWEDEN 2021
Performance Investigation &
Gas Exchange Assessment of
Exhaust Piston–assisted Turbocharged
Engine (EPTE) Concept
A simulation-based assessment
NACHIKETH LINGACHARI ACHARYA & SAURAV DASGUPTA
Master of Science Thesis TRITA-ITM-EX 2021:546
KTH Industrial Engineering and Management
Machine Design, Division of Internal Combustion Engines
SE-10044 STOCKHOLM

iii
Examensarbete TRITA-ITM-EX 2021:546
Analys av prestanda och bedömning av gasutbyte för koncept med avgaskolv som assisterar turboladdning
av motor (EPTE)
Simuleringsbaserad bedömning
Nachiketh Lingachari Acharya
Saurav Dasgupta
Godkänt
2021-09-18
Examinator
Andreas Cronhjort
Handledare
Andreas Cronhjort
Uppdragsgivare
Olshammar Nebula AB
Kontaktperson
Mats Olshammar
Sammanfattning Okade krav i lagstiftningen for utslapp inom transportindustrin, tillsammans med ambitiosa
krav pa effekt och bransleekonomi fran kundsidan, har drivit fordonstillverkarna och relevanta
leverantorer av komponenter att utveckla och integrera en bred portfolj av motorteknik.
Turboladdning är en sådan teknisk lösning som används av industrin för att minska
bränsleförbrukningen och därmed koldioxidutsläpp från avgasröret. Omradet inom vilket
turboladdning har praktiserats stracker sig over en mangd olika fordonssegment, for bade
vagtrafik och offroad-applikationer.
Det är välkänt att standard turboladdning har en nackdel, då den inte har förmågan att
tillhandahålla god effektivitet över ett brett driftsområde. Dessutom har fyrtaktsmotorer med
fa cylindrar ojamna avgaspulser som strommar in i turbons turbin. Detta gor att turbon inte
klarar systemets krav pa lufttillgang under motorns hela cykeln. Det finns befintliga
kommersiella teknologier som turboladdning med ”twin-scroll”, turbo med variabel geometri
(VGT) och elektriskt assisterad turbo (EAT) for att hantera ovanstaende utmaningar. Men de
medfor hoga kostnader och overgripande systemkomplexitet. Ett patenterat konceptet, aven
kallat EPTE (Exhaust Piston-assisted Turbocharged Engine), havdar att det adresserar dessa
nackdelar med olika strategier for turboladdning. EPTE-konceptet anvander en extra kolv och
cylinder, som enbart komprimerar och expanderar de avgaser som kommer fran
forbranningscylindrarna. Denna extra kolv och cylinder kallas även EXC (Exhaust Cylinder).

iv
Denna avhandling undersoker EPTE-konceptets prestanda och gasutbyte over ett brett
motorvarvtal, och jamfor detta med en basmotor som saknar EXC-komponenten. Utvardering
gors for att bedoma effekten av EXC-komponenten pa turbon prestanda, samt dimensionering
av ljuddamparen och system for efterbehandling av avgaser. Prestandaanalys har utford for
EXC-komponenten for att kvantifiera dess bidrag till den totala bromseffekten som produceras
vid vevaxeln. Undersokningen utfordes med hjalp av det kommersiella verktyget for
motorprestanda, GT-PowerTM. Ytterligare resultat av studien inkluderade utvardering av
fluktuationer i NBT (Normalized Brake Torque) och de fysiska forandringar pa insugs- och
avgassidan som kravs nar basmotorn byggs om till EPTE. En utvardering av specifikationerna
for EXC-komponenten gors ocksa i denna avhandling, for att ge en overblick over den extra
kolven och cylindern fran konstruktionssynpunkt.
EPTE-konceptet visade sig vara mer bransleeffektivt och gav samtidigt hogre effekt an
basmotorn, nar laddtrycket hade ett hogt satt varde for begransning av trycket. Det nya
konceptet uppvisade nackdelar gallande bransleeffektivitet och effekt vid lagt laddtryck.
Konceptet visade sig ocksa oka turbons prestanda genom att ge turbinen ett jamnare
avgasflode/tryck over motorns hela cykel, detta jamfort med basmotorn. Konceptet hade ocksa
en positiv inverkan pa ljuddampare och system for efterbehandling av avgaser, samt for
storleken pa motorns svanghjul, da alla dessa komponenter kunde minskas i dimension.
Det observerades ocksa att EPTE-konceptet kan ge dessa fordelar utan att behov av stora
modifieringar av insugs- och avgassidans geometriska parametrar. Med en mindre turboladdare
visade sig en sadan motor vara fordelaktig, jamfort med basmotorn, over hela motorns
varvtalsregister.
Avhandlingen ger ett simuleringsbaserat perspektiv pa systemniva av EPTE-konceptet, som
har patenterats av Mats Olshammar. Ett sadant perspektiv pa systemniva bidrar till en forstaelse
for EPTE innan man paborjar nagra initiativ for utveckling av hardvara. Rapporten ger ocksa
nagra rekommendationer for framtida arbete, baserade pa de fordelar och nackdelar som
konceptmotorn uppvisar i detta arbete.

v
Master of Science Thesis TRITA-ITM-EX 2021:546
Performance Investigation & Gas Exchange Assessment of Exhaust Piston-assisted Turbocharged
Engine (EPTE) Concept
A simulation-based assessment
Nachiketh Lingachari Acharya
Saurav Dasgupta
Approved
2021-09-18
Examiner
Andreas Cronhjort
Supervisor
Andreas Cronhjort
Commissioner
Olshammar Nebula AB
Contact person
Mats Olshammar
Abstract There is an increasing stringency in the emission legislation within the transport industry along
with ambitious performance demands from the customer side. These have pushed the vehicle
manufacturers and relevant component suppliers to develop and integrate a wide portfolio of
engine technologies. Turbocharging is one such technical solution deployed by the industry to
reduce fuel consumption and thereby CO2 emissions from the tailpipe. The area within which
turbocharging has been practiced spans across a variety of vehicle segments including on-road
and off-road applications.
It has been well established that standard turbocharging comes with a downside of not having
the ability to provide suitable efficiency levels across a broad operating range. Furthermore,
four-stroke turbocharged engines with fewer cylinders have uneven exhaust pulsations flowing
into the turbine inlet. This implies that the turbocharger is not able to meet the air system
demands throughout the engine cycle. There are existing commercial technologies such as
twin-scroll turbocharging, Variable Geometry Turbochargers (VGTs) and Electrically-assisted
Turbochargers (EAT) to tackle the above highlighted challenges. However, they induce high
cost and overall system complexity. A patented concept also referred to as the Exhaust Piston-
assisted Turbocharged Engine (EPTE) claims to address the aforementioned drawbacks related
to various turbocharging strategies. The EPTE concept uses an extra piston-cylinder which acts
solely as a compressor and expander for the exhaust gases flushing out of the combustion
cylinders. This extra piston-cylinder is also referred to as the Exhaust Cylinder (EXC)
component.

vi
This thesis investigates the performance and gas exchange metrics of the EPTE concept across
a broad engine speed range, and further compares those against a baseline engine which does
not incorporate the EXC component. Gas exchange metrics were evaluated to assess the impact
of the EXC component on the performance of turbocharger and sizing of the muffler and
aftertreatment system. Performance analysis was conducted for the EXC component to
quantify its contribution to the total brake power produced at the crankshaft. The investigation
was performed using the commercial engine performance prediction tool,
GT-PowerTM. Additional outcomes of the study included evaluation of Normalized Brake
Torque (NBT) fluctuation and the hardware modifications in the intake and exhaust side
required while transitioning from baseline engine to EPTE. An evaluation of the EXC
component specifications was also conducted in this thesis to provide an overview of the extra
piston-cylinder from the design standpoint.
The EPTE concept proved to be more fuel efficient while producing higher power output than
the baseline engine at high boost pressure limits. The new concept exhibited disadvantages
from the fuel efficiency and power output standpoint at low boost pressure limits. The concept
proved to also increase the performance of the turbocharger by providing a smoother exhaust
pressure pulse to the turbine across the engine cycle, when compared against the baseline
engine. Furthermore, it had a positive impact on the aftertreatment sizing and flywheel inertia.
Another observation was that the EPTE concept can produce such benefits while not having
the need to radically modify the intake and exhaust geometrical parameters. With a smaller
turbocharger, such an engine proved to be beneficial compared to the baseline engine across
the whole engine operating range.
The thesis project provides a simulation-based system-level perspective of the EPTE concept
which has been patented by Mats Olshammar. Such a system-level perspective will help to gain
an understanding of the operation of the EPTE before commencing any hardware development
initiatives. The report also provides some recommendations for future work, based on the
advantages and disadvantages of the engine concept emanating from the results of the work.

Foreword
We would like to extend our gratitude to Mats Olshammar who served as our technical
supervisor during this thesis project. We feel grateful to have worked under him in such
an interesting proposition. His open mindedness gave us considerable amount of time to
understand the stakeholders’ requirements and potential demands pertaining to the patented
engine concept. His high flexibility in coordination and communication provided us with a
platform where we could contact him during challenging times and receive a fruitful feedback
to meet the project goals.
Wewould also like to thank ourmaster thesis examiner, Andreas Cronhjort, who first introduced
us to the thesis project which Mats Olshammar had proposed. In addition to this, our thesis
examiner continuously supported us with all the administrative aspects directly and indirectly
related to the degree project. His honest feedback during particular stages of the project helped
us to selfreflect on our work, which further improved the overall engineering content of the
simulation approach and thesis report.
Furthermore, we would like to extend our gratitude to the customer support team from Gamma
Technologies that supported us with technical queries related to the software GTPower TM. The
team’s swift assistance provided us with the knowledge required to deploy suitable modelling
choices for striking an optimal balance between computational time and internal validity.
Last but not the least, we would like to thank the ITSupport Team at KTH Royal Institute of
Technology for helping us combat challenges related to system and network related aspects,
and PhD researchers in the Internal Combustion Engine (ICE) division at KTH for providing
us with introductory lessons regarding engine simulations.
Nachiketh Lingachari Acharya & Saurav Dasgupta
Stockholm, September 2021
vii


Table of Contents
List of Abbreviations xiii
List of Figures xv
List of Tables xvii
1 Introduction 11.1 Background . . . . . . . . . . . . . . . . . . . . . . . . . . . . . . . . . . . . 1
1.2 Purpose . . . . . . . . . . . . . . . . . . . . . . . . . . . . . . . . . . . . . . 3
1.3 Research Questions . . . . . . . . . . . . . . . . . . . . . . . . . . . . . . . . 3
1.4 Stakeholders . . . . . . . . . . . . . . . . . . . . . . . . . . . . . . . . . . . . 4
1.5 Limitations and Delimitations . . . . . . . . . . . . . . . . . . . . . . . . . . 4
1.5.1 Limitations . . . . . . . . . . . . . . . . . . . . . . . . . . . . . . . . 5
1.5.2 Delimitations . . . . . . . . . . . . . . . . . . . . . . . . . . . . . . . 5
1.6 Research Approach . . . . . . . . . . . . . . . . . . . . . . . . . . . . . . . . 6
1.7 Outline . . . . . . . . . . . . . . . . . . . . . . . . . . . . . . . . . . . . . . 8
2 FrameofReference 92.1 Fourstroke cycle . . . . . . . . . . . . . . . . . . . . . . . . . . . . . . . . . 9
2.2 Engine Flywheel and Torque Fluctuations . . . . . . . . . . . . . . . . . . . . 11
2.3 Engine Downsizing and Turbocharging . . . . . . . . . . . . . . . . . . . . . 11
2.3.1 Wastegate . . . . . . . . . . . . . . . . . . . . . . . . . . . . . . . . . 12
2.3.2 Intercooler . . . . . . . . . . . . . . . . . . . . . . . . . . . . . . . . 13
2.3.3 Problems related to turbocharging . . . . . . . . . . . . . . . . . . . . 13
2.4 Current Concepts and Technologies . . . . . . . . . . . . . . . . . . . . . . . 14
2.4.1 Twinscroll turbochargers . . . . . . . . . . . . . . . . . . . . . . . . 14
2.4.2 Variable Geometry Turbochargers (VGTs) . . . . . . . . . . . . . . . . 16
2.4.3 ElectricallyAssisted Turbocharger (EAT) . . . . . . . . . . . . . . . . 17
ix

TABLE OF CONTENTS
2.4.4 Miller cycle . . . . . . . . . . . . . . . . . . . . . . . . . . . . . . . . 18
2.4.5 Schmitz fivestroke engine . . . . . . . . . . . . . . . . . . . . . . . . 19
2.5 Exhaust Pistonassisted Turbocharged Engine (EPTE) Concept . . . . . . . . . 21
3 Method & Implementation 253.1 Requirement Specifications . . . . . . . . . . . . . . . . . . . . . . . . . . . . 25
3.2 Introduction to GTPowerTM . . . . . . . . . . . . . . . . . . . . . . . . . . . 26
3.3 Modelling Theory . . . . . . . . . . . . . . . . . . . . . . . . . . . . . . . . . 27
3.3.1 Flow basics . . . . . . . . . . . . . . . . . . . . . . . . . . . . . . . . 27
3.3.2 Friction modelling . . . . . . . . . . . . . . . . . . . . . . . . . . . . 28
3.3.3 Heat transfer modelling . . . . . . . . . . . . . . . . . . . . . . . . . . 30
3.3.4 Combustion modelling . . . . . . . . . . . . . . . . . . . . . . . . . . 31
3.3.5 Fuel injection . . . . . . . . . . . . . . . . . . . . . . . . . . . . . . . 34
3.4 Model Generation . . . . . . . . . . . . . . . . . . . . . . . . . . . . . . . . . 35
3.4.1 Baseline engine model . . . . . . . . . . . . . . . . . . . . . . . . . . 35
3.4.2 EPTE model . . . . . . . . . . . . . . . . . . . . . . . . . . . . . . . 40
3.5 Model Optimization . . . . . . . . . . . . . . . . . . . . . . . . . . . . . . . . 42
3.5.1 Optimization approach . . . . . . . . . . . . . . . . . . . . . . . . . . 42
3.5.2 Baseline engine model optimization . . . . . . . . . . . . . . . . . . . 44
3.5.3 EPTE model optimization . . . . . . . . . . . . . . . . . . . . . . . . 45
3.5.4 Model evaluation . . . . . . . . . . . . . . . . . . . . . . . . . . . . . 46
4 Results 494.1 Performance Metrics . . . . . . . . . . . . . . . . . . . . . . . . . . . . . . . 49
4.1.1 Brake Specific Fuel Consumption (BSFC) . . . . . . . . . . . . . . . . 49
4.1.2 Brake Power (BP) . . . . . . . . . . . . . . . . . . . . . . . . . . . . 51
4.2 Gas Exchange Metrics . . . . . . . . . . . . . . . . . . . . . . . . . . . . . . 53
4.2.1 Crankresolved pressure before turbine . . . . . . . . . . . . . . . . . 53
4.2.2 Crankresolved pressure after turbine . . . . . . . . . . . . . . . . . . 55
4.3 Exhaust Cylinder (EXC) Contribution to Total BP . . . . . . . . . . . . . . . . 56
4.4 Predicted Hardware Modifications . . . . . . . . . . . . . . . . . . . . . . . . 59
4.4.1 Intake side . . . . . . . . . . . . . . . . . . . . . . . . . . . . . . . . 59
4.4.2 Exhaust side . . . . . . . . . . . . . . . . . . . . . . . . . . . . . . . 61
4.5 Normalized Brake Torque . . . . . . . . . . . . . . . . . . . . . . . . . . . . . 62
x

TABLE OF CONTENTS
5 Conclusions 655.1 Discussion . . . . . . . . . . . . . . . . . . . . . . . . . . . . . . . . . . . . . 65
5.1.1 Fuel economy . . . . . . . . . . . . . . . . . . . . . . . . . . . . . . . 65
5.1.2 Power output and EXC’s contribution to brake power . . . . . . . . . . 65
5.1.3 Impact on turbocharger efficiency . . . . . . . . . . . . . . . . . . . . 66
5.1.4 Impact on muffler and aftertreatment sizing . . . . . . . . . . . . . . . 66
5.1.5 Hardware modifications . . . . . . . . . . . . . . . . . . . . . . . . . 66
5.1.6 Impact on flywheel inertia . . . . . . . . . . . . . . . . . . . . . . . . 67
5.2 Recommendations . . . . . . . . . . . . . . . . . . . . . . . . . . . . . . . . . 67
References 69
Appendices I
A GTPowerTM Modelling IA.1 Modelling Theory . . . . . . . . . . . . . . . . . . . . . . . . . . . . . . . . . I
A.2 Baseline engine & EPTE models Enlarged view . . . . . . . . . . . . . . . . III
B Miscellaneous Results VB.1 EXC Specifications Post Optimization . . . . . . . . . . . . . . . . . . . . . V
B.2 Design of Experiments (DOE) . . . . . . . . . . . . . . . . . . . . . . . . . . VII
xi


List of Abbreviations
BP Brake Power
DOE Design of Experiments
IDO Integrated Design Optimizer
SI SparkIgnition
CI CompressionIgnition
EGR Exhaust Gas Recirculation
TDC TopDeadCenter
VGTs Variable Geometry Turbochargers
BDC BottomDeadCenter
RPM Revolutions Per Minute
EIVC Early Inlet Valve Closing
LIVC Late Inlet Valve Closing
VVT Variable Valve Timing
IVC Inlet Valve Closing
EPA Environmental Protection Agency
BMEP Brake Mean Effective Pressure
EFIS Electric Forced Induction System
EAT ElectricallyAssisted Turbocharger
LP LowPressure
HP HighPressure
CAD Crank Angle Degrees
EEVC Early Exhaust Valve Closing
LEVC Late Exhaust Valve Closing
EXC Exhaust Cylinder
EPTE Exhaust Pistonassisted
Turbocharged Engine
OEMs Original Equipment Manufacturers
ICE Internal Combustion Engine
BSFC Brake Specific Fuel Consumption
CMAES Covariance Matrix Adaptation
Evolution Strategy
PV PressureVolume
PFI Port Fuel Injected
FMEP Friction Mean Effective Pressure
SOC Start Of Combustion
TDCF TopDeadCenter Firing
xiii


List of Figures
1 EPTE model creation in GTPowerTM . . . . . . . . . . . . . . . . . . . . . . 6
2 Overview of thesis method . . . . . . . . . . . . . . . . . . . . . . . . . . . . 7
3 Fourstroke operating cycle [16] . . . . . . . . . . . . . . . . . . . . . . . . . 10
4 Turbocharged engine setup [4] . . . . . . . . . . . . . . . . . . . . . . . . . . 12
5 Exhaust gas pressure wave [36] . . . . . . . . . . . . . . . . . . . . . . . . . . 14
6 Twinscroll turbocharger in a 4cylinder engine [36] . . . . . . . . . . . . . . . 15
7 Crosssectional view and functions of VGT [7] . . . . . . . . . . . . . . . . . 16
8 Schematic diagram of EAT [2] . . . . . . . . . . . . . . . . . . . . . . . . . . 17
9 Fivestroke engine setup [31] . . . . . . . . . . . . . . . . . . . . . . . . . . . 20
10 Layout: 2 combustion cylinders + 1 EXC. [27] . . . . . . . . . . . . . . . . . 22
11 Exhaust pressure waves from a fourstroke engine with 2 combustion cylinders
and no EXC [27] . . . . . . . . . . . . . . . . . . . . . . . . . . . . . . . . . 22
12 Exhaust pressure waves from a fourstroke engine with 2 combustion cylinders
+ 1 EXC [27] . . . . . . . . . . . . . . . . . . . . . . . . . . . . . . . . . . . 24
13 Combined exhaust pressure waves from a fourstroke engine with 2 combustion
cylinders + 1 EXC [27] . . . . . . . . . . . . . . . . . . . . . . . . . . . . . . 24
14 Baseline Engine Model . . . . . . . . . . . . . . . . . . . . . . . . . . . . . . 36
15 EPTE model . . . . . . . . . . . . . . . . . . . . . . . . . . . . . . . . . . . . 41
16 Change in BSFC v/s Engine Speed @ different boost pressure limits . . . . . . 50
17 Change in BP v/s Engine Speed @ different boost pressure limits . . . . . . . . 52
18 Crankresolved pressure before turbine Baseline engine and EPTE (Olshammar) 54
19 Crankresolved pressure after turbine Baseline engine and EPTE (Olshammar) 55
20 EXC Contribution in BP v/s Engine Speed @ different boost pressure limits . . 57
21 PressureVolume (PV) trace in EXC at 3.5 bar boost pressure limit . . . . . . . 58
22 Change in Intake Runner Length v/s Boost Pressure Limit . . . . . . . . . . . 60
xv

LIST OF FIGURES
23 Change in Intake Runner Diameter v/s Boost Pressure Limit . . . . . . . . . . 60
24 Change in Exhaust Dimensions v/s Boost Pressure Limit . . . . . . . . . . . . 61
25 Comparison of CrankResolved Normalized Brake Torque . . . . . . . . . . . 63
26 FlowSplitTRight object [11] . . . . . . . . . . . . . . . . . . . . . . . . . . . II
27 Baseline Engine Model Enlarged View . . . . . . . . . . . . . . . . . . . . . III
28 EPTE model Enlarged View . . . . . . . . . . . . . . . . . . . . . . . . . . . IV
29 EXC Component in GTPowerTM . . . . . . . . . . . . . . . . . . . . . . . . . V
30 EXC Specifications Post Optimization . . . . . . . . . . . . . . . . . . . . . VI
31 DOE Plots for BP Turbine Orifice Diameter & Max. Allowable Boost
Pressure . . . . . . . . . . . . . . . . . . . . . . . . . . . . . . . . . . . . . . VIII
32 DOE Plots for BSFC Turbine Orifice Diameter & Max. Allowable Boost
Pressure . . . . . . . . . . . . . . . . . . . . . . . . . . . . . . . . . . . . . . VIII
xvi

List of Tables
1 EngineFrictionCF object specifications . . . . . . . . . . . . . . . . . . . . . 30
2 EngCylCombSIWiebe object specifications . . . . . . . . . . . . . . . . . . . . 33
3 InjAFSeqConn object specifications . . . . . . . . . . . . . . . . . . . . . . . 34
4 Fundamental specifications of Baseline engine model . . . . . . . . . . . . . . 36
5 Initial fluid state specifications . . . . . . . . . . . . . . . . . . . . . . . . . . 37
6 Thermocouple reference object specifications . . . . . . . . . . . . . . . . . . 38
7 TurbineSimple template specifications . . . . . . . . . . . . . . . . . . . . . . 39
8 CompressorSimple template specifications . . . . . . . . . . . . . . . . . . . . 39
9 Specifications of intercooler component . . . . . . . . . . . . . . . . . . . . . 40
10 Specifications of genetic algorithm . . . . . . . . . . . . . . . . . . . . . . . . 43
11 Engine variables optimized for baseline engine model . . . . . . . . . . . . . . 45
12 Engine variables optimized for EPTE model . . . . . . . . . . . . . . . . . . . 46
xvii


Chapter 1
Introduction
This chapter includes the background of the project, research questions identified, purpose,
stakeholders involved, delimitations and limitations, research approach adopted and the outline
of the thesis report.
1.1 Background
This master thesis project has been performed in collaboration with Olshammar Nebula AB
and KTH Royal Institute of Technology. Olshammar Nebula AB is a patent holding company
owned by Mats Olshammar, a Swedish inventor. The inventor applied for a patent for his
proposed engine concept in 2018, which got approved a year later. The engine concept was
proposed based on the motive of increasing the fuel efficiency and performance of turbocharged
engines. The concept engine has been predominantly named after the inventor as ”Olshammar
Engine” [27]. However, to facilitate the ease of scientific understanding and disseminating
technical knowhow of the concept, it will be referred as Exhaust Pistonassisted Turbocharged
Engine (EPTE) in the remaining portion of the document. The engine concept advocates the
usage of an extra cylinder in addition to the firing combustion cylinders. The extra cylinder is
also referred as exhaust cylinder, since it uses the exhaust gases emanating from the combustion
cylinders. This cylinder has no valves and has no combustion inside. Further details and
features of the engine concept are described in section 2.5.
The transport industry has been witnessing an increase in the stringency of emission
norms which requires effective emission reduction technologies across the product portfolio.
Furthermore, it is incumbent on vehicle manufacturers and Original Equipment Manufacturers
1

CHAPTER 1. INTRODUCTION
(OEMs) to meet customer demands within the aspects of fuel efficiency and performance.
Turbocharging has been a fruitful technology strategy for achieving these objectives for both
nonhybrid and hybrid engines over a long period of time. However, there are various
substrategies existing under turbocharging depending upon the application and operating
characteristics of the vehicle segment [35].
Turbocharging in general, also comes with certain downsides. These limitations have been
explained in detail in subsection 2.3.3. It points out that there is a tradeoff between the best
operating regions in small and largesized turbochargers. At the low Revolutions Per Minute
(RPM), smaller turbos are more efficient compared to larger turbos. On the other hand, large
turbos aremore efficient at the higher RPM. Electricallyassisted turbos andVGTs are strategies
used under turbocharging to combat the above problem. However, some problems related to
electricallyassisted turbochargers are system complexity and extra energy requirement in the
battery pack [27]. VGTs are promising when it comes to tackling the aforementioned challenge
but are more sensitive to higher exhaust temperatures [7] [27]. It has been pointed out that the
variable nozzles are sensitive to higher temperatures, thus affecting reliability and endurance
negatively [7]. With the need for hybridization of powertrains, manufacturers are also keeping
an eye on turbocharged engines with fewer cylinders. In the patent [27], it has been pointed out
that engines with fewer cylinders have uneven exhaust. This means that the exhaust pressure
has high variation with time and thus has a less ability to provide high continuous exhaust
pressure to the turbocharger inlet, when compared to engines with more cylinders. Twinscroll
turbochargers are typically deployed to combat this issue by reducing the pressure interference
between the cylinders. In such a technical solution, two separate exhaust manifolds are used to
drive the exhaust gases to the turbine inlet. Thus, higher pressure waves enter the turbocharger
across the engine cycle. From the cost of manufacturing perspective, it is relatively more
expensive to produce and package compared to singlescroll turbochargers, due to its higher
machining complexity [36].
The EPTE concept earlier mentioned in this subsection has been conceived and formulated
with the intention to provide a technical solution to the aforementioned challenges with respect
to turbocharging, and to also offer higher expansion ratio relative to compression ratio, with
a solution that does not add complexity and pumping losses. To bring such solutions into the
market, it is vital for anymanufacturer to gain an overall sense of the system performance before
building prototypes and hardware components. This requires product development based on
simulation approaches to predict the holistic impact of the system in environments which would
replicate the operating conditions. This forms the core foundation of the thesis work.
2

CHAPTER 1. INTRODUCTION
1.2 Purpose
The purpose of this thesis work is to realize the technical potential of the EPTE concept.
The assessment process of technical potential is based on analyzing the turbocharged ICE
performance and some critical gas exchange parameters in the exhaust side using a commercial
engine simulation software, GTPowerTM. This software is developed and sold by Gamma
Technologies. The technical potential of the EPTE concept is measured against a turbocharged
baseline engine, which does not have the exhaust cylinder component. All other components
and geometrical aspects of the baseline engine are the same as the EPTE concept.
In the context of the thesis work, performance analysis refers to assessment of Brake Specific
Fuel Consumption (BSFC) and Brake Power (BP) of both the engines, whereas the gas
exchange parameters refer to the pressure variation before and after the turbine component.
A side objective was to analyze the percentage of total BP contributed by the exhaust cylinder
component in the EPTE concept.
Serving the above purpose will help the relevant stakeholders to have a systemlevel view of the
engine concept before beginning any prototype building activity during the predevelopment
process. The relevant stakeholders have been highlighted in subsection 1.4.
1.3 Research Questions
Before beginning the thesis work, a literature study was performed connected to the assessment
study. This part is discussed in detail in Chapter 2. Based on the literature analysis, research
questions were formulated to devise the project roadmap. The research questions ultimately
relate to the overall purpose of the thesis work. These are framed below:
1. What is the EPTE concept and what theoretical benefits does it provide compared to
the conventional turbocharged ICE topology? Note that conventional turbocharged ICE
represents the topology without the extra cylinder component.
2. How should the sizing and modelling of the exhaust cylinder be performed in a
commercial engine simulation software and what input conditions does it require?
3. By what percentage is the EPTE better than the conventional turbocharged ICE topology
within the aspects of BSFC and BP, at different intake boost pressure limits?
3

CHAPTER 1. INTRODUCTION
4. What percentage of the total brake power produced at the crankshaft is contributed by
the exhaust cylinder in the EPTE?
5. How does the crankresolved exhaust pressure vary for both the engines, before and after
the turbine?
6. What are the hardware modifications in the intake and exhaust side required for the EPTE
model to produce the benefits from the performance metrics standpoint, when compared
to the baseline engine?
7. What impact do the baseline engine and EPTE models have on the flywheel weight and
sizing?
1.4 Stakeholders
The stakeholders related to this thesis work are envisioned as the individuals and relevant groups
who have interest in the outcome of the thesis project. These individuals and groups are directly
or indirectly affected by the findings of this work. In this context, the relevant stakeholders are
listed as follows:
1. Internal stakeholder : Mats Olshammar, the inventor behind the patented concept [27]
and his company Olshammar Nebula AB which is the owner of the patent.
2. External stakeholders : OEMs and vehicle manufacturers, which can develop, adopt and
commercialize the engine concept. OEMs could be suppliers of holistic engine systems
or producers of engine hardware components like turbochargers etc.
1.5 Limitations and Delimitations
This section includes the limitations and delimitations related to the thesis project. Limitations
are influences that the researcher or the thesis worker does not have control over. On the other
hand, delimitations refer to the choices made by the researcher in a project. Delimitations
represent the boundaries of any scientific or engineering work performed. The delimitations
were decided based on a mutual agreement between the thesis workers and the internal
stakeholder involved. This decision was based on the purpose and the goals of the assessment
study.
4

CHAPTER 1. INTRODUCTION
1.5.1 Limitations
1. The simulationbased assessment is bounded by the software limitations of GTPowerTM.
GTPower TM is a simulation tool widely used in the transport industry for predicting
performance of complete engine systems. It is a onedimensional flow solver which
accounts for the flow, heat transfer and friction effects in the engine [38]. The flow
parameters are considered as uniform in the crosssection of the components, whereas
realistically the flow field is nonuniform in the crosssections.
2. The software allows only one crankshaft component in an engine model. This limitation
leads to a delimitation which is described in subsection 1.5.2.
1.5.2 Delimitations
1. Due to the software limitation of allowing not more than one crankshaft in the engine
model, the thesis work was restricted to the (2+1) setup ideated in the patent [27]. The
patent also advocates different topologies such as the (3+1) and the (4+1) setup, which
require two separate crankshafts, one for the firing combustion cylinders and other one
for the exhaust cylinder . The (2+1) setup represents two combustion cylinders and one
exhaust cylinder. The same representation applies for both the (3+1) and (4+1) setup.
2. The assessment study in the thesis scope does not include the comparison of the baseline
engine and the EPTE from the exhaust emissions standpoint, as it does not form a part of
the core purpose as per section 1.2.
3. Knocking phenomena was not investigated in the assessment study, as it does not form a
part of the core purpose.
4. The engine models were simulated in steadystate conditions for having a reasonable
balance between internal validity and computational power.
5. The baseline engine and EPTE models were modelled as SparkIgnition (SI) engines
running on gasoline fuel.
6. For turbocharger modelling, TurbineSimple and CompressorSimple models were
used from the software library, for both the baseline engine and EPTE concept.
These models are generally used in the absence of turbocharger maps from
manufacturers, and when new charging concepts or turbocharger matching is required
for an engine. There were no turbocharger maps available from any manufacturer
5

CHAPTER 1. INTRODUCTION
during the thesis work, which motivates for such a choice. However, such a
modelling simplification also provides a detailed analysis of the gas exchange system
and its interaction with the engine combustion system. More specific details of the
TurbineSimple and CompressorSimple models have been described in chapter 3.
7. The analysis conducted was purely based on the results emanating from the simulation
study. Therefore, it does not encapsulate results from experiments or prototype testing.
However, the main purpose of the thesis work was to gain an overall sense of the
performance of EPTE using a commercial engine simulation tool, before commencing
hardware development activities for the concept.
1.6 Research Approach
This section gives a brief description of the research methodology adopted for the thesis work.
It summarizes the approach used for creating the EPTE model in GTPowerTM. In addition
to this, it also gives an overview of the simulationbased concept assessment study procedure.
Figure 1 shows the process by which the EPTE model was devised in the software. Figure 2
depicts the methodology overview related to the thesis work.
Figure 1: EPTE model creation in GTPowerTM
A preexisting inline 4cylinder naturally aspirated SI engine model was imported from the
examples library in GTPowerTM. This naturally aspirated 4cylinder engine was converted
to a 2cylinder engine by removing 2 cylinders and the relevant pipe connections attached to
it. The 2cylinder engine was then integrated with a turbocharger using TurbineSimple and
CompressorSimple models from the template library. Finally, this represented the baseline
engine model. Figure 1 shows that the EPTE model was created by adding an exhaust
6

CHAPTER 1. INTRODUCTION
cylinder component to the baseline engine. In the context of GTPowerTM, the exhaust cylinder
component is called as PistonCylinder w/o combustion. This component is available in the
template library and it acts as a reciprocating compressorexpander. It should be noted that the
exhaust cylinder incorporated in the EPTEmodel does not have any inlet or outlet valves. More
specific details of the exhaust cylinder component used in the engine model are explained in
chapter 3.
After both the engine models were created, some DOE studies were run to gain insights into a
common range of engine variables which gave sweet spot for the engine models from a BSFC
and BP standpoint. The engine variables under consideration were some critical intake and
exhaust parameters. This range for different engine variables were then used for optimizing
both the engine models in the Integrated Design Optimizer (IDO), a dedicated optimization
tool within GTPowerTM. The optimized engine models were then used for comparison of
performance and gas exchange parameters. This whole process is depicted in figure 2. More
specific details about the engine variables and the optimization approach are explained in
chapter 3.
Figure 2: Overview of thesis method
7

CHAPTER 1. INTRODUCTION
1.7 Outline
This section describes the content of individual chapters related to the thesis report.
• In chapter 1, the background information of the thesis is described to provide an overall
sense of the project scope and purpose.
• In chapter 2, a systematic literature review as a frameofreference is conducted. This
particular chapter provides a general view of turbocharging in ICE, its drawbacks and
currently available subtechnologies under turbocharging in the market. Information
regarding overexpanded cycles is provided before the EPTE concept is explained in
detail.
• In chapter 3, the method and implementation approach incorporated across the
simulationbased assessment is explained. It discusses some prominent features of the
software GTPowerTM, which are most critical to the modelling of baseline engine and
EPTE.
• In chapter 4, the results are analyzed, comparing the performance and gas exchange
metrics of both the engines models.
• In chapter 5, the results are consolidated in such a way that it provides a systematic
picture to the reader on how the answers to the research questions were delivered.
It also provides some recommendations which would foster the development process
of the EPTE concept.
8

Chapter 2
FrameofReference
In this chapter, a systematic review is provided of the literature, which helped to perform the
thesis work holistically. It covers all relevant engineering aspects pertaining to the concept and
provides a theoretical foundation on which the rest of the tasks were performed.
2.1 Fourstroke cycle
The ICEs under consideration in this thesis are sparkignition (SI) engines (sometimes called
Otto engines, or gasoline or petrol engines, though other fuels can be used). A French patent
filed in 1862 to Alphonse Beau de Rochas outlined the fundamentals of fourstroke cycle [17].
Reciprocating engines are those where pistons travel back and forth in the cylinder. It transmits
power from high pressure and high temperature burnt gases within the cylinder to a drive shaft
via the piston, connecting rod, and crank mechanism. The fourstroke cycle is widely employed
in reciprocating engines. To complete one cycle of operation, each cylinder takes four piston
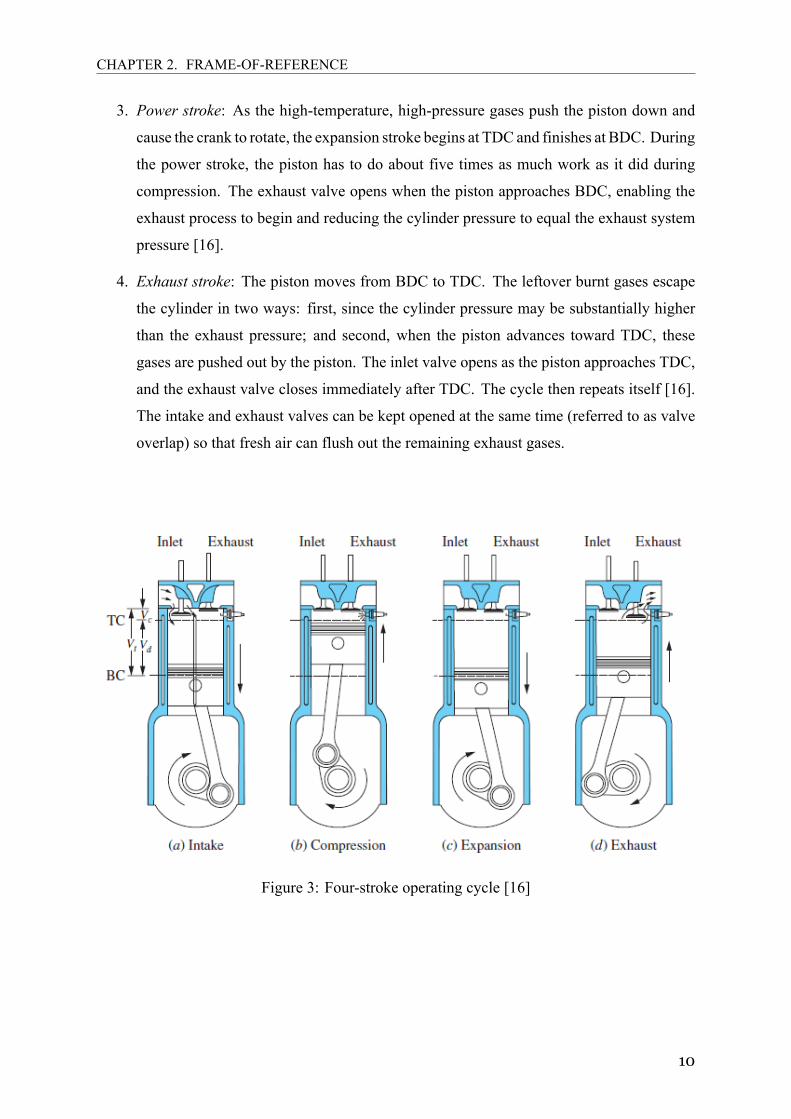
strokes (2 crankshaft rotations) [16]. Four strokes are as shown in figure 3.
1. Intake stroke: It begins at TopDeadCenter (TDC) and ends at BottomDeadCenter
(BDC), pulling new air or a fuelair combination into the cylinder. The intake valve
opens just before the stroke begins and closes just after it stops to enhance the mass
introduced [16].
2. Compression Stroke: When the piston is at BDC, the compression stroke begins and
finishes at TDC, when the airfuel mixture is compressed to a small fraction of its original
volume. Combustion begins at the end of the compression stroke, and the cylinder
pressure rises rapidly [16].
9
CHAPTER 2. FRAMEOFREFERENCE
3. Power stroke: As the hightemperature, highpressure gases push the piston down and
cause the crank to rotate, the expansion stroke begins at TDC and finishes at BDC. During
the power stroke, the piston has to do about five times as much work as it did during
compression. The exhaust valve opens when the piston approaches BDC, enabling the
exhaust process to begin and reducing the cylinder pressure to equal the exhaust system
pressure [16].
4. Exhaust stroke: The piston moves from BDC to TDC. The leftover burnt gases escape
the cylinder in two ways: first, since the cylinder pressure may be substantially higher
than the exhaust pressure; and second, when the piston advances toward TDC, these
gases are pushed out by the piston. The inlet valve opens as the piston approaches TDC,
and the exhaust valve closes immediately after TDC. The cycle then repeats itself [16].
The intake and exhaust valves can be kept opened at the same time (referred to as valve
overlap) so that fresh air can flush out the remaining exhaust gases.
Figure 3: Fourstroke operating cycle [16]
10

CHAPTER 2. FRAMEOFREFERENCE
2.2 Engine Flywheel and Torque Fluctuations
A flywheel is an energy storage device which absorbs and stores energy when the supply is
more than the requirement. It then releases the stored energy when the energy required exceeds
the supply [29]. In the context of an ICE, energy is produced during the power stroke but it runs
throughout the engine cycle covering all strokes. This is achieved with the help of a flywheel.
Apart from this functionality, flywheels are also used for providing ring gear attachment for
starter motors and facilitating the integration of the transmission via clutch.
Two important aspects related to an ICE operation are the instantaneous angular velocity and
torque. These parameters directly affect the combustion efficiency, power and vibrations of
the combustion engine [34]. The torque and the angular velocity are intermittent across the
whole engine cycle. The gas pressure inside the combustion cylinders fluctuates throughout
the cycle, thereby contributing to torque fluctuation. The acceleration and deceleration of the
piston assembly contributes to the fluctuation in angular velocity [29] [34]. These combined
fluctuations lead to a fluctuation in the turning moment produced at the crankshaft. Adding
more combustion cylinders in such a system can help tackling such an issue only to a certain
extent. Therefore, flywheels are necessary to offset this challenge of fluctuating torque levels
across the whole engine cycle. Having such a component helps the engine to produce a
relatively smoother torque across the whole engine cycle. According to engine theory [29],
the inertia of the flywheel attached to the crankshaft is directly proportional to the fluctuation
in torque. Therefore, an ICE with higher torque fluctuation would need a relatively heavier and
larger flywheel i.e. with higher moment of inertia.
2.3 Engine Downsizing and Turbocharging
Automobile powertrains must become more efficient in order to meet stricter emission and
fuel economy regulations. To meet the requirements, manufacturers are converting naturally
aspirated engines into boosted engines with smaller displacements. This method is referred to
as ‘engine downsizing’. The average engine load is higher, and an increased average efficiency
is achieved by substituting with a smaller engine. When a combustion engine is subjected to
high loads, its efficiency is at its peak [19]. The use of forced induction compensates for the
lower power output caused by the smaller engine displacement. The most common type of
forced induction system is the turbocharger system. It comprises of a compressor and a turbine
linked by a single shaft. The turbine recovers the engine’s leftover exhaust energy, which is then
11
CHAPTER 2. FRAMEOFREFERENCE
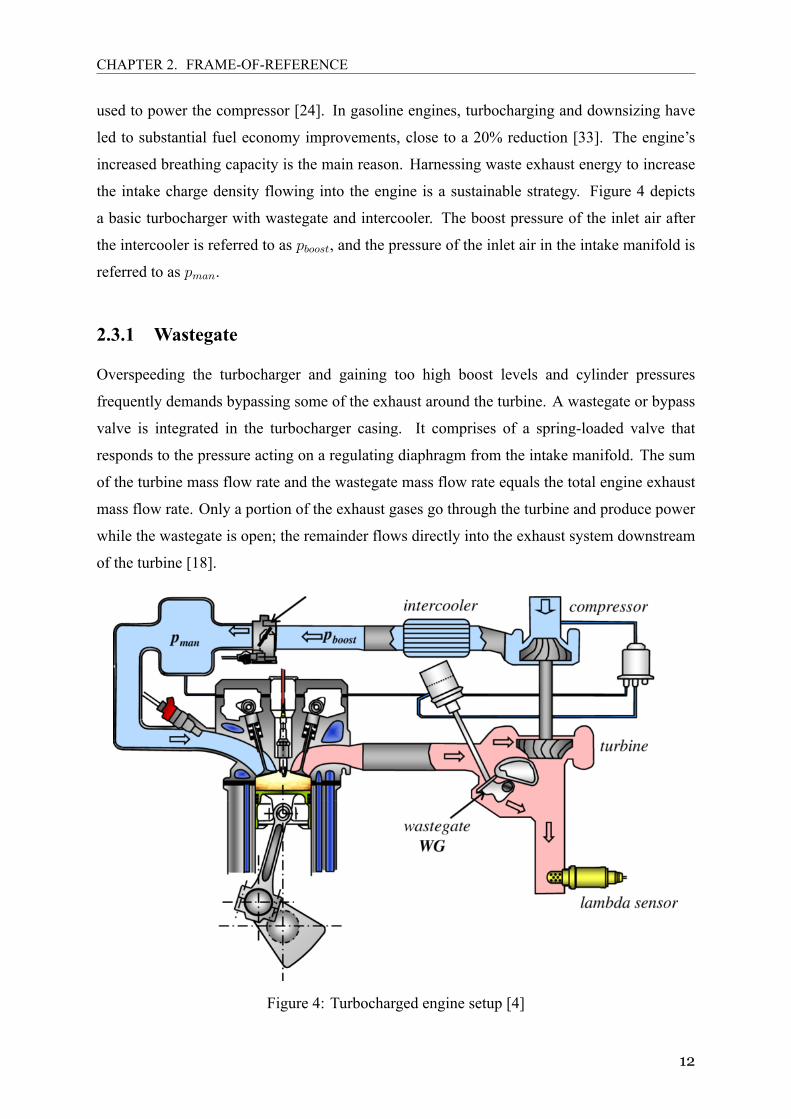
used to power the compressor [24]. In gasoline engines, turbocharging and downsizing have
led to substantial fuel economy improvements, close to a 20% reduction [33]. The engine’s
increased breathing capacity is the main reason. Harnessing waste exhaust energy to increase
the intake charge density flowing into the engine is a sustainable strategy. Figure 4 depicts
a basic turbocharger with wastegate and intercooler. The boost pressure of the inlet air after
the intercooler is referred to as pboost, and the pressure of the inlet air in the intake manifold is
referred to as pman.
2.3.1 Wastegate
Overspeeding the turbocharger and gaining too high boost levels and cylinder pressures
frequently demands bypassing some of the exhaust around the turbine. A wastegate or bypass
valve is integrated in the turbocharger casing. It comprises of a springloaded valve that
responds to the pressure acting on a regulating diaphragm from the intake manifold. The sum
of the turbine mass flow rate and the wastegate mass flow rate equals the total engine exhaust
mass flow rate. Only a portion of the exhaust gases go through the turbine and produce power
while the wastegate is open; the remainder flows directly into the exhaust system downstream
of the turbine [18].
Figure 4: Turbocharged engine setup [4]
12
CHAPTER 2. FRAMEOFREFERENCE
2.3.2 Intercooler
After compression, just before gas enters the cylinder, charge cooling with a heat exchanger
(also referred as an intercooler) is widely used to lower the temperature of the air. Consequently
the inlet air density increases. Typically, an intercooler is installed between the compressor
and the engine’s intake manifold. By lowering the temperature of the air coming out of the
compressor outlet, incylinder knocking can be reduced [18].
2.3.3 Problems related to turbocharging
Apart from enhancing the volumetric efficiency of an ICE, turbocharging presents a number of
challenges. For starters, there is a compromise between ideal operating zones with small and
big turbochargers.
Small turbochargers, for example, perform better at low engine speeds than high engine speeds.
Small turbos may spool up faster at low engine RPM, due to the decreased inertia of the turbine
and higher pressure in the smaller orifice. Because of the faster spooling, the turbocharger
may reach a suitable boost pressure ratio at low engine RPM. At high engine RPM, the
massive quantity of exhaust gas might cause mechanical failure in the smaller turbine wheel
and compressor choking. High exhaust mass flow into a smaller turbine could also lead to
high engine backpressures. High backpressures can lead to more pumping losses and thereby
further efficiency reduction [36].
On the other hand, big turbos have promising efficiencies at high engine RPM but not at low
RPM [27]. This is because at low RPM, the exhaust flow pressure is not sufficient to provide
enough boost to start spinning the turbocharger. The minimum engine speed required for the
turbocharger to spool up is called the boost threshold. For this reason, it is vital to match a
suitable turbocharger with the engine.
The exhaust flow from the cylinder is not uniform and exhaust gas pressure peaks are formed
(peg) which is indicated by figure 5 in the following page. Pressure wave travels through the
exhaust manifold causing a pressure drop after peg. This pressure can drop below the turbine
inlet pressure (pt) [36].
13

CHAPTER 2. FRAMEOFREFERENCE
Figure 5: Exhaust gas pressure wave [36]
The exhaust process in the ICE is characterized by 3 phases [36]:
1. Blowdown phase (period between exhaust valve opening and TDC)
2. Backward displacement stroke
3. The scavenging phase (valve overlap)
2.4 Current Concepts and Technologies
In this section, commercial technological solutions currently available related to turbocharging
and overexpanded cyclebased concepts have been discussed from a holistic standpoint, which
form a foundation for the EPTE concept. This is because the EPTE concept is claimed to
increase the efficiency of the turbocharger and contribute to the overexpansion of gas due to
the presence of an EXC [27].
2.4.1 Twinscroll turbochargers
Single and twinscroll turbochargers are generally two approaches towards turbocharging
strategy. ‘Scroll’ refers to the turbine housing (or turbine manifold, or volute) that connects
between exhaust manifold and the turbine rotor.
Singlescroll turbochargers use a common exhaust manifold for all cylinders, as stated by [36].
Each cylinder’s exhaust ports are linked to a collector, which is a shared volume. As a result,
before reaching the turbine, the exhaust gas pressure waves from each cylinder interact and
reduce the pressure peaks. This technique guarantees a steady pressure continuous flow to the
14

CHAPTER 2. FRAMEOFREFERENCE
turbine rotor, but the pressure dampening results in a loss of usable exhaust gas energy [28].
The singlescroll turbocharger provides cost effective, easy to produce and good performance
at increased exhaust gas flow. But it suffers in performance at low to medium RPM and engine
loads [36]. The back pressure increases in multicylinder engines resulting in low scavenging
and consequently, diluting the intake charge which affects engine performance.
By integrating different exhaust manifolds from the cylinder exhaust ports, the twinscroll
turbocharger approach helps to prevent this issue. This system features a split turbine housing
and a well designed exhaust manifold that couples the appropriate cylinders to direct exhaust
gases into each scroll separately [8]. The turbine housing (or volute) is divided meridionally
into two scrolls and each inlet feeds the entire turbine rotor circumference. This design saves
energy from exhaust gas and improves cylinder gas exchange [30]. The firing order of a four
cylinder engine is usually 1342. The exhaust channels from the two pairs of cylinders are
linked to the turbine via separate scrolls of various diameters, as shown in figure 6 and explained
by [36]. The wider channel A, which connects cylinders 2 and 3, guides one exhaust stream
to the turbine blades’ outer edge, allowing the turbocharger to spin quicker. The narrower
channel B connecting cylinder 1 and 4 guides the other exhaust stream onto the inner surfaces of
the turbine blades and therefore improves the turbocharger responsiveness during the engine’s
transient operation.
Figure 6: Twinscroll turbocharger in a 4cylinder engine [36]
15

CHAPTER 2. FRAMEOFREFERENCE
This configuration of twinscroll turbocharger offers excellent lowend torque as well as better
highend power. Along with this, it also offers better engine scavenging due to reduced back
pressure and noninteraction of exhaust pulses, reduced engine pumping loss, increased turbine
efficiency and lower fuel consumption [8]. But twinscroll turbochargers are more complex in
design due to smaller exhaust runners compared to a singlescroll turbocharger. This complexity
leads to higher manufacturing costs of the exhaust manifold and turbine casing for a twin
scroll turbocharger [36]. During unequal admission (different exhaust mass flow rate in the two
turbine scrolls) or partial admission (exhaust mass flow in only one scroll), efficiency of the
turbocharger can be reduced due to cross flow between the two turbine scrolls, especially if the
turbine has unequal volute geometries [37]. Due to additional exhaust manifolds, the system
will also require additional wastegate and dumptube which results in a bulkier turbocharger,
which creates a negative effect to engine compactness.
2.4.2 Variable Geometry Turbochargers (VGTs)
VGTs have emerged as a potential commercial option as the demand increases for optimal
turbocharger efficiency throughout the operating range. A variable nozzle area control
mechanism is included in this system, which aids in maintaining adequate levels of
turbocharging efficiency at all RPM [7]. Figure 7 depicts a crosssectional view of the
technology and the operating mechanism at low and high engine speeds.
Figure 7: Crosssectional view and functions of VGT [7]
A correctly tuned engine with variable nozzle guarantees that the exhaustpressure increases at
low RPM and drops at higher RPM, as described in figure 7. The closing and opening of the
nozzle is assisted by an actuator. However, Ebisu et al. [7] highlighted certain technological
16

CHAPTER 2. FRAMEOFREFERENCE
problems with VGTs, based on a technical report by Mitsubishi Heavy Industries. Regulating
the variable nozzle geometry is difficult because fluctuating exhaust pressure can cause
preignition and knocking issues within the combustion cylinder. This is especially problematic
in gasoline engines, as higher boost pressure can cause hotspots inside the cylinder [7].
In addition, gasoline engines produce greater exhaust temperatures than diesel engines.
This raises the expense of developing a variable nozzle turbine for gasoline engines since
hightemperature resistant materials are required. An Exhaust Gas Recirculation (EGR) would
counter this issue, but the complexity of the system increases.
2.4.3 ElectricallyAssisted Turbocharger (EAT)
The only power source for the turbochargers are the exhaust gases. This topology is subject
to poor mechanical responsiveness and low efficiency. This is typical when the engine
speed is low, as noted by Bumby et al. [2]. This holds true even with the addition of the
twinscroll turbochargers andVGTs described in subsections 2.4.1 and 2.4.2. The electrification
of turbochargers is a solution to the above. This system is also known as the Electric Forced
Induction System (EFIS). Some advantages of EFIS over nonelectrified systems are:
• higher transient response (reduced turbo lag),
• increased engine output power,
• energy regenerative capability,
• applicable to fuel cell vehicles [22].
There are different EFIS topologies, but the topology of interest is the EAT. This topology is
shown in figure 8.
Figure 8: Schematic diagram of EAT [2]
17

CHAPTER 2. FRAMEOFREFERENCE
According to Bumby et al. [2], a highspeed electric machine is linked between the turbine and
the compressor. At low RPM, the electric machine acts as a motor, giving more torque to the
compressor. This results in higher boost pressure and faster transient response. The electric
machine creates power at higher RPM, which may be stored in a battery. It can also limit the
turbine speed. But this may result in a significant back pressure in the engine, cancelling the
energy recovered from exhaust gases [2, 5].
Bumby et al. [2] also highlighted the advantages and disadvantages of EAT. Improved
boosting at low RPM, selfsensing capability of the electric machine rotor position, motoring
and generating capabilities, and the requirement of electric components with lower power
output, which implies cheaper cost, are all benefits of this topology [21]. Reducing the
hightemperature effect on the electric machine when the machine is located within the
turbocharger is a difficulty with this topology. Switched reluctance machines, Induction
machines or fluxswitching permanent magnet machines can be utilized for this topology since
they are more suitable for hightemperature operation and thermal management than surface
permanent magnet machines. However, significant switching losses, poor heat dissipation, and
electromagnetic interference hamper these highspeed electric devices. Mechanical losses in
the form of stress on highspeed electric machine components, particularly the rotor and ball
bearings, may also occur [2]. As indicated in section 1.1, EAT also requires an extra battery as
well as additional electrical components.
2.4.4 Miller cycle
The major disadvantage of engine downsizing, as stated by Nhut [24], is the large percentage
of wasted exhaust gas energy which cannot be efficiently recovered. This percentage can
be minimized by using overexpanded cycles. An overexpanded cycle is a cycle where the
effective expansion ratio exceeds the compression ratio. Ralph Miller [23] proposes that
varying Inlet Valve Closing (IVC) timing is a simple approach to accomplish overexpansion in
standard crank mechanism engines. According to [20], overexpanded cycles are also known as
Miller or Atkinson cycles, after their inventors, Ralph Miller and James Atkinson respectively.
The literature is not uniform in the use of these terminologies. According to Environmental
Protection Agency (EPA) [6, 20], the Atkinson cycle is an overexpanded cycle with Early
Inlet Valve Closing (EIVC) or Late Inlet Valve Closing (LIVC) in engines that does not feature
any forced induction systems, whereas the Miller cycle is an Atkinson cycle boosted by either a
turbocharger or supercharger. According to Schutting et al. [32], the overexpansion achieved
via Variable Valve Timing (VVT) of the intake valve is credited to Ralph Miller (called as
18

CHAPTER 2. FRAMEOFREFERENCE
Miller cycle), whereas James Atkinson should be credited with the overexpansion achieved
by modifications to the cranktrain mechanism (called as Atkinson cycle). The difference arose
due to Miller’s proposed cycle, which solely considered EIVC while David Luria achieved the
Atkinson cycle and named it the OttoAtkinson process by incorporating LIVC instead of a
complex crank mechanism [38].
Modern practices use either EIVC or LIVC to achieve overexpanded cycles. Jääskeläinen [20]
further explains that, at the end of the compression stroke, EIVC and LIVC predominantly
lowers the incylinder temperature. This allows for increased geometric ratios that in turn
provide a higher expansion ratio resulting in improved efficiency. The geometric compression
ratio is increased by increasing the expansion ratio while keeping the effective compression
ratio close to the base value. The consequence would be a reduction in Brake Mean Effective
Pressure (BMEP), as indicated by Branyon and Simpson [1], but an increase in thermal
efficiency. Typically, the Miller cycle is used in conjunction with turbochargers. The
loss in BMEP can be recovered with a higher intake boost pressure limit. Because of the
shorter compression stroke, the Miller cycle essentially has no efficiency benefit as shown
by Wu, Puzinauskas, and Tsai [39]. Therefore, the Miller cycle is beneficial when used
with a turbocharger or supercharger. The Otto cycle’s preignition or knocking problem,
on the other hand, may be mitigated by cooling the air–fuel mixture before combustion by
either EIVC or LIVC.
2.4.5 Schmitz fivestroke engine
A majority of ICE in the market work on the fourstroke cycle, which is described in detail
in section 2.1. With higher expansion ratios obtained in the power stroke, more work can be
extracted out of the system. But in conventional fourstroke cycles, the effective compression
ratio is equal to the effective expansion ratio. In 2003, Gerhard Schmitz came up with a concept
to decouple the compression and expansion ratios, which allows the engine to have higher
effective expansion ratios, and facilitated an increased power density and higher power output
of the ICE [31]. This was achieved by adding an extra cylinder where, a second expansion of the
exhaust gases occur. This cylinder is a LowPressure (LP) cylinder with a larger displacement
working on a twostroke cycle. Due to the additional expansion stroke, this engine concept is
referred to as a fivestroke engine. The power density is increased by using a turbocharger to
supply compressed air as intake.
19

CHAPTER 2. FRAMEOFREFERENCE
Figure 9: Fivestroke engine setup [31]
General setup of the fivestroke engine is shown in figure 9. The system consists of
two HighPressure (HP) firing cylinders, a LP cylinder with no firing and a turbocharger setup
(after part 19). The HP cylinders perform the intake stroke, compression stroke and the first
expansion stroke (or power stroke). The compression and expansion ratios are equal till this
point. The gases of combustion from the two HP cylinders later move to the LP cylinder
via part 16 & 17 where a second expansion stroke occurs before sending the gases into the
exhaustmanifold (part 19). This increases the effective expansion ratio, which is now calculated
as the product of volume ratios of the two expansion processes [31]. The thermodynamic
efficiency is increased due to more work being extracted from each fivestroke cycle.
The overall compression ratio remains unchanged during the cycle at nearly 7.0:1 while
the effective expansion ratio is 14.5:1. The concept can also be extended to a 5cylinder
configuration with three HP cylinders and two LP cylinders. This concept was developed by
Ilmor Engineering which built a working prototype. Apart from the benefits mentioned above,
this concept has additional advantages like:
• The compression ratio can be varied independently of the expansion ratio in order to
address knocking effects without affecting the performance of the engine.
• Engine downsizing leads to reduced pumping work and a more compact setup.
• Use of standardized parts without the need for any additional manufacturing processes.
20

CHAPTER 2. FRAMEOFREFERENCE
The engine concept has its limitations which are:
• At low loads of operation, the indicated power of this cylinder could be negative or close
to zero after considering the cylinder losses. This will negatively affect the engine, due to
additional work required to operate the LP cylinder, overcome the friction losses, instead
of getting useful work out of it [26].
• According to Olshammar [27], this concept focuses on increasing the fuel efficiency by
having higher expansion than compression, but the exhaust valve on the exhaust cylinder
prevents direct flow to the turbine. This is negative for the turbine, it increases pumping
losses and requires a larger exhaust piston with more friction, when compared to the
EPTE concept.
2.5 EPTE Concept
In this section, the invention of a new engine concept introduced in section 1.1 will be explained
in detail. This invention concerns an ICEwith standard cylinders operating on fourstroke cycle,
a turbocharger arrangement and an EXC arranged in fluid communication with the combustion
cylinders [27]. The motivation behind the invention is to increase the fuel efficiency while
also improving the performance of the turbocharger. This concept identifies the problems
of conventional turbochargers explained in section 2.3.3 and also examines the limitations of
all the concepts mentioned in Section 2.4. Even though VGTs and EAT address the issues
with operating under different workloads, turbolag and fuel consumption, there are still some
challenges regarding cost effectiveness, reliability and control. The inventor Olshammar
realised there is still a need for improvements and developed the EPTE concept. Different
topologies of the engine has been proposed by Olshammar in his patent. Due to a limitation
in GTPowerTM mentioned in subsection 1.5.1, a (2+1) configuration is considered for the
purpose of the thesis. Regardless, other configurations proposed by the author will be reviewed
in this section.
The configuration that will be analyzed in this thesis is a (2+1) type as seen in figure 10.
It consists of two combustion cylinders (2) and (3). The channels from the two cylinders,
(14) and (15) respectively, lead the exhaust gases after power stroke into the EXC (1).
The EXC has two ports, each connected to channels (14) and (15), but they do not feature
any valves. The outlet of (1) is connected to the turbocharger arrangement via exhaust duct
(17) which allows for a fluid communication between the turbine and (1).
21

CHAPTER 2. FRAMEOFREFERENCE
Figure 10: Layout: 2 combustion cylinders + 1 EXC. [27]
The flow of gases to the EXC is controlled by the exhaust valves (8) and (10) provided for
(2) and (3). An intercooler (heat exchanger) (13) is provided to cool the intake gas after
compression. In the absence of (1), during a complete fourstroke cycle [corresponding to
720 Crank Angle Degrees (CAD)], there will be two exhaust pulses to the turbocharger
arrangement, each pulse lasting for 180 CAD, not considering Early Exhaust Valve Closing
(EEVC) or Late Exhaust Valve Closing (LEVC) [27]. This pulsating nature of the exhaust gas
flow, as seen in figure 11, affects the turbine parts and its performance.
Figure 11: Exhaust pressure waves from a fourstroke engine with 2 combustion cylinders andno EXC [27]
22

CHAPTER 2. FRAMEOFREFERENCE
During the exhaust stroke of (2) and in the presence of (1), the exhaust gases exiting (2) are
allowed to distribute itself between (1) and (17), such that a portion of the exhaust gases remain
in (1) while the remaining exhaust gases drive the turbine. The exhaust piston (4) moves in a
direction away from the TDC while the exhaust gases from (2) flows out during the exhaust
stroke of (2). By distributing the exhaust gases between (1) and (17), the back pressure is
reduced. In the following stroke, when (4) moves towards TDC, the remaining exhaust gases
in (1) will be pushed out into (17) and to the turbocharger arrangement.
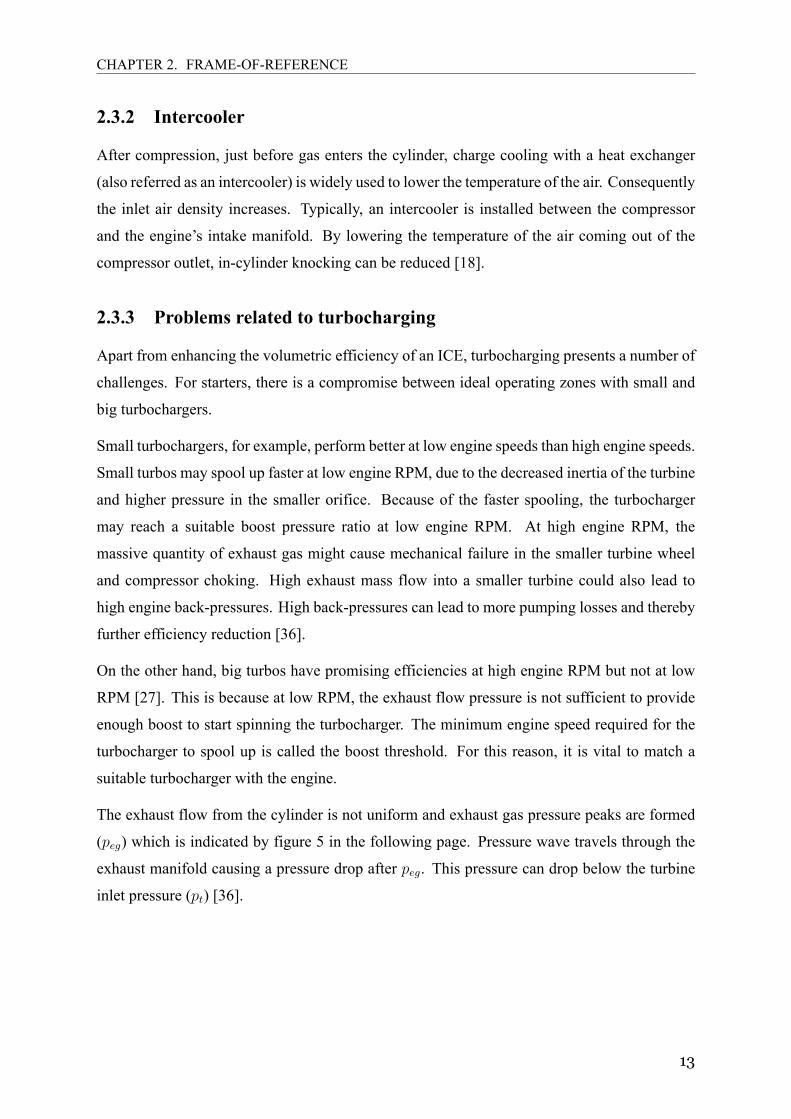
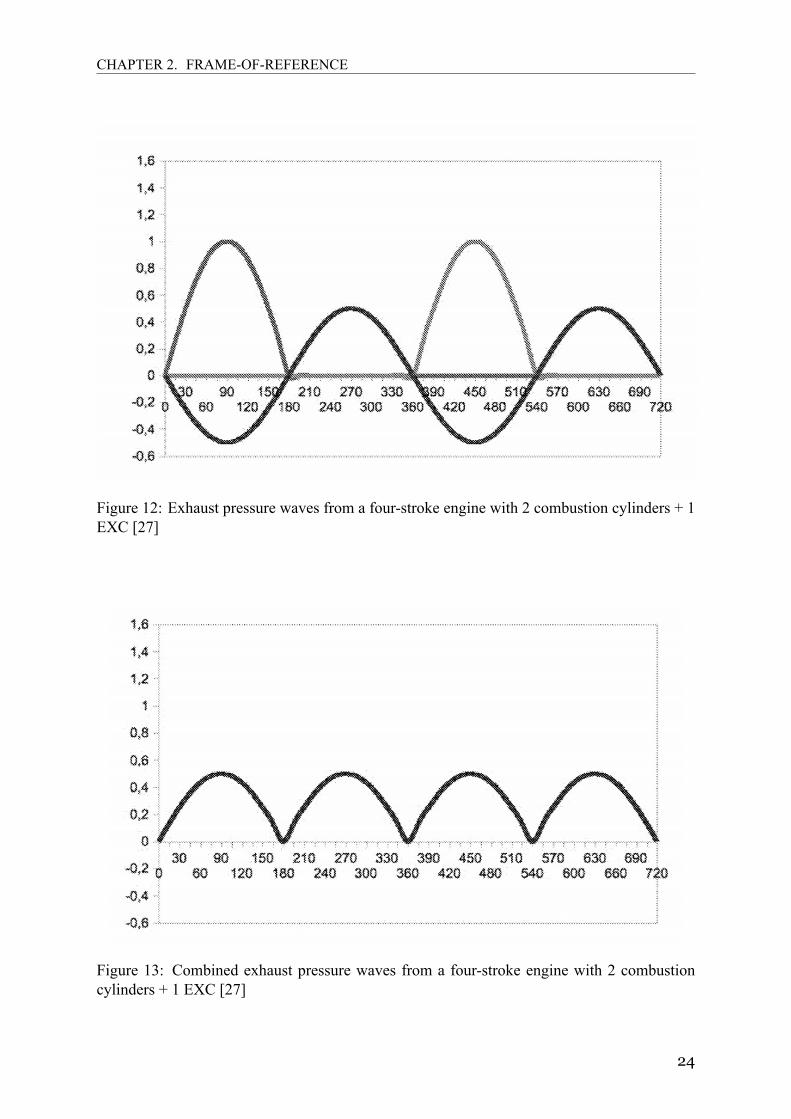
The exhaust flow in such a case can be visualized in figure 12. The grey line represents the
exhaust pressure waves from the combustion cylinders and the black line represents the exhaust
pressure waves from the EXC. Hence, the exhaust gases from (2) were distributed over a longer
period of time (nearly half the engine cycle) as seen in figure 13. This is beneficial at higher
loads, where the otherwise bypassed exhaust gases through a wastegate is instead delayed by
the EXC and sent to the turbocharger without any bypass. This increases the turbocharger
efficiency [27].
The exhaust duct inlet is arranged in such a way that the exhaust chamber is in fluid
communication with the exhaust duct irrespective of the exhaust piston position. By arranging
the exhaust duct in the cylinder head, this could be achieved. The engine is allowed for phase
shifts between cycles of the first combustion cylinder and the EXC, which will reduce the back
pressure and peak pressure of the exhaust at high load situations, and increase the pressure
during low load situations. This can be achieved by having the exhaust piston on a separate
crankshaft, which is driven by the primary crankshaft. Exhaust piston could also be controlled
independently of primary crankshaft with the help of free piston linear generator [27].
With a (3+1) setup, the exhaust piston mounted on a separate crankshaft, rotates 50% faster
than the combustion pistons. This is possible due to lesser load on the exhaust piston and the
absence of valves in the EXC. This provides a more even mass flow than (2+1) setup. With four
combustion cylinders, two configurations are possible, (4+1) or (4+2). A (4+1) setup has four
combustion pistons and one exhaust piston that rotates twice as fast as the combustion pistons.
in a (4+2) setup, the engine could be 90 degree V4 similar to joining two (2+1) in Vshape.
But from the exhaust flow perspective, (3+1) is better among all the configurations, which can
be seen in [27].
23
CHAPTER 2. FRAMEOFREFERENCE
Figure 12: Exhaust pressure waves from a fourstroke engine with 2 combustion cylinders + 1EXC [27]
Figure 13: Combined exhaust pressure waves from a fourstroke engine with 2 combustioncylinders + 1 EXC [27]
24

Chapter 3
Method & Implementation
In this chapter, a detailed explanation about the proposed methodology to conduct studies
on EPTE concept is discussed. An overview of requirements specifications from internal
stakeholders, modelling theory for engines in GTPowerTM, model generation of the baseline
engine and EPTE, model optimization and evaluation process of different performance and gas
exchange metrics are described.
3.1 Requirement Specifications
In this section, a compilation of EPTE model requirements are elucidated. Requirements
were specified by internal stakeholder which include features, functions and constraints that
the models should incorporate. Further, a best suited model was generated, which meets all
individual requirements of the concept. These requirement specifications are as follows:
1. The model should be a turbocharged 2cylinder SI engine. Turbocharger should have
a wastegate system that limits boost pressure to a desired value. Engine should also
feature an intercooler to cool compressed air by increasing air density at a constant
pressure before entering intake manifold. Fuel is injected in the intake port (Port
Fuel Injected (PFI)) prior to intake valve, with one injector per combustion cylinder.
This model is considered to be the baseline engine model.
2. In addition, the model should have one EXC. Exhaust channels from two combustion
cylinders should connect to inlets of EXC, one inlet port for each exhaust channel. Outlet
of EXC is connected to turbocharger system via an exhaust duct. Baseline engine model
along with the additional EXC constitutes EPTE model.
25
CHAPTER 3. METHOD & IMPLEMENTATION
3. EXC should not feature any valves on either inlet or outlet sides. During an entire cycle of
EXC (one expansion stoke and one compression stroke), inlet channels, exhaust chamber
and outlet channel should be in fluid communication with each other, irrespective of
exhaust piston position.
4. There should be no combustion in EXC. Hence, fuel injection related to this cylinder is
zero and there is no firing in this cylinder.
5. During operation, a portion of exhaust gases from either combustion cylinders are
expanded in EXC when exhaust piston moves from TDC to BDC. Remaining exhaust
gases move directly from inlet to outlet of EXCwithout being expanded, which will drive
the turbine during expansion stroke of EXC.
6. During compression stroke of EXC, expanded gases are compressed into exhaust duct
flowing towards the turbocharger.
7. Firing order of engine should be 1EXC2. Firing interval between combustion cylinders
and EXC should be allowed to vary. Since there is no combustion in EXC, firing, in this
case, refers to start of expansion stroke, when exhaust piston starts to move downward
from TDC.
8. The models should be built in a way that it allows for a fair comparison between baseline
engine and EPTE models. Solver specifications of GTPowerTM, attributes of parts that
are not being optimized should be kept constant between both models. Geometry of
optimizing parts between the two models should not vary to an extent where a fair
comparison between these two models is not viable.
9. Optimization of both models should follow the same approach. Evaluation of these
models should be conducted independent of each other in order to eliminate bias and
choose the best optimized model in both baseline engine and EPTE.
3.2 Introduction to GTPowerTM
GTPowerTM is a onedimensional engine simulation software, a product of
GTSuite — a versatile multiphysics platform for creating models of various systems
using builtin libraries (flow, thermal, mechanical, chemistry etc.). GTPowerTM is an
industry standard software used for designing and developing complete engines. It offers
wide range of capabilities with respect to simulating gas exchange process, combustion,
26

CHAPTER 3. METHOD & IMPLEMENTATION
heat transfer, incylinder motion. More about the features and functions can be found in [15].
The builtin libraries in GTPowerTM offers a multitude of preexisting engine templates;
or different components & subsystems to create custom engine models, along with several
controller models for studying the dynamic control of systems.
3.3 Modelling Theory
This section discusses the multiphysics phenomena and different simulation modelling
approaches available in GTPowerTM. It also explains relevant theory, governing equations
that GTPowerTM employs, useful for understanding the results presented in this report.
All equations in this section were derived from GTPowerTM documentation [10, 11].
3.3.1 Flow basics
GTPowerTM utilizes the 1D NavierStokes equations to solve the flow models, i.e., the
conservation of continuity, energy and momentum equations. All quantities related are
calculated as averages across the direction of flow by splitting the whole system into multiple
volumes and solving the variables in each volume. Integration of these variables are later
done by either an explicit time integration method and an implicit time integration method.
The variables and the range of time step is affected by which integration method the user
chooses. More details on how the time step is calculated can be seen in Appendix A.1.
The explicit method requires very small time steps, GTPowerTM recommends this method
for engine performance studies where unsteady flow and high pressure fluctuations are
involved. Mass flow, density and internal energy are the primary variables in the explicit
method; secondary variables like pressure and temperatures are calculated from them.
The governing equations for explicit method are given in Equations 3.1, 3.2 and 3.3, cited
from the GTPowerTM documentation [11].
Continuity :dm
dt=
∑boundaries
m (3.1)
Energy :d(me)
dt= −ρ
dV
dt+
∑boundaries
(mh)− hAs(Tfluid − Twall) (3.2)
Momentum :dm
dt=
dpA+∑
boundaries(mu)− 4Cfρu|u|2
dxAD
−Kp(12pu|u|)A
dx(3.3)
27

CHAPTER 3. METHOD & IMPLEMENTATION
where, m is boundary mass flux into volume (m = ρAu), m is mass of the volume, V is the
volume, p is the pressure, ρ is the density, A is the crosssectional flow area, As is the heat
transfer surface area, e is the total specific internal energy (internal energy plus kinetic energy
per unit mass), H is the total specific enthalpy (H = e + pρ), h is the heat transfer coefficient,
Tfluid is the fluid temperature, Twall is the wall temperature, u is the velocity at the boundary,
Cf is the Fanning friction factor; it will be explained in subsection 3.3.2,Kp is the pressure loss
coefficient (due to bend, taper or restriction),D is the equivalent diameter, dx is length of mass
element in the flow direction (discretization length) and dp is the pressure differential acting
across dx.
Discretization Length
In order to increase accuracy of the model, GTPowerTM splits larger components into
smaller segments. This process is called discretization. The software discretizes a pipe into
many smaller subvolumes where each subvolume calculates the primary variables using
NavierStokes equations. This discretization length of each subvolume is smaller than the
component length which the user can decide. For engine simulation purposes, GTPowerTM
recommends a value for discretization length that offers good balance between accuracy and
computation speed. For intake systems, GTPowerTM recommends a discretization length of
0.4 times the bore diameter of combustion cylinder; for exhaust systems, a value of 0.55 times
the bore diameter is recommended.
3.3.2 Friction modelling
Friction in components can result in flow losses in the system. In this section, we will see how
the losses due to friction are calculated in two major flow components in the model, namely,
pipes and engine cranktrain.
Friction losses in pipes
Fluid flow in pipes is affected by friction due to pipe wall and surface roughness. The type
of flow, laminar or turbulent, also causes flow losses. The losses are calculated using Fanning
friction factor, Cf , which is a function of Reynolds number (ReD) and wall surface roughness
[11]. Two approximations of the Colebrook equation are used to calculate the friction factor.
These approximations in GTPowerTM are ‘simple’ and ‘improved’methods; they provide faster
computational time. GTPowerTM recommends the use of simple method for gas circuits and
incompressible liquid circuits. Simple method is faster and only results in a 5% deviation
28

CHAPTER 3. METHOD & IMPLEMENTATION
from the Colebrook equation when used in automotive applications. In the thesis, cast iron
(sand roughness = 0.26) was used as the material for all pipe components. It has high surface
roughness thus allowing us to model the upper limit of friction losses. The flow regime was
considered as turbulent due to pulsations in pressure and flow velocity. The equation forCf for
a smooth pipe (zero surface roughness) in turbulent regime (ReD > 4000), for air and gasoline
fluids (both are Newtonian fluids) is seen in Equation 3.4. The value of Cf is later used in the
momentum equation.
Cf =0.08
Re0.25D
(3.4)
Under same conditions, if the surface roughness > 0, then the equation for Cf is given by
Nikuradse formula [25], seen in in Equation 3.5.
Cfrough =0.25(
2 ∗ log10(
D2ε
)+ 1.74
)2 (3.5)
where, ε is the pipe wall sand roughness height and D is the pipe diameter.
Engine friction
GTPowerTM uses several different reference objects to model the mechanical friction of
the engine. ‘EngineFrictionCF’ is one of them and was used in this thesis [10]. This
reference objects can also be used to model auxiliary losses along with engine friction losses.
GTPowerTM employs the model by ChenFlynn [3] in order to determine the engine friction,
which is shown below.
FMEP = C + (PF ∗ Pmax) + (MPSF ∗ Speedmp) + (MPSSF ∗ Speed2mp) (3.6)
where, FMEP is the Friction Mean Effective Pressure, Pmax is the maximum cylinder
pressure, Speedmp is the mean piston speed, C is the constant part of FMEP, PF is the peak
cylinder pressure factor, MPSF is the Mean Piston Speed Factor and MPSSF is the Mean
Piston Speed Squared Factor.
Equation 3.7 states the formula for Friction Mean Effective Pressure (FMEP) in when multiple
cylinders are involved. Here, Si is the instantaneous speed of piston i and #Cylinders denote
number of cylinders in the engine.
FMEPtot =
∑#cylindersi=1 [C + PF (Pmax,i) +MPSF (Si) +MPSSF (S2
i )]
#Cylinders(3.7)
29

CHAPTER 3. METHOD & IMPLEMENTATION
where, Si =
∮Si(t)dt∮
dt(3.8)
Table 1 shows the values of different friction model attributes used in baseline engine and
EPTE simulation models.
Table 1: EngineFrictionCF object specifications
ATTRIBUTE VALUE UNITConstant part of FMEP 0.4 bar
Peak Cylinder Pressure Factor 0.005
Mean Piston Speed Factor 0.09 bar/(m/s)
Mean Piston Speed Squared Factor 9e−4 bar/(m/s)2
3.3.3 Heat transfer modelling
In this section, losses due to heat transfer in pipes and the incylinder heat transfer models are
described along with relevant equations.
Heat transfer in pipes
Heat transfer occurs between the fluid flowing in the pipes and wall of the pipes. The heat
transfer coefficient is used to determine this heat transfer; it is calculated using the Colburn
correlation [11]. The Colburn correlation for smooth pipes is given below (Equation 3.9).
hg =
(1
2
)CfρUeffCpPr−2/3 (3.9)
where, hg is the heat transfer coefficient of smooth pipe, Cf is the Fanning friction factor
of smooth pipe, ρ is the density, Ueff is the effective velocity outside boundary layer,
Cp is the specific heat, Pr is the Prandtl number.
Equation 3.10 represents the heat transfer coefficient in pipes with nonzero wall
surface roughness. Here, hg,rough is the heat transfer coefficient for rough pipes and
Cf,rough is the Fanning friction factor for rough pipes [11].
hg,rough = hg
(Cf,rough
Cf
)n
where, n = 0.68 ∗ Pr0.215 (3.10)
30
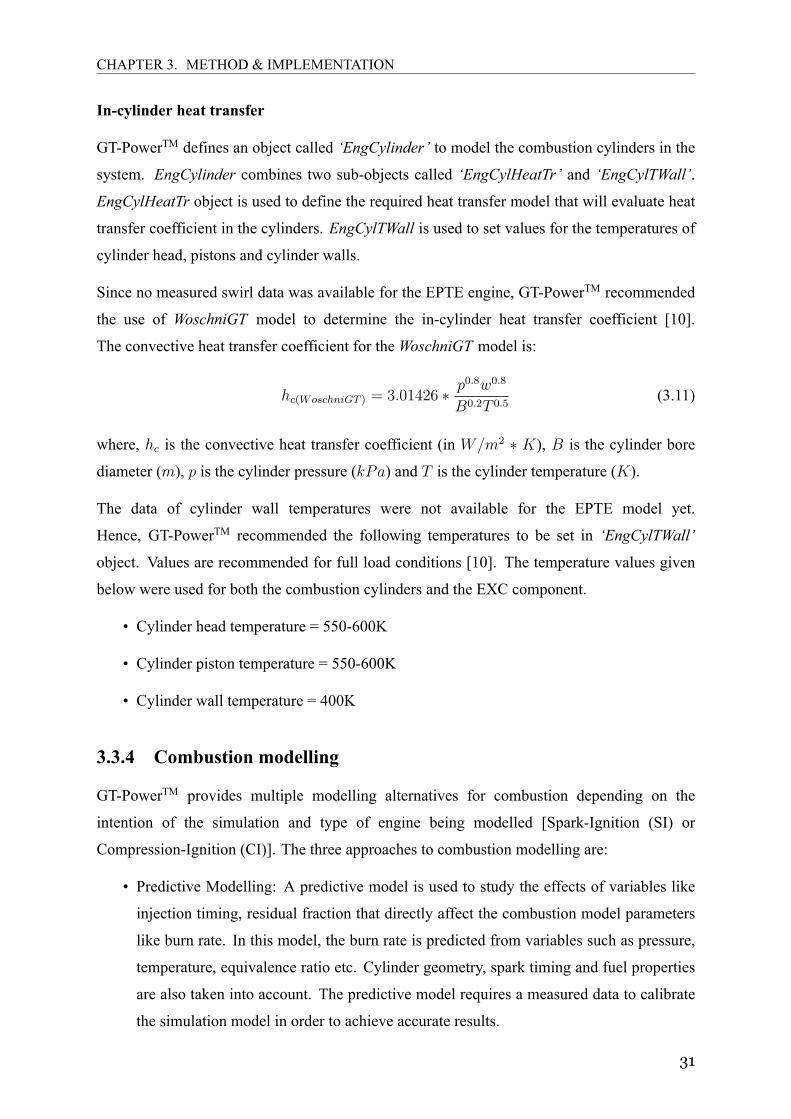
CHAPTER 3. METHOD & IMPLEMENTATION
Incylinder heat transfer
GTPowerTM defines an object called ‘EngCylinder’ to model the combustion cylinders in the
system. EngCylinder combines two subobjects called ‘EngCylHeatTr’ and ‘EngCylTWall’.
EngCylHeatTr object is used to define the required heat transfer model that will evaluate heat
transfer coefficient in the cylinders. EngCylTWall is used to set values for the temperatures of
cylinder head, pistons and cylinder walls.
Since no measured swirl data was available for the EPTE engine, GTPowerTM recommended
the use of WoschniGT model to determine the incylinder heat transfer coefficient [10].
The convective heat transfer coefficient for theWoschniGT model is:
hc(WoschniGT ) = 3.01426 ∗ p0.8w0.8
B0.2T 0.5(3.11)
where, hc is the convective heat transfer coefficient (in W/m2 ∗ K), B is the cylinder bore
diameter (m), p is the cylinder pressure (kPa) and T is the cylinder temperature (K).
The data of cylinder wall temperatures were not available for the EPTE model yet.
Hence, GTPowerTM recommended the following temperatures to be set in ‘EngCylTWall’
object. Values are recommended for full load conditions [10]. The temperature values given
below were used for both the combustion cylinders and the EXC component.
• Cylinder head temperature = 550600K
• Cylinder piston temperature = 550600K
• Cylinder wall temperature = 400K
3.3.4 Combustion modelling
GTPowerTM provides multiple modelling alternatives for combustion depending on the
intention of the simulation and type of engine being modelled [SparkIgnition (SI) or
CompressionIgnition (CI)]. The three approaches to combustion modelling are:
• Predictive Modelling: A predictive model is used to study the effects of variables like
injection timing, residual fraction that directly affect the combustion model parameters
like burn rate. In this model, the burn rate is predicted from variables such as pressure,
temperature, equivalence ratio etc. Cylinder geometry, spark timing and fuel properties
are also taken into account. The predictive model requires a measured data to calibrate
the simulation model in order to achieve accurate results.
31

CHAPTER 3. METHOD & IMPLEMENTATION
• NonPredictiveModelling: This model can be used to study variables in a simulation that
has little influence on the burn rate. Burn rate is set as a simulation input rather than being
predicted. As long as there is enough fuel available in the cylinder, burn rate inputted
will be considered regardless of the cylinder geometry or injection timing.
• SemiPredictive Modelling: It offers a good balance between the two models mentioned
above. While this model is sensitive to variables that affect the burn rate, users can still
impose burn rate as a simulation input with the help of lookup tables or other methods.
Different neural networks are employed to predict the parameter values that are to be
specified for nonpredictive model. This is a more complex since it involves a lot of
control systems [10].
As no measured data was available for EPTE simulation model in order to calibrate the
combustion model, predictive model was not used. Semipredictive method was discarded
due to the simulation complexities and higher computational time. The nonpredictive
model provides a faster computation and is not affected by other variables in the simulation.
Also, Weibe function is a zerodimensional nonpredictive combustion model most frequently
used for gas exchange studies in SI engines.
The object ‘EngCylCombSIWiebe’ is a SI Wiebe Model in which the Weibe function calculates
an approximate profile of SI burn rate. This model is recommended byGTPowerTM to impose a
reasonable burn rate when measured data of cylinder pressure is unavailable, as was the case in
the current thesis. Wiebe constant, Start Of Combustion (SOC) and burn rate together constitute
the Wiebe equations and are given by equations 3.12, 3.13 and 3.14. All equations were taken
from GTPowerTM documentation [10].
Inputs:
• AA = Anchor Angle (deg)
• D = Duration (deg)
• E = Wiebe Exponent
• CE = Fraction of Fuel Burned (also known as “Combustion Efficiency”)
• BM = Burned Fuel Percentage at Anchor Angle
• BS = Burned Fuel Percentage at Duration Start
• BE = Burned Fuel Percentage at Duration End
32

CHAPTER 3. METHOD & IMPLEMENTATION
Calculated Constants:
• BMC = −ln(1−BM) is the Burned Midpoint Constant
• BSC = −ln(1−BS) is the Burned Start Constant
• BEC = −ln(1−BE) is the Burned End Constant
WC =
[D
BEC1
(E+1) −BSC1
(E+1)
]−(E+1)
(3.12)
SOC = AA− (D)(BMC)1
(E+1)
BEC1
(E+1) −BSC1
(E+1)
(3.13)
Combustion(θ) = (CE)[1− e−(WC)(θ−SOC)(E+1)
] (3.14)
where, θ is the instantaneous crank angle. The cumulative burn rate calculated is normalized
to unity [10].
Table 2 shows the values of different combustion model attributes used in baseline engine and
EPTE simulation models. Some default parameter values are also mentioned below. Note that
the notation “def” denotes the default values set in GTPowerTM.
Table 2: EngCylCombSIWiebe object specifications
ATTRIBUTE VALUE UNITAnchor Angle (= 50% burn) 8.0 deg
Duration (= 10% to 90% burn) 25.0 deg
Wiebe Exponent def (= 2.0)
Fraction of Fuel Burned 1.0 fraction
Number of Temperature Zones twotemp
Burned Fuel % at Anchor Angle def (= 50.0) %
Burned Fuel % at Duration Start def (= 10.0) %
Burned Fuel % at Duration End def (= 90.0) %
33

CHAPTER 3. METHOD & IMPLEMENTATION
3.3.5 Fuel injection
Fuel injection is done with the help of an object called ‘InjConn’. There are different kinds
of InjConn objects depending on the type of combustion model used, type of fuel and the
method of injection. In this thesis, the EPTE model required portfuel sequential injection of
gasoline fuel. Hence an object called ‘InjAFSeqConn’was used for both combustion cylinders.
An attribute in this object, called “Vaporized Fuel Fraction”, determines the fraction of liquid
fuel that evaporates into vapour fuel upon injection [10]. GTPowerTM recommends a value
of 0.3 for a portinjected SI engine. An important parameter of InjAFSeqConn object is the
pulse width; it is the duration of fuel injection in crank angle degrees. In order to estimate
delivery rate of the injector, certain considerations are made if pulse width is not known.
GTPowerTM recommends that “the longest pulse duration in crankangle degrees is about
equal to the duration of the intake valve opening: 180 to 210 degrees” [10]. GTPowerTM
also recommends considering the highest engine speed while estimating injection delivery rate.
The equation to calculate the delivery rate is given by:
mdelivery = ηvρrefNrpmVd(F
A)
6
#Cylinders ∗ PulseWidth(3.15)
where, mdelivery is the injector delivery rate (g/s), ηv is the volumetric efficiency (in fraction),
ρref is the reference density (kg/m3) (1.16kg/m3, ambient conditions), Nrpm is the engine
speed (RPM), Vd is the displacement of engine (in Litres), F/A is the fueltoair ratio
& PulseWidth is the duration of injection, in CAD [10].
The fuel used in this thesis was called ‘Indolene’. It is the standard gasoline fuel used for engine
testing purpose. Octane number of indolene is similar to commercially available gasoline fuels.
Table 3 shows values of different friction model attributes used in baseline engine and EPTE
engine models. In the table, “Injection Timing Angle” refers to the crank angle relative to
TopDeadCenter Firing (TDCF) at which fuel injection starts.
Table 3: InjAFSeqConn object specifications
ATTRIBUTE VALUE UNITFluid Object indolenecombust
Injected Fluid Temperature 300 K
Vaporized Fluid Fraction 0.3
Injector Location 0.5 (@ centre of inlet ports)
Injection Timing Angle 360 CAD
34

CHAPTER 3. METHOD & IMPLEMENTATION
3.4 Model Generation
The following section provides a detailed methodology for creating the EPTE model in
GTPowerTM. A basic understanding of this was provided in section 1.6. The EPTE concept
presented by Olshammar in his patent [27] is still in the early stages of research; there
was no physical engine model/prototype available to extract data for simulation purposes.
However, GTPowerTM provides a set of example models that are modelled based on the
intention of simulation and certain default values of variables are prespecified based on these
purposes. One such example model was adopted in order to simulate and assess the technical
potential of EPTE model. ‘4cylSIfinal’ is an example model which can be found under
Files → Tutorials → Modelling_Applications → 04 − 4cylSI in the GTISE software.
The example model was modified based on requirement specifications by Olshammar, to create
a baseline engine model and subsequently, the EPTE model. EPTE model was built from
baseline engine model by adding an exhaust cylinder to the baseline engine model. Except for
geometrical parameters and timing attributes (firing interval, valve timings) that were optimized
for performance, all other engine attributes were kept constant between the two models.
The multiphysics objects used (flow model, heat transfer model, friction model), solution
algorithms and initialization settings were also unchanged. DOE studies were performed to
determine the best ranges of operation for all optimizing parameters. This resulted in a fair
comparison of performance metrics by limiting deviations between the models.
3.4.1 Baseline engine model
A preexisting example 4cylSIfinal mentioned in Section 3.4 was imported into GTPowerTM.
This model was a fourcylinder naturally aspirated SI engine model. In order to meet
the requirement specifications, two cylinders were removed from the model along with the
associated intake manifold pipe components, exhaust manifold pipe components. This resulted
in a twocylinder naturally aspirated SI engine.
Table 4 gives a basic summary of engine configurations that apply for both baseline engine
and EPTE models. Figure 14 represents the final baseline engine model. An enlarged
view of figure 14 can be found in Appendix A.2. Exhaust ports of both ‘cylinder1’ and
‘cylinder4’ were connected to a common exhaust manifold via ‘FlowSplitTRight3’.
FlowSplitTRight3 is a Tshaped pipe component that combines exhaust flows from the two
ports ‘exhport1’ and ‘exhport4’ to provide a common flow passage for the exhaust gases.
Modelling of FlowSplitTRight3 is described in Appendix A.1. Orifices called ‘OrificeConn’
35

CHAPTER 3. METHOD & IMPLEMENTATION
in GTPowerTM were used to connect any two pipes together. Part ‘7’ is a rounded pipe that
connects the exhaust manifold to the turbocharger arrangement.
Figure 14: Baseline Engine Model
Table 4: Fundamental specifications of Baseline engine model
ATTRIBUTE VALUE UNITEngine Type 2cylinder, four stroke, Inline
Fuel Injection PFI
Engine Speed Range 20006500 rpm
Bore x Stroke 86 x 86.07 mm
Displacement Volume 1000 cc
Geometrical Compression Ratio 9.5
Connecting Rod Length 175 mm
TDC Clearance Height 1.0 mm
Head/Bore Area Ratio 1.15 mm
Piston/Bore Area Ratio 1.0 mm
36

CHAPTER 3. METHOD & IMPLEMENTATION
Initial fluid states
Table 5 gives values for the initial conditions of intake air and exhaust gases required to start
the simulations. Object ‘initial’ was used as initial fluid state for all components before the
combustion cylinders and ‘initial_exh’ was used for all components after, wherever applicable.
The compositions air and exh_gas are available as reference objects in GTPowerTM.
Table 5: Initial fluid state specifications
ATTRIBUTE initial initial_exh UNITPressure (Absolute) 1.0 1.1 bar
Temperature 300 750 K
Composition air exh_gas
Fuel injectors
The fuel injector components are represented by ‘siinject1’ and ‘siinject4’. The injectors
were positioned at the centre of the intake ports ‘intport1’ and ‘intport4’. The estimation
of delivery rate was based on equation 3.15, GTPowerTM recommendations mentioned in
subsection 3.3.5 and engine specifications mentioned in table 4. Other specifications of the
fuel injectors are mentioned in table 3.
Intake plenum
The intake plenum was modelled by three components: ‘FlowSplitTRight1’,
‘FlowSplitTRight2’ and ‘ManPipe1’. Volume of intake plenum was inputted as a multiple
of the engine displacement volume. DOE studies were performed to estimate the volume of
plenum. Simulations showed that plenum volume 6 times the volume of engine displacement
(i.e., 6 litres in this case) improved engine performance, in both BSFC and BP. More details of
DOE studies are mentioned in Appendix B.2.
Thermocouple
Thermocouple template from GTPowerTM was used to measure temperatures in different
sections of the engine model. The reference object ‘thermocouple’ was used to model the
thermocouples inside the pipes. Table 6 lists the specifications of thermocouple. All attribute
values of thermocouple not mentioned below were considered as default.
37

CHAPTER 3. METHOD & IMPLEMENTATION
Table 6: Thermocouple reference object specifications
ATTRIBUTE VALUE UNITConstruction Type Shielded
Sheath Material Steel
Sheath Diameter 4.5 mm
Sheath Length 20.0 mm
Sheath Thickness 0.5 mm
Emissivity 0.15
Turbocharger
There are different templates available in the software library to model the turbocharger
arrangement. In the absence of a turbocharger map, GTPowerTM recommends using
TurbineSimple and CompressorSimple templates as mentioned briefly in section 1.6.
Turbocharger shaft was modelled as a sensoractuator system with a gain controller.
The system senses (part ‘SensorConn’ the turbine power and rotates CompressorSimple using
an actuator (part ‘ActuatorConn’). Gain controller ‘Gain1’ was set at 0.9 to account for shaft
losses. GTPowerTM does not allow for a turbocharger shaft component to be attached when
the TurbineSimple and CompressorSimple models are used.
TurbineSimple
This template represents a turbocharger’s turbine in simple form. Basic understanding of
the system was provided in the previous paragraph. Using turbine orifice flow model and
imposed efficiency, it will estimate output power and temperature at the outlet. The flow rate
of exhaust gases was computed by using upstream and downstream pressures. The pressure
ratio, mass flow rate, and efficiency were used to calculate the output power. The pressure
ratio and efficiency were also used to evaluate the outlet temperature. This template is meant
to be used in the early phases of engine design when turbine maps aren’t present; however
the user wants to establish trends in a model which are similar to those seen in a turbocharged
engine [14]. Inlet of TurbineSimple was connected to pipe component 7, and the outlet was
connected to environment. TurbineSimple has a builtin wastegate system, whose diameter was
controlled by component ‘ControllerTurboWG’. An averaging signal was used to sense pressure
in the intake manifold component ‘intrunner2’ present after the heat exchanger, represented by
component ‘intercooler’. Depending on this pressureControllerTurboWG limits boost pressure
to a desired value by changing the wastegate diameter. Specifications of the TurbineSimple are
38

CHAPTER 3. METHOD & IMPLEMENTATION
listed in table 7. In this table, [orificedia] denotes that the turbine orifice diameter is an attribute
that was being optimized and hence the range of values considered for optimization will be
mentioned further in section 3.5.2.
Table 7: TurbineSimple template specifications
ATTRIBUTE VALUE UNITInlet Pressure Flag total
Outlet Pressure Flag total
Efficiency: PR Lookup Definition sameasmap
Performance Definition Orifice Flow & Constant Efficiency
Turbine Efficiency 0.7 fraction
Turbine Orifice Diameter [orificedia] mm
CompressorSimple
Using basic thermodynamic equations, mass flow rate and output temperature were derived
from inlet temperature, pressure ratio, efficiency, and input power. ActuatorConn was used to
actuate the input power derived from SensorConn. This essentially works as a turbocharger
shaft. [inputpower] in table 8 refers to this power derived from the turbine when simulations
start. The outlet temperature was obtained using the inlet temperature, pressure ratio, and
efficiency. The mass flow rate was calculated utilizing temperature change throughout the
compressor and input power [13]. Specifications of CompressorSimple are listed in table 8.
Table 8: CompressorSimple template specifications
ATTRIBUTE VALUE UNITInlet Pressure Flag total
Outlet Pressure Flag static
Efficiency: PR Lookup Definition sameasmap
Compressor Efficiency 0.72 fraction
Compressor Input Power [inputpower] mm
Damping Time Scale 1.0 ms
39
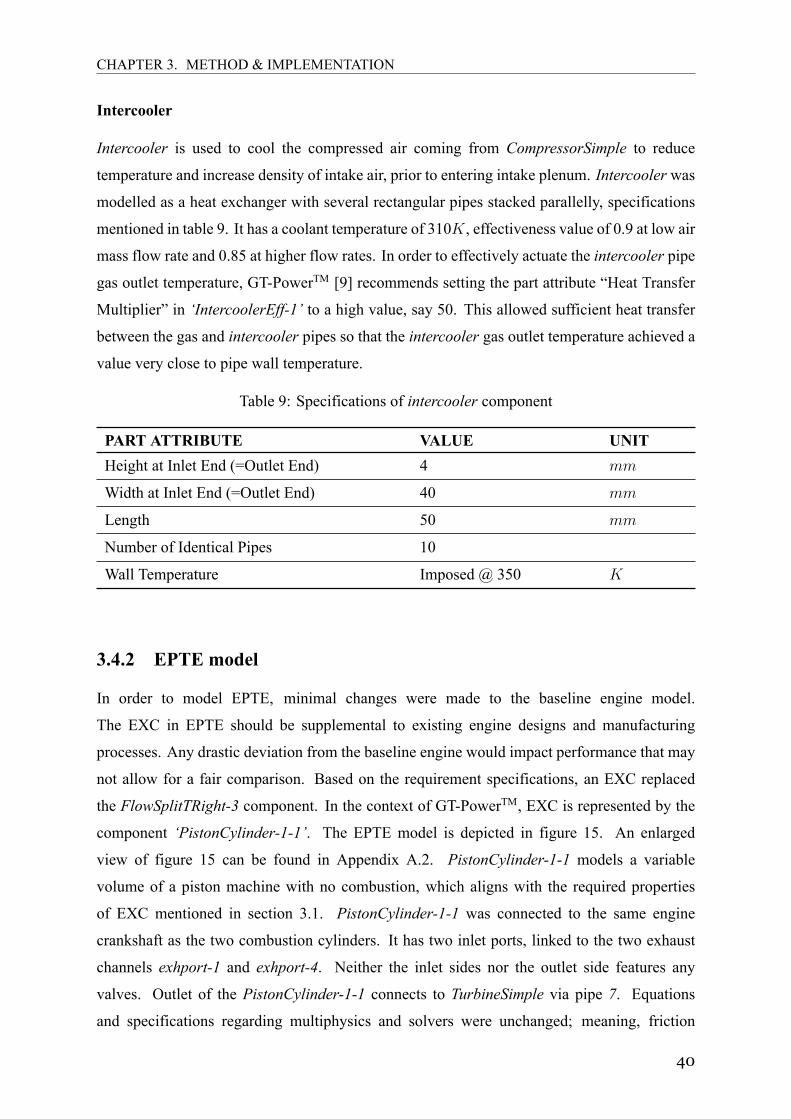
CHAPTER 3. METHOD & IMPLEMENTATION
Intercooler
Intercooler is used to cool the compressed air coming from CompressorSimple to reduce
temperature and increase density of intake air, prior to entering intake plenum. Intercooler was
modelled as a heat exchanger with several rectangular pipes stacked parallelly, specifications
mentioned in table 9. It has a coolant temperature of 310K, effectiveness value of 0.9 at low air
mass flow rate and 0.85 at higher flow rates. In order to effectively actuate the intercooler pipe
gas outlet temperature, GTPowerTM [9] recommends setting the part attribute “Heat Transfer
Multiplier” in ‘IntercoolerEff1’ to a high value, say 50. This allowed sufficient heat transfer
between the gas and intercooler pipes so that the intercooler gas outlet temperature achieved a
value very close to pipe wall temperature.
Table 9: Specifications of intercooler component
PART ATTRIBUTE VALUE UNITHeight at Inlet End (=Outlet End) 4 mm
Width at Inlet End (=Outlet End) 40 mm
Length 50 mm
Number of Identical Pipes 10
Wall Temperature Imposed @ 350 K
3.4.2 EPTE model
In order to model EPTE, minimal changes were made to the baseline engine model.
The EXC in EPTE should be supplemental to existing engine designs and manufacturing
processes. Any drastic deviation from the baseline engine would impact performance that may
not allow for a fair comparison. Based on the requirement specifications, an EXC replaced
the FlowSplitTRight3 component. In the context of GTPowerTM, EXC is represented by the
component ‘PistonCylinder11’. The EPTE model is depicted in figure 15. An enlarged
view of figure 15 can be found in Appendix A.2. PistonCylinder11 models a variable
volume of a piston machine with no combustion, which aligns with the required properties
of EXC mentioned in section 3.1. PistonCylinder11 was connected to the same engine
crankshaft as the two combustion cylinders. It has two inlet ports, linked to the two exhaust
channels exhport1 and exhport4. Neither the inlet sides nor the outlet side features any
valves. Outlet of the PistonCylinder11 connects to TurbineSimple via pipe 7. Equations
and specifications regarding multiphysics and solvers were unchanged; meaning, friction
40

CHAPTER 3. METHOD & IMPLEMENTATION
and heat transfer attribute values along with cylinder wall temperatures were equal in both
EXC and the combustion cylinder. The firing order of the baseline engine was 1 − 2 with
a firing interval of 360 CAD. In the EPTE model, the firing order was 1 − EXC − 2.
Firing in the case of PistonCylinder11 means the start of expansion stroke from TDC to
BDC. This is not to be confused with firing of the spark plug, as there is no combustion in
PistonCylinder11 and consequently no fuel injection and spark ignition. Start of firing in
the case of both the combustion cylinders 1 and 2 denotes the start of the power stroke which
is when the the piston moves from TDC to BDC during the engine cycle. The firing angles
(in CAD) for cylinder1, PistonCylinder11 and cylinder2 were 0, [fireint], and
(360 − [fireint]) respectively. Cylinder firing angle was relative to the preceding cylinder.
For the first cylinder, GTPowerTM recommends setting this value as zero. [fireint] denotes that
this value was optimized. The cylinder geometry of EXCwas same as the combustion cylinders
except for the bore diameter and compression ratio; these two parameters, [exhbore] and
[exh − CR] were optimized along with [fireint]. The parameters [exhbore] and
[exh−CR] denotes the bore diameter and geometrical compression ratio of the EXC component
respectively. The range of values considered during optimization is provided in table 12.
Figure 15: EPTE model
41

CHAPTER 3. METHOD & IMPLEMENTATION
3.5 Model Optimization
This section discusses the optimization approach used for both the models: Baseline engine
and EPTE. The optimization process was performed using the IDO tool in GTPowerTM
software. The optimized models emanating from this process were then used for the evaluation
of performance metrics, gas exchange metrics and other critical indicators discussed in chapter
4. The following subsections will explain about the approach and techniques used for model
optimization followed by the engine parameters which were optimized for both the baseline
engine and EPTE. In the context of engine development activities within the transport industry,
optimization of engine parameters is often referred to as “calibration”.
3.5.1 Optimization approach
This subsection explains the optimization approach which was adopted in the thesis project.
To perform a fair comparison regarding various performance and gas exchange metrics, it was
vital that the approach used for optimizing both the engine models were alike. This meant that
the type of optimization, optimization algorithm and optimization objectives were the same for
both the baseline engine and EPTE models. The motivation behind such optimization choices
are also explained in this subsection.
The background knowledge used for performing the optimization process via IDO emanated
from Gamma Technologies’ Optimization Manual, 2019 version [12]. The optimizer feature
in GTPowerTM works based on an automated iterative approach. This feature in the IDO
sets input variables, runs the model, evaluates the model response variables, and changes the
input variables again to achieve the optimization objective specified by the user. This process
continues until a stopping criteria is met [12]. In this context, the response variables were BSFC
and BP.
In this thesis project, the optimization process involved two objectives. One objective was to
minimize the BSFC and the other one was to maximize the BP across the operating engine
speed range. Therefore, a multiobjective optimization approach was used in this concept
assessment study. These objectives were based on a caseweighted average. This means that
the two objectives were given a certain weightage factor for engine speed cases ranging from
2000 RPM to 6500 RPM. Within an operating range of 2000 RPM to 5500
RPM, 40 % weightage was given to BP maximization and 60 % weightage was
assigned for BSFC minimization. For engine speeds of 6000 RPM and 6500 RPM,
42

CHAPTER 3. METHOD & IMPLEMENTATION
40% weightage was given to BSFC minimization and 60% weightage was given to
BP maximization. There are two subapproaches under multiobjective optimization in
GTPowerTM IDO. One is the weightedsum approach and the other one is called as the pareto
approach. According to GTPowerTM optimization manual [12], weightedsum approach is a
reasonable method when the multiple objectives involved in the optimization process decrease
or increase simultaneously when the factor values change. The factor values are the system
variables which are to be optimized to achieve the objectives specified by the user. However,
a major number of optimization problems in the field of engineering design incorporate
tradeoffs, for which the weightedsum approach would not be a feasible method. In such
scenarios, the pareto approach under multiobjective optimization is recommended [12].
Therefore, multiobjective optimization with pareto approach was used in the optimization
process of both the baseline engine and EPTE models. This choice would help to maintain
an adequate level of internal validity, as compared to the weightedsum approach.
There are various search algorithms available in the GTPowerTM optimization tool. According
to the optimization manual [12], Genetic Algorithm (NSGA III) and Covariance Matrix
Adaptation Evolution Strategy (CMAES) are recommended for optimization problems with
mediumhigh complexity. These algorithms are predominantly used when the relationship
between the factor values and the response variables is nonlinear, and when there are more
than four factor values involved. However, the optimization manual further recommends the
genetic algorithm over CMAES for multiobjective optimization problems. Therefore, genetic
algorithm was used for the model optimization in the thesis project.
Table 10 provides the specifications related to the genetic algorithm used for optimizing the
two engine models. It must be noted that the specifications highlighted in the table below were
the same while optimizing both the engine models.
Table 10: Specifications of genetic algorithm
ATTRIBUTE OBJECT VALUEPopulation Size def (=calculated)
Number of Generations def (=15)
Crossover Rate def (=1)
Crossover Rate Distribution Index def (=15)
Mutation Rate def (=calculated)
Mutation Rate Distribution Index def (=20)
43

CHAPTER 3. METHOD & IMPLEMENTATION
From the table 10, all values related to the attributes were fed based on the default or the
recommended values by Gamma Technologies in their optimization manual [12]. However,
the most critical attributes regarding the optimization process were population size and number
of generations. The number of design conditions evaluated in the model optimization is a direct
function of these two attributes. Equation 3.16 describes this relationship.
No. of designs evaluated = Population size× No. of generations (3.16)
The attribute ”population size” in equation 3.16 depends on the number of engine factors to
be optimized [12]. According to the GTPowerTM optimization manual [12], the population
size is 50 if the number of factor values is greater than 9. During the optimization
of both the engine models, the number of factor values optimized was greater than 9.
These engine factor values have been highlighted in subsections 3.5.2 and 3.5.3.
Therefore, the population size was calculated as 50. As a result, the total number of design
conditions evaluated by the IDO was 750. This number corresponded to both the engine
models. After performing the genetic algorithmbased optimization, the optimization tool
in GTPowerTM recommended some optimized models out of all the 750 design conditions.
These optimized models encapsulated both local and global optimums. But GTPowerTM
specifies that it is impossible for any optimizer to identify the optimizedmodel which represents
the global optimum. Therefore, the user has to search through the entire design space of the
optimized models and thereafter decide the most suitable optimized model based on some
subjective information. Therefore, a subjectivebased framework was adopted for selecting the
most suitable optimized model within the optimization process. This framework is highlighted
in subsection 3.5.4.
3.5.2 Baseline engine model optimization
This subsection highlights and discusses the engine variables or factors which were optimized
for the baseline engine model. The range for each of these variables which was used as an input
for the optimization tool has been specified. This range was decided based on DOE studies
which yielded reasonably low BSFC values and high BP values across the operating range.
More information about theDOE studies has been explained inAppendix B.2. The optimization
approach discussed in subsection 3.5.1 was followed during the calibration of baseline engine
model. Table 11 lists all the engine variables, their corresponding part name according to figure
14 and the range considered for the variables during the optimization process.
44

CHAPTER 3. METHOD & IMPLEMENTATION
Table 11: Engine variables optimized for baseline engine model
ENGINE VARIABLE PART NAME RANGE UNITIntake Runner Length intrunner1, intrunner4 300700 mm
Intake Runner Diameter intrunner1, intrunner4 3380 mm
Intake Valve Opening (IVO) intvalve1, intvalve4 300360 CAD
Intake Valve Opening Duration intvalve1, intvalve4 150300 CAD
Fuel Injection Rate siinject1, siinject4 1840 g/s
Exhaust Port Length exhport1, exhport4 3070 mm
Exhaust Port Diameter exhport1, exhport4 3070 mm
Exhaust Valve Opening (EVO) exhvalve1, exhvalve4 102140 CAD
Exhaust Valve Opening Duration exhvalve1, exhvalve4 220320 CAD
Exhaust Runner Diameter PipeRound 7 3080 mm
Exhaust Runner Length PipeRound 7 3080 mm
Exhaust Split Chamber Length FlowSplitTRight3 3070 mm
Turbine Orifice Diameter TurbineSimple1 1540 mm
3.5.3 EPTE model optimization
This subsection highlights and discusses the engine variables or factors which were optimized
for the EPTE model. The range for each of these variables used as an input for the optimization
tool have been specified. This range was decided based on DOE studies which yielded
reasonably low BSFC values and high BP values across the operating range. More information
about the DOE studies has been explained in Appendix B.2. The optimization approach
discussed in subsection 3.5.1 was followed during the calibration of EPTE model. Table 12
lists all the engine variables, their corresponding part name according to figure 15 and the
range considered for the variables during the optimization process. It must be noted that
the component FlowSplitTRight3 was replaced by PistonCylinder11 in the EPTE model
as discussed in subsection 3.4.2. Therefore, parameters like bore diameter, geometrical
compression ratio and firing interval for the EXC component were optimized instead. All other
engine variables specified in table 11 were optimized in the EPTE model as well. Table 12 has
been depicted in the following page.
45

CHAPTER 3. METHOD & IMPLEMENTATION
Table 12: Engine variables optimized for EPTE model
ENGINE VARIABLE PART NAME RANGE UNITIntake Runner Length intrunner1, intrunner4 300700 mm
Intake Runner Diameter intrunner1, intrunner4 3380 mm
Intake Valve Opening (IVO) intvalve1, intvalve4 300360 CAD
Intake Valve Opening Duration intvalve1, intvalve4 150300 CAD
Fuel Injection Rate siinject1, siinject4 1840 g/s
Exhaust Port Length exhport1, exhport4 3070 mm
Exhaust Port Diameter exhport1, exhport4 3070 mm
Exhaust Valve Opening (EVO) exhvalve1, exhvalve4 102140 CAD
Exhaust Valve Opening Duration exhvalve1,exhvalve4 220320 CAD
Exhaust Runner Diameter PipeRound 7 3080 mm
Exhaust Runner Length PipeRound 7 3080 mm
Turbine Orifice Diameter TurbineSimple1 1540 mm
EXC Bore Diameter PistonCylinder11 70115 mm
EXC Compression Ratio PistonCylinder11 550 No Unit
EXC Firing Interval with respectto Cylinder1
PistonCylinder11 100200 CAD
3.5.4 Model evaluation
After the IDO tool suggested a set of optimized models for both the baseline engine and EPTE,
a subjectivebased framework was adopted to select the most suitable optimized model for both
the engines. This framework was based on the following requirements:
1. The most suitable optimized model should have minimum BSFC values within an
operating range of 2000 RPM to 5500 RPM, as compared to other optimized models.
2. The same optimized model should have maximum BP values for engine speeds of
6000 RPM and 6500 RPM, compared to other optimized models recommended by the
optimization tool in GTPowerTM. It must be noted that the engine speed range had an
interval size of 500 RPM for both the optimization and the evaluation process concerning
performance and gas exchange metrics.
This identification process behind selecting the most suitable optimized model for both the
baseline engine and EPTE was performed independently. This means that the selection was not
done parallelly, but rather in sequence for both the engine models. Such a practice ensured a
46

CHAPTER 3. METHOD & IMPLEMENTATION
fair and unbiased selection strategy, to enhance the internal validity of the results. After this
process was completed, the selected models for both the baseline engine and EPTE were ready
for postprocessing and analysis.
Data concerning the response variables and other emanating engine variables from the final
selection process was exported to Microsoft Excel for indepth analysis of the performance and
gas exchange metrics across the operating engine speed range. For quantifying the contribution
of the EXC component towards the total BP produced at the crankshaft, the friction parameters
from table 1 were used. These friction parameters were same for both the combustion cylinders
and EXC component. Using the friction parameters, cylinder geometry and combustion
cylinder peak pressure values, the BPwas calculated for each combustion cylinder for all engine
speeds under consideration. Subsequently, the brake power produced by the EXC component
was calculated by subtracting the BP produced by the combustion cylinders from the total
BP produced at the crankshaft. The results concerning overall performance and gas exchange
metrics have been discussed in the subsequent chapter.
47


Chapter 4
Results
In this chapter, the most critical results are discussed and analyzed for the baseline engine
and EPTE models after the optimization process. It compares the performance and critical
gas exchange metrics of EPTE with the baseline engine model. Other results discussed are
the exhaust cylinder’s contribution to total brake power, predicted hardware modifications
and normalized brake torque. All results analyzed were based on the background knowledge,
theoretical frameofreference and the modelling approach used in GTPowerTM.
4.1 Performance Metrics
This section presents the results obtained from the optimization simulations of baseline engine
and EPTE models. Comparison was done between both the engine models based on the
performance metrics such as BSFC and BP. This comparative analysis was done at different
limits of intake boost pressures: 1.5 bar, 2.5 bar and 3.5 bar. The limit in the intake boost
pressure of a turbocharged engine depends on the application area, and hence it was important to
get an overall sense on how the performance metrics would vary with the intake boost pressure
requirement and limits, for the EPTE model. The performance analysis was conducted across
a broad operating range: 20006500 RPM.
4.1.1 Brake Specific Fuel Consumption (BSFC)
This performance metric is an indicator of fuel efficiency of an ICE, which produces shaft
power using the burned fuel. BSFC is a typical performance indicator which helps to compare
the fuel efficiency of engines with a power output. It is the ratio of the fuel consumption rate to
49

CHAPTER 4. RESULTS
the power output produced at the flywheel. Lower BSFC is a target which engine developers
aim for, as it indicates better fuel economy and thereby relatively lower CO2 emissions from the
tailpipe. Figure 16 consolidates the changes in BSFC (in % terms) as a function of engine speed
for different intake boost pressure limits. This change in BSFC is with respect to the baseline
engine model. The intake boost pressure limits in bar is in absolute terms. The following
comparison was done for both the models of baseline engine and EPTE after the optimization
process. This was done to facilitate a fair comparison.
(a) @ 1.5 bar max. boost pressure
(b) @ 2.5 bar max. boost pressure
(c) @ 3.5 bar max. boost pressure
Figure 16: Change in BSFC v/s Engine Speed @ different boost pressure limits
50

CHAPTER 4. RESULTS
From figure 16, it is conclusive that maximum reduction in BSFC is observed at higher intake
boost pressure limits. At an intake boost pressure limit of 1.5 bar, the EPTE concept performed
worse than the baseline engine at the higher RPM i.e. from 55006500 RPM. Furthermore, the
reduction in BSFC at 1.5 bar maximum boost pressure was very minimal for the EPTE model
from low to mid RPM. At intake boost pressure limits of 2.5 bar and 3.5 bar, the EPTE model
performed better than the baseline engine model across the whole operating range, with the
percentage reduction in BSFC amplified when the limit of intake boost pressure was increased
from 2.5 bar to 3.5 bar. It is also interesting to note that the maximum reduction in BSFC
occured at 4500 RPM when the comparison was done at 2.5 bar and 3.5 bar of intake boost
pressure limits. The reason behind this is explained in section 4.3.
4.1.2 Brake Power (BP)
This performance indicator denotes the useful power produced at the crankshaft. From a
realistic standpoint, a portion of the BP is used to deliver power to engine auxiliaries such
as oil pump, water pump, camshaft, alternator etc. The remaining portion of the brake power
is used to drive the wheels via the transmission. It should be noted that BP is the product of
brake torque and the engine speed. Alternatively, it is also the remaining portion of the power
produced inside the engine cylinders after the frictional losses that take place while the piston
transfers the mechanical energy to the crankshaft, via the connecting rod.
Figure 17 consolidates the changes in BP (in% terms) as a function of engine speed for different
intake boost pressure limits. This change in BP is with respect to the baseline engine model.
The comparison between both the engine models was done after the optimization process to
execute it from an equitable perspective. Furthermore, the friction parameters of the cylinders
and pipes for both the baseline engine and EPTE models were unchanged throughout the
simulation process. This was done to make sure that these effects are isolated while the
comparison took place. Figure 17 is depicted in the succeeding page.
51

CHAPTER 4. RESULTS
(a) @ 1.5 bar max. boost pressure
(b) @ 2.5 bar max. boost pressure
(c) @ 3.5 bar max. boost pressure
Figure 17: Change in BP v/s Engine Speed @ different boost pressure limits
It was observed that the EPTE concept performed worse than the baseline engine model even
from the BP perspective, at an operating boost pressure limit of 1.5 bar. The performance from
the BP standpoint improved in the EPTE model when the boost pressure limit was increased to
2.5 bar. At the highest operating boost pressure limit i.e. 3.5 bar, EPTE model exhibited better
BP response across the whole operating RPM range. At 4500 RPM, EPTE concept proved to
be around 7%more powerful than the baseline engine. At 2500 RPM, the BP improvement was
just 0.12 %, and therefore it does not seem to be visible in the plot due to the scaling based on
52

CHAPTER 4. RESULTS
the minimum and maximum values. It must be noted that 43% increment in BP at 2000 RPM
with the EPTE concept was observed because the optimization process yielded a turbine orifice
diameter of 22 mm and 25 mm for the EPTE model and the baseline engine model respectively.
The smaller turbine orifice diameter for the EPTE model indicated that the turbocharger spools
up earlier in the operating range, compared to the baseline engine model. The faster spooling
up of the turbine in the new concept increased the BP abruptly, unlike the scenario in baseline
engine.
4.2 Gas Exchange Metrics
This section compares both the baseline engine and EPTE models based on gas exchange
metrics. The gas exchange metrics under interest are: Crankresolved pressure before and after
the turbine. These metrics are explained in the subsections 4.2.1 and 4.2.2. From section 4.1,
it was concluded that EPTE concept performs better than the baseline engine model across the
whole operating range when the boost pressure limit is set to 3.5 bar. Therefore, the plots related
to the critical gas exchange metrics are shown for the engines operating at 3.5 bar maximum
boost pressure.
4.2.1 Crankresolved pressure before turbine
This subsection deals with the comparison between the two engine models based on
crankresolved pressure plots before the turbine. This pressure is measured at part number
7 according to figures 14 and 15. Part number 7 is an exhaust runner connected to the turbine
inlet. The pressure plots are static pressure measurements in absolute terms.
The motive behind comparing the preturbine pressure plots for both the engine models was to
assess if the EPTE model facilitates in enhancing the degree of evenness in the exhaust pulse
which enters the turbine. This would help to confirm the claim cited in Olshammar’s patent
[27]. This comparison is shown in figure 18, in the succeeding page.
Figure 18 consolidates the pressure measurements before the turbine, for both the models:
Baseline engine and the EPTE. It must be noted that the plots in figure 18 have been imported
from GTPowerTM. In this figure, ”Olshammar engine” corresponds to the EPTE model. The
crankresolved pressure plot typically depicts the pressure variation across the whole engine
cycle i.e. across all the four strokes of the cycle. The xaxis in the plots which represents all
the strokes of the engine cycle, was referenced as per the first combustion cylinder.
53

CHAPTER 4. RESULTS
Figure 18: Crankresolved pressure before turbine Baseline engine and EPTE (Olshammar)
The first combustion cylinder is represented by ”cylinder1” as per figures 14 and 15. Figure 18
depicts the exhaust pressure trace at all operating conditions, ranging from 2000 RPM to 6500
RPM. It must be noted that in the baseline engine model, the pressure trace is more uneven
across the engine cycle, as compared to the EPTE model. This is because the pressure trace
coincides with 1 bar and values under it for the baseline engine model, during the major portion
of power and intake strokes. This indicated that therewas no extra pressure on the turbine during
these portions of the power and intake stroke, as the ambient pressure was set to atmospheric
i.e. 1 bar. In the case of EPTE model or Olshammar engine model, the pressure trace hardly
coincides with 1 bar. In most of the operating engine speeds, the exhaust pressure trace is above
1 bar for the whole duration of power and intake strokes. This indicated that the turbine in the
EPTEmodel is subjected to an extra pressure across the engine cycle. This extra pressure on the
turbine implied that there is more evenness in the exhaust pressure before the turbine, thereby
creating a more uniform turbine power distribution across the engine cycle. From such an
analysis, it was clear that the EPTE model increased the efficiency of the turbocharger, unlike
the baseline engine model.
54

CHAPTER 4. RESULTS
4.2.2 Crankresolved pressure after turbine
This subsection deals with the comparison between the two engine models based on
crankresolved pressure plots after the turbine. This pressure is measured at part number 24
according to figures 14 and 15. Part number 24 is an exhaust runner with one end connected to
the turbine outlet, and the other end linked to the atmosphere. It must be noted that the pressure
plots are static pressure measurements in absolute terms.
The motive behind comparing the postturbine pressure plots for both the engine models was to
assess the effect of the EXC on the muffler and aftertreatment sizing and weight. Reduction in
the size of such exhaust regulator components can also contribute to backpressure reduction,
thus maintaining better fuel economy levels.
Figure 19: Crankresolved pressure after turbine Baseline engine and EPTE (Olshammar)
Figure 19 consolidates the pressure measurements at the turbine outlet, for both the models:
Baseline engine and the EPTE. From the plots, it was observed that the exhaust pressure trace
had higher peaks and higher flutter in the baseline engine, when compared against the EPTE
concept. The design and overall size of exhaust regulator subsystems such as mufflers and
aftertreatment devices depend on the pulsating nature of the exhaust gas exiting the tailpipe.
The EPTE concept exhibited lower peaks and lesser fluttering nature of the exhaust gas across
55

CHAPTER 4. RESULTS
the whole engine cycle and operating RPM range. Therefore, it could be inferred that a more
compact and lower weight exhaust system could be designed and integrated with the turbine
outlet.
4.3 Exhaust Cylinder (EXC) Contribution to Total BP
This section discusses the portion of total BP contributed by the EXC. This analysis was done at
intake boost pressure limits: 1.5 bar, 2.5 bar and 3.5 bar. The motive of this section is to analyze
as to what extent the EXC contributes to power generation using the fact that a portion of the
exhaust gas flushing out of the combustion cylinders would exert gas pressure on the exhaust
piston. The exhaust piston corresponds to the piston in the EXC. Figure 20 consolidates the
plots which depict the percentage of total BP at the crankshaft which was contributed by the
EXC, at different limits of boost pressure. The specifications of the EXC component which
yielded these results are discussed in section B.1.
Based on Olshammar’s patent [27], a portion of the exhaust gas emanating from the two firing
cylinders push the piston in the EXC, whereas the remainder portion of the exhaust gas flows
directly to the turbocharger via the outlet (17) of the EXC, based on figure 10. To have a
better understanding of the BP contribution by the EXC, it was also vital to visualize the
PressureVolume (PV) trace inside the EXC. This is depicted in figure 21. The PV trace is
shown for all operating RPM.
Figure 20 has been depicted in the following page. From figure 20, it can be observed that
there was a marginal contribution by the EXC towards the total BP produced at the crankshaft,
when the EPTE concept operated at the minimum boost pressure limit under consideration,
i.e., 1.5 bar. Furthermore, there was negative contribution from the EXC at the lowest and
the highest RPM within the 1.5 bar boost pressure limit. At 2500 RPM, the contribution from
the EXC component was around 0.01 %. Therefore the bar is not visible due to the scaling
based on the minimum and maximum values. At 2.5 bar and 3.5 bar maximum boost pressure
limits, the EXC component contributed to around 5% and 7% respectively, towards the total
BP produced. These values corresponded to 4500 RPM, where the maximum contribution was
observed. This is explained further by figure 21.
56

CHAPTER 4. RESULTS
(a) @ 1.5 bar max. boost pressure
(b) @ 2.5 bar max. boost pressure
(c) @ 3.5 bar max. boost pressure
Figure 20: EXC Contribution in BP v/s Engine Speed @ different boost pressure limits
Figure 21 depicts the full PV trace inside the EXC component of the EPTE concept at 3.5 bar
boost pressure limit. It has been specifically shown for 3.5 barmaximumboost pressure because
themaximum contribution from the EXC occured at this operating condition. This PV trace was
imported fromGTPowerTM simulations. It must be noted that each RPM shows two lines in the
57

CHAPTER 4. RESULTS
trace, as these represent full 720 degrees across the engine cycle. The area inside the PV trace
is directly proportional to the BP contributed by the EXC component. Furthermore, the largest
area enclosed by the PV trace was observed at 4500 RPM, represented by the darkened violet
lines. Therefore, the maximum contribution towards the total BP occured at 4500 RPM, as
shown in figure 20. Another important observation was that the peak pressures were quite low
inside the EXC component, which indicated that this extra component could be manufactured
with lightweight and less sophisticated materials during the prototype building activity of the
EPTE. The peak pressure inside the EXC component was around 3.3% of the peak pressure
inside the combustion cylinders.
Figure 21: PV trace in EXC at 3.5 bar boost pressure limit
58

CHAPTER 4. RESULTS
4.4 Predicted Hardware Modifications
This section discusses the predicted hardware modifications required while translating the
baseline engine to the EPTE. These predictions in the hardware modifications were analyzed
for the optimized models of both the engines. Based on section 4.1, it was inferred that EPTE
model performed better than the baseline engine model both from the fuel consumption and
power output standpoint, at the higher boost pressure limits of 2.5 bar and 3.5 bar. Thus, it was
also vital to have a broad understanding of the extent to which the baseline engine should be
modified apart from adding the EXC component, to produce such benefits. The change in the
dimensions predicted in percentage terms was based on the intake and exhaust geometrical
parameters which were suggested for both the engine models after the model optimization
process.
4.4.1 Intake side
In the thesis project, the predicted modifications in the intake side dealt with the potential
changes in intake runner length and intake runner diameter for the EPTE model relative to
the baseline engine model. The intake plenum chamber volume was set to be six times the total
engine displacement of the cylinders with combustion, for both themodels: Baseline engine and
EPTE. This was done to ensure that there was an adequate level and even distribution of air to
the combustion cylinders. According to figures 14 and 15, the plenum chamber represented the
combined volume of parts FlowSplitTRight1, ManPipe1 and FlowSplitTRight2. According
to figure 14, the intake runner length represented the combined length of the components
intrunner1 and intport1 for cylinder1, and intrunner4 and intport4 for cylinder2. It must
be noted that the length of intake runners for each combustion cylinder were equal. Similarly
for figure 15, the intake runner length represented the combined length of the components
intrunner1 and intport1 for cylinder1, and intrunner4 and intport4 for cylinder4. Even for
the EPTEmodel, the intake runner lengths for each combustion cylinder were equal. The intake
runner diameter represented the diameter of the aforementioned components corresponding to
the baseline engine and EPTE model. For both the engine models, the intake runner diameter
was constant from the plenum chamber to the combustion cylinders. The diameter of intake
runners for each combustion cylinder were equal in the respective engine models.
59

CHAPTER 4. RESULTS
Figures 22 and 23 represent the relative changes in the intake runner length and intake runner
diameter for the EPTE model with respect to the baseline engine model. These changes were
predicted for the optimized models of baseline engine and EPTE for boost pressure limitss of
1.5 bar, 2.5 bar and 3.5 bar.
Figure 22: Change in Intake Runner Length v/s Boost Pressure Limit
Figure 23: Change in Intake Runner Diameter v/s Boost Pressure Limit
60

CHAPTER 4. RESULTS
Section 4.1 indicated that the EPTE model performed worse than the baseline engine model
at 1.5 bar boost pressure limit, from the BSFC and BP standpoint. Therefore, dimensional
reductions at 1.5 bar for the EPTE model depicted in figures 22 and 23 do not serve as a
purpose of this section’s analysis. At boost pressure limit of 2.5 bar, there was no change
in the intake runner length in the EPTE model, as indicated by figure 22. This implied that the
EPTE can be operated with the same intake runner length as the baseline engine, to produce
the benefits highlighted in section 4.1. At the same boost pressure limit, the optimized EPTE
model exhibited around 10% increase in the intake runner length, compared to the baseline
engine model.
According to figure 23, the EPTE model exhibited the benefits discussed in section 4.1 with
around 20 % narrower intake runner at a boost pressure limit of 2.5 bar. With an operating
maximum boost pressure of 3.5 bar, the EPTE model exhibited benefits highlighted in section
4.1 with the same dimensions of intake runner diameter as the baseline engine model.
4.4.2 Exhaust side
In the thesis project, the predicted modifications in the exhaust side dealt with the potential
changes in exhaust port length, exhaust port diameter, exhaust runner length, exhaust runner
diameter and turbine orifice diameter for the EPTEmodel, relative to the baseline enginemodel.
It must be note that these changes were measured for the optimized versions of the EPTEmodel
against the optimized baseline engine models at different limits of boost pressure.
Figure 24: Change in Exhaust Dimensions v/s Boost Pressure Limit
61
CHAPTER 4. RESULTS
From figure 24, it can be inferred that the EPTE model exhibited the least modification for
the exhaust runner length at 3.5 bar maximum boost pressure. Furthermore, it was deduced
that at 3.5 bar boost pressure limit, the EPTE could be made compact compared to the baseline
engine in relation to other exhaust geometrical variables such as exhaust port length, exhaust
port diameter, exhaust runner diameter and turbine orifice diameter while producing the benefits
discussed in section 4.1. It must be noted that after the optimization of both the engine models,
it was shown that EPTE could operate with the same exhaust port length as that of the baseline
engine. Therefore, the ”dark blue” bar is not visible at 2.5 bar maximum allowable boost
pressure in figure 24.
4.5 Normalized Brake Torque
The motive behind analyzing the normalized brake torque was to assess if the EPTE model
contributed towards the torque fluctuation suppression to a certain degree, when compared
against the baseline engine model. The theory related to torque fluctuation in an ICE has
been discussed in section 2.2. Such an analysis would help to compare the weight and sizing
of flywheel required for both the engines from a qualitative perspective. It must be noted
that the engine models simulated in GTPowerTM had no cranktrain inertia object in the part
EngineCranktrain. This indicated that the flywheel was modelled neither in the baseline
engine or the EPTE model. This also provided a foundation to perform a fair comparative
analysis for visualizing the effect of both the engine models on the flywheel sizing from a
qualitative standpoint.
Figure 25 depicts the variation of normalized brake torque as a function of crank angle degrees.
Based on section 4.1, the maximum benefit with the EPTE model was observed at 3.5 bar boost
pressure limit and an engine speed of 4500 RPM. Therefore, the graph was extracted for both
the enginemodels operating at a maximum allowable boost pressure of 3.5 bar and the operating
engine speed corresponding to figure 25 was 4500 RPM. As per section 4.1, both the engine
models had different power output levels throughout the operating speed range. This indicated
that the average torque values at a specific engine speed for both the baseline engine and EPTE
were different from each other. Therefore, in order to facilitate a fair comparison between
the two, it was vital to normalize the instantaneous torque values of both the engine models.
For any engine, the normalized brake torquewas calculated by dividing the instantaneous torque
by the average torque value at that operating engine speed. Figure 25 has been depicted and
discussed in the succeeding page.
62

CHAPTER 4. RESULTS
Figure 25: Comparison of CrankResolved Normalized Brake Torque
From figure 25, it can be inferred that the fluctuation in the normalized brake torque for
the EPTE model was lesser compared to that of the baseline engine model at 3.5 bar
maximum allowable boost pressure and 4500 RPM. In this analysis, peaktopeak difference
was considered as an indicator for measuring the fluctuation in normalized brake torque.
The reduction in this peaktopeak difference was observed to be around 6 % relative to the
baseline engine model. In section 2.2, it was discussed that lower fluctuations in torque
indicates that a flywheel of lower moment of inertia could be attached to the engine crankshaft.
Therefore, it was deduced that the EPTE has the potential to be operated with a lighter and more
compact flywheel, when compared to the baseline engine.
63


Chapter 5
Conclusions
This chapter summarizes the results discussed in chapter 4, and thereby provides answers to
the research questions listed in chapter 1. It further proposes some recommendations for future
work which would foster the development process of the EPTE.
5.1 Discussion
This section summarizes the results emanating from the concept assessment performed in the
thesis project. With this, the benefits and drawbacks of the EPTE concept can be visualized
based on a systemlevel simulation approach.
5.1.1 Fuel economy
The EPTE concept proved to be more fuel efficient than the conventional turbocharged ICE
topology at high boost pressure limits. However, the new concept exhibited higher fuel
consumption values for low boost pressure limit of 1.5 bar, mostly at the higher RPM.
The EPTE concept proved to be 4% more fuel efficient on average with 2.5 bar maximum
allowable boost pressure, and 5% more fuel efficient on average with 3.5 bar maximum
allowable boost pressure.
5.1.2 Power output and EXC’s contribution to brake power
The EPTE concept had lower BP levels compared to the baseline engine at 1.5 bar boost
pressure limit. This downside came with around 5% reduction on average across the operating
range. However, with higher boost pressure limit i.e. at 3.5 bar, the EPTE concept proved
65

CHAPTER 5. CONCLUSIONS
to deliver around 4% higher BP on average, when compared with the baseline engine.
The EXC component in the EPTE concept contributed to the total BP produced at the
crankshaft due to the exhaust gases driving the exhaust piston. It was observed that the EXC
component contributed to around 7% of the total BP at 4500 RPMwhen the boost pressure limit
was set to 3.5 bar.
5.1.3 Impact on turbocharger efficiency
The EPTE concept proved to improve the efficiency of the turbocharger with the help of the
EXC component, as per figure 18 This is because the EXC component helped in evening out
the exhaust pressure into the turbine inlet, which ensured a more even power distribution to the
turbine across the whole engine cycle, as compared to the baseline engine.
5.1.4 Impact on muffler and aftertreatment sizing
The EPTE concept proved that a more lightweight and compact muffler and aftertreatment
system could be integrated with the engine. This conclusion emanates from the analysis based
on figure 19. The EXC component helps in reducing the ”peaks” and ”flutters” in the exhaust
pressure measured at the turbine outlet. From this analysis it was inferred that the sizing of
exhaust regulation components like muffler and aftertreatment system could be reduced to a
suitable level, thereby achieving more compactness in the overall system.
5.1.5 Hardware modifications
Based on the analysis from section 4.4, it was concluded that the EPTE concept can produce
the benefits from the fuel economy and power output standpoint, while not having the need
to modify the intake and exhaust geometry radically. At boost pressure limit of 3.5 bar,
the EPTE concept needed the least modification in exhaust runner length. Whereas, other
exhaust geometrical parameters can be made more compact compared to the baseline engine.
From the intake side modification standpoint, the EPTE needed around 10 % increment in the
runner length and no modification in the runner diameter to produce benefits from the BSFC
and BP perspective.
66

CHAPTER 5. CONCLUSIONS
5.1.6 Impact on flywheel inertia
The EPTE concept proved that a more compact and lightweight flywheel could be used in
such an engine. This conclusion is based on figure 25. From this analysis, the peaktopeak
reduction in brake torque level was observed to be around 6%, when compared to the baseline
engine. This proved that the fluctuations in the torque level is lower and therefore a lower inertia
flywheel could be integrated with the EPTE concept. Thanks to the EXC component.
5.2 Recommendations
Based on the overall modelling and analysis process, the EPTE concept proved to have
higher benefits than the conventional turbocharged ICE topology from both fuel consumption
and power output standpoint. These benefits were observed for high boost pressure
limits. Therefore to foster and accelerate the development of the EPTE concept, it
would be recommended to assess such a concept for turbocharged engines operating at
high boost pressures. Diesel engines for heavyduty applications and largebore 4stroke
marine engines fall under this category. Assessing the potential of this concept for these
preexisting engine models can help to realize the benefits of the EPTE concept on a broader
level. Another recommendation would be to perform an assessment on existing turbocharged
engines for which performance maps are available for both the turbine and compressor
components. This will help to assess the turbocharger efficiency enhancement with better
resolution across the relevant operating speed range. Thirdly, a semipredictive combustion
model could be used while analyzing the impact of EXC component on the performance and
gas exchange metrics of the overall engine system. This would mean that the combustion
rate of airfuel mixture would be influenced by other input variables based on lookup tables.
It offers a good balance between predictive and nonpredictive combustion modelling from the
internal validity standpoint [10]. These studies will be crucial before commencing hardware
development activities.
67


References
[1] Branyon, David. and Simpson, Dean. “Miller Cycle Application to the Scuderi Split
Cycle Engine (by Downsizing the Compressor Cylinder)”. In: SAE 2012World Congress
Exhibition. SAE International, Apr. 2012. DOI: https://doi.org/10.4271/2012-
01-0419. URL: https://doi.org/10.4271/2012-01-0419.
[2] Bumby, J.R., Spooner, E.S., Carter, J., Tennant, H., Mego, G.G., Dellora, G., Gstrein,
W., Sutter, H., and Wagner, J. “Electrical machines for use in electrically assisted
turbochargers”. In: Second International Conference on Power Electronics, Machines
and Drives (PEMD 2004). Vol. 1. 2004, 344–349 Vol.1. DOI: 10.1049/cp:20040310.
[3] Chen, Simon K. and Flynn, Patrick F. Development of a Single Cylinder Compression
Ignition Research Engine. eng. SAE Technical Paper Series. 1965.
[4] Colin, Guillaume., Chamaillard, Yann., and Bellicaud, Benoit. “Robust control for the air
path of a downsized engine”. In: Proceedings of the Institution of Mechanical Engineers,
Part D: Journal of Automobile Engineering 225 (July 2011), pp. 930–943. DOI: 10.
1177/0954407011401503.
[5] Dijkstra, Rutger., Boot, Michael., Eichhorn, Ruud., Smeulders, D., Lennblad, Johan.,
and Serrarens, Alex. “Experimental Analysis of Engine Exhaust Waste Energy Recovery
Using Power Turbine Technology for Light Duty Application”. In: SAE International
Journal of Engines 5 (Jan. 2012), pp. 1729–1739. DOI: 10.4271/2012-01-1749.
[6] Draft Technical Assessment Report: Midterm Evaluation of LightDuty Vehicle
Greenhouse Gas Emission Standards and Corporate Average Fuel Economy Standards
for Model Years 20222025. Tech. rep. EPA, CARB, 2016. URL: https://nepis.epa.
gov/Exe/ZyPDF.cgi/P100OXEO.PDF?Dockey=P100OXEO.PDF.
[7] Ebisu, M., Danmoto, Y., Akiyama, Y., Arimizu, H., and Sakamoto, K. Development of
Variable Geometry Turbocharger Contributes to Improvement of Gasoline Engine Fuel
Economy. Tech. rep. Mitsubishi Heavy Industries Technical Review Vol. 53 No.3, Sept.
69

REFERENCES
2016. DOI: https://www.mhi.co.jp/technology/review/pdf/e533/e533030.
pdf.
[8] Ferrara,Michael. Twin Scroll vs. Single Scroll Turbo Test | TheGreat Divide. 20160229.
URL: https://dsportmag.com/the-tech/twin-scroll-vs-single-scroll-
turbo-test-the-great-divide/ (visited on 08/17/2021).
[9] Gamma Technologies, 2019. ENGINE (GTPOWER) COMPONENTS : IntercoolerEff
Intercooler Outlet Gas Temperature Control. Available in the template help for
’IntercoolerEff’. Last accessed 30/08/2021. Westmont, IL, 2019.
[10] Gamma Technologies, 2019. Engine Performance Application Manual Version 2019.
Last accessed 25/08/2021. Westmont, IL, 2019.
[11] Gamma Technologies, 2019. Flow Theory Manual Version 2019. Last accessed
25/08/2021. Westmont, IL, 2019.
[12] Gamma Technologies, 2019. Optimization Manual Version 2019. Last accessed
01/09/2021. Westmont, IL, 2019.
[13] Gamma Technologies, 2019. TURBINES, PUMPS AND
COMPRESSORS COMPONENTS: CompressorSimple Simple Compressor if No Map
Data Available. Available in the template help for ’CompressorSimple’. Last accessed
01/09/2021. Westmont, IL, 2019.
[14] Gamma Technologies, 2019. TURBINES,
PUMPS AND COMPRESSORS COMPONENTS: TurbineSimple Simple Turbine if No
Map Data Available. Available in the template help for ’TurbineSimple’. Last accessed
01/09/2021. Westmont, IL, 2019.
[15] GTPOWER Engine Simulation Software. 2015. URL: https://www.gtisoft.com/
wp-content/uploads/2015/01/Power1.pdf (visited on 08/24/2021).
[16] Heywood, John B. “ENGINE OPERATING CYCLES”. en. In: Internal Combustion
Engine Fundamentals, Second Edition. 2nd edition. NewYork:McGrawHill Education,
2018. ISBN: 9781260116106. URL: https://www.accessengineeringlibrary.
com / content / book / 9781260116106 / toc - chapter / chapter1 / section /
section4.
70

REFERENCES
[17] Heywood, John B. “INTRODUCTION AND HISTORICAL PERSPECTIVE”. en.
In: Internal Combustion Engine Fundamentals, Second Edition. 2nd edition. New
York: McGrawHill Education, 2018. ISBN: 9781260116106. URL: https://www.
accessengineeringlibrary . com / content / book / 9781260116106 / toc -
chapter/chapter1/section/section2.
[18] Heywood, John B. “SUPERCHARGING AND TURBOCHARGING”. en. In:
Internal Combustion Engine Fundamentals, Second Edition. 2nd edition. New York:
McGrawHill Education, 2018. ISBN: 9781260116106. URL: https : / / www .
accessengineeringlibrary . com / content / book / 9781260116106 / toc -
chapter/chapter6/section/section47.
[19] Ishii, Mori., Shimokawa, Kiyohiro., Machida, Koichi., and Nakajima, Hiroshi. “A Study
on Improving Fuel Consumption of HeavyDutyDiesel Engine Specifically Designed for
LongHaul Trucks on Highway”. In: Apr. 2015. DOI: 10.4271/2015-01-1256.
[20] Jääskeläinen, Hannu. Miller Cycle Engines. 20191204. URL: https://dieselnet.
com/tech/engine_miller-cycle.php#early-late (visited on 08/17/2021).
[21] Kim, SeHwan. and Seok, JulKi. “Comprehensive PM motor controller design for
electrically assisted turbocharger systems”. In: 2013 IEEE Energy Conversion Congress
and Exposition. 2013, pp. 860–866. DOI: 10.1109/ECCE.2013.6646793.
[22] Lee,Woongkul., Schubert, Erik., Li, Yingjie., Li, Silong., Bobba, Dheeraj., and Sarlioglu,
Bulent. “Overview of Electric Turbocharger and Supercharger for Downsized Internal
Combustion Engines”. In: IEEE Transactions on Transportation Electrification 3 (Mar.
2017), pp. 36–47. DOI: 10.1109/TTE.2016.2620172.
[23] Miller, Ralph. Supercharged engine. patent US2817322A. 19571224. URL: https:
//patents.google.com/patent/US2817322A/en.
[24] Nhut, Lam. “Double CompressionExpansion Engine Concepts: Experimental and
simulation study of a splitcycle concept for improved brake efficiency”. English.
Defence details Date: 20190503 Time: 10:15 Place: LectureHallM:B,MBuilding, Ole
Römers väg 1, LundUniversity, Faculty of Engineering LTHExternal reviewer(s) Name:
Morgan, Robert Title: Professor Affiliation: University of Brighton, United Kingdom—.
PhD thesis. 2019. ISBN: 9789178950508.
[25] Nikuradse, J. Strömungsgesetze in rauhen Rohren. Forschungsheft. Beilage zu
“Forschung auf dem Gebiete des Ingenieurwesens”. Ausgabe B Band 4, JuliAugust
1933 ; VDIVerlag, 1933.
71

REFERENCES
[26] Noga, Marcin. “Fivestroke Internal Combustion Engine yesterday, today and
tomorrow”. In: IOP Conference Series: Materials Science and Engineering 421 (Oct.
2018), p. 042058. DOI: 10.1088/1757-899X/421/4/042058.
[27] Olshammar, Mats. Internal Combustion Engine with Turbocharge Arrangement. 2019.
URL: https://patents.google.com/patent/WO2019078776A1/en.
[28] Olsson, Viktor. An onengine twinscroll turbine performance estimation. 2015. URL:
http://urn.kb.se/resolve?urn=urn:nbn:se:kth:diva-170801.
[29] Ratnaweera, Asanga. Design of a Flywheel. URL: http://eng.pdn.ac.lk/old/
mechanical/menu/class/downloads/notes/flywheel_ppt.pdf.
[30] Romagnoli, Alessandro., Copeland, Colin D., MartinezBotas, Ricardo., Seiler, Martin.,
Rajoo, Srithar., and Costall, Aaron. “Comparison Between the Steady Performance of
DoubleEntry and TwinEntry Turbocharger Turbines”. In: Journal of Turbomachinery
135.1 (Oct. 2012). 011042. ISSN: 0889504X. DOI: 10 . 1115 / 1 . 4006566. eprint:
https://asmedigitalcollection.asme.org/turbomachinery/article-pdf/
135/1/011042/6296719/turb\_135\_1\_011042.pdf. URL: https://doi.org/
10.1115/1.4006566.
[31] Schmitz, Gerhard. Fivestroke internal combustion engine, Patent US6553977B2. 2003
0429. URL: https://patents.google.com/patent/US6553977B2/en.
[32] Schutting, Eberhard., Dumböck, Ortwin., Kraxner, Thomas., and Eichlseder, Helmut.
“Thermodynamic consideration of the Miller cycle on the basis of simulation and
measurements”. In: Internationaler Motorenkongress 2016. Ed. by Johannes. Liebl and
Christian. Beidl. Wiesbaden: Springer Fachmedien Wiesbaden, 2016, pp. 259–280.
ISBN: 9783658129187.
[33] Shahed, S. and Bauer, KarlHeinz. “Parametric Studies of the Impact of Turbocharging
on Gasoline Engine Downsizing”. In: SAE International Journal of Engines 2 (Oct.
2009), pp. 1347–1358. DOI: 10.4271/2009-01-1472.
[34] Silva Cardoso, D., Oliveira Fael, P., and EspíritoSanto, A. “Instantaneous angular
velocity and torque on Otto singlecylinder engine: A theoretical and experimental
analysis”. In: Energy Reports 6 (2020). The 7th International Conference on Energy
and Environment Research—“Driving Energy and Environment in 2020 Towards A
Sustainable Future”, pp. 43–48. ISSN: 23524847. DOI: https://doi.org/10.1016/
j . egyr . 2020 . 10 . 031. URL: https : / / www . sciencedirect . com / science /
article/pii/S2352484720313846.
72

REFERENCES
[35] Subramani, DA., Dhinagaran, R., and Prasanth, VR. “Introduction to turbocharging—a
perspective on air management system”. In: Design and Development of Heavy Duty
Diesel Engines. Springer, 2020, pp. 85–193.
[36] Twinscroll turbochargers. URL: https : / / x - engineer . org / automotive -
engineering / internal - combustion - engines / ice - components - systems /
twin-scroll-turbochargers/ (visited on 08/12/2021).
[37] Uhlmanna, Tolga., Lückmannb, Dominik., Aymannsa, Richard., Scharf, Johannes.,
Höpkeb, Björn., Scassac, Mauro., Rüttena, Oliver., Schornd, Norbert., and Kindld,
Helmut. “DEVELOPMENT AND MATCHING OF DOUBLE ENTRY TURBINES
FOR THE NEXT GENERATION OF HIGHLY BOOSTED GASOLINE ENGINES”.
In: 2014.
[38] Venkataraman, V. “The Miller Cycle on SingleCylinder and Serial Configurations of a
HeavyDuty Engine”. In: 2018. URL: https://kth.diva-portal.org/smash/get/
diva2:1196111/FULLTEXT01.pdf.
[39] Wu, Chih., Puzinauskas, Paul V., and Tsai, Jung S. “Performance analysis and
optimization of a supercharged Miller cycle Otto engine”. In: Applied Thermal
Engineering 23.5 (2003), pp. 511–521. ISSN: 13594311. DOI: https://doi.org/
10.1016/S1359-4311(02)00239-9. URL: https://www.sciencedirect.com/
science/article/pii/S1359431102002399.
73


Appendix A
GTPowerTM Modelling
Appendix A deals with additional GTPowerTM modelling theories required to understand the
methodology better along with enlarged views of baseline engine and EPTE models.
A.1 Modelling Theory
This section explains additional theory regarding time step calculation and split flow modelling
briefly mentioned in subsections 3.3.1 and 3.4.1. All equations in this section are derived from
GTPowerTM documentation files [10, 11].
Time step calculation
Courant condition specifies the condition that must be satisfied to achieve convergence while
solving flow equations like the NavierStokes equations in explicit method. the time step must
be chosen in such a way that it satisfies the Courant condition in order to achieve numerical
stability. The Courant number, C, is a dimensionless number that establishes the relation
between time step and discretization length [11]. The Courant condition is given by:
∆t
∆x(|u|+ c) ≤ C ∗m (A.1)
We can get the equation A.2 for time step by rearranging the equation A.1 and removing the
inequality.
∆t =C ∗M ∗∆x
|u|+ c(A.2)
I

APPENDIX A. GTPOWERTM MODELLING
where, ∆t is the time step (s), ∆x is the minimum discretization length of the element (m),
u is the fluid velocity (m/s), c is the speed of sound (m/s) and M is the time step multiplier
specified by the user in RunSetup (less than or equal to 1.25).
The value of C should be equal to or less than 1.0. GTPowerTM uses a value C = 0.8 to make
sure that a wide range of models can attain solution stability [11].
Split flow modelling
The flow solver in GTPowerTM provides a onedimensional solution of the NavierStokes
equation. At the centers of finite volumes, mass and energy equations (scalar) are calculated,
while mass flow equation (vector) are solved at the boundaries between them. A flowsplit is
formed when a finite volume has several entrances. Friction and heat transfer solutions are
computed in the same way that pipes are. The key distinction is that the velocities used in
calculating friction and heat transfer coefficients are weighted boundary velocities [11].
In this thesis, FlowSplitTRight object was used. This object has three boundaries, with one
pipe being perpendicular to the other two pipes, resembling the shape of ‘T’. This object is
a simplified way of modelling a pipe that intersects with another pipe at right angles. This
flowsplit is defined in the same way that a pipe is, with only the main diameter and length
of the flowsplit required to define the flowsplit geometry. The boundary geometry is known
from the FlowSplitTRight object’s default geometry as well as the associated orifices and pipes.
Figure 26 depicts the FlowSplitTRight object, where dx is the discretization length andD is the
internal expansion diameter of boundaries 1 and 2 [11].
Figure 26: FlowSplitTRight object [11]
II

APPENDIX A. GTPOWERTM MODELLING
A.2 Baseline engine & EPTE models Enlarged view
Figure 27: Baseline Engine Model Enlarged View
III

APPENDIX A. GTPOWERTM MODELLING
Figure 28: EPTE model Enlarged View
IV
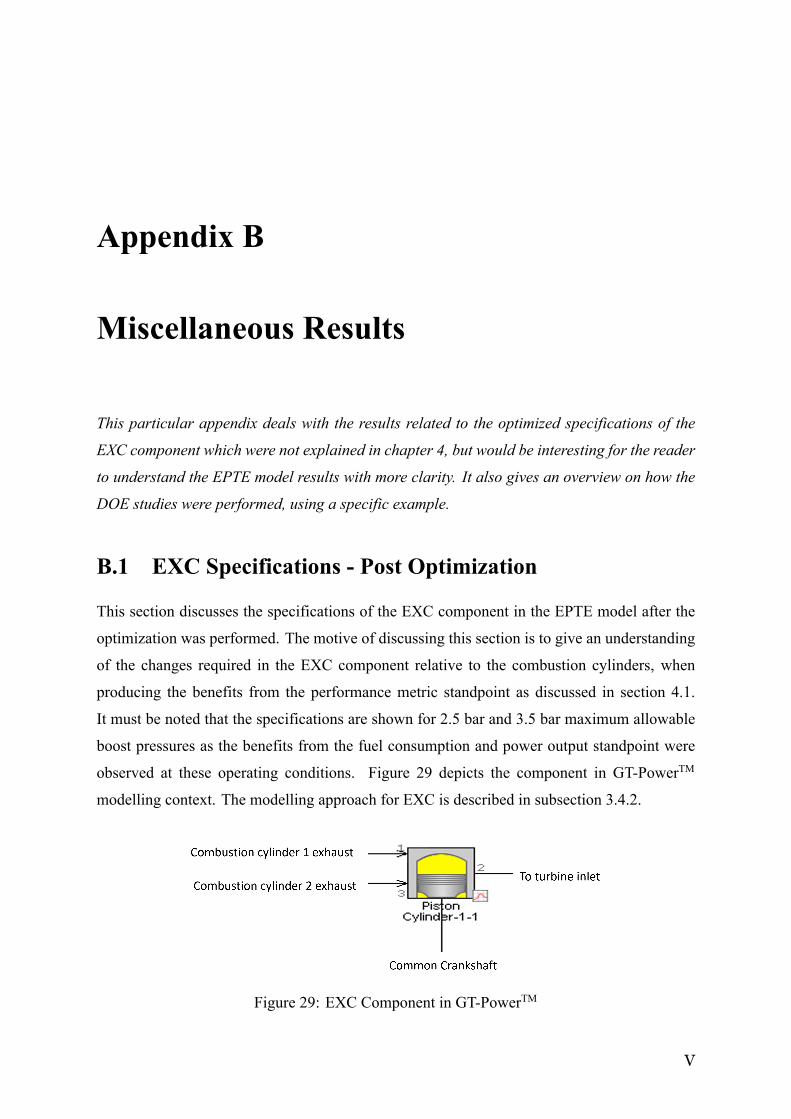
Appendix B
Miscellaneous Results
This particular appendix deals with the results related to the optimized specifications of the
EXC component which were not explained in chapter 4, but would be interesting for the reader
to understand the EPTE model results with more clarity. It also gives an overview on how the
DOE studies were performed, using a specific example.
B.1 EXC Specifications Post Optimization
This section discusses the specifications of the EXC component in the EPTE model after the
optimization was performed. The motive of discussing this section is to give an understanding
of the changes required in the EXC component relative to the combustion cylinders, when
producing the benefits from the performance metric standpoint as discussed in section 4.1.
It must be noted that the specifications are shown for 2.5 bar and 3.5 bar maximum allowable
boost pressures as the benefits from the fuel consumption and power output standpoint were
observed at these operating conditions. Figure 29 depicts the component in GTPowerTM
modelling context. The modelling approach for EXC is described in subsection 3.4.2.
Figure 29: EXC Component in GTPowerTM
V

APPENDIX B. MISCELLANEOUS RESULTS
The component has the following features:
1. It is placed in between the two combustion cylinders.
2. It is connected to the same crankshaft as that of the combustion cylinders.
3. Since the EXC component is placed on a common crankshaft, it has the same stroke
length as that of the combustion cylinders.
4. There is no combustion occurring inside.
5. There are no valves inside the EXC component.
6. Since there are no valves inside, the EXC component can have a different compression
ratio compared to that of the combustion cylinders. Absence of valves prevents high
pressure build up, even if the compression ratio is high.
(a) Bore Diameter Comparison EXC and Combustion Cylinder
(b) Compression Ratio Comparison EXC and Combustion Cylinder
Figure 30: EXC Specifications Post Optimization
VI

APPENDIX B. MISCELLANEOUS RESULTS
Figure 30 shows the comparison of cylinder bore diameter and geometrical compression ratio
between the EXC component and the combustion cylinder. After the optimization for the EPTE
model was performed, these geometrical characteristics were compared. From figure 30, it
was inferred that the EXC component needs to be wider compared to the combustion cylinder,
while maintaining the same stroke length. Furthermore, higher geometrical compression
ratio is required compared to the combustion cylinder. It must be noted that the absence of
valves and combustion inside the EXC component would help in achieving higher geometrical
compression ratio relative to the combustion cylinder.
B.2 Design of Experiments (DOE)
As mentioned in section 3.5, DOE studies were performed before the commencement of the
model optimization process. The motive behind performing DOE studies was to understand
the behaviour of the baseline engine and EPTE models from the BSFC and BP standpoint,
under the influence of various engine variables. Furthermore, the studies were also useful in
identifying a suitable range for the engine variables, which was later deployed in IDO during
the optimization process as per tables 11 and 12.
The DOE studies performed were based on an iterative approach. In a DOE study, the influence
of two engine variables on BSFC and BP were analyzed, while keeping all other factors
constant. While performing a DOE study, a range for both the input variables were considered
along with a specified interval size. After the analysis, the range and interval size of the
input variables were changed to accommodate the resolution demands of the study, if needed.
All the DOE studies were based on a fullfactorial method i.e., every possible combination of
both the input variables within the specified range was analyzed to understand the response of
both the engine models from the BP and BSFC perspective. The most suitable combination
of the two input variables were then chosen which yielded maximum BP and minimum BSFC
across the operating engine RPM range. This combination was further used in the subsequent
DOE study which involved a combination of other engine variables.
Since it was not possible to include all the DOE results in this report because of its iterative
nature, an example has been depicted which would help in understanding on how this process
was performed. Figures 31 and 32 have been represented in the following page to serve as an
example.
VII

APPENDIX B. MISCELLANEOUS RESULTS
Figure 31: DOE Plots for BP Turbine Orifice Diameter & Max. Allowable Boost Pressure
Figure 32: DOE Plots for BSFC Turbine Orifice Diameter & Max. Allowable Boost Pressure
VIII

APPENDIX B. MISCELLANEOUS RESULTS
Figures 31 and 32 depict one of the DOEbased simulations performed before the optimization
process. These figures capture the BP and BSFC of the EPTE model under the influence of
a range of turbine orifice diameters, and maximum allowable boost pressures regulated by the
wastegate of the turbocharger. All other factors related to the engine model within the particular
DOEbased simulation were kept constant. The plots are shown for 2000, 3000, 4000 and
5000 RPM within the considered range of 2000 RPM to 6500 RPM. The xaxis and yaxis
values represent the tested points in the DOE study. The plots implied that the most suitable
combination which yielded maximum power output and best fuel economy across the engine
RPM range, was 20 mm turbine orifice diameter at 3.5 bar max. allowable boost pressure.
This combination, represented in white circles, was then used as a constant input factor for
the subsequent DOE study. The process continued until the engine models were visualized on
a systemlevel, and a reasonable range of engine variables was decided for the optimization
process to provide a more accurate and fair platform for the comparison of baseline engine and
EPTE models.
IX