Embed Size (px)
Citation preview
ALAEDDIN MOHAMED EJLEDI
A thesis submitted in fulfillment of the requirement for the award of the
Degree of Master of Engineering
Faculty of Mechanical and Manufacturing Engineering
University Tun Hussein Onn Malaysia
MAY 2011

Abstract
The chassis dynamometer room is one of many extensions in the automotive
laboratory, UTHM, which is one of a few dynamometer rooms available in Malaysia.
Consequently, it becomes highlighted facility to do tests and researches with respect
to vehicle components such as the braking, cooling, and electrical systems. The
major application however is to evaluate engine performance. Ventilation system is
an essential system to reduce the air pollution, thus maintain acceptable indoor air
quality (IAQ) in any chassis dynamometer room. Currently, the room depends on
two types of ventilation: natural ventilation through two windows and a door,
enhanced with mechanical ventilation which is an exhaust fan placed on the top of
the room. Unfortunately, the existing ventilation system is not sufficient to support
activities conducted in the room as was proven in the IAQ study. Therefore in the
current study, results of a computational fluid dynamics (CFD) for air flow and
thermal distribution in the tested room are presented. CFD results expose the
weaknesses of the existing system. Thus, a much better air flow structure and thermal
distribution as required shall be provided by the installation of a new improved
ventilation design as proposed in this study.
Abstrak
Ruang chassis dynamometer merupakan salah satu lanjutan yang banyak di
makmal otomotif, UTHM, yang merupakan salah satu ruang dinamometer yang
terdapat di Malaysia. Akibatnya, ia menjadi kemudahan yang terserlah untuk
diuji dan dikaji dalam kaitannya dengan komponen kenderaan seperti brek,
pendingin, dan sistem elektrik. Namun, aplikasi umumnya ialah untuk
membuat penilaian terhadap prestasi enjin. Sistem Pengudaraan merupakan
sistem penting untuk mengurangkan pencemaran udara, sehingga menjaga
kualiti udara yang boleh diterima dalam ruang (IAQ) di setiap ruang
dinamometer chassis. Pada masa ini, ruang bergantung pada dua jenis
pengudaraan: pengudaraan semulajadi melalui dua jendela dan pintu,
dipertingkatkan dengan pengudaraan mekanikal yang merupakan exhaust fan
diletakkan di atas ruang. Malangnya, sistem pengudaraan yang ada tidak cukup
untuk menyokong kegiatan yang dilakukan di ruangan tersebut sebagaimana
terbukti dalam kajian IAQ. Oleh kerana itu dalam kajian ini, keputusan
pengkomputeran dinamik bendalir (CFD) untuk aliran udara dan pengedaran
panas di ruangan itu dipersembahkan. Hasil daripada CFD mendedahkan
kelemahan sistem yang sedia ada. Dengan demikian, struktur aliran udara yang
jauh lebih baik dan pengedaran terma yang diperlukan hendaklah disediakan
oleh pemasangan rekabentuk pengudaraan yang baru diperbaiki seperti yang
dicadangkan dalam kajian ini.
CONTENTS
TITLE i
DECLARATION ii
DEDICATION iii
ACKNOWLEDGEMENT iv
ABSTRACT v
ABSTRAK vi
CONTENTS vii
LIST OF TABLES xi
LIST OF FIGURES xiii
LIST OF SYMBOLS xvii
viii
CHAPTER 1 INTRODUCTION
Introduction 1
1.1 Problem statement 3
1.2 Objective of study 4
1.3 Scope of study 5
1.4 Expected Results 5
1.5 Methodology of study 6
1.6 Gantt chart 7
CHAPTER 2 LITERATURE REVIEW
Introduction 8
2.1 Ventilation system 8
2.1.1 Simulation of ventilation air flow 10
2.1.2 Analysis on natural ventilation in buildings or rooms 12
2.2 Indoor Air quality 13
2.2.1 Effect fresh air on indoor air quality 14
2.2.2 Thermal comfort 16
2.2.3 Indoor air quality in garage 18

ix
CHAPTER 3 INDOOR AIR QUALITY STUDY
3.1 Experiment and procedures 21
3.2 Measurement of Indoor Environmental Parameters 22
3.2.1 Toxic GAS Measuring Equipment (TG – 501) 22
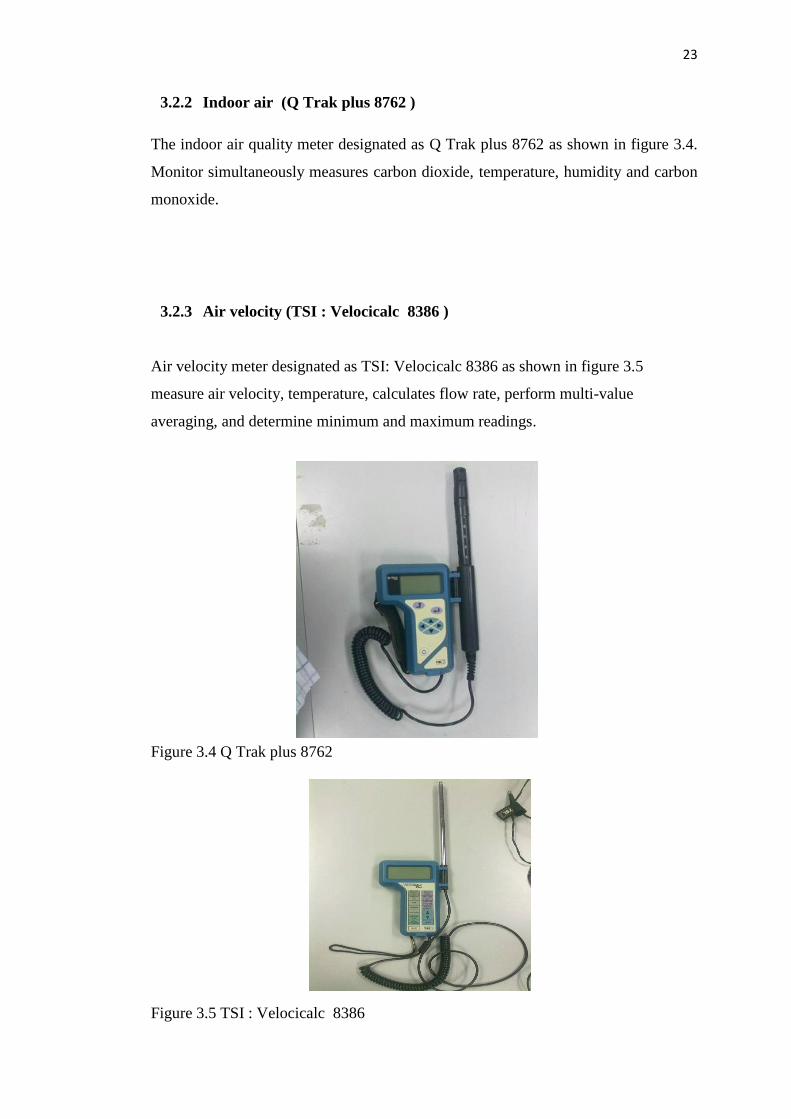
3.2.2 Indoor air (Q Trak plus 8762 ) 23
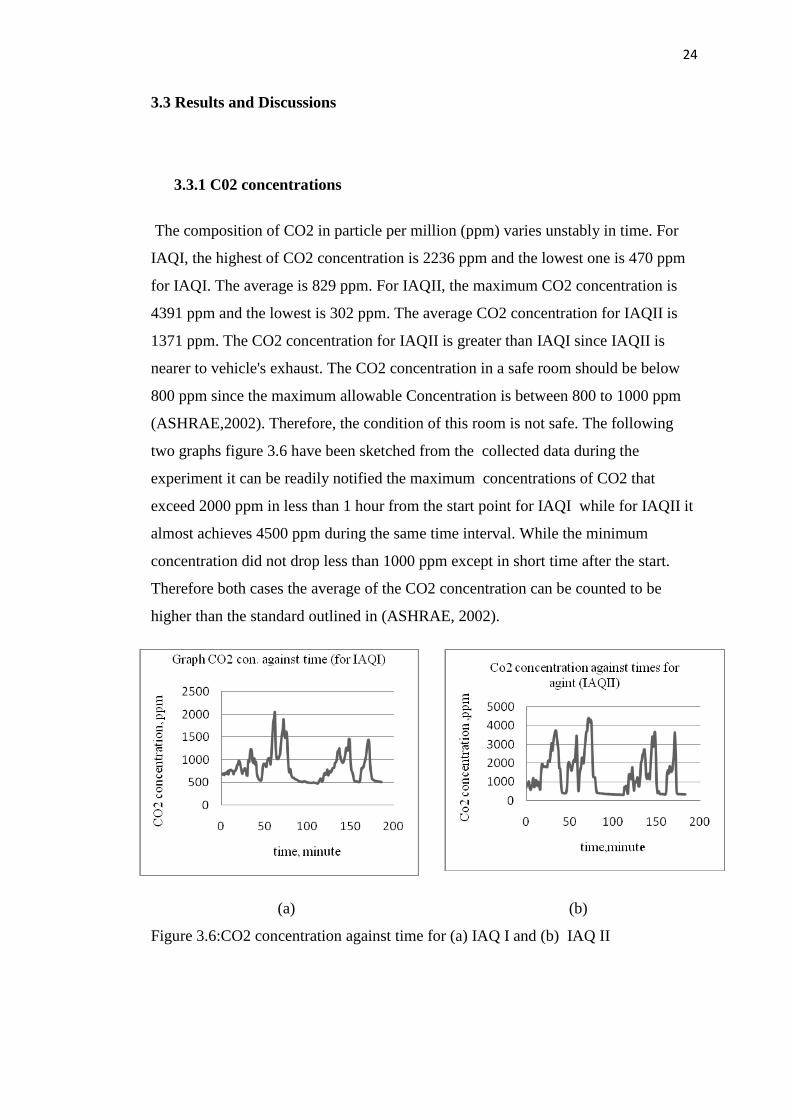
3.2.3 Air velocity (TSI : Velocicalc 8386 ) 23
3.3. Results and Discussions 24
3.3.1 C02 concentrations 24
3.3.2 CO Concentrations 25
3.3.3 Temperature 25
3.3.4 Relationship between CO2 concentration and temperature 26
3.3.5 Velocity and airflow rates 27
3.3.6 Relative humidity 28
3.4 Conclusion for IAQ Study
29
CHAPTER 4 NUMERICAL METHODOLOGY
4.1 Computational Fluid Dynamics (CFD) 30
4.2 Gambit CFD Model (Geometry and mesh)
.
32
x
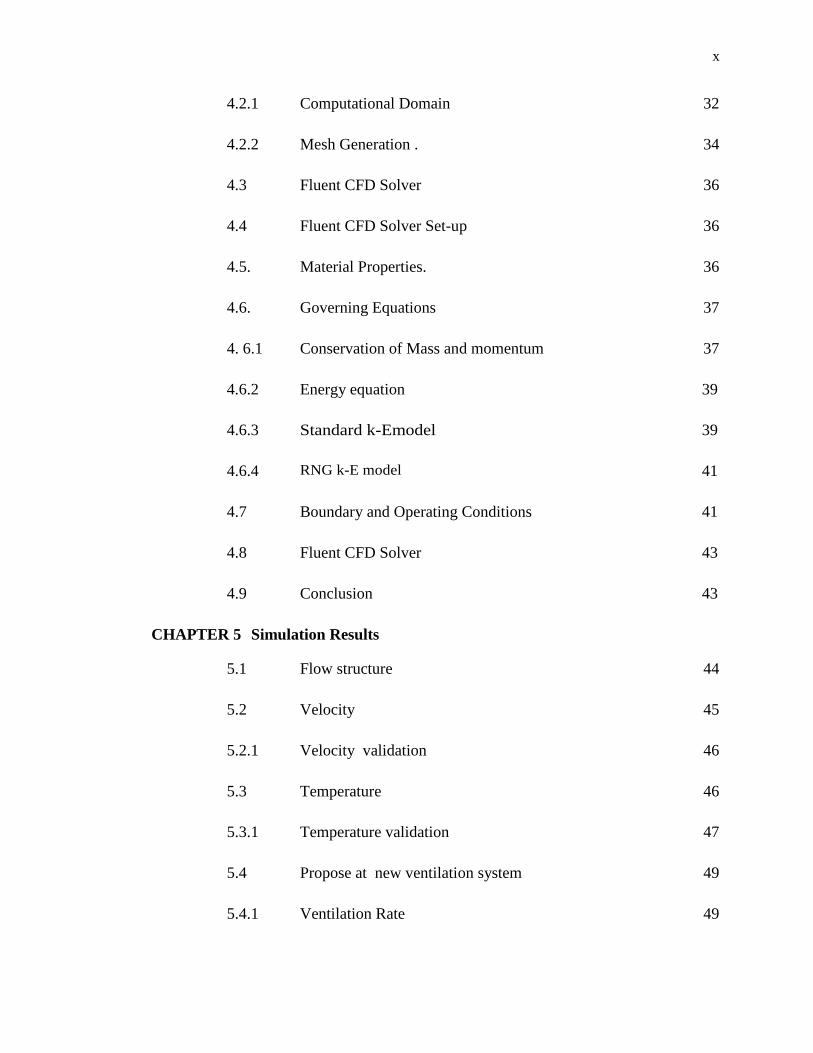
4.2.1 Computational Domain 32
4.2.2 Mesh Generation . 34
4.3 Fluent CFD Solver 36
4.4 Fluent CFD Solver Set-up 36
4.5. Material Properties. 36
4.6. Governing Equations 37
4. 6.1 Conservation of Mass and momentum 37
4.6.2 Energy equation 39
4.6.3 Standard k-Emodel 39
4.6.4 RNG k-E model 41
4.7 Boundary and Operating Conditions 41
4.8 Fluent CFD Solver 43
4.9 Conclusion 43
CHAPTER 5 Simulation Results
5.1 Flow structure 44
5.2 Velocity 45
5.2.1 Velocity validation 46
5.3 Temperature 46
5.3.1 Temperature validation 47
5.4 Propose at new ventilation system 49
5.4.1 Ventilation Rate 49

xi
5.4.2 Improved Ventilation System 50
CHAPTER 6 Conclusion and recommendation 52
APPENDIX Indoor air quality measurement in chassis dynamometer
room
53
ASHARE standard 59
REFERENCES
60
xii
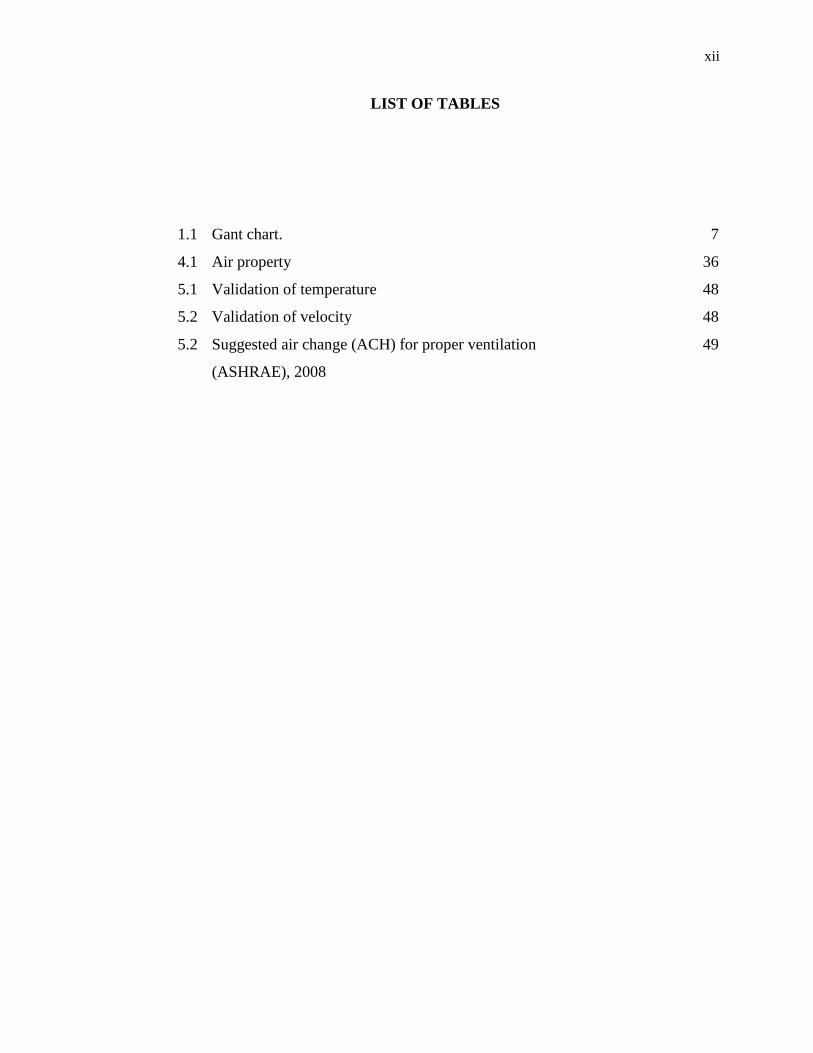
LIST OF TABLES
1.1 Gant chart. 7
4.1 Air property 36
5.1 Validation of temperature 48
5.2 Validation of velocity 48
5.2 Suggested air change (ACH) for proper ventilation
(ASHRAE), 2008
49
xiii
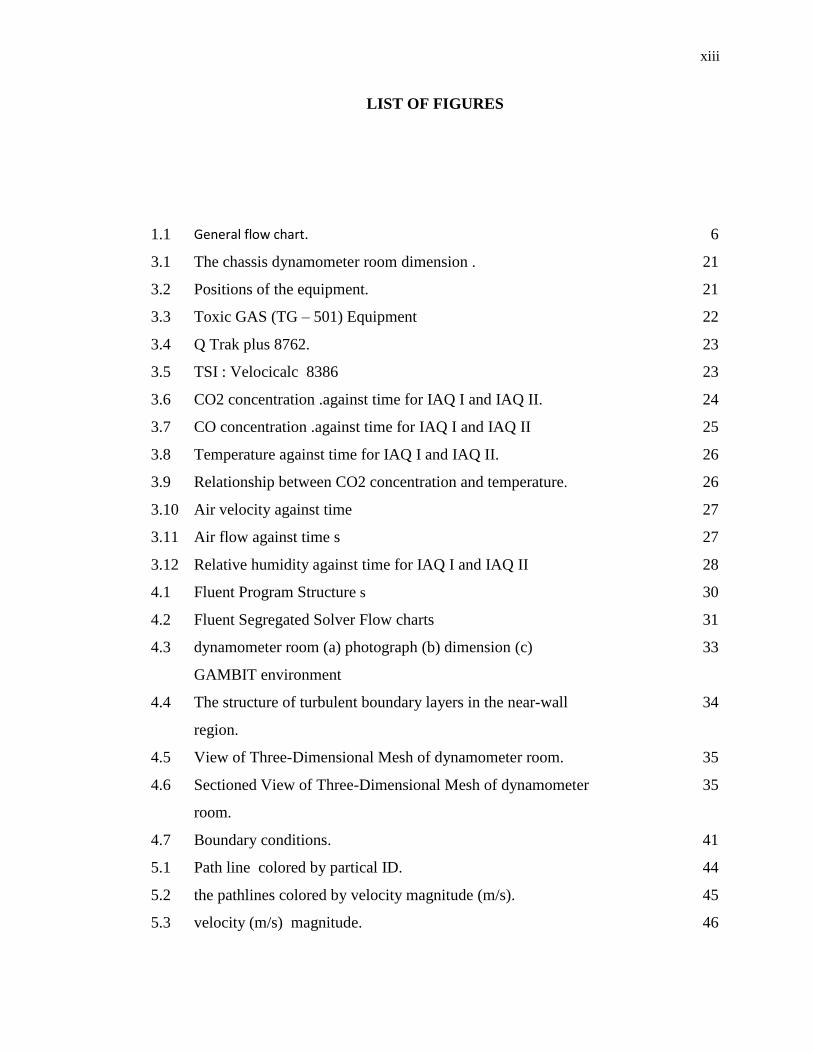
LIST OF FIGURES
1.1 General flow chart. 6
3.1 The chassis dynamometer room dimension . 21
3.2 Positions of the equipment. 21
3.3 Toxic GAS (TG – 501) Equipment 22
3.4 Q Trak plus 8762. 23
3.5 TSI : Velocicalc 8386 23
3.6 CO2 concentration .against time for IAQ I and IAQ II. 24
3.7 CO concentration .against time for IAQ I and IAQ II 25
3.8 Temperature against time for IAQ I and IAQ II. 26
3.9 Relationship between CO2 concentration and temperature. 26
3.10 Air velocity against time 27
3.11 Air flow against time s 27
3.12 Relative humidity against time for IAQ I and IAQ II 28
4.1 Fluent Program Structure s 30
4.2 Fluent Segregated Solver Flow charts 31
4.3 dynamometer room (a) photograph (b) dimension (c)
GAMBIT environment
33
4.4 The structure of turbulent boundary layers in the near-wall
region.
34
4.5 View of Three-Dimensional Mesh of dynamometer room. 35
4.6 Sectioned View of Three-Dimensional Mesh of dynamometer
room.
35
4.7 Boundary conditions. 41
5.1 Path line colored by partical ID. 44
5.2 the pathlines colored by velocity magnitude (m/s). 45
5.3 velocity (m/s) magnitude. 46

xiv
5. 4 path lines colored by total temperature (c ). 47
5.5 Plan section showing point A,B. 47
5.6 Plan section showing point C 48
5.7 new ventilation system design 50
xv
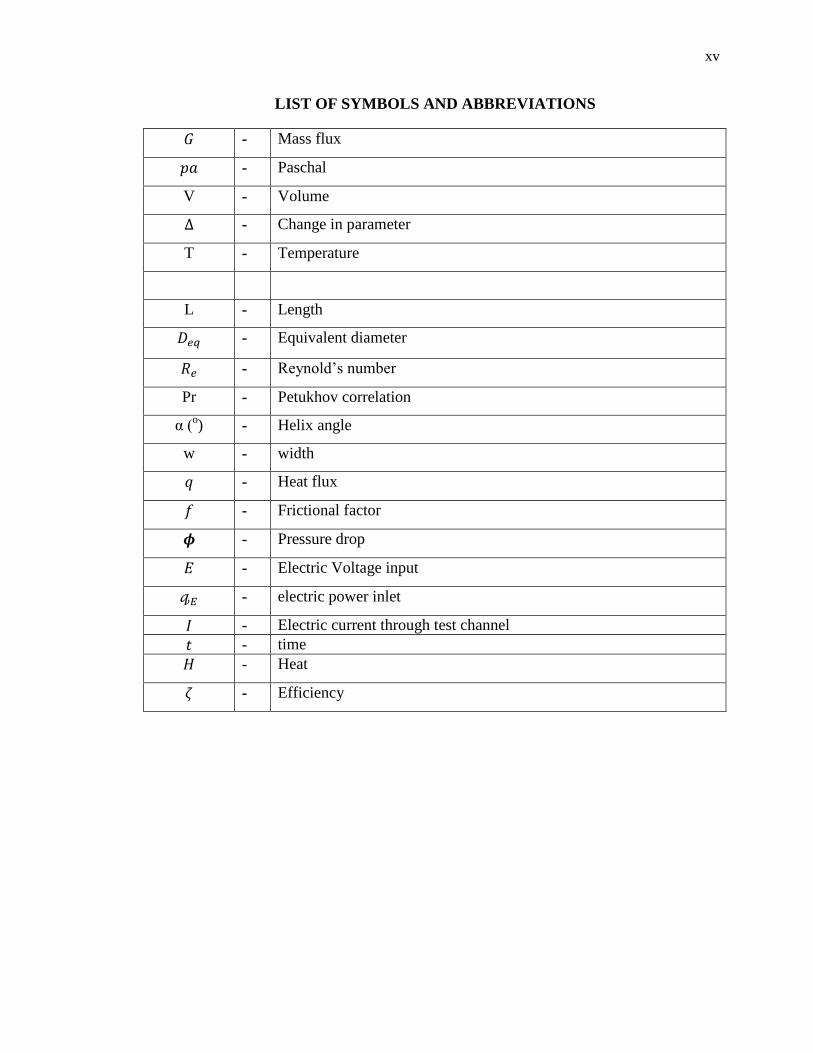
LIST OF SYMBOLS AND ABBREVIATIONS
- Mass flux
- Paschal
V - Volume
- Change in parameter
T - Temperature
L - Length
- Equivalent diameter
- Reynold’s number
Pr - Petukhov correlation
α (o) - Helix angle
w - width
- Heat flux
- Frictional factor
- Pressure drop
- Electric Voltage input
- electric power inlet
- Electric current through test channel
- time
- Heat
- Efficiency
CHAPTER 1
INTRODUCTION
In today’s, with the ever-increasing emission of noxious gas and fumes from industrial
sites, the issue of air pollution has become one of the most topical issues. Air pollution
is defined in many air pollution control lows as the presence of one or more
contaminants, in such quantities and of such duration as they be or tend to be injurious to
human life or property. Carbon monoxide (CO) and Carbon dioxide (CO2) are highly
toxic gases (K. Papakonstantinou et al., 2003).
CO has no colour, no smell, emitted as a product of incomplete combustion of
hydrocarbon based fuel coming from the car exhaust and burning of coal or wood, the
most dangerous types of air pollution and the most toxic to human and animal. When
inhaled, CO binds reversibly with blood haemoglobin to form carboxy-haemoglobin,
impairing the oxygen-transport of the blood, as well as the oxygen's release to body
tissues, causing therefore severe and even fatal asphyxiation, CO2 consists of carbon
dioxide from the combustion of organic materials such as paper, wood, coal and oil. The
carbon dioxide resulting from fuel from the most important pollutants introduced by the
air rights and lead to increased difficulty in breathing with irritation of the mucous
membranes and inflammation of the bronchial and throat irritation.
However, there is an increasing demand for indoor concentration measurements,
especially indoor workplaces with high-expected CO2/CO concentrations
(K. Papakonstantinou et al., 2003). The indoor workplaces have been reported as an
important determinant of exposure to CO/CO2. Insufficient or malfunctioning
2
ventilation inside, allows contaminated air to accumulate, and pollutant concentrations
to increase.
This accumulation of contaminant may cause damages to employees' health,
taking into consideration that exposure to CO/CO2 covers all their working day. The
problem of indoor air quality gives rise to questions concerning the arrangement of fresh
air supply. Processes involved in ventilation are the most important in determining the
quality of indoor air. It is important to get adequate mixing of inlet air with room air, in
order to obtain a uniform fresh air distribution. The evolution, during the last decade, of
a large number of multi-dimensional, multiphase models and solutions techniques for
simulating fluid flow and concentration dispersion processes has made it possible to use
new computational fluid dynamics methods to assess the effectiveness provisions in
buildings
However, in this study we concentrated on chassis dynamometer room which is
the standard tool for legislatively prescribed emission tests. For emission testing and
many other vehicle test purposes the dynamic response is an adequate approximation to
‘on road’ conditions. This is not necessarily true if the requirement is to study vehicle
driveline dynamics. Also we can say that chassis dynamometer room extremely useful
for testing the effectiveness of vehicle modifications. It’s a near-ideal environment to
perform back-to-back comparisons of different camshafts, turbochargers and just about
any engine upgrade you can mention. A chassis Dynamometer room is also a great place
to hold an engine at a specific load/rpm site to perform engine management tuning; also
commonly used for fault-finding and speedometer calibration.
In the test vehicle will result in out hot smoke contain harmful gases (carbon
monoxide and carbon dioxide). These gases will increase the room temperature and
indoor air pollution of the dynamometer room. In this case we need a good ventilation
system provided to evacuate the room of hot air and exhaust gases and allow cool air to
enter for the car radiator.
Furthermore, studies of indoor air quality employing computational fluid
dynamics (CFD) are widespread, because CFD is capable of providing precise
information on factors including the distribution of flow and concentration. Several
indexes of ventilation effectiveness have been proposed and examined with the aid of
3
CFD. The use of computational fluid dynamics (CFD) to simulate environmental and
building problems has been around for over 20 years (Zhang Lin et al., 2006). The
majority of building research investigates mainly office, residential and commercial
buildings such as office and workshops. In a few cases, public areas have also been
simulated such as the case of an indoor auto-racing complex. CFD was used to
determine the optimal way to design a ventilation system to prevent vehicle exhausts
from cars from reaching spectators. The CFD technique has become an increasingly
popular method to determine the indoor environment. Computational fluid dynamics
(CFD) makes it possible to simulate airflow patterns, thermal comfort and concentration
distributions of pollutants in a space at much less cost. This technique, allowing the
simulation and the visualization of environmental problems, represents a powerful tool
to motivate, guide and educate about the environment (R.A. Pitarma at el ., 2004). CFD
involves the solutions of the equations that govern the physics of the flow. Due to the
limitations of the experimental approach and the increase in the performance and
affordability of computers, CFD provides a practical option for computing the airflow
and pollutant distributions in buildings(Tatsuya Hayashi et al., 2002). A more practical
approach is to subdivide the space inside the room into a number of imaginary sub-
volumes, or elements. These sub-volumes usually do not have solid boundaries; rather,
they are open to allow gases to flow through their bounding surfaces (John D et al.,
2001).
Therefore, the goal of current study is to find the velocity throughout the room,
for each of the sub volumes. This will reveal the flow patterns and the pollution
migration throughout the room The temperature distribution within the loted is also of
concern
1.1 Problem of statement
The chassis dynamometer room in the automotive laboratory UTHM is one of very few
chassis dynamometer room available in Malaysia. Therefore, it's considered as a one of
4
rare facilities for test concerning engine performances, fuel consumptions and exhaust
emissions. SIRIM for instance, needs the equipment for experiments on new invented
biodiesels. The room is already equipped by a ventilation system, but unfortunately this
existing system is not sufficient to support activities conducted in the room, as high
temperature and accumulated smoke in the room are obviously observed. Hence, the
person in charge needs the aid of natural ventilation which is windows and door
opening. However, the problem is still occurring. Therefore, health and comfort issues
are crucial. Furthermore, reliability of the chassis dynamometer test results could be
questioned due to the instability of temperatures and relative humidity in the room
during experiments. In order to obtain good results both temperature and relative
humidity in chassis dynamometer room shall be maintained at certain constant values
during testing. In the present work the Indoor Air Quality (IAQ) in the chassis
dynamometer room is has been proved to be poor, leading to hazardous and
uncomfortable working environment. Thus, the development of an improved ventilation
system is essential. In this study will focus on finding alternative solutions and the
development of the ventilation system in the room by using CFD software.
1.2 Objective of study
i) To measure the Indoor air quality (IAQ) in the chassis dynamometer room
(Automotive Lab UTHM).
ii) To study the air flow structure and temperature distribution in the chassis
dynamometer room (Automotive Lab UTHM ) .
iii) To propose a new ventilation system design
5
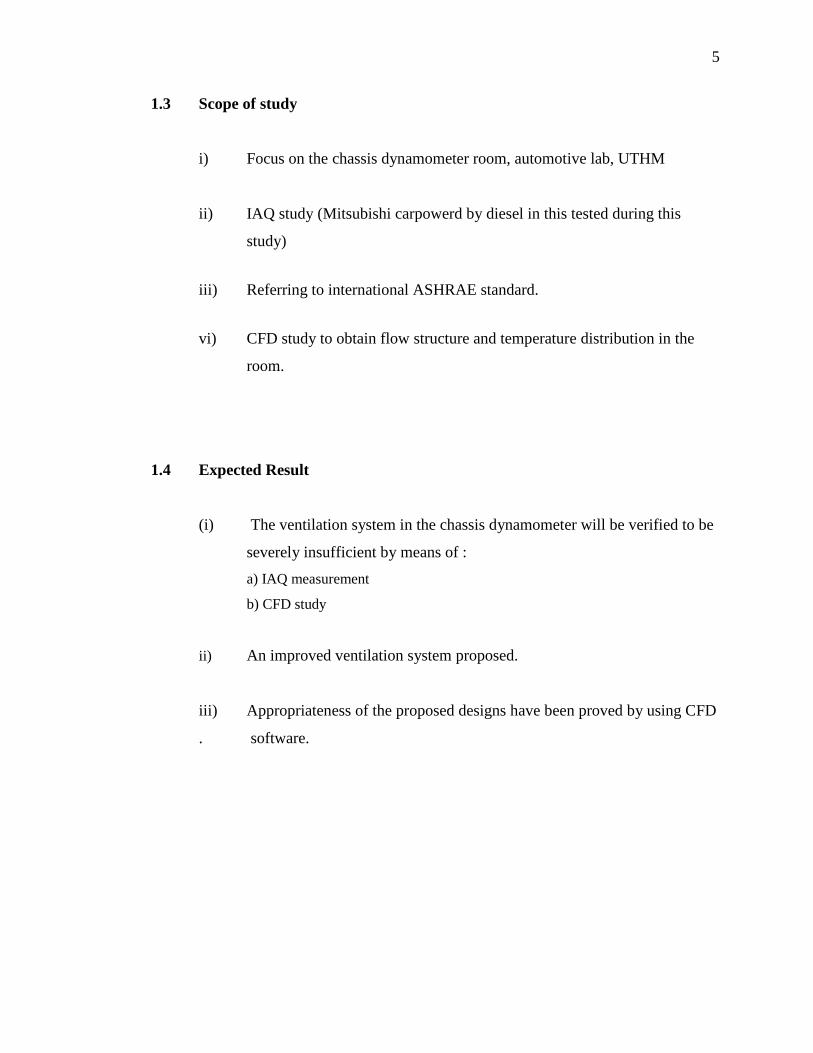
1.3 Scope of study
i) Focus on the chassis dynamometer room, automotive lab, UTHM
ii) IAQ study (Mitsubishi carpowerd by diesel in this tested during this
study)
iii) Referring to international ASHRAE standard.
vi) CFD study to obtain flow structure and temperature distribution in the
room.
1.4 Expected Result
(i) The ventilation system in the chassis dynamometer will be verified to be
severely insufficient by means of :
a) IAQ measurement
b) CFD study
ii) An improved ventilation system proposed.
iii) Appropriateness of the proposed designs have been proved by using CFD
. software.
6
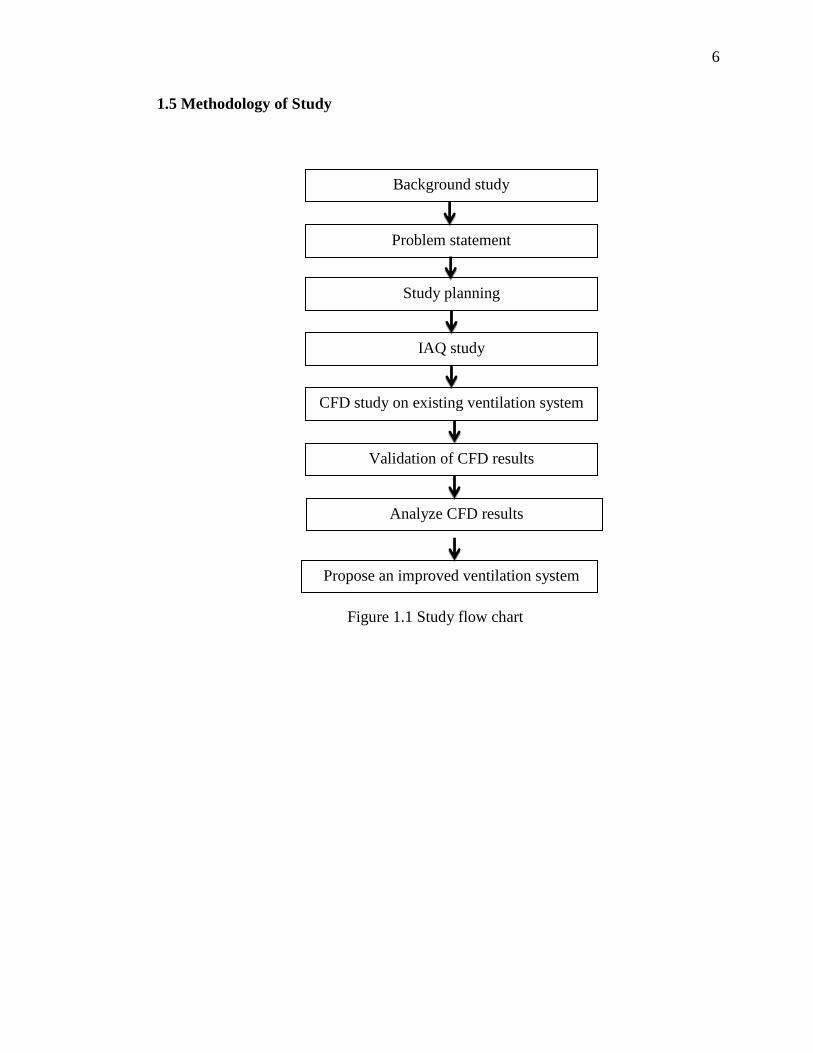
1.5 Methodology of Study
Figure 1.1 Study flow chart
Analyze CFD results
Validation of CFD results
CFD study on existing ventilation system
IAQ study
Study planning
Problem statement
Background study
Propose an improved ventilation system
7
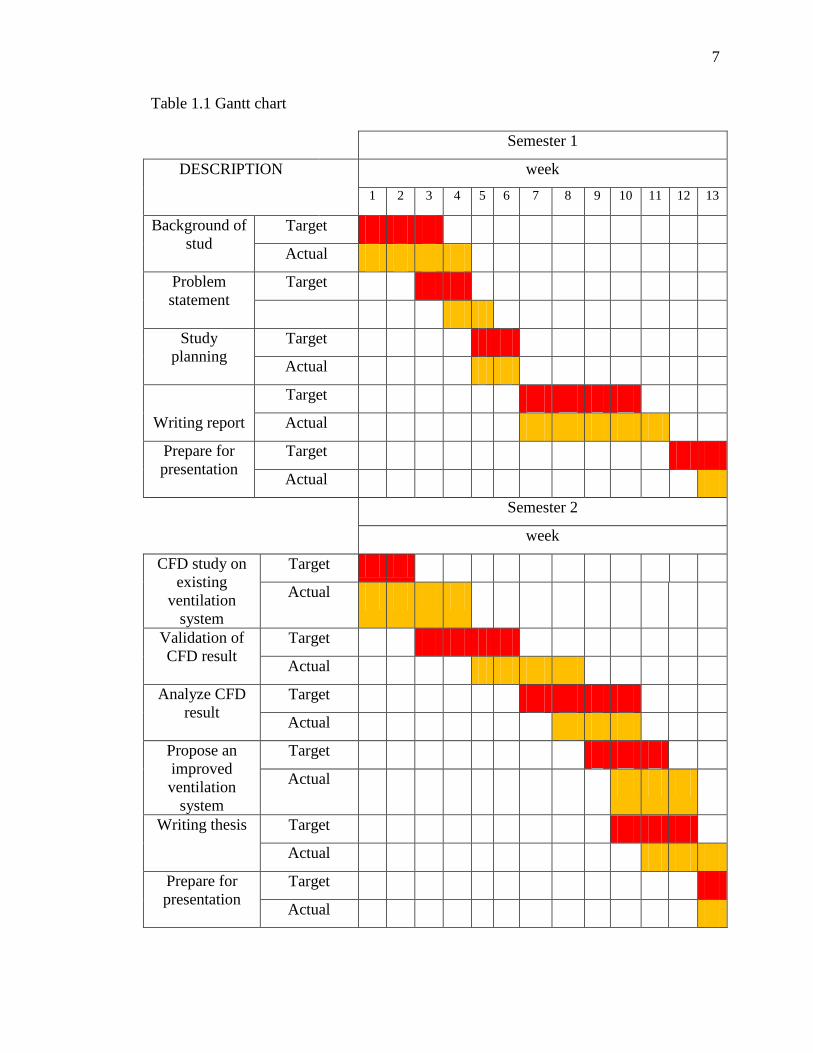
Table 1.1 Gantt chart
Semester 1
DESCRIPTION week
1 2 3 4 5 6 7 8 9 10 11 12 13
Background of
stud
Target
Actual
Problem
statement
Target
Study
planning
Target
Actual
Target
Writing report Actual
Prepare for
presentation
Target
Actual
Semester 2
week
CFD study on
existing
ventilation
system
Target
Actual
Validation of
CFD result
Target
Actual
Analyze CFD
result
Target
Actual
Propose an
improved
ventilation
system
Target
Actual
Writing thesis Target
Actual
Prepare for
presentation
Target
Actual
CHAPTER 2
LITERATURE REVIEW
This chapter presents a review of literature related to the topic under investigation.
In the first part of this chapter, a few researches on the ventilation system are
outlined. The second part excerpts the studies carried out on the indoor air quality.
2.1 Ventilation system
Ventilation is a process of introducing fresh air into a space of interest to dilute
contamination and to remove excess heating or cooling loads. For building
ventilation, the fresh air comes from outdoor or from HVAC (heating, ventilation
and air conditioning) systems. In a manned spacecraft, the fresh air comes from Air
Revitalization (AR) Subsystem (CO2 and trace contaminants removal), Temperature
and Humidity Control (THC) Subsystem (heat and water vapor removal) and
Atmosphere Control and Supply (ACS) Subsystem (O2 supply). In space, because of
the absence of natural convection, ventilation is also the primary means to remove
the heat produced by onboard equipment and the crew and to promote the well
mixing of the atmosphere constituents (O2, N2, CO2, etc.) inside the cabin.
In general, the objective of ventilation is to provide a habitat with good air
quality and thermal condition that are more suitable for people and processes than
what naturally occurs in an unventilated space with lowest possible energy
consumption. Therefore, the value of ventilation lies in how well these basic needs
are fulfilled. (Peng,1998).A good ventilation system can thus be defined as the one
which can provide a habitat with healthy indoor air quality and comfortable indoor
thermal condition with as low as possible energy consumption.
9
(Koji Sakai et al., 2007). In Japan, the following of further improvement in
the amenity : washable seat, heated seat, deodorization with function stool. In this
study, the examination was carried out on the usefulness of the local ventilation
system using CFD analysis method on the assumption of the lavatory in office
building. In the analysis, it is examined by changing the volumetric exhaust flow rate
on ceiling ventilation, local ventilation and ceiling and local ventilation combined
use. On each case, it is examined by changing air ventilation balance and outlet
position. The result showed that the local ventilation could reduce the indoor
pollutant quality concentration in comparison with the ceiling ventilation at little
ventilation air volume. And, it was shown that diffusion range of the pollutant to the
near human head was reduced .
In the individual exhaust system, in which an exhaust opening was installed
near a lavatory basin, results showed that concentration of indoor air contaminants
could be kept low compared with others. And it was shown that the energy saving by
the ventilator volume reduction could be expected by the adoption of this system.
Furthermore, when using only ceiling exhaust, it was clarified that the indoor
average concentration and the concentration in a respiratory zone were high
compared to other situations. Future studies of the influence of rising heat currents
near a user and concentration properties with intermittent ventilation are scheduled .
(Duncan A. Phillips et al., 2004). discussed the design of ventilation systems
for negatively and positively pressurized patient isolation rooms. The paper focuses
on how to quantify and achieve target levels of protection for either the patient
(positively pressurized rooms) or health care workers and other hospital occupants
(negatively pressurized rooms). Attention is paid to the influence of ceiling supply
diffuser selection. Thermal comfort issues are also discussed, and an alternative to
“age-of-air” techniques using age-of-contaminant calculations is recommended for
use in patient isolation room design. Practical considerations are illustrated through
the presentation of two case studies. The first case study of a TB isolation room
includes a CFD model analysis of different air distribution systems including
an assessment of ventilation effectiveness and patient thermal comfort. This work
includes simulation of a cough from a patient toward a health care worker and
throughout the isolation suite. The second case study of a positive pressure isolation
room assesses the throw of supply air around a patient bed in terms of providing
protection for the patient while maintaining comfortable conditions.
10
The CFD analysis of both rooms highlighted how the conditions near the
door are not well controlled. People entering an isolation room can release
contaminated aerosol particles into regions outside the door and people entering the
positively pressurized room can bring in air that might cause complications for the
patient. Neither of these rooms had an anteroom. It would appear that for severe and
acute contagions, an anteroom is necessary to positively protect the patient and/or
other occupants in the hospital.
2.1.1 Simulation of ventilation air flow
(K. Hooman et al.,2008). Uses CFD modelling to simulate the airflow
behaviour in underground crosscut regions, where brattice sails are used to direct the
airflow into these regions. Brattice sails are cost effective ventilation control devices
for temporary or permanent use in underground mining. They can be used to deflect
air into the unventilated areas such as crosscut regions. Their design and installation
is a fundamental issue for maintaining a sufficient supply of fresh air and achieving
effective air circulation and contaminant removal. At the same time, they should
have little impact on the mine ventilation system. This paper presents the results of a
two-dimensional CFD model, which examines the effects of brattice length on fluid
flow behavior in the crosscut regions. The results of this study will assist in
understanding the ventilation air behavior and in determining the optimum size of
brattice curtain (sails), which provide a highly effective contaminant removal from
the unventilated mine areas. This, in turn, helps the mine ventilation designers to
meet the mine safety requirements. The flow field within a segment of an
underground mine, where a crosscut is located, was investigated numerically. The
study was carried out to compare the flow field within the crosscut region with and
without a brattice. The brattice was used to deflect the airflow into the crosscut
region. In addition, the effects of brattice length on the flow pattern within the
crosscut region were examined at different main airstream velocities.
The results showed a slight difference between the presented flow patterns.
This was an indication of minor dependency of the dimensionless streamlines to the
magnitude of main airstream velocity. With no brattice, the streamlines proved weak
11
compared to that when a brattice was used. The use of a brattice increases the
airflow into the crosscut region, depending on the distance of brattice with the wall.
The y-velocity in the crosscut region behaved differently for various brattice lengths.
Higher brattice lengths showed a higher maximum velocity near the right wall of the
crosscut and therefore, a better ventilation mechanism. This study proved to be very
useful in predicting the flow behavior in a section of the mine, where a brattice was
used to deflect the airflow into the crosscut. It is recommended to develop the present
model to study other configurations of the brattice and different locations of the
brattice in the mine workings (K. Hooman et al.,2008)..
(Robert N et al., 2009). examined how well Computational Fluid Dynamics
(CFD) techniques can reproduce recent wind-tunnel measurements performed by
Karava (2008) of airflow around and within a model rectangular building. Various
strategies are examined including numerical simulation of the approach boundary
layer, consideration of alternative turbulence models, 2-d vs. 3-d simulations, and the
use of domain decomposition to simulate internal building flows based on external
simulation of the building with sealed openings..
Full-domain and domain decomposed CFD calculations were compared to
wind-tunnel measurements of natural ventilation. The external flow field
characteristics and internal flow channel trajectories as well as cross-ventilation flow
rates and internal pressures were reproduced within experimental uncertainty. The
methods produce results accurate enough to support ventilation designs. The internal
flows fields and associated cross ventilation flow rates appear to be fairly insensitive
to choice of turbulence model. Domain decomposition worked well, and provides a
valuable analysis tool which can significantly reduce computational overhead.
Elsafty, A. F (2010).In Ship's cabins due to low internal heights and limited
space, the supplied air is directed to persons at low mixing ratios. This does not
enable the mixing process between the supplied air and the indoor air to be
completed before the air enters human lungs. The purpose of this paper is to
investigate using an experimental and numerical simulation (Computational Fluid
Dynamics or CFD) the effect of the air supply location on thermal air diffusion in the
ship's cabin space. A computational fluid dynamics (CFD) program FLUENT was
applied to investigate the temperature distribution and air movement within an air-
conditioned existing ship‟s cabin with two different inlet and exhaust positions.
12
The CFD results are reported in terms of Air Diffusion Performance Index
(ADPI). The study focuses on the typical Middle East region working vessel under
the corresponding thermal and boundary conditions. This includes the high cooling
load used in this region. Results indicated that the supply should be located at the
high sidewall of the cabin. This gives better ADPI inside the space rather than the
center of the room.
The study gives vital details on the fluid flow inside the room in order to
allocate the furniture, inlet and outlet air positions. As in marine applications the
available inlets and outlets are restricted, and while the outlets are always from a
register in the lower part of the door, the study deals only with two alternatives, the
first is from the ceiling and the second above the door. The study concentrates on the
effect of changing the inlet positions of air, from the available two positions, for
accomplishing comfort in most of the cabin space. This also explains the low value
for the ADPI obtained from the study. Comparing the ADPI values, it is concluded
that case B, high sidewall gives better air distribution inside the space.
While running the model through the package, the investigations show a great
change variation in the air distribution due to any small change in air inlet velocity .
2.1.2 .Analysis natural ventilation in buildings or rooms
(Liping Wang et al.,2009) .studied the coupling strategies for natural
ventilation between building simulation (BS) and computational fluid dynamics
(CFD) are discussed and coupling methodology for natural ventilation is highlighted.
Two single-zone cases have been used to validate coupled simulations with full CFD
simulations. The main discrepancy factors have also been analyzed. The comparison
results suggest that for coupled simulations taking pressure from BS as inlet
boundary conditions can provide more accurate results for indoor CFD simulation
than taking velocity from BS as boundary conditions.
The validation results indicate that coupled simulations can improve indoor
thermal environment prediction for natural ventilation taking wind as the major
force. With the aids of developed coupling program, coupled simulations between
BS and CFD can effectively improve the speed and accuracy in predicting indoor
13
thermal environment for natural ventilation studies. Pressure coefficient prediction,
non-uniform boundary conditions, empirical discharge coefficients, pressure loss
estimation through openings and the impacts of surroundings on wind incidence are
the five major discrepancy factors to explain the discrepancy between coupled
simulation and full CFD simulation results.
From the simulation results, it can be seen that to further improve the
accuracy of inlet boundary condition is critical in improving the prediction of
coupled simulation results. In terms of coupling strategies, by comparing two
different coupling strategies (velocity as boundary condition and pressure as
boundary conditions for indoor CFD) between BS and CFD, taking pressure results
of apertures from BS as indoor CFD boundary conditions is a reliable strategy for
natural ventilation prediction. Coupled simulation should take pressure as opening
boundary conditions for better results. Single-zone cases were simulated and the
coupling results were validated with full CFD simulation (both indoor and outdoor)
to verify the reliability of the pressure coupling strategy. The comparison results
show that coupled simulation can better predict the indoor airflow simulation than
BS program alone (airflow network) and the simulation results are reasonable
compared with full CFD simulation.
2.2. Indoor Air quality
When we discuss indoor air quality, we probably cannot forget Benjamin
Franklin (1706-1790) as a great believer in fresh air, who regularly took a cold air
bath in the morning when he sat naked in his bedroom. In his 11-page long
“Preparatory notes and hints for writing a paper concerning what is called catching
cold” in 1773, he noted “numbers of people in a close room, and exercising there, fill
the air with putrid particles” and “think they get cold by coming out of such hot
rooms. They get them by being in”. On July 14, 1773 he wrote in a letter to
Benjamin Rush: “I have long been satisfied from observation, that besides the
general colds now termed influenzas, (which may possibly spread by contagion, as
well as by a particular quality of the air), people often catch cold from one another

14
when shut up together in close rooms, coaches, etc., and when sitting near and
conversing so as to breathe in each other‟s transpiration; the disorder being in a
certain state.” At this point, we should consider the current concerns about the threat
of an influenza pandemic from avian influenza (H5N1). It has probably been one of
the most unfortunate “events” for the field of indoor air and ventilation that Franklin
did not complete his planned paper on catching cold
It has taken us a long time to recognize the importance of indoor air quality.
Indoor air quality affects our health and is especially important because people spend
more than 90% of their time indoors.
2.2.1 Effect fresh air on indoor air quality
(Du Xiaogang et al.,2008) . Studied the ventilation in guest room in hotel. To
air-conditioning system with fan and fresh air, the pollutants indoor were mainly
removed by fresh air. Enlarging the fresh air volume could develop the indoor air
quality, but goes against to the energy saving. This paper simulated the CO2
concentration indoor under different fresh air volume when the bathroom door opens
and closed. The result indicates that only enlarging the fresh air volume affects the
IAQ slightly, and exhaust fan can satisfy the ventilation indoor whether the bedroom
door opens or closed. When the IAQ satisfies the standard, enlarging the fresh air
effects on the oxygen indoor slightly, but can enlarge the energy consume and
exhaust fan in bathroom can satisfy the air flow in bedroom in spite of the door is
open or closed
(Gang Wang et al., 2009) .investigated the effect of three different fresh air
modes on the indoor pollutant dispersion is analyzed by the method of CFD
(Computational Fluid Dynamics) simulation and experiment. The fresh air modes
include natural ventilation, hybrid ventilation and mechanical ventilation with total
heat exchanger. Performance of the fresh air modes is compared considering the
factors like fresh air volume, heat/cold load and outdoor air parameters etc. In
addition, the ventilation performance under different fresh air volume and control
modes is contrastively studied under running condition. The result shows that, fresh
air volume is the key factor in diluting the pollutant and heat recovery is vital for
15
energy efficiency. By the means of CFD simulation and experimental test, impact of
three kinds of fresh air modes on pollutant dispersion, airflow and energy
consumption are analyzed. For natural ventilation, because of the high air tightness
and many other uncontrollable factors, careful design is energy efficiency at the same
time. Fresh air volume has significant effect on the indoor pollutant concentration.
Larger fresh air volume could dilute the pollutant more quickly and keep the
concentration at a lower level. Use of the total heat exchanger and then recovery the
heat in exhaust air could save the load to heat/cold fresh air and reduce the
temperature difference between indoor air and fresh air, which will improve thermal
comfort of indoor environment. This feature is very important when fresh air
volume and enthalpy difference between indoor and outdoor air is high. When
combined with multi-connected air conditioning system, hybrid ventilation and
mechanical ventilation with total heat exchanger has similar performance in affecting
the concentration and velocity field.
(Xianli Lia,et al.,2009) . With serious energy crisis and high demand for
Indoor air quality (IAQ), natural ventilation has taken more and more attention,
which is recognized to be an effective and economic method to decrease the risk of
Sick Building Syndrome (SBS), as well as reducing air-conditioning opening time,
and thus saving energy. In view of window‟s characteristics having a great effect on
ventilation, the paper discussed the influence of air inlet window type and area ratio
of open window to floor on indoor steady-state contamination of CO2 and steady-
state time. In addition, for tilt, hopper or grille window, the larger opening angle, the
better ventilation performance, yet once over 30°, its influence on steady-state
contamination became unobvious, so, the paper only discussed the situation with
opening angle 30°, inside. And to calculate more accurately and quickly, as well as
conveniently and cost effectively, CFD model was used, which was firstly validated
by experiment, good agreement in between, with absolute error in simulation 9.2%.
Then, combined with the measured outdoor weather data in Tianjin, the results were
obtained, push-pull window was the preferred window type, lower indoor average
steady-state contamination of CO2 and shorter steady-state time, 550ppm and
6.5min, with area ratio of open window to floor β 5%. Moreover, on this basis, the
optimal area ratio of open window to floor β for push-pull window was studied,
which was proposed to be or larger than 10%.
16
The CFD model could accurately and quickly simulate indoor contamination
field of pollution, a good agreement between the measured and simulated values,
with absolute error in simulation 9.2%<10%. By analysis, push-pull window was the
preferred window type, lower indoor average steady-state contamination of CO2
and shorter steady-state time, 550ppm and 6.5min, with area ratio of open window to
floor β 5%. In addition, push-pull window was more cheap and convenient installing,
so it‟s very suitable to residential housing. To guarantee good ventilation
erformance, the optimal area ratio of opening to floor β should be or larger than 10%
for push-pull window.
2.2.2 Thermal comfort
(N. P. Gaoa et al.,2007) . Investigated the pollutant exposure reduction and
thermal comfort that can be achieved with personalised ventilation (PV) design when
a PV system is combined with two types of background air conditioning systems. For
the investigation of inhaled air quality, pollutants emitted from building materials are
the targeted pollutants; and for the investigation of thermal comfort, local discomfort
associated with nonuniform thermal environment is focused upon. These
investigations were performed by combining CFD simulation of the 3D air flow and
a multi-nodal humanbody thermo-regulation model. The results reveal some new
characteristics of the three typical air distribution designs, i.e. mixed ventilation,
displacement ventilation and PV, and provide insight into the possible
optimisation of system combinations. a numerical study of IAQ and thermal comfort
that can be achieved when PV is combined with MV or DV. A breathing NTM with
16 body segments was developed by coupling CFD with a thermoregulation model,
both of which have been separately validated in previous studies. A comprehensive
validation of the simulation results has not been specifically performed, but
comparison with the experimental results using similar conditions by other
researchers indicates the reasonable predictive accuracy of the current modelling
approach. A small portion of the application of this NTM is exhibited in the process
of investigation of PV. With the assumptions that the person is not moving and that
17
the dynamic breathing process can be considered approximately as steady inhalation,
the following
can be drawn but with caution. DV provides better inhaled air quality than
MV except in the situation where contaminants are emitted from the floor. Serving
personalised air to the breathing zone can greatly improve the inhaled air quality. But
the degree of this improvement also depends on the room‟s average pollutant
concentration level. DV is more energy efficient than MV since it is only aimed at
conditioning the occupied zone. Equipped with PV the whole body sensation and
comfort are controlled not only by personalised air but also by the indoor
temperature level. Air movement at the head forced by PV can increase acceptable
thermal stratification up to 6 °C. Obviously, the ultimate validations of these
conclusions have yet to be decided by human subject testing.
(R.A. Pitarma et al., 2004). Shown the applicability of CFD for the
simulation of indoor- environment quality is confirmed. Indoor-environment quality
is influenced by room air distribution that depends on several parameters (boundary
conditions): airflow rate, thermal load, location of obstacles, ventilation systems and
pollutants load. To achieve a good indoor climate and air quality, it is necessary to
supply the thermal load and fresh air either by opening windows or by installing a
suitable ventilation system for the introduction of fresh air. A new way of thinking
and therefore a new approach to education is necessary. But, little information is
available on indoor-environment quality. A concentrated effort To provide
educational material to all levels of society should be undertaken. Formal education
for design professionals is needed. Informal and formal education should be
developed for building owners and operators, for occupants and the general public.
CFD models can provide an effective tool for the sensitization of these problems.
Certainly this use of CFD will take an increasingly important and prominent position
in the promotion of a more positive attitude towards issues of energy consciousness
and the environment.

18
2.2.3 Indoor air quality in garage
(K. Papakonstantinou et al., 2003). Studied the accumulation of contaminants
that comes primarily from inside the building can constitute a potential health hazard
in microenvironments where people spend most of their time indoors. The present
paper refers to the numerical prediction of carbon monoxide (CO) concentration
inside a typical garage in Athens urban area. Specifically, the study was concerned to
investigate the indoor air quality and focuses on identifying the appropriate
ventilation system as an attempt to improve air quality in workplace micro-
environments.
The model developed for the simulation of CO levels is used in conjunction
with a general-purpose CFD code, PHOENICS that can provide detailed information
on the CO concentration and velocity fields in a three-dimensional configuration.
The transient variation of CO concentration was simulated under different scenarios
of ventilation rates. Experimental measurements on the CO level inside the garage
were performed using the portable, electrochemical CO monitor. From the
continuous readings, instantaneous readings were stored every 15 s by the data log
system. These data were used to verify the simulation results.
Finally, the CO exposure of employees and garage‟s users is assessed and
compared with occupational limit value and recommended public health criteria. The
results show that under the proper ventilation conditions the levels of CO
concentration decrease and remain below the health based indoor air quality criteria.
with the simulation of CO concentration in different sites inside a typical central
garage. Specifically, the study investigates the dispersion of indoor CO levels under
two different conditions, with no mechanical ventilation and when mechanical
ventilation of 2 m/s was applied.
Experimental measurements of CO levels at the „exit‟ and „indoor‟ sites were
also conducted and gave good agreement with the numerical results. The study was
also concerned to investigate the indoor air quality. Thus, the measured results were
compared with short and long-term exposure limits to CO. The results appeared to be
very interesting and demonstrate that numerical solutions are very effective for
ventilation design purposes. The design of an efficient ventilation system will result
in a better quality of air inside buildings . As far as short and long-term health
problems are concerned CO compound, reducing CO levels in occupational spaces is
19
an important issue. It was found that when ventilation was applicable the CO levels
inside the garage fulfill the indoor air quality acceptance requirements
(Eleni et al., 2009) . the investigation of CO production and dispersion using
experimental and numerical approaches. Measurements of CO concentration and
ventilation air velocities have been performed in an actual operating medium-sized
car-repair shop. In addition, a detailed numerical simulation of the developing
transient flow field has been carried out, using the Fire Dynamics Simulator CFD
code. The obtained experimental data have been used to validate the CO
concentration predictions with overall good qualitative and occasionally quantitative
agreement. Different levels of ventilation airflow rates have been numerically
investigated; the ensuing CO concentration levels have been compared to current
occupational health legislation. The levels of CO concentration in indoor
environments may pose a serious health hazard for occupational safety, especially in
the case of car-repair shops, where employees are exposed on a daily basis to vehicle
exhaust fumes. In this work, CO production and dispersion has been investigated
sing both experimental and numerical simulation approaches.
Measurements of CO concentrations and ventilation flow rates have been
performed in an actual medium-sized car repair shop. In addition, a detailed
numerical simulation of the developing transient flow-field has been carried out,
using the Fire Dynamics Simulator CFD code. The obtained experimental data have
been used to validate the CO concentration predictions. Good qualitative and,
occasionally, quantitative agreement has been achieved; the complexity of the
developing flow, in conjunction with the numerous simplifying assumptions
employed in the simulations, render the obtained results acceptable for engineering
purposes. A numerical parametric study has been performed, investigating various
ventilation air flow rates; the ensuing CO concentration levels have been compared
to current occupational health legislation. In this frame, a generalized CO mass
source term has been developed, based on records of the average number of vehicles
entering or leaving the car-repair shop.
CHAPTER 3
INDOOR AIR QUALITY
The ventilation system in a chassis dynamometer room is significant to maintain
indoor air quality IAQ for health and comfortable environment. The IAQ of a space
is determined by the level of indoor air pollution and other characteristics, including
the air temperature, relative humidity and air speed, and contaminants and gases
(ASHRAE,2002)
Recently, many researchers have notified that indoor air is becoming an
increasingly more concerning health hazard than outdoor air which figured out the
necessity of developing the ventilation system as a method of improving indoor air
quality (Li WM, Ao CH,2002). Research based on calculation of concentration of
contaminants resulted from accidental spills (ASHRAE, 2008), and sampling the air
to determine the concentration ( Sandru E, 2005). , has proved the fact that there are
substantial resources for reducing the ventilation rates in laboratory spaces.
Minimizing the energy cost for ventilation could be achieved by transferring energy
between the air exhausted and supplied to the laboratories and by reducing the air
flow rates. One of the most debated Safety issues today are how far the air flow
could be diminished without compromising the indoor air quality. The most acutely
toxic indoor air contaminants are CO and CO2, which are heavily produced by
automobile exhaust in the chassis dynamometer room The badly effect on human
being health, that is the reason to eliminate or reduce their concentration in the space,
for example CO2 should not exceed 1,000 ppm according to ( Sharp G, 2007),while
(NIOSH,2008) recommended that CO2 levels not exceed 700 ppm above outdoor
ambient levels. In the present work, an indoor air quality IAQ has been performed in
the chassis dynamometer room, in the automotive laboratory, UTHM.
21
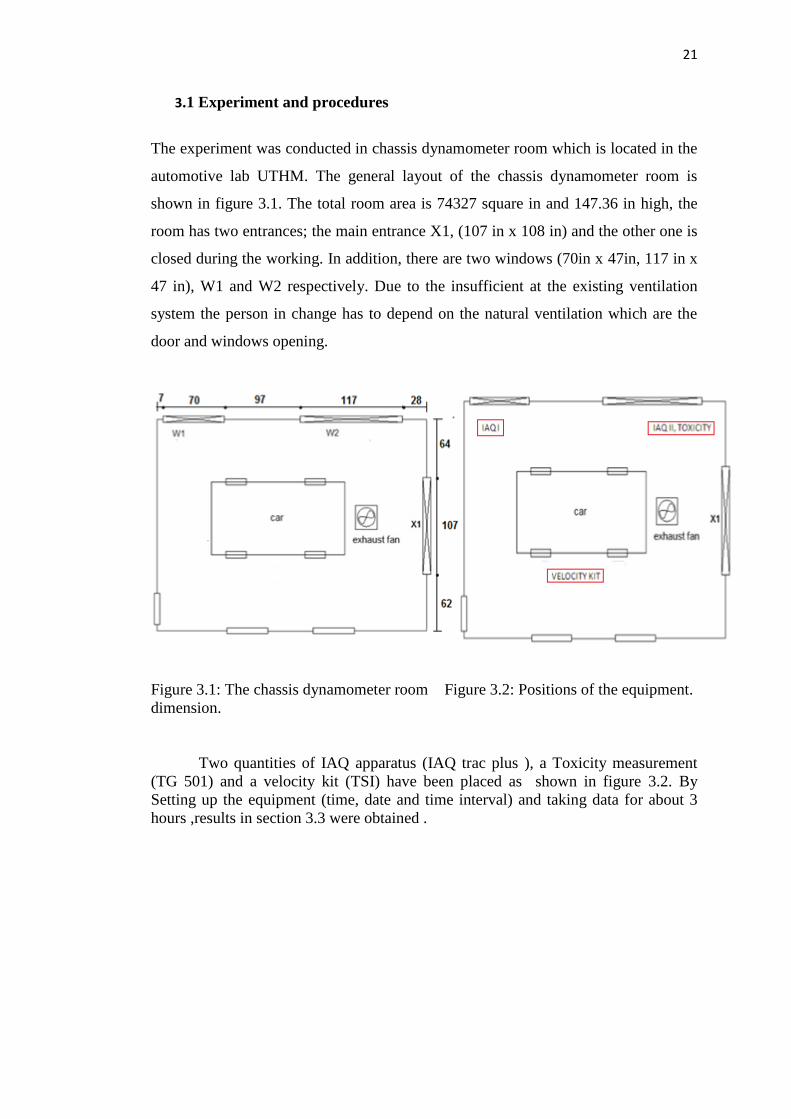
3.1 Experiment and procedures
The experiment was conducted in chassis dynamometer room which is located in the
automotive lab UTHM. The general layout of the chassis dynamometer room is
shown in figure 3.1. The total room area is 74327 square in and 147.36 in high, the
room has two entrances; the main entrance X1, (107 in x 108 in) and the other one is
closed during the working. In addition, there are two windows (70in x 47in, 117 in x
47 in), W1 and W2 respectively. Due to the insufficient at the existing ventilation
system the person in change has to depend on the natural ventilation which are the
door and windows opening.
Figure 3.1: The chassis dynamometer room Figure 3.2: Positions of the equipment.
dimension.
Two quantities of IAQ apparatus (IAQ trac plus ), a Toxicity measurement
(TG 501) and a velocity kit (TSI) have been placed as shown in figure 3.2. By
Setting up the equipment (time, date and time interval) and taking data for about 3
hours ,results in section 3.3 were obtained .
22
3.2 Measurement of Indoor Environmental Parameters
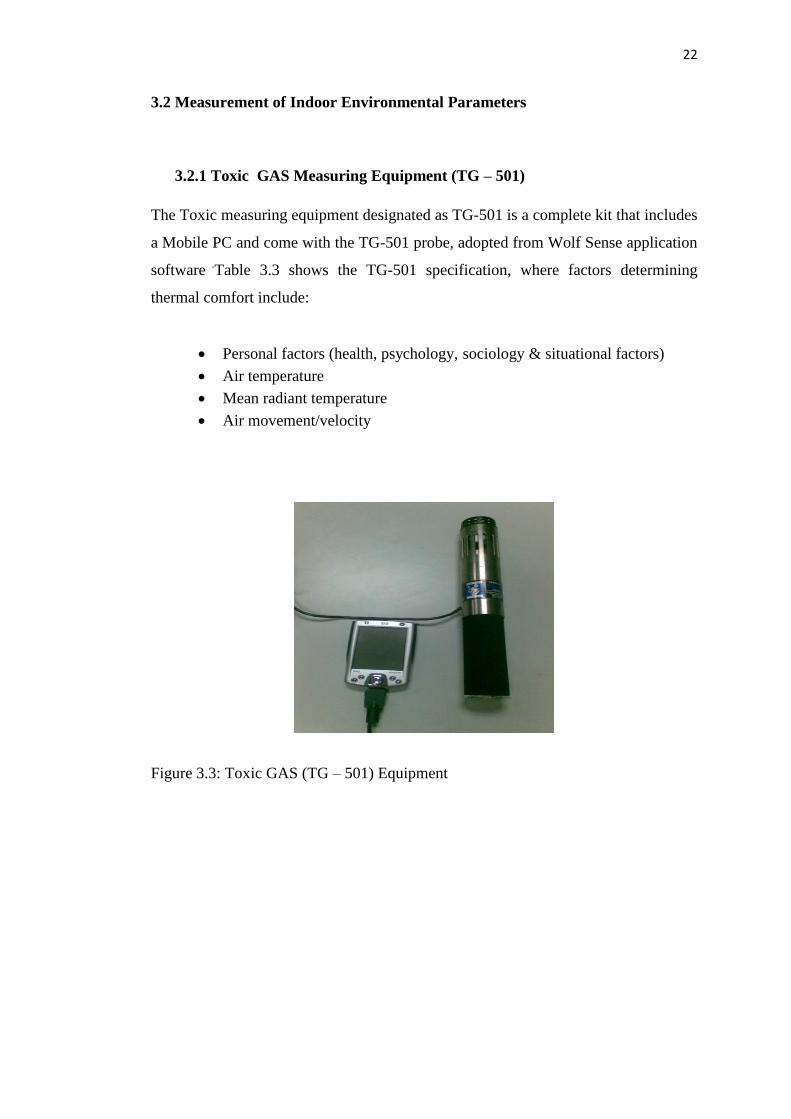
3.2.1 Toxic GAS Measuring Equipment (TG – 501)
The Toxic measuring equipment designated as TG-501 is a complete kit that includes
a Mobile PC and come with the TG-501 probe, adopted from Wolf Sense application
software .
Table 3.3 shows the TG-501 specification, where factors determining
thermal comfort include:
Personal factors (health, psychology, sociology & situational factors)
Air temperature
Mean radiant temperature
Air movement/velocity
Figure 3.3: Toxic GAS (TG – 501) Equipment
23
3.2.2 Indoor air (Q Trak plus 8762 )
The indoor air quality meter designated as Q Trak plus 8762 as shown in figure 3.4.
Monitor simultaneously measures carbon dioxide, temperature, humidity and carbon
monoxide.
3.2.3 Air velocity (TSI : Velocicalc 8386 )
Air velocity meter designated as TSI: Velocicalc 8386 as shown in figure 3.5
measure air velocity, temperature, calculates flow rate, perform multi-value
averaging, and determine minimum and maximum readings.
Figure 3.4 Q Trak plus 8762
Figure 3.5 TSI : Velocicalc 8386
24
3.3 Results and Discussions
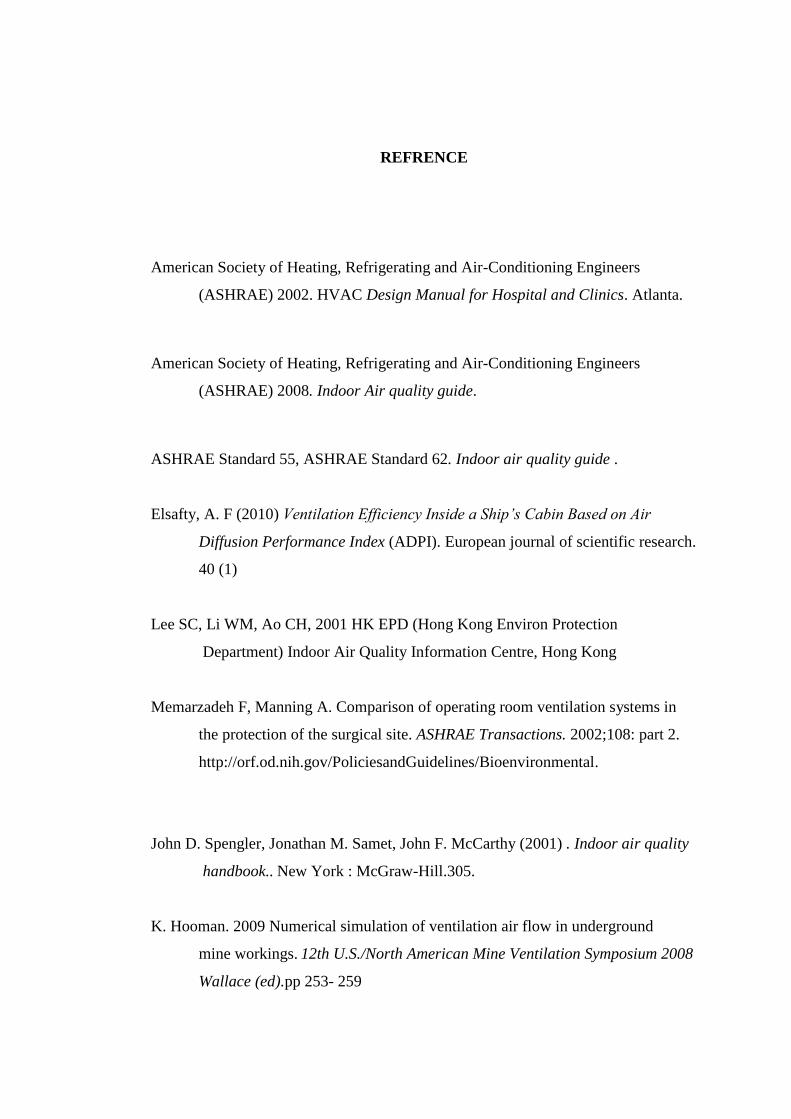
3.3.1 C02 concentrations
The composition of CO2 in particle per million (ppm) varies unstably in time. For
IAQI, the highest of CO2 concentration is 2236 ppm and the lowest one is 470 ppm
for IAQI. The average is 829 ppm. For IAQII, the maximum CO2 concentration is
4391 ppm and the lowest is 302 ppm. The average CO2 concentration for IAQII is
1371 ppm. The CO2 concentration for IAQII is greater than IAQI since IAQII is
nearer to vehicle's exhaust. The CO2 concentration in a safe room should be below
800 ppm since the maximum allowable Concentration is between 800 to 1000 ppm
(ASHRAE,2002). Therefore, the condition of this room is not safe. The following
two graphs figure 3.6 have been sketched from the collected data during the
experiment it can be readily notified the maximum concentrations of CO2 that
exceed 2000 ppm in less than 1 hour from the start point for IAQI while for IAQII it
almost achieves 4500 ppm during the same time interval. While the minimum
concentration did not drop less than 1000 ppm except in short time after the start.
Therefore both cases the average of the CO2 concentration can be counted to be
higher than the standard outlined in (ASHRAE, 2002).
(a) (b)
Figure 3.6:CO2 concentration against time for (a) IAQ I and (b) IAQ II
REFRENCE
American Society of Heating, Refrigerating and Air-Conditioning Engineers
(ASHRAE) 2002. HVAC Design Manual for Hospital and Clinics. Atlanta.
American Society of Heating, Refrigerating and Air-Conditioning Engineers
(ASHRAE) 2008. Indoor Air quality guide.
ASHRAE Standard 55, ASHRAE Standard 62. Indoor air quality guide .
Elsafty, A. F (2010) Ventilation Efficiency Inside a Ship’s Cabin Based on Air
Diffusion Performance Index (ADPI). European journal of scientific research.
40 (1)
Lee SC, Li WM, Ao CH, 2001 HK EPD (Hong Kong Environ Protection
Department) Indoor Air Quality Information Centre, Hong Kong
Memarzadeh F, Manning A. Comparison of operating room ventilation systems in
the protection of the surgical site. ASHRAE Transactions. 2002;108: part 2.
http://orf.od.nih.gov/PoliciesandGuidelines/Bioenvironmental.
John D. Spengler, Jonathan M. Samet, John F. McCarthy (2001) . Indoor air quality
handbook.. New York : McGraw-Hill.305.
K. Hooman. 2009 Numerical simulation of ventilation air flow in underground
mine workings. 12th U.S./North American Mine Ventilation Symposium 2008
Wallace (ed).pp 253- 259
61
Koji Sakai1, Yasutaka Murata2, Ryutaro Kubo3 and Ryoichi Kajiya1 2007 A CFD
analysis of ventilation system of lavatory in office building.: Building
Simulation 2007 .pp. 415- 420.
K. Papakonstantinou, A. Chaloulakou, A. Duci, N. Vlachakis and N. Markatos
(2003) Air quality in an underground garage: computational and experimental
investigation of ventilation effectiveness. Energy and Buildings. 35.
(2003).pp 933–940
Indoor environmental quality: Building ventilation," National Institute for Occupational
Safety and Health, 2008.
WANG*, L and N H Wong, "Coupled simulations for naturally ventilated rooms
between building simulation (BS) and computational fluid dynamics (CFD)
for better prediction of indoor thermal environment". BUILDING AND
ENVIRONMENT, 44, no. 1 (2009).pp 95-112.
Roger W. Haines, O. Lewis Wilson, “HVAC System Design Hand Book “4TH
Edition, 2003 Mc Grawhill.
R.A. Pitarma, J.E. Ramos, M.E. Ferreira, M.G. Carvalho, (2004) "Computational
fluid dynamics: An advanced active tool in environmental management and
education. Management of Environmental Quality.15.(2).pp.102 - 110
Robert N. Meroney 2009 CFD Prediction of Airflow in Buildings for Natural
62
Ventilation. 11th Americas Conference on Wind Engineering. San Juan,
Puerto Rico
Sharp G. 2007. A comprehensive review of the indoor environmental quality and energy
impacts of dynamically varying air change rates at multiple laboratory facilities.
In: Labs21 2007 Annual Conference, North Charleston, USA, October 2-4, 2007.
Sandru E. and Ouyang X. 2005. Planning and designing laboratory ventilation systems
for the safety of the users and protection of the environment. In: Proceedings of
the 10th International Conference on Indoor Air Quality and Climate-Indoor Air
2005.4.
Wei Cai, Danjun Wang, Xiaodong Wen, Xubo Yu (2010) Indoor Air Quality
Assessment in an Art Gallery with an HVAC System
Lin Zhang, Jiang Feng, Chow TT, Tsang CF, Lu WZ. CFD analysis of ventilation
effectiveness in a public transport interchange. Building and Environment,
41(3), 2006, 254-261.


![8 - Pewarisan.ppt - liyantanto.files.wordpress.com · –C++. Hirarki class. ... • Inheritance merupakan salah satu dari tiga konsep ... 8 - Pewarisan.ppt [Compatibility Mode] Author:](https://img.pdfslide.us/doc/110x75/5b5b09be7f8b9a885b8d38a4/8-liyantantofileswordpresscom-c-hirarki-class-inheritance.jpg)