Embed Size (px)
Citation preview
AERA 2004 Subject matter knowledge 1
Teachers’ subject matter knowledge as a teacher qualification:
A Synthesis of the quantitative literature on students’ mathematics achievement
Soyeon Ahn and Jinyoung Choi
Michigan State University
Presented at the American Educational Research Association, San Diego, April, 2004
AERA 2004 Subject matter knowledge 2
For many years, educational scholars and policy makers have been concerned with the
factors that influence teaching and learning. The qualifications of teachers have been assumed to
be one of the critical factors. Even though there are debates on how to define a qualified teacher,
teachers’ subject matter knowledge has been long considered an important influence on teaching
and learning.
However, studies that examined the influences of teachers’ subject matter knowledge on
student achievement have produced mixed findings. Several reviews of empirical studies on the
relationship between teachers’ subject matter knowledge and the quality of teaching have found
that the studies fail to yield consistent findings (Ashton & Crocker, 1987; Darling-Hammond,
2000; Wilson, Floden, & Ferrini-Mundy, 2001). Even though in some studies, a positive
connection between teachers’ subject matter knowledge and student achievement was found
(e.g., Darling-Hammond, 2000; Mandeville & Liu, 1997; Rowan, Chiang, & Miller, 1997), some
studies found a non-significant effect of subject matter knowledge on student achievement, and
others report a negative association (e.g., Koch, 1972; Reed, 1986).
This paper examines the reasons for these disparities. That is, the focus of this paper is
not on the question of whether teachers’ subject matter knowledge influences student learning.
Such an influence is assumed. It is a question of why research has drawn different relationships
between teachers’ subject matter knowledge and student learning. That is, the main focus of our
study is to find different kinds of variables that might contribute to variations in the strength and
direction of the relationship by examining quantitative studies that relate mathematic teachers’
subject matter knowledge to student achievement in mathematics.
This paper has three main sections. The first section reviews all quantitative studies that
have investigated the relationship between teachers’ mathematics subject matter knowledge and
AERA 2004 Subject matter knowledge 3
student learning we have found. In this section, we describe variations in the following three
domains (a) measurement, (b) data analytic techniques, and (c) the samples of subjects we
assume that these variations may influence study outcomes. In the second section, we present a
meta-analysis of a sub-set of these studies, which rely on correlation coefficients to examine
hypotheses. Then, we summarize the results and draws implications based on what we have
learned from our analysis.
LITERATURE REVIEW
Selection of Studies for the Review
Studies for this review were drawn from the broader TQ-QT project’s database. The TQ-
QT project is a synthesis of studies investigating the relationship between indicators of teacher
qualifications (TQ) and the quality of teaching (QT) using studies conducted in the United States
since 1960. See Wu et al. (2002) for more details on the full project. From this TQ-QT database,
studies for this review were selected if they investigated the relationship between indicators of
teachers’ subject matter knowledge and student achievement. Specific criteria for selection of
studies are as follows.
First, each study must have at least one measure of subject matter knowledge. In the TQ-
QT project we have developed a list of indicators of subject-matter knowledge. We chose the
following search terms to identify the applicable studies in the overall TQ-QT database: ‘teacher
knowledge’, ‘content knowledge’, ‘subject-matter knowledge’, ‘GPA in subject’, ‘major or
degree in subject’, ‘degree level in subject’, ‘certified in subject’, ‘numbers of courses taken’,
‘credit hours of course taken’, ‘NTE’, ‘Praxis’, ‘certification test’, ‘knowledge test’, and ‘teacher
test’. Second, each study must have reported on at least one student achievement outcome as an
indicator of student learning. Third, each study must have reported at least one link between
AERA 2004 Subject matter knowledge 4
indicators of teachers’ subject matter knowledge and student mathematics outcomes. Fourth,
each should be a quantitative study. Fifth, the subject matter was limited to mathematics for this
search.
This selection process identified a total of 41 studies. These include 8 journal articles, 1
book chapter, 7 research reports, 1 conference proceeding, and 24 dissertations. 41 studies were
examined for the brief literature review but some studies were omitted from the meta-analysis.
Hypotheses for Inconsistent Findings on the Relationships
Interest in the role of subject matter knowledge as a component of teacher knowledge on
teaching and learning has been increased since Shulman (1986) pointed out subject matter
knowledge as a “missing paradigm” in the study of teaching. Since then, researchers have
explored what subject matter knowledge looks like and whether and/or how subject matter
knowledge affects both teaching practices and student learning. Even though the importance of
subject matter knowledge is generally believed for teaching and learning, findings of empirical
studies on the relationship between teachers’ subject matter knowledge and the quality of
teaching have been inconsistent as mentioned above.
Many variables may contribute to inconsistencies and variations in study findings but we
focus on variations in the following three domains (a) measurement, (b) data analysis techniques,
and (c) the samples of subjects. In the next section, we will describe these variations addressing
our hypotheses for our meta-analysis.
Measurement Variations
Variation in indicators of subject matter knowledge
Because subject matter knowledge is a broad construct, researchers choose indicators of
subject matter knowledge based on their operationalizations of this construct. The use of
AERA 2004 Subject matter knowledge 5
different indicators may act as an important moderator. Due to the intangible nature of
knowledge, researchers need to create variables that are visible and practical in order to
investigate relationships and different indicators of subject matter knowledge were used in the
studies.
These measures fall into two general categories. The first type is educational background
indicators, including GPA in mathematics courses, number of courses taken in mathematics,
major or degree in mathematics, degree level in mathematics, certification in mathematics, or
composite variables that combine more than two educational background variables. The second
category is tests, including large-scale teacher tests such as NTE area tests and state certification
tests and research based local tests such as the Glennon Test of Basic Mathematics
Understanding developed by other researchers (e.g., Bassham, 1962) and researcher-made tests
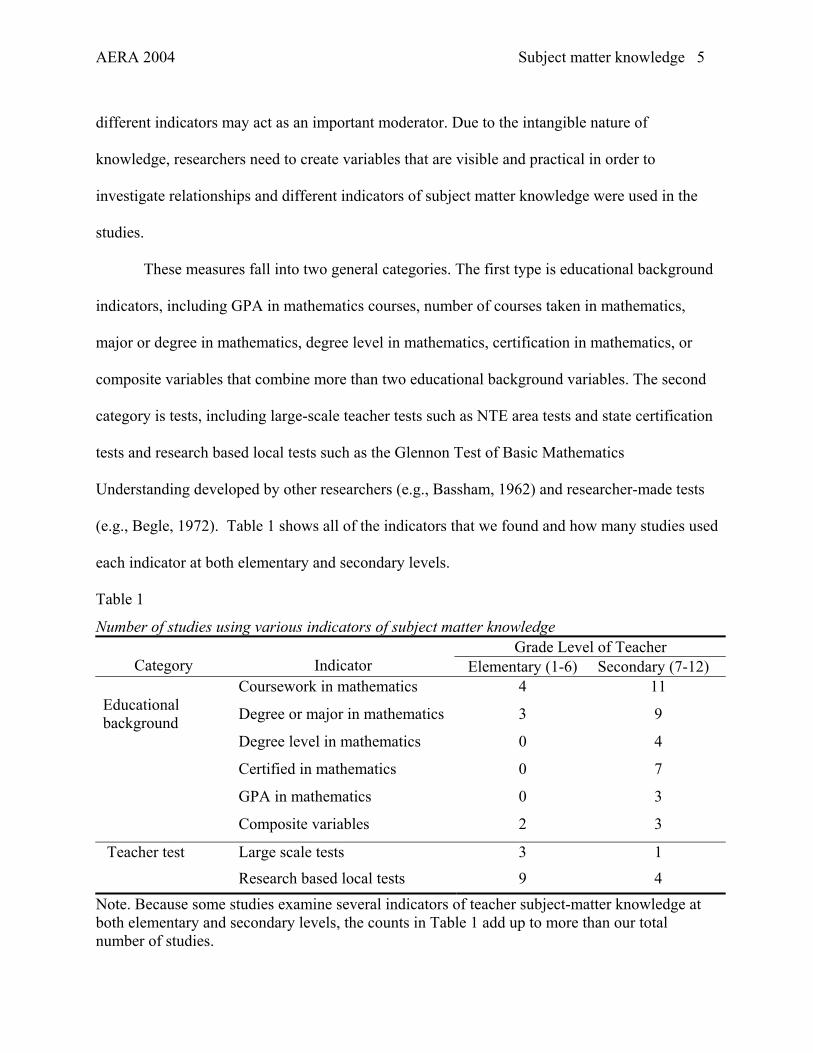
(e.g., Begle, 1972). Table 1 shows all of the indicators that we found and how many studies used
each indicator at both elementary and secondary levels.
Table 1
Number of studies using various indicators of subject matter knowledge Grade Level of Teacher
Category
Indicator Elementary (1-6) Secondary (7-12) Coursework in mathematics 4 11
Degree or major in mathematics 3 9
Degree level in mathematics 0 4
Certified in mathematics 0 7
GPA in mathematics 0 3
Educational background
Composite variables 2 3
Large scale tests 3 1 Teacher test
Research based local tests 9 4 Note. Because some studies examine several indicators of teacher subject-matter knowledge at both elementary and secondary levels, the counts in Table 1 add up to more than our total number of studies.
AERA 2004 Subject matter knowledge 6
Two-thirds of the indicators used in the studies fall into the first category- educational
background variables. Within the educational background category, the most often used variable
is a measure of the coursework taken in mathematics. A third of studies in this category used
teachers’ coursework in mathematics. Another set of widely-used variable includes major or
degree in mathematics; 26 % of the studies in this category used major or degree to represent
teachers’ subject matter knowledge. As shown in Table 1, educational background variables
were used more often in studies that examined grade seven through twelve teachers to measure
teachers’ subject matter knowledge.
The second main approach shown in Table 1 is the use of test scores. The studies used the
National Teacher Examination specialty test, State certification tests, tests developed by other
researchers, or researcher-made tests. We found that 25 % of the studies in our sample used one
or another type of test to measure teachers’ subject matter knowledge. Research based local tests
are the most often used to measure teachers’ subject matter knowledge. Whereas secondary
school studies used educational background variables more often, teacher tests were used more
often in studies that examined grade one through six teachers to measure teachers’ subject matter
knowledge.
Thus, the variations in indicators of subject matter knowledge may influence inconsistent
study findings on the relationship between teachers’ subject matter knowledge and student
mathematics achievement.
Measurement variations on the same indicator
There are also variations within these general categories of indicator. There are many
tests and many ways of tallying up coursework. As a case, we examine the ways in which
AERA 2004 Subject matter knowledge 7
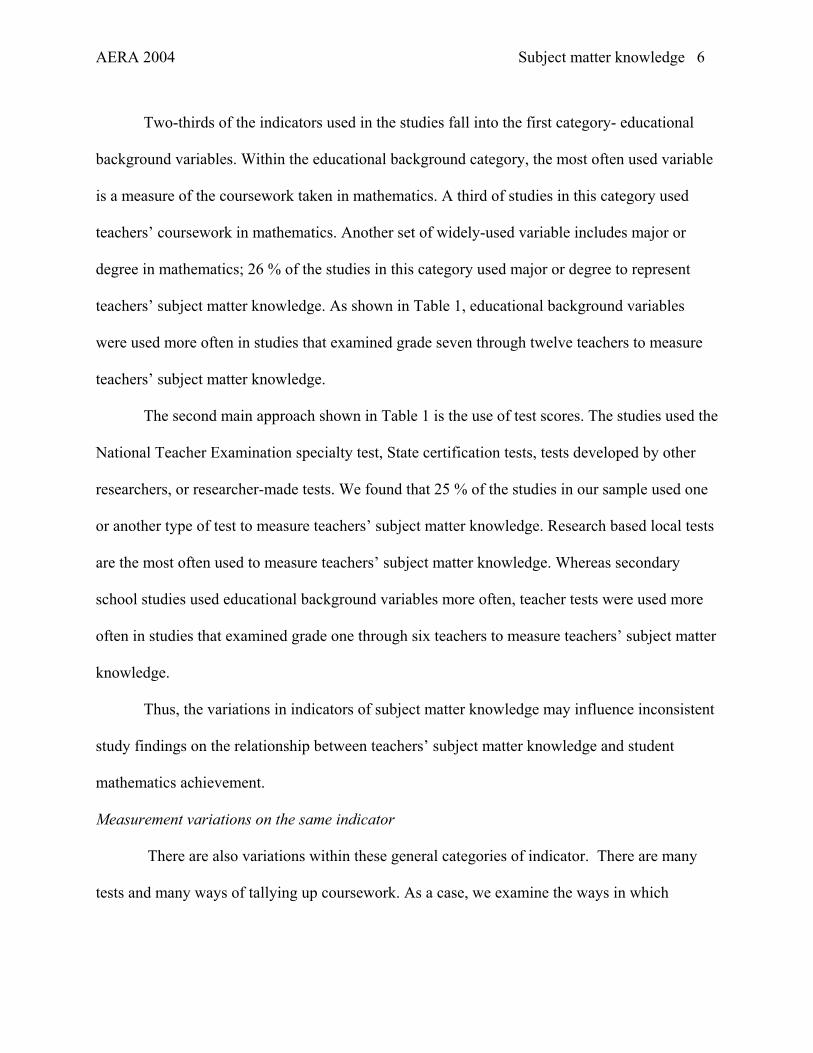
coursework taken in mathematics was measured in the studies. Table 2 shows the different
approaches to measuring teachers’ coursework in mathematics.
Table 2
Number of studies by approaches for using teachers’ coursework in mathematics Amount of courses Level of courses
Coursework number of courses Credit hours
N of studies 4 6 5
The first approach shown in table 2 is to measure the amount of math courses taken,
regardless of the level of courses. That is, the amount of courses were counted regardless of
whether the courses were introductory or advanced courses. In most studies, coursework taken in
mathematics was measured as the amount of courses by counting total number of courses or total
credit hours across all courses.
The second approach in Table 2 is to measure the amount of coursework, differentiating
by the level of the courses. Five studies examined whether teachers who took advanced
mathematics courses or more advanced mathematics courses have students with higher
achievement in mathematics. For example, Chaney (1995) classified teachers as those who took
courses only at the calculus level or below versus those who took advanced courses in
mathematics, and then examined whether eighth grade students performed better if their
mathematics teachers had taken courses beyond the level of calculus.
Within the second approach, researchers used different ways to measure teachers’
coursework in related to level of the courses. Two studies measured teachers’ coursework in
related to the level of courses asking whether or not they took advanced courses. A study
measured it asking how many advanced courses teachers took. Other two studies developed their
own rating scales to measure teachers’ coursework in related to the level of courses. For
AERA 2004 Subject matter knowledge 8
instance, Rouse (1967) developed a scale with 9 values to measure the extent of teachers’ college
mathematics preparation. While 1 of value means no mathematics courses, 9 of value means that
teachers took one or more of the most advanced mathematics courses.
Thus, it may be that study findings are different when researchers choose different
approaches using the same measure. For example, it may be that using different approaches to
measure the amount of coursework makes a difference in study findings. There may also be
differences in findings between studies that used the amount of coursework and studies that used
the level of coursework as indicators of subject matter knowledge.
Different scaling of data
Studies chose different scaling of the data using the same measure. For example, while 8
studies used continuous variables, measuring exact count of numbers of courses or credit hours,
5 studies created categorical coursework variables by grouping number of courses or credit
hours. One study used both continuous and categorical variables to examine the relationship
between teachers’ subject matter knowledge measured by teachers’ coursework in mathematics
and student mathematics achievement. In addition, the studies that used categorical variables
used different categories because there are no clear cut-points to make categories.
Using different scaling of the data may influence study findings. For example, Monk
(1995) investigated the effect of subject matter knowledge measured by teachers’ coursework in
mathematics and student mathematics achievement using both continuous and categorical
variables. While positive effects of subject matter knowledge on student achievement were found
in his study, Monk reported that the magnitudes of the positive effects varied. Using a
continuous variable, he found that an increase of one mathematics course was associated with a
1.2% increase in the junior students’ mathematics test scores. The addition of courses beyond
AERA 2004 Subject matter knowledge 9
the fourth course had a smaller effect (0.2 % increase) on student performance when he used a
categorical variable (0-4 vs. 5 up).
Thus, it may be that using different scales to measure teachers’ subject matter knowledge
influence inconsistent study findings. These researchers’ choices of scaling were related to their
choices of data analytic techniques we will discuss in the next.
Variations in Data Analytic Techniques
Studies also used very different data analytic techniques to examine the influence of
teachers’ subject matter knowledge in relation to student mathematics achievement. The major
data analytic techniques used in our sample are as follows: (a) correlation analysis, (b)
regression, (c) hierarchical linear modeling, and (d) group comparison techniques such as
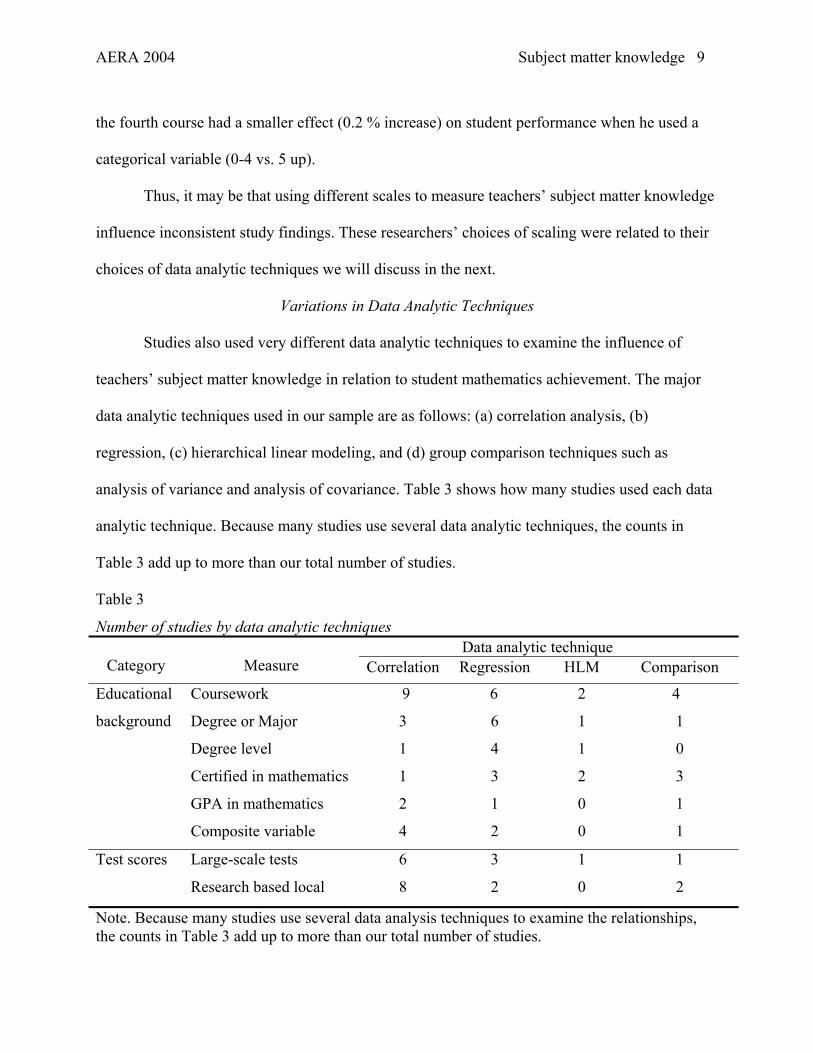
analysis of variance and analysis of covariance. Table 3 shows how many studies used each data
analytic technique. Because many studies use several data analytic techniques, the counts in
Table 3 add up to more than our total number of studies.
Table 3
Number of studies by data analytic techniques
Note. Because many studies use several data analysis techniques to examine the relationships, the counts in Table 3 add up to more than our total number of studies.
Data analytic technique Category
Measure Correlation Regression HLM Comparison
Coursework 9 6 2 4
Degree or Major 3 6 1 1
Degree level 1 4 1 0
Certified in mathematics 1 3 2 3
GPA in mathematics 2 1 0 1
Educational
background
Composite variable 4 2 0 1
Large-scale tests 6 3 1 1 Test scores
Research based local 8 2 0 2
AERA 2004 Subject matter knowledge 10
Thus, study findings on the relationship between teachers’ subject matter knowledge and
students’ mathematics achievement may vary by the type of data analytic technique used in the
study.
Variations in Subjects: Grade Level of Teachers ands Students
Teachers and students who participated in the studies we found ranged in grade from 1
through12. This fact means that the studies are concerned with different mathematical content.
That is, the relationships between teachers’ subject matter knowledge and students’ mathematics
achievement may depend on what grade was taught.
Findings in the following two studies support this hypothesis. Chiang (1996) studied the
relationship between teachers’ educational training and student mathematics achievement using
NELS 88 data. One variable representing teachers’ subject matter preparation was whether the
teacher held dual degrees in mathematics – undergraduate and graduate degrees in mathematics.
He used it to examine whether teachers who had dual degrees in mathematics had students with
higher mathematics achievement. He found that while teachers with two degrees in math were
not more effective in increasing student achievement in the 10th grade mathematics classes and
any degree in mathematics was equally effective, in the 12th grade mathematics classes, teachers
holding dual produced higher student achievement. Monk (1994) also found that the effects of
subject matter knowledge measured by number of undergraduate mathematics courses on student
achievement in mathematics were different for the sophomore and junior students. He reported
that the magnitude of the effect was larger at the junior level.
Thus, we hypothesize that study findings may differ by grade level taught.
AERA 2004 Subject matter knowledge 11
RESEARCH QUESTIONS
Given the literature review, our main purpose of the meta-analysis is to identify variables
that moderate the relationship of teachers’ subject matter knowledge and student mathematics
achievement. Our specific questions are as follows.
1. What is the overall strength of the relationship between teachers’ subject matter
knowledge and student learning?
2. Does the strength of the relationship differ by types of indicators of teachers’ subject
matter knowledge?
3. Does the strength of the relationship differ by grade level taught?
4. Does the strength of the relationships differ by other measurement variations such as
types of subject matter knowledge tests, ways in which teachers’ coursework were measured,
and unit of analyses?
META-ANALYSIS
Methods
Of 41 relevant studies our meta-analysis is based on the 27 studies including 4 journal
articles, 1 conference paper, 4 reports, and 18 dissertations. We will discuss the omitted studies
and combined studies in this section. The characteristics of the 27 studies included in this
research synthesis are in Appendix I.
Omitted Studies
A number of potential studies were omitted from this research synthesis for two reasons.
First, some did not report enough information to obtain a correlation coefficient, which was the
selected effect-size metric in this meta-analysis (e.g. Darling-Hammond, 2002; Hurst, 1967). For
example, Cox (1970) used analysis of covariance to test the effect of teachers’ level of
AERA 2004 Subject matter knowledge 12
competence in mathematics on student achievement in arithmetic controlling for student
Intelligent Quotient (IQ) and pre-test achievement. It was not possible to obtain a correlation
coefficient from this study.
Second, we omitted studies that used incomparable statistical designs such as hierarchical
linear modeling (HLM), and multiple regression with no correlations reported. Nine studies that
used HLM or regression did not allow us to compute an effect size comparable to a correlation
coefficient (e.g., Chaney, 1995; Ziegler, 2000).
Combined Studies
Two studies in which the same dataset was used were combined together as one study.
Rowan, Chiang, and Miller (1997) used the same dataset (NELS:88) that Chiang (1996) used in
his dissertation. Most of the reported correlation values were identical in the two studies.
Therefore, we combined those two studies and extracted the correlation values from Chiang’s
(1996) study because Rowan et al. (1997) did not report one of the correlation values that we
were interested in.
Coding
Indicators of teachers’ subject- matter knowledge
The indicators of teachers’ subject-matter knowledge (SMK) were characterized into two
main categories: Educational background variables and teacher tests. Educational background
variables included 1) GPA in mathematics, 2) coursework in mathematics, 3) degree or major in
mathematics, 4) degree level in mathematics, 5) certificate in mathematics, and 6) some
combinations of educational background variables.
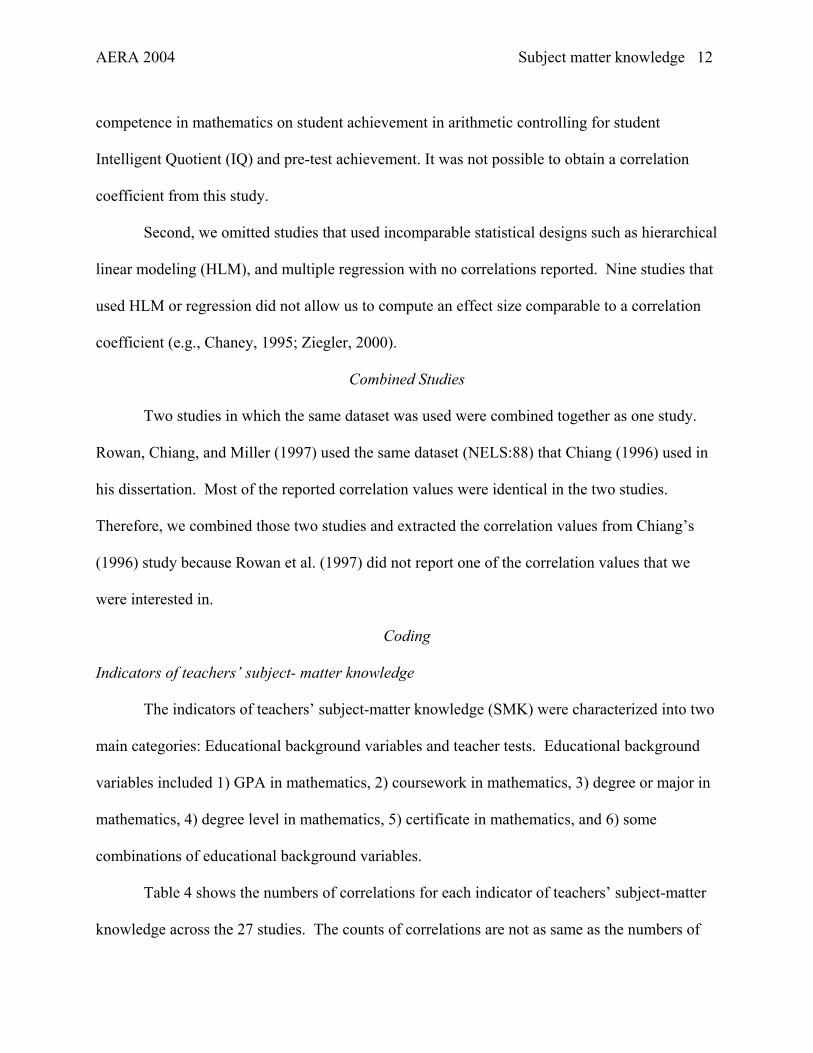
Table 4 shows the numbers of correlations for each indicator of teachers’ subject-matter
knowledge across the 27 studies. The counts of correlations are not as same as the numbers of
AERA 2004 Subject matter knowledge 13
studies (27) used in this meta-analysis because some studies reported on multiple samples and
multiple indicators of teachers’ SMK
Table 4
Numbers of correlation for teachers’ subject-matter knowledge (SMK) and grade SMK Grade Types of SMK # of R
Educational Elementary GPA 0 Background (K=10) Coursework 6 Variables Major/Degree 3 (K=38) Certification status 0 Combinations of background variables 1 Secondary GPA 2 (K=28) Coursework 9 Major/Degree 10 Certification status 2 Combinations of background variables 5 Teacher tests Elementary Large-scale based 12 (K=26) (K=16) Research based –local 4
Secondary
Large-scale based 8
(K=10) Research based –local 2
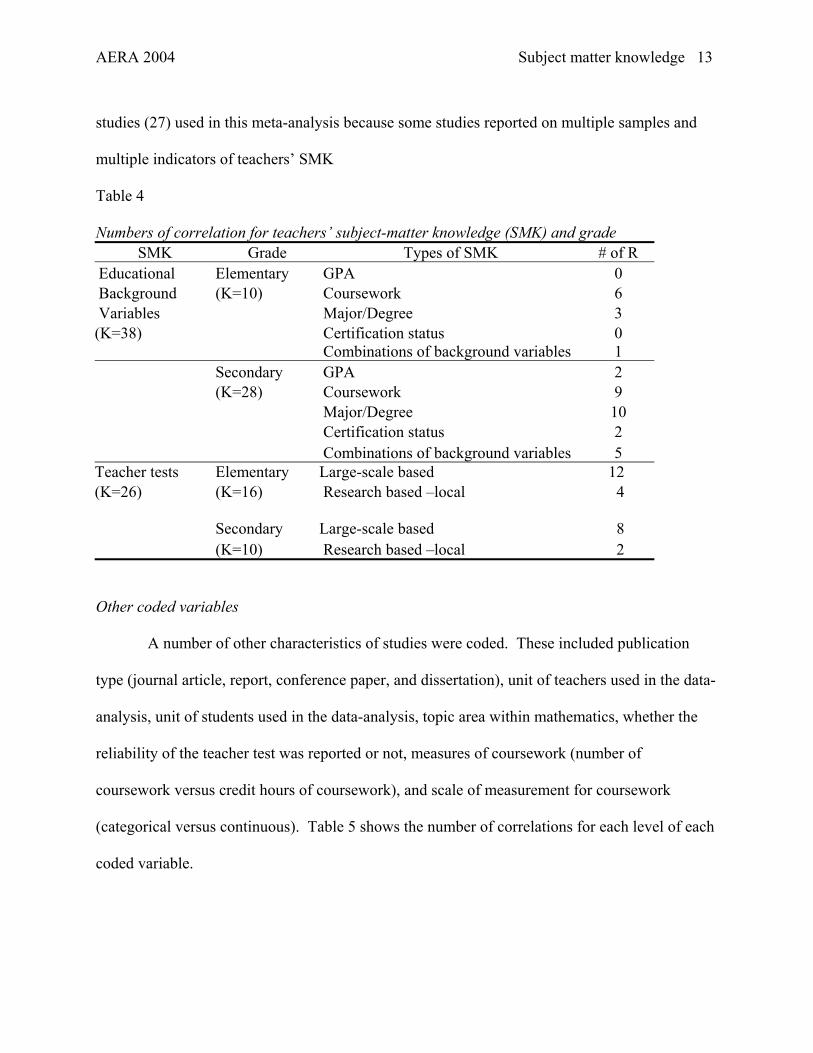
Other coded variables
A number of other characteristics of studies were coded. These included publication
type (journal article, report, conference paper, and dissertation), unit of teachers used in the data-
analysis, unit of students used in the data-analysis, topic area within mathematics, whether the
reliability of the teacher test was reported or not, measures of coursework (number of
coursework versus credit hours of coursework), and scale of measurement for coursework
(categorical versus continuous). Table 5 shows the number of correlations for each level of each
coded variable.
AERA 2004 Subject matter knowledge 14
Table 5 Other coded variables
Variables Levels of the variable # of R
Publication type Journal Report Dissertation Conference paper
7 39 17 1
Unit of teachers Individual level Classroom level School level
54 7 3
Unit of students Individual level Classroom level School level
42 18 4
Topic area within mathematics General mathematics Arithmetic Algebra Geometry Other
22 16 20 5 1
Whether reliability of teacher test is reported or not Reliability reported Reliability unreported
8 17
Measures of coursework Number of courses Hours of courses
8 7
Effect Size
The main index used to represent the association between teachers’ subject matter
knowledge was the Pearson product-moment correlation coefficient (r). If a zero-order
correlation coefficient was reported in the primary study, we used the reported correlation
coefficient value as our outcome. However, when we could not directly get correlation
coefficients from primary studies, we extracted them in several ways:
1) When a study reported raw data, we directly computed the correlation coefficient (e.g.
Carezza, 1970; Koch, 1972; Lampela, 1966; Smith, 1964; Soeteber, 1969).
AERA 2004 Subject matter knowledge 15
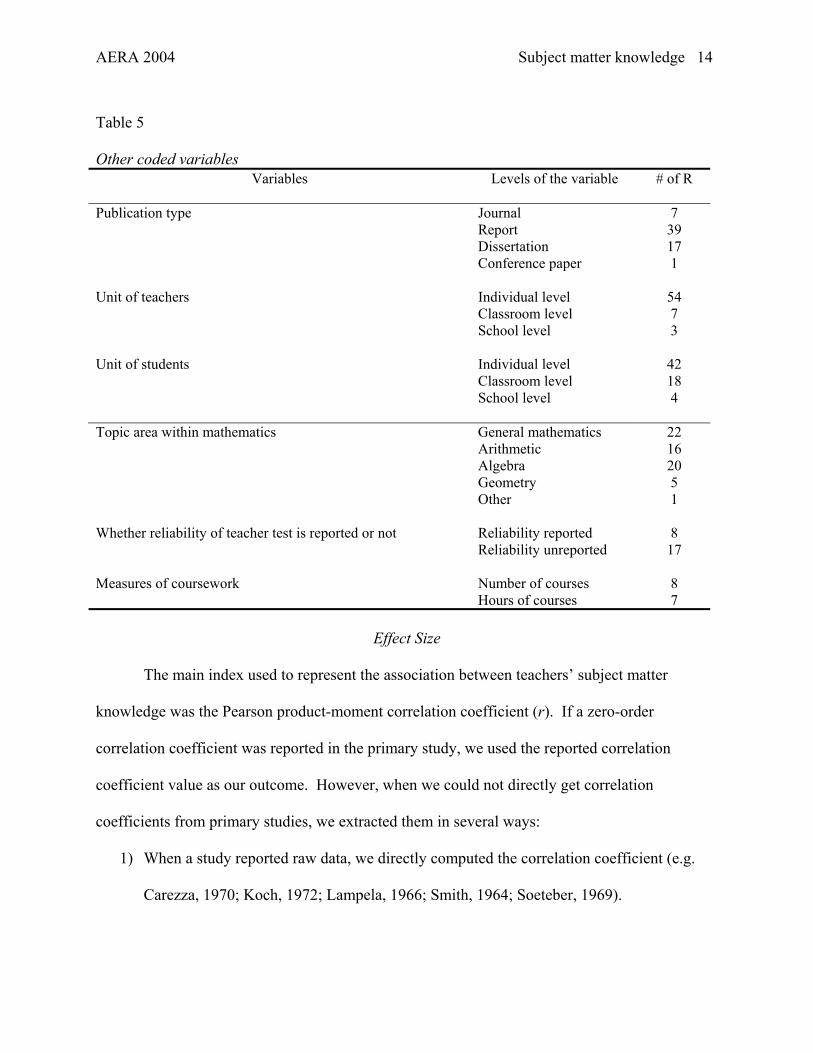
2) When a study reported means (Mi) and standard deviations (SDs) for two groups that
represented different levels of teacher knowledge, we first obtained Cohen’s d as
pooledSMMd 21 −= , (1-1),
where Spooled is the pooled within-groups SD (that appears in the two-sample t test) and then
converted d to r via
42
2
+=
ddr . (1-2).
The signs of correlation estimates were assigned to be positive when the group presumed to
represent a higher level of teacher knowledge had a higher mean (e.g., Fagnano, 1988).
3) When a study reported a t value for a two group comparison, we converted the t value to
r as follows:
dfttr+
= 2
2
, (1-3)
where (Rosenthal, 1994). Again here the sign of r was made positive when the
group presumed to have more knowledge scored higher (e.g. Prather, 1991).
221 −+= nndf
4) When a study reported on more than two groups and reported an ANOVA table, we
computed eta2 and used eta as an alternative to the correlation value if eta2 appeared to be
comparable (i.e., if the groups showed a linear relation or higher means for groups presumed to
have higher teacher subject matter knowledge). Even though some researchers have
recommended avoiding squared indices of effect size such as eta2 because they lose the
directionality of effect sizes (Rosenthal, 1994), we used eta, and directionality of the data was
examined using the reported means of all the groups (e.g. Reed, 1986).
AERA 2004 Subject matter knowledge 16
Because correlation coefficients can range only from –1 to +1, their distributions can
violate the normality assumption for several statistical methodologies. Therefore, all the
correlation coefficient values were transformed using Fisher’s (1925) z, which ranges from
negative infinity to positive infinity, and is computed as follows:
))1/()1ln((*5. iii rrz −+= , (1-4)
where ln is the natural logarithm. The conditional variance of zi is
31−
=i
i nv , (1-5)
where ni is the sample size used in each study. Then, all the estimates (e.g., means and
confidence limits) computed based on Fisher’s z were then transformed back into the r metric via
11)( 2
2
+−
= z
z
eezr . (1-6)
Thus, after reversing Fisher’s z, the effect-size estimates can be simply interpreted as common
correlation coefficients. Below, for simplicity, we refer to all of the effect measures obtained as
correlations, regardless of how they were initially computed.
Analyses
Our analyses follow random-effects models (Raudenbush, 1994) rather than fixed-effects
models. The distinction between fixed and random effects is a sophisticated data analysis
problem (Raudenbush, 1994). Cooper (1998) suggests that the meta-analyst should choose a
random-effects model in cases where the effect sizes in a data set are likely to be affected by a
large number of uncontrollable influences such as differences in the teachers and schools
sampled, the specific measures used of each variable, and so on. Also, Raudenbush (1994)
AERA 2004 Subject matter knowledge 17
indicated that, if the outcome of a process cannot be predicted in advance due to a multiplicity of
potential moderators, it would be reasonable to consider a study’s true effect size as random.
We will first examine the overall mean correlation and its 95% confidence interval. In
this overall analysis, we will include all the correlations obtained from 27 studies in spite of
dependencies among multiple outcomes from several studies. Then, we will examine the effects
of potential moderator variables on the relationship between teachers’ subject-matter knowledge
and student learning using both weighted regression analyses and ANOVA-like categorical
analyses (Raudenbush, 1994).
Results
Description of Studies
The 27 studies included in this research synthesis allowed for the computation of 64
effect sizes. Studies often have multiple samples (which provide different independent
correlation coefficients) as well as multiple correlation coefficients for single samples, depending
on how many measures were obtained of teachers’ subject-matter knowledge and of student
learning. When multiple samples were identified, we treated each sample independently. For
example, Begle (1972) reported separate correlation coefficients for male teachers and female
teachers. So, we treated Begle’s male and female teachers as two independent samples. When
multiple outcomes were reported in studies, we used the most fine-grained subsets for our effect
size computation. The largest number of correlations was obtained from Begle and Geeslin
(1972), which produced 9 correlations from multiple samples and multiple outcomes.
Therefore, the total number of correlations used in this research synthesis is 64.
Assessing the Presence of Publication Bias
AERA 2004 Subject matter knowledge 18
Publication bias arises when the probability that a study is published depends on the
statistical significance of its results. It represents the degree to which studies in the meta-
analysis truly represent the broader population in which researchers are interested. One way to
assess whether publication bias is likely to be problematic for a set of studies is to examine the
funnel plot. Since correlations from smaller studies show more variability than those from larger
studies, a plot of correlations against sample sizes should look like a funnel if there is no
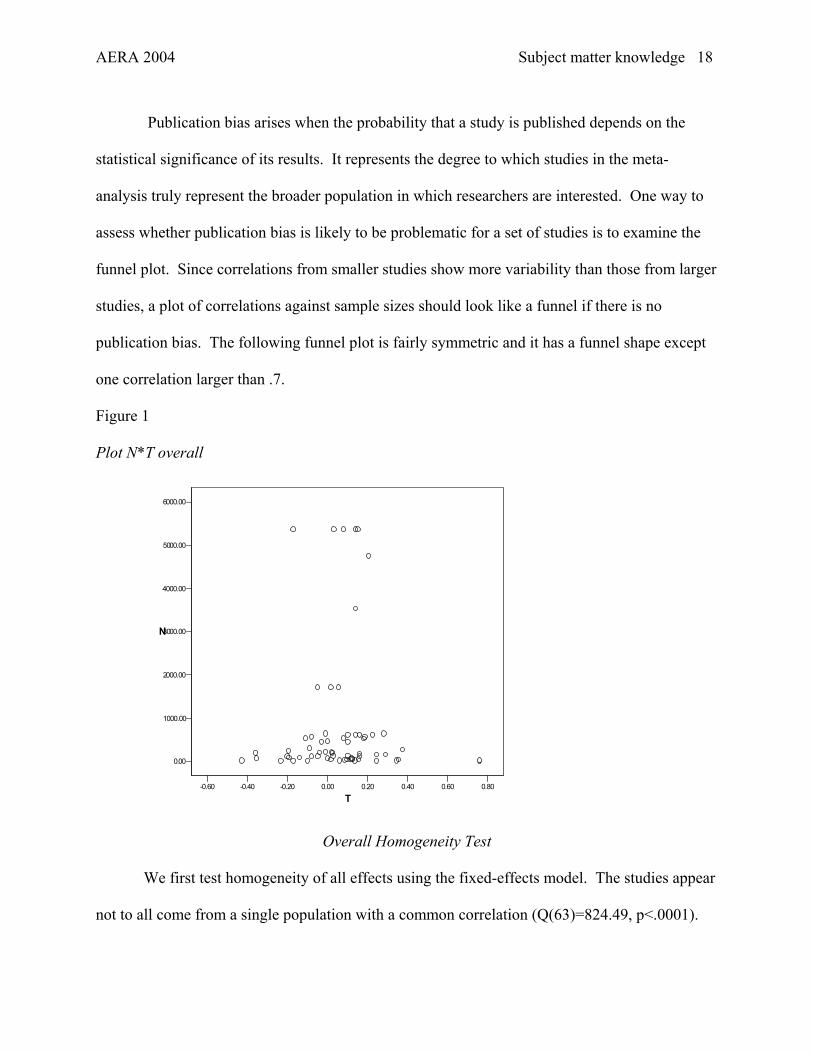
publication bias. The following funnel plot is fairly symmetric and it has a funnel shape except
one correlation larger than .7.
Figure 1
Plot N*T overall
-0.60 -0.40 -0.20 0.00 0.20 0.40 0.60 0.80
T
0.00
1000.00
2000.00
3000.00
4000.00
5000.00
6000.00
N
Overall Homogeneity Test
We first test homogeneity of all effects using the fixed-effects model. The studies appear
not to all come from a single population with a common correlation (Q(63)=824.49, p<.0001).
AERA 2004 Subject matter knowledge 19
Hence, as we assumed, a random-effects model is more appropriate to describe the average size
of the relationship between teachers’ subject-matter knowledge and student learning across all
the samples. Under the random-effects model, the estimated average correlation is .06 with a
95% confidence interval (CI) ranging from .06 to .07 and with a standard error of .004. This
result indicates that the relationship between teachers’ subject-matter knowledge and student
learning is statistically different from zero. The estimate of the between-studies variance
component is .03.
Moderator Analysis
Since the purpose of our study is to explore the effect of different moderators on the
relationship between teachers’ subject-matter knowledge and student achievement, we conducted
a number of moderator analyses. Also, our initial set of 64 effect sizes suffers from dependence
because of multiple outcomes from different indicators (e.g., Carezza, 1969; Chiang, 1996). The
moderator analyses will often reduce the dependence among the multiple correlations from
individual studies by classifying them into separate subsets.
Educational background variables versus teacher knowledge tests
One possible moderator is whether teachers’ subject-matter knowledge was measured by
educational background variables or a teacher knowledge test. To examine the effect of the
measure of teachers’ subject-matter knowledge on the relation of teachers’ SMK to student
achievement, we conducted a weighted regression analysis with a dummy variable (0 =
educational background variable, 1 = teacher knowledge test). The model for this regression
analysis is shown in Table 6.
Table 6 shows the relationship between teachers’ SMK is significantly different
depending on whether teachers’ knowledge in mathematics is measured by either educational
AERA 2004 Subject matter knowledge 20
background or teachers’ SMK (Qmodel(1)=34.89, p<.0001). The measures of teachers’ subject
matter knowledge explain some of the variation in the strength of the teachers’ SMK to student
achievement. However, all the variation is not explained by the difference between these two
types of measures of teachers’ knowledge in mathematics.
More specifically, the parameter estimates from the fixed-effects model with the dummy
variable are shown in Table 6. The mean difference of the relationship between teachers’ subject
matter knowledge and student achievement depending on the measures of teachers’ subject
matter knowledge (educational background variable versus. teachers’ knowledge test) are -.05,
which is significant. Also, the estimate of the mean correlation is .08 when we measure teacher
knowledge with educational background variables, while the estimate of the mean correlation
is .03 when teachers’ knowledge in mathematics is measured by a knowledge test.
Grade level
Another possible moderator is grade level of teachers and students. To examine the
effect of grade level on the relation of teachers’ SMK to student achievement, we conducted a
weighted regression analysis with a dummy variable (0 = elementary level, 1 = secondary level).
The model for this regression analysis is also shown in Table 6. Result shows the test for the
model (Qm) is significant, but much variations is still unexplained (Qe), indicating that the
relationship between teachers’ subject matter knowledge and student learning varies significantly
depending on the grade level assessed (elementary versus. secondary).
The mean difference in the relationship between teachers’ subject matter knowledge and
student achievement depending on the grade level is .04. Also, the estimate of the mean
correlation is .03 at the elementary level, while the estimate of the mean correlation is .07 at the
secondary level.
AERA 2004 Subject matter knowledge 21
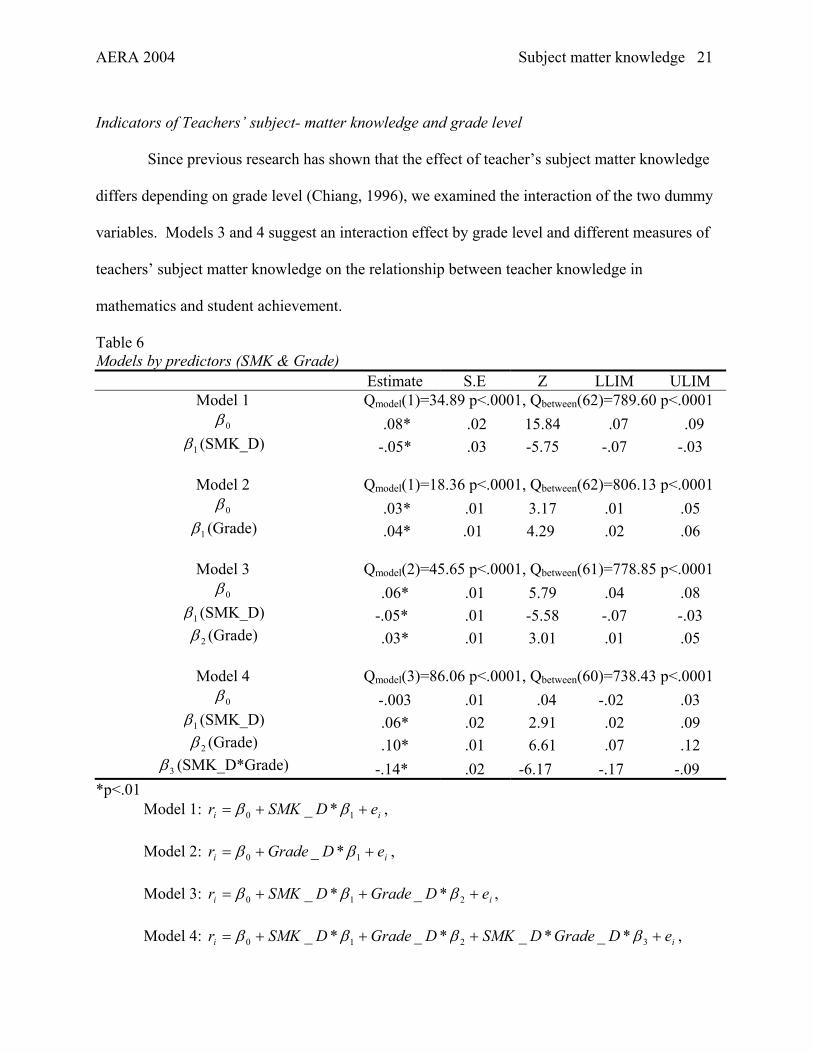
Indicators of Teachers’ subject- matter knowledge and grade level
Since previous research has shown that the effect of teacher’s subject matter knowledge
differs depending on grade level (Chiang, 1996), we examined the interaction of the two dummy
variables. Models 3 and 4 suggest an interaction effect by grade level and different measures of
teachers’ subject matter knowledge on the relationship between teacher knowledge in
mathematics and student achievement.
Table 6 Models by predictors (SMK & Grade)
Estimate S.E Z LLIM ULIM Model 1 Qmodel(1)=34.89 p<.0001, Qbetween(62)=789.60 p<.0001
0β .08* .02 15.84 .07 .09 1β (SMK_D) -.05* .03 -5.75 -.07 -.03
Model 2 Qmodel(1)=18.36 p<.0001, Qbetween(62)=806.13 p<.0001
0β .03* .01 3.17 .01 .05 1β (Grade) .04* .01 4.29 .02 .06
Model 3 Qmodel(2)=45.65 p<.0001, Qbetween(61)=778.85 p<.0001
0β .06* .01 5.79 .04 .08 1β (SMK_D) -.05* .01 -5.58 -.07 -.03
2β (Grade) .03* .01 3.01 .01 .05
Model 4 Qmodel(3)=86.06 p<.0001, Qbetween(60)=738.43 p<.0001 0β -.003 .01 .04 -.02 .03
1β (SMK_D) .06* .02 2.91 .02 .09 2β (Grade) .10* .01 6.61 .07 .12
3β (SMK_D*Grade) -.14* .02 -6.17 -.17 -.09 *p<.01 Model 1: ii eDSMKr ++= 10 *_ ββ ,
Model 2: ii eDGrader ++= 10 *_ ββ ,
Model 3: ii eDGradeDSMKr +++= 210 *_*_ βββ ,
Model 4: r ii eDGradeDSMKDGradeDSMK ++++ 321 *_*_*_*_= 0 ββββ ,
AERA 2004 Subject matter knowledge 22
where SMK_D is 1 if teacher knowledge is used for measuring teachers’ subject matter
knowledge and is 0 otherwise. Also, Grade_D is 1 for elementary school teachers and students,
and is 0 for secondary school teachers and students.
Since teachers’ SMK and grade and their interaction did not fully account for all between
study differences, we estimated the mean correlations under the random-effects model. The
random-effects model assumes there is a population of effects varying randomly around an
average true effect. An estimate of this uncertainty is incorporated into the mean correlation and
its standard error. Table 6 shows the average correlation of teachers’ SMK with student
achievement depending on grade level and type of SMK.
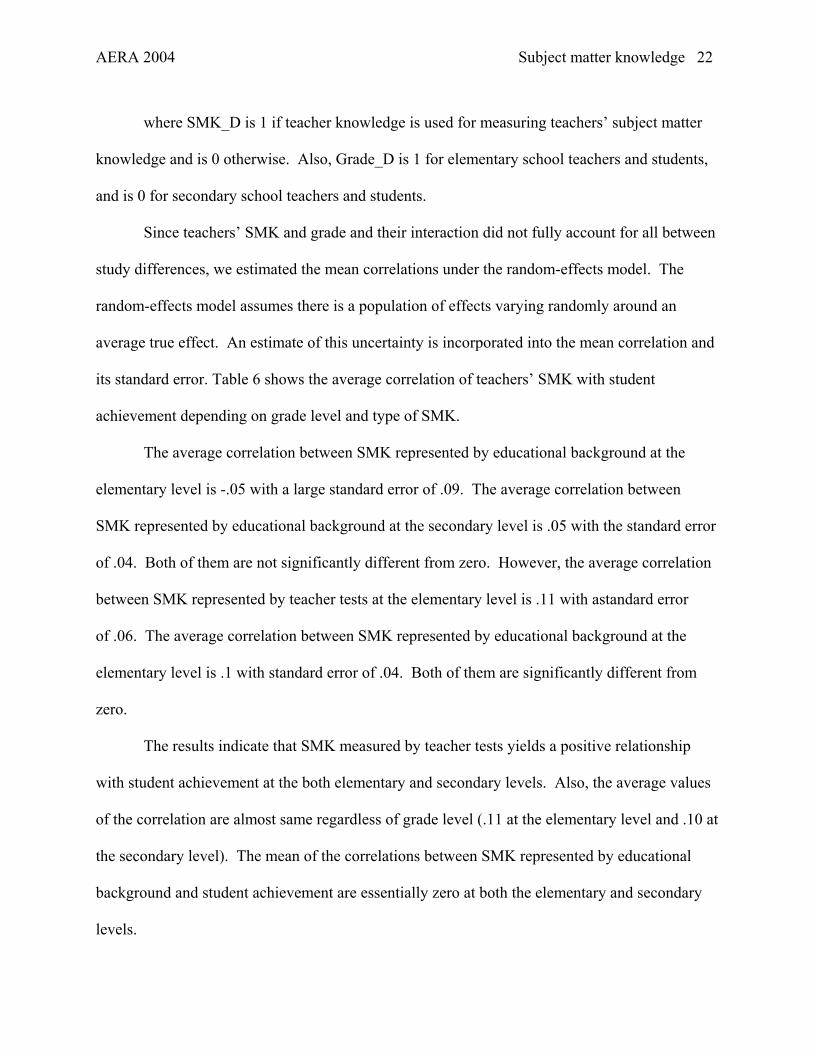
The average correlation between SMK represented by educational background at the
elementary level is -.05 with a large standard error of .09. The average correlation between
SMK represented by educational background at the secondary level is .05 with the standard error
of .04. Both of them are not significantly different from zero. However, the average correlation
between SMK represented by teacher tests at the elementary level is .11 with astandard error
of .06. The average correlation between SMK represented by educational background at the
elementary level is .1 with standard error of .04. Both of them are significantly different from
zero.
The results indicate that SMK measured by teacher tests yields a positive relationship
with student achievement at the both elementary and secondary levels. Also, the average values
of the correlation are almost same regardless of grade level (.11 at the elementary level and .10 at
the secondary level). The mean of the correlations between SMK represented by educational
background and student achievement are essentially zero at both the elementary and secondary
levels.
AERA 2004 Subject matter knowledge 23
Table 7 The average correlations of teachers’ SMK with student achievement depending on Types of SMK and grade level
Educational background Teacher tests 95% CI 95% CI
SMK Grade
Mean S.E Lower Upper
Mean S.E Lower Upper
Elementary -.05 .09 -.16 .06 .11* .06 .003 .22
Secondary .05 .04 -.02 .12 .10* .04 .03 .18
* p<.05
Figure 2
Confidence interval for SMK by grade level under the random effects
E E S E E T S T
S M K
- 0 . 1 0
0 .0 0
0 .1 0
0 .2 0
L L I MU L I M
M e a n
EE: Educational background variables at the elementary level ET: Teacher tests at the elementary level SE: Educational background variables at the secondary level ST: Teacher tests at the secondary level One other regression model with four predictors – SMK, grade, SMK*grade, unit of
teacher and publication year – is shown in the appendix II. In this regression model, the Qmodel is
significant and Qerror is significant. It indicates that these four predictors explain between study
variations. However, unexplained variations still exist in this model.
AERA 2004 Subject matter knowledge 24
Categorical Analyses
In order to examine the effect of different moderators on the relationship between
teachers’ knowledge in mathematics and student learning, we also conducted several categorical
data analyses.
Measures of teachers’ SMK and grade level: All grade levels
We examined the effect of different kinds of measures of teachers’ SMK across all grade
levels. As shown in Table 8, since Qbetween is significant, differences between five different
measures of teachers’ subject matter knowledge – GPA, coursework, degree/major, test, and
combinations of other indicators - explain some of the variation in correlations across all grade
levels. However, there is still considerable unexplained variation and a significant Qwithin, which
indicates the predictor, types of measure of teachers’ subject matter knowledge, does not give a
full explanation of all the variation in the relationship between teachers’ SMK and student
achievement. Of the five indicators of teachers’ SMK, the two groups labeled “combination of
other indicators” (e.g., GPA + coursework) and certification status yielded the highest mean
correlations. We found negative but insignificant correlations between teachers’ subject matter
knowledge and student achievement when GPA and coursework were used to represent teachers’
knowledge in mathematics.
Measures of teachers’ SMK and grade level: Elementary level
As shown in Table 7, since Qbetween is significant, four different measures of teachers’
subject matter knowledge – coursework, degree/major, test and combination – do explain some
variations of correlation in elementary school. However, there are still unexplained variations in
correlation.
AERA 2004 Subject matter knowledge 25
Measures of teachers’ SMK and grade level: Secondary level
For the secondary studies the five different measures of teachers’ SMK – GPA,
coursework, degree/major, test and combination – do explain some variation in the correlations.
However, again unexplained variation still remains.
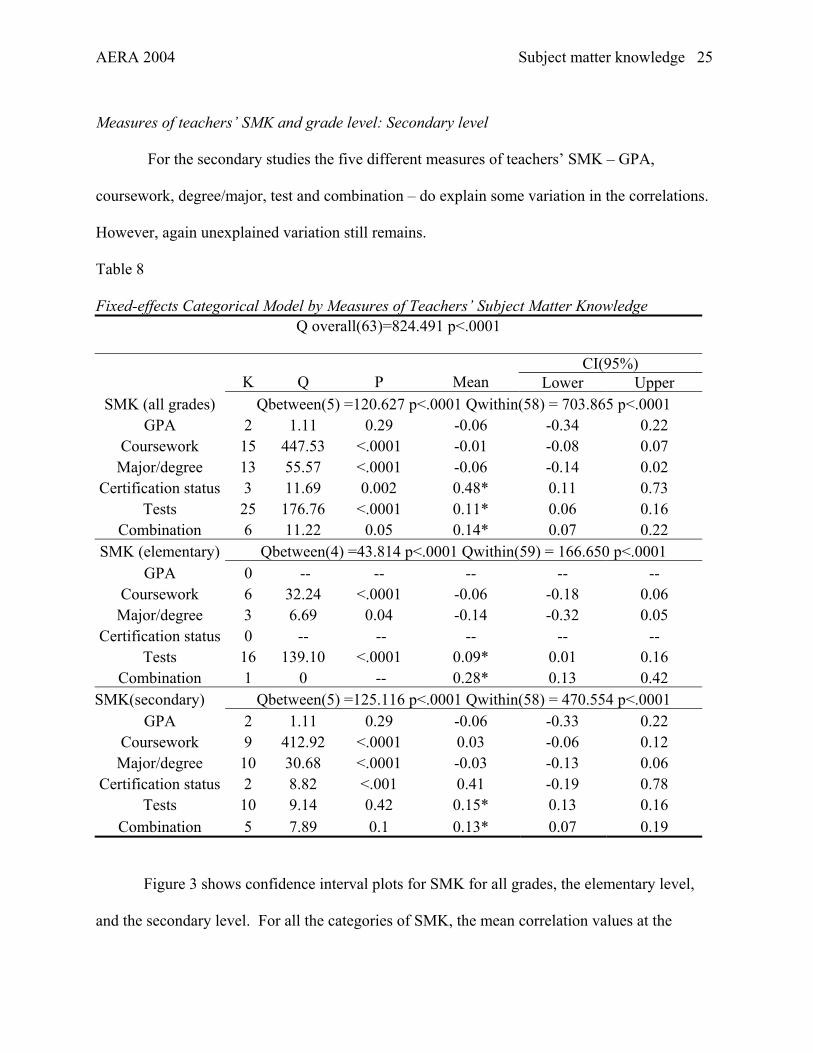
Table 8 Fixed-effects Categorical Model by Measures of Teachers’ Subject Matter Knowledge
Q overall(63)=824.491 p<.0001
CI(95%) K Q P Mean Lower Upper
SMK (all grades) Qbetween(5) =120.627 p<.0001 Qwithin(58) = 703.865 p<.0001 GPA 2 1.11 0.29 -0.06 -0.34 0.22
Coursework 15 447.53 <.0001 -0.01 -0.08 0.07 Major/degree 13 55.57 <.0001 -0.06 -0.14 0.02
Certification status 3 11.69 0.002 0.48* 0.11 0.73 Tests 25 176.76 <.0001 0.11* 0.06 0.16
Combination 6 11.22 0.05 0.14* 0.07 0.22 SMK (elementary) Qbetween(4) =43.814 p<.0001 Qwithin(59) = 166.650 p<.0001
GPA 0 -- -- -- -- -- Coursework 6 32.24 <.0001 -0.06 -0.18 0.06
Major/degree 3 6.69 0.04 -0.14 -0.32 0.05 Certification status 0 -- -- -- -- --
Tests 16 139.10 <.0001 0.09* 0.01 0.16 Combination 1 0 -- 0.28* 0.13 0.42
SMK(secondary) Qbetween(5) =125.116 p<.0001 Qwithin(58) = 470.554 p<.0001 GPA 2 1.11 0.29 -0.06 -0.33 0.22
Coursework 9 412.92 <.0001 0.03 -0.06 0.12 Major/degree 10 30.68 <.0001 -0.03 -0.13 0.06
Certification status 2 8.82 <.001 0.41 -0.19 0.78 Tests 10 9.14 0.42 0.15* 0.13 0.16
Combination 5 7.89 0.1 0.13* 0.07 0.19
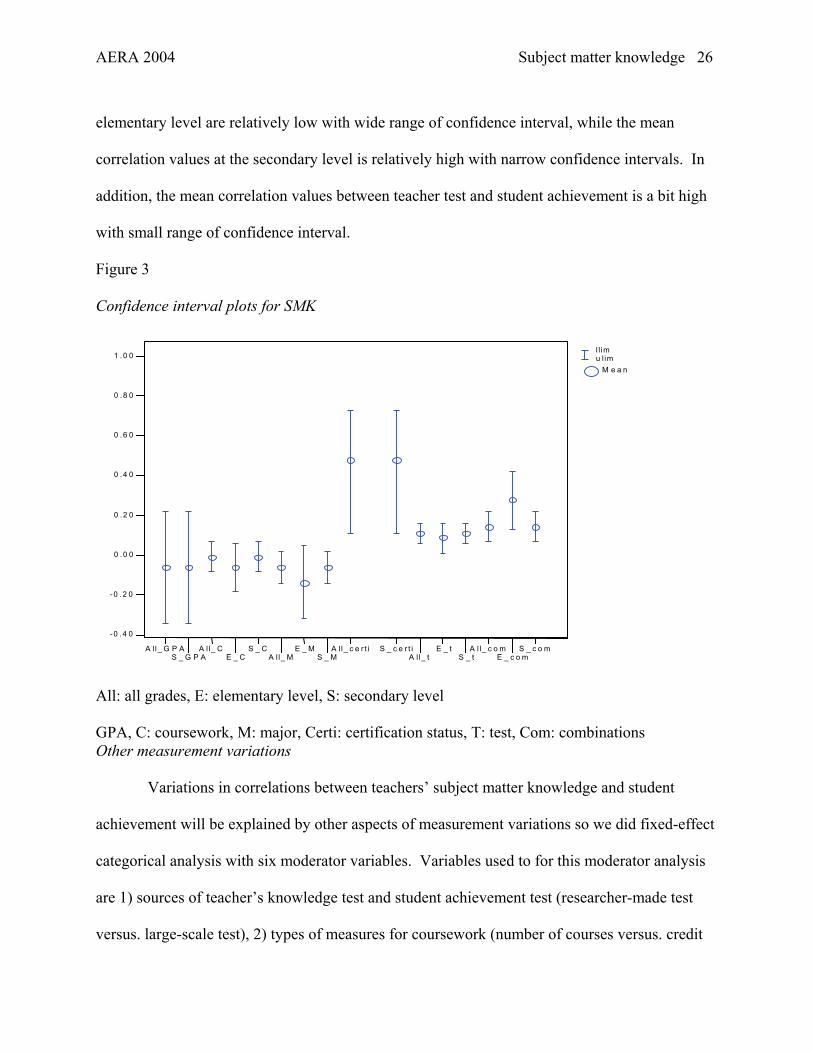
Figure 3 shows confidence interval plots for SMK for all grades, the elementary level,
and the secondary level. For all the categories of SMK, the mean correlation values at the
AERA 2004 Subject matter knowledge 26
elementary level are relatively low with wide range of confidence interval, while the mean
correlation values at the secondary level is relatively high with narrow confidence intervals. In
addition, the mean correlation values between teacher test and student achievement is a bit high
with small range of confidence interval.
Figure 3
Confidence interval plots for SMK
A ll_ G P A S _ G P A
A l l_ C E _ C
S _ C A ll_ M
E _ M S _ M
A ll_ c e r t i S _ c e r t iA l l_ t
E _ tS _ tA l l_ c o m
E _ c o mS _ c o m
-0 .4 0
- 0 .2 0
0 .0 0
0 .2 0
0 .4 0
0 .6 0
0 .8 0
1 .0 0 l l im u l im M e a n
All: all grades, E: elementary level, S: secondary level
GPA, C: coursework, M: major, Certi: certification status, T: test, Com: combinations Other measurement variations
Variations in correlations between teachers’ subject matter knowledge and student
achievement will be explained by other aspects of measurement variations so we did fixed-effect
categorical analysis with six moderator variables. Variables used to for this moderator analysis
are 1) sources of teacher’s knowledge test and student achievement test (researcher-made test
versus. large-scale test), 2) types of measures for coursework (number of courses versus. credit
AERA 2004 Subject matter knowledge 27
hours), 3) scale of the measure of coursework (Continuous scale versus. categorical scale), 4)
whether reliability is reported or not for teacher test, 5) unit of the teacher data (individual,
classroom, or school), and 6) unit of students (individual, classroom, or school). Table 9 shows
effects of other measurement variations on the relationship between teacher knowledge in
mathematics and student
Table 9. Measure variations k Q p value Mean SE of mean Source of measures (Teacher test)
Qtotal(24) =175.52 Qbetween(2) =11.27** Qwithin(22)=164.25**
Large-scale based Research-based local
5 20
18.29** 145.97**
<.001 <.001
.13*
.10* .05 .03
Measure of coursework Qtotal(14) =585.29 Qbetween(1) = 429.23** Qwithin(13) = 156.06** Number of courses Credit hours
8 7
90.27** 65.78**
<.001 <.001
-.09 .06
.05
.01
Level of coursework Qtotal(14) =585.29 Qbetween(1) = 14.96** Qwithin(13) = 570.33** General mathematics Higher level mathematics
12 3
367.51** 202.82**
<.001 <.001
.004 -.12
.03
.15
Whether reliability is reported or not
Qtotal(24) =175.52 Qbetween(1) = 40.59** Qwithin(23) = 134.93**
Reported Unreported
8 17
117.58** 17.35**
.02 <.0001
.08*
.16* .04 .02
Unit of teacher data Qtotal(63) =824.49, Qbetween(1) =44.22**, Qwithin(62)=780.27 ** Individual School
61 3
798.63** 1.33
<.0001 .51
.05*
.14* .03 .02
Unit of student data Qtotal(63) =824.49, Qbetween(2) =44.36**, Qwithin(61)=780.13 ** Individual Classroom School
24 37 3
495.79** 283.00** 1.33
<.0001 <.0001
.51
.07* .03 .14*
.02
.04
.02 ** p<.01
Source of the measures. For teacher knowledge test, the source of the measure explains
some variation of correlation (Qbetween(1) =11.27 p<.0001). However, unexplained variance
remains in the effect size by this moderator. The means of correlation under random-effects
AERA 2004 Subject matter knowledge 28
model are .13 and .10 for large-scale based test and research based local test. The mean
correlation for large-scale based test yields a bit higher correlation value.
Measures of coursework. The kinds of measure of coursework, either number of courses
taken or credit hours of mathematics, explains the variation in correlation between teachers’
subject matter knowledge and student achievement (Qbetween(1) = 429.23, p<.001). However,
this does not fully explain variation among the correlations (Qwithin(13) = 156.06, p<.001).
Types of coursework. Two different types of coursework, general mathematics courses or
higher level mathematics courses, explain some variations in the correlation between teachers’
subject matter knowledge represented by coursework in mathematics and student achievement
(Qbetween(1) = 14.96, p<.001). However, again this moderator does not fully explain differences
in these correlations (Qwithin(13) = 570.33, p<.001).
Whether reliability of teachers’ subject matter knowledge is reported or not. Whether
reliability of teachers’ subject matter knowledge is reported or not does explain variations in the
correlations (Qbetween(1) = 40.59, p<.001). Even though this cannot fully explain the variations of
effect size, the studies that report reliability have lower positive correlation values than those that
do not report reliability (Qwithin(23) = 134.93, p<.001). The mean correlation of SMK and
student learning under the random-effects model is higher when the study did not report
reliability for teacher tests than that when study did report reliability information for teacher tests.
Unit of analysis. The unit of the teacher data explains some between study differences,
but it also does not fully account for the variation in correlations between studies (Qbetween(1)
=44.22, p<.0001). The average correlation under random-effects model is lower at the individual
teacher level than at the school level. Unit of students also explain some of between study
differences, but it also does not fully account for the variations between studies (Qbetween(2)
AERA 2004 Subject matter knowledge 29
=44.36, p<.0001). The average correlation under random-effects model is the lowest at the
classroom level.
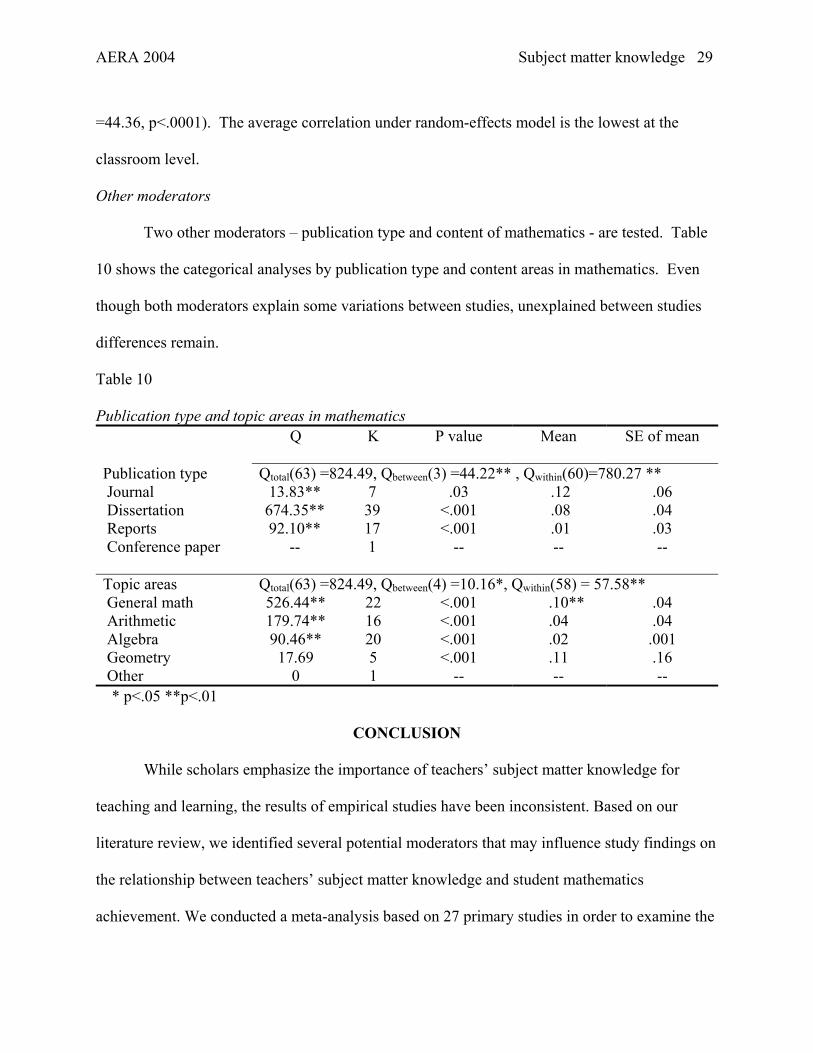
Other moderators
Two other moderators – publication type and content of mathematics - are tested. Table
10 shows the categorical analyses by publication type and content areas in mathematics. Even
though both moderators explain some variations between studies, unexplained between studies
differences remain.
Table 10 Publication type and topic areas in mathematics Q K P value Mean SE of mean
Publication type Qtotal(63) =824.49, Qbetween(3) =44.22** , Qwithin(60)=780.27 ** Journal Dissertation Reports Conference paper
13.83** 674.35** 92.10**
--
7 39 17 1
.03 <.001 <.001
--
.12 .08 .01 --
.06
.04
.03 --
Topic areas Qtotal(63) =824.49, Qbetween(4) =10.16*, Qwithin(58) = 57.58** General math Arithmetic Algebra Geometry Other
526.44** 179.74** 90.46** 17.69
0
22 16 20 5 1
<.001 <.001 <.001 <.001
--
.10** .04 .02 .11 --
.04
.04 .001 .16 --
* p<.05 **p<.01
CONCLUSION
While scholars emphasize the importance of teachers’ subject matter knowledge for
teaching and learning, the results of empirical studies have been inconsistent. Based on our
literature review, we identified several potential moderators that may influence study findings on
the relationship between teachers’ subject matter knowledge and student mathematics
achievement. We conducted a meta-analysis based on 27 primary studies in order to examine the
AERA 2004 Subject matter knowledge 30
effects of different moderators on the relationship between teachers’ subject matter knowledge
and student learning. In particular, we focused on measurement variations (i.e., of the different
indicators of teachers’ subject matter knowledge) to explain the diverse results on the
relationship between what teachers know in mathematics and student learning. The following
findings emerged in the meta-analysis.
(1) Under the random-effects model, teachers’ subject matter knowledge was positively
related to student mathematics achievement but the magnitude of the estimated mean correlation
coefficient across the 27 studies was very small (r= .06).
(2) The strength of the relationship between teachers’ subject matter knowledge and
student mathematics achievement was moderated by different types of indicators of subject
matter knowledge. Under the random-effects model, the estimated mean correlation was .02
when subject matter knowledge was measured by educational background variables, but the
estimated mean correlation was .11 when subject matter knowledge was measured by teacher
tests.
(3) The relationship of teachers’ subject matter knowledge to student mathematics
achievement is moderated by grade level taught. Under the random-effects model, while the
estimated mean correlation was .05 at the elementary level (grade 1-6), the estimated mean
correlation was .07 at the secondary level (grade 7-12).
(4) There was an interaction effect between grade level taught and types of indicators of
teachers’ subject matter knowledge. Under the random-effects model, while the estimated mean
correlation was -.05 at the elementary level when subject matter knowledge was measured by
educational background variables, the mean correlation was .05 at the secondary level when
subject matter knowledge was measured by educational background variables. However, the
AERA 2004 Subject matter knowledge 31
estimated mean correlations were similar at elementary level and secondary level when subject
matter knowledge was measured by teacher tests. As a result, the indicators of teachers’ subject
matter knowledge show different strengths of the relationship between the extent of teachers’
knowledge in mathematics and student achievement depending on the grade level of students.
(4) Other characteristics of measures such as sources of teacher knowledge tests, types of
coursework measures, whether reliability is reported or not for teacher knowledge tests, and unit
of analysis also account for some part of the variation in correlations between teachers’ subject
matter knowledge and student achievement.
(5) None of moderators fully explains the variations among the correlations between
teachers’ subject matter knowledge and student achievement. The results of our meta-analysis
indicate other moderator variables may predict the unexplained variations of correlation between
teachers’ subject matter knowledge and student achievement.
LIMITATION
Our meta-analysis has several limitations investigating the relationship between teachers’
subject matter knowledge and student mathematics achievement and the variables that moderate
the relationship. The first limitation is that we did not include all the quantitative studies that
have examined the relationship between teachers’ subject matter knowledge and student
achievement. A number of studies using multiple regression and hierarchical linear model
(HLM) were omitted for our meta-analysis. Due to these omitted studies, this meta-analysis can
only be generalized to correlational studies. In addition, because some studies that examined
teacher subject matter knowledge represented by degree level in mathematics and student
achievement were omitted (e.g., Goldhaber & Brewer, 1997; 2000), we could not examine how
AERA 2004 Subject matter knowledge 32
degree level as a measure of teachers’ subject matter knowledge related to student achievement
in this meta-analysis.
Second, we did not include qualitative studies that examined the relationship between
what mathematics teachers know and the quality of teaching (e.g., Stein, Baxter, & Leinhardt,
1990). Those qualitative studies focused more on the influence of teachers’ subject matter
knowledge on their instructional practices rather than on student mathematics achievements and
found a more clear and positive connection using different measures of subject matter knowledge
such as interview with teachers and task completion. Unfortunately, we cannot incorporate
qualitative research into quantitative meta-analysis. The inferences from this meta-analysis
should be interpreted with the valuable information provided by qualitative research in this area.
Third, in this study we only investigated teachers’ subject matter knowledge as related to
student achievement test scores, which is just one indicator of student learning influenced by
teachers’ subject matter knowledge. There are other indicators of student learning such as
students’ interests toward mathematics and communication with peers in mathematics
classrooms that can be influenced by teachers’ subject matter knowledge. Thus, teachers’ subject
matter knowledge should also be appreciated in relation to other indicators of student learning as
well as teachers’ instructional practices.
Fourth, there are other moderators that were not examined in our meta-analysis to explain
variations in study findings because information was not available or not enough for our meta-
analysis. One of potential moderators is feature of student mathematics achievement tests. While
we examined whether measures of teachers’ subject matter knowledge influence study outcomes,
we did not examine the influence of different types of student achievement tests. For example,
while some studies used large-scale standardized tests to measure student achievement, several
AERA 2004 Subject matter knowledge 33
studies used teacher-made tests. It may be that the correlation between teachers’ subject matter
knowledge and student mathematics achievement is higher when student tests are aligned with
what teachers taught (e.g., Moody, 1968). What the tests assess could also be a feature of student
achievement tests. While a student achievement test or a sub-test assesses students’ computation
skills, another test assesses students’ thinking skills. Depending on what the tests assess, the
relationship between teachers’ subject matter knowledge and student achievement test scores
may differ (e.g., Mandeville & Liu, 1997). Another potential moderator is students’ achievement
level. It would be different in study findings depending on where students were selected. That is,
whether students were selected from high achieving schools or low achieving schools depending
on school locations would influence study findings (e.g., Bassham, 1962; Reed, 1986).
IMPLICATATION
This research has implications for tow audiences: 1) educational researchers or policy
makers who make inferences about the relationship between teachers’ subject matter knowledge
and student learning and 2) methodologists who want to carry out research synthesis in education
or social science.
As found in this meta-analysis, the relationship between teachers’ subject matter
knowledge and student learning differs depending on measurement variations. Thus we argue
that educational researchers and policy makers should carefully examine different aspects of
measurement such as scales, types of measures, and unit of analysis before making inferences
from the findings.
Methodologists who carry out meta-analyses should consider a number of important
moderators to explain study variations found in primary studies. In particular, most outcomes in
educational areas are influenced by a number of factors. It is important for meta-analysts to find
AERA 2004 Subject matter knowledge 34
the most important predictors to explain the variations in the findings. In addition, for future
research one important issue will be to find ways to incorporate various research designs into
meta-analysis. In particular we intend to synthesize with the current studies other research
studies using different data analytic techniques such as HLM and multiple regression.
AERA 2004 Subject matter knowledge 35
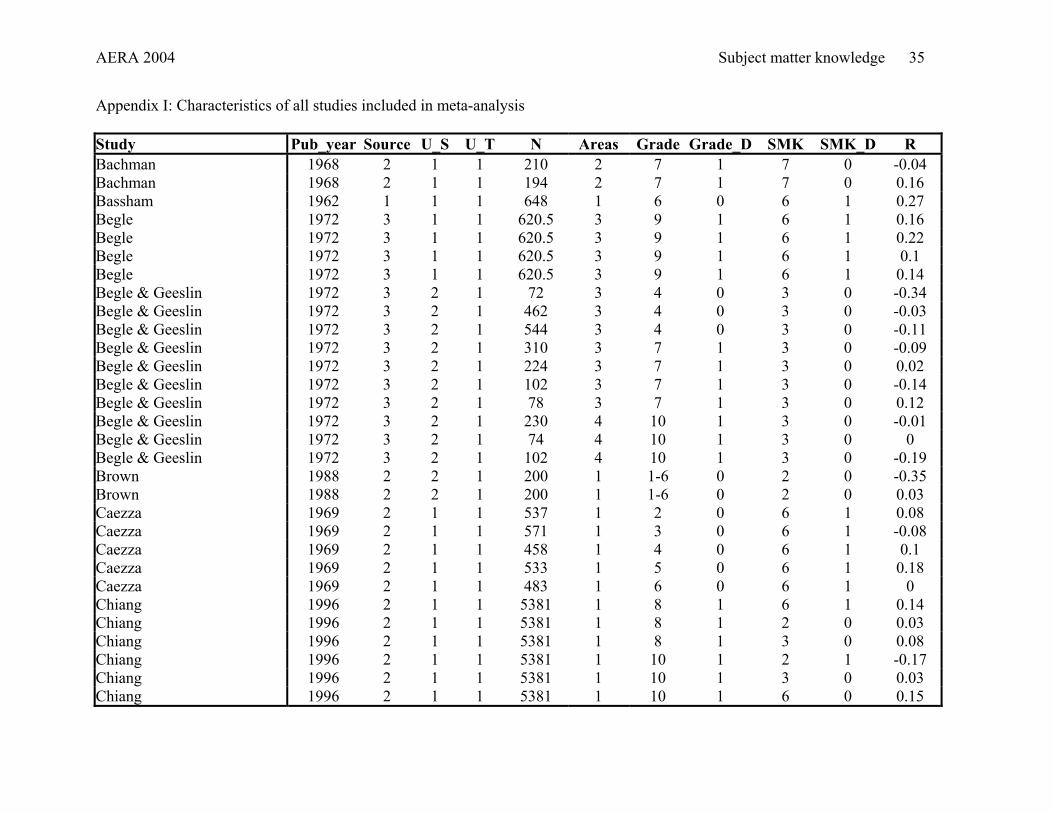
Appendix I: Characteristics of all studies included in meta-analysis
Study Pub_year Source U_S U_T N Areas Grade_DGrade SMK SMK_D RBachman 1968 2 1 1 210 2 7 1 7 0 -0.04Bachman 1968 2 1 1 194 2 7 1 7 0 0.16Bassham 1962 1 1 1 648 1 6 0 6 1 0.27 Begle 1972 3 1 1 620.5 3 9 1 6 1 0.16Begle 1972 3 1 1 620.5 3 9 1 6 1 0.22Begle 1972 3 1 1 620.5 3 9 1 6 1 0.1Begle 1972 3 1 1 620.5 3 9 1 6 1 0.14Begle & Geeslin 1972 3 2 1 72 3 4 0 3 0 -0.34 Begle & Geeslin 1972 3 2 1 462 3 4 0 3 0 -0.03 Begle & Geeslin 1972 3 2 1 544 3 4 0 3 0 -0.11 Begle & Geeslin 1972 3 2 1 310 3 7 1 3 0 -0.09 Begle & Geeslin 1972 3 2 1 224 3 7 1 3 0 0.02 Begle & Geeslin 1972 3 2 1 102 3 7 1 3 0 -0.14 Begle & Geeslin 1972 3 2 1 78 3 7 1 3 0 0.12 Begle & Geeslin 1972 3 2 1 230 4 10 1 3 0 -0.01 Begle & Geeslin 1972 3 2 1 74 4 10 1 3 0 0 Begle & Geeslin 1972 3 2 1 102 4 10 1 3 0 -0.19 Brown 1988 2 2 1 200 1 1-6 0 2 0 -0.35 Brown 1988 2 2 1 200 1 1-6 0 2 0 0.03 Caezza 1969 2 1 1 537 1 2 0 6 1 0.08Caezza 1969 2 1 1 571 1 3 0 6 1 -0.08 Caezza 1969 2 1 1 458 1 4 0 6 1 0.1 Caezza 1969 2 1 1 533 1 5 0 6 1 0.18 Caezza 1969 2 1 1 483 1 6 0 6 1 0 Chiang 1996 2 1 1 5381 1 8 1 6 1 0.14 Chiang 1996 2 1 1 5381 1 8 1 2 0 0.03 Chiang 1996 2 1 1 5381 1 8 1 3 0 0.08 Chiang 1996 2 1 1 5381 1 10 1 2 1 -0.17 Chiang 1996 2 1 1 5381 1 10 1 3 0 0.03 Chiang 1996 2 1 1 5381 1 10 1 6 0 0.15
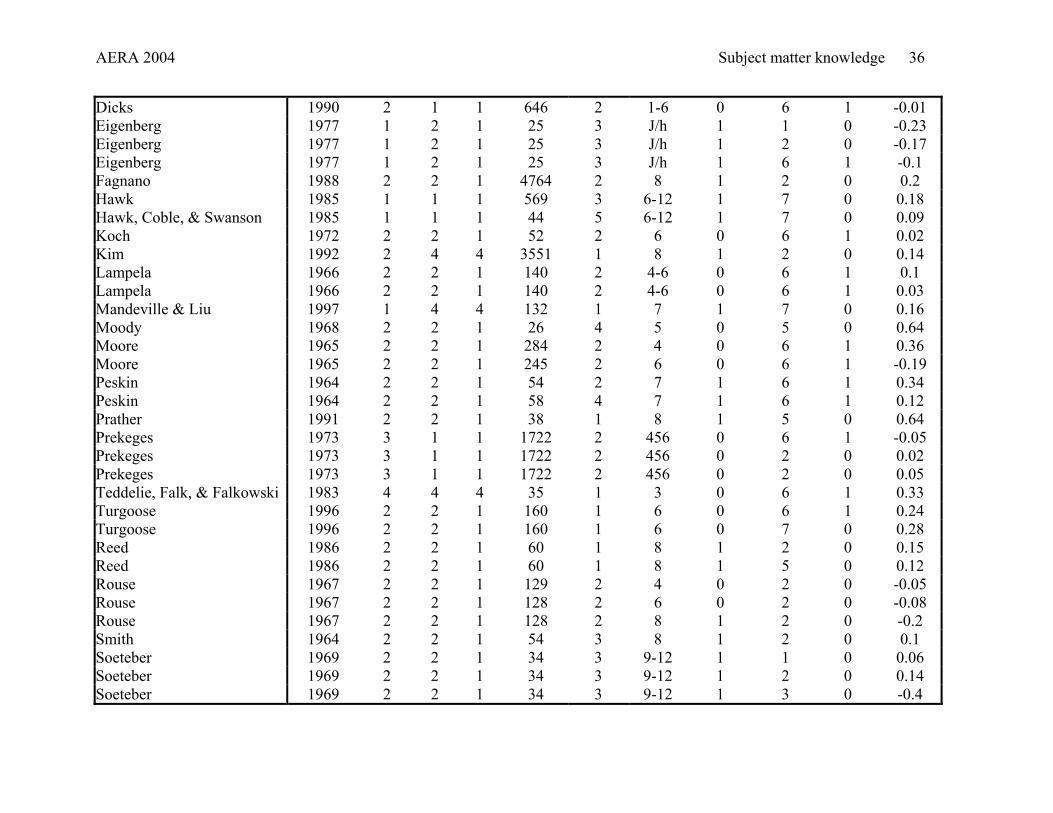
AERA 2004 Subject matter knowledge 36
Dicks 1990 2 11 646 2 1-6 0 6 1 -0.01Eigenberg 1977 1 2 1 25 3 J/h 1 1 0 -0.23 Eigenberg 1977 1 2 1 25 3 J/h 1 2 0 -0.17 Eigenberg 1977 1 2 1 25 3 J/h 1 6 1 -0.1 Fagnano 1988 2 2 1 4764 2 8 1 2 0 0.2 Hawk 1985 1 1 1 569 3 6-12 1 7 0 0.18 Hawk, Coble, & Swanson 1985 1 1 1 44 5 6-12 1 7 0 0.09 Koch 1972 2 2 1 52 2 6 0 6 1 0.02 Kim 1992 2 4 4 3551 1 8 1 2 0 0.14Lampela 1966 2 2 1 140 2 4-6 0 6 1 0.1 Lampela 1966 2 2 1 140 2 4-6 0 6 1 0.03 Mandeville & Liu 1997 1 4 4 132 1 7 1 7 0 0.16 Moody 1968 2 2 1 26 4 5 0 5 0 0.64Moore 1965 2 2 1 284 2 4 0 6 1 0.36Moore 1965 2 2 1 245 2 6 0 6 1 -0.19Peskin 1964 2 2 1 54 2 7 1 6 1 0.34 Peskin 1964 2 2 1 58 4 7 1 6 1 0.12 Prather 1991 2 2 1 38 1 8 1 5 0 0.64Prekeges 1973 3 1 1 1722 2 456 0 6 1 -0.05Prekeges 1973 3 1 1 1722 2 456 0 2 0 0.02Prekeges 1973 3 1 1 1722 2 456 0 2 0 0.05Teddelie, Falk, & Falkowski 1983 4 4 4 35 1 3 0 6 1 0.33 Turgoose 1996 2 2 1 160 1 6 0 6 1 0.24Turgoose 1996 2 2 1 160 1 6 0 7 0 0.28Reed 1986 2 2 1 60 1 8 1 2 0 0.15Reed 1986 2 2 1 60 1 8 1 5 0 0.12Rouse 1967 2 2 1 129 2 4 0 2 0 -0.05Rouse 1967 2 2 1 128 2 6 0 2 0 -0.08 Rouse 1967 2 2 1 128 2 8 1 2 0 -0.2 Smith 1964 2 2 1 54 3 8 1 2 0 0.1Soeteber 1969 2 2 1 34 3 9-12 1 1 0 0.06 Soeteber 1969 2 2 1 34 3 9-12 1 2 0 0.14 Soeteber 1969 2 2 1 34 3 9-12 1 3 0 -0.4
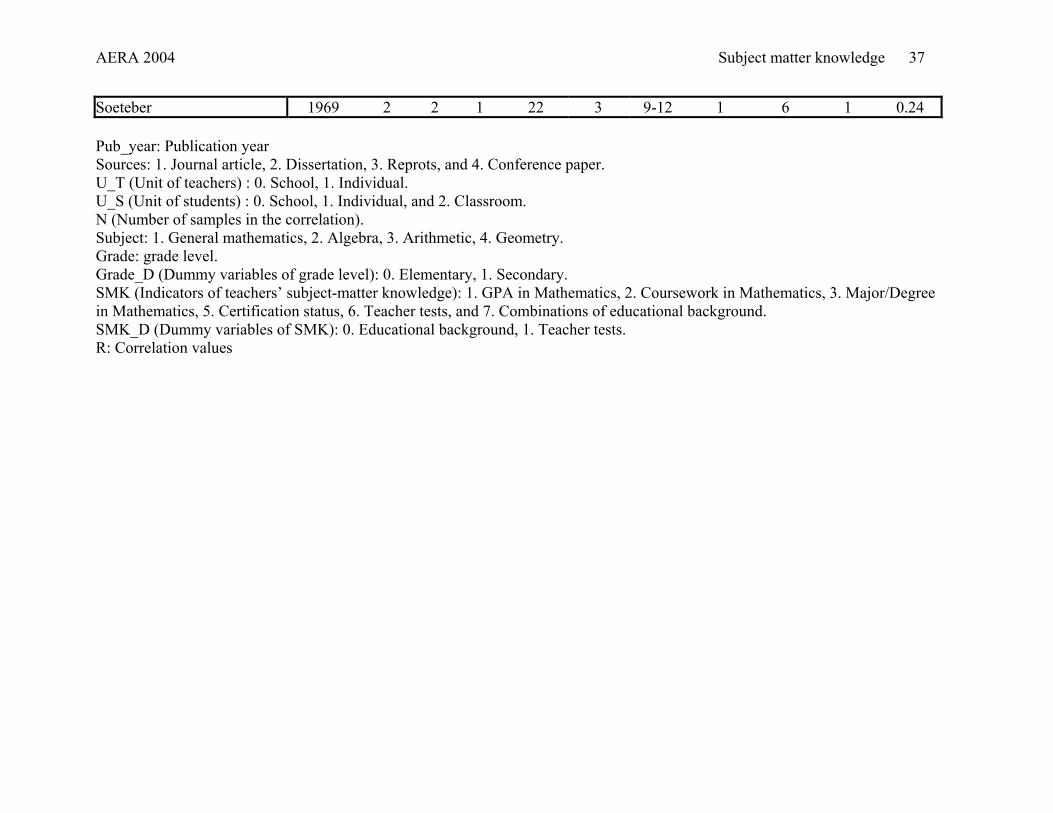
AERA 2004 Subject matter knowledge 37
Soeteber 1969 2 2 1 22 3 9-12 1 6 1 0.24 Pub_year: Publication year Sources: 1. Journal article, 2. Dissertation, 3. Reprots, and 4. Conference paper. U_T (Unit of teachers) : 0. School, 1. Individual. U_S (Unit of students) : 0. School, 1. Individual, and 2. Classroom. N (Number of samples in the correlation). Subject: 1. General mathematics, 2. Algebra, 3. Arithmetic, 4. Geometry. Grade: grade level. Grade_D (Dummy variables of grade level): 0. Elementary, 1. Secondary. SMK (Indicators of teachers’ subject-matter knowledge): 1. GPA in Mathematics, 2. Coursework in Mathematics, 3. Major/Degree in Mathematics, 5. Certification status, 6. Teacher tests, and 7. Combinations of educational background. SMK_D (Dummy variables of SMK): 0. Educational background, 1. Teacher tests. R: Correlation values
AERA 2004 Subject matter knowledge 38
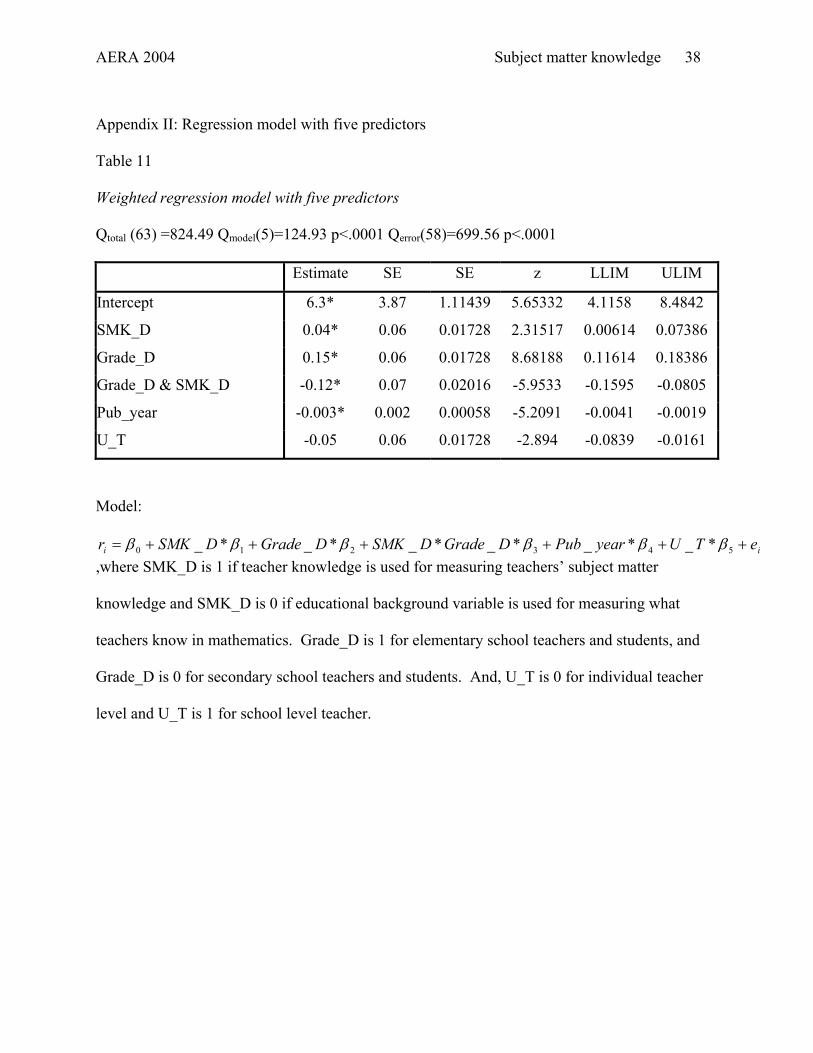
Appendix II: Regression model with five predictors
Table 11
Weighted regression model with five predictors
Qtotal (63) =824.49 Qmodel(5)=124.93 p<.0001 Qerror(58)=699.56 p<.0001
Estimate SE SE z LLIM ULIM
Intercept 6.3* 3.87 1.11439 5.65332 4.1158 8.4842
SMK_D 0.04* 0.06 0.01728 2.31517 0.00614 0.07386
Grade_D 0.15* 0.06 0.01728 8.68188 0.11614 0.18386
Grade_D & SMK_D -0.12* 0.07 0.02016 -5.9533 -0.1595 -0.0805
Pub_year -0.003* 0.002 0.00058 -5.2091 -0.0041 -0.0019
U_T -0.05 0.06 0.01728 -2.894 -0.0839 -0.0161
Model:
ii eTUyearPubDGradeDSMKDGradeDSMKr ++++++= 543210 *_*_*_*_*_*_ ββββββ,where SMK_D is 1 if teacher knowledge is used for measuring teachers’ subject matter
knowledge and SMK_D is 0 if educational background variable is used for measuring what
teachers know in mathematics. Grade_D is 1 for elementary school teachers and students, and
Grade_D is 0 for secondary school teachers and students. And, U_T is 0 for individual teacher
level and U_T is 1 for school level teacher.
AERA 2004 Subject matter knowledge 39
References
Ashton, P., & Crocker, L. (1987). Systematic study of planned variations: The essential focus of
teacher education reform. Journal of Teacher Education, 38, 2-8.
**Bachman, A. M. (1968). Factors related to the achievement of junior high school students in
mathematics. Unpublished doctoral dissertation, University of Oregon.
**Bassham, H. (1962). Teacher understanding and pupil efficiency in mathematics--a study of
relationship. Arithmetic Teacher, 9, 383-387.
**Begle, E. G. (1972). Teacher knowledge and student achievement in algebra (SMSG Report
No. 9). Stanford CA: Stanford University.
**Begle, E. G., & Geeslin, W. (1972). Teacher effectiveness in mathematics instruction
(Longitudinal Study of Mathematics Abilities Report N. 28). Washington DC:
Mathematical Association of America and National Council of Teachers of Mathematics.
*Brewer, D. J., & Goldhaber, D. D. (1996). Educational achievement and teacher qualifications:
New evidence from microlevel data. In B. S. Cooper & S. T. Speakman (Eds.),
Optimizing Educational Resources (pp. 243-264). Greenwich CT: JAI.
**Brown, M. A. (1988). The relationship between levels of mathematics anxiety in elementary
classroom teachers, selected teacher variables, and student achievement in grades two
through six. Unpublished doctoral dissertation, The American University.
**Caezza, J. F. (1969). A study of teacher experience, knowledge of and attitude toward
mathematics and the relationship of these variables to elementary in mathematics.
Unpublished doctoral dissertation, Syracuse University.
*Chaney, B. (1995). Student outcomes and the professional preparation of eighth-grade teachers
in science and mathematics: NSF/NELS:88 Teacher transcript analysis. Rockford MD:
Westat.
**Chiang, F.-S. (1996). Ability, motivation, and performance: A quantitative study of teacher
effects on student mathematics achievement using NELS:88 Data. Unpublished doctoral
dissertation, University of Michigan, Ann Arbor.
Cooper, H. M. (1989). Synthesizing research: A guide for literature review (3rd ed.). Thousand
Oaks: Sage Publication Inc.
AERA 2004 Subject matter knowledge 40
*Cox, L. A. S. (1970). A study of pupil achievement in mathematics and teacher competence in
mathematics. Unpublished doctoral dissertation, University of Kansas.
*Darling-Hammond, L. (2000). Teacher quality and student achievement: A review of state
policy evidence. Educational Policy Analysis Archives, 8(1).
*Devaney, T. A. (1997). Relationship of teacher training and mathematics achievement Using
the trial state assessment and hierarchical linear modeling. Unpublished doctoral
dissertation, Mississippi State University.
**Dick, J. C. (1990). Relationship of teacher Cbest scores to teaching practice and student
performance. Unpublished doctoral dissertation, Loma Linda University.
**Eisenberg, T. A. (1977). Begle revisited: Teacher knowledge and student achievement in
algebra. Journal for Research in Mathematics Education, 8(3), 216-222.
**Fagnano, C. L. (1988). An Investigation into the effects of specific types of teacher training on
eighth grade mathematics students' mathematics achievement. Unpublished doctoral
dissertation, University of California, Los Angeles.
*Gable, S. (1971). An exploratory study of the relationship between teacher knoweldge and
student achievement and attitudes toward reading. Unpublished doctoral dissertation,
University of Iowa.
*Goldhaber, D. D., & Brewer, D. J. (2000). Does teacher certification matter? High school
teacher certification status and student achievement. Educational Evaluation and Policy
Analysis, 22(2), 129-145.
**Hawk, P. P., Coble, C. R., & Swanson, M. (1985). Certification: It does matter. Journal of
Teacher Education, 36(3), 13-15.
**Hurst, D. (1967). The Relationship between certain teacher-related variables and student
achievement in third grade arithmetic. Unpublished doctoral dissertation, Oklahoma
State University.
*Johnson, K. A. (2000). The effects of advanced teacher training in education on student
achievement. Heritage Center for Data Analysis.
**Kim, L. Y. (1992). Factors affecting student learning outcomes: A school-level analysis of the
1990 NAEP mathematics trial state assessment (mathematics assessment, state
assessment). Unpublished doctoral dissertation, University of Southern California.
AERA 2004 Subject matter knowledge 41
*Kiplinger, V. L. (1996). Investigation of factors affecting mathematics achievement in the
eighth grade: Academic performance in Hawaii's public schools. Unpublished doctoral
dissertation, University of Colorado at Boulder.
**Koch, D. (1972). Concept of self and mathematics achievement. Unpublished doctoral
dissertation, Auburn University.
**Lampela, R. M. (1966). An investigation of the relationship between teacher understanding
and change in pupil understanding of selected concepts in elementary school
mathematics. Unpublished doctoral dissertation, University of California.
Lipsey, M. W. (1994). Identifying potentially interesting variables and analysis opportunities. In
H. M. Cooper & L.V. Hedges (Eds.), The handbook of research synthesis. New York:
Russel Sage Foundation.
**Mandeville, G. K., & Liu, Q. (1997). The effect of teacher certification and task level on
mathematics achievement. Teaching and Teacher Education, 13(4), 397-407.
*Monk, D. H. (1994). Subject area preparation of secondary mathematics and science teachers
and student achievement. Economics of Education Review, 13(2), 125-145.
**Moody, W. B. (1968). An investigation of the relationship between fifth-grade student and
teacher performance on selected tasks involving non-metric geometry. Unpublished
doctoral dissertation, University of Maryland.
**Moore, R. E. (1965). The mathematical understanding of the elementary school teacher as
related to pupil achievement in intermediate-grade arithmetic. Unpublished doctoral
dissertation, Stanford University.
**Peskin, A. (1964). Teacher understanding and attitude and student achievement and attitude
in seventh grade mathematics. Unpublished doctoral dissertation, New York University.
**Prather, R. L. M. (1991). The effects of instruction by certified secondary education
mathematics teachers versus instruction by certified elementary education teachers on
mathematics achievement at the eighth-grade level. Unpublished doctoral dissertation,
The University of Mississippi.
**Prekeges, D. P. (1973). Relationship Between Selected Teacher Variables and Growth in
Arithmetic in Grades Four, Five and Six. Washington D.C.: U.S Department of Health,
Education, and Welfare.
AERA 2004 Subject matter knowledge 42
Raudenbush, S. W. (1994). Random Effects Model. In H. M. Cooper & L.V. Hedges (Eds.), The
handbook of research synthesis. New York: Russel Sage Foundation.
**Reed, W. D. (1986). The effects of teacher mathematics preparation on student performance
in the middle level schools. Unpublished doctoral dissertation, The University of Arizona.
Rosenthal, R. (1994). Parametric Measures of Effect Size. In H. M. Cooper & L.V. Hedges
(Eds.), The handbook of research synthesis. New York: Russel Sage Foundation.
**Rouse, W. M., JR. (1967). A study of the correlation between the academic preparation of
teachers of mathematics and the mathematics achievement of their students in
kindergarten through grade eight. Unpublished doctoral dissertation, Michigan State
University.
**Rowan, B., Chiang, F.-S., & Miller, R. J. (1997). Using research on employees' performance
to study the effects of teachers on students' achievement. Sociology of Education, 70,
256-284.
*Rowan, B., Correnti, R., & Miller, R. J. (2002). What large-scale survey research tells us about
teacher effects on student achievement: Insights from the Prospects Study of elementary
schools. Philadelphia: University of Pennsylvania Consortium for Policy Research in
Education.
Shulman, L. S. (1986). Those who understand: Knowledge growth in teaching. Educational
Researcher, 15(2), 4-14.
**Smith, W. (1964). The achievement of English-grade students in arithmetic with respect to
selected patterns of teacher preparation. Unpublished doctoral dissertation, The
University of Oklahoma.
**Soeteber, W. (1969). Major-minor teaching assignments and related achievement.
Unpublished doctoral dissertation, Colorado State College.
Stein, M. K., Baxter, J., & Leinhardt, G. (1990). Subject-matter knowledge and elementary
instruction: A case from functions and graphing. American Educational Research
Journal, 27(4), 639-663.
**Teddlie, C., Falk, W., & Falkowski, C. (1983). The Contribution of Principal and Teacher
Inputs to Student Achievement. Paper presented at the American Educational Research
Association, Montreal, Quebec.
AERA 2004 Subject matter knowledge 43
**Turgoose, L. E. (1996). The relationship of teacher efficacy, mathematics anxiety,
achievement, preparation, and years of experience to student Iowa Tests of Basic Skills
mathematics test scores. Unpublished doctoral dissertation, University of Idaho.
*Wenglinsky, H. (2000). How Teaching Matters: Bringing the Classroom Back Into Discussions
of Teacher Quality. ETS/National Council for Accreditation of Teacher Education.
Wilson, S. M., Floden, R. E., & Ferrini-Mundy, J. (2001). Teacher Preparation Research:
Current Knowledge, Gaps, and Recommendations. East Lansing: MSU.
*Ziegler, J. F. (2000). Constructivist views of teaching, learning, and supervising held by public
school teachers and their influence on student achievement in mathematics. Unpublished
doctoral dissertation, Indiana University of Pennsylvania.
*Studies included in the literature review
** Studies included in the literature view and meta-analysis.
![Subject:- IN THE MATTER OF NORMATIVE …aera.gov.in/upload/order/575e696581589Orderno.07201617.pdf[F. No. AERA/20010/Normative Approach/aora-rs] Airports Economic Regulatory Authority](https://img.pdfslide.us/doc/110x75/5b039eb67f8b9a2d518c6b38/subject-in-the-matter-of-normative-aeragovinuploadorder575e696581589orderno.jpg)