Embed Size (px)
Citation preview
9/13/13 Aim: How and why do psychologists produce valid
research?• Do Now: Fill out the survey.
1
Aim: How do biases contaminate our everyday judgments?
• Do now: I need 5 volunteers – raise your hand if you want to volunteer.
» Truth/lie % of your confidence 50 guess
» 100 % totally sure
• 1
• 2
• 3
• 4 2
3
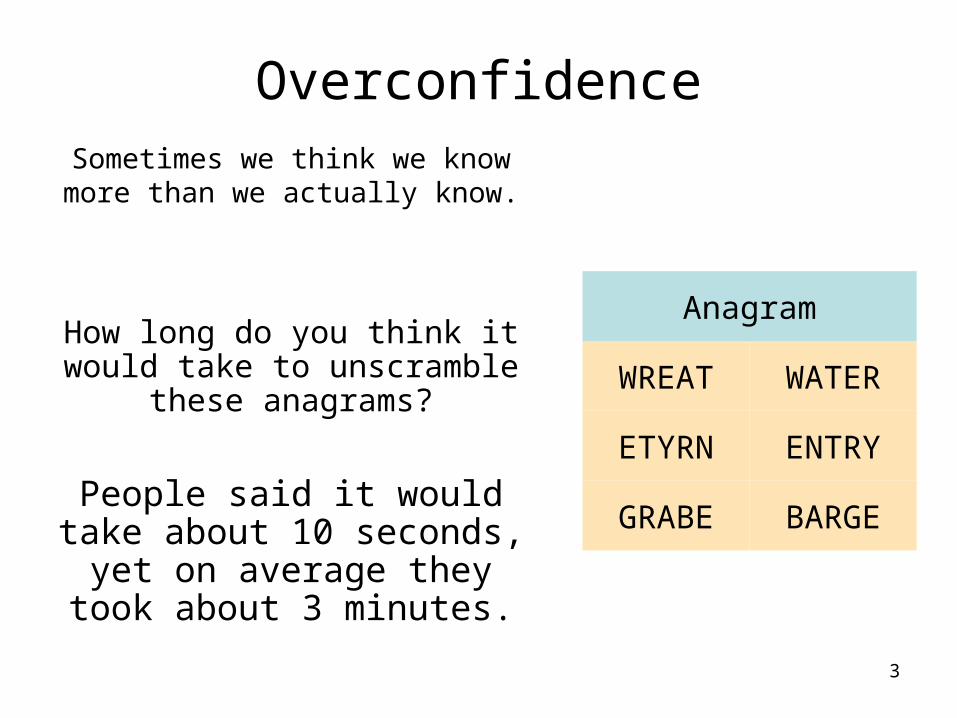
OverconfidenceSometimes we think we know more than we actually know.
Anagram
BARGEGRABE
ENTRYETYRN
WATERWREATHow long do you think it would take to unscramble
these anagrams?
People said it would take about 10 seconds,
yet on average they took about 3 minutes.
4
Hindsight Bias is the “I-knew-it-all-along” phenomenon.
After learning the outcome of an event, many people believe they could have predicted that
very outcome. We only knew the dot.com stocks would plummet after they actually did plummet.
Show clip.
Hindsight Bias
Confirmation Bias
• We seek to find information that confirms what we already know.
• How does the Seinfeld clip show confirmation bias? Explain.
5
False Consensus Effect
• The tendency to overestimate how much other people agree with you. There is a tendency for people to assume that their own opinions, beliefs, preferences, values and habits are 'normal' and that others also think the same way that they do.
• Show clip
6
Aim: What are the Goals of Research -
• Do Now: copy the statements (leave room)– Placebo
– Explain about lie detectors
– Explain Hite research
– What is correlation7
9/15 Aim: What are the 3 goals of psychological research?
• Do Now: Set up an experiment to determine if viewing Spongebob causes decreased ability to focus in academic tasks in young viewers
8
9/19 Aim: How do experiments, powered by random assignment, clarify cause and effect?
• Do Now: Identify the difference between the following:– Random sample– Random assignment
– Also, what is the placebo effect?– After the clip, answer “How does the clip show
a placebo effect?”
9
10
The Need for Psychological Science
Intuition & Common Sense
Many people believe that intuition and common sense are enough to bring forth
answers regarding human nature.
Intuition and common sense may aid queries, but they are not free of error.
11
Psychological Science
1. How can we differentiate between uniformed opinions and examined conclusions?
2. The science of psychology helps make these examined conclusions, which leads to our understanding of how people feel, think, and act as they do!
12
The Scientific Attitude
The scientific attitude is composed of curiosity (passion for exploration), skepticism
(doubting and questioning) and humility (ability to accept responsibility when wrong).
13
Scientific Method
Psychologists, like all scientists, use the scientific method to construct
theories that organize, summarize and simplify observations.
14
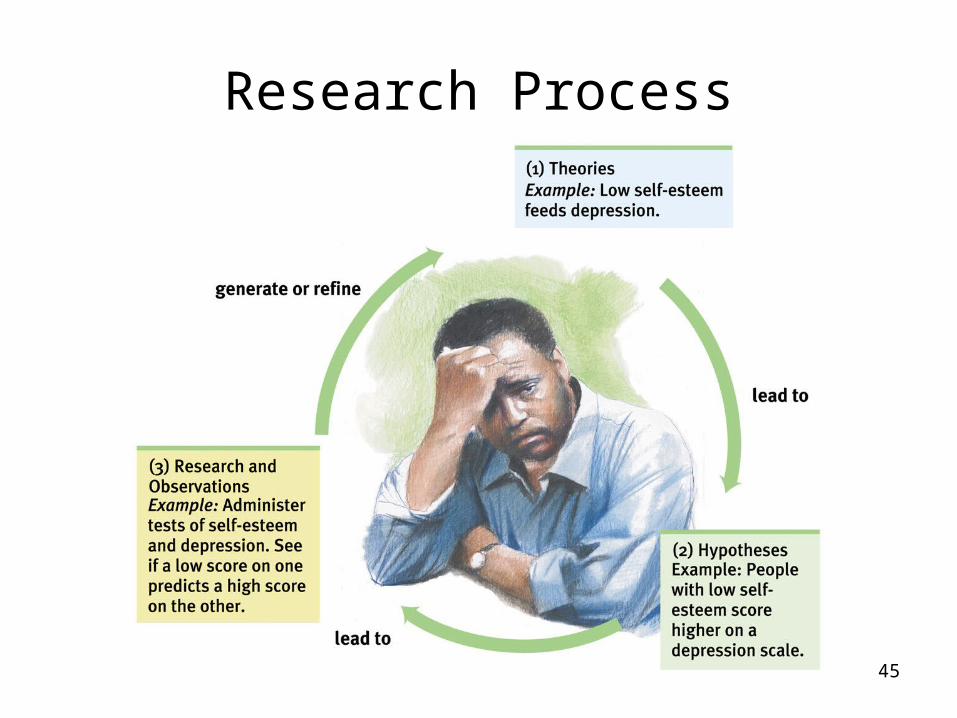
Research would require us to administer tests of self-esteem and
depression. Individuals who score low on a self-esteem test and high on a depression test would confirm our
hypothesis.
Research Observations
Aim: What are the goals of psychological research?
• 1. describe behavior
• 2. predict behavior
• 3. determine cause and effect
15
Describe behavior has 3 tools
• Case Study
• Survey
• Naturalistic Observation
16
Prediction has 1 tool
• Correlation
17
Determine cause and effect has one tool
• Experimentation
18
19
Describe behavior – CASE STUDYCase Study
A technique in which one person is studied in depth to reveal underlying behavioral principles.
Advantages – get to know one person in depth Disadvantage – cannot generalize findings to population
20
Describe behavior - SurveyA technique for questioning the self-reported attitudes, opinions or behaviors of people Advantages inexpensive, easy to collect data, easy to generalize – used in
conjunction with correlations Disadvantages – may not be honest, wording effects may confuse people, may not
be a representative sample (Hite research)Terms - representative, random sample, generalize.
Social desirability bias – people answer how they think others want them to answer
21
Survey - disadvantages
A tendency to overestimate the extent to which others share our
beliefs and behaviors.
False Consensus Effect
22
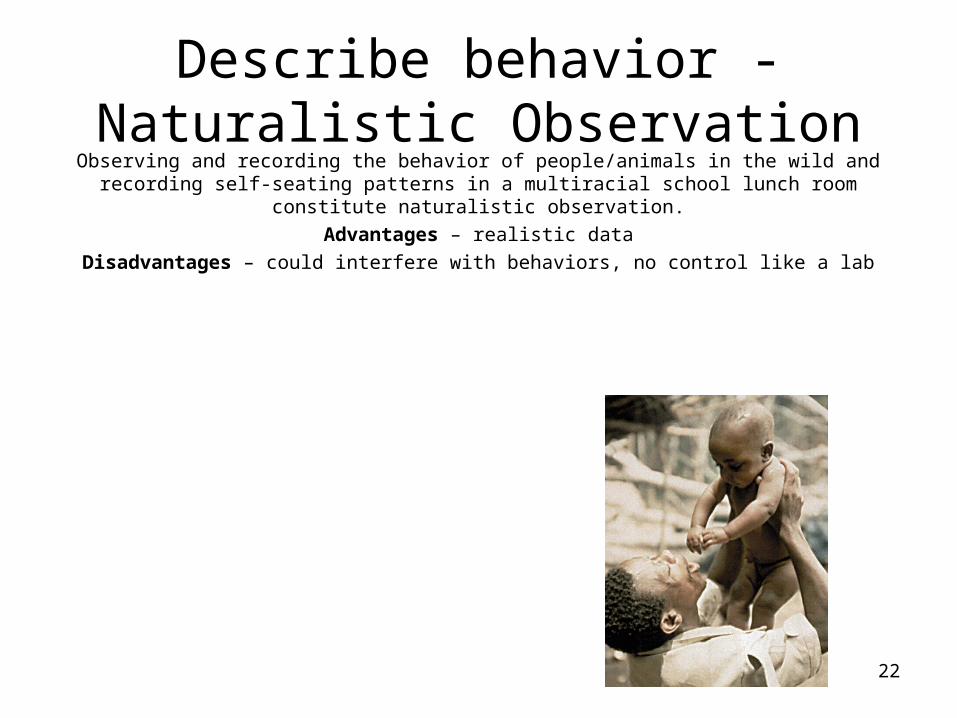
Describe behavior - Naturalistic Observation
Observing and recording the behavior of people/animals in the wild and recording self-seating patterns in a multiracial school lunch room constitute naturalistic
observation.Advantages – realistic data
Disadvantages – could interfere with behaviors, no control like a lab
9/18 Aim: What are positive and negative correlations, and why do they enable prediction but
not cause-effect explanation?
• Copy Aim onto top of worksheet
23
24
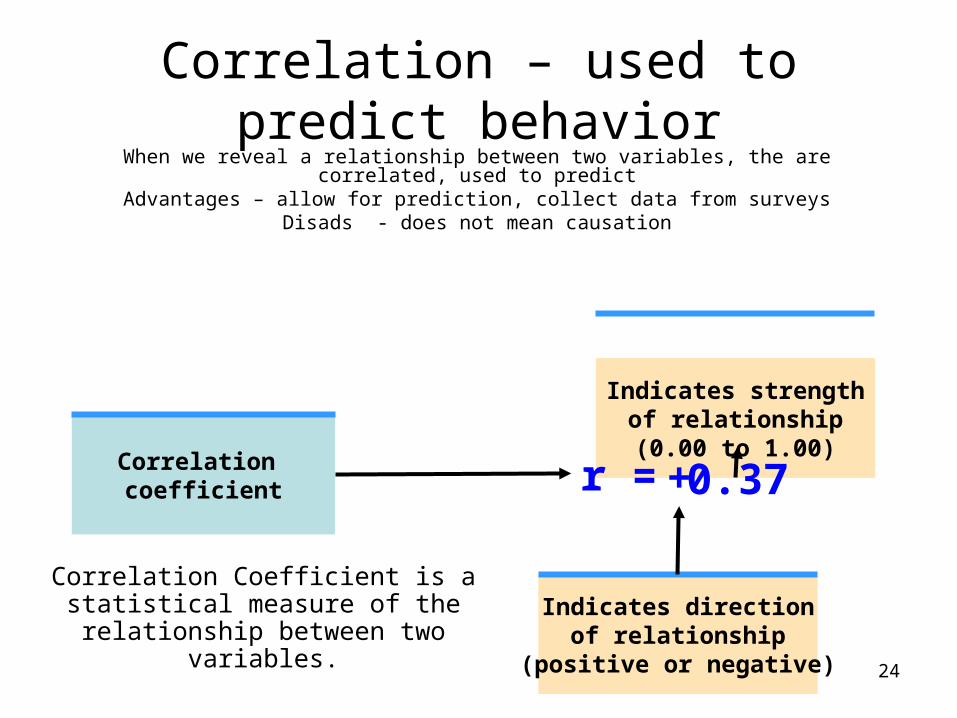
Correlation – used to predict behavior
When we reveal a relationship between two variables, the are correlated, used to predict
Advantages – allow for prediction, collect data from surveysDisads - does not mean causation
Correlation coefficient
Indicates directionof relationship
(positive or negative)
Indicates strengthof relationship(0.00 to 1.00)
r = 0.37+
Correlation Coefficient is a statistical measure of the relationship between two
variables.
25
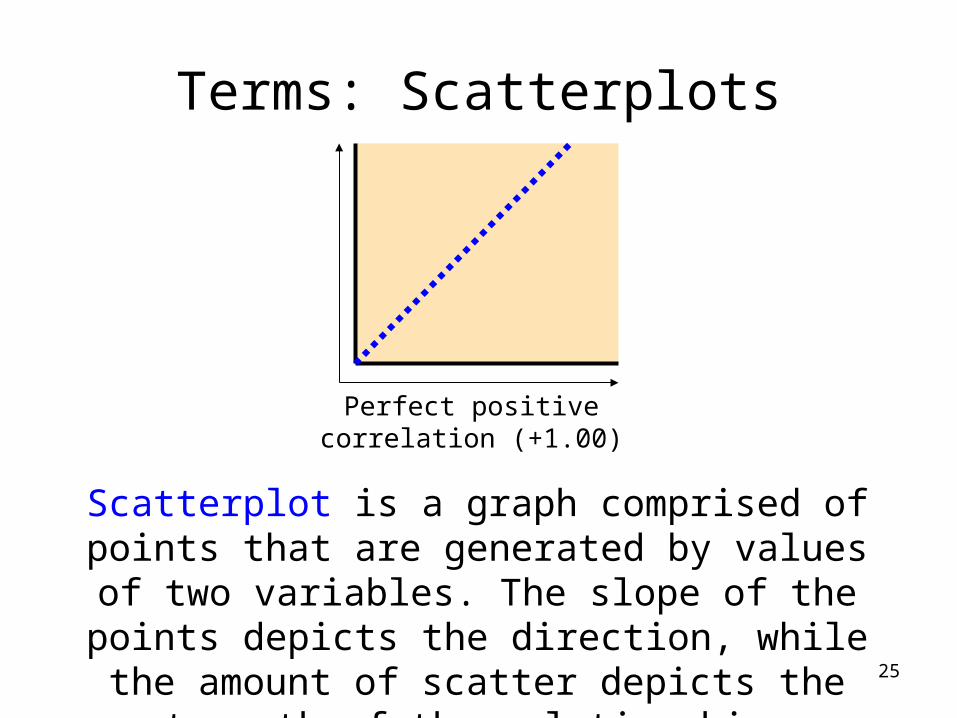
Perfect positivecorrelation (+1.00)
Scatterplot is a graph comprised of points that are generated by values of two
variables. The slope of the points depicts the direction, while the amount of scatter depicts the strength of the relationship.
Terms: Scatterplots
26
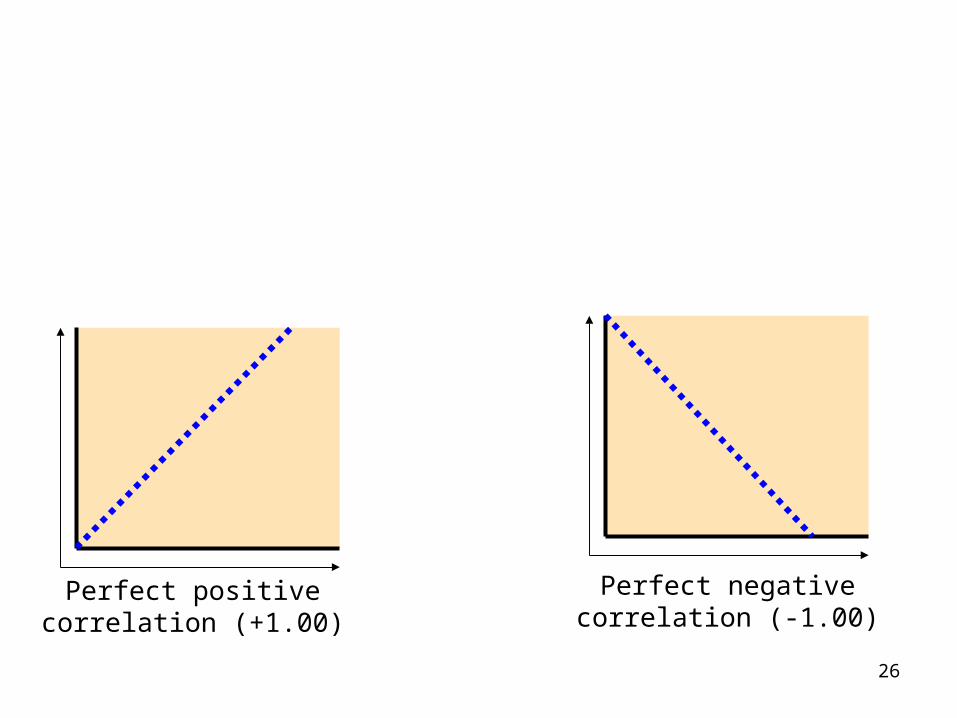
Perfect negativecorrelation (-1.00)
Perfect positivecorrelation (+1.00)
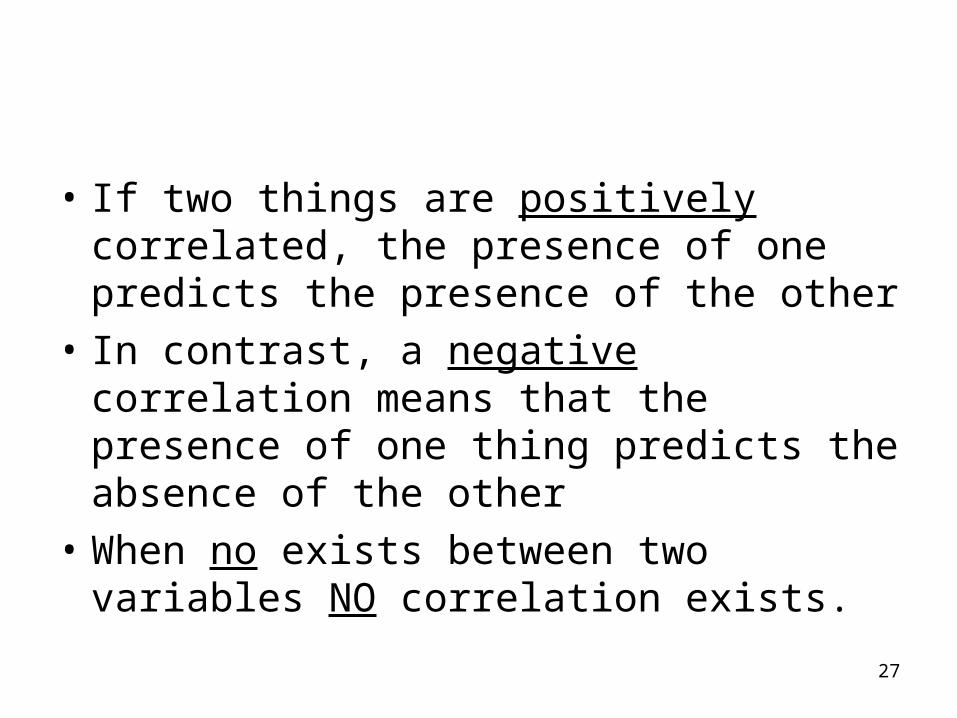
• If two things are positively correlated, the presence of one predicts the presence of the other
• In contrast, a negative correlation means that the presence of one thing predicts the absence of the other
• When no exists between two variables NO correlation exists.
27
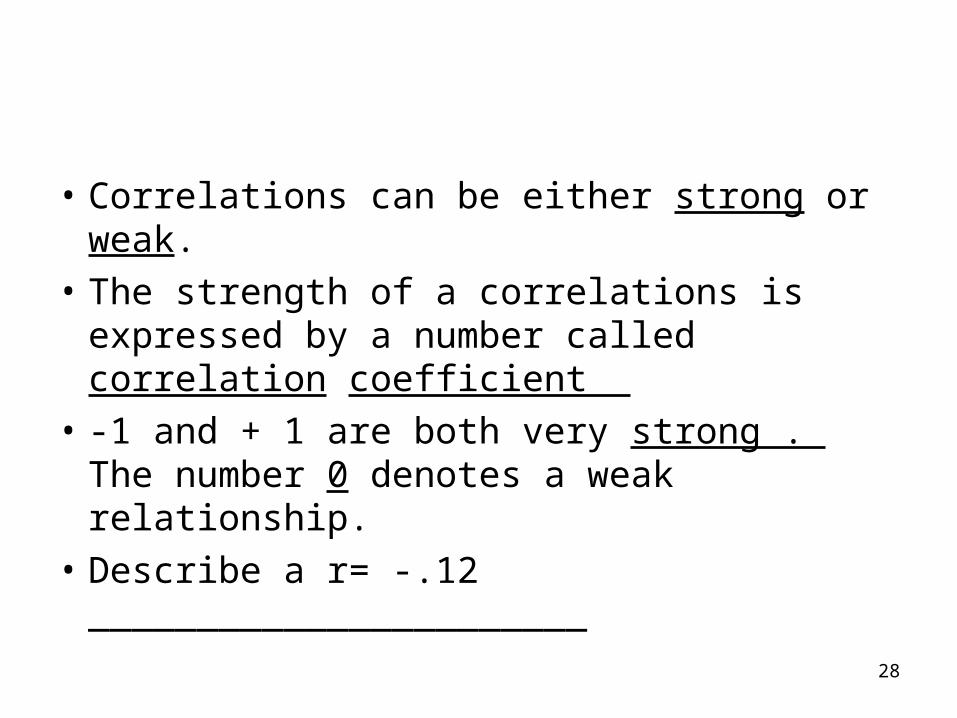
• Correlations can be either strong or weak.
• The strength of a correlations is expressed by a number called correlation coefficient
• -1 and + 1 are both very strong . The number 0 denotes a weak relationship.
• Describe a r= -.12 _______________________
28
29
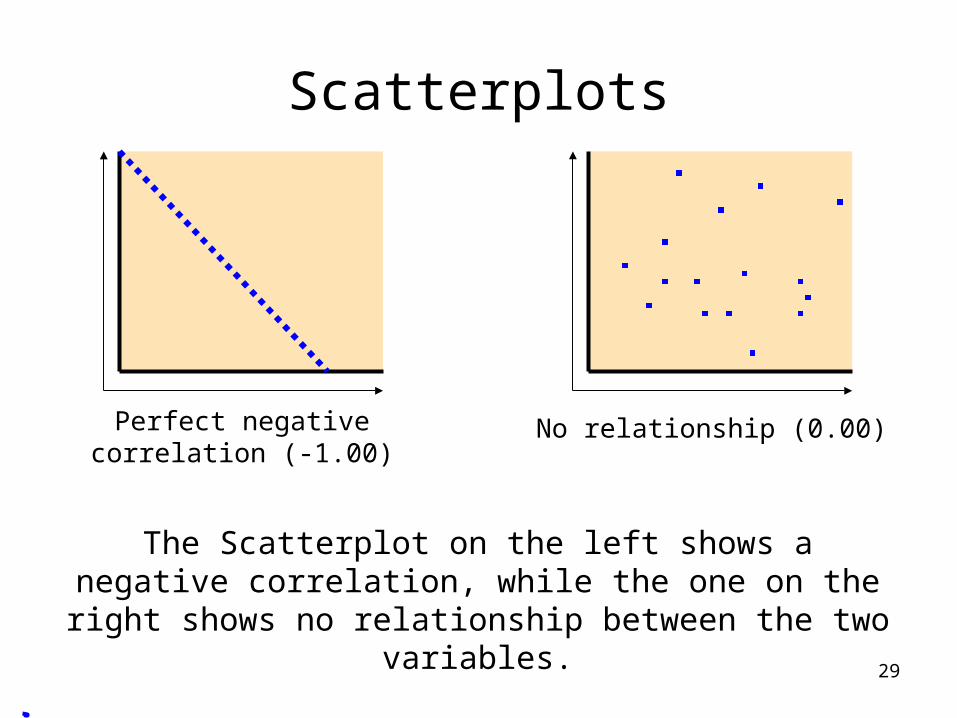
No relationship (0.00)Perfect negativecorrelation (-1.00)
The Scatterplot on the left shows a negative correlation, while the one on the right shows no
relationship between the two variables.
Scatterplots
30
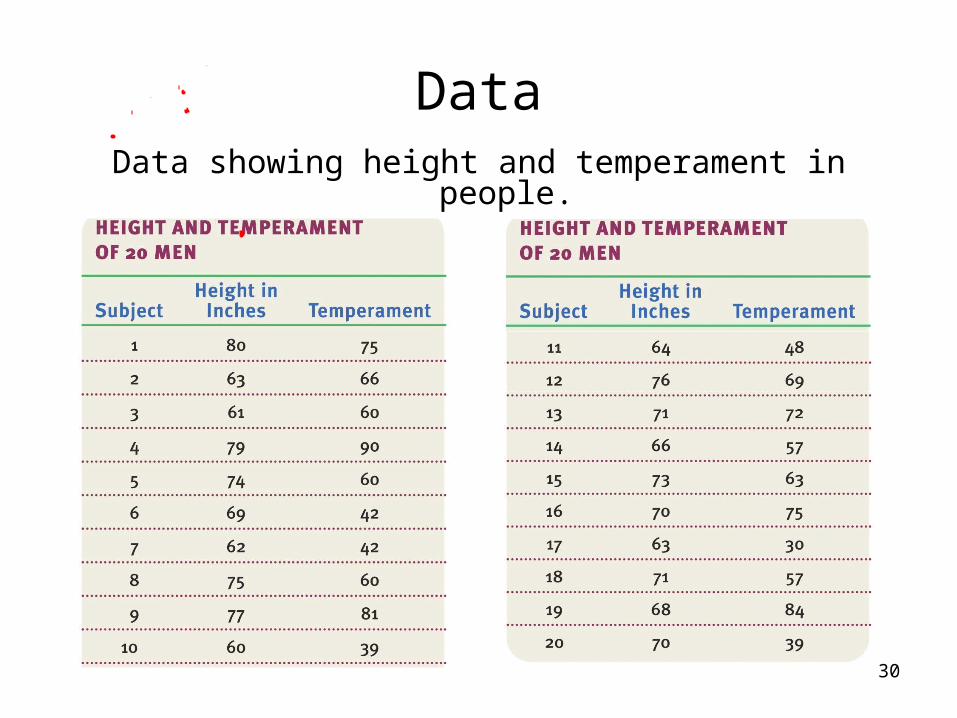
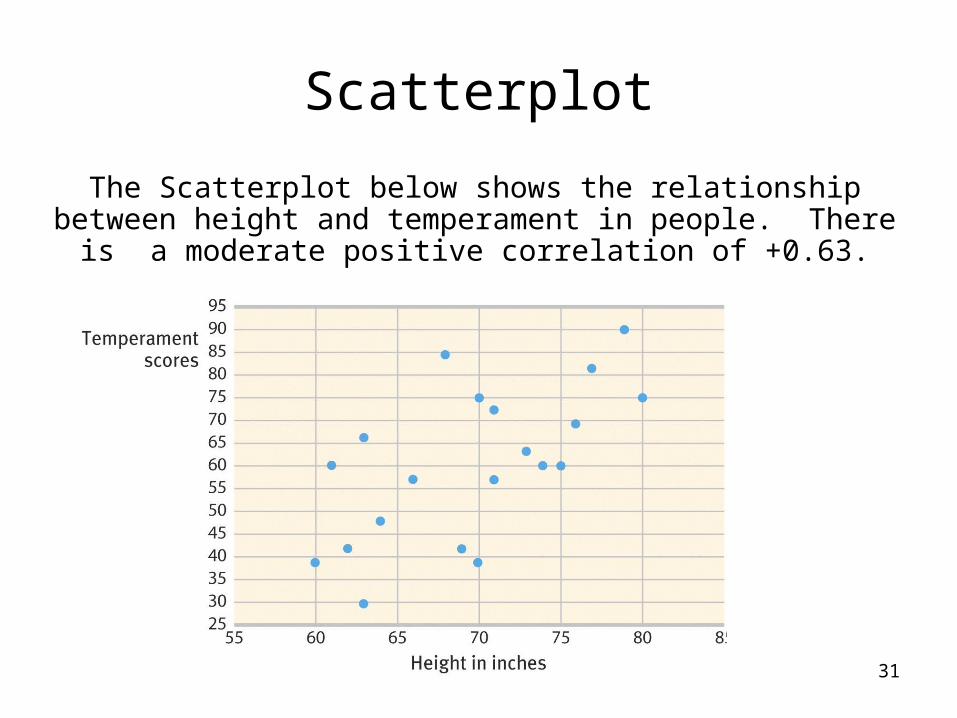
DataData showing height and temperament in people.
31
Scatterplot
The Scatterplot below shows the relationship between height and temperament in people. There
is a moderate positive correlation of +0.63.
32
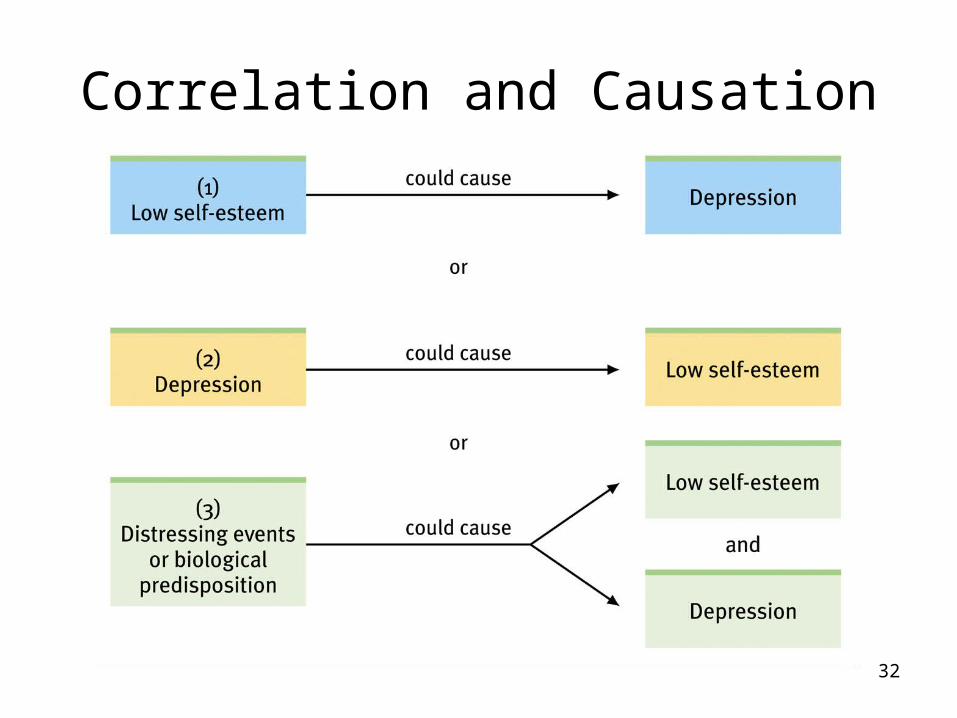
or
Correlation and Causation
33
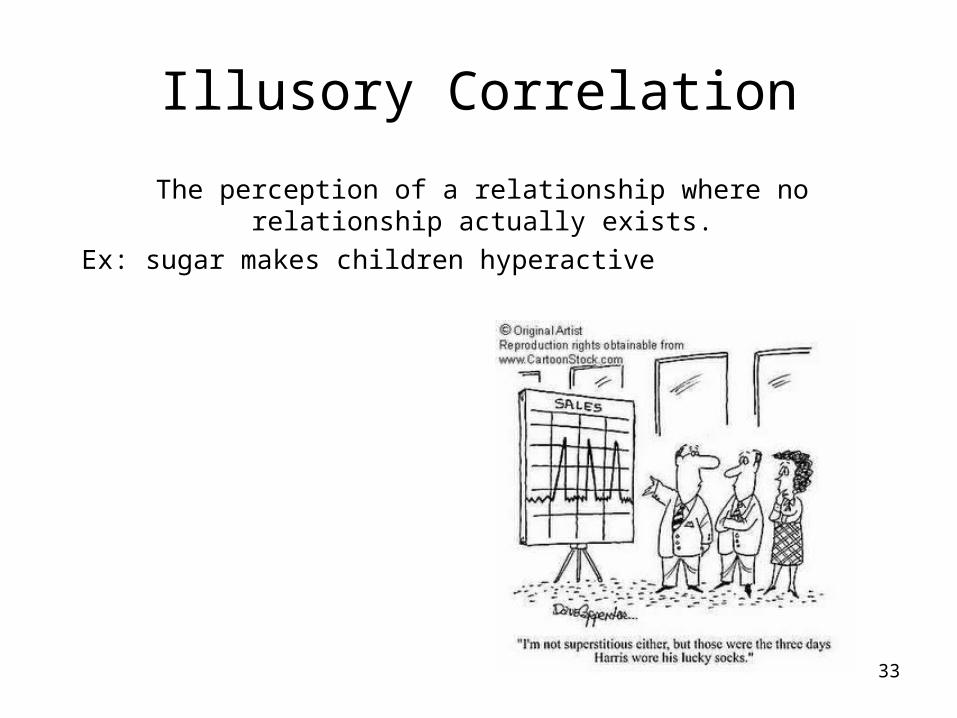
Illusory Correlation
The perception of a relationship where no relationship actually exists.
Ex: sugar makes children hyperactive
34
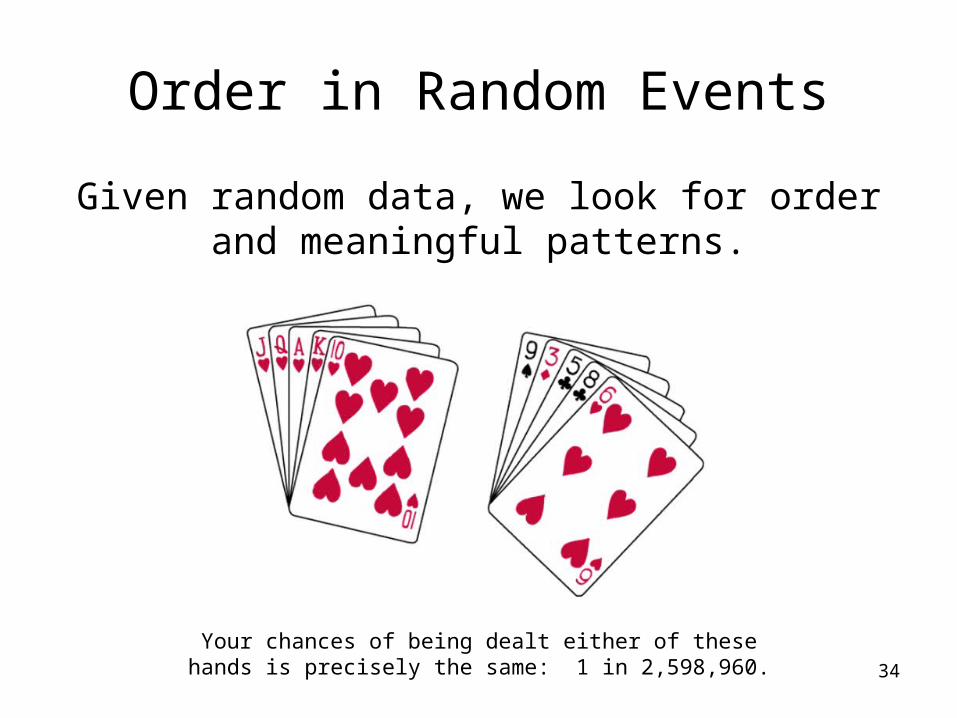
Given random data, we look for order and meaningful patterns.
Order in Random Events
Your chances of being dealt either of these hands is precisely the same: 1 in 2,598,960.
35
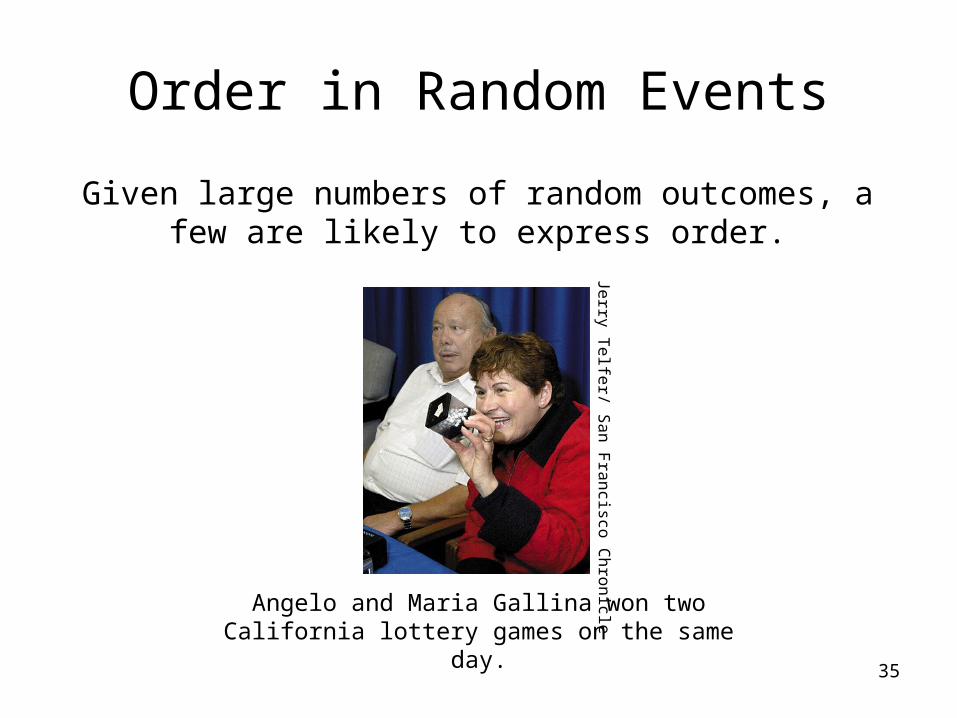
Order in Random Events
Given large numbers of random outcomes, a few are likely to express order.
Angelo and Maria Gallina won two California lottery games on the same day.
Jerry Telfer/ S
an Francisco C
hronicle
36
Aim: How do we use Experimentation To determine
Cause and EffectLike other sciences, experimentation is the backbone of psychology research. Experiments
isolate causes and their effects. Experiments (1) manipulate factors that interest us, while other factors are kept under (2) control
Advantages – controlled environmentDisadvantages – confounding variables – variables the may affect our data
Terms – assignment of group members - -control/experimental, double blind, blind, placebo, experimenter bias
37
Many factors influence our behavior..
Effects generated by manipulated factors isolate cause and effect relationships.Advantages – controlled environment
Disadvantages – confounding variables, experimenter bias
Terms – assignment, random, double blind, blind, placebo, control group, experimental
group
Exploring Cause & Effect
38
An Independent Variable is a factor manipulated by the experimenter. The effect of the independent variable is the
focus of the study.
Independent Variable
39
A Dependent Variable is a factor that may change in response to an independent variable. In psychology, it is usually a
behavior or a mental process.
Dependent Variable
Operational Definitions
• Clearly define your variables so that others can clearly replicate your research and get the same results (reliable)– Example: watching 9 minutes of Sponge Bob
– Independent variable operationally defined
40
Example
• Independent Variable – special juice
• Dependent Variable – worker productivity
• Exp Group – juice
• Control – no juice
• Always make your experimental group the Independent variable and it will be right!
41
Megan wants to test 3 different treatments on the cure of phobias. Subjects were exposed to one of the 3 possible treatments for a period of 3 months and are then tested for a reaction to their fear.
42
43
In evaluating drug therapies, patients and experimenter’s assistants should
remain unaware of which patients had the real treatment and which patients had the
placebo treatment.
Evaluating Therapies
Double-blind Procedure
9/20/13 What are the terms associated with good research?• On the bottom of yesterdays sheet, match
the terms.
44
45
Research Process
1. It all starts with a THEORY
• Explanation using an integrated set of principles that organize and predicts observations and ideas
46
2. Population
• all the cases in a group, from which samples may be drawn for a study
47
3. Valid
• Does the research measure what it intends to measure– Ex: If you are trying to measure for
intelligence but actually ask questions regarding physical tasks (jumping up and down, how fast you can run)
48
4. Replication
• repeating the essence of a research study, usually w/ different participants in different situations, to see whether the basic finding extends to other participants and circumstances – Need to have clear operational definitions to
replicate
49
50
5. Critical Thinking
Critical thinking does not accept arguments and conclusions blindly.
It examines assumptions, discerns hidden values, evaluates evidence and assesses
conclusions.
6. Reliable
• Through replication can we support the same or similar results again and again
51
52
A Hypothesis is a testable prediction, often prompted by a theory, to enable us
to accept, reject or revise the theory.
Ex: People with low self-esteem are more likely to feel depressed. (correlation)Viewing aggressive television creates
causes aggressive behavior.(cause and effect)
7. Hypothesis
8. Operational definition
• Clearly define your variables so another researcher can replicate your experiment and or findings– Defining clearly your independent and
dependent variables
53
9.Generalize
• The ability to apply your research findings in your sample to the entire population
54
10. Sample
• group that fairly represents a population because each member has an equal chance of inclusion in the study – Best is random sample
55
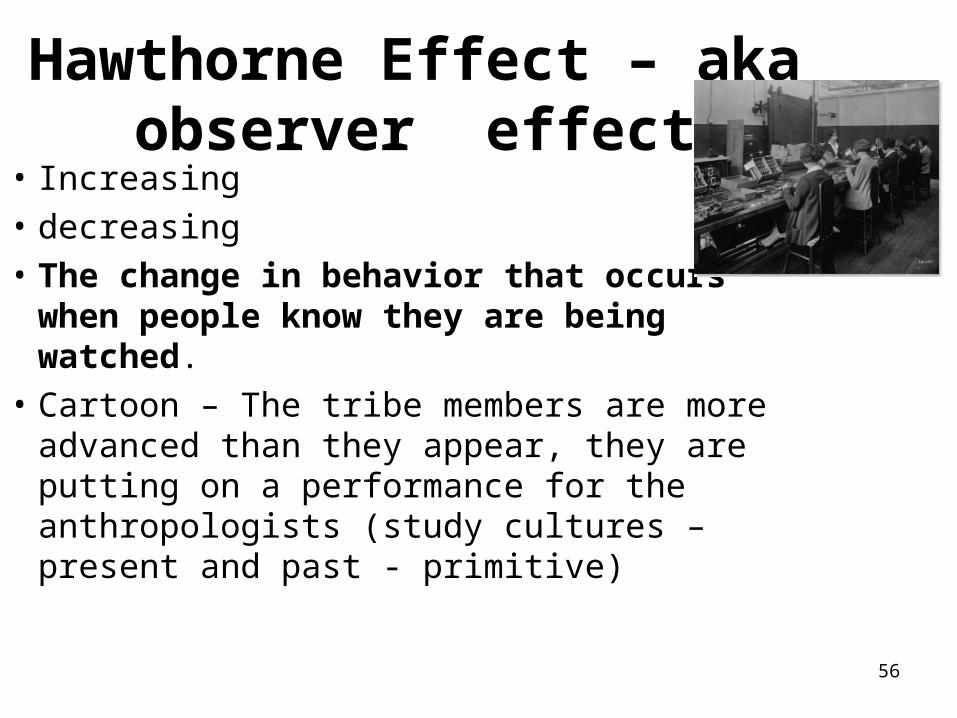
Hawthorne Effect – aka observer effect
• Increasing• decreasing• The change in behavior that occurs
when people know they are being watched.
• Cartoon – The tribe members are more advanced than they appear, they are putting on a performance for the anthropologists (study cultures – present and past - primitive)
56
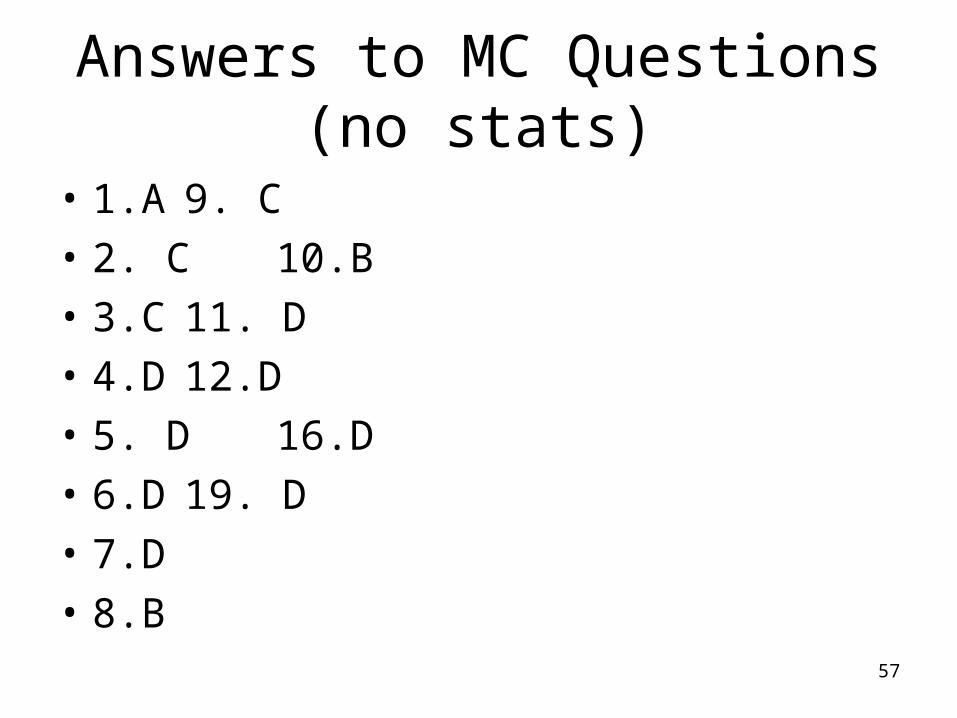
Answers to MC Questions (no stats)
• 1.A 9. C
• 2. C 10.B
• 3.C 11. D
• 4.D 12.D
• 5. D 16.D
• 6.D 19. D
• 7.D
• 8.B57
58
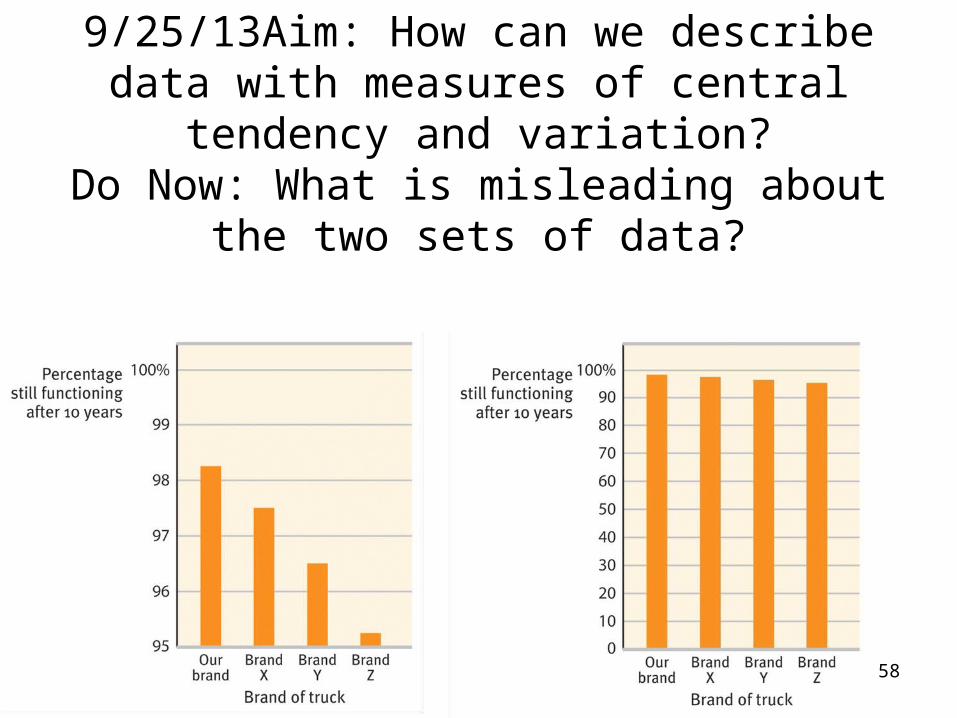
9/25/13Aim: How can we describe data with measures of central
tendency and variation?Do Now: What is misleading about the
two sets of data?
59
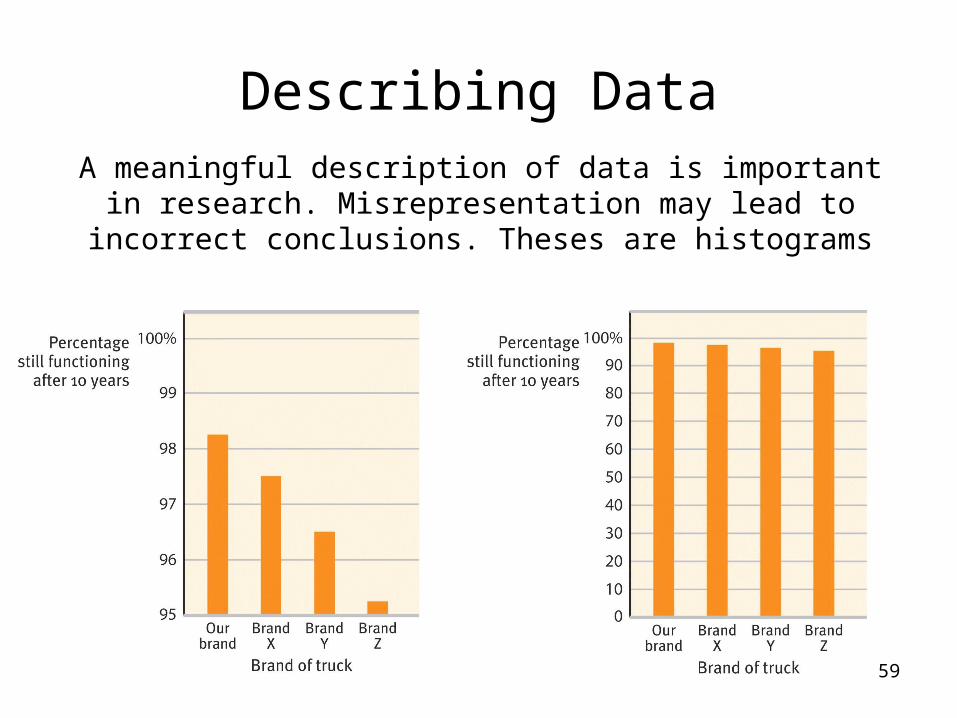
Describing DataA meaningful description of data is important in research. Misrepresentation may lead to
incorrect conclusions. Theses are histograms
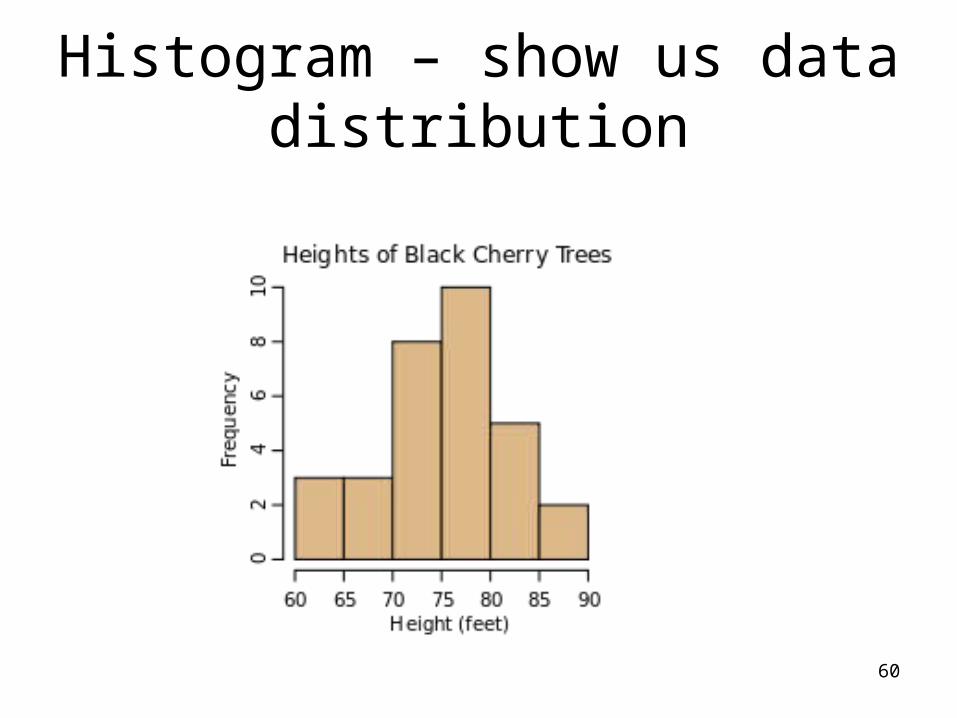
Histogram – show us data distribution
60
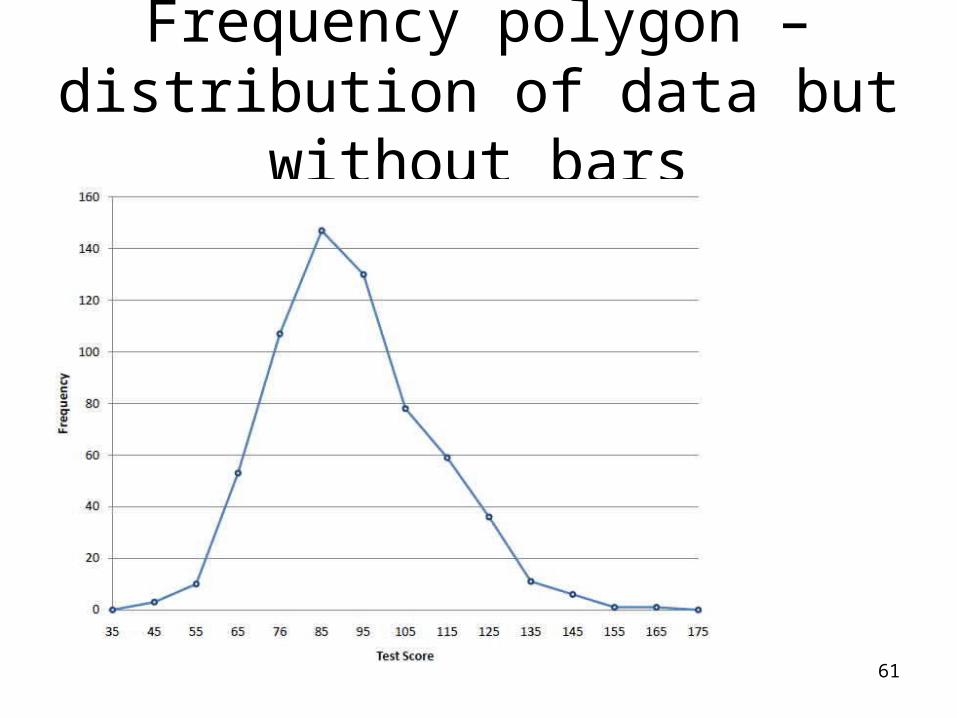
Frequency polygon – distribution of data but without
bars
61
62
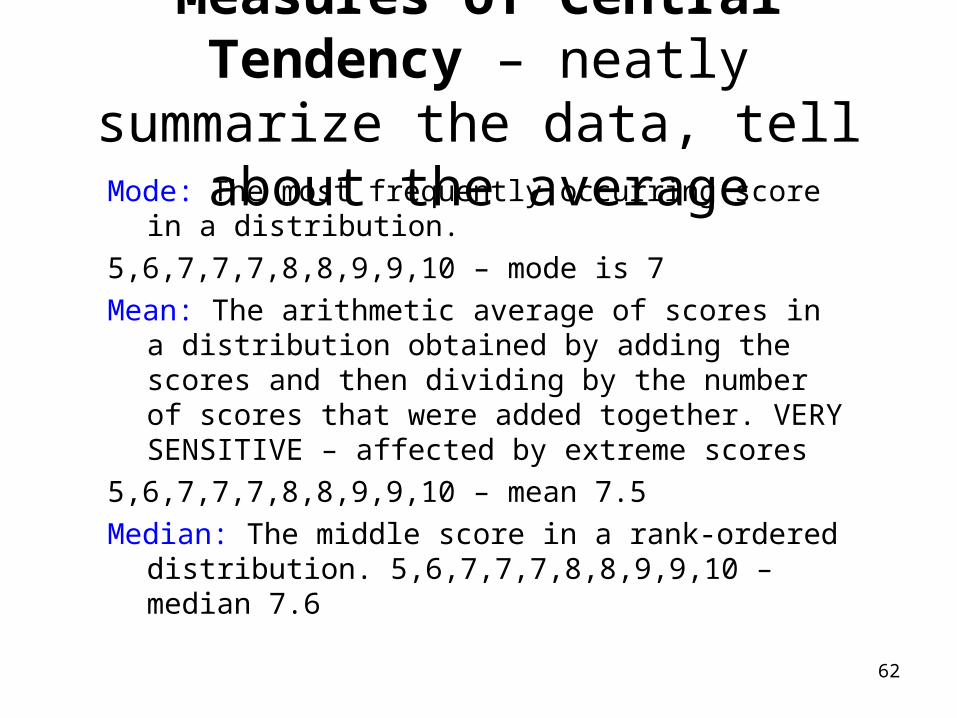
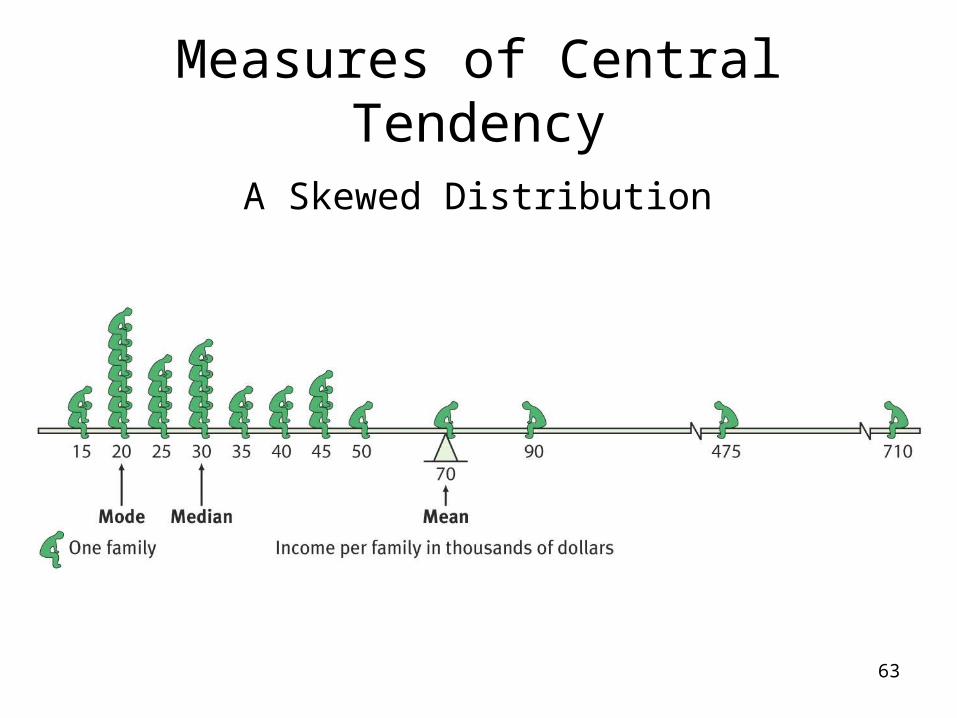
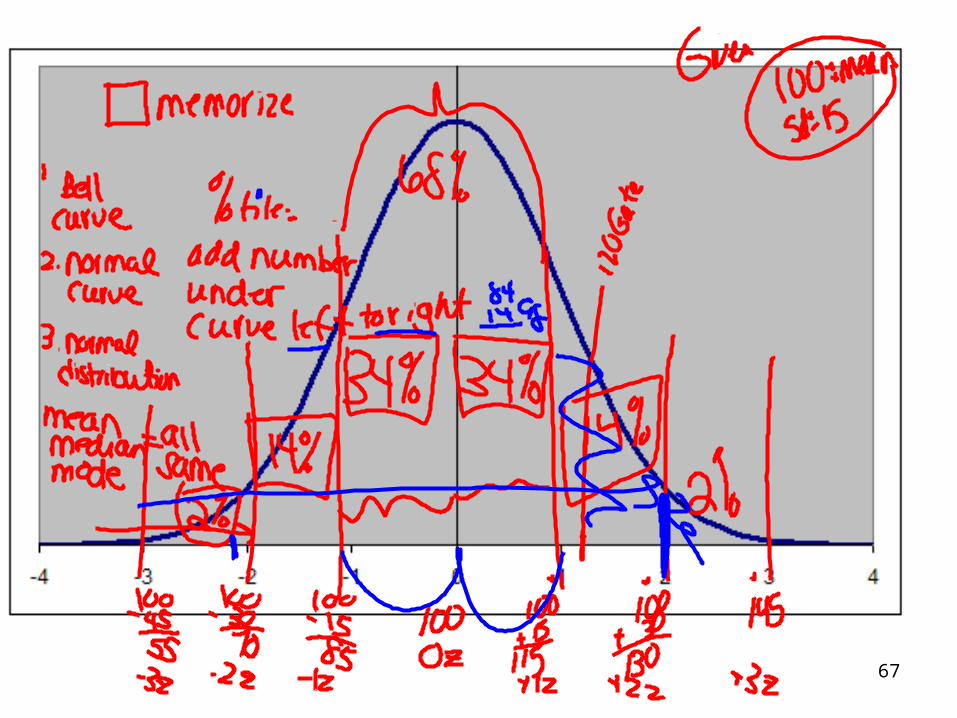
Measures of Central Tendency – neatly summarize
the data, tell about the averageMode: The most frequently occurring score
in a distribution.5,6,7,7,7,8,8,9,9,10 – mode is 7Mean: The arithmetic average of scores in a
distribution obtained by adding the scores and then dividing by the number of scores that were added together. VERY SENSITIVE – affected by extreme scores
5,6,7,7,7,8,8,9,9,10 – mean 7.5Median: The middle score in a rank-ordered
distribution. 5,6,7,7,7,8,8,9,9,10 – median 7.6
63
Measures of Central Tendency
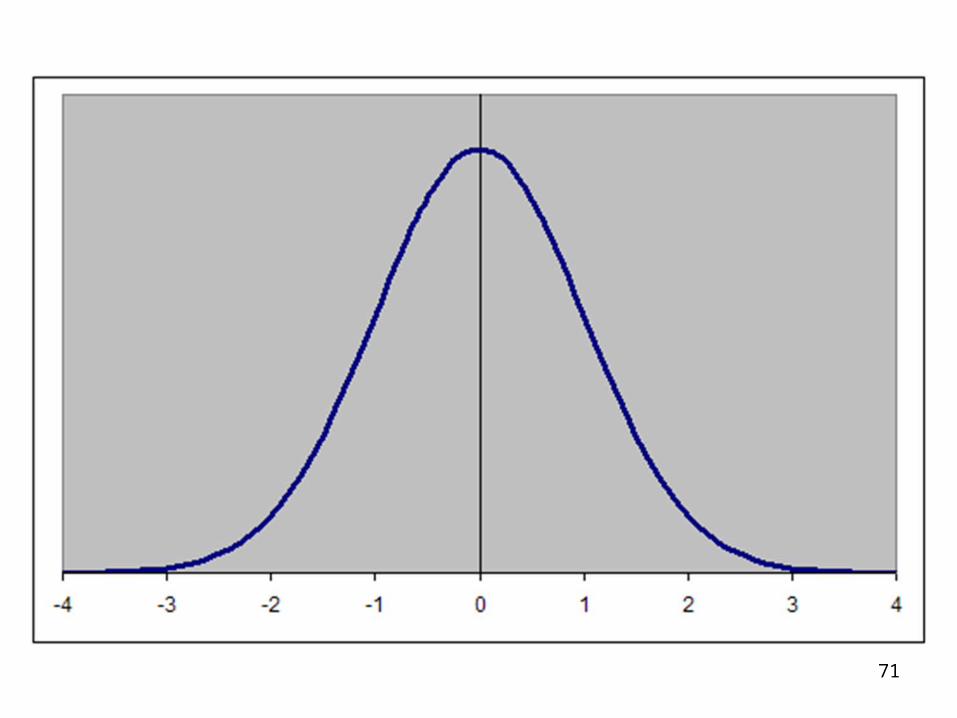
A Skewed Distribution
So…which measure of central tendency is most affected by
extreme scores??• Mean
• Let’s find out how – handout with extreme scores on the bottom
64
65
66
67
Positive Skew
68
Negative Skew
69
70
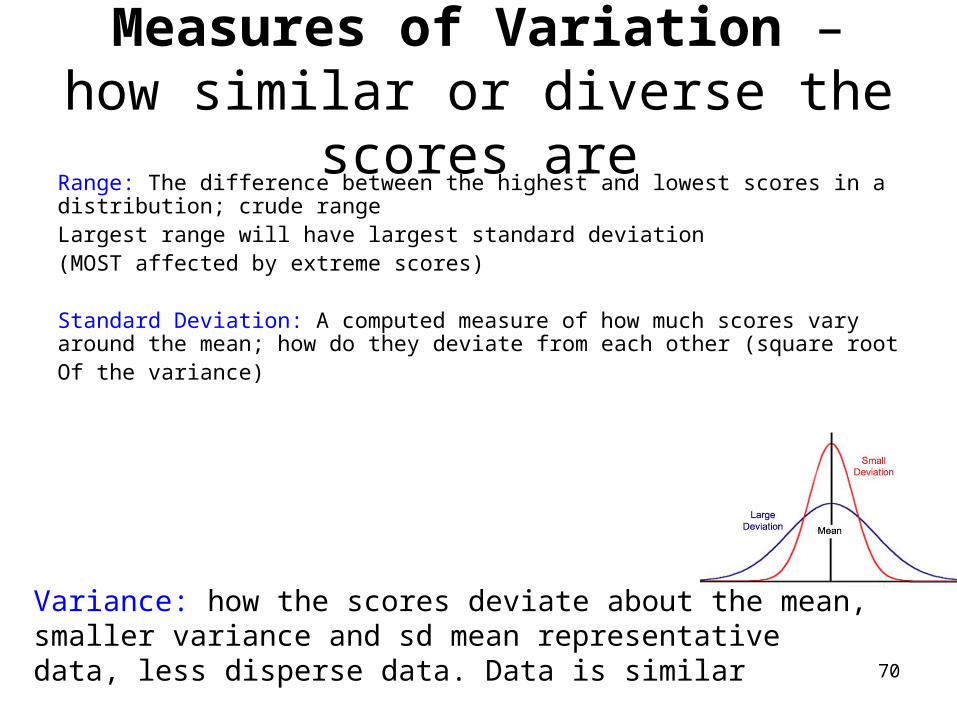
Measures of Variation – how similar or diverse the scores
areRange: The difference between the highest and lowest scores in a distribution; crude rangeLargest range will have largest standard deviation(MOST affected by extreme scores)
Standard Deviation: A computed measure of how much scores vary around the mean; how do they deviate from each other (square rootOf the variance)
Variance: how the scores deviate about the mean, smaller variance and sd mean representative data, less disperse data. Data is similar
71
Which measure of variation is most affected by extreme
scores?• The range (difference of low to high)
72
What kind of data suggests that scores are similar?
• Scores with low variance and standard deviation
• Data that is similar is better. Why?– You can generalize it to the population
73
74
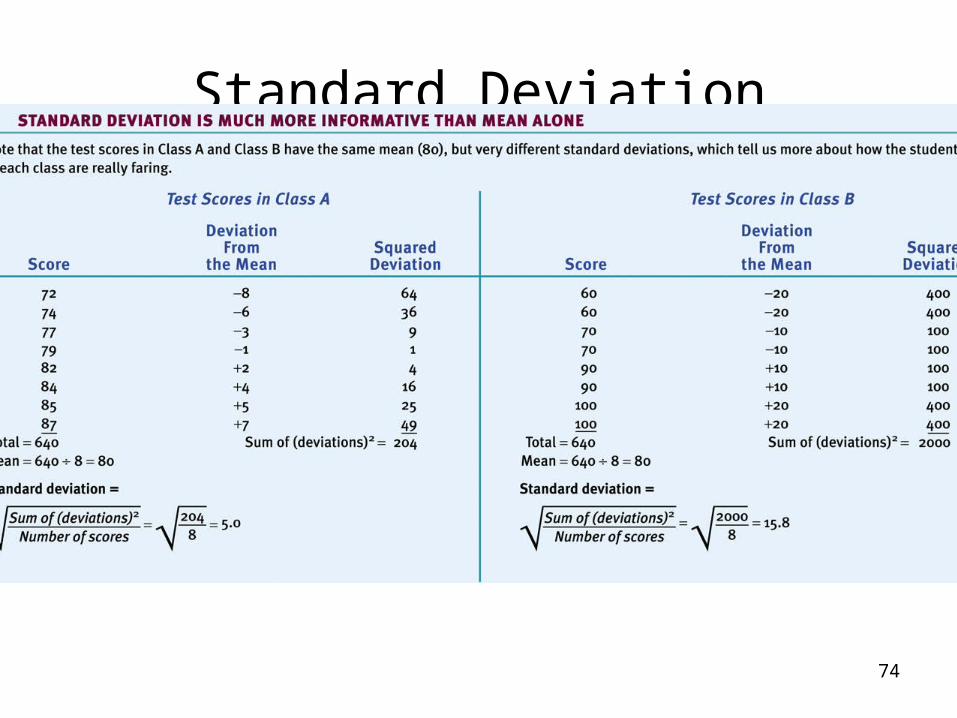
Standard Deviation
Variance
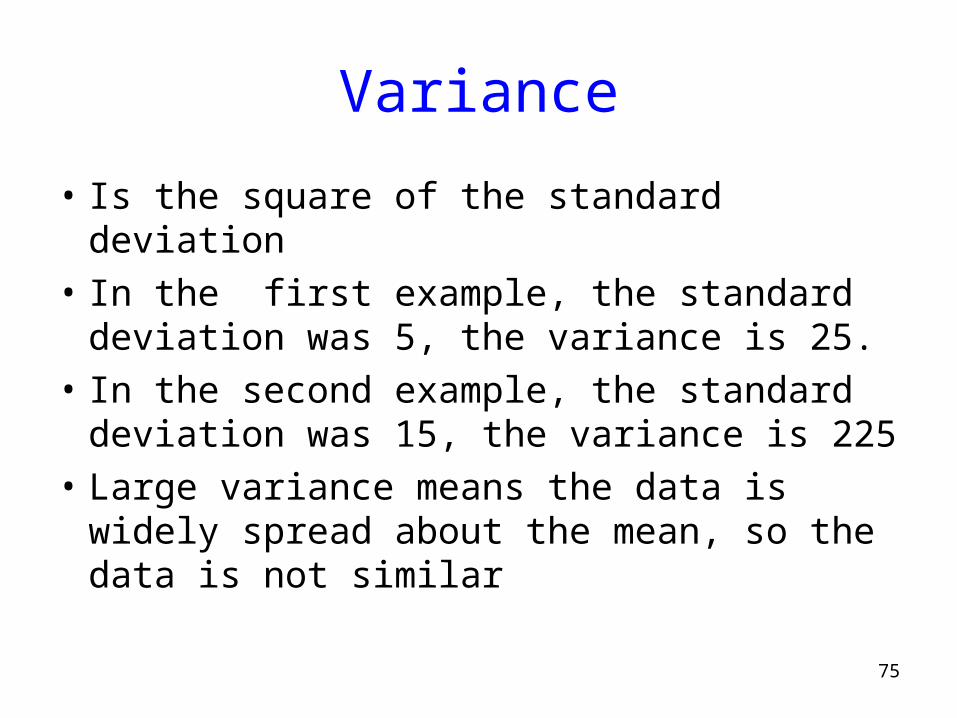
• Is the square of the standard deviation
• In the first example, the standard deviation was 5, the variance is 25.
• In the second example, the standard deviation was 15, the variance is 225
• Large variance means the data is widely spread about the mean, so the data is not similar
75
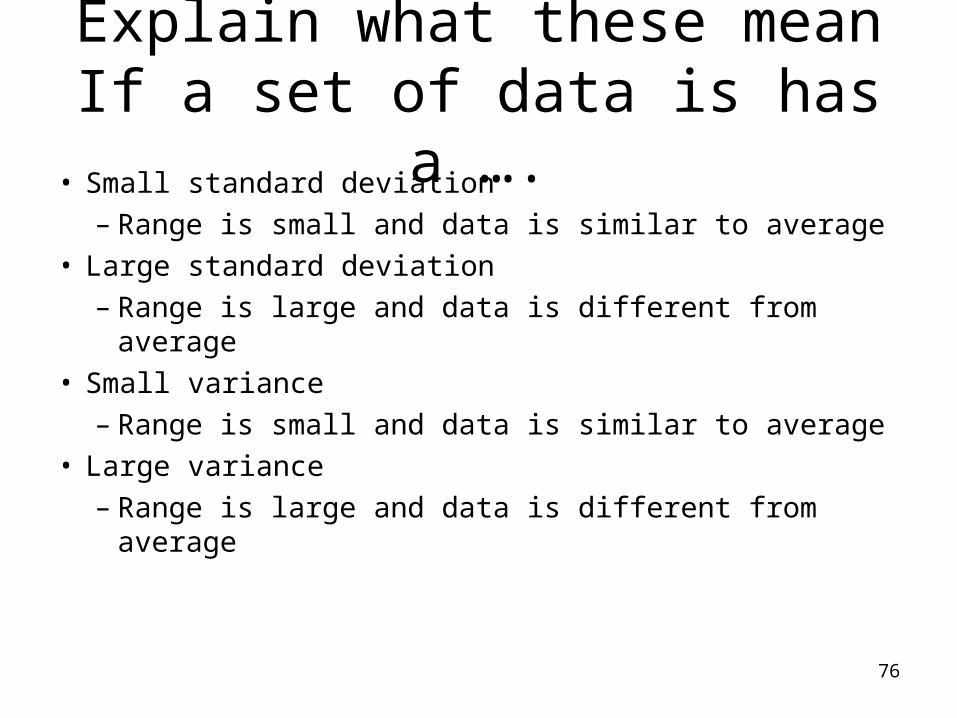
Explain what these meanIf a set of data is has a ….
• Small standard deviation– Range is small and data is similar to average
• Large standard deviation– Range is large and data is different from average
• Small variance– Range is small and data is similar to average
• Large variance– Range is large and data is different from average
76
77
Making Inferences
A statistical statement of how frequently an obtained result occurred by experimental manipulation or by chance.Are the results real or not?
How similar are your scores to what the general population would have scored?
What do you think? Do we want our results to because of our experiment or because of chance? Pick one and explain why.
78
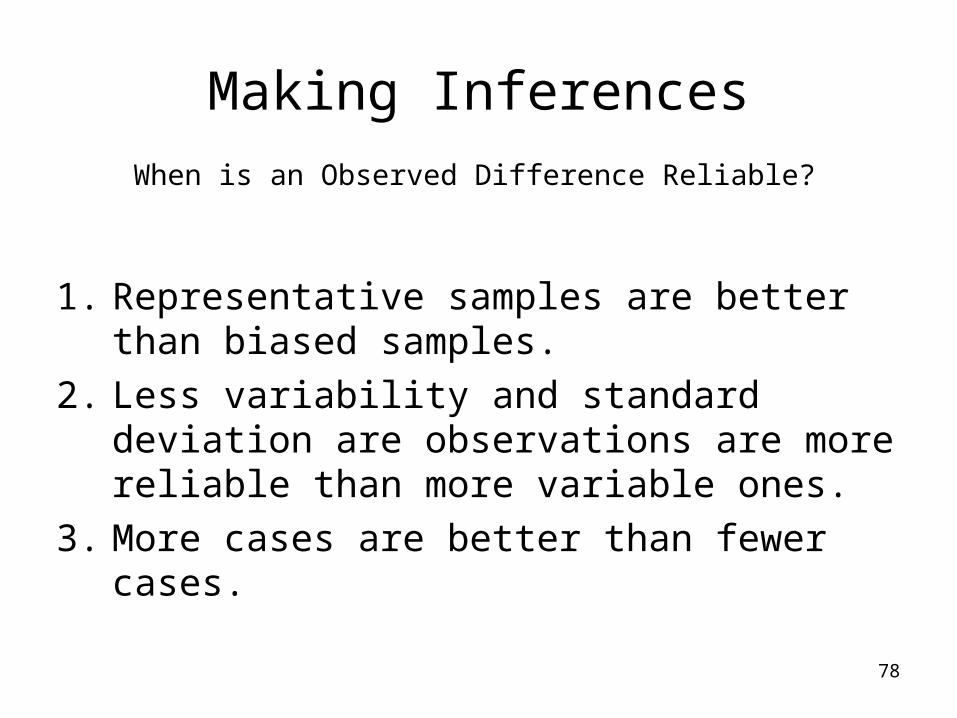
Making Inferences
1. Representative samples are better than biased samples.
2. Less variability and standard deviation are observations are more reliable than more variable ones.
3. More cases are better than fewer cases.
When is an Observed Difference Reliable?
79
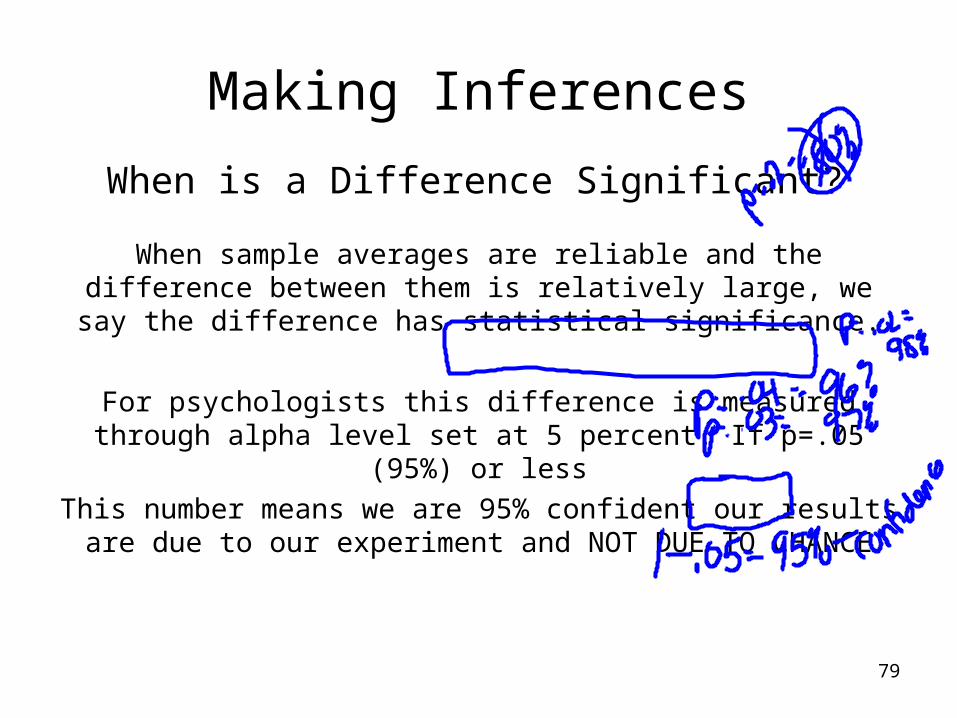
Making Inferences
When sample averages are reliable and the difference between them is relatively large, we say the difference
has statistical significance.
For psychologists this difference is measured through alpha level set at 5 percent. If p=.05 (95%) or less
This number means we are 95% confident our results are due to our experiment and NOT DUE TO CHANCE
When is a Difference Significant?
Answers to MC stats questions
• 13. A
• 14.D
• 15. B
• 16 D
• 17.C
• 18.C
• 20.A
80
9/24/12 Aim: What are the ethics involved in conducting research?
• Do Now: Look at your informed consent form - What do you think is unethical about it? List.
81
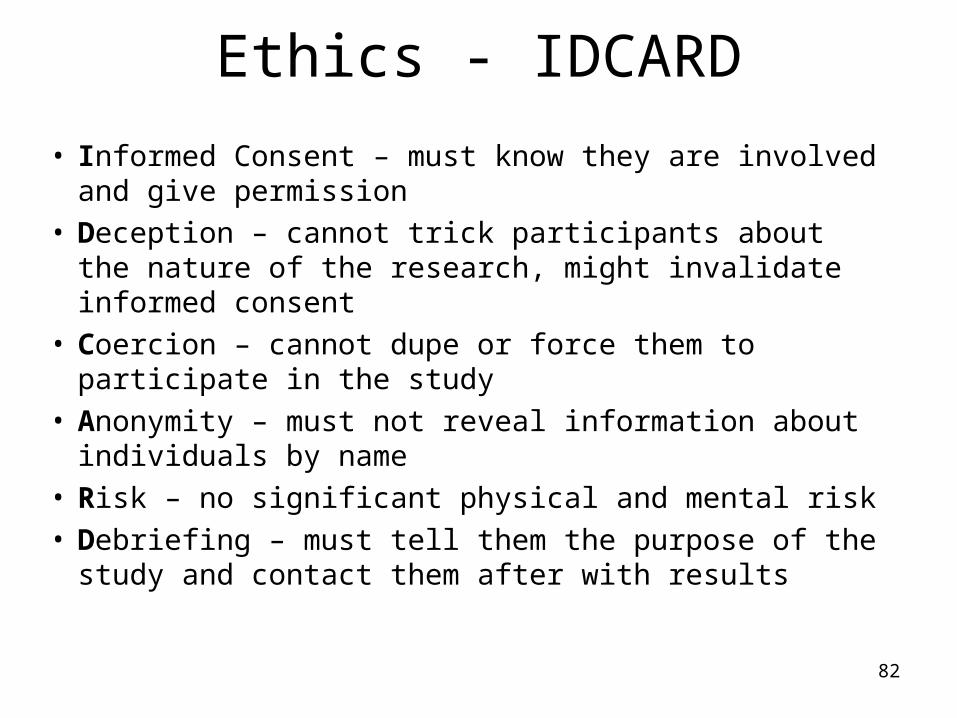
Ethics - IDCARD
• Informed Consent – must know they are involved and give permission
• Deception – cannot trick participants about the nature of the research, might invalidate informed consent
• Coercion – cannot dupe or force them to participate in the study
• Anonymity – must not reveal information about individuals by name
• Risk – no significant physical and mental risk• Debriefing – must tell them the purpose of the study
and contact them after with results
82
Here’s a question for you…
• When is it permissible for a psychologist to share a client’s test scores with another person?
83
When the client provides written permission to share results (informed consent)
84
What are the 3 guidelines for experimenting on animals?
All researchers who deal with animal research are required to follow ethical guidelines in caring for these animals
1.Clear purpose2. Care for animals (alaa rocks)
3. Least amount of riskWhat is the difference between animals and
mans? Animals can be placed in greater harm than humans
• On a scale of 1-5, please rate how accurate the personality assessment is.
• 1 – not accurate at all
• 2 –maybe a tiny bit accurate
• 3 – eh
• 4 – somewhat accurate
• 5- very accurate, this is totally me
85
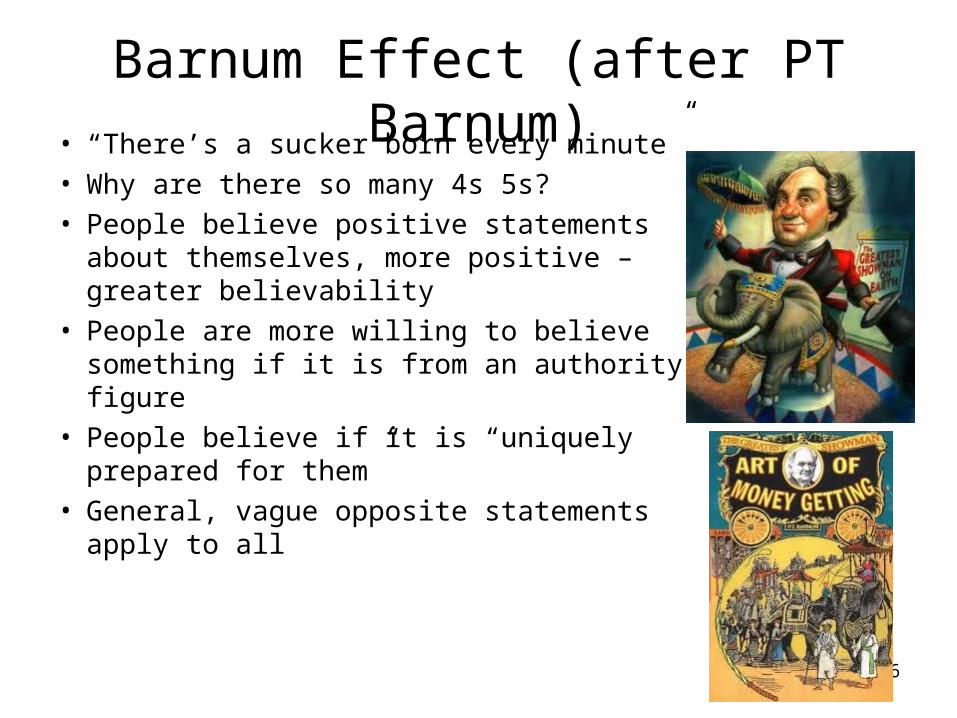
Barnum Effect (after PT Barnum)• “There’s a sucker born every minute”• Why are there so many 4s 5s?• People believe positive statements about
themselves, more positive – greater believability
• People are more willing to believe something if it is from an authority figure
• People believe if it is “uniquely prepared for them”
• General, vague opposite statements apply to all
86