Embed Size (px)
Citation preview

< .•
' ~.} ..., .,, j, .~.-: \/~,nt:.d ~·
t'!••t,' ~. ,., .. ~~-~q~:,.~,r
P'·',l'·· H·.·•,,· :· 1 DOCUMENT CONTROL
3imuLH ion 'lodel Of i~nt.•r,:y and Xitrt)c-~en BaLmce for F'n·e ·Ra:E'im~ Runinants
. S:1<-: '~~
):;. 'I L

ALASKA RESOUR~ES LiBR~\~Y ~T'f~t of the Intenor u ..s. ,1./IVj:F_. ___ _
The Journal Of
(ISSN 0022-541X)
An Official Publication Of The Vvildlife Society
Vol. 47, No.3, July 1983
JWMAA9 47(3i 573-892 (1983)
• "
•
.. ..

.. . ~ -- ...... .
1·HE JOURNAL· OF VJILDLIFE MANAGEME~fT Vol. 1.7, No.3, july 1983 Clait E. Braun, Editor in Chief .
Associate Editors: Keith E. Evans, Vagn F. Flyger (Book Reviews), James M. Peek, H. Mlit Reeves, Gerald L. Storm, and Louis J. Verme Editorial Assistants: Nanc~1 J. K. Braun and Barbara P. Alldredge
CONTENTS
SEX RATIO VARIATION IN ODOCOILEUS: A CRITICAL REVIEW, ....... Louis J. Verme 573
CONDITION PARAMETERS OF WHITE-TAILED DEER l;l TEXAS .................... . . . • . . . . . . . . . . . . . . . . . . . . . . . . . . . . . John G. Kie, Marshall White; and D. Lynn Drawe 583
EFFECTS OF PHOTOPERIOD ON PUBERTY ATTAINMENT OF FEMALE WHITE-TAILED DEER .....................................•............... Wayne S. Budde 595
WHITE-TAILED DEER HABITAT AND COTTAGE DEVELOPMENT IN CENTRAL ONTARIO· , . . . . . . . . . . . . . . . . . . . . . . . . . . . .. Edward Armstrong, David Euler, and Gerald Racey 605
A BIVARIATE NORMAL TEST fOR ELLIPTICAL HOME-RANGE MODELS: BIOLOGICAL IMPLICATIONS AND RECOMMENDATIONS ..................... Winston P. Smith 613
A SIMULATION MODEL OF ENERGY AND NITROGEN BALANGE FOR FREE-RANGIJtG RUMINANTS~ ... :;: ...........................................•... David M. Swift .. 6205~,
FEEDING BEHAVIOR AND HABITAT SELECTION OF MULE DEER AND ELK ON NORTH-ERN UTAH SUMMER RANGE ................. William B. Collins and Philip J. Urness 646
Ei..'< HABITAT USE RELATIVE TO FOREST SUCCESSION IN IDAHO ........•........ . . . . . . . . . . . . . . . . . . . . . . . .................... Larry L. Irwin and James M. Peek 664
USE OF SHORELINE TIMBER RESERVES BY MOOSE ... L. M. Brusnyk and F. F. Gilbert 673
HABITAT SELE(;TION BY SNOWSHOE HARES IN NORTH CENTRAL MINNESOTA ..... . . . . . . . . . . . . . . . . . . . . . . . . . . . . . . . • . . . . . . . . . • Pamela J. Pietz anJ Jolln R. Tester 686
RELIABILITY OF AERIAL CACHE SURVEYS TO MONITOR BEAVER POPULATION TRENDS ON PRAIRIE RIVERS IN MONTANA ...................•......................•
. . . . . . . . . . . . Jon E. Swenson, Stephen J. Knapp, Peter R. Martin, and Thomas C. Hinz 697
BLOOD INDICATORS OF SEASONAL METABOLIC PATTERNS IN CAPTIVE ADULT GRAY· WOLVES •.......................................... U.S. Seal and L. D. Mech 704
NUMERICAL ESTIMATION OF SURVIVAL RATES FROM BAND-RECOVERY AND BIOTE-LEMETRY DATA ..................................•........... Gary C. White 716
CONCENTRATED NESTING OF MALLARDS AND GADWALLS ON MILLER LAKE ISLAND, NORTH DAKOTA ......•.. Harold F. Duebbert, John T. Lokemoen, and David E. Sharp 72S
MIGRATION AND WINTER DISTRIBUTIONS OF CANVASBACKS STAGING ON THE UP~ PER MISSISSIPPI RIVER ...... Jerome R. Serie, David L. Traugei, and David E. Sharp 741
SPECIES, AGE, AND SEX IDENTIFICATION OF NEARCTIC GOLDENEYES FROM WINGS ............................•.........•.................• Samuel M. Carney 754
THE EFFECT OF WEATHER ON BIOENERGETICS OF BREEDING AMERICAN WOODCOCK . . . . . . . . . . . . . . . . . Dale L. Raba, Harold H. Prince, and Erik D. Goodman 762
WOODCOCK SINGING-GROUND COUNTS AND HABITAT CHANGES IN THE NORTHL:ASTERN UNITED STATES .. Thomas J. Dwyer, Daniel G. McAuley, and Eric L. Derleth 772
RESIDENT MOURNING DOVES IN BERKELEY, CALIFORNIA. , ...•.•.•.•....•....... . . : . •..••.......................•........ A. Starker Leopold and Mark F. Dedon 780
ARTIFICIAL TREES AS A CAVITY SUBSTRATE FOR WOODPECKERS •..........•... . • . . . . . . . . . . . . . . . . . . . . . . . . . . . . . . . . . • Alan W. Peterson and Thomas C. Grubb, Jr. 790
SNAG RETENTION INCREASES BIRD USE OF A CLEAR-CUT ...•................... . • . • . . . . . . . . . . • . . . . James G. Dickson, Richard N. Conner, and J. Howard Williamson 799
(Continued on inside back cover)
Tttl! Jm!Rl'IAL Of' Wuoun: MANAGEMENT {ISSN 0022-541 Xl (L(' 51-17007) is published quancrly by The Wildlife ~ocicty. Subscription $54 per ('.llclliL1r ycllt, cmrtnl numhe1'5 S 13.50. and mclndcs WtLDI.lFE l\lo~oGRAPHS i!.sued that }car, A current price list of available back issues can be
obt:uncd from the Soc'cl\ 's h~:adqu:~rt~·rs in Bethesda. Mal) land. t\ddrtn nll sub~npttOn. mcml>er5htp, business orrcspo,,dcncc, afld ~hang.:~ of address to the E.'\C(JIIir!! Dircct<.:r, The \Vildlifc Society, 54 !0
Growcnor L:lnc,llcthcwa. MD :Z0814. Send m:tnuscrtpts to tbl! [;diror in Chit/. Tony J. Pctcrlc, The Ohio Stntc Unhcr5ity, P.O. Box 3341, Columbu~. 011 43210. Send :umounccmcnts
or new books to R1X1k Rt•rJi'll J~'dli(Jr. \'agn F. flnwr. Department of Animal Science (An.tcx). University of 1'-lr~l)'land. College Park. MD 20742. Second Cln1sl'o~ta1w l';~id at Bethesda, MD. and at additional mailing office. Pnntcd by Allen Press, Inc.., !\AI New Hampshire Street. Lawrence,
I<S 66044. ;C The Wtldllfc Society, lr.c. 1'183.
..

• ""'"'~ . -., .. ,. . ..: ... -... --··--,. .... - '
A SIMULATION MODEL OF ENERGY AND NITROGEN BALANCE FOR FREE-RANGING RUMINANTS
DAVID M. SWIFT. Natural Resource Ecology Laboratory, Colorado State University, Fort Collins, CO 80523
Abstract: A generalized simulation model of energy and nitrogen balance for free-ranging nonreproducing ruminants is presentPtl. Th(• model estimates daily energy and nitrogen (N) requirements. Bas(•d on dail) diet digestibility ~nd ;-,; concenlralion, tl1C' model predicts total voluntary intake, rates of digestion and passage, partitioning of energy and :-..: to maintenance, growth, and fattening, changes (posili\'e or .11egalh t' in lean bod) mass and adipose reser\'es, and r('turns of (•nergy and N to thC' t•cosystem.
Animal performance, whether measured as growth, reproduction, or population dynamics, depends upon nutrition. Studies of free-ranging animal food habits and diet quality an' often directed at understanding the basis of animal performance. Although the determination of dietary information is no snu~~l feat in itself, we can at present only approximate the effects of these diets on animal performance. The connection between diet and performance can be further elucidated either by long-term and refined feeding trials, or by combining our knowledge of digestive physiology and animal metabolism into models that simulate animal performance. The latter approach is considerably quickc•r, clwapc'r, and more generalizable, but depends upon the adequacy and accuracy of existing information, and upon our ability to combine this information into a structure that realistically represents the interactions between diet, metabolism, and performance.
The model described here is a synthesis of information on ruminant digestion and physiology that estimates the effects of dietary energy and nitrogen levels and ambient environmental conditions upon ruminant nutritional status and performance. This n1odel is a genC'ralized model of <>nergy and nitrogen balance for nonreproducing ruminants. It is generalized in that it can be used to simu~ate the functioning
620
J. WILDL. MANAGE 47(3):620-645
of a variety of ruminant species by altt•r· ing certain input parameters that chara<. · terize the species to be simulated. I\'eilht t the model structure nor any of its cndt~. need be changed to s\vitch from 1 spe<:it"'to another.
The objectives of the mod€'1 are to IH«'' diet rates of forage intake, rates of di~t''-· tion and metabolism of energy and :\. th,., partitioning of energy and N within th· body, and losses of energy and?\ from I~:" body. The energy and nitrogen hal.1h ~· predictions permit the model to c!'>tim.,·~ the effect of the diet upon the animah • terms of weight gains or losses and eh.!ll'>:'"' in body composition. In addition. t~ •• model has been used to prc'did ann: • impact on ~he ecosystem through n·m· ·~· of forage by grazing and through tlw •. turn of nutrients to the syslem.
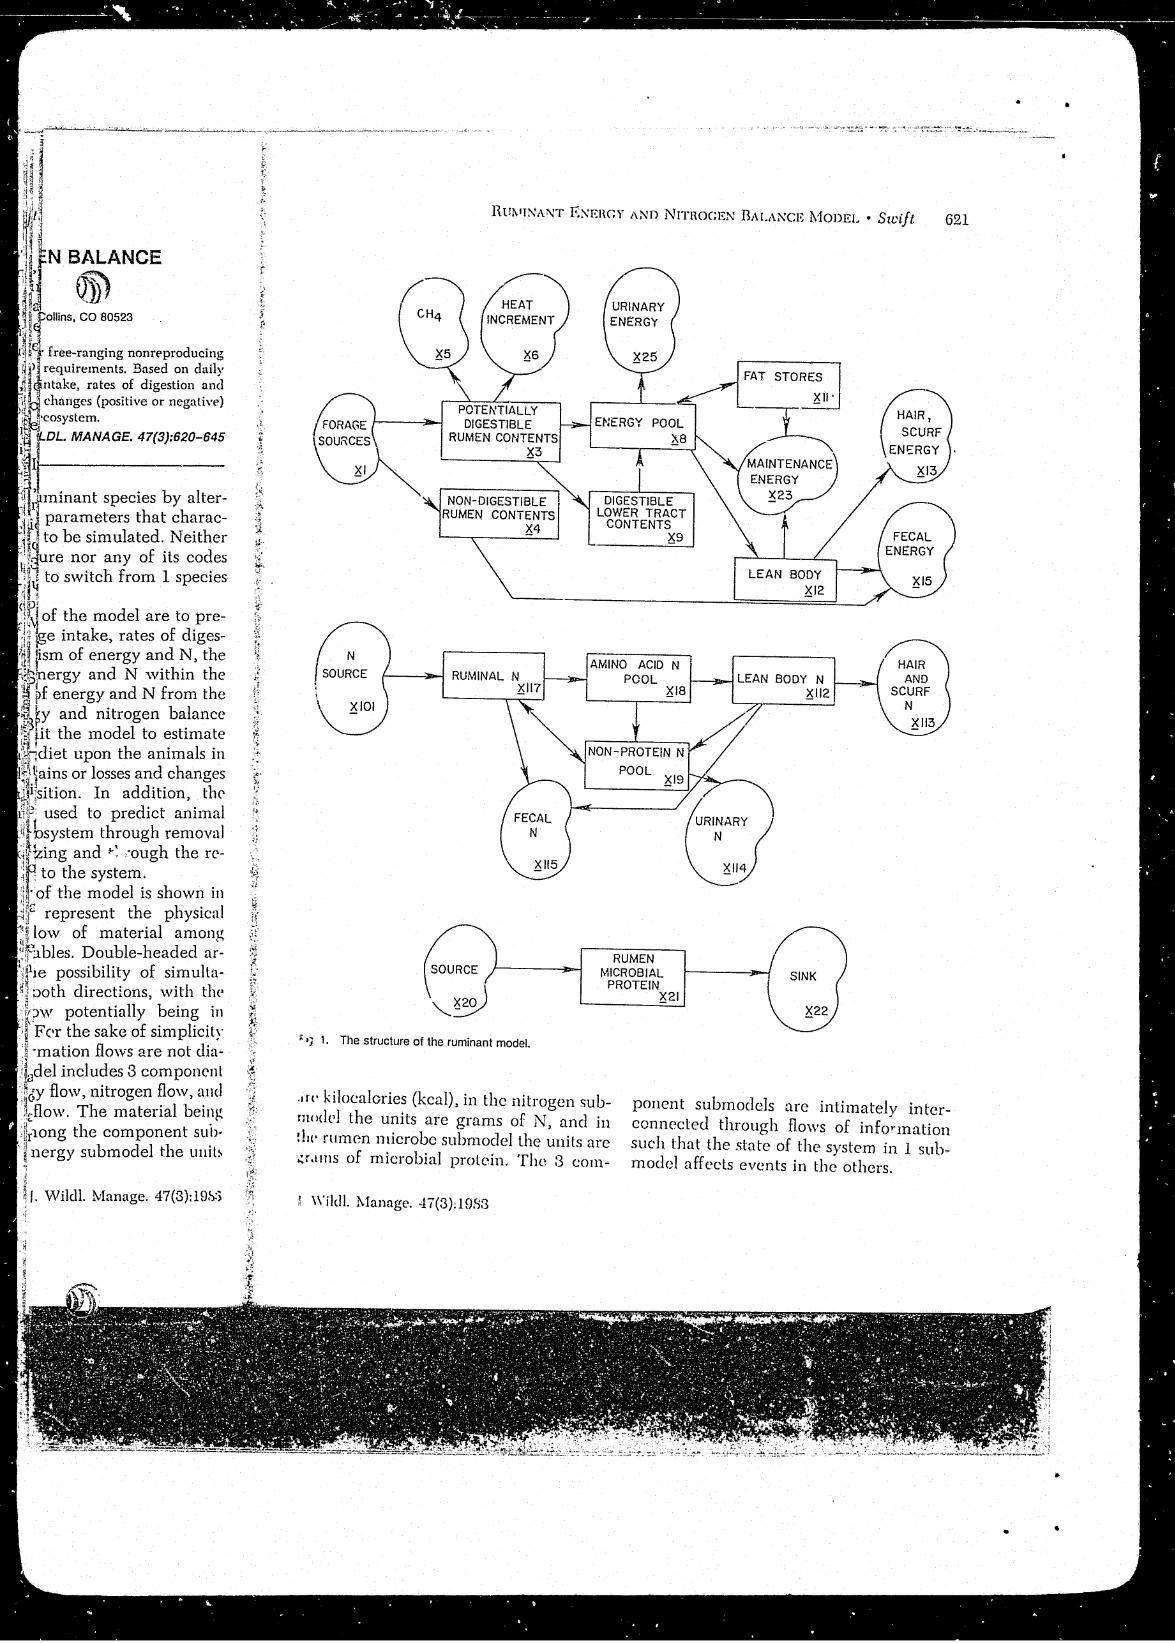
The structure of the model b !>ho" · ",;, Fig. l. Arrows represe-nt lhe pin • movement or flow of material .1n. · •· ~ model state variables. Doublt'-h('adt·,! , rows indicate the possibility of !-itw/ ., neous fluxes in both directions, \\ill,: •
resultant net flow potentially b<'1n.: : either dirPetion. For the sake of .!-inw' and datity, information flows nn' n•!, .•
gramed. The model incl udC's 3 com!"' ' ' submodels: energy flow, nitrogen llo\\ • ,,.
rumen microbe flow. The matNi.d ~" ,, flowed varies among the compom•HI ' ., models. In the energy submodel tlw ·
J. \\'ildl. ~lanagc. ·17
·. ,,'
- -~
<'- .·
..
BALANCE
~ Q})
inant species by alterparameters that characto be simulated. Neither
nor any of its codes to switch from I species
of the model are to preintake, rates of digesof energy and N, the
ergy and N within the energy and N from the and nitrogen balance the model to estimate
diet upon the animals in or losses and changes
tion. In addition, thr . · used to predict animal bsystem through removal
and ~: ·ough the reto the system.
the model is shown in represent the physical
low of material among bles. Double-headed ar-
1~11e possibility of simultanj :Joth directions, with the +:nv potentially being in ·lFc•r the sake of simplic~ty '~ ·mation £10\vs are not d!a·4
.lbdel includes 3 component ·:~ •y flow, nitrogen flow, and i'l(>
l...flow. The material being ;U;1ong the component subi nergy submodel the uuib 1 J ~ r. vVildl. Manage. 47(3):19b:)
L
Rtrl\tT:\'A~T ENEHCY 1\~D NITHOGEN BALANCE MODEL • Swift
~101
POTENTIALLY DIGESTIBLE
RUMEN CONTENTS ~3
NON-DIGESTIBLE RUMEN CONTENTS
~4
~ •') 1. The structure of the ruminant model.
DIGESTIBLE LOWER TRACT
CONTENTS ~9
AMINO ACID N POOL
LEAN BODY
~12
1--~-i LEAN BODY N ~18 ~112
L-----,-----J
NON- PROTEIN N .
POOL
RUMEN MICROBIAL
PROTEIN ~21
621
.art• kilocalories (kcal), in the nitrogen submoch'l the units are grams of N, and in ~lw rumen microbe submodelthe units are ~r.tms of microbial protein. The 3 com-
ponent submoclels are intimately interconnected through flows of information such that the state of the system in 1 submodel affects events in the others.
! \\'ildl. i\.lanage. 47(3);198:3
. ..
•
.. •

622 l\Ui\1INA1\'T ENERGY A:'\D i'.'JTHOGEN BALA!\'CE l\loDEL • Swift
The model is a difference equation model operating at a 1-day time step (DT). Thus, all fluxes and rate parameters have the implied time dimension of day-1
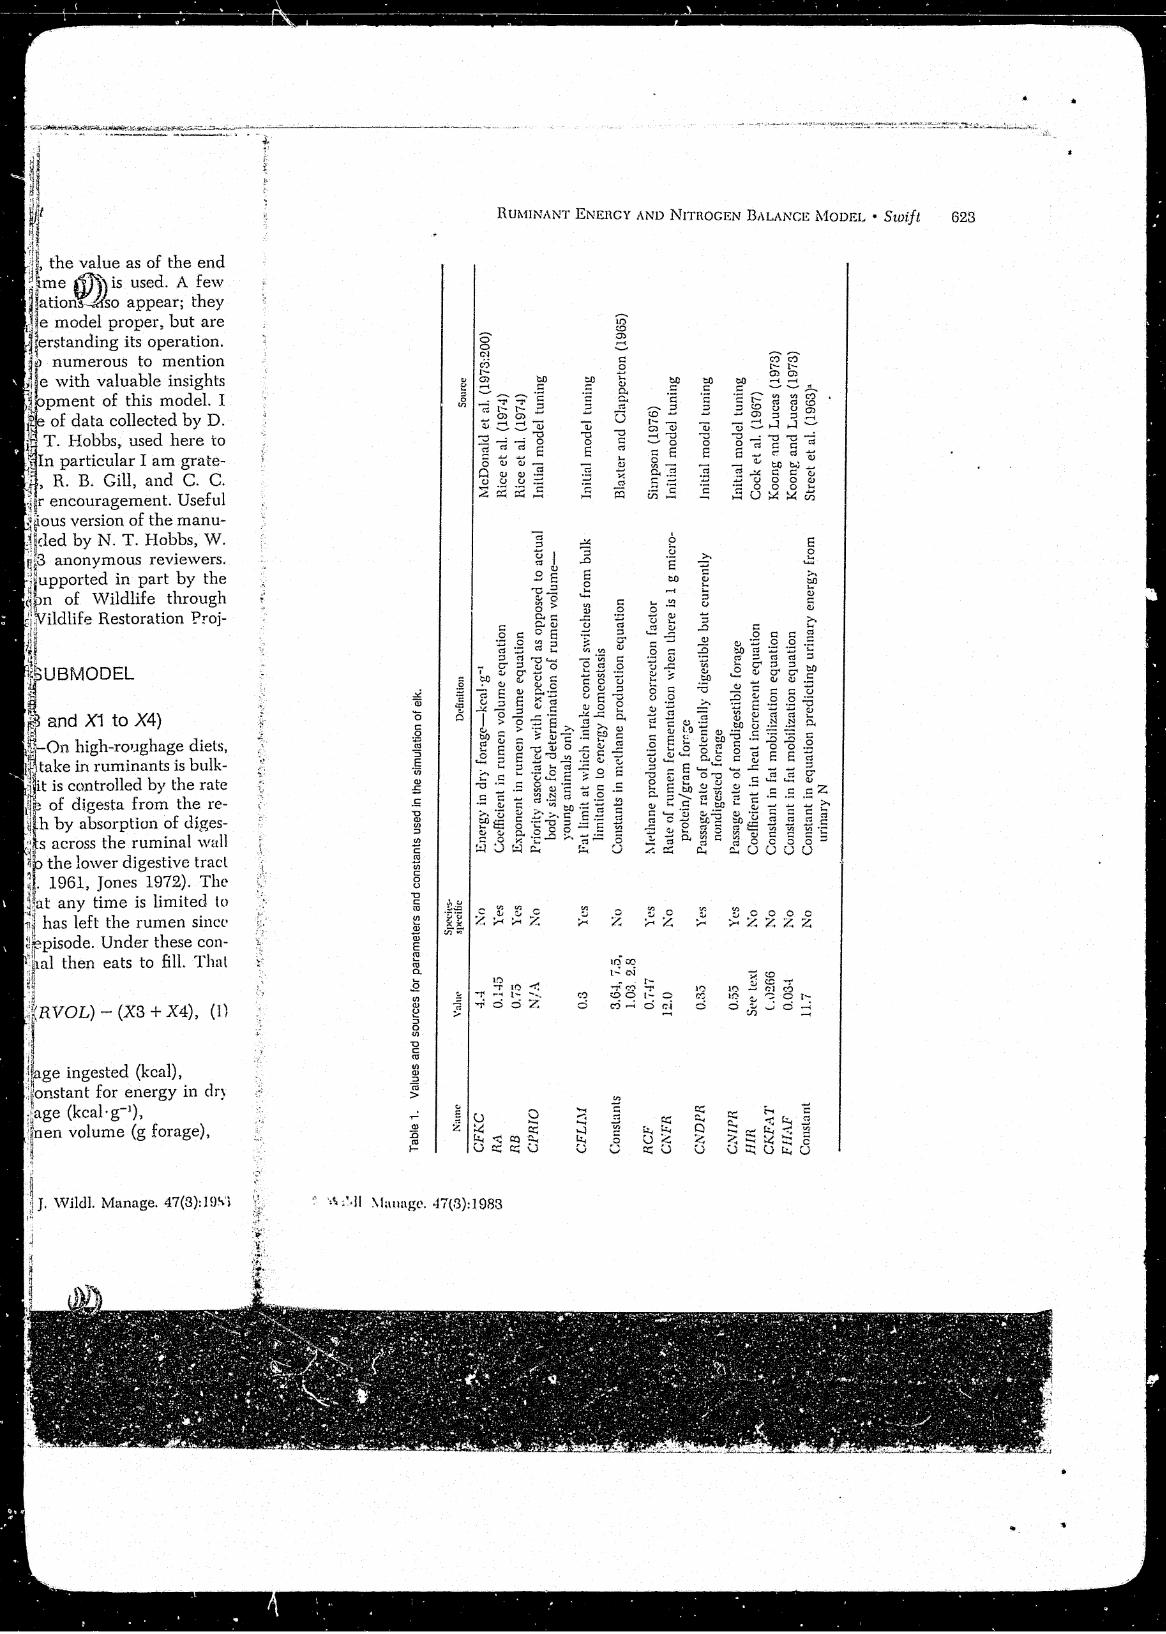
• The model has been implemented in several modeling languages, both as a stand-alone model and as a constituent submodel of a larger ecosystem model. As part of the ecosystem model, the ruminant model simultaneously simulates a number of ruminant species each with its peculiar biological characteristics and each with its own population structure and density. However, it operates on a single· animal basis; that is, the "mean" animal of each speci·~s or cohort is simulated. Results pertaining to the average animal are then extrapolated to the entire popul<:~tion of its cohort to arrive at the total impact for that cohort. In the discussion that follows, the model is described as it operates at the level of the individual animaL All flc)\vs among state variables are described and equations for their calculation are included, except in the sim plcr cases in which a word description of the calculation is more efficient and unambiguous. All equations that are constituents of the model are numbered. The equations are presented in the order in whieh l'lw calculations arc made in the modeL Variable nanws beginning with the letter X represent state variables of the model. All other variable names refer either to input parameters or to intermediate system variables (variables calculated at each time step from the parameters and state variables). Table 1 lists all input parame~ers, defines them, gives the values assigned to them for the simulation run reported here, and identifies the source of all tht• values. The parameters appear in the orcle in 'vhich they are discussed. If an t•quativl requires, as part of its right-huucl side, a variable that has not yet been ealculatt'd during the
present time step, the value as of the end of the previous time step is used. A few unnumbered equations also appear; they arc not part of the model proper, but are important in understanding its operation.
IGdividuals too numerous to mention have provided me with valuable insights during the development of this 1nodel. I appreciate the use of data collected by D. L. Baker and N. T. Hobbs, used here to ...lrive the model. In particular I am grateful to J. E. Ellis, R. B. Gill, and C. C. Schwartz for their encouragement. Usef1.1l reviews of a previous version of the manuscript were provided by N. T. Hobbs, \V. vV. Mautz, and 3 anonvmous reviewers. This study was supported in part by the Colorado Division of \~'ildlife through Federal Aiel in vVilcllife Hestoration Project \iV-126-R.
THE ENERGY SUBMODEL
Forage Intake (Flows X1 to X3 and X1 to X4)
Total Intake.-On high-rough2ge diets. voluntary food intake in ruminants is bulklimited-that is, it is controlled by the rate of disappearance of digesta from the IT
lkulo-rumen both by absorption of digestion end products aeros~ the rumina} wall and by passage to the Io,\·er digestive tract (Campling ct al. 1961, Jones 1972). The animal's intake at any time is limited to the amount that has left the rumen since the last feeding episode. Under these conditions the animal then eats to fill. That is,
FIN= CFKC· (RVOL) - (X3 + X4), 0}
where
FIN - forage ingested (kcal), CFKC - a constant for energy in dr~
forage (kcal·g-t), RVOL - rumen volume (g forage),
J. \Vildl. i\lanage. 47(3):19~3
~~:;..~;.,;:~~-t.Jtliii!.(>t;.!!;:·~"iL~~ • .,.;;:-..;~~....;..,.:;l,.,-~-.,..,...,_~~..:.--.-·-··-..:...--" _____ ..__,........._ __ ~-··__,_~"---~.·-.. ··--......- __ ... * .. ·" ...
the value as of the end e (f)}) is used. A few onV:'Jcfso appear; they
e model proper, but are anding its operation.
numerous to mention e with valuable insights pment of this model. I of data collected by D.
T. Hobbs, used here to particular I am grate-
R. B. Gill, and C. C. encouragement. Useful
version of the manuded by N. T. Hobbs, W.
anonymous reviewers. ·upported in part by the
of \iVildlife through e Restoration Proj-
and X1 to X4)
high-ro1Jghage diets, take in ruminants is bulktis controlled by the rate of digesta from the reby absorption of diges
s across the ruminal wall the lower digestive tracl 1961, Jones 1972). The
any time is limited to
has left the rumen since . Under these con
al then eats to fill. That
RVOL)- {X3 + X4), (l)
e ingested (kcal), t for energy in d r)
(kcal· g-l), volume (g forage),
J. \Vildl. Manage. 47(3):1U~')
f
·' .
c·
...
~ Qj
0 c 0
~ 'S E
'(.? Q)
£ .s 'U Q) rJ)
::l t/)
c <ll iii c 0 u 'U c <ll (/) .... Q)
a; E <ll .... <ll a..
.2 rJ) Q) u ::; 0 (/)
'U c <ll 1/) (j) ::l ro >
Rm.nNANT ENEHCY AND NITROGEN BALANCE MODEL • Swift 623
~ "0 0
E
u:i' ~ l...: c-i -i rf:! !:;
co c
I
0 b ·s
:!) 0 l- 0 ci......; 0 d
E 0
...=
~ 0 0 0 ~ ;..-cZZZZ
• •

Table 1. Continued.
: .. Jtl\{i \'.lhll' Spl'l'il'S• spt•t·ifk
.\I.F~\ 7H.O Yes
BET..:\ 0.75 Yt•s
FLCT ····10.0 Yt>s
TG.-\ 1.7 Yt•s
C.\ TAB 0.53 \'{'S
\\'TOD :?..5 ::-\o
( :umtanl 5.Ci5 ::-\o
.\DYrT :?.IJO.O Yt'S
SJ>l. :?.,:?.00. () Yes
Con~tunl ·1.25 ::-\o
Con!itanl ;).J.2 ::-\o
Comtnnt 0..1·19 ::-\o
( :omtanl 0.:3:3:3 ~() '--<
_. Constant {) :?.18 ~C) _.
-· c.. - Cons! anl O.G~J.l-1 :-.!o y ,..... 5 Constant 0.:}05(; :-\o ~
::rq ~ >4.
HXHEC St'(' lt'Xl ~0
-I C:TJ>J) O.H No ~ -· -·~ ,_ :.r .. ,.·· .•,.i~ 5 a ~· •
!J ..
Ddinitinn Sou ret•
Alpha in bnsa!· metabolic w.lc t•qualion !\luloiy et ul. (1970)
BP~:1. in basal metabolic rate equation tvluloiy el al. (1970)
Ft.sling lo\\'Pr critical tempt·ralurl' Gates anti Hudson (1979)
Tlwmwl conductance Wesley (1971)
:\clh ity eost, fraelion of n:--nt Craiglwad et ul. (1973), Gates unci Hudson (1979)
Consbutl nmvNling wc.'l ,n•ight to dry weight for ani- Garrett ami Hinman (1969)
mal ti:i~m· kl'nl· g 1 for dry ll'an hmly lissut• ConvPnlional value for average pro-
lein
~ la:dmum adult ll'Hll body weight, kg Derived from each species by filling growth curve to available data on age vs. weight
~laxinllltn lift• spun, days DNivcd from each spedes by fitting growth curve to a ,•ailable data on age vs. weight
Shape paranwler in Brody growth curve DE>rived by fitting growth curve to available data
ken! rwr gram N in a111ino acids Forbes et al. (1928)
El'fid<·ncy of usc> of nitrogt•nous enE>rgy-bea!'iiig com- Falter (1972), as cited in Koong and
pounds for maintenance purposes Lucas (1973)
Ileal produced hy pn•ct•ding reaction Falter (1972), as cited in Kooug and Lucas (1973)
1\t•sidualt•rtergy in urea formed as by-product of Falter (1972), us cited in Koong and
nbch'<~ reac:tion Lucas (1973)
Proportion nitrogenous Ptwrgy in lean body Faller (1972), as cited in Koong and Lucas (1973)
Proportion non-nitrogenous energy in lean body Faller (J 972), as cited in Koong and Lucas (1973)
i'\ recyt'littg rnlt', to/from rum('n Humc: et al. (1970)
True prolt>in digl•stibilily Comprpmise from Elliot and Fokke-ma { 19GO), Van Soesl (1967), i-da son (1969)
~ '- ~ 't.F •'--l•ooo.,••"'.,, •,! •
(j') tv ;!:>.
!:0 c ~ .... z > z -!
t::1 z :::1 ::;:J () >-< > z t)
z ::j ::;:J 0 () t:'l % t;j :> l' > 7. (') t:l 7' ,.;:...
0 t) t=l l'
{I)
"' t;
..:'i:, ,...
~·
l ., .. '
~; $
lfl :jltP ~~ J:
t' .r)1
~'..
;l
!: j:, l•
\ 1
f i
l I i j
~ ~ f: ' I;
tii ·! ' :r
~ ~ t
iJ ~. ··t ~-f I jlj
r r. I r I
•
..

' i.:;:-)
f:
. .,.
"';--<
~ .... .... ...._. ~ :---<:" -~ ::l ~
r.< !"~;'
:t ...
-.... ,.,:•
(.'f:• .... .... >
A. 1f -l 'Z5 .__.. ,_. CD ():) VJ
~~~~.:-..a -d.,ii ......... ; )toojl) ,.,...,_L1lCtf!.-Tftr1.:r.1t:~~!!~:~~~·~~?,, . ....,~~ . ~ .,~ •
Falter (197~). as cited in Konng a';;d ~--"-~""'~·"=""""'"''·-- • Constant
Constant 0.218
Constant 0.694-1
Constant 0.30:56
/lSHI:C: S(•t· te:o:l
r u·o ()I)
~.:-· ~ ""~
No
No
No
:No >:o
H.esidual energy in urea formed as by-product of above reaction
Proportion nitrogenous energy in lean body
Proporlion non-nitrogenous energy in lean body
N recyding rule, to/from rumen rnw prolt'ill dig<•slibilily
"t-·.~-:~". ':l.t:r,_~ ~.-.lH;'?"'- ,II,"~.;('~~,___,
--~:~~~~~~:r"~~~~:~~~:::..:?.~!·rg'·~:~~~~~~".~·k1·~~'n:,'r.~'·:·;.•?;'-s:<;·~t~~~"dj(~ . .>·. ~,f~~ :~:r ::.
Table 1. Contmued.
:"\';amt' \'ulu.: St)('cic•s· SpPdfic D~fi11ilion
·:·;··.
FWTOD 1.18 No Conversion from wel to dr)' weight for fat (g wel .. ' g dry wt)
Constant G.25 CMICD 0.8 CB\' 0.75 CAE UN O.l.J() CBEUN 0.72 CMFNK 0.003 Constant 0.02
Constant 0.7:3 Constant -11.7()
Constant 14.0·1
Consb.'tll G G9
CPOUT 0 .. '3
No No 1'\o Yes YI'S
Yes No
l'Jo No
No
J:o~o
No
Grams pro1.ein p<.>r gram N Di~estibility of microbial protein Biological value of microbial protein Alpha in C'ndogenous urinary N equation Beta in C'ndogC'nous urinary N t:'qualion Hale of production of metabolic feea] N CoC'fficienl in equation predicting N lost in hair and
scurf ExponC'nl in above equation Coefficient in microbial protein production equation
Coefficient in microbial protein production equation
Coefficient in microbial protein production equation
Hate of microbiai washout from mmen
• Form of equatiml modified by D. 1\1. Swift. b Equation d,•velop~.•d l>y D. :0.1. Swift from datu pl'o.'Sl'nh•d in thes<· papers.
Lucas (1973) Falter (1972), as cited ira Koong ... @~
Lucas (1973) S Falter (1972), as cited in Koong and
Lucas (1973) Hume ct al. (1970) Compromise from Elliot and Fokke
ma (1960), Van Soest (1967), Mason (H)G9)
·· .. ::~-. ;.-, ·-·','(:.·, \,
Source
Wang and Pierson (1976)
Conventional Salter and Smith (1977) Henderickx (1976) Agric. Res. Counc. (19()5) Agric. Ht•s. Counc. (1965) Agric. H.cs. Cm· .c. (1965) Agric. Hes. Counc. (1965)
Agric. Ht•s. Counc. (1965) Hunw (l970a,b), Hume and Bird
(1970), Hume ct al. (1970)" Hurre (1970a,b), Hume and Bird
(1970), Hume et nl. (1970)1> Hume (1970a,b), Hume and Bird
(1970), Hume el al. (1970)b Initial model tuning
:"'', ,, '
::;:l c:: :::::: z > z ...; t:rj z m ::::l () ~
> 7. 0
z ..... :j "'' 0 () :7:1 z b:l
~ ?:: J!;.. () :7:1 7 ...:;, 0 0 :7:1 l'
en .... (';:
..:::, -Ol t-v CJt
t ~ i ~.:
·l: j;
J ,,. <: ~; f ~: • ~~ 11
t r ,. l -.,.,., l
l I
:~ li ;t
j :~ l
~ ~
.r ·~ II
l' . ~ ·'
-,~ ,, ,.
~ l
I ~ •
•

• ·'<"' "-· • _..., ,;,c.~_,__,.~·:..
~- '-·""'"' ' ... ~--··"'· -·---.-·
626 RU~IINAXT ENERGY Al':D N!THOGEX BALANCE P.lODEL • Swift
X3 - potentially digestible rumen contents at end of the last DT (kcal), and
X4 - nondigestible rumen contents at end of the last DT (kcal).
Rumen volume can be estimated from metabolic body size (Rice et al. 1974) as
RVOL = 1,000.·RA · (Cl\IAX\VR 8), (2)
where
RVOL - rumen volume (g forage), 1,000. - a constant (g· kg-1
),
RA - a constant (kg· kg-n11),
RB - metabolic body-size exponent (nondimensional), and
Cl\1AX\-V - maximum weight yet attained by this animal (kg).
The maximum weight yet attained by the animal is used rather than its current weight because there is no evidence that a reduction in rumen volmhe is a necessary consequence of normal seasonal weight loss. If the current weight were used in the model, losses in weight resulting from reduced intake would reduce rumen volume and thus future intake would decline, resu1ting in an even more :apid weight loss and decrease of rumen volume, a spiral from which the model animal could nol recover.
In applying the model to young animals, it was found that predicting rumen volume from eq. (2) resulted in depressed growth rates. Even though the animal was growing, its simulated rumen was not expanding rapidly enough to permit the level of intake necessary to support the rapid rates of growth observed in young ruminants. Short (1964) showed that rumen volume in young white-tailed deer ( Odocoileus virginianus) increased more rapidly relative to body weight than was true for older animals. Flatt et al. (1955) demonstrated that increases in rumen volume
are quite variable in young cattle and an• accelerated by consumption of rougha~\· diets.
It seems probable that in the young au· imal, rumen development is a high-1)rior~ ity process and that energy is allocalt'd t1• that purpose even in instances in whkh the total energy being processed is imuf· ficient to meet the total growth requin•· ment. This degree of refinement in inlN• nal energy partitioning is beyond tb~· resolution of the model; that is, the mocl<·l does not simulate the separate den•lop• ment of individual organs. The problem was handled nonmechanistically by rt•· placing CA1AX\V in eq. (2) with another variable (CP\·FT) that represents a com· pronlise between current simulated hod) weight and the expected weight for ;m animal of this species and age (see eq. 17 ~
CP\VT = CPR! 0 · E\V + (1. - CPRIO) · CLB\V, (:3!
where
CPRIO - priority attached to the expected as opposed to the aetual body weight for det<.>rmination of rumen volumt• (nondimensional),
EvV - expected lean body weight (kg), and
CLBVl - current lean body weight (kg).
The value of CPRIO clu~nges with time. being high for young animals and decreasing to zero as the animal ages. For simulation of young pronghorn (A..ntiloca1Jra americana), for instance, it was assumed that CPRIO was equal to 1.0 up to an age of 120 days. It then declined linearly to 0.73 at 180 days and the." linearly to 0.0 at 210 days. After the age of 210 days, rumen volume is solely a function of simulated body \Veight and is no longer de-:"'endent upon expected weight.
J. \V.ildl. ivlanage. 47(3):1983
··.
..
•
•

·otmg cattle and are pti~~~f roughage
\W mt in the young an-ent is a high-priorergy is allocated to instances in which processed is insuf
tal growth requirerefinement in inter
is beyond the ; that is, the model separate develop
The, problem anistically by re. (2) with another
t represents a comt simulated body
weight for an d age (see eq. 17).
(3)
Dttached to the exopposed to the acweight for deter
of rumen volume · nal),
lean body weight
lean body weight
changes with time, animals and de
. e animal ages. For pronghorn (Antiloinstance, it was as
equal to 1.0 up to then declined lin
ys and then linearly the age of 210
is solely a function ght and is no longer
ed weight.
Managa. 47(3):1983
RUMINANT ENERGY AND NITROGEN BALANCE MODEL • Swift 627
Equation (1) is used to predict intake under «normal" or bulk-limited conditions. There is evidence, ho\vever, that ruminants on a high plane of nutrition are not bulk-limited and do not eat to fill, but rather adjust intake to maintain energy homeostasis so that a constant \Veight is maintained (Montgomery and Baumgm-dt 1965). Therefore, should the animal reach a preset level in its fat reserves (CFLIJ-1, an input parameter), eq. (1) is not used, and the follmving formulation for intake is invoked, provided it predicts a value less than that predicted by eq. (1).
FIN= (C}.-11~EQ + CHI + CI14 + CURE)/CDIG, (~1)
where
FIN = forage ingested (kcal), Clv!REQ = maintenance requirement
(kcal) (see below), CHI = heat increment (kcal) (see
eq. 9), CH4 - methane production (kcal)
(see eq. 5), CURE - urinary energy loss (kcal)
(see below), and CDIG - forage digestibility (non
dimensional) (sec below).
Under these circumstances (release from bulk limitation, coupled \Vith high levels of body fat), the animal consumes an amount of forage just sufficient to meet its energy req'.lirement and thus maintain body WP,ight. This is probably an unusual set of circumstances for wild ruminants . Data on diet quality for pronghorn (Schwartz et al. 1977) are the only data I have used to run the model that have yielded this response.
Digestible and Nondigestible Intake.Once the total intake (FIN) has been calculated, the calculation of digestible intake (flow from Xl to X3) and nondigestible intake (flow from X1 to X4) is
J. Wilcll. Manage. 47(3):1983
straightforward. Digestible intake is sirn.ply total intake multiplied by the digestibility of the diet. Indigestible intake is then the difference between the total and digestible intakes.
When the model is run as a stand-alone model, dietary digestibility is input as a time series of observed or estimated digestibility values. Linear interpolation within this series of data yields digestibility for each day of the simulation. vVhen the model is operated as a component of some larger model, some other means of estimating digestibility may be necessary; the exact method is dependent upon the structure of the larger modeL In the case of th'-~ simulations using this model reported by Parton et al. (1979), a digestibility value was assumed for each plant part being simulated by a primary-production model (Detling et aL 1879); a dietselection model modified from Ellis et al. (1976) selected a diet from among these components. Dietary digestibility was calculated from the digestibility of the various components and their predicted proportions in the diet. The terms "potentially digestible, and "noncligestiblc," as used here, relate to this empirically determined or calculated digestibility of the diet and not directly to the chcmieal components of the diet (cellulose, lignin, etc.) and their potential for digestion by microbial or mammalian enzymes.
Methane Production (Flow from X3 to X5)
rvlethane pro::luced in the rumen as a by-product of the fermentation process and Josl through eructation represents a substantial loss of energy to the grazing animal. Blaxtcr and Clapperton (19G5) analyzed data on methane production in cattle and sheep and developed a series of equations that predict methane producUon from feeding level and forage digest-
• •

628 H.U!vllNM-iT El'\ERGY AND NITROG
ibilitv. They presented 2 equution predicting the rate of methane produ on roughage diets. One predicts the of methane production for an anim the maintenance level of feeding an other predicts the rate of change il methane production rate as the le'' intake varies. Combining their 2 <:
tions I obtained
where
CH4R = 3.64 + 7.5·(DIG) + FL·[L03-2.8·\DIG)],
CII4R - rate of methane produ (kcal·lOO kcai-1 consu:rr
DIG - forage digestibiHty ( kcal-1), and
FL - present feeding level in tiples of the maintenan( quirement, that is, Fl CA1REQ, 'vher<.> FD digestible intake (kcal} Cl\IREQ = mainlcnanc• quirement (kc:al).
This equation ls suitable for catth sheep but may nol be appmpriatc fm er ruminants. At the maintenance le' feeding on diets that are 50% cligcs this equation predicts that 7% of gro• crgy intake will be lost as methane. ley (1971) states that 3% is a better f for pronghorn. Simpson (1976) SUf
that methane production averages 5.· gross energy for elk (Ccrous elaplws) corresponding figure for white-tailed is bet-ween 2 and 3Sf, (fhompson 1973, Ivlautz et al. 1975). ~ly mode a species-specific r~1te correction f (RCF), entered as an input parame compensate for differences among sr The rate calculated in eq. (5) is m ult by this rate correction factor to obtt adjusted rate for the species being luted.
. '\ ~ . . - -- --1 --.. --- . : -- -"" 1 • . . . . .,1_ ____ -- -- - _.3_
. -------- ~--==:------'----. ~#----+----' -------·-
rN BALANCT!: MODEL o Swift
· for ~tion
rate al at l the
the ~I of
(5)
The rate corrcr.tion factor can be ap· proximated by comparing typical methane production rates for the species to h"'· simulated to the 7% figure obtained fr~Hn the cattle-sheep equat1::m. The .:-atr· cor· rection fact:.n· for pronghorn ic;. F ;)f example, 3/7 01 0.43
Total meth'lih: rrodPctiun for :lie da: is found by applying the cc;rrected meth~ ane production rate to the total .intake for the day, b.:aring in mind that the units for the production rate are kilocalories of methane/ 100 kilocalories consumed.
Digestion and Passage of Forage and Production of the Heat Increment
Digestion in the Rumen (Flow from X3 to XS).-Energy digestion occurs primarily in the rumen, where volatile fatly acids arc produced and absorbed (Ulyatl 1973). On high-roughage diets, fiber-digesting bacteria regulate rate of fermentation in the rumen (Schwartz and Gilchrist 1975). The type and number of cellulolytic bacteria in the rumen ha\'e been shO\vn to affect the rate of dry-matter disappearance and subsequent feed intake (~1oir and Harris 1962, Van Gylswyk 1970). Hice et al. (1974) suggested thal the rate of digestion can be related to the concentration of microbial biomass or protein in the rumen as
CFB = CNFR·(X21/RVOL), (6)
where
CFR. = rumina! digestion rate (kcal· kcal- 1),
CNFR. - nominal rate of rumina} digestion (kcal· kcal- 1),
X21 - microbial protein ir.. rumen (g)., and
R.VOL - rumen volume (g forage).
No good data exist with which to estimate the value of CNFR, so it \V~~s estimated from initial experience with th(•
J. \Vildl. ~lanage. 47(3):1983
' .
• It
·,.

ion factor can be apP~~1 typical meth
es £t~1e species to be % figure obtained from
,.,,,., .. ,, . ...,, uation. The rate corpronghorn is, for ex-
production for the day . ing lhe corrected methte to the total intake for
mind that the units for te are kilocalories of
ies consumed.
·,,;_;.T~ of Forage and Heat lr1crement
P Rumen (Flow from · digestion o,:curs pri-
eP, where volatiJ c; fatty .md absor0ed {Ulyatt
ugh.l115e Jiets, fiher-dite rate o.f f(;Tmen
(Schwartz and GHchrtype and number of ria in the rumen have ect the rate of dry-w&tand subsequent feed in· rris 1962, Van Gylswyk
197 4) suggested that the be related to the con
obial biomass or protein
· R · (X21/RVOL), (6}'
inal digestion rat(' · kcul-1),
inal rate of rumina) on (kcal· kcal-1),
· 1 protein in rumen nd
('11 volume (g forage).
<'xist with which to esliCNFR, so it was esti-
. ial experience with tho
\\'ildl. ivlanage. 47(3):198:3
.·.
,•
RU!vHNANT ENEH'., Y AND NJTHOGEN BALAXCE MODEL • Swift 629
model. CNFR can be thought c~ as the rate of digestion per unit of "microbial concentration" in the rumen. After calculation of CFR as above, its value is constrained to be <0.95, as suggested by Rice et al. (1974). The total digestion in the rumen is then calculated as
where
CRD X3
CH4
CFR
CRD = (X3- CH4)·CFR, (7)
--
-
-
digestion in rumen (kcal), potentially digestible material in rumen (kcal), methane production (kcal), and ruminal digestion rate (kcal· kcal-1).
The value of CH4 calculated above is subtracted from the total potentially digestible rumen contents before calculating the total digestion because that portion (CH4) of the digestible energy will be converted to methane and will thus not be available fvt digestion and transfer to the energy pool (X8).
Heat !ncmrnent (Flow from X3 to X6).-The production of the heal increment of feeding is, for ruminants, the sum of 2 processes: heat production associated with rumen fermentation and heat production associated with specific dynamic <'ffect. However, in measuring heat increment this separation is not usually made, and it is consequently more reasonable to predict the sum of the 2 than to predict hPat production by each process separatelv. Cock et al. (1967) expressed heat in(:rement as a function of dietary pmtein <llld metabolizable energy. The current model docs not contain an entity "metabolizable energy," but this value can be approximated by subtracting urinr energy from the total energy digested ciuring this time step. That is,
C'Ili = (CRV + DPR- CURE)·IIIR, (B)
}. Wildl. iv1anage. ·f/{:3):1983
where
CHI = heat increment (kcal), CRD - energy digested in rumen
(kcal), DPR - digestion post-rumen (kcal),
CURE - urinary energy (kcal), and HIR - rate of heat increment pro
duction (kcal · kcai-1 metabolizable energy).
The rate of heat increment production (HIR) is found by linear interpolation \vithin the data reported by Cock et al. (1967). They related heat increment (as percent of metabolizable energy) to percent protein in the diet and found heat increment to be 23% at a protein content of 3.6%, 30% at 9.4%, 32% at 16.3%, and 25% at 21.6%.
Passage of Potentially Digestible A1aterial and Its Digestion in the Lower Tmct (Flows from X3 to X9 and X9 to X8).-Some potentially digestible material escapes digestion in the rumen and instead passes to the lm.ver tract where it is digested chemically (Ulyatt 1973). In the model, a constant proportion of the potentially digestible material remaining in the rumen after ruminal digestian, methane production, and heat increment production have been accounted for is transferred to the 10\ver tract That is, the flow from X3 to X9 is
PASSD = CNDPR·(X3- CII4- CRD -- (jJJi), (9)
where
PASSD - potentially digestible energy to pass from rumen to lmver tract (kcal),
CND PR -- nominal digestible passage rate (kcal· kcal-1),
X3 - potentially digestible material in the rumen (kcal),
CII4 - methane production (kcal),
• ..

630 RUMINAJ'.:T ENERGY AND NITHOGEN BALANCE MODEL • Swift
CRD = digestion in rumen (kcal), and
CHI = heat increment produced (kcal) (see eq. 8).
It is assumed that any potentially digestible material that escapes to the lower tract will be digested there. Thus, the flow from X9 to X8 is simply equal to X9.
The effect of including the previous 2 flows of energy is not to change the proportion of intake digested but simply to introduce a time lag of 1 day for energy digested post-rumen as compared to that digested within the rumen.
Passage of Nondigestible nfaterial frorn Rumen to Feces (Flow jr01n X4 to Xl5).A constant proportion of the nondigcstiblc energy leaves the .. umen at each time step and appears as fecal energy. That is, the flow from X5 to Xl5 is simply X~1 multiplied by an exit rale constant ( CNIPR, an input parameter).
Normal Contribution of Fat to the Energy Pool
Fat stores are not static but are rather in a state of dynamic flux, constantly undergoing mobilization and deposition (Schoenheimer 19-12, Maynard and Loosli 1962:77, Harper et aL 1977:298). The normal rate of mobilization is a function of body size and of fatness (Koong and Lucas 1973); I use their equation to predict fat mobilization,
FTOE = crcFAT· (Xl2)· {X11/Xl2/ [fXll/Xl2) + FIIAF]}, (10)
where
FTOE - contribution of fat to the energy pool (kcal),
CKFAT - a rate parameter specifying the maximum rate (nondim ensional),
X11 - fat stores (kcal), X12 - lean body mass (kcal). and
FIIAF - fatness value at which rate will be one-half the maximum rate (nondimensional).
The energy associated with this normal mobilization of fat is added to the labile energy pool (X8) before that pool is partitioned to its various uses. The labile energy pool therefore contains energy both from dietary and endogenous sources.· This is a major departure from the standard gross energy-digested energy-metabolizable energy-net energy scheme of energy partitioning normally used, and has important consequences for both energy and, particularly, protein metabolism.
Urinary Energy (Flow from X8 to X25)
Urinary energy loss is predicted from urinary nitrogen loss. For this purpose I use a modification of an equation presented by Street et al. (1963). Their equation is
UE = 0.026 + 0.117UN,
where
UE = urinary energy (kc~d · ml- 1), and UN = urinary nitrog('n (~C).
Because this model does not predict urine volumes, I required an equation that would predict enef'gy lost directly from N lost. .By ignoring the small intercept in their equation and by approximating the specific gravity of urine to be 1.0, it can be seen ~hat each gram of nitrogen lost would be associated with a loss of 11.7 kcal of energy. Urinary energy (in kcal) is thus simply 11.7 X urinary N (in g).
Energy Requirements and Allocation of the Energy Pool
The energy residing in lhe en .. ~rgy pool is available for maintenance, growth. and
]. \\'ildL l\1anage. ·!7(:3):HJ83
•
" '·
..

e at which rate ~}tal£ the maxi~ndimension-
·ith this normal ~d to the labile 1at pool is par-The labile en
us energy both us sources. This :1 the standard rgy-metabolizleme of energy 1, and has imJth energy and, Jolism.
Jredicted from this purpose I equation pre
S). Their equa-
kcal· ml-1), and (%).
)t predict urine equation that
Hrectly from N tll interc~pt in 'foximating the ) be 1.0, it can 1f nitrogen lost a loss of 11.7
. ergy (in kcal) is N (in g).
:he energy pool ::::e, growth, and
mage. 47(3):1983
Rt:MINANT E~rmGY AND Nrrnocr:N BALANCE MODEL • Swift 631
fattening. The way ;n v"·hich it is allocated among those metabolic activities depends upon the amount of energy in the pool, the proportion of nitrogenous constituents in the poo:. the maintemmce energy demand, the animal's growth requirement, and the relative priorities associated with the 3 possible uses.
The priority system used to allocate energy in the model is simple. Maintenance energy demands must be met before any other purpose is considered, and the lean body g:owth requirement must be satisfied (within the limits imposn: by N availability) before fattening can occur.
Ma·intenance Energy Requirenwnts.~daintenance energy has 3 components: basal metabolic rate, cost of activity, and thermoregulation. Basal metabolic rate is predicted as a function of metabolic body size. That is,
BA1R = ALFA·(YVTKC)nr:1''\ (11)
where
BA1R = basal metabolic requirement (kcal·day··t),
A.LFA - a multiplier (kcal· day·· I· kg-llf;l',;\)'
\FTKG - body ,.veight (fat + lean) (kg), and
BETA - metabolic body size expo-nent.
\l<'asurcments of basal metabolic rates h.l\·e shown that for a given species the 'alue of ALFA is a function of age, being hit.dlc'r for inunature animals and decrcaslllg to the adult level as maturation pron•<•ds (\Vesley 1971). Consequently there !'-a provision in the model pc·rmitting the t·ntry of a user-developed table of m('a\ttn•d values of ALFA at variou<> ages. The '.du<• of ALFA. actually used on any day ~<> then obtained by linear interpolation \\ ithin this table.
TIH' activity cost, us a proportion of bas-
Wildl. i\lanage . .J7(S):l98:3
al metabolic cost, is supplied to the model as a user-developed table of activity costs (CATAB) measured at various times of the year. The appropriate value for any day is obtained by linear interpolation within this table. In the absence of such detailed information, activity cost can be made a constant fraction of basal metabolic cost.
Energy expended for thermoregulation depends upon the conditions to which the animal is exposed. its fasting lower critical temperature, its thermal conductance, and the heat increment of feeding. Daily maximum and minimum temperatures are used to estimate cold stress. If the minimum temperature exceeds the fasting lower critical temperature (FLCT) of the anir:.1al, thermoregulatory costs are set equal to zero. If the minimm · temperature is less than FLCT, it becomes necessary to estimate the length of the period during which the ambient temperature is less than FLCT and the average temperature during that period. The course of temperature is assumed to follow a truncated sine \Vave during the daylight hours, with the daily minimum temperature (TAJN) occ1.1rring at sunrise and the maximum (T'A!X) at 1400 hours. Night-time temperatures are represented by an exponential relationship declining from sunset to sunrise (Parton and Logan 1981).
Tnf = (T1\1X - Ti\1N)·SIN[27r'Al/ (Y + ~:t)J + TAIN, and (12)
TN= Tt\!N - (TS - TAIN)cr 2·'·, (13)
where
Tl\1 = air temperature at the l\1th hour after sunrise, (C),
Y - the number of daylight hours, TN - air temperature at the Nth hour
after sunset (C), and TS - air temperature at sunset (C)
(equal to TAJ at !If= Y).

632 RUI\tiNA~T ENEHGY AND NrfROGEK BALA!'\CE ~lODEL • Swift
By solving these equations appropriately, the time period(s) of the day during which the ambient temperature is less than FLCT can be determined. By then integrating the temperature function(s) during this period(s), the average temperature during the period of cold stress <:an be obtained. The cost of thermoregulation if the animal is fasting is then
CTR = [TCA · (\VTKG)O.T>] ·[(FLCT- A VCOLD)
where
CTR -
TCA -
"\VTKG -0.75 -
FLCT -
AVCOLD -
· (TCOLD /24)], (14)
cost of thermoregulation (kcal), thermal conductance (kcal· da y-l . c- 1 • kg--() •;:;)) body weight (kg), metabolic body-size exponent, fasting lower critical temperature (C), average tern perature during the period of cold stress (C),
TCOLD - length of period of cold stress (hr), and
24 - a constant (hr· day- 1).
Normally the animal is not fasting, so all or part of the cost of thermoregulation may be offset by the heat increment of feeding. It is assumed that ihe heat increment is bPing produced uniformly throughout the day, and only that portion produced during the period of cold stress is useful in offsetting thermoregulatory costs.
CTR = CTR- (CIII·TCOLD/2~1), (15)
where
CTR = cost of thermoregulation (kcal), and
CIII = heat increment (kcal).
CTR must then be constrained to be >·0.; that is, if the heat increment produced during the period of cold stress is greater than the thermoregulatory demand, the thermoregulatory demand must be set equal to zero.
Growth Requ.irement.-Thc requirement for growth of lean body mass is calculated as the difference between the animal's current lean body weight and its expected lean body weight (eq. 17).
GRDW = (E\V- CLB\V)f\VTOD, (16)
where
GRD\V = growth requirement (kg dry weight),
ElF - expected lean body \Veight (kg wet weight),
CLB\V - current lean body ,.veight (kg wet weight), and
\VTOD - a constant (kg wet W(:!ight· kg-1 dry weight).
This growth requirement is then constrained to be >0. and converted to kilocaloric units, assuming that each zram of lean body tissue (dry weight) contains 5.65 kilocalories.
The expected lean body size is calculated from a Brody growth curve (Brody 1945). The equation takes the form
E\V = l\.D\VT· (l. - ei-·125·(•\GE;SI'I.iJ), c17)
where
E\V - expected lean body wet weight (kg),
AD\l'T = maximum adult lean bodv .. \Vet weight (kg),
4.25 - a shape parameter (nondi-mcnsional),
AGE - current age (days), and SPL - maximum life span (days).
The parameters AD\FT and SPL are usN-supplied for each species. It should be emphasized that AD\VT represents a
]. Wild!. :--I:mage. 47(:3):1983
• ..

to be >'0.; incr~nt produced coldi~)Jvbss is greater latory demand, the
and must be set
ent.-The requirebody mass is cal
. nee between the an)Qdy vveight and its
ght (eq. 17).
.~B\'1.1)/VVTOD, (16)
·[
t• requirement (kg dry
Jean body weight weight), lean body weight weight), and
t (kg wet weight· weight).
t is then cond converted to kilo
that each gram of t) contains 5.65
body size is calcuwth curve (Brody
kes the form
:f j lJ.yl
~: id lean body wet "1.1(kg),
m adult lean body .. ght (kg),
parameter (nondial),
. age (days), and m life span (days).
\.VT and SPL are species. It should
· · DvVT represents a
~vlanage. 47(8):1983
1\UMINANT ENEHGY Al':D NrrnoGEN BAL:\l':CE IvlODEL • Swift 633
reasonable maximum expected weight for lean body mass, exclusive of fat stores, for a member of the population under consideration.
Ene1·gy Pm·titioning.-The energy pool (X8) consists of both nitrogenous and nonnitrogenous compounds. Because the production of lean body requires both types of compounds and because the 2 types of compounds are used for maintenance 0nergy with different eff:ciencies, it is im-~ortant to know how much of the energy in the pool is contributed by nitrogenous <.·ompounds. This can be readily calculat<'d because the state variable Xl8, amino acid N pool, contains the value for the amount of nitrogen in the form of amino acids included in the energy pool. Because each gram of nitrogen in protein or amino acids represents 34.2 kcal of energy \Forbes et al. 1928), the nitrogenous fraction of the energy pool is simply Xl8 multiplied by 34.2, and the non-nitrogC'nous portion calculated by difference.
The first energy cost to be satisfied is the maintenance requirement (busal metabolism + activity + thermon•gulalion). Energy for this purpose is drawn imm the non-nitrogenous portion of the pool \CNiVEP) if that component is largt• t•nough lo satisfy the requiremt'nt. If CNNEP is not large enough to satisfy the maintenance requirement, all of it is used for this purpose ttnd the nitrogenous portion (CNEP) is drawn on until the residual r<•quirement is met or until CNEP is exhausted. The use of CNEP for mainlt'nance proceeds with au efficiency of ·1--!.fJf( 1 Falter 1972, as cited in Koong and Luca~ I $J78). The remaining energy is lost as heat t:1:3.8%) or remains in the urea fornwd hy tlw necessary dcamlnation proc(~ss (21.8~(). Tlwreforc, to offset 1 unit of maintennnc:e n•quirc•ment. 1/0.449 units are lost from CSEP. By keeping track of thC' c.•twrgy drawn from CNEP and CN.NEP for
J. \ Yildl. Manaw'- -t7(:3l: 10,<:>:1
maintenance, the flow for X8 to X23 can be calculated
X8 to 23 = CNNEU + (0.449·CNEU), (18)
where
XB to 23 - maintenance requirement clra wn from cner(Tv pool o. (kcal),
CNNEU - non-nitrogenous energy lost in meeting maintenance requirement (kcal),
CNEU - nitrogenous energy lost in meeting maintenance re·~ ... uiremcn t (kcal), and
0.449 - efficiency of use of nitrogenous energy for this purpose (nondimensional).
If the total energy pool ( CN EP + CNNEP) is insufficient to meet the maintenance requirement, the energy pool is exhausted and any residual requirement must be met by the fat reserves. Should this occur, the flow from X11 to X23 is set equal to the energy in the fat used for this purpose.
This process is assumed to occur wiU· an cfficicncv of 10.0~E·. This assumption i. rC'asonable because the inefficiency of fat catabolism is contained implicitly in measured costs of basal metabolism. \Vhen basal metabolic costs are measured, the animal has been fasted and therefore is catabolizing its fat reserves for maintenance. Conseqm~ntly, the measured cost inelndes both the true t~ncrgy cost and the indfici<.>n('V associated with this catabolism. Anv ;naintc•mmc<' n•quircmt•nt to be met fro~1 fat in the mod<•l consists of the true n•quin'ment, plus tlw irwfficic•ncy incurred wh<'n tlw rC'quirC'nwnt is nwt from boch· rc'serves. Because the cost being nwt incl~tdes this inefficiency, no additional indficic•ncy should be' charged against tlw process. In olhC't "ords, WC' nn· in lerPstcd not in llw absolute or biochemical effi-
• ..

634 HVMINt\NT E>-:EHGY AND NITHOGEN BALANCE tdOPEL • Swift
ciency of this process, but rather the efficiency with which fat is used relative to the efficiency of substrate catabolism occurring at the time the measurement of basal metabolism was made. Because these measurements are routinely made on fasting animals catabolizing, largely, fat, the 2 substrates being compared are the same, so the relative efficiency is J 00%.
If the fat reserves are insufficient to meet the residual maintenance requirement, the fat reserves are exhausted and the remaining requiremC'nt is met by catabolizing lean body tissue. \Vhen lean body catabolizes, it yields nitrogenous and non-nitrogenous energy in the ratio 0.6944: 0.3056 (Falter 1972, as cited in Keong and Lucas 1973). The nitrogenous forms must then be deaminated to yield energy useful for maintenance. Again, this process is 44.9% efficient. Thus to yield z units of useful energy, y units of lean body must be catabolized and
z = 0.305G·y + (0.694 .. 1·0A49·y)
or
y = 1.6197 'z.
Thus, the flow from X12 lo X2.'3 is found by multiplying tlw maintenance n•quirc'ments remaining after exhaustion of the fat reSC'fVC'S by 1.6HJ7.
The sequence of events outlirH'd above-direct us<' of fat or lean hody for maintenance-occurs only under nutritional stress. \Vlwn nutrition is adequate, there is energy remaining in th<.' energy pool after the maintenance n'q uircment is satisfied. This ener!;y is then parlitimK.:l to lean body growth and to rc'nr <..Tetion of the fat stores. Lean body growth is assumed to have tlw higher priority and therefore occurs first. To build lean body, energy must be providcd from both Lhc nitrogenous and non-nitrog<'nous eompo-
nents of the energy pool, in the ratio 0.69L14:0.3056 (Falter 1972, as cited in Koong and Lucas 1973). \1\'ith a given growth requirement either (A) neither pool vvHl be exhausted when the requirement is mel, or (B) l pool or the other will be exhausted before the requirement is met. In case (A), after the requirement is met, any remaining CNEP deaminates to CNNEP with an efficiency of 44.9%, and all CNNEP is converted to fat at an efficiency of 100~~.
In case (B), either CNEP or CNNEP may limit lean body growth. If CNEP is exhausted then growth stops and the remaining CNNEP is converted to fat. If CNNEP is exhausted, growth need not stop. Deamination of part of the remaining CNEP to CNNEP will proceed at an efficiency of 44.9%. The augmented CNNEP pool ,.vill then combine as before with CNEP and growth continues. If sufficient CNEP exists to meet the growth requirement by this process, that requirement is met and any remaining CNEP cleaminates to CNNEP, which is converteel to fat. If CNEP is insufficient to meet the growth requirement by this process, an amount of CNEP deaminates that ""ill maximize lean body growth, i.e., CNNEP" and CNEP arc brought into the ratio 0.3056:0.6944 with an efficiency of 44.9%. Lean body growth tl1C'n procee-ds until the 2 pools are simultant'ously exhausted. In this instance, the lean body growth requirement is not completely satisfied and no fat is produced.
By keeping trad;: of the fate of the nitrogenous and non-nitrogenous pools after the maintenance requirement has been met, it is possible to calculate the flmvs from the energy pool (XS) to lean body (X12) and to fat rest'rves (Xll). The flow to l<.>an body (X8 to X12) is simply the l'nergy drawn from lhc enc'rgy pool for lean body growth.
J. \Vildl. :-.runagP. 47(:3):198:3
pool, in the ratio .· r l:f,as cited in ~J73):..1~'l/ith a given
either (A) neither when the require
~~ mol or the other will ;~ the requirement is
·· the requirement is deaminates to
ency of 44.9%, and ted to fat at an effi-
CNEP or CNNEP growth. If CNEP is h stops and the re-
:converted to fat. lf . • growth need not part of the remain
.: will proceed at an ' The at!gmented
combine as before continues. If sufmeet the growth ess, that require
remaining CNEP .iP, which is convert
f~ insufficient to meet ;('nt by this process, , that will
, i.e., CNNEP· · '1ght into the ratio
efficiency of 44.9%. ; •n proceeds until the .:<~ously exhausted. In ~
~in body growth re-::pletely satisfied and
· f the fate of the ni, :rogenous pools after wirement has been ·• , calculate the flows :J (X8) to lean body ~ves (Xll). The flow ·x12) is simply the ~he energy pool for
~11. iv1anage. 47(3);1983 '
•,
.,.
·~
' ;
H.llt-.II:-iANT E:-IEHGY A.:--.'D NIThOGEN BALANCE tv10DEL • Swift 635
The flow to the fat reserves is
XB to 11 = EUF- FTOE, (19)
where
XB to 11 - flow from X8 to Xll {kcal), EUF - energy drawn from the en
ergy pool for fattening· (kcal), and
FTOE - normal contribution of fat to the energy pool (kcal) (see eq. 10).
:"Jolc that this flow may be either positive or negative depending upon the relative nllues of EUF and FTOE. This represents either a net increase or decrease in the fat reserves.
Metabolic Fecal Energy (Flow from X12 to X15)
This flow is the energy analog of metabolic fecal nitrogen (flow Xll2 to Xll5) (sec eq. 29). Once metabolic fecal nitrogen has been calculated, this flow is calculated as
CA1FE = BNT01,IFN · (34.2/0.69-1-1), (20)
Ci\IFE = metabolic fecal energy lost (kcal),
BNTOA1FN = metabolic fecal nitrogen lmt (g),
34.2- a constant (kcal·g· 1 I\'), and
0.6944· - a constant representing the pr·.>portion of <'11-
ergy h the lean body that is nitrogenous (kcal· kcal- 1).
Energy Lost in Hair and Scurf (Flow fiom X12 to X13)
This flow is the energy analog of nitrogen lost in hair and scurf (flow X112 to X 113) (see eq. 30). Once the amount of ..
J \\'ildl. iv1anage. £!7(3):1983
nitrogen lost in hair and scurf has been calculated, this flc•w is calculated as
HSE = HSN·(34.2/0.6944), (21)
where
HSE - energy lost in hair and scurf (kcal), and
HSN - nitrogen lost jn hair and scurf (g) and the constants are the same as in eq. (20).
THE NITROGEN SUBMODEL
Ingested Nitrogen (Flow from X1 01 to X117)
Dietary N concentrations enter the model in much the same way as diet::ry digestibility values. If the ruminant model is operating as a stand-alone model, data on dietary N arc used. They are presented as a table of dietary N values (grams N per gram forage dry weight) observed or estimated on various elutes during the year.
If the ruminant model is operating as part of a larger model that includes ~im~ ulati.on of N content of forage ph1nts, dietary N concentration may be calculated. In eillwr case, total N intake is calculated as
CNIN = FORN·(FIN/CFK.C), (22)
where
CNIN PORN
FIN CFK.C
--
--
N ingested (g), dietary N concentrations (g· g-1), total forage intake (kcal), and a constant (kcal· g·-t forage dry weight).
Nitrogen Recycling
Huminants are able, under conditions of low N diets, to effect a substantial net recycling of nonprotein nitrogen (~PN) to the rumen (Houpt 1959). This NPN enters in the saliva and by osmosis across the ru-
• ..

1\n.tt:-.:A::--:T ENEHGY AND NITHOGEN BALANCE l'v10DEL • Swift
minal wall from the blood. Nitrogen entering the rumen in this fashion is readily available to the ruminal microflora for protein synthesis, and thus serves to maintain a favorable rumen environment in spite of low forage N concentrations. Hume et al. (1970) presented results of a study of N recycling in sheep. At low forage N levels there was a net gain to the rumen via recycling pathways, whereas at high forage N levels there was a net loss (more NPN was lost across the n. .ninal wall than was input in the saliva). From the data they presentC'd, I determined the amount of N recycled to the rumen (as a percent of ing(~sted N) for the various dietary N levels (%) they presented. HC'cycled N '"as 21% of ingested N when di-
t N 0 ,.. i ('~ 1,... ~ 1 0 (),.. ('T 0 ,.. C": e ary 1 \VaS .<J'-:ttO, I ;tO \\' 1Cn .v<J/c, .:J/o
when 1.82%, and -32% when 3.29%. The recycling rate (RNREC) for any dietary N level is found by linear interpolation within these data. N recycled is then calculated by multiply~ng the total N ingested ( CNIN) by this rate. Because the amount recycle;-:\ must not exceed the amount avaihhlc for recycling, it is constrained to be <Xl9, the 1\PN pool. The m"Pount of N recycled to or fron1 the rumen then becomes a factor in calculating the net £10\v from Xll7 (rurninal N) to Xl9 (NPN). Another controlling factor related to the biological value of microbial protein is considered below.
Nitrogen Digestion
In the model, the rate (but not the extent) of N digestion is coupled to the rate of energy digestion. That is, the proportion of rumina} N dig('Stcd at any time step is equal to the proportion of potentially digestible erwrgy digesl{'d during that time step. This simplificatim: does not affect the amount of dietary N made available to the animal, hut may !uwe a
minor effect upon the timing of that availability.
CNGON = CTPD·(Xll7)·(r.RD/X3), fr-;n)) \-''
where
CNGON - N apparently digested in rumen (g),
CTPD - true protein digestibili l r (an input parameter) (non dimensional),
Xll7 - total rumina! N (g), CRD - energy digested in rumt'Il
(kcal), and X3 - total potentially digestibk
energy in rumen (kcal).
This is based on the true protein digestibility (TPD) scheme, which calculate~ protein digestibility from forage protein ingc~sted and nondigcsted forage protein in the feces. This scheme will overpreclid N digestion because part of the i\ assumed to be digested by this scheme (that which does not appear in the feces as forage N)' leaves the rumen in microbial bodies that have a protein digestibility of lt>:-s than lOO~f. The fradion of microbial :\ not digested must be added to the forag<' N not digested to determine the total :\ escaping digestion. The amount of incligestible microbial N leaving the runwn can be estimated
C1\1IFN = (X21/6.25) ·[CPOUT
where
C~JIFN
X2l
CPOUT
· (l - C:\tiCD)], (2·1i
- N leaving rumen in microbial bodies that will not be• d igcstccl (g),
- microbial protein in rumen (g),
- a constant (g protein· g-1
~),
- fraction of microbial pro-
J. \Vildl. ~tanag<'. ·17{3): HJS:3
,. ·-'

timing of that a vail-
, I(~ . (Xll1?(CRD/X3),
(23)
ntly digested in n (g), protein digestibility input parameter) imcnsional),
rumina! N (g), digested in rumen
, and '·potentially digestible
in rumen (kcal).
~ true protein digest. e, which calculates
l
from forage protein forage protein
e will overpredict part of the N as-
by this scheme (that in the feces as for
en in microbial bodn digestibility of less tion of microbial N
• added to the forage ine the total N
amount of indiieaving the rumen
J6.25) ·[CPOUT 'L Cli1ICD)], (24)
rumen in micro~ '·JUl.A.H:i;:'l that will not be
1ted (g), rbial pro~ein in ru'l(g),
tant (g protein· g-1
of microbial pro-
J
lildl. Manage. 47(3):1983 1 ., '\ i
1 ·\
., >
~: '
--'
HUt-.lll'A:--.'T E?-:EHGY Al'D NITHOGE?-: BALAXCE !vlODEL • Stcift 637
tein to flow from rumen each DT (see below) (nondimensional), and
C~1ICD - microbial protein digestibility constant (nondimensional).
The actual amount of N cligcstcd is then
CNDIG = CNGON- Ci\fiFN (25)
where
CNDIG - N digested (g), CNCON - N apparently digested by
TPD scheme (g), and CA1IFN - microbial N escaping
digestion (g).
R-u.minal Nitrogen to .Amino Acid Pool (Flow from X117 to X18).-Thc biological value of protein is a measure of the efficiency with which absorbed proteins supply the amino acids required for synthesis of body protein Cvlaynarcl and Loosli H)62). In essence it represents the amount of correspondence between the amino acid pattern that has been absorb.:d and that which is currently required. Because animals have limited ability to store amino acids, thGse that are in excess are subject to cleamination.
In the model, this phenomenon is represented by flowing to the amino acid pool a proportion of the digested nitrogen lhat corresponds to the biological value of the protein (total N digested X biological value). The remainder flows to the nonprotein N (NPN) pool. Because the majority of N digested by the ruminant is from microbial rather than forage protein (Smith 1975), the appropriate constant for biological value ( CBV) is that associated with microbial protein.
Ruminal Nitrogen to NPN (FlozD from .\117 to XJ9).-Digested N that is deaminated clue to a biological value < 1.0 is
J. Wild!. Manage. 47(3):1983
transferred to the NPN pool. In addition, some N may be transferred from the rumen to the NPN pool or vice versa as a result of N recycling within the animal. This transfer must be accounted for when calculating the net flow of N from the rumen to the NPN pool. The total flow of N from the rumen to the NPN pool is the flow associated with biological value minus the N recycled from the NPN pool to the rumen (see above).
Rwninal Nitrogen to Fecal Nitrogen (Flow from X117 to Xll5).-Any N that leaves the rumen but is not digested, whether that N is in forage protein or in microbial protein, is transferred to fecal N. Undigested forage N is calculated using the rate of d3sappearance of forage N from the rumen and the true protein digestibility of the forage. The equation used is the complement of cq. (23). That is,
CFNI = (1.- CTPD)·(Xll7)·(CRD/XS), (26)
where
CFNI = foragl' N leaving the rumen but escaping digestion (g).
All the variables and parameters on the right-hand side of the equation are the same as those in eq. (23).
Vlicrobial N leaving the rumen and that \\· ~ cscftpc digestion (C~\JIFN) has been calculated in eq. (2-±). The total flow of N from the rumen to the feces is the sum of CFNI and C1\1IFN.
Amino Acid Pool to NPN (Flow from X18 to X19)
This flow is the sum of all cleaminalion processes that occur during the partitioning of the energy pool. Amino adds, which arc lhe nitrogt,nous components of the energy pool, may be dcarninated to provide carbon skeletons for 3 purposes during the
• ..

638 Hvr-.111'\A~T E:'\EHCY A='D NITHOC:EK B:\LM\CE ~ lODEL • Swift
energy partitioning process: (1) to meet part of the maintenance energy requirement, (2) to combine with remaining amino acids to produce lean body, and (3) i :>
be converted U fat. Having monitored the nitrogenous energy used in these ways, the model then calculates the N that must be converted to NP:N by dividing the energy value by 34.2, the average energy contc•nt of amino acids (kcal· g-1 N) (Forbes et al. 1928).
Amino Acid Pool to Lean Body (Flow from X18 to X112)
This flO\v depends, as did the preceding 1, upon the manipulation and partitioning of the energy pool. The amount of N transferred to lean body is found by converting the nitrogenous energy transferred to kan body to its 0J equivalent, as above.
Lean Body to NPN {Flow from X112 to X19)
This flow is the sum of :\ lost from the lean body by 2 processes: :\' lost as a result of catabolism of nitrogenous lean body tissue to meet maintenance <'1wrgy requirements, nncl <'ndogc'nous urinary N t.roduclion. In the modeL lean body is catabolized lo salisfy mailll<'IlHil<'<' energy only if the maintenance.' requirement <.'x
ceecls tlw amount of energy iu the cuerg.r pool plus the total energy in the fal reserves. This condition occurs in the model only following a protract(•d period of profound negative C'll<.'rgy balance. Should lean body energy he used for this purpose, the amount of body N lransf<•rrecl to ?'\P:\ as a consequence is calculated as
BNT(Ji'\TN = 0.6944 · BETO.\I E/:3~1.2, (27)
where
BNTOSPS - lean body ~ coll\'c'rl<'cl
to NPN as a result of maintenance catabolism (g),
0.69.:14 - proportion of le!ln body energy that is nitrogenous,
BETO'A1E - lean body energy used . to meet maintenance requirement (see seelion on energy parti-tioning), and ,
341.2 = a constant (kcal- g- 1 N).
The other process by which body N is lost to NPN is the production of endogenous urinary nitrogen (EUN). This loss is not directly related to ingested N, but rather results from the balance of normal construction and wastage of body tissues (~IcDonald et aL 1973). The amount of:\ lost from the lean body as EUN is predicted from mc'tabolic body size as su~g(•stccl by :.IcDonald ct al. (1973) and \laynarcl and Loosli (1962). The equation lS
E"CJN = CAE UN· (YVTKG)cm:t'.'', (2S)
where
EUN
CAE UN \VTI(G
CBEUN
-
-
--
endogenous urinary N production (g), a consta:1t (g ~ · kg--ni/D),
body wdghl (kg), aud rnC'labolic body siz<' exporwnt for predicting 1~( ·s (nonclimensional).
The total flow of -:\ from lean body lo NP;.J is then the sum of BNTONPX and EUN.
Metabolic Fecal Nitrogen (Flow from X112 to X115)
The nitrogen usually measured as met· abolic fecal nitrogen (?\1F.01) is not alllrul;. erHlog('I1fHIS in origin. That porlion thul l"
N lost from th<' gut as a result of font~'
.. •

NPN as a result of ; willl(•nancc catabo-'sm (QJ) roportwn of lean body
. wrgy that is nitrogeo:ms, an body energy used
· :> meet n1aintenance ,•quirement (see secbn on energy parti
-~ning), and : constant (kcal· g-1 N).
~ by which body N is )J'oduclion of endoge·n (EUN). This loss is
.! to ingested N, but ;he balanc~ of normal :tstage of body tissues
)73). The amount of N :j)ody as EUN is pre
li c body sizP. as sug-· :1c1 et al. (1973) and : {1062). The eqnation I
c
:;,Pnous urinary N pro-,.., (g),
·. tant (g N · kg-c:lllw,,·), ·,1 weight (kg), and · ·h)lic bodv size expo; for predicting EUN ;limcnsional).
\ from lean body to n of BNTONPN and
rogen o X115)
dly measured as met(MFN) is not all truly
1. That portion that is as a result of forage
:Jdl. ?\lanage. 47(3):1983
RUMINANT ENEHGY AXD NITROGEN BALANCE MODEL • Swift 639
digestion and the physical passage of forage (Niason 1969) is of endogenous origin. That portion that is N associated with undigested microbial bodies is not, and should not be charged as a loss to the animal because it is N that the animal never incorporated. The u.::ual equations predicti~g i\1FN from dry-matter intake (Agric. Res. Counc. 1965., i\kDonald <.'tal. 1973, Hobbins et al. 1974) predict N lost from both sources. Because this model estimates the amount of microbial N leaving the rumen, the predicted N lost as .MFN can be partitioned between endogenous and exogenous sources. The standard procedure for estimating i\·1FN (Agric. Res. Counc. 1 965) is to expect a constant loss of N per unit of dry-matter intake. In the model this is
CNIFN = (FIN/CFKC)·(C~IFNK), (29)
where
CA1FN = total n1C'labo1ic fecal N lost (g),
FIN = forage intake (see eq. 1) (kcal),
CFKC = a constant for energy in dry fornge (ken!· g· 1), and
where
IISN = N lost in hair and scurf (g), 0.02 - a constant (g·kg-07:t),
\¥TKG - body weight (kg), and 0.73 - metabolic body size expo
nent for predicting N lost in hair and scurf (no.Pdimensional).
This equation predicts a small, contii1uous, nearly constant rate of loss of N by this process for mature animals. For animals that show a pronounced seasonal molt, it would be a simple matter to reflect seasonal variatiou in the rate of loss provided the amount of hair molted is known.
Urinary Nitrogen Lost (Flow from X19 to X114)
Once the NPN pool size has been calculated (augmented by deamination and EUN and modified by the net recycling of N to or from the rumen), the entire pool is transferred to urlnary N.
RUMEN MICROBIAL PROTEIN SUBMODEL
CZ..1FNK = metabolic fecal N pro-duced per gram forage ingested (g· g-· 1) (an input parameter).
The amount of N drawn from lean body by this process (BNTOl\fFN) is found by subtracting the microbial component, CA1IFN (see eq. 24), from the total, CAJFN.
Nitrogen Lost in Hair and Scurf (Flow from X112 to X113)
This suhmr : ' is a simple representation of rumen .. dcrohial protdn synthesJs and microbial washout from the rumen. Its purpose is not to simulat(• rumen funetion at a high h~vel of resolution, but shuply to give reasonable estimates of fermentative capacity at various l'inws and under a variety of forage conditions. It is included hccause microbial biomass acts as a control on the rate at which forage is digested, which in turn controls voluntary intake by the grazing animal.
The amount of N lost in hmr and scurf is predicted from n1C'taholic body size using the equation presented by the Agricultural Research Council (1965). It is
HSN = 0.02· ('FTKG)07\ (30)
]. Wild}. Manag<>. 17(3):198:3
Rate of Microbial Protein Synthesis (Flow from X20 to X21)
The equation used to predict the rate uf microbial protein synthesis was developed from data presented by IIume
. ..

640 Hm.IIS.·\:\'T ENERGY AND ?\'"ITROGEN BALANCE l\LODEI.. • Swift
.... :r
250
200
150
~ 100 3:
50
0 0 0 c 0 0 0 0
0 8 8 B 0
8
0 (\
0 0
0
0 0
0
0 0
0 0
0 0
0 0 0 0 0 0 0 8
0
0
0 0 0
0
0 8 ()
0 0 0
0 .... 0
·~ 30 ~o /o s'o ub do 1&i rlo t4o 2io i>-'0<'~"1 0310 330350 10 30 50 70 90 1!0 130 150 170 190 210 230250 270290 3l0 3303 0 10 1978
1976 1977
JULIAN DAY
Fig. 2. Simulated total and lean body weight of an elk.
(1970a,/;), 11 umc and Bird (1970), nncl H ume et al. (1970). In tlwir study they reported rates of microbic.)! protein synthesis (g microbial protein synthesb~c·cl per 100 g d1·y maller digt•sl(.•d) on diets of differing N concentrations. They reported also the amount of NPN r<'eyclcd to tlw rumen on the different diets. By adding recycled N to forage N, I arrivc•d nt a total functional N conc·entration for ('ach diet and developed a n•gn•ssion c•qunlion pn·dicting rate of microbial protein synthesis. That ('quntion is
w lwre
u =
X=
!I= -11.7(1 + 14.0-Jx.
llli( rohiai prol<'in synllwsized per 100 g dry matter digestc•cl (g), aud cotH .. ·entrntion of?\ in the diet (for-age• +recycled) (~().
l\'ote that the equation has u negalin• in~ tercept and as a result preclids JH'gath t' rat('S of synthesis n t :::'\ concen tra lions below 0.84~; (prolt'ill COIH.'t'ulrations <5.2-Jf(). A plot of Lht- data indicatt•d thal the n•sponst' was liJH•ar at ~ cmtct'ntraUons > 1.w·~, hut that a diffc•n•nl equation
would be mon· approprialt' al conct•nll'~l· lions <1.6>-E. Consequently, I extrapolated from the ''al uc predicted at l.G% to the origin. I then use the equation above for N concentrations > 1.6%, but for concerJtrntions <1.6% the equation takes the form
u = 6.69x.
In the model, microbial protein syntlwsis is calculated as: the total N ent<.·rin~ the rumen (TN) is the sum of that enl<'ring in the forage and that recycled to tin· rumen. Tht• functional ~ concentration pf the diet is tlwn calculated as
COSCN = [TN/(171N/CFKC)]·l00 .. 1:11
w lwre
CONCN
TS FIN
CFKC
-
---
N concentration nf d:t • (('C),
total .:\ entering nlm<•n ·· c forage intake (kc·alL a constant for em•rt?;: :: dry forage' (kca1·g ll, .Ui·;
100. = a factor to conn·rt lo f"': cent.
The rate of microbial protcjn synlht·~l"' :• then calculated ns
. ..

Q
Q Q
Q 0 0
0
u'o 1~0 ISO do 1~0 2lo 2w 2~ 1978
1ropriat~ at concentra·]Uently, 1 extrapolated 'dieted at 1.6% to the
<' equation above for 1.6%, but for concc:nuation takes the form
: robial protein synthe-the total N entering
1IC sum of that enterd that recycled to the , tal N concentration of 1Ilatc'd as
. N/CFKC)]-100., (31)
>ncentration of diet
entering rumen (g), ' intake (kcal),
1stant for energy in Jrage (kcal· g-1), and or to con vert to per-
I protein synthesis is
dl. i\fanage. 47(3);198!3
H.U:-..tiNA~T EA'ERGY A;'\0 NITHOGEN BALi\A'CE i\fODEL • Sroift 6·11
SYNR = -11.76 + 14.0·J·(CONCN) (32)
for CONCN > 1.6 and
SYNR = 6.69·(CONCN) (33)
for CONCN < 1.6,
where
SYNR - microbial protein synthesized per 100 g dry matter digested (g·100 g- 1), and
CONCN = N concentration of diet (%).
The total synthesis of microbial protein is then calculated from this rate of synthesis and th~ predicted quantity of forage digested (see eq. 7).
Rate of Microbial Washout from Rumen (Flow from X21 to X22)
It is assumed that the washout of microbes from the rumen is a passive process. A constant proportion ( CPOUT) of the microbial protein is thus removed from the rumen each day. The pan.1nwter CPOUT was dc>rivccl from initial F odd runs. Its value has been S('t so that n!icrobial synthesis and washout are apprm:imately balanced on an annual basis.
AN EXAMPLE SIMULATION
Simulated changes in lean body \Vcight and total \veight for an elk in Hocky ~vlountain National Park, Colorado are shown in Fig. 2. The simulated animal cnten•cl Hs lst winter at the beginning of lht' mock·l run (Nov ] 976) and was assigned an age of IGO days and a weight of 87 kg (Dean et al. 1976)~ of which 10 kg was fat (Flook 1970).
Data on dietary digestibility and crude protein used to drive the model (Fig. :3) arc from Hobbs ct al. (1981) and from Baker and H.obbs (EJ82). All dahl are for animals of an age corresponding to tlw .. t
J. \Vildl. .t-..1an:1ge. 47(;3); 19S:3
of the simulated animal. Data \vere not available for the spring periods (Mar-Jun), therefore I assumed that animals would select diets of high quality by the end of April and I have inserted digestibility and protein values equal to the early-summer values at those points. Constants and parameters used in this simulation are shown in Table 1.
Because we do not have information on weight changes of elk consuming these diets we cannot consider this model to be critically validated, hmvever the results are generally satisfying. The patterns of growth and \Veight loss simulated here correspond closely to measured patterns for elk (Gates 1980). Likewise, the better performance during the 1st as compared to the 2nd wintc'r agrees with results presented by \Vood et al. (1962) and l\·1cEwan (1968) for black-tailed deer (Odocoileus hemionus) and caribou (Bangifer tarandus). Peak summer weights of 210 kg for a yearling and 255 kg for a 2-yearold appear reasonable (Dean ct al. 1976, Gates 1980). The L19-kg weight loss during the 2nd winter (a loss of 23% of total body weight) is substantial, but probably docs nc,t n•pn·sent a Iife-thrratening situation (dr'Calesta et al. 1975, 1977).
DISCUSSfON
This model has been used in a variety of \\'Hys. During the study of the nutritional ecology of wintering elk, the model was used first as a n:•search planning tool (Swift et al. 1979) and then as a data interpretation tool (I Iobbs 1979). In the lst role, the model specified lhc data that needed to be collected. ln the 2nd, it assisted in analysis hy permilling ~'stimation of the biological significance of differ('nces in elk diets observed for different habitat types.
As a component of a grassland ecosystem simulation model, it has been used to
.• . ' ' . ~ ·.·
• •

642 RUl\1INANT ENERGY A:-\'D NITROGEN BALANCE MODEL • Swift
16
14
12
z iJ IG t-o a: a.. w § 8 0:: u
r---q I \ I \ I \ I \ I \ I \ I \ I \ I \ I ' I I I I I \ I \ I \ I \ I \ I \ I \
6 if A, v----« I
', I ~ ~-~-~ ~~
4
"0----o.
0.65
0.60
0.55
< 0 !: 0
0.45
0.40
0.35
0 t Nov' Dec I Jan 1Feb 1Mar
1Apr
1May
1Jun
1Jul
1Aug
1Sep 'oct 1
Nov1Dec IJan
1Feb 1Mar 1Apr 1May1Jun
1Jul
1Aug 'sel '
0
1976 1977 1978
CALENDER DATES
Fig. 3. Dietary crude protein (Q-- -o) and in vitro dry-matter digestibility (e-----8) values used as input for the examp'e simulation of elk energy and n!trogen balance.
assess the effect <if different strip-mine reclamation practices on the condition of cattle and pronghorn. In that study (Parton et al. 1979), model results indicated that although variety of reclamation techniques resulted in the development of similar and adequate levels of primary productivity, there were large differences in the level of secondary productivity supported due to the inherent diff<'rences in quality of alternative forage plants.
The model has abo been used to estimate the energy am: nitrogen requirements of wintering elk a:1d mule deer and to compare the relative importance of certain dietary and en\'ironmentnl factors to their winter survi\'al (Switt et al. 1980).
Such comparisons provide useful informuti--.a both for researchers and for managers of big game populations.
By n•moving the voluntary intake por· tion of the model, and driving it with different levels of intake, the model was ust•<l to L·stablish feeding levels for mule d<·<·r in\'olvcd in experiments on the relationship between winter nutritional l{'\'<'l nml the mobilization of endogenous r<'S<'n'(''
for maintenance (Torhil et al. 1 }JS·!' The intak<' levels specified in this way n·· ·~ul ted in the desired rate of weigh l lo.,, for 3 treatment groups.
(vly expc :ence wilh the model imhcat<'s that it is more useful as a tool to com pare the likely results of alter nat i \ <'
J. \Yildl. ~lanage. ·17(3';: UJ!..,.~
• •
-,"

·:"'.·~-c.r~~~~~""J--'"""":.<::.f---'r'--r·:r....._
--q r0.65 'Q . ' '
' 'j
~ 0.60 \ \ \ \ \ 0.55 \
< 0 :s:: 0
0.45
0.40
0.35
as input for tho. example
useful inferand for man
Uons. 1tary intake porving it with difmodel was used for mule deer
on the relationtiona! level and
lgenous reserves · t et al. 1984). d in this way re<' of weight loss
he model imliul as a tool to
of alternative
ianage. 47(3):1983
r~
' '·
,, ..
' ·,
,, ,. "
j; •.I
'
•
)~
~-: '-
1\Ul\HN:\NT ENEHGY AND 1'\THOGEN BALANCE MODEL • Su.:ift 648
dietary regimes, revegetation practices, stress periods, etc. than as an absolute predictor of condition changes in a specific circumstance. This follows from the large number of parameters in the model and the fact that there is experimental error associated with each of them. \Vhen used in the former way, the model has proven to aid understanding by permitting the user to trace through model output and discover the sequence of events that led to the results being com parceL
The model has shortcomings. The addition of a routine to simulate the physiology of reproduction and lactation would broaden its appHcability and link nutrition to population dynamics.
Although all the processes represented are, perforce, simplifications, some may be intolerably simplified. Chief among these are the way in which energy is allocated to lean body and fat and the way in which these 2 components are drawn upon during periods of negative energy balance. Recent work indicates that my representation of these processes is oversimplified, both during the anabolic (Verme and Ozoga 1980) and catabolic (Torbit et aL 1984) phases.
Although model expansion and rcfim'ment will continue, il is presented at this time because it has reached a useful level of development. In the simulation run described here, the mod(•} was able to integrate a considerable quantity of ]nformation on general ruminant physiology with specific information on (•Jk physiology and diet quality to produce a result that responds much as an t>lk would I)(' expected to respond. This suggests that tlw data used to build and to drive the model are accurate and dependable descriptors of the processes involved and that the structure of the model caplun.•s the <'S
sence of the relationship between the grazing animal and its environment. This
J. \Vildl. :\Ianagt'. 47{:1):19S:3
is encouraging. This model is, after all, a literature-based fabric of hypotheses describing the way in vvhich digest!ve and metabolic processes occur and are controlled in a ruminant. If these hypotheses and the experimentally determined parameters relating to them, cannot be logically combined in a mathemu.tical construct that behaves like the animal of interest, this would indicate substantial· error in either our theoretical or empirical information. The fact that this model performs with reasonable success substantiates the field and laboratory results used in its construction. Hopefully, this and similar models can help to bring basic scientific information to hear on applied management problems.
LITERATURE CITED
AGHIC:l:LTl"HAL HESEARCH COC:\Cil.. H)6.5. The nutrk•nt rl"quin•meuts of farm livt'slock. 2. Runtiuanls. Tech. H<•v., Agric. Ht•s. Counc., London, U.K. 26-!pi).
IhKEH, D. L., A:\D X T. Honns. lfJ.I32. Cmnposilinn and qualtly of t>lk summer diets in Colorado. J. Wild!. =-.ianage. ·1fi:G9·1-703.
BL:\XTEH, K. L., Ai\"D J. L. CLAPPERTO:\. 1965. Prediction of tht• amount of methane produ~:.·<•d Ly ruminants. Br. J. l'\utr. 19:511-522.
BnonY, S. HJ-45. Biot•twrgelies nnd growth. Hl'inhold Publ. Co., :--;,.w York, ~. Y. l02:3pp.
CA!'.IPLI:-:<:, H. C., ::-.1. FHEEH, A:-\D C. C. B:\I.C:II.
l $JfH. Faetors affeeling tlw voluntary intakt• of food hy t·ows. 2. Tllt' n•lationship b<'lween tlw Yolunlary intake of roughag<'S, tlw amount of digc•sta in tlw n•lieulorunwn and thP ratt> of disappearuuc(~ of di~esla from lhP aiinwnlary tract. Br. J. :\ntr. 15:531-.53.5.
CocK, L. :-, 1., B. H. POCI.TO:--', W. l I. !IOO\"l·:n. A:'\D P. II. K:\0\\'I,TO:\. WG7. Dit'lary nitrogt>n t•fft>l'l 011 ruminant heal iucn•nwut. J Anim. Sci. :2G:S·1.'5-H-!8.
CH.\Ic:m::\n, J. ]., F. C. CH:\H;m~,\D, It L. Hl"FF, A:\D
B. \\'. O'C:\lt\. 1!:)7:3. IIonw ranges and at'lh·ily pall,•rns of nonmigratory l'lk of lh<' =-.tadison drai!lage lll•rd as dt•lc•rmint•d hy hiol('h•nwtry. Wild!. ;'\lono~r. ;'3:3. ,)Opp.
DE:\;-..", H. E., E. T, TIIOH:\E, A:\D I. J. Y<mc;,,so:-;. 10/(i. \Vc·ights of Hot'k)' ~lounlain elk.]. :-.hunmal. ;)7: l S(i-1 H~J.
DI~CAI.ESTA, D. S., ]. (;. :\':\c;r, .-\:\D ]. :\. BAILEY. 197;3. Starving and n•fpc•ding muiP dt•t•r. ] . Wildl. :-.tuHagt•. :3\1:()():3-()(i!J.

•
644 Ru~uKAJ'\T E:-mncY Ai':D I'\JTHOGEN BALA:'\CE 1\loDEL • Swift
---, , AND • 1977. ExpNim<•nts on starvation and rrcovery of mule deer does. J. \Vildl. !vlanage. 41:81-86.
DETLJ:-.:G, J. K., \V. J. PAl\TON, AND H. W. Hl'NT. 1979. A simulation model of Boutcloua gracilis biomass dvnmnics on the North American shortgrass prai;ie. Ot-cologia 38:167-191.
ELLIOT, H. C., AND K. FOKKE:\1:\. l9G0. Protein digestibility rdationships in ruminants. Hbodesia Agric. J. 57:!301-304.
ELLIS, ]. E., J. A. \\'lENS, C. F. HODELL, AND }. C. :\NWA Y. 197G. :\ conceptual rnodt>l of dkt selection as an t'cosyst<'m process. J. Theon•t. Bioi. 60:93-108.
F:\LTEH, K. II. 1972. A math(•matical model for the energy and protein metabolism of homeotherrns. lnsl. Stat. ~linwo Ser. IH3, ?\.C. State Univ., H:.tl<'igh.
FLATT, \\'. P., H. G. WAHNEH, AND c. H. GHIPI'IN. :')55. ln vivo retit'ulo-runwn volumes of Y''lmg dairy calv<•s us affee!t•d by age and diel. J. :\nim. Sci. 14:1202.
FLOOK, P. H. W70. :\ stlltlv of S<'X differ<'nlial in the survival of wapiti. C:::m. Wildt. Sen·. Ht>p. Ser. ll. 7lpp.
FOH131:S, E. B., \\'. W. BH.\!\fAN, :-.1. KniSS, C. D. jEFFIIIES, H. \\'. Swurr, H. B. FIIE:-\'C!l, H. C. ;-,tn.LEH, .\:-\'D C. \'. S\1\'TIIE. HJ:?.S. Tlw t•nprgy nwlabolism of cullle in n•lation to llw phuw of nutrition. J :\grie. Hes. :3'i:2.?3-:300.
GAHH1~1T, \\' . .:--:., AND .:--:. liiN:\1-\N. l$Jfjg. H('-t'\':11-
llalion of tlw r(•lalionship l><'hn't'll carcass d('n-5ily and hody composition of ll<'<'f slt•<•rs. J. :\nim. Sci. 28:31-:1;).
GATES, C. C. HJ!j(), Pnltl'J n~ < f bdt<i\'im:r and pt•rformant~e of ,,·,tpili (Cerws claplw.\ nclso11ii) in tht• bon•al mixed wood fon·~l. Ph.D. Diss., (' nh., AlhNla, Edmonton. 17;'5pp.
---, AND H. S. 1It'DSON. Hl7H. Efft·cls of post un• antl aelivily on nwtaholk t'l'Sponsl's of wapiti lo cold. J. Wild!. :-.tanage. -!3:5()-J-5()7.
liAHI'EH, II.:\., V. W. HoD\\'El.L, AND J'. :\. :-.L\YES. H)77. Ht>\'iew of pl1ysiolop;kal dwmislry. 1 ()lh t•d. Lange• :-.kd. Publ., Los Altos, C,1lif. ()f>lpp.
HENDEHJC:KX, I I. K. 1971). QuantitaliY<' al'pt•t•l:; of lh(' usc• of non-prntc·in nitrogen in ruminant fet•dill~. Cuban J. Agrk. SC'i. 10:1-lh.
HoBBS,:\. T. HJ7H. \\'inter dit•t qualilv aud nutritional ~talus of t•lk in til(' tlJlJ>l'l' monlmw zorw, Colorado. Ph.D. Diss., Colo. StalC' l'niY., Fori ( :olliw •. 1:31 pp.
---, D. L. lt\KEH, J. E. Er.us, .\:\D D. \1. SWIFT.
HUH. Composition and quality of c•lk wint<'f diets ln Colorado. J. Wild). :-.lanugc•. -43: 13£)-171.
lTOt'I'T. T. n. H).-.m. t"lilizalion of hlood IIT<'a ill ruminauts. :\rn. J. I'hy~iol HJ7:1 10-1:20.
H'..":\IE, I. D. HJ70a. Syutlwsi~ nf mkrobial protein in tlw I'lllllt'll. 11. A n·~potN' to hight·r \'nblih• fatly at'icb. :\nst. ]. :\gri<.-. Ht•s. 2U!H7 .. :30.J.
--- H170h Syntlwsis of mh'robial prolt•in in
the rumen. III. The effect of dietary protc·in Aust. J. Agric. Hes. 21:305-314.
---, A;-.;o P. H. Bmo. 1970. Svnlhesis of mien~ bial protein in the rumen. IY: The influenct• uC the level and form of clif'tary sulphur. Aust. J Agric. Hcs. 21:315-322.
---, H. J. ~rom, AND M. So~nms. 1970. S) n· thesis of microbial prott•in in the rumen. I. J n· lluence of tll<' level of nitrogen intake. Amt. J
'Agric. Rf•s. 21:283~296. JONES, G. ~t. 1972. Chemical factors and tllt'ir n··
lalion to fet>d intak<• l'(·gulation in ntminanl~ .1
revi<•w. Can. J. Anim. Sci. 52:207~:!:?.3. KOO!'\G, L. J., A:-\V H. L. LeCAS. 1973. A malht•
matical model for llw joint metabolism of nittn gPn anrl enNgy. Inst. Stat. !\lim eo Ser. ~8::!. :..; ( State Gniv., H.uleigh. 11 Gpp.
:i\1:\LOIY, G. ~t 0., H . .:--:. B. K:\ Y, A~D E. D. GooD.\1 1 1970. Dig<•slion and nitrogen metabolism n sll('<'P and red det•r gin•n large or small amnm•t' of watN and prot<•in. Fr. J. :\uti'. 2·t:S-l:3-~:5:l
:.1:\SO:"', V. C. HJG9. Some ohst•rvations on tlw d:~ trihution and origiu of nilrogl'tl in sht'{'P fat•tt•• J. Agric. Sci. 73:~)9-11 L
~1.\l!TZ, \V. \\'., II. SII.\'EH, :\~1) H. H. lL\ YFS. l c,-;.i Estimating nwtham.>, urine• and lwal im·n•nwr.: for dt•t.•r consuming brows<·. J. \Vildl. :-.latt.l".~~· ~U:S0-8().
:-.IAY!'\AHD, J. :\., AXJJ J. K. Loos1:1. H)():!. :\nim.t~ nntrilion. 5th t•(L ~k(;ra w-I Jill Bonk Co., ....,- .. ,. York, ~.Y. 33:3pp.
!\.lcDoNALD, P.. H. A. ED\\',\HDS, A:-.:D J. F. n GHEl·::-.:liAI.Gll. 197:3. Animal nutrition. 2nd l"~ Haftwr Puhl. Co., ='<'w York, X. Y. -17Upp.
.:-.tcEwA:-:, E. H. HJGH. Growth and dt'Yelopmt·t..! of the barr<·n-ground cnrihott. II. Po~lll<~l·l~ growth ralt•s. Can J. Zonl. ·Hl:I0:?.:3-10:20.
;-.!om, H. J., ,\:\I> L. E. IL\HH!S. HJCi2. lhnnitwl f!n:~ sludit•s in Ow shet•p. X. Influence of nilrn:.:•" inlakP upon nuninnl funelion. J. ~·utr. 17 ::!"-~ 29H.
:.Io:-.:T<:o:-.11-:1\Y, :-.1. ]., AXD B. H. BAt::\tC::\HDT. )!Jt).",
H<•gulation of food intake in mminant!.. 1. f'r•: leted ralwns varying in t•twrgy t'otlCt'lllraticm J Dairv Sci. .JJi:5GH-:57·1.
PAHTO;-.;, \\'. J., A:-.:D j. :\. Loc:,\:-\'. HJBl. :\ rnodr~ for diurnal variation in soil and air lc·mpc•ratun Agric. ).kteorol. 2:3:203-21().
---. J. E. ELLIS, :\:\D D. \1. S\\'IF'l'. lU7fJ. lk imp;~els of strip minl' n·elarnalion pradic t'' ..,
simulation study. Pagc·s 3B·l-.)~Jl in :-.1. K \\ .1l:
l'cl. Ecology and coal tT~mtrt't' dt•v<'lopnwnl )',·~ gamon Pn•ss, Xc•w York, :-\.Y.
HrcE, H. \\'., J. C. :-.IoHHJS, B. T. :-.1 "D.\, .\:\ll H I B\LD\\'1:-\'. H)7·L Simulation of animal fuw· lions in tn()(h·l~ of produ(·:, 111 ~v~t<·m!>~ J"lllllill.ll•'•
Ol! the rang('. F(•d. Prot·. :3:3;Ih,<j- HJ.). Hol!lll';~. C. T.', H. L. PHIOH, A. :\. i\10I·:N, :\\.ll \\
J. \ "tsEK. l!J7·1. ='ilrngt•n nwtaholism Df whi!t• tuilc•d cltw. ]. Anim. Sd. ;).lj:J.')(i-HJI.
]. \\'ildl. ~lanagt>. -J7(:3):HJ'1~i
..

. . . ... ·.·. ':, ·... . -. ·... . _.· 'f1 •' • q • '
· effect of dieta.t·y protein. 1{'''')314. i . .J: Synthesis of micro·
.1men. IV. The influence of lf dietary sulphur. Aust. J. 22. • M. SOl\lEHS, 1970. Synrotein in the rumen. I. In)f nitrogen intake. Aust. j. )G. •mica! factors and their rercgulation i11 ruminants: a . Sd. 52:207-239. LUCAS. 1978. A mathe-
• _joint meh1bolism of nilro-1\Hmeo Ser. 882, N.C.
ll6pp. KAY, :\;xn K D. GooDAlL. I nitrogPn metabolism in ven large or small amounts Br. J. Nutr. 24:843-835.
1e obserYations on th£• disf nitrogen in shePp fue~.:es. 1.
, •\:>-.'D H. H. IlA YES. 1975. urine: and heat inerement •r0wse. J. \Vildi. ~Ianage.
. Loosu. 1962. Animal ~raw-HHI Book Co., New
:owAnDs, 1\XD J. F. v. Animal nutrition 2nd t'd. v York, N.Y. ·1'i9pp. ;rO\vth and d('V<'I<lpment :1 caribou. II. Postnatal ;(>OJ. 46:] 023-1029. HIS. 1962. Ruminalflora X. Influent'e of nitrogen unction. J. Nutr. 77:285-
!3. R. BAUMGAHDT. 1965. ::~.kl• in ruminani.:i. 1. P(·l-1 eonergy concentration. J.
LOGAN. 1981. A rr.ouel soil and air temperature. )-216. '· ?vf. S\\'lFT. 1979. The reocium~tion pra.ctict>s: ~~ : 58°1-591 in M. K. \Vali, ;ourc<:' devl'lopment. Pl'rk, N.Y. n. T. ~1AED1\, AND n. r.. nlalion of animal funelclion systems: ruminants ~. 3:3:188-195. fl, A. N. 1\IOEN, AND \Y. ;('ll metabolism of whitt•i. 38:1136-HJL
1. ~~anage. 47(3):190:3
~· ,.
H..u~nNANT E:-.:rmGY M\D 1\ITHOCEN BALA!\'CE i\fODEL • Swift 645
S.-\LTER, D. N., AND H. H. 5:-.IITII. 1977. Digestihililies r,f nitrog<'n <·omp,~unds in nmwn hac·tcria and in otht·r compmwnts of digesta in the small intestine of the young stt•t•r. Br. J. Nulr. 38:207 -2.1G.
SCIIOENHEIMER, R. 19-12. The dynamic stale of body constituents. Hafn(•r Publ. Co., New York, N.Y. 78pp.
ScmV,\l\1~l, C. C., J, G. NAGY, AND H. \V. H.t<.l~. 1977. Pronghorn dietary quality relative to forage avai1ability and otlwr ruminants in Colo· rado. ]. Wild!. i\lanage. 4l:Hil-1G9.
Sc!lwAnr, II. 1\f., A:'I:D F. ?-.1 C. CJLCIIIWiT. Hl75. t-.1k ,>b:al interactions with the diet and the host ammal. Page's 1()5-180 in I. \V. ~lcDonuld and A. C. I. \Varner, <'ds. Di;_ "stion and metabolism in the ruminant. Univ . .:-.:ew England Puhl. Unit, Armida!<\ N.S.W., Ausl.
SIIOHT, H. L. 19G·L Postnatal slomadt dt•vC'lopment of white-tailed d~·er. J. \Vildl. ?\lanage. 2S: 445-458.
!-il\lPSON, A. i\1. 1976. A study nf tlw t•uerp;y metabolism and St'aSonal eyclt•s of capliv<' n·d d<•(•r. Univ. AbPrdeen. Scotland. 18Dpp.
!->".liTH, H.. li. 1975. 1'\itrogen m(•tabolism in the rumen and the composition and nutrilive value of nitrogen compounds entt"ring the duoclt•num. Pages 390--115 in I. W. ;-.IcDonalcl and A. C. I. \Varner, eds. Digestion and metabolism in lht• ruminant. Univ. New England Pub!. 1.'nil, Armiclalc. ;.,.·.s.w .. Aust.
':iTHEI~T. J. C .• J. E. lkTcnr-:n, A~D L. E. l!An.ns. 19fi3. Estimating urint• t'tWt'gy {c:nllle. she<•p) from uriJH' nilrog(•n. J. Anim. Sd. 22:8·17.
SWIFT, D. 1\1., J. E. ELLIS, A~D N. T. HOBBS. Hl7fJ. Application of a ruminant ('tWn:;Nics model to a study of elk winter range carrying c.•apal'ily. Puges 457-..lGO in R. l\L Linn, ed. Proc. 1st Conf. Sci. Res. Natl. Parks. VoL l. U.S. DPp. Intt•r., Washington, D.C.
, , A~D • l9HO. Nilroben aud energy rPquirenwnts of l\orlh Anwrican c.·ervids
J Wildl. iv1anag('. 47(:1): HJS:3
in winter-A simulation study. Pages 244-251 in E. H.<'inNs, E. Gaan>, and S. Skj('lllH'herg, rds. Proc. 2nd Int. H.eindeer and Caribou Symp. H0-rns, Norway.
Tuo:-.JPSON, C. G.,]. B. Hor:mn, H. H. HAYES, H. SILVEH, AND W. E. UHBA;-,1, Jn. 1973. Nutrition of white-tailed deer. T. Energy requirements of fa·,ns. j. Wild!. Manage. 37:301-311.
Tonnrr, S. C., L. H. CAJU'l~NTEH, D. ~t S\-'I'IFT, AND A. W. ALLDHEDCE. 1 )84. \Vinter dynamics of mule deer body composition. J. \Vildl. Manage. 48: In review .
ULY:\TT, !vi. .1\I. 1973. The fec•ding value of herb· ag('. Pages l31-17S in G. W. Butler and R. \V. Bailey, C'ds. Clwmistry and biochemistry of herbage. Vol. 2. Acadt•mic Press, New York, N.Y.
VAN GYLSW¥K, N. 0. 197!>. The effeet of supplementing a low-protein hav on the cellulolytie bactcria in the rumen of slu'ep and on the digestibility of t:ellulose and hemicellulose. J. Agric. Sci. Camb. 74:169-180.
\':\-:-: SOEST, P. ]. 1967. Dev,·lopm<'nt of n compreh(•nsiw ::yslem of feN] analyses and its application to forages. J. Anim. Sci. :!6:119-128.
YEn:-.m, L. J., AXD J. J. 0ZDG:\. 1980. Effects of diet on gro\\'th and lipog('nesis in deer fawns. J. Wild!. ;-.Ianagc. 44:315-324.
WAXG, J., A~D H. X Pnmsox, ]H. HJ7Ci. Disparate hydration of adipose and k•an tissue require a nc•w model for body water distribution in man. J. I'\ulr. 10G:l6&7-IG93.
\VESLEY, D. E. 1971. Energy and water flux in pronghom. Ph.D. Diss., Colo. Slat(' Vni\'., Fort Collins. 84 pp.
WooD, A. J., l. I\1. CO\\',\X, A~D II. C. l'\QIUJAN. 1062. Periodicity ()f growth in ungulatl'S as shown by de~·r of tht· g(•nus Odocoilt•w;. Can. j. Zoo!. ·10:59:3-603.
Bc•~!'it:ed 1/ September 1981. Accepted 7 September 1.982.

nces affecting individual taxa. An wse ca" 1.pd, in effect, "the con·
:<;entia' Jfective rare plant con. This~ fills this need and <.lis· nt subject in depth. ,Nl from a meeting of botanists :1rl<.l at Kings College, Cambridge, U>O. The 42 chapters are divided dions: Survey and Assessment of ,,d Species, Tropical Forests-The Tily, Understanding Rarity and 'lant Populations, Ecological Stud' I nlrod uction and He in lrod ucl ion, as for Plant Conservation. Som(' it'neral principles and approacht's ·vation, others deal with programs •s, and still others address prott•cwstems or taxa. ;,;s a wealth of information valucnd conservationists. Unlike manv ;ntific meetings that result in dr;· ~1ts is remarkably interesting and iod it impossible to skim, as ca<.'l1 new insights into the problem and ; plant conservation, specific infor~.mclusions of a multitude of an,J]uC'print emerges, but thC' s0rious II gain a much better understnnclmservation from the scientists who ; volume. Rare Plants cannot lw h·-it should be studied carefulk ·a wide range of professionals i;l>ortant problem: scientists, consermag:crs, and politicians, Although ~nitten and edited, the scientific ~·s will discourage svmf.' \vho should \·m could have been O\'t>rcome in fS included a glossary of the mor(•
1. hardbound COiJY is prohibitiv<·ly ,don on its appearing on many pri'However, the procpecJs from sah•s
good cause: to support studies of . promote their conservation. Tlw '~ is unfortunate because wide dis~ ;ii1portant book is definitely desir·
.}'\spccts of Rare Plant Conserr:a·1ortanl general concepts and sp<• :s wt·ll written and well presl.'nlt•(i, ·:1d welcoh1C addition to the field.;i£cological Directions Internation'11ale, ~ID 20737.
J. 'Wild!. Manage. 47{3):HJS:3
CONTENTS (Continued from inside front cover)
FALL MIGRATION AND MORTALITY OF 11\!TERLAKE, MANITOBA SANDHILL CRANES fN . NORTH DAKOTA ... ; .... · •..•....... ; ...... Scott M. tylelvin and Stanley A. Tempa
Short Communicqtions . . ,.
FALL MIGRATION OF SANDHILL CRANES IN WEST CENTRAL NORTH DAKOTA •••. , ~ .....•......•..•.... · ...•............... Martha J. Carlisle and Thomas c. Tveha
BENTHIC SAMPLING FOR WATERFOWL FOODS IN EMERGENT VEGETATION ••••••• . . . . . . . . . . . . . . . . . • . . . . . . . . . . . . . . . . . . . • . . . . . • . . . . • . . • . . George A. S\vanson
RELATIONSHIPS BETWEEN CORNFIELD CHARACTERISTICS AND BLACKBIRD DAMAGE .•.•..•...•.........•.•...... William T. Bridgeland and James W. Caslick
EFFECTS OF HEAVY BROWSING ON A BIRD COMMUNITY IN DECIDUOUS FOREST ..• ....•..•......•..•...•.••.•...•.•...•..•........• Daniel Casey and Dale Hein
RESPONSES OF BIRDS AND DEER MICE TO PRESCRIBED BURNING IN PONDEROSA PINE ....•.••.......•....•......•.•••.......... Carl E. Bock aPd Jane H; Bock
COMPARISON OF PITFALL AND CONVENTIONAL TRAPS FOR SAMPLING SMALL MAM- . MAL POPULATIONS ................•.... Daniel F. Williams and Suzanne E. Braun
EYE LENS WEIGHT AS A CRITERION FOR AGE CLASSIFICATION OF WILD WOODCHUCKS ....••.....•...•..•............ Jacques Nuckle and Jean-Marie Bergeron
CHEWING-REMOVAL OF RADIO COLLARS BY GRAY WOLVES IN WISCONSIN ....... . ........•.•..•.....•........•....•........ Richard P. Thiel and Steven H. Fritts
AVOIDANCE OF COYOTES BY RED FOX FAMILIES . . Dennis R. Voigt and Bany D. Earle
LOCATING PUP-AE' '.RING DENS OF RED FOXES WITH RADIO-EQUIPPED WOODCHUCKS . . . • . . . . . . . • . . . . . • . . . . . . . . . . . . . . . . . . Dennis R. Voigt and Jim Broadfoot
COMPARISON OF RED FOX LITTER SIZES DETERMINE!) FBOM COUNTS OF EMBRYOS AND PLACENTAL SCARS .•..... , ..........•....•.....•.•...•. Stephen H. Allen
EVALUATION OF HUMANE TRAPS: MOMENTUM THRESHOLDS FOR FOUR FURBEARERS •.....•.••. Samuel Zelin, Jan C. Jofriet, Kent Percival, and David J. Abdinoor
A NEW ATTACHMENT DEVICE FOR RADIO-TAGGING LARGE WHALES ......•• : ... . • . • . . . • • • . Bruce R. Mate, James T. Harvey, Lawrence Hobbs, and Romaine Maief~.
ABILITY OF DIFFERENT RUMEN INOCULA TO DIGEST RANGE FORAGES ...•....•... .••.........•...•••..•... Bruce L Welch, Jordan C. Pederson, and Warren P. Clary
DIGESTION AND FRAGMENTATION: INFLUENCE ON HERBIVORE DIET ANALYSIS .... . . . • • . . • • . • . • . . . . • . • . . . . . • Mark 1<. Johnson, Helen Wofford, and Henry A. Pearr.on
WINTER BED-SITE SELECTION BY WHITE-TAILED DEER IN CENTRAL ONTARIO ..... . ...............•...••..•....... Edward Armstrong, David Euler, and Gerald Racey
ERUPTION PATTERNS OF SELECTED TEETH IN THREE NORTH AMERICAN MOOSE POPULATIONS ....•.••• Rolf 0. Peterson, Charles C. Schwartz, and Warren B. Ballard
ESTIMATION OF ARBOREAL LICHEN BIOMA3S ,~VAILABLE TO CARIBOU ..•••••.... • . . . . . . . • . . . . . . • . . • . • . . • . . . . • • . . . Lawrence J. Van Daele and Donald R. Johnson
Book Reviews . .........•..............•..............•...•...••.............
• ..
tna ' '
B2t
Jl;;)A ., ... ,.
829
836
841
846
851
852
858
860
863
868
•.73
877
880
884
888
891

•
INSTRUCTIONS FOR CONTRIBUTORS TO THE JOURNAL OF WILDLIFE MANAGEMENT
POLICY Original manuscripts couceming all phases of wildlife management are welcome. Referees and an associate editor judge each manuscript on originality of data, ideas or interpretations, and on accuracy, conciseness, and clarity. Except for abstracts, prior publication or concurrent submission elsewhere precludes publication in The Journal.
PAGE CHARGES, COPYRIGHTS Cum~nt policies and charges are explained in an acknowledgment sent to authors when manuscripts are received. If a manuscript that is not in the public domain is accepted for publication, authors or their employers must transfer their full copyright interest exclusively to The Wildlife Society.
MANUSCRIPT Authors must choose between 2 lormats depending only on manuscript length. Tf 11 or more typed pages of text and literature citations (not tables or figures), use the longer-article format (with an abstract). If shorter, use the Short Communications format. See recent issues for examples. A detailed guide to manuscript preparation is available from the Editor in Chief.
COPY Usc good quality white paper 215 X 280 mm (81/2 '< 11 in.), or size A4, not "erasable," light weight, or mimeo bond. Double space throup,hout, with 3-cm margins. Do not hyphenate at the right margin. In the top left corner of page 1, typ2 the na'llc and complete address of the person who is to receive editorial t..•orrcspomlence. On succeeding pages, typ~.: the senior author's last name in the top left corner, the page number in the top right corner. Keep 1 copy. Submit 3 good xerographic (preferred) copies. Do not fold any copy.
STYLE Follow the CBE Style Manual 4th Ed., 1978 (Am. Inst. Biol. Sci., 1401 Wilson Blvd., Arlington, VA 22209), except for spt::::ific style items that difrcr m 1978 or later issues uf The Journal. For general guidance, see CBE chapters 2 and 3, particularly pages 18-27. For spelling, see fVcbster's Third New I mer~ national Dictionary, unabridged. For numbers, usc dig~ its except at the beginning of a sentence. Usc pcrc\!nt sign (%) with digits and 1n table headings.
TITLE Use no more than 10 words :Jsc vernacular names of organisms. For longer-article manuscripts (11 + pages), include below the title a "running head" no more than 4$ characters long.
ABSTRACT, KEY 'WORDS Longer manuscripts (II+ pages) require an abstract of about 1 typed line per typed page of text. In 1 paragraph describe the problem studied, the most important findings, and their utility, Pln;;e key words below the abstract in longer manuscripts (11 + pages), below the title in shorter ones. !:iupply 6-12 key words for indexing: vernacular and scientific names of principal organisms, geographic area, phenomena and entities studied, and methods.
FOOTNOTES Use only for an author's addrc.~s if it differs from the byline address, for crediting financial support, and in tables.
SCIENTIFIC NAI\-IES Do not usc in the title or for names of domesticated animals or culth a ted plants. In the abstract or text accompanv the lirst nll~ntion of a vernacular name \Vith its scientific name.
·If'
MEASUREMENT UNITS Use metric units. For conversions of trade terms and the like that may'be ambiguous, show English equivalents in parentheses.
REFERENCES Authors are responsible for accuracy and completeness, and must use the style in the most recent issues of The Journal. Avoid unnecessary referencing. In text the sequence of references named consecutively is by date. Show page numbers for quota~ tions, paraphrases, and for citations in books or bulletins unless reference is to the entire publication. Cite unpublished reports O'lly if essential; put them parenthetically in the text.
LITERATURE CITED Use capital and lowerc~se letters for authors' last names, initials for given names. Abbreviate titles of cerial publications according to references endorsed in the 1978 CBE manual, p. 239. Show issue number or month only if pagination is not consecutive throughout the volume.
TABLES AND ILLUSTRATlONS Each rr.~st be selfexplanatory and be referenced in text. Preparation for column width (67 mm) is preferred over that for page width (138 mm). Av01d repeating information among tables, figures, and text.
Tables.-Start each one on a separat\! page and continue long tables onto 1 or more pages. Double space throughout, omit vertical lines, and leave margins of at least 3 em. A void unusual abbreviations. Identify footnotes by roman letters, or asterisks for probabilities. Percentages shown for curscry comparison should havc only I or 2 significant digits. Do not show perrcntnges within small samples (N < 26).
Ilh!strations.-See Steps Towarr/ Better Scientific Illrtstratii!J!S bv Arly Aile!< (Allen Press, Lawrence, KS 66044 ). Type captions on a separate page, in paragraph form. On the back of each illustrat::m, lightly write the 'ienior author's narne, figure number, and "Top." Few pictures are accepted. These should be unmounted, sharply focused, high contrast prints on glossy paper not larger than about 10 X 12.5 em. Submit 3 prints of each picture. Dra\vings must bt.: in India ink or equivalent, on white drafting paper or tradng cloth. The submitted original or copies must be no larger than 215 X 280 mm (8Vz X 11 in.). A drawing will be reduced to 67 mm wide unless it is much w!der than high or exc<.•ptionallv detailed. Best scale is 1.5 times the re~ duced size. Make all letter.; and numbers large enough to be at least 1.5 mm tall when l educed. Lettering style and sizl: '.vhen reduced should be the same in all ligures. Typ~d labels arc not acceptable. To guard against loss, photographs or offset prints of drawings arc: preferred over originals. Xcrogr "' h:c copies are acceptable with duplicates ofthe manuscript.
TRANSMITTAL LETT.Ii:R With the 3 manuscript copies, send a letter to the Editor in Chief, The Journal of Wildlife ll.fanagl?ment, The Ohio State Unh'ersity; P.O. Box 3341, Columbus, OH 43210, stating intent to r;ubmit the manuscri1)t exclusively for publication in The Jouma!. Explain any similarities bct\vcen information in the manuscript and that in other publi· cations or concurrent manuscripts by the same nutlwr(s). and furni~h <1 t:opy of such publications or manuscripts.
~· '<
.. < ", ~ ' ' ...
..
"'
..
"