Embed Size (px)
Citation preview

1
Preliminary statement for the year ended 31 March 2011
London – 18 May 2011
ICAP plc (IAP.L), the world’s premier interdealer broker and supplier of post trade risk and information services, today announced its audited results for the year ended 31 March 2011.
Continuing operations
Year ended31 March 2011
£m
Year ended 31 March 2010
£m Growth
Revenue 1,741 1,605 8%Net operating expenses1,3 (1,366) (1,251) (9)%Profit2 350 335 4%Profit before tax – statutory 233 247 (6)%
EPS (basic) 28.7p 18.0p 59%EPS (adjusted basic) 4 39.9p 32.6p 22%EPS (continuing adjusted basic)4 39.9p 35.4p 13%Dividends per share 19.95p 17.55p 14%
Group financial highlights: • Group revenue from continuing operations increased by 8% to £1,741m with profit2 of £350m up 4%
• Electronic revenue of £302m increased by 20% produced operating profit3 of £123m up 23% - a record high for our electronic broking business
• Post trade risk and information revenue rose 30% to £184m and produced operating profit3 of £79m up 14% - our strongest performance to date
• Electronic broking and post trade risk and information contributed 54% of operating profit3
• The Group's operating profit3 margin was 22% (2010: 22%), unchanged on the prior year as a result of investment in new businesses and one-off costs.
• EPS (basic) up 59% to 28.7p; EPS (adjusted basic) up 22% to 39.9p
• The directors recommend a final dividend per ICAP share of 14.68p, which will be paid on 19 August 2011. The full year dividend will be 19.95p compared with 17.55p per share in 2009/10
Michael Spencer, Group Chief Executive Officer, said: “ICAP delivered a solid performance during the financial year, facilitated by our global reach and diverse range of services. It has been another period of substantial progress for our electronic broking and post trade risk services businesses. During the year we continued to increase our market share.
This past year we concentrated on organic growth, leveraging existing assets and further developing the collaborative relationships we have with our bank customers. We invested successfully in a number of new products and services, most notably our electronic interest rate swap platform, which has now transacted more than €360 billion in trades since its launch last September.
In the first half of the year we saw generally quieter markets but delivered good revenue and earnings growth driven primarily by our electronic broking. We benefited from the strength of our emerging markets businesses, continuing turbulence in the world’s commodity markets, significant euro denominated bond issuance and rising concerns about higher inflation. More recently, the political and economic uncertainties in the Middle East and North Africa have contributed to volatility in global financial markets.
I am sorry to say that after six years at ICAP, our Group Operating Officer Mark Yallop has decided to leave the Group. During his time with ICAP Mark has been heavily involved in the strategic development of our business and I would like to thank him for the outstanding contribution he has made to the firm. Mark has agreed to remain with ICAP until we appoint a replacement.
We have made a good start to the new financial year and the short-term outlook is underpinned by macroeconomic stress and continuing market volatility. We are confident we can continue to deliver growth as we continue to invest in the business.”

There will be a briefing for analysts and investors at 09:30 BST on Wednesday 18 May 2011 at 2 Broadgate, London EC2M 7UR. The presentation slides and an audiocast will be available on the website, www.icap.com at 17:00 BST on Wednesday 18 May 2011. The audiocast will remain on the website for six months. A further conference call will be held at 14:30 BST/09:30 EST for investors and analysts in North America. For dial in details and a copy of the presentation please contact Maitland on +44 (0) 20 7379 5151.
Notes
1. Includes operating expenses net of other income.
2. Profit is defined as pre-tax profit from continuing operations before acquisition and disposal costs and exceptional items.
3. From continuing operations excluding acquisition and disposal costs and exceptional items.
4. Adjusted basic EPS is based on total earnings before acquisition and disposal costs and exceptional items (and their tax effects).Continuing adjusted basic EPS is based on earnings from continuing operations before acquisition and disposal costs and exceptional items.
Contacts: Michael Spencer Group Chief Executive Officer +44 (0) 20 7050 7400 Mike Sheard Director of Corporate Affairs +44 (0) 20 7050 7103 Alexandra Umpleby Head of Media Relations +44 (0) 20 7050 7104 Alex Dee Head of Investor Relations +44 (0) 20 7050 7123 Neil Bennett Maitland +44 (0) 20 7379 5151
Notes to editors:
About ICAP ICAP is the world’s premier interdealer broker and provider of post trade risk and information services. The Group matches buyers and sellers in the wholesale markets in interest rates, credit, commodities, foreign exchange, emerging markets, equities and equity derivatives through voice and electronic networks. For more information go to www.icap.com

3
Preliminary statement for the year ended 31 March 2011
Review of operations The Group reports revenue of £1,741 million, 8% above the prior year reflecting substantial progress in ICAP’s electronic broking and post trade risk and information businesses. We have seen increases in volumes on both our traditional fixed income and FX electronic trading platforms together with the successful launch of our new euro IRS platform.
During the year, we moved closer to our strategic goal to have our operating profit generated evenly between voice broking, electronic broking and post trade risk and information with a total of 54% generated by our non-voice broking businesses. Strong volumes contributed to the percentage of operating profit* generated by the electronic broking platforms increasing from 28% to 33%, while the acquisition of TriOptima in March 2010 and higher volumes in Traiana offset the impact of lower activity levels in Reset, resulting in a two percentage point increase to 21% for post trade services share of Group operating profit*.
The management of our cost base remains an area of substantial focus and, while we saw net operating expenses increase by 9% in the year to 31 March 2011, a substantial component of the rise relates to £17 million of non-recurring one-off costs and the Group’s investment in businesses, systems and processes which will fuel future growth. The acquisition of TriOptima, as well as investment in developing our newer voice businesses, including Brazil, accounted for £42 million of the total increase, 45% of the total if we exclude FX, with a further £22 million reflecting our increased spend on technology systems.
The Group reports an operating profit* from continuing operations of £375 million, up 6% on the prior year due to a strong performance by our electronic broking and post trade risk and information businesses offset by continued investment and one-off costs. The Group’s operating profit margin generated from its continuing operations for the year ended 31 March 2011 remained unchanged at 22%.
Profit before tax of £350 million was up 4% on the prior year and includes a full year contribution from TriOptima which was previously accounted for as an associate. Profit before tax on a statutory basis reduced by £14 million to £223 million primarily as a result of higher pre-tax trading profits being partially offset by an increase of £22 million in amortisation of intangibles related to the acquisition of TriOptima.
Delivering on strategic objectives Our goals are to be the leading global intermediary, the leading post trade risk services provider and the main infrastructure provider to the world’s wholesale financial markets. We aim to have at least 35% of overall interdealer market revenues and to generate operating profit evenly distributed between voice broking, electronic broking and post trade risk and information services. In 2010/11, 54% of ICAP’s operating profit was generated from electronic broking and post trade risk and information activities, their highest combined level in ICAP’s history.
There are three components to our strategy:
• the expansion of our leading voice broking business;
• the growth of our global electronic broking business both through increasing volumes of existing products and by developing new markets; and
• the development of our post trade risk and information businesses to provide innovative services that enable our customers to reduce their costs and risks and to increase their efficiency, return on capital and capacity to process trades.
A year ago we said that we would be concentrating on growing our business organically and working with our customers to expand the use of the market infrastructure in which we had previously invested. We have consolidated our position as a leading global intermediary in the wholesale financial markets by a clear margin with a further increase in our market share. Our leading voice broking business has expanded in emerging markets and commodities. Lower levels of activity in credit and equity derivatives slowed our business in those products. We’ve taken electronic markets into new asset classes following the launch last September of ICAP’s electronic euro interest rates swaps (IRS) platform. The platform which has market maker support, brings increased transparency and greater efficiency as well as lower transaction costs to the world’s largest OTC derivative market. This platform has now transacted over €360 billion in volume involving more than 4,300 trades representing over 20% of our euro IRS activity since its launch. We continue to see month-on-month increases in activity on this platform and, in March 2011, over 30% of our euro IRS trades were transacted on the platform. We plan to expand the platform to include dollar IRS during 2011.
This is a prime example of how we work closely with our customers, aligning our interests with theirs and expanding their use of ICAP’s developing market infrastructure. The development of our post trade risk and information businesses in providing innovative services has continued apace. Traiana’s Harmony FX product has continued to gain significant market share with higher levels of integration with our customer base and the CLSAS joint venture with CLS Group in FX has seen a very large increase in volume. In addition, Traiana recently launched real-time straight-through-processing connectivity for our customers to CME Clearing for OTC FX derivatives and non-deliverable forwards (NDFs).
* From continuing operations excluding acquisition and disposal costs and exceptional items.

Business drivers ICAP continues to have the potential for further growth and we have invested ahead of our competitors. Factors that support this growth include:
• instability in currencies, interest rate and credit markets leading to price volatility and forming the basis for further growth in interest rate and credit derivatives, FX, commodities and listed financial markets;
• demand for improved operational and capital efficiency for bank and hedge fund traders in these markets;
• use of derivatives to manage efficiently and hedge risk exposure to changes in interest rates and FX, commodity and other price fluctuations;
• continuing high levels of government and corporate bond issuance as structural change reduces bank lending to corporates;
• reallocation of capital to commoditised “flow” markets and the structural shift away from complex structured products;
• continuing regulatory pressure on financial market participants to overhaul OTC market infrastructure, reducing systemic and operational risk by improving back office procedures and reducing systemic and counterparty risk;
• clearing of OTC derivatives trades to reduce risk, improve market efficiency and reduce costs;
• increased political pressure for new regulations requiring more electronic trading, improved transparency and higher capital requirements for OTC trades that are not cleared; and
• continued liberalisation of emerging markets. Economic growth and increasing sophistication are driving growth in onshore and offshore interest rate, FX and credit markets in these countries.
Competitive environment We continue to benefit from greater scale and broader diversity than our competitors and have outperformed many of them in terms of market share. When assessing our available market size we include interdealer broking markets in rates, FX, commodities (including shipping), emerging markets, credit and equities – together with markets such as post trade risk. Markets like financial futures remain separate from this broader definition, although ICAP does act as an executing broker in listed futures markets. By our estimates, overall industry revenue was unchanged in 2010 at $11 billion. On this basis ICAP currently estimates its share of this market has grown to 23%–25%. Our strategy remains to increase this share to 35%.
Financial markets reform Significant progress is being made by regulators in proposing changes to financial regulation which aim to strengthen supervision and market infrastructure. It is clear that there will be a long road to travel as, once the changes have been agreed, implementation of some aspects is likely to be phased over several years.
Following the publication of the Basel III capital and liquidity reform package as well as the banks’ capital requirements, we expect a clearer view will now emerge of the potential impact on the operations of banks and their customers as a result of the way their trading operations (both proprietary and flow) are treated for risk and capital purposes.
Regulators want to lower operational and systemic risk through greater automation and increased transparency of trading execution. The CFTC has not yet finalised the parameters that would define a Swap Execution Facility, a type of organised trading venue in the US, but we believe ICAP is well placed to provide sophisticated technology platforms that are fully compliant with the rules as they are finalised. In Europe, there are positive signs of the EU’s commitment to open, efficient and resilient markets in the proposed European Market Infrastructure Regulations. The EU’s MiFID II consultation is underway and the proposals are expected to be released in the second half of 2011.
The regulatory push towards more electronic or hybrid trading of derivatives and central clearing are positive drivers for our sector. As a leading provider of OTC market infrastructure, ICAP is in a very strong position to work with market participants and lead new initiatives to address regulatory concerns.
In addition to reducing counterparty risk through the extension of central clearing of eligible derivatives, we believe that there will be significant continuing demand for bilateral clearing of the many OTC derivatives that are not suitable for central counterparty (CCP) clearing. Regulators are increasingly aware of the need to build resilience in these markets and ICAP is continuing to work on the development of automated collateral management networks to streamline the process for both banks and their customers. This reduces cost, improves efficiency and mitigates risk.
Above all, however, we believe that the many changes proposed will stimulate the banks and market infrastructure providers, including ICAP, to further technological innovation that will help achieve the objectives of the regulators for more resilient markets, and thereby create opportunities for building new businesses.

5
Markets ICAP reports on segments of its business in the same way externally as we manage and report the business internally. The major segments are the three regions of core voice broking, electronic broking, post trade risk and information and new businesses. New businesses, comprising new voice broking businesses, have been separated out to allow the appropriate focus given the very substantial investment that has been undertaken in recent years. ICAP provided services in a broad range of markets and the diversity of its market coverage is a key strength of the Group. The revenue and growth rates per market from our continuing operations are given below.
Continuing operations Markets
2011 Revenue*
£m
2010 Revenue*
£m Growth
%
Rates 695 630 10
FX 321 292 10
Commodities 213 175 22
Emerging markets 191 141 35
Credit 185 204 (9)
Equities 136 163 (17)
Total 1,741 1,605 8
Segmental performance Core voice broking
Revenue*
£m
Growth
%
Operating profit*
£m Growth
%
EMEA 578 1 114 (4)
The Americas 471 2 83 –
Asia Pacific 134 6 (3) n/m
Total 1,183 2 194 (7)
Our voice broking business is active in the wholesale markets in rates, FX, commodities, emerging markets, credit and equities. ICAP’s strategy is to profitably expand our leading voice broking business by increasing market share.
Revenue* from ICAP’s core voice broking businesses was broadly in line with the prior year despite revenue from Asia Pacific being adversely impacted by the loss of 38 brokers in September 2010. Revenue growth reflected strong performance of emerging markets, commodities, and interest rate derivatives, which was offset by slower performances in credit and equity derivatives. In addition revenue benefited from stronger dollar and euro exchange rates. Operating profit* decreased by 7% and operating profit margin by 3 percentage points following a number of one-off costs across all segments. However, our continued focus on costs, together with our new businesses reaching operational maturity, will support operating profit* margin for the voice broking business.
Rates The interest rate markets have been active during 2010/11 with volume increases seen across the three main products: interest rate derivatives, government bonds and particularly repurchase agreements (repos). Volatility remained high due to the sovereign debt crisis in Europe and continuing global high levels of government debt issuance. Within the interest rate derivatives market, the biggest component of our business in terms of revenue, the euro swaps business and the cross-currency swaps area were the best performers and ICAP retained its position as the largest broker in these areas. Business was supported by high levels of corporate bond issuance in EMEA in what is still a very low rate environment.
FX FX markets remained volatile in both developed and emerging markets resulting in significantly increased volumes in forward products. The spot FX business market has performed in line with the prior year. The strength of our FX business was evident during the year as we grew both revenue and market share, particularly in the major currencies.
* From continuing operations excluding acquisition and disposal costs and exceptional items.

Commodities Economic uncertainty has substantially benefited our commodities business specifically trading in oils, coal and natural gas contributing to record revenue in EMEA. In the US, our electricity and oil businesses continue to perform strongly. We continue to develop our hybrid trading options for customers with momentum building for ICAPture, our US-focused platform designed to meet the changing regulatory requirements of the Dodd-Frank Act. With a focus on oils, we are extending ICAP TrueQuote from a post trade support engine to an interactive execution tool, providing screen-supported voice hybrid execution alongside straight-through-processing to multiple clearing venues.
ICAP Shipping saw a general improvement in trading conditions and while it recorded a small operating loss we expect investments made in the current year will position the business to respond to improvements in market conditions.
Emerging markets We have seen a strong increase in both volume and market share in the emerging markets’ rates businesses, specifically central European interest rate swaps, and have maintained our market leadership in Latin American businesses where we have deep customer and exchange relationships.
In Asia, market conditions remained highly competitive, with a large number of brokers competing for business in all of our markets. In September we lost 38 broking staff in Singapore to a competitor and, while we have been actively rehiring, revenue was adversely impacted in the second half of the year. Over the medium term, we expect substantial growth in the region to come from China, where we have recently expanded the scope of our joint venture with CFETS and commenced broking renminbi on an offshore basis.
Credit Revenue in credit as a whole was down on previous years and we saw a return to more normal markets. Although there was a reduction in the risk appetite of some our customers, overall market volumes in corporate bond markets remained relatively high. Tighter spreads however reduced ICAP’s revenue. Against this we saw an increase in CDS revenue driven in particular by strong growth in index products with increased volumes and an improvement in market share. We expect that potential changes to the market structure driven by further regulatory change are likely to impact these markets in the coming years. The introduction of electronic platforms is well advanced in the CDS markets on both sides of the Atlantic.
Equities Equity derivatives are the main focus of this segment. Proposed regulatory changes, with the threat of increased capital requirements and reduced proprietary trading put our customers’ margins under pressure. This in turn had two effects; the first was commission compression for brokers of 20% - 30% and the second, low market volumes, particularly in the first three quarters of the year. In the first half, our US business performed better by increasing market share. We have successfully kept our teams intact despite aggressive approaches to key staff by competitors. As a result we were in a good position to benefit in the last quarter of the year when we saw an increase in market volumes.
Electronic broking
£m Growth
%
Revenue 302 20
Operating profit* 123 23
ICAP operates the world’s leading electronic trading platforms in the OTC FX and fixed income markets. The platforms offer efficient and effective trading solutions to customers in more than 50 countries in a range of instruments including spot FX, US Treasuries, European government bonds and EU and US repo. The platforms are built on our unique networks connecting participants in wholesale financial markets.
ICAP’s strategy is to grow our global electronic broking business both through increasing volumes of existing products and by developing new markets.
Combined average daily electronic broking volumes for the BrokerTec fixed income platform and EBS spot FX platform for the 12 months ended 31 March 2011 were $778 billion, up 24% from the previous year, with the highest average daily volume of $914.5 billion being achieved.
Electronic broking reported revenue of £302 million, an increase of 20% over the prior year. Operating profit increased by 23% to £123 million. Despite the substantial revenue growth, operating profit margin increased marginally to 41% reflecting one-off costs primarily related to the write-down of technology platforms.
ICAP’s demonstrated expertise developing and operating highly transparent and efficient electronic trading solutions positions it well to benefit from impending regulatory changes in Europe and the US.
To further support its market leading position in a time of heightened competition in electronic trading, ICAP continues to invest in product development, operations and technology.
* From continuing operations excluding acquisition and disposal costs and exceptional items.

7
Rates Fixed income Trading on the BrokerTec platform was strong with total average daily volumes in US Treasury products, EU repo and US repo at $627 billion, up 27% on the prior year. Growth in US Treasury products benefited from high levels of issuance and activity in the US repo markets was particularly strong.
In Europe, electronic trading of European government bonds continued the growth seen in the previous year. From April 2011, BrokerTec, an official platform in Portugal, secured primary dealer obligations from domestic market participants increasing the number of EU governments that recognise the use of the BrokerTec platform.
In August 2010, having previously achieved the ability to submit overnight repos to the central clearer, LCH.Clearnet, BrokerTec EU repo trading was launched in Spain, leading to considerable new customer participation and the capture of considerable business in term secured funding.
Investment in the BrokerTec platform technology continued throughout the year and was focused on delivering performance improvements and facilitating enhancements to EU and US trading capabilities. A capital expenditure programme to significantly upgrade the platform is on track to be completed in the second quarter of 2012.
Interest rates In September we launched an electronic platform for trading euro IRS with market maker support, bringing increased transparency and greater efficiency, as well as lower transaction costs to the world’s largest OTC derivative market. This initiative will make a substantial contribution towards further reducing operational and systemic risks in trading OTC derivatives. Our electronic IRS platform takes ICAP’s established voice liquidity and combines it with a proven electronic platform to create a single liquidity pool in a wide range of euro IRS instruments out to 30 years’ maturity. Since its launch, the platform has transacted over €360 billion in volume involving more than 4,300 trades representing 20% of our euro IRS activity. We continue to see month-on-month increases in activity and in March 2011, over 30% of our euro IRS trades were transacted on the platform. We plan to expand into dollar IRS during 2011.
FX We saw growth in FX activity over the course of the year. Average daily electronic broking volumes on the EBS platform were $151 billion, an 11% year-on-year increase.
The EBS platform continued to demonstrate its role as the FX market’s central source of pricing and liquidity, especially clear, in moments of heightened volatility.
Over the past year several new order types designed to support manual traders, including the introduction of the first purely electronic Fix Order were launched. Decimalised pricing on the EBS platform was launched in March 2011.
Increased activity in a diverse range of currency pairs continued and the EBS presence in emerging markets strengthened. In September 2010, EBS was the first electronic platform to enable trading of Hong Kong cleared Chinese renminbi. March 2011 was a record month for Commonwealth and emerging markets’ currencies overall, with record monthly trading of the Australian dollar, Hong Kong cleared Chinese renminbi, Russian rouble and NDFs.
MyTreasury My Treasury is an electronic money market trading platform for corporate treasury investors launched initially to offer AAA- rated money market funds and currently being extended to cover term deposits and certificates of deposit.
During a period of fund sector consolidation, the value of funds invested via MyTreasury increased 270% from 2009/10. The platform has achieved complete offshore fund provider coverage and now offers access to more than 160 fund accounts. The number of investors using the platform increased by more than 40% year-on-year.
Credit ICAP has a number of electronic platforms which have been developed to address different aspects of the credit derivatives markets. ICAP launched the first hybrid electronic and voice platform in Europe in 2004 and the first purely electronic credit trading application in the US in 2007. The product provides traders with real-time access to the full range of CDS markets, such as the on-the-run and off-the-run investment grade and high yield CDX indices, including unique support for curves, switches and rolls. ICAP recently introduced single name CDS instruments to the platform and is rolling out new single-name credit sectors weekly. The BrokerTec credit platform offers both manual and automated trading to all major banking institutions and has consistently been in the top three interdealer platforms. More recently, in the US we launched an additional hybrid platform for the credit default index market.
Institutions in the US are anticipating the implementation of new regulatory requirements and accordingly have shown growing interest in our electronic credit solutions. CDS trading activity on the BrokerTec platform continues to grow, with steady participation in the market on a daily basis. It is expected that in the second quarter of 2011 total volumes since launch will surpass $300 billion. We are well positioned to take advantage of regulatory changes within the credit market, and our trading platforms are expected be fully compliant.

Post trade risk and information
£m Growth
%
Revenue 184 30
Operating profit* 79 14
ICAP’s strategy is to develop our post trade risk and information businesses to provide innovative services that enable our customers to reduce their costs and risks and to increase their efficiency, return on capital and capacity to process trades. The post trade risk and information segment comprises Traiana and the Portfolio Risk Services businesses – TriOptima, ReMatch and Reset – and the information business.
The post trade risk and information business continued to perform strongly reporting revenue of £184 million, an increase of 30% on the prior year, while operating profit increased 14% reflecting a combination of the acquisition of TriOptima and higher volumes in Traiana. These improvements were offset by Reset which saw lower activity levels as a result of benign market conditions during the first part of the year. A change in the revenue mix, together with the ongoing investment in Traiana and ReMatch, resulted in operating profit* margin falling from 49% to 43%.
Reset Reset is the market leading provider for interest rate reset risk management, accounts for the largest proportion of ICAP’s post trade risk revenue and operating profit*. Reset are experts in short-end risk management and thereby help our customers to control their fixing risk. The Reset matching engine allows for unilateral matching with hedging, therefore it is no longer necessary for our customers to have an offsetting position for each trade to be executed. During the first part of the year, Reset saw some slowdown as short-term interest rates remained low and stable although we saw a pick up in the final quarter as volatility returned to the LIBOR market. In addition, Reset began to benefit from its newly launched inflation fixing and basis fixing services and will be launching other new products, including bonds, over the next 12 months.
TriOptima TriOptima is the provider of OTC derivatives infrastructure services including triReduce and triResolve. TriOptima’s services, aimed at reducing risk and helping financial institutions to manage their OTC derivative portfolios more efficiently, continue to be well utilised by the markets. The regulatory environment creates interesting opportunities for TriOptima as our customers focus significant resources on their new regulatory obligations.
The business has faced a challenging operating environment as regulatory pressure on customers has been focused on maximising submission to clearing rather than optimising their portfolios through compression. These conditions are expected to be temporary.
TriOptima’s portfolio compression service, triReduce, eliminated $45.8 trillion in IRS notionals in a record 53 cycles and $8.5 trillion in CDS notionals in a record 95 compression cycles during 2010/11.
TriOptima’s counterparty exposure management service, triResolve, for OTC derivatives, including portfolio reconciliation, margin call management and dispute resolution, also continued to expand. In October, TriOptima announced that the ‘Big Six’ Canadian banks had joined the triResolve service. Currently, six million OTC derivative trades from 2,800 legal entities are regularly reconciled through triResolve. This represents 75% of all non-cleared OTC derivative transactions
Traiana Traiana, the post trade netting and aggregation service, operates the industry-standard platform, for electronically processing OTC FX, futures, equities and equity derivatives. Traiana saw strong growth and has continued to expand its offering in new asset classes to both the buy- and sell- side firms across FX, exchange trade derivatives, equities and equity derivatives. Traiana Harmony now processes more than US$700 billion in trading volume each day, and connects more than 500 market participants including buy-side, sell-side, execution venues and ISVs.
In FX, Traiana has continued to see strong revenue growth from existing services and the introduction of new products with daily trades processed more than doubling year over year, driven by continued growth in volumes from banks and prime brokers, increasing volumes from high-frequency trading and rising retail FX trading volumes. In addition, Traiana’s trade aggregation joint venture with CLS Group, CLS Aggregation Service (CLSAS), continued to expand. In December, Traiana and the CLS Group announced that all eight founding member banks of CLSAS had gone live with the service after adoption in just a year. On 15 March 2011 the CLSAS service processed the highest daily volume recorded so far with over 295,984 gross trades, aggregated to 11,788. Average daily volumes processed through CLSAS in March 2011 were 162,300 with an average compression ratio of 93.8%, from a standing start at the beginning of the year.
In a move to help customers address new regulations, Traiana announced in March that it had launched a new service for the clearing of OTC FX derivatives, Harmony CCP Connect, with Citi as its first customer and CME Group its first clearing house. Harmony CCP Connect links Banks and Prime Brokers to clearing houses to comply with global financial reforms in the wake of the 2008 financial crisis, easing the implementation of central clearing mandates for derivatives.
Traiana has also continued to expand the Harmony Network into new asset classes, including contract-for-difference (CFD) equity swaps and exchange-traded derivatives. Harmony is now the largest CFD equity swap messaging network in the world, and is used by 12 of the world’s largest equity swap counterparties and over 60 executing brokers. In March 2011, Traiana expanded Harmony’s CFD equity swaps network to the buy-side and a growing group of buy-side firms have already connected to the network.
* From continuing operations excluding acquisition and disposal costs and exceptional items.

9
ReMatch ReMatch provides market risk mitigation and portfolio rebalancing services to address the problems derived from the build-up of illiquid, calendar spread, net open positions in CDS portfolios. In the past year it expanded its services to include US financials and western European sovereign CDS products. ReMatch addresses the problem of minimal or no exit liquidity at the ‘off the run’ points in a trader’s CDS portfolio, and reduces the market risk created by the build-up of these illiquid positions. Since its launch in October 2009, ReMatch has helped the market reduce a total of $250 billion in CDS trades.
Information ICAP information empowers customers to make trading decisions with authoritative, independent and consistent OTC market information, across a range of asset classes. We provide real-time, end-of-day and historical data solutions across our brokered product range from 32 contributing countries. Our data is the intelligence behind algo trading and research models for customers and is a key source of mark-to-market data for the industry. This part of our post trade risk and information business is a profitable, high margin cash generative business with a broad, loyal, global customer base. The business has exhibited strong performance year-on-year with both revenue and profit growth and employs a subscription-based charging structure which provides a regular revenue stream.
New businesses
2011
£m 2010
£m
Revenue 72 54
Operating profit* (21) (24)
For 2010/11 the new business segment included the Group’s investment in a number of new initiatives which have been started or acquired over the past two years. These include Brazil, intellectual property and base metals.
This segment has been reviewed and as a result of the decreasing number of new businesses set-up or established over the past two financial years, it is planned to discontinue this segment for the year ending 31 March2012.
Brazil ICAP’s operations in Brazil, with more than 250 brokers and support staff, encompasses three core products: futures (BM&F), equities (Bovespa) and a retail share trading platform (MyCAP). ICAP saw its market position improve with a near doubling of its revenue year-on-year and the MyCAP customer base increased to 10,000 accounts.
As a result of our ongoing investment the business was loss making during 2010/11 and this is expected to continue in the year ahead as we continue to invest albeit at a lower level. We are now the leading independent broker and in the top 10 across all key product lines amidst a very competitive field of over 60 broker organisations. We have invested significantly in our systems and infrastructure and have seen encouraging recent growth in direct market access which will provide a key driver for the future.
Base metals ICAP is a Category 2 broking member of the London Metals Exchange (LME). The LME business produced strong revenue growth and is profitable. It gained access to new pools of liquidity by expanding geographically to offer a global service and by broadening its product offering over the past 12 months, including the new futures mini contract which was launched on the Singapore Exchange in February 2011, as well as opening a new office in Hong Kong. In future, base metals will be reported as part of the EMEA commodities segment.
Intellectual property Patents continue to build a strong pipeline of deals and has held a number of auctions making a modest profit. The market growth is fuelled by smartphone patent wars, corporate bankruptcies and patent litigation risk. We have expanded the business beyond the traditional markets into automotive and pharmaceutical asset classes both of which offer significant growth opportunities.
Outlook We have made a good start to the new financial year and the short-term outlook is underpinned by macroeconomic stress and market volatility. As the banks and our regulators seek to create more resilient, robust and orderly OTC derivatives markets we believe that ICAP’s business model is well prepared for changes in the financial market infrastructure. Investments in previous years have created a solid base for future growth and there are significant opportunities to expand the use of the market infrastructure we have built. We are confident we can deliver sustainable long-term growth.
The Group remains focused on the disciplined execution of our strategy and we have positioned the business for sustained long-term development. Once again, this year we are concentrating on organic growth and remain committed to developing collaborative relationships with our bank customers.
* From continuing operations excluding acquisition and disposal costs and exceptional items.

Profit for the year
Year ended 31 March
2011 £m
Year ended 31 March
2010 £m
Profit before tax* from continuing operations 350 335
Acquisition and disposal costs (94) (62)
Exceptional Items (23) (26)
Profit before tax from continuing operations (statutory) 233 247
Tax (50) (83)
Profit from continuing operations 183 164
The Group reports a solid performance with profit after tax, acquisition and disposal costs and exceptional items of £183 million from continuing operations.
Acquisition and disposal costs For the year commencing 1 April 2010, the Group has redefined the column previously entitled ‘amortisation and impairment of intangibles arising on consolidation’ having considered the impact of the adoption of IFRS3 (revised) ‘Business Combinations’ to the consolidated income statement. The Group saw amortisation of intangibles increase by £22 million over the prior year related to the acquisition of TriOptima.
Exceptional items and discontinued operations The Group’s policy is to separately disclose items in its income statement as exceptional which are non-recurring and, in terms of both size and nature, material.
The Group has recognised an exceptional, pre-tax charge in its continuing business of £23 million in respect of the recoverability of the loans made to a number of associates active in non-core agency voice markets (£20 million) and an adjustment to the 2010 SEC settlement-related costs (£3 million).
A post-tax credit of £4 million relating to a reversal of a prior year exceptional charge, disclosed as discontinued in 2010/11, was recognised as an exceptional item relating to the decision to close the European and Asia Pacific full service agency cash equities businesses in 2009/10.
Tax The overall objective continues to be to plan and manage the tax affairs of the Group efficiently while complying with local tax regulations. The Group’s effective tax rate, excluding acquisition and disposal costs, exceptional items and discontinued operations is 26% (2010 – 32%) which represents maintenance of the underlying rate of 32% less a reduction of 6% in respect of settling enquires with tax authorities.
A tax credit of £32 million (2010 – £20 million) has been recognised in the consolidated income statement column entitled ‘acquisition and disposal costs’ to reflect the impact of deferred tax on amortising intangible assets.
The Group’s tax charge is affected by the varying tax rates in different jurisdictions applied to taxable profits; the mix of those profits; and the rules impacting deductibility of certain costs. The Group continues to take a prudent approach to the management of its tax affairs and provisions are set to cover tax exposures. We expect the Group’s effective tax rate, excluding acquisition and disposal costs, exceptional items and discontinued operations will be 31% for the financial year ending 31 March 2012.
Earnings and earnings per share (EPS) We believe that the most appropriate EPS measurement ratio for the Group is adjusted basic EPS as this measure better reflects the Group’s underlying cash earnings. Adjusted basic EPS from continuing operations excludes the impact of the performance of acquisition and disposal costs, exceptional items and discontinued operations.
Adjusted basic EPS from continuing operations increased by 13% to 39.9p. The Group’s basic EPS from continuing operations increased from 25.5p to 28.1p and total basic EPS, including discontinued operations, increased from 18.0p to 28.7p primarily as a result of a tax credit recognised in the financial year.
Dividend For the past four years, the Group has paid a dividend equal to 50% of adjusted basic EPS which reflects the board’s desire to balance distributions to shareholders against the wider capital demands of the Group.
For the current year we propose, subject to shareholder approval, to continue to apply the same multiple which results in a final dividend of 14.68p being proposed. This compares to 12.44p in the prior year and, when taken in conjunction with the interim dividend of 5.27p per share, results in a full-year dividend of 19.95p which is an increase of 14% on the prior year.
Interim dividends are calculated as 30% of the previous year’s full-year dividend. This approach is expected to continue for the 2011/12 financial year.
Subject to approval at the annual general meeting, the final dividend will be paid on 19 August 2011 to shareholders on the register at the close of business on 22 July 2011. The shares will be quoted ex-dividend from 20 July 2011.
* Profit before tax, acquisition and disposal costs and exceptional items.

11
Operating profit*/cash conversion The Group continues to generate substantial free cash flow. Over the long term it is expected free cash and post-tax profit will converge. At 31 March 2011 our free cash flow conversion was 80% against a three year average ongoing free cash conversion of 107% of post-tax profit. This compares to 118% in the prior year as a result of increasing working capital requirements.
Free cash flow
Year ended 31 March
2011 £m
Year ended 31 March
2010 £m
Cash from ongoing operations** 363 390
Interest and tax (86) (69)
Cash flow from ongoing operating activities 277 321
Capital expenditure (69) (66)
Dividends from associates and investments 2 9
Ongoing free cash flow 210 264
Discontinued and exceptional** (21) (46)
Free cash flow 189 218
Cash generated from ongoing operations decreased by £27 million in 2010/11 of which £8 million relates to the change in restricted funds, £3 million related to higher trading levels, offset by the impact of initially unsettled trades of £38 million.
Net payments in respect of interest and tax have increased by £17 million to £86 million, primarily reflecting the full year impact of the five-year senior notes.
The Group distributed £90 million of its free cash flow to shareholders through its dividend.
Events after the balance sheet date On 8 April 2011, the FSA approved the Group’s application to renew its waiver from investment firm consolidation for a further five years.
* From continuing operations excluding acquisition and disposal costs and exceptional items.
** Cash from operations disclosed in the consolidated cash flow statement consists of cash from ongoing operations plus discontinued and exceptional.


Consolidated income statement Year ended 31 March 2011
1
Note
Before acquisition and disposal costs
and exceptional items
£m
Acquisition and disposal costs*
£m
Exceptional items (note 5)
£m Total
£m
Continuing operations Revenue 1 1,741 – – 1,741Operating expenses 6 (1,387) (88) (3) (1,478)Other income 21 – – 21Operating profit 1 375 (88) (3) 284Finance income 5 – – 5Finance costs (33) – (20) (53)Share of profit/(loss) of associates after tax 1 3 (6) – (3)Profit before tax from continuing operations 350 (94) (23) 233Tax 4 (90) 32 8 (50)Profit for the year from continuing operations 260 (62) (15) 183Profit for the year from discontinued operations – – 4 4Profit for the year 260 (62) (11) 187Attributable to: Owners of the Company 260 (62) (11) 187Non-controlling interests – – – – 260 (62) (11) 187Earnings per ordinary share from continuing operations – basic 2(b) 28.1– diluted 2(b) 27.6Earnings per ordinary share from total operations – basic 2(a) 28.7– diluted 2(a) 28.2
*See basis of preparation for change of definition to the column now entitled ‘acquisition and disposal costs’.

Consolidated income statement Year ended 31 March 2010
2
Note
Before acquisition and disposal costs
and exceptional items*
£m
Acquisition and disposal costs*
£m
Exceptional items (note 5)
£m Total
£m
Continuing operations Revenue 1 1,605 – – 1,605 Operating expenses 6 (1,270) (61) (26) (1,357)Other income 19 – – 19 Operating profit 1 354 (61) (26) 267 Finance income 7 – – 7 Finance costs (33) (2) – (35)Share of profit of associates after tax 1 7 1 – 8 Profit before tax from continuing operations 335 (62) (26) 247 Tax 4 (107) 20 4 (83)Profit for the year from continuing operations 228 (42) (22) 164 Loss for the year from discontinued operations (18) – (30) (48)Profit for the year 210 (42) (52) 116 Attributable to: Owners of the Company 210 (42) (52) 116 Non-controlling interests – – – – 210 (42) (52) 116 Earnings per ordinary share from continuing operations – basic 2(b) 25.5p– diluted 2(b) 25.1pEarnings per ordinary share from total operations – basic 2(a) 18.0p– diluted 2(a) 17.7p
*The comparative results have been re-presented for the change in the definition of the column now entitled ‘acquisition and disposal costs’. The net impact of this change has been to reallocate £2m from finance costs in the first column to ‘acquisition and disposal costs’ (see basis of preparation for details of change in definition).

Consolidated and Company balance sheet
3
Group Company
Note
As at 31 March
2011 £m
As at 31 March
2010 £m
As at 31 March
2011 £m
As at 31 March
2010 £m
Assets Non-current assets Intangible assets arising on consolidation 1,358 1,489 – –Intangible assets arising from development expenditure 63 72 – –Property and equipment 87 68 – –Investment in subsidiaries – – 1,989 1,989Investment in joint ventures – – 1 1Investment in associates 31 30 – –Deferred tax assets 4 17 34 – –Trade and other receivables 14 35 – –Available-for-sale investments 30 27 – – 1,600 1,755 1,990 1,990Current assets Trade and other receivables 74,693 60,101 40 36Available-for-sale investments 1 1 – –Restricted funds 7(c) 73 81 – –Cash and cash equivalents 7(c) 404 423 – – 75,171 60,606 40 36Total assets 76,771 62,361 2,030 2,026Liabilities Current liabilities Trade and other payables (74,634) (60,098) (89) (660)Borrowings 8(b) (183) (257) – (40)Tax payable (119) (100) – –Provisions (2) (36) – – (74,938) (60,491) (89) (700)Non-current liabilities Trade and other payables (29) (30) (140) (140)Borrowings 8(a) (382) (395) – –Deferred tax liabilities 4 (117) (174) – –Retirement benefit obligations (1) (1) – –Provisions (53) (55) – – (582) (655) (140) (140)Total liabilities (75,520) (61,146) (229) (840)Net assets 1,251 1,215 1,801 1,186Equity Capital and reserves Called up share capital 66 66 66 66Share premium account 452 425 452 425Other reserves 75 71 1 1Translation 73 138 – –Retained earnings 565 498 1,282 694Equity attributable to owners of the Company 1,231 1,198 1,801 1,186Non-controlling interests 20 17 – –Total equity 1,251 1,215 1,801 1,186
Approved by the board on 18 May 2011 and signed on its behalf by:
Michael Spencer Iain Torrens Group Chief Executive Officer Group Finance Director

Consolidated and Company statement of cash flow
4
Group Company
Note
Year ended 31 March
2011 £m
Year ended 31 March
2010 £m
Year ended 31 March
2011 £m
Year ended 31 March
2010 £m
Cash flows from operating activities 7(a) 256 275 – –Cash flows from investing activities Investments in subsidiaries – – – (34)Dividends received from associates – 7 – –Other equity dividends received 2 2 – –Payments to acquire property and equipment (45) (17) – –Intangible development expenditure (24) (49) – –Net (payments)/receipts on available-for-sale investments (1) 14 – –Acquisition of interests in businesses net of cash acquired (27) (147) – –Acquisition of associates and joint ventures (2) (2) – –Net cash flows from investing activities (97) (192) – (34)Cash flows from financing activities Proceeds from issue of ordinary shares – – – 3Proceeds from exercise of share options 2 – 2 5Proceeds from issues of ordinary shares to non-controlling interest 1 – – –Dividends paid to owners of the Company (90) (92) (90) (92)Payments to acquire Treasury Shares (8) – (8) –Receipts/(payments) to acquire own shares for employee share trusts* 4 (2) – –Loans to employee benefit trust to acquire new shares – – – (7)Repayment of borrowings (377) (488) (40) –Funds received from borrowing, net of fees 305 591 – 40Net receipts from subsidiaries – – 136 85Net cash flows from financing activities (163) 9 – 34FX adjustments (15) (8) – –Net (decrease)/increase in cash and cash equivalents (19) 84 – –Cash and cash equivalents at beginning of the year 7(c) 423 339 – –Cash and cash equivalents at end of the year 7(c) 404 423 – –
*Payments to acquire own shares for employee share trusts is shown net of £4m (2010 – £5m) of contributions received from participants in the trusts.

Basis of preparation
5
Preparation of financial statements The financial statements have been prepared in accordance with IFRS adopted by the EU, IFRIC interpretations and with those parts of the Companies Act applicable to companies reporting under IFRS and therefore comply with Article 4 of the EU IAS Regulation. The financial statements have also been prepared under the historical cost convention, as modified to include the fair value of certain financial instruments in accordance with IFRS. The financial statements are prepared in pound sterling, which is the functional currency of the Company and presented in millions.
The significant accounting policies adopted by the Group and Company are included at the front of the notes to which they relate.
The preparation of financial statements requires management to make judgements, estimates and assumptions that affect the reported amounts of assets, liabilities, income and expenses. Management consider goodwill and tax (note 4) to be the areas where increased judgement is required. Due to the inherent uncertainty in making estimates, actual results reported in future periods may be based on amounts which differ from those estimates. Judgements, estimates and assumptions are continuously evaluated and are based on historical experience and other factors, including expectations of future events that are believed to be reasonable under the circumstances. Revisions to accounting estimates are recognised in the period in which the estimate is revised and in any future periods affected.
This set of financial statements are the first in which the Group has presented the notes in an order that reflects management’s view of the importance of information contained in the notes to the performance and position of the Group for the year ended 31 March 2011.
Presentation of the income statement The Group maintains a columnar format for the presentation of its consolidated income statement. The columnar format enables the Group to continue its practice of improving the understanding of its results by presenting profit for the year before acquisition and disposal costs and exceptional items. This is the profit measure used to calculate adjusted EPS (note 2) and is considered to be the most appropriate as it better reflects the Group’s underlying cash earnings. Profit before acquisition and disposal costs and exceptional items are reconciled to profit before tax on the face of the consolidated income statement.
For the financial year commencing 1 April 2010, and for future periods, the Group has redefined the column previously entitled ‘amortisation and impairment of intangibles arising on consolidation’ having considered the impact of the adoption of IFRS3 (revised) ‘Business Combinations’ (effective for the Group from 1 April 2010) to the consolidated income statement. This column has accordingly been renamed as ‘acquisition and disposal costs’ and will include: any re-measurement after initial recognition of deferred contingent consideration which has been classified as a liability; any gains or losses on the revaluation of previous interests; any gains or losses on the disposal of investments, associates or subsidiaries; and costs associated with a combination that do not constitute fees relating to the arrangement of financing. The column may also include items such as gains or losses on the settlement of pre-existing relationships with acquired businesses and the re-measurement of liabilities that are above the value of indemnification. To take into account the aforementioned changes the Group has also moved the impact of the unwind of the discounting of deferred contingent consideration into this column. Accordingly, the comparative consolidated income statement has been re-presented within the financial statements. For the year ending 31 March 2010 acquisition and disposal costs have increased by £2m from £40m to £42m. The column will continue to include the amortisation and impairment of intangible assets arising on consolidation. Each of the items reported under the acquisition and disposal column will be excluded from the calculation of adjusted basic EPS and adjusted diluted EPS (note 2). The Group believes this change will help to improve users of the financial statements understanding of the underlying results.
Items which are of a non-recurring nature and material, when considering both size and nature, are disclosed separately to give a clearer presentation of the Group’s results. These are shown as ‘exceptional items’ on the face of the consolidated income statement together with any adjustments to prior period exceptional items.
On the face of the consolidated income statement, basic and diluted EPS from continuing operations have also been disclosed. This enables the Group to provide clarity of the EPS of the continuing core business. The prior period basic and adjusted EPS have been re-presented to reflect the change in definition of the column ‘acquisition and disposal costs’ resulting in an increase in the adjusted diluted EPS of 0.3p.
The Company has taken advantage of section 408 of the Companies Act not to present its own income statement and statement of comprehensive income.
Presentation of the balance sheet As part of the Group’s brokerage activities in matched principal and exchange traded markets, the Group is required to hold a mix of cash, cash equivalents and other securities with those institutions which provide it with clearing and settlement services. Balances represent deposits held with a clearer. The Group has traditionally accounted for the cash elements of these balances as cash and cash equivalents on the basis that the nature of the Group’s business model, which does not involve it taking proprietary positions, does not put the balances at risk. However, following a review undertaken in 2010/11 it was determined that the balances could not be withdrawn on a same day basis and, as such, failed to meet the definition contained in IAS7 ‘Statement of Cash Flows’ for cash and cash equivalents and it was therefore concluded that these balances should be separately identified on the face of the consolidated balance sheet and separately identified within the consolidated statement of cash flow under cash from operations. The impact of re-presenting the balance results in a decrease in cash of £81m in the prior year and increased restricted funds by the same amount. There is no impact to total current assets.

Basis of preparation continued
6
Basis of consolidation The Group’s consolidated financial statements include the results and net assets of the Company, its subsidiaries and the Group’s share of joint ventures and associates.
An entity is regarded as a subsidiary if the Group has control over its strategic, operating and financial policies and intends to hold the investment on a long-term basis for the purpose of securing a contribution to the Group’s activities.
The results of companies acquired during the year are included in the Group’s results from the effective date of acquisition. The results of companies disposed of during the year are included up to the effective date of disposal.
The Group treats transactions with non-controlling interests as transactions with equity owners of the Group. For purchases from non-controlling interests, the difference between any consideration paid and the relevant share acquired of the carrying value of net assets of the subsidiary is recorded in equity. Gains or losses on disposals to non-controlling interests are also recorded in equity.
Intercompany transactions, balances and unrealised gains on transactions between Group companies (the Company and its subsidiaries) are eliminated as part of the consolidation process. Unrealised losses are also eliminated unless the transaction provides evidence of an impairment of the asset transferred.
A joint venture is an entity in which the Group has an interest and, in the opinion of the directors, exercises joint control over its operating and financial policies. An interest exists where an investment is held on a long-term basis for the purpose of securing a contribution to the Group’s activities. Joint ventures are proportionately consolidated, whereby the Group’s consolidated income statement and balance sheet include the Group’s share of the income and assets on a line-by-line basis.
An associate is an entity in which the Group has an interest and, in the opinion of the directors, can exercise significant influence, but not control, over its operating and financial policies. An interest exists where an investment is held on a long-term basis for the purpose of securing a contribution to the Group’s activities. Significant influence generally exists where the Group holds more than 20% and less than 50% of the shareholders’ voting rights.
Associates are accounted for under the equity method whereby the Group’s consolidated income statement includes its share of their profits and losses and the Group’s consolidated balance sheet includes its share of their net assets.
Foreign currencies In individual entities, transactions denominated in foreign currencies are recorded at the prior month closing exchange rate between the functional currency and the foreign currency. At each end of the reporting period, monetary assets and liabilities that are denominated in foreign currencies are retranslated at the rates prevailing at the end of the reporting period. Exchange differences are recognised in the consolidated income statement, except for exchange differences arising on non-monetary assets and liabilities where these form part of the net investment of an overseas business or are designated as hedges of a net investment or cash flow and, therefore, the changes in value are recognised directly in other comprehensive income. Non-monetary assets and liabilities carried at fair value that are denominated in foreign currencies are translated at the rates prevailing at the date when the fair value was determined.
On consolidation, the results of businesses with non-pound sterling functional currencies are translated into the presentational currency of the Group at the average exchange rates for the period where these approximate to the rate at the date of the transactions. Assets and liabilities of overseas businesses are translated into the presentational currency of the Group at the exchange rate prevailing at the end of the reporting period. Exchange differences arising are recognised within other comprehensive income. Cumulative translation differences arising after the transition to IFRS are taken to the consolidated income statement on disposal of the net investment.
Goodwill and fair value adjustments arising on the acquisition of a non-pound sterling entity are treated as assets and liabilities of that entity and translated into the presentational currency of the Group at the period closing rate. Where applicable, the Group has elected to treat goodwill and fair value adjustments arising before the date of transition to IFRS as denominated in the presentational currency of the Group.
In the consolidated statement of cash flows, cash flows denominated in foreign currencies are translated into the presentational currency of the Group at the average exchange rate for the year or at the rate prevailing at the time of the transaction where more appropriate.
Recent accounting developments The following new standards and amendments to standards are mandatory for the first time for the financial year beginning 1 April 2010 and are considered relevant to the Group.
− IFRS3 (revised), ‘Business Combinations’ and consequential amendments to IAS27, ‘Consolidated and Separate Financial Statements’, IAS28, ‘Investments in Associates’, and IAS31, ‘Interests in Joint Ventures’. These changes apply to the Group prospectively for business combinations enacted on or after 1 April 2010. The revised standard continues to apply the acquisition method to business combinations, with some significant changes. For example, all payments to purchase a business are recorded at fair value at the acquisition date, with contingent payments classed as debt subsequently remeasured through the consolidated income statement. There is a choice on an acquisition-by-acquisition basis to measure the non-controlling interest in the acquiree either at fair value or at the non-controlling interest’s proportionate share of the acquiree’s net assets. All acquisition-related costs should be expensed. The Group expects that the impact on results will depend on the nature of transactions undertaken by the Group. Contingent deferred consideration payable arising from acquisitions enacted before 1 April 2010 will be remeasured in accordance with IFRS3 as movements to goodwill and not through the consolidated income statement as required by IFRS3 (revised).

Basis of preparation continued
7
Recent accounting developments - continued − The amendments to IAS27 have also resulted in changes to the Group’s accounting policies. Previously transactions with non-
controlling interests were treated as transactions with parties external to the Group. Disposals therefore resulted in gains or losses in the consolidated income statement and purchases resulted in the recognition of goodwill. On disposal or partial disposal, a proportionate interest in reserves attributable to the subsidiary was reclassified to the consolidated income statement or directly to retained earnings. Previously, when the Group ceased to have control or significant influence over an entity, the carrying amount of the investment at the date control or date when significant influence was lost, became its cost for the purposes of subsequently accounting for the retained interests as associates, jointly controlled entities or financial assets. The Group has applied the new policy prospectively to transactions occurring on or after 1 April 2010. As a consequence, no adjustments were necessary to any of the amounts previously recognised in the consolidated financial statements.
A number of other interpretations and amendments to existing standards have been made by the IASB and IFRIC but are not considered relevant to the Group’s operations.
The following new standards and amendments to standards and interpretations have been issued, but are not effective for the financial year beginning 1 April 2010 and have not been early adopted:
− Revised IAS24 ‘Related Party Disclosures’ was issued in November 2009 and is required to be applied for accounting periods on or after 1 January 2011. It supersedes IAS24 ‘Related Party Disclosures’ issued in 2003. The impact of the adoption of the standard will result in minor changes to the disclosure.
− IFRS9 ‘Financial Instruments’ addresses clarification and measurement of financial assets, as the first phase of the replacement of IAS39 ‘Financial Instruments: Recognition and Measurement’ and is effective for annual periods beginning after 1 January 2013, subject to EU endorsement. The impact on the Group’s financial statements of the future adoption of the standard is still under review.
Financial risk management The Group operates internationally and is exposed to a variety of financial risks including currency, interest rate, market price, liquidity and credit.
The Group’s overall financial risk management programme focuses on the unpredictability of financial markets and seeks to minimise potential adverse effects on the Group’s financial performance by using derivative instruments to lower funding costs, alter interest rate exposures arising as a result of mismatches between assets and liabilities or to achieve greater certainty of future costs. The use of derivatives forms part of the Group’s overall risk management framework as determined by the board through the Group risk and capital committee (GRACC).
The Group’s funding and exposure to interest rate and FX rate risk are managed by the Group’s treasury function in accordance with a policy framework approved by the GRACC. The framework lays out the Group’s appetite for risk and the steps to be taken to manage these risks. The GRACC receives bi-monthly reports on the activities of the treasury function and is also responsible for approving significant transactions such as new financing arrangements or changes to the Group’s hedging strategy. The GRACC sets and monitors treasury’s counterparty limits in conjunction with the risk team.
The Group’s exposure to market price risk arises mainly through counterparties to matched principal and exchange traded transactions failing to fulfil their obligations or through trade mismatches and other errors. In matched principal transactions, the Group acts as an intermediary by serving as counterparty for identified buyers and sellers in matching, in whole or in part, reciprocal back-to-back trades. In order to facilitate customer transactions and provide liquidity, the Group may participate in certain marketplaces by posting quotations. On occasion, the act of posting quotations in pursuit of customer orders can result in the Group becoming principal to unmatched trades. In exchange traded transactions, the Group executes the trade as principal and then novates the contract to its client. A failure by the client to accept the trade would result in the Group becoming exposed to market price risk.
The market risk the Group faces in these situations is restricted to short-term price movements in the underlying instrument temporarily held by the Group and movements in FX rates. Any such market price risk arising is identified, monitored and reported to senior management on a daily basis and to the GRACC. Policies and procedures are in place to reduce the likelihood of such trade mismatches and, in the event that they arise, the Group’s policy is to liquidate or hedge and liquidate these principal positions as soon as reasonably practicable.
The Company is not exposed to market price risk as it holds no listed investments, and has no trading activity.

Notes to the financial statements
8
1 Segmental information
The Group has determined its operating segments based on the management information reviewed on a regular basis by the Company’s board. The Group considers the executive members of the Company’s board to be the Chief Operating Decision Maker (CODM).
The CODM currently considers the business to consist of core and new business elements, although expects the new business segment to be incorporated into core next year. The core business consists of regional voice brokerage businesses in EMEA, the Americas and Asia Pacific, a global electronic brokerage business active in fixed income interest rate derivatives and FX markets and a global post trade risk and information business. Each of these five business areas are managed and reviewed by the CODM on a stand-alone basis and, as such, are considered segments. In addition, the CODM separately manages and reviews a portfolio of new business initiatives, currently comprising new voice broking businesses, which were either acquired or started during the course of the past two financial years. The Group reviews the composition of the operating segments at the beginning of each fiscal year to determine whether they remain appropriate. Any changes would result in restatement of the figures reported in the prior year for comparative purposes.
Revenue comprises commission from the Group’s core voice business, brokerage or access fees from its electronic business and fees from the provision of post trade risk and information.
Core voice broking Matched principal and stock lending business Certain Group companies are involved in a non-advisory capacity as principals in the matched purchase and sale of securities and other financial instruments between our customers. Revenue is generated from the difference between the purchase and sale proceeds and is recognised in full at the time of the commitment by our customers to sell and purchase the security or financial instrument. The revenue generated by the stock lending business is not material to the Group.
Agency business (name give-up transactions) The Group acts in a non-advisory capacity to match buyers and sellers of financial instruments and raises invoices for the service provided. The Group does not act as principal in name give-up transactions and only receives and transmits orders between counterparties. Revenue is stated net of rebates and discounts, value added tax and other sales taxes and is recognised in full on the date of the trade. Amounts receivable at the year end are reported as other trade receivables within trade and other receivables.
For the shipbroking business, the Group acts in a non-advisory capacity to match buyers and sellers of services and recognises revenue, net of rebates and discounts, value added tax and other sales taxes when the Group has a contractual entitlement to commission, normally the point at which there is a completion of contractual terms between the principals of a transaction. Amounts receivable at the year end are reported as other trade receivables within trade and other receivables.
Execution on exchange business The Group also acts as a broker of exchange listed products, where the Group executes customer orders as principal and then novates the trade to the underlying customers’ respective clearing broker for settlement. Revenue is generated from either the difference between the purchase and sale proceeds or by invoice, depending on the product, market and agreements in place with the customer and is recognised on the trade date.
Electronic broking The Group acts as a broker for FX, interest rate derivatives, fixed income products and CDS through the Group’s electronic platforms. Revenue is generated from brokerage fees which are dependent on the customer's global coverage and average trading volumes. The Group also charges fees to use the electronic trading platform for access to liquidity in the FX or precious metal markets.
Post trade risk and information The Group receives fees from the sale of financial information and provision of post trade risk and information to third parties. These are stated net of value added tax, rebates and other sales taxes and recognised in revenue on an accruals basis to match the provision of the service. Amounts receivable at the year end are reported as other trade receivables within trade and other receivables.
Reorganisation of portfolio The new business segment principally consists of Brazil, intellectual property, base metals, UK and Asia financial futures. For the period commencing 1 April 2010, Link and ICAP Shipping have been moved out of the new business segment as they are no longer new to the Group. Link has been split between each of the three core voice segments. ICAP Shipping is now included within EMEA voice broking. Comparatives have been re-presented to show the impact. Each of the operating segments of the Group is managed on a day-to-day basis by one or more members of the GEMG, which consists of both members of the board and other senior management. The management of new businesses is dependent on which core area the business will eventually become part of. TriOptima, acquired on 24 March 2010, is included within post trade risk and information and not as a new business, as the Group held a minority interest prior to the acquisition and has had a significant influence over the business since inception.
As a result of the decreasing number of new businesses set-up or established over the past two financial years, it is planned to discontinue the new business segment for the year ending 31 March 2012 and instead to combine the initiatives into the segment operated by the appropriate member of the GEMG. The decision to no longer report the new business segment reflects management’s decision 12 months ago to focus on organic expansion and developing partnerships with customers. This has resulted in a low level of new business initiatives which do not otherwise meet the criteria to be reported under the core segments. No longer presenting new businesses separately will result in the other segments initially showing lower margins while businesses such as Brazil move towards operational maturity.

Notes to the financial statements continued
9
1 Segmental information continued The Group continues to disclose an operating segment for the voice broking business in Asia Pacific even though this segment does not meet the quantitative thresholds to be mandatory under IFRS8 ‘Operating Segments’. This is to reflect the importance of the Asia Pacific region to the Group and the way the segment is managed.
Year ended 31 March 2011 Core voice broking
EMEA
£mAmericas
£mAsia Pacific
£m
Electronic broking
£m
Post trade risk and
information £m
New businesses
£mTotal
£m
Continuing operations Revenue 578 471 134 302 184 72 1,741Operating profit before acquisition and disposal costs and exceptional items 114 83 (3) 123 79 (21) 375Reconciliation to the consolidated income statement: Acquisition and disposal costs (88)Exceptional items (3)Operating profit 284Finance income 5Finance costs (53)Share of loss of associates after tax (3)Profit before tax from continuing operations 233Tax (50)Profit for the year from continuing operations 183Profit after tax from discontinued operations 4Profit for the year 187
Details of total gross debt and total cash reviewed by the CODM can be found in notes 8(c) and 7(c) respectively.
Year ended 31 March 2010 Core voice broking
EMEA
£mAmericas
£mAsia Pacific
£m
Electronic broking
£m
Post trade risk and
information £m
New businesses
£m Total
£m
Continuing operations Revenue 570 460 127 252 142 54 1,605Operating profit before acquisition and disposal costs and exceptional items 119 83 7 100 69 (24) 354Reconciliation to the consolidated income statement: Acquisition and disposal costs (61)Exceptional items (26)Operating profit 267Finance income 7Finance costs (35)Share of profit of associates after tax 8Profit before tax from continuing operations 247Tax (83)Profit for the year from continuing operations 164Loss after tax from discontinued operations (48)Profit for the year 116
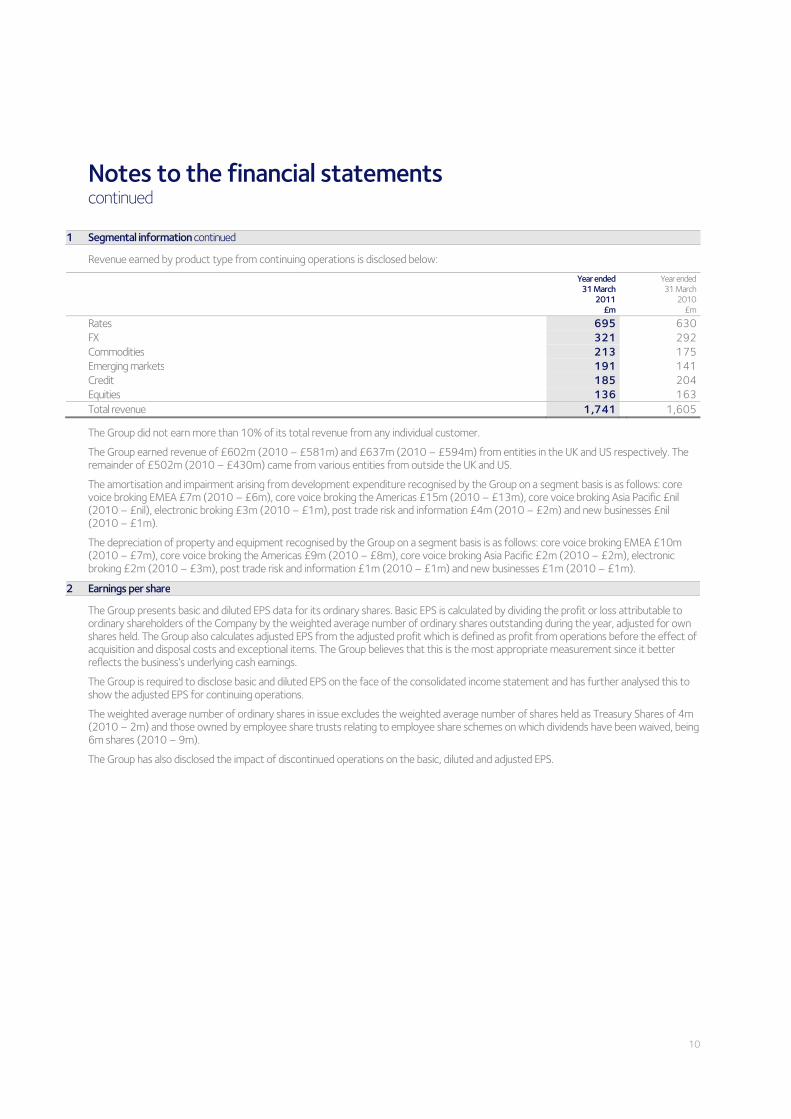
Notes to the financial statements continued
10
1 Segmental information continued
Revenue earned by product type from continuing operations is disclosed below:
Year ended 31 March
2011 £m
Year ended 31 March
2010 £m
Rates 695 630FX 321 292Commodities 213 175Emerging markets 191 141Credit 185 204Equities 136 163Total revenue 1,741 1,605
The Group did not earn more than 10% of its total revenue from any individual customer.
The Group earned revenue of £602m (2010 – £581m) and £637m (2010 – £594m) from entities in the UK and US respectively. The remainder of £502m (2010 – £430m) came from various entities from outside the UK and US.
The amortisation and impairment arising from development expenditure recognised by the Group on a segment basis is as follows: core voice broking EMEA £7m (2010 – £6m), core voice broking the Americas £15m (2010 – £13m), core voice broking Asia Pacific £nil (2010 – £nil), electronic broking £3m (2010 – £1m), post trade risk and information £4m (2010 – £2m) and new businesses £nil (2010 – £1m).
The depreciation of property and equipment recognised by the Group on a segment basis is as follows: core voice broking EMEA £10m (2010 – £7m), core voice broking the Americas £9m (2010 – £8m), core voice broking Asia Pacific £2m (2010 – £2m), electronic broking £2m (2010 – £3m), post trade risk and information £1m (2010 – £1m) and new businesses £1m (2010 – £1m).
2 Earnings per share
The Group presents basic and diluted EPS data for its ordinary shares. Basic EPS is calculated by dividing the profit or loss attributable to ordinary shareholders of the Company by the weighted average number of ordinary shares outstanding during the year, adjusted for own shares held. The Group also calculates adjusted EPS from the adjusted profit which is defined as profit from operations before the effect of acquisition and disposal costs and exceptional items. The Group believes that this is the most appropriate measurement since it better reflects the business’s underlying cash earnings.
The Group is required to disclose basic and diluted EPS on the face of the consolidated income statement and has further analysed this to show the adjusted EPS for continuing operations.
The weighted average number of ordinary shares in issue excludes the weighted average number of shares held as Treasury Shares of 4m (2010 – 2m) and those owned by employee share trusts relating to employee share schemes on which dividends have been waived, being 6m shares (2010 – 9m).
The Group has also disclosed the impact of discontinued operations on the basic, diluted and adjusted EPS.

Notes to the financial statements continued
11
2 Earnings per share continued
(a) EPS relating to the Group’s total operations
Year ended 31 March 2011 Year ended 31 March 2010
Basic and diluted Earnings
£mShares millions
Earnings per share
penceEarnings
£m Shares millions
Earnings per share
pence
Basic 187 652 28.7 116 643 18.0Dilutive effect of share options – 10 (0.5) – 11 (0.3)Diluted basic 187 662 28.2 116 654 17.7
Year ended 31 March 2011 Year ended 31 March 2010*
Adjusted basic and diluted Earnings
£mShares millions
Earnings per share
penceEarnings
£m Shares millions
Earnings per share
pence
Basic 187 652 28.7 116 643 18.0Acquisition and disposal costs 62 – 9.5 42 – 6.5Exceptional items net of tax (note 5) 11 – 1.7 52 – 8.1Adjusted basic 260 652 39.9 210 643 32.6Dilutive effect of share options – 10 (0.6) – 11 (0.5)Adjusted diluted 260 662 39.3 210 654 32.1
*Adjusted basic and diluted EPS have been re-presented to reflect the change in definition of the column ‘acquisition and disposal costs’ in the consolidated income statement.
(b) EPS relating to the Group’s continuing operations
Year ended 31 March 2011 Year ended 31 March 2010
Basic and diluted Earnings
£mShares millions
Earnings per share
penceEarnings
£m Shares millions
Earnings per share
pence
Basic 183 652 28.1 164 643 25.5Dilutive effect of share options – 10 (0.5) – 11 (0.4)Diluted basic 183 662 27.6 164 654 25.1
Year ended 31 March 2011 Year ended 31 March 2010*
Adjusted basic and diluted Earnings
£mShares millions
Earnings per share
penceEarnings
£m Shares millions
Earnings per share
pence
Basic 183 652 28.1 164 643 25.5Acquisition and disposal costs 62 – 9.5 42 – 6.5Exceptional items net of tax (note 5) 15 – 2.3 22 – 3.4Adjusted basic 260 652 39.9 228 643 35.4Dilutive effect of share options – 10 (0.6) – 11 (0.5)Adjusted diluted 260 662 39.3 228 654 34.9
*Adjusted basic and diluted EPS have been re-presented to reflect the change in definition of the column ‘acquisition and disposal costs’ in the consolidated income statement.

Notes to the financial statements continued
12
2 Earnings per share continued
(c) EPS relating to the Group’s discontinued operations
Year ended 31 March 2011 Year ended 31 March 2010
Basic and diluted Earnings
£mShares millions
Earnings per share
penceEarnings
£m Shares millions
Earnings per share
pence
Basic 4 652 0.6 (48) 643 (7.5)Dilutive effect of share options – 10 – – 11 0.1Diluted basic 4 662 0.6 (48) 654 (7.4)
Year ended 31 March 2011 Year ended 31 March 2010
Adjusted basic and diluted Earnings
£mShares millions
Earnings per share
penceEarnings
£m Shares millions
Earnings per share
pence
Basic 4 652 0.6 (48) 643 (7.5)Exceptional items net of tax (note 5) (4) – (0.6) 30 – 4.7Adjusted basic – 652 – (18) 643 (2.8)Dilutive effect of share options – 10 – – 11 –Adjusted diluted – 662 – (18) 654 (2.8)
3 Dividends payable
The Company recognises the final dividend payable only when it has been approved by the shareholders of the Company in a general meeting. The interim dividend is recognised when the amount due has been paid.
Amounts recognised as distributions to equity holders in the year:
Year ended 31 March
2011 £m
Year ended 31 March
2010 £m
Final dividend for the year ended 31 March 2010 of 12.44p per ordinary share (2009 – 12.35p) 81 79Interim dividend for the year ended 31 March 2011 of 5.27p per ordinary share (2010 – 5.11p) 34 33Total dividend recognised in year 115 112
The final dividend for the year ended 31 March 2010 was satisfied with a cash payment of £56m and a scrip dividend of 6,267,039 ICAP ordinary shares issued at £3.985 (value £25m).
The directors have proposed a final dividend of 14.68p per share for the year ended 31 March 2011. This has not been recognised as a liability of the Group at the year end as it has not yet been approved by shareholders. Based on the number of shares in issue at the year end, the total amount payable would be £96m.
No scrip dividend alternative was offered in relation to the interim dividend for the year ended 31 March 2011.
The right to receive dividends has been waived in respect of the shares held in employee share trusts and no dividend is payable on Treasury Shares.

Notes to the financial statements continued
13
4 Tax
Tax on the profit for the year comprises both current and deferred tax as well as adjustments in respect of prior years. Tax is charged or credited to the consolidated income statement, except when it relates to items charged or credited to other comprehensive income or directly to equity, in which case the tax is also included in other comprehensive income or directly within equity, respectively.
Current tax is the expected tax payable on the taxable income for the period, using tax rates enacted, or substantively enacted by the end of the reporting period.
Deferred tax is recognised using the liability method, in respect of temporary differences between the carrying value of assets and liabilities for reporting purposes and the amounts charged or credited for tax purposes. Deferred tax is calculated at the rate of tax expected to apply when the liability is settled or the asset is realised. A deferred tax asset is recognised only to the extent that it is probable that future taxable profits will be available against which the asset can be utilised.
Deferred tax is provided on temporary differences arising on investments in subsidiaries, joint ventures, associates and intangibles arising on consolidation, except where the timing of the reversal of the temporary difference is controlled by the Group and it is probable that the temporary difference will not reverse in the foreseeable future. No provision is made in respect of any further tax liability that would arise on the distribution of retained earnings of overseas joint ventures and associates.
Deferred tax liabilities are offset against deferred tax assets within the same taxable entity or qualifying local tax group where there is both the legal right and the intention to settle on a net basis or to realise the asset and settle the liability simultaneously.
Significant judgement is required in determining the Group’s income tax liabilities. In arriving at the current and deferred tax liability the Group has taken account of tax issues that are subject to ongoing discussions with the relevant tax authorities. Calculations of these liabilities have been based on management’s assessment of legal and professional advice, case law and other relevant guidance. Where the expected tax outcome of these matters is different from the amounts that were recorded initially, such differences will impact the current and deferred tax amounts in the period in which such determination is made.
Tax charged to the consolidated income statement in the year
Year ended 31 March
2011 £m
Year ended 31 March
2010 £m
Current tax – current year 111 98– double tax relief (1) (1)– adjustment to prior years (26) (5) 84 92Deferred tax – deferred tax on origination and reversal of timing differences (33) (9)– deferred tax impact of changes in tax rates (1) - (34) (9)Total tax charged to consolidated income statement – continuing operations 50 83Tax charge/(credited) to the consolidated income statement for discontinued operations can be analysed as follows: Tax credit on discontinued operations, excluding exceptional items – (7)Tax charge/(credited) on exceptional items – discontinued operations 2 (11)Total tax charge/(credited) to the consolidated income statement – discontinued operations 2 (18)Total tax charged to the consolidated income statement 52 65Tax charged to the consolidated income statement for continuing operations can be analysed as follows: Total tax charged to the consolidated income statement – continuing operations 50 83Tax credit on acquisition and disposal costs 32 20Tax credit on exceptional items – continuing operations 8 4Tax on profit before acquisition and disposal costs and exceptional items 90 107
The Group’s share of profit of associates in the consolidated income statement is shown net of tax of £2m (2010 – £3m).
The Group’s effective tax rate is reduced by 6% to 26% (2010 – 32%), due to a one-off settlement reached with tax authorities.
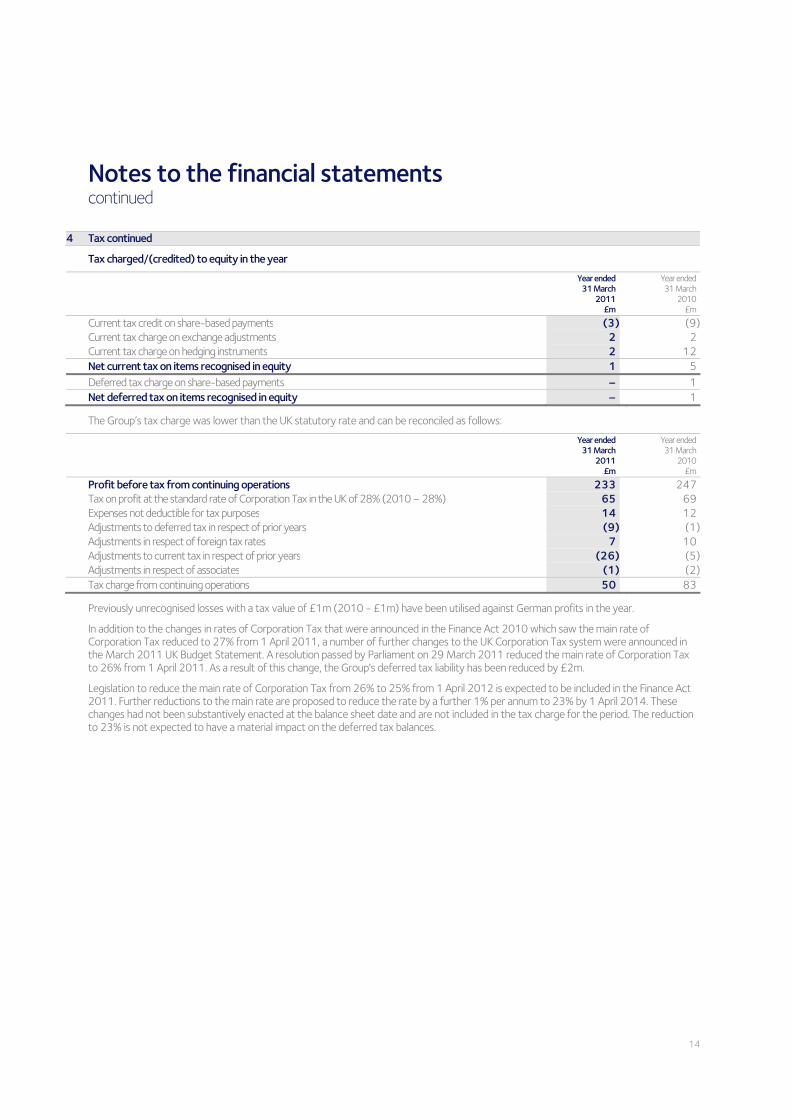
Notes to the financial statements continued
14
4 Tax continued
Tax charged/(credited) to equity in the year
Year ended 31 March
2011 £m
Year ended 31 March
2010 £m
Current tax credit on share-based payments (3) (9)Current tax charge on exchange adjustments 2 2Current tax charge on hedging instruments 2 12Net current tax on items recognised in equity 1 5Deferred tax charge on share-based payments – 1Net deferred tax on items recognised in equity – 1
The Group’s tax charge was lower than the UK statutory rate and can be reconciled as follows:
Year ended 31 March
2011 £m
Year ended 31 March
2010 £m
Profit before tax from continuing operations 233 247Tax on profit at the standard rate of Corporation Tax in the UK of 28% (2010 – 28%) 65 69Expenses not deductible for tax purposes 14 12Adjustments to deferred tax in respect of prior years (9) (1)Adjustments in respect of foreign tax rates 7 10Adjustments to current tax in respect of prior years (26) (5)Adjustments in respect of associates (1) (2)Tax charge from continuing operations 50 83
Previously unrecognised losses with a tax value of £1m (2010 - £1m) have been utilised against German profits in the year.
In addition to the changes in rates of Corporation Tax that were announced in the Finance Act 2010 which saw the main rate of Corporation Tax reduced to 27% from 1 April 2011, a number of further changes to the UK Corporation Tax system were announced in the March 2011 UK Budget Statement. A resolution passed by Parliament on 29 March 2011 reduced the main rate of Corporation Tax to 26% from 1 April 2011. As a result of this change, the Group's deferred tax liability has been reduced by £2m.
Legislation to reduce the main rate of Corporation Tax from 26% to 25% from 1 April 2012 is expected to be included in the Finance Act 2011. Further reductions to the main rate are proposed to reduce the rate by a further 1% per annum to 23% by 1 April 2014. These changes had not been substantively enacted at the balance sheet date and are not included in the tax charge for the period. The reduction to 23% is not expected to have a material impact on the deferred tax balances.

Notes to the financial statements continued
15
4 Tax continued
Deferred tax – Group The movement in deferred tax balance is as follows:
Goodwill
£m
Intangible assets
arising on consolidation
£m
Employee-related
items £m
Deferred income and
accrued expenses
£m
Losses carried
forward £m
Other £m
Total £m
Net balances at 31 March 2009 (11) (139) 18 8 8 (8) (124)Tax (charge)/credit (23) 19 (1) 2 (6) 18 9Acquisition – (31) – – – – (31)Reserves (1) – – – – – (1)FX (1) 7 (1) 2 – – 7 (36) (144) 16 12 2 10 (140) Deferred tax assets at 31 March 2010 7 – 28 18 2 10 65Deferred tax liabilities at 31 March 2010 (43) (144) (12) (6) – – (205)Net balances at 31 March 2010 (36) (144) 16 12 2 10 (140) Tax (charge)/credit (8) 32 4 (5) 8 3 34Reserves – – 4 1 – (5) –FX 2 5 – (1) – – 6 (42) (107) 24 7 10 8 (100) Deferred tax assets at 31 March 2011 13 1 44 10 10 21 99Deferred tax liabilities at 31 March 2011 (55) (108) (20) (3) – (13) (199)Net balances as at 31 March 2011 (42) (107) 24 7 10 8 (100)
Deferred tax balances after offset of balances within countries
Year ended 31 March
2011 £m
Year ended 31 March
2010 £m
Deferred tax assets 17 34Deferred tax liabilities (117) (174)Net balances (100) (140)
Deferred tax assets of £5m have been re-instated in respect of German losses remaining unutilised at the year end.
Deferred tax assets of £8m (2010 – £6m) have not been recognised in respect of certain trading losses because it is not probable that future profit will be available against which the Group can utilise the benefits.
The principal movement in deferred tax relates to the ongoing release of the deferred tax liability on the amortisation of intangibles arising on consolidation.

Notes to the financial statements continued
16
5 Exceptional items
Exceptional items are significant items of a non-recurring nature and considered material in both size and nature. These are disclosed separately to enable a full understanding of the Group’s financial performance. Transactions which may give rise to exceptional items are principally gains and losses on disposal of investments and other large gains and losses not attributable to the normal course of the Group’s activities. These are shown as ‘exceptional items’ on the face of the consolidated income statement.
Year ended 31 March
2011 £m
Year ended 31 March
2010 £m
Exceptional items – continuing businesses Total exceptional items before tax – continuing business (23) (26) Tax 8 4 Total exceptional items after tax – continuing businesses (15) (22) Exceptional items – discontinued business Total exceptional items before tax - discontinued business 6 (41)Tax (2) 11 Total exceptional items after tax – discontinued business 4 (30)
For the year ended 31 March 2011, the Group recognised an exceptional pre-tax charge in its continuing business of £23m in respect of the recoverability of the loans made to a number of associates active in non-core agency voice markets (£20m) and SEC settlement-related costs (£3m). During the twelve months to 31 March 2010, the Group recognised a pre-tax exceptional charge of £26 million in respect of settling the SEC matter (£21m) and the continuing cash equities business (£5m).
A post-tax credit of £4m relating to a reversal of a prior year exceptional charge (2010 – £nil) was also recognised for the year ended 31 March 2011. For the 12 months to 31 March 2010, the Group recognised a post-tax exceptional charge of £30m in respect of the closure of its European and Asia Pacific full service agency cash equities businesses.

Notes to the financial statements continued
17
6 Operating expenses
Profit before tax from continuing operations is stated after charging:
Year ended 31 March
2011 £m
Year ended 31 March
2010 £m
Employee costs 1,001 950Information technology costs 163 141Amortisation and impairment of intangible assets arising on consolidation 84 61Professional and legal fees (including auditors’ remuneration) 20 20Amortisation and impairment of intangible assets arising from development expenditure 29 23Depreciation of property and equipment 25 22Governance costs* 13 8Clearing and settlement fees 19 18Operating lease rentals – minimum lease payments 23 23Exchange adjustments 6 7Other** 95 84Total 1,478 1,357Auditors’ remuneration Fees payable to the Company’s auditor for the audit of the Company’s annual financial statements 0.4 0.5Fees payable to the Company’s auditor for other services: – for the audit of the Company’s subsidiaries 3.2 2.6– regulatory 1.4 0.3– tax services 0.7 0.5– corporate finance services 0.1 0.2– other 0.3 0.1 6.1 4.2
* Governance costs include fees associated with risk, compliance, internal audit and legal.
** Other includes exceptional costs (note 5) of £3m (2010 – £26m).
Contractual arrangements The Group places reliance on a number of key suppliers to carry out its business effectively and has procedures to ensure that purchasing decisions balance cost against other factors including service quality, global reach and resilience.
The success of ICAP’s core voice broking business is reliant on its ability to attract and retain highly qualified staff. Staff costs represent approximately 68% of total costs. A number of legal arrangements, including rolling term contracts and non-compete arrangements, are employed to mitigate the risk of key staff being lost to competitors.
Information technology costs which represent approximately 11% of total costs are key to the delivery of both voice and electronic products. The Group seeks to ensure that its systems have full redundancy and are capable of operating from business continuity sites.
The balance of costs represent premises, governance, clearing and other costs. These represent 21% of total costs.
The settlement of matched principal and exchange traded businesses requires access to clearing houses either directly or through third party providers of clearing and settlement services. In North America the Group is a member of the FICC and NSCC through which it clears US Treasury products, agency, mortgage and equity trades for its customer base. In Europe and Asia Pacific, with the exception of base metal clearing on LCH.Clearnet Group Ltd, the majority of the Group’s clearing activities are outsourced to third parties where ICAP seeks to partner with one of the leading clearing providers in each market.

Notes to the financial statements continued
18
7 Cash
Cash and cash equivalents comprise cash on hand, demand deposits and other short-term highly liquid investments which are subject to insignificant risk of change in fair value and are readily convertible into a known amount of cash with less than three months maturity.
The Group holds money, and occasionally financial instruments, on behalf of customers (client monies) in accordance with local regulatory rules. Since the Group is not beneficially entitled to these amounts, they are excluded from the consolidated balance sheet along with the corresponding liabilities to customers.
Restricted funds are comprised of cash held with a CCP clearing house, or a financial institution providing ICAP with access to a CCP, and funds set aside for regulatory purposes, but excluding client money. The funds represent cash for which the Group does not have immediate and direct access or for which regulatory requirements restrict the use of the cash.
(a) Reconciliation of Group profit before tax to net cash flow from operating activities
Group Year ended
31 March 2011
£m
Group Year ended 31 March
2010 £m
Profit before tax from continuing operations 233 247Profit/(loss) before tax from discontinued operations 6 (66)Discontinued operations exceptional item (note 5) (6) 41Operating exceptional items 23 26Share of operating profits of associates after tax (3) (7)Amortisation and impairment of intangible assets arising on consolidation 84 61Amortisation and impairment of intangible assets arising from development expenditure 29 23Depreciation of property and equipment 25 22Other amortisation and impairments 10 4Share-based payments 8 10Net finance expense 28 28Operating cash flows before movements in working capital 437 389(Increase)/decrease in trade and other receivables (66) 26Decrease/(increase) in restricted funds 6 (1)Decrease in trade and other payables (14) (53)Net receipts in respect of financial assets held at fair value – 4Cash generated by operations before exceptional items 363 365Operating exceptional items paid (21) (21)Cash generated by operations 342 344Interest received 3 3Interest paid (30) (17)Tax paid (59) (55)Net cash flow from operating activities 256 275
The movement in trade and other receivables and trade and other payables excludes the impact of the gross-up of matched principal trades as permitted by IAS7 ‘Statement of Cash Flows’. The gross-up has no impact on the cash flow or net assets of the Group. The cash flow movement in trade and other receivables includes the net movement on matched principal transactions and deposits for securities borrowed/loaned. The movement for the year ended 31 March 2011, after accounting for acquisitions, is an outflow of £18m (2010 inflow of £20m).
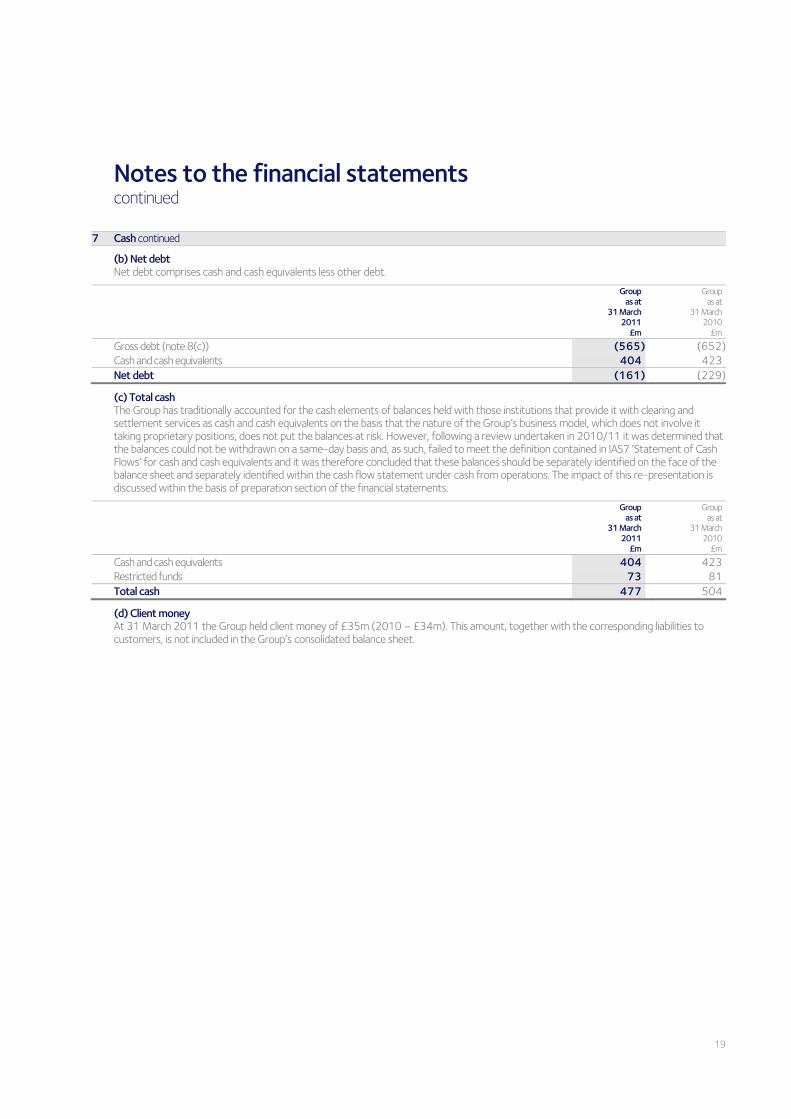
Notes to the financial statements continued
19
7 Cash continued
(b) Net debt Net debt comprises cash and cash equivalents less other debt.
Group as at
31 March 2011
£m
Group as at
31 March 2010
£m
Gross debt (note 8(c)) (565) (652)Cash and cash equivalents 404 423Net debt (161) (229)
(c) Total cash The Group has traditionally accounted for the cash elements of balances held with those institutions that provide it with clearing and settlement services as cash and cash equivalents on the basis that the nature of the Group’s business model, which does not involve it taking proprietary positions, does not put the balances at risk. However, following a review undertaken in 2010/11 it was determined that the balances could not be withdrawn on a same-day basis and, as such, failed to meet the definition contained in IAS7 ‘Statement of Cash Flows’ for cash and cash equivalents and it was therefore concluded that these balances should be separately identified on the face of the balance sheet and separately identified within the cash flow statement under cash from operations. The impact of this re-presentation is discussed within the basis of preparation section of the financial statements.
Group as at
31 March 2011
£m
Group as at
31 March 2010
£m
Cash and cash equivalents 404 423Restricted funds 73 81Total cash 477 504
(d) Client money At 31 March 2011 the Group held client money of £35m (2010 – £34m). This amount, together with the corresponding liabilities to customers, is not included in the Group’s consolidated balance sheet.

Notes to the financial statements continued
20
8 Borrowings
Long-term borrowings are recognised initially at fair value, being their issue proceeds net of transaction costs incurred. At subsequent reporting dates long-term borrowings are held at amortised cost using the effective interest rate method, with changes in value recognised through the consolidated income statement. Transaction costs are recognised in the consolidated income statement over the period of the borrowings using the effective interest rate method.
(a) Long-term borrowings
Group year ended 31 March
2011 £m
Group year ended 31 March
2010 £m
As at 1 April 395 270New long-term borrowings – 257Issue costs capitalised – (3)Amortisation of issue costs – 1Repaid in the year – (135)Exchange adjustment (9) 3Fair value hedging adjustment (4) 2As at 31 March 382 395Analysis of long-term borrowings Subordinated loan notes repayable 2015 120 127Five year senior notes 262 268As at 31 March 382 395
The Group has in issue $193m of guaranteed subordinated loan notes repayable in 2015 paying a coupon of LIBOR plus 1.95%.
The Group also has in issue €300m of five-year senior notes (the ‘Notes’) repayable in July 2014 with a coupon of 7.5%. The Notes were issued at a price of €99.496, and are shown net of both this discount and fees of £1m (2010 - £2m) directly attributable to the issue. The carrying value of the Notes of £263m (2010 - £270m) includes a fair value hedging adjustment to decrease the carrying value by £2m (2010 - £2m increase) relating to the mark-to-market of the interest portion of the Notes.
To enable the Group to manage the translational exposure which arises as a result of the Notes being denominated in euros and to meet its risk management objective of minimising both interest cost and the impact of interest volatility on its consolidated income statement, the Group entered into a number of cross-currency swaps to convert its obligations over the life of the Notes from euros to pound sterling. €100m of the Notes have been swapped from a fixed euro-denominated coupon of 7.5% to a fixed pound sterling denominated coupon of 8.58% and the remaining €200m from a fixed euro-denominated coupon of 7.5% to a floating pound sterling denominated coupon of six month LIBOR plus 4.92%. The fixed to fixed swaps have been accounted for as a cash flow hedge and at 31 March 2011 have a fair market value of £1m liability (2010 – £2m asset). These swaps offset the effect of FX on the Notes, which resulted in a £nil charge (2010 – £nil) being recognised in the consolidated income statement and £2m charge (2010 – £3m charge) in other comprehensive income during the year. The fixed to floating swaps have been treated as a fair value hedge, have a fair market value of £5m (2010 – £11m) at 31 March 2011 and resulted in a £6m charge (2010 – £11m gain) being recognised in the consolidated income statement during the year. The impact on the consolidated income statement relating to the fair value movement on the Notes is a £6m credit (2010 – £9m charge).
The fair value of the long-term borrowings is not materially different from their book values.
There are no long-term external borrowings in the Company.
(b) Short-term borrowings
Group as at
31 March 2011
£m
Group as at
31 March 2010
£m
Company as at
31 March 2011
£m
Company as at
31 March 2010
£m
Revolving credit facility – net of fees 183 217 – –European Commercial Paper – 40 – 40 183 257 – 40

Notes to the financial statements continued
21
8 Borrowings continued
On 7 May 2010, the Group refinanced its £473m three-year unsecured revolving credit facility (RCF) and $94m swingline with a new $880m revolving credit facility incorporating an up to $200m swingline facility, with a maturity date of 31 May 2013. The drawings under the revolving credit facility as at 31 March 2011 of £183m (2010 – £217m) are net of capitalised fees of £4m (2010 – £nil). To take advantage of lower short-term interest rates, the amounts drawn as at 31 March 2011 were for a one-week period and have been included within short-term borrowings. The facility carries a floating interest rate at LIBOR plus 2% with an additional 0.50% payable dependent on the debt to earnings ratio. The weighted average effective interest rate for the year was 2.2% (2010 – 1.0%).
The Group continues to issue commercial paper under its £500m European Commercial Paper (ECP) programme, providing a diverse source of finance for the Group’s working capital and margin requirements. During the year there was regular issuance, however, at 31 March 2011 the Group had none in issue (2010 – €45m (£40m)). The weighted average effective interest rate was 0.9% (2010 – 1.0%).
Bank overdrafts are for short-term funding and are repayable on demand, and are generally being repaid within a very short time period. There were £nil overdrafts at 31 March 2011 (2010 – £nil).
The Group’s bank facilities contain a number of customary financial and operational covenants. The Group remained in compliance with the terms of these covenants throughout the year ended 31 March 2011.
Under the terms of the Group’s bank financings, the Company is required to remain as the ultimate holding company in the Group. A change in ownership of the Company could result in the Group’s three-year unsecured revolving credit facility becoming repayable.
The fair value of the short-term borrowings is not materially different from their book values.
(c) Liquidity risk management Group Through the GRACC, the board regularly reviews the liquidity demands of the Group. The objective is to ensure that each entity has access to appropriate forms of liquidity to meet their forecast regulatory, commercial and settlement requirements. The GRACC also ensures that the Group, in totality, has sufficient headroom to provide constant access, even in periods of market turmoil, to an appropriate level of cash, other forms of marketable securities and committed funding lines to enable it to finance its ongoing operations, proposed acquisitions and other reasonable unanticipated events on cost-effective and attractive terms.
At 31 March 2011, the Group had gross debt of £565m (2010 – £652m) and cash and cash equivalents of £404m (2010 – £423m) (see note 7(b)). It is the Group’s policy to only hold cash necessary to meet local regulatory, commercial, settlement and short-term working capital requirements and for excess cash to be used to reduce gross debt. Cash has decreased from 31 March 2010 due to repayment of borrowings during the year and payment of interest on the Notes.
The Group invests its cash balances in a range of capital protected instruments including money market deposits, AAA liquidity funds and government bonds with the objective of optimising the return, while having regard to security, liquidity and counterparty risk. With the exception of some small, local cash management balances, surplus cash is invested with strong investment grade institutions which have an equivalent credit rating of A or better and are marked-to-market at the end of each reporting period. Counterparty limits applied are reviewed by the GRACC in conjunction with the risk function.
Although the Group does not undertake proprietary trading, it is subject to a combination of margin and collateral requirements of the clearing houses or financial institutions which provide ICAP with access to the clearing houses. The most significant margin requirements arise in the US where, as part of its broking business, it provides clearing services to customers and is required to deposit margin with the FICC and NSCC. During the year to 31 March 2011, these deposits averaged $33m. Cash held at clearing houses, or a financial institution providing ICAP with access to a CCP, is now separately disclosed as restricted funds (see note 7). The deposits are met through a combination of internal cash resources and the $200m swingline facility. The Group has no other material margin requirements on a routine basis.
To provide protection against unexpected events, the Group has traditionally maintained minimum core liquidity, in the form of cash and undrawn debt facilities, of £150m ($250m). The headroom remained undrawn throughout the year. At 31 March 2011, the Group had committed headroom under its core credit facilities of £362m (2010 – £318m).

Notes to the financial statements continued
22
8 Borrowings continued
Committed facilities
Group as at
31 March 2011
£m Drawn
Group as at
31 March 2011
£m Undrawn*
Group as at
31 March 2010
£m Drawn
Group as at
31 March 2010
£mUndrawn
Less than one year 183 – 257 –Between one and two years – – – 318Between two and five years 382 362 395 – 565 362 652 318
*The undrawn balance has been classified based on the maturity date of the facility.
As at 31 March 2011, the Group’s long-term issuer default rating on senior debt was BBB+ by Fitch and Baa2 by Moody’s. There has been no changes in ratings since 31 March 2010.
Company The Company seeks to ensure that it has constant access to an appropriate level of cash and funding to enable it to fund its ongoing operations, proposed acquisitions and other reasonable unanticipated events on cost-effective and attractive terms.
If the Company has any cash, it is loaned intra-group for further investment. All of the Company’s financial liabilities are payable within three months, with the exception of a subordinated loan owed to a subsidiary of £140m which has a maturity date of 26 March 2014.
9 Matched principal transactions
Matched principal transactions are those where the Group acts in a non-advisory capacity as principal in the commitment to purchase and sell securities and other financial instruments through two or more transactions between our customers. Such trades have no contractual settlement date and are complete only when all sides of the transaction are settled, and therefore an aged analysis of matched principal trade receivables is not appropriate. Substantially all matched principal receivables and payables settle within a short period of time, usually within three days of trade date. Any unsettled trades that have gone beyond their normal settlement date remain in matched principal receivables or payables as appropriate.
The gross amount of matched principal transactions included in both trade and other receivables and trade and other payables is £73,454m (2010 – £58,626m).
Certain Group companies are involved in collateralised stock lending transactions as an intermediary between counterparties. The gross amount of these transactions included within trade and other receivables and trade and other payables is £747m (2010 – £1,034m).

Notes to the financial statements continued
23
10 Events after the balance sheet date
On 8 April 2011, the FSA approved the Group’s application to renew its waiver from investment firm consolidation for a further period of five years.
11 Exchange rates
The principal exchange rates which affect the Group, expressed in currency per pound sterling, are shown below:
Closing rate as at
31 March 2011
Closing rate as at
31 March 2010
Average rate year ended 31 March
2011
Average rate year ended 31 March
2010
Dollar 1.60 1.52 1.56 1.59Euro 1.13 1.12 1.17 1.13Yen 132.85 141.74 133.10 147.35
Notes to the financial statements continued
24
Statement of directors’ responsibilities for the Annual Report The directors are responsible for preparing the Annual Report, the remuneration report and the financial statements in accordance with applicable law and regulations.
Company law requires the directors to prepare financial statements for each financial year. Under that law the directors have elected to prepare the Company and Group financial statements in accordance with International Financial Reporting Standards (IFRS) as adopted by the EU. Under company law the directors must not approve the financial statements unless they are satisfied that they give a true and fair view of the state of affairs of the Company and the Group and of the profit or loss of the Group for that period.
In preparing these financial statements, the directors are required to:
− select suitable accounting policies and then apply them consistently;
− make judgements and accounting estimates that are reasonable and prudent;
− state whether applicable IFRSs as adopted by the EU have been followed, subject to any material departures disclosed and explained in the financial statements; and
− prepare the financial statements on the going concern basis unless it is inappropriate to presume that the Company and the Group will continue in business.
The directors are responsible for keeping adequate accounting records that are sufficient to show and explain the Company’s and the Group’s transactions and disclose with reasonable accuracy at any time the financial position of the Company and the Group and enable them to ensure that the financial statements and the remuneration report comply with the Companies Act 2006 and, as regards the Group financial statements, Article 4 of the IAS Regulation. They are also responsible for safeguarding the assets of the Company and the Group and hence for taking reasonable steps for the prevention and detection of fraud and other irregularities.
The directors are responsible for the maintenance and integrity of the Company’s website. Legislation in the UK governing the preparation and dissemination of financial statements may differ from legislation in other jurisdictions.
Directors’ statement pursuant to the Disclosure and Transparency Rules The directors are also required by the Disclosure and Transparency Rules of the FSA to include a management report containing a fair review of the business and a description of the principal risks and uncertainties facing the Company and the Group.
Each of the directors, whose name and function is listed in the directors’ profiles, confirms that, to the best of their knowledge and belief:
− the financial statements, prepared in accordance with IFRS as adopted by the EU, give a true and fair view of the assets, liabilities, financial position and profit or loss of the Company and the undertakings included in the consolidation taken as a whole; and
− the management report disclosures are contained in the business review and include a fair review of the development and performance of the business and the position of the Company and the undertakings included in the consolidation taken as a whole, together with a description of the principal risks and uncertainties that they face.
Related Parties The Group has considered related parties and there have been no material changes since those previously reported at 31 March 2010 and 30 September 2010.