Embed Size (px)
Citation preview

TP ICAP plc interim results For the six months ended 30 June 2017 8 August 2017

John Phizackerley
TP ICAP plc interim results for the six months ended 30 June 2017 | 8 August 2017 2
Chief Executive

Agenda
TP ICAP plc interim results for the six months ended 30 June 2017 | 8 August 2017 3
Introduction
John Phizackerley
H1 2017 highlights
John Phizackerley
Key financials
Andrew Baddeley
Business and operational update
John Phizackerley
Q & A

H1 2017 highlights
TP ICAP plc interim results for the six months ended 30 June 2017 | 8 August 2017 4

H1 2017 – robust financial performance in a mixed global market environment
• Diverse global product portfolio combined with financial strength
• Revenues and operating profit margin increased in H1 2017
• Revenue per broker increased in every region
• Rates and oil businesses performed strongly, while power and commodities were subdued
• We are driving the integration of TP ICAP and delivering synergies
• Further investments in regulatory, governance and strategic initiatives
TP ICAP plc interim results for the six months ended 30 June 2017 | 8 August 2017 5
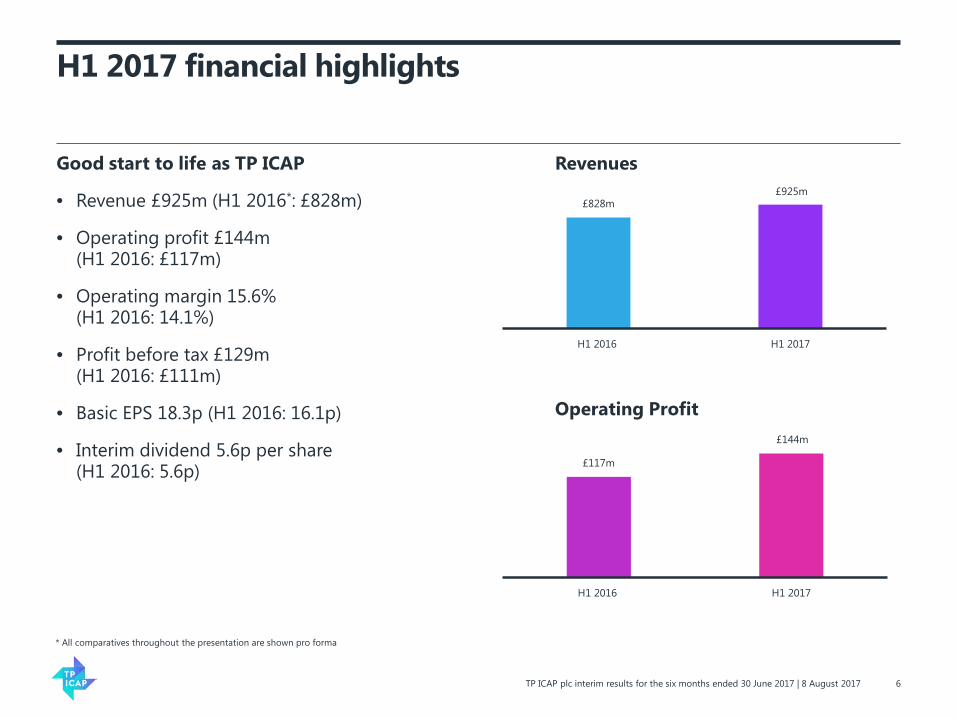
H1 2017 financial highlights
Good start to life as TP ICAP
• Revenue £925m (H1 2016*: £828m)
• Operating profit £144m (H1 2016: £117m)
• Operating margin 15.6% (H1 2016: 14.1%)
• Profit before tax £129m (H1 2016: £111m)
• Basic EPS 18.3p (H1 2016: 16.1p)
• Interim dividend 5.6p per share (H1 2016: 5.6p)
TP ICAP plc interim results for the six months ended 30 June 2017 | 8 August 2017 6
Revenues
803.7
891.5
* All comparatives throughout the presentation are shown pro forma
Operating Profit
£117m
£144m
H1 2016 H1 2017
£828m £925m
H1 2016 H1 2017

H1 2017 integration highlights
• Integration on schedule
• £8m of synergies recognised – ahead of plan
• On track to deliver plan
• Single regional heads in the Americas and APAC
• Single global business division heads
• Single global heads for all corporate support functions
• Continued management of separate brands
• Support staff headcount reduction of 175
TP ICAP plc interim results for the six months ended 30 June 2017 | 8 August 2017 7

H1 2017 integration highlights
• IT decommissioning more than 50% of the combined 490 TP ICAP systems
• Rationalising our office footprint and co-locating teams
• Moving to new US HQ in Lower Manhattan
• Moving to single Frankfurt and Singapore offices
• Harmonisation of policies – phase 1 complete
• On track to exceed our full year cost synergy target
TP ICAP plc interim results for the six months ended 30 June 2017 | 8 August 2017 8

H1 2017 operational highlights
• Kept up momentum in our business
• Second firmwide employee survey due out shortly
• Regional and brand variations
• EMEA - outperforms
• Americas - relatively bigger and positive outlook
• APAC - Australia important centre
• Hiring experienced talent and managing out underperformers
• Early talent programme
• Platforms enhanced and expanded data offering
• Belfast centre on plan, more than 50 employees
• MiFID II on track
TP ICAP plc interim results for the six months ended 30 June 2017 | 8 August 2017 9

Andrew Baddeley
TP ICAP plc interim results for the six months ended 30 June 2017 | 8 August 2017 10
Chief Financial Officer

Key financials
TP ICAP plc interim results for the six months ended 30 June 2017 | 8 August 2017 11

Revenue by division
TP ICAP plc interim results for the six months ended 30 June 2017 | 8 August 2017 12
£m (2016 at constant exchange rates) H1 2017 H1 2016 Change
Global Broking 670 657 +2%
Energy & Commodities 182 186 -2%
Institutional Services 16 4 +300%
Data & Analytics 57 52 +10%
Revenue at constant exchange rates 925 899 +3%
Exchange translation (71)
Revenue as reported 925 828 +12%

Revenue by product – Global Broking
TP ICAP plc interim results for the six months ended 30 June 2017 | 8 August 2017 13
£m (2016 at constant exchange rates) H1 2017 H1 2016 Change
Rates 279 268 +4%
Credit 65 69 -6%
FX & Money Markets 111 110 +1%
Emerging Markets 120 116 +3%
Equities 95 94 +1%
Global Broking revenue at constant exchange rates 670 657 +2%
Exchange translation (53)
Global Broking revenue as reported 670 604 +11%

Revenue by region
TP ICAP plc interim results for the six months ended 30 June 2017 | 8 August 2017 14
£m (2016 at constant exchange rates) H1 2017 H1 2016 Change
EMEA 462 436 +6%
Americas 333 336 -1%
Asia Pacific 130 127 +2%
Revenue at constant exchange rates 925 899 +3%
Exchange translation (71)
Revenue as reported 925 828 +12%

Underlying operating profit and margin by region
TP ICAP plc interim results for the six months ended 30 June 2017 | 8 August 2017 15
Underlying operating profit Margin
£m (at reported rates) H1 2017 H1 2016 Change H1 2017 H1 2016
EMEA 92 74 +24% 19.9% 17.5%
Americas 39 31 +26% 11.7% 10.6%
Asia Pacific 13 12 +8% 10.0% 10.7%
144 117 +23% 15.6% 14.1%
• Integration is on track with guidance remaining the same
• £8m of synergy savings recognised in the H1 2017 P&L
• IT infrastructure
• Belfast centre
• Legal entity consolidation
Progress on integration
TP ICAP plc interim results for the six months ended 30 June 2017 | 8 August 2017 16

H1 2017 income statement
TP ICAP plc interim results for the six months ended 30 June 2017 | 8 August 2017 17 1 Unaudited and on a pro forma basis
£m H1 2017 H1 20161
Revenue 925 828
Operating profit 144 117
Operating profit margin 15.6% 14.1%
Finance income 3 5
Finance costs (18) (11)
Profit before tax 129 111
Tax (33) (26)
Effective tax rate 26% 23%
Share of JVs and associates less non-controlling interests 5 4
Net income pre exceptionals 101 89
Total exceptionals (44) (22)
Net income after exceptionals 57 67
Weighted average basic shares in issue 552.4m 553.0m
Underlying basic EPS 18.3p 16.1p
Reported EPS 10.3p 12.1p

Exceptional and acquisition related items
TP ICAP plc interim results for the six months ended 30 June 2017 | 8 August 2017 18
£m H1 2017 H1 2016
ICAP acquisition related costs - (5)
ICAP integration costs (28) (5)
Acquisition related share-based payment charge (5) (5)
Amortisation of intangible assets arising on acquisition (20) (1)
Cost improvement programmes (5) (5)
Other acquisition and disposal items - (1)
Acquisition related finance expense - (3)
(58) (25)
Tax relief/(charge) 14 3
Total Exceptional and acquisition related items (44) (22)

Balance sheet
TP ICAP plc interim results for the six months ended 30 June 2017 | 8 August 2017 19
£m
Jun-17 Dec-16
Goodwill & other intangibles 1,749 1,783
Other non-current assets 155 166
Current assets less current and non-current liabilities (78) (168)
Cash and financial assets 759 786
Pension assets / obligations 54 97
Deferred tax liabilities (174) (197)
Interest bearing loans and borrowings (577) (547)
Net assets 1,888 1,919
Shareholders’ equity 1,867 1,898
Attributable to non-controlling interests 21 21
Attributable to shareholders 1,888 1,919

Debt profile, refinancing and interest cost
TP ICAP plc interim results for the six months ended 30 June 2017 | 8 August 2017 20
£m Jun-17 Dec-16 Jun-16
7.04% Sterling notes July 2016 - - 141
5.25% Sterling notes June 2019 80 80 80
5.25% Unsecured sterling notes January 2024 500 470 -
Unamortised issue costs (3) (3) (1)
577 547 220
Net interest costs • Net interest costs of £15m include £2m for the one-off cost of the bridge loan fees
Committed facility • £250m RCF currently undrawn

Net funds
Cash and financial assets
TP ICAP plc interim results for the six months ended 30 June 2017 | 8 August 2017 21
Movement in net funds
£759m
£239m
£182m
£(9)m £(27)m
£(18)m
£(3)m
Net funds Dec2016
Cash flow Dividends Mvt in FX Bridge FacilityFee
Net funds Jun2017
£643m
£74m
£42m
Regulated entitiesNon-regulated entitiesCorporate

Business and operational update
TP ICAP plc interim results for the six months ended 30 June 2017 | 8 August 2017 22

The TP ICAP proposition
TP ICAP plc interim results for the six months ended 30 June 2017 | 8 August 2017 23
Synergies
Balance Sheets
Offshoring IT
Institutional Services
Grazing
Yield Curve
Broker Pay
Electronic Markets
Data
Legal Compliance
Real Estate
Capital Efficiency
Procurement
Revenue Diversity
Hiring Next Generation
Operations
Human Resources
Diverse Customer
Base
Reputed Brands
Geographic Footprint
Industry Leading
Technology
Conduct and Culture
Strong Financial
Performance
Regulatory Developments
Risk Management

• We provide voice, hybrid, electronic volume matching, algorithmic matching, risk mitigation platforms, post trade and risk management services, to satisfy the evolution of the marketplace
• We provide business-critical intelligence and services to clients, through our brokers, supplemented by proprietary screens, electronic solutions, pricing data and analytics and post-trade services
Electronic execution methodologies
Technology is part of our DNA
TP ICAP plc interim results for the six months ended 30 June 2017 | 8 August 2017 24
Session Based
(Auction/ Volume
Matching)
Workup
RFQ/RFS
Transactional “Chat”
Auxiliary/ Continuous Matching
Indication of Interest Platforms
Central Limit Order
Book
TP ICAP

There will always be a need for brokers
TP ICAP plc interim results for the six months ended 30 June 2017 | 8 August 2017 25
“Voice communication is very or extremely critical to trading workflow, and we don’t see it going away.” The Voice of Trading Greenwich Associates, Q2 2017
“Trillions of dollars of swaps trade globally each day through a variety of execution methods tailored around their episodic liquidity. In many cases, interdealer brokers exercise discretion in executing counterparty trades.” Keynote Address of CFTC Commissioner J. Christopher Giancarlo Before SEFCON VII, January 2017
“72% of participants said trading bonds with a notional size of greater than $15m was difficult.” The Voice of Trading Greenwich Associates, Q2 2017
“Complex products or large trades, or products where the valuation is complex, or where there isn’t always a large universe of buyers and sellers, or confidentiality is important where you are going to need assistance in putting a trade together and for that a broker is really valuable.” The Voice of Trading Greenwich Associates, Q2 2017

TP ICAP global business lines
TP ICAP investor presentation 26
Global Broking • Hybrid voice business operating across all major asset classes • 5 product lines: Rates, FX and Money Markets, Emerging Markets, Equities and Credit • Hybrid platforms with rich functionality and variety of execution methods • Post trade risk mitigation services business
Energy & Commodities
Data & Analytics
Institutional Services
TP IC
AP
Busi
ness
Lin
es • Operates markets in oil, gas, power, renewables, ferrous metals, base metals, precious metals,
soft commodities and coal • Largest Energy and Commodities franchise and number one oil broker globally • Diverse customer base • Highly regarded publications
• The leading OTC data business by a significant margin • Reputation for quality assurance • Breadth and depth of pricing data and suite of sophisticated analytics • Attractive future growth potential
• A new revenue stream for TP ICAP • High-touch, alpha generating cross asset broking service • Client base of institutional asset managers and hedge funds • Building a “one stop shop” service, important for many macro funds

Global Broking
• Record months in our volume matching sessions
⎯ Particular success in US emerging markets bonds
⎯ Launched index synthetics and rolls in financials and sovereign bonds
• Investment in sales efforts in our post-trade business
⎯ Traction in Asia
⎯ Record volumes transacted in EMEA in June
• New global RFQ platform for FX Options
⎯ Clients now interact directly with our liquidity pools through electronic connectivity, with broker guidance and negotiation support
⎯ Incorporates enhanced analytics and streamlined straight-through processing
TP ICAP plc interim results for the six months ended 30 June 2017 | 8 August 2017 27
Revenues - £670m

Energy & Commodities
• Natural Gas Liquids (NLG) desk in US, which links in with our global Liquefied Petroleum Gas desk in EMEA
• Expansion of Liquefied Natural Gas (LNG) desk in EMEA
• Expanding customer base by successfully pitching to funds in coal and iron ore
• 35 new hires made in H1 across the E&C brands
— Added 12 new joiners from the early talent programme
• Growth plans in Houston, Texas
TP ICAP plc interim results for the six months ended 30 June 2017 | 8 August 2017 28
Oil Gas Power Renewables Ferrous metals
Base metals Precious metals Soft commodities Coal Freight
Revenues - £182m

Data & Analytics
• Sales capability reorganised, adding resource in London, NY, Singapore and Tokyo, with strong pipeline of new business emerging
• New European corporate bond package for over 2,000 Eurobonds in more than 40 countries, sourced from our Global Broking business, with proprietary analytics
• Partnership to distribute equity and credit research and analytics data
• Comprehensive market data service for interest rate derivatives market in Scandinavia
• Upgraded our Interest Rate Options volatility data services, adding greater depth and breadth to our swaption coverage
TP ICAP plc interim results for the six months ended 30 June 2017 | 8 August 2017 29
Revenues - £57m

Institutional Services
• Completed strategic review to validate and articulate new business proposition
• Large fee pool potential as institutions seek new service providers – modest revenues to date
• Extensively canvassed and interviewed our target client base
• Added expertise and building the team
• Added FX and corporate bond expertise
• Investment in new FinTech platform, LiquidityChain
TP ICAP plc interim results for the six months ended 30 June 2017 | 8 August 2017 30
Revenues - £16m

H1 key workstreams
• Continuing focus on conduct and culture, increasingly differentiates
• MiFID II readiness
—Major workstream
—Partnership with Bloomberg
—On schedule
• Brexit
—Dedicated workstream
—Extensive client feedback
—Existing EU footprint
—Dialogue with regulators
—Political uncertainty
TP ICAP plc interim results for the six months ended 30 June 2017 | 8 August 2017 31
Market outlook
• Continued political uncertainty (US, UK, North Korea, China, Middle East)
• Marked economic disparities
• European economies remain fragile, US more buoyant, Asia continues to grow
• Period of ultra-low interest rates is coming to an end, but not imminently
• Energy & Commodities markets reflect abundant supply of natural gas and oil from shale rock and outlook for demand from China
TP ICAP plc interim results for the six months ended 30 June 2017 | 8 August 2017 32

Summary
• Good start to life as TP ICAP – urgency on integration
• Diversity of our business is helpful
• Data & Analytics and Institutional Services are growth areas
• Integration on track
• We are well-placed to:
⎯ Deliver synergies
⎯ Build the business
⎯ Deliver value to shareholders
• Capital Markets Day, 30th November
TP ICAP plc interim results for the six months ended 30 June 2017 | 8 August 2017 33

Q&A
TP ICAP plc interim results for the six months ended 30 June 2017 | 8 August 2017 34


![EC client overview v5 CB.pptx [Read-Only]...Biography TP ICAP Presentation 2 Career George has been with the TP ICAP Group since 1993, where he started his career in Interest Rate](https://img.pdfslide.us/doc/110x75/602cb81773101f254801dc73/ec-client-overview-v5-cbpptx-read-only-biography-tp-icap-presentation-2-career.jpg)