Embed Size (px)
Citation preview
PreliminaryResults
Preliminary Results 2005
for the year ended 31 December 2005
Allied Irish Banks, p.l.c.

A number of statements we will be making in our presentation and in the accompanying slides will not be based on historical fact, but will be “forward-looking” statements within the meaning of the United States Private Securities Litigation Reform Act of 1995. Actual results may differ materially from those projected in the forward looking statements. Factors that could cause actual results to differ materially from those in the forward looking statements include, but are not limited to, global, national and regional economic conditions, levels of market interest rates, credit or other risks of lending and investment activities, competitive and regulatory factors and technology change. Any ‘forward-looking statements made by or on behalf of the Group speak only as of the date they are made.
visit www.aibgroup.com/investorrelations
Forward looking statements
All comparisons in this presentation are relative to 2004 pro-forma IFRS figures
Eugene Sheehy
Group Chief Executive
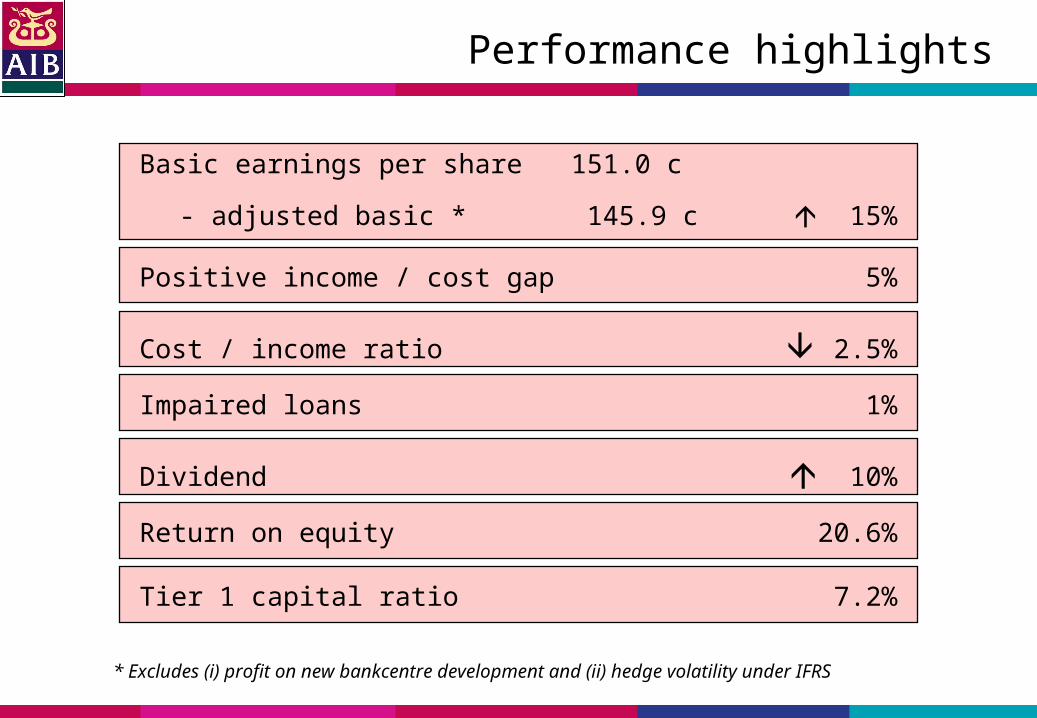
Performance highlights
Basic earnings per share 151.0 c
- adjusted basic * 145.9 c 15%
* Excludes (i) profit on new bankcentre development and (ii) hedge volatility under IFRS
Positive income / cost gap 5%
Cost / income ratio 2.5%
Impaired loans 1%
Dividend 10%
Return on equity 20.6%
Tier 1 capital ratio 7.2%
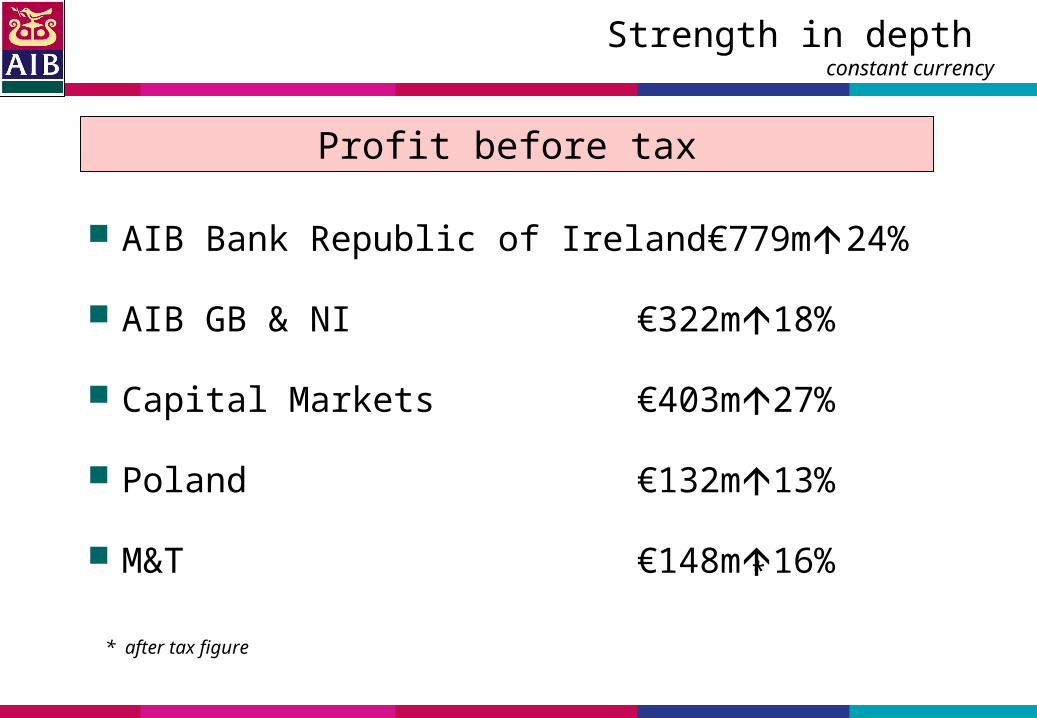
Strength in depth constant currency
AIB Bank Republic of Ireland €779m 24%
AIB GB & NI €322m 18%
Capital Markets €403m 27%
Poland €132m 13%
M&T €148m 16%*
* after tax figure
Profit before tax
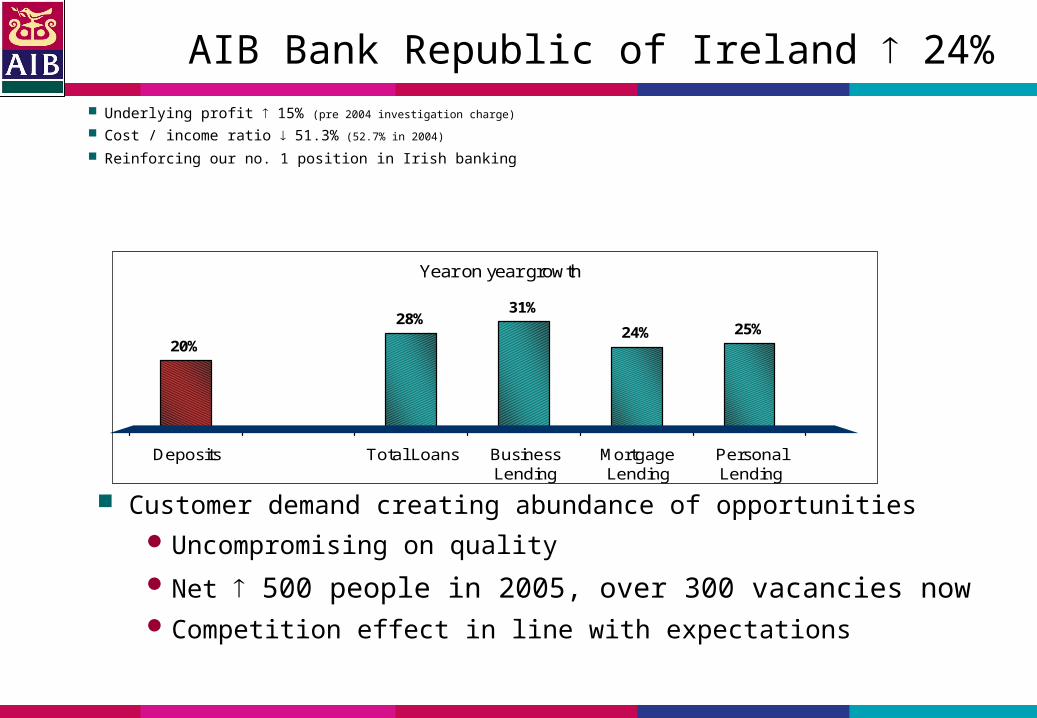
Underlying profit 15% (pre 2004 investigation charge)
Cost / income ratio 51.3% (52.7% in 2004)
Reinforcing our no. 1 position in Irish banking
AIB Bank Republic of Ireland 24%
Year on year growth
25%24%
31%28%
20%
Deposits Total Loans BusinessLending
MortgageLending
PersonalLending
Customer demand creating abundance of opportunitiesUncompromising on quality
Net 500 people in 2005, over 300 vacancies nowCompetition effect in line with expectations
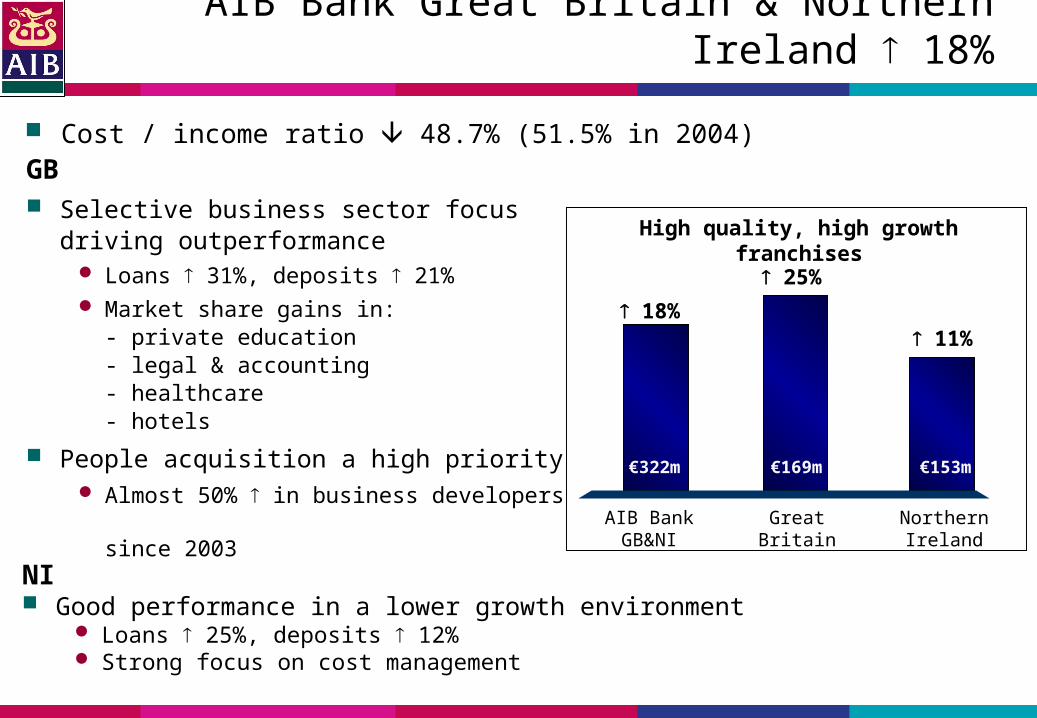
AIB Bank Great Britain & Northern Ireland 18%
18%
25%
11%
AIB Bank GB&NI
Great Britain
Northern Ireland
€322m €169m €153m
Cost / income ratio 48.7% (51.5% in 2004)
GB Selective business sector focus driving
outperformance Loans 31%, deposits 21% Market share gains in:
- private education - legal & accounting - healthcare - hotels
People acquisition a high priority Almost 50% in business developers
since 2003 NI Good performance in a lower growth environment
Loans 25%, deposits 12% Strong focus on cost management
High quality, high growth franchises
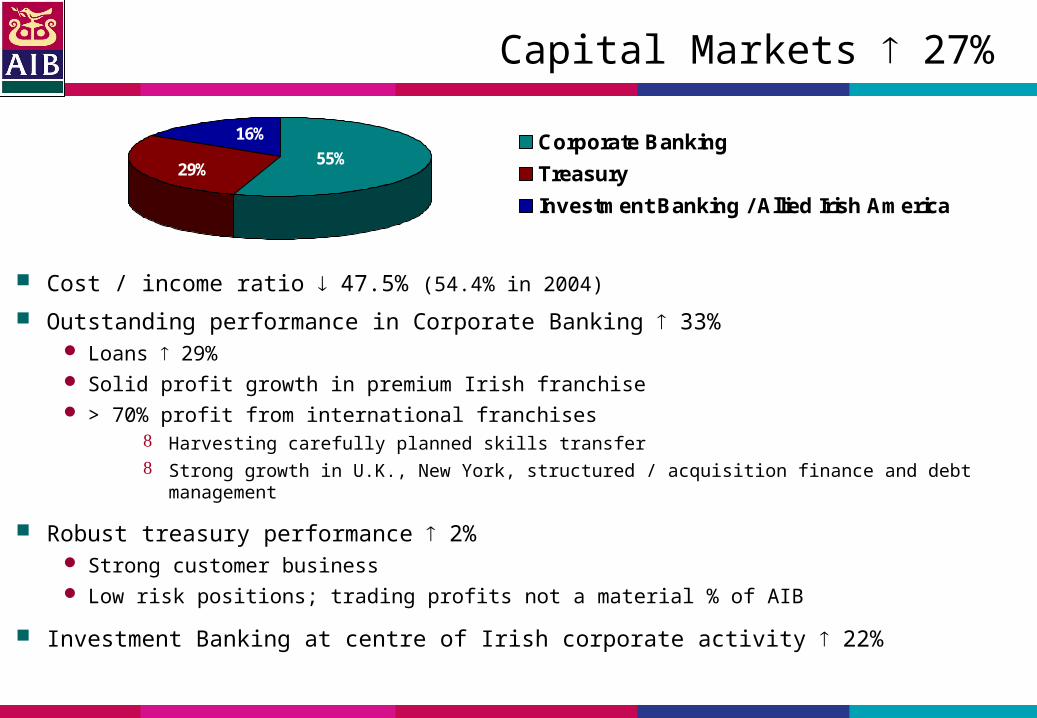
55%29%
16%Corporate Banking
Treasury
Investment Banking / Allied Irish America
Capital Markets 27%
Cost / income ratio 47.5% (54.4% in 2004)
Outstanding performance in Corporate Banking 33% Loans 29% Solid profit growth in premium Irish franchise > 70% profit from international franchises
Harvesting carefully planned skills transfer Strong growth in U.K., New York, structured / acquisition finance and debt management
Robust treasury performance 2% Strong customer business Low risk positions; trading profits not a material % of AIB
Investment Banking at centre of Irish corporate activity 22%
Poland 13%
Underlying profit 29% (pre disposal of business in 2004)
Cost / income ratio to 65.7% (67.4% in 2004)
Performance driven by: Non interest income 10%
Tight cost management 3%
Further provision reductions 54%
Early signs of loan book momentum 4% following flat H1
Personal cash loans 80%
Maintaining risk discipline
Top tier mutual funds provider; income 115%, market share12.6%
M&T 16%
Strong management driving performance in challenging
environment
Cost management offsetting slow income growth
Cost / income ratio 51.2% (53.5% in 2004)
Further reduction in non performing loans and provisions
US yield curve movements not a material factor
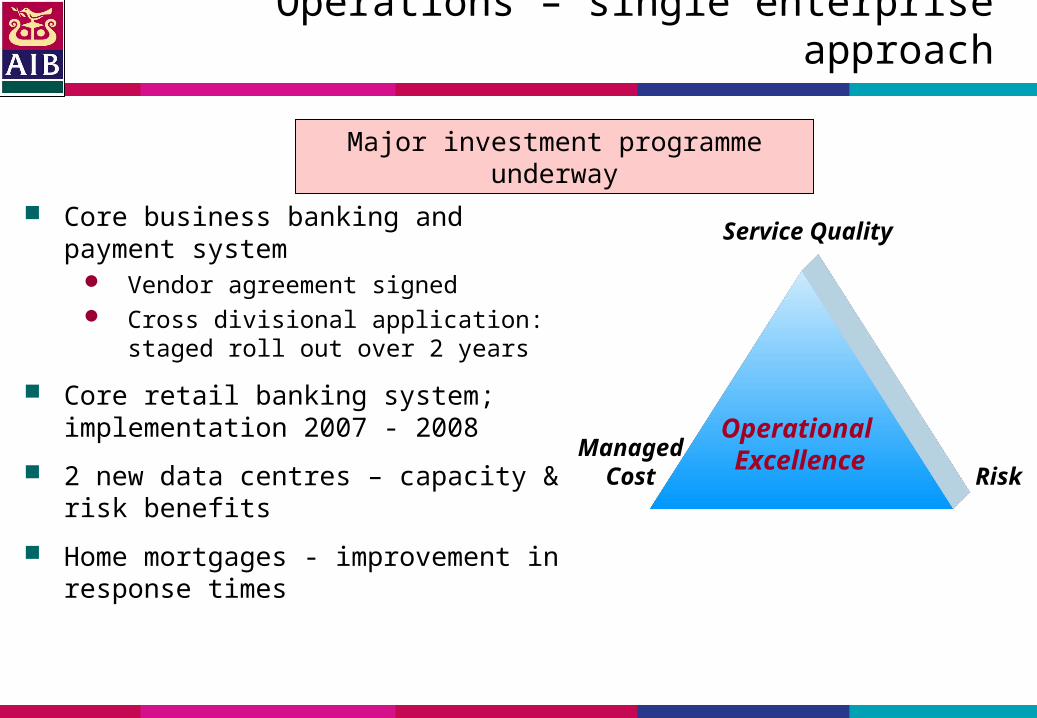
Operations – single enterprise approach
Core business banking and payment system
Vendor agreement signed Cross divisional application: staged roll
out over 2 years
Core retail banking system; implementation 2007 - 2008
2 new data centres – capacity & risk benefits
Home mortgages - improvement in response times
RiskManaged
Cost
Service Quality
Operational Excellence
Major investment programme underway
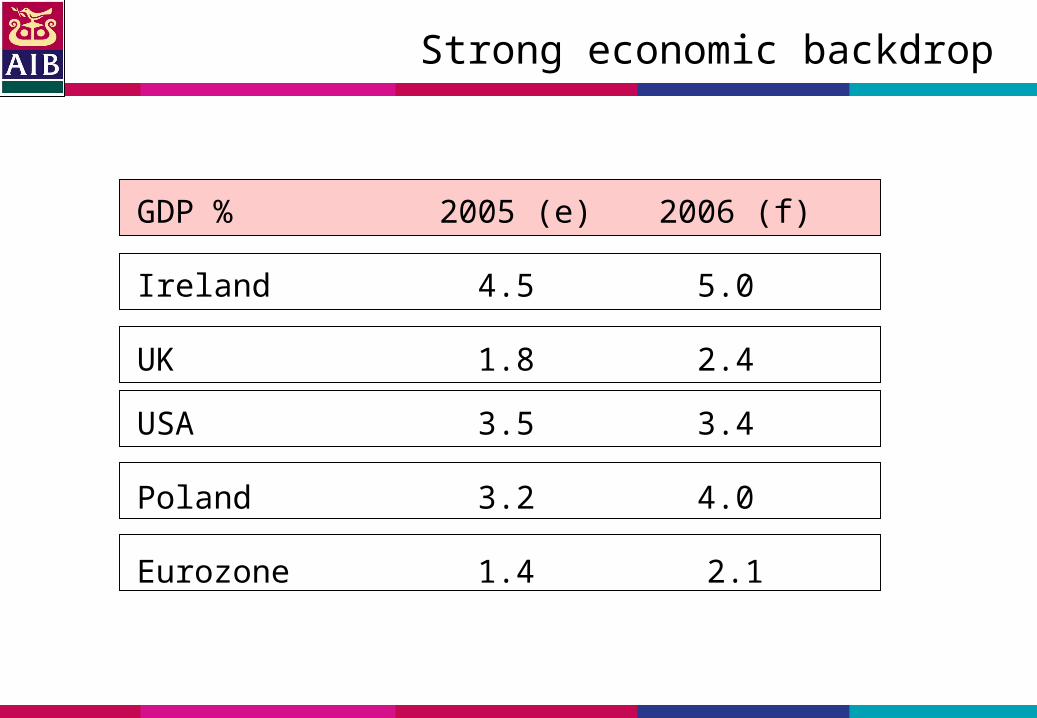
Strong economic backdrop
GDP % 2005 (e) 2006 (f)
Ireland 4.5 5.0
UK 1.8 2.4
USA 3.5 3.4
Poland 3.2 4.0
Eurozone 1.4 2.1
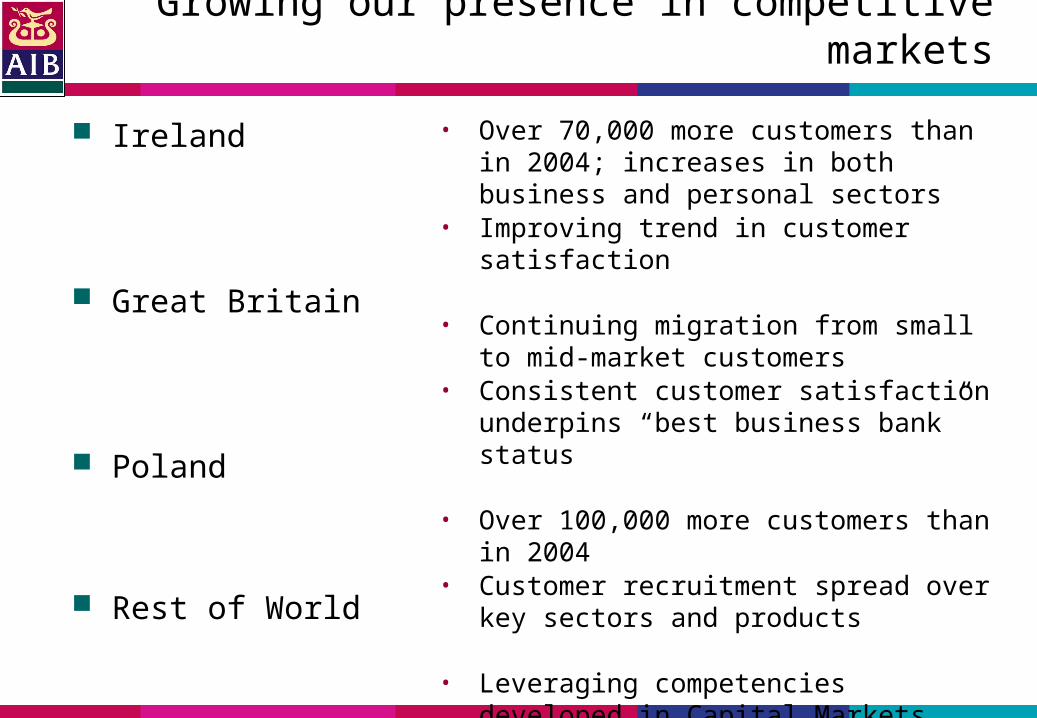
Growing our presence in competitive markets
Ireland
Great Britain
Poland
Rest of World
• Over 70,000 more customers than in 2004; increases in both business and personal sectors
• Improving trend in customer satisfaction
• Continuing migration from small to mid-market customers
• Consistent customer satisfaction underpins “best business bank” status
• Over 100,000 more customers than in 2004• Customer recruitment spread over key
sectors and products
• Leveraging competencies developed in Capital Markets
• Selective international expansion
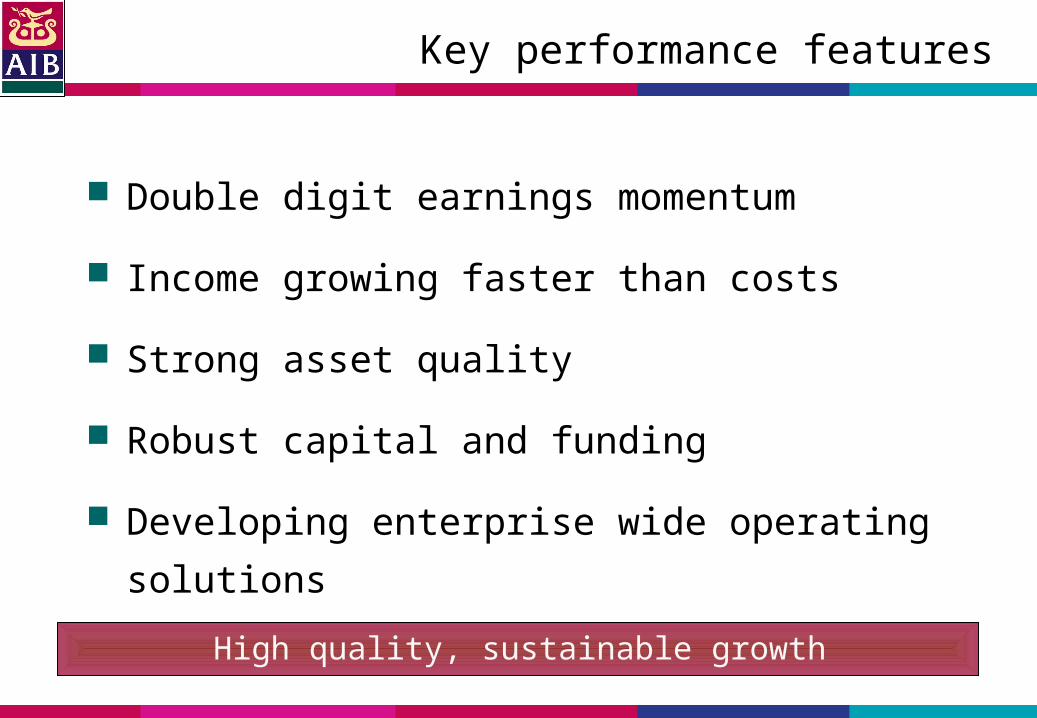
Key performance features
Double digit earnings momentum
Income growing faster than costs
Strong asset quality
Robust capital and funding
Developing enterprise wide operating solutions
High quality, sustainable growth
John O’Donnell
Group Finance Director
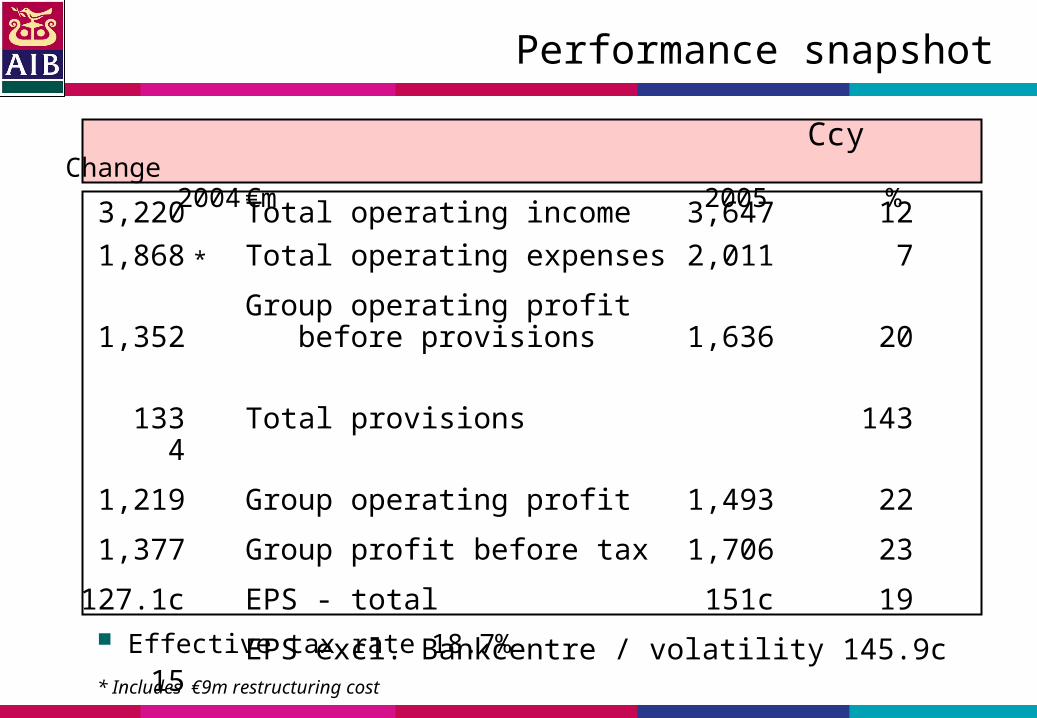
Performance snapshot
3,220 Total operating income 3,647 12
1,868 Total operating expenses 2,011 7
Group operating profit 1,352 before provisions 1,636 20
133 Total provisions 143 4
1,219 Group operating profit 1,493 22
1,377 Group profit before tax 1,706 23
127.1c EPS - total 151c 19
EPS excl. Bankcentre / volatility 145.9c 15
Ccy Change 2004 €m 2005 %
Effective tax rate 18.7%
*
* Includes €9m restructuring cost
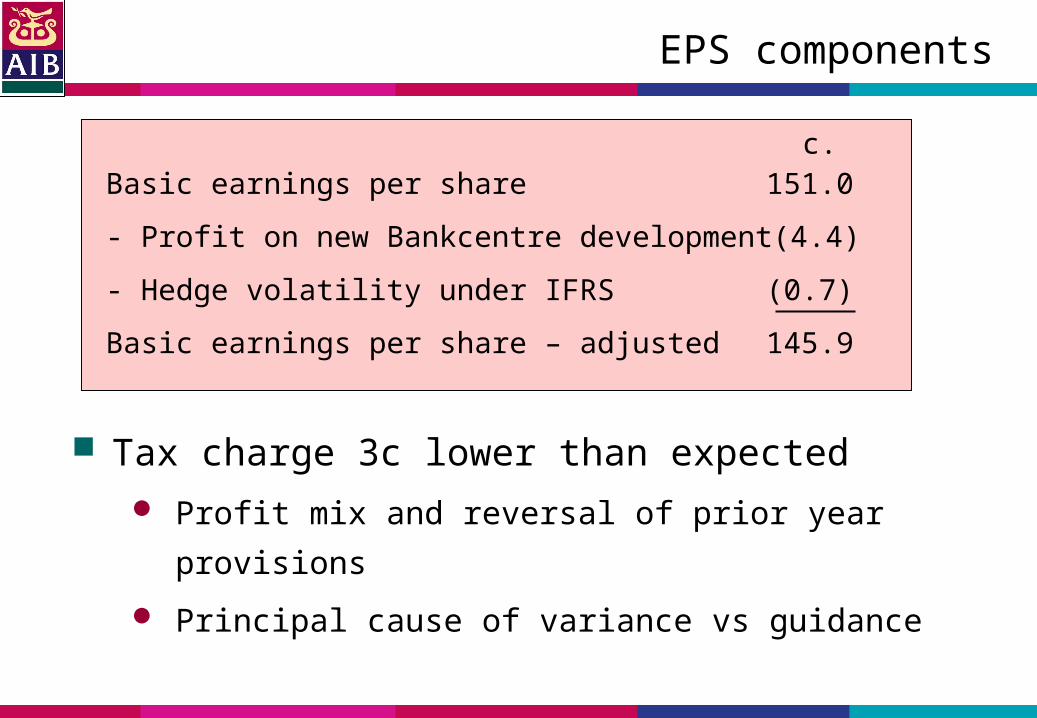
EPS components
Basic earnings per share 151.0
- Profit on new Bankcentre development (4.4)
- Hedge volatility under IFRS (0.7)
Basic earnings per share – adjusted 145.9
Tax charge 3c lower than expected
Profit mix and reversal of prior year provisions
Principal cause of variance vs guidance
c.
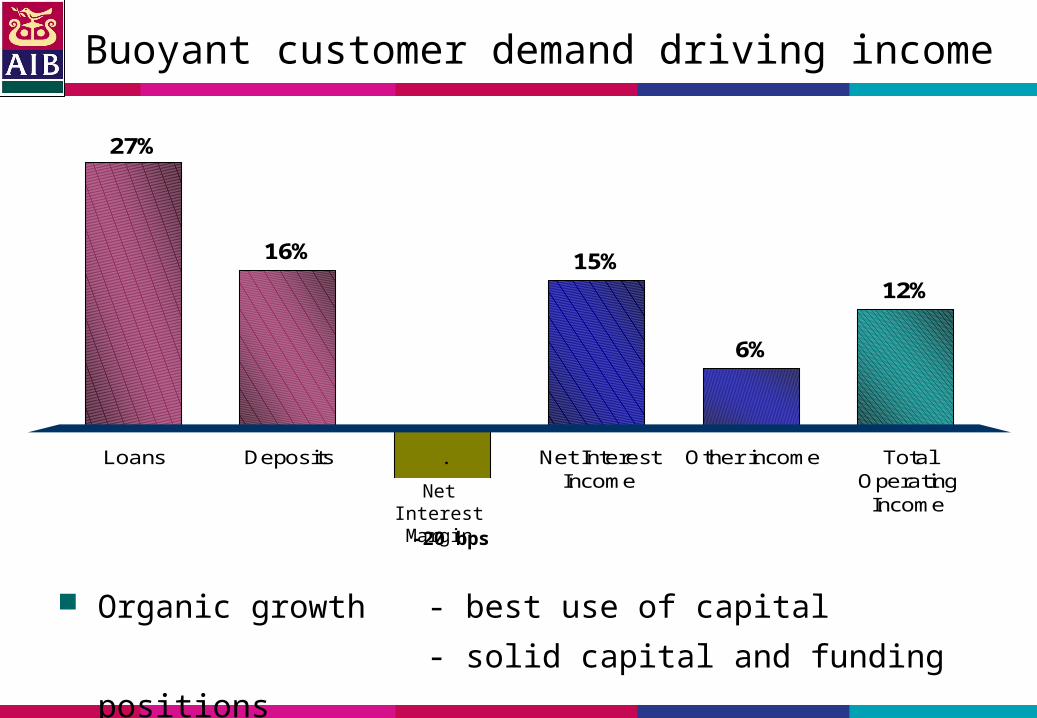
Buoyant customer demand driving income
12%
16%
27%
6%
15%
Loans Deposits . Net InterestIncome
Other income TotalOperating
IncomeNet Interest
Margin-20 bps
Organic growth - best use of capital
- solid capital and funding positions
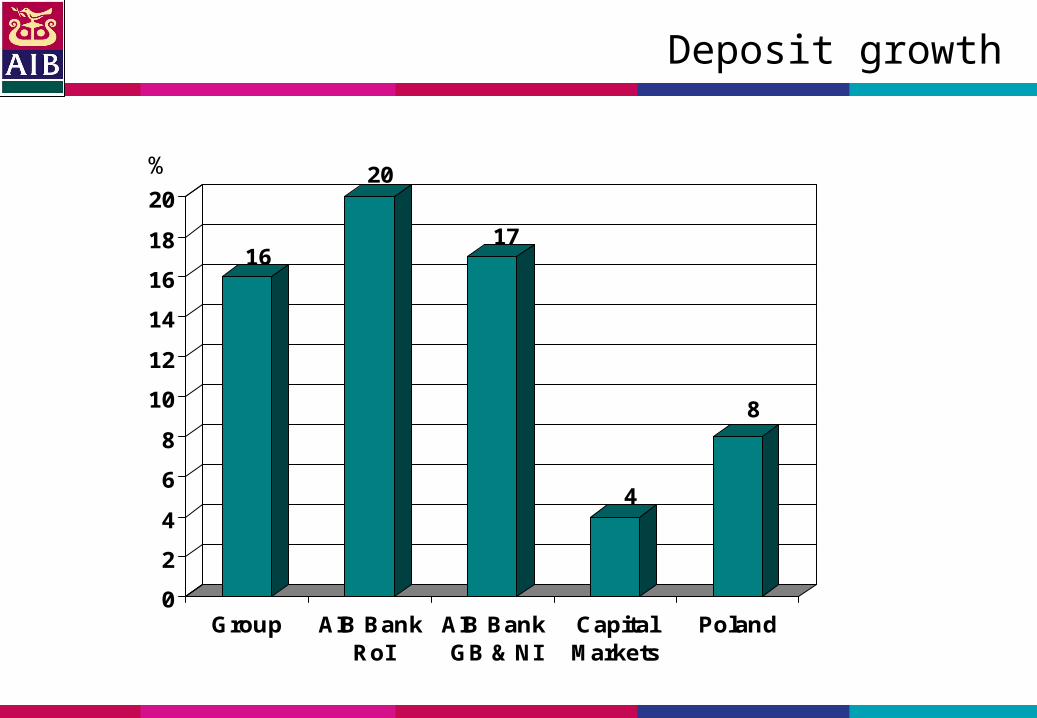
Deposit growth
16
20
17
4
8
0
2
4
6
8
10
12
14
16
18
20
Group AIB BankRoI
AIB BankGB & NI
CapitalMarkets
Poland
%
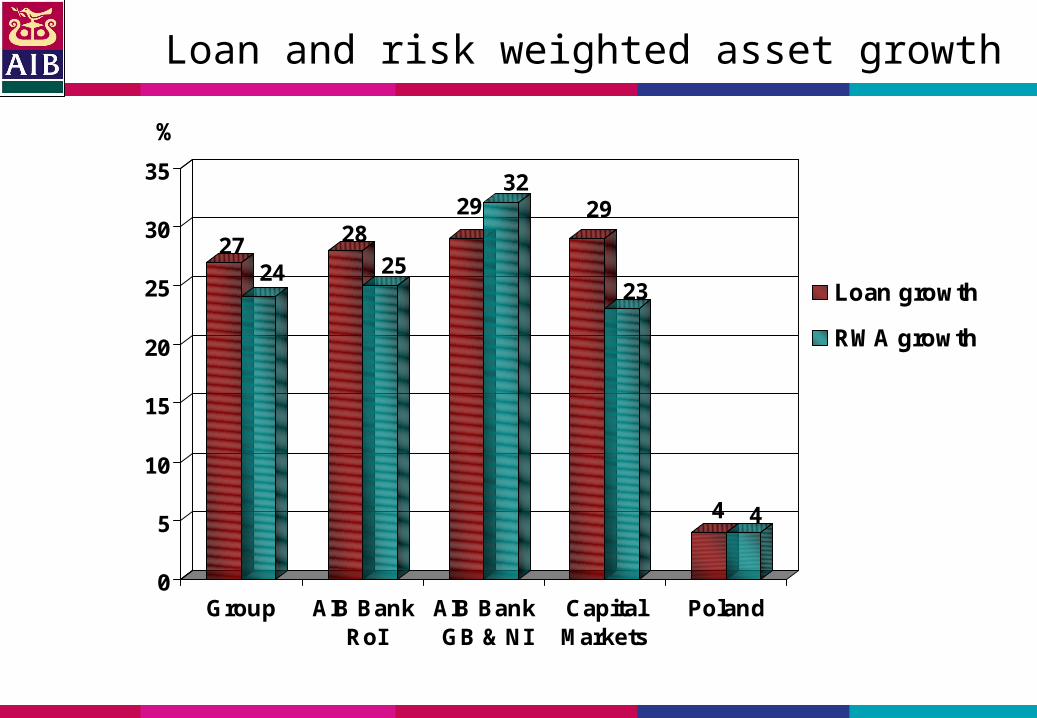
Loan and risk weighted asset growth
2724
2825
2932
29
23
4 4
0
5
10
15
20
25
30
35
Group AIB BankRoI
AIB BankGB & NI
CapitalMarkets
Poland
Loan growth
RWA growth
%
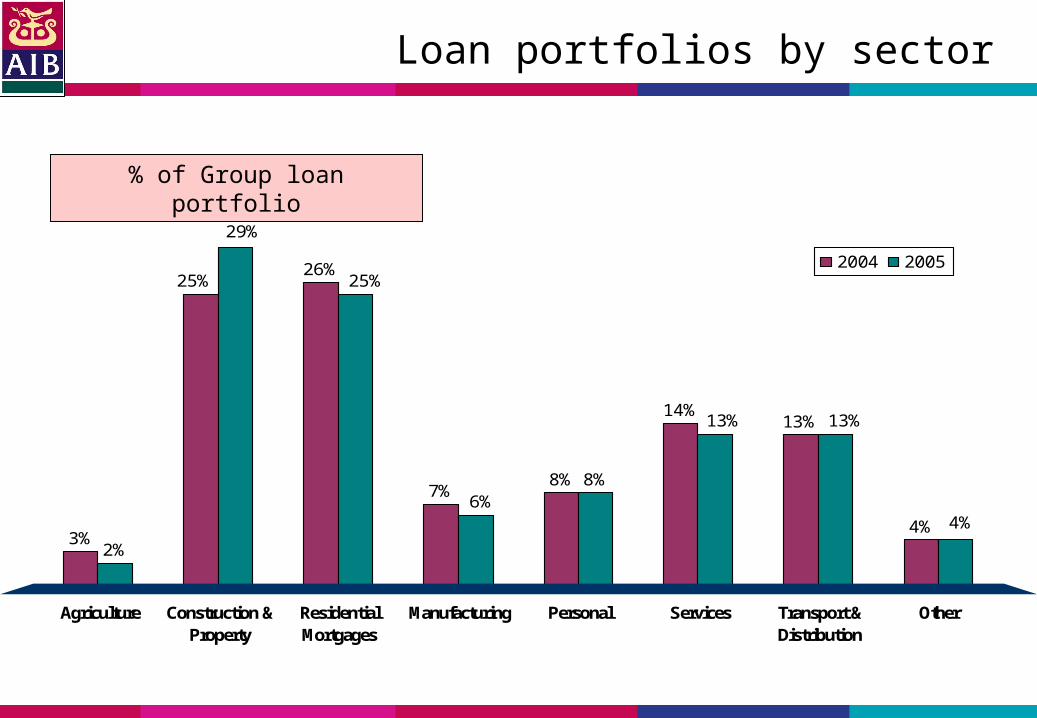
3%
26%
7%8%
14%13%
4%2%
8%
25%
4%
13%13%
6%
25%
29%
Agriculture Construction &Property
ResidentialMortgages
Manufacturing Personal Services Transport &Distribution
Other
2004 2005
Loan portfolios by sector
% of Group loan portfolio
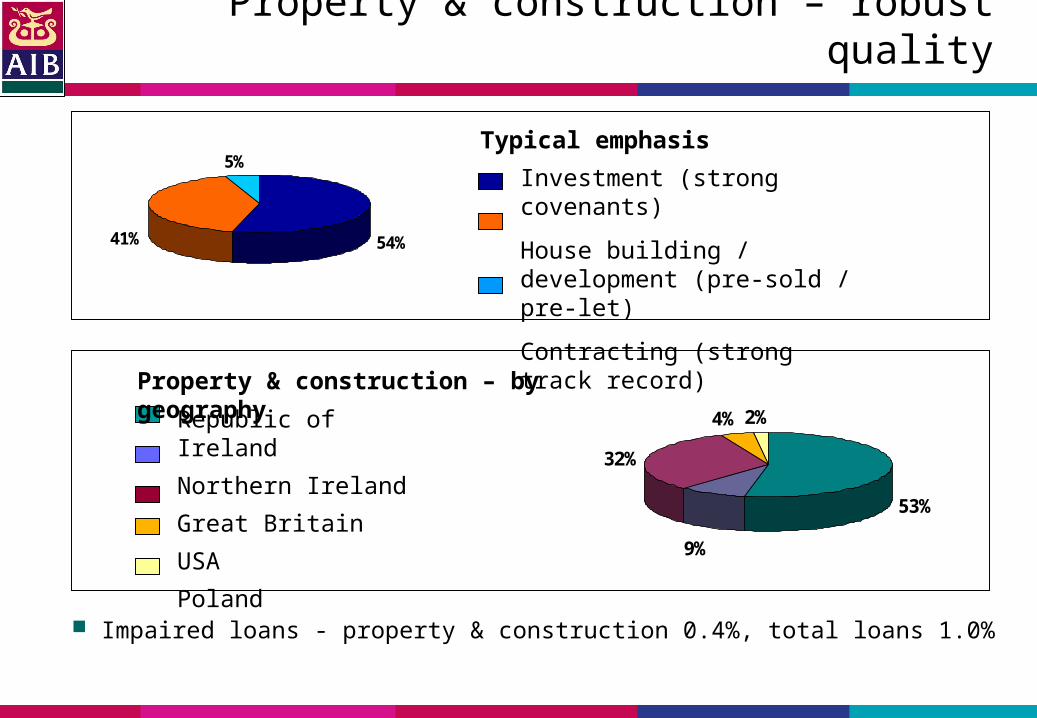
Property & construction – robust quality
54%41%
5%
Impaired loans - property & construction 0.4%, total loans 1.0%
53%
9%
32%
4% 2%
Investment (strong covenants)
House building / development (pre-sold / pre-let)
Contracting (strong track record)
Republic of Ireland
Northern Ireland
Great Britain
USA
Poland
Property & construction – by geography
Typical emphasis
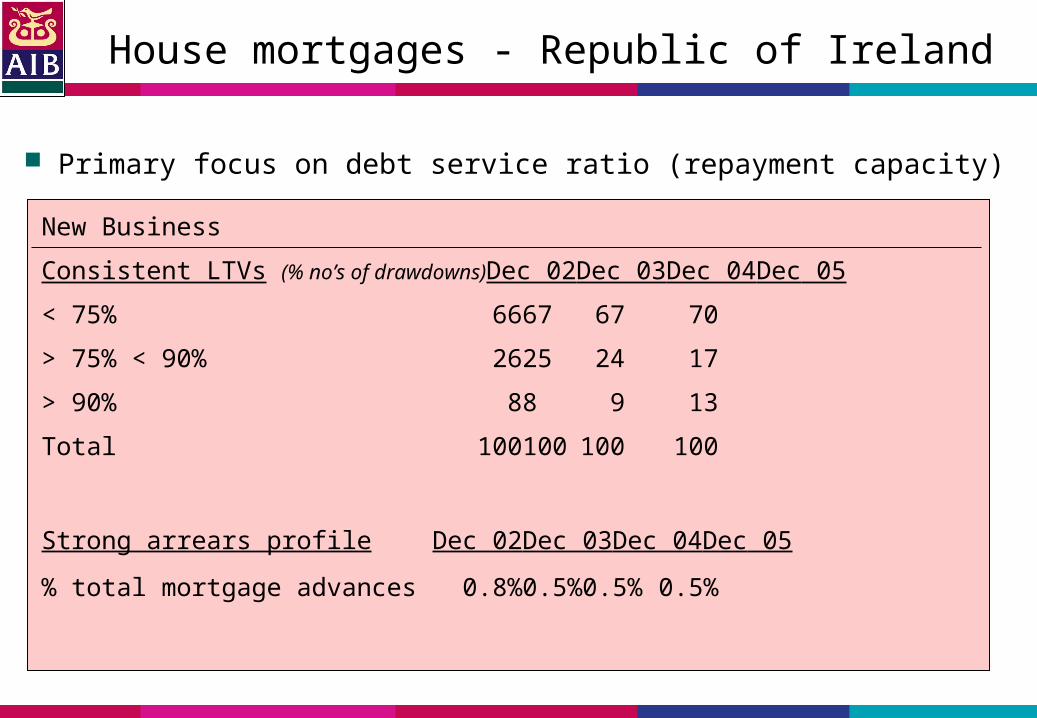
House mortgages - Republic of Ireland
Primary focus on debt service ratio (repayment capacity)
New Business
Consistent LTVs (% no’s of drawdowns)Dec 02 Dec 03 Dec 04 Dec 05
< 75% 66 67 67 70
> 75% < 90% 26 25 24 17
> 90% 8 8 9 13
Total 100 100 100 100
Strong arrears profile Dec 02 Dec 03 Dec 04 Dec 05
% total mortgage advances 0.8% 0.5% 0.5% 0.5%
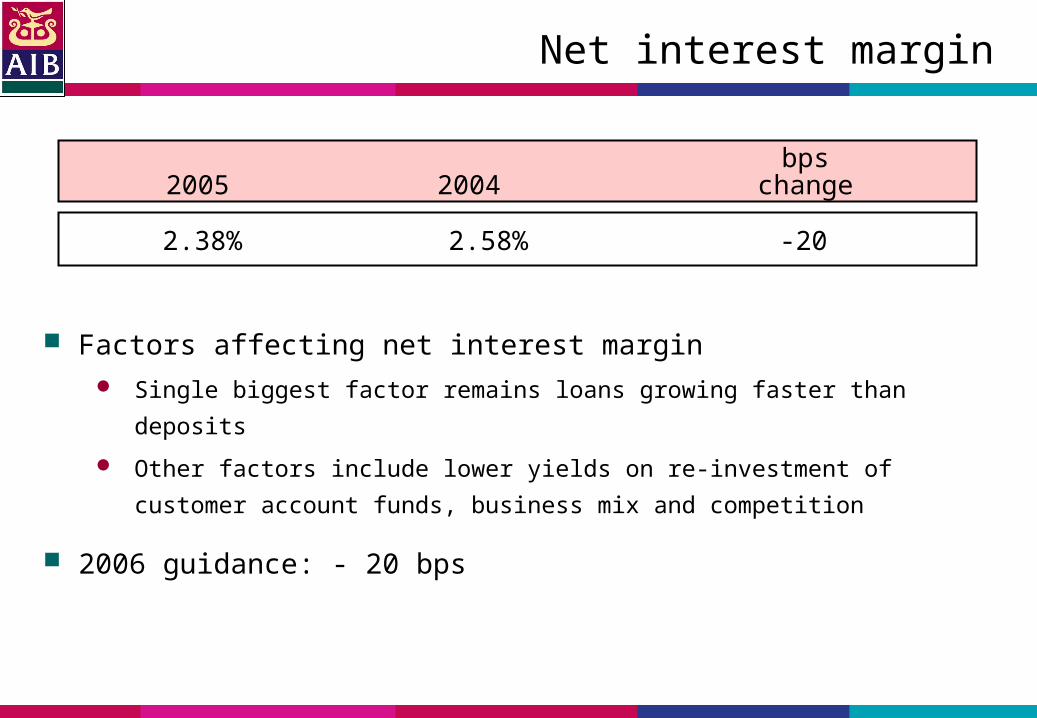
Net interest margin
Factors affecting net interest margin Single biggest factor remains loans growing faster than deposits
Other factors include lower yields on re-investment of customer account
funds, business mix and competition
2006 guidance: - 20 bps
bps2005 2004 change
2.38% 2.58% -20
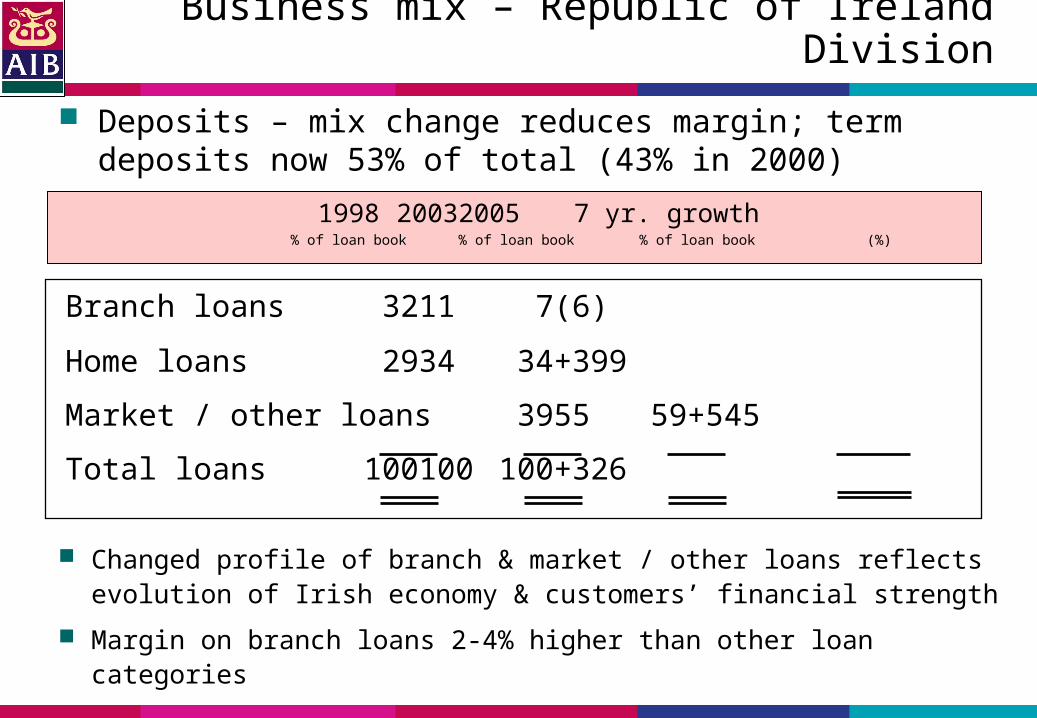
Business mix – Republic of Ireland Division
Branch loans 32 11 7 (6)
Home loans 29 34 34 +399
Market / other loans 39 55 59 +545
Total loans 100 100 100 +326
1998 2003 2005 7 yr. growth% of loan book % of loan book % of loan book (%)
Changed profile of branch & market / other loans reflects evolution of Irish economy & customers’ financial strength
Margin on branch loans 2-4% higher than other loan categories
Deposits – mix change reduces margin; term deposits now 53% of total (43% in 2000)
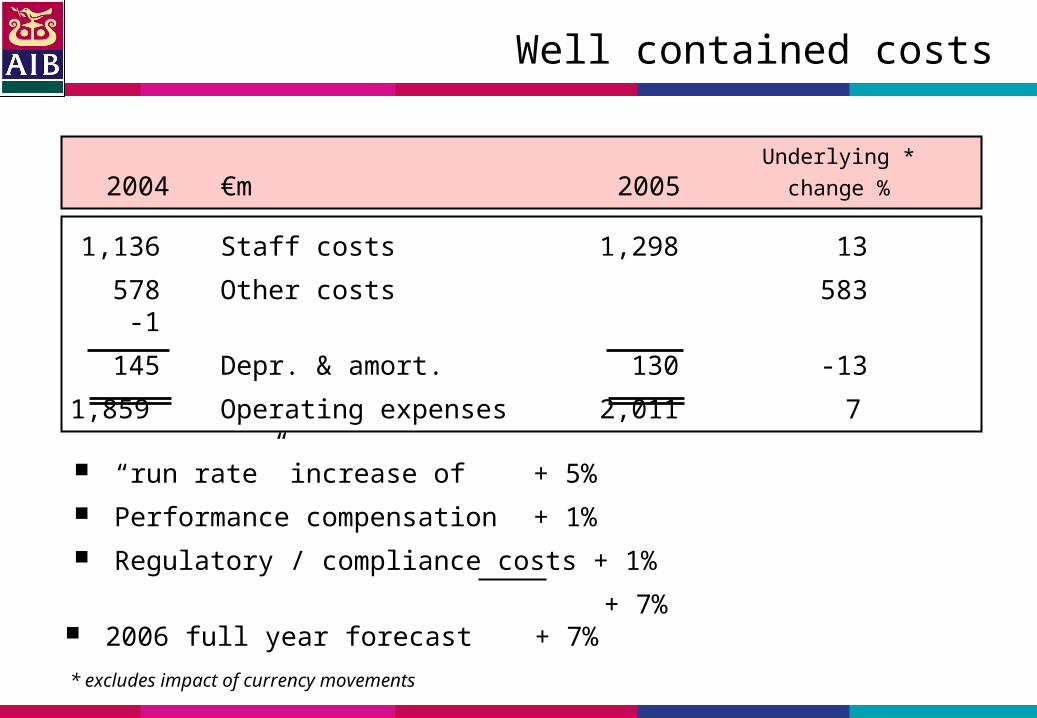
Well contained costs
1,136 Staff costs 1,298 13
578 Other costs 583 -1
145 Depr. & amort. 130 -13
1,859 Operating expenses 2,011 7
“run rate” increase of + 5%
Performance compensation + 1%
Regulatory / compliance costs + 1%
+ 7%
Underlying *
2004 €m 2005 change %
* excludes impact of currency movements
2006 full year forecast + 7%
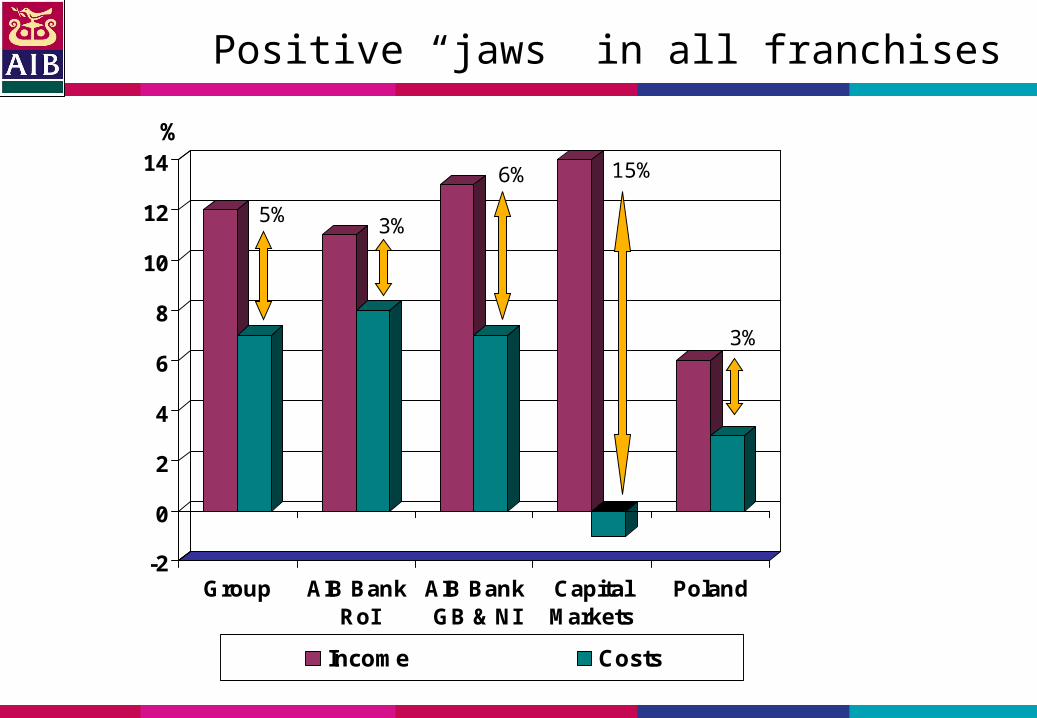
Positive “jaws” in all franchises
-2
0
2
4
6
8
10
12
14
Group AIB BankRoI
AIB BankGB & NI
CapitalMarkets
Poland
Income Costs
5% 3%
6%
3%
15%
%
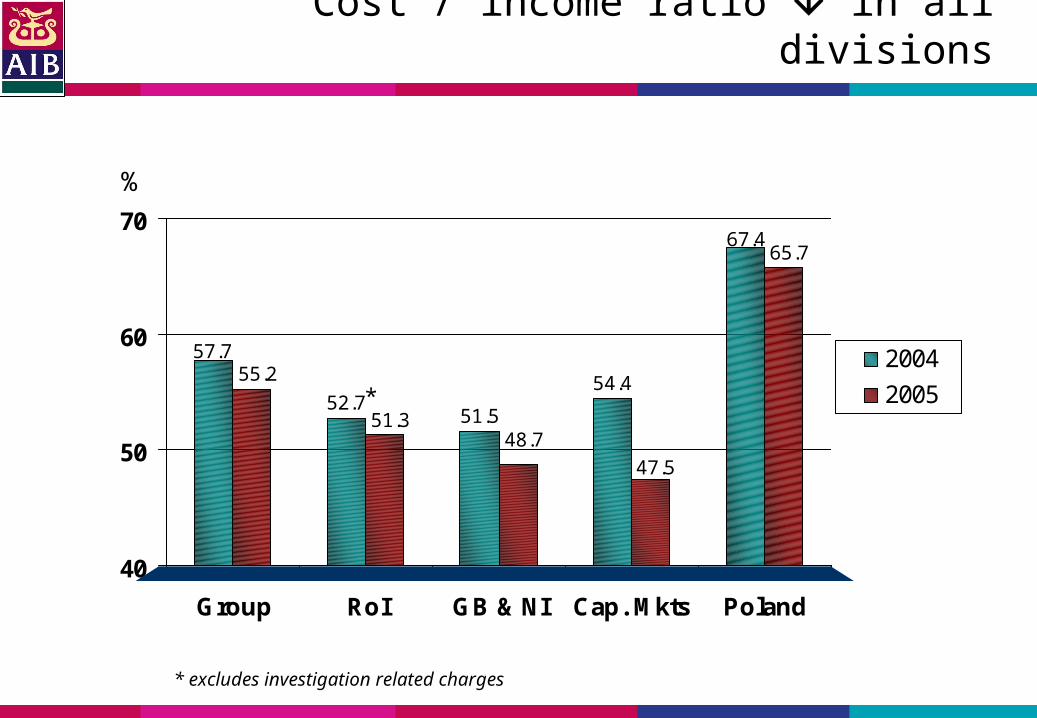
Cost / income ratio in all divisions
52.751.5
54.4
67.4
57.7
65.7
47.5
48.751.3
55.2
40
50
60
70
Group RoI GB & NI Cap. Mkts Poland
2004
2005
%
* excludes investigation related charges
*
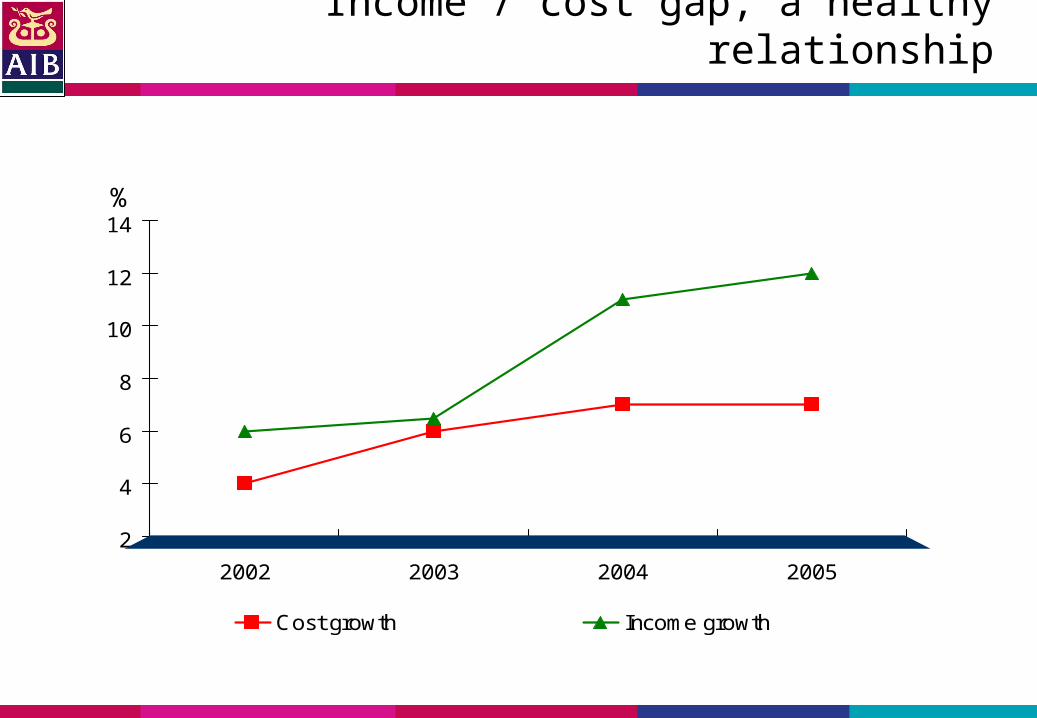
Income / cost gap; a healthy relationship
2
4
6
8
10
12
14
2002 2003 2004 2005
Cost growth Income growth
%
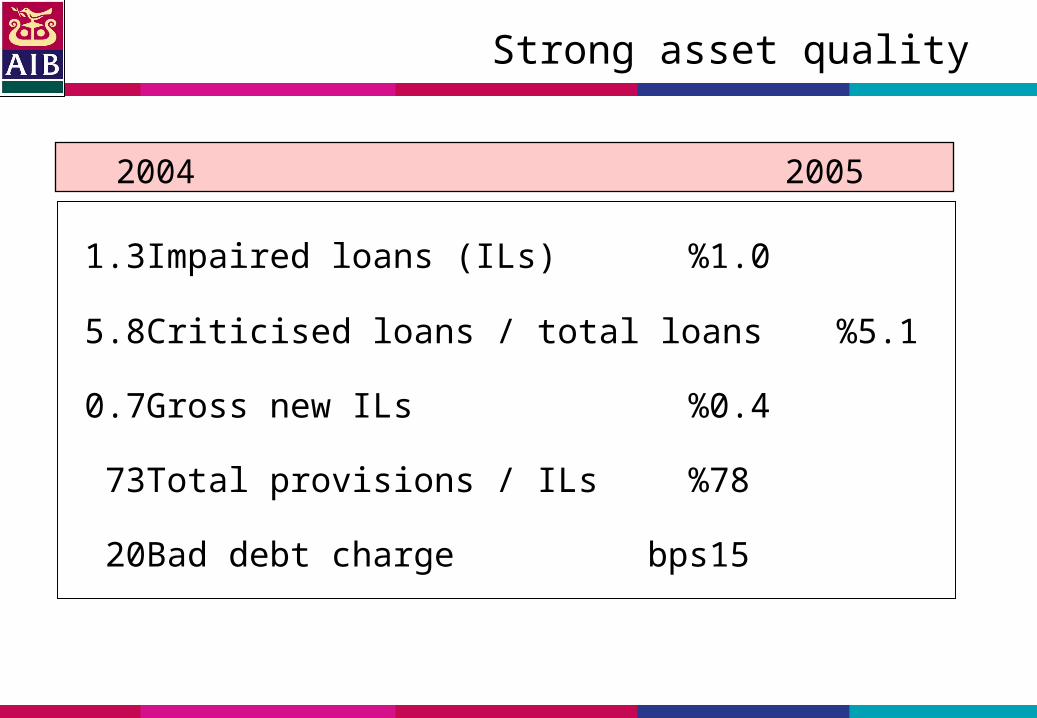
Strong asset quality
2004 2005
1.3 Impaired loans (ILs) % 1.0
5.8 Criticised loans / total loans % 5.1
0.7 Gross new ILs % 0.4
73 Total provisions / ILs % 78
20 Bad debt charge bps 15
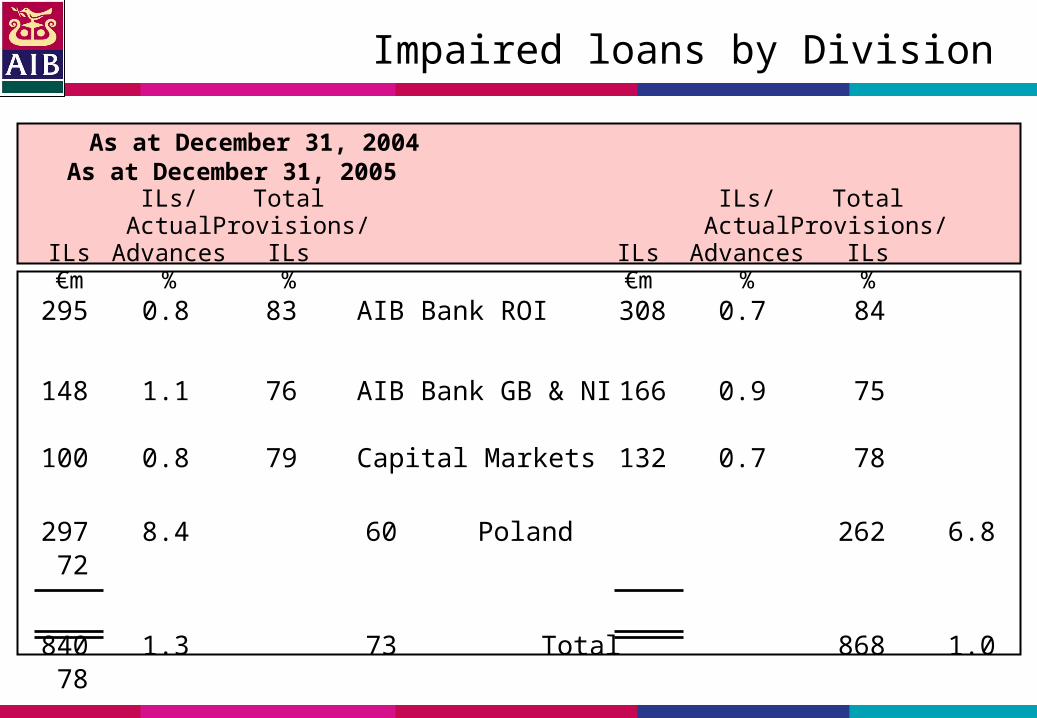
Impaired loans by Division
295 0.8 83 AIB Bank ROI 308 0.7 84
148 1.1 76 AIB Bank GB & NI 166 0.9 75
100 0.8 79 Capital Markets 132 0.7 78
297 8.4 60 Poland 262 6.8 72
840 1.3 73 Total 868 1.0 78
As at December 31, 2004 As at December 31, 2005ILs/ Total ILs/ Total
Actual Provisions/ Actual Provisions/ ILs Advances ILs ILs Advances ILs €m % % €m % %
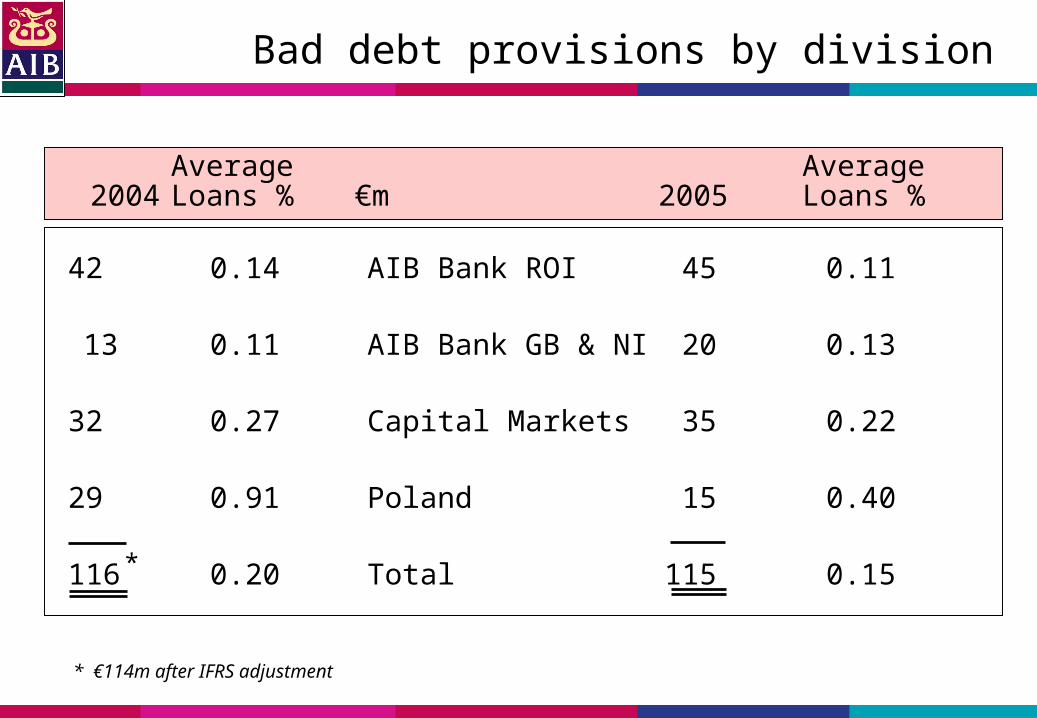
Bad debt provisions by division
42 0.14 AIB Bank ROI 45 0.11
13 0.11 AIB Bank GB & NI 20 0.13
32 0.27 Capital Markets 35 0.22
29 0.91 Poland 15 0.40
116 0.20 Total 115 0.15
Average Average 2004 Loans % €m 2005 Loans %
* €114m after IFRS adjustment
*
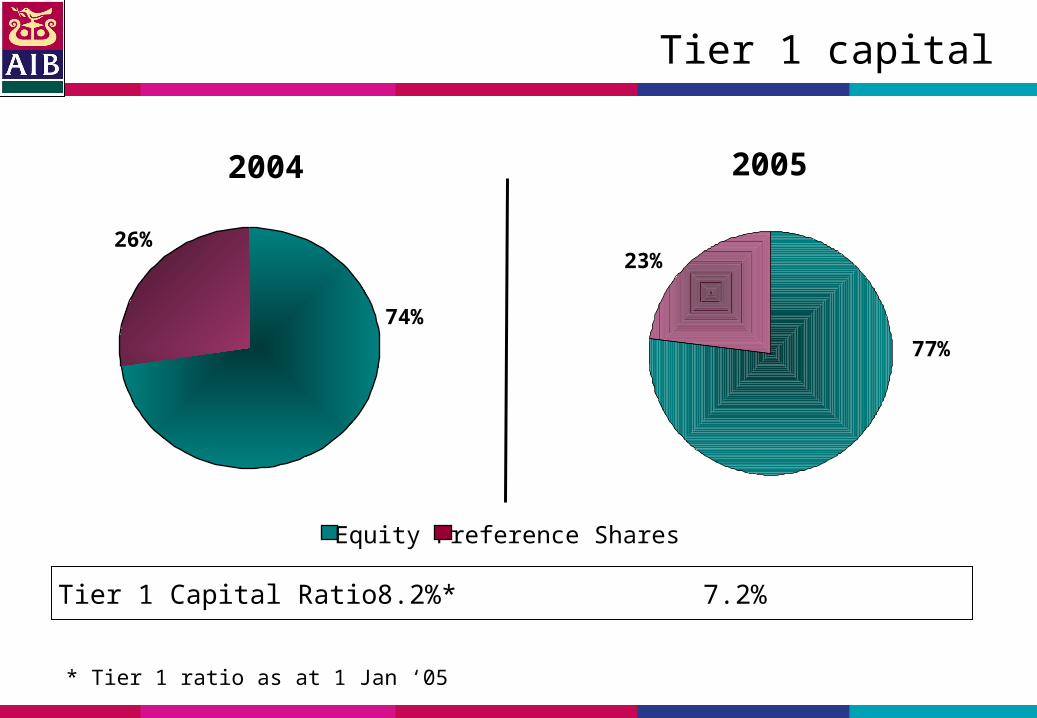
Tier 1 capital
23%
Tier 1 Capital Ratio 8.2%* 7.2%
Equity Preference Shares
2004
26%
* Tier 1 ratio as at 1 Jan ‘05
2005
77%
74%
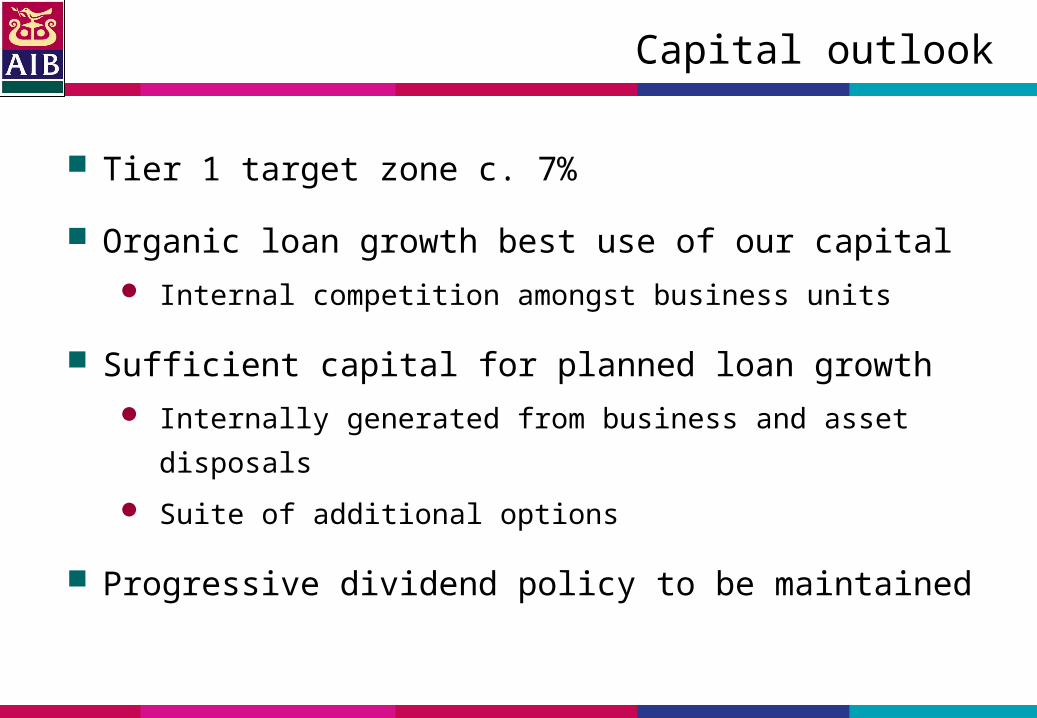
Capital outlook
Tier 1 target zone c. 7%
Organic loan growth best use of our capital
Internal competition amongst business units
Sufficient capital for planned loan growth
Internally generated from business and asset disposals
Suite of additional options
Progressive dividend policy to be maintained
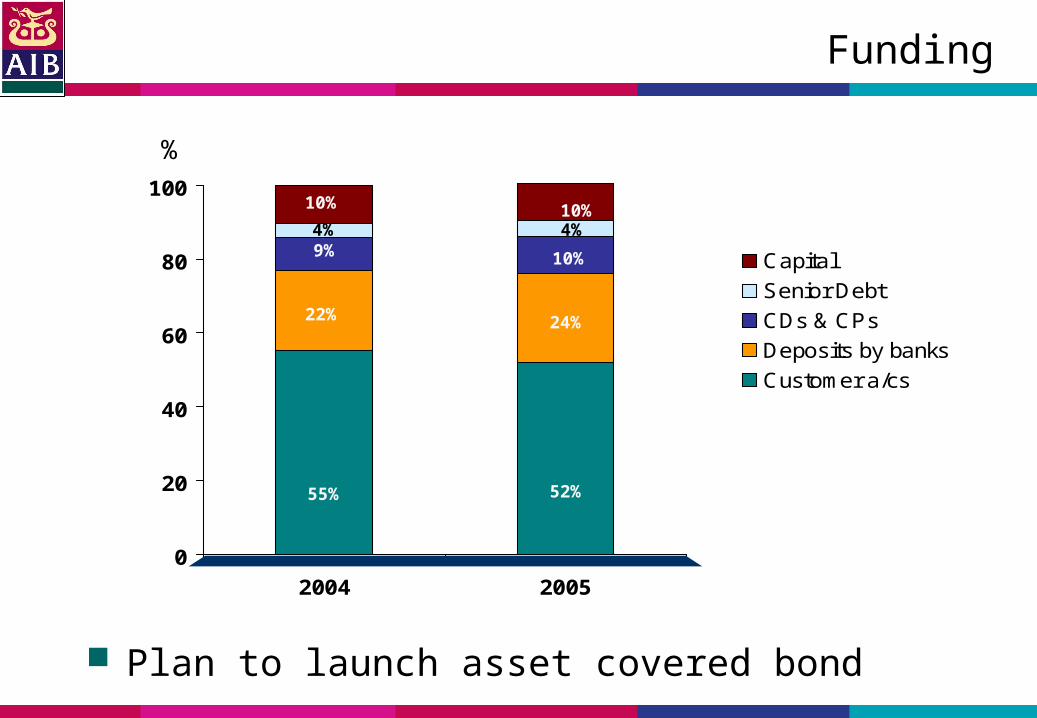
Funding
0
20
40
60
80
100
2004 2005
Capital
Senior Debt
CDs & CPs
Deposits by banks
Customer a/cs
55%
22%
10%
9%
52%
24%
10%
10%
%
4% 4%
Plan to launch asset covered bond
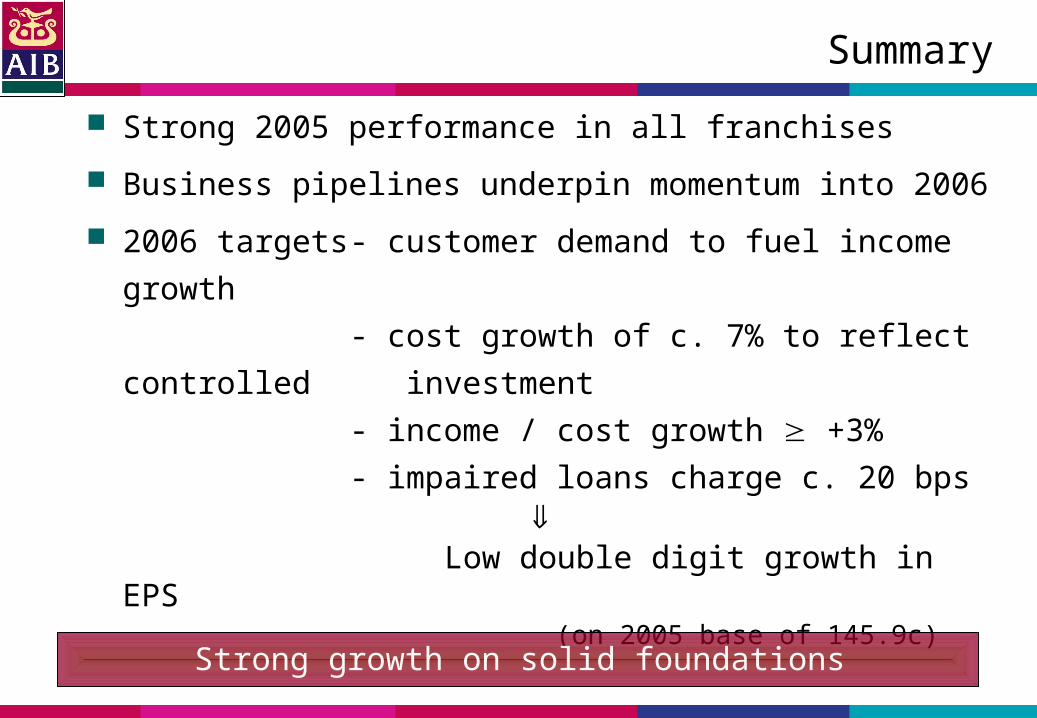
Summary
Strong 2005 performance in all franchises
Business pipelines underpin momentum into 2006
2006 targets - customer demand to fuel income
growth
- cost growth of c. 7% to reflect
controlled investment
- income / cost growth +3%
- impaired loans charge c. 20 bps
Low double digit growth in EPS (on 2005 base of 145.9c) Strong growth on solid foundations
Contacts
+353-1-660 0311
+353-1-641 2075
Alan Kelly [email protected] +353-1-6412162
Maurice Tracey [email protected] +353-1-6414191
Pat Clarke [email protected] +353-1-6412381
Alma Pearson [email protected] +353-1-6413469
Our Group Investor Relations Department will be happy to
facilitate your requests for any further information
Visit our website www.aibgroup.com/investorrelations