Embed Size (px)
Citation preview

24 May 2017
Hogg Robinson Group plc
(‘the Company’ or ‘the Group’)
Preliminary Results for the year ended 31 March 2017
Strategic progress driving earnings growth
Summary of results Years ended 31 March
2017 2016
Change (actual
exchange rates)
Change (constant exchange
rates) (1)
Revenue £335.1m £318.3m +5% (4%)
Reported earnings
- Operating profit £45.5m £39.3m +16% +7%
- Operating profit margin 13.6% 12.3% +1.3pp
- Profit before tax £33.1m £26.7m +24% +12%
- Earnings per share 6.9p 5.8p +19%
Underlying earnings (2)
- Operating profit £49.4m £44.8m +10% +2%
- Operating profit margin 14.7% 14.1% +0.6pp
- Profit before tax £37.0m £32.2m +15% +4%
- Earnings per share 7.8p 7.2p +8%
Dividend per share 2.64p 2.51p +5%
Free cash inflow (3)
£18.6m £28.9m (£10.3m)
Net debt (4)
(£21.0m) (£33.6m) +£12.6m
Online adoption (5)
51% 50% +1pp
David Radcliffe, Chief Executive of Hogg Robinson Group plc, said: “This has been a successful year for Hogg Robinson Group. We re-focused our growth strategy while also delivering a good financial and operating performance in line with our expectations. We are now seeing real gains in terms of improved efficiency, lower operating costs and an enhanced service to our clients and end customers. Against a backdrop of continuing macroeconomic and geopolitical uncertainty, combined with previously flagged strong competitor pricing activity, we have this year continued to expand underlying operating profit margin and deliver earnings growth. “As outlined at the half year, we have completed our review of the strategy for the Group. This has reaffirmed our confidence in the growth opportunities for HRG, our travel management business, and Fraedom, our FinTech business. We have a clear strategy and a defined route to accelerate and improve performance, underpinned by our technology. We have already started and will continue to invest in both businesses as we deliver our strategic objectives for growth. Concurrent with our results statement and consistent with our growth strategy, we have today announced the acquisition of travel innovator eWings.com and we look forward to welcoming our new colleagues to the Group.”
Operational highlights Re-focused our strategy with a clear pathway to generate and accelerate growth across the Group Achieved further operational efficiencies with annualised savings of £17m after two years of the 3-year
restructuring programme Rolled out new technology which is providing increased efficiency and an enhanced client experience
Financial highlights
Encouraging earnings growth with underlying profit before tax up 15%, up 4% at constant currency, driven by improved profitability with underlying operating profit margin up from 14.1% to 14.7%
Underlying basic EPS up 8% from 7.2p to 7.8p, with reported basic EPS up 19% from 5.8p to 6.9p HRG delivered a robust performance, with a 5% reduction in constant currency revenues largely offset by an
improvement in operating margin with underlying operating profit broadly flat year-on-year at constant currency
Fraedom performed strongly with revenue up 29% and underlying operating profit up 39%, or up 13% and 22% respectively at constant currency
Net debt further reduced to £21.0m, representing 0.3x EBITDA, creating a platform to support strategic intent with ongoing cash generation available to invest in the business
The Group’s pension deficit increased by £6.9m to £265.2m. An increase of £96.7m in liabilities resulting from a decrease in the discount rate from 3.5% to 2.7% in the period was largely offset as a result of a collaborative exercise with the Trustees which refined the underlying demographic assumptions for the members of the UK Defined Benefit Pension Scheme (‘the UK Scheme’) and contributed to a reduction in the UK Scheme’s liabilities of £68.4m
Final dividend up 5% to 1.925p per share; full-year dividend up 5% to 2.64p with underlying dividend cover of 3.0 times (2016: 2.9 times)
Key messages going forward We have undertaken a comprehensive review of our business and today announce our strategic plans which
we are confident will see significant growth in both HRG and Fraedom Both businesses will receive targeted incremental investment over the next three financial years as we invest
a total of circa £25m (excluding depreciation and amortisation) in operating expenditure and circa £13m in additional capital expenditure
The Board believes the benefits will be significant, resulting in a 3-year Group revenue CAGR of more than 4% with underlying operating profit margin targeted to exceed 16% in the medium term
FY18 will be a year of transition as we make our initial incremental investments. Excluding these investments, we anticipate FY18 would show modest growth in Group revenue and earnings year-on-year
Current trading and outlook Hogg Robinson Group has performed in line with management’s expectations since the year-end The Board is excited about the re-focused strategy and is confident in the investments that the Company is
making and that Hogg Robinson Group will make further good progress through the rest of the year in line with its strategic plan and growth targets
Notes: (1) Local currency results for March 2017 have been translated at March 2016 exchange rates. (2) Before amortisation of acquired intangibles and exceptional items. (3) Free cash flow is the change in net debt before acquisitions and disposals, Employee Benefit Trust purchases, dividends and the impact of foreign exchange movements. (4) A calculation of net debt is shown in Note 17 of the Financial Statements. (5) Online adoption is the proportion of total transactions booked by clients via proprietary or third-party online booking tools. (6) Our financial statements disclose financial measures which are required under IFRS. We also report additional financial measures that we believe enhance the relevance and usefulness of the financial statements. These are important for understanding underlying business performance.
For further information contact: Hogg Robinson Group +44 (0)1256 312 600 David Radcliffe, Chief Executive Michele Maher, Chief Financial Officer Angus Prentice, Head of Investor Relations FTI Consulting +44 (0)20 3727 1340 John Waples Alex Le May
Notes to Editors Hogg Robinson Group plc is a leading global B2B services company specialising in travel, payments and expense management. We help companies, governments and financial institutions manage and control their expenditure. We combine high-quality service delivered by experienced staff with the very latest digital solutions

based on our own technology. Our aim is to provide superior service and technology solutions that add real value to our clients and meet their unique requirements. Established in 1845, Hogg Robinson Group today consists of two market-leading and dynamic divisions - Fraedom, our FinTech business and HRG, our global travel management business. Our brands are seen across 120 countries where we provide innovative technology and superior services that add real value to our clients. www.hoggrobinson.com A presentation for analysts and institutional investors will be held at 0900h BST today at FTI Consulting, 200 Aldersgate, Aldersgate Street, London EC1A 4HD. A conference call facility and live webcast will also be available for analysts and institutional investors unable to attend in person. Pre-registration for this event is necessary to comply with security procedures at the venue. To register your interest in attending the presentation, to obtain conference call details and access to the live webcast, please contact FTI Consulting on +44 (0)20 3727 1340. A replay recording of the presentation via audio webcast and podcast with audio commentary from the Company's presentation team will be available at www.hoggrobinson.com by 1100h BST today or soon thereafter. This announcement may contain forward-looking statements with respect to certain of the plans and current goals and expectations relating to the future financial conditions, business performance and results of Hogg Robinson Group plc. By their nature, all forward-looking statements involve risk and uncertainty because they relate to future events and circumstances that are beyond the control of the Company, including amongst other things, the Company's future profitability, competition within the markets in which the Company operates and its ability to retain existing clients and win new clients, changes in economic conditions generally or in the travel and airline sectors, terrorist and geopolitical events, legislative and regulatory changes, the ability of its owned and licensed technology to continue to service developing demands, changes in taxation regimes, exchange rate fluctuations, and volatility in the Company’s share price. As a result, the Company's actual future financial condition, business performance and results may differ materially from the plans, goals and expectations expressed or implied in these forward-looking statements. The Company undertakes no obligation to publicly update or revise forward-looking statements, except as may be required by applicable law and regulation (including the Listing Rules). No statement in this announcement is intended to be a profit forecast or be relied upon as a guide to future performance.

Chairman’s Statement I am delighted to report to you during a momentous period for Hogg Robinson Group, one which has seen the appointment of new Board members, including myself, continuing operational progress, as well as a step-change in the Company’s strategy as we aim to generate and accelerate our growth. We are seeing substantial changes taking place in our markets. Client and end-customer needs are shifting rapidly towards better quality information for decision making, speed of delivery, increased flexibility and ease of use. Hogg Robinson Group has a deserved reputation for the quality of its service and is viewed as an industry innovator. The past year has been one of substantial change within the Group, and I am both encouraged and excited by the new and significant opportunities we have identified, and the progress being achieved. Hogg Robinson Group delivered a good financial performance during the past year in line with market expectations. Helped by favourable exchange rates, the Company saw revenue grow by 5% and operating profit by 16% on a reported basis, whilst underlying earnings and operating margin increased at constant currency. Strong free cash generation resulted in a 38% reduction in net debt to £21m at the financial year-end. This was underpinned by a strong operational performance and significant strategic progress. A more comprehensive analysis of business performance is provided by David Radcliffe, Chief Executive, in his statement later in this report. It would be wrong of me not to mention that we continue to operate in very challenging times. The macroeconomic and geopolitical backdrop is uncertain and variable. Global confidence has been shaken and trading conditions in our markets are typically fragile. Given this, clients are understandably asking more of us. Core to Hogg Robinson Group’s business model as a B2B services company is the delivery of superior, innovative services that solve clients’ commercial needs and deliver outstanding end-customer experience. We achieve this by combining high-quality service delivered by experienced staff with cutting-edge digital solutions based on our technology. The Company’s track record of consistent year-on-year earnings growth is testament to the robustness of the business model and its focus on delivering real value to our clients. In recent years, the Company has focused on restructuring the business, driving efficiency and reducing net debt. Two years into the 3-year restructuring programme, annualised savings of £17m have been achieved. Year-end net debt has now reduced by more than 75% since 2013. These are very significant achievements, positioning the business favourably and providing the platform for growth. During the past year, an in-depth review of both HRG, our travel management business, and Fraedom, our FinTech business, was undertaken. The results are very encouraging and confirmed our belief that market opportunities exist to grow both businesses significantly. Our strategy to achieve this is clear and details on the strategic initiatives to grow HRG and accelerate the growth of Fraedom are provided later in this report. Achieving this growth will require investment and in parallel with the Company’s strategy review, the Board also considered the appropriate capital structure for the business during the next phase of its development. The Board places great emphasis on maintaining the flexibility to deliver on its strategy and undertake the investment needed to achieve these growth plans. Accordingly, the Board has determined to target year-end net debt / EBITDA of less than 1.0 times, whilst being prepared to see leverage rise to 2.0 times in the context of acquisition opportunities to deliver growth. In addition, the Board will look to continue to grow dividends. Based on the performance of the Company during the year and our confidence in the strategy, we propose an increase in the total dividend of 5% for the year ended 31 March 2017. Ensuring that the Company demonstrates and adheres to the principles of good corporate governance is one of my main responsibilities as Chairman. This is certainly a theme on which the Board devotes a considerable amount of time and energy. Proper delivery of corporate governance starts at Board level and, in my opinion, having breadth of experience amongst the Board’s members is fundamental to successful execution. To that end, we welcomed two new members to the Board during the financial year. John Krumins joined as a Non-Executive Director on 1 April 2016 and Ashley Hubka was appointed Non-Executive Director with effect from 1 August 2016, both of whom bring extensive and valuable experience. John and Ashley are both members of the Company's Audit, Remuneration and Nominations Committees. Hogg Robinson Group attaches the highest importance to corporate governance matters, and continues to comply with the provisions and apply the principles of the UK Corporate Governance Code. The Board last conducted a formal review of its effectiveness during the financial year ending 31 March 2014. A further review of its operational effectiveness was deferred pending the change of Chairmanship and additional Non-Executive appointments to the Board which were completed in August 2016. With these changes now complete, the Board will conclude a formal review of its effectiveness and I look forward to reporting on that in due course.

Finally, I would like to extend my thanks on behalf of the Board to the senior management and staff who have contributed to the Company’s performance this year. We are at an exciting stage in the growth and development of the business and I look forward to the many positive challenges that lie ahead as we continue to deliver value for clients, employees and shareholders. Nigel Northridge Chairman

Chief Executive’s Statement Overview This was an exciting year for Hogg Robinson Group. Listening to our clients and end customers, it’s clear that the changes we have been making in recent years to the delivery of our service and deployment of our technology are providing real benefits. We have a proud reputation as a market leader and have worked hard during the past year to develop a strategy to deliver medium and long-term growth. Our culture is one of innovation: we seek to disrupt the norm. Our success continues to be driven by our ability to both drive and respond to change. Given the rapid transformations taking place in our markets and the opportunities that we see, we have moved from a phase where we focused on managing margins to deliver growth in profits to one where we believe we can generate and accelerate both revenue and earnings growth over the coming years. I provide more detail on this later in my report. I am delighted with the foundations we have built during the past year. We are now two thirds of the way through our three-year restructuring programme and we have already achieved £17m of the targeted £20m of annualised savings, with cumulative net underlying exceptional costs of £7.5m. These savings have been made as a result of numerous initiatives centred on a review of our operational and overhead cost base, consolidating our service delivery through hub locations as we reduce our property footprint, as well as deploying technology to improve efficiency. The estimated total cost over the three-year programme is approximately £11m. As part of those foundations, this year we commenced a major transformation programme aimed at modernising our core mid and back-office systems and processes, while harmonising our technology platforms across our European operations. When complete, we anticipate significant benefits in terms of speed of processing, quality of data and information delivered and, importantly, further cost reduction. I am also very pleased to report on a year of good financial performance for the Group, in line with our expectations. The financial year ended 31 March 2017 was challenging. The macroeconomic and geopolitical conditions continued to have a de-stabilising effect on many of the markets in which the Group operates. However, under such conditions we found many opportunities to work alongside our clients to offer real value through innovative service solutions often delivered in conjunction with our technology. Once again, the Group’s business model proved resilient, and we delivered earnings growth and margin gain compared to prior year. These achievements were made despite the predicted and continuing downward pressure on revenue caused by ongoing aggressive competitor pricing, lost clients and the further migration of our clients to online booking. Strategy update Hogg Robinson Group is a leading global B2B services company specialising in travel, payments and expense management. We help companies, governments and financial institutions manage and control their expenditure. We combine high-quality service delivered by experienced staff with the very latest digital solutions based on our own technology. Our aim is to provide superior service and technology solutions that add real value to our clients and meet their unique requirements. During the past three years, our strategy included two core elements: to grow our managed travel business by increasing our business from existing clients with new service offerings, entering new markets and winning new business by leveraging our technology and service delivery; and to develop a SaaS business focused on providing travel, expense and payment solutions to existing and new clients, either direct or through third party travel and payment providers. This strategy has proved to be the right one and, combined with our proven business model, has enabled us to grow earnings notwithstanding the challenging market conditions that have prevailed through this period. However, our markets are continually changing. Client needs have moved on with greater emphasis now on added value, and improved data and information to aid decision-making. Better service is required for the traveller/end-customer in the digital space and the use of mobile technology is increasingly important. With changes we see opportunities and we are determined to take advantage of these developments. Our aim is to innovate and disrupt, to lead in our chosen markets, and to ensure that we benefit from the changes taking place. Our response to the changing market in recent years has been focused on evolving the operational model and creating a more agile business, driving greater efficiency and reducing net debt. We have been very successful in this, continuing to deliver underlying earnings growth through improved profitability and reducing net debt by more than 75%. Our goal has been to consolidate our operating platform in order to create efficiency and drive the opportunity for future growth. We have worked hard to reduce our operating costs, and our three-year restructuring programme, combined with our technology, has been at the core of this initiative and our consistent record of underlying operating profit growth. Through tight cash management and ongoing free cash generation,

we have successfully deleveraged the business and thereby created future investment capacity. In short, we believe our business is now in good shape and we have the platform for growth. As we shifted our focus from operational effectiveness to delivering long-term growth, we undertook a detailed review of the Group’s businesses and the markets in which they operate, to ensure we continue to deliver real value to our clients and end customers, while identifying the opportunities available to the Group. The results of this review are very encouraging and reaffirm our belief that we can significantly grow the Group’s revenue over the medium and long term without diluting profitability. Furthermore, we see this being delivered through clear opportunities to grow HRG and at the same time accelerate the growth of Fraedom. The travel management industry continues to grow. Recent data published by the World Travel & Tourism Council forecasts a 38% increase in business travel expenditure over the next ten years. As the industry changes in response to evolving client and end-customer needs, we believe HRG’s reputation for providing superior service to its clients based on the knowledge and experience of its staff combined with its technology provides it with the necessary differentiation needed to take advantage of these changes and the growth in the industry. Our ambition is to create a seamless end-customer experience, superior travel content and data functionality. In addition, a lower cost to serve and our standardised operational model will deliver exceptional service to our clients. We are already providing new, innovative ways to add further value in our service to clients, and taking a leading position in the travel management industry through our work with suppliers to develop new distribution models. The FinTech industry has seen explosive growth in recent years both in terms of investment and areas of specialisation. There is now great diversity in the industry and because of this, scale is likely to be a pre-requisite for success along with focus on a particular discipline. Fraedom is focused on the Payments segment, providing technology solutions designed to maximise corporate card spend for issuers such as Visa and SunTrust. According to independent research, amongst the global population of roughly 25,000 banks, there are approximately 500 corporate card issuers. This is exactly the space Fraedom is targeting. Beyond the corporate issuer opportunities, there is further opportunity for Fraedom to partner with retail banks serving SME customers to provide white-label services including payment, expense and travel management. Lloyds Banking Group is an example of a Fraedom client in this category. With our ambition for growth, we have therefore taken the opportunity to update and develop the Company’s strategy which can now be summarised as: To grow HRG through market leadership and innovation, and to accelerate the growth of Fraedom
through partnership and market disruption, while driving shareholder value. To deliver on our strategy, we will employ our people and technology to deliver superior, innovative services that solve our clients’ commercial needs and deliver outstanding end-customer experience. Going forward, our clear focus is on significantly growing our two businesses. To achieve this, we have identified a number of strategic initiatives for each business as follows: HRG Build on technology innovations that increase service efficiency and thereby lower operating cost, while
enhancing our service capability Offer better quality data and actionable insight to our clients and improve the end-customer experience Align sales force scale and capabilities with new market opportunities Grow supplier revenue and margin, working more closely with our key supplier partners using our technology Implement new operational and productivity initiatives that drive greater efficiency and lower operational costs Fraedom Work with our chosen partners to define and build market-leading capabilities Add new partners to accelerate market penetration Build scale advantage in the Payments space through investment in sales and support resources to grow
revenue, and in technology to improve the efficiency of client on-boarding and to create unique value for our clients
Invest further in Fraedom’s platform to ensure a mobile-first approach to all technology development Enable a ‘touchless transaction’ experience for Fraedom’s expense management user base In order to deliver these strategic initiatives, we will make a series of incremental investments across the two businesses over the next three years, with the phasing weighted towards years two and three. A significant

proportion of these investments will support the recruitment of additional sales and support resources as well as investments in the development and roll-out of our technology. Across the 3-year period, we anticipate incremental operating expenditure totalling circa £25m (excluding depreciation and amortisation) and circa £13m in additional capital expenditure. The Board believes the financial benefits of this investment will be significant, increasing overall 3-year Group revenue CAGR to more than 4% with the underlying operating profit margin targeted to exceed 16% in the medium term. This reflects: In HRG, a 3-year revenue CAGR of more than 2% per annum and medium-term underlying operating profit
margin in excess of 15%; and In Fraedom, revenue CAGR of circa 20% with underlying operating profit margin maintained above 22% over
the medium term. FY18 will be a year of transition as we absorb the roll-over effect of FY17 losses and the slowdown in sales as well as build our initial incremental investments to drive our growth strategy. Excluding these investments, if we were not following our revised strategy, we anticipate FY18 would show modest growth in Group revenue and earnings year-on-year, but this would have relied on HRG being more reliant on cost savings which would have made a subsequent strategy for significant growth more difficult to pursue in the medium term. Consistent with the investment profile, the Board expects the realisation of these returns to accelerate over the three-year strategy period as initiatives are delivered and once the initial costs have been absorbed. In addition to these potential organic improvements, the Board believes that growth could be further enhanced through selective acquisitions. We see scope to acquire businesses capable of bringing complementary capability and market reach to each of HRG and Fraedom, and the Group’s strong financial position provides us with the flexibility to pursue these opportunities as they arise. Consistent with this philosophy is our acquisition announced today of travel innovator eWings.com, a next-generation travel management company offering a fast, easy online solution to digital business travel, with a simple-to-start process and low cost service model especially well suited to small businesses. Fitting well with our technology platform, eWings.com provides HRG with a developed solution as well as exciting new technology which is highly complementary to our own technology. Performance in FY17 On a reported basis, Group revenue rose by 5%. Underlying operating profit was up 10% and underlying profit before tax rose by 15% compared to prior year. We delivered further growth in underlying operating profit margin, up 0.6 percentage points to 14.7%, driven by an increasing contribution from Fraedom as well as improved profitability in the travel management business as a result of the restructuring programme. Reported revenue and earnings benefited from the effect of favourable foreign exchange rate movements in the period as a proportion of our business is transacted in non-sterling currencies. At constant exchange rates, revenue was 4% lower than in prior year, while underlying operating profit and profit before tax were 2% and 4% higher respectively. Cash generation remained strong and we achieved an excellent level of free cash generation in the period. As a result of ongoing tight cash management, the Company generated £18.6m in free cash inflow and reduced net debt by £12.6m, or 38%, to £21.0m. We took proactive measures in the year to improve the estimate of the Group’s pension liabilities. During the second half, in collaboration with the Trustees of the UK Scheme, we commissioned a Medically Underwritten Mortality Study (MUMS) to improve the quality of demographic assumptions relating to the UK Scheme’s members. This valuable exercise contributed to a £68.4m benefit to the year-end accounting deficit, which largely offset a £97.0m increase in the UK Scheme liabilities as a result of a reduced discount rate. As a result of this, as well as an increase in the value of plan assets, the overall Group pension deficit increased by £6.9m. HRG showed a steady performance during the year growing underlying operating profit margin by 0.3 percentage points to 13.6%. Market conditions during the first half of the financial year remained broadly similar to the prior year, although the second half saw some deterioration as the lack of clarity around the effect of Britain’s exit from the European Union made some UK and Continental European companies act more cautiously. As predicted, aggressive competitor pricing continued and together with the effect of the ongoing trend of clients moving to online booking, we experienced continued downward pressure on our revenue. We also saw the effect of client churn from clients lost last year as well as clients lost in the current year, particularly in the second half. Against this backdrop, it was therefore encouraging to see the results of management’s actions to restructure operations

and align operating costs such that, whilst HRG’s revenue was down 5% overall at constant currency, underlying operating profit remained broadly unchanged. We are very pleased to welcome a number of new HRG clients that joined us during the year, including BearingPoint, Elekta, Estee Lauder, Sidel, Tata Communications and WSP Parsons Brinkerhoff. We also secured expanded contracts, in terms of service and geography, with existing clients such as ABB, Tetra Laval, Politiet and VW Group. Notable amongst clients renewing their contracts with HRG were AIG, Bechtel, Centrica / Direct Energy, Deutsche Bank, Lloyds Banking Group and Wells Fargo. Once again, these successes are evidence of the huge diversity of HRG’s client base across both industries and geographies, which is one of the Group’s key strengths. In line with our expectations, Fraedom continued to perform well. Compared to prior year, revenue rose by 13% and underlying operating profit by 22%, both at constant currency. Fraedom now accounts for 10% of Group revenue and 17% of underlying operating profit (2016: 8% and 13%, respectively), which is testament to its growing importance within the Group. We invested in new staff and office space during the first half of the financial year to support the continued pace of growth and to accommodate some new banking partners that began to generate incremental revenue during the second half. During the year, we welcomed several new banking partners including ING Bank, TD Bank and UMB Financial Corporation, and extended our global contract with long time strategic partner, Visa. Towards the end of FY15, we launched the Fraedom brand to take advantage of marketing all our Software as a Service (SaaS) and non-travel related technology operations under one trade name. Fraedom has grown rapidly and with that success we have since aligned the Group’s operations into two divisions: HRG, covering our travel management operations, and Fraedom, our FinTech business. HRG is operating in an industry where market forces are continuing to drive change. We believe that travel management companies like HRG that have their own proprietary technology are likely to be the most successful. Fraedom ’s technology development resources are now focused on its core payments and expense management offerings, while continuing to offer plug-in applications, including travel. Capital structure update One of our priorities in recent years has been to reduce net debt and this remained a priority in the current year. Through strong free cash generation and ongoing tight cash control, I am pleased to report that we reduced year-end net debt by £12.6m (38%) to £21.0m, equivalent to 0.3 times EBITDA for the last 12 months (2016: 0.6 times). During the year, we undertook a review to consider the appropriate capital structure for the Company in the context of our foreseeable plans for the business. The Board places great emphasis on maintaining the flexibility to deliver on its strategy and will undertake investment to increase growth in HRG and accelerate growth in Fraedom. Accordingly, the Board has determined to target year-end net debt / EBITDA of less than 1.0 times, whilst being prepared to see leverage rise to 2.0 times in the context of acquisition opportunities. The Board will look to continue to grow dividends. Summary and outlook This has been a very busy and exciting year for Hogg Robinson Group, during which we undertook a detailed review of the industries and markets in which our two businesses, HRG and Fraedom, operate, and identified a wealth of opportunities for growth for both. Consequently, we re-focused our strategy during the period as we moved from an emphasis on operational efficiency to manage margins, to one centred on growing HRG and accelerating the growth of Fraedom. We plan to invest in both our businesses as we implement our strategic objectives. We also made good operational and financial progress during the year, delivering further savings from our restructuring programme, while increasing underlying operating profit and free cash generation. However, as previously predicted, we saw continued migration by clients to online booking as well as ongoing competitive pricing pressure during the year. With our focus on only engaging in contracts which will be profitable for HRG or which offer strategic benefit to the Group, these factors resulted in some client losses in the period. Going forward, we anticipate that the rollover effect of these losses and our absorption of the initial costs of our strategic investments will mean that FY18 will be a year of transition. Excluding these investments, we anticipate FY18 would show modest growth in Group revenue and earnings year-on-year. Thereafter, the Board expects the returns on these investments to accelerate and deliver both revenue and earnings growth in the medium term.

We are very excited about the prospects for the Group. We expect macroeconomic and geopolitical uncertainties to continue to influence our markets but we have confidence in our business model and in our ability to make adjustments to mitigate any resulting adverse effects or take advantage of emerging favourable trends. Since the year-end, Hogg Robinson Group has performed in line with management’s expectations. The Board is confident in the investments that the Company is making and that Hogg Robinson Group will make further good progress through the rest of the year in line with its strategic plan and growth targets. In closing, these results would not have been possible without the commitment and professionalism of all my colleagues in Hogg Robinson, to whom I would like to say a sincere thank you. David Radcliffe Chief Executive
Operational review HRG
Years ended 31 March 2017 2016
Change (actual
exchange rates)
Change (constant exchange
rates)
Revenue £302.0m £292.7m +3.2% (5.4%)
Share of Group revenue 90.1% 92.0% (1.9pp)
Operating profit £37.4m £33.9m +10.3% +3.5%
Underlying operating profit (1)
£41.2m £38.9m +5.9% (0.5%)
Share of Group underlying operating profit 83.4% 86.8% (3.4pp)
Underlying margin (1)
13.6% 13.3% +0.3pp
Online adoption 51% 50% +1pp
(1) Before amortisation of acquired intangibles and exceptional items
Revenue declined by only 5.4% at constant currency in spite of a 7% year-on-year decline in client
transaction activity Underlying operating profit margin up from 13.3% to 13.6% Client travel transaction activity declined by 7% year-on-year, while client travel spend at constant currency fell by 10%. Air travel bookings accounted for 46% of all bookings, rail 17% and hotel 28%, all broadly in line with last year. For the 12-month period, air bookings declined by 6%, while rail and hotel were down by 9% and 7% year-on-year respectively. HRG clients continue to focus on cost control and maximising value for money from travel budgets. This is increasingly coupled with introducing digital services to enhance the experience for travellers. Our clients implement ever more sophisticated savings strategies to maximise the efficiency of travel and accommodation expenditure in line with their corporate objectives. Leveraging consolidated volumes to secure discounts is complemented by changing traveller behaviour to take advantage of spot buying in order to benefit from ‘lowest on the day’ fares or rates. HRG continues to build capability and demonstrate added value in this area, particularly through stakeholder engagement and communication to highlight the potential opportunity for savings through proprietary reporting and analytics. New savings strategies that are being implemented include alternatives to travel (e.g. video conferencing, travelling less frequently), and control of wider travel related expenses as they relate to the total cost of each trip. Such programme optimisation, as well as a growing demand for outsourcing travel management solutions, provides additional revenue opportunities for the Group, helping to offset the effect on our revenue of clients moving online and increasingly competitive pricing pressure. This also results in encouraging the development of more strategic and higher margin relationships.

Self booking is growing more modestly, with organisations taking a specific interest in broader content sources that complement the traditional corporate travel market. This has created a growing overlap between the corporate and leisure market. Online adoption reached 51% from the previous 50% in FY16. Whilst revenue to HRG may reduce in the short term as a result of this shift, once the cost associated has been re-directed or taken out, we have seen our margins increase. Traveller experience solutions are increasingly central to many procurement decisions. This can be described as the service provided to the traveller before, during and after travel, and in addition to simply making a booking or reservation. This requirement is being fulfilled by interactive and contextual mobile solutions, supported by offline service support when and where appropriate. Our continued focus on delivering added value management solutions has resulted in a number of successful client retentions. Like any global business, we lost some clients as our model is mainly focused on profitability through client fees rather than supplier volume. However, it is pleasing to report that during this financial year HRG retained and/or expanded its relationship with many clients including ABB, AIG, Bechtel, BMW, Centrica, Deutsche Bank, Lloyds Banking Group, Politiet, Tetra Laval and Wells Fargo. HRG technology During the year we consolidated all of our travel technology resources within HRG and created a new team called hrgtec. This team is focused solely on HRG and the transformation of our digital end-customer experience. Due to the rapidly changing market place in business travel, with product consumerisation and the need to evolve our offering, the development focus of our team is on a ‘mobile first’ strategy, reflecting the change away from classic desktop-based enterprise systems. Our travel technology developments during the year include: our new HRG travel app, delivering a range of itinerary-based information and support for the enabled traveller; a refresh of our global i-Suite travel portal; and a new look and feel for our booking tool, HRG Online. All of these travel technology tools are device agnostic and screen contextual, which means our products can be viewed on any device screen of any size including mobile, tablet and desktop. We have also commenced work on our enhanced ‘Direct Connect Platform’ which will enable HRG to remain the market leader as we enter the next phase of travel distribution. Within our global branch network we have continued to deploy our ‘smart’ booking app agent desktop and our unified communications strategy. This paves the way for further enhancements as we create an omni-channel digital end-customer platform to enable us to communicate in multiple ways. Data remained a critical focus during the year with a new back end data structure and capture process being developed along with a new more dynamic user interface being in its first trials. All of these technology developments underpin our strategy for growth, and enhanced service delivery to our clients and end customers. Fraedom
Years ended 31 March 2017 2016
Change (actual
exchange rates)
Change (constant exchange
rates)
Revenue £33.1m £25.6m +29.3% +12.9%
Share of Group revenue 9.9% 8.0% +1.9pp
Operating profit £8.1m £5.4m +50.0% +31.5%
Underlying operating profit (1)
£8.2m £5.9m +39.0% +22.0%
Share of Group underlying operating profit 16.6% 13.2% +3.4pp
Underlying margin (1)
24.8% 23.0% +1.8pp
(1) Before amortisation of acquired intangibles and exceptional items Strong revenue and earnings growth Expansion in underlying profit margin Release of new native apps Fraedom has two channels or routes to market: (1) Partners - typically banking partners, which use Fraedom’s technology to build and brand Payment and Expense products for their own business customers, and (2) Direct -

clients which buy Fraedom’s technology to use within their own business to help them implement Expense solutions for their company. Revenue increased by 13% on the prior year with underlying operating profit up 22%, both at constant currency. Revenue from Partners accounted for 79%, with 21% coming from Direct clients, unchanged from prior year. Usage and hosting fees accounted for 74% of revenue and development/implementation 26% (2016: 73% and 27%, respectively). The geographic distribution of revenue in the period was Americas 66%, AsPac 27% and Europe 7% (2016: 68%, 25% and 7%, respectively). New and existing banking clients continued to drive revenue growth with a number of new banking partners signed over the course of the year, including ING Bank, UMB Financial Corporation and TD Bank, while at the same time strategic partner Visa extended its global contract with Fraedom for an additional five years. In our Direct business, we continued to focus sales efforts on the Asia Pacific region, successfully signing a number of new client contracts including George Weston Foods and Iluka Resources. Across the entire client base, the Fraedom platform managed over 192m transactions in FY17, an increase of 16.6% on the prior year. During the course of the financial year, the Fraedom platform managed transactions totalling £33.6bn, up 34% at constant currency. As the commercial payments arena becomes increasingly consumerised, the desire for value-adding technology among banks and their commercial clients has never been greater. As demand for digital self-service tools along with more advanced payment and expense capabilities continues to grow, Fraedom is well positioned to capitalise on the B2B payments opportunity and will continue to invest in these key areas as part of its strategy moving forward. Specifically, trends in the areas of big data, artificial intelligence and machine learning offer strong future potential for the payments industry, while regulation looks set to drive a future of more ‘open banking’, making API’s and technology ‘plug-ins’ an area of strategic focus for the Fraedom business. Fraedom continues to invest in R&D and platform support with a total of £10.3m for the year, up 47% from £7.0m last year, principally due to investment by the business in new development teams to progress the development of card management, ePayables and expense management functionality. The team commenced rollout of the new UX (User Experience) across the platform, as well as the development and release of a mobile app to support both the direct Expense module and Fraedom’s white-labelled partner offerings. In addition, new visual reporting solutions have been developed and launched providing graphical insights into transactional spend. These new product offerings were further supported by significant investments into Fraedom’s infrastructure and architectural technologies. This investment has been underpinned by a dual strategy to provide native mobile apps alongside a responsive desktop website. This approach has ensured that all new product offerings to the market adhere to industry best practice and mobile-first design principles. Notable milestones for the year include the concurrent release of native apps to the market on both iOS and Android. These mobile apps have subsequently been white labelled and delivered to Fraedom’s partners, with further work under way expanding this offering to include other Fraedom product verticals such as ePayables.

HRG - Regional activity We should be mindful that all our regions exist to serve our global capability and do not operate for the sake of separate regional profitability. Below we provide trading detail on our material travel management businesses. Europe
Years ended 31 March 2017 2016
Change (actual
exchange rates)
Change (constant exchange
rates)
Revenue £204.9m £201.9m +1.5% (5.3%)
Share of TM revenue 67.8% 69.0% (1.2pp)
Operating profit £25.9m £26.3m (1.5%) (6.5%)
Underlying operating profit (1)
£28.5m £30.3m (5.9%) (10.6%)
Share of TM underlying operating profit 69.2% 77.9% (8.7pp)
Underlying margin (1)
13.9% 15.0% (1.1pp)
Online adoption 48% 46% +2pp
(1) Before amortisation of acquired intangibles and exceptional items Constant currency revenue lower due to price competition, lost clients, ongoing adoption of online and lower
trading Overall performance impacted by re-tender restrictions with the UK Government and some client losses Underlying operating profit reduction largely in line with fall in travel booking activity Revenue was down by 5.3% while underlying operating profit declined by 10.6%, both at constant currency. Client travel spend decreased by 8% year-on-year in real terms and travel activity was 6% lower. Client adoption of online self-booking grew moderately during the period, accounting for 48% of all bookings made in the region, up from 46% last year. UK As noted at the half year, we were restricted from being able to retain all of the UK Government business that we had historically serviced. The resulting loss of several UK Government departments along with a number of corporate losses and continued downtrading in the Energy & Marine sector, has meant that client travel spend and booking activity in the UK declined versus prior year by 9% and 11% respectively. However, during the second half of the year we did see some growth in a number of existing clients. Online adoption has remained relatively stable compared to prior year at around 60%. Our success rate for new business in FY17 was not at the levels we normally experience and we have taken steps to further develop our proposition, as well as invest in additional sales resource that will be in place for the start of FY18. This has been a challenging year for client contract renewals, which is reflected in some lost business but we are pleased to have secured, renewed or extended contracts with a number of key clients, including ABB, Centrica, Lloyds Banking Group and TSB. We have also seen year-on-year travel activity and revenue growth in the UK Government business that we retained last year and were also pleased to win WSP Parsons Brinkerhoff as a new client, which will commence trading early FY18. The challenging trading environment has meant that our three-year cost restructuring programme has remained a key priority. During the final quarter, we commenced a project to consolidate our Leicester business travel operations into Manchester, which will be completed by the summer. The global standardisation of our agent booking platform has continued during the year with completion expected by the end of 2017. The centralisation of operational support tasks from the UK and other European markets into Poland has been successful and plans to expand this further during FY18 have commenced. Nordics Our Nordic business saw positive year-on-year growth in client travel activity during the financial year, driven by Sweden, Finland and Denmark, with Norway continuing to see a modest decline due to ongoing weakness in the Energy & Marine market. However, we did see signs of a recovery in Norway during H2 with booking activity showing positive year-on-year growth. Overall client booking activity across the region was 6% higher, while client spend was broadly unchanged at constant currency. The Nordics have had a successful year in winning new business with SSAB and Scania starting trading in Q4 and we have extended contracts with Politiet (including additional business) and Tetra Laval. Online adoption levels continue to increase in the region from 55% last year to 60% this year. Our Nordics Meetings, Groups & Events (MGE) business continues to grow, driven by Sweden and Norway. The SME market continues to be challenging with volume and revenue declines across all markets, although this decline is now slowing. Given the growing online adoption levels and pressure on margins, we remained focused on reducing our cost base across the Nordic markets. Staffing levels have

decreased versus last year and we have downsized our offices in Oslo, Stockholm and Helsinki in order to drive operational efficiencies. Germany While German economic growth remains stable largely driven by strong exports, we have seen automotive clients display a more cautious and cost conscious approach compared to prior years. In our German operations, client travel activity declined by 1% year-on-year while client spend was 3% lower at constant currency. This decline reflected the loss of KPMG and Novartis which ceased trading during the second half of the year, whilst new client ABB started trading. We were also pleased to be notified of a major new client, BearingPoint, which will commence trading with us in Q2 FY18. Our Sports business has enjoyed a successful year delivering strong revenue and earnings growth, as we benefited from work related to the European Football Championships and Olympic games last summer, as well as qualification matches for the 2018 World Cup. As noted at the half year, we agreed to sell our shareholding in our joint venture with Borussia Dortmund, which generated a positive earnings benefit. Our German MGE business has also delivered double-digit year-on-year revenue growth, on the back of new client wins including Merck, Amgen and Samsung. Online adoption is still relatively low in Germany but continues to increase, up from 23% last year to 28% this year. This reflects new business with higher than company average online adoption levels, plus demand from existing clients to drive online bookings. During the financial year as part of a wider European initiative, we transitioned 24 hour services from Frankfurt to a new centralised team based in Barcelona, as well as closing our Bonn office and consolidating its operations into Cologne. We have already successfully implemented airline direct connect solutions for a large German client and see further demand for these solutions going forward. Switzerland The loss of key client Novartis during the first half of the financial year along with the continuation of the general downward trend in trading has meant that Switzerland has seen a significant year-on-year decline in both client spend, lower by 25% at constant currency and client booking activity, lower by 18%. The resulting decline in revenue has meant that the Swiss business has again had to respond quickly to reduce its cost base. As well as reacting quickly to reduce operational headcount, we have closed our offices in both Lausanne and Winterthur, downsized office space in Zurich and Basel whilst also continuing to increase home working opportunities for employees. During the final quarter we also transitioned operational support services to Poland as part of the European centralisation programme. The SME sector remains an important part of the Swiss market. We have focused on this segment during the year and been successful in winning new clients in this competitive area. Despite the loss of revenue associated with the lost business, earnings in the period have been broadly maintained versus prior year and we have taken steps to invest in new sales resource in this market. The online adoption rate remains low compared to other markets. However, it has increased from 18% last year to 21% this year. North America
Years ended 31 March 2017 2016
Change (actual
exchange rates)
Change (constant exchange
rates)
Revenue £80.0m £74.0m +8.1% (4.6%)
Share of TM revenue 26.5% 25.3% +1.2pp
Operating profit £12.1m £10.3m +17.5% +5.8%
Underlying operating profit (1)
£12.5m £10.9m +14.7% +3.7%
Share of TM underlying operating profit 30.3% 28.0% +2.3pp
Underlying margin (1)
15.6% 14.7% +0.9pp
Online adoption 61% 59% +2pp
(1) Before amortisation of acquired intangibles and exceptional items Revenue down only 4.6% at constant currency in spite of an 8% year-on-year reduction in client transaction
activity Earnings growth with underlying operating profit up 3.7% at constant currency Excellent margin increase with underlying operating margin up from 14.7% to 15.6% Client spend was down 12% at constant currency and activity levels were lower by 8%. Adoption of online self-booking by clients is well advanced in this market and accounted for 61% of all transactions compared to 59% last year.

Although revenue was down by 4.6%, underlying operating profit rose by 3.7%, both at constant currency. This increase in underlying operating profit together with the expansion to underlying margin of 0.9pp was underpinned by continued cost-saving measures and efficiencies. During FY17, we downsized our Corporate Head Office space in New York and continued to streamline overhead costs and operational processes through the introduction of technology to further optimise the booking process. The business travel market in North America was generally stable. However, we did experience a higher than usual impact from client losses during FY17. Corporate client booking activity was lower than in prior year, mainly due to business lost in H1, which included Novartis, Yahoo, Discovery and DirectTV. We also lost Disney in the final quarter of the financial year. Clients in the Energy & Marine and Finance & Banking sectors have traded down slightly this year, however with recent positive movements in both interest rates and oil prices we have seen some modest recovery in the volumes traded within these sectors. North America remains a key area of growth opportunity for HRG. We have strengthened our sales team accordingly during the financial year and will continue to invest going forward in what continues to be a key market. We won and implemented new business from AIG TravelGuard and Duracell during the year and have recently been advised of new business from WSP Parsons Brinkerhoff and Sandvik that will commence trading in FY18. It was a busy year for contract renewals during FY17 and we were pleased to secure contract extensions with several important clients, including Wells Fargo, Deutsche Bank, VW and BMW. Our loyalty business saw year-on-year growth in activity levels during the financial year as we successfully secured some important existing clients. This included the renewal and expansion of our contract with Scotiabank during the year and also the extension of our contract with another key client, Expedia, whilst we finalise a new three-year agreement. The new business pipeline continues to be strong particularly within the Tier 1 banking sector. We won new business from Points.com and ASA Nippon Airways during the year and are currently working on a number of exciting opportunities to expand this business segment further in North America. Asia Pacific
Years ended 31 March 2017 2016
Change (actual
exchange rates)
Change (constant exchange
rates)
Revenue £17.1m £16.8m +1.8% (11.3%)
Share of TM revenue 5.7% 5.7% -
Operating loss (£0.6m) (£2.7m) +£2.1m +£2.3m
Underlying operating profit/(loss) (1)
£0.2m (£2.3m) +£2.5m +£2.6m
Share of TM underlying operating profit 0.5% (5.9%) +6.4pp
Underlying margin (1)
1.2% (13.7%) +14.9pp
Online adoption 41% 45% (4pp)
(1) Before amortisation of acquired intangibles and exceptional items Complete restructuring of our Australian operations Significant improvement in operating profit resulting from cost reduction actions Revenue was down by 11% at constant currency in spite of client travel spend falling by 21% year-on-year in real terms and travel activity 21% lower. Underlying operating profit improved from a loss of £2.3m last year to a profit of £0.2m this period including a £0.1m adverse currency effect. Online self-booking of travel in the Asia Pacific region accounts for 41% of all bookings, down from 45% in prior year. Australia We continued to restructure our Australian business throughout the financial year, in response to continuing weak economic conditions in the domestic economy as well as a number of client losses. Travel booking activity declined by 32% year-on-year with travel spend reducing by 36% in real terms, and we have aligned the cost base to this downturn in trading delivering a reduction in FTEs of 45% compared to last year. The benefits from our cost reduction actions were apparent with operating profit improving significantly year-on-year and the business is now well placed to capitalise on a recovering Australian economy. We have put in place new management and have invested in additional sales resource in order to grow the business going forward. We were also pleased to extend a number of contracts with key clients including MMG, ABB, Air Services Australia and National Broadband Network. Online adoption in this mature online market remains at over 65%. The MGE

sector has performed strongly and we continue to see opportunities to develop our MGE business on the back of some successful projects for key clients. During the year we took the opportunity to downsize our Sydney property and consolidate two offices into a new location in Melbourne.

Financial Review Overview Revenue of £335.1m was up 5.3% as reported but down 4.0% at constant exchange rates. Underlying operating profit, which is before amortisation of acquired intangibles of £0.2m (2016: £0.7m) and exceptionals of £3.7m (2016: £4.8m) increased by £4.6m resulting in the margin increasing from 14.1% to 14.7%. The 10.3% rise in underlying operating profit included a 7.8% benefit from currency movements. Underlying profit before tax was up by 14.9% to £37.0m while underlying EPS was up by 8.3% from 7.2p to 7.8p. Reported operating profit increased by 15.8% to £45.5m (2016: £39.3m). Reported profit before tax increased 24.0% from £26.7m to £33.1m and EPS was up by 19.0% from 5.8p to 6.9p. We continue to demonstrate strong cash flow generation with net debt reducing by £12.6m. Year-end net debt of £21.0m represented 0.3 times EBITDA for the last 12 months (2016: 0.6 times). This translates into a gearing of 9.6% (2016: 17.0%). We continue to operate well within our banking covenants. On an accounting basis, the Group-wide pre-tax pension deficits have increased by £6.9m to £265.2m. The UK Defined Benefit Scheme (‘the UK Scheme’) deficit increased by £9.7m to £247.3m due to an increase in liabilities of £28.6m offset by an increase in the fair value of plan assets of £18.9m. The rise in liabilities was primarily due to the impact of a lower discount rate (£96.7m) and higher inflation rate (£17.9m) partly offset by the application of the latest publically available mortality rate tables (£19.0m) and a refinement to the demographic assumptions on the UK Scheme (£68.4m). On a post-tax basis, the Group pension deficit at the year-end was £223.1m. The next triennial valuation, based on actuarial values at 31 March 2017, is currently underway after which the Company will be discussing with the Trustees the appropriateness of the existing recovery plan. It is expected that the funding valuation performed by the UK Scheme’s actuary will factor in the latest demographic assumptions. We will provide an update on the triennial valuation at the time of the interim results announcement in November 2017. The Board has declared a final dividend of 1.925p, up 5% on the final payment a year ago. The dividend will be paid on 1 August 2017 to shareholders on the register at the close of business on 30 June 2017. Revenue Reported revenue increased by 5.3% to £335.1m, comprised of a decrease of 4.0% at constant exchange rates more than offset by 9.3% favourable currency movements. Operating expenses Reported operating expenses increased by 3.8% to £289.6m. Underlying operating expenses, which are before amortisation of acquired intangibles and exceptional items, increased by 4.5% to £285.7m. This represented a 5.0% decrease at constant exchange rates, comprised of a 3.4% decrease in staff costs and 8.3% decrease in other expenses. Underlying operating profit Underlying operating profit, which is before amortisation of acquired intangibles and exceptional items, increased by 10.3% from £44.8m to £49.4m, or by 2.5% at constant exchange rates. Underlying operating profit margin increased from 14.1% to 14.7%. Exceptional items The cost of exceptional items was £3.7m (2016: £4.8m). These related to £4.1m (2016: £3.8m) restructuring costs including redundancy and property exit costs within Travel Management and Fraedom as part of our planned cost restructuring programme, partly offset by a pension curtailment gain of £0.4m (2016: £nil). Prior year exceptional items also included a pension rectification charge of £1.0m reflecting a £10.5m past service cost and £2.3m legal fees offset by settlement monies received. Net finance costs Net finance costs decreased by £0.3m to £13.3m, reflecting a reduction in interest on bank overdrafts and loans partly offset by an increase in the finance costs relating to retirement benefit obligations. Taxation

The tax charge of £9.5m (2016: £7.4m) for the year represents an overall effective tax rate (ETR) of 29% of the reported profit before tax (2016: 28%). The underlying ETR was 28%. We anticipate an underlying ETR of circa 28% in future years. EPS Underlying EPS rose by 8% from 7.2p to 7.8p. Basic EPS rose by 19% from 5.8p to 6.9p. Return on capital employed Return on capital employed is calculated by dividing underlying operating profit plus net share of the results of associates and joint ventures by average net assets. Average net assets are based on each of the 12 month ends for the financial year and exclude net debt, pension deficits and tax provisions. Average net assets amounted to £227.2m (2016: £213.5m) compared with £223.5m at the year-end (2016: £193.4m). The return for the year was 22.1% (2016: 21.5%). Cash flow Free cash inflow, which is the change in net debt before acquisitions and disposals, Employee Benefit Trust share purchases, dividends and the impact of foreign exchange movements on net debt balances, was £18.6m (2016: £28.9m). Cash outflow in respect of working capital was £5.4m (2016: £5.7m). The net cash outflow related to interest was £4.2m (2016: £4.9m). Dividends received from equity accounted investments were £0.7m (2016: £0.7m). Tax paid in cash was £8.9m (2016: £5.4m), partly reflecting the increase in tax payable on the pension rectification receipt. Capital expenditure, which is primarily internal software development and office equipment, was £11.0m (2016: £8.3m). Cash costs for pension deficit reduction were £7.3m (2016: £7.3m). Of the £5.3m cash outflow in respect of exceptional items, £3.2m was paid relating to current year charges and £2.1m related to prior year exceptional charges. Of the prior year £4.7m cash inflow in respect of exceptional items, £4.4m related to cash outflow from exceptional items and the balance related to cash inflow from the pension rectification. In addition to free cash flow, other cash flow items are related to proceeds received on the disposal of interests in associates in Germany of £0.5m, share purchases of £1.4m made by the Employee Benefit Trust (2016: £1.3m), £8.2m of dividends paid to shareholders during the year (2016: £7.7m) and £3.1m of favourable foreign exchange related movements (2016: £1.2m). Funding and net debt The principal banking facility is a £150m multi-currency revolving credit facility (RCF) that is committed until May 2018. The RCF is used for loans, letters of credit and guarantees, with interest based on the inter-bank lending rate for the appropriate currency plus a margin. At the year-end, £35.6m of the facility has been utilised. In addition the Group has a £20m fixed rate loan, repayable by 2018, and additional uncommitted facilities amounting to around £16m at the year-end. We have a robust medium to long-term finance structure in place with liquidity available for our growth strategy. Net external interest costs of £4.2m were covered 14.5 times by underlying EBITDA (2016: 11.3 times). Net debt decreased from 31 March 2016 by £12.6m to £21.0m and was equivalent to 0.3 times EBITDA for the last 12 months (2016: 0.6 times). We continue to operate well within our banking covenants. The principal covenants continue to be measured semi-annually, at the end of March and the end of September, against EBITDA. The covenants require that net interest is covered at least 4.0 times by EBITDA and net debt is less than 3.0 times EBITDA, both on a rolling 12-month basis. The definition of EBITDA for covenant purposes is not materially different from the definition used in these financial statements. Pensions The Group-wide pension deficits under IAS 19 have increased by £6.9m to £265.2m before tax. The UK Scheme deficit increased by £9.7m to £247.3m due to an increase in liabilities of £28.6m offset by an increase in the fair value of plan assets of £18.9m. In the second half of the year, the Company commissioned a Medically Underwritten Mortality Study (MUMS) in collaboration with the UK Scheme’s Trustees, an exercise that uses actual health data provided by a sample of the UK Scheme members to improve the quality of demographic assumptions. As a consequence, the MUMS

results contributed to a reduction in the accounting liabilities/deficit at the year-end of £68.4m. The positive financial impact of the MUMS study is included within the £28.6m increase in the UK Scheme’s liabilities. Excluding this reduction, the UK Scheme liabilities have increased by £97.0m, primarily driven by a 0.8% decrease in the discount rate and a higher inflation rate assumption partly offset by the adoption of the latest mortality rates. The Company contributed a further £3.7m to the UK Scheme in the second half of the year in line with the existing deficit recovery plan. For several years, the UK Scheme has been closed to new entrants and has capped increases in pensionable salary. The UK defined benefit section was closed to future accrual on 30 June 2013 and replaced with a defined contribution section. The overseas schemes are primarily in Germany and Switzerland, where the deficit decreased by £2.8m to £17.9m. The overseas schemes’ deficit decrease of £2.8m includes an increase of £1.7m relating to foreign exchange. Excluding foreign exchange, the overseas schemes’ deficit decreased by £4.5m, driven by a decrease in the schemes’ liabilities of £3.8m, including the effect of a £1.0m curtailment gain in Switzerland and an increase in schemes’ assets of £0.7m. The net deficit of the overseas schemes primarily relates to the German scheme £16.3m (2016: £14.8m). At the year-end, there was a deferred tax asset of £42.0m (2016: £42.8m) relating to the UK deficit and an asset of £0.1m (2016: £1.1m) relating to the overseas schemes. Related parties Related party disclosures are provided in note 27 to the financial statements. Share price The closing mid-market price at the year-end was 69.5p (2016: 62p). During the year, the price ranged from 62p to 77p per share.

Summary income statement
Years ended 31 March 2017 2016
£m £m
Revenue 335.1 318.3
EBITDA before exceptional items 60.7 55.5
Depreciation and amortisation (1)
(11.3) (10.7)
Underlying operating profit 49.4 44.8
Amortisation of acquired intangibles (0.2) (0.7)
Exceptional items (3.7) (4.8)
Operating profit 45.5 39.3
Share of associates and joint ventures 0.9 1.0
Net finance costs (13.3) (13.6)
Profit before tax 33.1 26.7
Taxation (9.5) (7.4)
Profit for the period 23.6 19.3
Summary balance sheet
As at 31 March 2017 2016
£m £m
Goodwill and other intangible assets 256.9 242.1
Property, plant, equipment and investments 12.5 12.5
Working capital (43.0) (46.8)
Current tax liabilities (net) (5.2) (6.1)
Deferred tax assets (net) 41.6 44.7
Net debt (21.0) (33.6)
Pension liabilities (pre-tax) (265.2) (258.3)
Provisions and other items (2.9) (4.4)
Net liabilities (26.3) (49.9)
Summary cash flow statement
Years ended 31 March 2017 2016
£m £m
EBITDA before exceptional items 60.7 55.5
Cash (outflow)/inflow from exceptional items (5.3) 4.7 Working capital movements (excluding exceptional items) (5.4) (5.7)
Net interest paid (4.2) (4.9)
Dividends received from equity accounted investments 0.7 0.7
Tax paid (8.9) (5.4)
Net capital expenditure (11.0) (8.3)
Pension funding in excess of EBITDA charge (7.3) (7.3)
Other movements (0.7) (0.4)
Free cash inflow 18.6 28.9
Acquisitions and disposals 0.5 -
Employee Benefit Trust share purchases (1.4) (1.3)
Dividends paid to external shareholders (8.2) (7.7)
Currency translation and other 3.1 1.2
Reduction in net debt 12.6 21.1
(1) Excluding amortisation of acquired intangibles

Hogg Robinson Group plc Consolidated Income Statement For the year ended 31 March 2017
Years ended 31 March
Notes 2017 2016
£m £m
Revenue 1 335.1 318.3
Operating expenses 2 (289.6) (279.0)
Operating profit 45.5 39.3
Analysed as:
Underlying operating profit
49.4 44.8
Amortisation of acquired intangibles 8 (0.2) (0.7)
Exceptional items 2 (3.7) (4.8)
Operating profit
45.5 39.3
Share of results of associates and joint ventures 0.9 1.0
Finance income 4 - 0.1
Finance costs 4 (13.3) (13.7)
Profit before tax
33.1 26.7
Income tax expense 5 (9.5) (7.4)
Profit for the financial year
23.6 19.3
Profit attributable to: Owners of the Company
22.3 18.7
Non-controlling interests
1.3 0.6
23.6 19.3
Years ended 31 March
2017 2016
Earnings per share
pence pence
Basic 6 6.9 5.8
Diluted 6 6.7 5.6

Hogg Robinson Group plc Consolidated Statement of Comprehensive Income For the year ended 31 March 2017
Year ended 31 March Year ended 31 March
Other Retained
Other Retained
reserves deficit 2017
reserves deficit 2016
£m £m £m
£m £m £m
Profit for the financial year - 23.6 23.6 - 19.3 19.3
Other comprehensive income/(expense)
Items that will not be subsequently reclassified to profit or loss
Remeasurements on defined benefit pension schemes - (5.0) (5.0)
- 13.1 13.1
Deferred tax movement on pension liability - 0.6 0.6
- (2.5) (2.5)
Deferred tax movement on pension liability attributable to impact of UK rate change - (2.3) (2.3)
- (4.6) (4.6)
Items that may be subsequently reclassified to profit or loss
Currency translation differences 14.3 0.5 14.8
6.0 - 6.0
Amounts charged to hedging reserve 0.2 - 0.2
0.2 - 0.2
Other comprehensive income/(expense) for the year, net of tax 14.5 (6.2) 8.3 6.2 6.0 12.2
Total comprehensive income for the year 14.5 17.4 31.9 6.2 25.3 31.5
Total comprehensive income attributable to: Owners of the Company 14.5 16.1 30.6
6.1 24.7 30.8
Non-controlling interests - 1.3 1.3 0.1 0.6 0.7
14.5 17.4 31.9 6.2 25.3 31.5

Hogg Robinson Group plc Consolidated Balance Sheet As at 31 March 2017
As at 31 March
Notes 2017 2016
£m £m
Non-current assets Goodwill and other intangible assets 8 256.9 242.1
Property, plant and equipment 9 8.4 8.8
Investments accounted for using the equity method 4.1 3.7
Trade and other receivables 0.3 -
Deferred tax assets 45.2 50.8
314.9 305.4
Current assets Trade and other receivables 106.5 93.3
Financial assets - derivative financial instruments 0.3 0.2
Current tax assets
0.7 1.7
Cash and cash equivalent assets 35.1 43.8
142.6 139.0
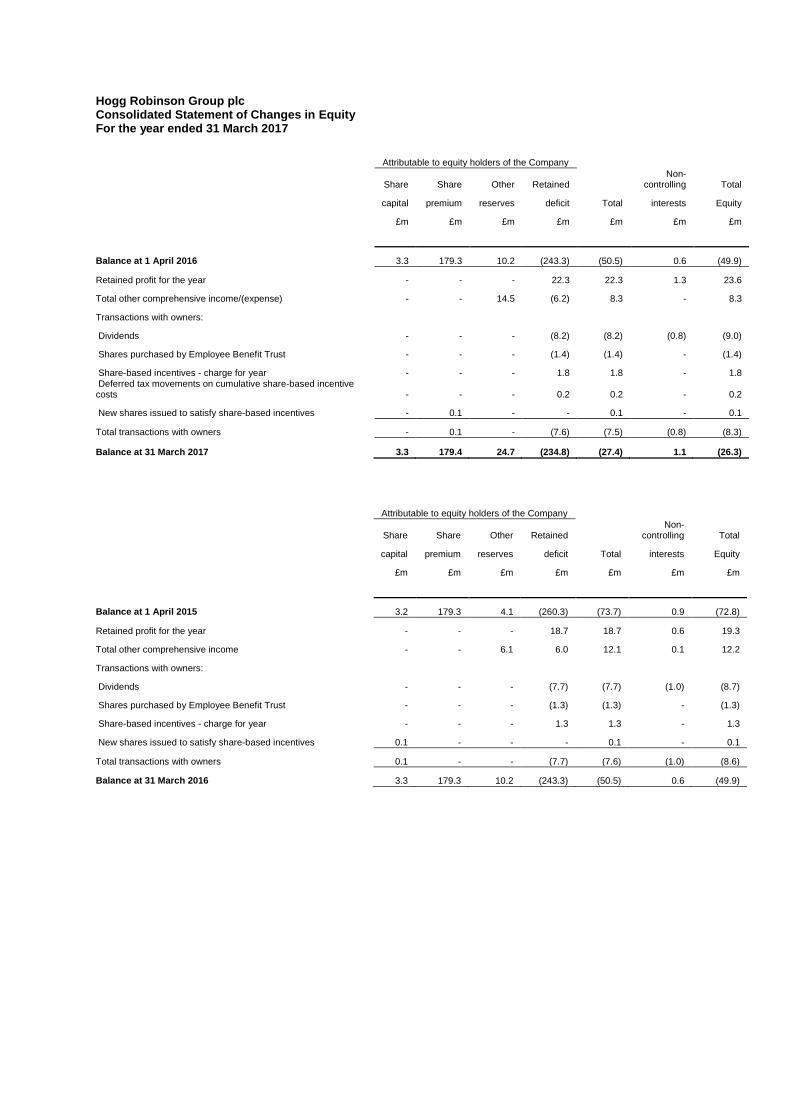
Total assets 1 457.5 444.4
Non-current liabilities Financial liabilities - borrowings (45.6) (66.4)
Deferred tax liabilities (3.6) (6.1)
Trade and other payables (1.5) (1.5)
Retirement benefit obligations 12 (265.2) (258.3)
Provisions 11 (2.1) (2.5)
(318.0) (334.8)
Current liabilities Financial liabilities - borrowings (10.1) (10.0)
Financial liabilities - derivative financial instruments (0.3) (0.8)
Current tax liabilities
(5.9) (7.8)
Trade and other payables (148.3) (138.6)
Provisions 11 (1.2) (2.3)
(165.8) (159.5)
Total liabilities
(483.8) (494.3)
Net liabilities (26.3) (49.9)
Equity
Share capital 3.3 3.3
Share premium 179.4 179.3
Other reserves 24.7 10.2
Retained deficit (234.8) (243.3)
Attributable to owners of Hogg Robinson Group plc
(27.4) (50.5)
Attributable to non-controlling interests 1.1 0.6
Total equity (26.3) (49.9)
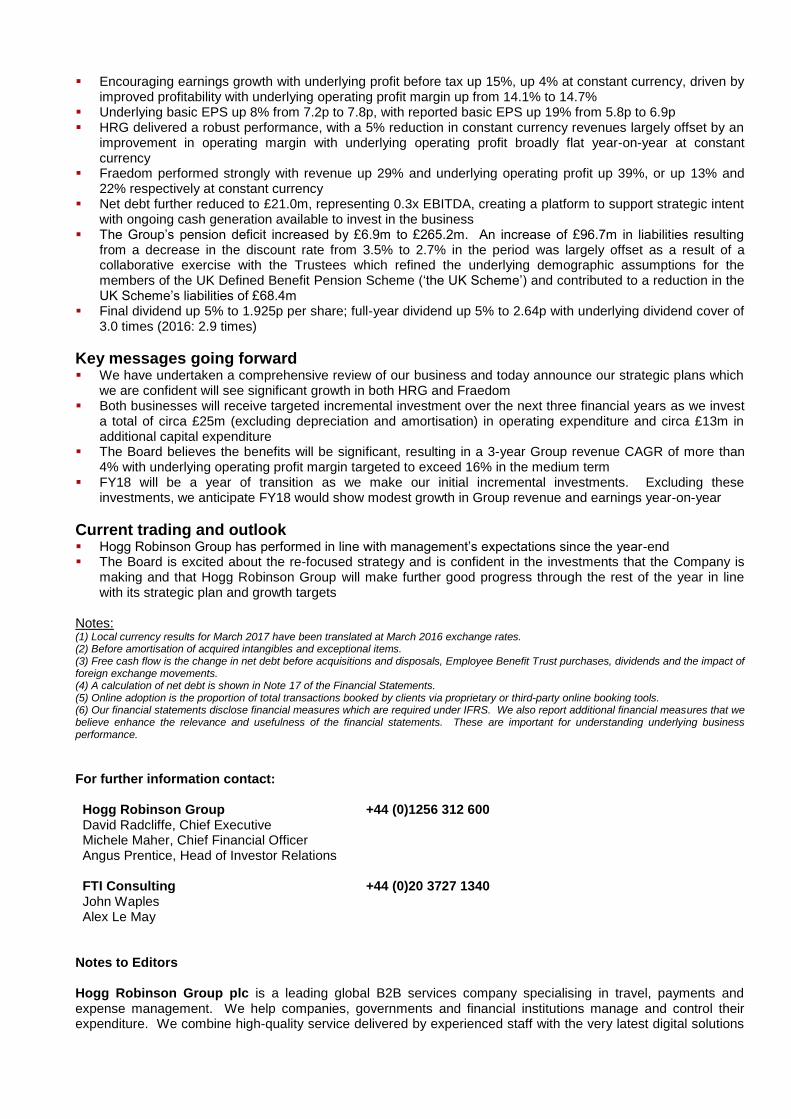
Hogg Robinson Group plc Consolidated Statement of Changes in Equity For the year ended 31 March 2017
Attributable to equity holders of the Company
Share Share Other Retained
Non-controlling Total
capital premium reserves deficit Total interests Equity
£m £m £m £m £m £m £m
Balance at 1 April 2016 3.3 179.3 10.2 (243.3) (50.5) 0.6 (49.9)
Retained profit for the year - - - 22.3 22.3 1.3 23.6
Total other comprehensive income/(expense) - - 14.5 (6.2) 8.3 - 8.3
Transactions with owners:
Dividends - - - (8.2) (8.2) (0.8) (9.0)
Shares purchased by Employee Benefit Trust - - - (1.4) (1.4) - (1.4)
Share-based incentives - charge for year - - - 1.8 1.8 - 1.8 Deferred tax movements on cumulative share-based incentive costs - - - 0.2 0.2 - 0.2
New shares issued to satisfy share-based incentives - 0.1 - - 0.1 - 0.1
Total transactions with owners - 0.1 - (7.6) (7.5) (0.8) (8.3)
Balance at 31 March 2017 3.3 179.4 24.7 (234.8) (27.4) 1.1 (26.3)
Attributable to equity holders of the Company
Share Share Other Retained
Non-controlling Total
capital premium reserves deficit Total interests Equity
£m £m £m £m £m £m £m
Balance at 1 April 2015 3.2 179.3 4.1 (260.3) (73.7) 0.9 (72.8)
Retained profit for the year - - - 18.7 18.7 0.6 19.3
Total other comprehensive income - - 6.1 6.0 12.1 0.1 12.2
Transactions with owners:
Dividends - - - (7.7) (7.7) (1.0) (8.7)
Shares purchased by Employee Benefit Trust - - - (1.3) (1.3) - (1.3)
Share-based incentives - charge for year - - - 1.3 1.3 - 1.3
New shares issued to satisfy share-based incentives 0.1 - - - 0.1 - 0.1
Total transactions with owners 0.1 - - (7.7) (7.6) (1.0) (8.6)
Balance at 31 March 2016 3.3 179.3 10.2 (243.3) (50.5) 0.6 (49.9)

Hogg Robinson Group plc Consolidated Cash Flow Statement For the year ended 31 March 2017
Years ended 31 March
Notes 2017 2016
£m £m
Cash flows from operating activities Cash generated from operations 14 42.9 48.1
Interest paid
(4.2) (5.0)
Tax paid
(8.9) (5.4)
Cash flows generated from operating activities - net
29.8 37.7
Cash flows from investing activities Purchase of property, plant and equipment
(3.3) (2.1)
Purchase and internal development of intangible assets 8 (7.7) (6.3)
Proceeds from sale of property, plant and equipment
- 0.1
Interest received
- 0.1
Dividends received from associates and joint ventures 0.7 0.7
Disposals of associates, joint ventures and other investments 0.5 -
Cash flows used in investing activities - net
(9.8) (7.5)
Cash flows from financing activities Repayment of borrowings
(22.0) (25.0)
New borrowings
- 9.0
Cash effect of currency swaps
0.6 (0.5)
Proceeds from issue of share capital
0.1 -
Purchase of own shares by the Employee Benefit Trust
(1.4) (1.3)
Dividends paid to external shareholders (8.2) (7.7)
Dividends paid to non-controlling interests (0.8) (1.0)
Cash flows used in financing activities - net
(31.7) (26.5)
Net (decrease)/increase in cash and cash equivalents
(11.7) 3.7
Cash and cash equivalents at beginning of the year
43.7 38.4
Exchange rate effects
3.0 1.6
Cash and cash equivalents at end of the year
35.0 43.7
Cash and cash equivalent assets 35.1 43.8
Overdrafts (0.1) (0.1)
Cash and cash equivalents at end of the year
35.0 43.7

Additional Financial Information General information and basis of preparation
The financial information which comprises the Consolidated Income Statement, the Consolidated Statement of Comprehensive Income, the Consolidated Balance Sheet, the Consolidated Statement of Changes in Equity and the Consolidated Cash Flow Statement and related notes does not constitute the Company’s Consolidated Financial Statements for the years ended 31 March 2017 and 2016, but is derived from those financial statements. The auditors have reported on the Group’s Consolidated Financial Statements for each of the years ended 31 March 2017 and 31 March 2016. Their reports were unqualified, did not draw attention to any matters by way of emphasis and did not contain statements under s498(2) or (3) of Companies Act 2006 or equivalent preceding legislation. The Consolidated Financial Statements for the year ended 31 March 2016 have been delivered to the Registrar of Companies and the Consolidated Financial Statements for the year ended 31 March 2017 will be filed with the registrar in due course. The Consolidated Financial Statements have been prepared in compliance with International Financial Reporting Standards (IFRS) as endorsed and adopted for use by the European Union, IFRS Interpretations Committee (IFRS IC) interpretations and with those parts of the Companies Act 2006 applicable to companies reporting under IFRS. The Consolidated Financial Statements have been prepared under the historical cost convention, as modified by the use of valuations for certain financial instruments, share-based payment incentives and retirement benefits. Critical accounting policies and forward-looking statements
The preparation of the IFRS financial statements requires the use of estimates and assumptions that affect the reported amounts of assets and liabilities at the date of the Consolidated Financial Statements and the reported amounts of revenues and expenses during the year. The Operational Review should be read in conjunction with the audited Consolidated Financial Statements. The discussions contain forward-looking statements that appear in a number of places and include statements regarding the Group’s intentions, beliefs or current expectations concerning, among other things, results of operations, revenue, financial condition, liquidity, growth, strategies, new products and the markets in which the Group operates. Readers are cautioned that any such forward-looking statements are not guarantees of future performance and involve risks and uncertainties. Non-GAAP measures
Underlying operating profit is calculated as operating profit before amortisation of acquired intangibles and exceptional items. Earnings Before Interest, Taxation, Depreciation and Amortisation (EBITDA) is calculated as operating profit before exceptional items before net finance costs, income taxes, depreciation, amortisation and impairment. The Directors believe that the presentation of underlying operating profit and EBITDA enhances an investor’s understanding of the Group’s financial performance. However, underlying operating profit and EBITDA should not be considered in isolation or viewed as substitutes for retained profit, cash flow from operations or other measures of performance as defined by IFRS. Underlying operating profit and EBITDA as used in this announcement is not necessarily comparable to other similarly titled captions of other companies due to potential inconsistencies in the method of calculation and are unaudited line items but are derived from audited financial information. The Directors use underlying operating profit and EBITDA to assess the Group’s operating performance and to make decisions about allocating resources among various reporting segments. 1 Segment information
The Chief Operating Decision Maker has been identified as the Executive Management Team, which reviews the Group’s internal reporting in order to assess performance and allocate resources. The Executive Management Team has determined the operating segments based on these reports. The Executive Management Team considers the business from the perspective of two core activities, Travel Management (HRG), which is analysed into three distinct geographic segments and includes Fraedom Travel, and FinTech (Fraedom) which includes the Fraedom Payments and Expense operations. The Group’s internal reporting processes do not distinguish between the numerous sources of income that comprise revenue for Travel Management. The performance of the operating segments is assessed based on a measure of operating profit excluding items of an exceptional nature. Interest income and expenditure and income tax expense are not included in the result for each operating segment that is reviewed by the Executive Management Team. Except as noted below, other information provided to the Executive Management Team is measured in a manner consistent with that in the financial statements.

Total segment assets exclude cash and cash equivalent assets, current tax assets, financial assets and deferred tax assets which are managed on a central basis. These are included as part of the reconciliation to total Consolidated Balance Sheet assets.
HRG
Fraedom
North Asia
Europe America Pacific Total
Total
£m £m £m £m
£m
£m
Year ended 31 March 2017 Revenue from external customers 204.9 80.0 17.1 302.0
33.1
335.1
Underlying operating profit 28.5 12.5 0.2 41.2 8.2 49.4
Amortisation of acquired intangibles - (0.2) - (0.2) - (0.2)
Operating profit before exceptional items 28.5 12.3 0.2 41.0
8.2
49.2
Exceptional items (2.6) (0.2) (0.8) (3.6)
(0.1)
(3.7)
Operating profit / (loss) 25.9 12.1 (0.6) 37.4 8.1 45.5
Underlying operating margin 13.9% 15.6% 1.2% 13.6% 24.8% 14.7%
Year ended 31 March 2016 Revenue from external customers 201.9 74.0 16.8 292.7
25.6
318.3
Underlying operating profit / (loss) 30.3 10.9 (2.3) 38.9 5.9 44.8
Amortisation of acquired intangibles (0.1) (0.3) - (0.4) (0.3) (0.7)
Operating profit / (loss) before exceptional items 30.2 10.6 (2.3) 38.5
5.6
44.1
Exceptional items (3.9) (0.3) (0.4) (4.6)
(0.2)
(4.8)
Operating profit / (loss) 26.3 10.3 (2.7) 33.9 5.4 39.3
Underlying operating margin 15.0% 14.7% -13.7% 13.3% 23.0% 14.1%
There is no material inter-segment revenue. External revenue from clients by origin (where the Group’s operations are located) is not materially different from external revenue from clients by geographical area (where the client is located) disclosed above. A reconciliation of operating profit to total profit before income tax expense is provided in the Consolidated Income Statement.
HRG
Fraedom
North Asia
Europe America Pacific Total
Total
£m £m £m £m £m £m
Total segment assets 31 March 2017 261.3 86.5 11.6 359.4
16.8
376.2
31 March 2016 244.8 81.1 9.7 335.6
12.3
347.9
Reported segments’ assets are reconciled to total assets as follows:
Years ended 31 March
2017
2016
£m
£m
Total segment assets
376.2
347.9
Cash and cash equivalent assets
35.1
43.8
Current tax assets
0.7
1.7
Financial assets - derivative financial instruments 0.3
0.2
Deferred tax assets
45.2
50.8
457.5 444.4
Capital expenditure by geographical location:
HRG
Fraedom
North Asia
Europe America Pacific Total
Total
£m £m £m £m £m £m
Capital expenditure 31 March 2017 5.3 0.5 0.3 6.1
5.0
11.1
31 March 2016 4.9 0.2 0.2 5.3
3.7
9.0

2 Operating expenses
Years ended 31 March
2017 2016
£m £m
Underlying operating expenses Staff costs (note 3) 196.1 184.5
Amortisation of intangible assets other than acquired intangible assets 7.0 6.8
Depreciation of property, plant and equipment 4.3 3.9
Auditors' remuneration for audit services 1.1 1.0
Operating lease rentals - buildings 11.4 10.8
Operating lease rentals - other assets 0.5 0.5
Currency translation differences 0.1 0.3
Other expenses 65.2 65.7
285.7 273.5
Amortisation of acquired intangibles: Amortisation of client relationships 0.2 0.4
Amortisation of other acquired intangible assets - 0.3
0.2 0.7
Exceptional items: Restructuring costs: - Staff costs (note 3) 2.7 3.7
- Other expenses 1.0 0.1
3.7 3.8
Pension rectification: - Past service cost (note 12) - 10.5
- Legal fees - 2.3
- Settlement - (11.8)
- 1.0
3.7 4.8
Total operating expenses 289.6 279.0
Included within underlying operating expenses above is £2.4m relating to research (2016: £1.5m). EXCEPTIONAL ITEMS
Total exceptional costs of £3.7m have been incurred in the year. These costs relate to planned cost reduction programmes in HRG and Fraedom and are in respect of redundancy costs and onerous lease provisions totalling £4.1m, partly offset by a £0.4m pension curtailment gain that arose as a result of the cost restructuring programme in Switzerland (note 12). Total exceptional costs of £4.8m were incurred in respect of the year ended 31 March 2016, representing £3.8m of restructuring costs and £1.0m relating to pension rectification. During the year ended 31 March 2016, the High Court granted rectification of a deed of amendment dated 8 September 1999 in respect of the UK pension scheme due to a mistake that had been made in the original drafting of that deed of amendment. As a result of the High Court confirming the correct rate of increase for any period of deferment for pensionable service between 8 September 1999 and 28 September 2006, a past service cost of £10.5m (note 12) together with associated legal costs of £2.3m was incurred. This amount was materially offset by the settlement of a claim in respect of this mistake.

SERVICES PROVIDED BY THE COMPANY’S AUDITORS
The cost of services provided by the Company’s auditors, PricewaterhouseCoopers LLP (PwC), and its associates is set out below:
Years ended 31 March
2017 2016
£m £m
Charged to operating expenses: Fees paid to the Company's auditor for the audit of the Parent Company and
Consolidated Financial Statements 0.3 0.3
Fees payable to the Company's auditor and its associates for other services: Audit of the Company's subsidiaries pursuant to legislation 0.8 0.7
Auditors' remuneration for audit services 1.1 1.0
Audit related assurance service 0.1 0.1
Tax compliance services 0.2 0.1
1.4 1.2
In addition to the above services, the Company's auditors acted as auditors to the Hogg Robinson (1987) Pension Scheme (‘The UK Scheme’). The appointment of auditors to the UK Scheme and the fees paid in respect of that audit are agreed by the Trustees of the scheme, who act independently from the management of the Group. The aggregate fees paid to the Group's auditors for audit services to the UK Scheme during the year were less than £0.1m (2016: less than £0.1m). 3 Staff costs
Years ended 31 March
2017 2017 2017 2016
Before
exceptional Exceptional
items items
£m £m £m £m
Wages and salaries 167.5 - 167.5 157.0
Social security costs 18.0 - 18.0 17.3
Other pension costs 8.6 (0.4) 8.2 19.2
Redundancy and termination costs 0.2 3.1 3.3 3.9
Share-based incentives 1.8 - 1.8 1.3
196.1 2.7 198.8 198.7
Other pension costs comprise: Defined benefit schemes (note 12): - Current service charge and administration expenses 2.2 - 2.2 2.1
- Curtailment gain (0.6) (0.4) (1.0) -
- Past service cost - - - 10.5
Defined contribution schemes 7.0 - 7.0 6.6
8.6 (0.4) 8.2 19.2

Years ended 31 March
2017 2016
Average monthly number of staff employed by the Group including Key Management number number
HRG
4,360 4,704
Fraedom
262 235
4,622 4,939
4 Finance income and finance costs
Years ended 31 March
2017 2016
£m £m
Finance income - bank interest - 0.1
Interest on bank overdrafts and loans (3.5) (4.3)
Amortisation of issue costs on bank loans (0.6) (0.6)
Net interest expense on retirement obligations (8.5) (8.1)
Other finance charges (0.7) (0.7)
Finance costs (13.3) (13.7)
Net finance costs (13.3) (13.6)
5 Income tax expense
Years ended 31 March
2017 2016
£m £m
Current tax: Tax on profits of the financial year 7.4 7.0
Adjustments in respect of previous years 0.3 (2.3)
Total current tax 7.7 4.7
Deferred tax: Origination and reversal of temporary differences 2.5 0.3
Adjustments in respect of previous years (0.9) 2.2
Impact of UK rate change 0.2 0.2
Total deferred tax 1.8 2.7
Taxation charge 9.5 7.4
The tax charge is split as follows:
Years ended 31 March
2017 2016
£m £m
United Kingdom 1.6 1.5
Overseas 7.9 5.9
Taxation charge 9.5 7.4

Years ended 31 March
2017 2016
£m £m
On underlying business 10.4 8.4
Tax on amortisation of acquired intangibles (0.1) (0.2)
Exceptional items (0.8) (0.8)
Taxation charge 9.5 7.4
The tax assessed for the year differs from the standard rate of corporation tax in the UK of 20% (2016: 20%) as explained below:
Years ended 31 March
2017 2016
£m £m
Profit before tax: Continuing operations 33.1 26.7
Profit before tax multiplied by the standard rate of corporation tax in the UK of 20% (2016: 20%) 6.6 5.3
Effects of: Impact of UK rate change on net deferred tax assets 0.2 0.2
Utilisation of unrecognised losses (0.4) (1.0)
Non recognition of deferred tax assets - losses 0.5 0.3
Expenses not deductible for tax purposes 0.3 0.5
Overseas tax rate differential 2.9 1.8
Adjustments in respect of previous years (0.6) (0.1)
Other - 0.4
Taxation charge 9.5 7.4
The Group makes maximum use of all brought forward losses and other available reliefs in mitigating current tax payable. 6 Earnings per share
Earnings per share attributable to equity holders of the Company were as follows:
Years ended 31 March
2017 2016
pence pence
Earnings per share Basic 6.9 5.8
Diluted 6.7 5.6
Years ended 31 March
2017 2016
£m £m
Earnings for the purposes of earnings per share: Profit for the financial year 23.6 19.3
Less: amount attributable to non-controlling interests (1.3) (0.6)
Total 22.3 18.7

Basic earnings per share (EPS) is calculated by dividing the earnings attributable to equity holders of the Company by the weighted average number of Ordinary shares outstanding during the year, excluding those purchased by the Company's Employee Benefit Trust. For diluted earnings per share, the weighted average number of Ordinary shares in issue is adjusted to assume conversion of all dilutive potential Ordinary shares. The following amounts have been used in the calculation of earnings per share:
Years ended 31 March
2017 2016
number number
m m
Weighted average number of Ordinary shares in issue Issued (for basic EPS) 323.7 324.2
Effect of dilutive potential Ordinary shares - share-based incentives 7.9 7.7
For diluted EPS 331.6 331.9
Underlying earnings per share
Underlying earnings per share attributable to equity holders of the Company were as follows:
Years ended 31 March
2017 2016
pence pence
Underlying earnings per share Basic 7.8 7.2
Diluted 7.6 7.0 Underlying earnings per share is calculated on the profit attributable to equity holders of the Company before amortisation of acquired intangibles and exceptional items after charging taxation associated with those profits.
Years ended 31 March
2017 2016
£m £m
Earnings for the purposes of underlying earnings per share: Profit before tax from continuing operations 33.1 26.7
Add: amortisation of acquired intangibles 0.2 0.7
Add: exceptional items 3.7 4.8
Underlying profit before tax 37.0 32.2
Underlying income tax expense (10.4) (8.4)
Underlying profit for the financial year 26.6 23.8
Less: amounts attributable to non-controlling interests (1.3) (0.6)
Total 25.3 23.2
Underlying earnings are earnings before amortisation of acquired intangibles, exceptional items and related income tax expense.

7 Dividends per share
The dividends to the Company's shareholders in the year ended 31 March 2017 were:
Years ended 31 March
2017 2016
£m £m
Final dividend in respect of year ended 31 March 2016
1.83p per share (31 March 2015: 1.69p per share)
5.9
5.5
Interim dividend in respect of year ended 31 March 2017
0.715p per share (31 March 2016: 0.68p per share)
2.3
2.2
Total dividends to the Company's shareholders
8.2
7.7
A final dividend in respect of the year ended 31 March 2017 of 1.925p per Ordinary share, amounting to a final dividend of £6,216,454 is to be proposed at the Annual General Meeting on 27 July 2017. The Employee Benefit Trust has waived its rights to dividends. 8 Goodwill and other intangible assets
Years ended 31 March
2017 2016
£m £m
Goodwill
235.9 223.0
Other intangible assets
21.0 19.1
256.9 242.1

Computer software
Externally Internally Client
Goodwill acquired generated relationships Total
£m £m £m £m £m
Cost At 1 April 2015 242.9 18.6 47.5 36.1 345.1
Additions - 0.5 5.8 - 6.3
Disposals - (0.3) - - (0.3)
Exchange differences 6.5 0.4 0.2 2.1 9.2
At 31 March 2016 249.4 19.2 53.5 38.2 360.3
Additions - 0.8 6.9 - 7.7
Disposals - (0.3) (3.2) - (3.5)
Exchange differences 12.9 1.6 2.9 3.9 21.3
At 31 March 2017 262.3 21.3 60.1 42.1 385.8
Accumulated amortisation and impairment losses At 1 April 2015 26.4 16.7 29.7 35.5 108.3
Amortisation charge for the year - 1.1 6.0 0.4 7.5
Disposals - (0.3) - - (0.3)
Exchange differences - 0.4 0.2 2.1 2.7
At 31 March 2016 26.4 17.9 35.9 38.0 118.2
Amortisation charge for the year - 0.7 6.3 0.2 7.2 Disposals - (0.3) (3.2) - (3.5)
Exchange differences - 1.4 1.7 3.9 7.0
At 31 March 2017 26.4 19.7 40.7 42.1 128.9
Carrying amount At 1 April 2015 216.5 1.9 17.8 0.6 236.8
At 31 March 2016 223.0 1.3 17.6 0.2 242.1
At 31 March 2017 235.9 1.6 19.4 - 256.9
The amortisation charge for the year of £7.2m (2016: £7.5m) is comprised of £0.2m (2016: £0.7m) in respect of intangible assets acquired via business combinations, £7.0m (2016: £6.8m) which relates to amortisation of software purchased and internally generated by existing businesses. There are £0.9m of assets in the course of construction included within internally generated assets at 31 March 2017 (2016: £nil). Impairment of goodwill
The recoverable amount used in the assessment of goodwill for all cash generating units comprises the higher of value in use and fair value less costs to sell. During the year the Group reviewed its discount rate and long term growth rates and these have been applied in the assessment. The value in use has been calculated by discounting at 14% per annum (2016: 11% per annum) the anticipated pre-tax cash flows. The forecasts are prepared from management information taking into account historical trading performance and anticipated changes in future market conditions. The detailed forecasts cover a period of three years from the balance sheet date; cash flows are projected beyond that period based on market consensus for GDP growth of 2% for HRG (2016: 2%) and 5% for Fraedom (2016: 5%). Goodwill consists of the following amounts related to cash generating units of the Group:

Years ended 31 March
2017 2016
£m £m
HRG Europe 174.3 167.9
North America 54.1 47.7
Asia Pacific 2.0 1.9
230.4 217.5
Fraedom 5.5 5.5
235.9 223.0
The key assumptions used in the impairment testing were as follows:
Discount rates
Rates of growth in cash generating units beyond 3 years
Cash flow forecasts for years 1 to 3 Discount rate
The discount rate reflects management’s estimate of the pre-tax cost of capital employed for the Group’s cash generating units listed above. The same rate is applied to all cash generating units, and reflects the Group’s funding arrangements where all units have equal access to the Group’s treasury functions and borrowing lines to fund their operations. None of the Group’s cash generating units demonstrate levels of risks that are significantly different from those experienced by the Group generally, and all have similar funding profiles and therefore the discount rate applied is deemed to be justified. Rates of growth in cash generating units beyond 3 years and cash flow
Management have reviewed corporate travel industry and payment industry forecasts and consider that the market consensus for GDP growth of 2% for Travel Management and 5% for FinTech is reasonable for the purposes of the assessment of goodwill. Goodwill impairment
Management believes that no reasonable change in the key assumptions would cause any of the identified cash generating units to become impaired.

9 Property, plant and equipment
Property
Plant and equipment Total
£m £m £m
Cost At 1 April 2015 9.1 41.6 50.7
Additions for the year 0.3 2.4 2.7
Disposals for the year (0.4) (1.6) (2.0)
Exchange differences 0.1 1.6 1.7
At 31 March 2016 9.1 44.0 53.1
Additions for the year 0.3 3.1 3.4
Disposals for the year (0.6) (3.5) (4.1)
Exchange differences 0.7 4.8 5.5
At 31 March 2017 9.5 48.4 57.9
Accumulated depreciation At 1 April 2015 7.5 33.4 40.9
Depreciation charge for the year 0.4 3.5 3.9
Disposals for the year (0.4) (1.6) (2.0)
Exchange differences 0.1 1.4 1.5
At 31 March 2016 7.6 36.7 44.3
Depreciation charge for the year 0.5 3.8 4.3
Disposals for the year (0.6) (3.4) (4.0)
Exchange differences 0.6 4.3 4.9
At 31 March 2017 8.1 41.4 49.5
Carrying amount At 1 April 2015 1.6 8.2 9.8
At 31 March 2016 1.5 7.3 8.8
At 31 March 2017 1.4 7.0 8.4
Property is comprised of leasehold properties and leasehold improvements. Plant and equipment is comprised of IT and office equipment.
Years ended 31 March
2017 2016
£m £m
Carrying amount of property, plant and equipment held under finance leases 0.4 0.9

10 Net debt
Years ended 31 March
2017 2016
£m £m
Total financial liabilities - borrowings 55.7 76.4
Add back: Unamortised loan issue costs 0.4 1.0
Cash and cash equivalent assets (35.1) (43.8)
Net debt 21.0 33.6
Analysis by currency after currency swaps
Years ended 31 March
2017 2016
£m £m
Sterling 38.1 53.9
Euro (8.0) (6.4)
Swiss Franc (1.7) (2.5)
Other European currencies (4.0) (6.2)
Canadian Dollar 0.6 3.1
US Dollar 0.2 (5.6)
Other currencies (4.2) (2.7)
21.0 33.6
11 Provisions
Restructuring Other Total
£m £m £m
At 1 April 2015 2.7 2.7 5.4
Additional provisions made in the year charged in the Consolidated Income Statement 4.1 0.1 4.2
Additional provisions made in the year in respect of property dilapidations included in property, plant and equipment - 0.2 0.2
Amounts used during the year (4.6) (0.2) (4.8)
Unused provisions reversed (0.1) (0.3) (0.4)
Exchange differences 0.2 - 0.2
At 31 March 2016 2.3 2.5 4.8
Additional provisions made in the year charged in the Consolidated Income Statement 4.3 0.2 4.5
Amounts used during the year (5.5) (0.2) (5.7)
Unused provisions reversed - (0.5) (0.5)
Exchange differences 0.1 0.1 0.2
At 31 March 2017 1.2 2.1 3.3
Restructuring provisions represent redundancy and office closure costs in a number of Group companies and are disclosed as current liabilities because they are likely to give rise to payment within one year of the balance sheet date. At 31 March 2017, £1.1m (2016: £2.2m) was held against restructuring provisions in respect of exceptional items. Other includes provisions for onerous contracts, property dilapidations and litigation, which are likely to give rise to payment after more than one year of the balance sheet date, ranging from 2 to 8 years.

Provision has been made for the present value of property lease commitments in respect of properties surplus to operational requirements. Allowance has been made for anticipated sublet rental income, and costs to restore premises to their original condition upon vacating them where such an obligation exists under the lease.
12 Retirement benefit obligations
Defined benefit pension arrangements
The Group’s principal defined benefit pension arrangement is the Hogg Robinson (1987) Pension Scheme (the UK Scheme). The UK Scheme is registered and subject to the statutory scheme-specific funding requirements outlined in UK legislation, including the payment of levies to the Pension Protection Fund as set out in the Pension Act 2004. The UK Scheme is established under trust and the responsibility for its governance lies jointly with the Trustees (Hogg Robinson (1987) Pension Scheme Trustee Limited) and the Group. The UK Scheme was closed to new members in March 2003, with benefits based on final pensionable salary. The increase in final pensionable salary since 31 March 2003 is predominantly limited to the lower of the increase in inflation and 5% per annum. The latest actuarial valuation of the UK Scheme was carried out as at 31 March 2014 by an independent qualified actuary. Following a consultation process with active members, the UK defined benefit section was closed to future accrual on 30 June 2013 and replaced with a defined contribution section. The Group also operates defined benefit schemes in Switzerland, Germany, Italy and France. The defined benefit scheme in Norway was closed in the year to 31 March 2016. The following amounts have been included in the Consolidated Income Statement in respect of all defined benefit pension arrangements:
Years ended 31 March
2017 2016
£m £m
Current service charge 2.2 2.1
Curtailment gain (0.6) -
Charge to underlying operating profit 1.6 2.1
Charge to exceptional items - pension rectification (note 2) - 10.5
Charge to exceptional items - curtailment gain (note 2) (0.4) -
Charge to operating profit 1.2 12.6
Interest cost on pension scheme liabilities 17.6 17.1
Interest return on pension scheme assets (9.1) (9.0)
Charge to finance costs 8.5 8.1
Total charge to Consolidated Income Statement 9.7 20.7
In respect of the year ended 31 March 2016 a past service cost of £10.5m arose in the UK as a result of the correction of a mistake in the drafting of a deed of amendment. Further detail is provided in note 2. A curtailment gain of £1.0m arose in the year ended 31 March 2017 in respect of leavers of the Switzerland scheme. £0.4m is included within exceptional items and £0.6m is included in underlying operating profit. The following amounts have been recognised as movements in equity:

Years ended 31 March
2017 2016
£m £m
Actual return/(loss) on scheme assets 29.8 (3.4)
Less: amounts included in interest income (9.1) (9.0)
20.7 (12.4)
Experience gains and losses arising on scheme liabilities 0.3 1.5
Changes in assumptions underlying the present value of scheme liabilities: - Demographic 86.8 2.8
- Financial (112.8) 21.2
(5.0) 13.1
Exchange rate movement (1.7) (1.6)
Movement in the year (6.7) 11.5
Cumulative amount recognised in the Consolidated Statement of Comprehensive Income since the transition date to IFRS, 1 April 2003 (208.1) (201.4)
The key assumptions used for the UK Scheme were:
Years ended 31 March
2017 2016 2015
Rate of increase in final pensionable salary 2.90% 2.60% 2.60% Rate of increase in pensions in payment - accrued before 1999 5.00% 5.00% 5.00% Rate of increase in pensions in payment - accrued after 1999 3.40% 3.10% 3.10%
Discount rate 2.70% 3.50% 3.30%
Inflation - RPI 3.40% 3.10% 3.10%
Inflation - CPI 2.60% 2.40% 2.40% The assumptions for the schemes in Switzerland, Germany, Italy and France do not produce materially different results from the assumptions used for the UK Scheme. The net present value of the defined benefit obligations of the UK Scheme is sensitive to both the actuarial assumptions used and to market conditions. If the discount rate assumption was 0.1% lower, the obligations would be expected to increase by £11.2m and if it was 0.1% higher, they would be expected to decrease by £10.9m. If the inflation assumption was 0.1% lower, the obligations would be expected to decrease by £5.0m and if it was 0.1% higher, they would be expected to increase by £3.1m. The inflation assumption sensitivity factors in the impact of inflation on the rate of increase in final pensionable salary and rate of increase in pensions in payment accrued after 1999 assumptions. During the year the Group commissioned a review, in collaboration with the UK Scheme’s Trustees, of the statistical mortality assumptions underpinning the UK Scheme’s liabilities. This review called a Medically Underwritten Mortality Study (MUMS) seeks to better understand the specific health profile of the UK Scheme’s membership. A sample of members aged 55 to 80 was selected, representing 13% of the UK Scheme’s total membership by headcount and 39% by liability value. These members were asked to complete and return a health questionnaire and follow-up interviews were conducted where clarification was needed. Approximately two thirds of targeted members responded, representing 24% of the UK Scheme’s total liabilities. The responses were analysed by mortality underwriting specialists who translated them into mortality assumptions. The results from the sample were then extrapolated using a postcode differential to calculate the UK Scheme’s IAS19 liabilities. The methodology used was compliant with the relevant technical Actuarial Standards in force published by the Financial Reporting Council.

The mortality assumptions for the UK Scheme are based on SAPS / CM1(2016) tables (2016: SAPS / CM1(2013) tables) with ‘medium cohort’ projections and a 1.25% underpin in the rate of future improvements in mortality. Life expectancy at the age of 65 is assumed to be:
Years ended 31 March
2017 2016
Current pensioners Male 21.4 24.0
Female 23.6 26.4
Future retirements Male 22.8 25.9
Female 25.1 28.4 The UK liability is based on the assumption that active and deferred members will take 25% of the value of their pension as a lump sum on retirement. The net present value of the defined benefit obligations of the UK Scheme are sensitive to the life expectancy assumption. If there was an increase of one year to this assumption the obligations would be expected to increase by £25.9m. The provision included in the Consolidated Balance Sheet arising from obligations in respect of all the Group’s defined benefit schemes is as follows:
Years ended 31 March
2017 2016
£m £m
Present value of defined benefit obligations Unfunded scheme 17.5 15.8
Wholly or partly funded schemes 567.7 539.1
585.2 554.9
Fair value of scheme assets (320.0) (296.6)
265.2 258.3
The net present value of defined benefit obligations has moved as follows:
2017 2016
£m £m
At beginning of year 554.9 563.8
Current service cost 2.2 2.1
Curtailment gain (1.0) -
Past service cost - pension rectification - 10.5
Interest cost 17.6 17.1
Contributions by plan participants 0.6 0.6
Actuarial losses 25.7 (25.5)
Foreign currency exchange changes 5.5 3.0
Benefits paid (20.3) (16.7)
At end of year 585.2 554.9
The fair value of scheme assets has moved as follows:

Years ended 31 March
2017 2016
£m £m
At beginning of year 296.6 305.2
Interest income 9.1 9.0
Actual return on assets excluding amounts included in interest income 20.7 (12.4)
Foreign currency exchange changes 3.8 1.5
Contributions by the employer 9.5 9.4
Contributions by plan participants 0.6 0.6
Benefits paid (20.3) (16.7)
At end of year 320.0 296.6
The assets held in defined benefit schemes were as follows:
Years ended 31 March
2017 2016
£m £m
Equity instruments
UK Scheme
Developed World Hedge Fund 28.2 24.3
Global Absolute Return Fund 44.9 41.2
Private Equity 10.5 9.6
Broad Opportunities Fund 25.4 24.9
109.0 100.0
Overseas Schemes 16.1 13.6
125.1 113.6
Debt instruments
UK Scheme UK Equity Linked Gilts 17.7 14.6
Overseas Equity Linked Gilts 33.6 29.1
Credit Fund 30.4 29.5
Fixed Income Global Opportunities 21.6 20.6
103.3 93.8
Overseas Schemes 18.5 15.8
121.8 109.6
Property
UK Scheme Long Lease Property Fund 30.2 28.1
Partners Fund 27.2 25.2
Real Estate Fund 4.4 9.1
61.8 62.4
Overseas Schemes 6.6 7.0
68.4 69.4
Cash and cash equivalents
UK Scheme 4.6 3.6
Overseas Schemes 0.1 0.4
4.7 4.0
320.0 296.6

None of the plan assets are represented by financial instruments of the Group. None of the plan assets are occupied or used by the Group. The majority, £278.3m (2016: £253.2m) of the schemes’ assets are held in active markets with quoted market prices, the remaining £41.7m (2016: £43.4m) is invested in small company shares held in private equity funds and illiquid funds. For several years, the UK Scheme has been closed to new entrants, has capped increases in pensionable salary and was closed to future accrual from 30 June 2013 following a consultation process with active members. Following the most recent triennial valuation, effective April 2014, the Trustees agreed deficit reduction payments totalling £8.3m for the year ending 31 March 2018, this represents a future economic benefit. The weighted average duration of the defined benefit obligation is 22 years. Through its defined benefit schemes the Group is exposed to a number of risks, the most significant of which are detailed below: Asset volatility – the scheme liabilities are calculated using a discount rate set with reference to corporate bond yields, if plan assets underperform this yield this will create a deficit. In mitigation, the schemes hold a significant proportion of equities, which are expected to outperform corporate bonds in the long-term but which may result in volatility and risk in the short-term. To avoid undue concentration of asset volatility risk in any one asset class, certain assets are held in a matching portfolio, consisting of corporate bonds and index-linked gilts, designed to mirror movements in corresponding liabilities. The Group believes that due to the long-term nature of plan liabilities and the strength of supporting Group, a level of continuing equity investment is an appropriate element of the Group’s long-term strategy to managed the plans efficiently. Interest rate risk – liabilities are sensitive to movements in interest rates, a decrease in corporate bond yields will increase plan liabilities, although this will be partly offset by an increase in the plans’ bond holdings. Inflation risk - liabilities are sensitive to movements in inflation, with higher inflation leading to an increase in the valuation of liabilities (within the limits set by the scheme). Life expectancy – liabilities are sensitive to life expectancy, with increases in life expectancy leading to an increase in the valuation of liabilities. The obligations and assets are split as follows:
Years ended 31 March
2017 2017 2017 2016 2016 2016
UK Overseas Total UK Overseas Total
£m £m £m £m £m £m
Defined benefit obligations (526.0) (59.2) (585.2) (497.4) (57.5) (554.9)
Fair value of plan assets 278.7 41.3 320.0 259.8 36.8 296.6
Deficit (247.3) (17.9) (265.2) (237.6) (20.7) (258.3)
The UK Scheme deficit increased by £9.7m to £247.3m driven by an increase in the UK Scheme liabilities of £28.6m partly offset by a £18.9m increase in the fair value of plan assets. During the year a MUMS was carried out looking into the health of the UK Scheme’s members in order to refine the mortality assumptions. The £28.6m increase in the UK Scheme liabilities is net of the positive financial impact of the MUMS on the year end pension valuation amounting to £68.4m. Excluding this reduction, the UK Scheme liabilities have increased by £97.0m primarily driven by a 0.8% decrease in discount rate, £96.7m, higher inflation rate assumption, £17.9m, partly offset by the application of the latest mortality rates, £19.0m. The overseas schemes’ deficit decreased by £2.8m and includes an increase of £1.7m relating to foreign exchange. Excluding foreign exchange the overseas schemes deficit have decreased by £4.5m, driven by a decrease in the schemes’ liabilities of £3.8m, including the effect of a £1.0m curtailment gain in Switzerland and an increase in schemes’ assets of £0.7m. The net deficit of the overseas schemes primarily relates to the German scheme £16.3m (2016: £14.8m).

Five year experience
Years ended 31 March
2017 2016 2015 2014 2013
£m £m £m £m £m
Defined benefit obligations
(585.2) (554.9) (563.8) (462.3) (423.4)
Fair value of plan assets
320.0 296.6 305.2 281.9 264.0
Deficit
(265.2) (258.3) (258.6) (180.4) (159.4)
Experience gains/(losses) on plan liabilities
0.3 1.5 5.3 (0.1) (0.2)
on plan assets
20.7 (12.4) 15.3 8.0 14.5
Pension funding in excess of the charge to operating profit is shown in the Consolidated Cash Flow Statement as follows:
Years ended 31 March
2017 2016
£m £m
Contributions less service cost (7.3) (7.3)
DEFINED CONTRIBUTION ARRANGEMENTS
The Group also operates defined contribution plans which receive fixed contributions from group companies. The
Group’s legal or constructive obligation for these plans is limited to the contributions. The expense recognised in
the current period in relation to these contributions was £7.0m (2016: £6.6m).
13 Contingent liabilities
In 1994 Compagnie Dens Ocean NV (CDO), an indirectly owned subsidiary, received a claim from the Belgian Customs authorities resulting in a liquidator being appointed in 1995. Civil litigation is in process with criminal proceedings being considered pending the final outcome of the civil action. The liquidator is defending the civil action vigorously and the Directors continue to believe, on the basis of legal advice received, that any future impact on the net assets of the Group would not be material.

14 Cash generated from operations
Years ended 31 March
2017 2016
£m £m
Profit before tax from continuing operations 33.1 26.7
Adjustments for: Depreciation and amortisation (note 8 and 9) 11.5 11.4
Net increase in provisions 4.0 3.8
Share of results of associates and joint ventures (0.9) (1.0)
Net finance costs (note 4) 13.3 13.6
Pension curtailment gain (1.0) -
Pension past service cost - 10.5
Share-based incentives 1.8 1.3
Other timing differences (0.5) -
61.3 66.3
Cash expenditure charged to provisions (note 11) (5.7) (4.8)
Change in trade and other receivables (7.0) 14.9
Change in trade and other payables 1.6 (21.0)
Pension funding in excess of charge to operating profit (7.3) (7.3)
Cash generated from operations 42.9 48.1