Embed Size (px)
Citation preview

A Service Provider Perspective on GBS Scope
….Doing more with Data and Analytics
Gary Plumpton
Traditional SSC approach may deliver less than expected ….……. And potentially less than Customers desire
Business Services must enable E2E Customer Lifecycle Management…….. “Experience” is the true differentiator
Data and Analytics within the GBS add value to the business
Opening Thoughts / Reflections on Yesterday
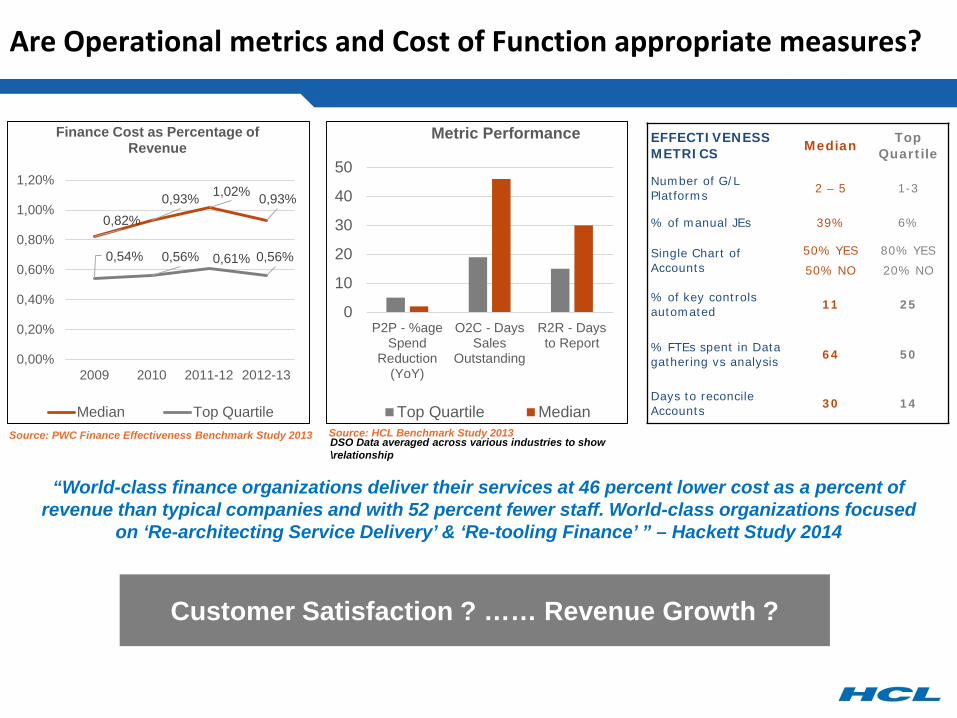
0,82%0,93% 1,02% 0,93%
0,54% 0,56% 0,61% 0,56%
0,00%
0,20%
0,40%
0,60%
0,80%
1,00%
1,20%
2009 2010 2011-12 2012-13
Finance Cost as Percentage of Revenue
Median Top QuartileSource: PWC Finance Effectiveness Benchmark Study 2013
Customer Satisfaction ? …… Revenue Growth ?
0
10
20
30
40
50
P2P - %ageSpend
Reduction(YoY)
O2C - DaysSales
Outstanding
R2R - Daysto Report
Metric Performance
Top Quartile MedianSource: HCL Benchmark Study 2013DSO Data averaged across various industries to show \relationship
“World-class finance organizations deliver their services at 46 percent lower cost as a percent of revenue than typical companies and with 52 percent fewer staff. World-class organizations focused
on ‘Re-architecting Service Delivery’ & ‘Re-tooling Finance’ ” – Hackett Study 2014
EFFECTIVENESS METRICS Median Top
Quartile
Number of G/L Platforms 2 – 5 1-3
% of manual JEs 39% 6%
Single Chart of Accounts
50% YES50% NO
80% YES20% NO
% of key controls automated 11 25
% FTEs spent in Data gathering vs analysis 64 50
Days to reconcile Accounts 30 14
Are Operational metrics and Cost of Function appropriate measures?

0% 5% 10% 15% 20% 25% 30% 35% 40% 45% 50%
Strategic relationship that provides business consulting, strategic planning and analysis that can include fundamental redesign of existing processes
Relationship enhances current capabilities by 'mining' and/or adding functionality to existing processes and
technologies
Relationship standardizes and/or consolidates existing processes in order to drive down costs and
achieve operational efficiencies
Current Status
Future Expectations
3 3.2 3.4 3.6 3.8 4 4.2
All (n=343)
1,000 - 4,999 (n=44)
5,000 - 9,999 (n=32)
10,000+ (n=76)
Ability to Transform your Business to a Cloud based model
Automation/Platform BPO Solutions
Analytics Capability
Talent
Global Delivery Infrastructure
This trend points towards a customer willingness to outsource higher value services to BPO providers.
Top 3 selection criteria to choose a provider:
1. Ability to transform business in to a cloud based model
2. Automation of Platform/BPO solutions3. Analytics capability
Top 3 outcomes from an outsourcing initiative:
1. Support/enhance Finance Transformation 2. Improve cash-flow and working capital 3. Globalize Finance Operations
0% 5% 10% 15% 20% 25% 30% 35% 40% 45%
Other
Leverage BPO providers strengths in mobility services
Leverage BPO providers financial services skills/knowledge for my industry
Leverage BPO providers infrastructure to scale operations
Leverage providers financial services platform/technology
Access quality talent related to financial operations
Standardize processes across regional operations and Acquisitions
Leverage provider’s experience and solutions to infuse efficiency into Financial business processes
Use analytics services to extract performance metrics
Globalize Financial Operations
Improve Cash Flow and Working capital
Achieve and/or enhance overall company’s financial transformation efforts
n=134
Source: IDC
CFO’s have begun to lay down wider expectations of BPO Vendors
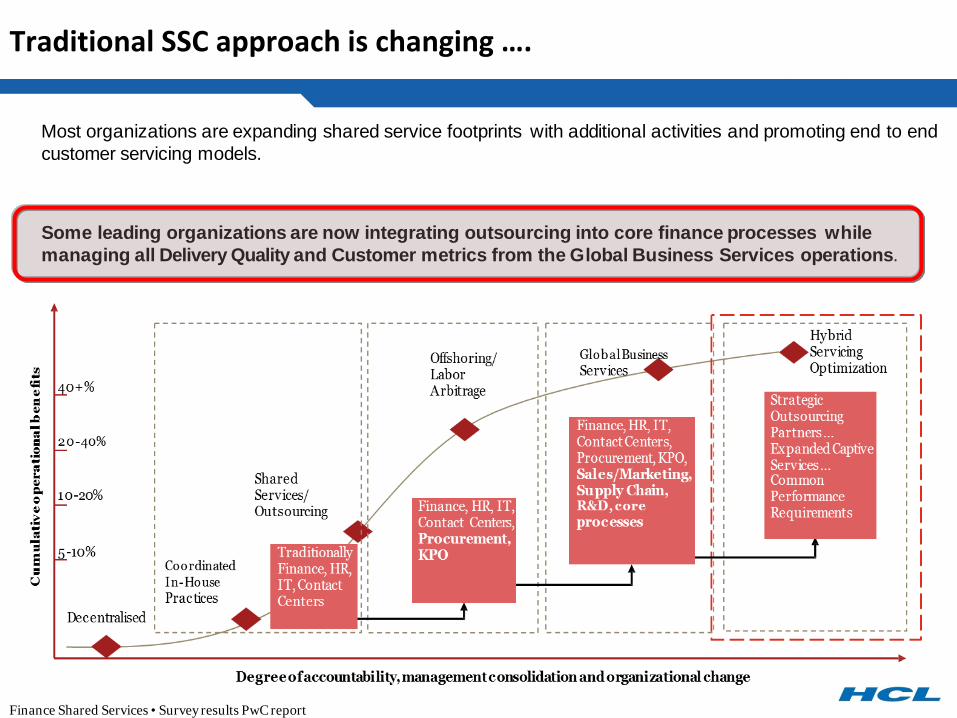
Most organizations are expanding shared service footprints with additional activities and promoting end to endcustomer servicing models.
Some leading organizations are now integrating outsourcing into core finance processes whilemanaging all Delivery Quality and Customer metrics from the Global Business Services operations.
Finance Shared Services • Survey results PwC report
Traditional SSC approach is changing ….
Contents
Some Practical Examples
A leading European Utility Services Provider – with a collections problem
A Leading Automotive Manufacturer – with declining market share
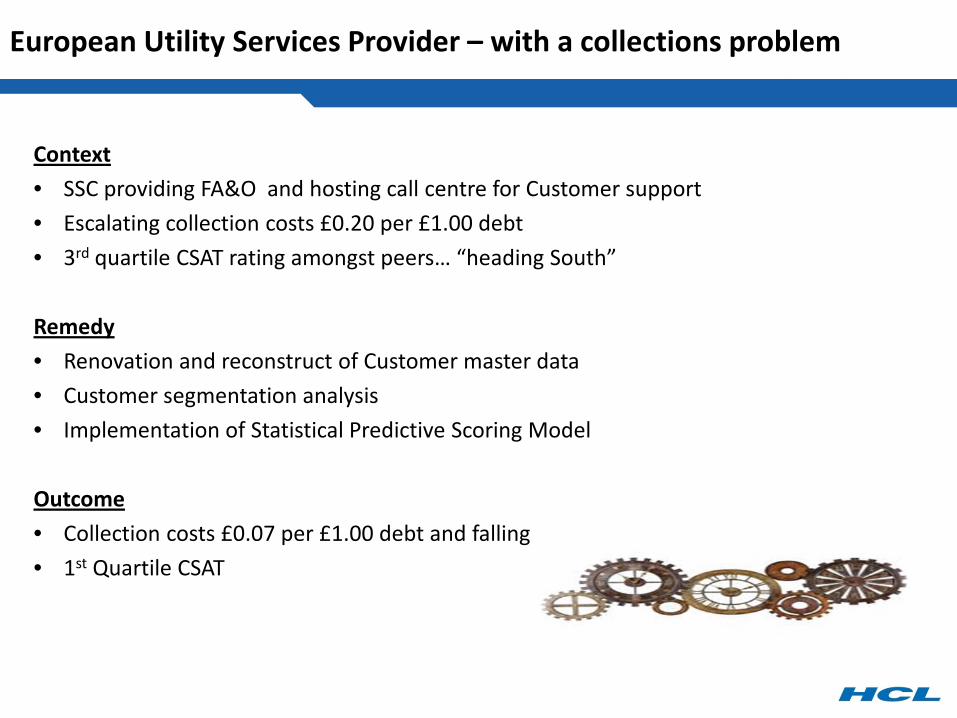
Context• SSC providing FA&O and hosting call centre for Customer support• Escalating collection costs £0.20 per £1.00 debt• 3rd quartile CSAT rating amongst peers… “heading South”
Remedy• Renovation and reconstruct of Customer master data • Customer segmentation analysis• Implementation of Statistical Predictive Scoring Model
Outcome• Collection costs £0.07 per £1.00 debt and falling• 1st Quartile CSAT
European Utility Services Provider – with a collections problem

The use of Master Data - Customer Behavior analysis
Customer Behavior analysis can benefit all areas of Client business
Marketing / Sales PaymentsService Bill Generation Bill Overdue Collections
SPSM: Statistical Predictive
Scoring Model
Bill Generation and Pre Bill Overdue Reminder to customers
with High Score
Pre sales Strategies can be formed using the same patterns of
behavior recorded
• SPSM (Statistical Predictive Scoring Model): This model will be created using a statistical tool which will provide behavior pattern of Origin’s current customers
• Onboard the customer on the correct plan• Prevention of customer churn• Know your customer’s behavior• Select right mode of collection at the right time (SMS, Emails, Letters, Collector less collector. Etc.)
Data from our Mercantile collections.
8
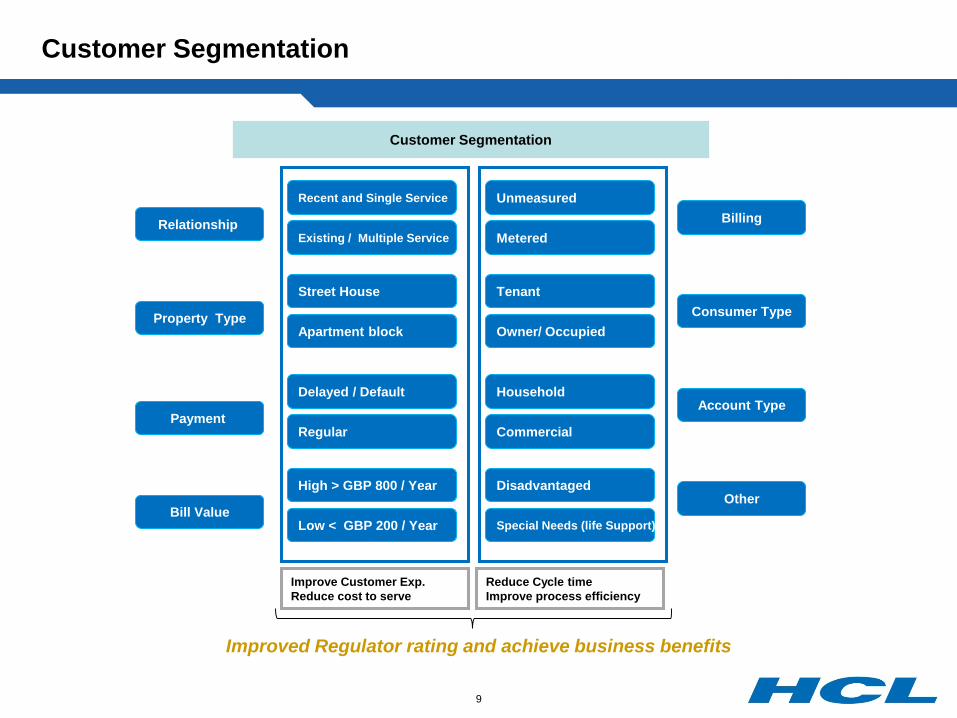
Customer Segmentation
Customer Segmentation
Recent and Single Service
Existing / Multiple Service
Street House
Apartment block
Delayed / Default
Regular
High > GBP 800 / Year
Low < GBP 200 / Year
Unmeasured
Metered
Tenant
Owner/ Occupied
Household
Commercial
Disadvantaged
Special Needs (life Support)
Billing
Consumer Type
Account Type
Other
Relationship
Property Type
Payment
Bill Value
Improve Customer Exp.Reduce cost to serve
Reduce Cycle timeImprove process efficiency
Improved Regulator rating and achieve business benefits
9
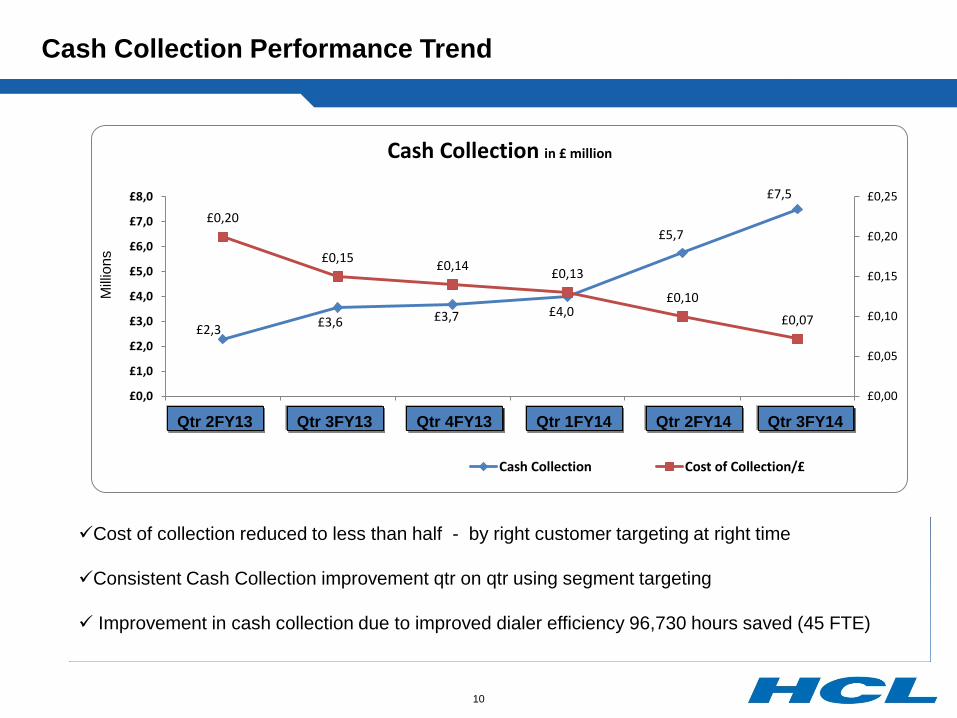
Cash Collection Performance Trend
Cost of collection reduced to less than half - by right customer targeting at right time
Consistent Cash Collection improvement qtr on qtr using segment targeting
Improvement in cash collection due to improved dialer efficiency 96,730 hours saved (45 FTE)
£2,3 £3,6 £3,7 £4,0
£5,7
£7,5
£0,20
£0,15 £0,14 £0,13
£0,10
£0,07
£0,00
£0,05
£0,10
£0,15
£0,20
£0,25
£0,0
£1,0
£2,0
£3,0
£4,0
£5,0
£6,0
£7,0
£8,0
2009-10 2010-11 2011-12 2012-13 2013-14 2014-15
Cash Collection in £ million
Cash Collection Cost of Collection/£
Milli
ons
Qtr 2FY13 Qtr 3FY13 Qtr 4FY13 Qtr 1FY14 Qtr 2FY14 Qtr 3FY14
10
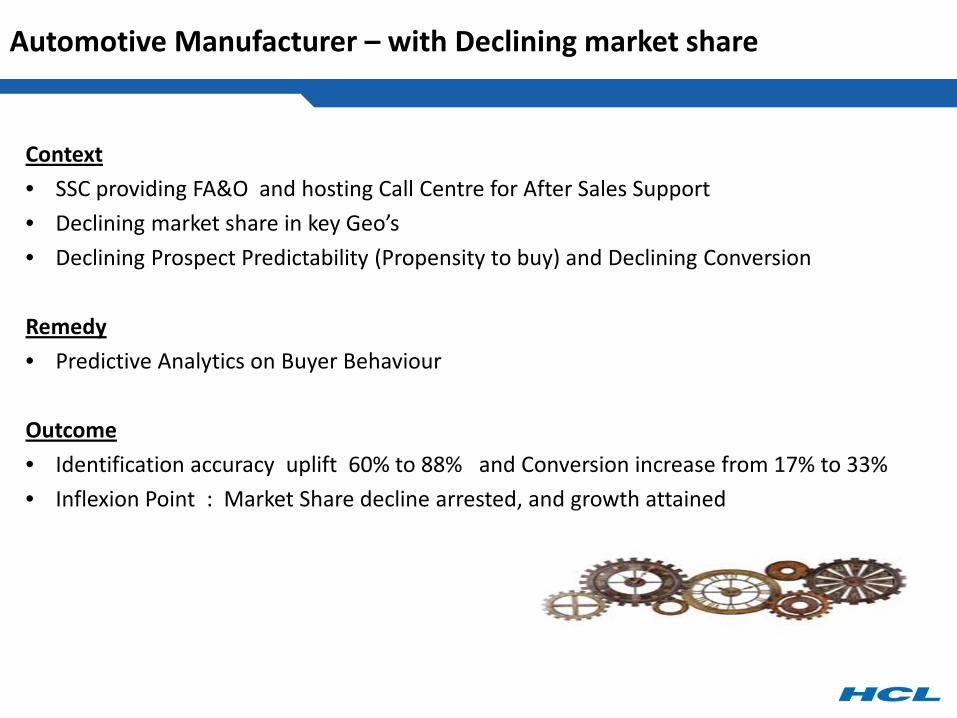
Context• SSC providing FA&O and hosting Call Centre for After Sales Support• Declining market share in key Geo’s• Declining Prospect Predictability (Propensity to buy) and Declining Conversion
Remedy• Predictive Analytics on Buyer Behaviour
Outcome• Identification accuracy uplift 60% to 88% and Conversion increase from 17% to 33%• Inflexion Point : Market Share decline arrested, and growth attained
Automotive Manufacturer – with Declining market share

Data Diagnostics Data Preparation Data Transformation
• Identifying common variables• Identifying primary key• Develop rules for identification
of key variable• create index variables if absent• Merge data using primary keys• Removal of duplicate variables• Removal of duplicate records• Creating new variables• Data cleansing
• Outlier detection & removal -Box-Cox plot
• Descriptive statistics• Graphical tests • Perform Multicollinearity Test &
Heteroscedasticity test• Correlation Analysis• Normality tests (P-P , Q-Q
plots, Anderson Darling)
• Selecting approapriate modeling technique(s) (Regression, Logistic, Cluster etc.)
• Model specification • Fit model• Diagnostic tests• Use simulation technique for
model suitability test on alternative scenarios
• Choosing a decision/classification rule(s)
• Acceptability• Predictability• Key Impact variables• Empirical Test• Final Model for deployment
• Redefine variables• Define coding criteria/
quantification of qualitative variables
• Innovating methods to use available data points
• Construct relevant scoring indices
• Prepare Index of Information Content (IIC)
• Checking data history• Checking duplicates & blanks• Identifying variables• Assess data consistency• Assess data completeness• Assess compatibility of different
data sources
Exploratory AnalysisModel DevelopmentFinal Model Validation
Model Implementation
Dat
a So
urce
MSC
RM
, aC
RM
Approach to Model Development
12
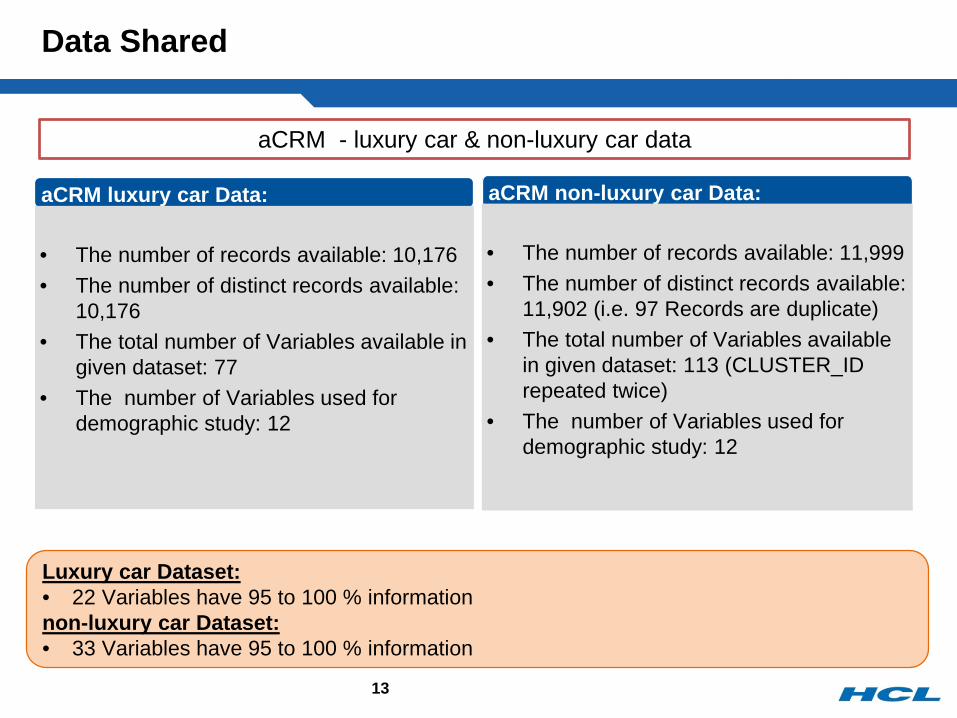
aCRM luxury car Data:
Data Shared
13
• The number of records available: 10,176• The number of distinct records available:
10,176• The total number of Variables available in
given dataset: 77• The number of Variables used for
demographic study: 12
aCRM - luxury car & non-luxury car data
aCRM non-luxury car Data:
• The number of records available: 11,999• The number of distinct records available:
11,902 (i.e. 97 Records are duplicate)• The total number of Variables available
in given dataset: 113 (CLUSTER_ID repeated twice)
• The number of Variables used for demographic study: 12
Luxury car Dataset:• 22 Variables have 95 to 100 % informationnon-luxury car Dataset:• 33 Variables have 95 to 100 % information

Models for Different Scenario and Visibility
Sno Variables Total observations Percentages Scenario-1 Scenario-2 Scenario-3 Scenario-4 Scenario-5 Scenario-61 Resi_city 20683 99.2 yes yes yes yes yes yes2 Resi_state 19359 89.6 yes yes yes3 Gender 18977 87.82 yes yes4 Pincode 17374 96.05 yes yes yes yes yes yes5 Occupation 14711 68.08 yes yes yes yes yes6 Marital_status 4153 19.22 yes yes7 Profession 1320 6.12 yes8 Employer 778 3.71 yes9 Qualification 449 2.08 yes
10 Designation 428 2.23 yes11 Fmly_size 223 1.03
TOTAL 21608
Number of Observation
used 129 9949 17094 11989 2821 10681Overall
Prediction 88% 64% 72% 67% 60% 65%Prediction Within luxury segment 93% 72% 70% 72% 81% 72%
We have tried all possible Scenarios to develop models based on :• Data Content• Availability• Prediction
Model Implemented: Logistic Regression
Predictive efficacy varies from 60% to 88%14

86(67%)
13(10%)
30(23%)
129
Model with Higher Prediction
Category Top decile customers
Middle layer
Bottom Layer
Number of Customers
Direction Must Target;Do multiple follow ups
Can be targeted;Single follow up Do not target
• Overall Prediction
88 %
• Prediction luxury category
93 %
Predicted TotalNot to
purchase luxury sedan
To purchase luxury sedan
Actual
NON_luxury car Purchased 22 7 29
Luxury sedan Purchased 8 92 100
Total 30 99 12915

Business Services must enable E2E Customer Lifecycle Management……..Post Digitisation “Experience” is the true differentiator
Data and Activity Based Analytics within the GBS identify value creation opportunities
If / What …. Not what / if ??
Closing Thoughts / Reflections on Tomorrow
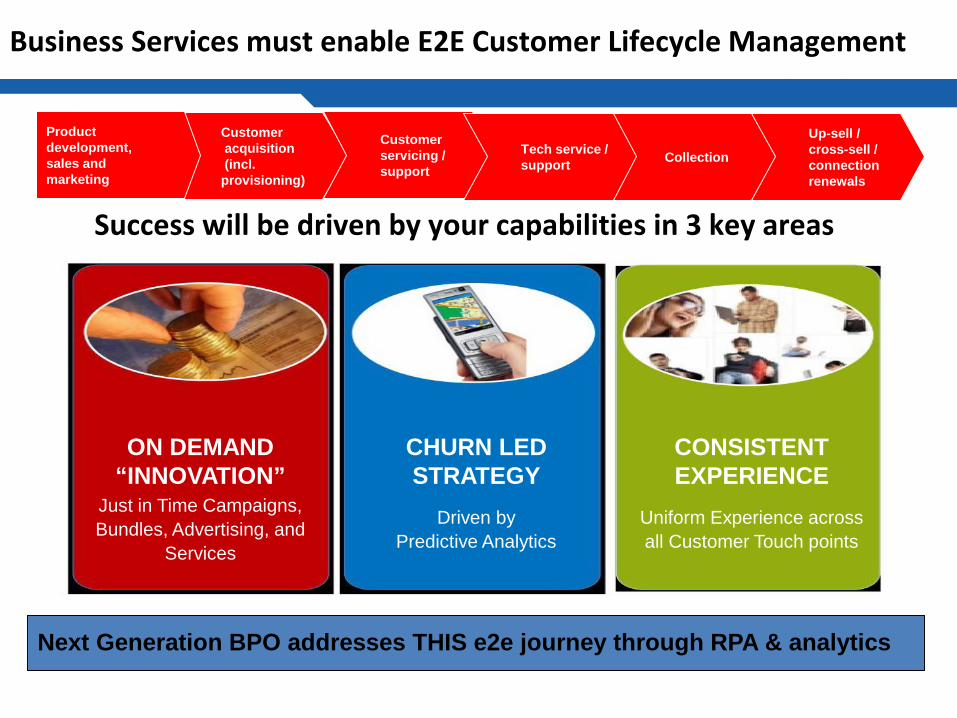
ON DEMAND“INNOVATION”
Just in Time Campaigns,Bundles, Advertising, and
Services
CHURN LEDSTRATEGY
Driven byPredictive Analytics
Uniform Experience acrossall Customer Touch points
CONSISTENTEXPERIENCE
Success will be driven by your capabilities in 3 key areas
Collection
Customer acquisition (incl. provisioning)
Customer servicing / support
Tech service /support
Product development,sales and marketing
Up-sell / cross-sell / connection renewals
Next Generation BPO addresses THIS e2e journey through RPA & analytics
Business Services must enable E2E Customer Lifecycle Management
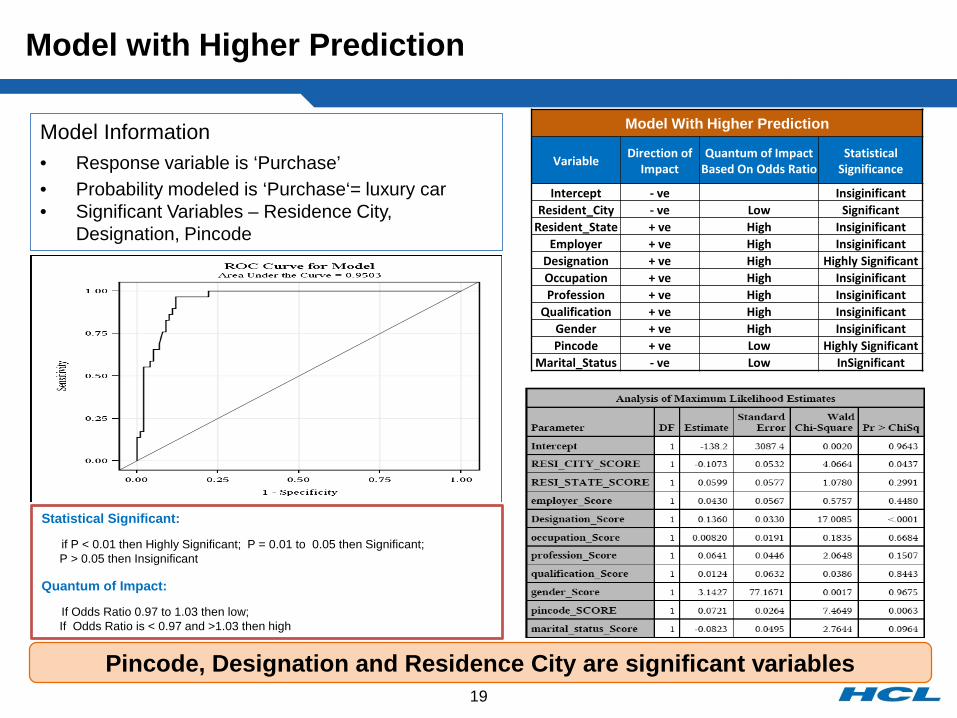
Model with Higher Prediction
Model Information• Response variable is ‘Purchase’• Probability modeled is ‘Purchase‘= luxury car• Significant Variables – Residence City,
Designation, Pincode
Model With Higher Prediction
Variable Direction of Impact
Quantum of Impact Based On Odds Ratio
Statistical Significance
Intercept - ve InsiginificantResident_City - ve Low Significant
Resident_State + ve High InsiginificantEmployer + ve High Insiginificant
Designation + ve High Highly SignificantOccupation + ve High InsiginificantProfession + ve High Insiginificant
Qualification + ve High InsiginificantGender + ve High InsiginificantPincode + ve Low Highly Significant
Marital_Status - ve Low InSignificant
Pincode, Designation and Residence City are significant variables
Statistical Significant:
if P < 0.01 then Highly Significant; P = 0.01 to 0.05 then Significant; P > 0.05 then Insignificant
Quantum of Impact:
If Odds Ratio 0.97 to 1.03 then low; If Odds Ratio is < 0.97 and >1.03 then high
19