Embed Size (px)
Citation preview
Indonesia Automotive Outlook: 2012
Presented by
Vivek Vaidya
Vice President of Automotive & Transportation Practice, Asia Pacific
18th January 2012
Contents Contents
Indonesia Automotive Recap of 2011
Indonesia Automotive Outlook 2012
3
Global Light Vehicle Sales reached around 75 million in 2011 a growth of 4% over 2010
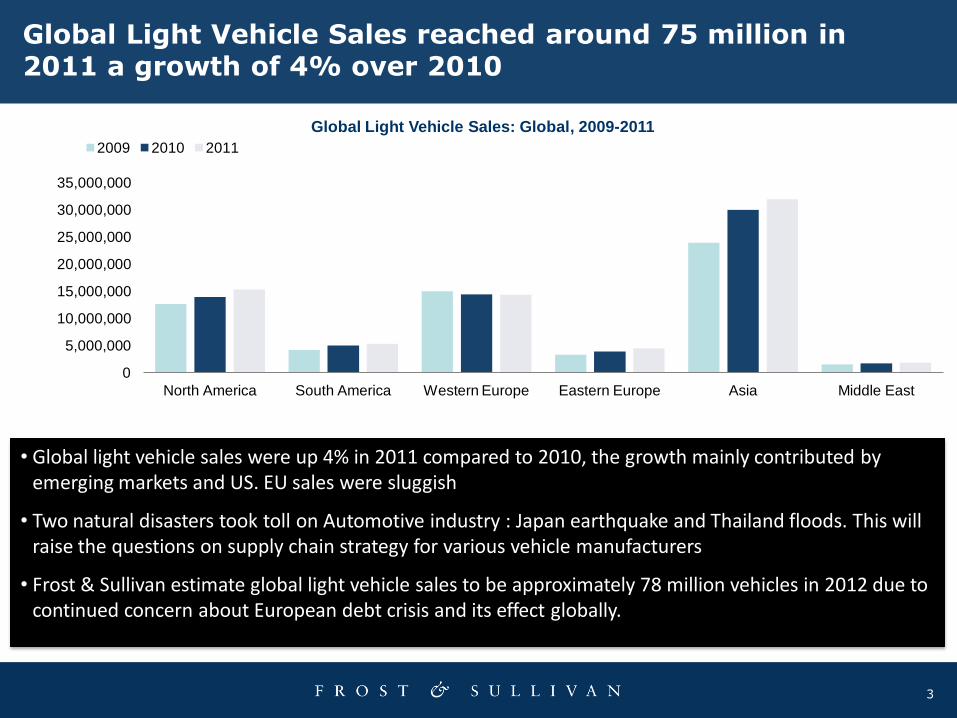
Global Light Vehicle Sales: Global, 2009-2011
• Global light vehicle sales were up 4% in 2011 compared to 2010, the growth mainly contributed by emerging markets and US. EU sales were sluggish
• Two natural disasters took toll on Automotive industry : Japan earthquake and Thailand floods. This will raise the questions on supply chain strategy for various vehicle manufacturers
• Frost & Sullivan estimate global light vehicle sales to be approximately 78 million vehicles in 2012 due to continued concern about European debt crisis and its effect globally.
0
5,000,000
10,000,000
15,000,000
20,000,000
25,000,000
30,000,000
35,000,000
North America South America Western Europe Eastern Europe Asia Middle East
2009 2010 2011
4
Brazil, Russia, India and China drove the growth along with US
0
4,000,000
8,000,000
12,000,000
16,000,000
20,000,000
China Brazil India Russia
2010 2011
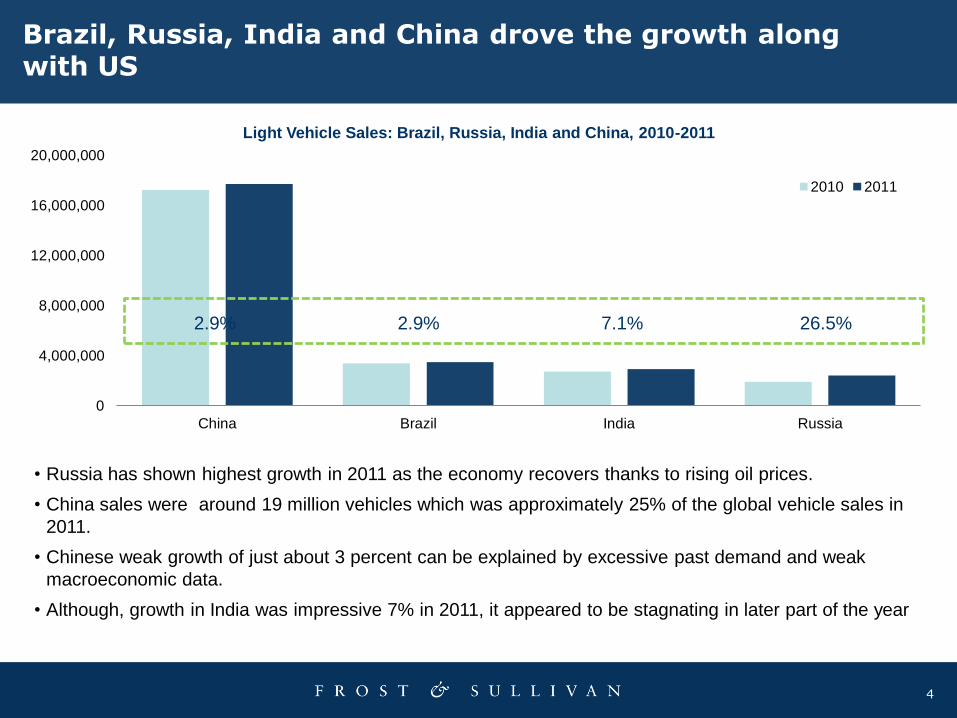
Light Vehicle Sales: Brazil, Russia, India and China, 2010-2011
• Russia has shown highest growth in 2011 as the economy recovers thanks to rising oil prices.
• China sales were around 19 million vehicles which was approximately 25% of the global vehicle sales in
2011.
• Chinese weak growth of just about 3 percent can be explained by excessive past demand and weak
macroeconomic data.
• Although, growth in India was impressive 7% in 2011, it appeared to be stagnating in later part of the year
2.9% 2.9% 7.1% 26.5%
Indonesia achieves no. 1 position among ASEAN countries for the first time
5
764,710 890,410
800,357 800,300*
605,156 605,000
2010 2011 Indonesia Thailand Malaysia
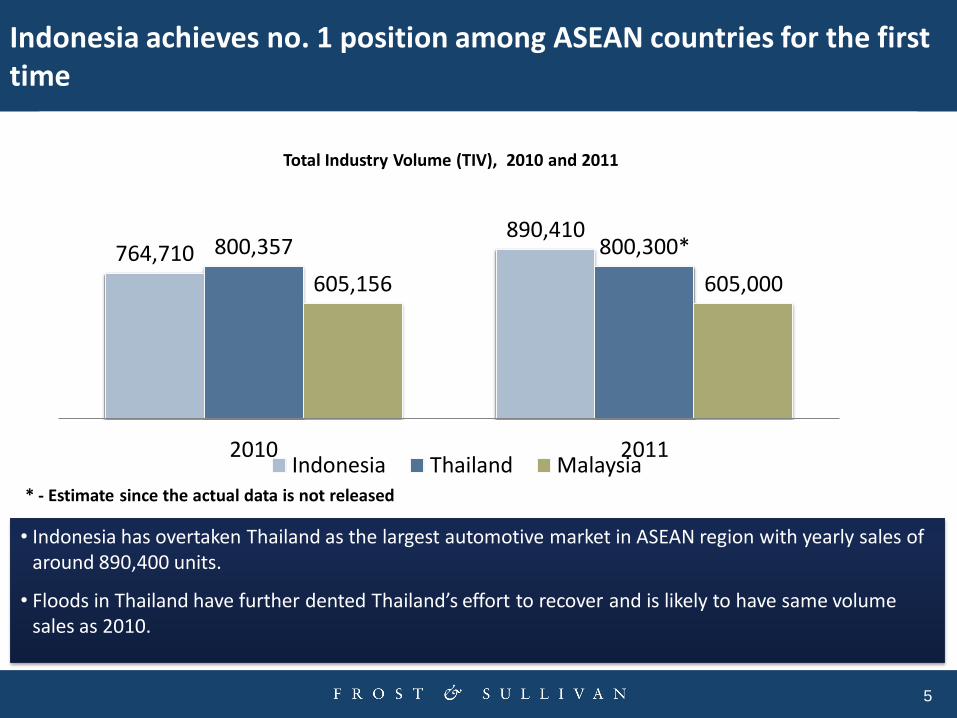
Total Industry Volume (TIV), 2010 and 2011
• Indonesia has overtaken Thailand as the largest automotive market in ASEAN region with yearly sales of around 890,400 units.
• Floods in Thailand have further dented Thailand’s effort to recover and is likely to have same volume sales as 2010.
* - Estimate since the actual data is not released
0
20,000
40,000
60,000
80,000
100,000
Jan Feb Mar Apr May Jun Jul Aug Sep Oct Nov Dec
Un
its
Monthly Sales Trend (2009 – 2011)
2009
2010
2011 (f)
Indonesia : 2011 TIV likely to be around 890,000; 16.4% YOY growth
6
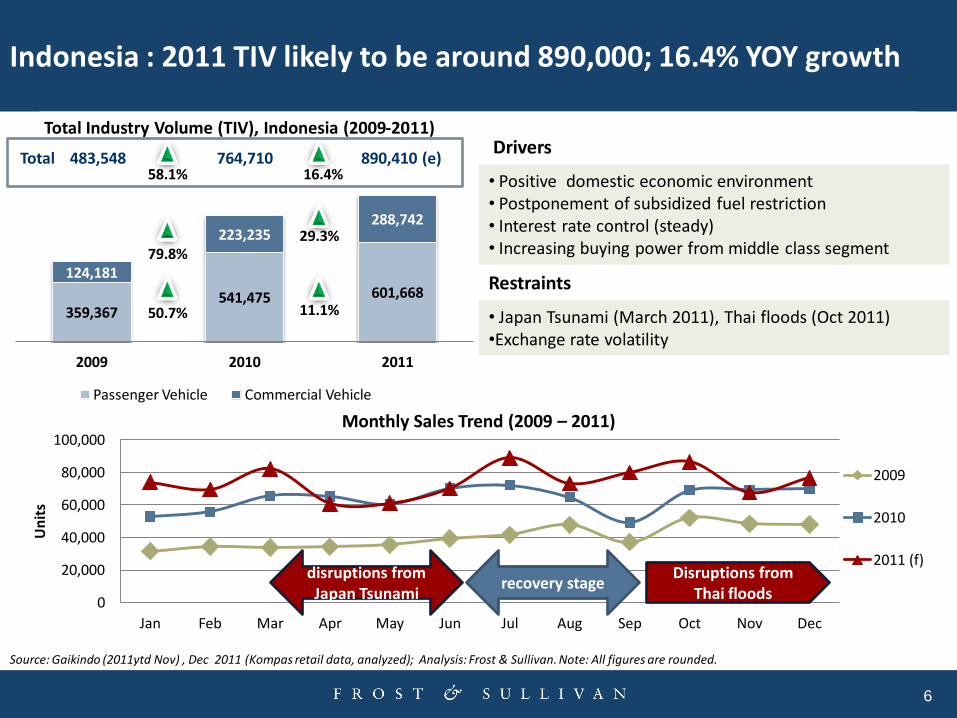
359,367 541,475 601,668
124,181
223,235 288,742
2009 2010 2011
Passenger Vehicle Commercial Vehicle
483,548 764,710 890,410 (e)
• Positive domestic economic environment • Postponement of subsidized fuel restriction • Interest rate control (steady) • Increasing buying power from middle class segment
Source: Gaikindo (2011ytd Nov) , Dec 2011 (Kompas retail data, analyzed); Analysis: Frost & Sullivan. Note: All figures are rounded.
50.7% 11.1%
79.8%
58.1%
29.3%
16.4% Total
disruptions from Japan Tsunami
recovery stage Disruptions from
Thai floods
• Japan Tsunami (March 2011), Thai floods (Oct 2011) •Exchange rate volatility
Restraints
Drivers Total Industry Volume (TIV), Indonesia (2009-2011)
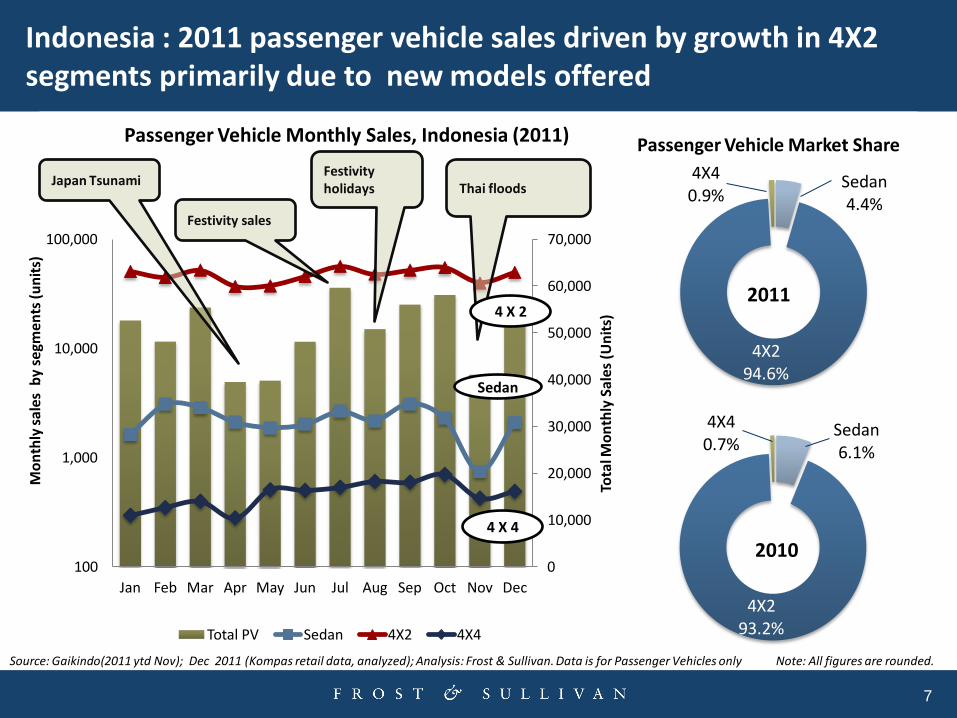
Sedan 4.4%
4X2 94.6%
4X4 0.9%
2011
Sedan 6.1%
4X2 93.2%
4X4 0.7%
2010
Indonesia : 2011 passenger vehicle sales driven by growth in 4X2 segments primarily due to new models offered
0
10,000
20,000
30,000
40,000
50,000
60,000
70,000
100
1,000
10,000
100,000
Jan Feb Mar Apr May Jun Jul Aug Sep Oct Nov Dec To
tal M
on
thly
Sal
es (
Un
its)
Mo
nth
ly s
ales
by
segm
ents
(u
nit
s)
Passenger Vehicle Monthly Sales, Indonesia (2011)
Total PV Sedan 4X2 4X4
7
Source: Gaikindo(2011 ytd Nov); Dec 2011 (Kompas retail data, analyzed); Analysis: Frost & Sullivan. Data is for Passenger Vehicles only Note: All figures are rounded.
Japan Tsunami Festivity holidays
Festivity sales
Thai floods
4 X 4
Sedan
4 X 2
Passenger Vehicle Market Share
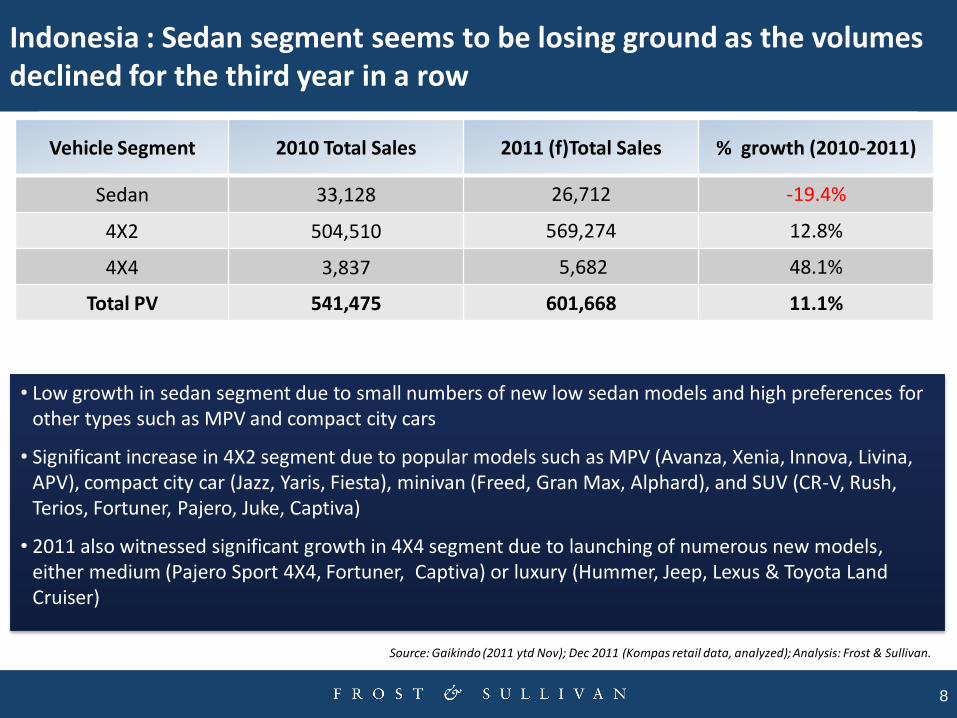
Indonesia : Sedan segment seems to be losing ground as the volumes declined for the third year in a row
8
Vehicle Segment 2010 Total Sales 2011 (f)Total Sales % growth (2010-2011)
Sedan 33,128 26,712 -19.4%
4X2 504,510 569,274 12.8%
4X4 3,837 5,682 48.1%
Total PV 541,475 601,668 11.1%
• Low growth in sedan segment due to small numbers of new low sedan models and high preferences for other types such as MPV and compact city cars
• Significant increase in 4X2 segment due to popular models such as MPV (Avanza, Xenia, Innova, Livina, APV), compact city car (Jazz, Yaris, Fiesta), minivan (Freed, Gran Max, Alphard), and SUV (CR-V, Rush, Terios, Fortuner, Pajero, Juke, Captiva)
• 2011 also witnessed significant growth in 4X4 segment due to launching of numerous new models, either medium (Pajero Sport 4X4, Fortuner, Captiva) or luxury (Hummer, Jeep, Lexus & Toyota Land Cruiser)
Source: Gaikindo (2011 ytd Nov); Dec 2011 (Kompas retail data, analyzed); Analysis: Frost & Sullivan.
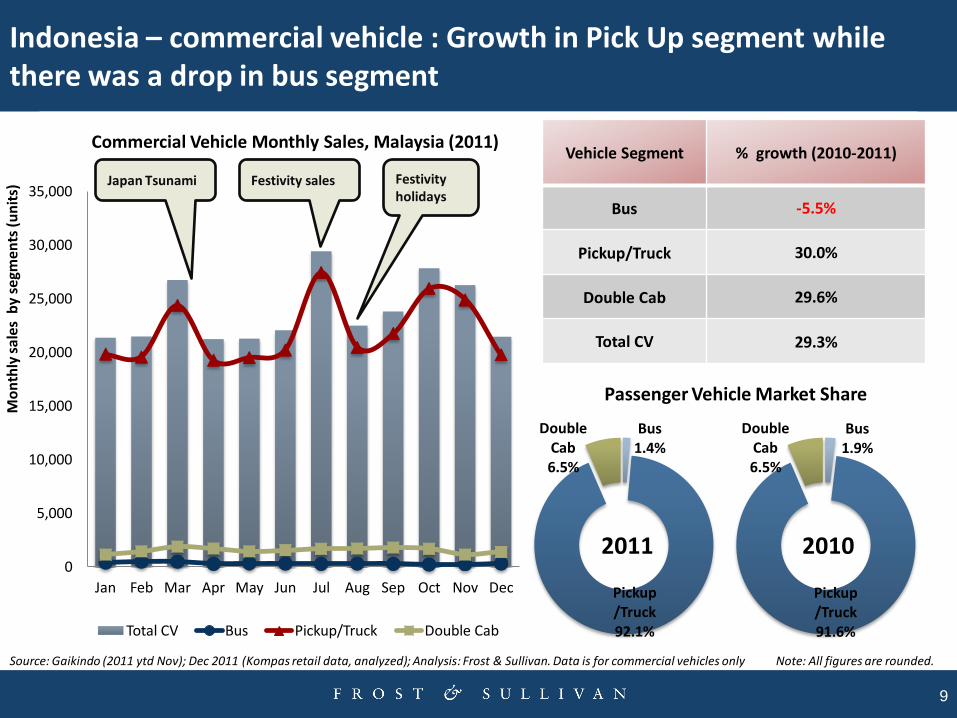
Bus 1.4%
Pickup/Truck 92.1%
Double Cab 6.5%
2011
Bus 1.9%
Pickup/Truck 91.6%
Double Cab 6.5%
2010
Indonesia – commercial vehicle : Growth in Pick Up segment while there was a drop in bus segment
0
5,000
10,000
15,000
20,000
25,000
30,000
35,000
Jan Feb Mar Apr May Jun Jul Aug Sep Oct Nov Dec
Mo
nth
ly s
ales
by
segm
ents
(u
nit
s)
Commercial Vehicle Monthly Sales, Malaysia (2011)
Total CV Bus Pickup/Truck Double Cab
9
Vehicle Segment % growth (2010-2011)
Bus -5.5%
Pickup/Truck 30.0%
Double Cab 29.6%
Total CV 29.3%
Source: Gaikindo (2011 ytd Nov); Dec 2011 (Kompas retail data, analyzed); Analysis: Frost & Sullivan. Data is for commercial vehicles only Note: All figures are rounded.
Passenger Vehicle Market Share
Japan Tsunami Festivity holidays
Festivity sales
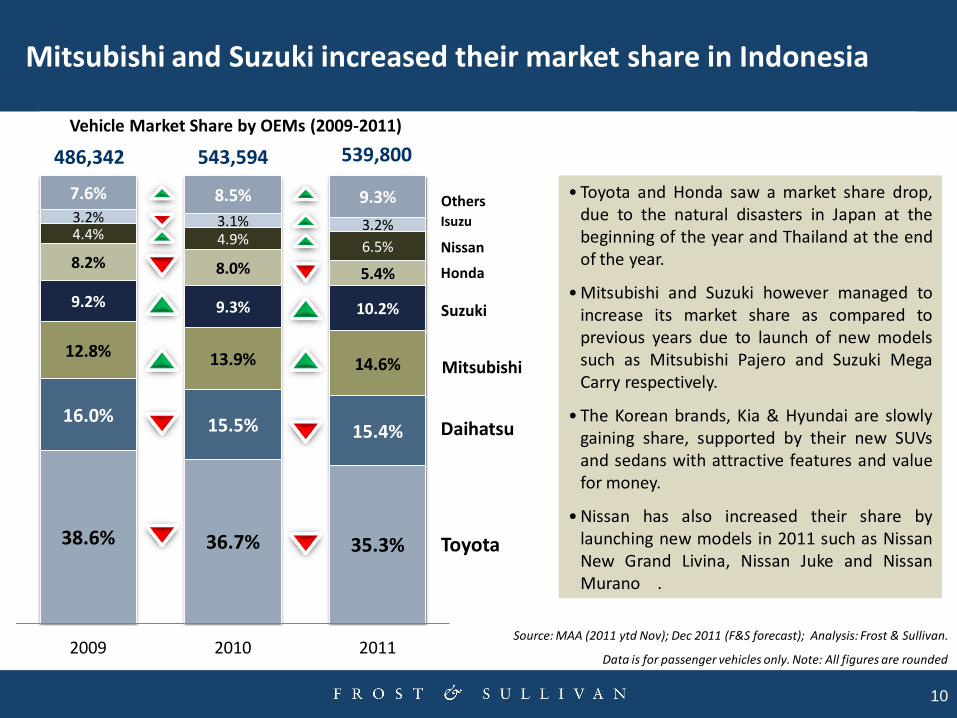
Mitsubishi and Suzuki increased their market share in Indonesia
38.6% 36.7% 35.3%
16.0% 15.5% 15.4%
12.8% 13.9% 14.6%
9.2% 9.3% 10.2%
8.2% 8.0% 5.4%
4.4% 4.9% 6.5%
3.2% 3.1% 3.2%
7.6% 8.5% 9.3%
2009 2010 2011
Vehicle Market Share by OEMs (2009-2011)
10
Toyota
Daihatsu
Mitsubishi
Suzuki
Honda
Nissan
Isuzu
Others
486,342 543,594 539,800
• Toyota and Honda saw a market share drop, due to the natural disasters in Japan at the beginning of the year and Thailand at the end of the year.
• Mitsubishi and Suzuki however managed to increase its market share as compared to previous years due to launch of new models such as Mitsubishi Pajero and Suzuki Mega Carry respectively.
• The Korean brands, Kia & Hyundai are slowly gaining share, supported by their new SUVs and sedans with attractive features and value for money.
• Nissan has also increased their share by launching new models in 2011 such as Nissan New Grand Livina, Nissan Juke and Nissan Murano .
Source: MAA (2011 ytd Nov); Dec 2011 (F&S forecast); Analysis: Frost & Sullivan.
Data is for passenger vehicles only. Note: All figures are rounded
Healthy domestic led economic growth supported the automotive sector to increase its volumes
11
2.4% 2.8% 3.7%
-3.6%
1.7% 2.3%
3.8%
-2.4%
1.9% 2.9%
3.4%
-1.4%
1.6%
2.9% 3.5%
6.5%
Q1 08
Q2 Q3 Q4 Q1 09
Q2 Q3 Q4 Q1 10
Q2 Q3 Q4 Q1 11
Q2 Q3 Q4
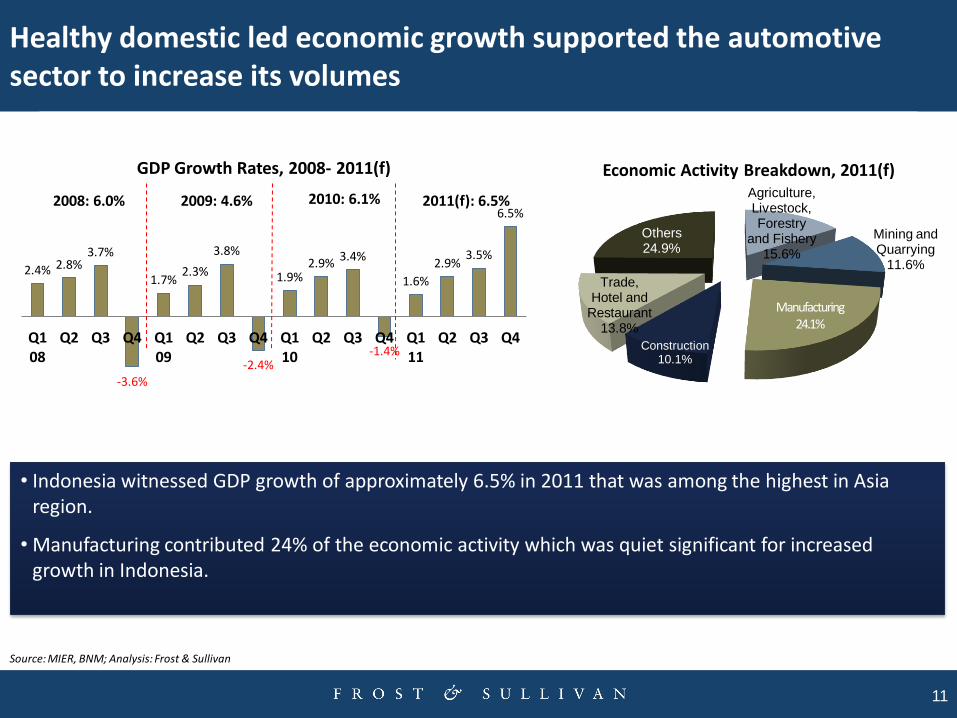
GDP Growth Rates, 2008- 2011(f)
2008: 6.0% 2009: 4.6% 2010: 6.1% 2011(f): 6.5% Agriculture, Livestock, Forestry
and Fishery 15.6%
Mining and Quarrying
11.6%
Manufacturing 24.1%
Construction 10.1%
Trade, Hotel and
Restaurant 13.8%
Others 24.9%
Economic Activity Breakdown, 2011(f)
Source: MIER, BNM; Analysis: Frost & Sullivan
• Indonesia witnessed GDP growth of approximately 6.5% in 2011 that was among the highest in Asia region.
• Manufacturing contributed 24% of the economic activity which was quiet significant for increased growth in Indonesia.
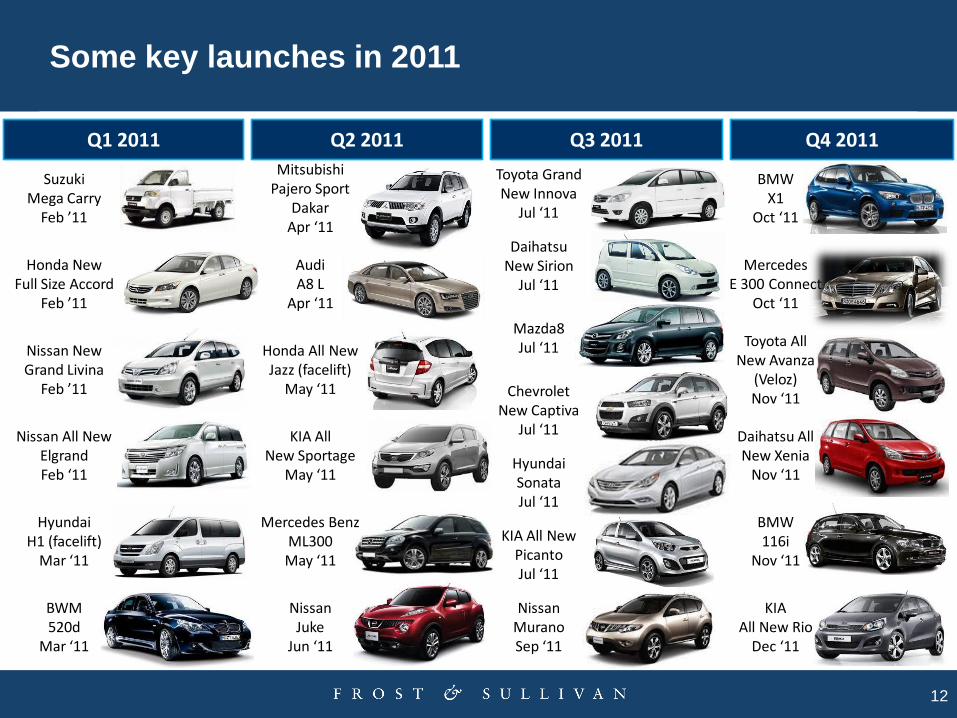
Some key launches in 2011
12
Suzuki Mega Carry
Feb ’11
Honda New Full Size Accord
Feb ’11
Nissan New Grand Livina
Feb ’11
Nissan All New Elgrand Feb ‘11
Hyundai H1 (facelift)
Mar ‘11
BWM 520d
Mar ‘11
Toyota Grand New Innova
Jul ‘11
Daihatsu New Sirion
Jul ‘11
Mazda8 Jul ‘11
Hyundai Sonata Jul ‘11
KIA All New Picanto Jul ‘11
Nissan Murano Sep ‘11
Q1 2011 Q2 2011 Q3 2011 Q4 2011
Chevrolet New Captiva
Jul ‘11
Mitsubishi Pajero Sport
Dakar Apr ‘11
Honda All New Jazz (facelift)
May ‘11
KIA All New Sportage
May ‘11
Mercedes Benz ML300 May ‘11
Nissan Juke
Jun ‘11
Audi A8 L
Apr ‘11
Toyota All New Avanza
(Veloz) Nov ‘11
Daihatsu All New Xenia
Nov ‘11
KIA All New Rio
Dec ‘11
BMW X1
Oct ‘11
BMW 116i
Nov ‘11
Mercedes E 300 Connect
Oct ‘11
Contents Contents
Indonesia Automotive Recap of 2011
Indonesia Automotive Outlook 2012
Economic Outlook 2012 : Stable economic growth of more than 6%
14
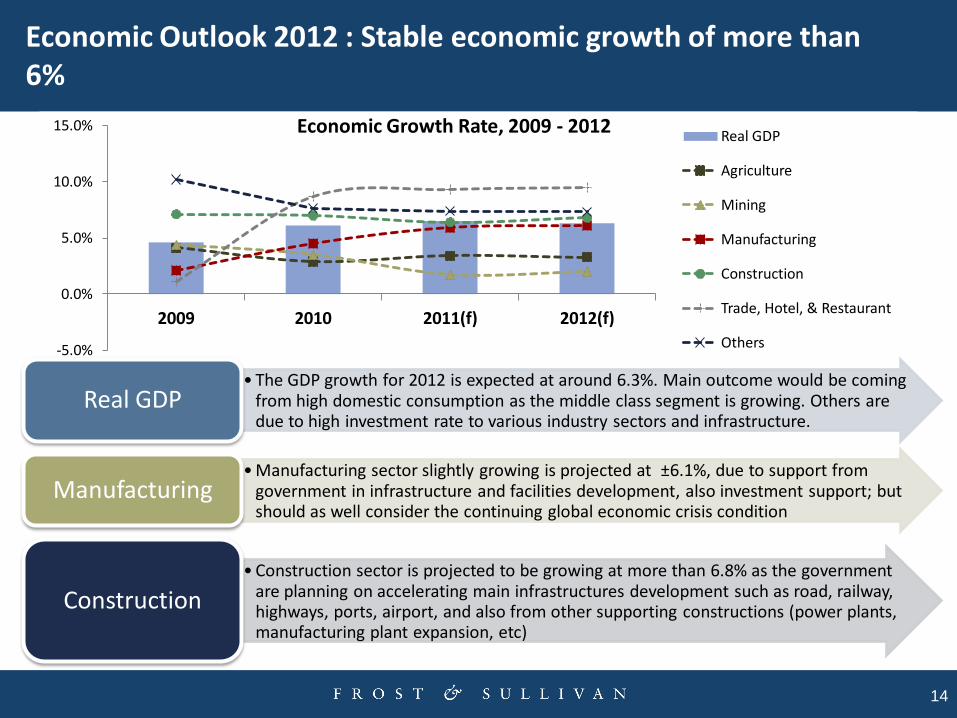
-5.0%
0.0%
5.0%
10.0%
15.0%
2009 2010 2011(f) 2012(f)
Real GDP
Agriculture
Mining
Manufacturing
Construction
Trade, Hotel, & Restaurant
Others
Economic Growth Rate, 2009 - 2012
• The GDP growth for 2012 is expected at around 6.3%. Main outcome would be coming from high domestic consumption as the middle class segment is growing. Others are due to high investment rate to various industry sectors and infrastructure.
Real GDP
• Manufacturing sector slightly growing is projected at ±6.1%, due to support from government in infrastructure and facilities development, also investment support; but should as well consider the continuing global economic crisis condition
Manufacturing
• Construction sector is projected to be growing at more than 6.8% as the government are planning on accelerating main infrastructures development such as road, railway, highways, ports, airport, and also from other supporting constructions (power plants, manufacturing plant expansion, etc)
Construction
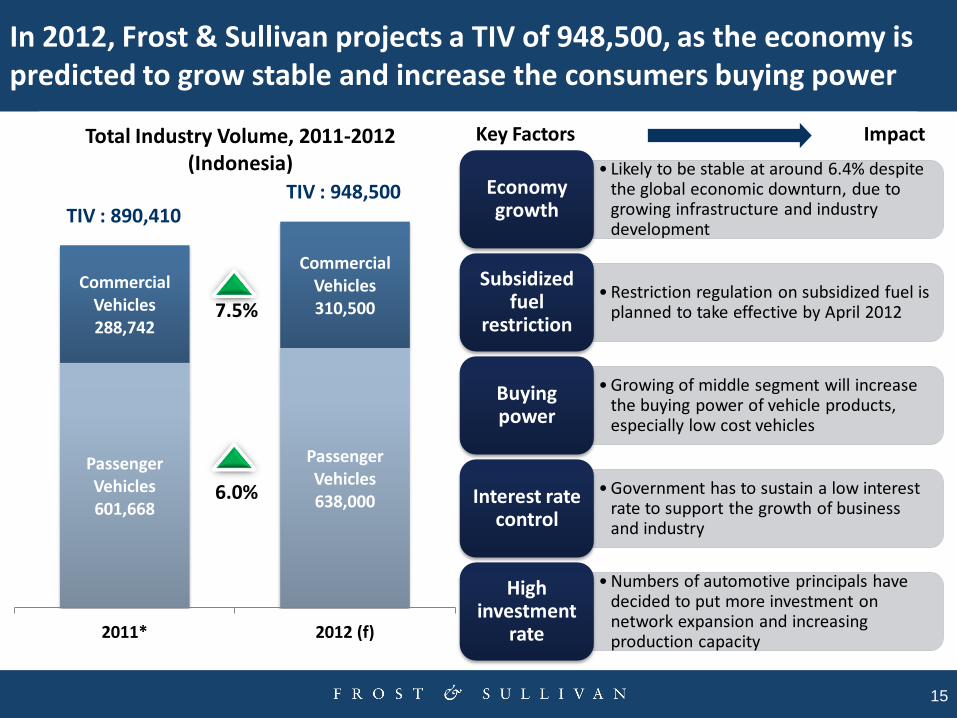
Passenger Vehicles 601,668
Passenger Vehicles 638,000
Commercial Vehicles 288,742
Commercial Vehicles 310,500
2011* 2012 (f)
Total Industry Volume, 2011-2012 (Indonesia)
In 2012, Frost & Sullivan projects a TIV of 948,500, as the economy is predicted to grow stable and increase the consumers buying power
15
6.0%
7.5%
TIV : 890,410 TIV : 948,500
Key Factors Impact
• Likely to be stable at around 6.4% despite the global economic downturn, due to growing infrastructure and industry development
Economy growth
• Restriction regulation on subsidized fuel is planned to take effective by April 2012
Subsidized fuel
restriction
• Growing of middle segment will increase the buying power of vehicle products, especially low cost vehicles
Buying power
• Government has to sustain a low interest rate to support the growth of business and industry
Interest rate control
• Numbers of automotive principals have decided to put more investment on network expansion and increasing production capacity
High investment
rate
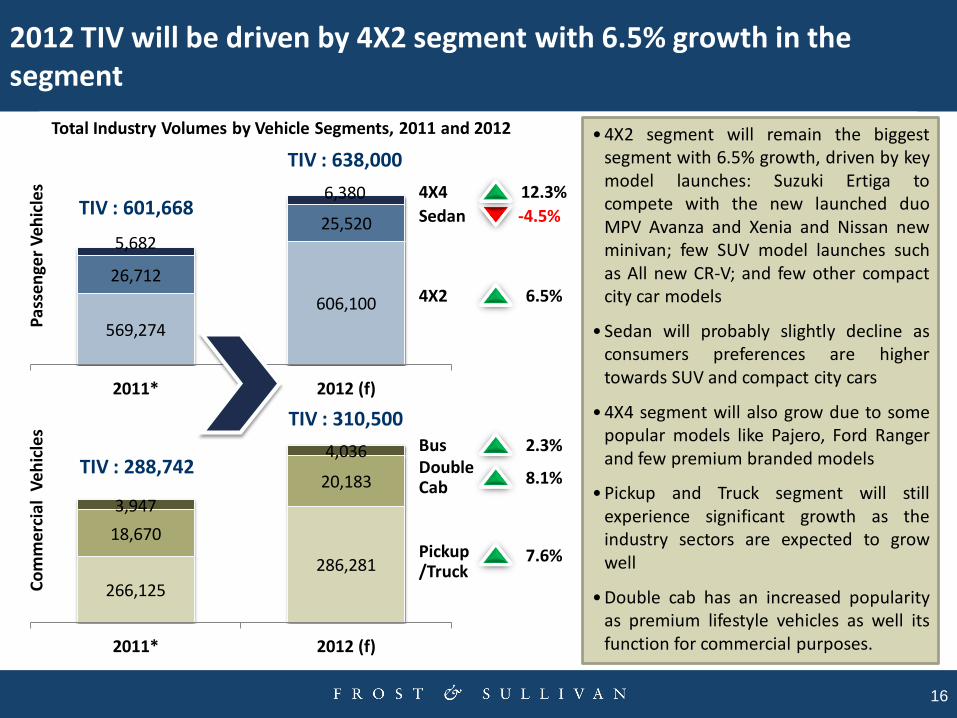
569,274
606,100
26,712
25,520 5,682
6,380
2011* 2012 (f)
266,125
286,281
18,670
20,183
3,947
4,036
2011* 2012 (f)
2012 TIV will be driven by 4X2 segment with 6.5% growth in the segment
16
Total Industry Volumes by Vehicle Segments, 2011 and 2012
TIV : 601,668
TIV : 638,000
7.6%
8.1%
6.5%
-4.5%
12.3%
• 4X2 segment will remain the biggest segment with 6.5% growth, driven by key model launches: Suzuki Ertiga to compete with the new launched duo MPV Avanza and Xenia and Nissan new minivan; few SUV model launches such as All new CR-V; and few other compact city car models
• Sedan will probably slightly decline as consumers preferences are higher towards SUV and compact city cars
• 4X4 segment will also grow due to some popular models like Pajero, Ford Ranger and few premium branded models
• Pickup and Truck segment will still experience significant growth as the industry sectors are expected to grow well
• Double cab has an increased popularity as premium lifestyle vehicles as well its function for commercial purposes.
4X2
Pas
sen
ger
Ve
hic
les
Co
mm
erci
al V
ehic
les
Sedan
4X4
Pickup/Truck
Double Cab
Bus 2.3% TIV : 288,742
TIV : 310,500
New launches supporting the growth in 2012
17
2012 will witness the launch/facelift of around 25-30 new models in Indonesia that will further increase the sales volumes growth.
Japanese OEMs mainly Toyota, Honda and Suzuki are likely to be the front runners in terms of new model introduction by launching close to 15-20 models in 2012.
Ford, Hyundai, Proton and BMW are the other OEMs that are each likely to introduce more than 2-3 new models and make their mark in Indonesia automotive market in 2012.
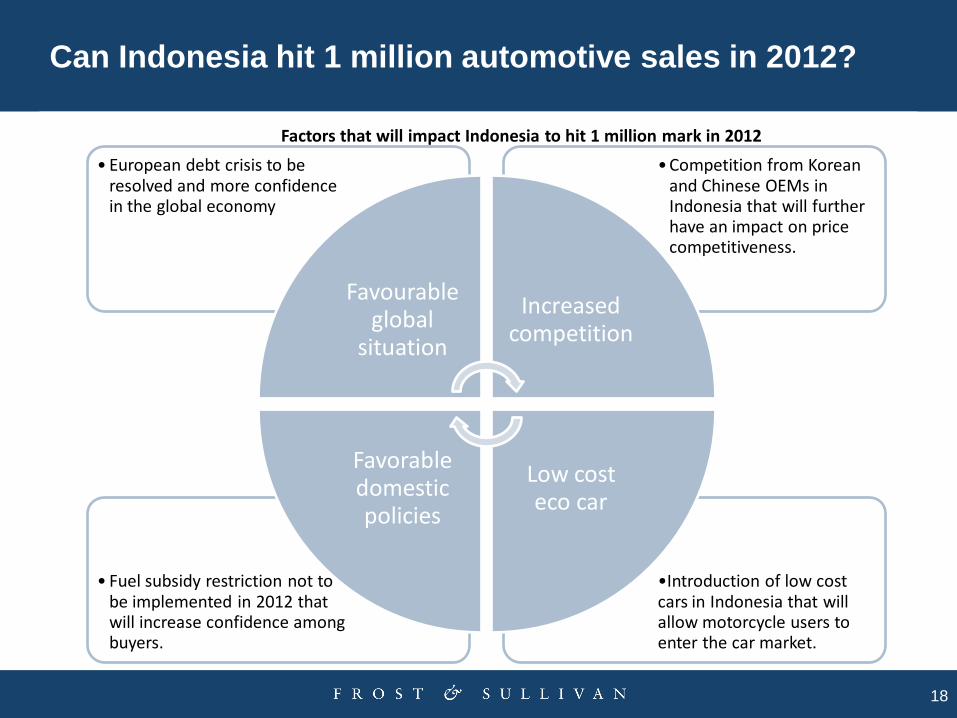
Can Indonesia hit 1 million automotive sales in 2012?
18
•Introduction of low cost cars in Indonesia that will allow motorcycle users to enter the car market.
• Fuel subsidy restriction not to be implemented in 2012 that will increase confidence among buyers.
• Competition from Korean and Chinese OEMs in Indonesia that will further have an impact on price competitiveness.
• European debt crisis to be resolved and more confidence in the global economy
Favourable global
situation
Increased competition
Low cost eco car
Favorable domestic policies
Factors that will impact Indonesia to hit 1 million mark in 2012
Conclusions
19
2011 was another tremendous year for Indonesia automotive industry as it experienced more than 16% growth despite of the global economic downturn and natural disasters that hit Japan and Thailand
2012 Indonesia Automotive TIV is expected to still grow at a moderate increase of 6.5% with support from stable economic condition and ever increasing consumer buying power
Consumer preferences on passenger vehicles will still high for 4X2 segments especially the MPV, SUV and compact city cars models; while for commercial vehicles the double cab will have an increasing popularity over common pickup models
If the global economic environment turns favorable and domestic policy support is strong, Indonesia may cross the magical 1 million unit sales. At this stage the possibility looks quite low.