Embed Size (px)
Citation preview
MARKET FEASIBILITY STUDY AND BUSINESS DEVELOPMENT PLAN FOR THE
HANDICRAFTS SECTOR
– A FROST & SULLIVAN REPORT –
SUBMITTED TO:
EXPORT PROMOTION COUNCIL FOR HANDICRAFTS, NEW DELHI, INDIA
AUGUST, 2005
1
Confidential To Export Promotion Council for Handicrafts © 2005 Frost & Sullivan
DISCLAIMER
Frost & Sullivan takes no responsibility for any incorrect information supplied to us by
manufacturers or other entities contacted during the research. Information pertaining to
trade data is based primarily on world trade data obtained from International Trade Center.
Frost & Sullivan reports contain valuable market information. No part of this report may
be given, lent, resold, or disclosed to non-customers without written permission.
Furthermore, no part may be reproduced, stored in a retrieval system, or transmitted in any
form or by any means, electronic, mechanical, photocopying, recording, or otherwise,
without the written permission from Frost & Sullivan.
For information regarding permission, write to:
Frost & Sullivan 7th Floor, Karumuttu Center 498, Anna Salai Nandanam Chennai – 600 035 INDIA
2
Confidential To Export Promotion Council for Handicrafts © 2005 Frost & Sullivan
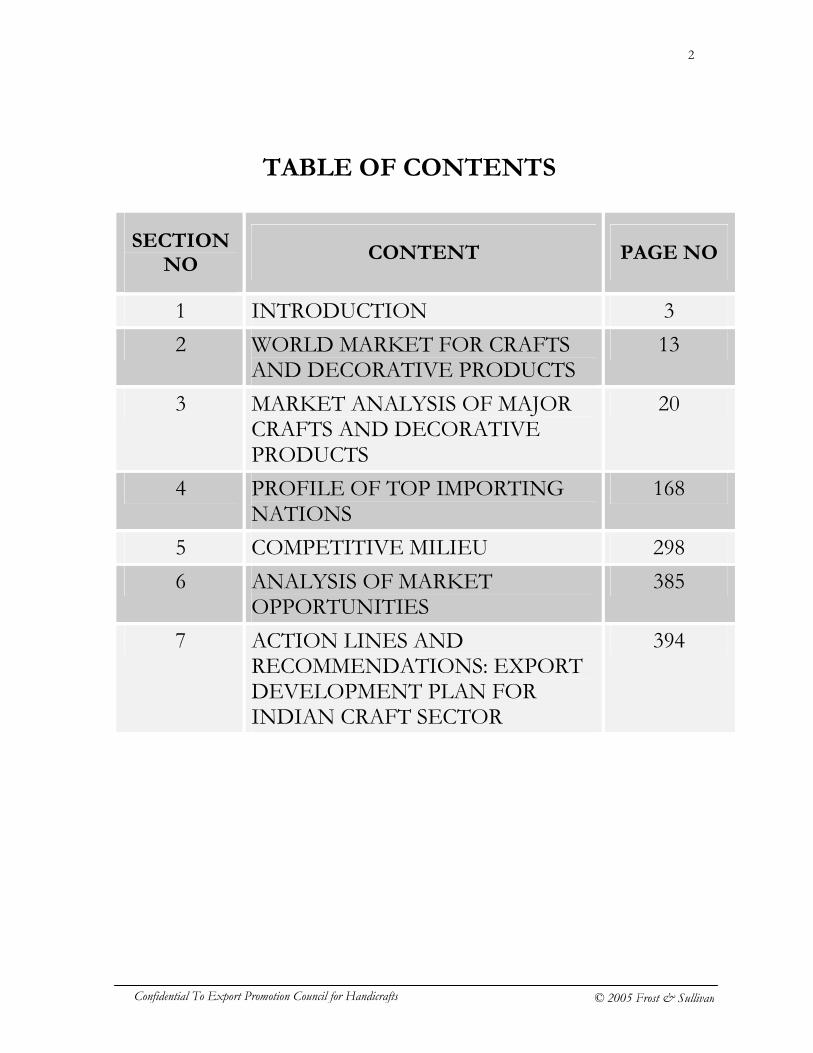
TABLE OF CONTENTS
SECTION NO
CONTENT PAGE NO
1 INTRODUCTION 3
2 WORLD MARKET FOR CRAFTS AND DECORATIVE PRODUCTS
13
3 MARKET ANALYSIS OF MAJOR CRAFTS AND DECORATIVE PRODUCTS
20
4 PROFILE OF TOP IMPORTING NATIONS
168
5 COMPETITIVE MILIEU 298
6 ANALYSIS OF MARKET OPPORTUNITIES
385
7 ACTION LINES AND RECOMMENDATIONS: EXPORT DEVELOPMENT PLAN FOR INDIAN CRAFT SECTOR
394
3
Confidential To Export Promotion Council for Handicrafts © 2005 Frost & Sullivan
SECTION 1 – INTRODUCTION 1.1 BACKGROUND a) Export Promotion Council for Handicrafts (EPCH) is a non-profit organization
established under the Exim Policy of Govt. of India in 1986-87. EPCH is the apex organization of trade, industry and government of India for promotion of handicrafts from India.
b) The Council continuously works toward promoting Indian handicraft products and
project India's image abroad as a reliable supplier of high quality of handicraft goods and services. The Council has created necessary infrastructure as well as marketing and information facilities, which are availed both by the member exporters and importers.
c) Currently, some of the spectrum of activities that EPCH takes up include,
� Provide commercially useful information and assistance to members � Offer professional advice and services to members in areas of technology
upgradation, quality and design improvement, standards and specifications, product development, innovation, etc.
� Organise overseas visits for its members to explore opportunities in international markets.
� Participate in international trade fairs for crafts and decorative products. � Organise Indian Handicrafts and Gifts Fair in New Delhi. � Coordinate between exporting community and government, at central and state
levels, and so on. d) The primary result that the Council aims to achieve through all of the aforesaid
activities is to increase India’s revenues from handicraft exports, penetrate major international markets and increase India’s share in world exports of handicraft products.
e) Though this result, the Council aims to address another important issue that has a
major economic implication on the country – employment in semi-urban and rural areas. The Council believes that measures taken to drive exports will help in creating and sustaining employment in these pockets of the country.
f) To achieve this, the Council is working on many strategic initiatives that aim to give
fillip to export promotion and bring India to the forefront.
4
Confidential To Export Promotion Council for Handicrafts © 2005 Frost & Sullivan
g) The “Integrated International Marketing Project” conceptualised by EPCH, under the Market Access Initiative (MAI) scheme of the Ministry of Commerce, Government of India, is a major initiative in this direction.
h) The main objective of the project is to provide support to cottage, small scale and
SMEs engaged in exports of handicrafts in their marketing efforts through long-term planning and creation of support facilities.
i) To achieve its objectives the Council commissioned Frost & Sullivan, a global
growth consulting company, to study the world market for handicrafts and develop a business plan for Indian handicrafts exports.
j) Based on the terms of references given by EPCH, Frost & Sullivan prepared a
detailed proposal outlining the key deliverables of the project. k) This report features the detailed findings and their implications for EPCH. Frost &
Sullivan has set forth a set of detailed recommendations for EPCH’s consideration. l) This report aims to be a stand-alone document that is complete and reasonably
categorical in nature.
5
Confidential To Export Promotion Council for Handicrafts © 2005 Frost & Sullivan
1.2 TERMS OF REFERENCE AND OBJECTIVES OF THE STUDY
1.2.1 TERMS OF REFERENCE
The terms of reference set forth by EPCH for the study are as follows :-
I) Quality and price of similar products from other countries.
This would inter-alia include product market relationship, trade data of target countries, price competitiveness of Indian products and volumes, income elasticity, price elasticity and cross elasticity.
II) Calculation of costs for similar products from various competitive countries, landed in target countries including duties.
This would inter-alia include break of expenses like, rental, legal utilities and maintenance, salary and wages, taxes, promotion, operative, duty, campaign etc.
III) Regulatory barriers.
This would inter-alia include country-wise non-tariff barriers and estimation of opportunities lost and measures needed.
IV) Market size and volumes.
This would inter-alia include the number and location of warehouses and retail units, identification of product groups, focus and trends, channels of distribution. � Market reception for new design / product / companies
This would inter-alia include process and methodology of brand launch, department stores etc.
� Typical payment terms for imports wholesale and retail � Typical shipping terms � Price / Inflation relationship in target countries � Seasonal cultural factors
V) Major expansion plan of exporters and capacities.
This would inter-alia include contemporary and traditional financial arrangements for exporters participation.
VI) Major promotional campaign of competitor countries.
6
Confidential To Export Promotion Council for Handicrafts © 2005 Frost & Sullivan
This would inter-alia include existing brands, brand value, brand capitalization in target countries.
VII) Major export measures of other exporter countries.
This would inter-alia include channels for media presentations.
VIII) Natural “allies” and supporters.
This would inter-alia include short listing of international collaborators and partners.
1.2.2 OBJECTIVES OF THE STUDY Based on the terms of reference, Frost & Sullivan defined the objectives for the study as follows: -
a) To study the world market for crafts and decorative products and arrive at the
current effective market for crafts and decorative products, in value terms, over the last 5 years.
b) Further, study the world market for in detail in order to
� Arrive at the world market for various individual crafts and decorative product categories, and assess their rate of growth over the last 5 years.
� To identify the major markets (importing nations) for the various craft and
decorative product categories across the world
� To understand the trend in imports of various product categories in the major markets over the last 5 years.
� To gain comprehensive insights into what products categories are in demand in
the major markets and who are the major suppliers of these product categories. c) This exercise intends to identify the top markets for various specific product
categories to facilitate the ‘product-market mapping’ exercise. d) To identify the major exporters (exporting nations) for the various craft and
decorative product categories across the world.
7
Confidential To Export Promotion Council for Handicrafts © 2005 Frost & Sullivan
e) To gain comprehensive insights into the portfolio of craft and decorative product categories exported by the major nations, and which product categories form bulk of the exports of these nations.
f) To examine trade data of various countries to decipher the underlying pattern of
export and import by value, of different product categories. This aids in identifying and categorising countries in different leagues for the purpose of benchmarking and drawing up strategies specific to markets and competition
g) To assess and evaluate the level of competition among the major exporters of
various craft product categories, especially the threat and degree of competition that India faces from other Asian countries over the last few years
h) To gain comprehensive insights into the various aspects of the consumers in the
major markets, such as,
� Consumer preferences � Impact of standard of living and availability of disposable income � Influence of cultural, social factors, etc.
i) To understand the distribution structure, and different trade channels that exist in
the markets, new and alternate channels that have come up in the last few years in the target markets.
j) To obtain information on the nature and quantum of market development and
product promotion efforts that are required to do well in the major markets, and new and innovative platforms that have come up in the last few years.
k) To understand the role of showrooms in the major markets in the US and Europe,
in terms of
� The extent of impact it has on the sales of craft and decorative products � The impact it has on promoting the country of origin as a brand � How good a platform it is to promote a brand � Whether effective are showrooms in bringing buyers and sellers on one
platform Based on answers for the above, and assessment of the markets, the aims to identify appropriate locations for setting up showrooms in the major markets
l) To obtain information on market access requirements, tariff and non-tariff barriers,
and other entry barriers that exist, if any.
8
Confidential To Export Promotion Council for Handicrafts © 2005 Frost & Sullivan
m) To understand the requirements and competencies that an exporting nation should possess in the areas of logistics and warehousing in various markets.
n) To provide other inputs that will aid in evolving a winning marketing and
competitive strategy for the handicraft sector in order to � Grow the market for its products � Penetrate the major markets at a faster pace than competition and establish itself
in such markets � Offer the ideal mix of products in terms of what the market demands � Maximise return on efforts by distributing products through right trade channels � Adopt new and innovative product promotion measures to increase sales � Develop a sound and effective brand building exercise
9
Confidential To Export Promotion Council for Handicrafts © 2005 Frost & Sullivan
1.3 CONSULTING APPROACH AND MARKET ESTIMATION METHODOLOGY
1.3.1 THE APPROACH a) The methodology adopted for the study involved: -
• Extensive Desk Research and Secondary Data Review • Focused Primary Research.
b) Desk Research involved a comprehensive review of a wide range of secondary
data relating to market for gifts and decorative products across major markets in North America and Europe, and also about exporting nations, especially the Asian countries such as China, Taiwan, Malaysia, Vietnam, Philippines, Thailand, etc.
c) Furthermore, during the study we accessed a wide range of published sources
including PC-TAS (the Trade Analysis System for Personal Computers) of the International Trade Centre, Geneva for all information pertaining to international trade. This information is primarily derived from the COMTRADE, the trade database of the United Nations Statistics Division, which covers over 90% of the world trade.
d) The world trade of crafts and decorative products is derived from the international
trade data for individual products categories. The data pertaining to individual products is identified based on the standard international harmonised system codes.
e) Primary Research entailed contacting a spectrum of entities comprising
Manufacturers, Exporters, Trade Promotion Bodies, Associations, Government Bodies, Export Promotion Councils, Importers, Buyers, Distributors, and Trade Channel Entities such as like large retail chains, speciality stores, departmental store, retailers, catalogue companies, agents, sales representatives, etc.
f) In the primary research component, information was obtained from relevant
individuals in each respondent category through loosely structured interviews/ discussions. Each interview was structured around a discussion guide. Discussion guides were developed separately for each respondent category.
g) The data obtained during the course of the study, both qualitative and quantitative
in nature have been collated and analysed extensively in line with the research objectives.
10
Confidential To Export Promotion Council for Handicrafts © 2005 Frost & Sullivan
1.3.2 MARKET SIZE ESTIMATION METHODOLOGY a) The world market for handicrafts is in a state of transition. The growing influx of
look-alike, low-cost, fully or partly mechanized crafts and decorative products from countries such as China, Hong Kong, and Taiwan, has penetrated and thereby affected the market for traditional hand crafted products.
b) Exports by most traditional craft products exporting nations include a variety of
products across categories such as textile clothing/accessories, furnishing, stationery and other houseware/household items, which include hand-crafted, semi-handcrafted and machine made goods.
c) Thus, the incursion of machine made craft products and semi-handcrafted products
has rendered the task of sizing the absolute market for handicraft products, a difficult task. Further, the fact that craft products are identified and categorized under the broader market for ‘gifts and decorative products’ have made this exercise a task difficult.
d) Therefore, it is imperative to view handicrafts as part of the larger market for craft
products, which in turn is part of ‘gifts and decorative’ market. e) This way, the predominantly handcrafted products from India compete with
products that are not only handcrafted but also semi-handcrafted and machine made. Since these products are perceived to offer the same decorative and utility value, these products vie for consumer attention in the broader market for gifts and decorative.
f) Based on detailed preliminary desk research and deliberations with EPCH, Frost &
Sullivan came up with a list of product categories for further research. World trade data for these product categories was obtained from the international trade database from International Trade Center, PC-TAS, which in turn is derived from the COMTRADE, the trade database of the United Nations Statistics Division.
g) PC-TAS is the only database available for information on world trade. It uses an
internationally prevalent 6 digit HS code system for classifying import export data. Considering the fact that this system has its own limitations and no separate category for gifts and decorative products, per se exist, Frost & Sullivan, based on thorough initial work, identified products within the 6 digit HS code framework that best fits the descriptions for gifts and decorative products. This includes products that are fully handcrafted, semi-handcrafted and machine crafted products.
h) The latest world trade data is available for the year 2003. Hence, all market size
details featuring in this report are only up to 2003.
11
Confidential To Export Promotion Council for Handicrafts © 2005 Frost & Sullivan
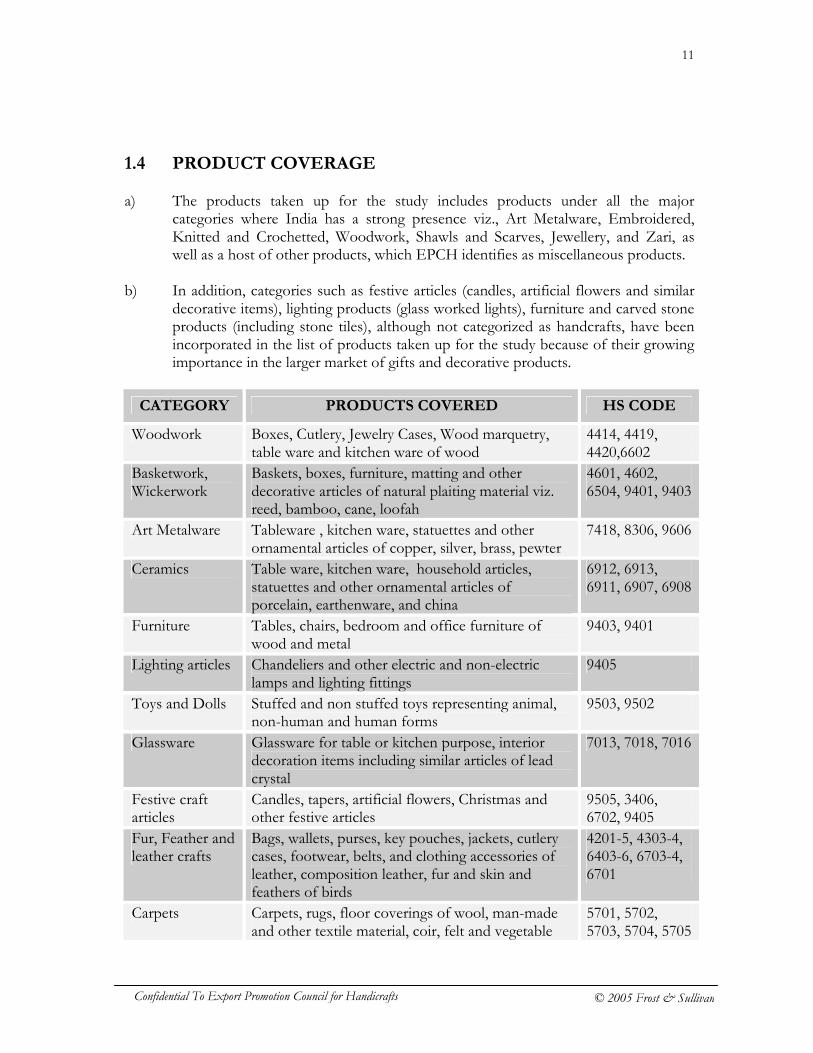
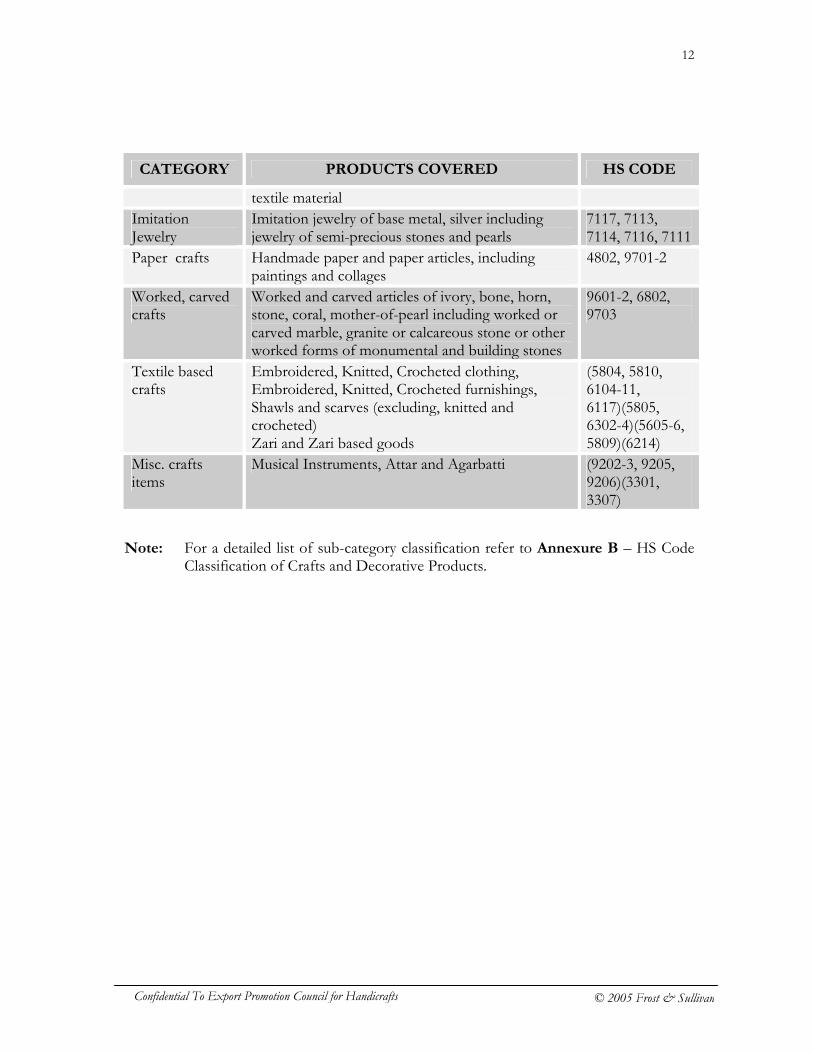
1.4 PRODUCT COVERAGE a) The products taken up for the study includes products under all the major
categories where India has a strong presence viz., Art Metalware, Embroidered, Knitted and Crochetted, Woodwork, Shawls and Scarves, Jewellery, and Zari, as well as a host of other products, which EPCH identifies as miscellaneous products.
b) In addition, categories such as festive articles (candles, artificial flowers and similar
decorative items), lighting products (glass worked lights), furniture and carved stone products (including stone tiles), although not categorized as handcrafts, have been incorporated in the list of products taken up for the study because of their growing importance in the larger market of gifts and decorative products.
CATEGORY PRODUCTS COVERED HS CODE
Woodwork Boxes, Cutlery, Jewelry Cases, Wood marquetry, table ware and kitchen ware of wood
4414, 4419, 4420,6602
Basketwork, Wickerwork
Baskets, boxes, furniture, matting and other decorative articles of natural plaiting material viz. reed, bamboo, cane, loofah
4601, 4602, 6504, 9401, 9403
Art Metalware Tableware , kitchen ware, statuettes and other ornamental articles of copper, silver, brass, pewter
7418, 8306, 9606
Ceramics Table ware, kitchen ware, household articles, statuettes and other ornamental articles of porcelain, earthenware, and china
6912, 6913, 6911, 6907, 6908
Furniture Tables, chairs, bedroom and office furniture of wood and metal
9403, 9401
Lighting articles Chandeliers and other electric and non-electric lamps and lighting fittings
9405
Toys and Dolls Stuffed and non stuffed toys representing animal, non-human and human forms
9503, 9502
Glassware Glassware for table or kitchen purpose, interior decoration items including similar articles of lead crystal
7013, 7018, 7016
Festive craft articles
Candles, tapers, artificial flowers, Christmas and other festive articles
9505, 3406, 6702, 9405
Fur, Feather and leather crafts
Bags, wallets, purses, key pouches, jackets, cutlery cases, footwear, belts, and clothing accessories of leather, composition leather, fur and skin and feathers of birds
4201-5, 4303-4, 6403-6, 6703-4, 6701
Carpets Carpets, rugs, floor coverings of wool, man-made and other textile material, coir, felt and vegetable
5701, 5702, 5703, 5704, 5705
12
Confidential To Export Promotion Council for Handicrafts © 2005 Frost & Sullivan
CATEGORY PRODUCTS COVERED HS CODE
textile material Imitation Jewelry
Imitation jewelry of base metal, silver including jewelry of semi-precious stones and pearls
7117, 7113, 7114, 7116, 7111
Paper crafts Handmade paper and paper articles, including paintings and collages
4802, 9701-2
Worked, carved crafts
Worked and carved articles of ivory, bone, horn, stone, coral, mother-of-pearl including worked or carved marble, granite or calcareous stone or other worked forms of monumental and building stones
9601-2, 6802, 9703
Textile based crafts
Embroidered, Knitted, Crocheted clothing, Embroidered, Knitted, Crocheted furnishings, Shawls and scarves (excluding, knitted and crocheted) Zari and Zari based goods
(5804, 5810, 6104-11, 6117)(5805, 6302-4)(5605-6, 5809)(6214)
Misc. crafts items
Musical Instruments, Attar and Agarbatti (9202-3, 9205, 9206)(3301, 3307)
Note: For a detailed list of sub-category classification refer to Annexure B – HS Code
Classification of Crafts and Decorative Products.
13
Confidential To Export Promotion Council for Handicrafts © 2005 Frost & Sullivan
SECTION 2 – WORLD MARKET FOR CRAFTS AND DECORATIVE PRODUCTS
2.1 OVERVIEW OF THE CURRENT WORLD MARKET FOR
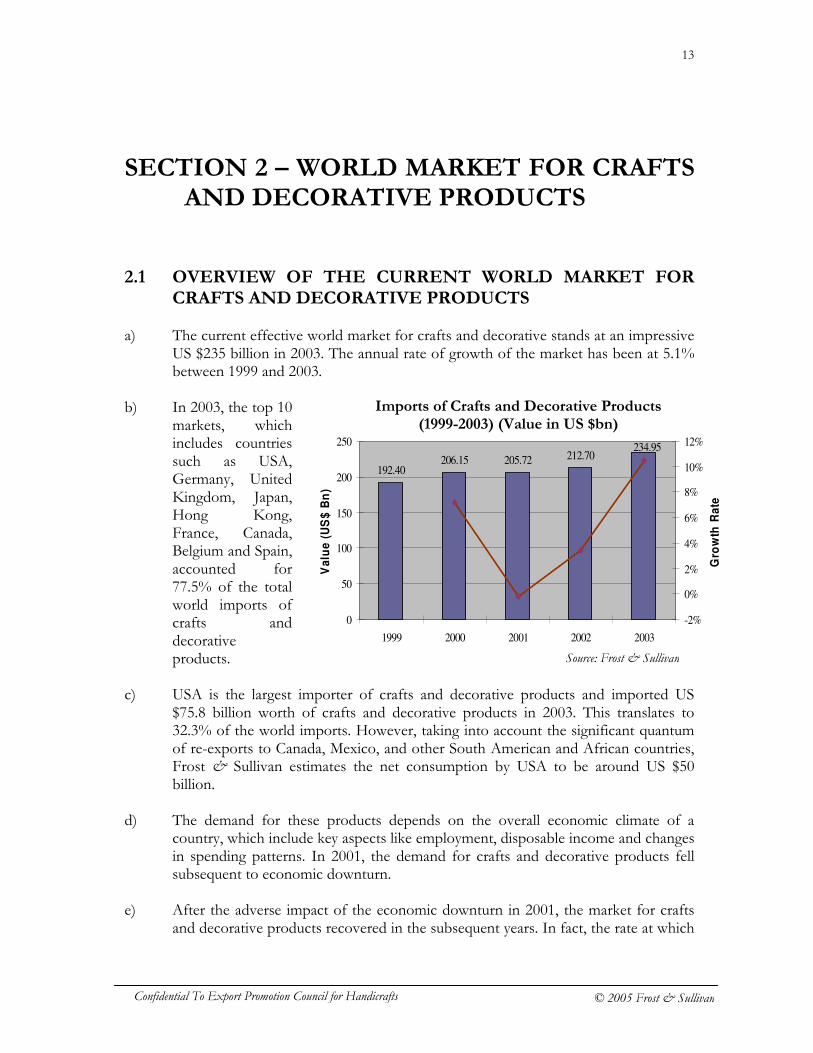
CRAFTS AND DECORATIVE PRODUCTS a) The current effective world market for crafts and decorative stands at an impressive
US $235 billion in 2003. The annual rate of growth of the market has been at 5.1% between 1999 and 2003.
b) In 2003, the top 10
markets, which includes countries such as USA, Germany, United Kingdom, Japan, Hong Kong, France, Canada, Belgium and Spain, accounted for 77.5% of the total world imports of crafts and decorative products.
c) USA is the largest importer of crafts and decorative products and imported US
$75.8 billion worth of crafts and decorative products in 2003. This translates to 32.3% of the world imports. However, taking into account the significant quantum of re-exports to Canada, Mexico, and other South American and African countries, Frost & Sullivan estimates the net consumption by USA to be around US $50 billion.
d) The demand for these products depends on the overall economic climate of a
country, which include key aspects like employment, disposable income and changes in spending patterns. In 2001, the demand for crafts and decorative products fell subsequent to economic downturn.
e) After the adverse impact of the economic downturn in 2001, the market for crafts
and decorative products recovered in the subsequent years. In fact, the rate at which
192.40206.15 205.72 212.70
234.95
0
50
100
150
200
250
1999 2000 2001 2002 2003
Va
lue
(U
S$
Bn
)
-2%
0%
2%
4%
6%
8%
10%
12%
Gro
wth
Ra
te
Source: Frost & Sullivan
Imports of Crafts and Decorative Products (1999-2003) (Value in US $bn)
14
Confidential To Export Promotion Council for Handicrafts © 2005 Frost & Sullivan
the market has grown post 2001 is relatively better than growth rate of the previous years.
f) The demand for craft products post 2001 is mainly attributed to the changing trend
in buying inexpensive gifts and decorative products made in China and other Asian countries.
g) Imports by countries like Japan and many European countries like UK, France,
Italy, Spain and Belgium have also increased. Factors such as rising disposable incomes, favorable changes in demographic profile and most importantly shift in consumer spend on gifts and decorative have been driving the demand for crafts and decorative products.
h) Concerted efforts by exporters – especially China and other Asian countries – to
develop the markets by way of flooding the market with low price products together with augmented market reach has contributed to market growth to a great extent.
i) Despite the fact that USA is the largest market, the European Union (EU), viewed
as a trading block, is fast emerging as a very attractive destination for crafts and decorative products. The 25 countries that constitute the European Union, account for 40% of the world imports.
j) Two important things need to be taken into account when examining the
opportunities the EU offers. Firstly, the rising appeal for one-of-a-kind decorative products in the EU markets. Secondly, intra-trade within EU countries is declining. Both the factors have translated into opportunities, specifically in the form of contract manufacturing, for Asian countries. In addition, the fair trade system has complemented the entire phenomenon and has helped the Asian countries penetrate these markets to a greater extent.
k) Bulk of the imports by USA is low value products, whereas in case of the EU
countries it is mostly medium to high value products. However, the incursion of low-cost products from Asian countries has made these markets highly competitive.
l) On the other hand, Japan, which accounts for 6.5% of the world market, is
relatively less competitive. Consumers here are willing to pay better prices for unique handcrafted products especially those originating from developing Asian countries.
15
Confidential To Export Promotion Council for Handicrafts © 2005 Frost & Sullivan
2.2 KEY MARKET TRENDS a) Driven by positive changes in major markets like USA and Europe, the world crafts
and decorative market has been witnessing a good growth from 2001 onwards. Currently, the USA and EU account for about 70% of the world imports of crafts and decorative products. The rising levels of consumer disposable incomes in these traditional markets together with the tendency to accessorize and re-style homes with unique articles are the major driving factors for the surge in demand for crafts and decorative products.
b) However, the demand is more for low price products, which are usually machine
made. Exporters are at their best in delivering products low price products that match consumer preferences. As a result, the market is becoming highly price competitive in the low and medium value market segments.
c) Currently, the market is more oriented toward fashionable products and hence,
prone to impulse purchases, which result in shorter product cycles. d) Another significant change is the surge in contract manufacturing arrangements
between EU and Asian countries like China, Hong Kong and Taiwan. As a result, these countries, which have been doing well on basic factors of production like labor and raw material, are now exposed to sophisticated designing, manufacturing processes, technology, product requirements and standards, and consumer preferences.
e) This has enabled a country like China to leverage its inherent strengths like
availability of abundant and quality labor, and raw material, to become the single largest exporter with a market share of about 30% in the total world exports in 2003.
16
Confidential To Export Promotion Council for Handicrafts © 2005 Frost & Sullivan
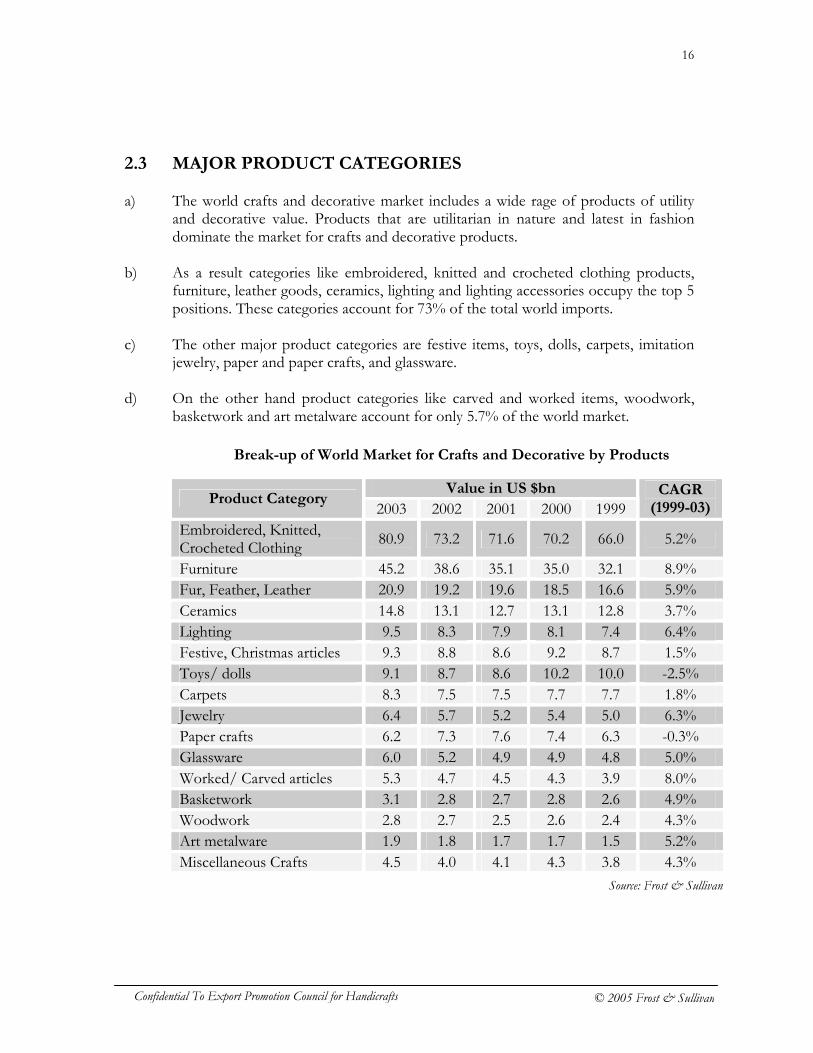
2.3 MAJOR PRODUCT CATEGORIES a) The world crafts and decorative market includes a wide rage of products of utility
and decorative value. Products that are utilitarian in nature and latest in fashion dominate the market for crafts and decorative products.
b) As a result categories like embroidered, knitted and crocheted clothing products,
furniture, leather goods, ceramics, lighting and lighting accessories occupy the top 5 positions. These categories account for 73% of the total world imports.
c) The other major product categories are festive items, toys, dolls, carpets, imitation
jewelry, paper and paper crafts, and glassware. d) On the other hand product categories like carved and worked items, woodwork,
basketwork and art metalware account for only 5.7% of the world market.
Value in US $bn
Product Category 2003 2002 2001 2000 1999
CAGR (1999-03)
Embroidered, Knitted, Crocheted Clothing
80.9 73.2 71.6 70.2 66.0 5.2%
Furniture 45.2 38.6 35.1 35.0 32.1 8.9% Fur, Feather, Leather 20.9 19.2 19.6 18.5 16.6 5.9% Ceramics 14.8 13.1 12.7 13.1 12.8 3.7% Lighting 9.5 8.3 7.9 8.1 7.4 6.4% Festive, Christmas articles 9.3 8.8 8.6 9.2 8.7 1.5% Toys/ dolls 9.1 8.7 8.6 10.2 10.0 -2.5% Carpets 8.3 7.5 7.5 7.7 7.7 1.8% Jewelry 6.4 5.7 5.2 5.4 5.0 6.3% Paper crafts 6.2 7.3 7.6 7.4 6.3 -0.3% Glassware 6.0 5.2 4.9 4.9 4.8 5.0% Worked/ Carved articles 5.3 4.7 4.5 4.3 3.9 8.0% Basketwork 3.1 2.8 2.7 2.8 2.6 4.9% Woodwork 2.8 2.7 2.5 2.6 2.4 4.3% Art metalware 1.9 1.8 1.7 1.7 1.5 5.2% Miscellaneous Crafts 4.5 4.0 4.1 4.3 3.8 4.3%
Break-up of World Market for Crafts and Decorative by Products
Source: Frost & Sullivan
17
Confidential To Export Promotion Council for Handicrafts © 2005 Frost & Sullivan
WORLD IMPORTS (2003)
19.63 18.2515.31 14.97 13.59
7.815.71 5.60 5.42 5.27 5.22 3.73 2.79 2.73 2.51 2.43 2.32 1.79 1.78
75.84
0
10
20
30
40
50
60
70
80
US
A,P
R,U
SV
I
GE
RM
AN
Y
UN
TD
KIN
GD
OM
JA
PA
N
HO
NG
KO
NG
FR
AN
CE
ITA
LY
CA
NA
DA
BE
LG
IUM
SP
AIN
NE
TH
ER
LA
ND
S
SW
ITZ
.LIE
CH
T
AU
ST
RIA
ME
XIC
O
AU
ST
RA
LIA
SW
ED
EN
DE
NM
AR
K
KO
RE
A R
EP
.
SIN
GA
PO
RE
NO
RW
AY
VA
LU
E (
US
$ B
n)
0.0%
5.0%
10.0%
15.0%
20.0%
25.0%
30.0%
CA
GR
(1999-2
003)
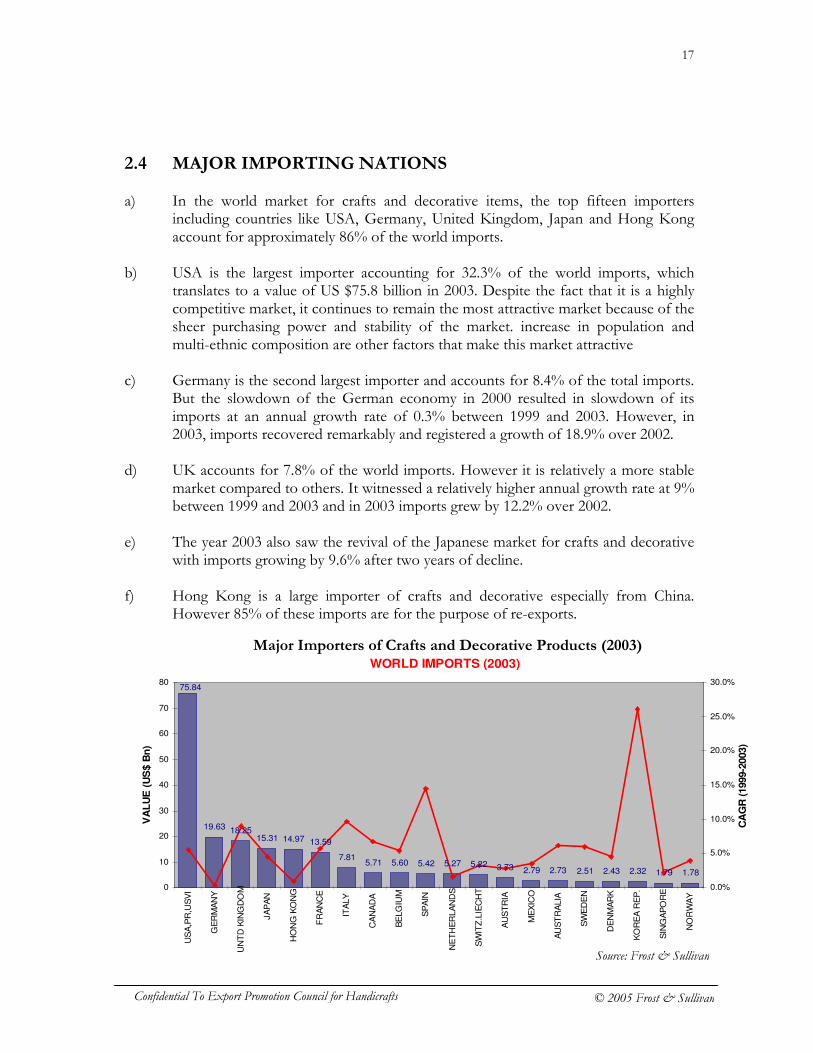
2.4 MAJOR IMPORTING NATIONS a) In the world market for crafts and decorative items, the top fifteen importers
including countries like USA, Germany, United Kingdom, Japan and Hong Kong account for approximately 86% of the world imports.
b) USA is the largest importer accounting for 32.3% of the world imports, which
translates to a value of US $75.8 billion in 2003. Despite the fact that it is a highly competitive market, it continues to remain the most attractive market because of the sheer purchasing power and stability of the market. increase in population and multi-ethnic composition are other factors that make this market attractive
c) Germany is the second largest importer and accounts for 8.4% of the total imports. But the slowdown of the German economy in 2000 resulted in slowdown of its imports at an annual growth rate of 0.3% between 1999 and 2003. However, in 2003, imports recovered remarkably and registered a growth of 18.9% over 2002.
d) UK accounts for 7.8% of the world imports. However it is relatively a more stable
market compared to others. It witnessed a relatively higher annual growth rate at 9% between 1999 and 2003 and in 2003 imports grew by 12.2% over 2002.
e) The year 2003 also saw the revival of the Japanese market for crafts and decorative
with imports growing by 9.6% after two years of decline. f) Hong Kong is a large importer of crafts and decorative especially from China.
However 85% of these imports are for the purpose of re-exports.
Major Importers of Crafts and Decorative Products (2003)
Source: Frost & Sullivan
18
Confidential To Export Promotion Council for Handicrafts © 2005 Frost & Sullivan
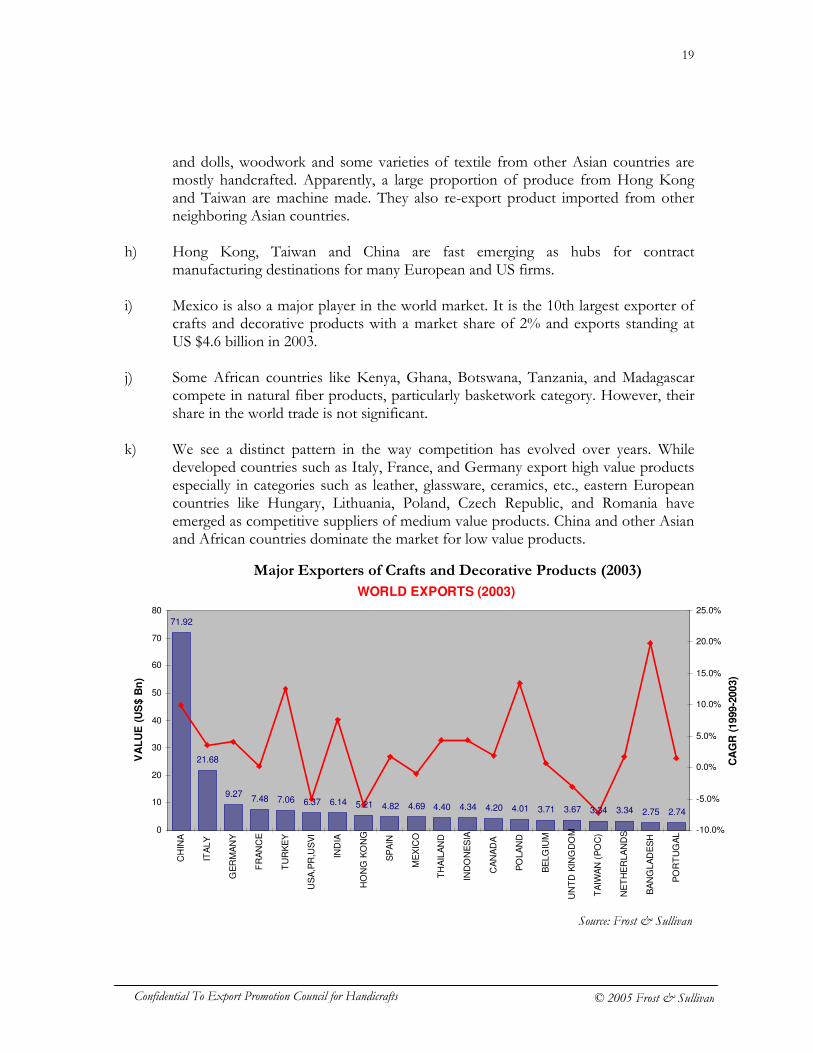
2.5 MAJOR EXPORTING NATIONS a) China, Italy, Germany, France, Turkey, USA, India, Hong Kong, Spain and Mexico
are the top ten exporters of crafts and decorative products in 2003. b) China is the largest exporter of craft and decorative products in the year 2003.
China’s ability to supply large volume and wide range of low-cost products has pushed in the forefront of competition. With a whopping US $71.9 billion in exports, it controls a 30% share in the world market of crafts and decorative products.
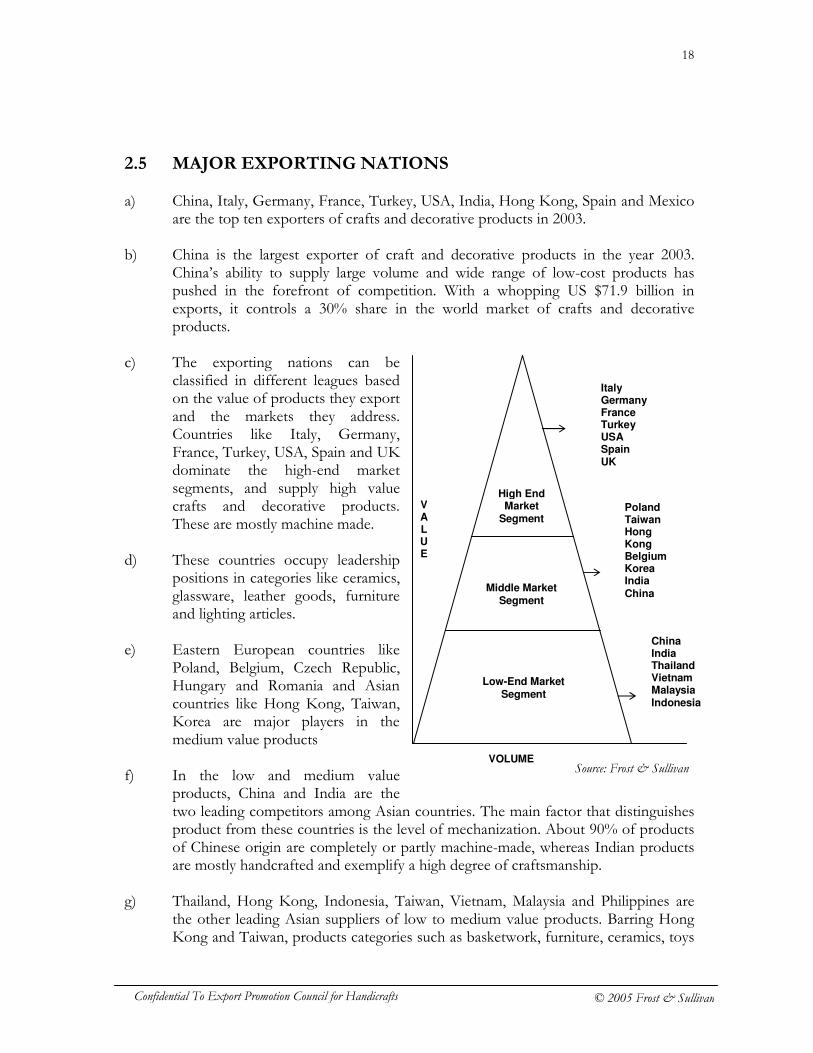
c) The exporting nations can be
classified in different leagues based on the value of products they export and the markets they address. Countries like Italy, Germany, France, Turkey, USA, Spain and UK dominate the high-end market segments, and supply high value crafts and decorative products. These are mostly machine made.
d) These countries occupy leadership
positions in categories like ceramics, glassware, leather goods, furniture and lighting articles.
e) Eastern European countries like
Poland, Belgium, Czech Republic, Hungary and Romania and Asian countries like Hong Kong, Taiwan, Korea are major players in the medium value products
f) In the low and medium value
products, China and India are the two leading competitors among Asian countries. The main factor that distinguishes product from these countries is the level of mechanization. About 90% of products of Chinese origin are completely or partly machine-made, whereas Indian products are mostly handcrafted and exemplify a high degree of craftsmanship.
g) Thailand, Hong Kong, Indonesia, Taiwan, Vietnam, Malaysia and Philippines are
the other leading Asian suppliers of low to medium value products. Barring Hong Kong and Taiwan, products categories such as basketwork, furniture, ceramics, toys
Source: Frost & Sullivan
Italy Germany France Turkey USA Spain UK
Poland Taiwan Hong Kong Belgium Korea India China
China India Thailand Vietnam Malaysia Indonesia
Middle Market Segment
High End Market
Segment
Low-End Market Segment
V A L U E
VOLUME
19
Confidential To Export Promotion Council for Handicrafts © 2005 Frost & Sullivan
and dolls, woodwork and some varieties of textile from other Asian countries are mostly handcrafted. Apparently, a large proportion of produce from Hong Kong and Taiwan are machine made. They also re-export product imported from other neighboring Asian countries.
h) Hong Kong, Taiwan and China are fast emerging as hubs for contract
manufacturing destinations for many European and US firms. i) Mexico is also a major player in the world market. It is the 10th largest exporter of
crafts and decorative products with a market share of 2% and exports standing at US $4.6 billion in 2003.
j) Some African countries like Kenya, Ghana, Botswana, Tanzania, and Madagascar
compete in natural fiber products, particularly basketwork category. However, their share in the world trade is not significant.
k) We see a distinct pattern in the way competition has evolved over years. While
developed countries such as Italy, France, and Germany export high value products especially in categories such as leather, glassware, ceramics, etc., eastern European countries like Hungary, Lithuania, Poland, Czech Republic, and Romania have emerged as competitive suppliers of medium value products. China and other Asian and African countries dominate the market for low value products.
WORLD EXPORTS (2003)
71.92
21.68
9.277.48 7.06 6.37 6.14 5.21 4.82 4.69 4.40 4.34 4.20 4.01 3.71 3.67 3.34 3.34 2.75 2.74
0
10
20
30
40
50
60
70
80
CH
INA
ITA
LY
GE
RM
AN
Y
FR
AN
CE
TU
RK
EY
US
A,P
R,U
SV
I
IND
IA
HO
NG
KO
NG
SP
AIN
ME
XIC
O
TH
AIL
AN
D
IND
ON
ES
IA
CA
NA
DA
PO
LA
ND
BE
LG
IUM
UN
TD
KIN
GD
OM
TA
IWA
N (
PO
C)
NE
TH
ER
LA
ND
S
BA
NG
LA
DE
SH
PO
RT
UG
AL
VA
LU
E (
US
$ B
n)
-10.0%
-5.0%
0.0%
5.0%
10.0%
15.0%
20.0%
25.0%
CA
GR
(1999-2
003)
Major Exporters of Crafts and Decorative Products (2003)
Source: Frost & Sullivan
20
Confidential To Export Promotion Council for Handicrafts © 2005 Frost & Sullivan
SECTION 3 – MARKET ANALYSIS OF MAJOR CRAFTS AND DECORATIVE PRODUCTS
3.1 EMBROIDERED, KNITTED AND CROCHETED –
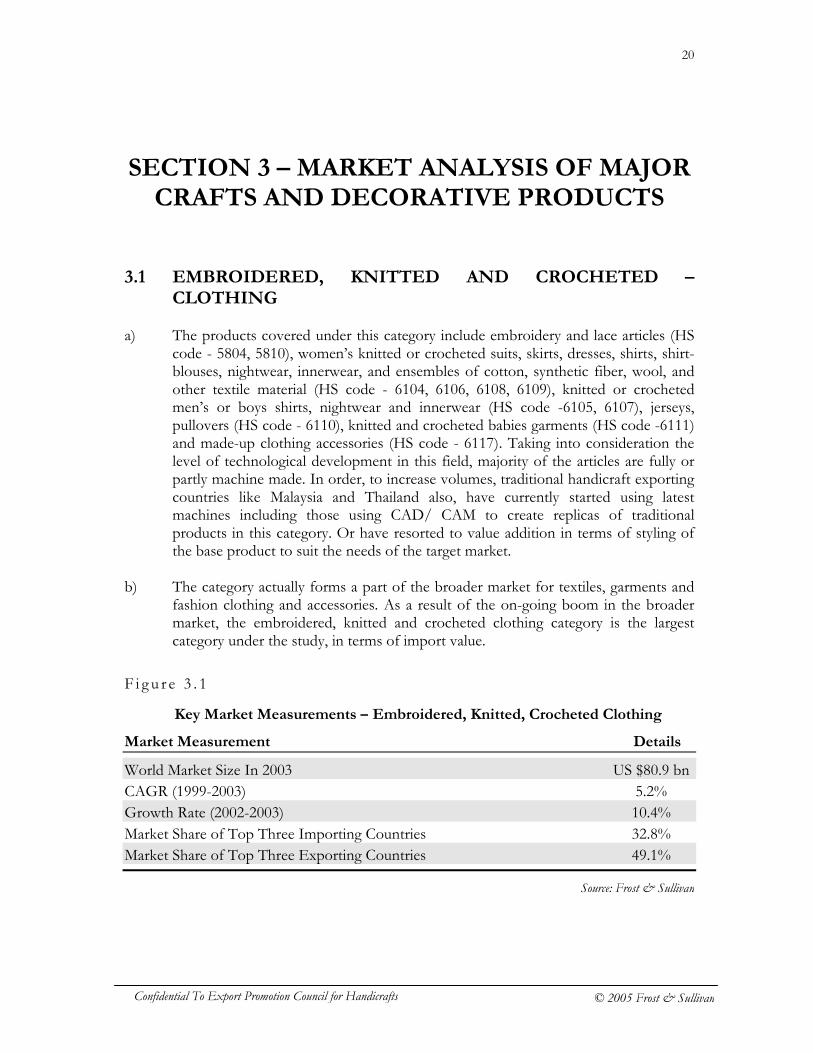
CLOTHING a) The products covered under this category include embroidery and lace articles (HS
code - 5804, 5810), women’s knitted or crocheted suits, skirts, dresses, shirts, shirt-blouses, nightwear, innerwear, and ensembles of cotton, synthetic fiber, wool, and other textile material (HS code - 6104, 6106, 6108, 6109), knitted or crocheted men’s or boys shirts, nightwear and innerwear (HS code -6105, 6107), jerseys, pullovers (HS code - 6110), knitted and crocheted babies garments (HS code -6111) and made-up clothing accessories (HS code - 6117). Taking into consideration the level of technological development in this field, majority of the articles are fully or partly machine made. In order, to increase volumes, traditional handicraft exporting countries like Malaysia and Thailand also, have currently started using latest machines including those using CAD/ CAM to create replicas of traditional products in this category. Or have resorted to value addition in terms of styling of the base product to suit the needs of the target market.
b) The category actually forms a part of the broader market for textiles, garments and
fashion clothing and accessories. As a result of the on-going boom in the broader market, the embroidered, knitted and crocheted clothing category is the largest category under the study, in terms of import value.
F i g u r e 3 . 1
Market Measurement Details
World Market Size In 2003 US $80.9 bn CAGR (1999-2003) 5.2% Growth Rate (2002-2003) 10.4% Market Share of Top Three Importing Countries 32.8% Market Share of Top Three Exporting Countries 49.1%
Source: Frost & Sullivan
Key Market Measurements – Embroidered, Knitted, Crocheted Clothing
21
Confidential To Export Promotion Council for Handicrafts © 2005 Frost & Sullivan
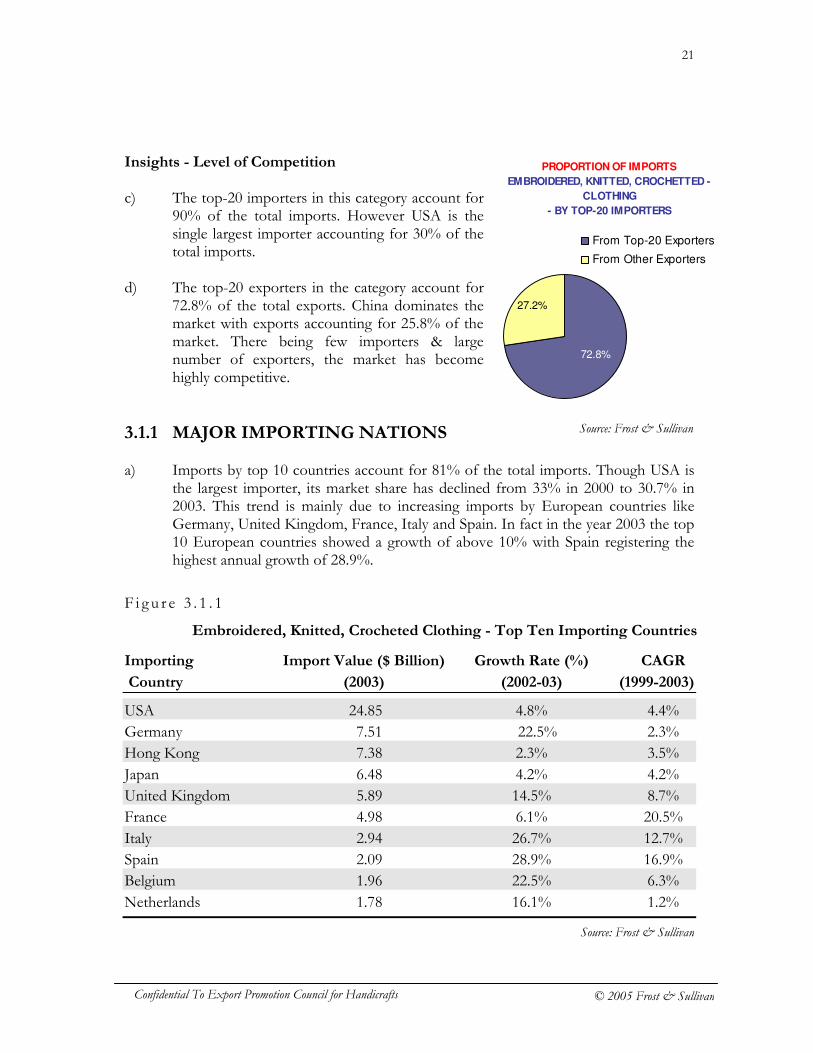
Insights - Level of Competition c) The top-20 importers in this category account for
90% of the total imports. However USA is the single largest importer accounting for 30% of the total imports.
d) The top-20 exporters in the category account for
72.8% of the total exports. China dominates the market with exports accounting for 25.8% of the market. There being few importers & large number of exporters, the market has become highly competitive.
3.1.1 MAJOR IMPORTING NATIONS a) Imports by top 10 countries account for 81% of the total imports. Though USA is
the largest importer, its market share has declined from 33% in 2000 to 30.7% in 2003. This trend is mainly due to increasing imports by European countries like Germany, United Kingdom, France, Italy and Spain. In fact in the year 2003 the top 10 European countries showed a growth of above 10% with Spain registering the highest annual growth of 28.9%.
F i g u r e 3 . 1 . 1
Importing Import Value ($ Billion) Growth Rate (%) CAGR
Country (2003) (2002-03) (1999-2003)
USA 24.85 4.8% 4.4% Germany 7.51 22.5% 2.3% Hong Kong 7.38 2.3% 3.5% Japan 6.48 4.2% 4.2% United Kingdom 5.89 14.5% 8.7% France 4.98 6.1% 20.5% Italy 2.94 26.7% 12.7% Spain 2.09 28.9% 16.9% Belgium 1.96 22.5% 6.3% Netherlands 1.78 16.1% 1.2%
PROPORTION OF IMPORTS
EMBROIDERED, KNITTED, CROCHETTED -
CLOTHING
- BY TOP-20 IMPORTERS
27.2%
72.8%
From Top-20 Exporters
From Other Exporters
Embroidered, Knitted, Crocheted Clothing - Top Ten Importing Countries
Source: Frost & Sullivan
Source: Frost & Sullivan
22
Confidential To Export Promotion Council for Handicrafts © 2005 Frost & Sullivan
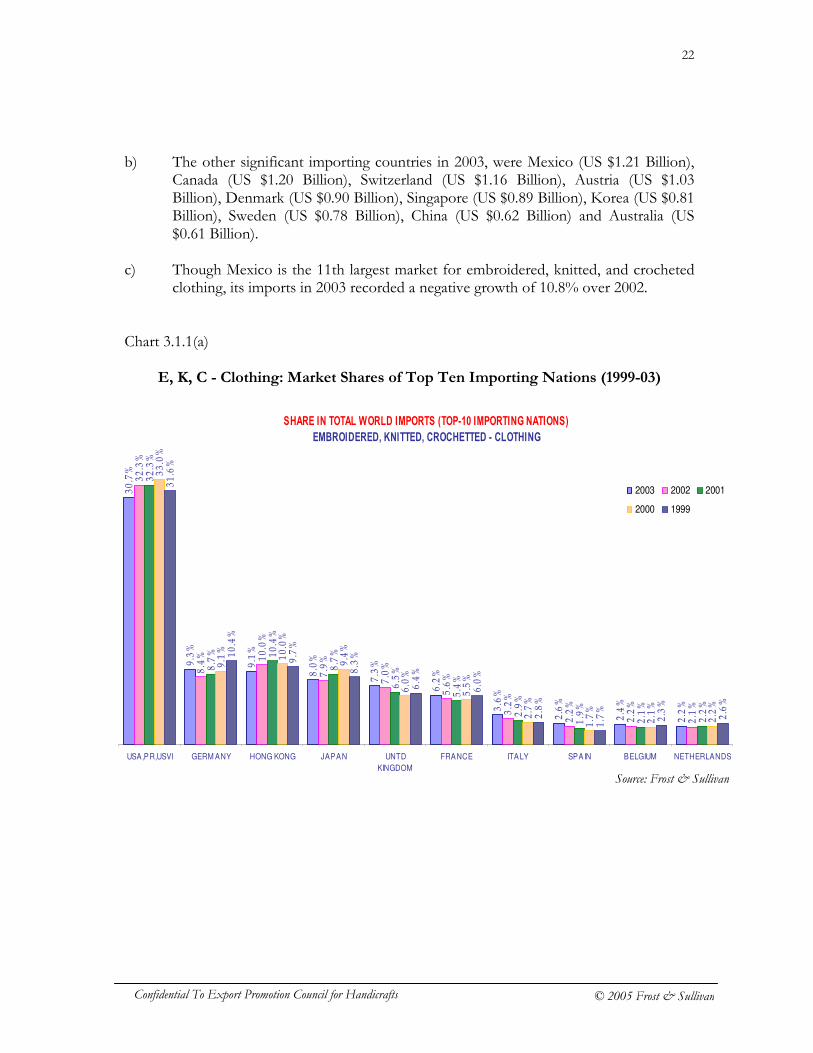
b) The other significant importing countries in 2003, were Mexico (US $1.21 Billion), Canada (US $1.20 Billion), Switzerland (US $1.16 Billion), Austria (US $1.03 Billion), Denmark (US $0.90 Billion), Singapore (US $0.89 Billion), Korea (US $0.81 Billion), Sweden (US $0.78 Billion), China (US $0.62 Billion) and Australia (US $0.61 Billion).
c) Though Mexico is the 11th largest market for embroidered, knitted, and crocheted
clothing, its imports in 2003 recorded a negative growth of 10.8% over 2002. Chart 3.1.1(a)
E, K, C - Clothing: Market Shares of Top Ten Importing Nations (1999-03)
SHARE IN TOTAL WORLD IMPORTS (TOP-10 IMPORTING NATIONS)
EMBROIDERED, KNITTED, CROCHETTED - CLOTHING
30.7%
9.3%
9.1%
8.0%
7.3%
6.2%
3.6%
2.6%
2.4%
32.3%
8.4% 10.0%
7.9%
7.0%
5.6%
3.2%
2.2%
2.2%
32.3%
8.7% 10.4%
8.7%
6.5%
5.4%
2.9%
1.9%
2.1%
2.2%
33.0%
9.1%
10.0%
9.4%
6.0%
5.5%
2.7%
1.7%
2.1%
31.6%
10.4%
9.7%
8.3%
6.4%
6.0%
2.8%
1.7%
2.3%
2.2%
2.1%
2.2%
2.6%
USA,PR,USVI GERM ANY HONG KONG JAPAN UNTD
KINGDOM
FRANCE ITALY SPAIN BELGIUM NETHERLANDS
2003 2002 2001
2000 1999
Source: Frost & Sullivan
23
Confidential To Export Promotion Council for Handicrafts © 2005 Frost & Sullivan
Cha r t 3 . 1 . 1 ( b )
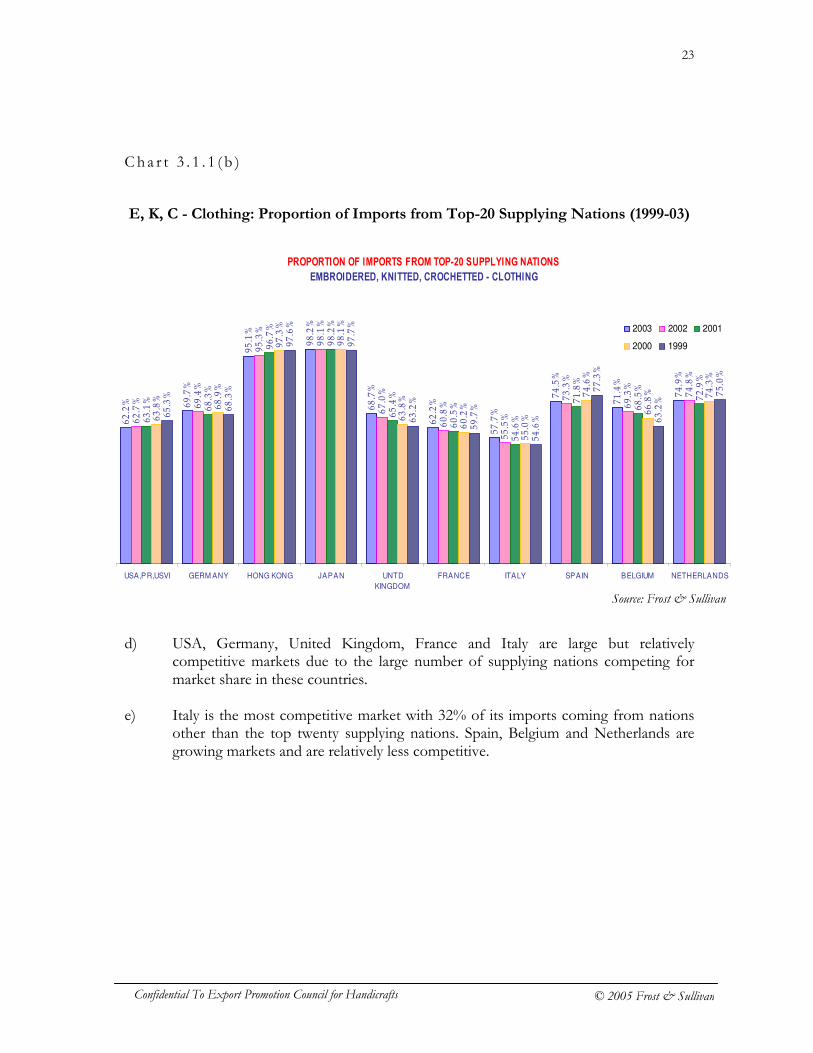
E, K, C - Clothing: Proportion of Imports from Top-20 Supplying Nations (1999-03)
d) USA, Germany, United Kingdom, France and Italy are large but relatively
competitive markets due to the large number of supplying nations competing for market share in these countries.
e) Italy is the most competitive market with 32% of its imports coming from nations
other than the top twenty supplying nations. Spain, Belgium and Netherlands are growing markets and are relatively less competitive.
PROPORTION OF IMPORTS FROM TOP-20 SUPPLYING NATIONS
EMBROIDERED, KNITTED, CROCHETTED - CLOTHING
62.2% 69.7%
95.1%
98.2%
68.7%
62.2%
57.7%
74.5%
71.4%
74.9%
62.7% 69.4%
95.3%
98.1%
67.0%
60.8%
55.5%
73.3%
69.3%
74.8%
63.1%
68.3%
96.7%
98.2%
65.4%
60.5%
54.6%
71.8%
68.5%
72.9%
63.8%
68.9%
97.3%
98.1%
63.8%
60.2%
55.0%
74.6%
66.8% 74.3%
65.3%
68.3%
97.6%
97.7%
63.2%
59.7%
54.6%
77.3%
63.2%
75.0%
USA,PR,USVI GERM ANY HONG KONG JAPAN UNTD
KINGDOM
FRANCE ITALY SPAIN BELGIUM NETHERLANDS
2003 2002 2001
2000 1999
Source: Frost & Sullivan
24
Confidential To Export Promotion Council for Handicrafts © 2005 Frost & Sullivan
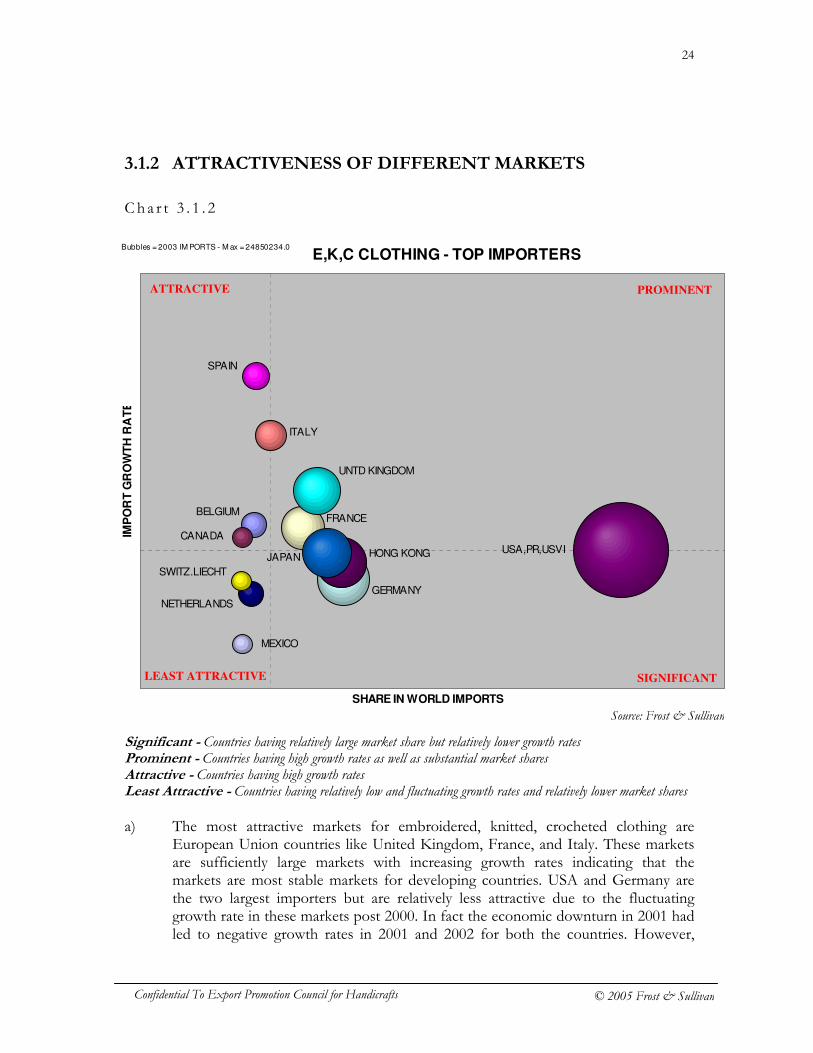
3.1.2 ATTRACTIVENESS OF DIFFERENT MARKETS
Cha r t 3 . 1 . 2
Significant - Countries having relatively large market share but relatively lower growth rates Prominent - Countries having high growth rates as well as substantial market shares Attractive - Countries having high growth rates Least Attractive - Countries having relatively low and fluctuating growth rates and relatively lower market shares a) The most attractive markets for embroidered, knitted, crocheted clothing are
European Union countries like United Kingdom, France, and Italy. These markets are sufficiently large markets with increasing growth rates indicating that the markets are most stable markets for developing countries. USA and Germany are the two largest importers but are relatively less attractive due to the fluctuating growth rate in these markets post 2000. In fact the economic downturn in 2001 had led to negative growth rates in 2001 and 2002 for both the countries. However,
E,K,C CLOTHING - TOP IMPORTERS
BELGIUM
CANADA
FRANCE
GERMANY
HONG KONG
ITALY
JAPAN
MEXICO
NETHERLANDS
SPAIN
SWITZ.LIECHT
UNTD KINGDOM
USA,PR,USVI
SHARE IN WORLD IMPORTS
IMP
OR
T G
RO
WT
H R
AT
E
Bubbles = 2003 IM PORTS - M ax = 24850234.0
PROMINENT ATTRACTIVE
SIGNIFICANT LEAST ATTRACTIVE
Source: Frost & Sullivan
25
Confidential To Export Promotion Council for Handicrafts © 2005 Frost & Sullivan
improvements in economic conditions, has seen USA increase its imports by 4.8% in 2003 and Germany registering a substantial growth of 22.5% in 2003. Though Hong Kong was the third largest importer in 2003, almost 80% of its imports in the category are for re-exports. Japan can therefore be considered as the third largest importer.
b) The Japanese market when considered from the point of view of growth from 1999-
2003 doesn’t seem very attractive; however imports have shown a sudden increase in 2003, growing by a stunning 12.2% after two years of decline. Taking into consideration the fact that Japanese women have started showing increasing preference towards internationally styled but traditionally made clothing especially from other Asian countries has led to growth in imports of embroidered, knitted, crocheted clothing with hand made clothing being able to obtain better prices.
c) In spite of the lower import values countries like Spain, Belgium and Canada, are
still promising markets considering their growth rate which has been considerably high between 1999-2003.
d) The decrease in intra-trade within European Union combined with the general
buoyant ness of the European Union, has led to the increase in the imports by many other European countries like Netherlands, Austria, Denmark and Sweden.
e) However the US and the countries forming part of the European Union, require
that the clothing and especially the accessories used as part of the clothing are of good quality. As a result, the basic clothing pieces are imported in large quantities from Asian countries and then styled and value-added to suit the country requirements.
26
Confidential To Export Promotion Council for Handicrafts © 2005 Frost & Sullivan
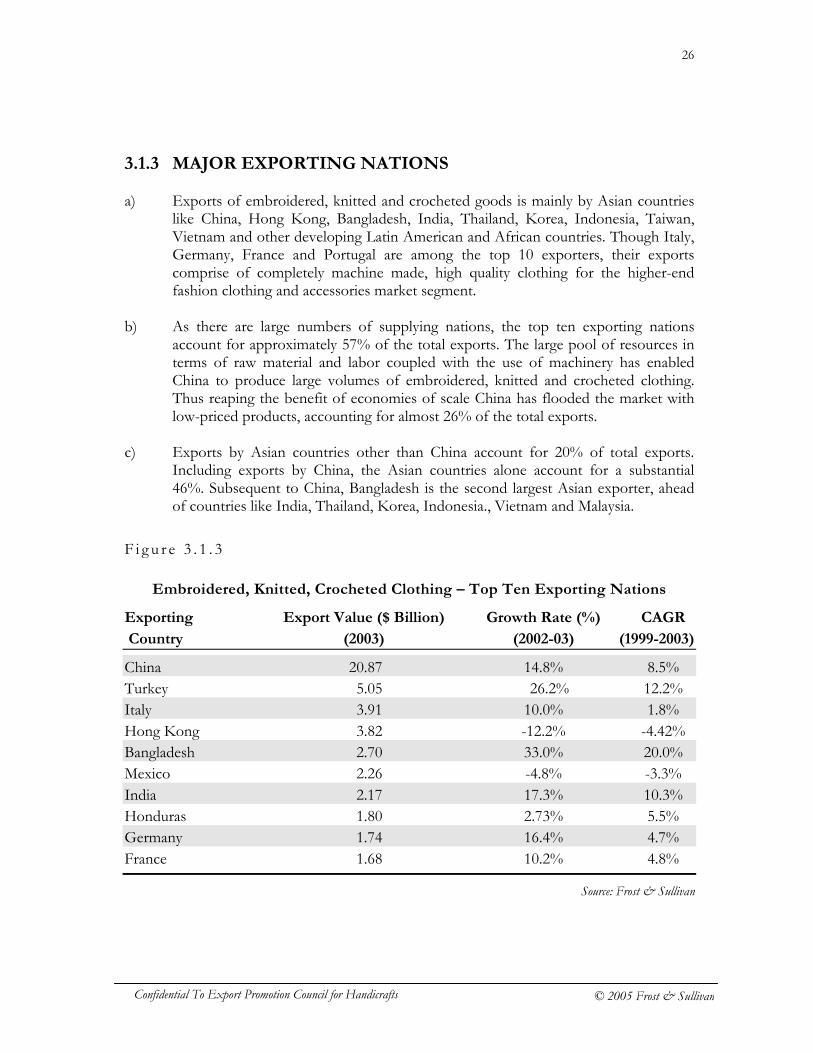
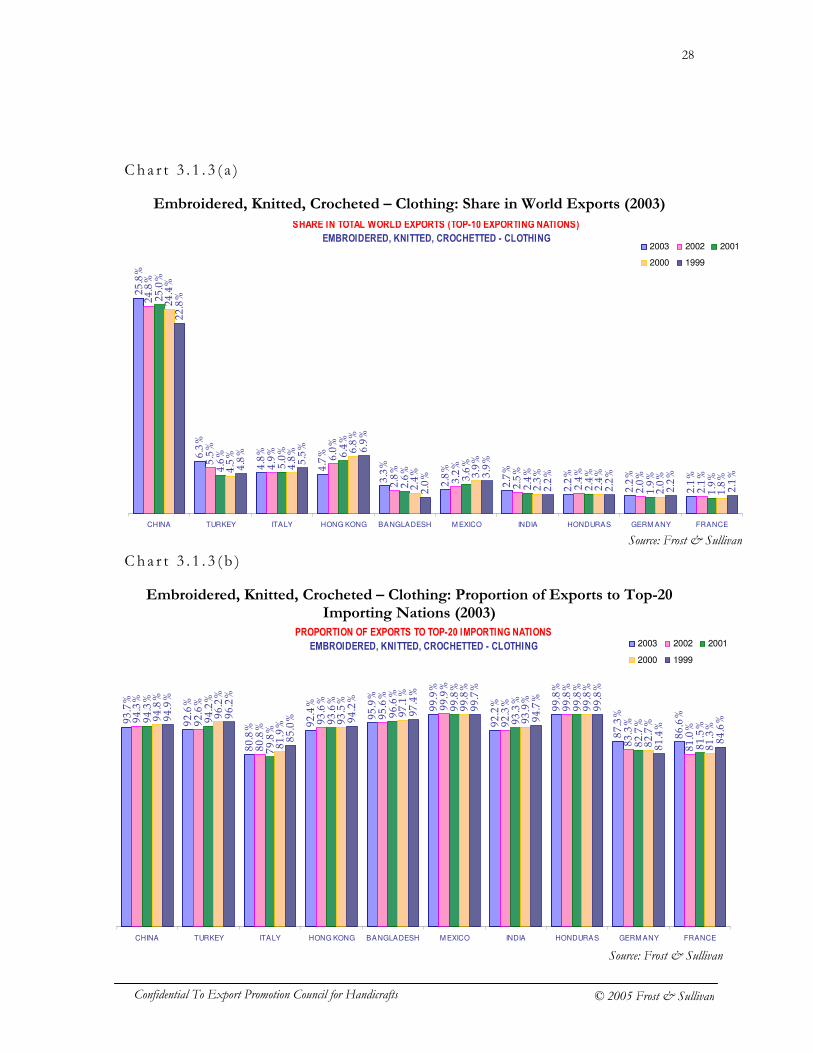
3.1.3 MAJOR EXPORTING NATIONS a) Exports of embroidered, knitted and crocheted goods is mainly by Asian countries
like China, Hong Kong, Bangladesh, India, Thailand, Korea, Indonesia, Taiwan, Vietnam and other developing Latin American and African countries. Though Italy, Germany, France and Portugal are among the top 10 exporters, their exports comprise of completely machine made, high quality clothing for the higher-end fashion clothing and accessories market segment.
b) As there are large numbers of supplying nations, the top ten exporting nations
account for approximately 57% of the total exports. The large pool of resources in terms of raw material and labor coupled with the use of machinery has enabled China to produce large volumes of embroidered, knitted and crocheted clothing. Thus reaping the benefit of economies of scale China has flooded the market with low-priced products, accounting for almost 26% of the total exports.
c) Exports by Asian countries other than China account for 20% of total exports.
Including exports by China, the Asian countries alone account for a substantial 46%. Subsequent to China, Bangladesh is the second largest Asian exporter, ahead of countries like India, Thailand, Korea, Indonesia., Vietnam and Malaysia.
F i g u r e 3 . 1 . 3
Embroidered, Knitted, Crocheted Clothing – Top Ten Exporting Nations
Exporting Export Value ($ Billion) Growth Rate (%) CAGR
Country (2003) (2002-03) (1999-2003)
China 20.87 14.8% 8.5% Turkey 5.05 26.2% 12.2% Italy 3.91 10.0% 1.8% Hong Kong 3.82 -12.2% -4.42% Bangladesh 2.70 33.0% 20.0% Mexico 2.26 -4.8% -3.3% India 2.17 17.3% 10.3% Honduras 1.80 2.73% 5.5% Germany 1.74 16.4% 4.7% France 1.68 10.2% 4.8%
Source: Frost & Sullivan
27
Confidential To Export Promotion Council for Handicrafts © 2005 Frost & Sullivan
d) The other significant exporters in the category in 2003 were European and Asian countries like Thailand (US $1.59 Billion), Portugal (US $1.56 Billion), Korea (US $1.41 Billion), Indonesia (US $1.29 Billion), Taiwan (US $1.27 Billion), USA (US $1.26 Billion), Vietnam (US $1.16 Billion), El Salvador (US $1.15 Billion), Romania (US $1.10 Billion) and United Kingdom (US $1.05 Billion).
e) Increase in efforts by export promotion bodies and associations in Thailand, led to
its exports growing by a good 5.4% in 2003. Specifically the (One Tampon One Product) project to help increase production and exports of handmade products has helped even the small and medium scale firms including house-hold production units to improve their clothing manufacturing processes as well as to produce and market goods in keeping with market requirements.
f) Though Korea ranked 13th in terms of export value in 2003, its exports have fallen
by a significant 13.1 % in 2003 and the CAGR for 1999-2003 has been (-9.06%).Both Indonesia and Taiwan registered positive growth rates of 10.7% and 5.2% respectively in 2003 after two years of decline in exports.
g) However the most noteworthy export performance has been by Vietnam, which has
grown by a remarkable 49.2% from 1999 to 2003 with exports in 2003 showing triple digit growth rate of 109%. The growth is attributed to improvements in manufacturing processes due to increasing FDI and training centers in the sector as well as better distribution and promotion.
28
Confidential To Export Promotion Council for Handicrafts © 2005 Frost & Sullivan
Cha r t 3 . 1 . 3 ( a )
Embroidered, Knitted, Crocheted – Clothing: Share in World Exports (2003)
Cha r t 3 . 1 . 3 ( b )
Embroidered, Knitted, Crocheted – Clothing: Proportion of Exports to Top-20 Importing Nations (2003)
SHARE IN TOTAL WORLD EXPORTS (TOP-10 EXPORTING NATIONS)
EMBROIDERED, KNITTED, CROCHETTED - CLOTHING
25.8%
6.3%
4.8%
4.7%
3.3%
2.8%
2.7%
2.2%
2.2%
2.1%
24.8%
5.5%
4.9%
6.0%
2.8%
3.2%
2.5%
2.4%
2.0%
25.0%
4.6%
5.0% 6.4%
2.6%
3.6%
2.4%
2.4%
1.9%
1.9%
24.4%
4.5%
4.8% 6.8%
2.4% 3.9%
2.3%
2.4%
2.0%
1.8%
22.8%
4.8%
5.5% 6.9%
2.0% 3.9%
2.2%
2.2%
2.2%
2.1%
2.1%
CHINA TURKEY ITALY HONG KONG BANGLADESH M EXICO INDIA HONDURAS GERM ANY FRANCE
2003 2002 2001
2000 1999
PROPORTION OF EXPORTS TO TOP-20 IMPORTING NATIONS
EMBROIDERED, KNITTED, CROCHETTED - CLOTHING
93.7%
92.6%
80.8%
92.4%
95.9%
99.9%
92.2%
99.8%
87.3%
86.6%
94.3%
92.6%
80.8%
93.6%
95.6%
99.9%
92.3%
99.8%
83.3%
81.0%
94.3%
94.2%
79.8%
93.6%
96.6%
99.8%
93.3%
99.8%
82.7%
81.5%
94.8%
96.2%
81.9%
93.5%
97.1%
99.8%
93.9%
99.8%
82.7%
81.3%
94.9%
96.2%
85.0% 94.2%
97.4%
99.7%
94.7%
99.8%
81.4%
84.6%
CHINA TURKEY ITALY HONG KONG BANGLADESH M EXICO INDIA HONDURAS GERM ANY FRANCE
2003 2002 2001
2000 1999
Source: Frost & Sullivan
Source: Frost & Sullivan
29
Confidential To Export Promotion Council for Handicrafts © 2005 Frost & Sullivan
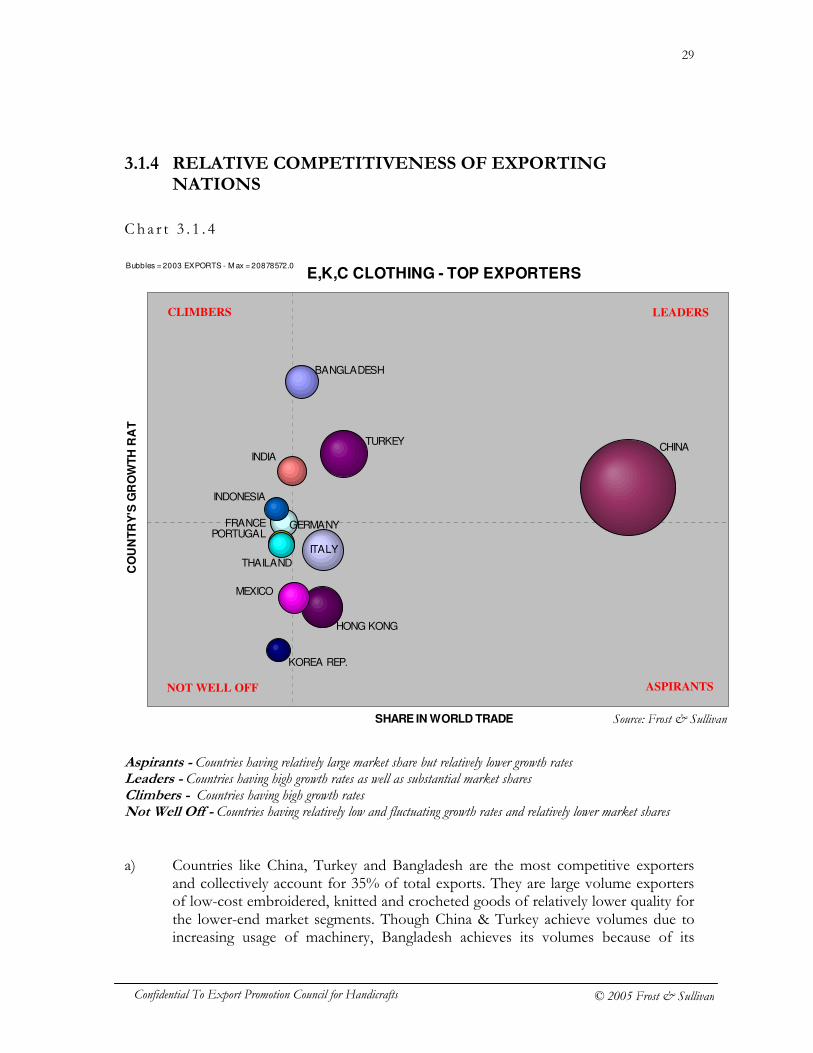
3.1.4 RELATIVE COMPETITIVENESS OF EXPORTING NATIONS
Cha r t 3 . 1 . 4
Aspirants - Countries having relatively large market share but relatively lower growth rates Leaders - Countries having high growth rates as well as substantial market shares Climbers - Countries having high growth rates Not Well Off - Countries having relatively low and fluctuating growth rates and relatively lower market shares a) Countries like China, Turkey and Bangladesh are the most competitive exporters
and collectively account for 35% of total exports. They are large volume exporters of low-cost embroidered, knitted and crocheted goods of relatively lower quality for the lower-end market segments. Though China & Turkey achieve volumes due to increasing usage of machinery, Bangladesh achieves its volumes because of its
E,K,C CLOTHING - TOP EXPORTERS
BANGLADESH
CHINA
FRANCE GERMANY
HONG KONG
INDIA
INDONESIA
ITALY
KOREA REP.
MEXICO
PORTUGAL
THAILAND
TURKEY
SHARE IN WORLD TRADE
CO
UN
TR
Y'S
GR
OW
TH
RA
TE
Bubbles = 2003 EXPORTS - M ax = 20878572.0
LEADERS CLIMBERS
ASPIRANTS NOT WELL OFF
Source: Frost & Sullivan
30
Confidential To Export Promotion Council for Handicrafts © 2005 Frost & Sullivan
abundant labor and raw materials and the prominence attached to the textile & clothing industry as a whole.
b) The European Union countries like Italy, Germany, France, and Portugal are large
exporters in terms of export value mainly because they supply high quality machine-made goods for higher-end markets. How ever the increasing low-cost exports by countries like China and the improvements in styling and quality has caused these originally dominant exporters to continue to loose their market share.
c) The countries like Indonesia, India and Vietnam have shown considerable growth in
exports due to increased awareness of market requirements and support by their respective governments in helping the manufacturers meet market requirements in terms of quality and styling in addition to increased promotion efforts.
d) Among Asian countries, Thailand is another country that needs to be considered.
Because though it showed negative growth rates in 2001 and 2002, its exports have substantially picked up in 2003 and are predicted to continue to increase due to improvements at the industry level itself that has led to better productivity and increased efficiency of the sector.
e) Hong Kong has moved up the ladder in terms of market segments to which it
caters. Presently majority of Hong Kong’s lower-end exports are re-exports of Chinese products but it has entered the higher end segment by supplying limited quantities of products at par with those of developed countries like France and Italy. The increasing fashion orientation of the domestic market itself combined with the access and availability of better design capabilities and technology and improved market access has enabled Hong Kong to make the required transition.
31
Confidential To Export Promotion Council for Handicrafts © 2005 Frost & Sullivan
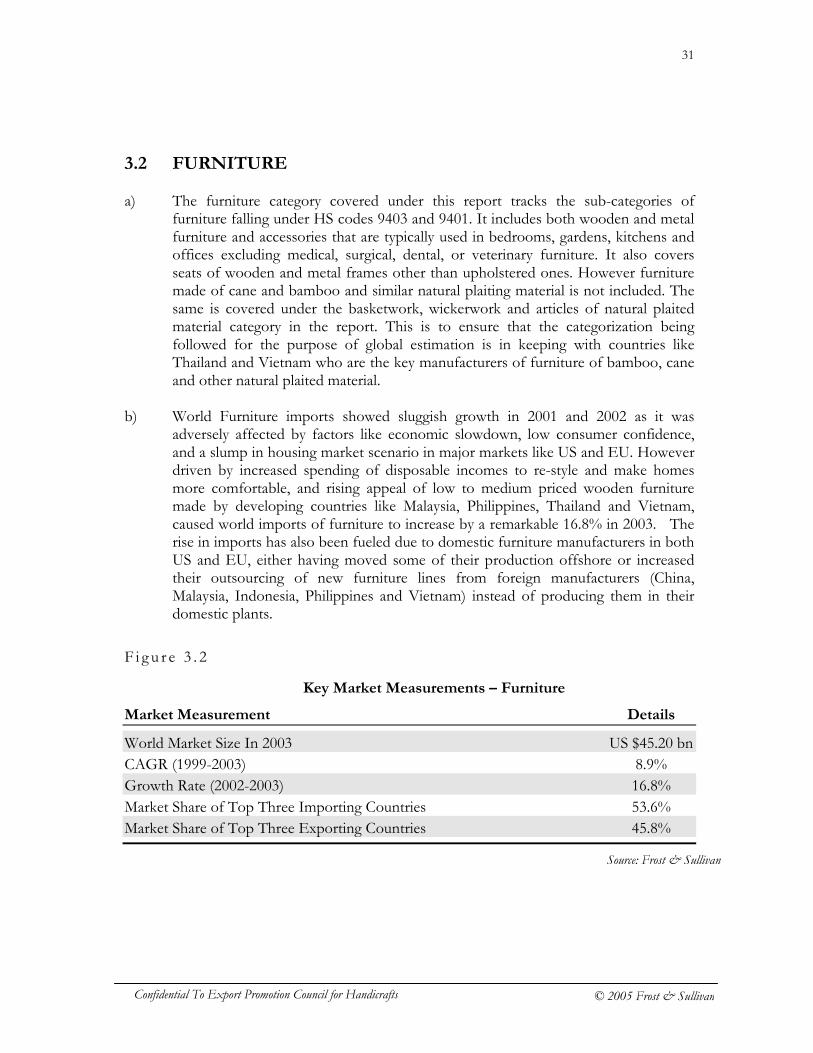
3.2 FURNITURE a) The furniture category covered under this report tracks the sub-categories of
furniture falling under HS codes 9403 and 9401. It includes both wooden and metal furniture and accessories that are typically used in bedrooms, gardens, kitchens and offices excluding medical, surgical, dental, or veterinary furniture. It also covers seats of wooden and metal frames other than upholstered ones. However furniture made of cane and bamboo and similar natural plaiting material is not included. The same is covered under the basketwork, wickerwork and articles of natural plaited material category in the report. This is to ensure that the categorization being followed for the purpose of global estimation is in keeping with countries like Thailand and Vietnam who are the key manufacturers of furniture of bamboo, cane and other natural plaited material.
b) World Furniture imports showed sluggish growth in 2001 and 2002 as it was
adversely affected by factors like economic slowdown, low consumer confidence, and a slump in housing market scenario in major markets like US and EU. However driven by increased spending of disposable incomes to re-style and make homes more comfortable, and rising appeal of low to medium priced wooden furniture made by developing countries like Malaysia, Philippines, Thailand and Vietnam, caused world imports of furniture to increase by a remarkable 16.8% in 2003. The rise in imports has also been fueled due to domestic furniture manufacturers in both US and EU, either having moved some of their production offshore or increased their outsourcing of new furniture lines from foreign manufacturers (China, Malaysia, Indonesia, Philippines and Vietnam) instead of producing them in their domestic plants.
F i g u r e 3 . 2
Market Measurement Details
World Market Size In 2003 US $45.20 bn CAGR (1999-2003) 8.9% Growth Rate (2002-2003) 16.8% Market Share of Top Three Importing Countries 53.6% Market Share of Top Three Exporting Countries 45.8%
Key Market Measurements – Furniture
Source: Frost & Sullivan
32
Confidential To Export Promotion Council for Handicrafts © 2005 Frost & Sullivan
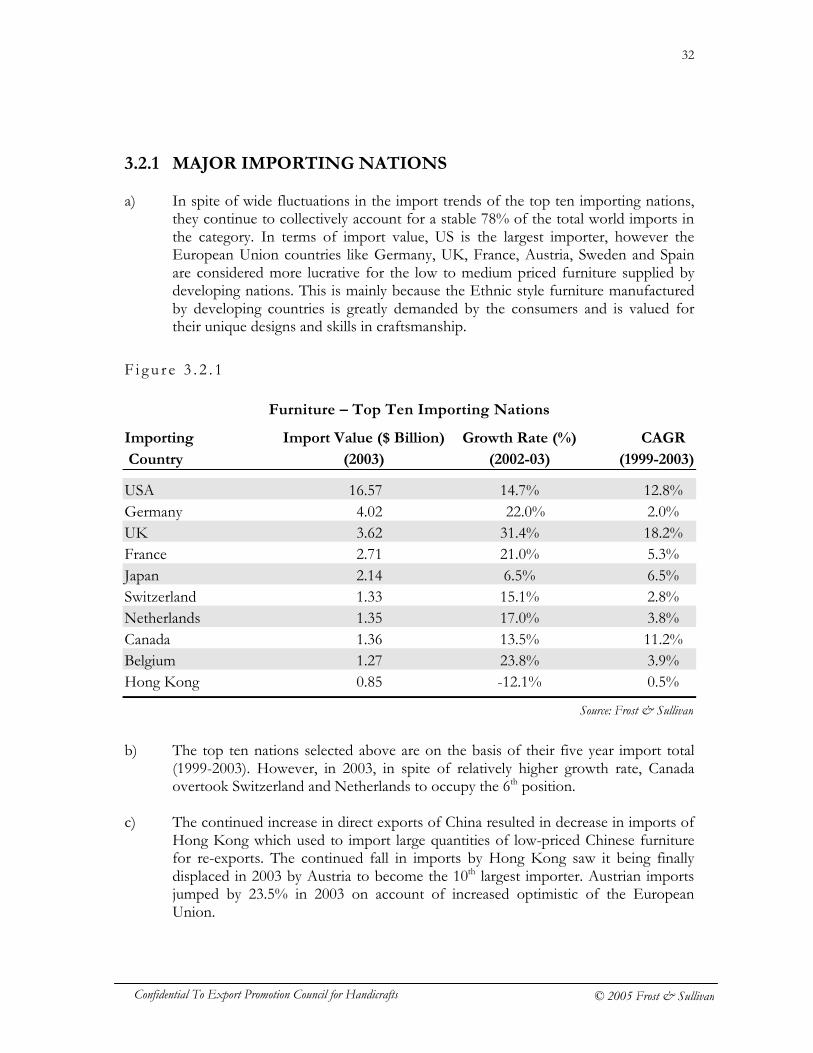
3.2.1 MAJOR IMPORTING NATIONS a) In spite of wide fluctuations in the import trends of the top ten importing nations,
they continue to collectively account for a stable 78% of the total world imports in the category. In terms of import value, US is the largest importer, however the European Union countries like Germany, UK, France, Austria, Sweden and Spain are considered more lucrative for the low to medium priced furniture supplied by developing nations. This is mainly because the Ethnic style furniture manufactured by developing countries is greatly demanded by the consumers and is valued for their unique designs and skills in craftsmanship.
F i g u r e 3 . 2 . 1
Furniture – Top Ten Importing Nations
Importing Import Value ($ Billion) Growth Rate (%) CAGR
Country (2003) (2002-03) (1999-2003)
USA 16.57 14.7% 12.8% Germany 4.02 22.0% 2.0% UK 3.62 31.4% 18.2% France 2.71 21.0% 5.3% Japan 2.14 6.5% 6.5% Switzerland 1.33 15.1% 2.8% Netherlands 1.35 17.0% 3.8% Canada 1.36 13.5% 11.2% Belgium 1.27 23.8% 3.9% Hong Kong 0.85 -12.1% 0.5%
b) The top ten nations selected above are on the basis of their five year import total
(1999-2003). However, in 2003, in spite of relatively higher growth rate, Canada overtook Switzerland and Netherlands to occupy the 6th position.
c) The continued increase in direct exports of China resulted in decrease in imports of
Hong Kong which used to import large quantities of low-priced Chinese furniture for re-exports. The continued fall in imports by Hong Kong saw it being finally displaced in 2003 by Austria to become the 10th largest importer. Austrian imports jumped by 23.5% in 2003 on account of increased optimistic of the European Union.
Source: Frost & Sullivan
33
Confidential To Export Promotion Council for Handicrafts © 2005 Frost & Sullivan
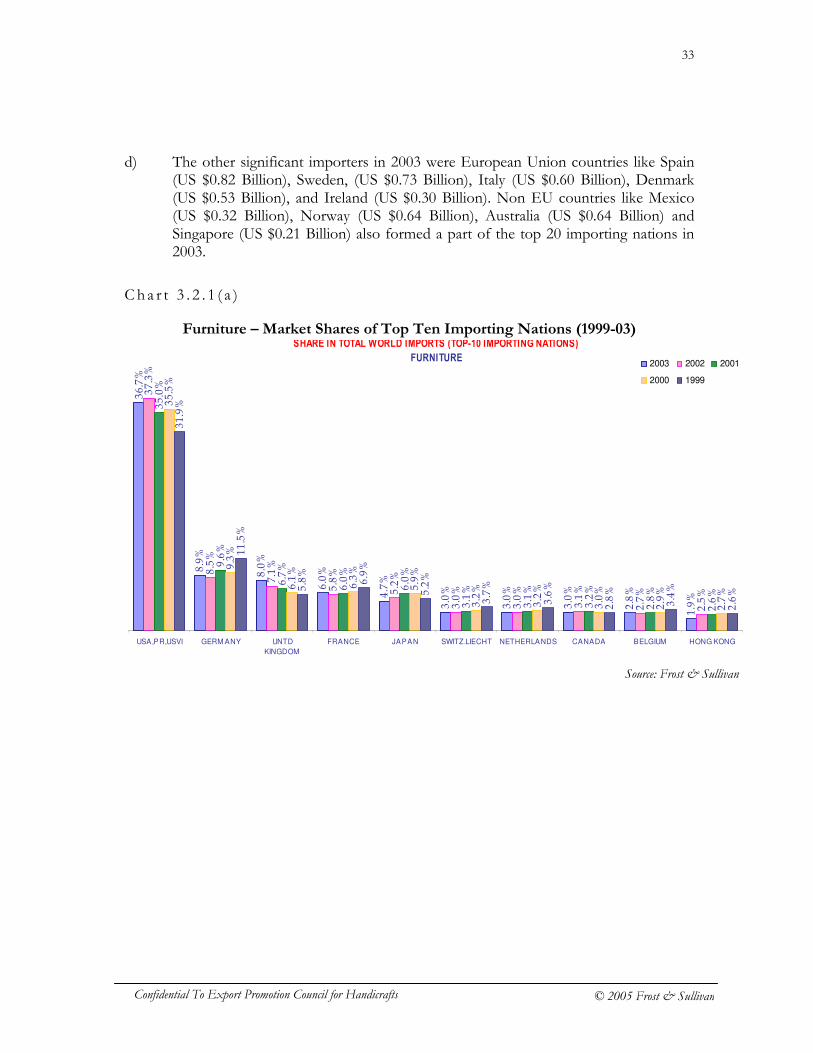
d) The other significant importers in 2003 were European Union countries like Spain (US $0.82 Billion), Sweden, (US $0.73 Billion), Italy (US $0.60 Billion), Denmark (US $0.53 Billion), and Ireland (US $0.30 Billion). Non EU countries like Mexico (US $0.32 Billion), Norway (US $0.64 Billion), Australia (US $0.64 Billion) and Singapore (US $0.21 Billion) also formed a part of the top 20 importing nations in 2003.
Ch a r t 3 . 2 . 1 ( a )
Furniture – Market Shares of Top Ten Importing Nations (1999-03) SHARE IN TOTAL WORLD IMPORTS (TOP-10 IMPORTING NATIONS)
FURNITURE
36.7%
8.9%
8.0%
6.0%
4.7%
3.0%
3.0%
3.0%
2.8%
1.9%
37.3%
8.5%
7.1%
5.8%
5.2%
3.0%
3.0%
3.1%
2.7%
2.5%
35.0%
9.6%
6.7%
6.0%
6.0%
3.1%
3.1%
3.2%
2.8%
2.6%
35.5%
9.3%
6.1%
6.3%
5.9%
3.2%
3.2%
3.0%
2.9%
2.7%
31.9%
11.5%
5.8%
6.9%
5.2%
3.7%
3.6%
2.8%
3.4%
2.6%
USA,PR,USVI GERM ANY UNTD
KINGDOM
FRANCE JAPAN SWITZ.LIECHT NETHERLANDS CANADA BELGIUM HONG KONG
2003 2002 2001
2000 1999
Source: Frost & Sullivan
34
Confidential To Export Promotion Council for Handicrafts © 2005 Frost & Sullivan
Cha r t 3 . 2 . 1 ( b )
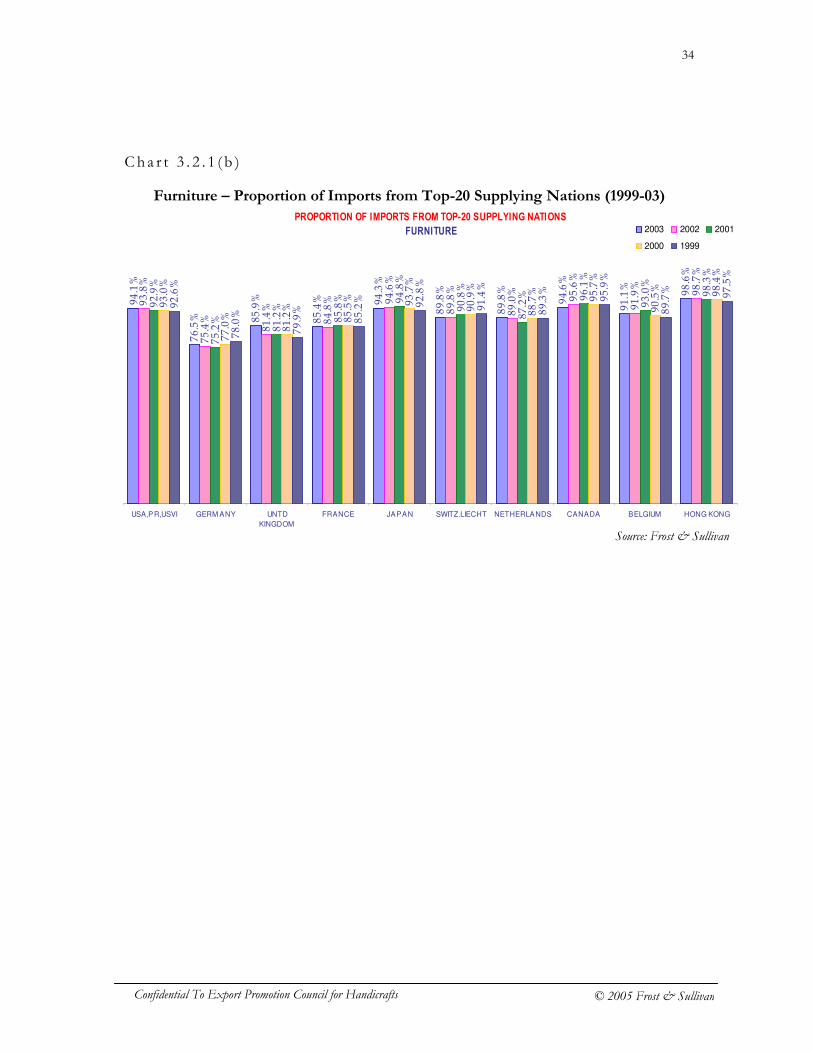
Furniture – Proportion of Imports from Top-20 Supplying Nations (1999-03)
PROPORTION OF IMPORTS FROM TOP-20 SUPPLYING NATIONS
FURNITURE
94.1%
76.5% 85.9%
85.4% 94.3%
89.8%
89.8%
94.6%
91.1%
98.6%
93.8%
75.4%
81.4%
84.8% 94.6%
89.8%
89.0%
95.6%
91.9%
98.7%
92.9%
75.2%
81.2%
85.8% 94.8%
90.8%
87.2% 96.1%
93.0%
98.3%
93.0%
77.0%
81.2%
85.5% 93.7%
90.9%
88.7%
95.7%
90.5%
98.4%
92.6%
78.0%
79.9%
85.2%
92.8%
91.4%
89.3%
95.9%
89.7%
97.5%
USA,PR,USVI GERM ANY UNTD
KINGDOM
FRANCE JAPAN SWITZ.LIECHT NETHERLANDS CANADA BELGIUM HONG KONG
2003 2002 2001
2000 1999
Source: Frost & Sullivan
35
Confidential To Export Promotion Council for Handicrafts © 2005 Frost & Sullivan
3.2.2 ATTRACTIVENESS OF DIFFERENT MARKETS
Cha r t 3 . 2 . 2
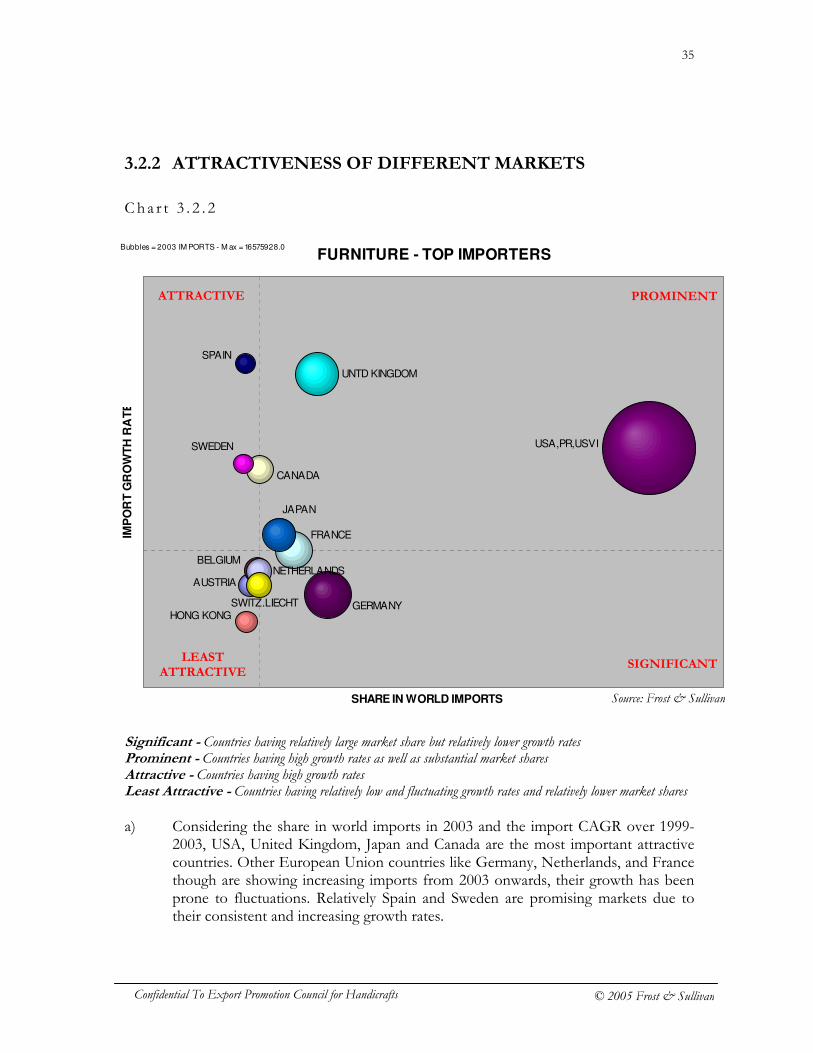
Significant - Countries having relatively large market share but relatively lower growth rates Prominent - Countries having high growth rates as well as substantial market shares Attractive - Countries having high growth rates Least Attractive - Countries having relatively low and fluctuating growth rates and relatively lower market shares a) Considering the share in world imports in 2003 and the import CAGR over 1999-
2003, USA, United Kingdom, Japan and Canada are the most important attractive countries. Other European Union countries like Germany, Netherlands, and France though are showing increasing imports from 2003 onwards, their growth has been prone to fluctuations. Relatively Spain and Sweden are promising markets due to their consistent and increasing growth rates.
FURNITURE - TOP IMPORTERS
AUSTRIA
BELGIUM
CANADA
FRANCE
GERMANY HONG KONG
JAPAN
NETHERLANDS
SPAIN
SWEDEN
SWITZ.LIECHT
UNTD KINGDOM
USA,PR,USVI
SHARE IN WORLD IMPORTS
IMP
OR
T G
RO
WT
H R
AT
E
Bubbles = 2003 IM PORTS - M ax = 16575928.0
ATTRACTIVE PROMINENT
LEAST ATTRACTIVE
SIGNIFICANT
Source: Frost & Sullivan
36
Confidential To Export Promotion Council for Handicrafts © 2005 Frost & Sullivan
b) Countries like Belgium, Austria, and Switzerland though are relatively small markets are important because they are all showed double-digit growth rates in 2003 and are further expected to hold good potential for entry-level low-priced furniture from developing countries especially the Asian countries.
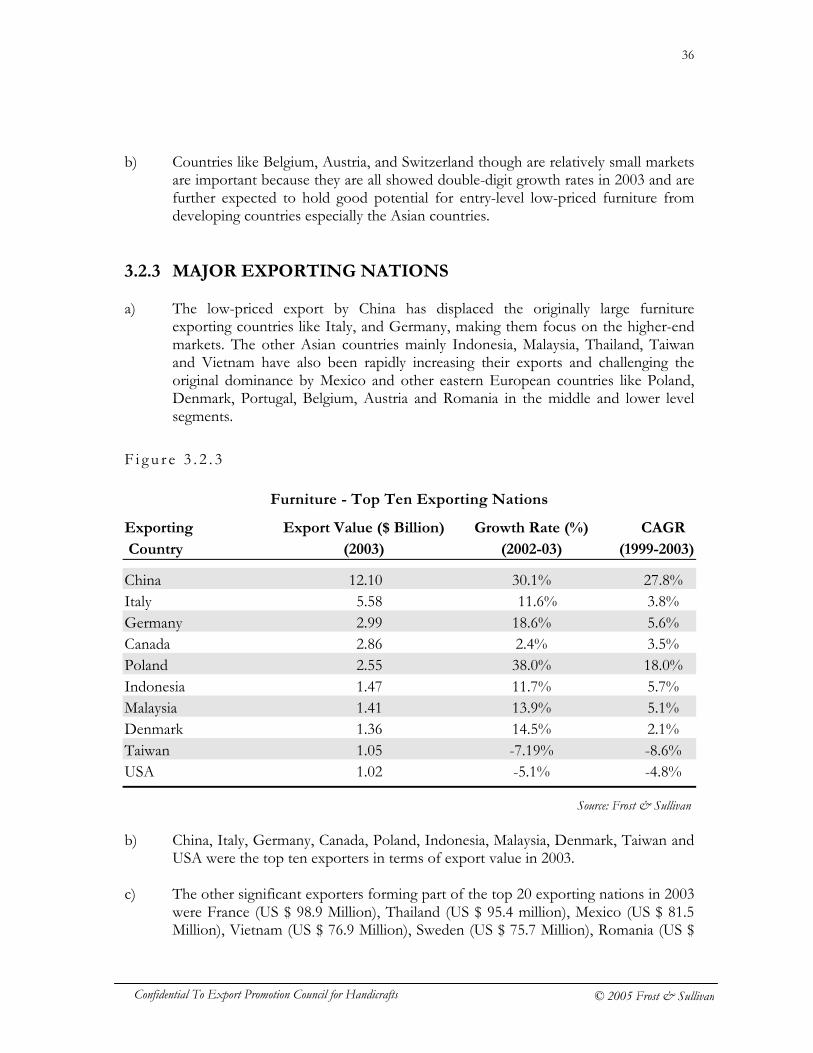
3.2.3 MAJOR EXPORTING NATIONS a) The low-priced export by China has displaced the originally large furniture
exporting countries like Italy, and Germany, making them focus on the higher-end markets. The other Asian countries mainly Indonesia, Malaysia, Thailand, Taiwan and Vietnam have also been rapidly increasing their exports and challenging the original dominance by Mexico and other eastern European countries like Poland, Denmark, Portugal, Belgium, Austria and Romania in the middle and lower level segments.
F i g u r e 3 . 2 . 3
Furniture - Top Ten Exporting Nations
Exporting Export Value ($ Billion) Growth Rate (%) CAGR
Country (2003) (2002-03) (1999-2003)
China 12.10 30.1% 27.8% Italy 5.58 11.6% 3.8% Germany 2.99 18.6% 5.6% Canada 2.86 2.4% 3.5% Poland 2.55 38.0% 18.0% Indonesia 1.47 11.7% 5.7% Malaysia 1.41 13.9% 5.1% Denmark 1.36 14.5% 2.1% Taiwan 1.05 -7.19% -8.6% USA 1.02 -5.1% -4.8%
b) China, Italy, Germany, Canada, Poland, Indonesia, Malaysia, Denmark, Taiwan and
USA were the top ten exporters in terms of export value in 2003. c) The other significant exporters forming part of the top 20 exporting nations in 2003
were France (US $ 98.9 Million), Thailand (US $ 95.4 million), Mexico (US $ 81.5 Million), Vietnam (US $ 76.9 Million), Sweden (US $ 75.7 Million), Romania (US $
Source: Frost & Sullivan
37
Confidential To Export Promotion Council for Handicrafts © 2005 Frost & Sullivan
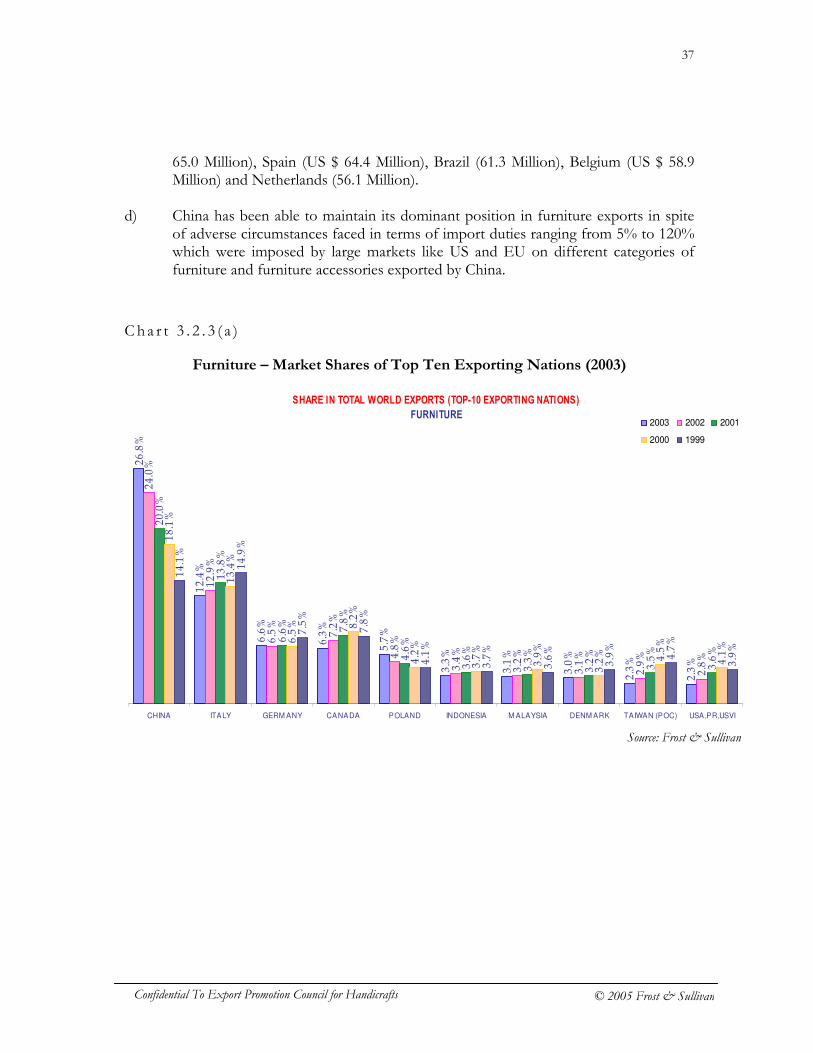
65.0 Million), Spain (US $ 64.4 Million), Brazil (61.3 Million), Belgium (US $ 58.9 Million) and Netherlands (56.1 Million).
d) China has been able to maintain its dominant position in furniture exports in spite
of adverse circumstances faced in terms of import duties ranging from 5% to 120% which were imposed by large markets like US and EU on different categories of furniture and furniture accessories exported by China.
C h a r t 3 . 2 . 3 ( a )
Furniture – Market Shares of Top Ten Exporting Nations (2003)
SHARE IN TOTAL WORLD EXPORTS (TOP-10 EXPORTING NATIONS)
FURNITURE
26.8%
12.4%
6.6%
6.3%
5.7%
3.3%
3.1%
3.0%
2.3%
2.3%
24.0%
12.9%
6.5%
7.2%
4.8%
3.4%
3.2%
3.1%
2.9%
2.8%
20.0%
13.8%
6.6%
7.8%
4.6%
3.6%
3.3%
3.2%
3.5%
3.6%
18.1%
13.4%
6.5% 8.2%
4.2%
3.7%
3.9%
3.2% 4.5%
4.1%
14.1%
14.9%
7.5%
7.8%
4.1%
3.7%
3.6%
3.9%
4.7%
3.9%
CHINA ITALY GERM ANY CANADA POLAND INDONESIA M ALAYSIA DENM ARK TAIWAN (POC) USA,PR,USVI
2003 2002 2001
2000 1999
Source: Frost & Sullivan
38
Confidential To Export Promotion Council for Handicrafts © 2005 Frost & Sullivan
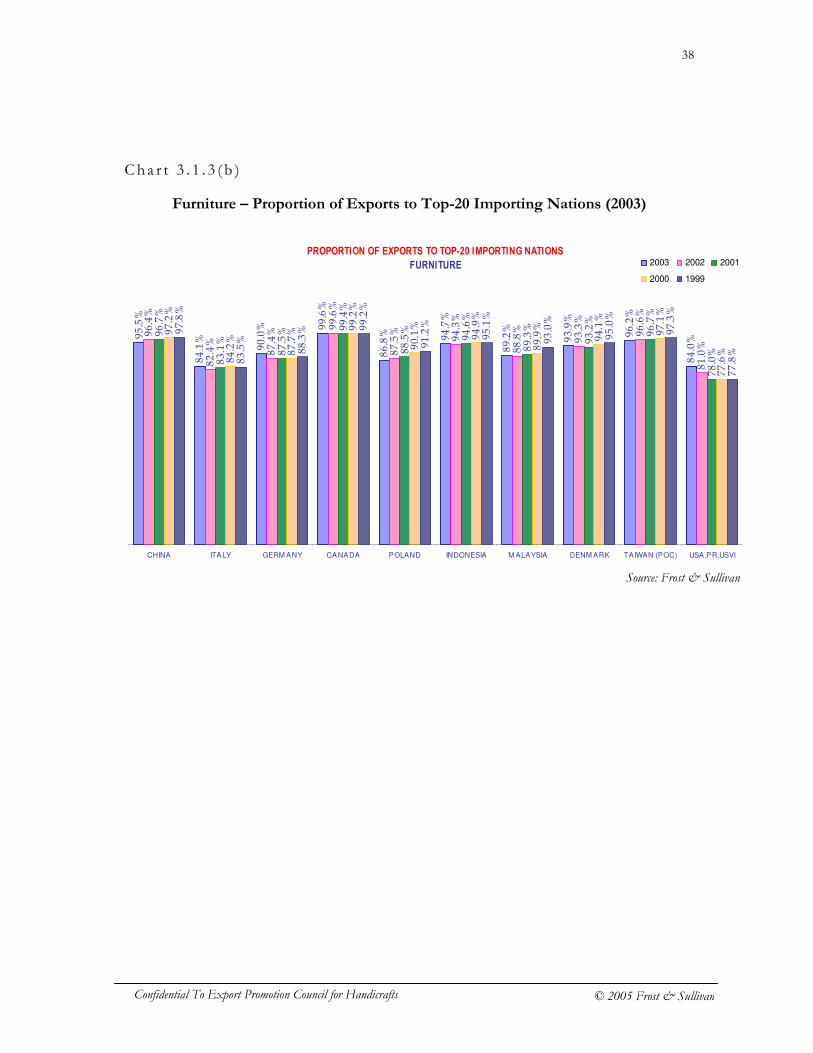
Cha r t 3 . 1 . 3 ( b )
Furniture – Proportion of Exports to Top-20 Importing Nations (2003)
PROPORTION OF EXPORTS TO TOP-20 IMPORTING NATIONS
FURNITURE
95.5%
84.1%
90.0% 99.6%
86.8% 94.7%
89.2%
93.9%
96.2%
84.0%
96.4%
82.4%
87.4%
99.6%
87.5%
94.3%
88.8%
93.3%
96.6%
81.0%
96.7%
83.1%
87.5%
99.4%
88.5%
94.6%
89.3%
93.2%
96.7%
78.0%
97.2%
84.2%
87.7%
99.2%
90.1%
94.9%
89.9%
94.1%
97.1%
77.6%
97.8%
83.5%
88.3% 99.2%
91.2%
95.1%
93.0%
95.0%
97.3%
77.8%
CHINA ITALY GERM ANY CANADA POLAND INDONESIA M ALAYSIA DENM ARK TAIWAN (POC) USA,PR,USVI
2003 2002 2001
2000 1999
Source: Frost & Sullivan
39
Confidential To Export Promotion Council for Handicrafts © 2005 Frost & Sullivan
3.2.4 RELATIVE COMPETITIVENESS OF EXPORTING NATIONS
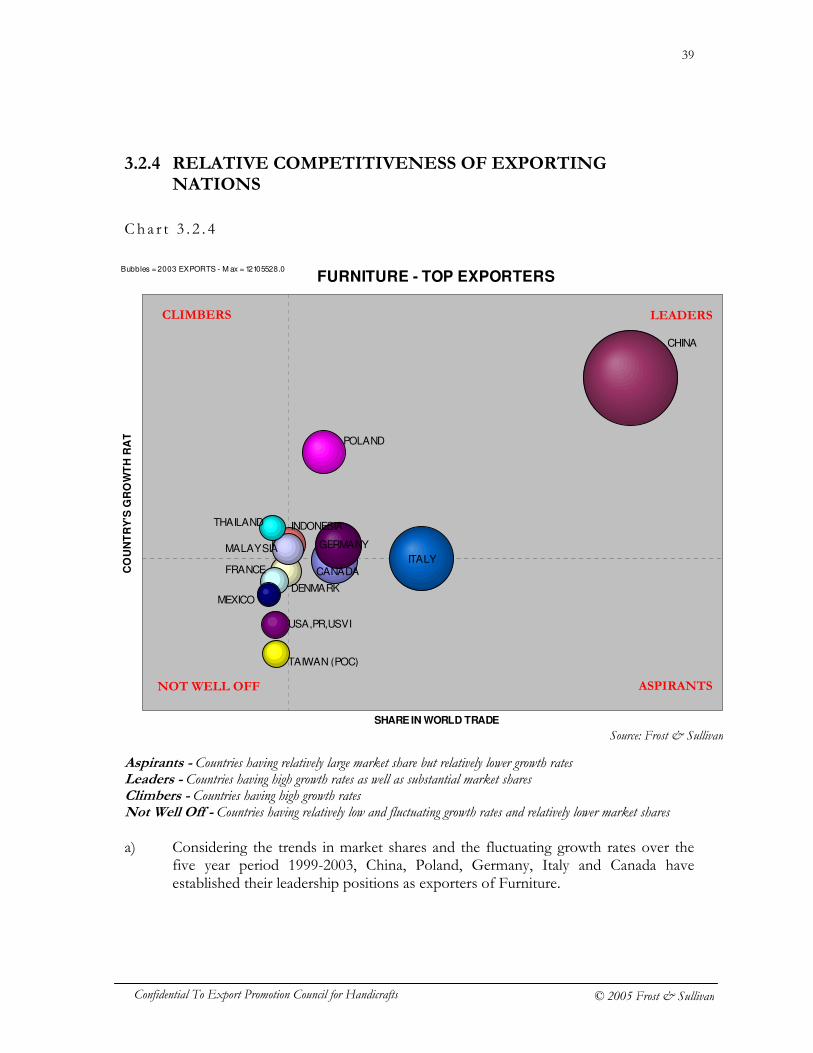
Cha r t 3 . 2 . 4
Aspirants - Countries having relatively large market share but relatively lower growth rates Leaders - Countries having high growth rates as well as substantial market shares Climbers - Countries having high growth rates Not Well Off - Countries having relatively low and fluctuating growth rates and relatively lower market shares a) Considering the trends in market shares and the fluctuating growth rates over the
five year period 1999-2003, China, Poland, Germany, Italy and Canada have established their leadership positions as exporters of Furniture.
FURNITURE - TOP EXPORTERS
CANADA
CHINA
DENMARK
FRANCE
GERMANY
INDONESIA
ITALY MALAYSIA
MEXICO
POLAND
TAIWAN (POC)
THAILAND
USA,PR,USVI
SHARE IN WORLD TRADE
CO
UN
TR
Y'S
GR
OW
TH
RA
TE
Bubbles = 2003 EXPORTS - M ax = 12105528.0
CLIMBERS LEADERS
NOT WELL OFF ASPIRANTS
Source: Frost & Sullivan
40
Confidential To Export Promotion Council for Handicrafts © 2005 Frost & Sullivan
b) In spite of high import duties imposed on China, by markets like EU and US, China’s dominant position was only slightly impacted. The increasing contract manufacturing to China is expected to continue to sustain its dominant position.
c) Poland, Germany, Italy, and Canada have been able to maintain their dominant
positions, in the face of fierce competition from Asian countries. This has been possible due to their focus on the higher-end markets and the trend of consolidations in industry structure of these countries due to mergers and acquisitions.
d) Apart from China, Canada and the top European exporters of furniture, the other
countries that need be watched out for are Asian countries like Indonesia, Malaysia, Thailand and Vietnam. These countries adequately supported by their governments in terms of distribution and promotion support have been able to leverage their ample recourses of raw material and skilled labor to achieve high growth rates.
e) The increasing competition from Asian countries has however led to the
displacement of countries like USA, Taiwan , Denmark, Mexico, France, Spain, Sweden, Romania, Brazil, Belgium and Netherlands who held significant market shares till late 1990’s. The most adversely affected were US and Taiwan who have continued to show negative growth rates from 2000 onwards.
f) USA which was a leading exporter till the late 1990’s has continued to slip in the
face of fierce competition from Asian and European exporters. Moreover the local production of furniture in USA has declined to such an extent that it is not even capable of meeting domestic demand which is continuing to increase in the lower and mid-market segments. US furniture market is also presently hit by the trend of US furniture manufacturers, who to increase their profitability are outsourcing manufacturing to Asian countries.
g) However countries like Denmark, France, Romanian, Brazil and Netherlands have
showed double-digit growth rates in 2003 indicating efforts to increase exports by leveraging suitable market niches in terms of product categories like Kitchen furniture and fittings and Small Office Home Office kind of furniture in which Asian countries still can’t meet expected market requirements and consumer preferences.
41
Confidential To Export Promotion Council for Handicrafts © 2005 Frost & Sullivan
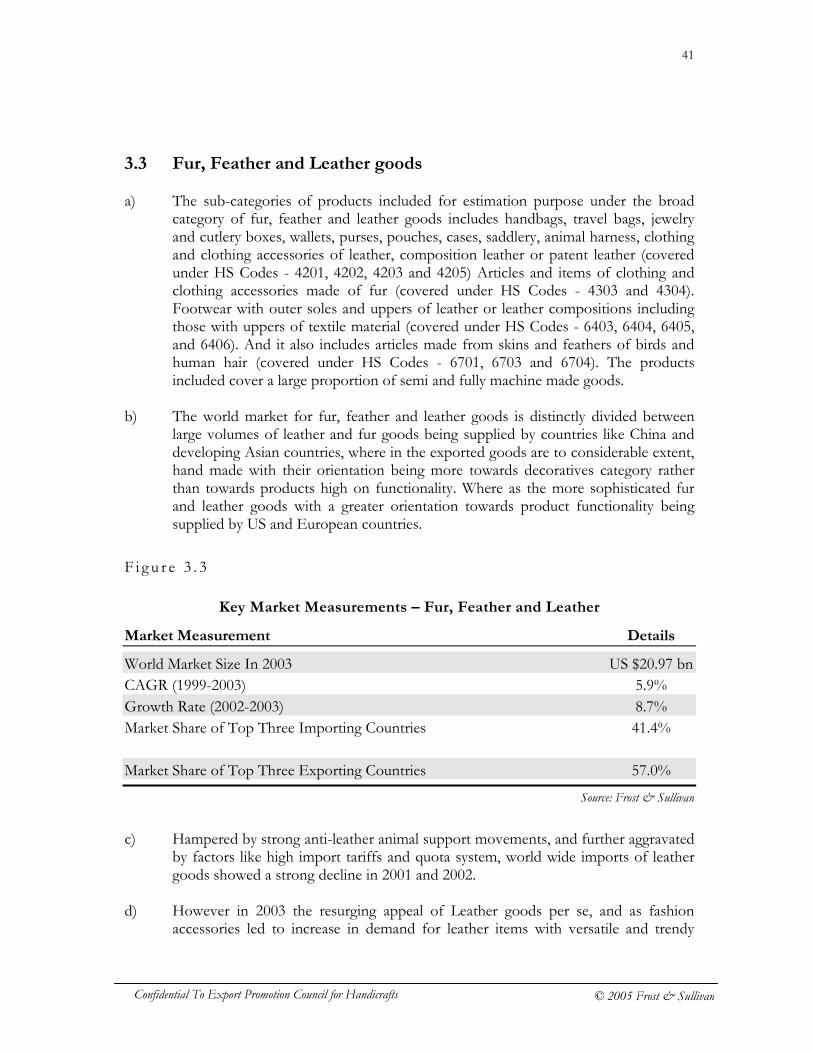
3.3 Fur, Feather and Leather goods a) The sub-categories of products included for estimation purpose under the broad
category of fur, feather and leather goods includes handbags, travel bags, jewelry and cutlery boxes, wallets, purses, pouches, cases, saddlery, animal harness, clothing and clothing accessories of leather, composition leather or patent leather (covered under HS Codes - 4201, 4202, 4203 and 4205) Articles and items of clothing and clothing accessories made of fur (covered under HS Codes - 4303 and 4304). Footwear with outer soles and uppers of leather or leather compositions including those with uppers of textile material (covered under HS Codes - 6403, 6404, 6405, and 6406). And it also includes articles made from skins and feathers of birds and human hair (covered under HS Codes - 6701, 6703 and 6704). The products included cover a large proportion of semi and fully machine made goods.
b) The world market for fur, feather and leather goods is distinctly divided between
large volumes of leather and fur goods being supplied by countries like China and developing Asian countries, where in the exported goods are to considerable extent, hand made with their orientation being more towards decoratives category rather than towards products high on functionality. Where as the more sophisticated fur and leather goods with a greater orientation towards product functionality being supplied by US and European countries.
F i g u r e 3 . 3
Key Market Measurements – Fur, Feather and Leather
Market Measurement Details
World Market Size In 2003 US $20.97 bn CAGR (1999-2003) 5.9% Growth Rate (2002-2003) 8.7% Market Share of Top Three Importing Countries 41.4% Market Share of Top Three Exporting Countries 57.0%
c) Hampered by strong anti-leather animal support movements, and further aggravated
by factors like high import tariffs and quota system, world wide imports of leather goods showed a strong decline in 2001 and 2002.
d) However in 2003 the resurging appeal of Leather goods per se, and as fashion
accessories led to increase in demand for leather items with versatile and trendy
Source: Frost & Sullivan
42
Confidential To Export Promotion Council for Handicrafts © 2005 Frost & Sullivan
designs. Additionally, the increasing use of customized leather articles being used as corporate gifts in US, Canada, Japan and EU countries also positively impacted the imports of leather goods like leather boxes, bags, cases, wallets and other leather based articles like diaries and organizers. Even the leather clothing and accessories segment picked up due the increasing preference of US female consumers towards contemporary leather ensembles with variants like retro-inspired looks being perceived as elegant and conforming to the return of ‘ladylike’ dressing trends. Even leather footwear is slowly making a comeback. As such the world wide leather imports of almost all subcategories of leather goods have picked up since 2003 and are expected to further increase in 2006 due to the quota system being eliminated in 2005.
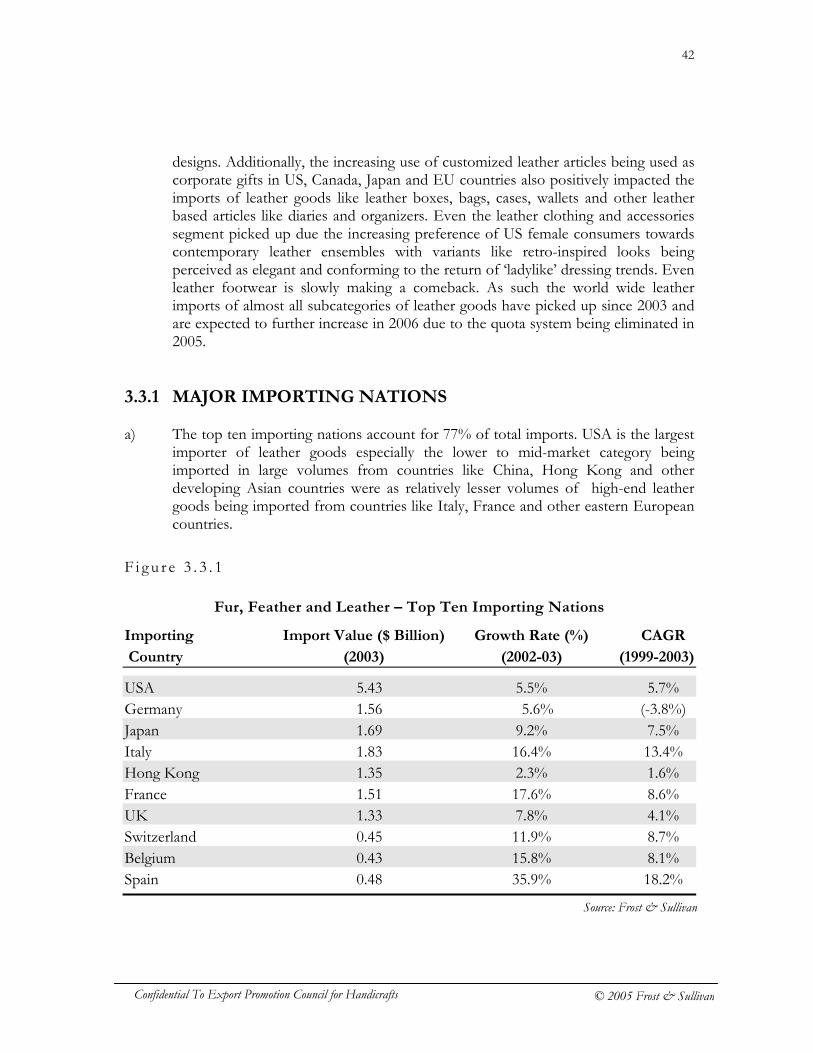
3.3.1 MAJOR IMPORTING NATIONS a) The top ten importing nations account for 77% of total imports. USA is the largest
importer of leather goods especially the lower to mid-market category being imported in large volumes from countries like China, Hong Kong and other developing Asian countries were as relatively lesser volumes of high-end leather goods being imported from countries like Italy, France and other eastern European countries.
F i g u r e 3 . 3 . 1
Fur, Feather and Leather – Top Ten Importing Nations
Importing Import Value ($ Billion) Growth Rate (%) CAGR
Country (2003) (2002-03) (1999-2003)
USA 5.43 5.5% 5.7% Germany 1.56 5.6% (-3.8%) Japan 1.69 9.2% 7.5% Italy 1.83 16.4% 13.4% Hong Kong 1.35 2.3% 1.6% France 1.51 17.6% 8.6% UK 1.33 7.8% 4.1% Switzerland 0.45 11.9% 8.7% Belgium 0.43 15.8% 8.1% Spain 0.48 35.9% 18.2%
Source: Frost & Sullivan
43
Confidential To Export Promotion Council for Handicrafts © 2005 Frost & Sullivan
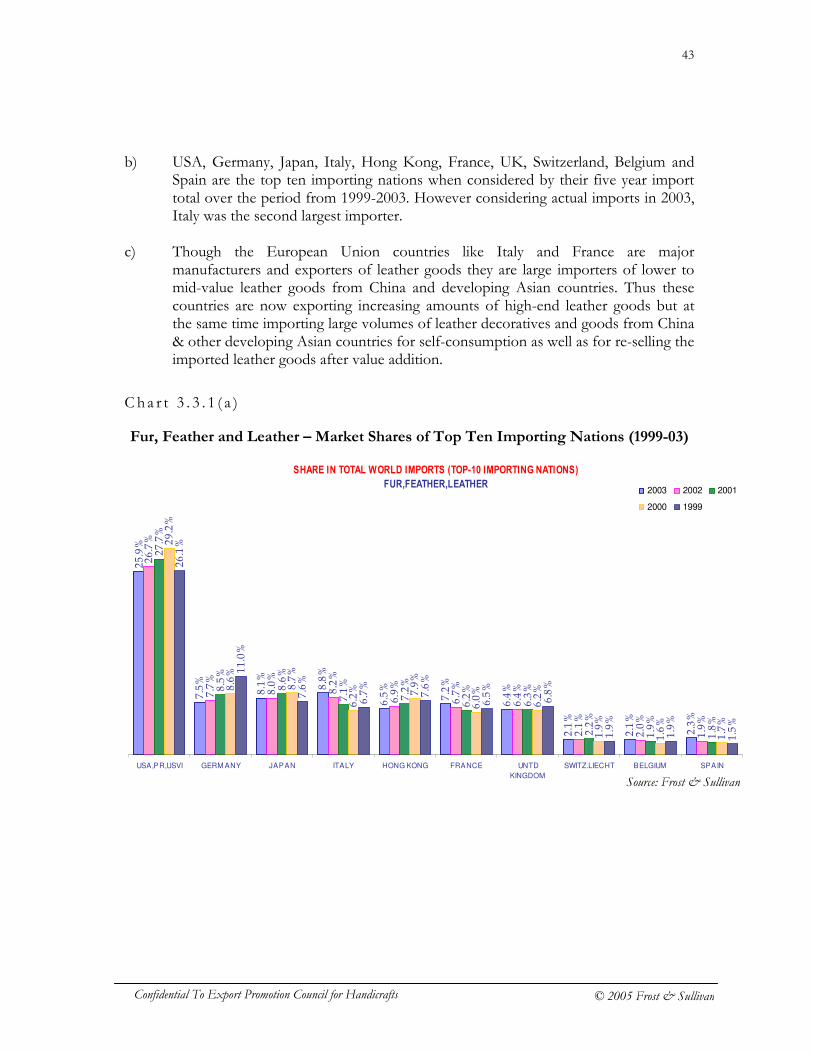
b) USA, Germany, Japan, Italy, Hong Kong, France, UK, Switzerland, Belgium and Spain are the top ten importing nations when considered by their five year import total over the period from 1999-2003. However considering actual imports in 2003, Italy was the second largest importer.
c) Though the European Union countries like Italy and France are major
manufacturers and exporters of leather goods they are large importers of lower to mid-value leather goods from China and developing Asian countries. Thus these countries are now exporting increasing amounts of high-end leather goods but at the same time importing large volumes of leather decoratives and goods from China & other developing Asian countries for self-consumption as well as for re-selling the imported leather goods after value addition.
Ch a r t 3 . 3 . 1 ( a )
Fur, Feather and Leather – Market Shares of Top Ten Importing Nations (1999-03)
SHARE IN TOTAL WORLD IMPORTS (TOP-10 IMPORTING NATIONS)
FUR,FEATHER,LEATHER
25.9%
7.5%
8.1%
8.8%
6.5%
7.2%
6.4%
2.1%
2.1%
2.3%
26.7%
7.7%
8.0%
8.2%
6.9%
6.7%
6.4%
2.1%
2.0%
1.9%
27.7%
8.5%
8.6%
7.1%
7.2%
6.2%
6.3%
2.2%
1.9%
1.8%
29.2%
8.6%
8.7%
6.2% 7.9%
6.0%
6.2%
1.9%
1.6%
1.7%
26.1%
11.0%
7.6%
6.7%
7.6%
6.5%
6.8%
1.9%
1.9%
1.5%
USA,PR,USVI GERM ANY JAPAN ITALY HONG KONG FRANCE UNTD
KINGDOM
SWITZ.LIECHT BELGIUM SPAIN
2003 2002 2001
2000 1999
Source: Frost & Sullivan
44
Confidential To Export Promotion Council for Handicrafts © 2005 Frost & Sullivan
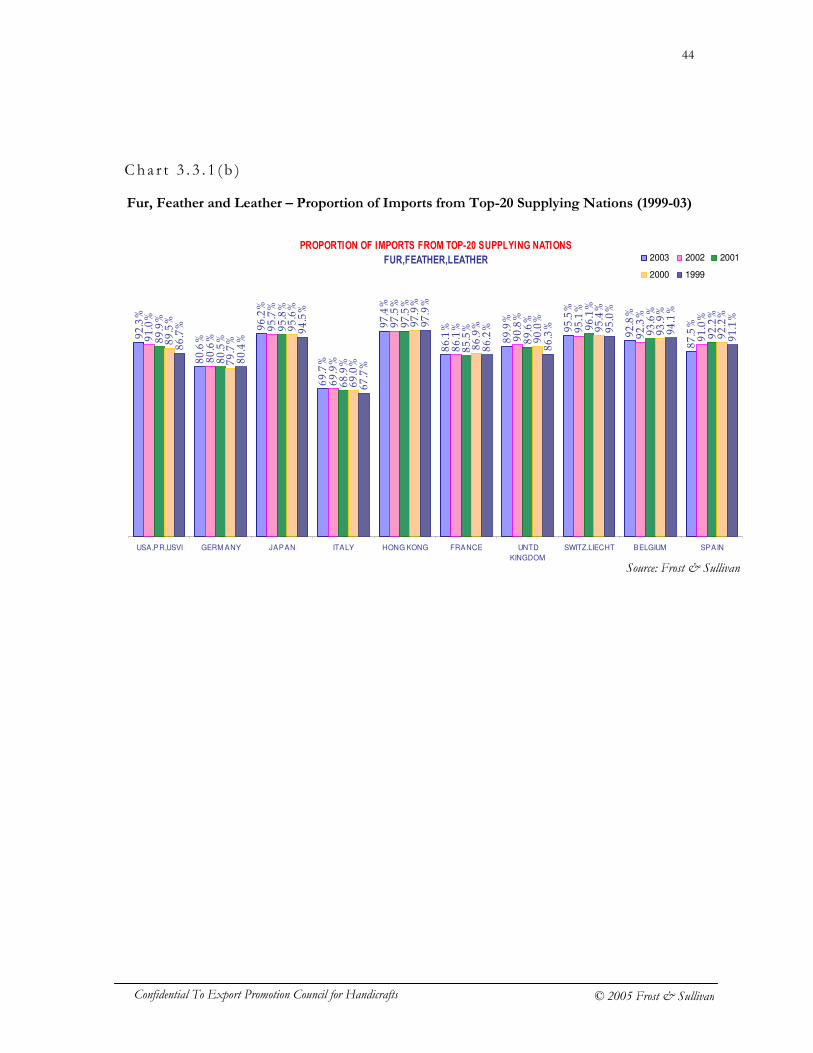
Cha r t 3 . 3 . 1 ( b )
Fur, Feather and Leather – Proportion of Imports from Top-20 Supplying Nations (1999-03)
PROPORTION OF IMPORTS FROM TOP-20 SUPPLYING NATIONS
FUR,FEATHER,LEATHER
92.3%
80.6%
96.2%
69.7%
97.4%
86.1%
89.9%
95.5%
92.8%
87.5%
91.0%
80.6%
95.7%
69.9%
97.5%
86.1%
90.8%
95.1%
92.3%
91.0%
89.9%
80.5%
95.8%
68.9%
97.5%
85.5%
89.6%
96.1%
93.6%
92.2%
89.5%
79.7%
95.6%
69.0%
97.9%
86.9%
90.0%
95.4%
93.9%
86.7%
80.4%
94.5%
67.7%
97.9%
86.2%
86.3% 95.0%
94.1%
91.1%
92.2%
USA,PR,USVI GERM ANY JAPAN ITALY HONG KONG FRANCE UNTD
KINGDOM
SWITZ.LIECHT BELGIUM SPAIN
2003 2002 2001
2000 1999
Source: Frost & Sullivan
45
Confidential To Export Promotion Council for Handicrafts © 2005 Frost & Sullivan
3.3.2 ATTRACTIVENESS OF DIFFERENT MARKETS
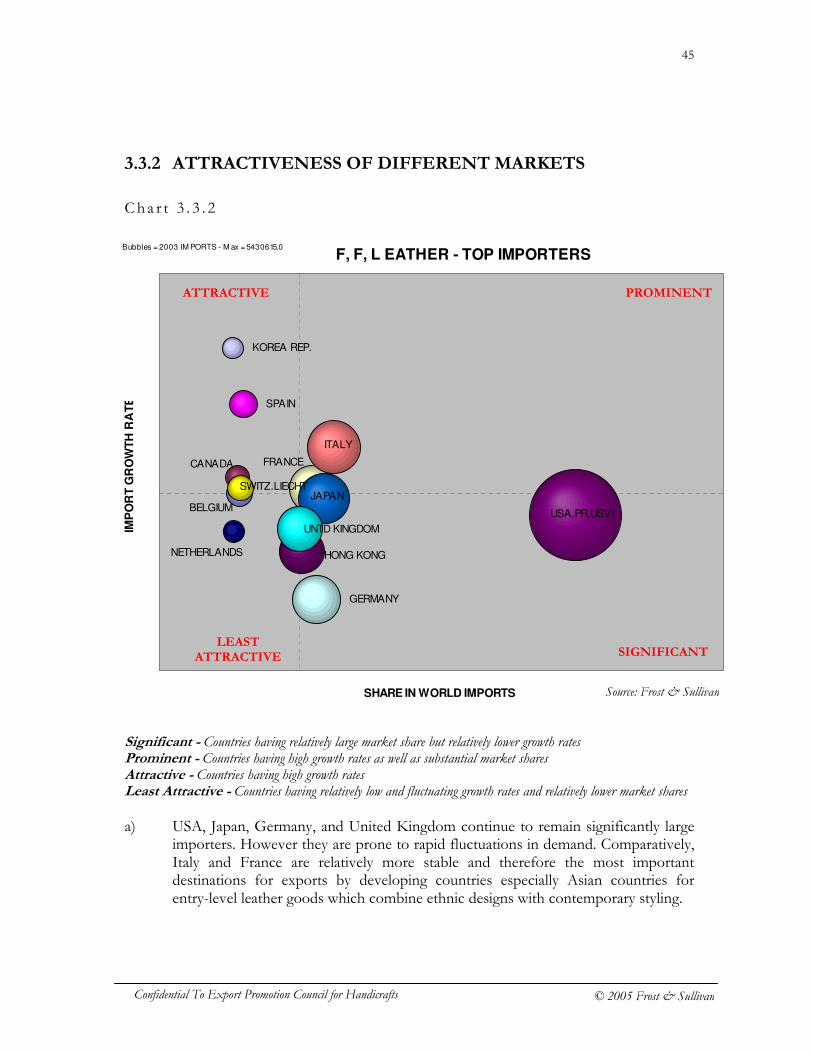
Cha r t 3 . 3 . 2
Significant - Countries having relatively large market share but relatively lower growth rates Prominent - Countries having high growth rates as well as substantial market shares Attractive - Countries having high growth rates Least Attractive - Countries having relatively low and fluctuating growth rates and relatively lower market shares a) USA, Japan, Germany, and United Kingdom continue to remain significantly large
importers. However they are prone to rapid fluctuations in demand. Comparatively, Italy and France are relatively more stable and therefore the most important destinations for exports by developing countries especially Asian countries for entry-level leather goods which combine ethnic designs with contemporary styling.
F, F, L EATHER - TOP IMPORTERS
BELGIUM
CANADA FRANCE
GERMANY
HONG KONG
ITALY
JAPAN
KOREA REP.
NETHERLANDS
SPAIN
SWITZ.LIECHT
UNTD KINGDOM
USA,PR,USVI
SHARE IN WORLD IMPORTS
IMP
OR
T G
RO
WT
H R
AT
E
Bubbles = 2003 IM PORTS - M ax = 5430615.0
ATTRACTIVE PROMINENT
LEAST ATTRACTIVE SIGNIFICANT
Source: Frost & Sullivan
46
Confidential To Export Promotion Council for Handicrafts © 2005 Frost & Sullivan
b) However, countries like Korea, Spain, Canada, and Switzerland and to an extent Belgium are promising markets due to their double digit growth rates.
3.3.3 MAJOR EXPORTING NATIONS a) The exports of fur, feather and leather goods is dominated by European Union
countries like Italy, France, Spain, Germany, Romania and Portugal who have consolidated their position as suppliers of high-end leather goods. However the extremely large volumes of lower and mid-market products being exported by China, has enabled it to control almost 30% of the total exports. The other Asian countries who account for significant exports are India, Hong Kong and Pakistan
F i g u r e 3 . 3 . 3
Fur, Feather and Leather – Top Ten Exporting Nations
Exporting Export Value ($ Billion) Growth Rate (%) CAGR
Country (2003) (2002-03) (1999-2003)
China 6.43 9.4% 9.9% Italy 4.20 12.5% 8.5% India 1.30 4.7% 3.3% France 1.11 15.4% 8.8% Spain 0.73 (-2.1%) 1.2% Germany 0.58 3.7% 0.6% Romania 0.55 16.0% 15.3% USA 0.39 12.3% (-2.1%) Turkey 0.41 4.9% 8.9% Portugal 0.32 5.0% (-2.7%)
b) Considering five year export values, so as to get an accurate position of the
exporting nations and to even out sporadic changes in imports, China, Italy, India, France, Spain, Germany, Romania, USA, Turkey and Portugal are the top ten exporters. The same countries continued to dominate the market even in 2003 in terms of export values. However the sudden increased exports of USA after two of decline resulted in USA overtaking Turkey to occupy the 8th position in 2003.
c) The other important players in 2003 were Tunisia (US $ 0.32 Billion), Pakistan (US
$ 0.26 Billion), Hong Kong (US $ 0.23 Billion), Korea (US $ 0.18 Billion), United
Source: Frost & Sullivan
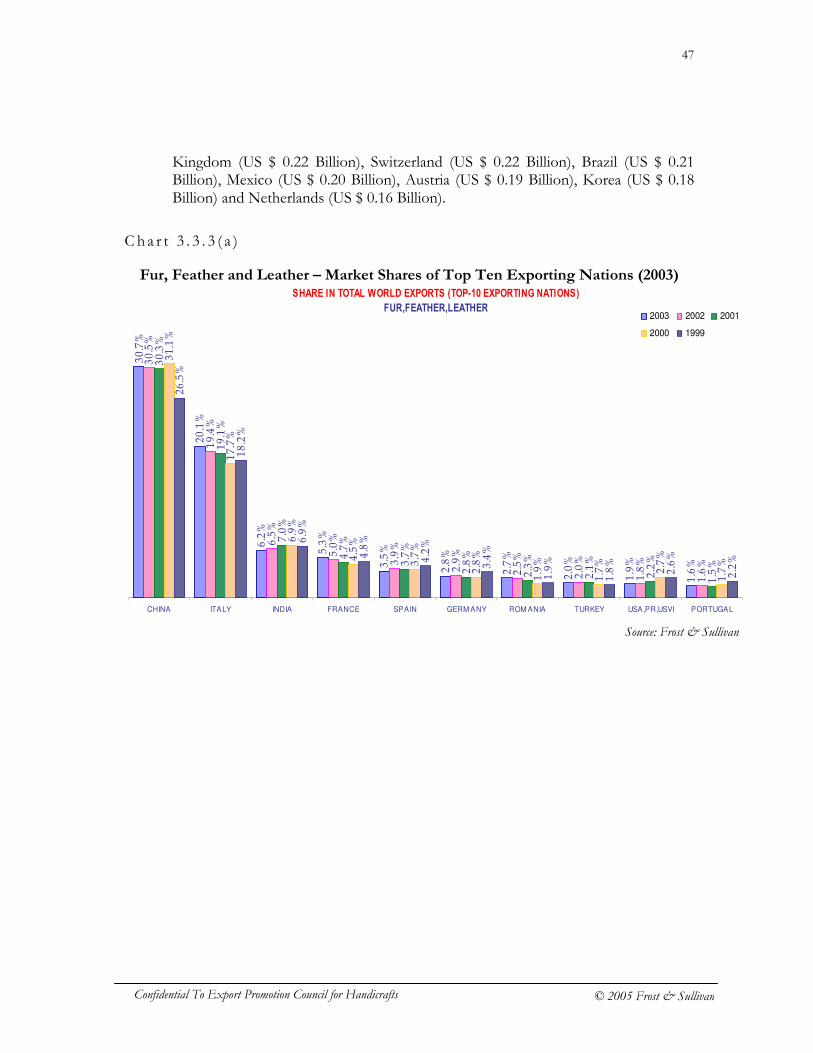
47
Confidential To Export Promotion Council for Handicrafts © 2005 Frost & Sullivan
Kingdom (US $ 0.22 Billion), Switzerland (US $ 0.22 Billion), Brazil (US $ 0.21 Billion), Mexico (US $ 0.20 Billion), Austria (US $ 0.19 Billion), Korea (US $ 0.18 Billion) and Netherlands (US $ 0.16 Billion).
C h a r t 3 . 3 . 3 ( a )
Fur, Feather and Leather – Market Shares of Top Ten Exporting Nations (2003)
SHARE IN TOTAL WORLD EXPORTS (TOP-10 EXPORTING NATIONS)
FUR,FEATHER,LEATHER
30.7%
20.1%
6.2%
5.3%
3.5%
2.8%
2.7%
2.0%
1.9%
1.6%
30.5%
19.4%
6.5%
5.0%
3.9%
2.9%
2.5%
2.0%
1.8%
1.6%
30.3%
19.1%
7.0%
4.7%
3.7%
2.8%
2.3%
2.1%
2.2%
1.5%
31.1%
17.7%
6.9%
4.5%
3.7%
2.8%
1.9%
1.7%
2.7%
1.7%
26.5%
18.2%
6.9%
4.8%
4.2%
3.4%
1.9%
1.8%
2.6%
2.2%
CHINA ITALY INDIA FRANCE SPAIN GERM ANY ROM ANIA TURKEY USA,PR,USVI PORTUGAL
2003 2002 2001
2000 1999
Source: Frost & Sullivan
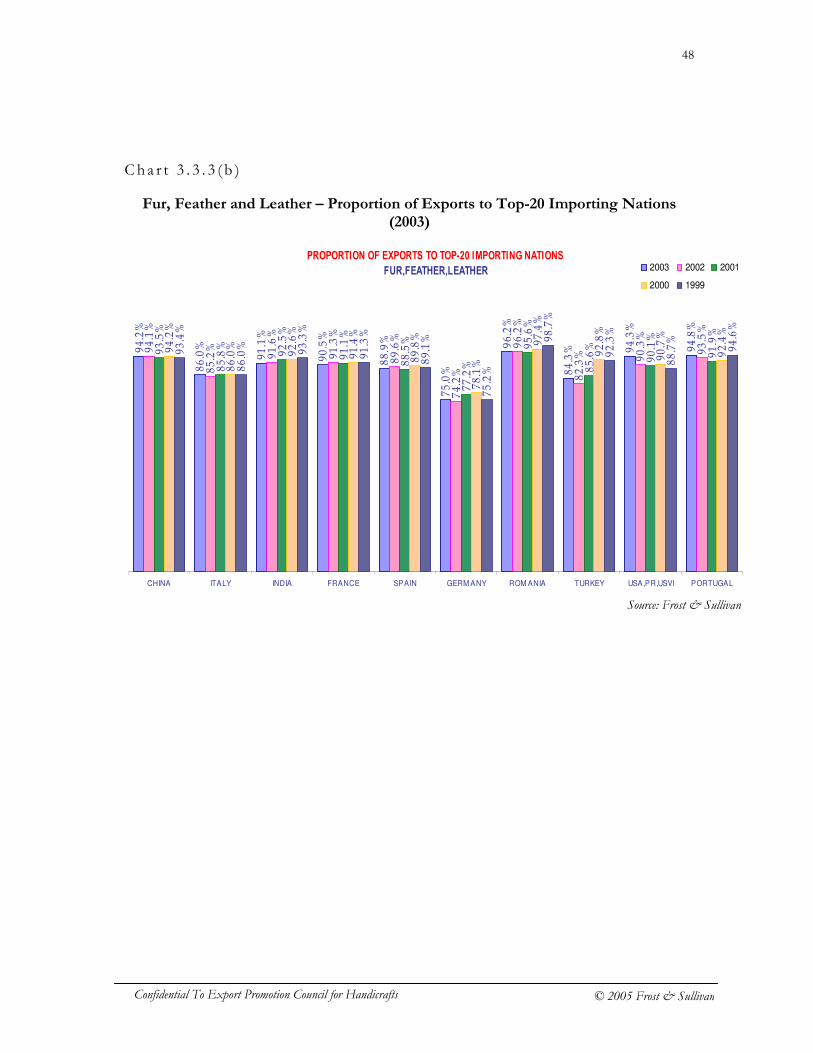
48
Confidential To Export Promotion Council for Handicrafts © 2005 Frost & Sullivan
Cha r t 3 . 3 . 3 ( b )
Fur, Feather and Leather – Proportion of Exports to Top-20 Importing Nations (2003)
PROPORTION OF EXPORTS TO TOP-20 IMPORTING NATIONS
FUR,FEATHER,LEATHER
94.2%
86.0%
91.1%
90.5%
88.9%
75.0%
96.2%
84.3% 94.3%
94.8%
94.1%
85.2%
91.6%
91.3%
89.6%
74.2%
96.2%
82.3% 90.3%
93.5%
93.5%
85.8%
92.5%
91.1%
88.5%
77.2%
95.6%
85.6%
90.1%
91.9%
94.2%
86.0%
92.6%
91.4%
89.8%
78.1%
97.4%
92.8%
90.7%
92.4%
93.4%
86.0%
93.3%
91.3%
89.1%
75.2%
98.7%
92.3%
88.7%
94.6%
CHINA ITALY INDIA FRANCE SPAIN GERM ANY ROM ANIA TURKEY USA,PR,USVI PORTUGAL
2003 2002 2001
2000 1999
Source: Frost & Sullivan
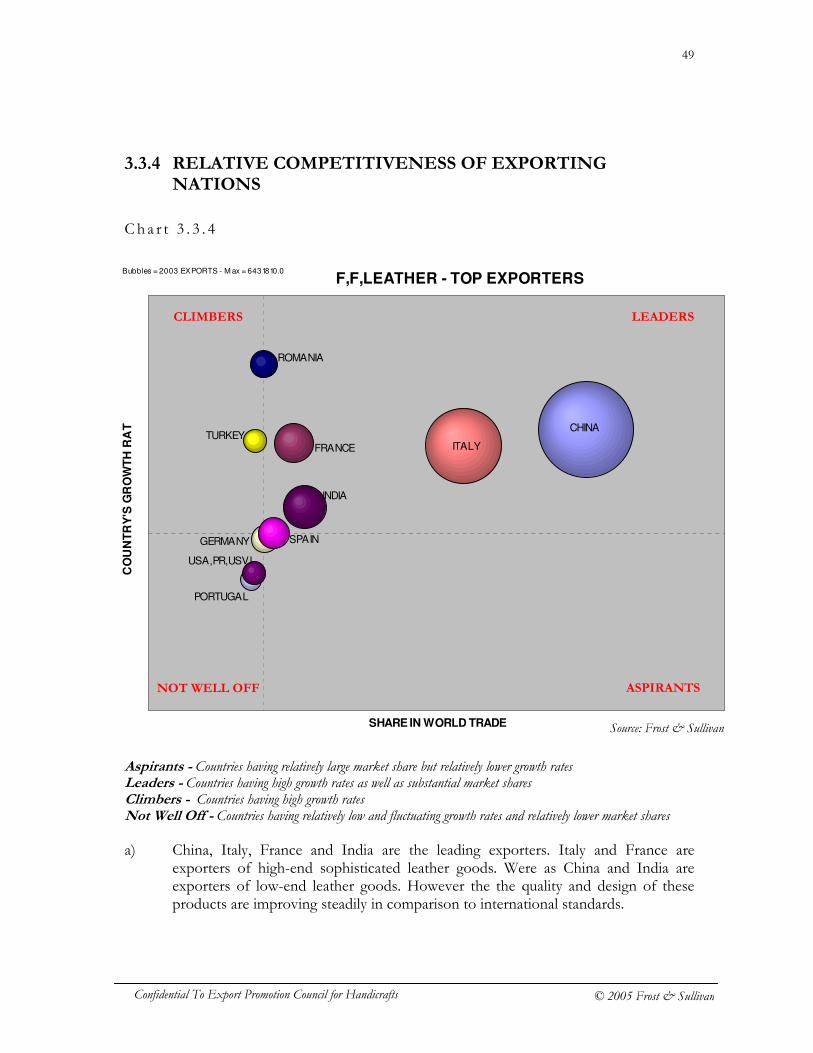
49
Confidential To Export Promotion Council for Handicrafts © 2005 Frost & Sullivan
3.3.4 RELATIVE COMPETITIVENESS OF EXPORTING NATIONS
Cha r t 3 . 3 . 4
Aspirants - Countries having relatively large market share but relatively lower growth rates Leaders - Countries having high growth rates as well as substantial market shares Climbers - Countries having high growth rates Not Well Off - Countries having relatively low and fluctuating growth rates and relatively lower market shares a) China, Italy, France and India are the leading exporters. Italy and France are
exporters of high-end sophisticated leather goods. Were as China and India are exporters of low-end leather goods. However the the quality and design of these products are improving steadily in comparison to international standards.
F,F,LEATHER - TOP EXPORTERS
CHINA
FRANCE
GERMANY
INDIA
ITALY
PORTUGAL
ROMANIA
SPAIN
TURKEY
USA,PR,USVI
SHARE IN WORLD TRADE
CO
UN
TR
Y'S
GR
OW
TH
RA
TE
Bubbles = 2003 EXPORTS - M ax = 6431810.0
LEADERS CLIMBERS
ASPIRANTS NOT WELL OFF
Source: Frost & Sullivan
50
Confidential To Export Promotion Council for Handicrafts © 2005 Frost & Sullivan
b) China has been able to dominate the exports of Leather, due to its advantage in the market in terms of lower pricing (mainly due to the lower costs of manufacturing), quick turn-around time on design development and supply. The fact that many large leather goods manufactures in Hong Kong have shifted their production to China mainland has helped Chinese manufacturers to improve its manufacturing processes. More over the trend of some large Chinese manufacturers to vertically integrate enabling better quality control and flexibility in production has also helped in increasing export capabilities.
c) Countries like Romania and Turkey, though relatively small in terms of market size,
can’t be ignored as these countries have shown excellent growth. Especially Romania has grown with a CAGR of 16% through 1999-2003.
d) Countries like Germany and Spain are significant exporters and can’t yet be ruled
out in spite of their decreasing exports. These countries are likely to turnaround with the improvements in economic conditions especially in case of Germany and more so when the present state of consolidations and upheavals in the industry structure is complete. Both the countries were adversely affected due to decrease in demand for Leather goods in the wake of the anti-leather sentiments in 2001 and 2002. The event had caused the small and medium sized manufacturers and retailers to hold excessive stock which further increased the competitive pressures.
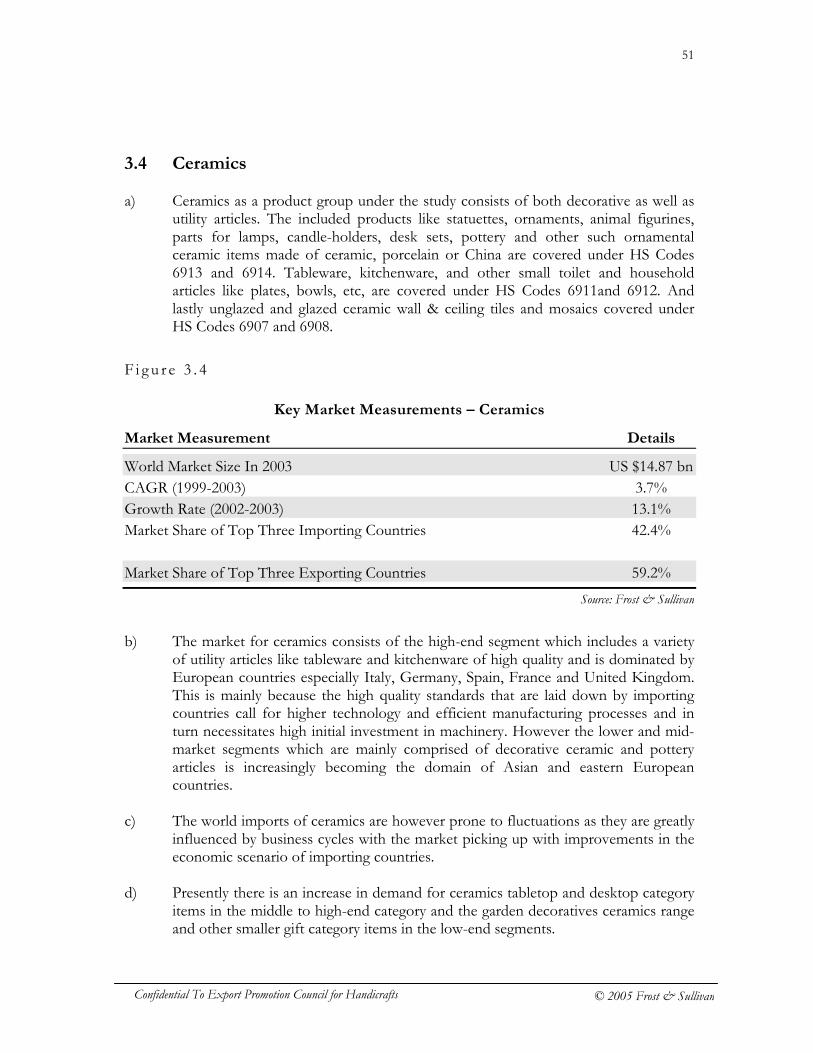
51
Confidential To Export Promotion Council for Handicrafts © 2005 Frost & Sullivan
3.4 Ceramics a) Ceramics as a product group under the study consists of both decorative as well as
utility articles. The included products like statuettes, ornaments, animal figurines, parts for lamps, candle-holders, desk sets, pottery and other such ornamental ceramic items made of ceramic, porcelain or China are covered under HS Codes 6913 and 6914. Tableware, kitchenware, and other small toilet and household articles like plates, bowls, etc, are covered under HS Codes 6911and 6912. And lastly unglazed and glazed ceramic wall & ceiling tiles and mosaics covered under HS Codes 6907 and 6908.
F i g u r e 3 . 4
Key Market Measurements – Ceramics
Market Measurement Details
World Market Size In 2003 US $14.87 bn CAGR (1999-2003) 3.7% Growth Rate (2002-2003) 13.1% Market Share of Top Three Importing Countries 42.4% Market Share of Top Three Exporting Countries 59.2%
b) The market for ceramics consists of the high-end segment which includes a variety
of utility articles like tableware and kitchenware of high quality and is dominated by European countries especially Italy, Germany, Spain, France and United Kingdom. This is mainly because the high quality standards that are laid down by importing countries call for higher technology and efficient manufacturing processes and in turn necessitates high initial investment in machinery. However the lower and mid-market segments which are mainly comprised of decorative ceramic and pottery articles is increasingly becoming the domain of Asian and eastern European countries.
c) The world imports of ceramics are however prone to fluctuations as they are greatly
influenced by business cycles with the market picking up with improvements in the economic scenario of importing countries.
d) Presently there is an increase in demand for ceramics tabletop and desktop category
items in the middle to high-end category and the garden decoratives ceramics range and other smaller gift category items in the low-end segments.
Source: Frost & Sullivan
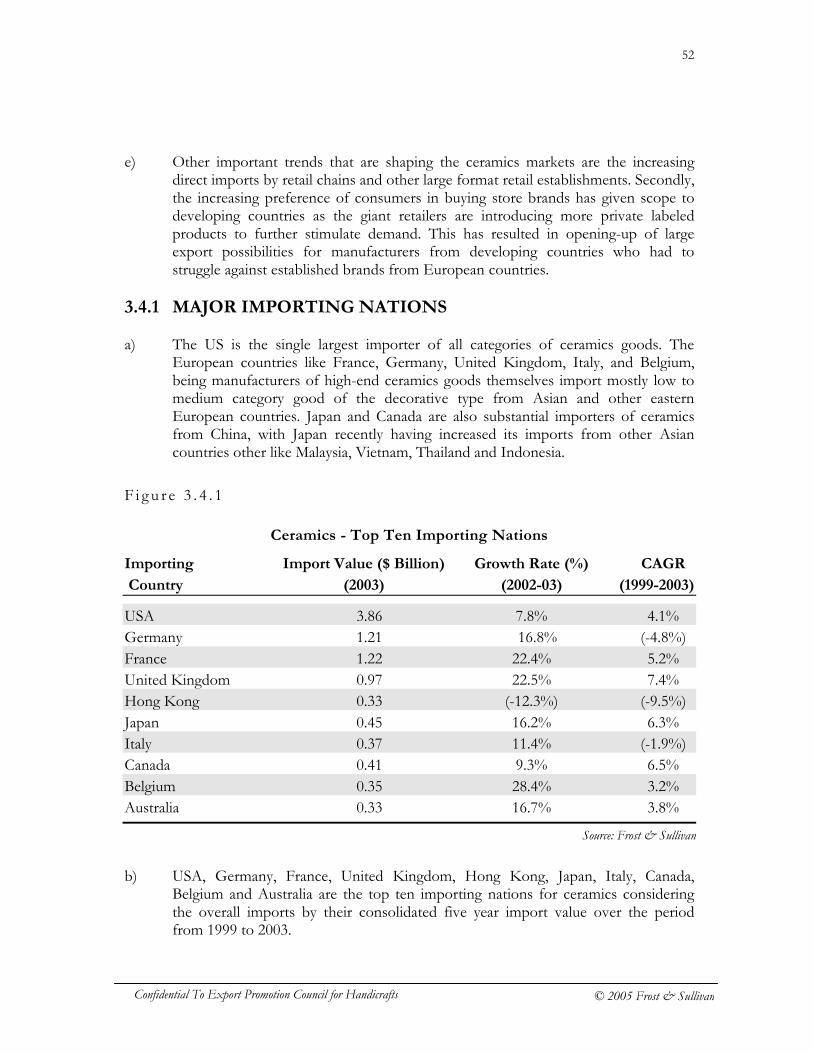
52
Confidential To Export Promotion Council for Handicrafts © 2005 Frost & Sullivan
e) Other important trends that are shaping the ceramics markets are the increasing direct imports by retail chains and other large format retail establishments. Secondly, the increasing preference of consumers in buying store brands has given scope to developing countries as the giant retailers are introducing more private labeled products to further stimulate demand. This has resulted in opening-up of large export possibilities for manufacturers from developing countries who had to struggle against established brands from European countries.
3.4.1 MAJOR IMPORTING NATIONS a) The US is the single largest importer of all categories of ceramics goods. The
European countries like France, Germany, United Kingdom, Italy, and Belgium, being manufacturers of high-end ceramics goods themselves import mostly low to medium category good of the decorative type from Asian and other eastern European countries. Japan and Canada are also substantial importers of ceramics from China, with Japan recently having increased its imports from other Asian countries other like Malaysia, Vietnam, Thailand and Indonesia.
F i g u r e 3 . 4 . 1
Ceramics - Top Ten Importing Nations
Importing Import Value ($ Billion) Growth Rate (%) CAGR
Country (2003) (2002-03) (1999-2003)
USA 3.86 7.8% 4.1% Germany 1.21 16.8% (-4.8%) France 1.22 22.4% 5.2% United Kingdom 0.97 22.5% 7.4% Hong Kong 0.33 (-12.3%) (-9.5%) Japan 0.45 16.2% 6.3% Italy 0.37 11.4% (-1.9%) Canada 0.41 9.3% 6.5% Belgium 0.35 28.4% 3.2% Australia 0.33 16.7% 3.8%
b) USA, Germany, France, United Kingdom, Hong Kong, Japan, Italy, Canada,
Belgium and Australia are the top ten importing nations for ceramics considering the overall imports by their consolidated five year import value over the period from 1999 to 2003.
Source: Frost & Sullivan
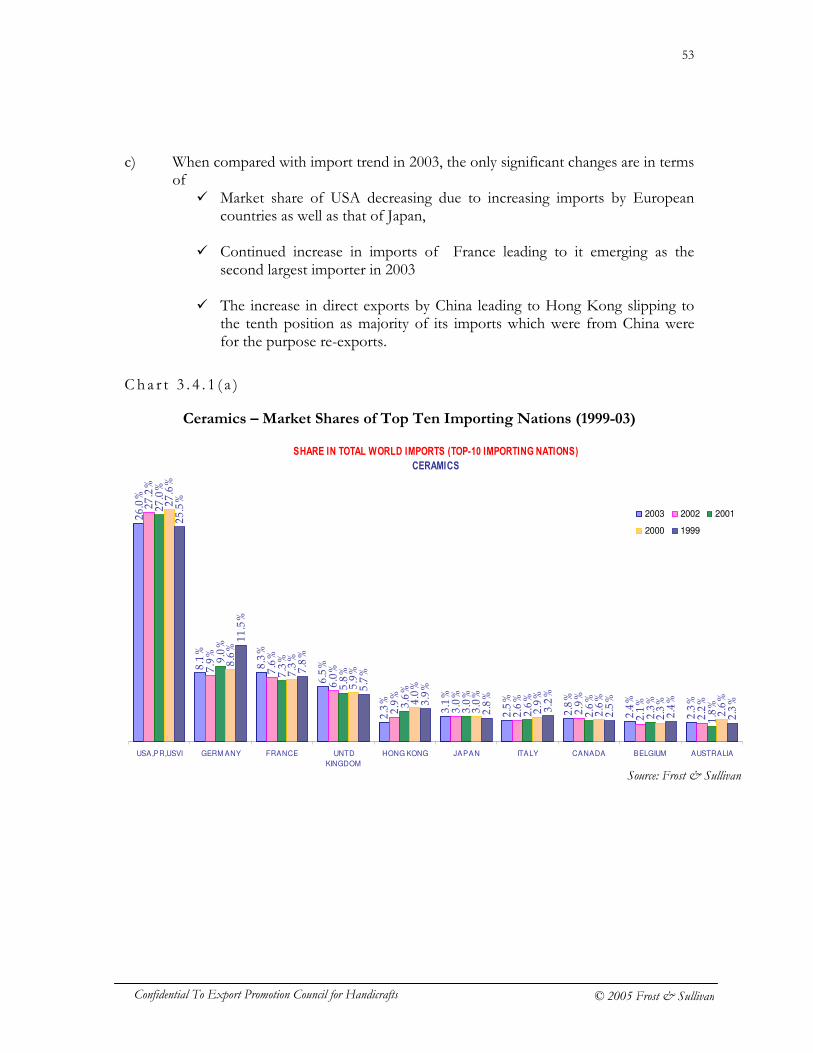
53
Confidential To Export Promotion Council for Handicrafts © 2005 Frost & Sullivan
c) When compared with import trend in 2003, the only significant changes are in terms of
� Market share of USA decreasing due to increasing imports by European countries as well as that of Japan,
� Continued increase in imports of France leading to it emerging as the
second largest importer in 2003 � The increase in direct exports by China leading to Hong Kong slipping to
the tenth position as majority of its imports which were from China were for the purpose re-exports.
Cha r t 3 . 4 . 1 ( a )
Ceramics – Market Shares of Top Ten Importing Nations (1999-03)
SHARE IN TOTAL WORLD IMPORTS (TOP-10 IMPORTING NATIONS)
CERAMICS
26.0%
8.1%
8.3%
6.5%
2.3%
3.1%
2.5%
2.8%
2.4%
2.3%
27.2%
7.9%
7.6%
6.0%
2.9%
3.0%
2.6%
2.9%
2.1%
2.2%
27.0%
9.0%
7.3%
5.8%
3.6%
3.0%
2.6%
2.6%
2.3%
1.8%
27.6%
8.6%
7.3%
5.9%
4.0%
3.0%
2.9%
2.6%
2.3%
2.6%
25.5%
11.5%
7.8%
5.7%
3.9%
2.8%
3.2%
2.5%
2.4%
2.3%
USA,PR,USVI GERM ANY FRANCE UNTD
KINGDOM
HONG KONG JAPAN ITALY CANADA BELGIUM AUSTRALIA
2003 2002 2001
2000 1999
Source: Frost & Sullivan
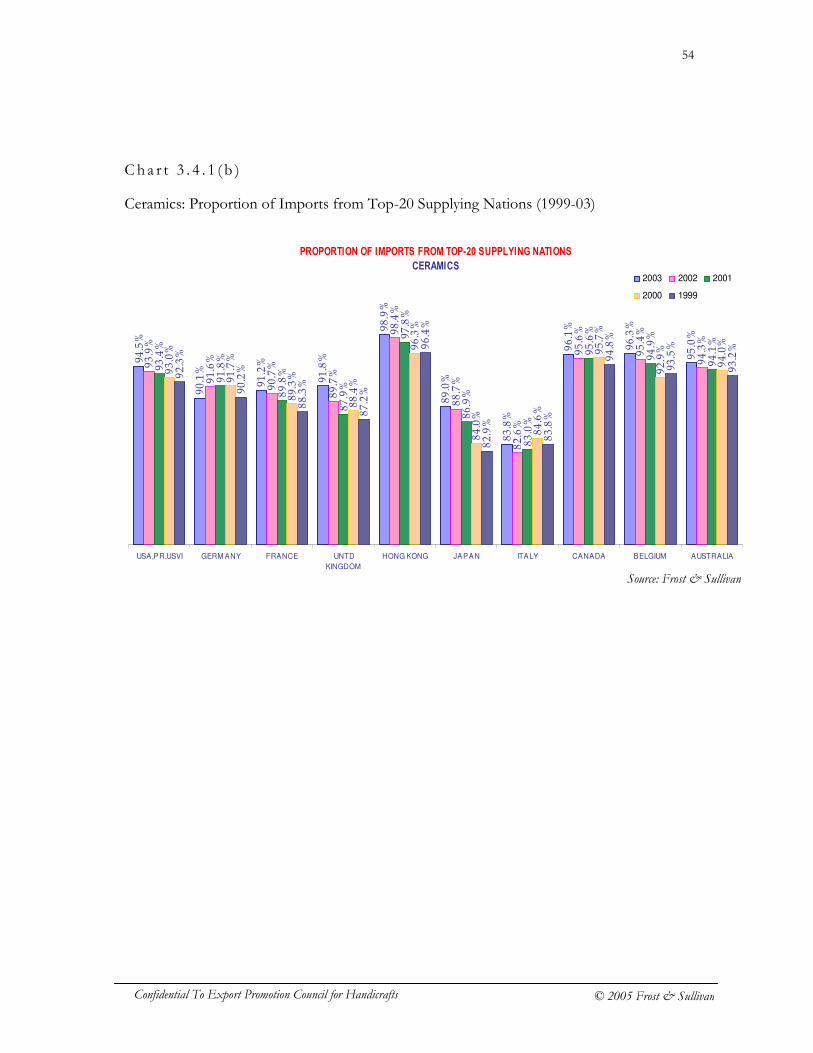
54
Confidential To Export Promotion Council for Handicrafts © 2005 Frost & Sullivan
Cha r t 3 . 4 . 1 ( b )
Ceramics: Proportion of Imports from Top-20 Supplying Nations (1999-03)
PROPORTION OF IMPORTS FROM TOP-20 SUPPLYING NATIONS
CERAMICS
94.5%
90.1%
91.2%
91.8%
98.9%
89.0%
83.8%
96.1%
96.3%
95.0%
93.9%
91.6%
90.7%
89.7%
98.4%
88.7%
82.6%
95.6%
95.4%
94.3%
93.4%
91.8%
89.8%
87.9%
97.8%
86.9%
83.0%
95.6%
94.9%
94.1%
93.0%
91.7%
89.3%
88.4%
96.3%
84.0%
84.6%
95.7%
92.9%
94.0%
92.3%
90.2%
88.3%
87.2%
96.4%
82.9%
83.8%
94.8%
93.5%
93.2%
USA,PR,USVI GERM ANY FRANCE UNTD
KINGDOM
HONG KONG JAPAN ITALY CANADA BELGIUM AUSTRALIA
2003 2002 2001
2000 1999
Source: Frost & Sullivan
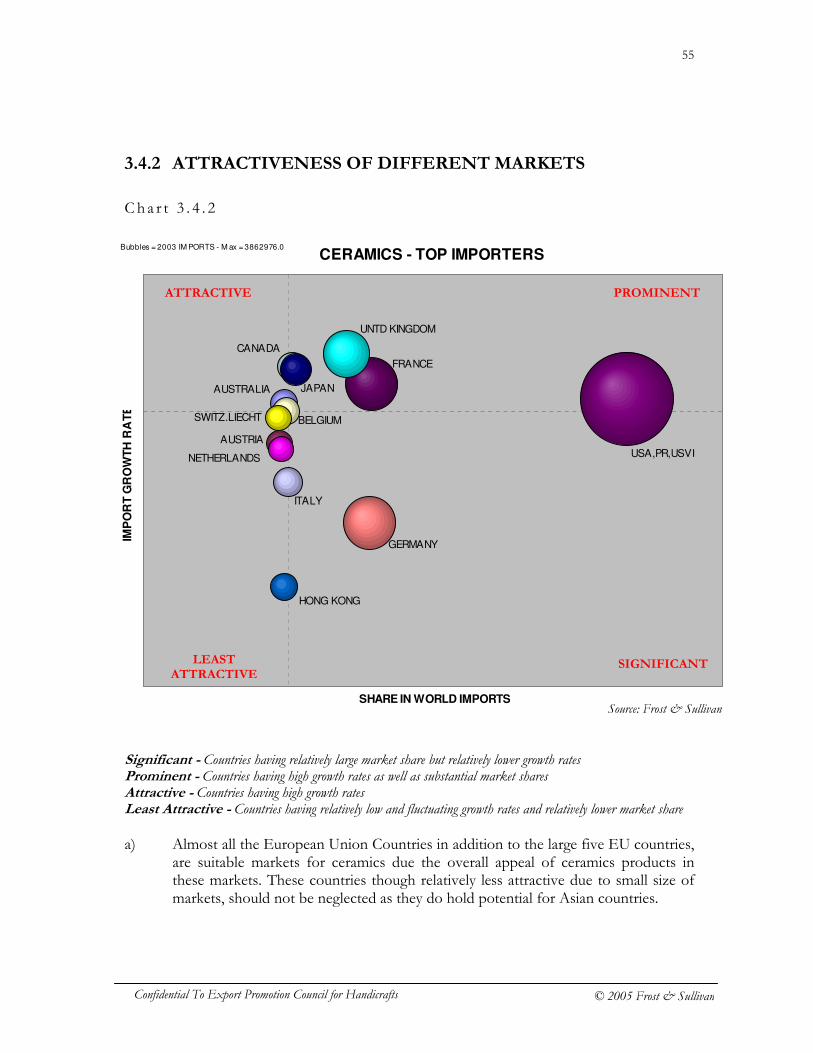
55
Confidential To Export Promotion Council for Handicrafts © 2005 Frost & Sullivan
3.4.2 ATTRACTIVENESS OF DIFFERENT MARKETS
Cha r t 3 . 4 . 2
Significant - Countries having relatively large market share but relatively lower growth rates Prominent - Countries having high growth rates as well as substantial market shares Attractive - Countries having high growth rates Least Attractive - Countries having relatively low and fluctuating growth rates and relatively lower market share
a) Almost all the European Union Countries in addition to the large five EU countries,
are suitable markets for ceramics due the overall appeal of ceramics products in these markets. These countries though relatively less attractive due to small size of markets, should not be neglected as they do hold potential for Asian countries.
CERAMICS - TOP IMPORTERS
AUSTRALIA
AUSTRIA
BELGIUM
CANADA
FRANCE
GERMANY
HONG KONG
ITALY
JAPAN
NETHERLANDS
SWITZ.LIECHT
UNTD KINGDOM
USA,PR,USVI
SHARE IN WORLD IMPORTS
IMP
OR
T G
RO
WT
H R
AT
E
Bubbles = 2003 IM PORTS - M ax = 3862976.0
PROMINENT ATTRACTIVE
SIGNIFICANT LEAST ATTRACTIVE
Source: Frost & Sullivan
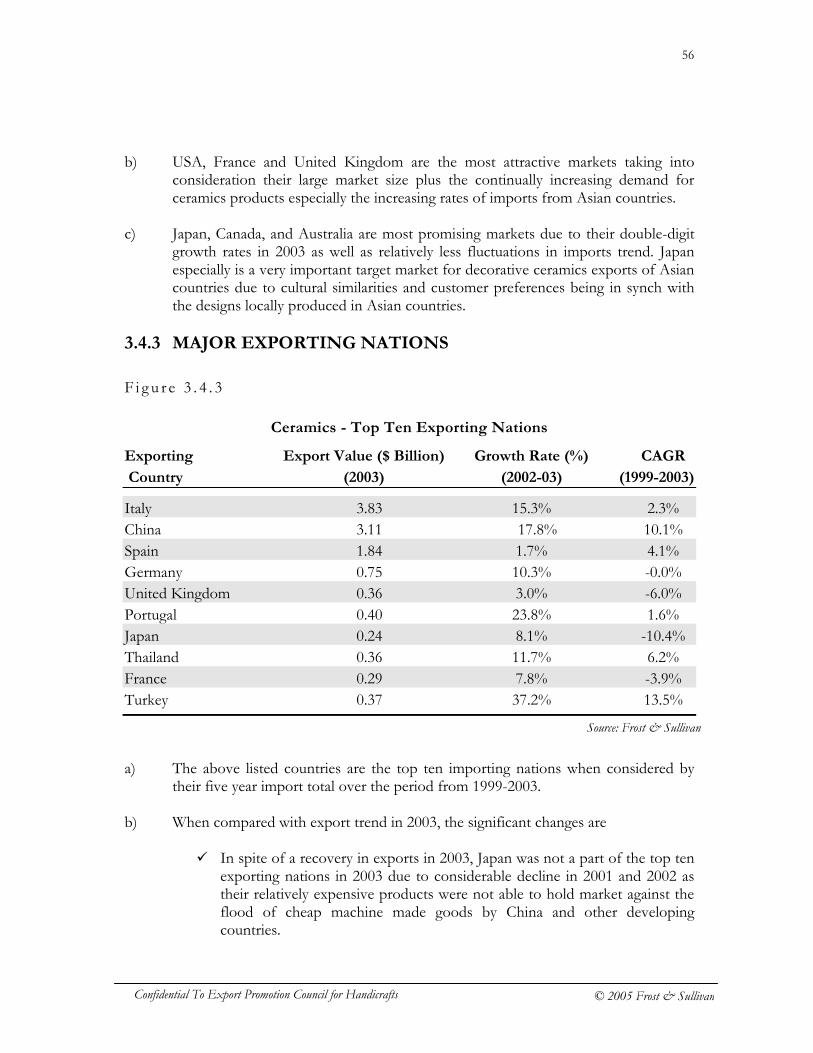
56
Confidential To Export Promotion Council for Handicrafts © 2005 Frost & Sullivan
b) USA, France and United Kingdom are the most attractive markets taking into consideration their large market size plus the continually increasing demand for ceramics products especially the increasing rates of imports from Asian countries.
c) Japan, Canada, and Australia are most promising markets due to their double-digit
growth rates in 2003 as well as relatively less fluctuations in imports trend. Japan especially is a very important target market for decorative ceramics exports of Asian countries due to cultural similarities and customer preferences being in synch with the designs locally produced in Asian countries.
3.4.3 MAJOR EXPORTING NATIONS
F i g u r e 3 . 4 . 3
Ceramics - Top Ten Exporting Nations
Exporting Export Value ($ Billion) Growth Rate (%) CAGR
Country (2003) (2002-03) (1999-2003)
Italy 3.83 15.3% 2.3% China 3.11 17.8% 10.1% Spain 1.84 1.7% 4.1% Germany 0.75 10.3% -0.0% United Kingdom 0.36 3.0% -6.0% Portugal 0.40 23.8% 1.6% Japan 0.24 8.1% -10.4% Thailand 0.36 11.7% 6.2% France 0.29 7.8% -3.9% Turkey 0.37 37.2% 13.5%
a) The above listed countries are the top ten importing nations when considered by
their five year import total over the period from 1999-2003. b) When compared with export trend in 2003, the significant changes are
� In spite of a recovery in exports in 2003, Japan was not a part of the top ten exporting nations in 2003 due to considerable decline in 2001 and 2002 as their relatively expensive products were not able to hold market against the flood of cheap machine made goods by China and other developing countries.
Source: Frost & Sullivan
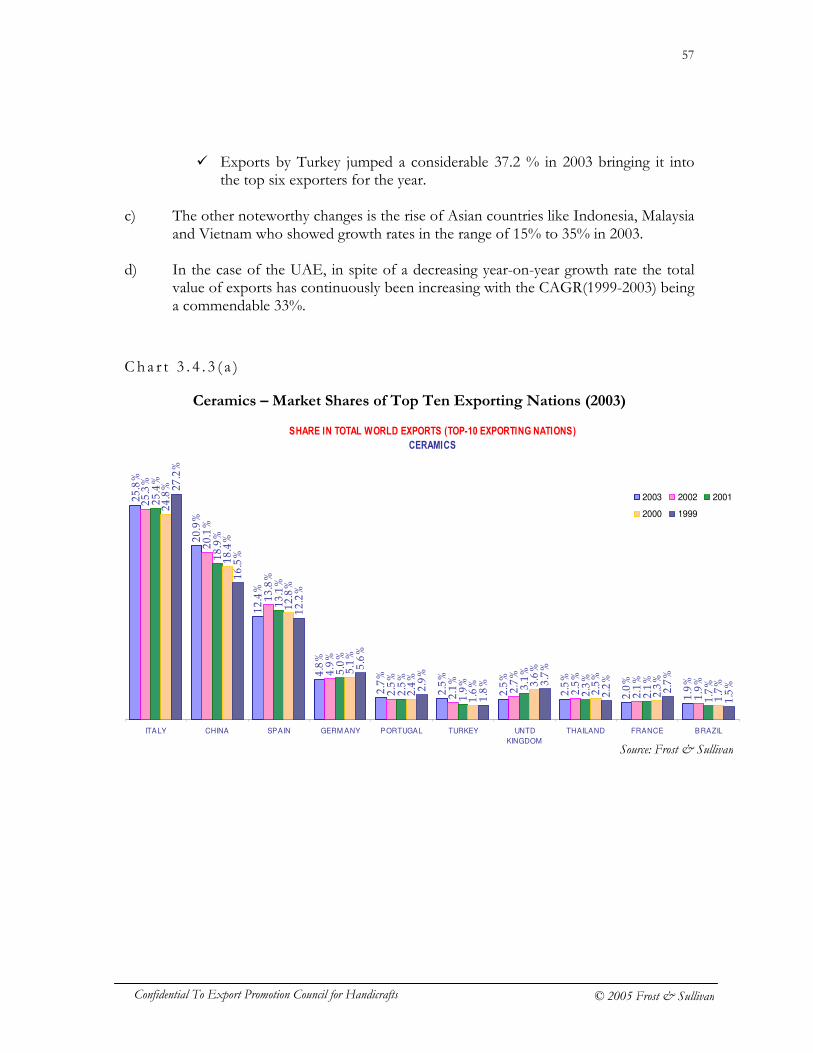
57
Confidential To Export Promotion Council for Handicrafts © 2005 Frost & Sullivan
� Exports by Turkey jumped a considerable 37.2 % in 2003 bringing it into the top six exporters for the year.
c) The other noteworthy changes is the rise of Asian countries like Indonesia, Malaysia
and Vietnam who showed growth rates in the range of 15% to 35% in 2003. d) In the case of the UAE, in spite of a decreasing year-on-year growth rate the total
value of exports has continuously been increasing with the CAGR(1999-2003) being a commendable 33%.
Cha r t 3 . 4 . 3 ( a )
Ceramics – Market Shares of Top Ten Exporting Nations (2003)
SHARE IN TOTAL WORLD EXPORTS (TOP-10 EXPORTING NATIONS)
CERAMICS
25.8%
20.9%
12.4%
4.8%
2.7%
2.5%
2.5%
2.5%
2.0%
1.9%
25.3%
20.1%
13.8%
4.9%
2.5%
2.1%
2.7%
2.5%
2.1%
1.9%
25.4%
18.9%
13.1%
5.0%
2.5%
1.9% 3.1%
2.3%
2.1%
1.7%
24.8%
18.4%
12.8%
5.1%
2.4%
1.6% 3.6%
2.5%
2.3%
1.7%
27.2%
16.5%
12.2%
5.6%
2.9%
1.8% 3.7%
2.2%
2.7%
1.5%
ITALY CHINA SPAIN GERM ANY PORTUGAL TURKEY UNTD
KINGDOM
THAILAND FRANCE BRAZIL
2003 2002 2001
2000 1999
Source: Frost & Sullivan
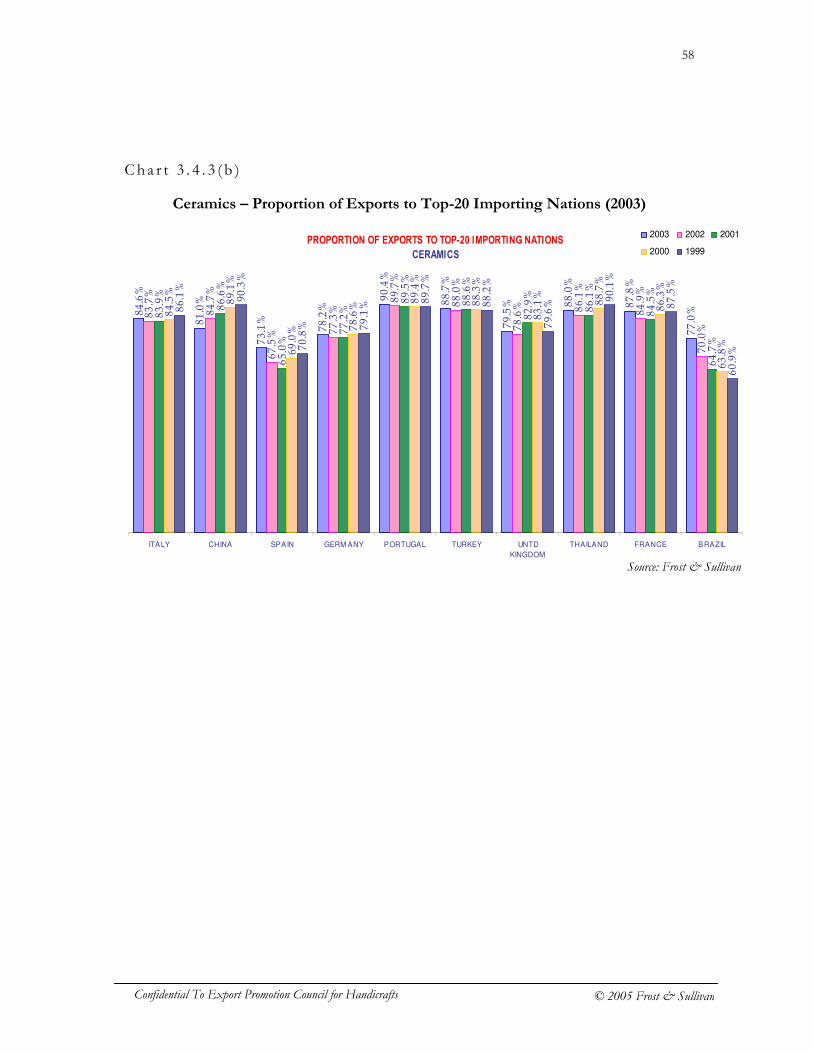
58
Confidential To Export Promotion Council for Handicrafts © 2005 Frost & Sullivan
Cha r t 3 . 4 . 3 ( b )
Ceramics – Proportion of Exports to Top-20 Importing Nations (2003)
PROPORTION OF EXPORTS TO TOP-20 IMPORTING NATIONS
CERAMICS
84.6%
81.0%
73.1%
78.2%
90.4%
88.7%
79.5% 88.0%
87.8%
77.0%83.7%
84.7%
67.5%
77.3%
89.7%
88.0%
78.6% 86.1%
84.9%
70.0%
83.9%
86.6%
65.0%
77.2%
89.5%
88.6%
82.9%
86.1%
84.5%
64.7%
84.5%
89.1%
69.0% 78.6%
89.4%
88.3%
83.1%
88.7%
86.3%
63.8%
86.1%
90.3%
70.8% 79.1%
89.7%
88.2%
79.6%
90.1%
87.5%
60.9%
ITALY CHINA SPAIN GERM ANY PORTUGAL TURKEY UNTD
KINGDOM
THAILAND FRANCE BRAZIL
2003 2002 2001
2000 1999
Source: Frost & Sullivan
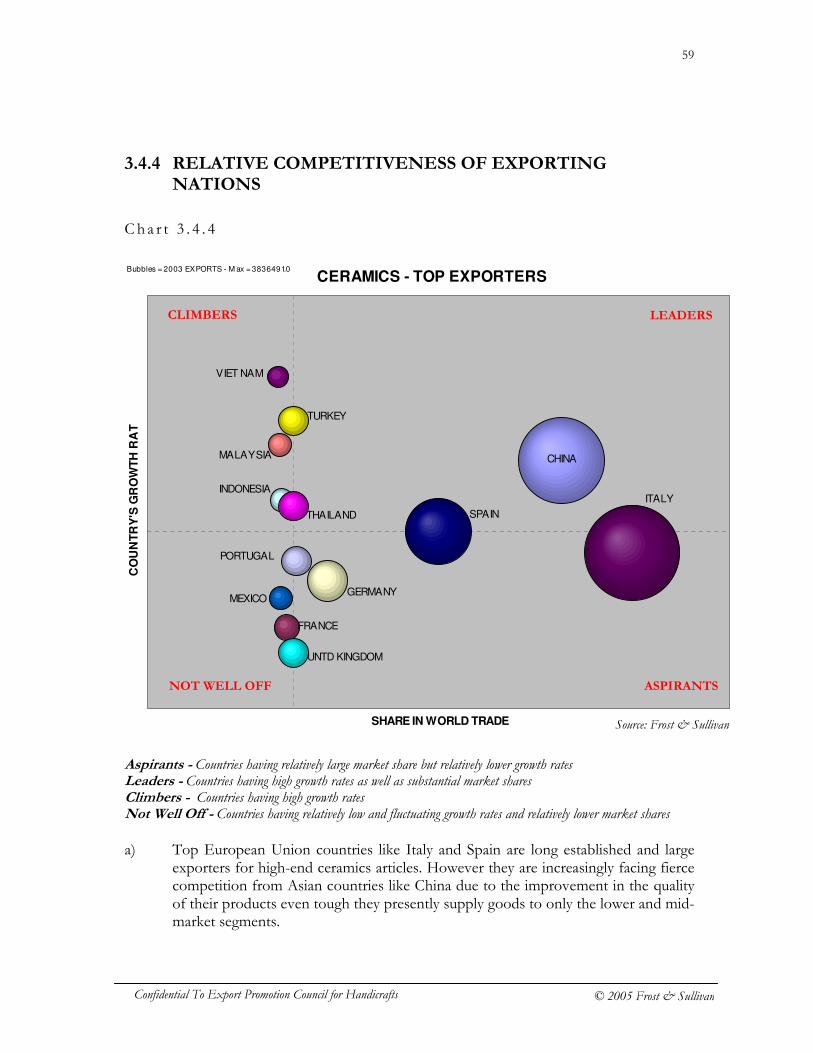
59
Confidential To Export Promotion Council for Handicrafts © 2005 Frost & Sullivan
3.4.4 RELATIVE COMPETITIVENESS OF EXPORTING NATIONS
Cha r t 3 . 4 . 4
Aspirants - Countries having relatively large market share but relatively lower growth rates Leaders - Countries having high growth rates as well as substantial market shares Climbers - Countries having high growth rates Not Well Off - Countries having relatively low and fluctuating growth rates and relatively lower market shares a) Top European Union countries like Italy and Spain are long established and large
exporters for high-end ceramics articles. However they are increasingly facing fierce competition from Asian countries like China due to the improvement in the quality of their products even tough they presently supply goods to only the lower and mid-market segments.
CERAMICS - TOP EXPORTERS
CHINA
FRANCE
GERMANY
INDONESIA ITALY
MALAYSIA
MEXICO
PORTUGAL
SPAIN THAILAND
TURKEY
UNTD KINGDOM
VIET NAM
SHARE IN WORLD TRADE
CO
UN
TR
Y'S
GR
OW
TH
RA
TE
Bubbles = 2003 EXPORTS - M ax = 3836491.0
LEADERS CLIMBERS
ASPIRANTS NOT WELL OFF
Source: Frost & Sullivan
60
Confidential To Export Promotion Council for Handicrafts © 2005 Frost & Sullivan
b) The increasing demand for lower priced decorative products has led to the developing countries like Vietnam, Indonesia and Malaysia slowly moving up due to remarkable growth in their exports. This is due to the fact that they have cheaper labor costs as opposed to the igh production cost incurred by European Union countries in order to meet high quality product standards.
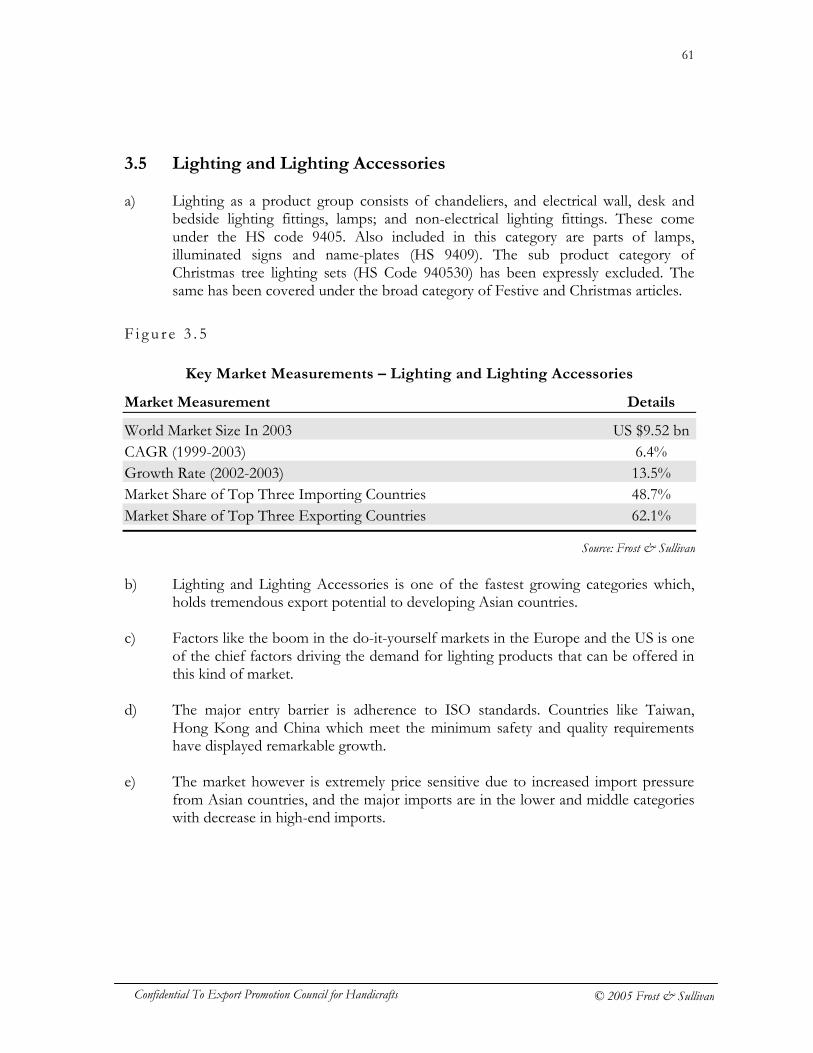
61
Confidential To Export Promotion Council for Handicrafts © 2005 Frost & Sullivan
3.5 Lighting and Lighting Accessories a) Lighting as a product group consists of chandeliers, and electrical wall, desk and
bedside lighting fittings, lamps; and non-electrical lighting fittings. These come under the HS code 9405. Also included in this category are parts of lamps, illuminated signs and name-plates (HS 9409). The sub product category of Christmas tree lighting sets (HS Code 940530) has been expressly excluded. The same has been covered under the broad category of Festive and Christmas articles.
F i g u r e 3 . 5
Key Market Measurements – Lighting and Lighting Accessories
Market Measurement Details
World Market Size In 2003 US $9.52 bn CAGR (1999-2003) 6.4% Growth Rate (2002-2003) 13.5% Market Share of Top Three Importing Countries 48.7% Market Share of Top Three Exporting Countries 62.1%
b) Lighting and Lighting Accessories is one of the fastest growing categories which,
holds tremendous export potential to developing Asian countries. c) Factors like the boom in the do-it-yourself markets in the Europe and the US is one
of the chief factors driving the demand for lighting products that can be offered in this kind of market.
d) The major entry barrier is adherence to ISO standards. Countries like Taiwan,
Hong Kong and China which meet the minimum safety and quality requirements have displayed remarkable growth.
e) The market however is extremely price sensitive due to increased import pressure
from Asian countries, and the major imports are in the lower and middle categories with decrease in high-end imports.
Source: Frost & Sullivan
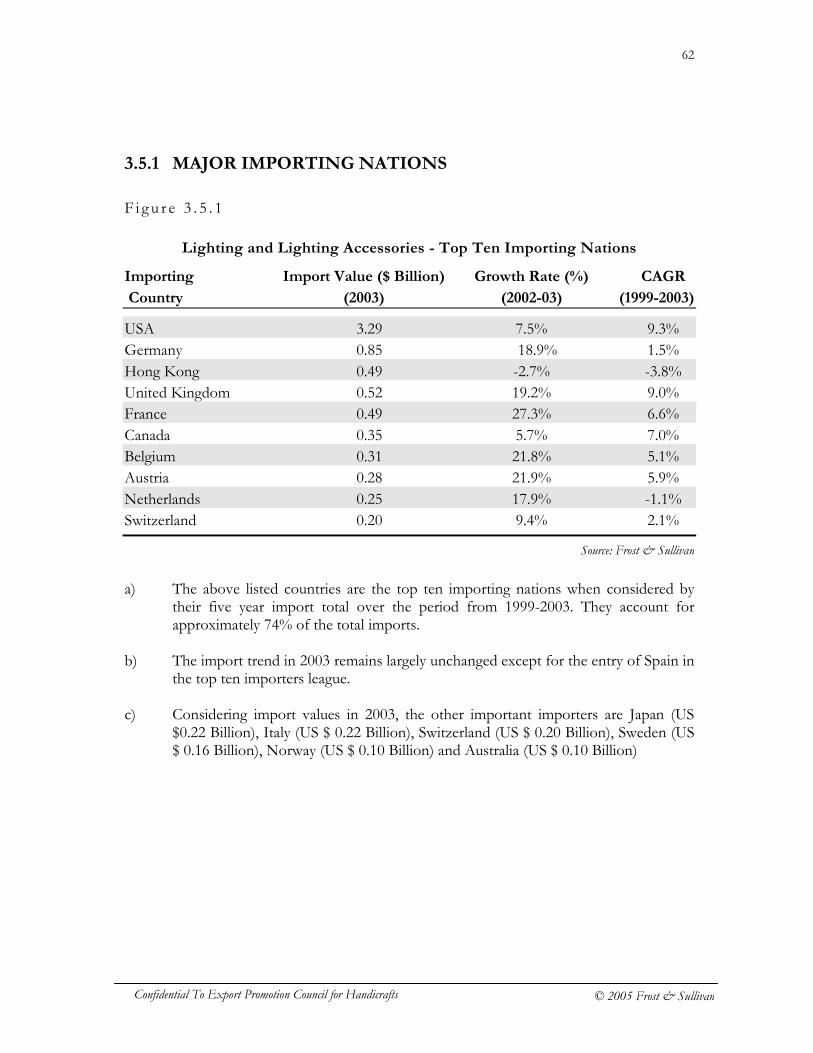
62
Confidential To Export Promotion Council for Handicrafts © 2005 Frost & Sullivan
3.5.1 MAJOR IMPORTING NATIONS
F i g u r e 3 . 5 . 1
Lighting and Lighting Accessories - Top Ten Importing Nations
Importing Import Value ($ Billion) Growth Rate (%) CAGR
Country (2003) (2002-03) (1999-2003)
USA 3.29 7.5% 9.3% Germany 0.85 18.9% 1.5% Hong Kong 0.49 -2.7% -3.8% United Kingdom 0.52 19.2% 9.0% France 0.49 27.3% 6.6% Canada 0.35 5.7% 7.0% Belgium 0.31 21.8% 5.1% Austria 0.28 21.9% 5.9% Netherlands 0.25 17.9% -1.1% Switzerland 0.20 9.4% 2.1%
a) The above listed countries are the top ten importing nations when considered by
their five year import total over the period from 1999-2003. They account for approximately 74% of the total imports.
b) The import trend in 2003 remains largely unchanged except for the entry of Spain in
the top ten importers league. c) Considering import values in 2003, the other important importers are Japan (US
$0.22 Billion), Italy (US $ 0.22 Billion), Switzerland (US $ 0.20 Billion), Sweden (US $ 0.16 Billion), Norway (US $ 0.10 Billion) and Australia (US $ 0.10 Billion)
Source: Frost & Sullivan
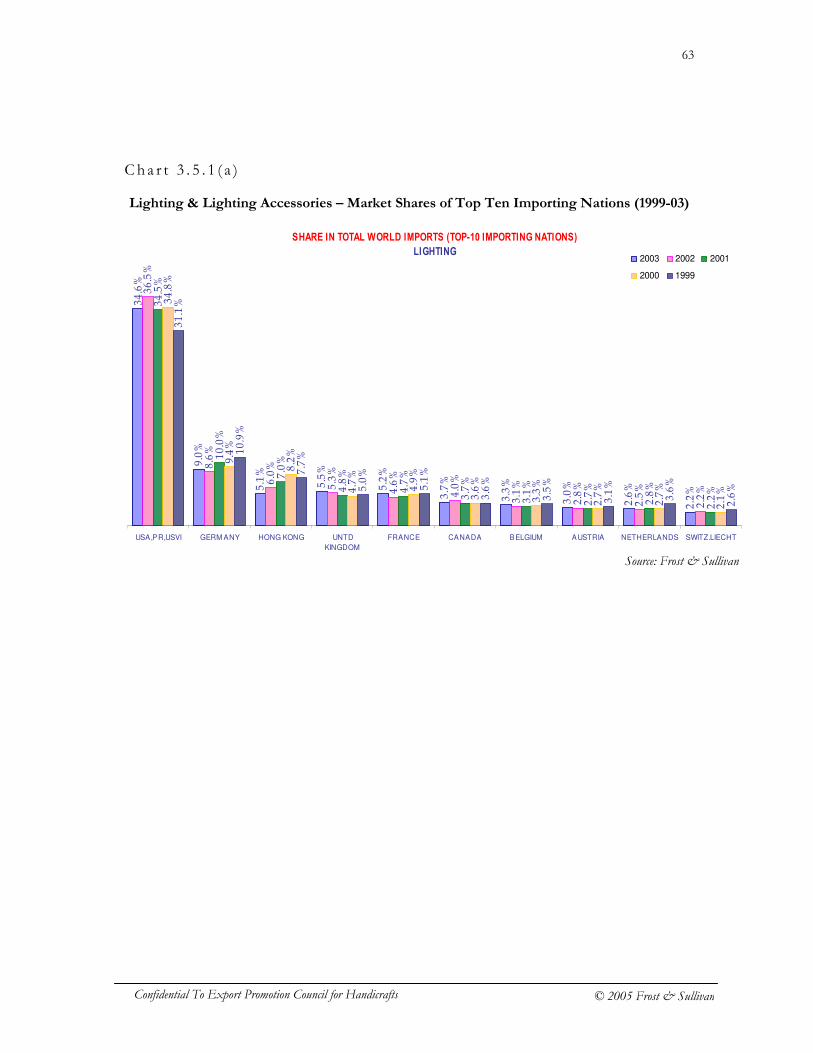
63
Confidential To Export Promotion Council for Handicrafts © 2005 Frost & Sullivan
Cha r t 3 . 5 . 1 ( a )
Lighting & Lighting Accessories – Market Shares of Top Ten Importing Nations (1999-03)
SHARE IN TOTAL WORLD IMPORTS (TOP-10 IMPORTING NATIONS)
LIGHTING
34.6%
9.0%
5.1%
5.5%
5.2%
3.7%
3.3%
3.0%
2.6%
2.2%
36.5%
8.6%
6.0%
5.3%
4.6%
4.0%
3.1%
2.8%
2.5%
2.2%
34.5%
10.0%
7.0%
4.8%
4.7%
3.7%
3.1%
2.7%
2.8%
2.2%
34.8%
9.4%
8.2%
4.7%
4.9%
3.6%
3.3%
2.7%
2.7%
2.1%
31.1%
10.9%
7.7%
5.0%
5.1%
3.6%
3.5%
3.1%
3.6%
2.6%
USA,PR,USVI GERM ANY HONG KONG UNTD
KINGDOM
FRANCE CANADA BELGIUM AUSTRIA NETHERLANDS SWITZ.LIECHT
2003 2002 2001
2000 1999
Source: Frost & Sullivan
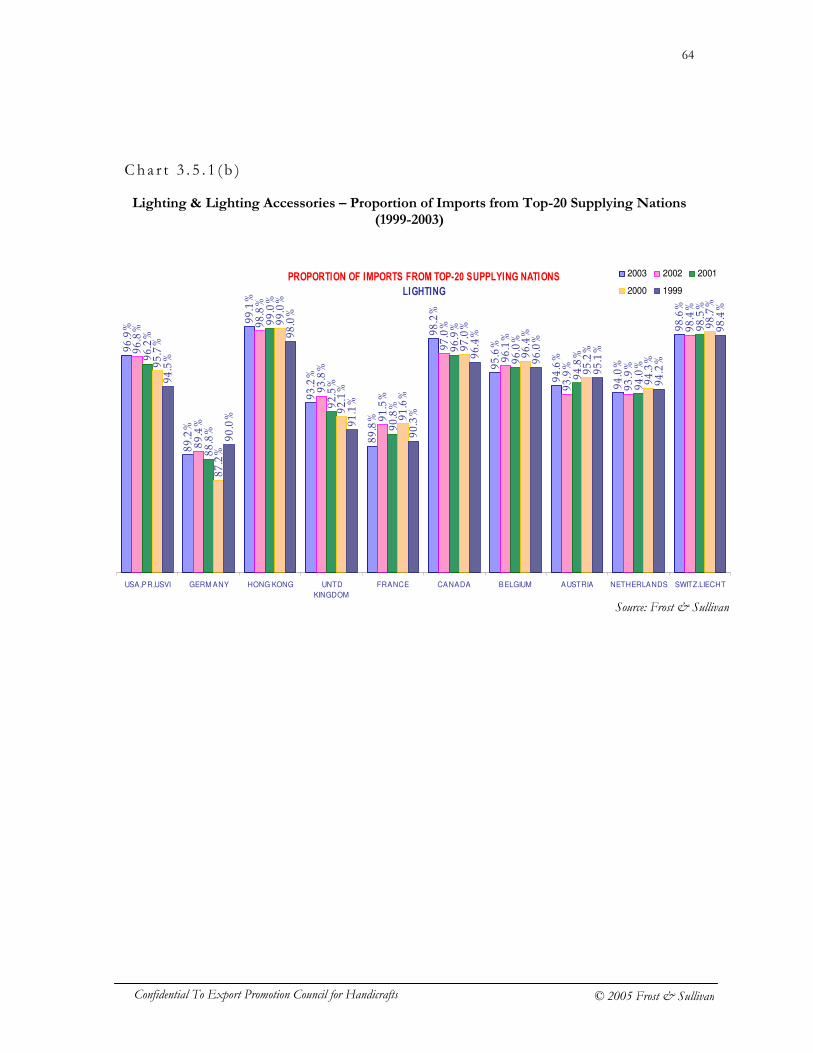
64
Confidential To Export Promotion Council for Handicrafts © 2005 Frost & Sullivan
Cha r t 3 . 5 . 1 ( b )
Lighting & Lighting Accessories – Proportion of Imports from Top-20 Supplying Nations (1999-2003)
PROPORTION OF IMPORTS FROM TOP-20 SUPPLYING NATIONS
LIGHTING
96.9%
89.2%
99.1%
93.2%
89.8%
98.2%
95.6%
94.6%
94.0%
98.6%
96.8%
89.4%
98.8%
93.8%
91.5%
97.0%
96.1%
93.9%
93.9%
98.4%
96.2%
88.8%
99.0%
92.5%
90.8%
96.9%
96.0%
94.8%
94.0%
98.5%
95.7%
87.2%
99.0%
92.1%
91.6%
97.0%
96.4%
95.2%
94.3%
98.7%
94.5%
90.0%
98.0%
91.1%
90.3%
96.4%
96.0%
95.1%
94.2%
98.4%
USA,PR,USVI GERM ANY HONG KONG UNTD
KINGDOM
FRANCE CANADA BELGIUM AUSTRIA NETHERLANDS SWITZ.LIECHT
2003 2002 2001
2000 1999
Source: Frost & Sullivan
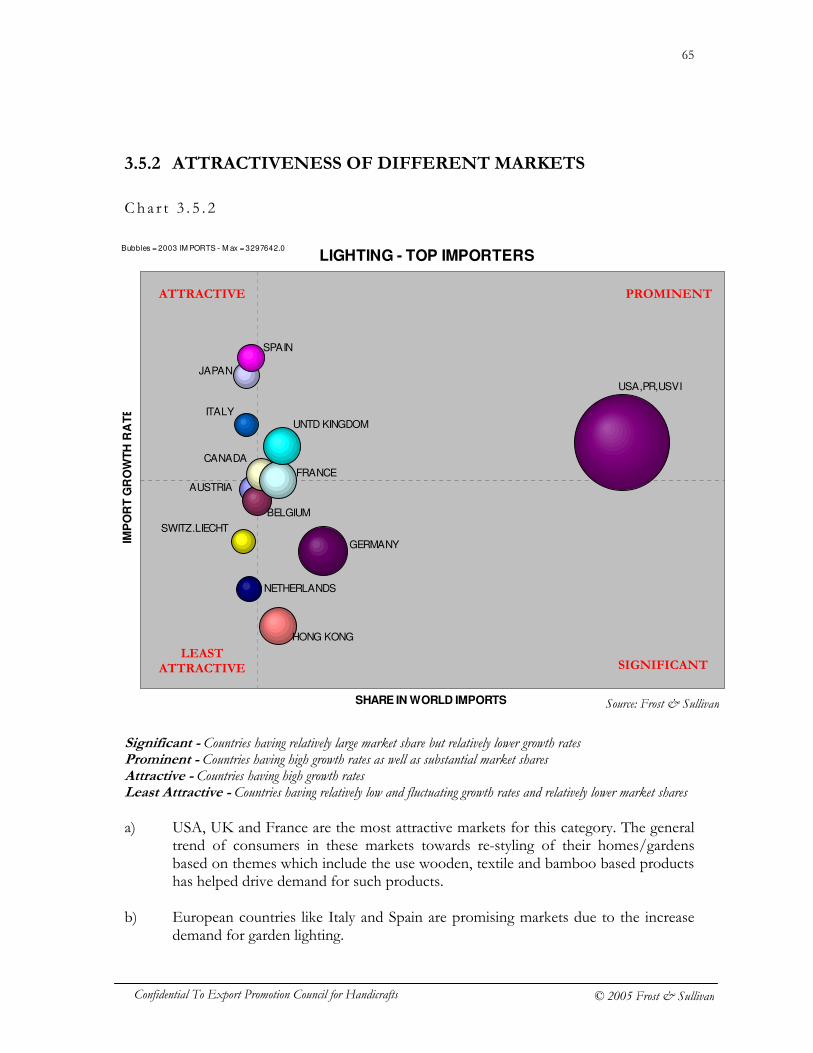
65
Confidential To Export Promotion Council for Handicrafts © 2005 Frost & Sullivan
3.5.2 ATTRACTIVENESS OF DIFFERENT MARKETS
Cha r t 3 . 5 . 2
Significant - Countries having relatively large market share but relatively lower growth rates Prominent - Countries having high growth rates as well as substantial market shares Attractive - Countries having high growth rates Least Attractive - Countries having relatively low and fluctuating growth rates and relatively lower market shares a) USA, UK and France are the most attractive markets for this category. The general
trend of consumers in these markets towards re-styling of their homes/gardens based on themes which include the use wooden, textile and bamboo based products has helped drive demand for such products.
b) European countries like Italy and Spain are promising markets due to the increase
demand for garden lighting.
LIGHTING - TOP IMPORTERS
AUSTRIA
BELGIUM
CANADA
FRANCE
GERMANY
HONG KONG
ITALY
JAPAN
NETHERLANDS
SPAIN
SWITZ.LIECHT
UNTD KINGDOM
USA,PR,USVI
SHARE IN WORLD IMPORTS
IMP
OR
T G
RO
WT
H R
AT
E
Bubbles = 2003 IM PORTS - M ax = 3297642.0
PROMINENT ATTRACTIVE
SIGNIFICANT LEAST
ATTRACTIVE
Source: Frost & Sullivan
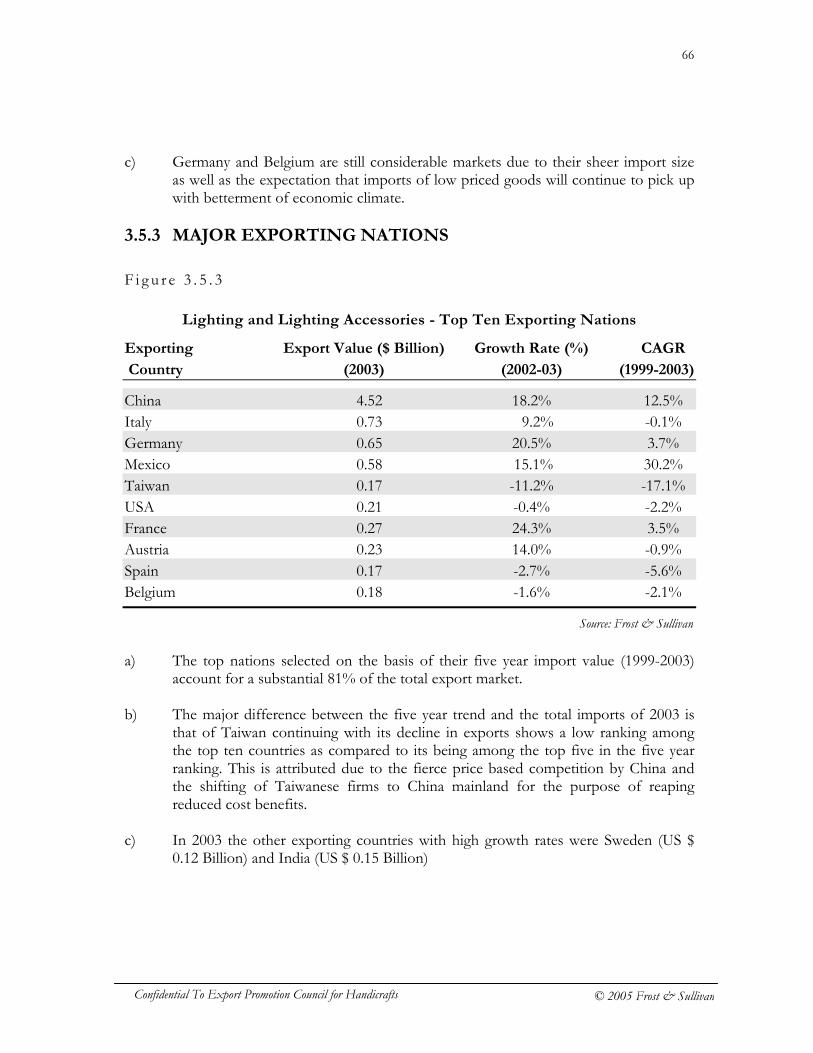
66
Confidential To Export Promotion Council for Handicrafts © 2005 Frost & Sullivan
c) Germany and Belgium are still considerable markets due to their sheer import size as well as the expectation that imports of low priced goods will continue to pick up with betterment of economic climate.
3.5.3 MAJOR EXPORTING NATIONS
F i g u r e 3 . 5 . 3
Lighting and Lighting Accessories - Top Ten Exporting Nations
Exporting Export Value ($ Billion) Growth Rate (%) CAGR
Country (2003) (2002-03) (1999-2003)
China 4.52 18.2% 12.5% Italy 0.73 9.2% -0.1% Germany 0.65 20.5% 3.7% Mexico 0.58 15.1% 30.2% Taiwan 0.17 -11.2% -17.1% USA 0.21 -0.4% -2.2% France 0.27 24.3% 3.5% Austria 0.23 14.0% -0.9% Spain 0.17 -2.7% -5.6% Belgium 0.18 -1.6% -2.1%
a) The top nations selected on the basis of their five year import value (1999-2003)
account for a substantial 81% of the total export market. b) The major difference between the five year trend and the total imports of 2003 is
that of Taiwan continuing with its decline in exports shows a low ranking among the top ten countries as compared to its being among the top five in the five year ranking. This is attributed due to the fierce price based competition by China and the shifting of Taiwanese firms to China mainland for the purpose of reaping reduced cost benefits.
c) In 2003 the other exporting countries with high growth rates were Sweden (US $
0.12 Billion) and India (US $ 0.15 Billion)
Source: Frost & Sullivan
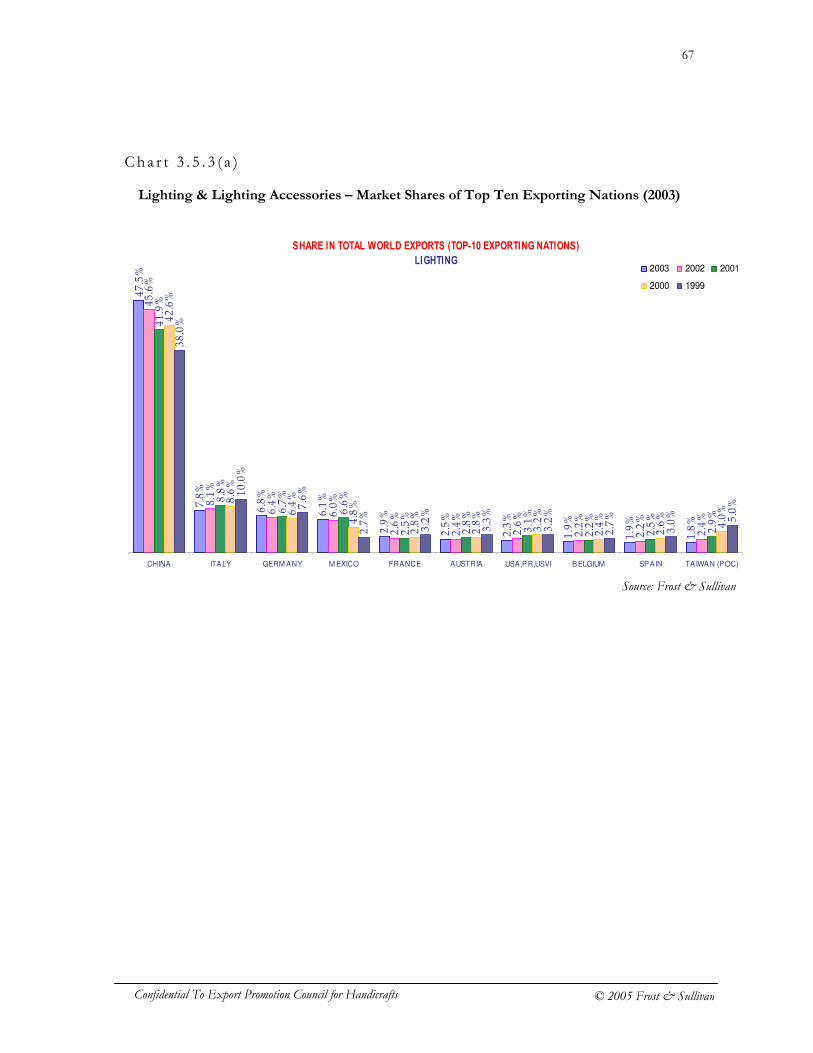
67
Confidential To Export Promotion Council for Handicrafts © 2005 Frost & Sullivan
Cha r t 3 . 5 . 3 ( a )
Lighting & Lighting Accessories – Market Shares of Top Ten Exporting Nations (2003)
SHARE IN TOTAL WORLD EXPORTS (TOP-10 EXPORTING NATIONS)
LIGHTING
47.5%
7.8%
6.8%
6.1%
2.9%
2.5%
2.3%
1.9%
1.9%
1.8%
45.6%
8.1%
6.4%
6.0%
2.6%
2.4%
2.6%
2.2%
2.2%
2.4%
41.9%
8.8%
6.7%
6.6%
2.5%
2.8%
3.1%
2.2%
2.5%
2.9%
42.6%
8.6%
6.4%
4.8%
2.8%
2.8%
3.2%
2.4%
2.6%
4.0%
38.0%
10.0%
7.6%
2.7%
3.2%
3.3%
3.2%
2.7%
3.0% 5.0%
CHINA ITALY GERM ANY M EXICO FRANCE AUSTRIA USA,PR,USVI BELGIUM SPAIN TAIWAN (POC)
2003 2002 2001
2000 1999
Source: Frost & Sullivan

68
Confidential To Export Promotion Council for Handicrafts © 2005 Frost & Sullivan
Cha r t 3 . 5 . 3 ( b )
Lighting & Lighting Accessories – Proportion of Exports to Top-20 Importing Nations (2003)
PROPORTION OF EXPORTS TO TOP-20 IMPORTING NATIONS
LIGHTING
93.3%
80.4%
87.8%
99.8%
87.4%
89.8%
83.6%
89.6%
81.5% 92.3%
94.4%
78.6%
85.6%
99.7%
86.9%
89.4%
82.5%
85.0%
73.2%
92.1%
94.9%
79.7%
82.5%
99.5%
82.6%
88.0%
79.8%
86.1%
69.8%
90.9%
95.6%
79.9%
85.3%
99.3%
82.8%
86.4%
78.2% 88.1%
74.0%
91.5%
96.1%
80.5%
85.4%
99.1%
87.4%
85.0%
75.6%
89.2%
74.4%
92.5%
CHINA ITALY GERM ANY M EXICO FRANCE AUSTRIA USA,PR,USVI BELGIUM SPAIN TAIWAN (POC)
2003 2002 2001
2000 1999
Source: Frost & Sullivan
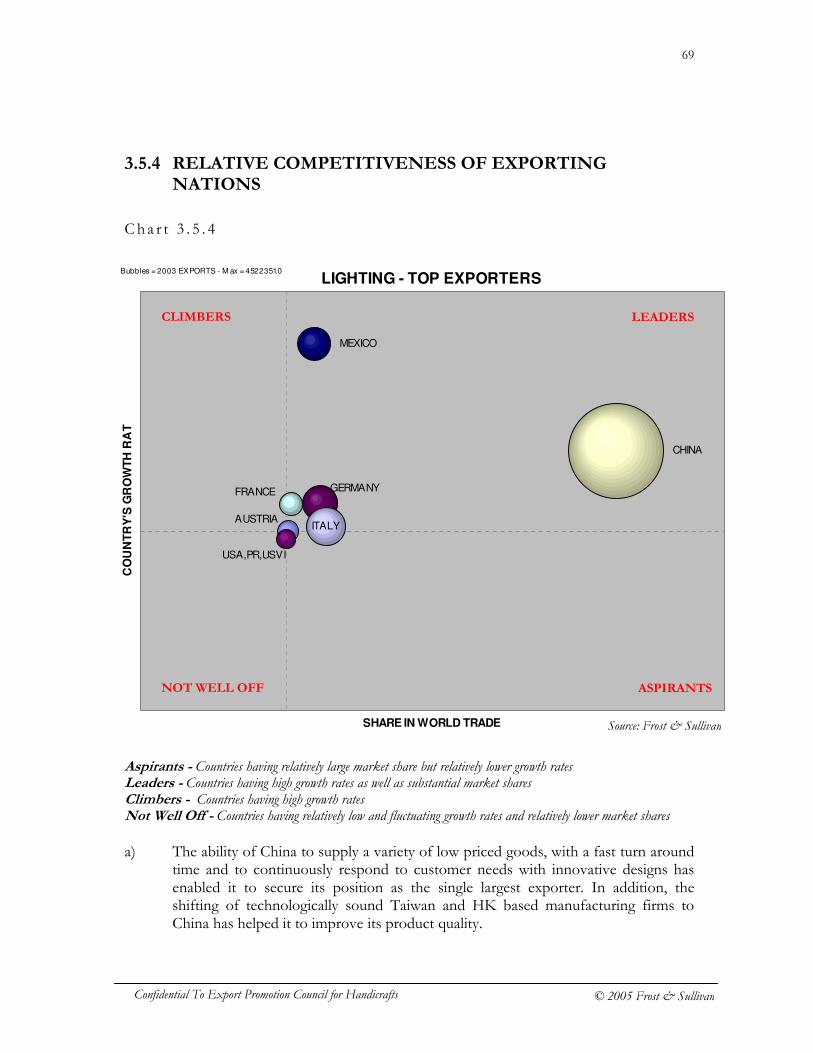
69
Confidential To Export Promotion Council for Handicrafts © 2005 Frost & Sullivan
3.5.4 RELATIVE COMPETITIVENESS OF EXPORTING NATIONS
Cha r t 3 . 5 . 4
Aspirants - Countries having relatively large market share but relatively lower growth rates Leaders - Countries having high growth rates as well as substantial market shares Climbers - Countries having high growth rates Not Well Off - Countries having relatively low and fluctuating growth rates and relatively lower market shares a) The ability of China to supply a variety of low priced goods, with a fast turn around
time and to continuously respond to customer needs with innovative designs has enabled it to secure its position as the single largest exporter. In addition, the shifting of technologically sound Taiwan and HK based manufacturing firms to China has helped it to improve its product quality.
LIGHTING - TOP EXPORTERS
AUSTRIA
CHINA
FRANCE GERMANY
ITALY
MEXICO
USA,PR,USVI
SHARE IN WORLD TRADE
CO
UN
TR
Y'S
GR
OW
TH
RA
TE
Bubbles = 2003 EXPORTS - M ax = 4522351.0
LEADERS CLIMBERS
ASPIRANTS NOT WELL OFF
Source: Frost & Sullivan
70
Confidential To Export Promotion Council for Handicrafts © 2005 Frost & Sullivan
b) Relatively speaking countries like Austria and France; in spite of smaller export values are potential players in the medium and higher end categories.
c) From the standpoint of developing Asian countries like India, the high growth rate
of exports of Mexico makes it a opponent in the lower end market.
71
Confidential To Export Promotion Council for Handicrafts © 2005 Frost & Sullivan
3.6 Festive and Christmas Articles a) Festive and Christmas articles refers to sub-product categories which are specifically
used as decorations during Christmas and other festivals and carnivals (HS Code - 9505) including product categories like electric lighting sets used for Christmas trees (HS Code - 9405), artificial flowers including plastic flowers (HS Code - 6702), and candles and tapers (HS Code - 3406), whose sale is seasonal with high sales during Christmas and other important western festivals.
b) Due the increasing scale of celebrations of major festivals like Christmas, Easter
(March/ April), Halloween and other important days like Fathers Day, Mother Day and Valentines Day the demand for products used as decorations and gifts during these seasons is relatively large compared to other product groups making it the 6th largest imported category when viewed in terms of export value. Though the demand for this product group seems to have leveled in USA post 2000, the category is expected to continue to be an important category due to its very nature as well as the increasing imports by European countries.
F i g u r e 3 . 6
Key Market Measurements – Festive and Christmas Articles
Market Measurement Details
World Market Size In 2003 US $9.33 bn CAGR (1999-2003) 1.5% Growth Rate (2002-2003) 5.1% Market Share of Top Three Importing Countries 63.1% Market Share of Top Three Exporting Countries 80.9%
c) The market for Christmas and other festive decorations in addition to being
seasonal is also very price competitive due the main target market of US, Canada and other European Union countries being flooded by a varied variety of predominantly low-value Chinese products.
d) However the sub-product categories like candles and artificial flowers which earlier
showed substantial sales only during seasonal peaks are now becoming increasingly popular as regularly used home decorations and are being demanded all round the year. However the sales still increase substantially during Christmas time.
Source: Frost & Sullivan
72
Confidential To Export Promotion Council for Handicrafts © 2005 Frost & Sullivan
e) The all round demand for candles has basically been influenced due the increasing availability of a variety of high quality & tastefully done candles which are viewed as decorative articles. The growing trend towards health and well-being, along with the popularity of incense, has also positively impacted sales, especially of candles with a distinct scent. In fact the increasing stress level the world over has created an attractive niche for aromatherapy candles, which help to create a feeling of well-being.
f) Similarly, artificial flowers were mostly demanded during festive seasons as added
decorations but the increasing acceptance of synthetic flora as a substitute to fresh flowers and indoor plants due to time constraints has caused them to be in demand all round the year as they are increasingly being used as general home decorations. More over the demand for the same has also been boosted due to technological advancements which has greatly improved the quality of artificial flowers. Earlier they used to be made from silk, which was expensive, or plastic, which did not look very authentic. However technological advances has led to the use of better materials, such as wrinkled silk, cotton, paper, polyester, glass, wood and metal, which has added to their authenticity. And this factor being complemented by a drop in prices, has led to a surge in the popularity of these versatile decorative creations all round the year in addition to their seasonal sales peaks.
3.6.1 MAJOR IMPORTING NATIONS
F i g u r e 3 . 6 . 1
Festive and Christmas Articles - Top Ten Importing Nations
Importing Import Value ($ Billion) Growth Rate (%) CAGR
Country (2003) (2002-03) (1999-2003)
USA 4.12 2.0% 2.6% Hong Kong 1.19 -11.8% -7.7% Germany 0.56 30.5% 1.4% United Kingdom 0.55 24.5% 8.9% Canada 0.36 5.6% 3.8% France 0.31 23.7% 2.0% Italy 0.25 16.3% 2.7% Netherlands 0.20 20.4% -1.2% Japan 0.14 -0.4% -0.0% Belgium 0.18 32.2% 5.2%
Source: Frost & Sullivan
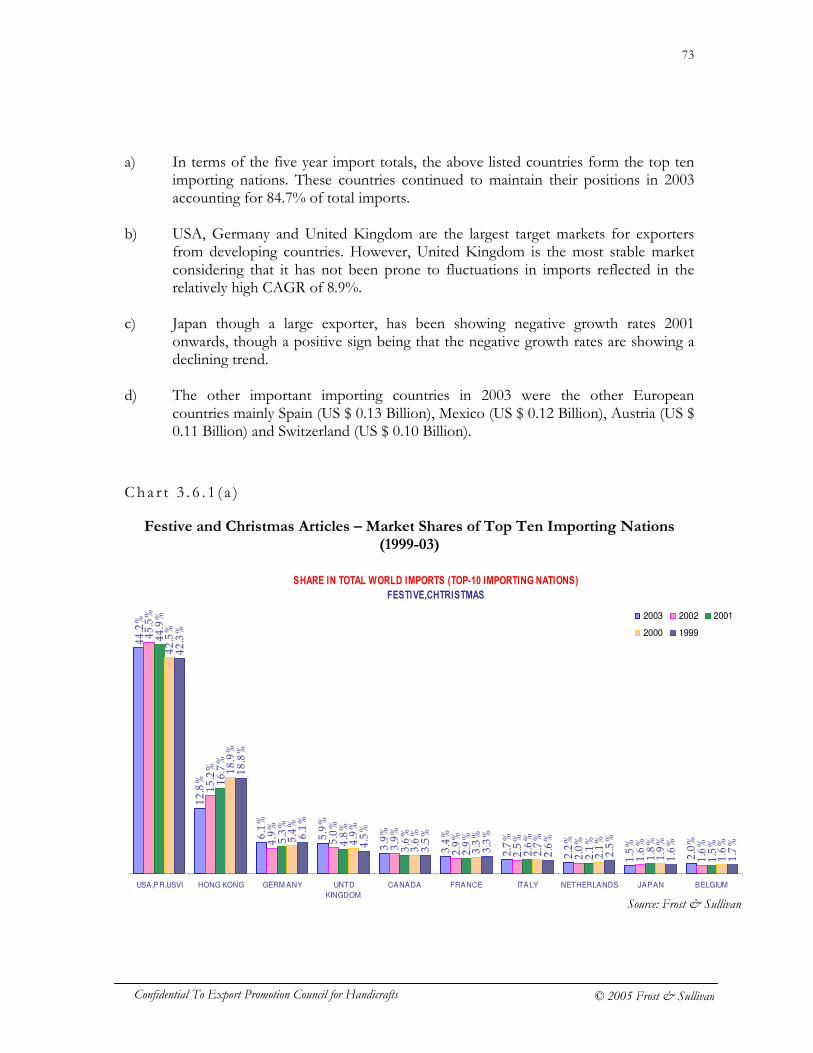
73
Confidential To Export Promotion Council for Handicrafts © 2005 Frost & Sullivan
a) In terms of the five year import totals, the above listed countries form the top ten importing nations. These countries continued to maintain their positions in 2003 accounting for 84.7% of total imports.
b) USA, Germany and United Kingdom are the largest target markets for exporters
from developing countries. However, United Kingdom is the most stable market considering that it has not been prone to fluctuations in imports reflected in the relatively high CAGR of 8.9%.
c) Japan though a large exporter, has been showing negative growth rates 2001
onwards, though a positive sign being that the negative growth rates are showing a declining trend.
d) The other important importing countries in 2003 were the other European
countries mainly Spain (US $ 0.13 Billion), Mexico (US $ 0.12 Billion), Austria (US $ 0.11 Billion) and Switzerland (US $ 0.10 Billion).
C h a r t 3 . 6 . 1 ( a )
Festive and Christmas Articles – Market Shares of Top Ten Importing Nations (1999-03)
SHARE IN TOTAL WORLD IMPORTS (TOP-10 IMPORTING NATIONS)
FESTIVE,CHTRISTMAS
44.2%
12.8%
6.1%
5.9%
3.9%
3.4%
2.7%
2.2%
1.5%
2.0%
45.5%
15.2%
4.9%
5.0%
3.9%
2.9%
2.5%
2.0%
1.6%
1.6%
44.9%
16.7%
5.3%
4.8%
3.6%
2.9%
2.6%
2.1%
1.8%
1.5%
42.5%
18.9%
5.4%
4.9%
3.6%
3.3%
2.7%
2.1%
1.9%
1.6%
42.3%
18.8%
6.1%
4.5%
3.5%
3.3%
2.6%
2.5%
1.6%
1.7%
USA,PR,USVI HONG KONG GERM ANY UNTD
KINGDOM
CANADA FRANCE ITALY NETHERLANDS JAPAN BELGIUM
2003 2002 2001
2000 1999
Source: Frost & Sullivan
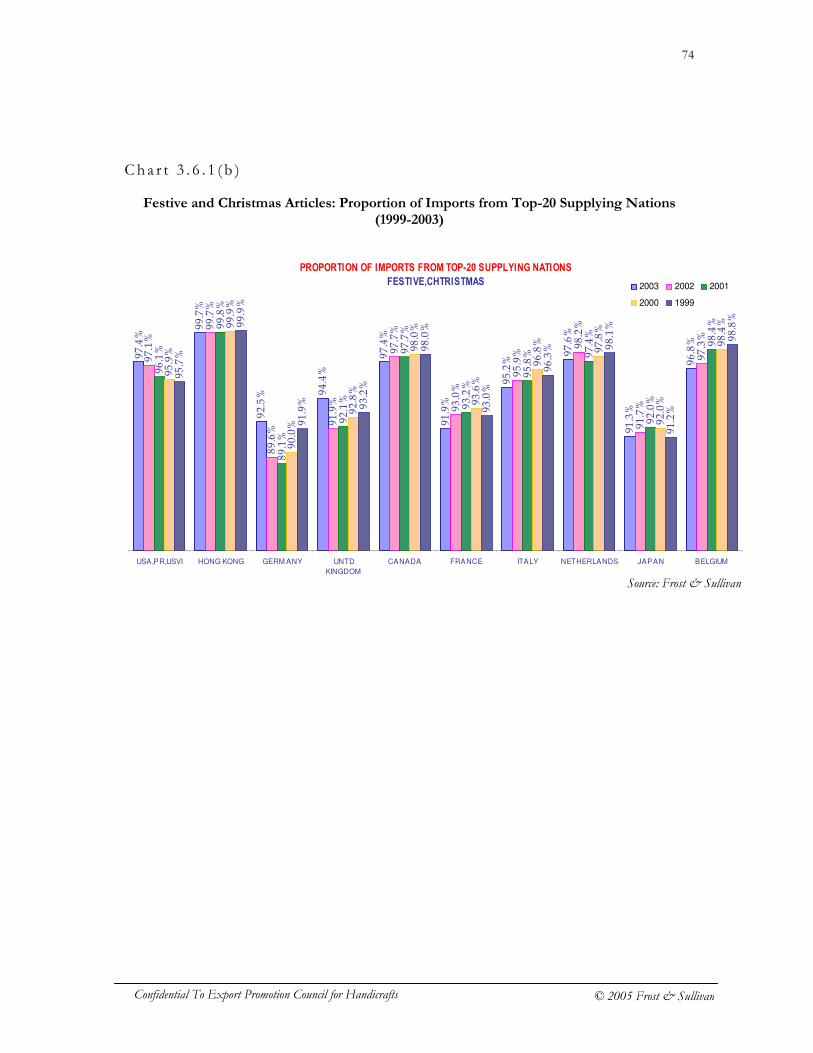
74
Confidential To Export Promotion Council for Handicrafts © 2005 Frost & Sullivan
Cha r t 3 . 6 . 1 ( b )
Festive and Christmas Articles: Proportion of Imports from Top-20 Supplying Nations (1999-2003)
PROPORTION OF IMPORTS FROM TOP-20 SUPPLYING NATIONS
FESTIVE,CHTRISTMAS
97.4%
99.7%
92.5% 94.4%
97.4%
91.9%
95.2%
97.6%
91.3%
96.8%
97.1%
99.7%
89.6%
91.9%
97.7%
93.0%
95.9%
98.2%
91.7%
97.3%
96.1%
99.8%
89.1%
92.1%
97.7%
93.2%
95.8% 97.4%
92.0%
98.4%
95.9%
99.9%
90.0%
92.8%
98.0%
93.6%
96.8%
97.8%
92.0%
98.4%
95.7%
99.9%
91.9% 93.2%
98.0%
93.0%
96.3% 98.1%
91.2%
98.8%
USA,PR,USVI HONG KONG GERM ANY UNTD
KINGDOM
CANADA FRANCE ITALY NETHERLANDS JAPAN BELGIUM
2003 2002 2001
2000 1999
Source: Frost & Sullivan
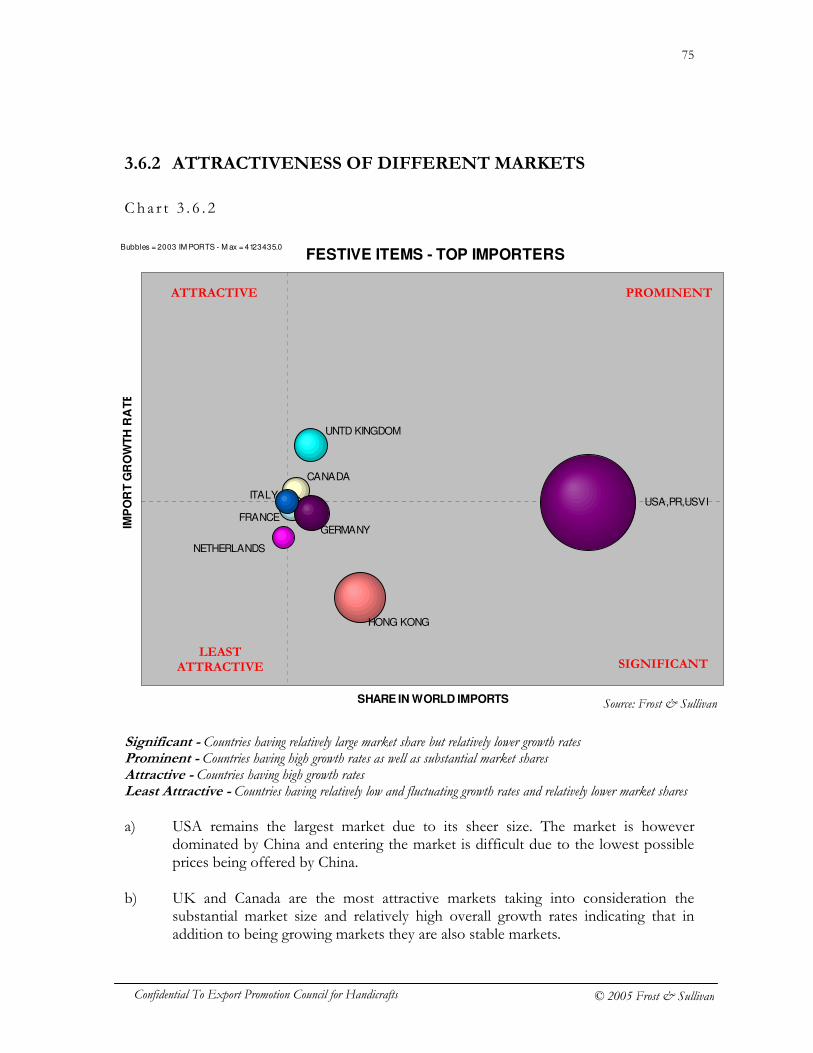
75
Confidential To Export Promotion Council for Handicrafts © 2005 Frost & Sullivan
3.6.2 ATTRACTIVENESS OF DIFFERENT MARKETS
Cha r t 3 . 6 . 2
Significant - Countries having relatively large market share but relatively lower growth rates Prominent - Countries having high growth rates as well as substantial market shares Attractive - Countries having high growth rates Least Attractive - Countries having relatively low and fluctuating growth rates and relatively lower market shares a) USA remains the largest market due to its sheer size. The market is however
dominated by China and entering the market is difficult due to the lowest possible prices being offered by China.
b) UK and Canada are the most attractive markets taking into consideration the
substantial market size and relatively high overall growth rates indicating that in addition to being growing markets they are also stable markets.
FESTIVE ITEMS - TOP IMPORTERS
CANADA
FRANCE GERMANY
HONG KONG
ITALY
NETHERLANDS
UNTD KINGDOM
USA,PR,USVI
SHARE IN WORLD IMPORTS
IMP
OR
T G
RO
WT
H R
AT
E
Bubbles = 2003 IM PORTS - M ax = 4123435.0
PROMINENT ATTRACTIVE
SIGNIFICANT LEAST
ATTRACTIVE
Source: Frost & Sullivan
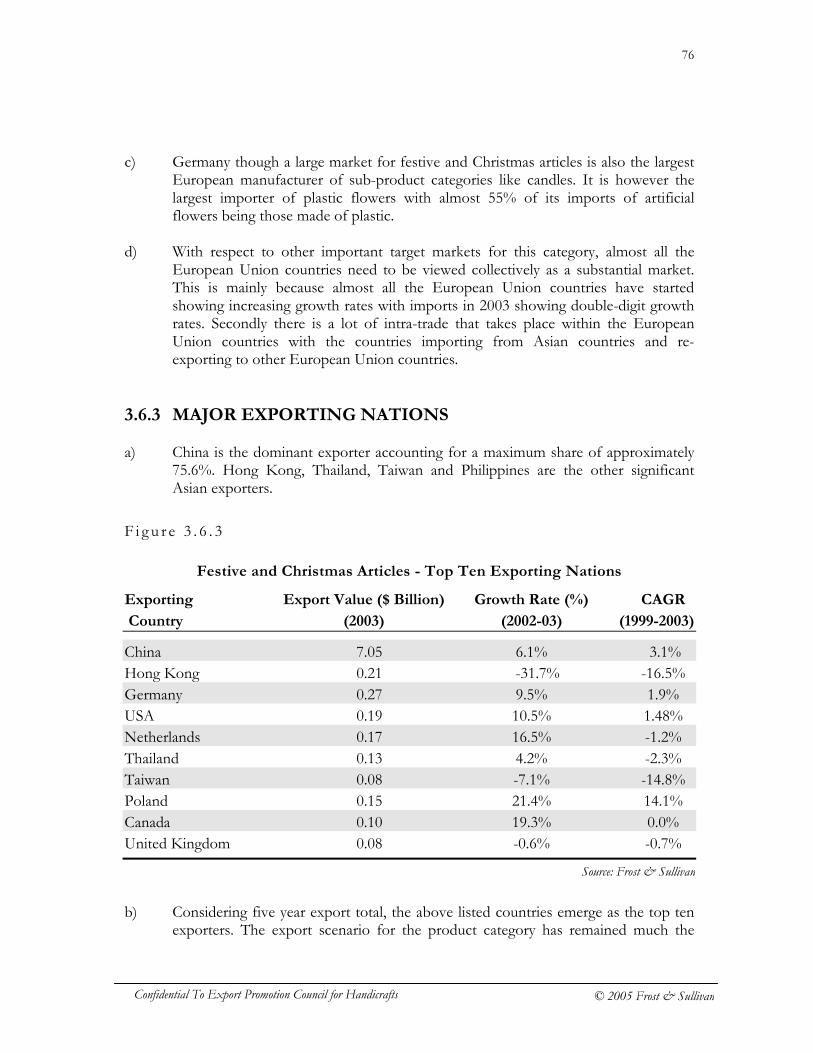
76
Confidential To Export Promotion Council for Handicrafts © 2005 Frost & Sullivan
c) Germany though a large market for festive and Christmas articles is also the largest European manufacturer of sub-product categories like candles. It is however the largest importer of plastic flowers with almost 55% of its imports of artificial flowers being those made of plastic.
d) With respect to other important target markets for this category, almost all the
European Union countries need to be viewed collectively as a substantial market. This is mainly because almost all the European Union countries have started showing increasing growth rates with imports in 2003 showing double-digit growth rates. Secondly there is a lot of intra-trade that takes place within the European Union countries with the countries importing from Asian countries and re-exporting to other European Union countries.
3.6.3 MAJOR EXPORTING NATIONS a) China is the dominant exporter accounting for a maximum share of approximately
75.6%. Hong Kong, Thailand, Taiwan and Philippines are the other significant Asian exporters.
F i g u r e 3 . 6 . 3
Festive and Christmas Articles - Top Ten Exporting Nations
Exporting Export Value ($ Billion) Growth Rate (%) CAGR
Country (2003) (2002-03) (1999-2003)
China 7.05 6.1% 3.1% Hong Kong 0.21 -31.7% -16.5% Germany 0.27 9.5% 1.9% USA 0.19 10.5% 1.48% Netherlands 0.17 16.5% -1.2% Thailand 0.13 4.2% -2.3% Taiwan 0.08 -7.1% -14.8% Poland 0.15 21.4% 14.1% Canada 0.10 19.3% 0.0% United Kingdom 0.08 -0.6% -0.7%
b) Considering five year export total, the above listed countries emerge as the top ten
exporters. The export scenario for the product category has remained much the
Source: Frost & Sullivan
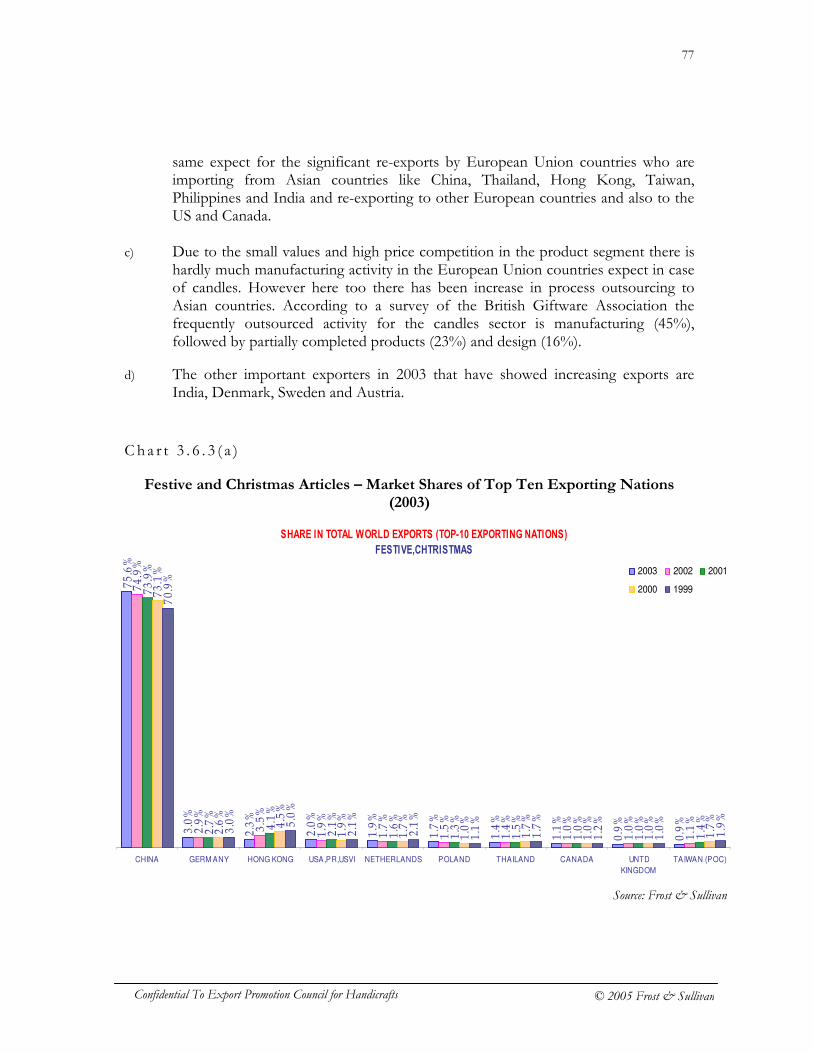
77
Confidential To Export Promotion Council for Handicrafts © 2005 Frost & Sullivan
same expect for the significant re-exports by European Union countries who are importing from Asian countries like China, Thailand, Hong Kong, Taiwan, Philippines and India and re-exporting to other European countries and also to the US and Canada.
c) Due to the small values and high price competition in the product segment there is
hardly much manufacturing activity in the European Union countries expect in case of candles. However here too there has been increase in process outsourcing to Asian countries. According to a survey of the British Giftware Association the frequently outsourced activity for the candles sector is manufacturing (45%), followed by partially completed products (23%) and design (16%).
d) The other important exporters in 2003 that have showed increasing exports are
India, Denmark, Sweden and Austria.
Cha r t 3 . 6 . 3 ( a )
Festive and Christmas Articles – Market Shares of Top Ten Exporting Nations (2003)
SHARE IN TOTAL WORLD EXPORTS (TOP-10 EXPORTING NATIONS)
FESTIVE,CHTRISTMAS
75.6%
3.0%
2.3%
2.0%
1.9%
1.7%
1.4%
1.1%
0.9%
0.9%
74.9%
2.9%
3.5%
1.9%
1.7%
1.5%
1.4%
1.0%
1.0%
1.1%
73.9%
2.7%
4.1%
2.1%
1.6%
1.3%
1.5%
1.0%
1.0%
1.4%
73.1%
2.6%
4.5%
1.9%
1.7%
1.0%
1.7%
1.0%
1.0%
1.7%
70.9%
3.0%
5.0%
2.1%
2.1%
1.1%
1.7%
1.2%
1.0%
1.9%
CHINA GERM ANY HONG KONG USA,PR,USVI NETHERLANDS POLAND THAILAND CANADA UNTD
KINGDOM
TAIWAN (POC)
2003 2002 2001
2000 1999
Source: Frost & Sullivan
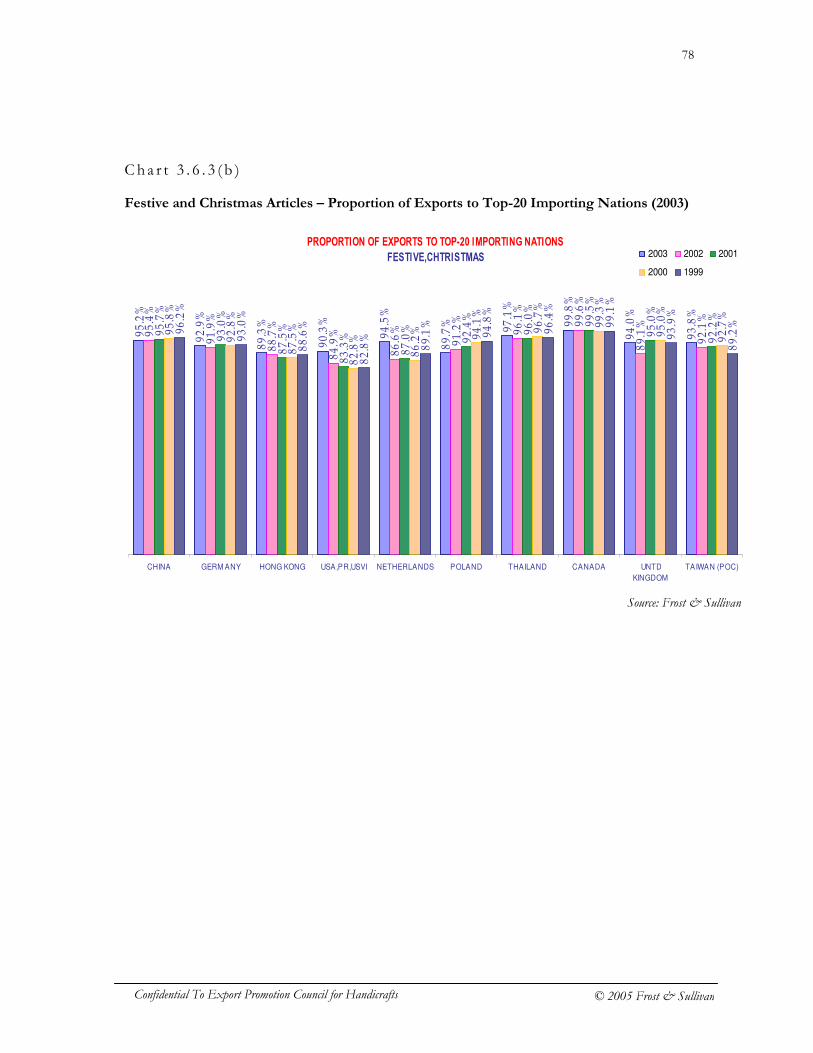
78
Confidential To Export Promotion Council for Handicrafts © 2005 Frost & Sullivan
Cha r t 3 . 6 . 3 ( b )
Festive and Christmas Articles – Proportion of Exports to Top-20 Importing Nations (2003)
PROPORTION OF EXPORTS TO TOP-20 IMPORTING NATIONS
FESTIVE,CHTRISTMAS
95.2%
92.9%
89.3%
90.3%
94.5%
89.7%
97.1%
99.8%
94.0%
93.8%
95.4%
91.9%
88.7%
84.9%
86.6%
91.2%
96.1%
99.6%
89.1%
92.1%
95.7%
93.0%
87.5%
83.3%
87.0%
92.4%
96.0%
99.5%
95.0%
92.2%
95.8%
92.8%
87.5%
82.8%
86.2%
94.1%
96.7%
99.3%
95.0%
92.7%
96.2%
93.0%
88.6%
82.8%
89.1%
94.8%
96.4%
99.1%
93.9%
89.2%
CHINA GERM ANY HONG KONG USA,PR,USVI NETHERLANDS POLAND THAILAND CANADA UNTD
KINGDOM
TAIWAN (POC)
2003 2002 2001
2000 1999
Source: Frost & Sullivan
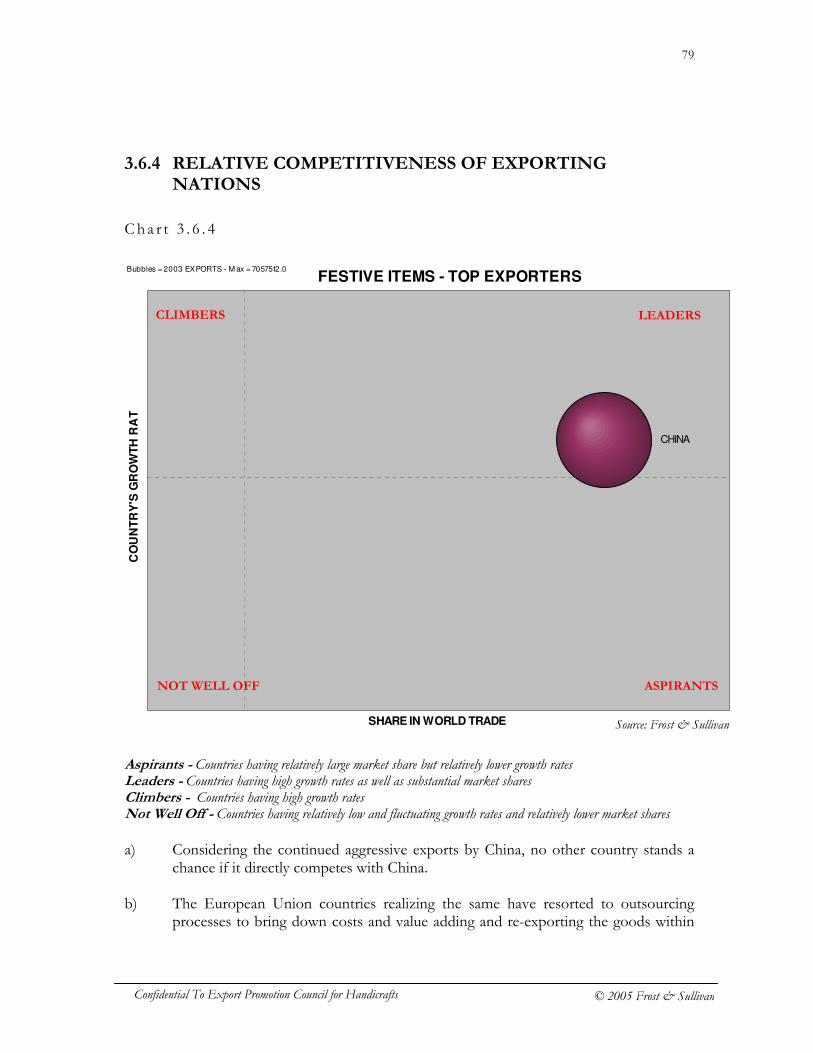
79
Confidential To Export Promotion Council for Handicrafts © 2005 Frost & Sullivan
3.6.4 RELATIVE COMPETITIVENESS OF EXPORTING NATIONS
Cha r t 3 . 6 . 4
Aspirants - Countries having relatively large market share but relatively lower growth rates Leaders - Countries having high growth rates as well as substantial market shares Climbers - Countries having high growth rates Not Well Off - Countries having relatively low and fluctuating growth rates and relatively lower market shares a) Considering the continued aggressive exports by China, no other country stands a
chance if it directly competes with China. b) The European Union countries realizing the same have resorted to outsourcing
processes to bring down costs and value adding and re-exporting the goods within
FESTIVE ITEMS - TOP EXPORTERS
CHINA
SHARE IN WORLD TRADE
CO
UN
TR
Y'S
GR
OW
TH
RA
TE
Bubbles = 2003 EXPORTS - M ax = 7057512.0
CLIMBERS
ASPIRANTS NOT WELL OFF
LEADERS
Source: Frost & Sullivan
80
Confidential To Export Promotion Council for Handicrafts © 2005 Frost & Sullivan
the European Union taking the additional benefit of European Union intra-trade. As a result they have been able to display slight increase in market shares and substantial growth rates in 2003.
c) To compete in such a scenario the only option available to other Asian countries is
to develop market niches along with aggressive promotions and continuous innovations.
81
Confidential To Export Promotion Council for Handicrafts © 2005 Frost & Sullivan
3.7 Toys and Dolls a) The sub-product categories included under the broad category of Toys & Dolls
mainly includes stuffed and non-stuffed toys representing animal and non-human creatures (HS Code - 9503) and dolls representing human beings including their garments, parts and accessories (HS Code - 9502). Toys and dolls including electronic components have been excluded as they expressly do not form part of the market under study.
b) The market for traditional and handmade toys and dolls of textile material and
wood and other hand made soft toys has been decreasing due to fact that today’s children are growing up faster than a generation before. In fact kids aged 12 or above easily turn to non-traditional playthings such as video games, computers, music, cosmetics, etc. This shift in general preference influenced by the increasing availability of smart toys that integrate electronics and new technology with toys to create additional and new playing possibilities has adversely affected the market for traditional and handmade toys.
c) The major opportunity for developing countries especially in categories like stuffed
toys is to adapt the product according to consumer preferences in the target markets or to under take contract manufacturing for overseas industry giants and licensed holders such as Disney, Hasbro, Mattel and Warner Bros. in the US, Zapf in Germany, and Bandai, Takara and Tomy in Japan. This is a suitable arrangement as production specifications and product designs are usually provided by these overseas buyers and this type of arrangement in effect minimises local manufacturers' risks related to product designs, inventory taking and marketing. However this depends upon the ability of the local manufacturers to leverage their production resources and process and gearing them to meet the requirements in terms of high product quality and product design specifications.
d) The other wooden toys and dolls are relatively small segments under the product
category with the demand for the same being driven due to their appeal as home decorations and collectibles and souvenirs rather than as toys.
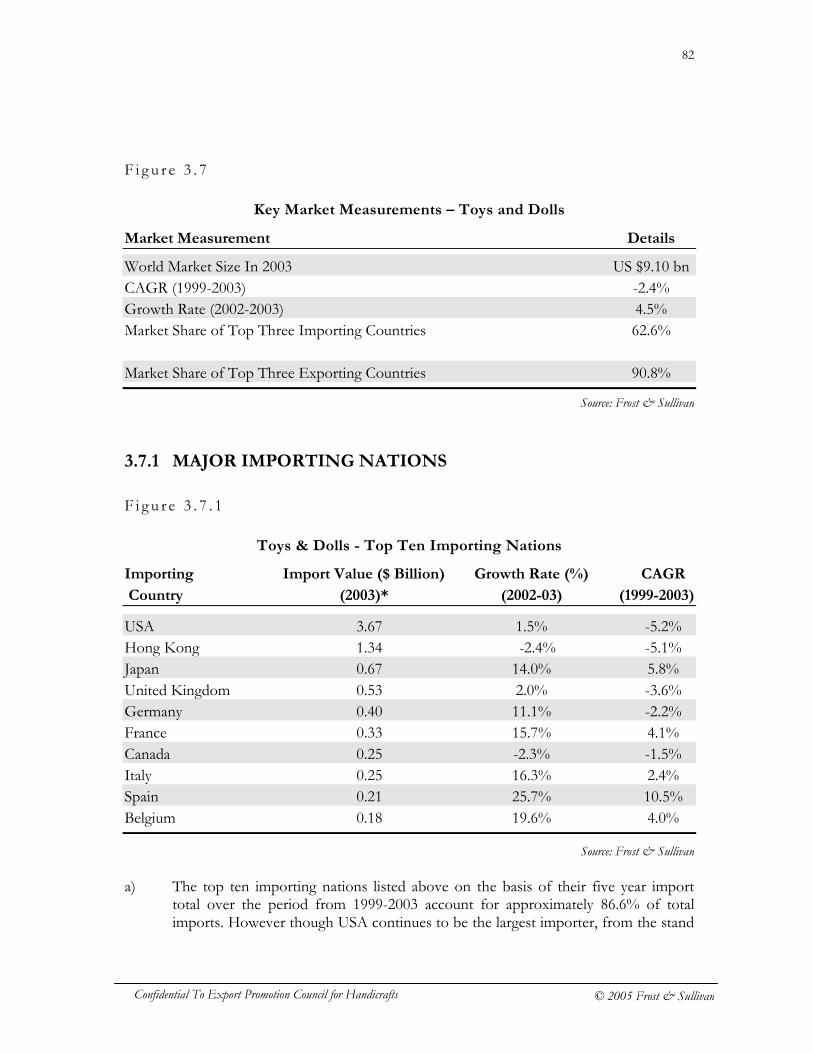
82
Confidential To Export Promotion Council for Handicrafts © 2005 Frost & Sullivan
F i g u r e 3 . 7
Key Market Measurements – Toys and Dolls
Market Measurement Details
World Market Size In 2003 US $9.10 bn CAGR (1999-2003) -2.4% Growth Rate (2002-2003) 4.5% Market Share of Top Three Importing Countries 62.6% Market Share of Top Three Exporting Countries 90.8%
3.7.1 MAJOR IMPORTING NATIONS
F i g u r e 3 . 7 . 1
Toys & Dolls - Top Ten Importing Nations
Importing Import Value ($ Billion) Growth Rate (%) CAGR
Country (2003)* (2002-03) (1999-2003)
USA 3.67 1.5% -5.2% Hong Kong 1.34 -2.4% -5.1% Japan 0.67 14.0% 5.8% United Kingdom 0.53 2.0% -3.6% Germany 0.40 11.1% -2.2% France 0.33 15.7% 4.1% Canada 0.25 -2.3% -1.5% Italy 0.25 16.3% 2.4% Spain 0.21 25.7% 10.5% Belgium 0.18 19.6% 4.0%
a) The top ten importing nations listed above on the basis of their five year import
total over the period from 1999-2003 account for approximately 86.6% of total imports. However though USA continues to be the largest importer, from the stand
Source: Frost & Sullivan
Source: Frost & Sullivan
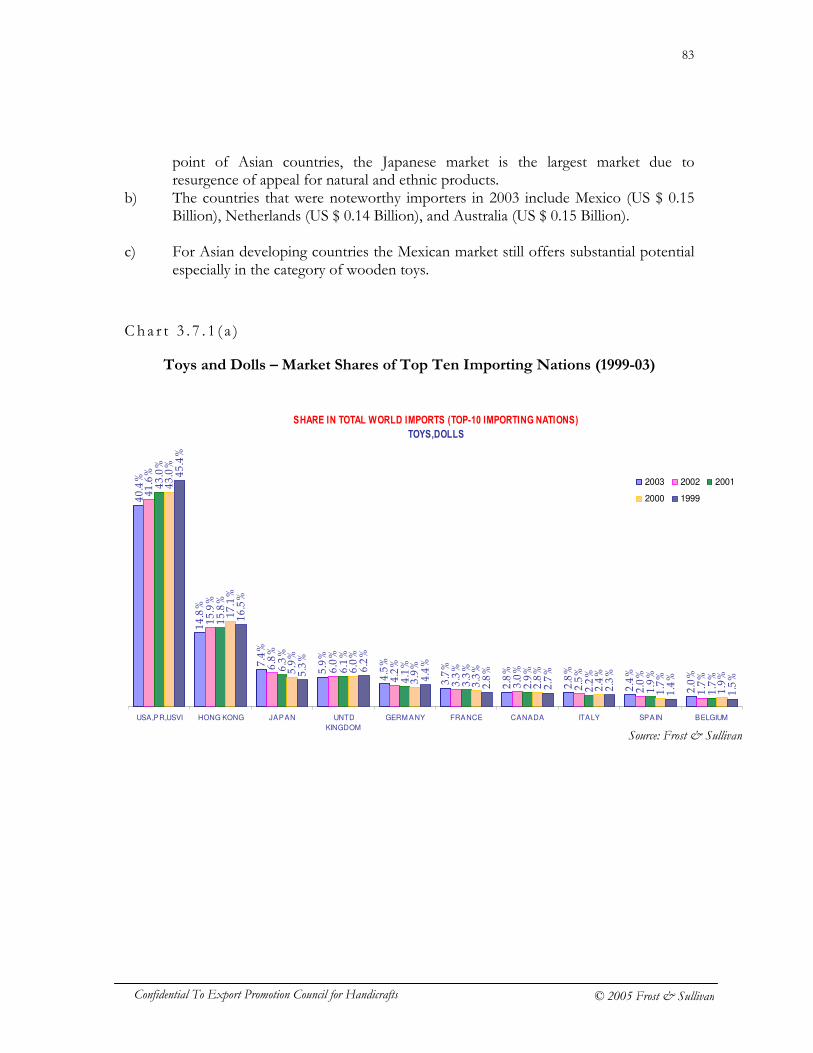
83
Confidential To Export Promotion Council for Handicrafts © 2005 Frost & Sullivan
point of Asian countries, the Japanese market is the largest market due to resurgence of appeal for natural and ethnic products.
b) The countries that were noteworthy importers in 2003 include Mexico (US $ 0.15 Billion), Netherlands (US $ 0.14 Billion), and Australia (US $ 0.15 Billion).
c) For Asian developing countries the Mexican market still offers substantial potential
especially in the category of wooden toys.
C h a r t 3 . 7 . 1 ( a )
Toys and Dolls – Market Shares of Top Ten Importing Nations (1999-03)
SHARE IN TOTAL WORLD IMPORTS (TOP-10 IMPORTING NATIONS)
TOYS,DOLLS
40.4%
14.8%
7.4%
5.9%
4.5%
3.7%
2.8%
2.8%
2.4%
2.0%
41.6%
15.9%
6.8%
6.0%
4.2%
3.3%
3.0%
2.5%
2.0%
1.7%
43.0%
15.8%
6.3%
6.1%
4.1%
3.3%
2.9%
2.2%
1.9%
1.7%
43.0%
17.1%
5.9%
6.0%
3.9%
3.3%
2.8%
2.4%
1.7%
1.9%
45.4%
16.5%
5.3%
6.2%
4.4%
2.8%
2.7%
2.3%
1.4%
1.5%
USA,PR,USVI HONG KONG JAPAN UNTD
KINGDOM
GERM ANY FRANCE CANADA ITALY SPAIN BELGIUM
2003 2002 2001
2000 1999
Source: Frost & Sullivan
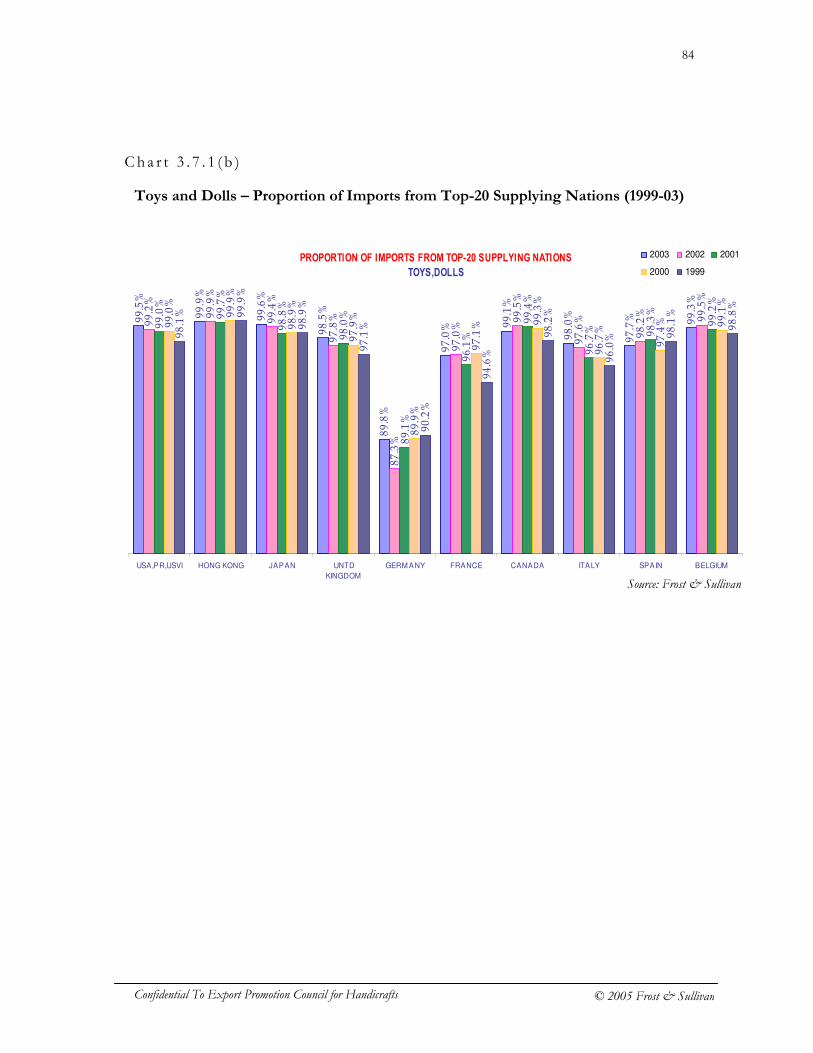
84
Confidential To Export Promotion Council for Handicrafts © 2005 Frost & Sullivan
Cha r t 3 . 7 . 1 ( b )
Toys and Dolls – Proportion of Imports from Top-20 Supplying Nations (1999-03)
PROPORTION OF IMPORTS FROM TOP-20 SUPPLYING NATIONS
TOYS,DOLLS
99.5%
99.9%
99.6%
98.5%
89.8%
97.0% 99.1%
98.0%
97.7% 99.3%
99.2%
99.9%
99.4%
97.8%
87.3%
97.0%
99.5%
97.6%
98.2%
99.5%
99.0%
99.7%
98.8%
98.0%
89.1%
96.1%
99.4%
96.7% 98.3%
99.2%
99.0%
99.9%
98.9%
97.9%
89.9%
97.1%
99.3%
96.7%
97.4% 99.1%
98.1% 99.9%
98.9%
97.1%
90.2%
94.6%
98.2%
96.0% 98.1%
98.8%
USA,PR,USVI HONG KONG JAPAN UNTD
KINGDOM
GERM ANY FRANCE CANADA ITALY SPAIN BELGIUM
2003 2002 2001
2000 1999
Source: Frost & Sullivan
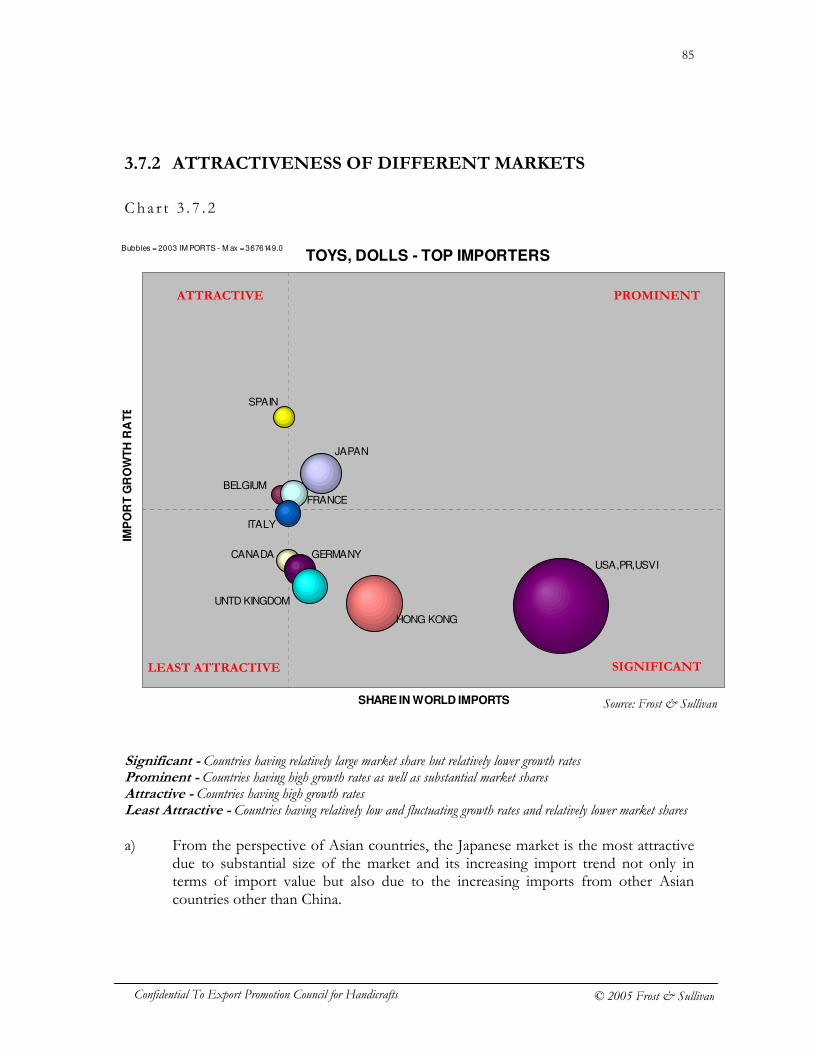
85
Confidential To Export Promotion Council for Handicrafts © 2005 Frost & Sullivan
3.7.2 ATTRACTIVENESS OF DIFFERENT MARKETS
Cha r t 3 . 7 . 2
Significant - Countries having relatively large market share but relatively lower growth rates Prominent - Countries having high growth rates as well as substantial market shares Attractive - Countries having high growth rates Least Attractive - Countries having relatively low and fluctuating growth rates and relatively lower market shares a) From the perspective of Asian countries, the Japanese market is the most attractive
due to substantial size of the market and its increasing import trend not only in terms of import value but also due to the increasing imports from other Asian countries other than China.
TOYS, DOLLS - TOP IMPORTERS
BELGIUM
CANADA
FRANCE
GERMANY
HONG KONG
ITALY
JAPAN
SPAIN
UNTD KINGDOM
USA,PR,USVI
SHARE IN WORLD IMPORTS
IMP
OR
T G
RO
WT
H R
AT
E
Bubbles = 2003 IM PORTS - M ax = 3676149.0
PROMINENT ATTRACTIVE
SIGNIFICANT LEAST ATTRACTIVE
Source: Frost & Sullivan
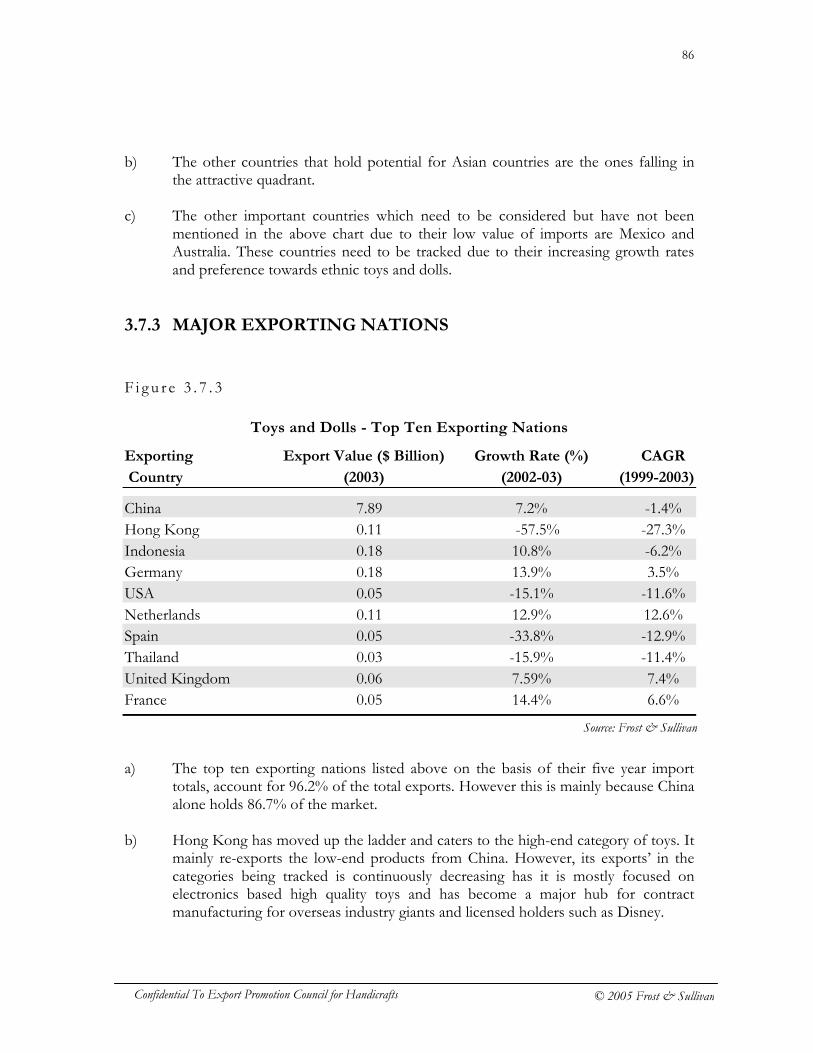
86
Confidential To Export Promotion Council for Handicrafts © 2005 Frost & Sullivan
b) The other countries that hold potential for Asian countries are the ones falling in the attractive quadrant.
c) The other important countries which need to be considered but have not been
mentioned in the above chart due to their low value of imports are Mexico and Australia. These countries need to be tracked due to their increasing growth rates and preference towards ethnic toys and dolls.
3.7.3 MAJOR EXPORTING NATIONS
F i g u r e 3 . 7 . 3
Toys and Dolls - Top Ten Exporting Nations
Exporting Export Value ($ Billion) Growth Rate (%) CAGR
Country (2003) (2002-03) (1999-2003)
China 7.89 7.2% -1.4% Hong Kong 0.11 -57.5% -27.3% Indonesia 0.18 10.8% -6.2% Germany 0.18 13.9% 3.5% USA 0.05 -15.1% -11.6% Netherlands 0.11 12.9% 12.6% Spain 0.05 -33.8% -12.9% Thailand 0.03 -15.9% -11.4% United Kingdom 0.06 7.59% 7.4% France 0.05 14.4% 6.6%
a) The top ten exporting nations listed above on the basis of their five year import
totals, account for 96.2% of the total exports. However this is mainly because China alone holds 86.7% of the market.
b) Hong Kong has moved up the ladder and caters to the high-end category of toys. It
mainly re-exports the low-end products from China. However, its exports’ in the categories being tracked is continuously decreasing has it is mostly focused on electronics based high quality toys and has become a major hub for contract manufacturing for overseas industry giants and licensed holders such as Disney.
Source: Frost & Sullivan
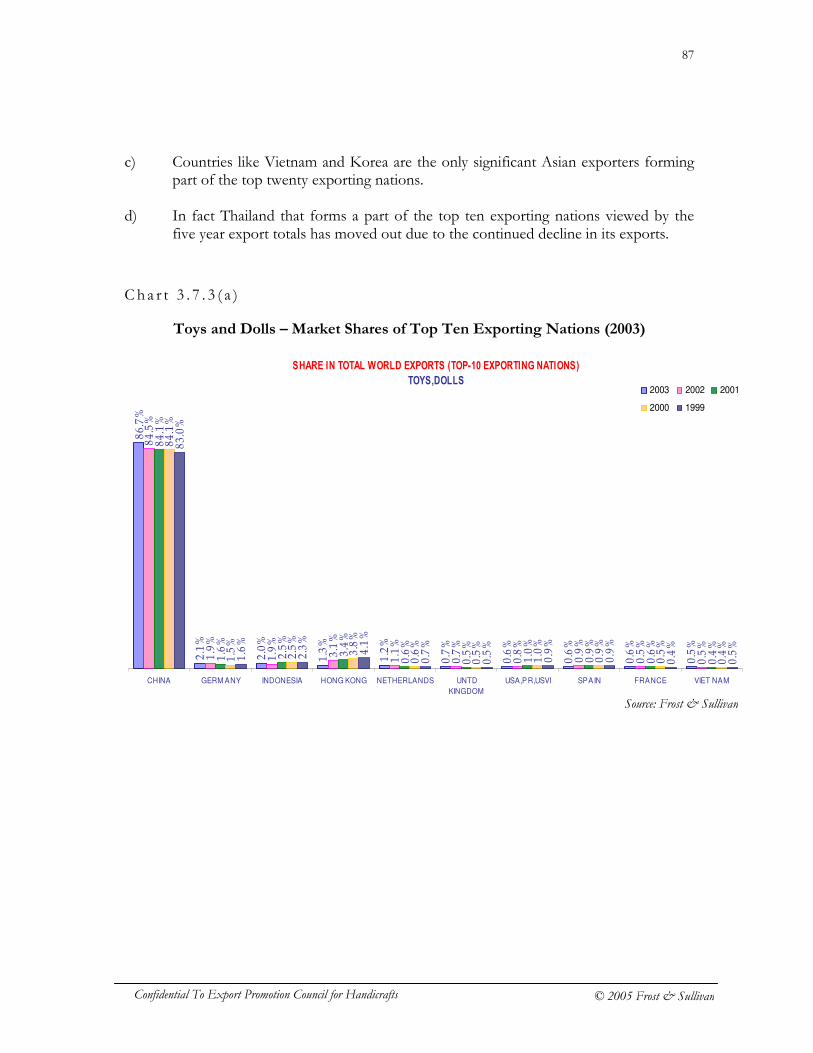
87
Confidential To Export Promotion Council for Handicrafts © 2005 Frost & Sullivan
c) Countries like Vietnam and Korea are the only significant Asian exporters forming part of the top twenty exporting nations.
d) In fact Thailand that forms a part of the top ten exporting nations viewed by the
five year export totals has moved out due to the continued decline in its exports.
C h a r t 3 . 7 . 3 ( a )
Toys and Dolls – Market Shares of Top Ten Exporting Nations (2003)
SHARE IN TOTAL WORLD EXPORTS (TOP-10 EXPORTING NATIONS)
TOYS,DOLLS
86.7%
2.1%
2.0%
1.3%
1.2%
0.7%
0.6%
0.6%
0.6%
0.5%
84.5%
1.9%
1.9%
3.1%
1.1%
0.7%
0.8%
0.9%
0.5%
0.5%
84.1%
1.6%
2.5%
3.4%
0.6%
0.5%
1.0%
0.9%
0.6%
0.4%
84.1%
1.5%
2.5%
3.8%
0.6%
0.5%
1.0%
0.9%
0.5%
0.4%
83.0%
1.6%
2.3%
4.1%
0.7%
0.5%
0.9%
0.9%
0.4%
0.5%
CHINA GERM ANY INDONESIA HONG KONG NETHERLANDS UNTD
KINGDOM
USA,PR,USVI SPAIN FRANCE VIET NAM
2003 2002 2001
2000 1999
Source: Frost & Sullivan
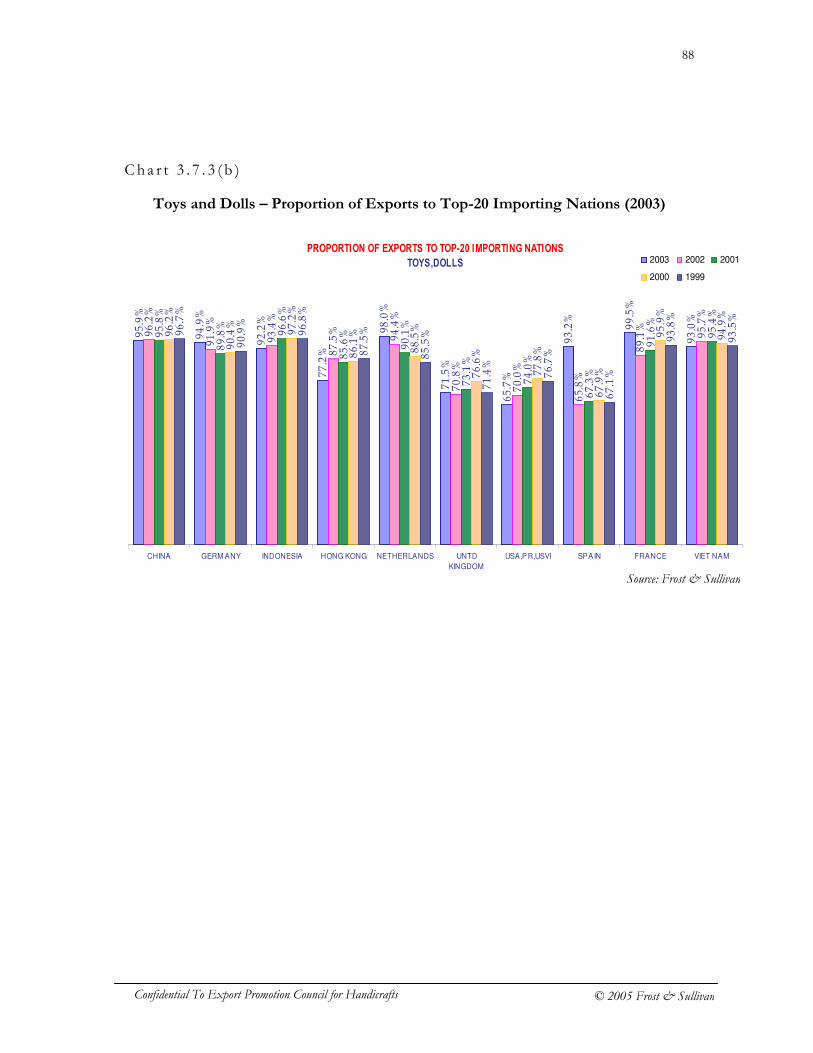
88
Confidential To Export Promotion Council for Handicrafts © 2005 Frost & Sullivan
Cha r t 3 . 7 . 3 ( b )
Toys and Dolls – Proportion of Exports to Top-20 Importing Nations (2003)
PROPORTION OF EXPORTS TO TOP-20 IMPORTING NATIONS
TOYS,DOLLS
95.9%
94.9%
92.2%
77.2%
98.0%
71.5%
65.7%
93.2%
99.5%
93.0%
96.2%
91.9%
93.4%
87.5%
94.4%
70.8%
70.0%
65.8%
89.1%
95.7%
95.8%
89.8%
96.6%
85.6%
90.1%
73.1%
74.0%
67.3%
91.6%
95.4%
96.2%
90.4%
97.2%
86.1%
88.5%
76.6%
77.8%
67.9%
95.9%
94.9%
96.7%
90.9%
96.8%
87.5%
85.5%
71.4%
76.7%
67.1%
93.8%
93.5%
CHINA GERM ANY INDONESIA HONG KONG NETHERLANDS UNTD
KINGDOM
USA,PR,USVI SPAIN FRANCE VIET NAM
2003 2002 2001
2000 1999
Source: Frost & Sullivan
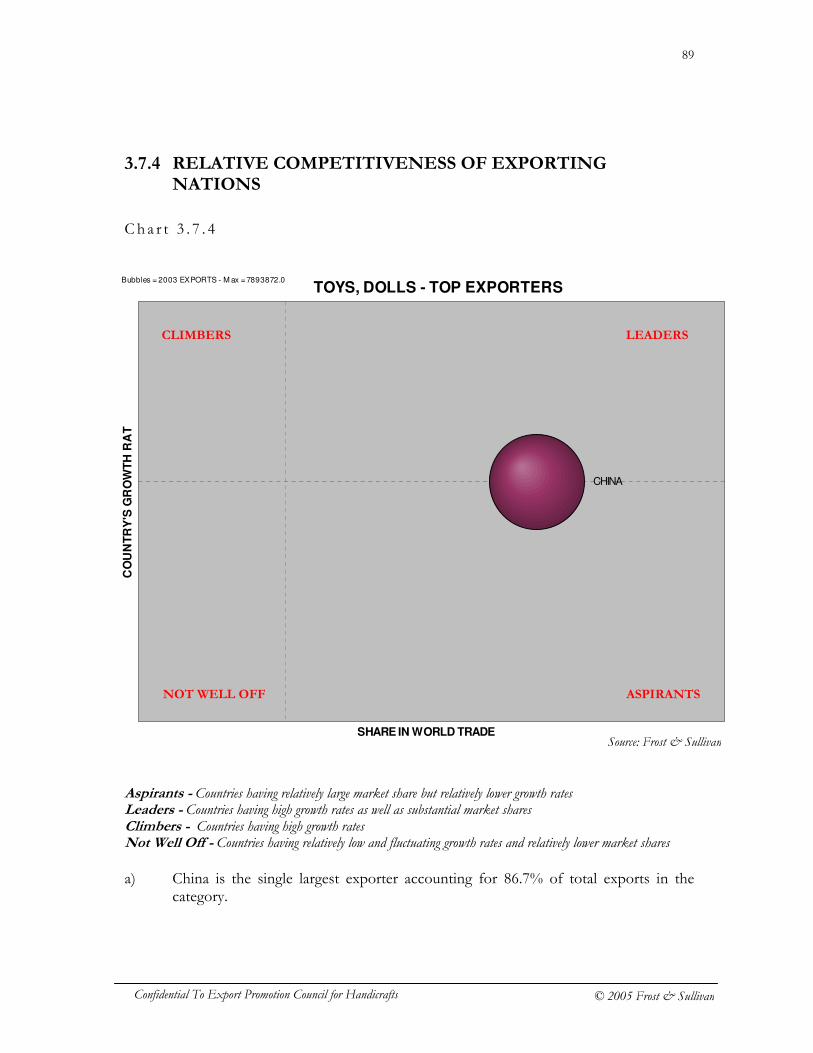
89
Confidential To Export Promotion Council for Handicrafts © 2005 Frost & Sullivan
3.7.4 RELATIVE COMPETITIVENESS OF EXPORTING NATIONS
Cha r t 3 . 7 . 4
Aspirants - Countries having relatively large market share but relatively lower growth rates Leaders - Countries having high growth rates as well as substantial market shares Climbers - Countries having high growth rates Not Well Off - Countries having relatively low and fluctuating growth rates and relatively lower market shares a) China is the single largest exporter accounting for 86.7% of total exports in the
category.
TOYS, DOLLS - TOP EXPORTERS
CHINA
SHARE IN WORLD TRADE
CO
UN
TR
Y'S
GR
OW
TH
RA
TE
Bubbles = 2003 EXPORTS - M ax = 7893872.0
LEADERS CLIMBERS
ASPIRANTS NOT WELL OFF
Source: Frost & Sullivan
90
Confidential To Export Promotion Council for Handicrafts © 2005 Frost & Sullivan
b) Indonesia is the second largest Asian exporter which has picked up exports substantially from 2003 onwards.
c) In spite of its relatively lower size of exports, the substantial support being given by
Japanese trade promotion organizations has helped it improve its export to Japan as well as other countries.
91
Confidential To Export Promotion Council for Handicrafts © 2005 Frost & Sullivan
3.8 Carpets a) The sub-products covered under the carpets category include knotted carpets of
wool or textile material, handmade rugs and other floor covering made of coir, textile material or fine animal hair including woven, not-tufted, flocked carpets or those made of pile construction (covered under HS Code 5701, 5702) and tufted “needle punched” carpets and floor coverings of wool, fine animal hair, textile material, nylon or other polyamides and felt (covered under HS Code 5703, 5704 and 5705).
b) The overall world market for traditional carpets and other handmade floor covering
showed negative growth rate in 2001 and 2002 due to factors like housing market slowdown and increasing influx of smooth floor coverings capturing an increasing share of the market - much to the detriment of the carpet sector, which was labeled as old fashioned. Fuelled by the numerous home makeover programs and magazines and the initial willingness of the US and especially European Union consumers to experiment with non-traditional floor coverings led to decrease in the imports of the traditional carpets and rugs.
c) However the with the picking-up of economic conditions in both US and European
Union countries and the subsequent increase in housing markets scenario accompanied with the present trend for re-styling and making homes more comfortable has caused the world imports for carpets to increase by a significant 9.7% in 2003.
d) The market for carpets is expected to continue to increase due to the resurgence of
its appeal in the traditional European Union market as well as the increasing influence of western lifestyle which has led to westernization of housing in Japan and Middle-east countries leading to increase in markets for carpets and there by imports.
e) Other factors expected to favorably impact the demand for carpets is the availability
of cheaper carpets of improving quality from China and other Asian countries as against the high priced carpets from Iran which is the traditional carpet exporting nation.
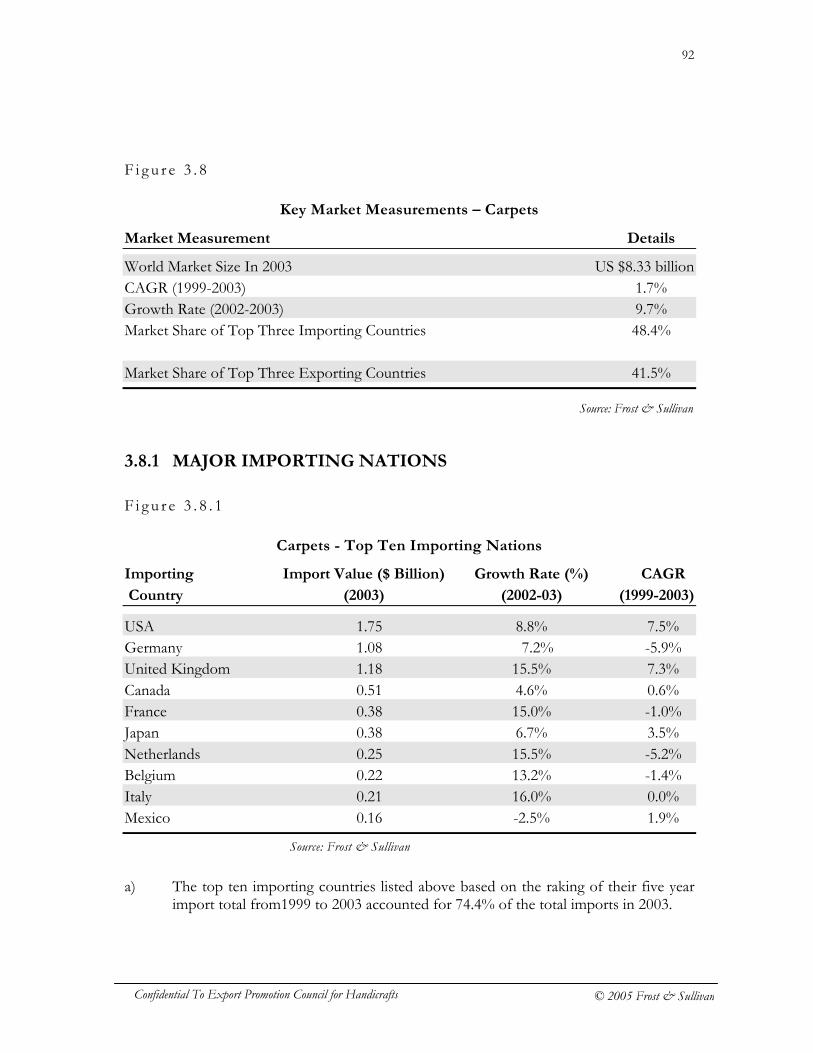
92
Confidential To Export Promotion Council for Handicrafts © 2005 Frost & Sullivan
F i g u r e 3 . 8
Key Market Measurements – Carpets
Market Measurement Details
World Market Size In 2003 US $8.33 billion CAGR (1999-2003) 1.7% Growth Rate (2002-2003) 9.7% Market Share of Top Three Importing Countries 48.4% Market Share of Top Three Exporting Countries 41.5%
3.8.1 MAJOR IMPORTING NATIONS
F i g u r e 3 . 8 . 1
Carpets - Top Ten Importing Nations
Importing Import Value ($ Billion) Growth Rate (%) CAGR
Country (2003) (2002-03) (1999-2003)
USA 1.75 8.8% 7.5% Germany 1.08 7.2% -5.9% United Kingdom 1.18 15.5% 7.3% Canada 0.51 4.6% 0.6% France 0.38 15.0% -1.0% Japan 0.38 6.7% 3.5% Netherlands 0.25 15.5% -5.2% Belgium 0.22 13.2% -1.4% Italy 0.21 16.0% 0.0% Mexico 0.16 -2.5% 1.9%
Source: Frost & Sullivan
a) The top ten importing countries listed above based on the raking of their five year
import total from1999 to 2003 accounted for 74.4% of the total imports in 2003.
Source: Frost & Sullivan
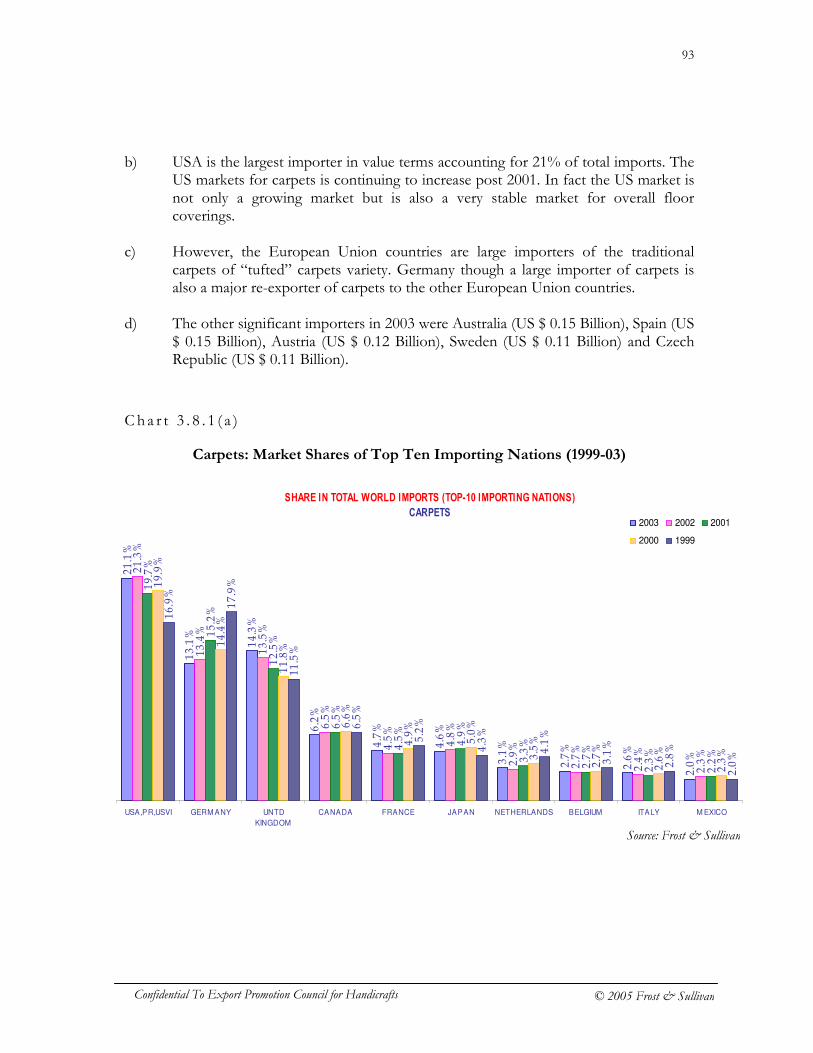
93
Confidential To Export Promotion Council for Handicrafts © 2005 Frost & Sullivan
b) USA is the largest importer in value terms accounting for 21% of total imports. The US markets for carpets is continuing to increase post 2001. In fact the US market is not only a growing market but is also a very stable market for overall floor coverings.
c) However, the European Union countries are large importers of the traditional
carpets of “tufted” carpets variety. Germany though a large importer of carpets is also a major re-exporter of carpets to the other European Union countries.
d) The other significant importers in 2003 were Australia (US $ 0.15 Billion), Spain (US
$ 0.15 Billion), Austria (US $ 0.12 Billion), Sweden (US $ 0.11 Billion) and Czech Republic (US $ 0.11 Billion).
C h a r t 3 . 8 . 1 ( a )
Carpets: Market Shares of Top Ten Importing Nations (1999-03)
SHARE IN TOTAL WORLD IMPORTS (TOP-10 IMPORTING NATIONS)
CARPETS
21.1%
13.1%
14.3%
6.2%
4.7%
4.6%
3.1%
2.7%
2.6%
2.0%
21.3%
13.4%
13.5%
6.5%
4.5%
4.8%
2.9%
2.7%
2.4%
2.3%
19.7%
15.2%
12.5%
6.5%
4.5%
4.9%
3.3%
2.7%
2.3%
2.2%
19.9%
14.4%
11.8%
6.6%
4.9%
5.0%
3.5%
2.7%
2.6%
2.3%
16.9%
17.9%
11.5%
6.5%
5.2%
4.3%
4.1%
3.1%
2.8%
2.0%
USA,PR,USVI GERM ANY UNTD
KINGDOM
CANADA FRANCE JAPAN NETHERLANDS BELGIUM ITALY M EXICO
2003 2002 2001
2000 1999
Source: Frost & Sullivan
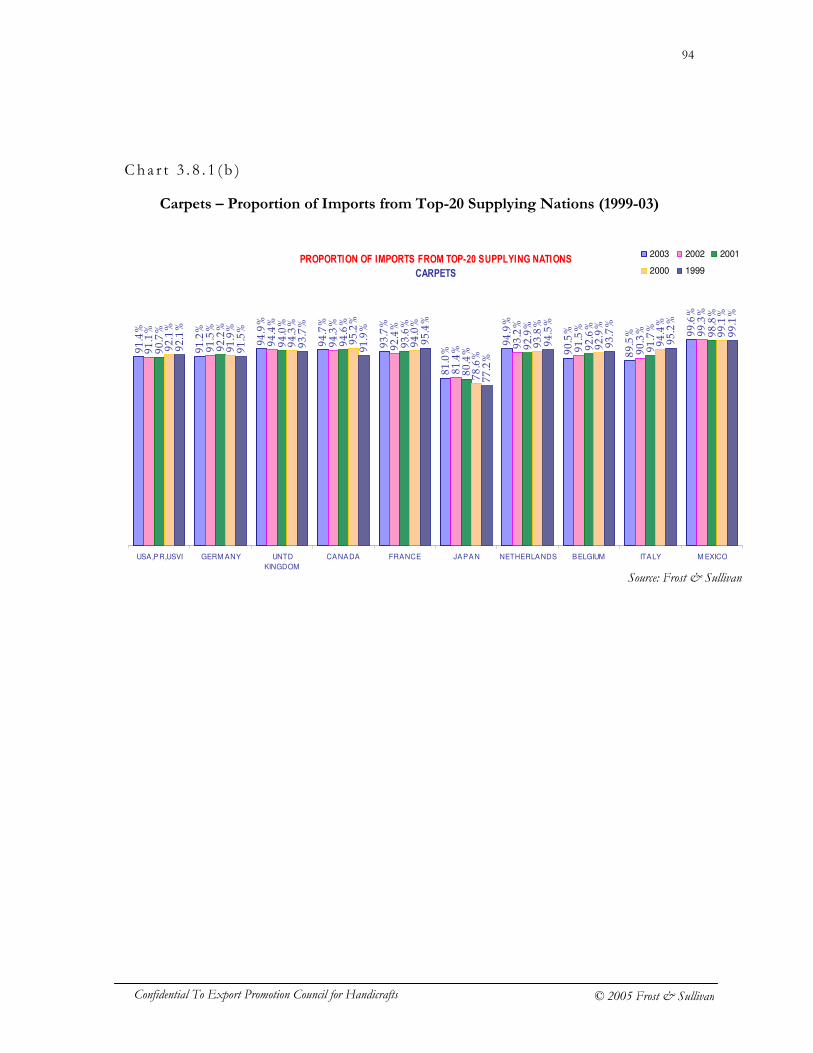
94
Confidential To Export Promotion Council for Handicrafts © 2005 Frost & Sullivan
Cha r t 3 . 8 . 1 ( b )
Carpets – Proportion of Imports from Top-20 Supplying Nations (1999-03)
PROPORTION OF IMPORTS FROM TOP-20 SUPPLYING NATIONS
CARPETS
91.4%
91.2%
94.9%
94.7%
93.7%
81.0%
94.9%
90.5%
89.5% 99.6%
91.1%
91.5%
94.4%
94.3%
92.4%
81.4%
93.2%
91.5%
90.3% 99.3%
90.7%
92.2%
94.0%
94.6%
93.6%
80.4%
92.9%
92.6%
91.7%
98.8%
92.1%
91.9%
94.3%
95.2%
94.0%
78.6%
93.8%
92.9%
94.4%
99.1%
92.1%
91.5%
93.7%
91.9%
95.4%
77.2%
94.5%
93.7%
95.2%
99.1%
USA,PR,USVI GERM ANY UNTD
KINGDOM
CANADA FRANCE JAPAN NETHERLANDS BELGIUM ITALY M EXICO
2003 2002 2001
2000 1999
Source: Frost & Sullivan
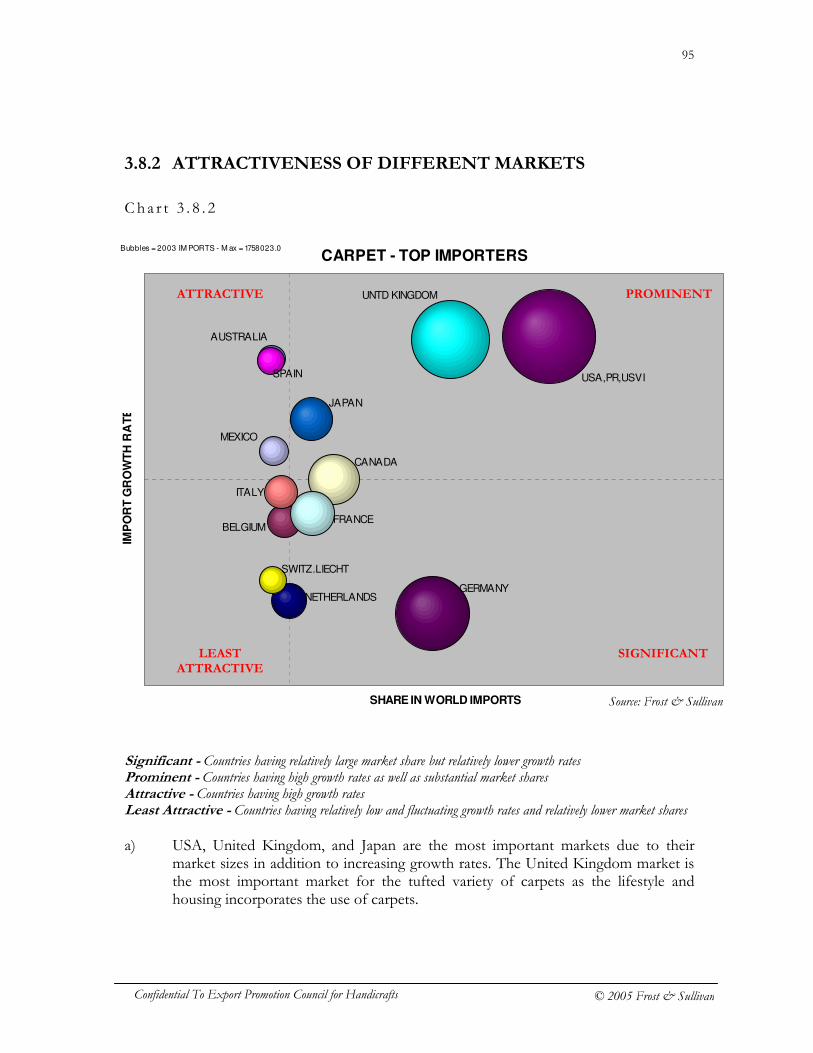
95
Confidential To Export Promotion Council for Handicrafts © 2005 Frost & Sullivan
3.8.2 ATTRACTIVENESS OF DIFFERENT MARKETS
Cha r t 3 . 8 . 2
Significant - Countries having relatively large market share but relatively lower growth rates Prominent - Countries having high growth rates as well as substantial market shares Attractive - Countries having high growth rates Least Attractive - Countries having relatively low and fluctuating growth rates and relatively lower market shares a) USA, United Kingdom, and Japan are the most important markets due to their
market sizes in addition to increasing growth rates. The United Kingdom market is the most important market for the tufted variety of carpets as the lifestyle and housing incorporates the use of carpets.
CARPET - TOP IMPORTERS
AUSTRALIA
BELGIUM
CANADA
FRANCE
GERMANY
ITALY
JAPAN
MEXICO
NETHERLANDS
SPAIN
SWITZ.LIECHT
UNTD KINGDOM
USA,PR,USVI
SHARE IN WORLD IMPORTS
IMP
OR
T G
RO
WT
H R
AT
E
Bubbles = 2003 IM PORTS - M ax = 1758023.0
PROMINENT ATTRACTIVE
SIGNIFICANT LEAST ATTRACTIVE
Source: Frost & Sullivan
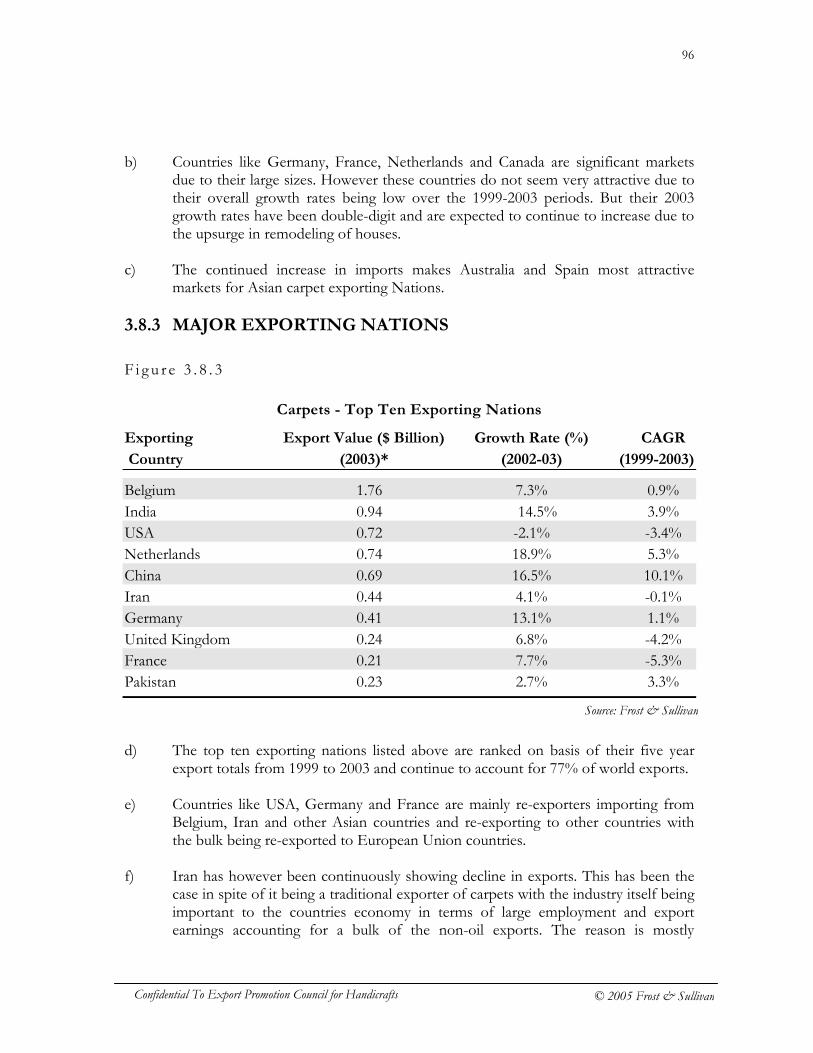
96
Confidential To Export Promotion Council for Handicrafts © 2005 Frost & Sullivan
b) Countries like Germany, France, Netherlands and Canada are significant markets due to their large sizes. However these countries do not seem very attractive due to their overall growth rates being low over the 1999-2003 periods. But their 2003 growth rates have been double-digit and are expected to continue to increase due to the upsurge in remodeling of houses.
c) The continued increase in imports makes Australia and Spain most attractive
markets for Asian carpet exporting Nations. 3.8.3 MAJOR EXPORTING NATIONS
F i g u r e 3 . 8 . 3
Carpets - Top Ten Exporting Nations
Exporting Export Value ($ Billion) Growth Rate (%) CAGR
Country (2003)* (2002-03) (1999-2003)
Belgium 1.76 7.3% 0.9% India 0.94 14.5% 3.9% USA 0.72 -2.1% -3.4% Netherlands 0.74 18.9% 5.3% China 0.69 16.5% 10.1% Iran 0.44 4.1% -0.1% Germany 0.41 13.1% 1.1% United Kingdom 0.24 6.8% -4.2% France 0.21 7.7% -5.3% Pakistan 0.23 2.7% 3.3%
d) The top ten exporting nations listed above are ranked on basis of their five year
export totals from 1999 to 2003 and continue to account for 77% of world exports. e) Countries like USA, Germany and France are mainly re-exporters importing from
Belgium, Iran and other Asian countries and re-exporting to other countries with the bulk being re-exported to European Union countries.
f) Iran has however been continuously showing decline in exports. This has been the
case in spite of it being a traditional exporter of carpets with the industry itself being important to the countries economy in terms of large employment and export earnings accounting for a bulk of the non-oil exports. The reason is mostly
Source: Frost & Sullivan
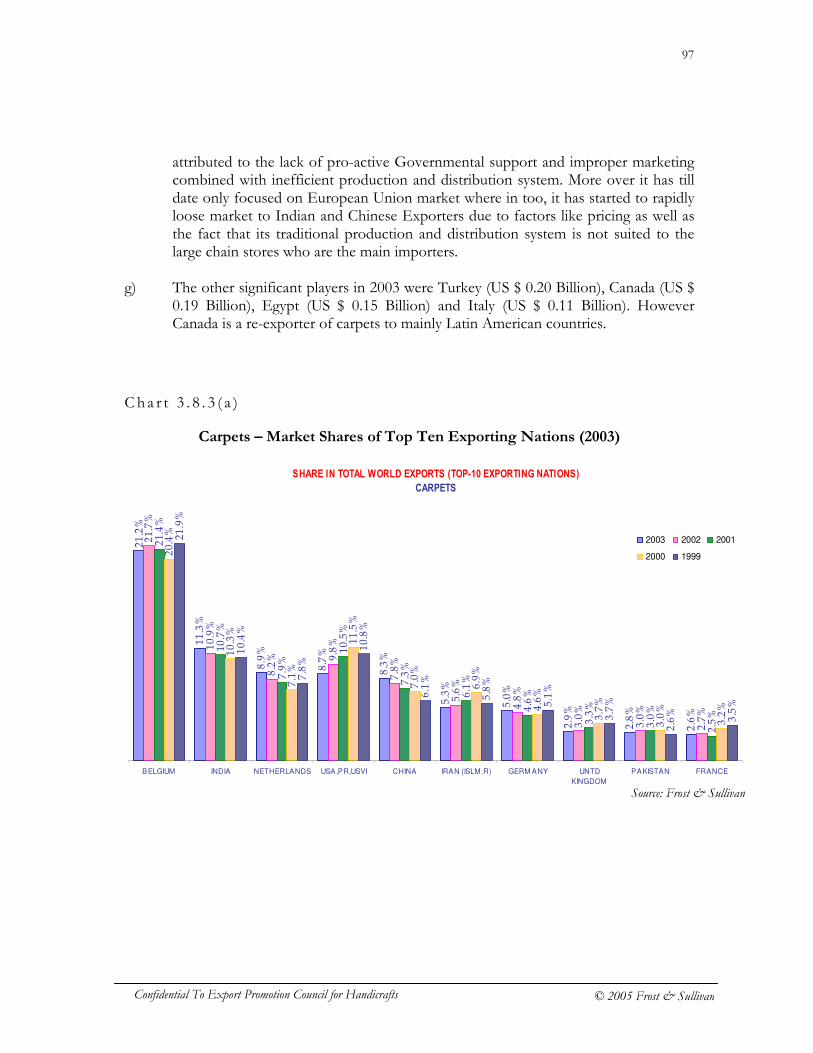
97
Confidential To Export Promotion Council for Handicrafts © 2005 Frost & Sullivan
attributed to the lack of pro-active Governmental support and improper marketing combined with inefficient production and distribution system. More over it has till date only focused on European Union market where in too, it has started to rapidly loose market to Indian and Chinese Exporters due to factors like pricing as well as the fact that its traditional production and distribution system is not suited to the large chain stores who are the main importers.
g) The other significant players in 2003 were Turkey (US $ 0.20 Billion), Canada (US $
0.19 Billion), Egypt (US $ 0.15 Billion) and Italy (US $ 0.11 Billion). However Canada is a re-exporter of carpets to mainly Latin American countries.
C h a r t 3 . 8 . 3 ( a )
Carpets – Market Shares of Top Ten Exporting Nations (2003)
SHARE IN TOTAL WORLD EXPORTS (TOP-10 EXPORTING NATIONS)
CARPETS
21.2%
11.3%
8.9%
8.7%
8.3%
5.3%
5.0%
2.9%
2.8%
2.6%
21.7%
10.9%
8.2% 9.8%
7.8%
5.6%
4.8%
3.0%
3.0%
2.7%
21.4%
10.7%
7.9%
10.5%
7.3%
6.1%
4.6%
3.3%
3.0%
2.5%
20.4%
10.3%
7.1%
11.5%
7.0%
6.9%
4.6%
3.7%
3.0%
3.2%
21.9%
10.4%
7.8%
10.8%
6.1%
5.8%
5.1%
3.7%
2.6%
3.5%
BELGIUM INDIA NETHERLANDS USA,PR,USVI CHINA IRAN (ISLM .R) GERM ANY UNTD
KINGDOM
PAKISTAN FRANCE
2003 2002 2001
2000 1999
Source: Frost & Sullivan
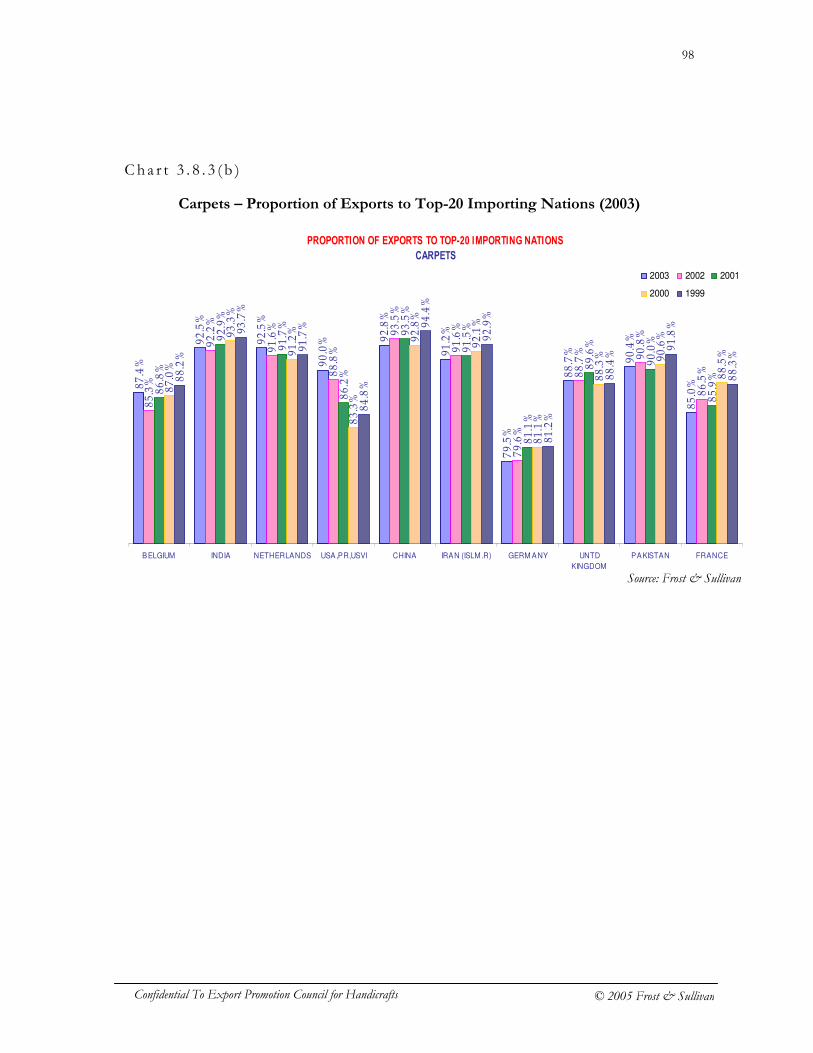
98
Confidential To Export Promotion Council for Handicrafts © 2005 Frost & Sullivan
Cha r t 3 . 8 . 3 ( b )
Carpets – Proportion of Exports to Top-20 Importing Nations (2003)
PROPORTION OF EXPORTS TO TOP-20 IMPORTING NATIONS
CARPETS
87.4%
92.5%
92.5%
90.0% 92.8%
91.2%
79.5%
88.7%
90.4%
85.0%
85.3%
92.2%
91.6%
88.8%
93.5%
91.6%
79.6%
88.7% 90.8%
86.5%
86.8%
92.9%
91.7%
86.2%
93.5%
91.5%
81.1%
89.6%
90.0%
85.9%
87.0%
93.3%
91.2%
83.3%
92.8%
92.1%
81.1%
88.3% 90.6%
88.5%
88.2%
93.7%
91.7%
84.8%
94.4%
92.9%
81.2%
88.4%
91.8%
88.3%
BELGIUM INDIA NETHERLANDS USA,PR,USVI CHINA IRAN (ISLM .R) GERM ANY UNTD
KINGDOM
PAKISTAN FRANCE
2003 2002 2001
2000 1999
Source: Frost & Sullivan
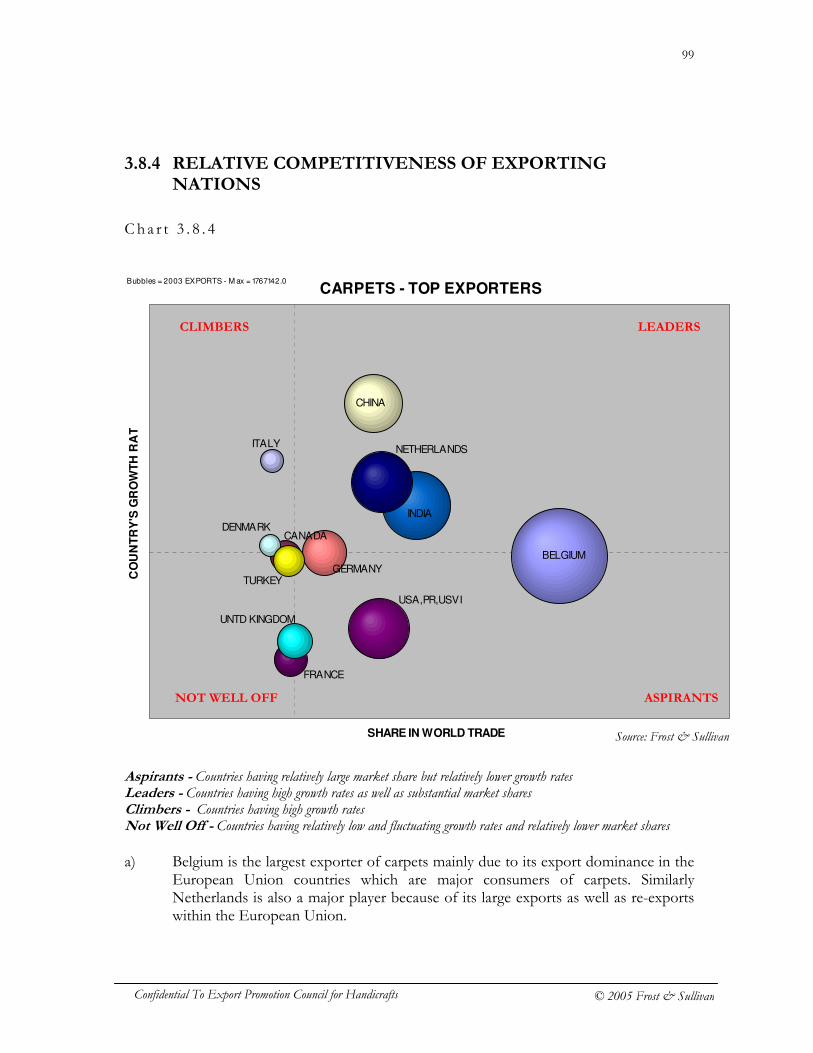
99
Confidential To Export Promotion Council for Handicrafts © 2005 Frost & Sullivan
3.8.4 RELATIVE COMPETITIVENESS OF EXPORTING NATIONS
Cha r t 3 . 8 . 4
Aspirants - Countries having relatively large market share but relatively lower growth rates Leaders - Countries having high growth rates as well as substantial market shares Climbers - Countries having high growth rates Not Well Off - Countries having relatively low and fluctuating growth rates and relatively lower market shares a) Belgium is the largest exporter of carpets mainly due to its export dominance in the
European Union countries which are major consumers of carpets. Similarly Netherlands is also a major player because of its large exports as well as re-exports within the European Union.
CARPETS - TOP EXPORTERS
BELGIUM
CANADA
CHINA
DENMARK
FRANCE
GERMANY
INDIA
ITALY NETHERLANDS
TURKEY
UNTD KINGDOM
USA,PR,USVI
SHARE IN WORLD TRADE
CO
UN
TR
Y'S
GR
OW
TH
RA
TE
Bubbles = 2003 EXPORTS - M ax = 1767142.0
LEADERS CLIMBERS
ASPIRANTS NOT WELL OFF
Source: Frost & Sullivan
100
Confidential To Export Promotion Council for Handicrafts © 2005 Frost & Sullivan
b) India and China are the other two leading players due to their ability to export large volumes as well as better promotion and distribution especially in North America.
c) From the perspective of Asian exporters, no other country offers much opposition
as most other countries that feature in the chart are re-exporters. USA is a large re-exporter to Canada and Mexico and the other European Union countries are large players in intra-EU trade.
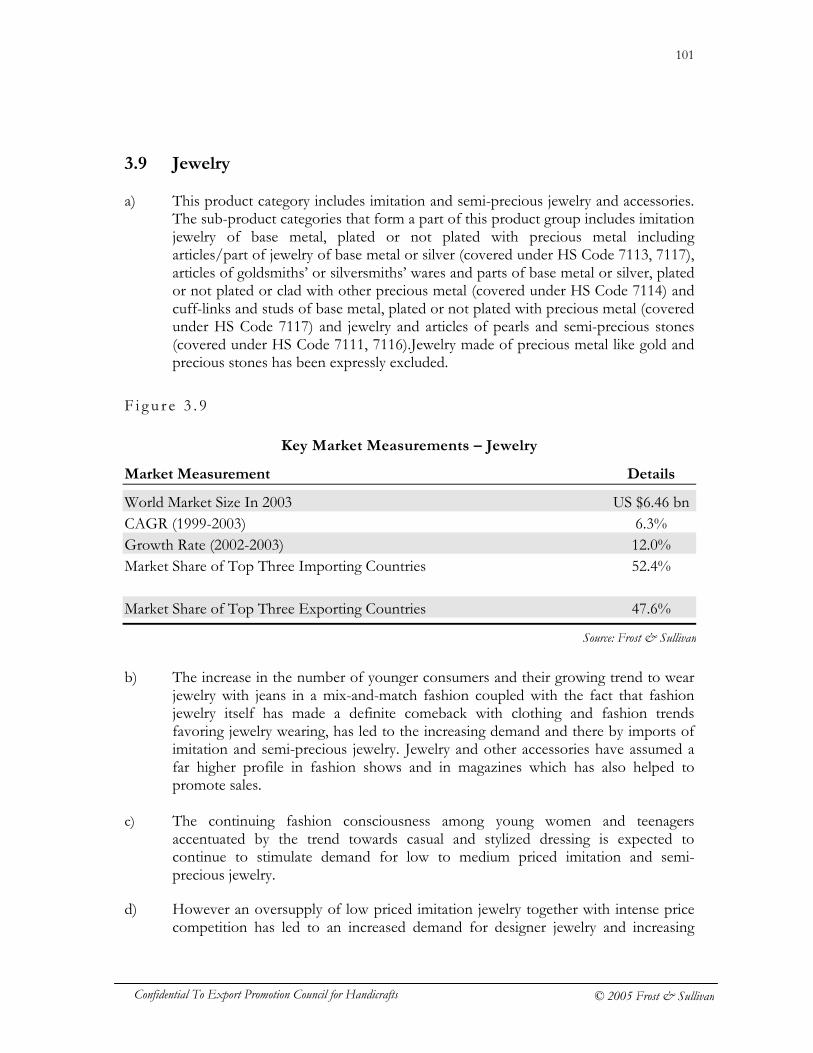
101
Confidential To Export Promotion Council for Handicrafts © 2005 Frost & Sullivan
3.9 Jewelry a) This product category includes imitation and semi-precious jewelry and accessories.
The sub-product categories that form a part of this product group includes imitation jewelry of base metal, plated or not plated with precious metal including articles/part of jewelry of base metal or silver (covered under HS Code 7113, 7117), articles of goldsmiths’ or silversmiths’ wares and parts of base metal or silver, plated or not plated or clad with other precious metal (covered under HS Code 7114) and cuff-links and studs of base metal, plated or not plated with precious metal (covered under HS Code 7117) and jewelry and articles of pearls and semi-precious stones (covered under HS Code 7111, 7116).Jewelry made of precious metal like gold and precious stones has been expressly excluded.
F i g u r e 3 . 9
Key Market Measurements – Jewelry
Market Measurement Details
World Market Size In 2003 US $6.46 bn CAGR (1999-2003) 6.3% Growth Rate (2002-2003) 12.0% Market Share of Top Three Importing Countries 52.4% Market Share of Top Three Exporting Countries 47.6%
b) The increase in the number of younger consumers and their growing trend to wear
jewelry with jeans in a mix-and-match fashion coupled with the fact that fashion jewelry itself has made a definite comeback with clothing and fashion trends favoring jewelry wearing, has led to the increasing demand and there by imports of imitation and semi-precious jewelry. Jewelry and other accessories have assumed a far higher profile in fashion shows and in magazines which has also helped to promote sales.
c) The continuing fashion consciousness among young women and teenagers
accentuated by the trend towards casual and stylized dressing is expected to continue to stimulate demand for low to medium priced imitation and semi-precious jewelry.
d) However an oversupply of low priced imitation jewelry together with intense price
competition has led to an increased demand for designer jewelry and increasing
Source: Frost & Sullivan
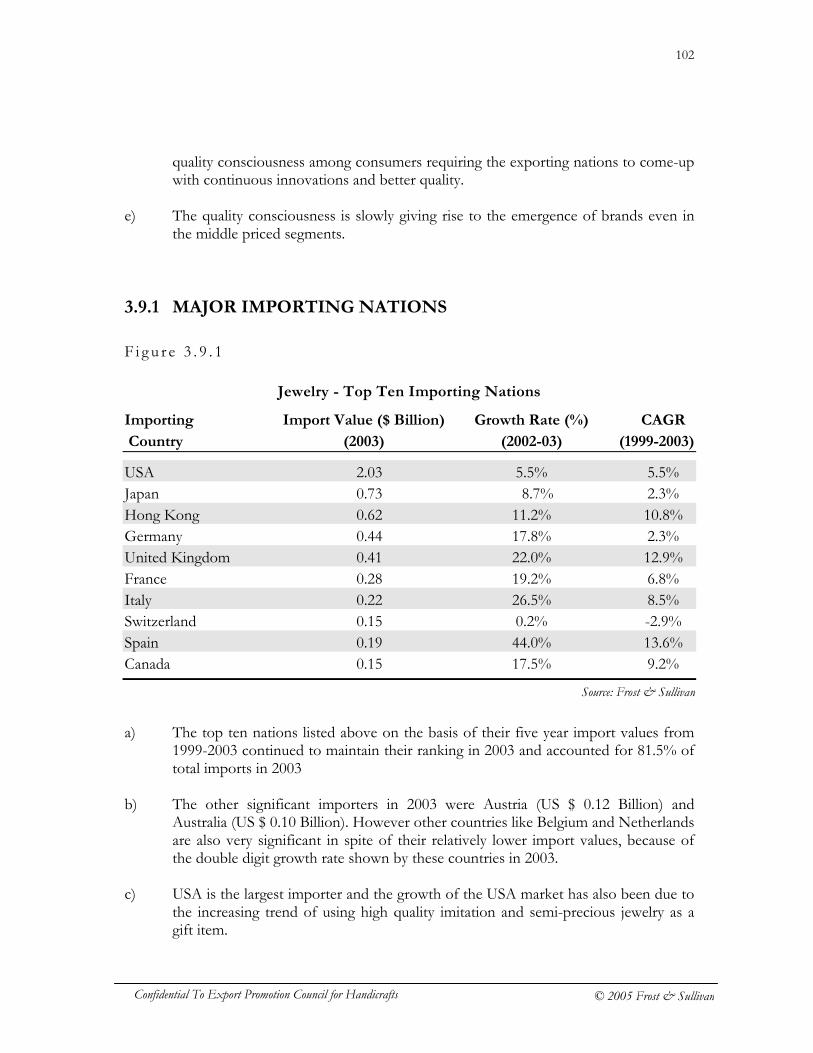
102
Confidential To Export Promotion Council for Handicrafts © 2005 Frost & Sullivan
quality consciousness among consumers requiring the exporting nations to come-up with continuous innovations and better quality.
e) The quality consciousness is slowly giving rise to the emergence of brands even in
the middle priced segments. 3.9.1 MAJOR IMPORTING NATIONS
F i g u r e 3 . 9 . 1
Jewelry - Top Ten Importing Nations
Importing Import Value ($ Billion) Growth Rate (%) CAGR
Country (2003) (2002-03) (1999-2003)
USA 2.03 5.5% 5.5% Japan 0.73 8.7% 2.3% Hong Kong 0.62 11.2% 10.8% Germany 0.44 17.8% 2.3% United Kingdom 0.41 22.0% 12.9% France 0.28 19.2% 6.8% Italy 0.22 26.5% 8.5% Switzerland 0.15 0.2% -2.9% Spain 0.19 44.0% 13.6% Canada 0.15 17.5% 9.2%
a) The top ten nations listed above on the basis of their five year import values from
1999-2003 continued to maintain their ranking in 2003 and accounted for 81.5% of total imports in 2003
b) The other significant importers in 2003 were Austria (US $ 0.12 Billion) and
Australia (US $ 0.10 Billion). However other countries like Belgium and Netherlands are also very significant in spite of their relatively lower import values, because of the double digit growth rate shown by these countries in 2003.
c) USA is the largest importer and the growth of the USA market has also been due to
the increasing trend of using high quality imitation and semi-precious jewelry as a gift item.
Source: Frost & Sullivan
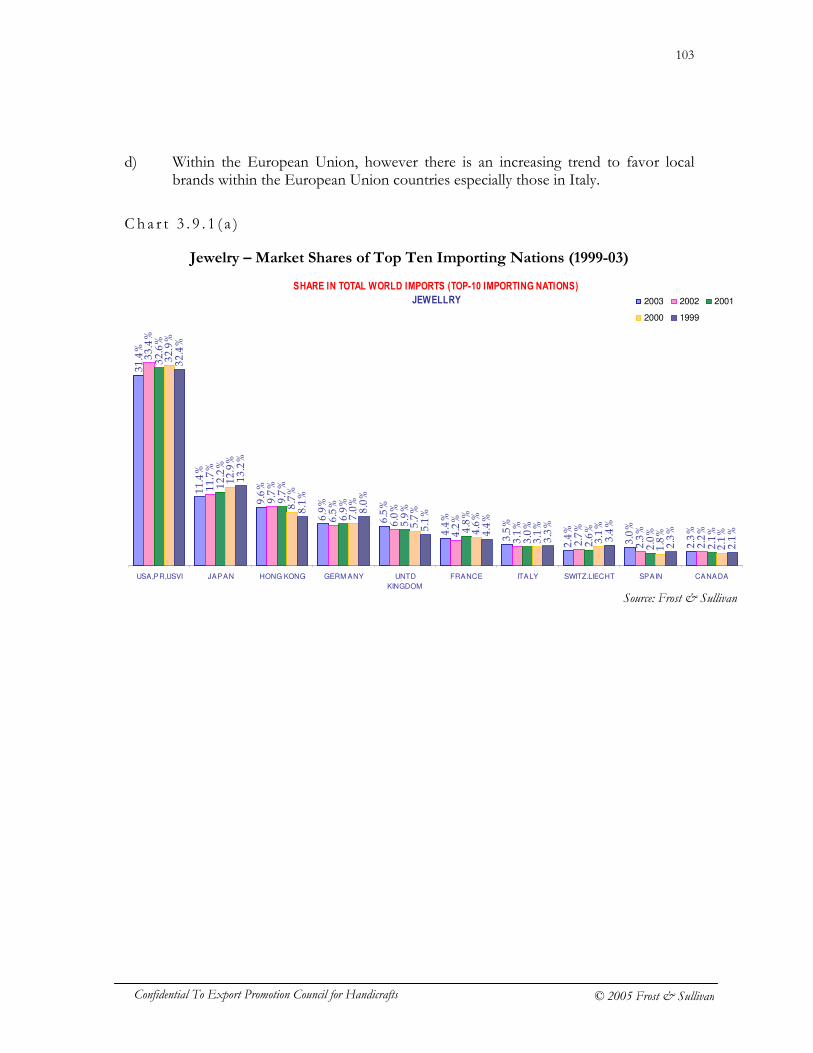
103
Confidential To Export Promotion Council for Handicrafts © 2005 Frost & Sullivan
d) Within the European Union, however there is an increasing trend to favor local brands within the European Union countries especially those in Italy.
C h a r t 3 . 9 . 1 ( a )
Jewelry – Market Shares of Top Ten Importing Nations (1999-03)
Source: Frost & Sullivan
SHARE IN TOTAL WORLD IMPORTS (TOP-10 IMPORTING NATIONS)
JEWELLRY
31.4%
11.4%
9.6%
6.9%
6.5%
4.4%
3.5%
2.4%
3.0%
2.3%
33.4%
11.7%
9.7%
6.5%
6.0%
4.2%
3.1%
2.7%
2.3%
2.2%
32.6%
12.2%
9.7%
6.9%
5.9%
4.8%
3.0%
2.6%
2.0%
2.1%
32.9%
12.9%
8.7%
7.0%
5.7%
4.6%
3.1%
3.1%
1.8%
2.1%
32.4%
13.2%
8.1%
8.0%
5.1%
4.4%
3.3%
3.4%
2.3%
2.1%
USA,PR,USVI JAPAN HONG KONG GERM ANY UNTD
KINGDOM
FRANCE ITALY SWITZ.LIECHT SPAIN CANADA
2003 2002 2001
2000 1999
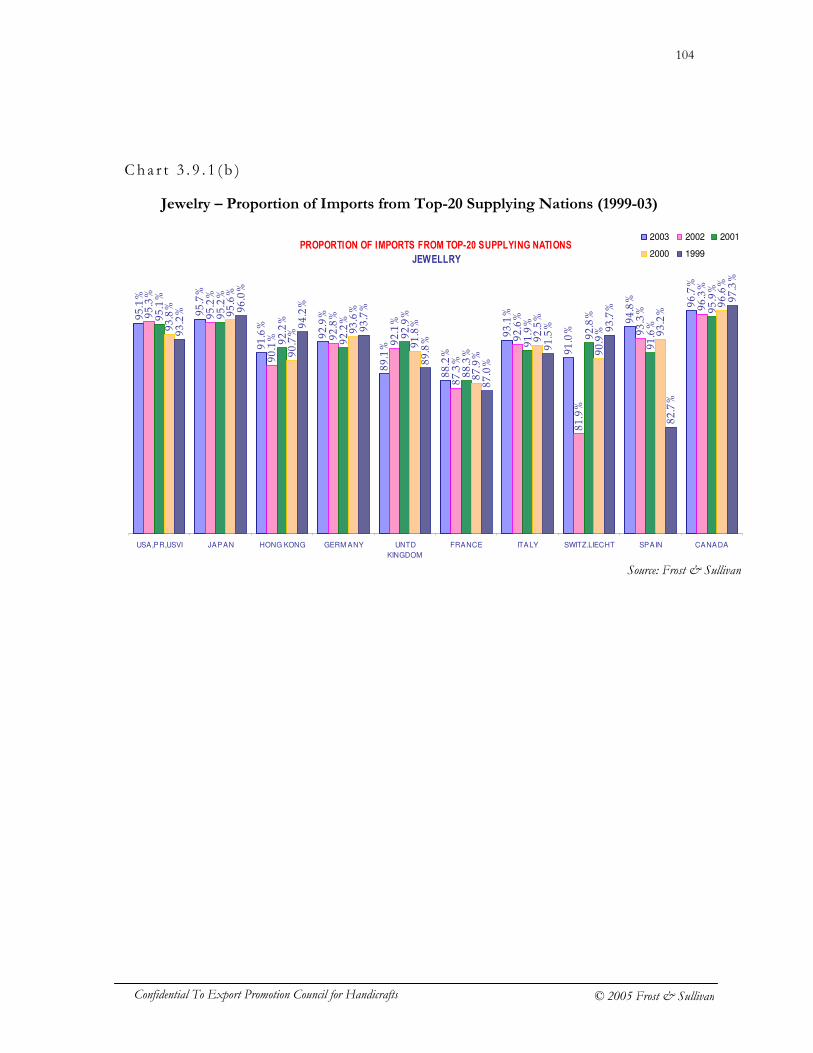
104
Confidential To Export Promotion Council for Handicrafts © 2005 Frost & Sullivan
Cha r t 3 . 9 . 1 ( b )
Jewelry – Proportion of Imports from Top-20 Supplying Nations (1999-03)
PROPORTION OF IMPORTS FROM TOP-20 SUPPLYING NATIONS
JEWELLRY
95.1%
95.7%
91.6%
92.9%
89.1%
88.2%
93.1%
91.0%
94.8%
96.7%
95.3%
95.2%
90.1% 92.8%
92.1%
87.3%
92.6%
81.9%
93.3%
96.3%
95.1%
95.2%
92.2%
92.2%
92.9%
88.3%
91.9%
92.8%
91.6%
95.9%
93.8%
95.6%
90.7% 93.6%
91.8%
87.9%
92.5%
90.9% 93.2%
96.6%
93.2% 96.0%
94.2%
93.7%
89.8%
87.0%
91.5% 93.7%
82.7%
97.3%
USA,PR,USVI JAPAN HONG KONG GERM ANY UNTD
KINGDOM
FRANCE ITALY SWITZ.LIECHT SPAIN CANADA
2003 2002 2001
2000 1999
Source: Frost & Sullivan
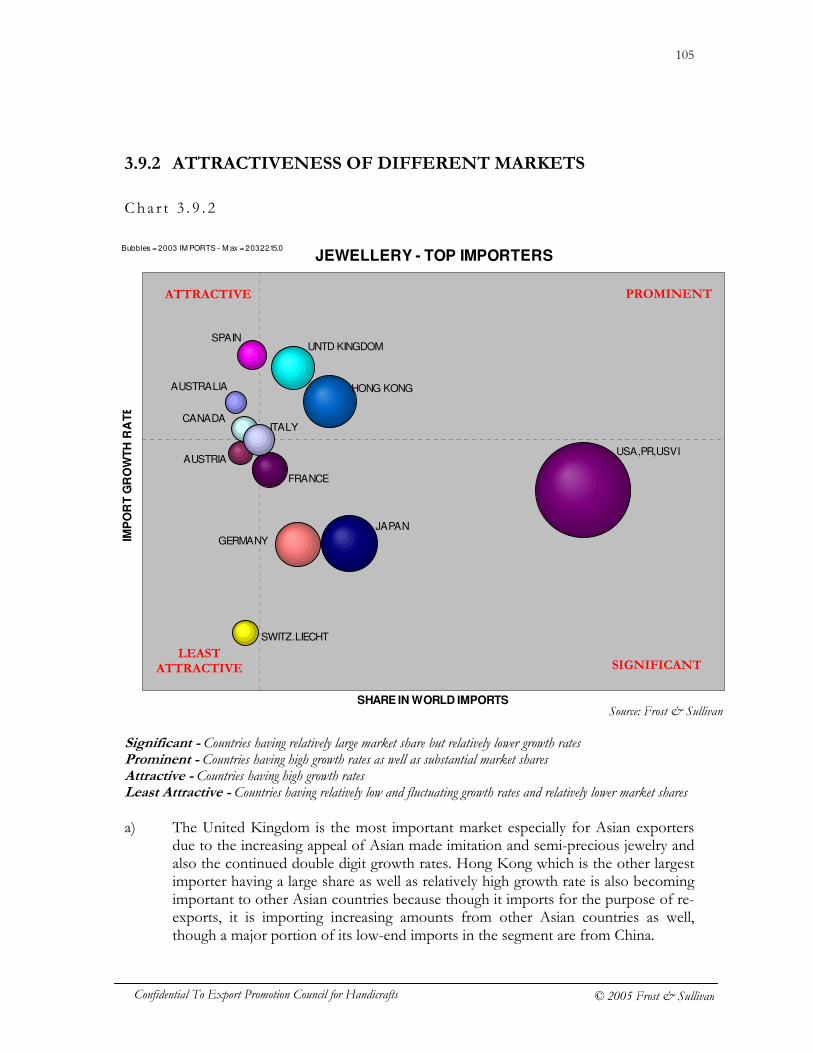
105
Confidential To Export Promotion Council for Handicrafts © 2005 Frost & Sullivan
3.9.2 ATTRACTIVENESS OF DIFFERENT MARKETS
Cha r t 3 . 9 . 2
Significant - Countries having relatively large market share but relatively lower growth rates Prominent - Countries having high growth rates as well as substantial market shares Attractive - Countries having high growth rates Least Attractive - Countries having relatively low and fluctuating growth rates and relatively lower market shares a) The United Kingdom is the most important market especially for Asian exporters
due to the increasing appeal of Asian made imitation and semi-precious jewelry and also the continued double digit growth rates. Hong Kong which is the other largest importer having a large share as well as relatively high growth rate is also becoming important to other Asian countries because though it imports for the purpose of re-exports, it is importing increasing amounts from other Asian countries as well, though a major portion of its low-end imports in the segment are from China.
JEWELLERY - TOP IMPORTERS
AUSTRALIA
AUSTRIA
CANADA
FRANCE
GERMANY
HONG KONG
ITALY
JAPAN
SPAIN
SWITZ.LIECHT
UNTD KINGDOM
USA,PR,USVI
SHARE IN WORLD IMPORTS
IMP
OR
T G
RO
WT
H R
AT
E
Bubbles = 2003 IM PORTS - M ax = 2032215.0
PROMINENT ATTRACTIVE
SIGNIFICANT LEAST
ATTRACTIVE
Source: Frost & Sullivan
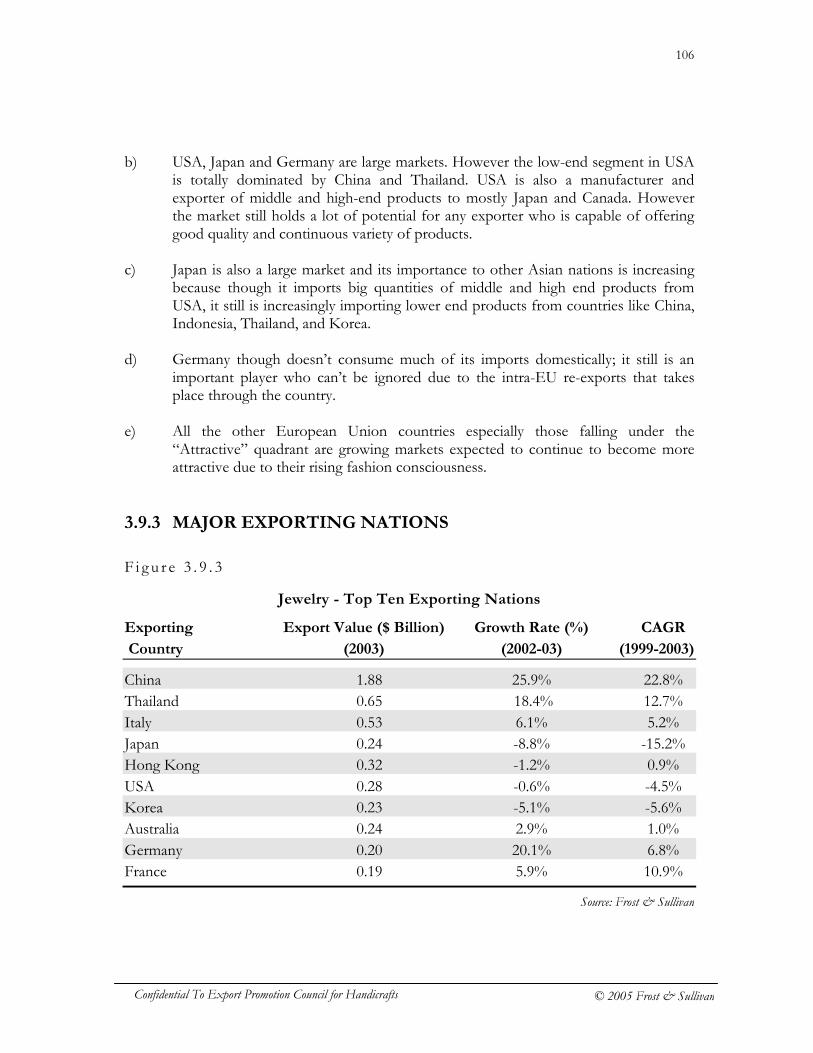
106
Confidential To Export Promotion Council for Handicrafts © 2005 Frost & Sullivan
b) USA, Japan and Germany are large markets. However the low-end segment in USA is totally dominated by China and Thailand. USA is also a manufacturer and exporter of middle and high-end products to mostly Japan and Canada. However the market still holds a lot of potential for any exporter who is capable of offering good quality and continuous variety of products.
c) Japan is also a large market and its importance to other Asian nations is increasing
because though it imports big quantities of middle and high end products from USA, it still is increasingly importing lower end products from countries like China, Indonesia, Thailand, and Korea.
d) Germany though doesn’t consume much of its imports domestically; it still is an
important player who can’t be ignored due to the intra-EU re-exports that takes place through the country.
e) All the other European Union countries especially those falling under the
“Attractive” quadrant are growing markets expected to continue to become more attractive due to their rising fashion consciousness.
3.9.3 MAJOR EXPORTING NATIONS
F i g u r e 3 . 9 . 3
Jewelry - Top Ten Exporting Nations
Exporting Export Value ($ Billion) Growth Rate (%) CAGR
Country (2003) (2002-03) (1999-2003)
China 1.88 25.9% 22.8% Thailand 0.65 18.4% 12.7% Italy 0.53 6.1% 5.2% Japan 0.24 -8.8% -15.2% Hong Kong 0.32 -1.2% 0.9% USA 0.28 -0.6% -4.5% Korea 0.23 -5.1% -5.6% Australia 0.24 2.9% 1.0% Germany 0.20 20.1% 6.8% France 0.19 5.9% 10.9%
Source: Frost & Sullivan
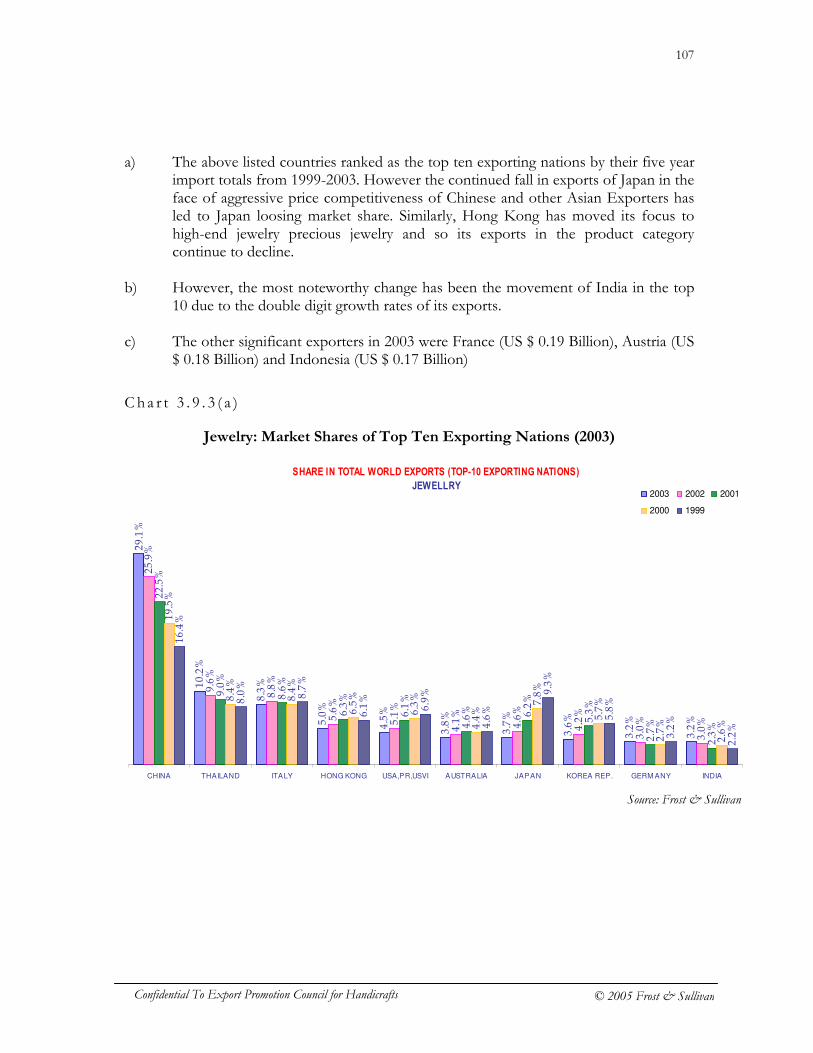
107
Confidential To Export Promotion Council for Handicrafts © 2005 Frost & Sullivan
a) The above listed countries ranked as the top ten exporting nations by their five year import totals from 1999-2003. However the continued fall in exports of Japan in the face of aggressive price competitiveness of Chinese and other Asian Exporters has led to Japan loosing market share. Similarly, Hong Kong has moved its focus to high-end jewelry precious jewelry and so its exports in the product category continue to decline.
b) However, the most noteworthy change has been the movement of India in the top
10 due to the double digit growth rates of its exports. c) The other significant exporters in 2003 were France (US $ 0.19 Billion), Austria (US
$ 0.18 Billion) and Indonesia (US $ 0.17 Billion)
Ch a r t 3 . 9 . 3 ( a )
Jewelry: Market Shares of Top Ten Exporting Nations (2003)
SHARE IN TOTAL WORLD EXPORTS (TOP-10 EXPORTING NATIONS)
JEWELLRY
29.1%
10.2%
8.3%
5.0%
4.5%
3.8%
3.7%
3.6%
3.2%
3.2%
25.9%
9.6%
8.8%
5.6%
5.1%
4.1%
4.6%
4.2%
3.0%
3.0%
22.5%
9.0%
8.6%
6.3%
6.1%
4.6% 6.2%
5.3%
2.7%
2.3%
19.5%
8.4%
8.4%
6.5%
6.3%
4.4%
7.8%
5.7%
2.7%
2.6%
16.4%
8.0%
8.7%
6.1%
6.9%
4.6%
9.3%
5.8%
3.2%
2.2%
CHINA THAILAND ITALY HONG KONG USA,PR,USVI AUSTRALIA JAPAN KOREA REP. GERM ANY INDIA
2003 2002 2001
2000 1999
Source: Frost & Sullivan
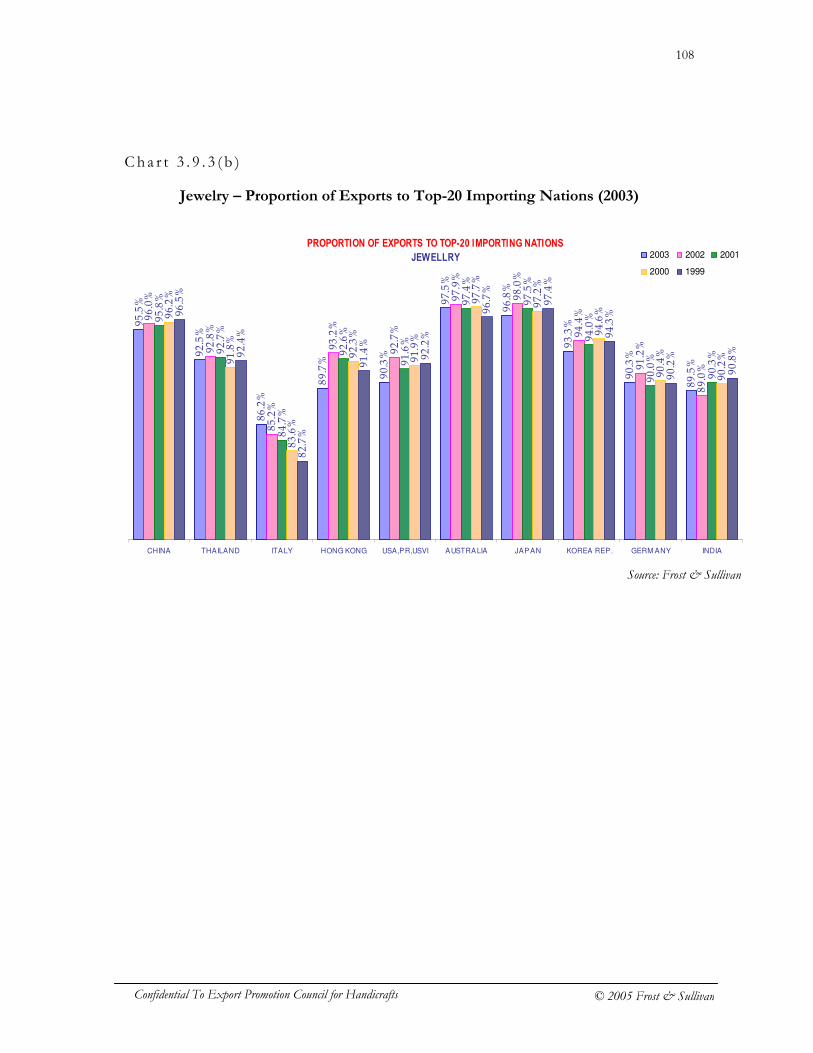
108
Confidential To Export Promotion Council for Handicrafts © 2005 Frost & Sullivan
Cha r t 3 . 9 . 3 ( b )
Jewelry – Proportion of Exports to Top-20 Importing Nations (2003)
PROPORTION OF EXPORTS TO TOP-20 IMPORTING NATIONS
JEWELLRY
95.5%
92.5%
86.2%
89.7%
90.3%
97.5%
96.8%
93.3%
90.3%
89.5%
96.0%
92.8%
85.2%
93.2%
92.7%
97.9%
98.0%
94.4%
91.2%
89.0%
95.8%
92.7%
84.7%
92.6%
91.6%
97.4%
97.5%
94.0%
90.0%
90.3%
96.2%
91.8%
83.6%
92.3%
91.9%
97.7%
97.2%
94.6%
90.4%
90.2%
96.5%
92.4%
82.7%
91.4%
92.2%
96.7%
97.4%
94.3%
90.2%
90.8%
CHINA THAILAND ITALY HONG KONG USA,PR,USVI AUSTRALIA JAPAN KOREA REP. GERM ANY INDIA
2003 2002 2001
2000 1999
Source: Frost & Sullivan
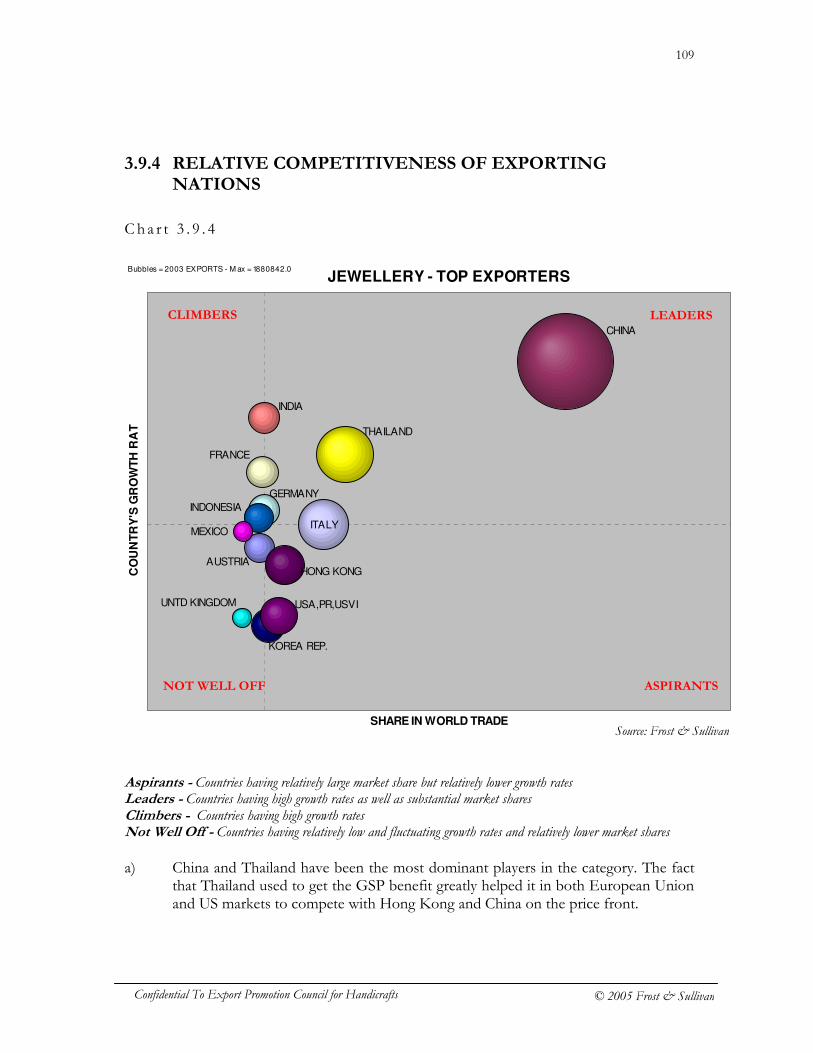
109
Confidential To Export Promotion Council for Handicrafts © 2005 Frost & Sullivan
3.9.4 RELATIVE COMPETITIVENESS OF EXPORTING NATIONS
Cha r t 3 . 9 . 4
Aspirants - Countries having relatively large market share but relatively lower growth rates Leaders - Countries having high growth rates as well as substantial market shares Climbers - Countries having high growth rates Not Well Off - Countries having relatively low and fluctuating growth rates and relatively lower market shares a) China and Thailand have been the most dominant players in the category. The fact
that Thailand used to get the GSP benefit greatly helped it in both European Union and US markets to compete with Hong Kong and China on the price front.
JEWELLERY - TOP EXPORTERS
AUSTRIA
CHINA
FRANCE
GERMANY
HONG KONG
INDIA
INDONESIA
ITALY
KOREA REP.
MEXICO
THAILAND
UNTD KINGDOM USA,PR,USVI
SHARE IN WORLD TRADE
CO
UN
TR
Y'S
GR
OW
TH
RA
TE
Bubbles = 2003 EXPORTS - M ax = 1880842.0
LEADERS CLIMBERS
ASPIRANTS NOT WELL OFF
Source: Frost & Sullivan
110
Confidential To Export Promotion Council for Handicrafts © 2005 Frost & Sullivan
b) India and Indonesia are the other major exporters showing continuous growth in exports. The other countries like France and Italy are the only players that can pose a challenge as the other European Union countries are mostly re-exporters.
111
Confidential To Export Promotion Council for Handicrafts © 2005 Frost & Sullivan
3.10 Paper crafts a) The sub-products that for a part of this category are handmade paper and
paperboard (covered under HS Code - 4802), decorative articles of paper like collages and decorative plaques and hand paintings and original engravings, prints and lithographs (covered under HS Code - 9701).
b) The category actually forms part of the stationery and greeting cards market.
Imports of these category products have been declining since the year 2001 especially due the continuous decline in imports of handmade paper and paper products by USA who is the largest importers.
c) Most developing countries from Asia, Latin American and Africa are the main
producers of handmade paper. However due to inability of these countries to meet the requirements of paper crafts products in form of stationery, gift-wrap paper, and decorative articles like bags, boxes etc of handmade paper, there is a increasing trend where-in countries mainly the European Union countries import the basic product from developing countries and value-add and style the products for domestic use as well as re-exports. The value of the basic product imported from the developing countries is small as against the value-added re-exports in form of paper based decoratives and paintings by the developed countries.
d) As a result the Asian and other developing countries do not appear as large
exporters in the category when tracked through the HS Code System for the broad paper category including both basic i.e. hand made paper and paper board and value added products like paintings, collages and other paper based decoratives. In fact the European Union countries appear as large exporters as well as importers of handmade paper products. More over the increasing exports of handmade paper from small Latin American and African countries is grouped as coming under ‘Free zone’ due to the improper reporting by the countries, hence the exact exports by these small countries can’t be ascertained on an individual country to country basis.
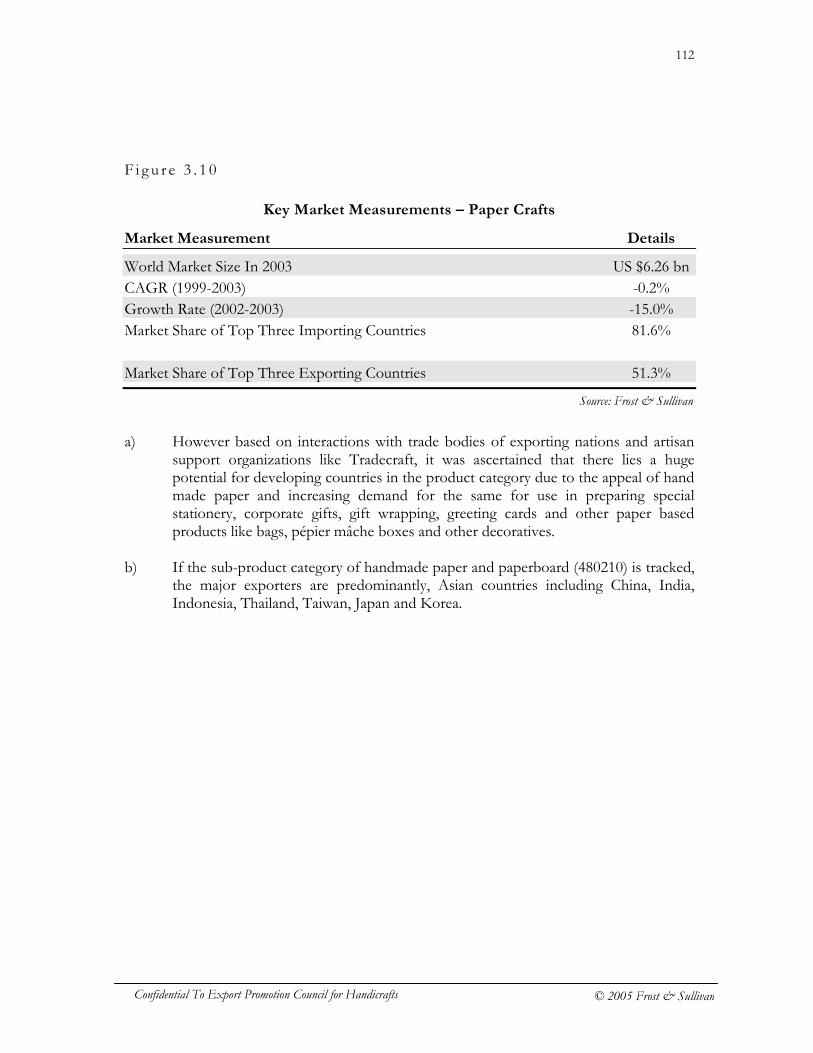
112
Confidential To Export Promotion Council for Handicrafts © 2005 Frost & Sullivan
F i g u r e 3 . 1 0
Key Market Measurements – Paper Crafts
Market Measurement Details
World Market Size In 2003 US $6.26 bn CAGR (1999-2003) -0.2% Growth Rate (2002-2003) -15.0% Market Share of Top Three Importing Countries 81.6% Market Share of Top Three Exporting Countries 51.3%
a) However based on interactions with trade bodies of exporting nations and artisan
support organizations like Tradecraft, it was ascertained that there lies a huge potential for developing countries in the product category due to the appeal of hand made paper and increasing demand for the same for use in preparing special stationery, corporate gifts, gift wrapping, greeting cards and other paper based products like bags, pépier mâche boxes and other decoratives.
b) If the sub-product category of handmade paper and paperboard (480210) is tracked,
the major exporters are predominantly, Asian countries including China, India, Indonesia, Thailand, Taiwan, Japan and Korea.
Source: Frost & Sullivan
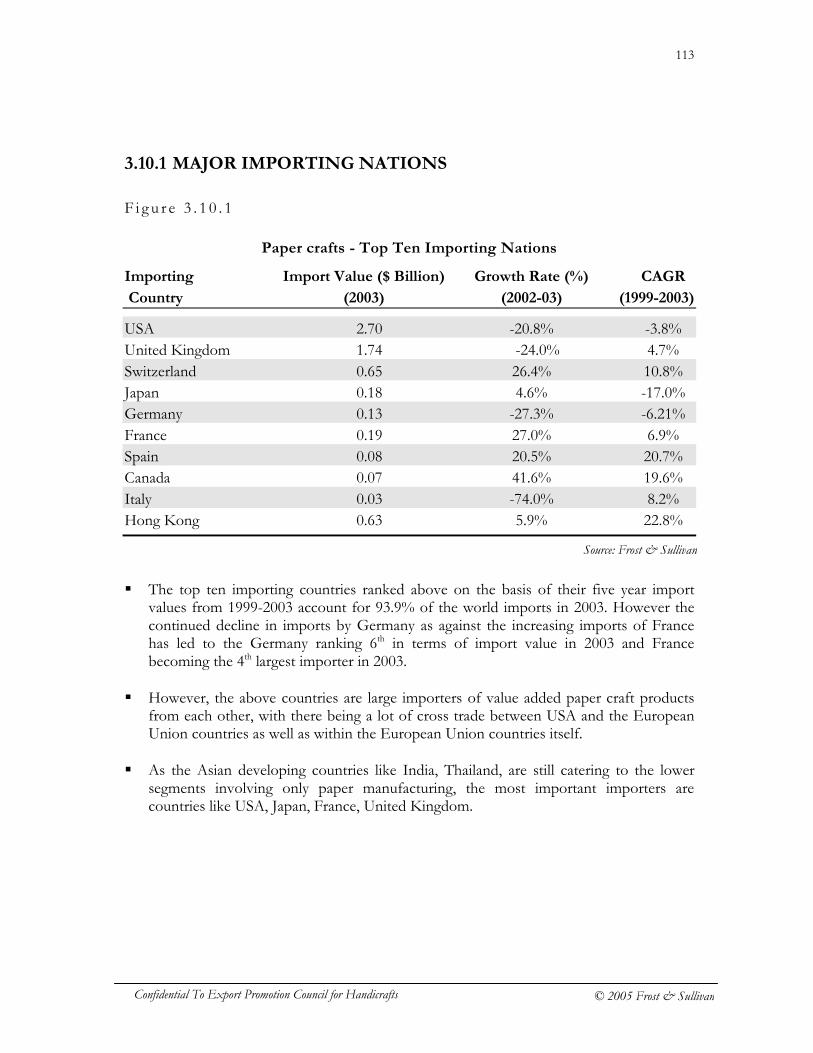
113
Confidential To Export Promotion Council for Handicrafts © 2005 Frost & Sullivan
3.10.1 MAJOR IMPORTING NATIONS
F i g u r e 3 . 1 0 . 1
Paper crafts - Top Ten Importing Nations
Importing Import Value ($ Billion) Growth Rate (%) CAGR
Country (2003) (2002-03) (1999-2003)
USA 2.70 -20.8% -3.8% United Kingdom 1.74 -24.0% 4.7% Switzerland 0.65 26.4% 10.8% Japan 0.18 4.6% -17.0% Germany 0.13 -27.3% -6.21% France 0.19 27.0% 6.9% Spain 0.08 20.5% 20.7% Canada 0.07 41.6% 19.6% Italy 0.03 -74.0% 8.2% Hong Kong 0.63 5.9% 22.8%
� The top ten importing countries ranked above on the basis of their five year import
values from 1999-2003 account for 93.9% of the world imports in 2003. However the continued decline in imports by Germany as against the increasing imports of France has led to the Germany ranking 6th in terms of import value in 2003 and France becoming the 4th largest importer in 2003.
� However, the above countries are large importers of value added paper craft products from each other, with there being a lot of cross trade between USA and the European Union countries as well as within the European Union countries itself.
� As the Asian developing countries like India, Thailand, are still catering to the lower segments involving only paper manufacturing, the most important importers are countries like USA, Japan, France, United Kingdom.
Source: Frost & Sullivan
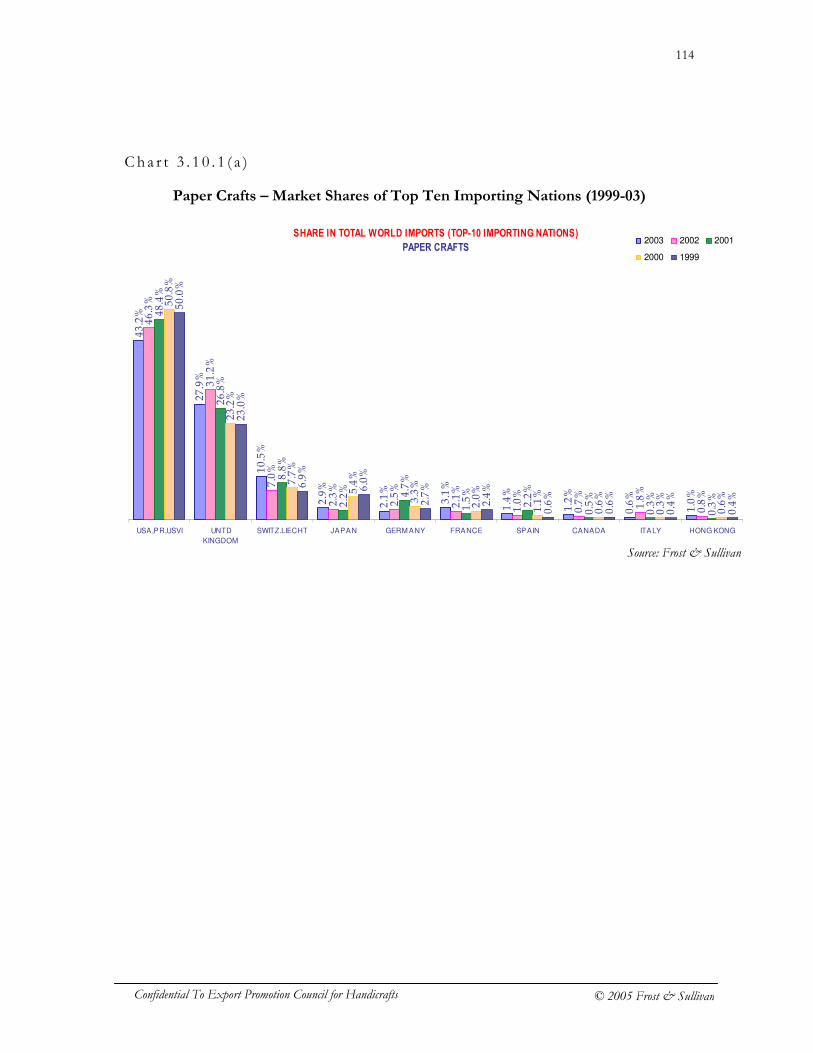
114
Confidential To Export Promotion Council for Handicrafts © 2005 Frost & Sullivan
Cha r t 3 . 1 0 . 1 ( a )
Paper Crafts – Market Shares of Top Ten Importing Nations (1999-03)
SHARE IN TOTAL WORLD IMPORTS (TOP-10 IMPORTING NATIONS)
PAPER CRAFTS
43.2%
27.9%
10.5%
2.9%
2.1%
3.1%
1.4%
1.2%
0.6%
1.0%
46.3%
31.2%
7.0%
2.3%
2.5%
2.1%
1.0%
0.7%
1.8%
0.8%
48.4%
26.8%
8.8%
2.2%
4.7%
1.5%
2.2%
0.5%
0.3%
0.3%
50.8%
23.2%
7.7%
5.4%
3.3%
2.0%
1.1%
0.6%
0.3%
0.6%
50.0%
23.0%
6.9%
6.0%
2.7%
2.4%
0.6%
0.6%
0.4%
0.4%
USA,PR,USVI UNTD
KINGDOM
SWITZ.LIECHT JAPAN GERM ANY FRANCE SPAIN CANADA ITALY HONG KONG
2003 2002 2001
2000 1999
Source: Frost & Sullivan
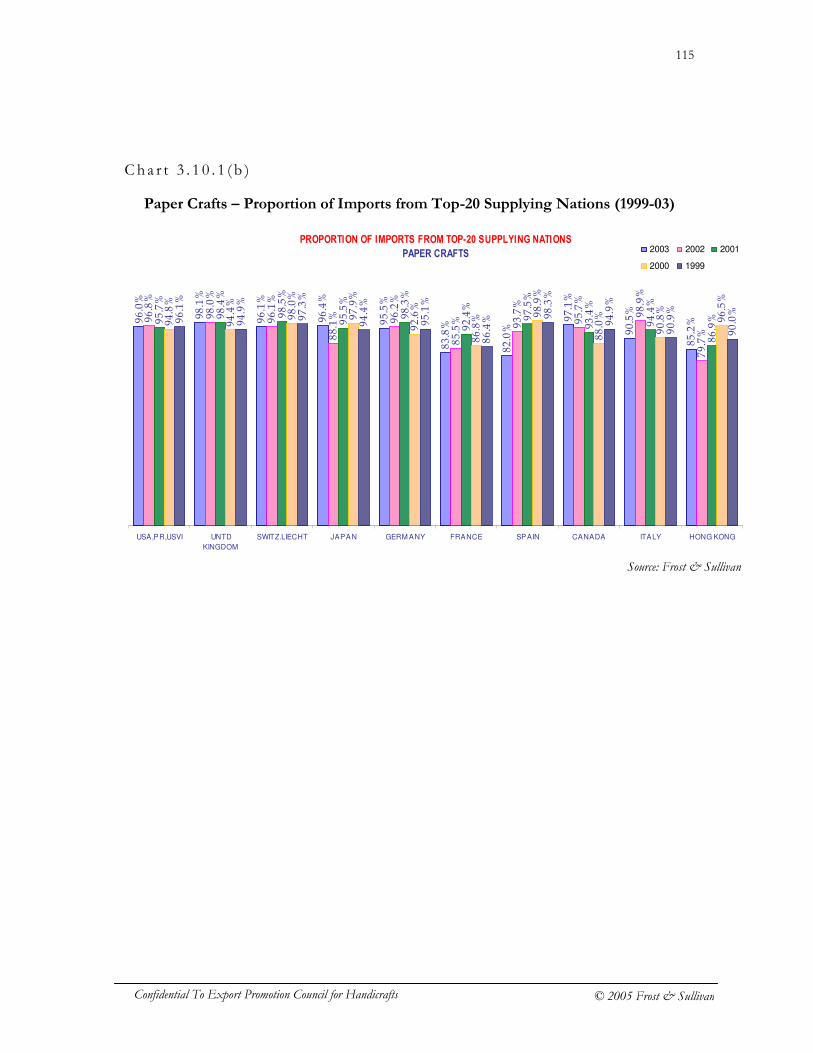
115
Confidential To Export Promotion Council for Handicrafts © 2005 Frost & Sullivan
Cha r t 3 . 1 0 . 1 ( b )
Paper Crafts – Proportion of Imports from Top-20 Supplying Nations (1999-03)
PROPORTION OF IMPORTS FROM TOP-20 SUPPLYING NATIONS
PAPER CRAFTS
96.0%
98.1%
96.1%
96.4%
95.5%
83.8%
82.0%
97.1%
90.5%
85.2%96.8%
98.0%
96.1%
88.1% 96.2%
85.5% 93.7%
95.7%
98.9%
79.7%
95.7%
98.4%
98.5%
95.5%
98.3%
92.4%
97.5%
93.4%
94.4%
86.9%94.8%
94.4%
98.0%
97.9%
92.6%
86.8%
98.9%
88.0%
90.8%
96.5%
96.1%
94.9%
97.3%
94.4%
95.1%
86.4%
98.3%
94.9%
90.9%
90.0%
USA,PR,USVI UNTD
KINGDOM
SWITZ.LIECHT JAPAN GERM ANY FRANCE SPAIN CANADA ITALY HONG KONG
2003 2002 2001
2000 1999
Source: Frost & Sullivan
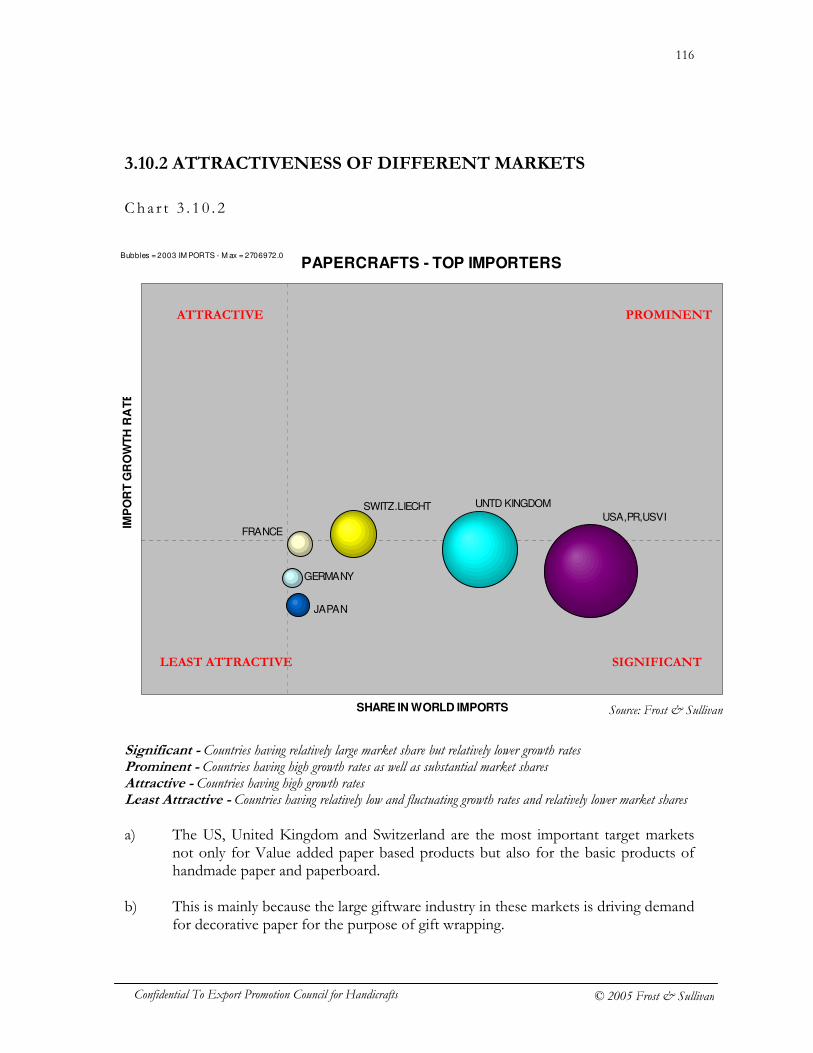
116
Confidential To Export Promotion Council for Handicrafts © 2005 Frost & Sullivan
3.10.2 ATTRACTIVENESS OF DIFFERENT MARKETS
Cha r t 3 . 1 0 . 2
Significant - Countries having relatively large market share but relatively lower growth rates Prominent - Countries having high growth rates as well as substantial market shares Attractive - Countries having high growth rates Least Attractive - Countries having relatively low and fluctuating growth rates and relatively lower market shares a) The US, United Kingdom and Switzerland are the most important target markets
not only for Value added paper based products but also for the basic products of handmade paper and paperboard.
b) This is mainly because the large giftware industry in these markets is driving demand
for decorative paper for the purpose of gift wrapping.
PAPERCRAFTS - TOP IMPORTERS
FRANCE
GERMANY
JAPAN
SWITZ.LIECHT UNTD KINGDOM
USA,PR,USVI
SHARE IN WORLD IMPORTS
IMP
OR
T G
RO
WT
H R
AT
E
Bubbles = 2003 IM PORTS - M ax = 2706972.0
PROMINENT ATTRACTIVE
SIGNIFICANT LEAST ATTRACTIVE
Source: Frost & Sullivan
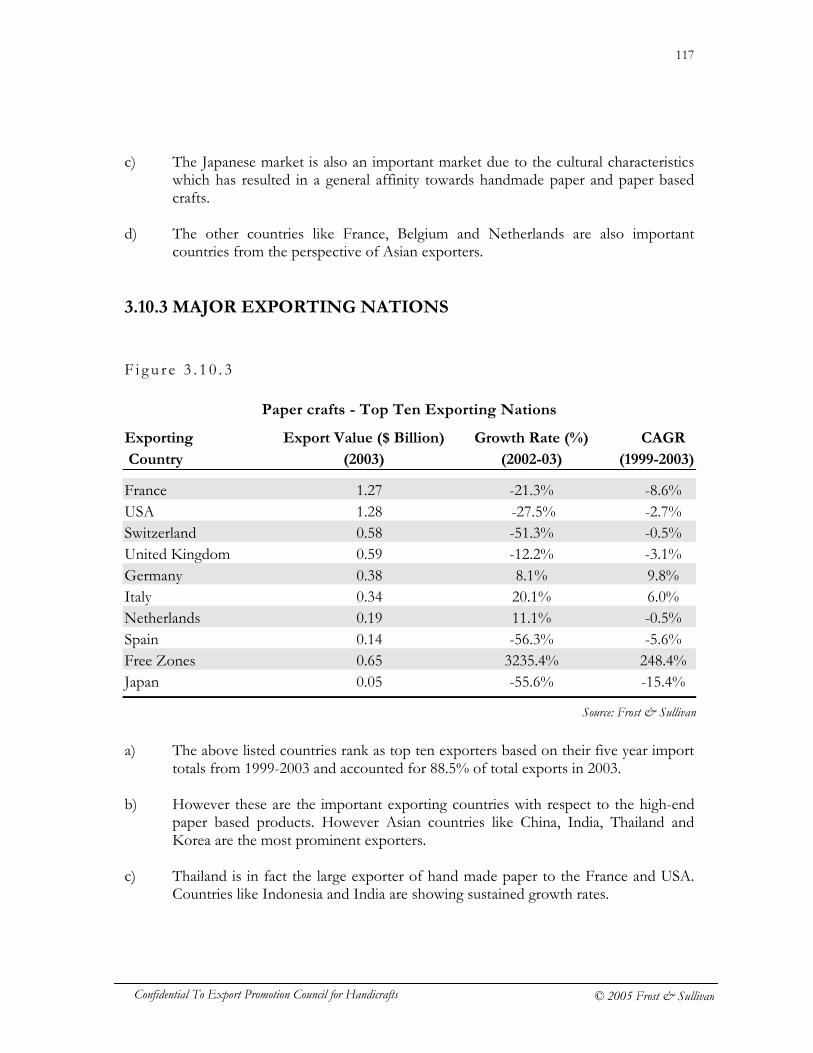
117
Confidential To Export Promotion Council for Handicrafts © 2005 Frost & Sullivan
c) The Japanese market is also an important market due to the cultural characteristics which has resulted in a general affinity towards handmade paper and paper based crafts.
d) The other countries like France, Belgium and Netherlands are also important
countries from the perspective of Asian exporters. 3.10.3 MAJOR EXPORTING NATIONS
F i g u r e 3 . 1 0 . 3
Paper crafts - Top Ten Exporting Nations
Exporting Export Value ($ Billion) Growth Rate (%) CAGR
Country (2003) (2002-03) (1999-2003)
France 1.27 -21.3% -8.6% USA 1.28 -27.5% -2.7% Switzerland 0.58 -51.3% -0.5% United Kingdom 0.59 -12.2% -3.1% Germany 0.38 8.1% 9.8% Italy 0.34 20.1% 6.0% Netherlands 0.19 11.1% -0.5% Spain 0.14 -56.3% -5.6% Free Zones 0.65 3235.4% 248.4% Japan 0.05 -55.6% -15.4%
a) The above listed countries rank as top ten exporters based on their five year import
totals from 1999-2003 and accounted for 88.5% of total exports in 2003.
b) However these are the important exporting countries with respect to the high-end paper based products. However Asian countries like China, India, Thailand and Korea are the most prominent exporters.
c) Thailand is in fact the large exporter of hand made paper to the France and USA.
Countries like Indonesia and India are showing sustained growth rates.
Source: Frost & Sullivan
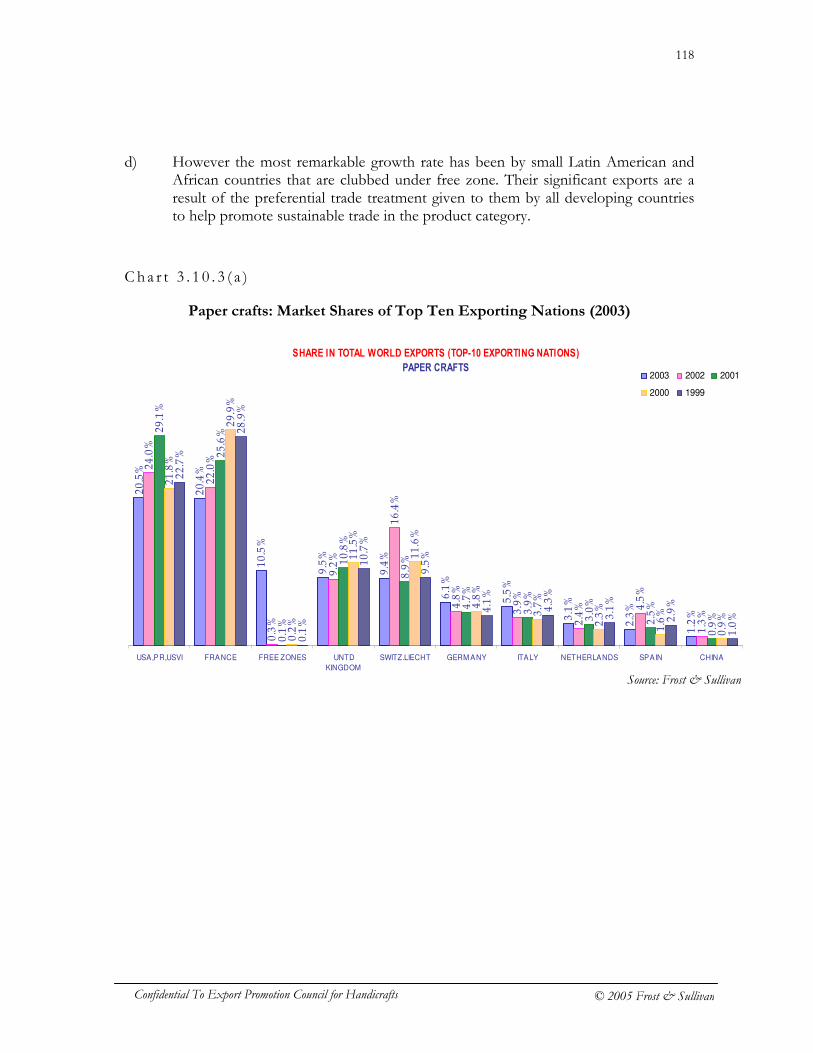
118
Confidential To Export Promotion Council for Handicrafts © 2005 Frost & Sullivan
d) However the most remarkable growth rate has been by small Latin American and African countries that are clubbed under free zone. Their significant exports are a result of the preferential trade treatment given to them by all developing countries to help promote sustainable trade in the product category.
C h a r t 3 . 1 0 . 3 ( a )
Paper crafts: Market Shares of Top Ten Exporting Nations (2003)
SHARE IN TOTAL WORLD EXPORTS (TOP-10 EXPORTING NATIONS)
PAPER CRAFTS
20.5%
20.4%
10.5%
9.5%
9.4%
6.1%
5.5%
3.1%
2.3%
1.2%
24.0%
22.0%
0.3%
9.2%
16.4%
4.8%
3.9%
2.4% 4.5%
1.3%
29.1%
25.6%
0.1%
10.8%
8.9%
4.7%
3.9%
3.0%
2.5%
0.9%
21.8%
29.9%
0.2%
11.5%
11.6%
4.8%
3.7%
2.3%
1.6%
0.9%
22.7%
28.9%
0.1%
10.7%
9.5%
4.1%
4.3%
3.1%
2.9%
1.0%
USA,PR,USVI FRANCE FREE ZONES UNTD
KINGDOM
SWITZ.LIECHT GERM ANY ITALY NETHERLANDS SPAIN CHINA
2003 2002 2001
2000 1999
Source: Frost & Sullivan

119
Confidential To Export Promotion Council for Handicrafts © 2005 Frost & Sullivan
Cha r t 3 . 1 0 . 3 ( b )
Paper crafts: Proportion of Exports to Top-20 Importing Nations (2003)
PROPORTION OF EXPORTS TO TOP-20 IMPORTING NATIONS
PAPER CRAFTS
99.2%
99.5%
99.7%
98.5%
99.7%
99.2%
98.4%
99.6%
99.0%
92.4%
99.4%
99.2%
90.6% 99.0%
99.6%
98.8%
98.1%
98.3%
98.6%
90.6%98.9%
99.4%
67.8%
99.1%
97.4%
99.2%
98.8%
99.0%
97.4%
88.2%98.3%
98.8%
98.7%
98.7%
99.4%
98.6%
98.9%
99.1%
97.6%
84.7%
98.7%
99.4%
97.8%
98.9%
99.8%
98.5%
98.9%
99.4%
98.3%
95.1%
USA,PR,USVI FRANCE FREE ZONES UNTD
KINGDOM
SWITZ.LIECHT GERM ANY ITALY NETHERLANDS SPAIN CHINA
2003 2002 2001
2000 1999
Source: Frost & Sullivan
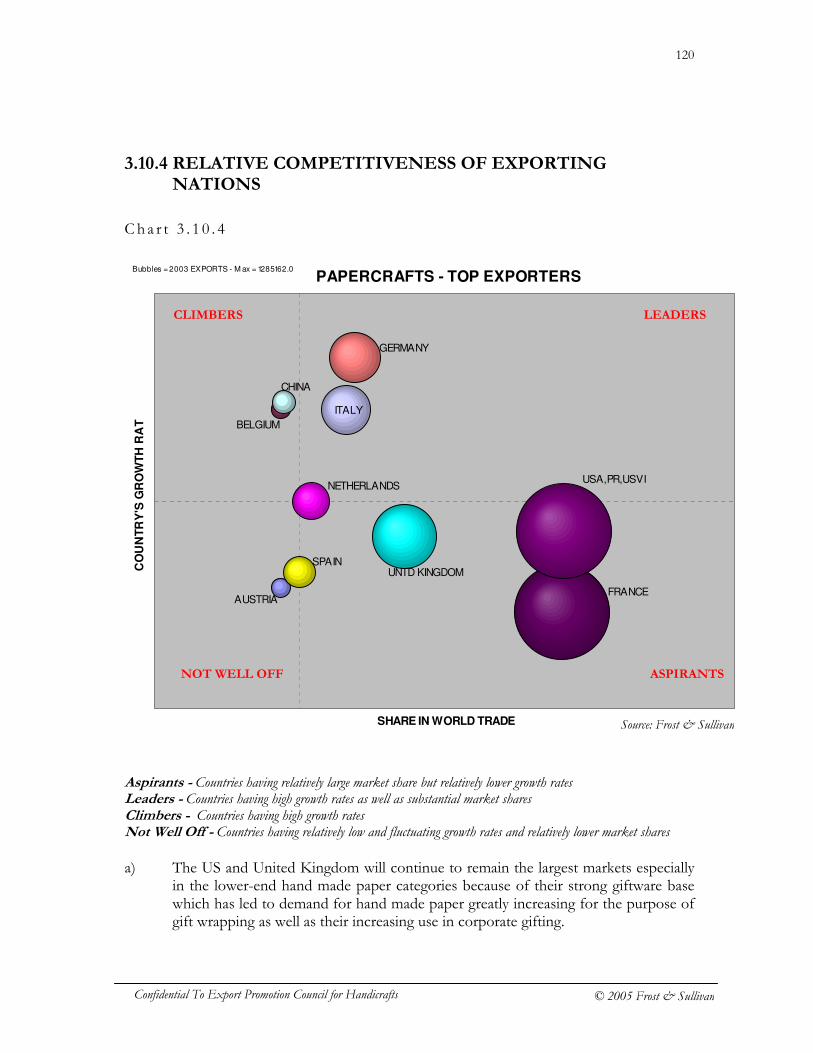
120
Confidential To Export Promotion Council for Handicrafts © 2005 Frost & Sullivan
3.10.4 RELATIVE COMPETITIVENESS OF EXPORTING NATIONS
Cha r t 3 . 1 0 . 4
Aspirants - Countries having relatively large market share but relatively lower growth rates Leaders - Countries having high growth rates as well as substantial market shares Climbers - Countries having high growth rates Not Well Off - Countries having relatively low and fluctuating growth rates and relatively lower market shares a) The US and United Kingdom will continue to remain the largest markets especially
in the lower-end hand made paper categories because of their strong giftware base which has led to demand for hand made paper greatly increasing for the purpose of gift wrapping as well as their increasing use in corporate gifting.
PAPERCRAFTS - TOP EXPORTERS
AUSTRIA
BELGIUM
CHINA
FRANCE
GERMANY
ITALY
NETHERLANDS
SPAIN UNTD KINGDOM
USA,PR,USVI
SHARE IN WORLD TRADE
CO
UN
TR
Y'S
GR
OW
TH
RA
TE
Bubbles = 2003 EXPORTS - M ax = 1285162.0
LEADERS CLIMBERS
ASPIRANTS NOT WELL OFF
Source: Frost & Sullivan
121
Confidential To Export Promotion Council for Handicrafts © 2005 Frost & Sullivan
b) For the high-end paper based crafts category the European Union countries like Germany, Italy and Netherlands are high growth markets. However for the low-end category that mainly includes handmade paper & paperboard, the crafts the US, France, UK and Japan are important importers.
122
Confidential To Export Promotion Council for Handicrafts © 2005 Frost & Sullivan
3.11 GLASSWARE a) This product category includes sub-product categories like glassware used for table,
kitchen, toilet, office and indoor decoration including drinking glasses of lead crystal and glass ceramics (covered under HS Code-7013), and small glass wares and imitation stones and other glass worked decoratives (covered under HS Code-7016 and 7018).The category includes both decorative articles as well as utility and can be either hand-made or machine-made.
b) The Glassware product category has been showing significant growth except for a
decline in world imports in 2001 due to the overall global economic slowdown. Both decorative as well as utility articles are expected to continue to show increasing exports with the decorative glassware category in the middle and lower-end holding immense potential for developing countries.
c) The market for higher-end glassware especially of the utility type is dominated by
European Union countries mainly France, Italy, Germany and Austria. Especially France has the world’s largest mass production infrastructure for both fine crystal and soda glass products.
d) The fact that producing glassware especially of the utility variety requires high
investment in machinery, had led to the market being dominated by financially strong European manufacturers.
e) However, over the years China has developed its manufacturing capabilities almost
at par with European Union manufacturers causing China to slowly emerge as the leading exporter of both utility as well as decorative glassware products. The resulting downward pressure on prices due to China’s entry has caused the market share of European exporters to shrink in the face of excessive price competition offered by China.
f) Currently, China is the largest exporter of both utility as well as decorative
glassware, followed by the displaced countries like Austria, France, Germany and Italy.
g) In the middle and lower end market for glassware products the competition is
becoming fierce from both Eastern European countries like Poland and Asian countries Indonesia and India.
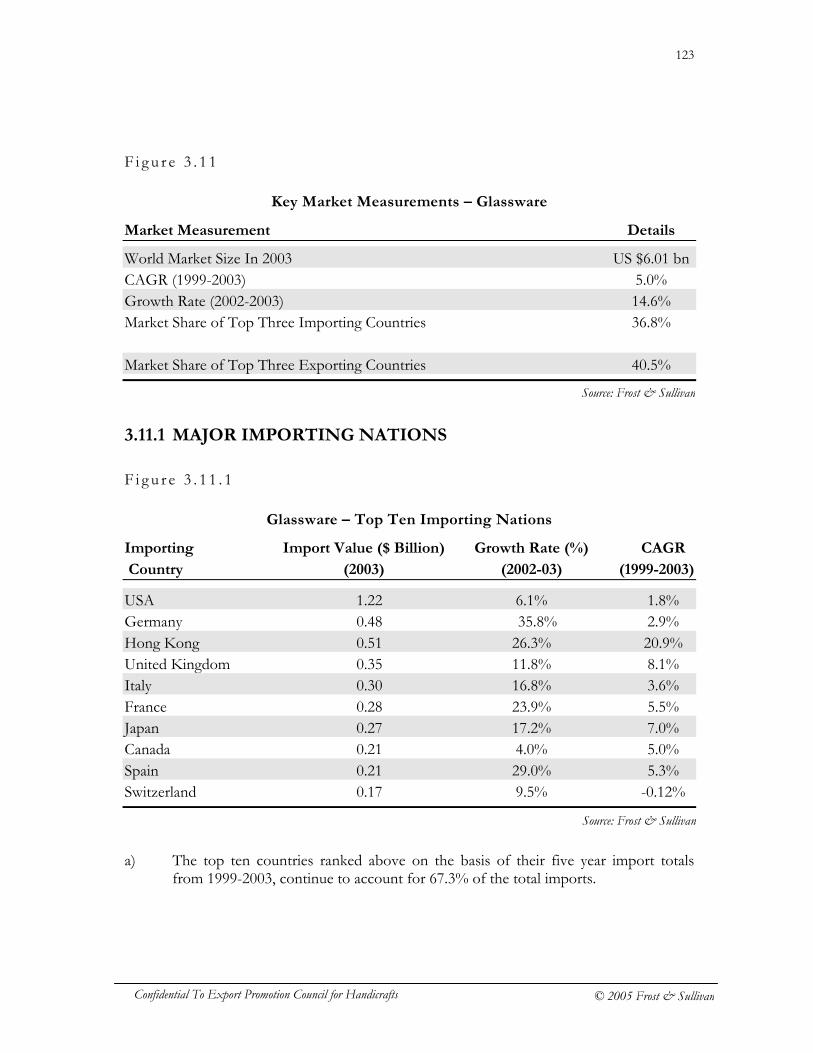
123
Confidential To Export Promotion Council for Handicrafts © 2005 Frost & Sullivan
F i g u r e 3 . 1 1
Key Market Measurements – Glassware
Market Measurement Details
World Market Size In 2003 US $6.01 bn CAGR (1999-2003) 5.0% Growth Rate (2002-2003) 14.6% Market Share of Top Three Importing Countries 36.8% Market Share of Top Three Exporting Countries 40.5%
3.11.1 MAJOR IMPORTING NATIONS
F i g u r e 3 . 1 1 . 1
Glassware – Top Ten Importing Nations
Importing Import Value ($ Billion) Growth Rate (%) CAGR
Country (2003) (2002-03) (1999-2003)
USA 1.22 6.1% 1.8% Germany 0.48 35.8% 2.9% Hong Kong 0.51 26.3% 20.9% United Kingdom 0.35 11.8% 8.1% Italy 0.30 16.8% 3.6% France 0.28 23.9% 5.5% Japan 0.27 17.2% 7.0% Canada 0.21 4.0% 5.0% Spain 0.21 29.0% 5.3% Switzerland 0.17 9.5% -0.12%
a) The top ten countries ranked above on the basis of their five year import totals
from 1999-2003, continue to account for 67.3% of the total imports.
Source: Frost & Sullivan
Source: Frost & Sullivan
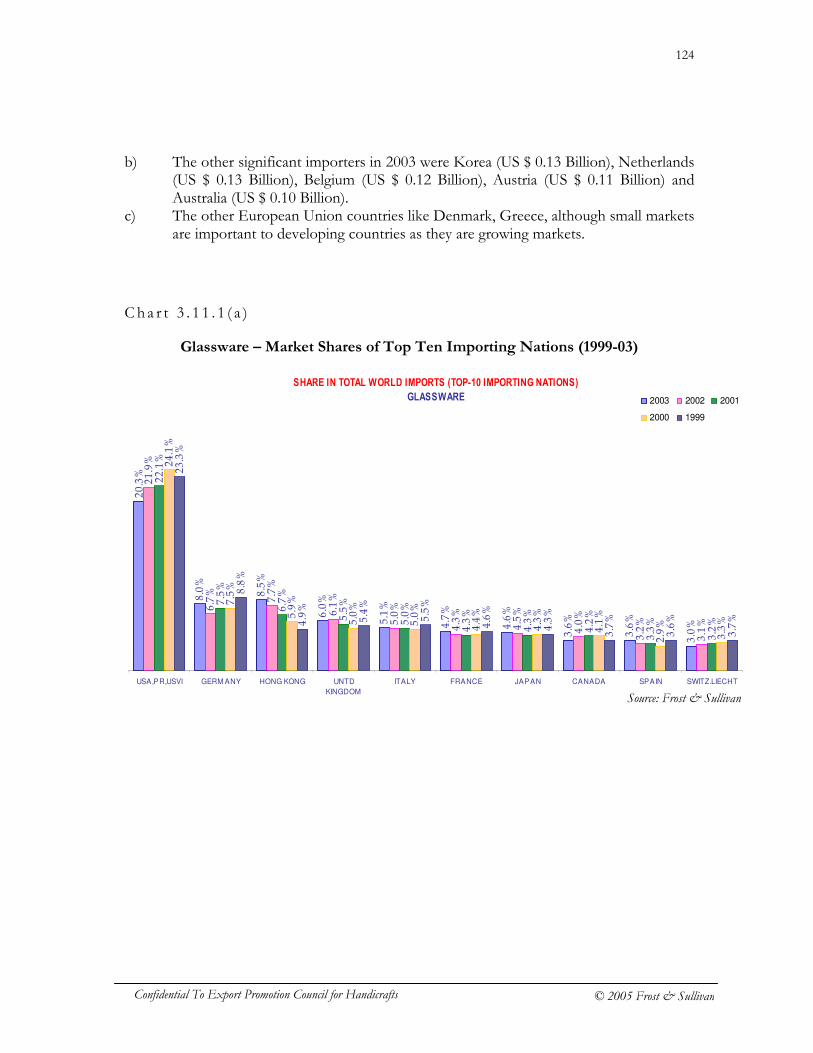
124
Confidential To Export Promotion Council for Handicrafts © 2005 Frost & Sullivan
b) The other significant importers in 2003 were Korea (US $ 0.13 Billion), Netherlands (US $ 0.13 Billion), Belgium (US $ 0.12 Billion), Austria (US $ 0.11 Billion) and Australia (US $ 0.10 Billion).
c) The other European Union countries like Denmark, Greece, although small markets are important to developing countries as they are growing markets.
C h a r t 3 . 1 1 . 1 ( a )
Glassware – Market Shares of Top Ten Importing Nations (1999-03)
SHARE IN TOTAL WORLD IMPORTS (TOP-10 IMPORTING NATIONS)
GLASSWARE
20.3%
8.0%
8.5%
6.0%
5.1%
4.7%
4.6%
3.6%
3.6%
3.0%
21.9%
6.7%
7.7%
6.1%
5.0%
4.3%
4.5%
4.0%
3.2%
3.1%
22.1%
7.5%
6.7%
5.5%
5.0%
4.3%
4.3%
4.2%
3.3%
3.2%
24.1%
7.5%
5.9%
5.0%
5.0%
4.4%
4.3%
4.1%
2.9%
3.3%
23.3%
8.8%
4.9%
5.4%
5.5%
4.6%
4.3%
3.7%
3.6%
3.7%
USA,PR,USVI GERM ANY HONG KONG UNTD
KINGDOM
ITALY FRANCE JAPAN CANADA SPAIN SWITZ.LIECHT
2003 2002 2001
2000 1999
Source: Frost & Sullivan
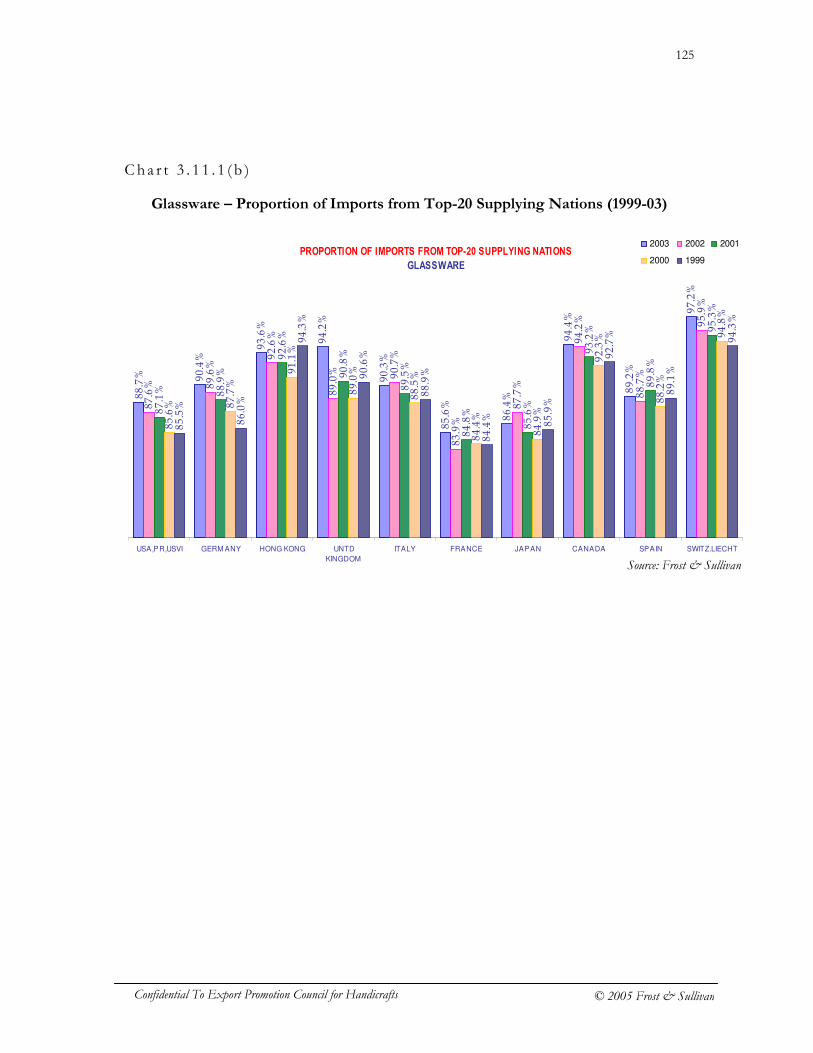
125
Confidential To Export Promotion Council for Handicrafts © 2005 Frost & Sullivan
Cha r t 3 . 1 1 . 1 ( b )
Glassware – Proportion of Imports from Top-20 Supplying Nations (1999-03)
PROPORTION OF IMPORTS FROM TOP-20 SUPPLYING NATIONS
GLASSWARE
88.7% 90.4%
93.6%
94.2%
90.3%
85.6%
86.4%
94.4%
89.2%
97.2%
87.6% 89.6%
92.6%
89.0% 90.7%
83.9%
87.7%
94.2%
88.7%
95.9%
87.1% 88.9%
92.6%
90.8%
89.5%
84.8%
85.6%
93.2%
89.8%
95.3%
85.6% 87.7%
91.1%
89.0%
88.5%
84.4%
84.9%
92.3%
88.2%
94.8%
85.5%
86.0%
94.3%
90.6%
88.9%
84.4%
85.9%
92.7%
89.1%
94.3%
USA,PR,USVI GERM ANY HONG KONG UNTD
KINGDOM
ITALY FRANCE JAPAN CANADA SPAIN SWITZ.LIECHT
2003 2002 2001
2000 1999
Source: Frost & Sullivan
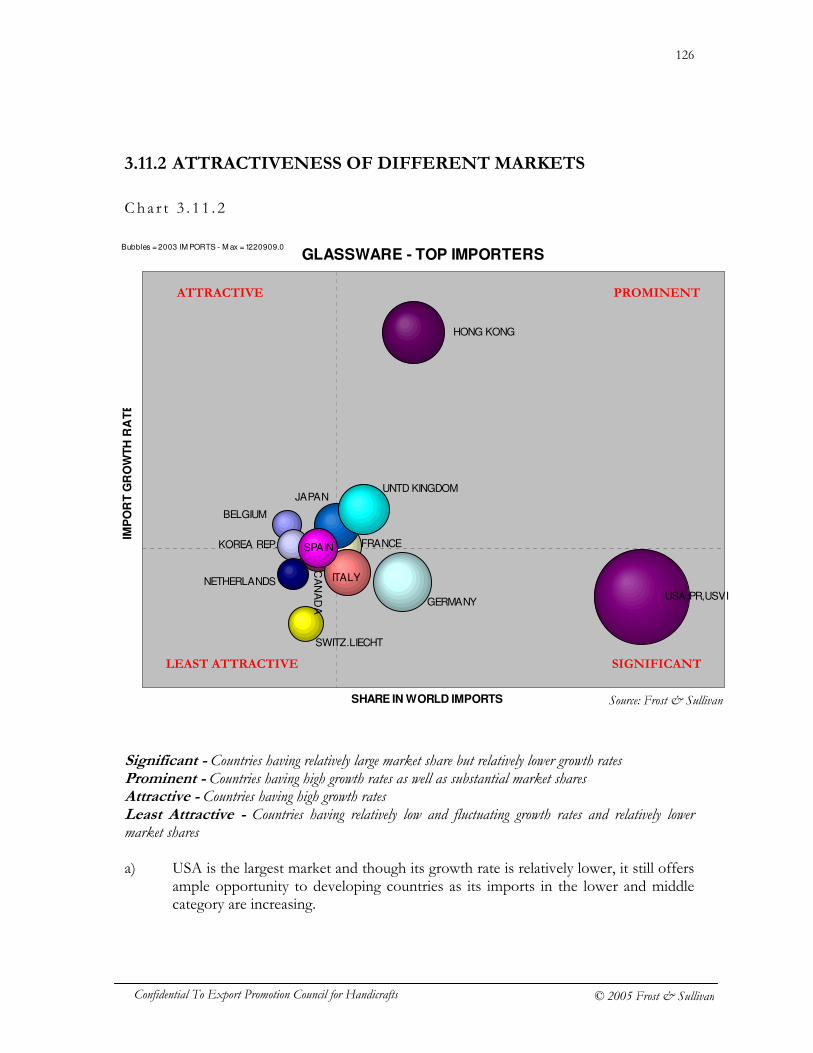
126
Confidential To Export Promotion Council for Handicrafts © 2005 Frost & Sullivan
3.11.2 ATTRACTIVENESS OF DIFFERENT MARKETS
Cha r t 3 . 1 1 . 2
Significant - Countries having relatively large market share but relatively lower growth rates Prominent - Countries having high growth rates as well as substantial market shares Attractive - Countries having high growth rates Least Attractive - Countries having relatively low and fluctuating growth rates and relatively lower market shares a) USA is the largest market and though its growth rate is relatively lower, it still offers
ample opportunity to developing countries as its imports in the lower and middle category are increasing.
GLASSWARE - TOP IMPORTERS
BELGIUM
CA
NA
DA
FRANCE
GERMANY
HONG KONG
ITALY
JAPAN
KOREA REP.
NETHERLANDS
SPAIN
SWITZ.LIECHT
UNTD KINGDOM
USA,PR,USVI
SHARE IN WORLD IMPORTS
IMP
OR
T G
RO
WT
H R
AT
E
Bubbles = 2003 IM PORTS - M ax = 1220909.0
PROMINENT ATTRACTIVE
SIGNIFICANT LEAST ATTRACTIVE
Source: Frost & Sullivan
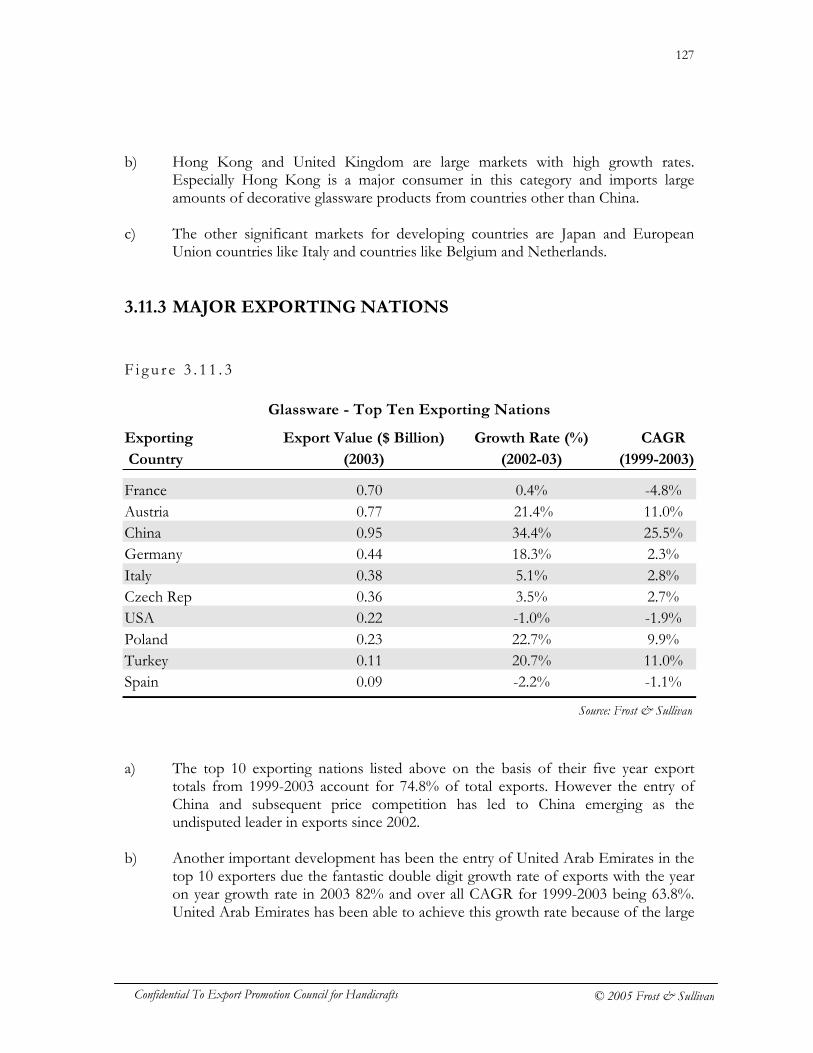
127
Confidential To Export Promotion Council for Handicrafts © 2005 Frost & Sullivan
b) Hong Kong and United Kingdom are large markets with high growth rates. Especially Hong Kong is a major consumer in this category and imports large amounts of decorative glassware products from countries other than China.
c) The other significant markets for developing countries are Japan and European
Union countries like Italy and countries like Belgium and Netherlands. 3.11.3 MAJOR EXPORTING NATIONS
F i g u r e 3 . 1 1 . 3
Glassware - Top Ten Exporting Nations
Exporting Export Value ($ Billion) Growth Rate (%) CAGR
Country (2003) (2002-03) (1999-2003)
France 0.70 0.4% -4.8% Austria 0.77 21.4% 11.0% China 0.95 34.4% 25.5% Germany 0.44 18.3% 2.3% Italy 0.38 5.1% 2.8% Czech Rep 0.36 3.5% 2.7% USA 0.22 -1.0% -1.9% Poland 0.23 22.7% 9.9% Turkey 0.11 20.7% 11.0% Spain 0.09 -2.2% -1.1%
a) The top 10 exporting nations listed above on the basis of their five year export
totals from 1999-2003 account for 74.8% of total exports. However the entry of China and subsequent price competition has led to China emerging as the undisputed leader in exports since 2002.
b) Another important development has been the entry of United Arab Emirates in the
top 10 exporters due the fantastic double digit growth rate of exports with the year on year growth rate in 2003 82% and over all CAGR for 1999-2003 being 63.8%. United Arab Emirates has been able to achieve this growth rate because of the large
Source: Frost & Sullivan
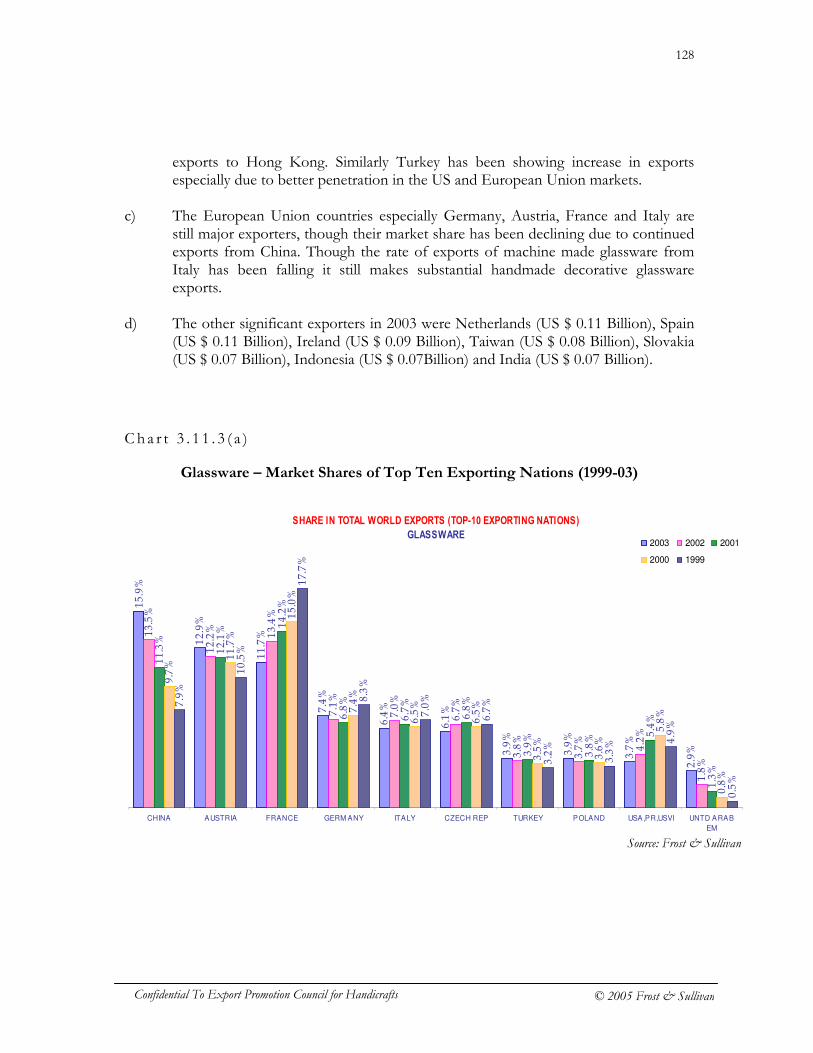
128
Confidential To Export Promotion Council for Handicrafts © 2005 Frost & Sullivan
exports to Hong Kong. Similarly Turkey has been showing increase in exports especially due to better penetration in the US and European Union markets.
c) The European Union countries especially Germany, Austria, France and Italy are
still major exporters, though their market share has been declining due to continued exports from China. Though the rate of exports of machine made glassware from Italy has been falling it still makes substantial handmade decorative glassware exports.
d) The other significant exporters in 2003 were Netherlands (US $ 0.11 Billion), Spain
(US $ 0.11 Billion), Ireland (US $ 0.09 Billion), Taiwan (US $ 0.08 Billion), Slovakia (US $ 0.07 Billion), Indonesia (US $ 0.07Billion) and India (US $ 0.07 Billion).
C h a r t 3 . 1 1 . 3 ( a )
Glassware – Market Shares of Top Ten Exporting Nations (1999-03)
SHARE IN TOTAL WORLD EXPORTS (TOP-10 EXPORTING NATIONS)
GLASSWARE
15.9%
12.9%
11.7%
7.4%
6.4%
6.1%
3.9%
3.9%
3.7%
2.9%
13.5%
12.2%
13.4%
7.1%
7.0%
6.7%
3.8%
3.7%
4.2%
1.8%
11.3%
12.1%
14.2%
6.8%
6.7%
6.8%
3.9%
3.8%
5.4%
1.3%
9.7%
11.7%
15.0%
7.4%
6.5%
6.5%
3.5%
3.6%
5.8%
0.8%
7.9%
10.5%
17.7%
8.3%
7.0%
6.7%
3.2%
3.3%
4.9%
0.5%
CHINA AUSTRIA FRANCE GERM ANY ITALY CZECH REP TURKEY POLAND USA,PR,USVI UNTD ARAB
EM
2003 2002 2001
2000 1999
Source: Frost & Sullivan
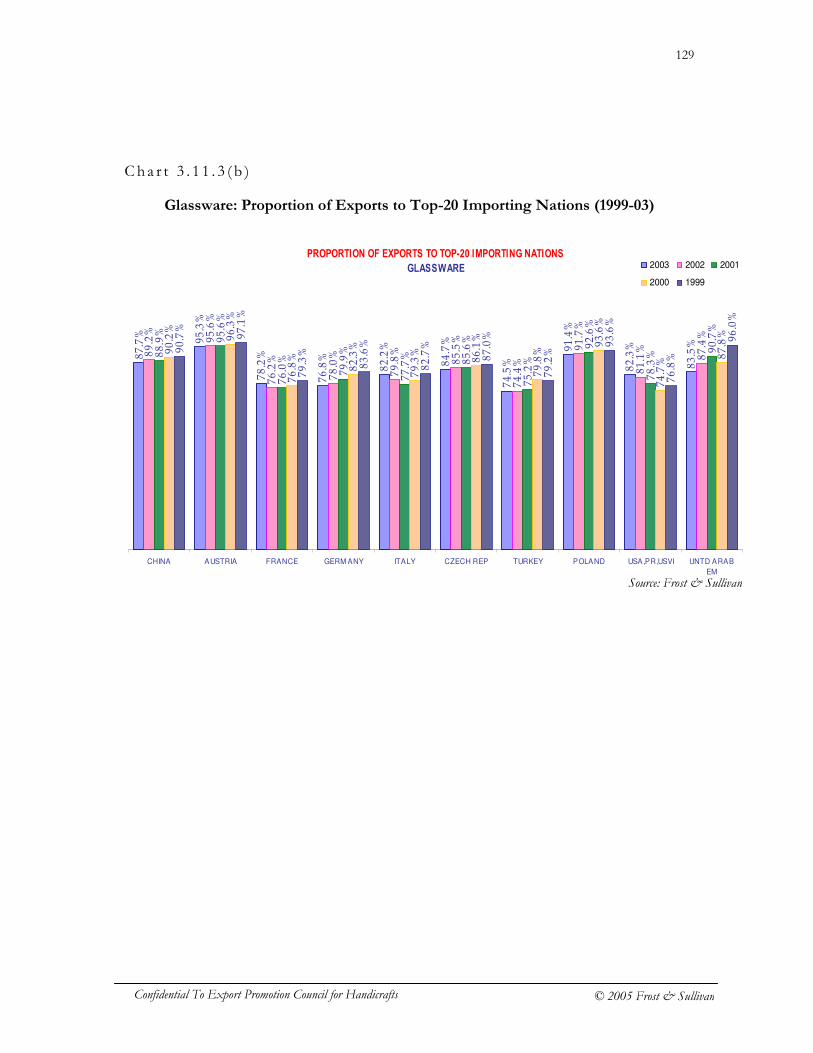
129
Confidential To Export Promotion Council for Handicrafts © 2005 Frost & Sullivan
Cha r t 3 . 1 1 . 3 ( b )
Glassware: Proportion of Exports to Top-20 Importing Nations (1999-03)
PROPORTION OF EXPORTS TO TOP-20 IMPORTING NATIONS
GLASSWARE
87.7%
95.3%
78.2%
76.8%
82.2%
84.7%
74.5%
91.4%
82.3%
83.5%
89.2%
95.6%
76.2%
78.0%
79.8%
85.5%
74.4%
91.7%
81.1%
87.4%
88.9%
95.6%
76.0%
79.9%
77.7%
85.6%
75.2%
92.6%
78.3%
90.7%
90.2%
96.3%
76.8%
82.3%
79.3%
86.1%
79.8%
93.6%
74.7%
87.8%
90.7%
97.1%
79.3%
83.6%
82.7%
87.0%
79.2%
93.6%
76.8%
96.0%
CHINA AUSTRIA FRANCE GERM ANY ITALY CZECH REP TURKEY POLAND USA,PR,USVI UNTD ARAB
EM
2003 2002 2001
2000 1999
Source: Frost & Sullivan
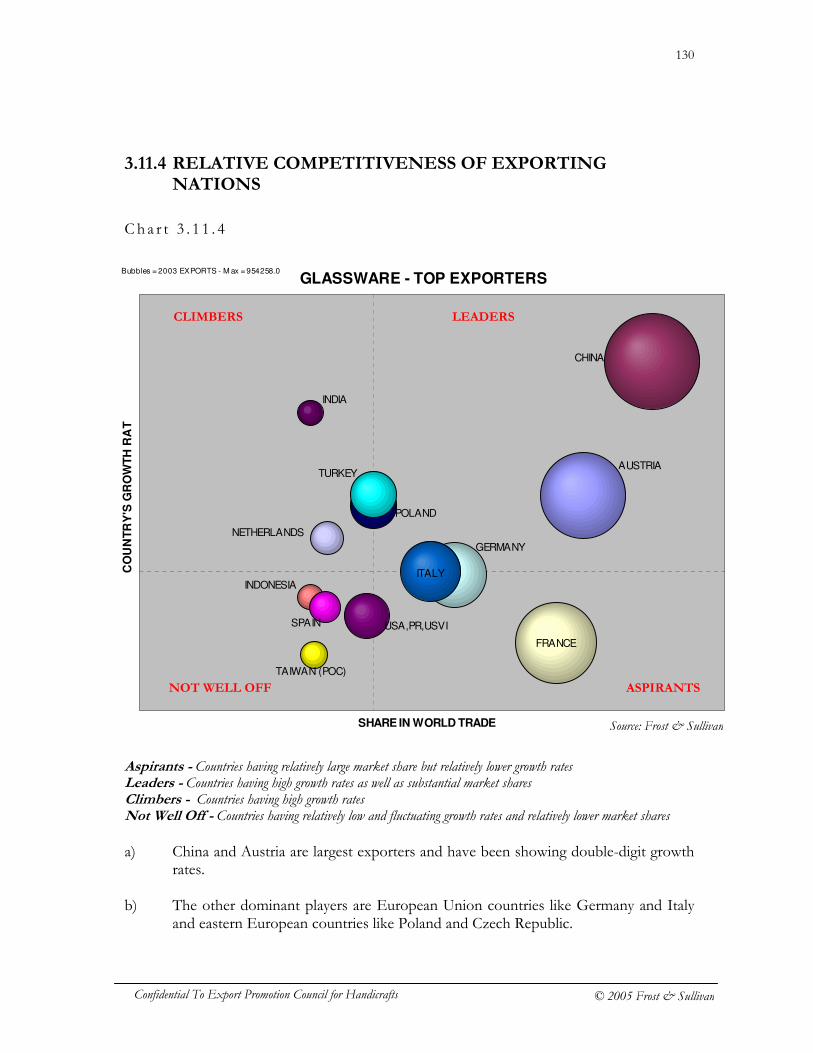
130
Confidential To Export Promotion Council for Handicrafts © 2005 Frost & Sullivan
3.11.4 RELATIVE COMPETITIVENESS OF EXPORTING NATIONS
Cha r t 3 . 1 1 . 4
Aspirants - Countries having relatively large market share but relatively lower growth rates Leaders - Countries having high growth rates as well as substantial market shares Climbers - Countries having high growth rates Not Well Off - Countries having relatively low and fluctuating growth rates and relatively lower market shares a) China and Austria are largest exporters and have been showing double-digit growth
rates. b) The other dominant players are European Union countries like Germany and Italy
and eastern European countries like Poland and Czech Republic.
GLASSWARE - TOP EXPORTERS
AUSTRIA
CHINA
FRANCE
GERMANY
INDIA
INDONESIA ITALY
NETHERLANDS
POLAND
SPAIN
TAIWAN (POC)
TURKEY
USA,PR,USVI
SHARE IN WORLD TRADE
CO
UN
TR
Y'S
GR
OW
TH
RA
TE
Bubbles = 2003 EXPORTS - M ax = 954258.0
LEADERS CLIMBERS
ASPIRANTS NOT WELL OFF
Source: Frost & Sullivan
131
Confidential To Export Promotion Council for Handicrafts © 2005 Frost & Sullivan
c) However from the perspective of developing Asian countries, the important competitors are countries like Indonesia and Taiwan, whose exports have started to pick-up post 2003, eastern European countries like Poland and Czech Republic and countries like Turkey and United Arab Emirates.
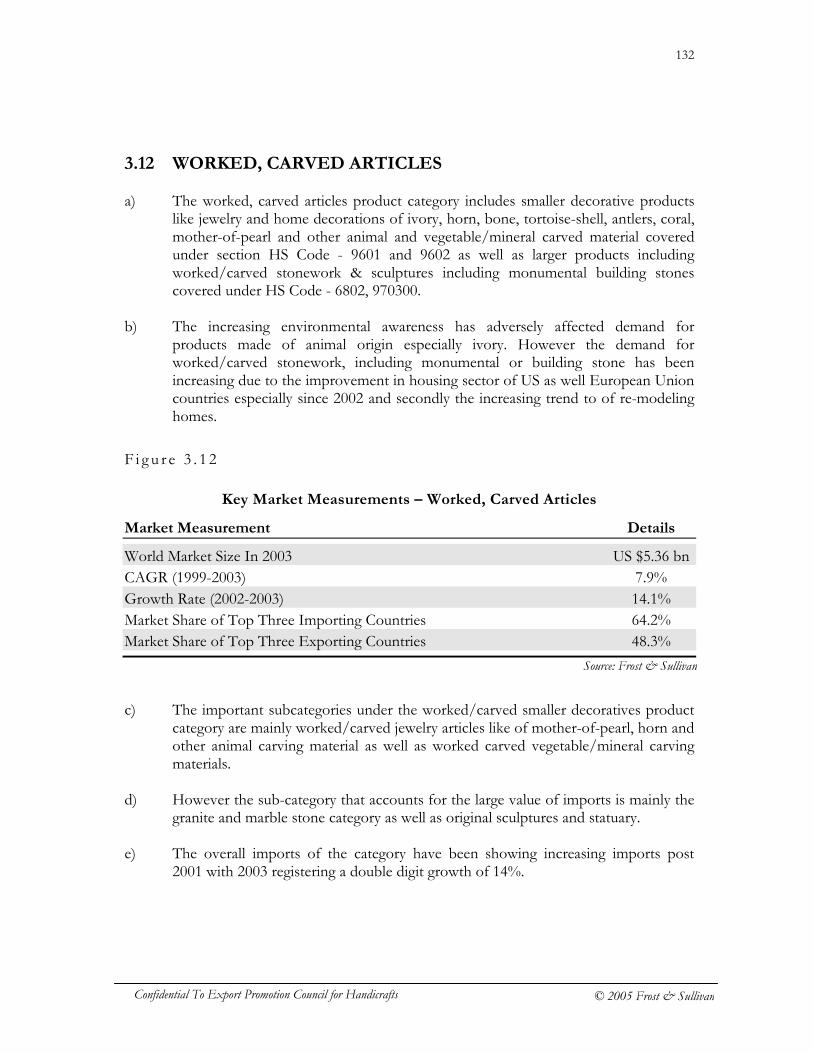
132
Confidential To Export Promotion Council for Handicrafts © 2005 Frost & Sullivan
3.12 WORKED, CARVED ARTICLES a) The worked, carved articles product category includes smaller decorative products
like jewelry and home decorations of ivory, horn, bone, tortoise-shell, antlers, coral, mother-of-pearl and other animal and vegetable/mineral carved material covered under section HS Code - 9601 and 9602 as well as larger products including worked/carved stonework & sculptures including monumental building stones covered under HS Code - 6802, 970300.
b) The increasing environmental awareness has adversely affected demand for
products made of animal origin especially ivory. However the demand for worked/carved stonework, including monumental or building stone has been increasing due to the improvement in housing sector of US as well European Union countries especially since 2002 and secondly the increasing trend to of re-modeling homes.
F i g u r e 3 . 1 2
Key Market Measurements – Worked, Carved Articles
Market Measurement Details
World Market Size In 2003 US $5.36 bn CAGR (1999-2003) 7.9% Growth Rate (2002-2003) 14.1% Market Share of Top Three Importing Countries 64.2% Market Share of Top Three Exporting Countries 48.3%
c) The important subcategories under the worked/carved smaller decoratives product
category are mainly worked/carved jewelry articles like of mother-of-pearl, horn and other animal carving material as well as worked carved vegetable/mineral carving materials.
d) However the sub-category that accounts for the large value of imports is mainly the
granite and marble stone category as well as original sculptures and statuary. e) The overall imports of the category have been showing increasing imports post
2001 with 2003 registering a double digit growth of 14%.
Source: Frost & Sullivan
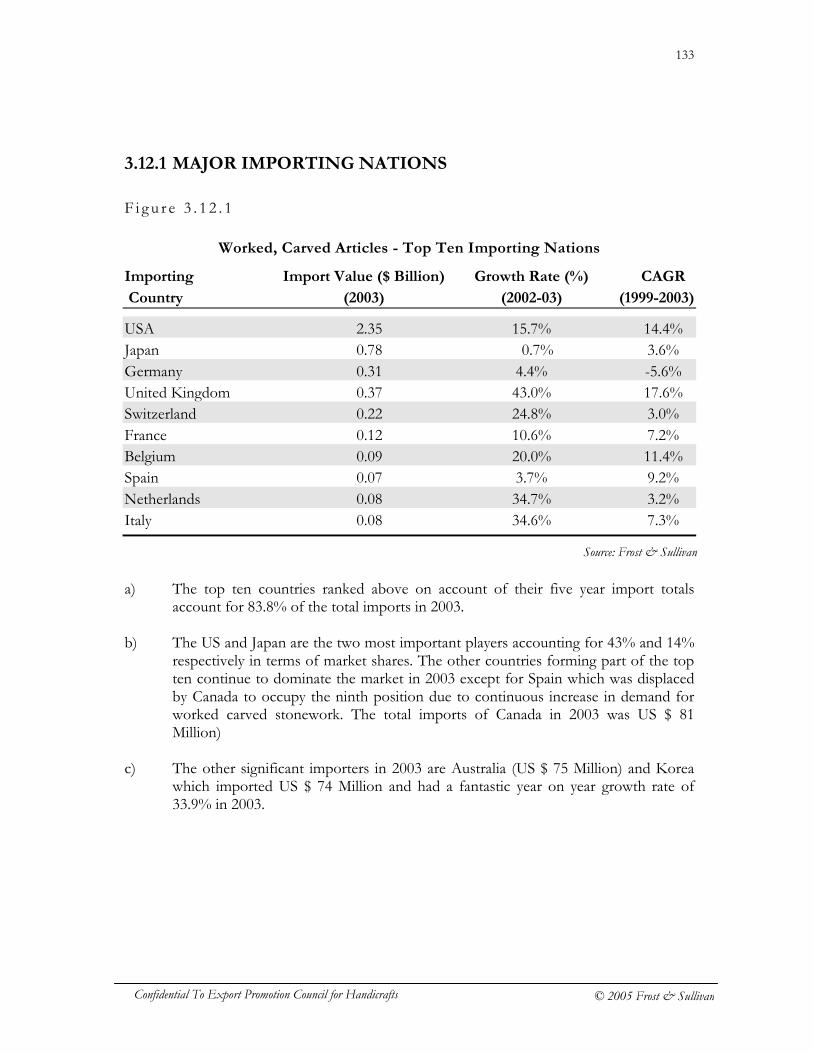
133
Confidential To Export Promotion Council for Handicrafts © 2005 Frost & Sullivan
3.12.1 MAJOR IMPORTING NATIONS
F i g u r e 3 . 1 2 . 1
Worked, Carved Articles - Top Ten Importing Nations
Importing Import Value ($ Billion) Growth Rate (%) CAGR
Country (2003) (2002-03) (1999-2003)
USA 2.35 15.7% 14.4% Japan 0.78 0.7% 3.6% Germany 0.31 4.4% -5.6% United Kingdom 0.37 43.0% 17.6% Switzerland 0.22 24.8% 3.0% France 0.12 10.6% 7.2% Belgium 0.09 20.0% 11.4% Spain 0.07 3.7% 9.2% Netherlands 0.08 34.7% 3.2% Italy 0.08 34.6% 7.3%
a) The top ten countries ranked above on account of their five year import totals
account for 83.8% of the total imports in 2003. b) The US and Japan are the two most important players accounting for 43% and 14%
respectively in terms of market shares. The other countries forming part of the top ten continue to dominate the market in 2003 except for Spain which was displaced by Canada to occupy the ninth position due to continuous increase in demand for worked carved stonework. The total imports of Canada in 2003 was US $ 81 Million)
c) The other significant importers in 2003 are Australia (US $ 75 Million) and Korea
which imported US $ 74 Million and had a fantastic year on year growth rate of 33.9% in 2003.
Source: Frost & Sullivan
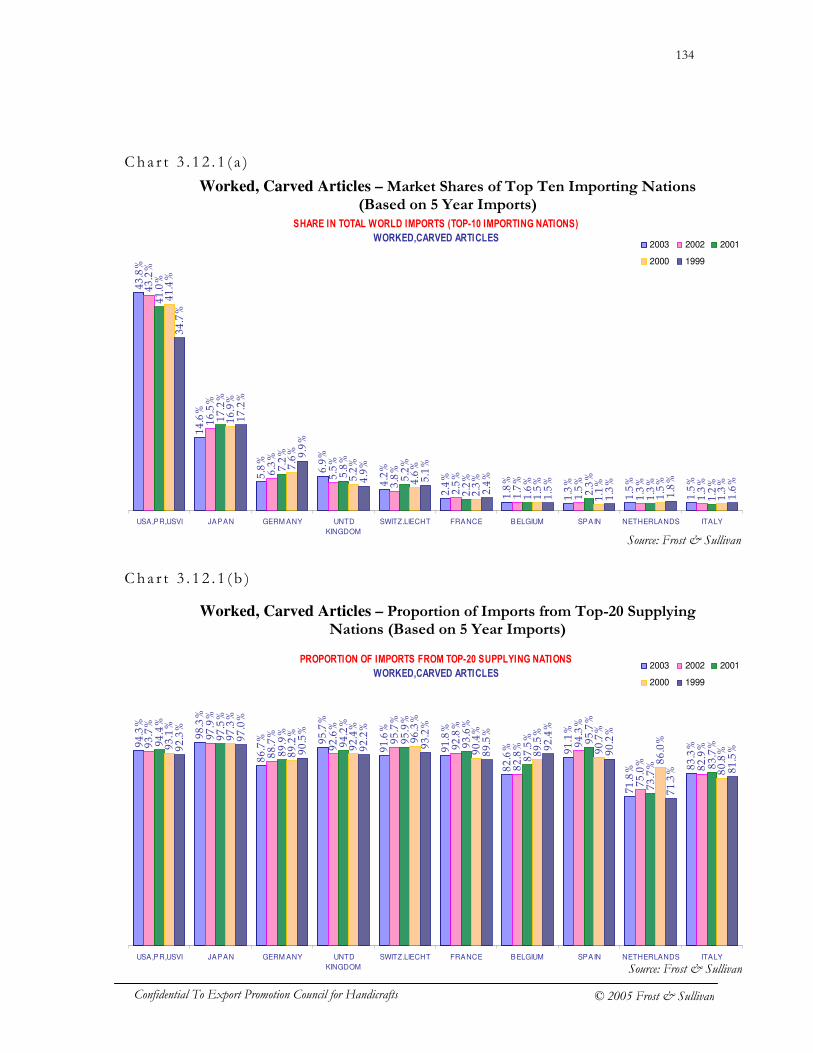
134
Confidential To Export Promotion Council for Handicrafts © 2005 Frost & Sullivan
Cha r t 3 . 1 2 . 1 ( a )
Cha r t 3 . 1 2 . 1 ( b )
Worked, Carved Articles – Market Shares of Top Ten Importing Nations (Based on 5 Year Imports)
Worked, Carved Articles – Proportion of Imports from Top-20 Supplying Nations (Based on 5 Year Imports)
PROPORTION OF IMPORTS FROM TOP-20 SUPPLYING NATIONS
WORKED,CARVED ARTICLES
94.3%
98.3%
86.7% 95.7%
91.6%
91.8%
82.6% 91.1%
71.8% 83.3%93.7%
97.9%
88.7%
92.6%
95.7%
92.8%
82.8% 94.3%
75.0%
82.9%
94.4%
97.5%
89.9%
94.2%
95.9%
93.6%
87.5% 95.7%
73.7% 83.7%93.1%
97.3%
89.2%
92.4%
96.3%
90.4%
89.5%
90.7%
86.0%
80.8%92.3%
97.0%
90.5%
92.2%
93.2%
89.5%
92.4%
90.2%
71.3% 81.5%
USA,PR,USVI JAPAN GERM ANY UNTD
KINGDOM
SWITZ.LIECHT FRANCE BELGIUM SPAIN NETHERLANDS ITALY
2003 2002 2001
2000 1999
SHARE IN TOTAL WORLD IMPORTS (TOP-10 IMPORTING NATIONS)
WORKED,CARVED ARTICLES
43.8%
14.6%
5.8%
6.9%
4.2%
2.4%
1.8%
1.3%
1.5%
1.5%
43.2%
16.5%
6.3%
5.5%
3.8%
2.5%
1.7%
1.5%
1.3%
1.3%
41.0%
17.2%
7.2%
5.8%
5.2%
2.2%
1.6%
2.3%
1.3%
1.2%
41.4%
16.9%
7.6%
5.2%
4.6%
2.3%
1.5%
1.1%
1.5%
1.3%
34.7%
17.2%
9.9%
4.9%
5.1%
2.4%
1.5%
1.3%
1.8%
1.6%
USA,PR,USVI JAPAN GERM ANY UNTD
KINGDOM
SWITZ.LIECHT FRANCE BELGIUM SPAIN NETHERLANDS ITALY
2003 2002 2001
2000 1999
Source: Frost & Sullivan
Source: Frost & Sullivan
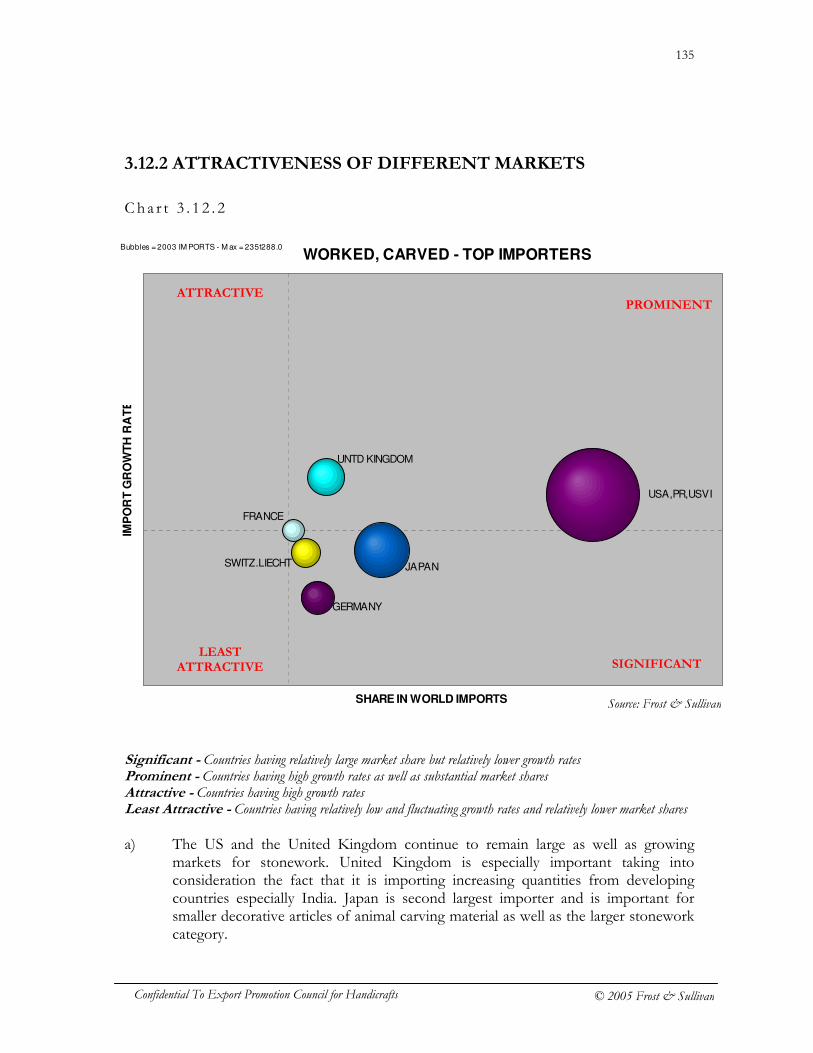
135
Confidential To Export Promotion Council for Handicrafts © 2005 Frost & Sullivan
3.12.2 ATTRACTIVENESS OF DIFFERENT MARKETS
Cha r t 3 . 1 2 . 2
Significant - Countries having relatively large market share but relatively lower growth rates Prominent - Countries having high growth rates as well as substantial market shares Attractive - Countries having high growth rates Least Attractive - Countries having relatively low and fluctuating growth rates and relatively lower market shares a) The US and the United Kingdom continue to remain large as well as growing
markets for stonework. United Kingdom is especially important taking into consideration the fact that it is importing increasing quantities from developing countries especially India. Japan is second largest importer and is important for smaller decorative articles of animal carving material as well as the larger stonework category.
WORKED, CARVED - TOP IMPORTERS
FRANCE
GERMANY
JAPAN SWITZ.LIECHT
UNTD KINGDOM
USA,PR,USVI
SHARE IN WORLD IMPORTS
IMP
OR
T G
RO
WT
H R
AT
E
Bubbles = 2003 IM PORTS - M ax = 2351288.0
PROMINENT ATTRACTIVE
SIGNIFICANT LEAST
ATTRACTIVE
Source: Frost & Sullivan
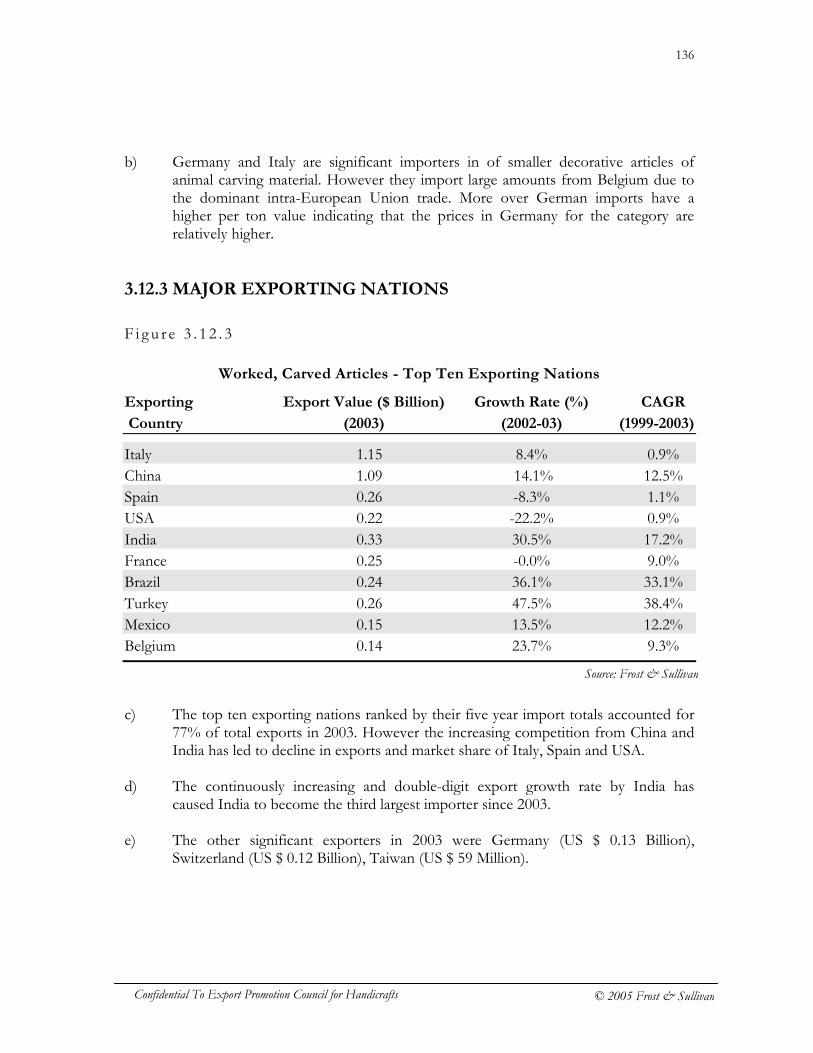
136
Confidential To Export Promotion Council for Handicrafts © 2005 Frost & Sullivan
b) Germany and Italy are significant importers in of smaller decorative articles of animal carving material. However they import large amounts from Belgium due to the dominant intra-European Union trade. More over German imports have a higher per ton value indicating that the prices in Germany for the category are relatively higher.
3.12.3 MAJOR EXPORTING NATIONS
F i g u r e 3 . 1 2 . 3
Worked, Carved Articles - Top Ten Exporting Nations
Exporting Export Value ($ Billion) Growth Rate (%) CAGR
Country (2003) (2002-03) (1999-2003)
Italy 1.15 8.4% 0.9% China 1.09 14.1% 12.5% Spain 0.26 -8.3% 1.1% USA 0.22 -22.2% 0.9% India 0.33 30.5% 17.2% France 0.25 -0.0% 9.0% Brazil 0.24 36.1% 33.1% Turkey 0.26 47.5% 38.4% Mexico 0.15 13.5% 12.2% Belgium 0.14 23.7% 9.3%
c) The top ten exporting nations ranked by their five year import totals accounted for
77% of total exports in 2003. However the increasing competition from China and India has led to decline in exports and market share of Italy, Spain and USA.
d) The continuously increasing and double-digit export growth rate by India has
caused India to become the third largest importer since 2003. e) The other significant exporters in 2003 were Germany (US $ 0.13 Billion),
Switzerland (US $ 0.12 Billion), Taiwan (US $ 59 Million).
Source: Frost & Sullivan
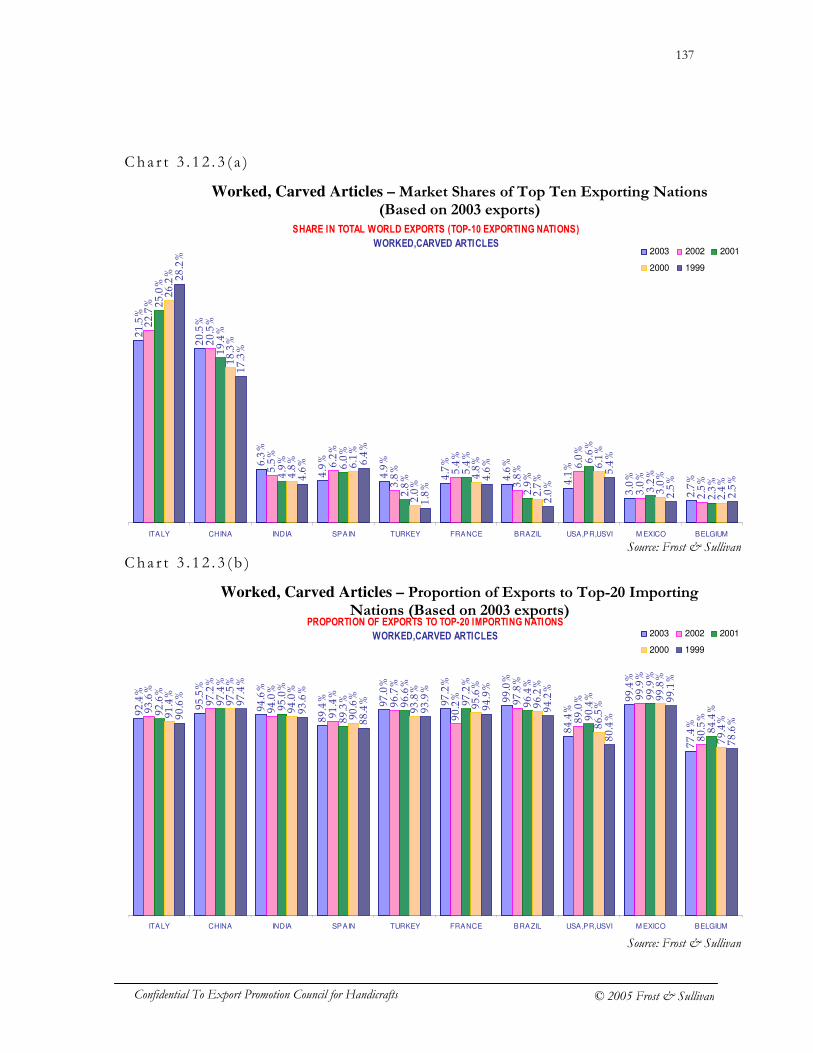
137
Confidential To Export Promotion Council for Handicrafts © 2005 Frost & Sullivan
Cha r t 3 . 1 2 . 3 ( a )
C h a r t 3 . 1 2 . 3 ( b )
PROPORTION OF EXPORTS TO TOP-20 IMPORTING NATIONS
WORKED,CARVED ARTICLES
92.4%
95.5%
94.6%
89.4%
97.0%
97.2%
99.0%
84.4%
99.4%
77.4%
93.6%
97.2%
94.0%
91.4%
96.7%
90.2%
97.8%
89.0% 99.9%
80.5%
92.6%
97.4%
95.0%
89.3%
96.6%
97.2%
96.4%
90.4% 99.9%
84.4%
91.4%
97.5%
94.0%
90.6%
93.8%
95.6%
96.2%
86.5%
99.8%
79.4%
90.6%
97.4%
93.6%
88.4%
93.9%
94.9%
94.2%
80.4%
99.1%
78.6%
ITALY CHINA INDIA SPAIN TURKEY FRANCE BRAZIL USA,PR,USVI M EXICO BELGIUM
2003 2002 2001
2000 1999
SHARE IN TOTAL WORLD EXPORTS (TOP-10 EXPORTING NATIONS)
WORKED,CARVED ARTICLES
21.5%
20.5%
6.3%
4.9%
4.9%
4.7%
4.6%
4.1%
3.0%
2.7%
22.7%
20.5%
5.5%
6.2%
3.8% 5.4%
3.8%
6.0%
3.0%
2.5%
25.0%
19.4%
4.9%
6.0%
2.8%
5.4%
2.9%
6.6%
3.2%
2.3%
26.2%
18.3%
4.8%
6.1%
2.0%
4.8%
2.7%
6.1%
3.0%
2.4%
28.2%
17.3%
4.6% 6.4%
1.8%
4.6%
2.0%
5.4%
2.5%
2.5%
ITALY CHINA INDIA SPAIN TURKEY FRANCE BRAZIL USA,PR,USVI M EXICO BELGIUM
2003 2002 2001
2000 1999
Worked, Carved Articles – Market Shares of Top Ten Exporting Nations (Based on 2003 exports)
Worked, Carved Articles – Proportion of Exports to Top-20 Importing Nations (Based on 2003 exports)
Source: Frost & Sullivan
Source: Frost & Sullivan
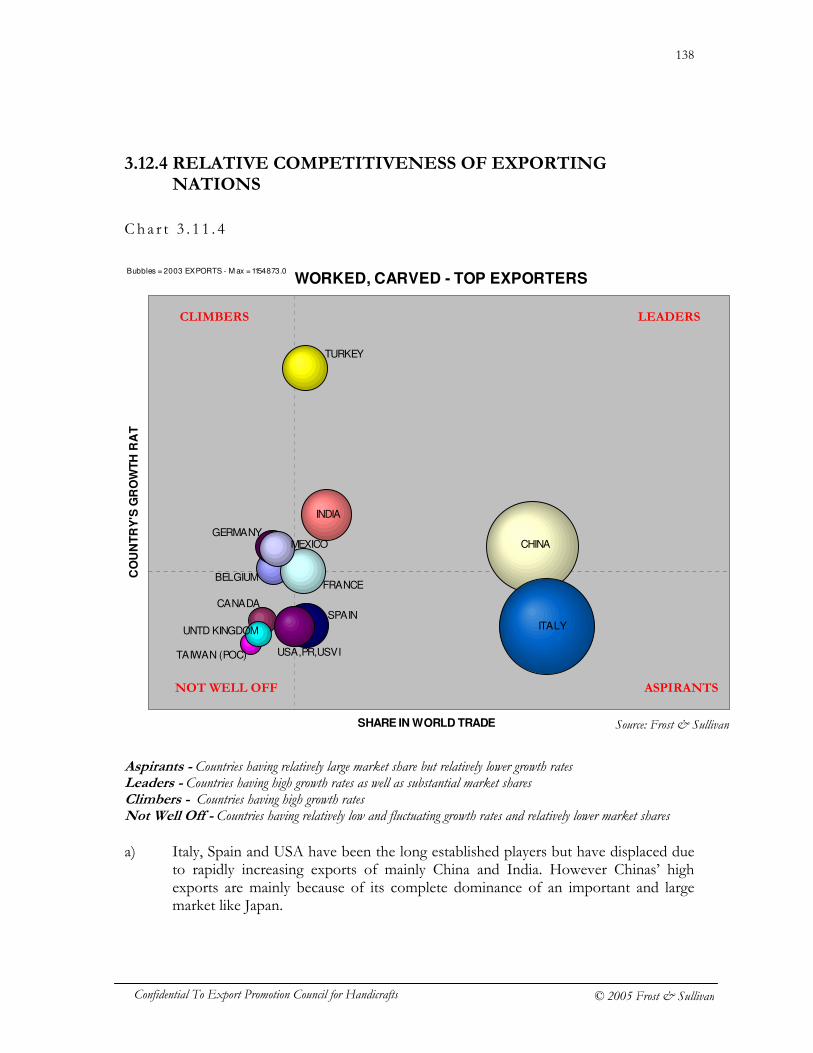
138
Confidential To Export Promotion Council for Handicrafts © 2005 Frost & Sullivan
3.12.4 RELATIVE COMPETITIVENESS OF EXPORTING NATIONS
Cha r t 3 . 1 1 . 4
Aspirants - Countries having relatively large market share but relatively lower growth rates Leaders - Countries having high growth rates as well as substantial market shares Climbers - Countries having high growth rates Not Well Off - Countries having relatively low and fluctuating growth rates and relatively lower market shares a) Italy, Spain and USA have been the long established players but have displaced due
to rapidly increasing exports of mainly China and India. However Chinas’ high exports are mainly because of its complete dominance of an important and large market like Japan.
WORKED, CARVED - TOP EXPORTERS
BELGIUM
CANADA
CHINA
FRANCE
GERMANY
INDIA
ITALY
MEXICO
SPAIN
TAIWAN (POC)
TURKEY
UNTD KINGDOM
USA,PR,USVI
SHARE IN WORLD TRADE
CO
UN
TR
Y'S
GR
OW
TH
RA
TE
Bubbles = 2003 EXPORTS - M ax = 1154873.0
LEADERS CLIMBERS
ASPIRANTS NOT WELL OFF
Source: Frost & Sullivan
139
Confidential To Export Promotion Council for Handicrafts © 2005 Frost & Sullivan
b) From the perspective of developing Asian countries, Belgium is a major competitor in the smaller decorative worked carved articles category due to its control in European Union intra-trade for the product category.
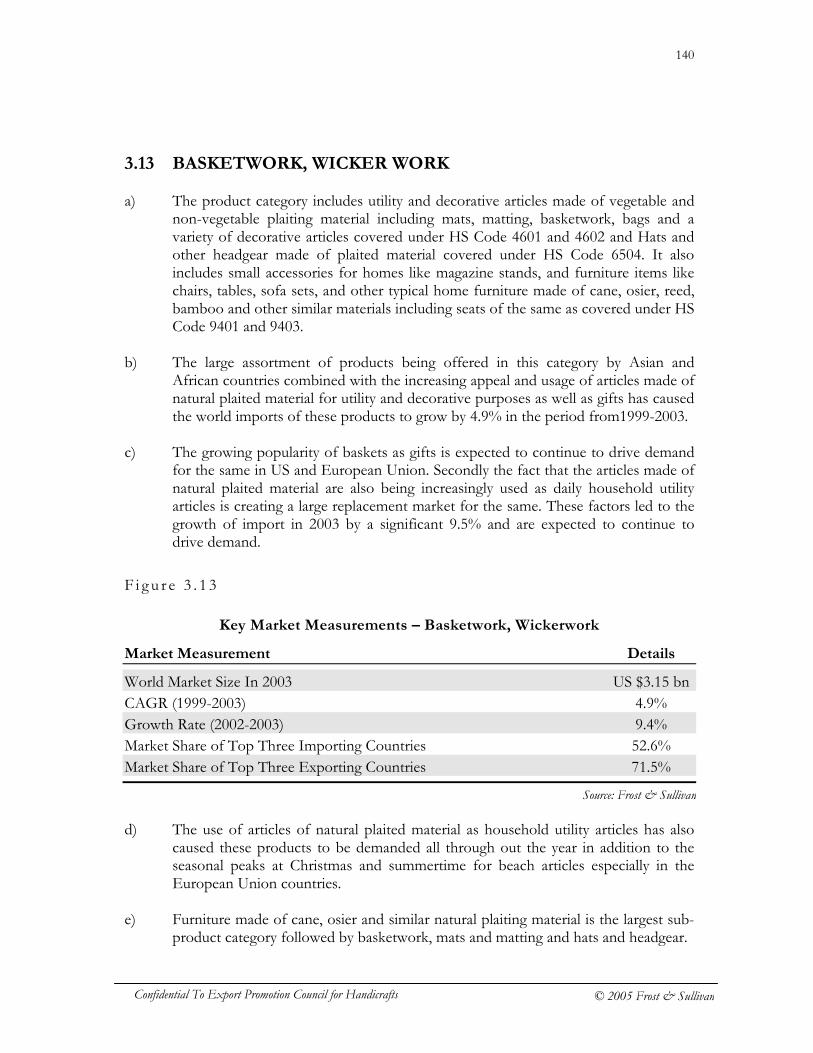
140
Confidential To Export Promotion Council for Handicrafts © 2005 Frost & Sullivan
3.13 BASKETWORK, WICKER WORK a) The product category includes utility and decorative articles made of vegetable and
non-vegetable plaiting material including mats, matting, basketwork, bags and a variety of decorative articles covered under HS Code 4601 and 4602 and Hats and other headgear made of plaited material covered under HS Code 6504. It also includes small accessories for homes like magazine stands, and furniture items like chairs, tables, sofa sets, and other typical home furniture made of cane, osier, reed, bamboo and other similar materials including seats of the same as covered under HS Code 9401 and 9403.
b) The large assortment of products being offered in this category by Asian and
African countries combined with the increasing appeal and usage of articles made of natural plaited material for utility and decorative purposes as well as gifts has caused the world imports of these products to grow by 4.9% in the period from1999-2003.
c) The growing popularity of baskets as gifts is expected to continue to drive demand
for the same in US and European Union. Secondly the fact that the articles made of natural plaited material are also being increasingly used as daily household utility articles is creating a large replacement market for the same. These factors led to the growth of import in 2003 by a significant 9.5% and are expected to continue to drive demand.
F i g u r e 3 . 1 3
Key Market Measurements – Basketwork, Wickerwork
Market Measurement Details
World Market Size In 2003 US $3.15 bn CAGR (1999-2003) 4.9% Growth Rate (2002-2003) 9.4% Market Share of Top Three Importing Countries 52.6% Market Share of Top Three Exporting Countries 71.5%
d) The use of articles of natural plaited material as household utility articles has also caused these products to be demanded all through out the year in addition to the seasonal peaks at Christmas and summertime for beach articles especially in the European Union countries.
e) Furniture made of cane, osier and similar natural plaiting material is the largest sub-
product category followed by basketwork, mats and matting and hats and headgear.
Source: Frost & Sullivan
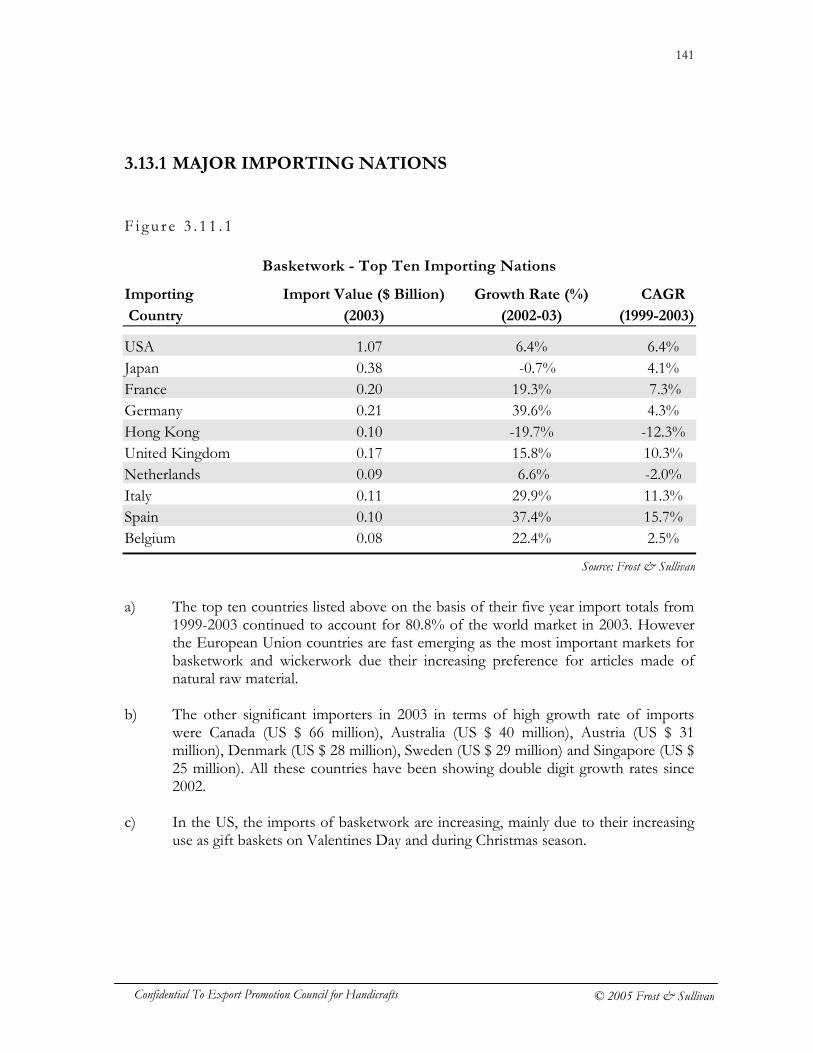
141
Confidential To Export Promotion Council for Handicrafts © 2005 Frost & Sullivan
3.13.1 MAJOR IMPORTING NATIONS
F i g u r e 3 . 1 1 . 1
Basketwork - Top Ten Importing Nations
Importing Import Value ($ Billion) Growth Rate (%) CAGR
Country (2003) (2002-03) (1999-2003)
USA 1.07 6.4% 6.4% Japan 0.38 -0.7% 4.1% France 0.20 19.3% 7.3% Germany 0.21 39.6% 4.3% Hong Kong 0.10 -19.7% -12.3% United Kingdom 0.17 15.8% 10.3% Netherlands 0.09 6.6% -2.0% Italy 0.11 29.9% 11.3% Spain 0.10 37.4% 15.7% Belgium 0.08 22.4% 2.5%
a) The top ten countries listed above on the basis of their five year import totals from
1999-2003 continued to account for 80.8% of the world market in 2003. However the European Union countries are fast emerging as the most important markets for basketwork and wickerwork due their increasing preference for articles made of natural raw material.
b) The other significant importers in 2003 in terms of high growth rate of imports
were Canada (US $ 66 million), Australia (US $ 40 million), Austria (US $ 31 million), Denmark (US $ 28 million), Sweden (US $ 29 million) and Singapore (US $ 25 million). All these countries have been showing double digit growth rates since 2002.
c) In the US, the imports of basketwork are increasing, mainly due to their increasing
use as gift baskets on Valentines Day and during Christmas season.
Source: Frost & Sullivan
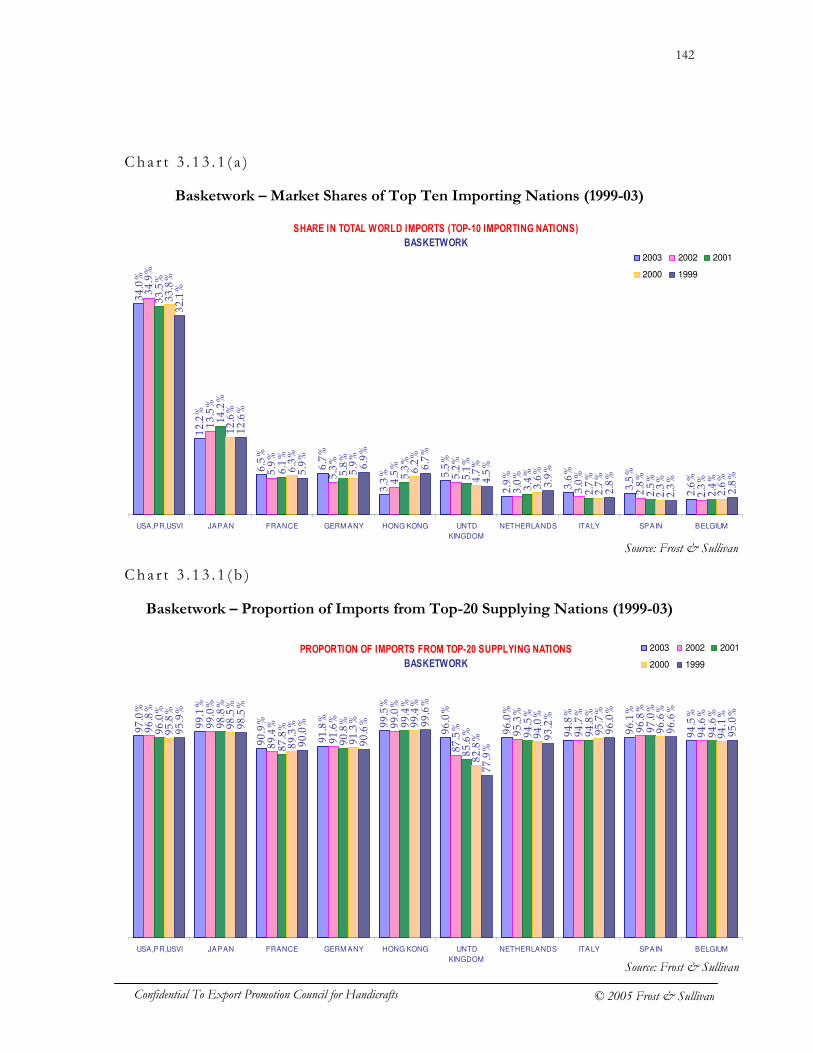
142
Confidential To Export Promotion Council for Handicrafts © 2005 Frost & Sullivan
Cha r t 3 . 1 3 . 1 ( a )
Basketwork – Market Shares of Top Ten Importing Nations (1999-03)
Cha r t 3 . 1 3 . 1 ( b )
Basketwork – Proportion of Imports from Top-20 Supplying Nations (1999-03)
SHARE IN TOTAL WORLD IMPORTS (TOP-10 IMPORTING NATIONS)
BASKETWORK
34.0%
12.2%
6.5%
6.7%
3.3% 5.5%
2.9%
3.6%
3.5%
2.6%
34.9%
13.5%
5.9%
5.3%
4.5%
5.2%
3.0%
3.0%
2.8%
2.3%
33.5%
14.2%
6.1%
5.8%
5.3%
5.1%
3.4%
2.7%
2.5%
2.4%
33.8%
12.6%
6.3%
5.9%
6.2%
4.7%
3.6%
2.7%
2.3%
2.6%
32.1%
12.6%
5.9%
6.9%
6.7%
4.5%
3.9%
2.8%
2.3%
2.8%
USA,PR,USVI JAPAN FRANCE GERM ANY HONG KONG UNTD
KINGDOM
NETHERLANDS ITALY SPAIN BELGIUM
2003 2002 2001
2000 1999
PROPORTION OF IMPORTS FROM TOP-20 SUPPLYING NATIONS
BASKETWORK
97.0%
99.1%
90.9%
91.8%
99.5%
96.0%
96.0%
94.8%
96.1%
94.5%
96.8%
99.0%
89.4%
91.6%
99.0%
87.5%
95.3%
94.7%
96.8%
94.6%
96.0%
98.8%
87.8%
90.8% 99.4%
85.6% 94.5%
94.8%
97.0%
94.6%
95.8%
98.5%
89.3%
91.3% 99.4%
82.8% 94.0%
95.7%
96.6%
94.1%
95.9%
98.5%
90.0%
90.6% 99.6%
77.9%
93.2%
96.0%
96.6%
95.0%
USA,PR,USVI JAPAN FRANCE GERM ANY HONG KONG UNTD
KINGDOM
NETHERLANDS ITALY SPAIN BELGIUM
2003 2002 2001
2000 1999
Source: Frost & Sullivan
Source: Frost & Sullivan
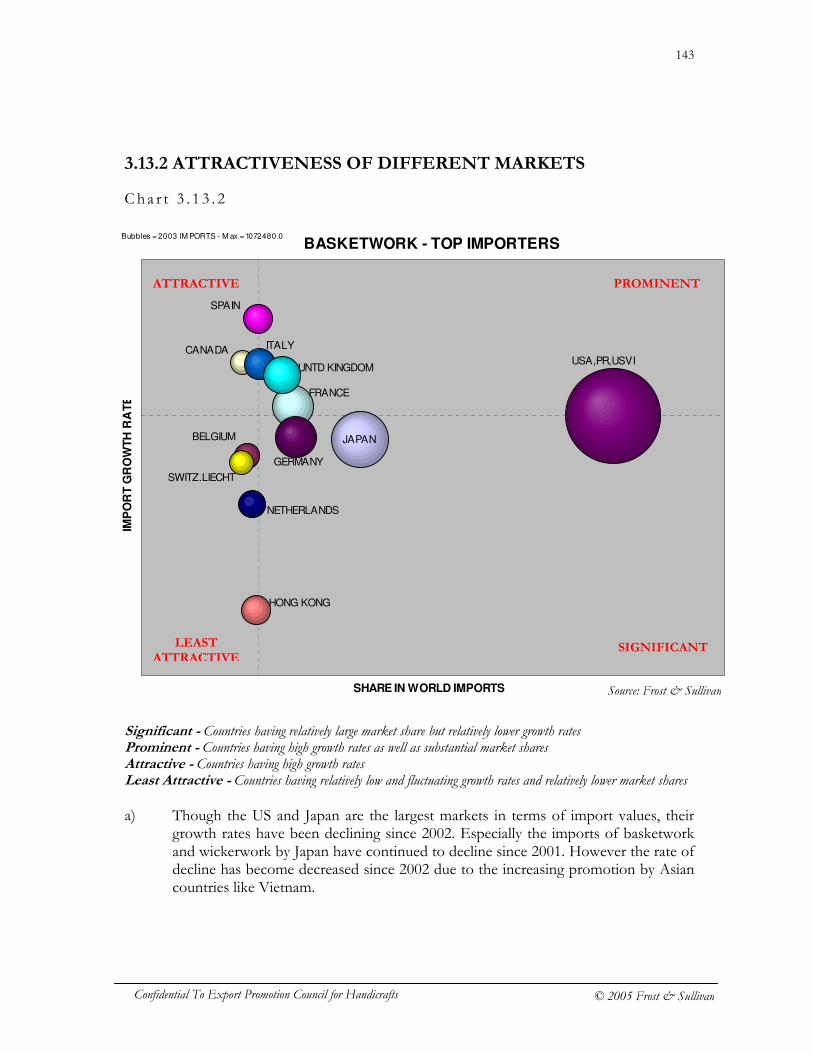
143
Confidential To Export Promotion Council for Handicrafts © 2005 Frost & Sullivan
3.13.2 ATTRACTIVENESS OF DIFFERENT MARKETS
Cha r t 3 . 1 3 . 2
Significant - Countries having relatively large market share but relatively lower growth rates Prominent - Countries having high growth rates as well as substantial market shares Attractive - Countries having high growth rates Least Attractive - Countries having relatively low and fluctuating growth rates and relatively lower market shares a) Though the US and Japan are the largest markets in terms of import values, their
growth rates have been declining since 2002. Especially the imports of basketwork and wickerwork by Japan have continued to decline since 2001. However the rate of decline has become decreased since 2002 due to the increasing promotion by Asian countries like Vietnam.
BASKETWORK - TOP IMPORTERS
BELGIUM
CANADA
FRANCE
GERMANY
HONG KONG
ITALY
JAPAN
NETHERLANDS
SPAIN
SWITZ.LIECHT
UNTD KINGDOM USA,PR,USVI
SHARE IN WORLD IMPORTS
IMP
OR
T G
RO
WT
H R
AT
E
Bubbles = 2003 IM PORTS - M ax = 1072480.0
PROMINENT ATTRACTIVE
SIGNIFICANT LEAST ATTRACTIVE
Source: Frost & Sullivan
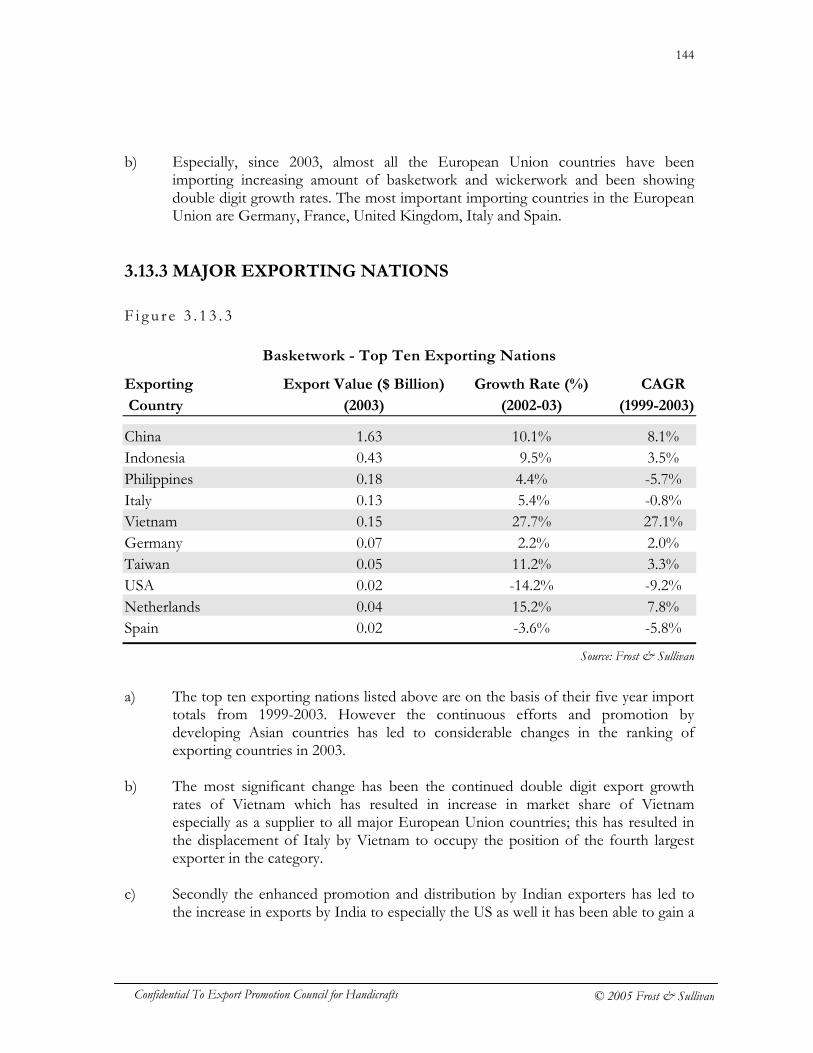
144
Confidential To Export Promotion Council for Handicrafts © 2005 Frost & Sullivan
b) Especially, since 2003, almost all the European Union countries have been importing increasing amount of basketwork and wickerwork and been showing double digit growth rates. The most important importing countries in the European Union are Germany, France, United Kingdom, Italy and Spain.
3.13.3 MAJOR EXPORTING NATIONS
F i g u r e 3 . 1 3 . 3
Basketwork - Top Ten Exporting Nations
Exporting Export Value ($ Billion) Growth Rate (%) CAGR
Country (2003) (2002-03) (1999-2003)
China 1.63 10.1% 8.1% Indonesia 0.43 9.5% 3.5% Philippines 0.18 4.4% -5.7% Italy 0.13 5.4% -0.8% Vietnam 0.15 27.7% 27.1% Germany 0.07 2.2% 2.0% Taiwan 0.05 11.2% 3.3% USA 0.02 -14.2% -9.2% Netherlands 0.04 15.2% 7.8% Spain 0.02 -3.6% -5.8%
a) The top ten exporting nations listed above are on the basis of their five year import
totals from 1999-2003. However the continuous efforts and promotion by developing Asian countries has led to considerable changes in the ranking of exporting countries in 2003.
b) The most significant change has been the continued double digit export growth
rates of Vietnam which has resulted in increase in market share of Vietnam especially as a supplier to all major European Union countries; this has resulted in the displacement of Italy by Vietnam to occupy the position of the fourth largest exporter in the category.
c) Secondly the enhanced promotion and distribution by Indian exporters has led to
the increase in exports by India to especially the US as well it has been able to gain a
Source: Frost & Sullivan
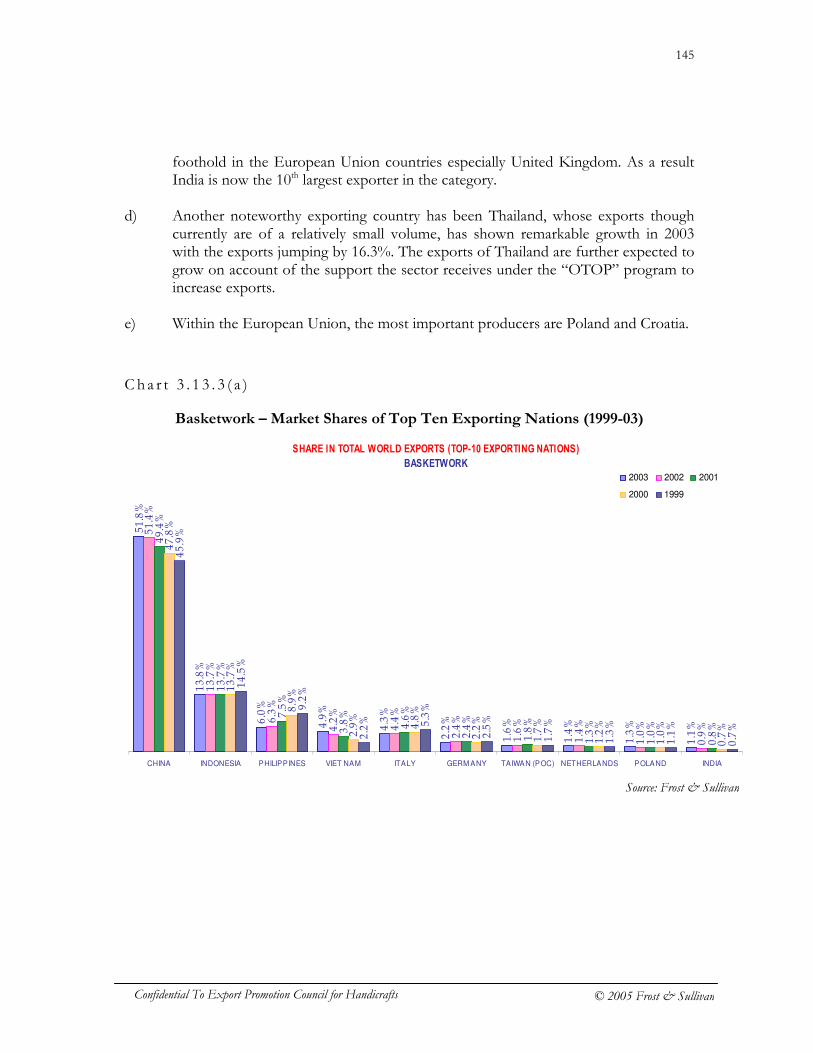
145
Confidential To Export Promotion Council for Handicrafts © 2005 Frost & Sullivan
foothold in the European Union countries especially United Kingdom. As a result India is now the 10th largest exporter in the category.
d) Another noteworthy exporting country has been Thailand, whose exports though
currently are of a relatively small volume, has shown remarkable growth in 2003 with the exports jumping by 16.3%. The exports of Thailand are further expected to grow on account of the support the sector receives under the “OTOP” program to increase exports.
e) Within the European Union, the most important producers are Poland and Croatia.
C h a r t 3 . 1 3 . 3 ( a )
Basketwork – Market Shares of Top Ten Exporting Nations (1999-03)
SHARE IN TOTAL WORLD EXPORTS (TOP-10 EXPORTING NATIONS)
BASKETWORK
51.8%
13.8%
6.0%
4.9%
4.3%
2.2%
1.6%
1.4%
1.3%
1.1%
51.4%
13.7%
6.3%
4.2%
4.4%
2.4%
1.6%
1.4%
1.0%
0.9%
49.4%
13.7%
7.5%
3.8%
4.6%
2.4%
1.8%
1.3%
1.0%
0.8%
47.8%
13.7%
8.9%
2.9%
4.8%
2.2%
1.7%
1.2%
1.0%
0.7%
45.9%
14.5%
9.2%
2.2% 5.3%
2.5%
1.7%
1.3%
1.1%
0.7%
CHINA INDONESIA PHILIPPINES VIET NAM ITALY GERM ANY TAIWAN (POC) NETHERLANDS POLAND INDIA
2003 2002 2001
2000 1999
Source: Frost & Sullivan
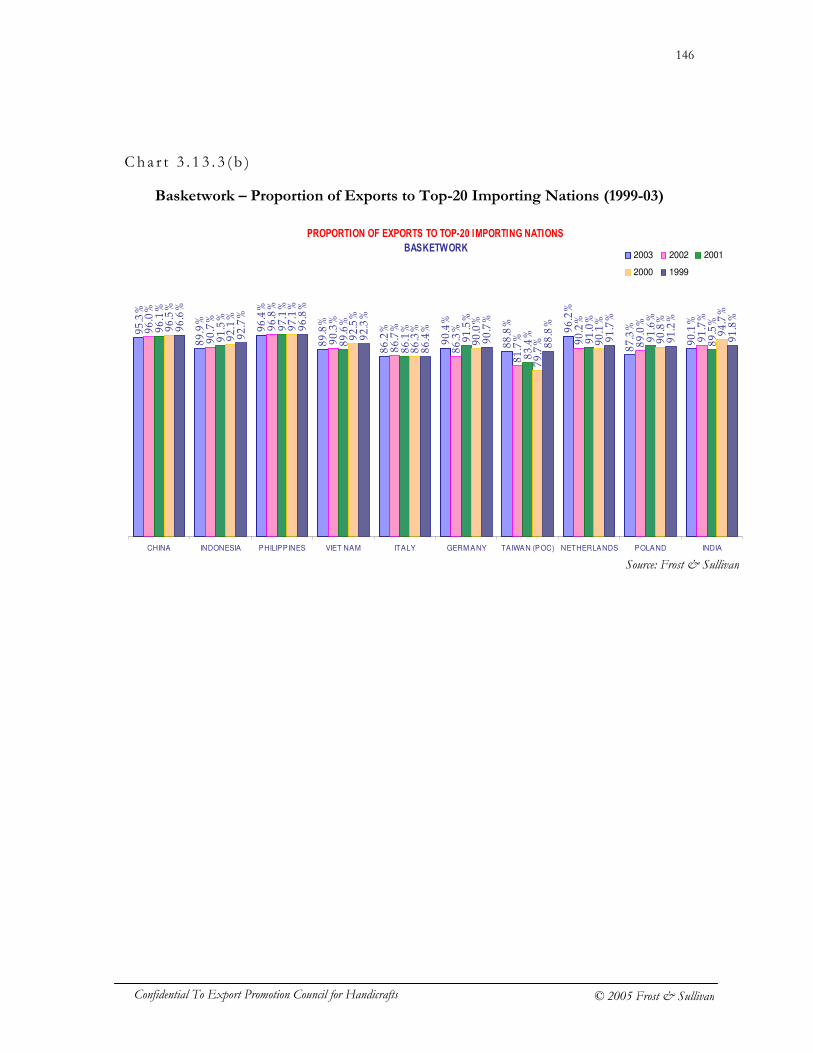
146
Confidential To Export Promotion Council for Handicrafts © 2005 Frost & Sullivan
Cha r t 3 . 1 3 . 3 ( b )
Basketwork – Proportion of Exports to Top-20 Importing Nations (1999-03)
PROPORTION OF EXPORTS TO TOP-20 IMPORTING NATIONS
BASKETWORK
95.3%
89.9%
96.4%
89.8%
86.2%
90.4%
88.8%
96.2%
87.3%
90.1%
96.0%
90.7%
96.8%
90.3%
86.7%
86.3%
81.7% 90.2%
89.0%
91.7%
96.1%
91.5%
97.1%
89.6%
86.1%
91.5%
83.4%
91.0%
91.6%
89.5%
96.5%
92.1%
97.1%
92.5%
86.3%
90.0%
79.7% 90.1%
90.8%
94.7%
96.6%
92.7%
96.8%
92.3%
86.4%
90.7%
88.8%
91.7%
91.2%
91.8%
CHINA INDONESIA PHILIPPINES VIET NAM ITALY GERM ANY TAIWAN (POC) NETHERLANDS POLAND INDIA
2003 2002 2001
2000 1999
Source: Frost & Sullivan
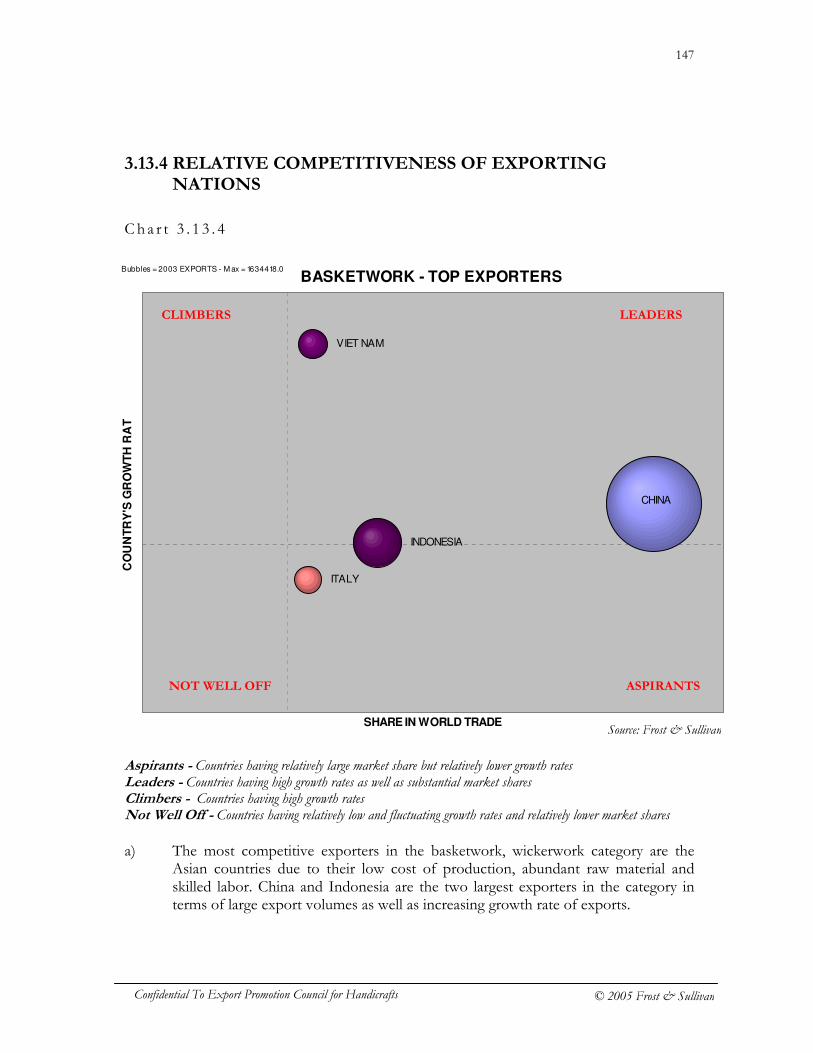
147
Confidential To Export Promotion Council for Handicrafts © 2005 Frost & Sullivan
3.13.4 RELATIVE COMPETITIVENESS OF EXPORTING NATIONS
Cha r t 3 . 1 3 . 4
Aspirants - Countries having relatively large market share but relatively lower growth rates Leaders - Countries having high growth rates as well as substantial market shares Climbers - Countries having high growth rates Not Well Off - Countries having relatively low and fluctuating growth rates and relatively lower market shares a) The most competitive exporters in the basketwork, wickerwork category are the
Asian countries due to their low cost of production, abundant raw material and skilled labor. China and Indonesia are the two largest exporters in the category in terms of large export volumes as well as increasing growth rate of exports.
BASKETWORK - TOP EXPORTERS
CHINA
INDONESIA
ITALY
VIET NAM
SHARE IN WORLD TRADE
CO
UN
TR
Y'S
GR
OW
TH
RA
TE
Bubbles = 2003 EXPORTS - M ax = 1634418.0
LEADERS CLIMBERS
ASPIRANTS NOT WELL OFF
Source: Frost & Sullivan
148
Confidential To Export Promotion Council for Handicrafts © 2005 Frost & Sullivan
b) Countries like Vietnam and Thailand are also significant competitors due the promotion programs induced by them, which has led to the increase in their exports post 2001 and the exports and market shares of these countries are further expected to further increase.
c) Italy being a major re-exporter of basketwork and wickerwork of Asian and eastern
European origin, is not a major threat to Asian exporting countries. However Poland who is a major producer of basketwork in the European Union needs to be tracked.
149
Confidential To Export Promotion Council for Handicrafts © 2005 Frost & Sullivan
3.14 WOODWORK a) The woodwork product category which is by and large identified as handicrafts
includes a variety of decorative articles like statuettes, sculptures, carvings as well as functional articles, like: bowls, plates, boxes, bookends, picture frames, caskets, cases, etc. covered under HS Code 4414, 4119, 4420 and also includes walking sticks covered under HS Code 6602000. Small and large wooden furniture has been expressly excluded as the same is included under the Furniture product category for estimation purpose.
b) With respect to sub-product categories, the most important sub-product category is
wooden frames for paintings, photographs and other similar objects. This is followed by statuettes and other ornaments of wood, then utility articles of wood like tableware, kitchenware of wood and decorative cum utility articles like jewelry boxes, wood marquetry, inlaid wood cases and caskets and lastly walking sticks.
F i g u r e 3 . 1 4
Key Market Measurements – Woodwork
Market Measurement Details
World Market Size In 2003 US $2.87 bn CAGR (1999-2003) 4.3% Growth Rate (2002-2003) 4.8% Market Share of Top Three Importing Countries 55.5% Market Share of Top Three Exporting Countries 67.3%
c) Though this category relatively accounts for a relatively lower value in total imports
of crafts and decorative products, it still is a very important category for Asian countries as they are the leading exporters in the category and have the resources for continued domination of the market.
d) More over though the overall growth rate for the period 1999-2003 has not been
exceptionally promising, the category still holds lot of potential for developing Asian exporting nations. The average growth rate of world imports for the category has been around 4%. This is mainly because of fluctuating imports by US and Japan, which are the two largest importers.
e) The US giftware market being the largest, it is a large importer of decorative
wooden frames which is a standard gift item in the US. The European Union
Source: Frost & Sullivan
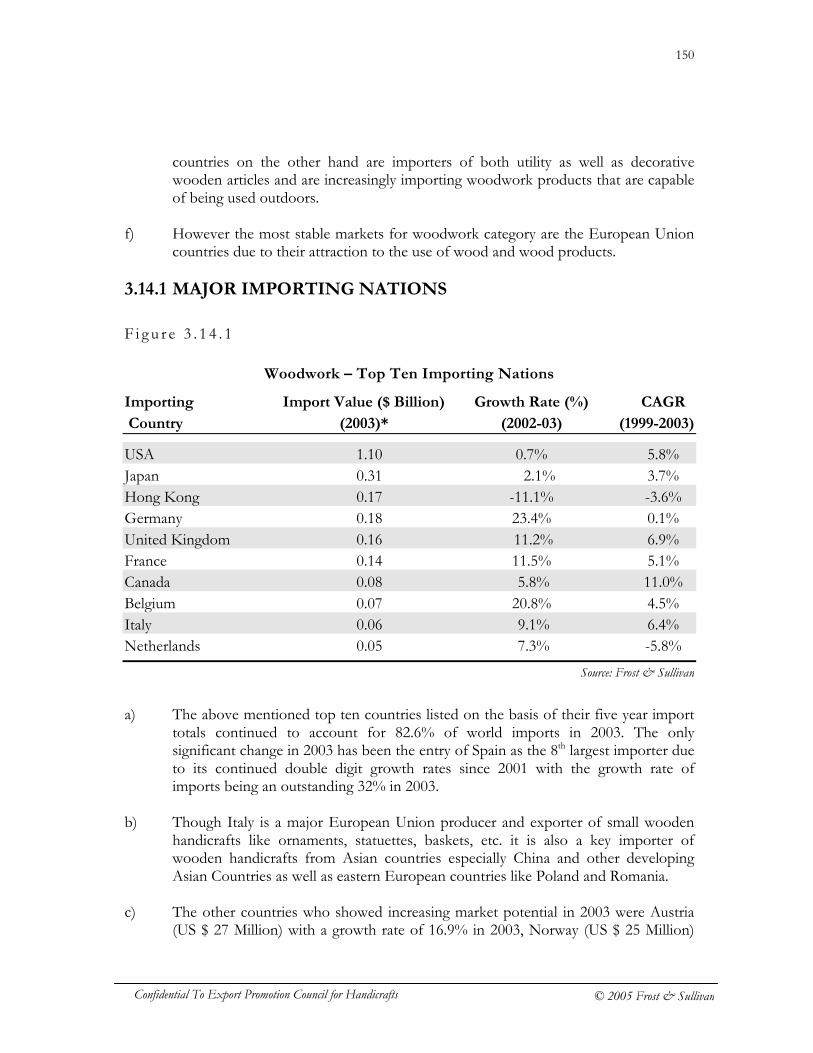
150
Confidential To Export Promotion Council for Handicrafts © 2005 Frost & Sullivan
countries on the other hand are importers of both utility as well as decorative wooden articles and are increasingly importing woodwork products that are capable of being used outdoors.
f) However the most stable markets for woodwork category are the European Union
countries due to their attraction to the use of wood and wood products.
3.14.1 MAJOR IMPORTING NATIONS
F i g u r e 3 . 1 4 . 1
Woodwork – Top Ten Importing Nations
Importing Import Value ($ Billion) Growth Rate (%) CAGR
Country (2003)* (2002-03) (1999-2003)
USA 1.10 0.7% 5.8% Japan 0.31 2.1% 3.7% Hong Kong 0.17 -11.1% -3.6% Germany 0.18 23.4% 0.1% United Kingdom 0.16 11.2% 6.9% France 0.14 11.5% 5.1% Canada 0.08 5.8% 11.0% Belgium 0.07 20.8% 4.5% Italy 0.06 9.1% 6.4% Netherlands 0.05 7.3% -5.8%
a) The above mentioned top ten countries listed on the basis of their five year import
totals continued to account for 82.6% of world imports in 2003. The only significant change in 2003 has been the entry of Spain as the 8th largest importer due to its continued double digit growth rates since 2001 with the growth rate of imports being an outstanding 32% in 2003.
b) Though Italy is a major European Union producer and exporter of small wooden
handicrafts like ornaments, statuettes, baskets, etc. it is also a key importer of wooden handicrafts from Asian countries especially China and other developing Asian Countries as well as eastern European countries like Poland and Romania.
c) The other countries who showed increasing market potential in 2003 were Austria
(US $ 27 Million) with a growth rate of 16.9% in 2003, Norway (US $ 25 Million)
Source: Frost & Sullivan
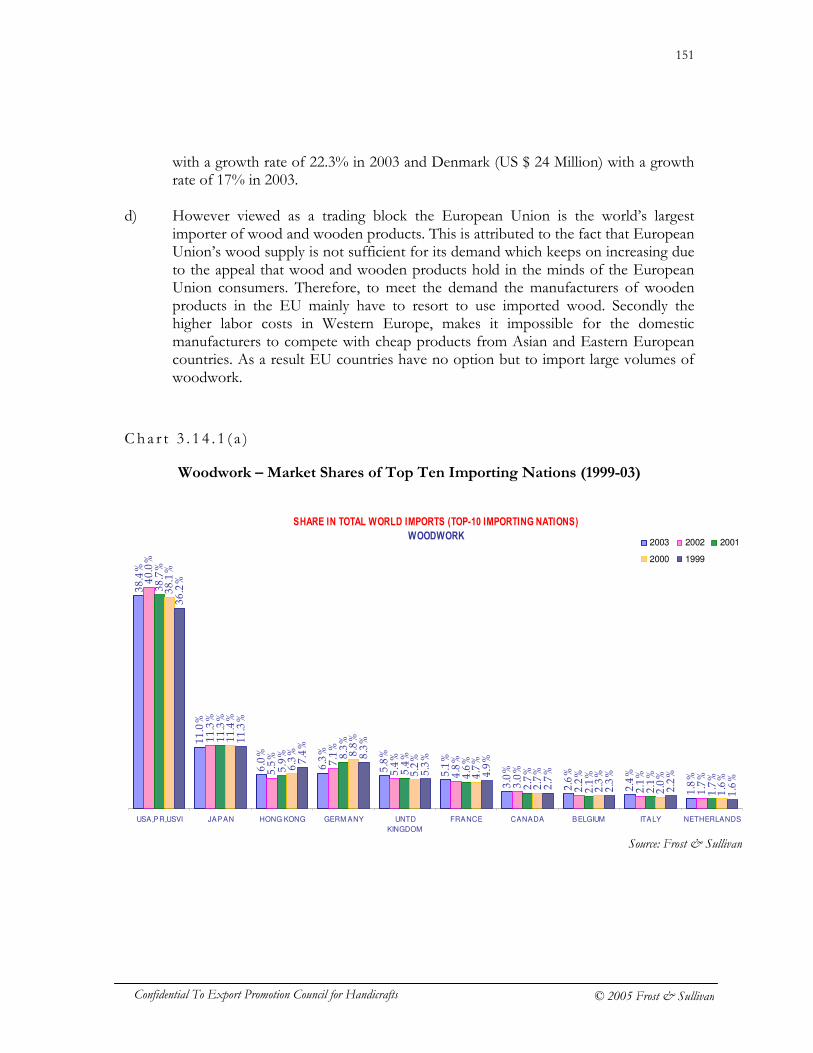
151
Confidential To Export Promotion Council for Handicrafts © 2005 Frost & Sullivan
with a growth rate of 22.3% in 2003 and Denmark (US $ 24 Million) with a growth rate of 17% in 2003.
d) However viewed as a trading block the European Union is the world’s largest
importer of wood and wooden products. This is attributed to the fact that European Union’s wood supply is not sufficient for its demand which keeps on increasing due to the appeal that wood and wooden products hold in the minds of the European Union consumers. Therefore, to meet the demand the manufacturers of wooden products in the EU mainly have to resort to use imported wood. Secondly the higher labor costs in Western Europe, makes it impossible for the domestic manufacturers to compete with cheap products from Asian and Eastern European countries. As a result EU countries have no option but to import large volumes of woodwork.
C h a r t 3 . 1 4 . 1 ( a )
Woodwork – Market Shares of Top Ten Importing Nations (1999-03)
SHARE IN TOTAL WORLD IMPORTS (TOP-10 IMPORTING NATIONS)
WOODWORK
38.4%
11.0%
6.0%
6.3%
5.8%
5.1%
3.0%
2.6%
2.4%
1.8%
40.0%
11.3%
5.5%
7.1%
5.4%
4.8%
3.0%
2.2%
2.1%
1.7%
38.7%
11.3%
5.9% 8.3%
5.4%
4.6%
2.7%
2.1%
2.1%
1.7%
38.1%
11.4%
6.3% 8.8%
5.2%
4.7%
2.7%
2.3%
2.0%
1.6%
36.2%
11.3%
7.4%
8.3%
5.3%
4.9%
2.7%
2.3%
2.2%
1.6%
USA,PR,USVI JAPAN HONG KONG GERM ANY UNTD
KINGDOM
FRANCE CANADA BELGIUM ITALY NETHERLANDS
2003 2002 2001
2000 1999
Source: Frost & Sullivan
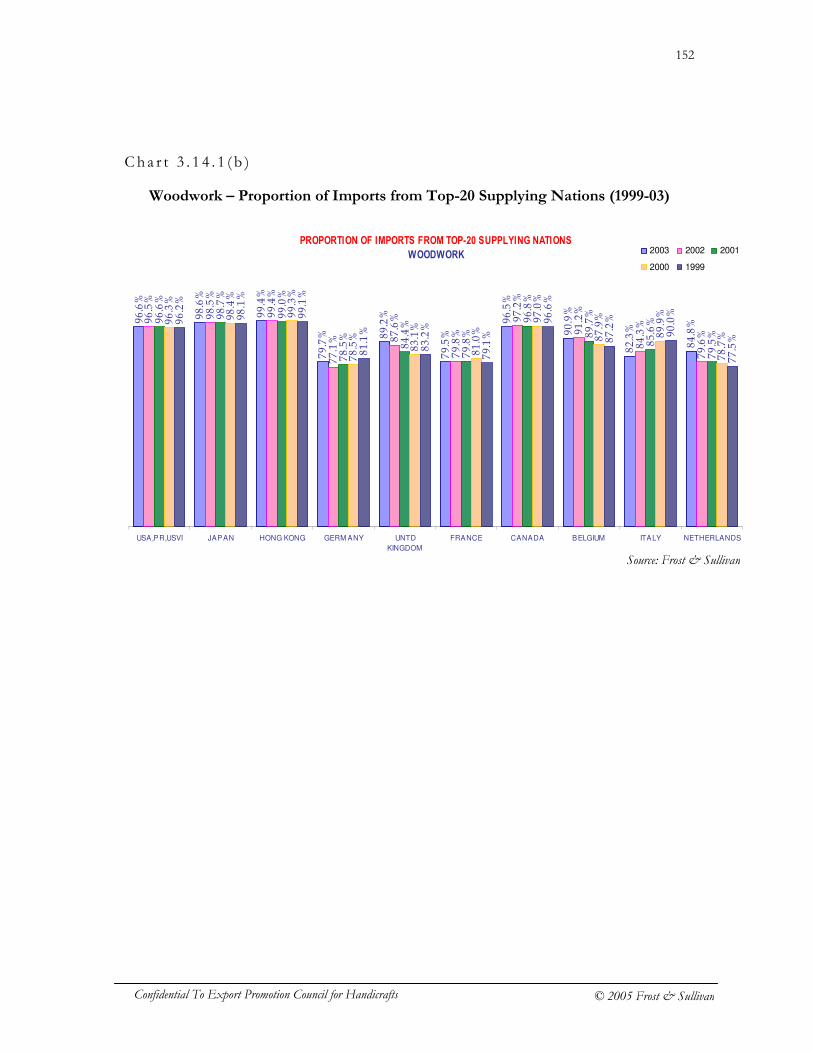
152
Confidential To Export Promotion Council for Handicrafts © 2005 Frost & Sullivan
Cha r t 3 . 1 4 . 1 ( b )
Woodwork – Proportion of Imports from Top-20 Supplying Nations (1999-03)
PROPORTION OF IMPORTS FROM TOP-20 SUPPLYING NATIONS
WOODWORK
96.6%
98.6%
99.4%
79.7% 89.2%
79.5%
96.5%
90.9%
82.3%
84.8%
96.5%
98.5%
99.4%
77.1% 87.6%
79.8%
97.2%
91.2%
84.3%
79.6%
96.6%
98.7%
99.0%
78.5%
84.4%
79.8%
96.8%
89.7%
85.6%
79.5%
96.3%
98.4%
99.3%
78.5%
83.1%
81.0%
97.0%
87.9%
89.9%
78.7%
96.2%
98.1%
99.1%
81.1%
83.2%
79.1%
96.6%
87.2%
90.0%
77.5%
USA,PR,USVI JAPAN HONG KONG GERM ANY UNTD
KINGDOM
FRANCE CANADA BELGIUM ITALY NETHERLANDS
2003 2002 2001
2000 1999
Source: Frost & Sullivan
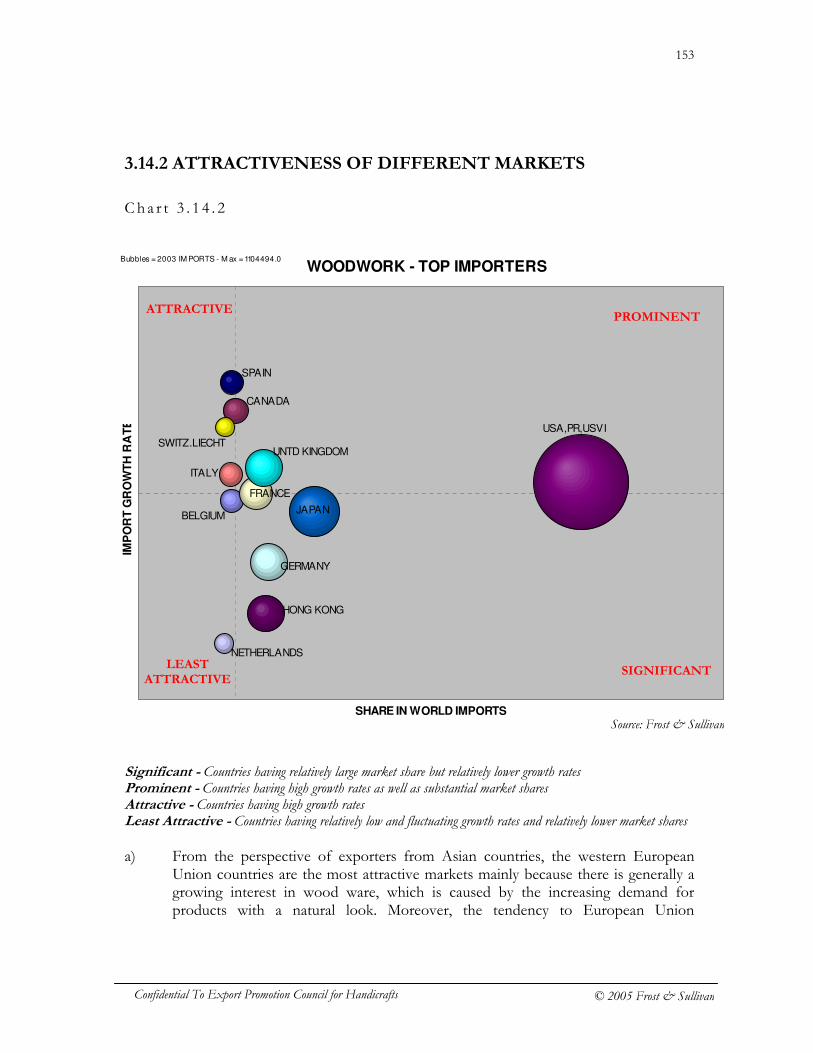
153
Confidential To Export Promotion Council for Handicrafts © 2005 Frost & Sullivan
3.14.2 ATTRACTIVENESS OF DIFFERENT MARKETS
Cha r t 3 . 1 4 . 2
Significant - Countries having relatively large market share but relatively lower growth rates Prominent - Countries having high growth rates as well as substantial market shares Attractive - Countries having high growth rates Least Attractive - Countries having relatively low and fluctuating growth rates and relatively lower market shares a) From the perspective of exporters from Asian countries, the western European
Union countries are the most attractive markets mainly because there is generally a growing interest in wood ware, which is caused by the increasing demand for products with a natural look. Moreover, the tendency to European Union
WOODWORK - TOP IMPORTERS
BELGIUM
CANADA
FRANCE
GERMANY
HONG KONG
ITALY
JAPAN
NETHERLANDS
SPAIN
SWITZ.LIECHT UNTD KINGDOM
USA,PR,USVI
SHARE IN WORLD IMPORTS
IMP
OR
T G
RO
WT
H R
AT
E
Bubbles = 2003 IM PORTS - M ax = 1104494.0
PROMINENT ATTRACTIVE
SIGNIFICANT LEAST
ATTRACTIVE
Source: Frost & Sullivan
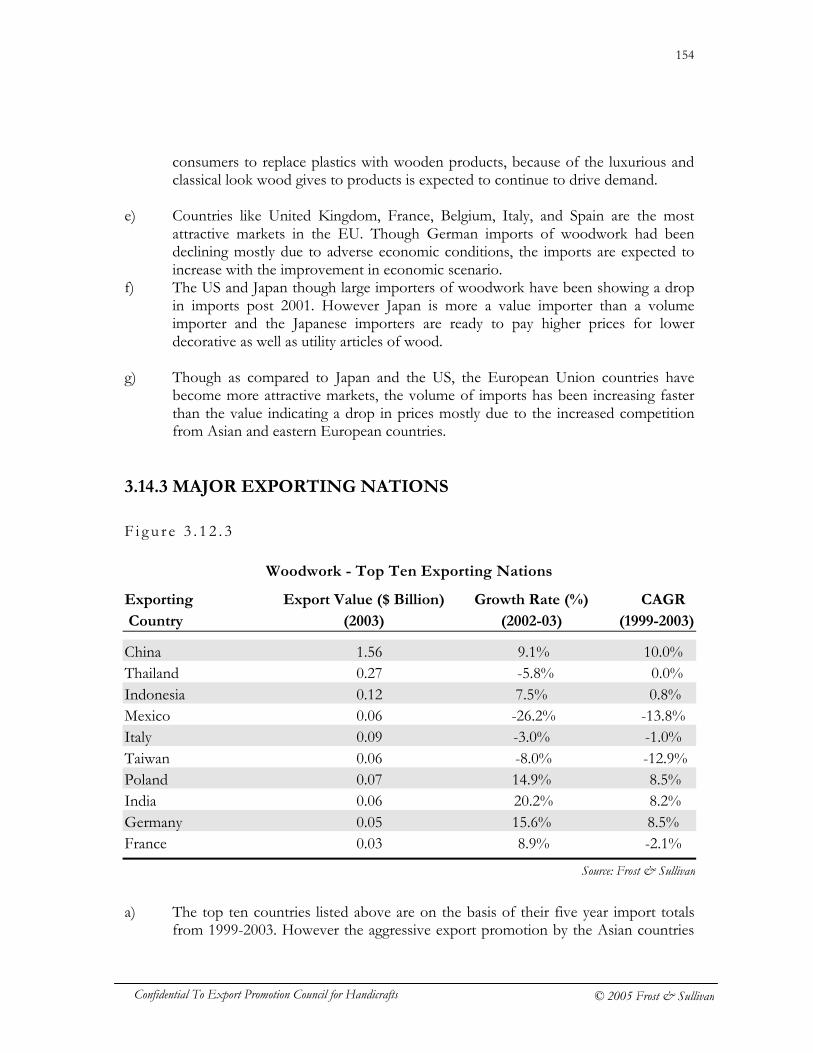
154
Confidential To Export Promotion Council for Handicrafts © 2005 Frost & Sullivan
consumers to replace plastics with wooden products, because of the luxurious and classical look wood gives to products is expected to continue to drive demand.
e) Countries like United Kingdom, France, Belgium, Italy, and Spain are the most
attractive markets in the EU. Though German imports of woodwork had been declining mostly due to adverse economic conditions, the imports are expected to increase with the improvement in economic scenario.
f) The US and Japan though large importers of woodwork have been showing a drop in imports post 2001. However Japan is more a value importer than a volume importer and the Japanese importers are ready to pay higher prices for lower decorative as well as utility articles of wood.
g) Though as compared to Japan and the US, the European Union countries have
become more attractive markets, the volume of imports has been increasing faster than the value indicating a drop in prices mostly due to the increased competition from Asian and eastern European countries.
3.14.3 MAJOR EXPORTING NATIONS
F i g u r e 3 . 1 2 . 3
Woodwork - Top Ten Exporting Nations
Exporting Export Value ($ Billion) Growth Rate (%) CAGR
Country (2003) (2002-03) (1999-2003)
China 1.56 9.1% 10.0% Thailand 0.27 -5.8% 0.0% Indonesia 0.12 7.5% 0.8% Mexico 0.06 -26.2% -13.8% Italy 0.09 -3.0% -1.0% Taiwan 0.06 -8.0% -12.9% Poland 0.07 14.9% 8.5% India 0.06 20.2% 8.2% Germany 0.05 15.6% 8.5% France 0.03 8.9% -2.1%
a) The top ten countries listed above are on the basis of their five year import totals
from 1999-2003. However the aggressive export promotion by the Asian countries
Source: Frost & Sullivan
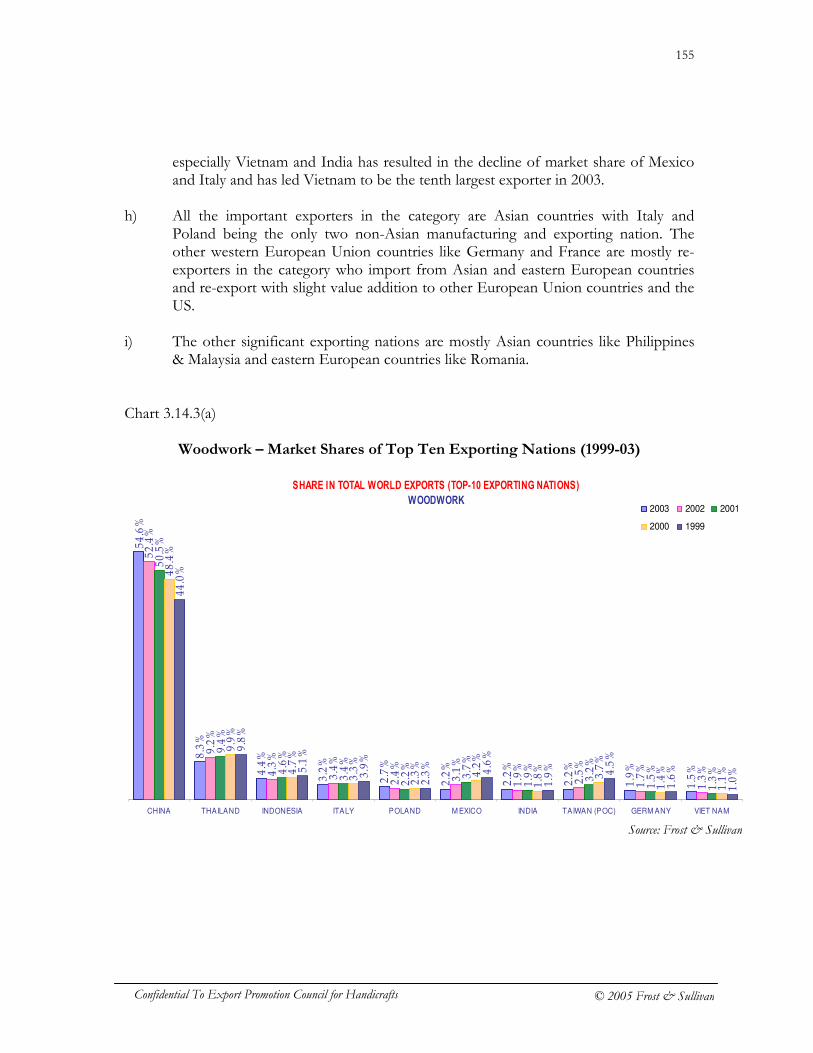
155
Confidential To Export Promotion Council for Handicrafts © 2005 Frost & Sullivan
especially Vietnam and India has resulted in the decline of market share of Mexico and Italy and has led Vietnam to be the tenth largest exporter in 2003.
h) All the important exporters in the category are Asian countries with Italy and
Poland being the only two non-Asian manufacturing and exporting nation. The other western European Union countries like Germany and France are mostly re-exporters in the category who import from Asian and eastern European countries and re-export with slight value addition to other European Union countries and the US.
i) The other significant exporting nations are mostly Asian countries like Philippines
& Malaysia and eastern European countries like Romania. Chart 3.14.3(a)
Woodwork – Market Shares of Top Ten Exporting Nations (1999-03)
SHARE IN TOTAL WORLD EXPORTS (TOP-10 EXPORTING NATIONS)
WOODWORK
54.6%
8.3%
4.4%
3.2%
2.7%
2.2%
2.2%
2.2%
1.9%
1.5%
52.4%
9.2%
4.3%
3.4%
2.4%
3.1%
1.9%
2.5%
1.7%
1.3%
50.5%
9.4%
4.6%
3.4%
2.2%
3.7%
1.9%
3.2%
1.5%
1.3%
48.4%
9.9%
4.7%
3.3%
2.3%
4.2%
1.8%
3.7%
1.4%
1.1%
44.0%
9.8%
5.1%
3.9%
2.3%
4.6%
1.9% 4.5%
1.6%
1.0%
CHINA THAILAND INDONESIA ITALY POLAND M EXICO INDIA TAIWAN (POC) GERM ANY VIET NAM
2003 2002 2001
2000 1999
Source: Frost & Sullivan
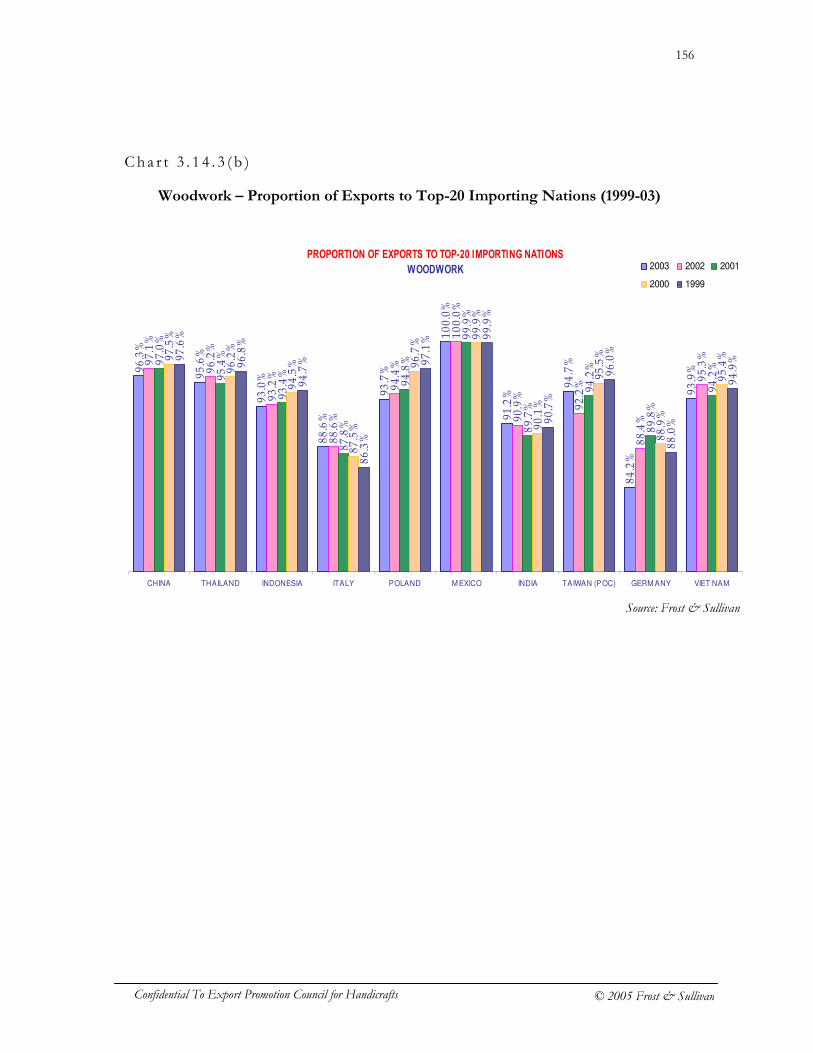
156
Confidential To Export Promotion Council for Handicrafts © 2005 Frost & Sullivan
Cha r t 3 . 1 4 . 3 ( b )
Woodwork – Proportion of Exports to Top-20 Importing Nations (1999-03)
PROPORTION OF EXPORTS TO TOP-20 IMPORTING NATIONS
WOODWORK
96.3%
95.6%
93.0%
88.6%
93.7%
100.0%
91.2%
94.7%
84.2%
93.9%
97.1%
96.2%
93.2%
88.6%
94.4%
100.0%
90.9%
92.2%
88.4%
95.3%
97.0%
95.4%
93.4%
87.8%
94.8%
99.9%
89.7%
94.2%
89.8%
94.2%
97.5%
96.2%
94.5%
87.5%
96.7%
99.9%
90.1%
95.5%
88.9%
95.4%97.6%
96.8%
94.7%
86.3%
97.1%
99.9%
90.7%
96.0%
88.0%
94.9%
CHINA THAILAND INDONESIA ITALY POLAND M EXICO INDIA TAIWAN (POC) GERM ANY VIET NAM
2003 2002 2001
2000 1999
Source: Frost & Sullivan
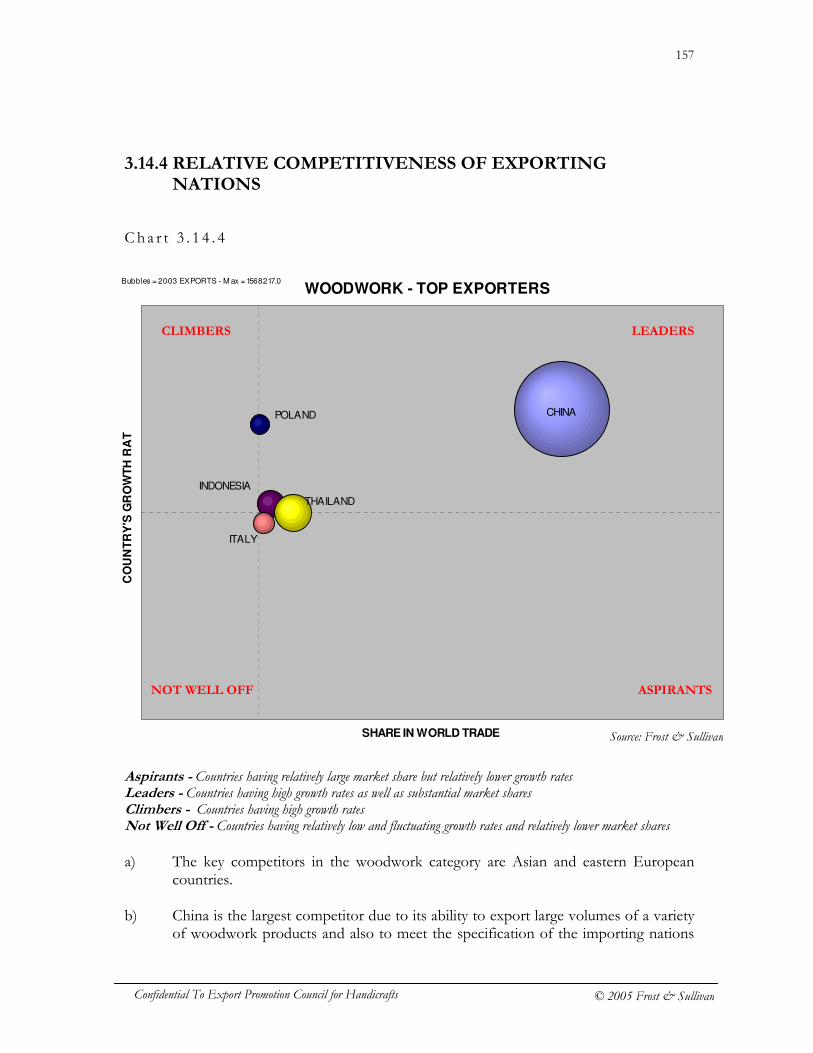
157
Confidential To Export Promotion Council for Handicrafts © 2005 Frost & Sullivan
3.14.4 RELATIVE COMPETITIVENESS OF EXPORTING NATIONS
C h a r t 3 . 1 4 . 4
Aspirants - Countries having relatively large market share but relatively lower growth rates Leaders - Countries having high growth rates as well as substantial market shares Climbers - Countries having high growth rates Not Well Off - Countries having relatively low and fluctuating growth rates and relatively lower market shares
a) The key competitors in the woodwork category are Asian and eastern European
countries.
b) China is the largest competitor due to its ability to export large volumes of a variety of woodwork products and also to meet the specification of the importing nations
WOODWORK - TOP EXPORTERS
CHINA
INDONESIA
ITALY
POLAND
THAILAND
SHARE IN WORLD TRADE
CO
UN
TR
Y'S
GR
OW
TH
RA
TE
Bubbles = 2003 EXPORTS - M ax = 1568217.0
LEADERS CLIMBERS
ASPIRANTS NOT WELL OFF
Source: Frost & Sullivan
158
Confidential To Export Promotion Council for Handicrafts © 2005 Frost & Sullivan
with regard to design as well as quality. More over China over the past 2-3 years has a gained a solid foothold in the European Union and US markets.
c) The other Asian countries that are significant competitors are mainly Thailand and
Indonesia who apart from having the resources in terms of raw material and skilled labor also have been actively promoting their products through various industry as well as market development initiatives.
d) However the Asian country that has slowly emerged as the most significant
competitor is Vietnam, who with Government and NGO support of importing nations like Japan has been able to leverage its sector resources to its fullest potential and combined with the promotion support has caused its market share in the category to increase from 1% to almost 2% in 2004 and is continuing to double it growth rate.
e) Though both Philippines and Malaysia had been showing declining growth rates
since 2000, the increased government support to the wooden handicrafts manufacturers and artisans has led to improved production, distribution and promotion leading to a revival of these traditional sectors in these countries and an enhancement of their export potential.
f) Among the non-Asian Exporters Poland is the most significant due to its
established reputation and distribution network in the European Union and secondly the country enjoys short transport distances to the EU markets, enabling it to supply at competitive prices. Furthermore, it has a suitable supply hardwood which will continue to sustain its export of woodwork.
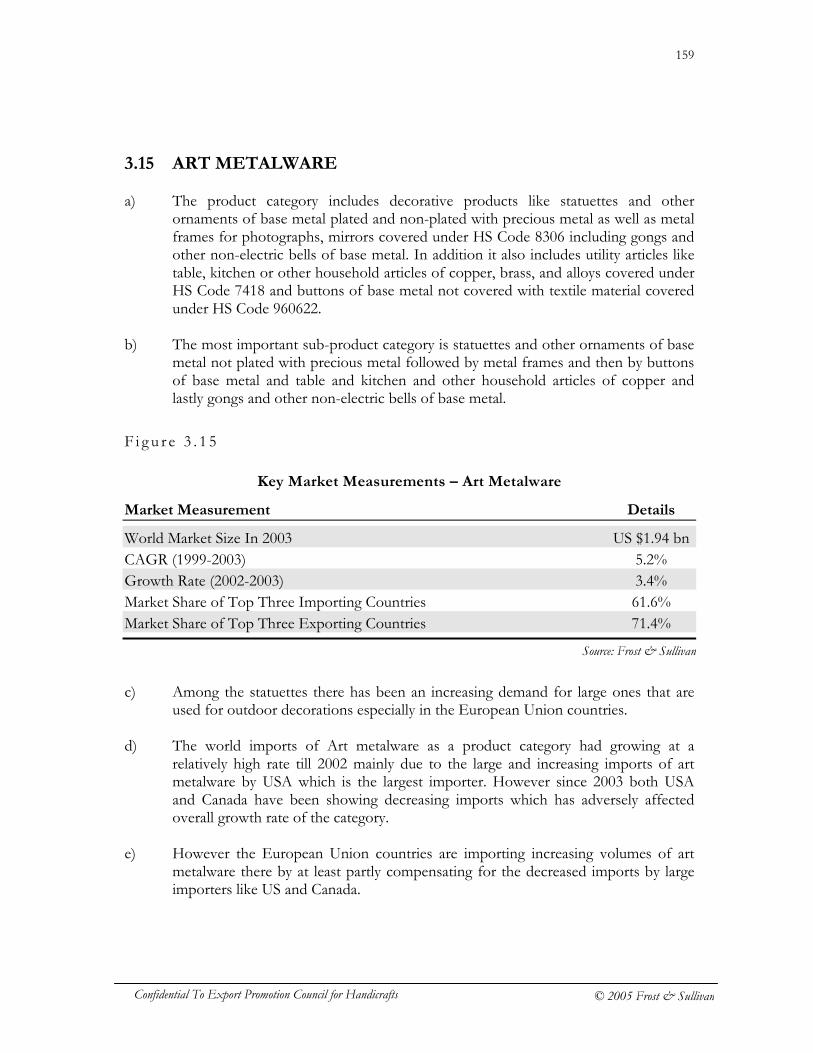
159
Confidential To Export Promotion Council for Handicrafts © 2005 Frost & Sullivan
3.15 ART METALWARE a) The product category includes decorative products like statuettes and other
ornaments of base metal plated and non-plated with precious metal as well as metal frames for photographs, mirrors covered under HS Code 8306 including gongs and other non-electric bells of base metal. In addition it also includes utility articles like table, kitchen or other household articles of copper, brass, and alloys covered under HS Code 7418 and buttons of base metal not covered with textile material covered under HS Code 960622.
b) The most important sub-product category is statuettes and other ornaments of base
metal not plated with precious metal followed by metal frames and then by buttons of base metal and table and kitchen and other household articles of copper and lastly gongs and other non-electric bells of base metal.
F i g u r e 3 . 1 5
Key Market Measurements – Art Metalware
Market Measurement Details
World Market Size In 2003 US $1.94 bn CAGR (1999-2003) 5.2% Growth Rate (2002-2003) 3.4% Market Share of Top Three Importing Countries 61.6% Market Share of Top Three Exporting Countries 71.4%
c) Among the statuettes there has been an increasing demand for large ones that are
used for outdoor decorations especially in the European Union countries.
d) The world imports of Art metalware as a product category had growing at a relatively high rate till 2002 mainly due to the large and increasing imports of art metalware by USA which is the largest importer. However since 2003 both USA and Canada have been showing decreasing imports which has adversely affected overall growth rate of the category.
e) However the European Union countries are importing increasing volumes of art
metalware there by at least partly compensating for the decreased imports by large importers like US and Canada.
Source: Frost & Sullivan
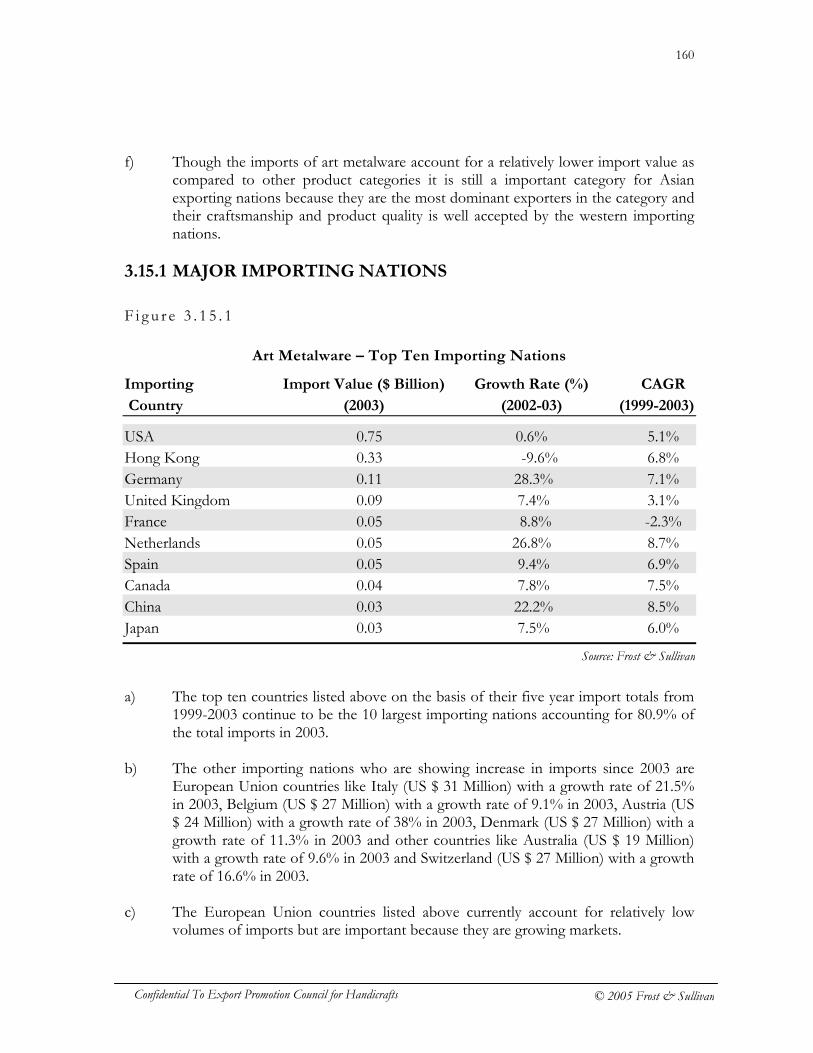
160
Confidential To Export Promotion Council for Handicrafts © 2005 Frost & Sullivan
f) Though the imports of art metalware account for a relatively lower import value as compared to other product categories it is still a important category for Asian exporting nations because they are the most dominant exporters in the category and their craftsmanship and product quality is well accepted by the western importing nations.
3.15.1 MAJOR IMPORTING NATIONS
F i g u r e 3 . 1 5 . 1
Art Metalware – Top Ten Importing Nations
Importing Import Value ($ Billion) Growth Rate (%) CAGR
Country (2003) (2002-03) (1999-2003)
USA 0.75 0.6% 5.1% Hong Kong 0.33 -9.6% 6.8% Germany 0.11 28.3% 7.1% United Kingdom 0.09 7.4% 3.1% France 0.05 8.8% -2.3% Netherlands 0.05 26.8% 8.7% Spain 0.05 9.4% 6.9% Canada 0.04 7.8% 7.5% China 0.03 22.2% 8.5% Japan 0.03 7.5% 6.0%
a) The top ten countries listed above on the basis of their five year import totals from
1999-2003 continue to be the 10 largest importing nations accounting for 80.9% of the total imports in 2003.
b) The other importing nations who are showing increase in imports since 2003 are
European Union countries like Italy (US $ 31 Million) with a growth rate of 21.5% in 2003, Belgium (US $ 27 Million) with a growth rate of 9.1% in 2003, Austria (US $ 24 Million) with a growth rate of 38% in 2003, Denmark (US $ 27 Million) with a growth rate of 11.3% in 2003 and other countries like Australia (US $ 19 Million) with a growth rate of 9.6% in 2003 and Switzerland (US $ 27 Million) with a growth rate of 16.6% in 2003.
c) The European Union countries listed above currently account for relatively low
volumes of imports but are important because they are growing markets.
Source: Frost & Sullivan
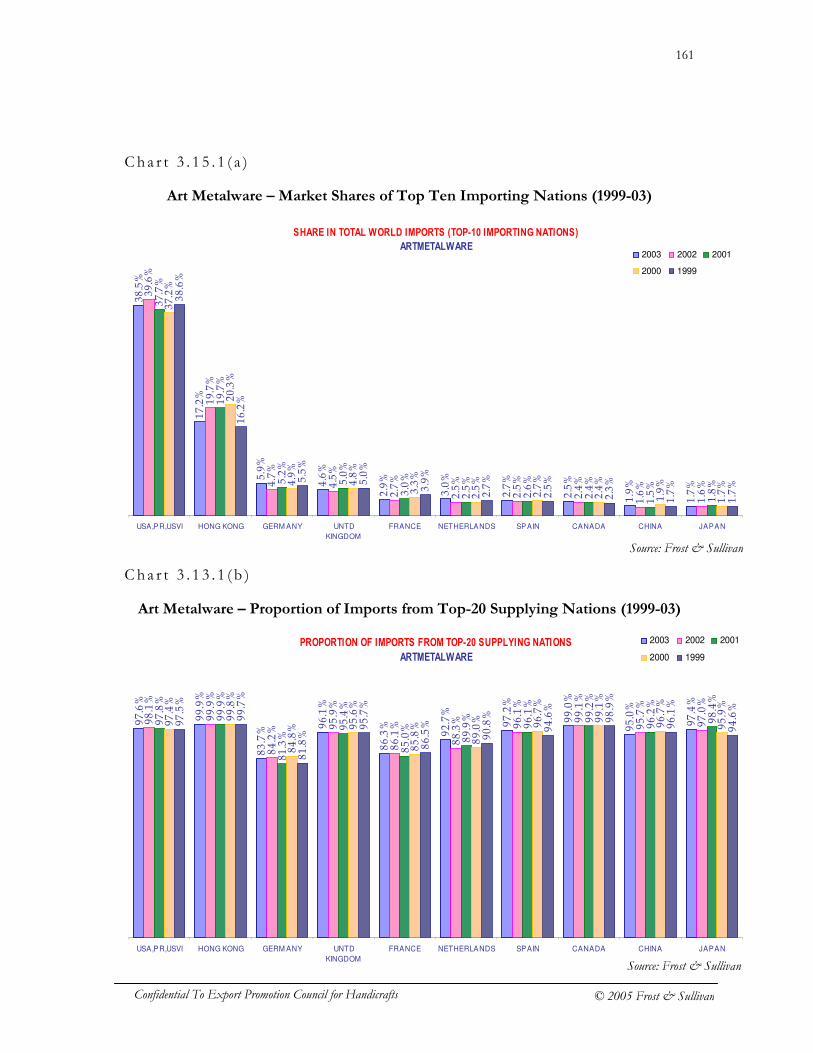
161
Confidential To Export Promotion Council for Handicrafts © 2005 Frost & Sullivan
Cha r t 3 . 1 5 . 1 ( a )
Art Metalware – Market Shares of Top Ten Importing Nations (1999-03)
Cha r t 3 . 1 3 . 1 ( b )
Art Metalware – Proportion of Imports from Top-20 Supplying Nations (1999-03)
SHARE IN TOTAL WORLD IMPORTS (TOP-10 IMPORTING NATIONS)
ARTMETALWARE
38.5%
17.2%
5.9%
4.6%
2.9%
3.0%
2.7%
2.5%
1.9%
1.7%
39.6%
19.7%
4.7%
4.5%
2.7%
2.5%
2.5%
2.4%
1.6%
1.6%
37.7%
19.7%
5.2%
5.0%
3.0%
2.5%
2.6%
2.4%
1.5%
1.8%
37.2%
20.3%
4.9%
4.8%
3.3%
2.5%
2.7%
2.4%
1.9%
1.7%
38.6%
16.2%
5.5%
5.0%
3.9%
2.7%
2.5%
2.3%
1.7%
1.7%
USA,PR,USVI HONG KONG GERM ANY UNTD
KINGDOM
FRANCE NETHERLANDS SPAIN CANADA CHINA JAPAN
2003 2002 2001
2000 1999
PROPORTION OF IMPORTS FROM TOP-20 SUPPLYING NATIONS
ARTMETALWARE
97.6%
99.9%
83.7%
96.1%
86.3%
92.7%
97.2%
99.0%
95.0%
97.4%
98.1%
99.9%
84.2%
95.9%
86.1%
88.3%
96.1%
99.1%
95.7%
97.0%
97.8%
99.9%
81.3%
95.4%
85.0%
89.9%
96.1%
99.2%
96.2%
98.4%
97.4%
99.8%
84.8% 95.6%
85.8%
89.0%
96.7%
99.1%
96.7%
95.9%
97.5%
99.7%
81.8%
95.7%
86.5%
90.8%
94.6%
98.9%
96.1%
94.6%
USA,PR,USVI HONG KONG GERM ANY UNTD
KINGDOM
FRANCE NETHERLANDS SPAIN CANADA CHINA JAPAN
2003 2002 2001
2000 1999
Source: Frost & Sullivan
Source: Frost & Sullivan
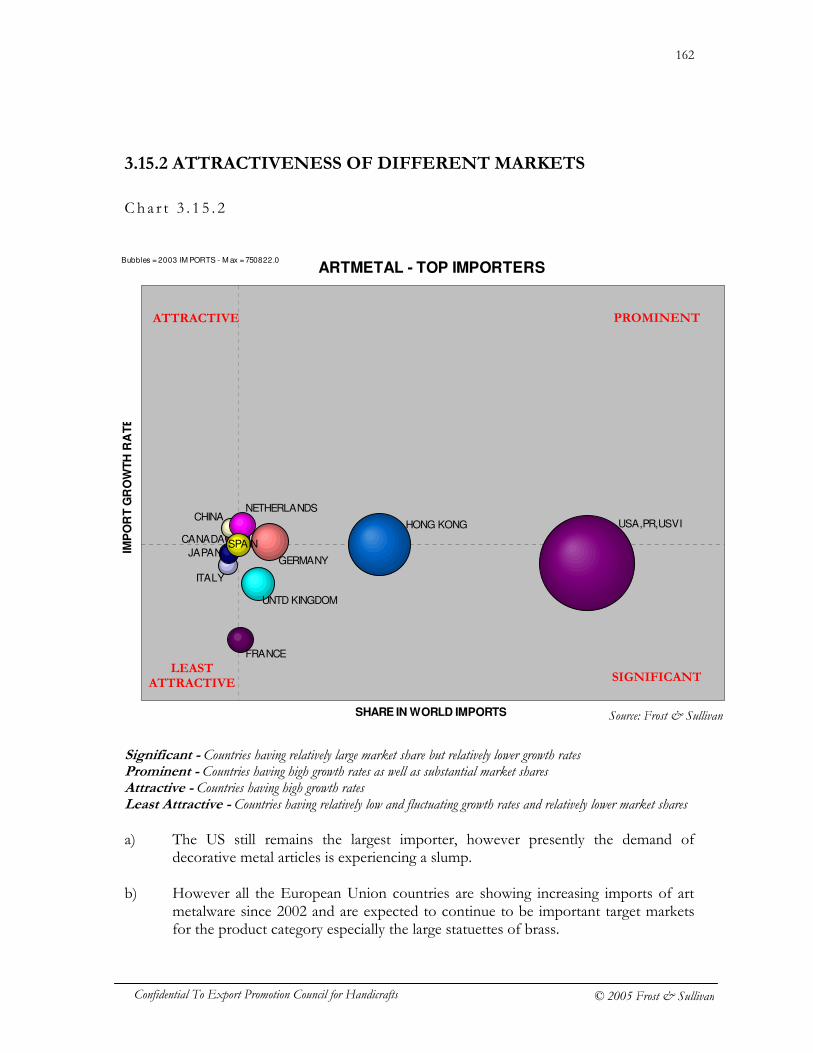
162
Confidential To Export Promotion Council for Handicrafts © 2005 Frost & Sullivan
3.15.2 ATTRACTIVENESS OF DIFFERENT MARKETS
Cha r t 3 . 1 5 . 2
Significant - Countries having relatively large market share but relatively lower growth rates Prominent - Countries having high growth rates as well as substantial market shares Attractive - Countries having high growth rates Least Attractive - Countries having relatively low and fluctuating growth rates and relatively lower market shares a) The US still remains the largest importer, however presently the demand of
decorative metal articles is experiencing a slump.
b) However all the European Union countries are showing increasing imports of art metalware since 2002 and are expected to continue to be important target markets for the product category especially the large statuettes of brass.
ARTMETAL - TOP IMPORTERS
CANADA
CHINA
FRANCE
GERMANY
HONG KONG
ITALY
JAPAN
NETHERLANDS
SPAIN
UNTD KINGDOM
USA,PR,USVI
SHARE IN WORLD IMPORTS
IMP
OR
T G
RO
WT
H R
AT
E
Bubbles = 2003 IM PORTS - M ax = 750822.0
PROMINENT ATTRACTIVE
SIGNIFICANT LEAST
ATTRACTIVE
Source: Frost & Sullivan
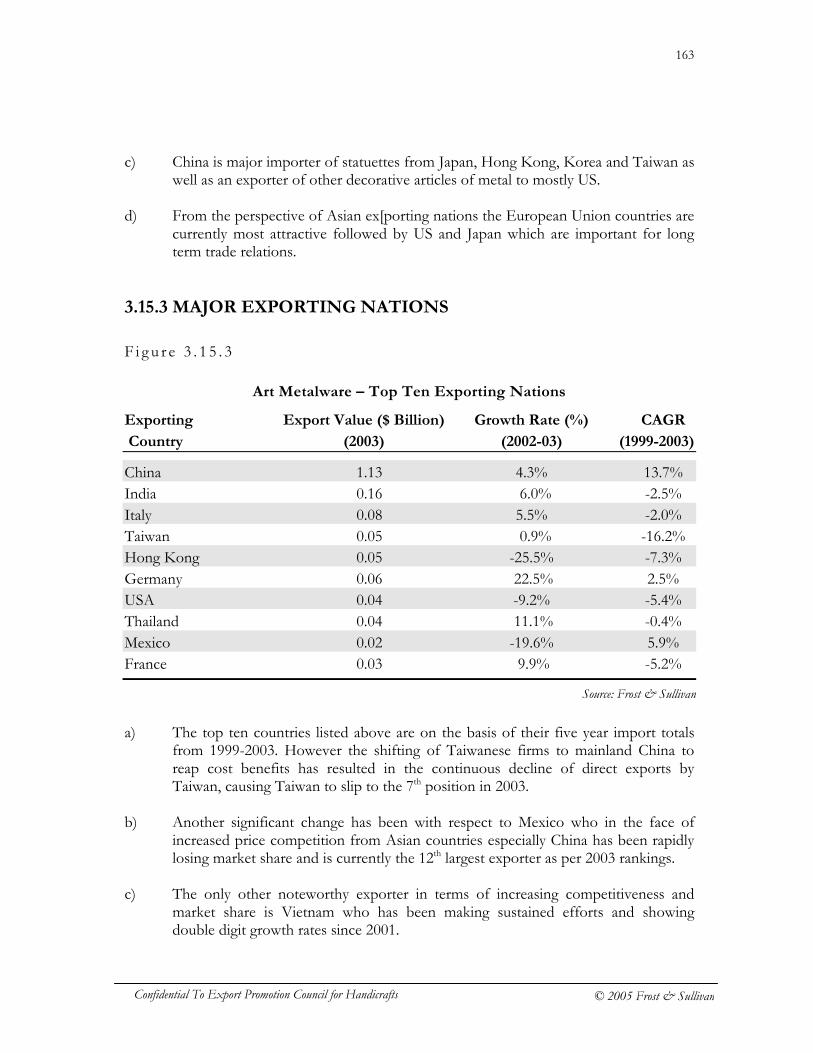
163
Confidential To Export Promotion Council for Handicrafts © 2005 Frost & Sullivan
c) China is major importer of statuettes from Japan, Hong Kong, Korea and Taiwan as well as an exporter of other decorative articles of metal to mostly US.
d) From the perspective of Asian ex[porting nations the European Union countries are
currently most attractive followed by US and Japan which are important for long term trade relations.
3.15.3 MAJOR EXPORTING NATIONS
F i g u r e 3 . 1 5 . 3
Art Metalware – Top Ten Exporting Nations
Exporting Export Value ($ Billion) Growth Rate (%) CAGR
Country (2003) (2002-03) (1999-2003)
China 1.13 4.3% 13.7% India 0.16 6.0% -2.5% Italy 0.08 5.5% -2.0% Taiwan 0.05 0.9% -16.2% Hong Kong 0.05 -25.5% -7.3% Germany 0.06 22.5% 2.5% USA 0.04 -9.2% -5.4% Thailand 0.04 11.1% -0.4% Mexico 0.02 -19.6% 5.9% France 0.03 9.9% -5.2%
a) The top ten countries listed above are on the basis of their five year import totals
from 1999-2003. However the shifting of Taiwanese firms to mainland China to reap cost benefits has resulted in the continuous decline of direct exports by Taiwan, causing Taiwan to slip to the 7th position in 2003.
b) Another significant change has been with respect to Mexico who in the face of
increased price competition from Asian countries especially China has been rapidly losing market share and is currently the 12th largest exporter as per 2003 rankings.
c) The only other noteworthy exporter in terms of increasing competitiveness and
market share is Vietnam who has been making sustained efforts and showing double digit growth rates since 2001.
Source: Frost & Sullivan
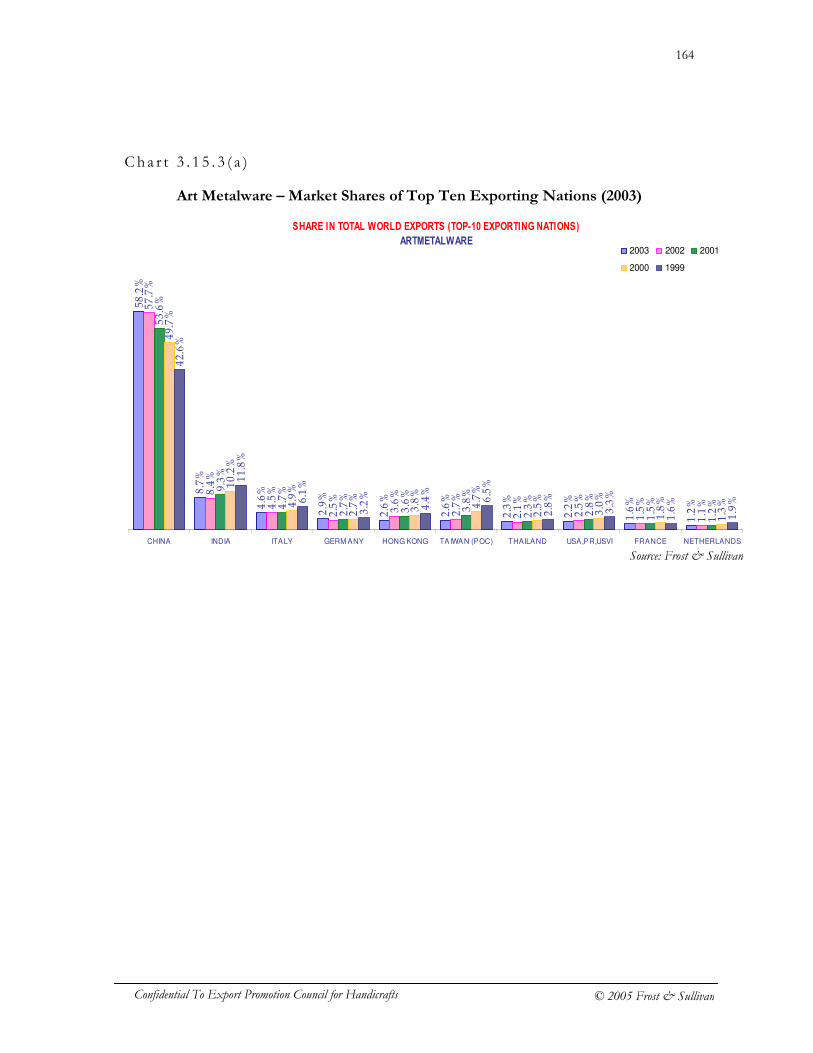
164
Confidential To Export Promotion Council for Handicrafts © 2005 Frost & Sullivan
Cha r t 3 . 1 5 . 3 ( a )
Art Metalware – Market Shares of Top Ten Exporting Nations (2003)
SHARE IN TOTAL WORLD EXPORTS (TOP-10 EXPORTING NATIONS)
ARTMETALWARE
58.2%
8.7%
4.6%
2.9%
2.6%
2.6%
2.3%
2.2%
1.6%
1.2%
57.7%
8.4%
4.5%
2.5%
3.6%
2.7%
2.1%
2.5%
1.5%
1.1%
53.6%
9.3%
4.7%
2.7%
3.6%
3.8%
2.3%
2.8%
1.5%
1.2%
49.7%
10.2%
4.9%
2.7%
3.8%
4.7%
2.5%
3.0%
1.8%
1.3%
42.6%
11.8%
6.1%
3.2%
4.4%
6.5%
2.8%
3.3%
1.6%
1.9%
CHINA INDIA ITALY GERM ANY HONG KONG TAIWAN (POC) THAILAND USA,PR,USVI FRANCE NETHERLANDS
2003 2002 2001
2000 1999
Source: Frost & Sullivan
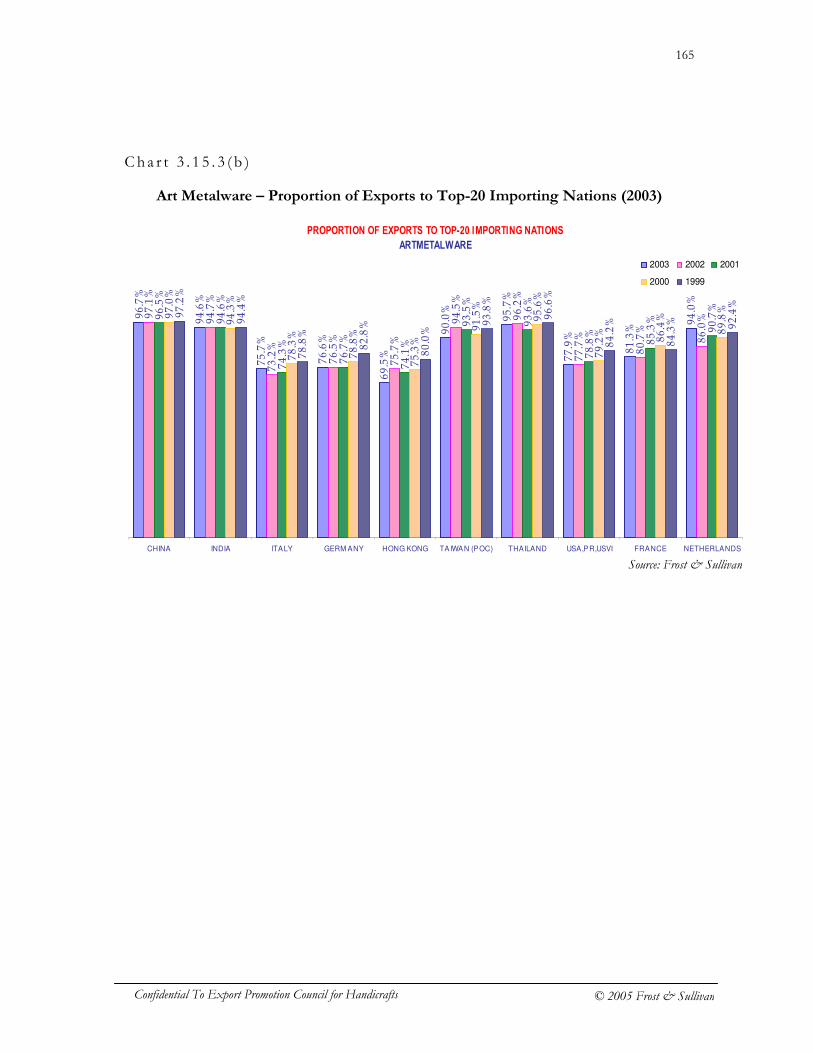
165
Confidential To Export Promotion Council for Handicrafts © 2005 Frost & Sullivan
Cha r t 3 . 1 5 . 3 ( b )
Art Metalware – Proportion of Exports to Top-20 Importing Nations (2003)
PROPORTION OF EXPORTS TO TOP-20 IMPORTING NATIONS
ARTMETALWARE
96.7%
94.6%
75.7%
76.6%
69.5%
90.0%
95.7%
77.9%
81.3%
94.0%
97.1%
94.7%
73.2%
76.5%
75.7%
94.5%
96.2%
77.7%
80.7%
86.0%96.5%
94.6%
74.3%
76.7%
74.1%
93.5%
93.6%
78.8%
85.3%
90.7%
97.0%
94.3%
78.3%
78.8%
75.3%
91.5%
95.6%
79.2%
86.4%
89.8%
97.2%
94.4%
78.8%
82.8%
80.0%
93.8%
96.6%
84.2%
84.3% 92.4%
CHINA INDIA ITALY GERM ANY HONG KONG TAIWAN (POC) THAILAND USA,PR,USVI FRANCE NETHERLANDS
2003 2002 2001
2000 1999
Source: Frost & Sullivan
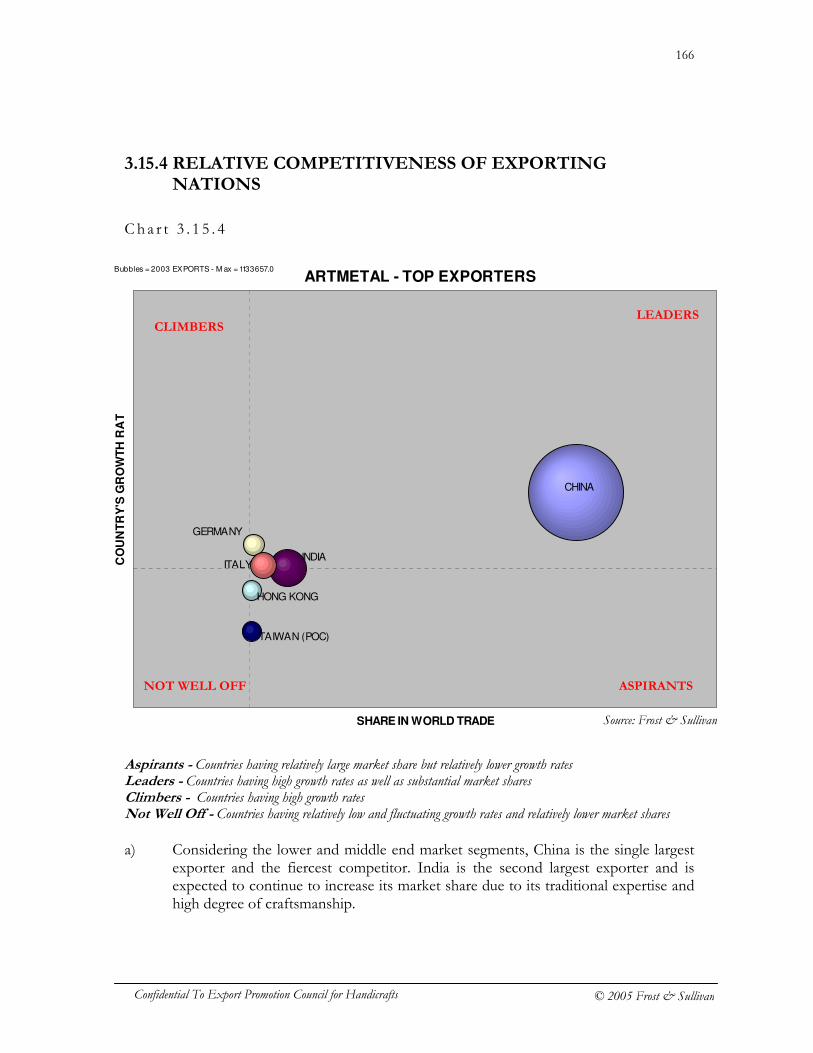
166
Confidential To Export Promotion Council for Handicrafts © 2005 Frost & Sullivan
3.15.4 RELATIVE COMPETITIVENESS OF EXPORTING NATIONS
Cha r t 3 . 1 5 . 4
Aspirants - Countries having relatively large market share but relatively lower growth rates Leaders - Countries having high growth rates as well as substantial market shares Climbers - Countries having high growth rates Not Well Off - Countries having relatively low and fluctuating growth rates and relatively lower market shares a) Considering the lower and middle end market segments, China is the single largest
exporter and the fiercest competitor. India is the second largest exporter and is expected to continue to increase its market share due to its traditional expertise and high degree of craftsmanship.
ARTMETAL - TOP EXPORTERS
CHINA
GERMANY
HONG KONG
INDIA ITALY
TAIWAN (POC)
SHARE IN WORLD TRADE
CO
UN
TR
Y'S
GR
OW
TH
RA
TE
Bubbles = 2003 EXPORTS - M ax = 1133657.0
LEADERS CLIMBERS
ASPIRANTS NOT WELL OFF
Source: Frost & Sullivan
167
Confidential To Export Promotion Council for Handicrafts © 2005 Frost & Sullivan
b) Though Italy is the third largest exporter its exports are mostly in the high-end category were in it has reputed manufacturers like Alessi who are specialized in high quality and design.
c) The only other exporting nations who are competitive are Vietnam and Malaysian
exporters in the case of decorative articles made of Pewter.
168
Confidential To Export Promotion Council for Handicrafts © 2005 Frost & Sullivan
SECTION 4 – PROFILE OF TOP IMPORTING NATIONS
4.1 OVERVIEW 4.1.1 SPECIFIC OBJECTIVES a) To get a clear understanding of current market size and market potential for crafts
and decorative products for major importing countries.
b) Insights into key market factors and characteristics that affect or influence the imports and domestic sales of crafts and decorative products in key importing countries so that the same can be then be used to formulate effective market development and market penetration strategies. This would include
� Market and customer preferences, perceptions and trends including specific
product trends � Key factors driving demand including the impact of seasonal and cultural
factors c) To establish competitive scenario for each product category and determine market
presence of competing countries by product categories in terms of market shares and there by determine scope for market penetration.
d) Market structure of importing countries including channels of distribution e) Other factors like market access requirements with the focus being non-tariff
barriers and other restrains if any that can adversely affect exports or sale of crafts and decorative products in target markets.
f) In sum, establish a detailed profile of the target market for insights in market
planning including direct marketing and other export decisions.
169
Confidential To Export Promotion Council for Handicrafts © 2005 Frost & Sullivan
4.1.2 MARKET EVALUATION AND PROFILING APPROACH AND METHODOLOGY
a) Though the absolute value of imports is an indicator of market size it does not give
a clear picture as to the market potential for long term export planning. As such in addition to ascertaining the market size in terms of absolute import value Frost & Sullivan has used a combination of economic and demographic factors to establish the long term market attractiveness to aid export planning.
b) More over the purchase of handicrafts and other decoratives is generally for gifting purpose or as home and personal accessories and as such is considered as being non-essential or luxury purchases. This results in the purchasing of it being greatly dependent on health of the economy and the resilience of consumer spending. As such Frost & Sullivan has considered � Economic factors like overall economic scenario and trends (including
factors like GDP, disposable incomes, consumer confidence).s
c) In addition Frost & Sullivan has also considered other important factors determining long term market attractiveness like � Demographic factors (including population, population growth rates,
population composition etc) � Social and cultural factors (including increase in number of households,
attitudes towards home and self, seasonal purchase linked to social and cultural factors like festive occasions etc)
� Other trends and development
d) To establish the competitive scenario for each product category and there by
determine scope for market penetration Frost & Sullivan has used the degree of market concentration where in the total market share held by the top 3 supplying countries for each product category is used as an indicator to determines the extent of fragmentation of a market and the difficulty of penetration into market for that product segment for e.g. a 65% Market Share of Top 3 supplying countries implies that the top three players dominate and control the market, thereby giving them a substantial bargaining power over other participants. Whereas a 45% Market Share of Top 3 supplying countries indicates that though the market is fragmented and the number of smaller competitors may be higher there still exist avenues for penetrating or creating a niche.
170
Confidential To Export Promotion Council for Handicrafts © 2005 Frost & Sullivan
e) Lastly, to obtain other important details like market and customer preferences, perceptions, channels of distribution, market trends and characteristics and non- tariff barriers, Frost & Sullivan has used a combination of primary and secondary research techniques to obtain the required data. The data obtained during primary interviews with key market participants including major retailers, importers, distributors and associations was cross verified with authentic secondary sources of information including published data regarding the larger market of gifts and decoratives and housewares.
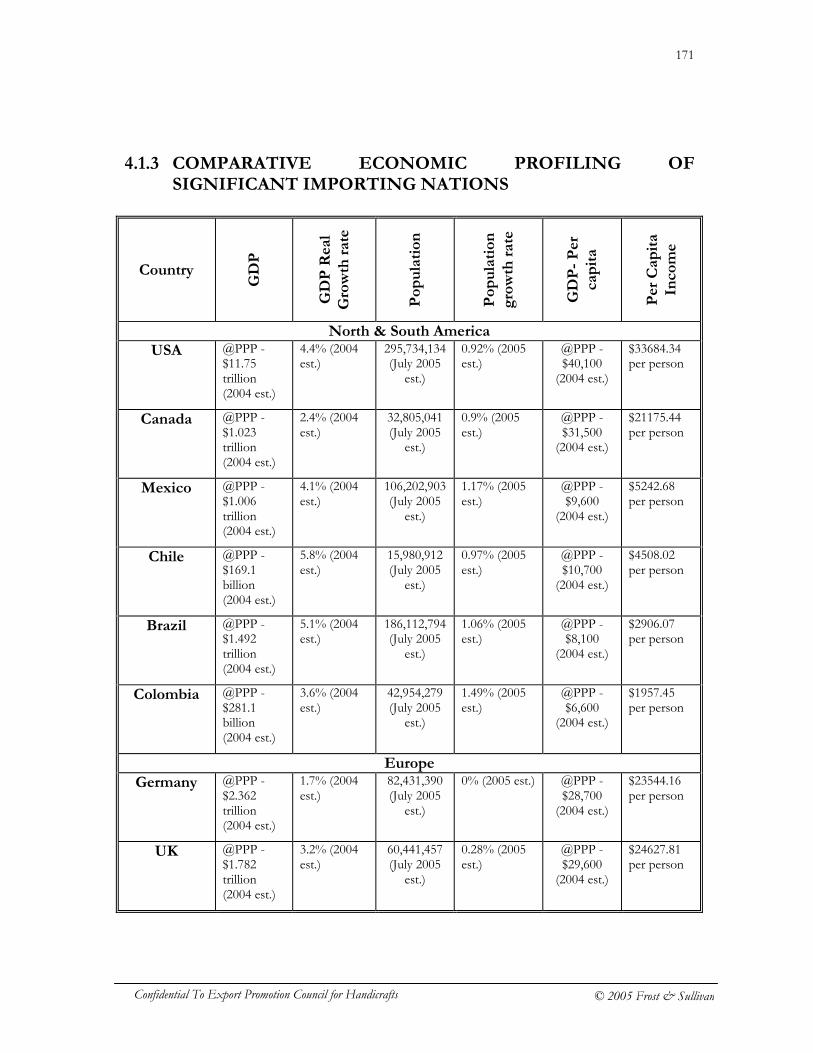
171
Confidential To Export Promotion Council for Handicrafts © 2005 Frost & Sullivan
4.1.3 COMPARATIVE ECONOMIC PROFILING OF SIGNIFICANT IMPORTING NATIONS
Country G
DP
GD
P R
eal
Gro
wth
rate
Po
pu
lati
on
Po
pu
lati
on
g
row
th r
ate
GD
P-
Per
ca
pit
a
Per
Cap
ita
Inco
me
North & South America
USA @PPP - $11.75 trillion (2004 est.)
4.4% (2004 est.)
295,734,134 (July 2005
est.)
0.92% (2005 est.)
@PPP - $40,100 (2004 est.)
$33684.34 per person
Canada @PPP - $1.023 trillion (2004 est.)
2.4% (2004 est.)
32,805,041 (July 2005
est.)
0.9% (2005 est.)
@PPP - $31,500 (2004 est.)
$21175.44 per person
Mexico @PPP - $1.006 trillion (2004 est.)
4.1% (2004 est.)
106,202,903 (July 2005
est.)
1.17% (2005 est.)
@PPP - $9,600
(2004 est.)
$5242.68 per person
Chile @PPP - $169.1 billion (2004 est.)
5.8% (2004 est.)
15,980,912 (July 2005
est.)
0.97% (2005 est.)
@PPP - $10,700 (2004 est.)
$4508.02 per person
Brazil @PPP - $1.492 trillion (2004 est.)
5.1% (2004 est.)
186,112,794 (July 2005
est.)
1.06% (2005 est.)
@PPP - $8,100
(2004 est.)
$2906.07 per person
Colombia @PPP - $281.1 billion (2004 est.)
3.6% (2004 est.)
42,954,279 (July 2005
est.)
1.49% (2005 est.)
@PPP - $6,600
(2004 est.)
$1957.45 per person
Europe
Germany @PPP - $2.362 trillion (2004 est.)
1.7% (2004 est.)
82,431,390 (July 2005
est.)
0% (2005 est.) @PPP - $28,700 (2004 est.)
$23544.16 per person
UK @PPP - $1.782 trillion (2004 est.)
3.2% (2004 est.)
60,441,457 (July 2005
est.)
0.28% (2005 est.)
@PPP - $29,600 (2004 est.)
$24627.81 per person
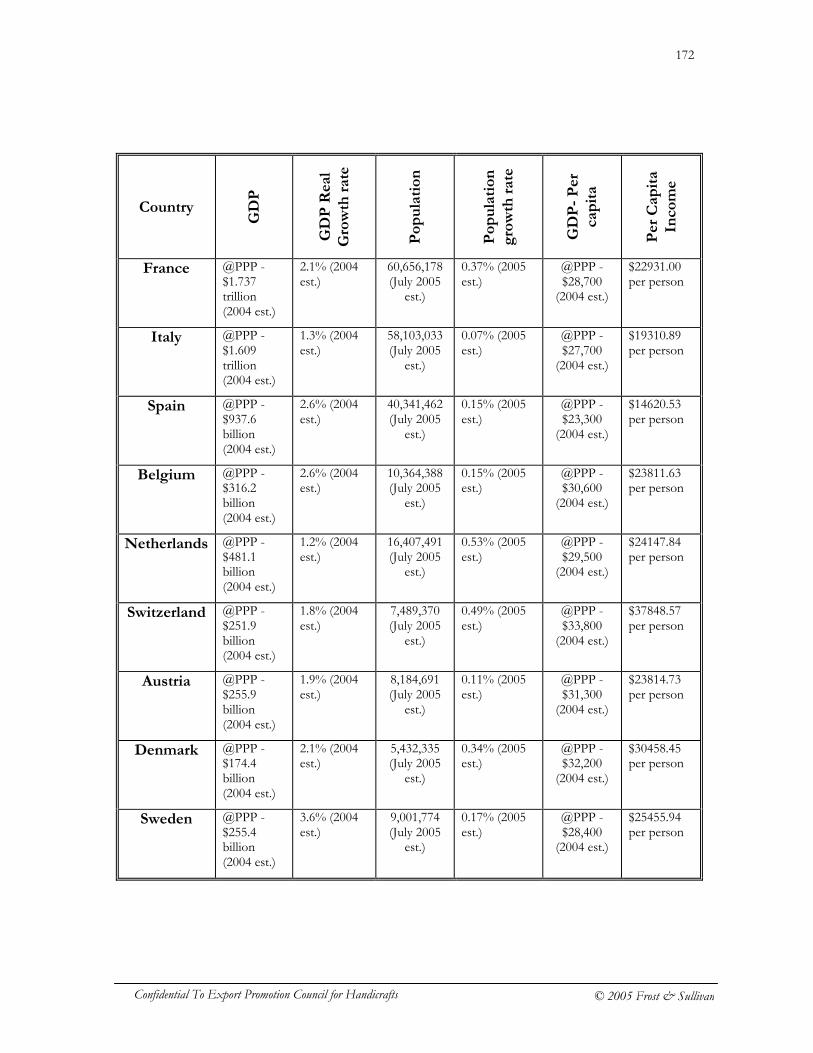
172
Confidential To Export Promotion Council for Handicrafts © 2005 Frost & Sullivan
Country
GD
P
GD
P R
eal
Gro
wth
rate
Po
pu
lati
on
Po
pu
lati
on
g
row
th r
ate
GD
P-
Per
ca
pit
a
Per
Cap
ita
Inco
me
France @PPP - $1.737 trillion (2004 est.)
2.1% (2004 est.)
60,656,178 (July 2005
est.)
0.37% (2005 est.)
@PPP - $28,700 (2004 est.)
$22931.00 per person
Italy @PPP - $1.609 trillion (2004 est.)
1.3% (2004 est.)
58,103,033 (July 2005
est.)
0.07% (2005 est.)
@PPP - $27,700 (2004 est.)
$19310.89 per person
Spain @PPP - $937.6 billion (2004 est.)
2.6% (2004 est.)
40,341,462 (July 2005
est.)
0.15% (2005 est.)
@PPP - $23,300 (2004 est.)
$14620.53 per person
Belgium @PPP - $316.2 billion (2004 est.)
2.6% (2004 est.)
10,364,388 (July 2005
est.)
0.15% (2005 est.)
@PPP - $30,600 (2004 est.)
$23811.63 per person
Netherlands @PPP - $481.1 billion (2004 est.)
1.2% (2004 est.)
16,407,491 (July 2005
est.)
0.53% (2005 est.)
@PPP - $29,500 (2004 est.)
$24147.84 per person
Switzerland @PPP - $251.9 billion (2004 est.)
1.8% (2004 est.)
7,489,370 (July 2005
est.)
0.49% (2005 est.)
@PPP - $33,800 (2004 est.)
$37848.57 per person
Austria @PPP - $255.9 billion (2004 est.)
1.9% (2004 est.)
8,184,691 (July 2005
est.)
0.11% (2005 est.)
@PPP - $31,300 (2004 est.)
$23814.73 per person
Denmark @PPP - $174.4 billion (2004 est.)
2.1% (2004 est.)
5,432,335 (July 2005
est.)
0.34% (2005 est.)
@PPP - $32,200 (2004 est.)
$30458.45 per person
Sweden @PPP - $255.4 billion (2004 est.)
3.6% (2004 est.)
9,001,774 (July 2005
est.)
0.17% (2005 est.)
@PPP - $28,400 (2004 est.)
$25455.94 per person
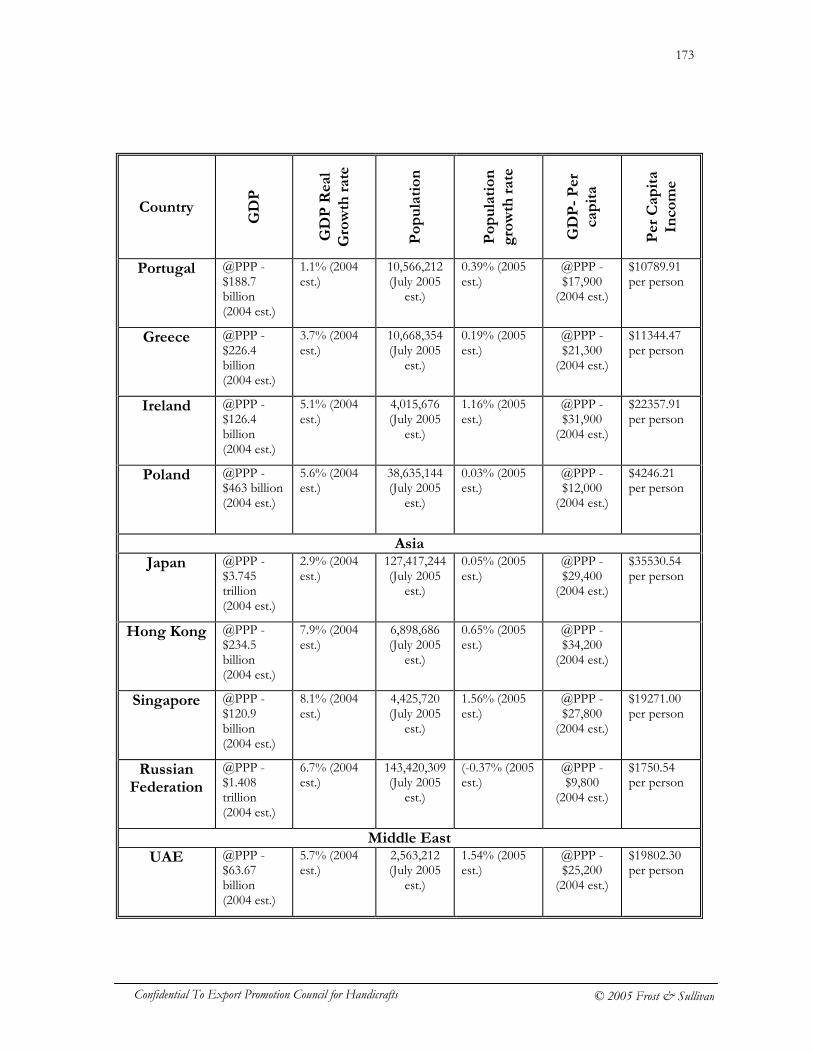
173
Confidential To Export Promotion Council for Handicrafts © 2005 Frost & Sullivan
Country
GD
P
GD
P R
eal
Gro
wth
rate
Po
pu
lati
on
Po
pu
lati
on
g
row
th r
ate
GD
P-
Per
ca
pit
a
Per
Cap
ita
Inco
me
Portugal @PPP - $188.7 billion (2004 est.)
1.1% (2004 est.)
10,566,212 (July 2005
est.)
0.39% (2005 est.)
@PPP - $17,900 (2004 est.)
$10789.91 per person
Greece @PPP - $226.4 billion (2004 est.)
3.7% (2004 est.)
10,668,354 (July 2005
est.)
0.19% (2005 est.)
@PPP - $21,300 (2004 est.)
$11344.47 per person
Ireland @PPP - $126.4 billion (2004 est.)
5.1% (2004 est.)
4,015,676 (July 2005
est.)
1.16% (2005 est.)
@PPP - $31,900 (2004 est.)
$22357.91 per person
Poland @PPP - $463 billion (2004 est.)
5.6% (2004 est.)
38,635,144 (July 2005
est.)
0.03% (2005 est.)
@PPP - $12,000 (2004 est.)
$4246.21 per person
Asia
Japan @PPP - $3.745 trillion (2004 est.)
2.9% (2004 est.)
127,417,244 (July 2005
est.)
0.05% (2005 est.)
@PPP - $29,400 (2004 est.)
$35530.54 per person
Hong Kong @PPP - $234.5 billion (2004 est.)
7.9% (2004 est.)
6,898,686 (July 2005
est.)
0.65% (2005 est.)
@PPP - $34,200 (2004 est.)
Singapore @PPP - $120.9 billion (2004 est.)
8.1% (2004 est.)
4,425,720 (July 2005
est.)
1.56% (2005 est.)
@PPP - $27,800 (2004 est.)
$19271.00 per person
Russian Federation
@PPP - $1.408 trillion (2004 est.)
6.7% (2004 est.)
143,420,309 (July 2005
est.)
(-0.37% (2005 est.)
@PPP - $9,800
(2004 est.)
$1750.54 per person
Middle East
UAE @PPP - $63.67 billion (2004 est.)
5.7% (2004 est.)
2,563,212 (July 2005
est.)
1.54% (2005 est.)
@PPP - $25,200 (2004 est.)
$19802.30 per person
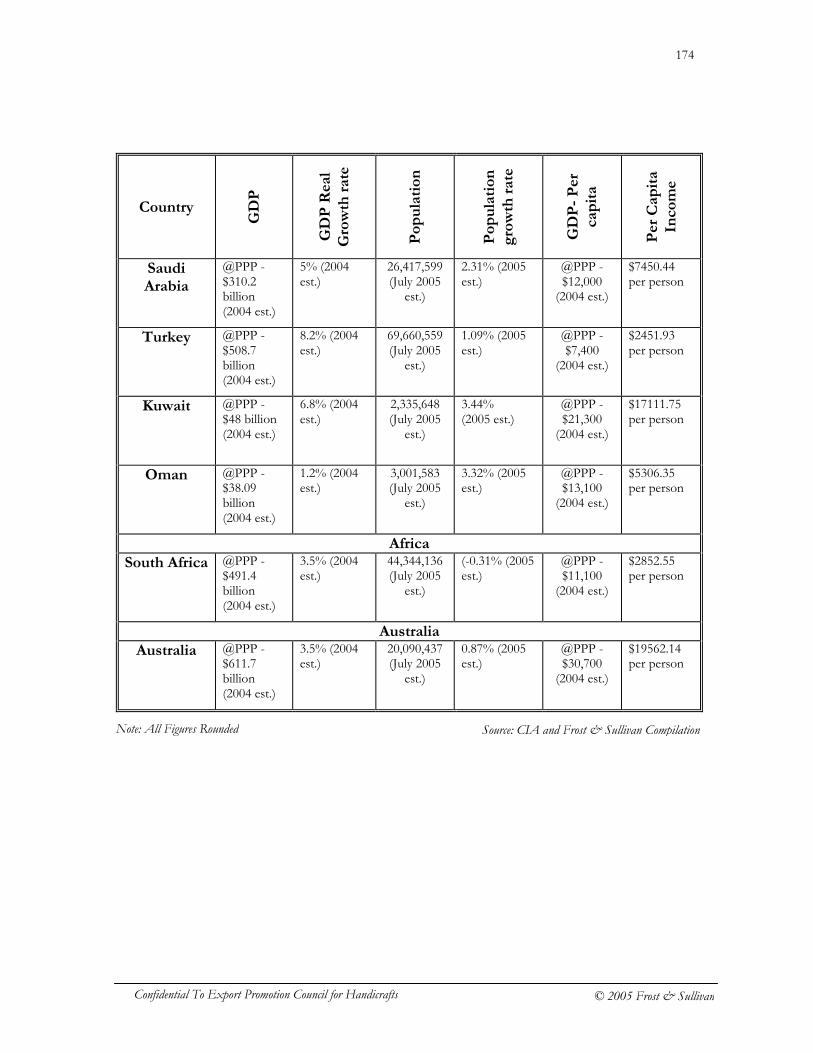
174
Confidential To Export Promotion Council for Handicrafts © 2005 Frost & Sullivan
Country
GD
P
GD
P R
eal
Gro
wth
rate
Po
pu
lati
on
Po
pu
lati
on
g
row
th r
ate
GD
P-
Per
ca
pit
a
Per
Cap
ita
Inco
me
Saudi Arabia
@PPP - $310.2 billion (2004 est.)
5% (2004 est.)
26,417,599 (July 2005
est.)
2.31% (2005 est.)
@PPP - $12,000 (2004 est.)
$7450.44 per person
Turkey @PPP - $508.7 billion (2004 est.)
8.2% (2004 est.)
69,660,559 (July 2005
est.)
1.09% (2005 est.)
@PPP - $7,400
(2004 est.)
$2451.93 per person
Kuwait @PPP - $48 billion (2004 est.)
6.8% (2004 est.)
2,335,648 (July 2005
est.)
3.44% (2005 est.)
@PPP - $21,300 (2004 est.)
$17111.75 per person
Oman @PPP - $38.09 billion (2004 est.)
1.2% (2004 est.)
3,001,583 (July 2005
est.)
3.32% (2005 est.)
@PPP - $13,100 (2004 est.)
$5306.35 per person
Africa
South Africa @PPP - $491.4 billion (2004 est.)
3.5% (2004 est.)
44,344,136 (July 2005
est.)
(-0.31% (2005 est.)
@PPP - $11,100 (2004 est.)
$2852.55 per person
Australia
Australia @PPP - $611.7 billion (2004 est.)
3.5% (2004 est.)
20,090,437 (July 2005
est.)
0.87% (2005 est.)
@PPP - $30,700 (2004 est.)
$19562.14 per person
Source: CIA and Frost & Sullivan Compilation Note: All Figures Rounded
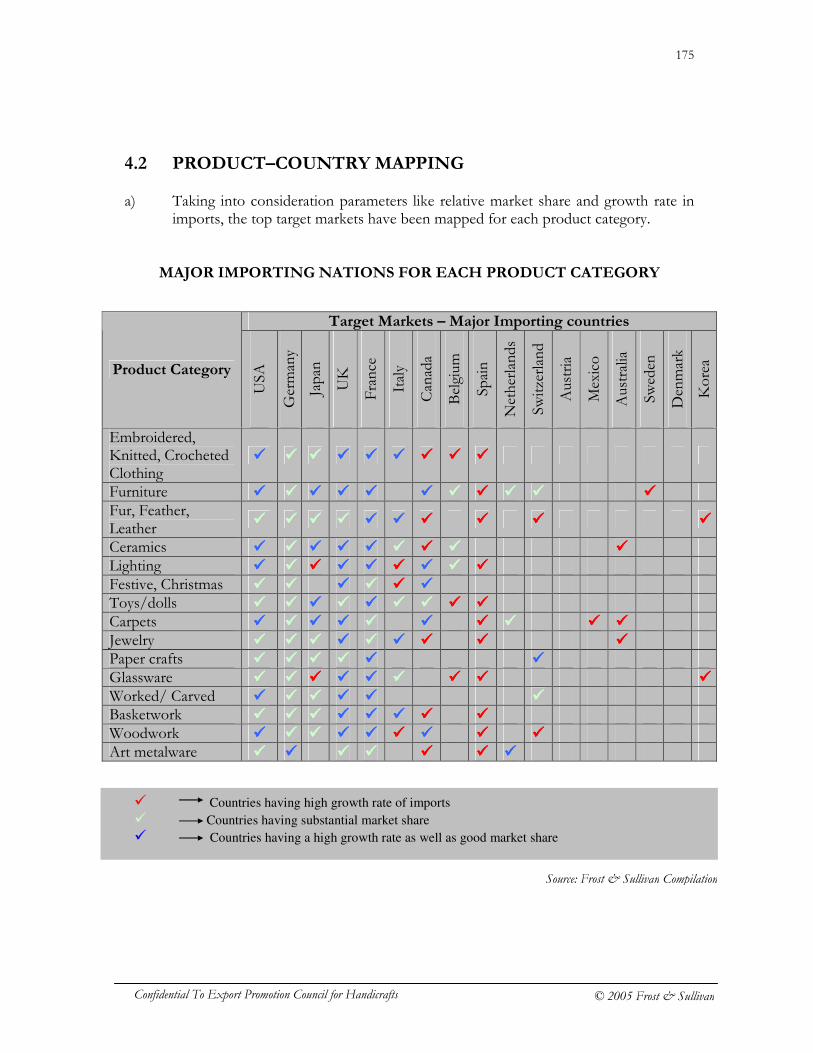
175
Confidential To Export Promotion Council for Handicrafts © 2005 Frost & Sullivan
4.2 PRODUCT–COUNTRY MAPPING a) Taking into consideration parameters like relative market share and growth rate in
imports, the top target markets have been mapped for each product category.
MAJOR IMPORTING NATIONS FOR EACH PRODUCT CATEGORY
Target Markets – Major Importing countries
Product Category
USA
Germany
Japan
UK
France
Italy
Canada
Belgium
Spain
Netherlands
Switzerland
Austria
Mexico
Australia
Sweden
Denmark
Korea
Embroidered, Knitted, Crocheted Clothing
���� ���� ���� ���� ���� ���� ���� ���� ����
Furniture ���� ���� ���� ���� ���� ���� ���� ���� ���� ���� ���� Fur, Feather, Leather ���� ���� ���� ���� ���� ���� ���� ���� ���� ����
Ceramics ���� ���� ���� ���� ���� ���� ���� ���� ���� Lighting ���� ���� ���� ���� ���� ���� ���� ���� ���� Festive, Christmas ���� ���� ���� ���� ���� ���� Toys/dolls ���� ���� ���� ���� ���� ���� ���� ���� ���� Carpets ���� ���� ���� ���� ���� ���� ���� ���� ���� ���� Jewelry ���� ���� ���� ���� ���� ���� ���� ���� ���� Paper crafts ���� ���� ���� ���� ���� ���� Glassware ���� ���� ���� ���� ���� ���� ���� ���� ���� Worked/ Carved ���� ���� ���� ���� ���� ���� Basketwork ���� ���� ���� ���� ���� ���� ���� ���� Woodwork ���� ���� ���� ���� ���� ���� ���� ���� ���� Art metalware ���� ���� ���� ���� ���� ���� ����
� Countries having high growth rate of imports
� Countries having substantial market share
� Countries having a high growth rate as well as good market share
Source: Frost & Sullivan Compilation
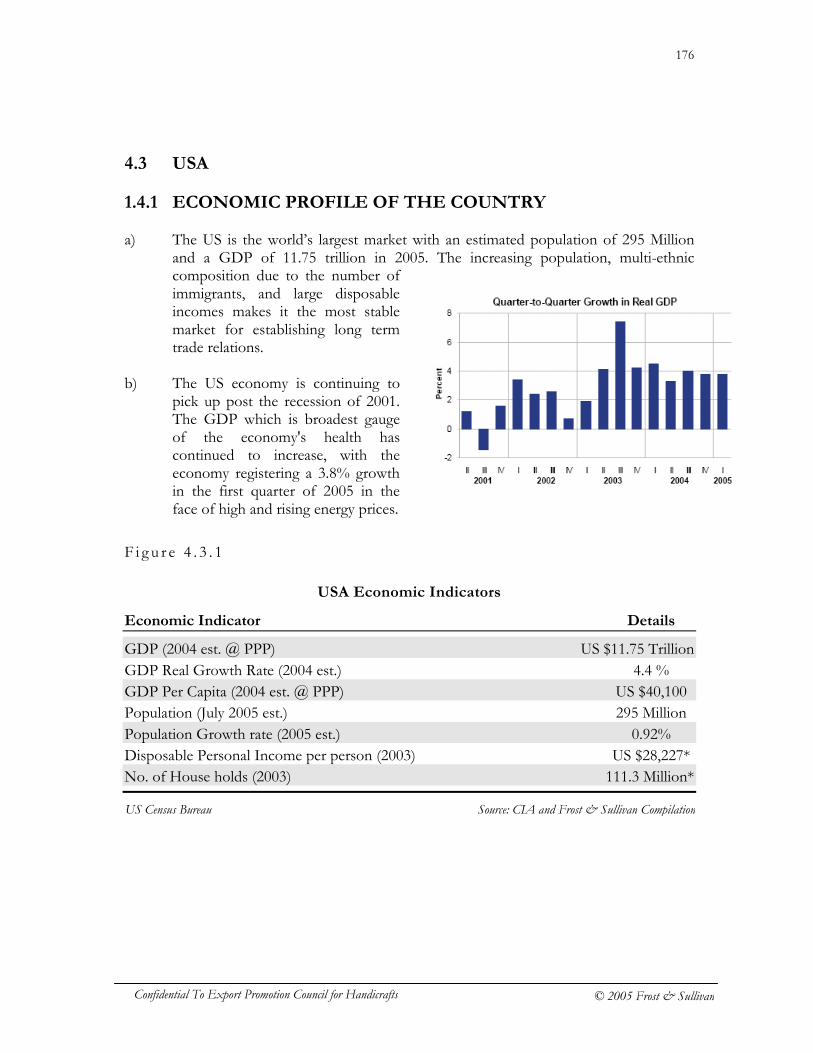
176
Confidential To Export Promotion Council for Handicrafts © 2005 Frost & Sullivan
4.3 USA 1.4.1 ECONOMIC PROFILE OF THE COUNTRY
a) The US is the world’s largest market with an estimated population of 295 Million
and a GDP of 11.75 trillion in 2005. The increasing population, multi-ethnic composition due to the number of immigrants, and large disposable incomes makes it the most stable market for establishing long term trade relations.
b) The US economy is continuing to
pick up post the recession of 2001. The GDP which is broadest gauge of the economy's health has continued to increase, with the economy registering a 3.8% growth in the first quarter of 2005 in the face of high and rising energy prices.
F i g u r e 4 . 3 . 1
USA Economic Indicators
Economic Indicator Details
GDP (2004 est. @ PPP) US $11.75 Trillion GDP Real Growth Rate (2004 est.) 4.4 % GDP Per Capita (2004 est. @ PPP) US $40,100 Population (July 2005 est.) 295 Million Population Growth rate (2005 est.) 0.92% Disposable Personal Income per person (2003) US $28,227* No. of House holds (2003) 111.3 Million*
Source: CIA and Frost & Sullivan Compilation US Census Bureau
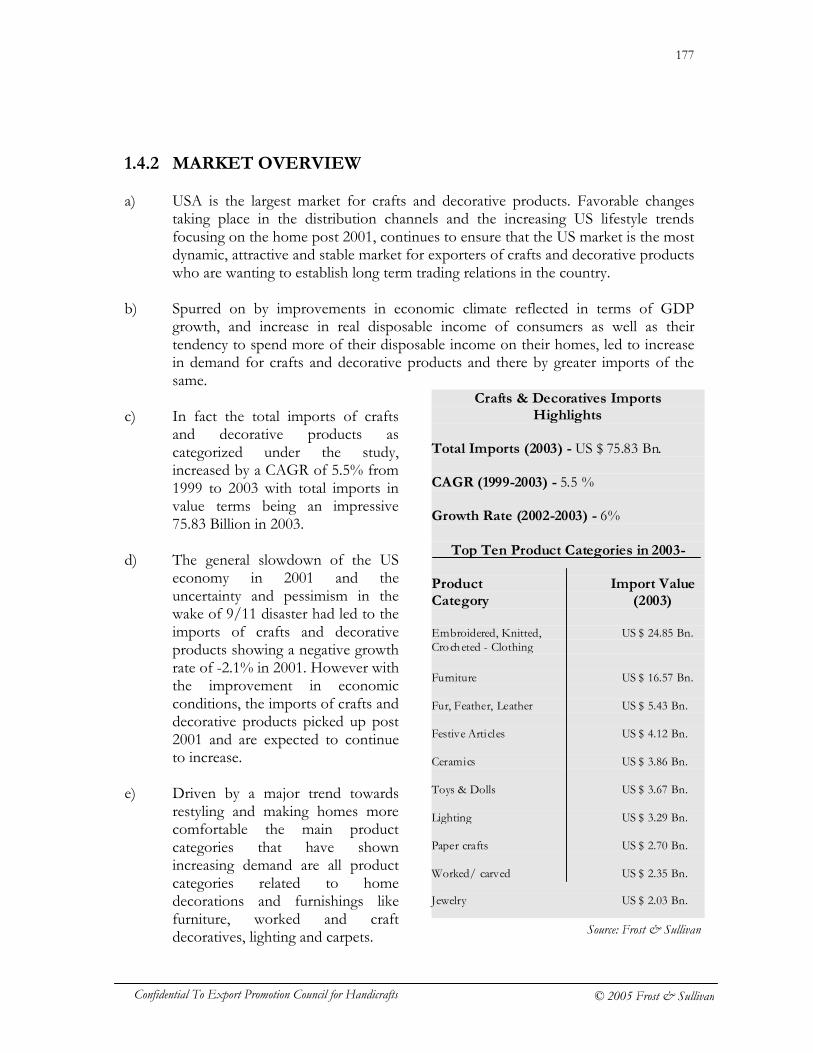
177
Confidential To Export Promotion Council for Handicrafts © 2005 Frost & Sullivan
1.4.2 MARKET OVERVIEW a) USA is the largest market for crafts and decorative products. Favorable changes
taking place in the distribution channels and the increasing US lifestyle trends focusing on the home post 2001, continues to ensure that the US market is the most dynamic, attractive and stable market for exporters of crafts and decorative products who are wanting to establish long term trading relations in the country.
b) Spurred on by improvements in economic climate reflected in terms of GDP
growth, and increase in real disposable income of consumers as well as their tendency to spend more of their disposable income on their homes, led to increase in demand for crafts and decorative products and there by greater imports of the same.
c) In fact the total imports of crafts
and decorative products as categorized under the study, increased by a CAGR of 5.5% from 1999 to 2003 with total imports in value terms being an impressive 75.83 Billion in 2003.
d) The general slowdown of the US
economy in 2001 and the uncertainty and pessimism in the wake of 9/11 disaster had led to the imports of crafts and decorative products showing a negative growth rate of -2.1% in 2001. However with the improvement in economic conditions, the imports of crafts and decorative products picked up post 2001 and are expected to continue to increase.
e) Driven by a major trend towards
restyling and making homes more comfortable the main product categories that have shown increasing demand are all product categories related to home decorations and furnishings like furniture, worked and craft decoratives, lighting and carpets.
Crafts & Decoratives Imports Highlights
Total Imports (2003) - US $ 75.83 Bn. CAGR (1999-2003) - 5.5 % Growth Rate (2002-2003) - 6%
Top Ten Product Categories in 2003-
Product Import Value Category (2003) Embroidered, Knitted, US $ 24.85 Bn. Crocheted - Clothing Furniture US $ 16.57 Bn. Fur, Feather, Leather US $ 5.43 Bn. Festive Articles US $ 4.12 Bn. Ceramics US $ 3.86 Bn. Toys & Dolls US $ 3.67 Bn. Lighting US $ 3.29 Bn. Paper crafts US $ 2.70 Bn. Worked/ carved US $ 2.35 Bn. Jewelry US $ 2.03 Bn.
Source: Frost & Sullivan
178
Confidential To Export Promotion Council for Handicrafts © 2005 Frost & Sullivan
f) The market has however becoming increasingly price sensitive due to increase in competition and the market being driven by impulse purchases. The flood of variety goods that has entered the market due to increased competition has whetted the appetite for new designs and products making the market extremely fashion oriented resulting in reduced shelf life of decoratives and faster production and distribution schedules.
g) The growth in the markets has been accompanied by shift in the distribution
channels with the independent stores losing market share due to increasing dominance of large retail chains and mail order catalogues. The preference of these large stores to import directly has led to shortening of distribution channels.
h) The increased pressure on the importers and wholesale companies due to the large
retailers by-passing them and the loss of market share of independent retailers who are their traditional customers has made them emphasize on continuous product innovation and custom design so as to compete in the face of increased competition.
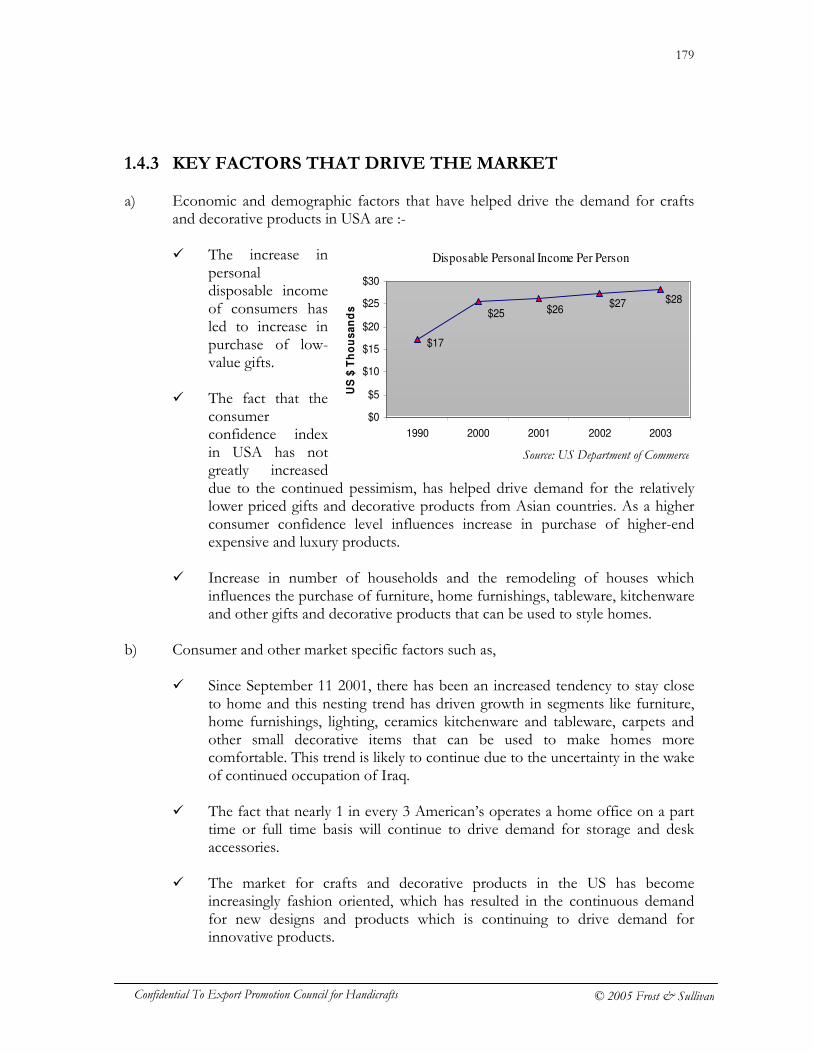
179
Confidential To Export Promotion Council for Handicrafts © 2005 Frost & Sullivan
1.4.3 KEY FACTORS THAT DRIVE THE MARKET a) Economic and demographic factors that have helped drive the demand for crafts
and decorative products in USA are :-
� The increase in personal disposable income of consumers has led to increase in purchase of low-value gifts.
� The fact that the
consumer confidence index in USA has not greatly increased due to the continued pessimism, has helped drive demand for the relatively lower priced gifts and decorative products from Asian countries. As a higher consumer confidence level influences increase in purchase of higher-end expensive and luxury products.
� Increase in number of households and the remodeling of houses which
influences the purchase of furniture, home furnishings, tableware, kitchenware and other gifts and decorative products that can be used to style homes.
b) Consumer and other market specific factors such as,
� Since September 11 2001, there has been an increased tendency to stay close to home and this nesting trend has driven growth in segments like furniture, home furnishings, lighting, ceramics kitchenware and tableware, carpets and other small decorative items that can be used to make homes more comfortable. This trend is likely to continue due to the uncertainty in the wake of continued occupation of Iraq.
� The fact that nearly 1 in every 3 American’s operates a home office on a part
time or full time basis will continue to drive demand for storage and desk accessories.
� The market for crafts and decorative products in the US has become
increasingly fashion oriented, which has resulted in the continuous demand for new designs and products which is continuing to drive demand for innovative products.
Disposable Personal Income Per Person
$17
$25 $26$27 $28
$0
$5
$10
$15
$20
$25
$30
1990 2000 2001 2002 2003
US
$ T
ho
us
an
ds
Source: US Department of Commerce
180
Confidential To Export Promotion Council for Handicrafts © 2005 Frost & Sullivan
� The other factors that have helped increase actual sales are entry of new categories which are growing, proliferation of cross-merchandising, diversification of retailers in the US, new niche stores, growth of mail order and home/cable shopping, the outreach of catalogues and outlet stores.
1.4.4 CONSUMER PREFERENCES a) In case of gifts the general preference of customers is towards high quality
moderately priced goods with increasing demand for new and unusual products. The main purchase considerations being quality, innovativeness/ unusualness and price.
b) With respect to home furnishings and utility articles of ceramics and glassware, there
is increasing preferences for brands. c) The market being highly fashion oriented, the specific preferences of consumers
with regard to products are subject to continuous change.
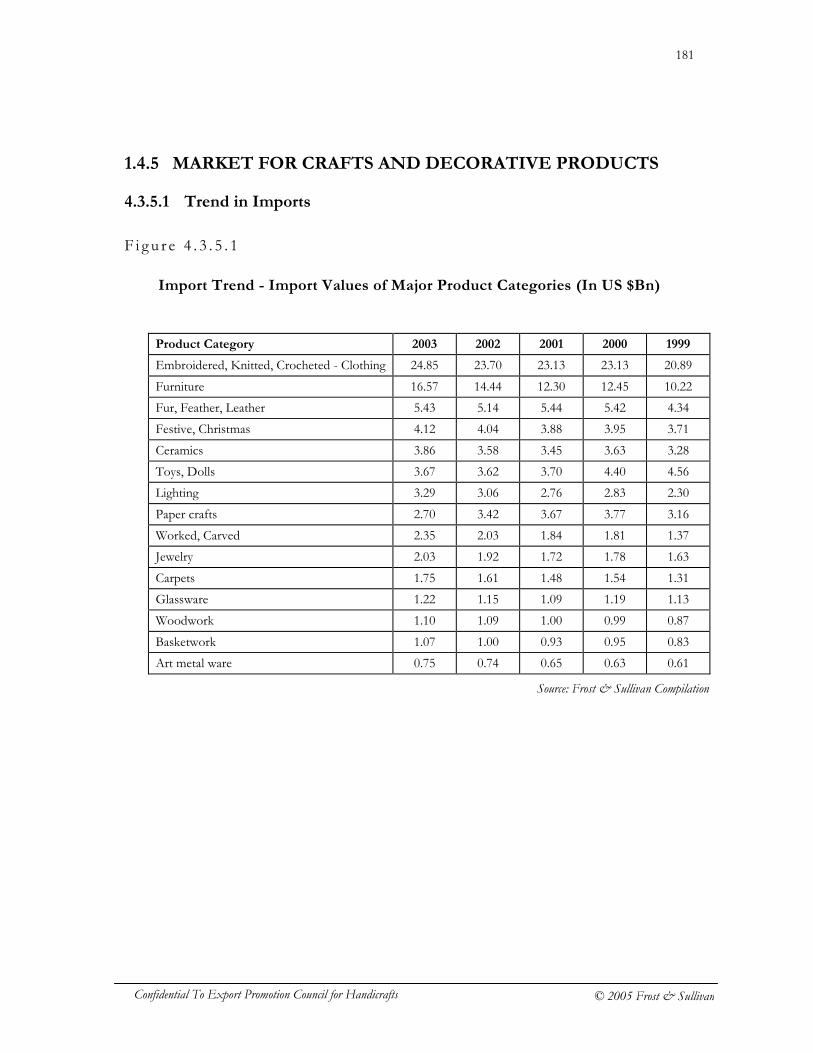
181
Confidential To Export Promotion Council for Handicrafts © 2005 Frost & Sullivan
1.4.5 MARKET FOR CRAFTS AND DECORATIVE PRODUCTS
4.3.5.1 Trend in Imports
F i g u r e 4 . 3 . 5 . 1
Import Trend - Import Values of Major Product Categories (In US $Bn)
Product Category 2003 2002 2001 2000 1999
Embroidered, Knitted, Crocheted - Clothing 24.85 23.70 23.13 23.13 20.89
Furniture 16.57 14.44 12.30 12.45 10.22
Fur, Feather, Leather 5.43 5.14 5.44 5.42 4.34
Festive, Christmas 4.12 4.04 3.88 3.95 3.71
Ceramics 3.86 3.58 3.45 3.63 3.28
Toys, Dolls 3.67 3.62 3.70 4.40 4.56
Lighting 3.29 3.06 2.76 2.83 2.30
Paper crafts 2.70 3.42 3.67 3.77 3.16
Worked, Carved 2.35 2.03 1.84 1.81 1.37
Jewelry 2.03 1.92 1.72 1.78 1.63
Carpets 1.75 1.61 1.48 1.54 1.31
Glassware 1.22 1.15 1.09 1.19 1.13
Woodwork 1.10 1.09 1.00 0.99 0.87
Basketwork 1.07 1.00 0.93 0.95 0.83
Art metal ware 0.75 0.74 0.65 0.63 0.61
Source: Frost & Sullivan Compilation
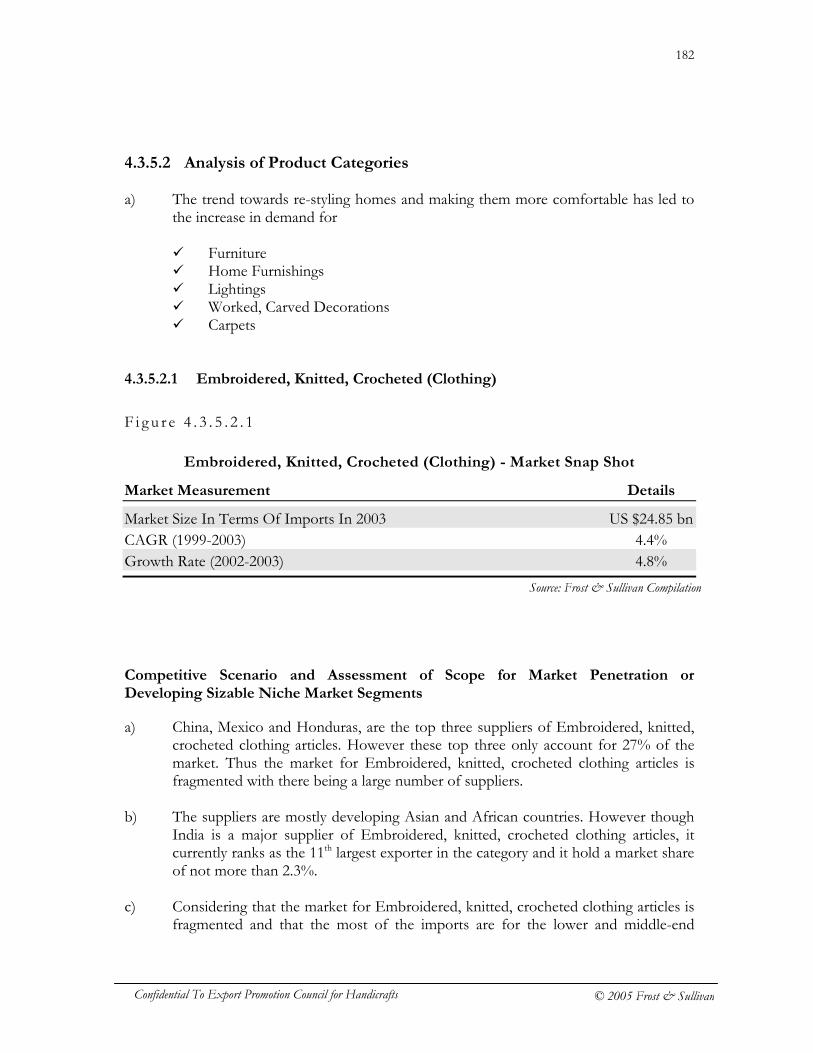
182
Confidential To Export Promotion Council for Handicrafts © 2005 Frost & Sullivan
4.3.5.2 Analysis of Product Categories a) The trend towards re-styling homes and making them more comfortable has led to
the increase in demand for
� Furniture � Home Furnishings � Lightings � Worked, Carved Decorations � Carpets
4.3.5.2.1 Embroidered, Knitted, Crocheted (Clothing)
F i g u r e 4 . 3 . 5 . 2 . 1
Embroidered, Knitted, Crocheted (Clothing) - Market Snap Shot
Market Measurement Details
Market Size In Terms Of Imports In 2003 US $24.85 bn CAGR (1999-2003) 4.4% Growth Rate (2002-2003) 4.8%
Competitive Scenario and Assessment of Scope for Market Penetration or Developing Sizable Niche Market Segments
a) China, Mexico and Honduras, are the top three suppliers of Embroidered, knitted, crocheted clothing articles. However these top three only account for 27% of the market. Thus the market for Embroidered, knitted, crocheted clothing articles is fragmented with there being a large number of suppliers.
b) The suppliers are mostly developing Asian and African countries. However though
India is a major supplier of Embroidered, knitted, crocheted clothing articles, it currently ranks as the 11th largest exporter in the category and it hold a market share of not more than 2.3%.
c) Considering that the market for Embroidered, knitted, crocheted clothing articles is
fragmented and that the most of the imports are for the lower and middle-end
Source: Frost & Sullivan Compilation
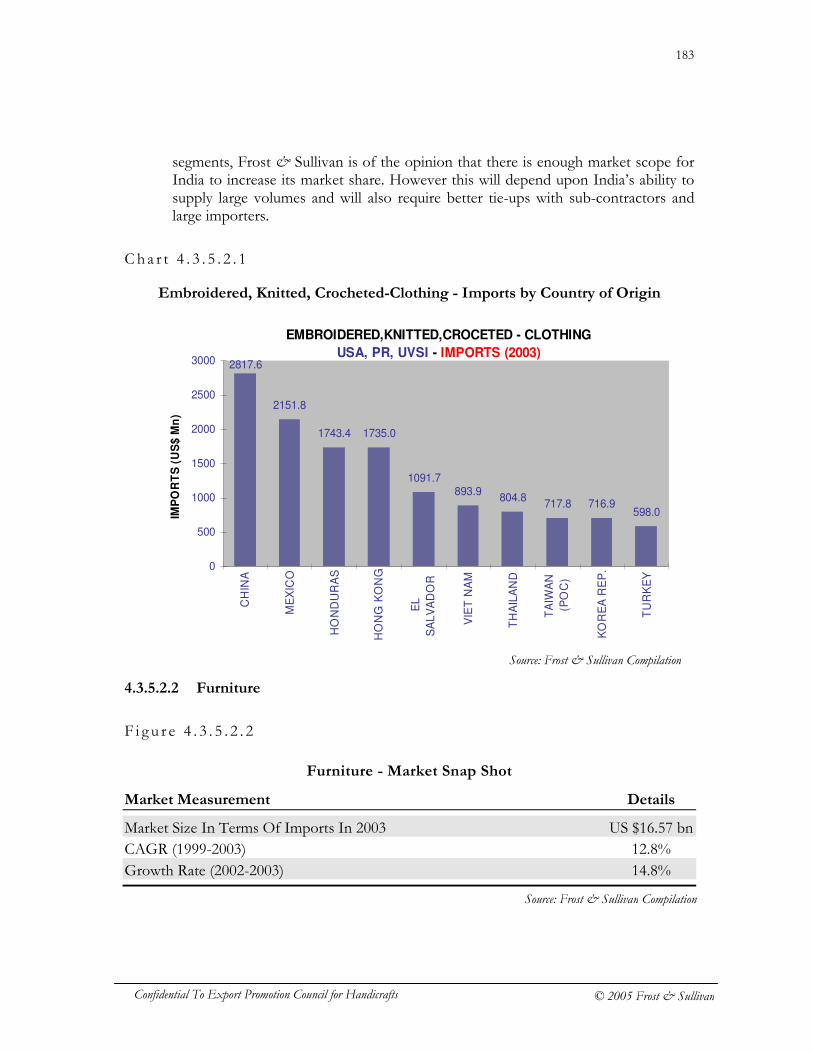
183
Confidential To Export Promotion Council for Handicrafts © 2005 Frost & Sullivan
segments, Frost & Sullivan is of the opinion that there is enough market scope for India to increase its market share. However this will depend upon India’s ability to supply large volumes and will also require better tie-ups with sub-contractors and large importers.
C h a r t 4 . 3 . 5 . 2 . 1
Embroidered, Knitted, Crocheted-Clothing - Imports by Country of Origin
4.3.5.2.2 Furniture
F i g u r e 4 . 3 . 5 . 2 . 2
Furniture - Market Snap Shot
Market Measurement Details
Market Size In Terms Of Imports In 2003 US $16.57 bn CAGR (1999-2003) 12.8% Growth Rate (2002-2003) 14.8%
EMBROIDERED,KNITTED,CROCETED - CLOTHING
USA, PR, UVSI - IMPORTS (2003)
2151.8
1743.4 1735.0
1091.7893.9
804.8717.8 716.9
598.0
2817.6
0
500
1000
1500
2000
2500
3000
CH
INA
ME
XIC
O
HO
ND
UR
AS
HO
NG
KO
NG
EL
SA
LV
AD
OR
VIE
T N
AM
TH
AIL
AN
D
TA
IWA
N
(PO
C)
KO
RE
A R
EP
.
TU
RK
EY
IMP
OR
TS
(U
S$
Mn
)
Source: Frost & Sullivan Compilation
Source: Frost & Sullivan Compilation
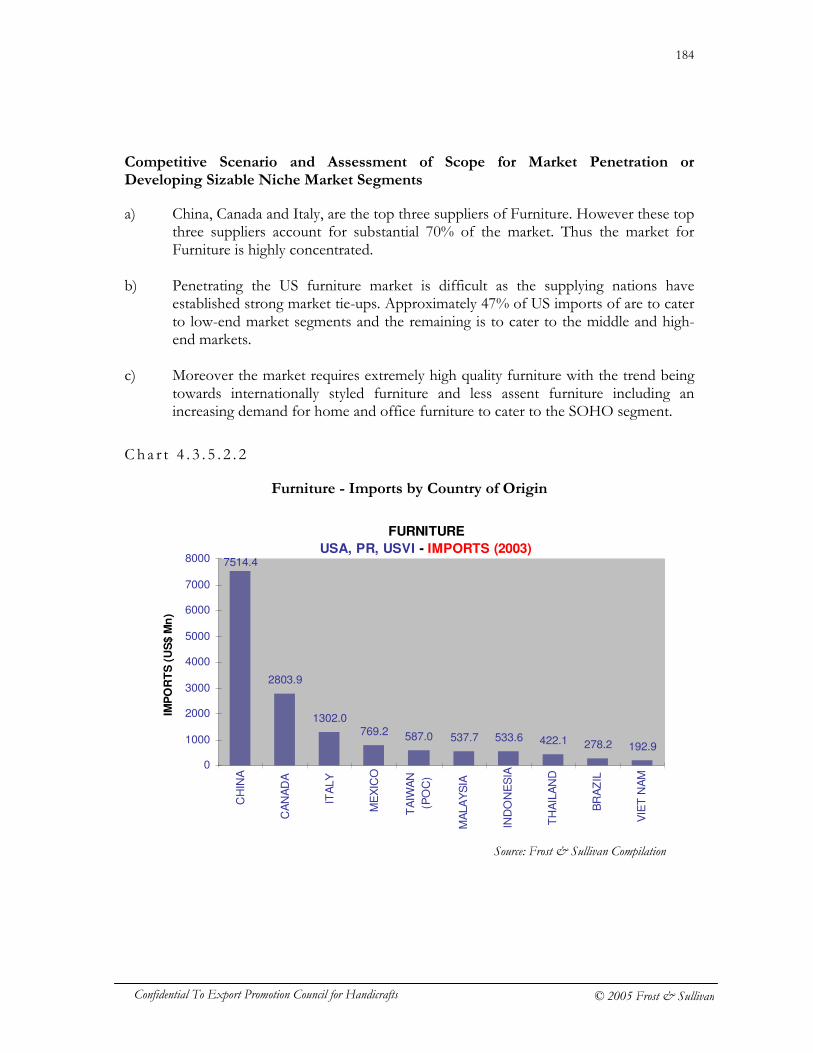
184
Confidential To Export Promotion Council for Handicrafts © 2005 Frost & Sullivan
Competitive Scenario and Assessment of Scope for Market Penetration or Developing Sizable Niche Market Segments
a) China, Canada and Italy, are the top three suppliers of Furniture. However these top three suppliers account for substantial 70% of the market. Thus the market for Furniture is highly concentrated.
b) Penetrating the US furniture market is difficult as the supplying nations have
established strong market tie-ups. Approximately 47% of US imports of are to cater to low-end market segments and the remaining is to cater to the middle and high-end markets.
c) Moreover the market requires extremely high quality furniture with the trend being
towards internationally styled furniture and less assent furniture including an increasing demand for home and office furniture to cater to the SOHO segment.
C h a r t 4 . 3 . 5 . 2 . 2
Furniture - Imports by Country of Origin
FURNITURE
USA, PR, USVI - IMPORTS (2003)
2803.9
1302.0769.2 587.0 537.7 533.6 422.1 278.2 192.9
7514.4
0
1000
2000
3000
4000
5000
6000
7000
8000
CH
INA
CA
NA
DA
ITA
LY
ME
XIC
O
TA
IWA
N
(PO
C)
MA
LA
YS
IA
IND
ON
ES
IA
TH
AIL
AN
D
BR
AZ
IL
VIE
T N
AM
IMP
OR
TS
(U
S$ M
n)
Source: Frost & Sullivan Compilation
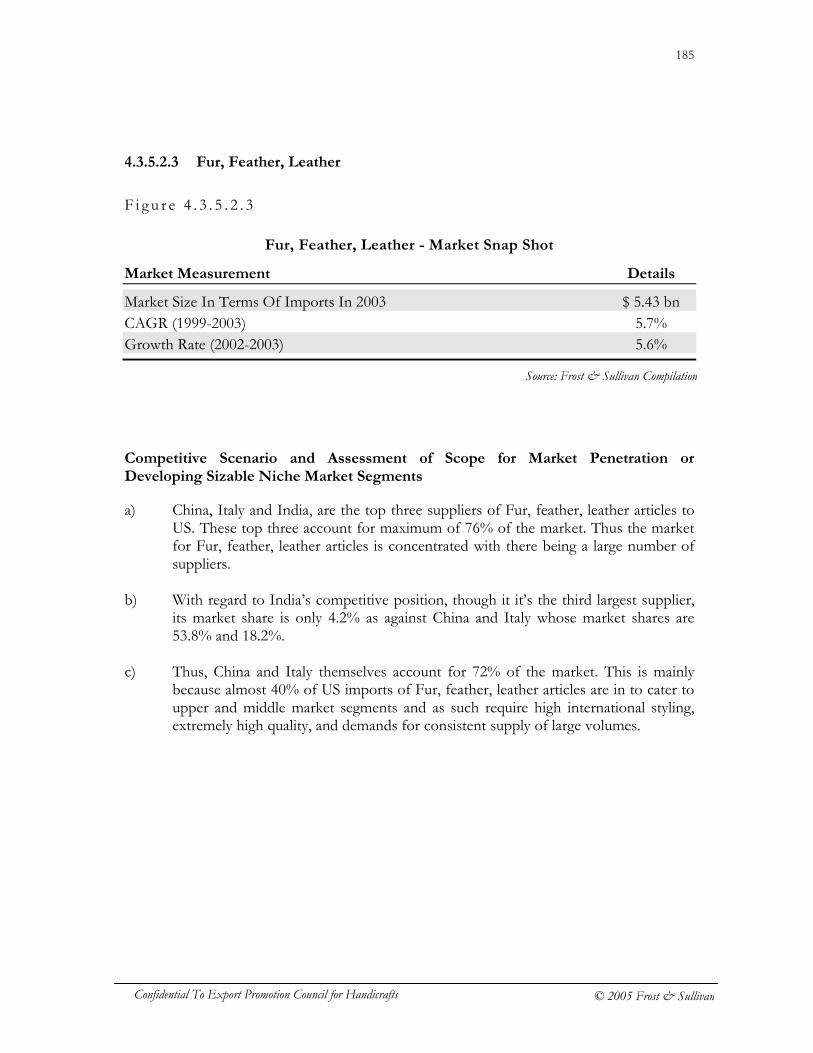
185
Confidential To Export Promotion Council for Handicrafts © 2005 Frost & Sullivan
4.3.5.2.3 Fur, Feather, Leather
F i g u r e 4 . 3 . 5 . 2 . 3
Fur, Feather, Leather - Market Snap Shot
Market Measurement Details
Market Size In Terms Of Imports In 2003 $ 5.43 bn CAGR (1999-2003) 5.7% Growth Rate (2002-2003) 5.6%
Competitive Scenario and Assessment of Scope for Market Penetration or Developing Sizable Niche Market Segments
a) China, Italy and India, are the top three suppliers of Fur, feather, leather articles to US. These top three account for maximum of 76% of the market. Thus the market for Fur, feather, leather articles is concentrated with there being a large number of suppliers.
b) With regard to India’s competitive position, though it it’s the third largest supplier,
its market share is only 4.2% as against China and Italy whose market shares are 53.8% and 18.2%.
c) Thus, China and Italy themselves account for 72% of the market. This is mainly
because almost 40% of US imports of Fur, feather, leather articles are in to cater to upper and middle market segments and as such require high international styling, extremely high quality, and demands for consistent supply of large volumes.
Source: Frost & Sullivan Compilation
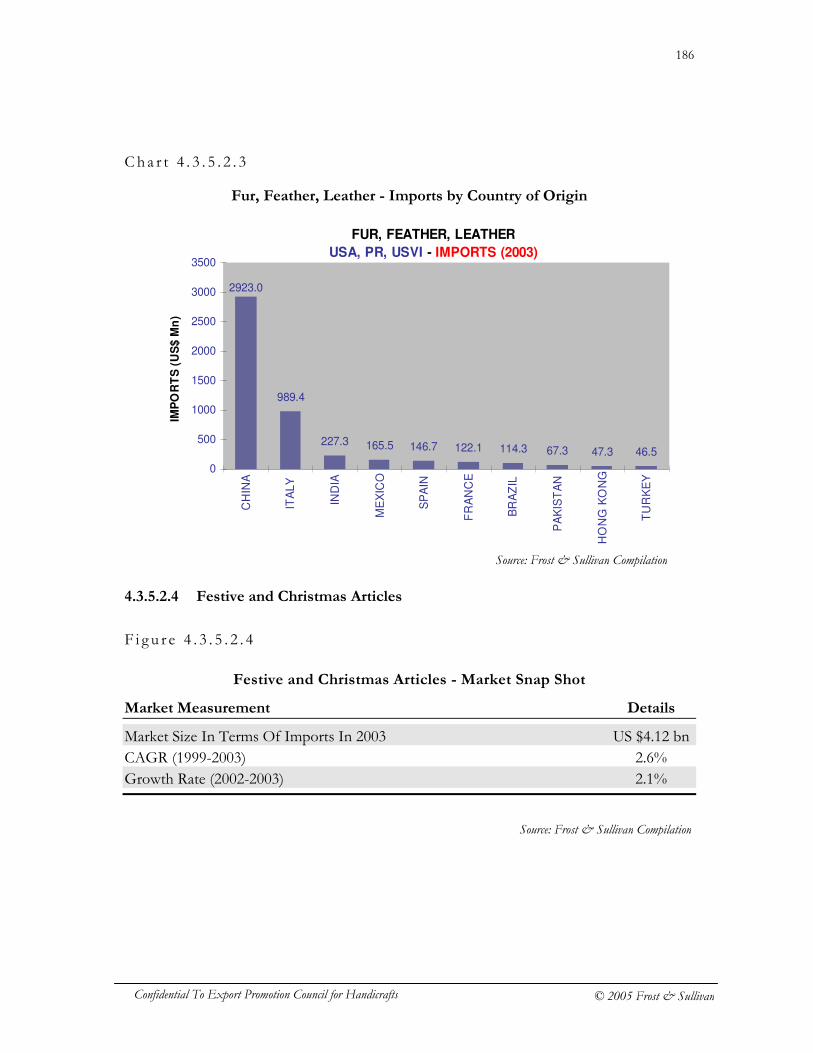
186
Confidential To Export Promotion Council for Handicrafts © 2005 Frost & Sullivan
Cha r t 4 . 3 . 5 . 2 . 3
Fur, Feather, Leather - Imports by Country of Origin
4.3.5.2.4 Festive and Christmas Articles
F i g u r e 4 . 3 . 5 . 2 . 4
Festive and Christmas Articles - Market Snap Shot
Market Measurement Details
Market Size In Terms Of Imports In 2003 US $4.12 bn CAGR (1999-2003) 2.6% Growth Rate (2002-2003) 2.1%
Source: Frost & Sullivan Compilation
Source: Frost & Sullivan Compilation
FUR, FEATHER, LEATHER
USA, PR, USVI - IMPORTS (2003)
989.4
227.3 165.5 146.7 122.1 114.3 67.3 47.3 46.5
2923.0
0
500
1000
1500
2000
2500
3000
3500
CH
INA
ITA
LY
IND
IA
ME
XIC
O
SP
AIN
FR
AN
CE
BR
AZ
IL
PA
KIS
TA
N
HO
NG
KO
NG
TU
RK
EY
IMP
OR
TS
(U
S$ M
n)
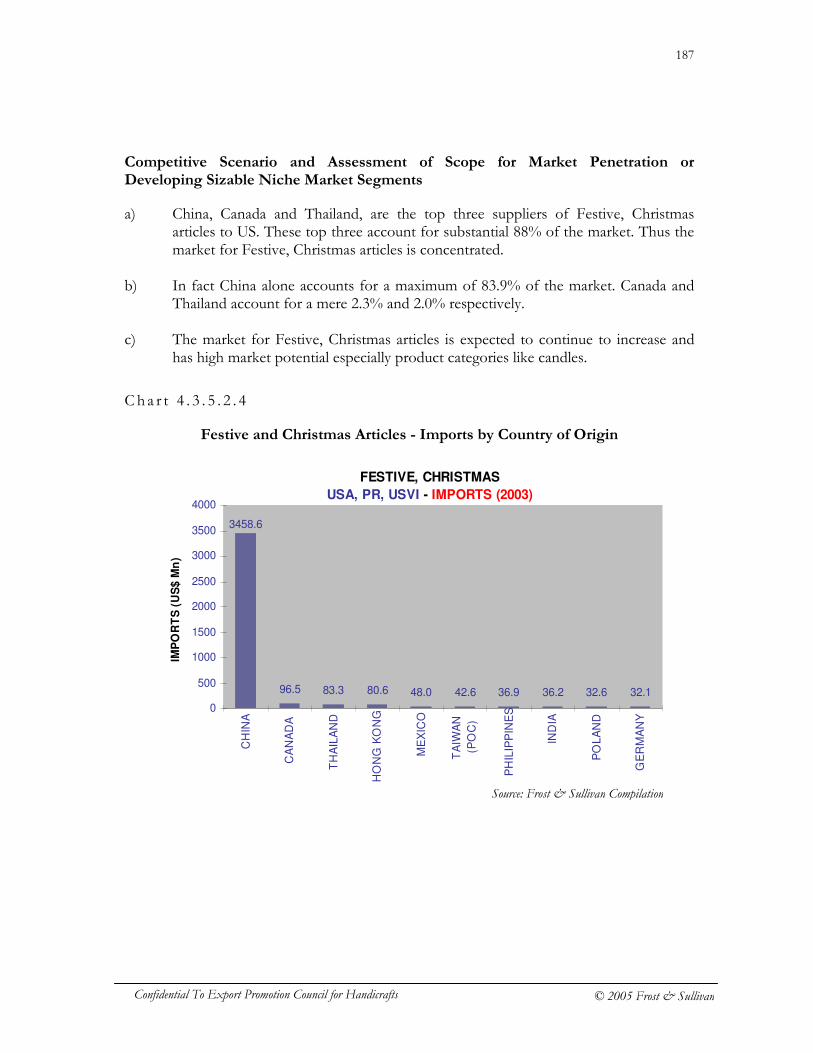
187
Confidential To Export Promotion Council for Handicrafts © 2005 Frost & Sullivan
Competitive Scenario and Assessment of Scope for Market Penetration or Developing Sizable Niche Market Segments
a) China, Canada and Thailand, are the top three suppliers of Festive, Christmas articles to US. These top three account for substantial 88% of the market. Thus the market for Festive, Christmas articles is concentrated.
b) In fact China alone accounts for a maximum of 83.9% of the market. Canada and
Thailand account for a mere 2.3% and 2.0% respectively. c) The market for Festive, Christmas articles is expected to continue to increase and
has high market potential especially product categories like candles.
C h a r t 4 . 3 . 5 . 2 . 4
Festive and Christmas Articles - Imports by Country of Origin
FESTIVE, CHRISTMAS
USA, PR, USVI - IMPORTS (2003)
96.5 83.3 80.6 48.0 42.6 36.9 36.2 32.6 32.1
3458.6
0
500
1000
1500
2000
2500
3000
3500
4000
CH
INA
CA
NA
DA
TH
AIL
AN
D
HO
NG
KO
NG
ME
XIC
O
TA
IWA
N
(PO
C)
PH
ILIP
PIN
ES
IND
IA
PO
LA
ND
GE
RM
AN
Y
IMP
OR
TS
(U
S$
Mn
)
Source: Frost & Sullivan Compilation
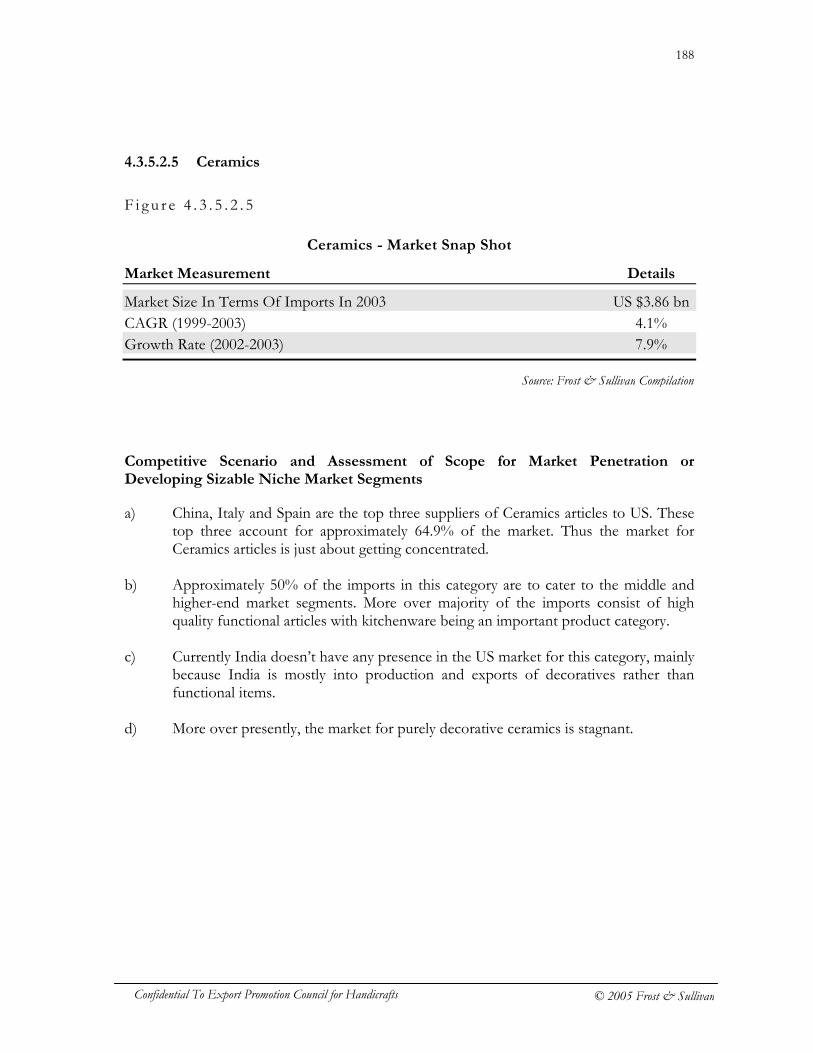
188
Confidential To Export Promotion Council for Handicrafts © 2005 Frost & Sullivan
4.3.5.2.5 Ceramics
F i g u r e 4 . 3 . 5 . 2 . 5
Ceramics - Market Snap Shot
Market Measurement Details
Market Size In Terms Of Imports In 2003 US $3.86 bn CAGR (1999-2003) 4.1% Growth Rate (2002-2003) 7.9%
Competitive Scenario and Assessment of Scope for Market Penetration or Developing Sizable Niche Market Segments
a) China, Italy and Spain are the top three suppliers of Ceramics articles to US. These top three account for approximately 64.9% of the market. Thus the market for Ceramics articles is just about getting concentrated.
b) Approximately 50% of the imports in this category are to cater to the middle and
higher-end market segments. More over majority of the imports consist of high quality functional articles with kitchenware being an important product category.
c) Currently India doesn’t have any presence in the US market for this category, mainly
because India is mostly into production and exports of decoratives rather than functional items.
d) More over presently, the market for purely decorative ceramics is stagnant.
Source: Frost & Sullivan Compilation
189
Confidential To Export Promotion Council for Handicrafts © 2005 Frost & Sullivan
Cha r t 4 . 3 . 5 . 2 . 5
Ceramics - Imports by Country of Origin
4.3.5.2.6 Toys and Dolls
F i g u r e 4 . 3 . 5 . 2 . 6
Toys and Dolls - Market Snap Shot
Market Measurement Details
Market Size In Terms Of Imports In 2003 US $3.67 bn CAGR (1999-2003) -5.2% Growth Rate (2002-2003) 1.5%
CERAMICS
USA, PR, UVSI - IMPORTS (2003)
974.1
334.7
226.9160.2 125.8 105.6 103.9 100.6 70.1
1199.2
0
200
400
600
800
1000
1200
1400
CH
INA
ITA
LY
SP
AIN
ME
XIC
O
BR
AZ
IL
TH
AIL
AN
D
JA
PA
N
UN
TD
KIN
GD
OM
IND
ON
ES
IA
GE
RM
AN
Y
IMP
OR
TS
(U
S$ M
n)
Source: Frost & Sullivan Compilation
Source: Frost & Sullivan Compilation
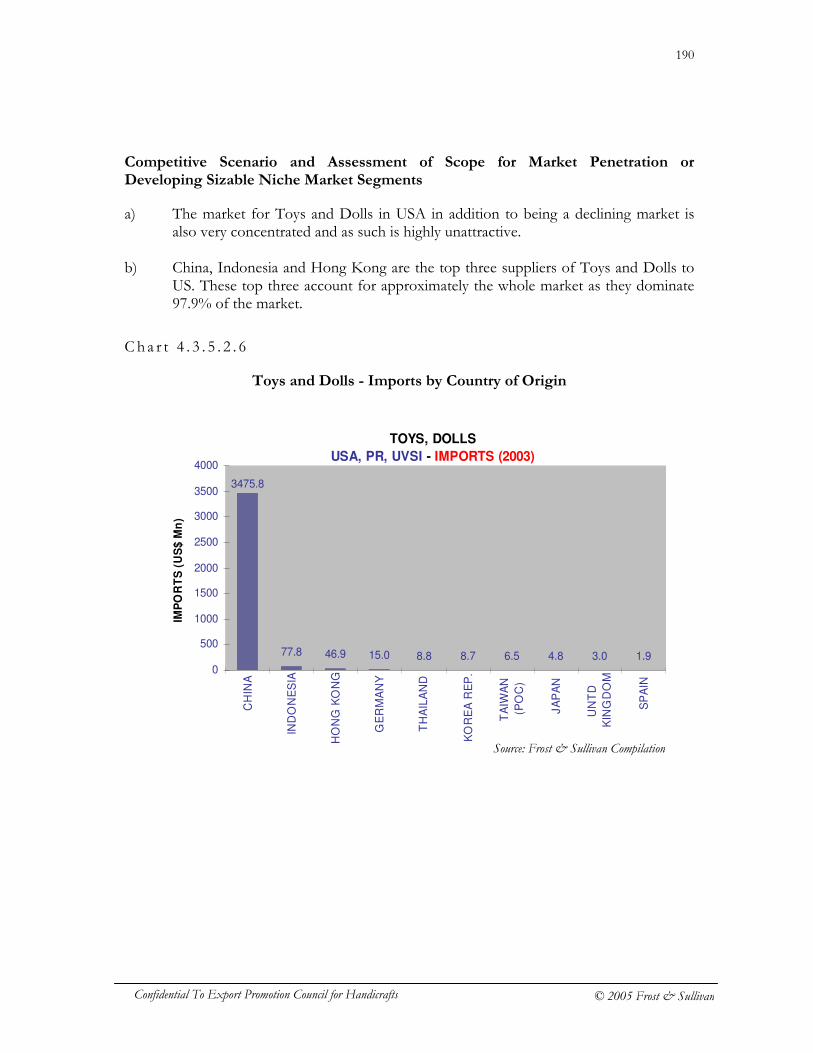
190
Confidential To Export Promotion Council for Handicrafts © 2005 Frost & Sullivan
Competitive Scenario and Assessment of Scope for Market Penetration or Developing Sizable Niche Market Segments
a) The market for Toys and Dolls in USA in addition to being a declining market is also very concentrated and as such is highly unattractive.
b) China, Indonesia and Hong Kong are the top three suppliers of Toys and Dolls to
US. These top three account for approximately the whole market as they dominate 97.9% of the market.
C h a r t 4 . 3 . 5 . 2 . 6
Toys and Dolls - Imports by Country of Origin
TOYS, DOLLS
USA, PR, UVSI - IMPORTS (2003)
77.8 46.9 15.0 8.8 8.7 6.5 4.8 3.0 1.9
3475.8
0
500
1000
1500
2000
2500
3000
3500
4000
CH
INA
IND
ON
ES
IA
HO
NG
KO
NG
GE
RM
AN
Y
TH
AIL
AN
D
KO
RE
A R
EP
.
TA
IWA
N
(PO
C)
JA
PA
N
UN
TD
KIN
GD
OM
SP
AIN
IMP
OR
TS
(U
S$
Mn
)
Source: Frost & Sullivan Compilation
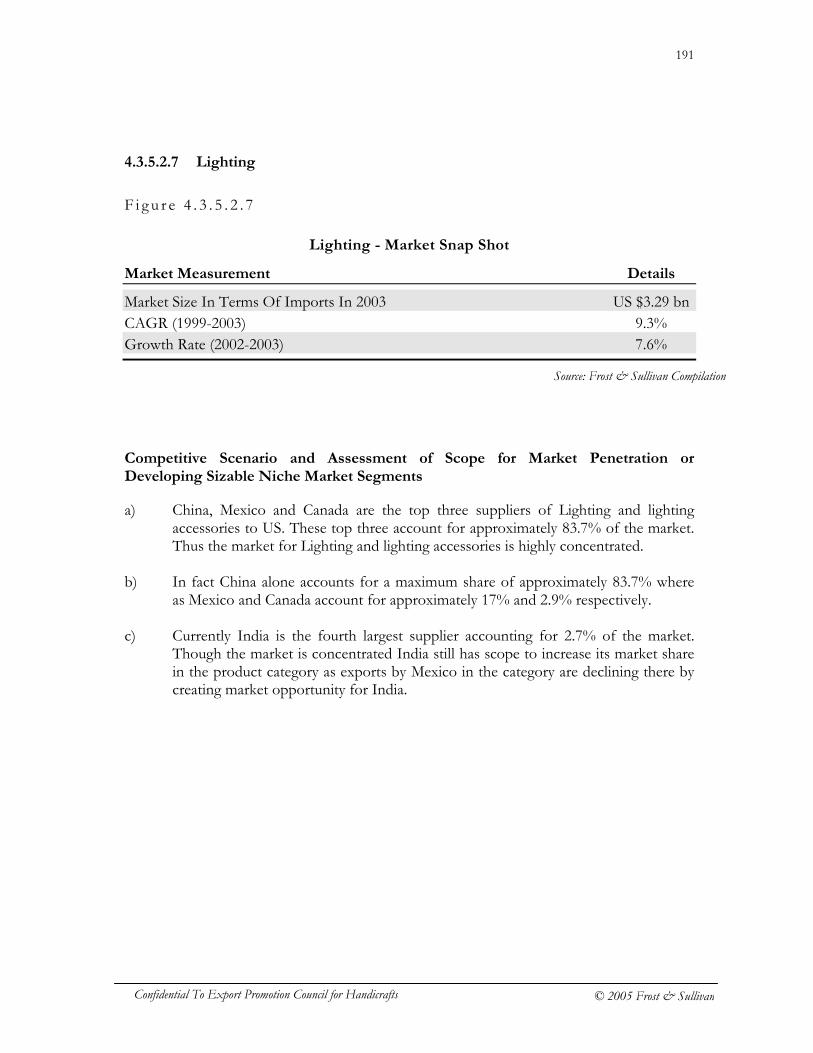
191
Confidential To Export Promotion Council for Handicrafts © 2005 Frost & Sullivan
4.3.5.2.7 Lighting
F i g u r e 4 . 3 . 5 . 2 . 7
Lighting - Market Snap Shot
Market Measurement Details
Market Size In Terms Of Imports In 2003 US $3.29 bn CAGR (1999-2003) 9.3% Growth Rate (2002-2003) 7.6%
Competitive Scenario and Assessment of Scope for Market Penetration or Developing Sizable Niche Market Segments
a) China, Mexico and Canada are the top three suppliers of Lighting and lighting accessories to US. These top three account for approximately 83.7% of the market. Thus the market for Lighting and lighting accessories is highly concentrated.
b) In fact China alone accounts for a maximum share of approximately 83.7% where
as Mexico and Canada account for approximately 17% and 2.9% respectively. c) Currently India is the fourth largest supplier accounting for 2.7% of the market.
Though the market is concentrated India still has scope to increase its market share in the product category as exports by Mexico in the category are declining there by creating market opportunity for India.
Source: Frost & Sullivan Compilation
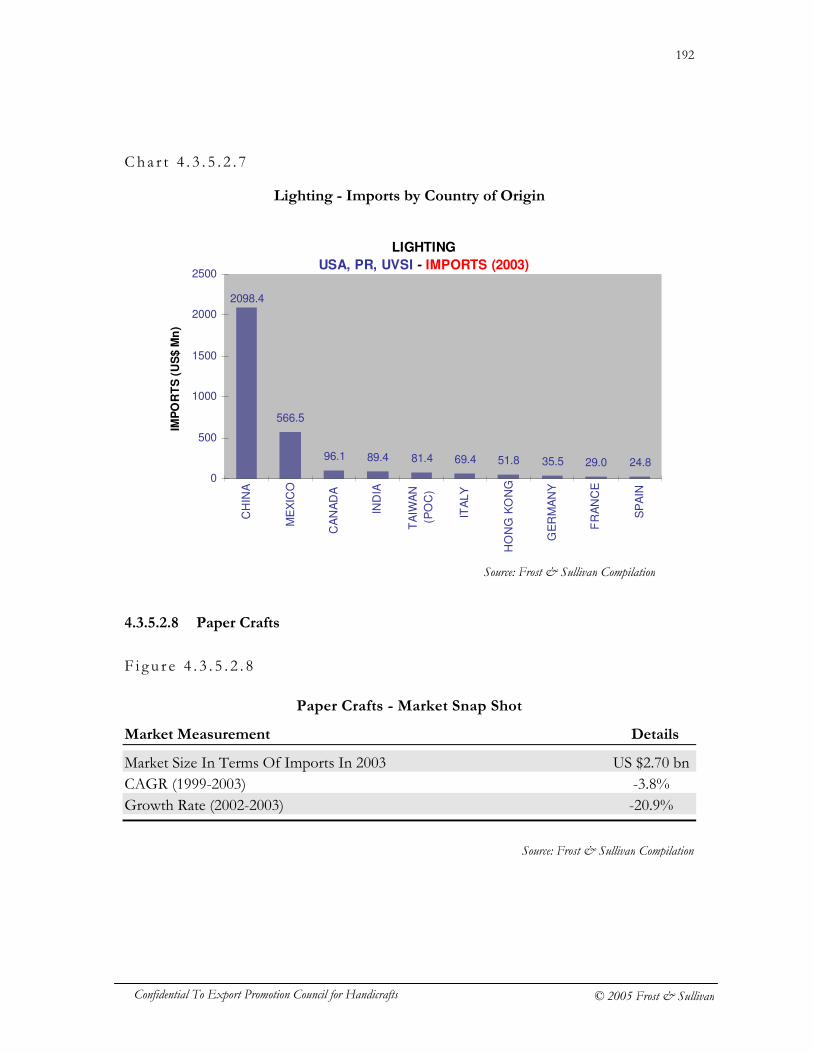
192
Confidential To Export Promotion Council for Handicrafts © 2005 Frost & Sullivan
Cha r t 4 . 3 . 5 . 2 . 7
Lighting - Imports by Country of Origin
4.3.5.2.8 Paper Crafts
F i g u r e 4 . 3 . 5 . 2 . 8
Paper Crafts - Market Snap Shot
Market Measurement Details
Market Size In Terms Of Imports In 2003 US $2.70 bn CAGR (1999-2003) -3.8% Growth Rate (2002-2003) -20.9%
Source: Frost & Sullivan Compilation
Source: Frost & Sullivan Compilation
LIGHTING
USA, PR, UVSI - IMPORTS (2003)
566.5
96.1 89.4 81.4 69.4 51.8 35.5 29.0 24.8
2098.4
0
500
1000
1500
2000
2500
CH
INA
ME
XIC
O
CA
NA
DA
IND
IA
TA
IWA
N
(PO
C)
ITA
LY
HO
NG
KO
NG
GE
RM
AN
Y
FR
AN
CE
SP
AIN
IMP
OR
TS
(U
S$ M
n)
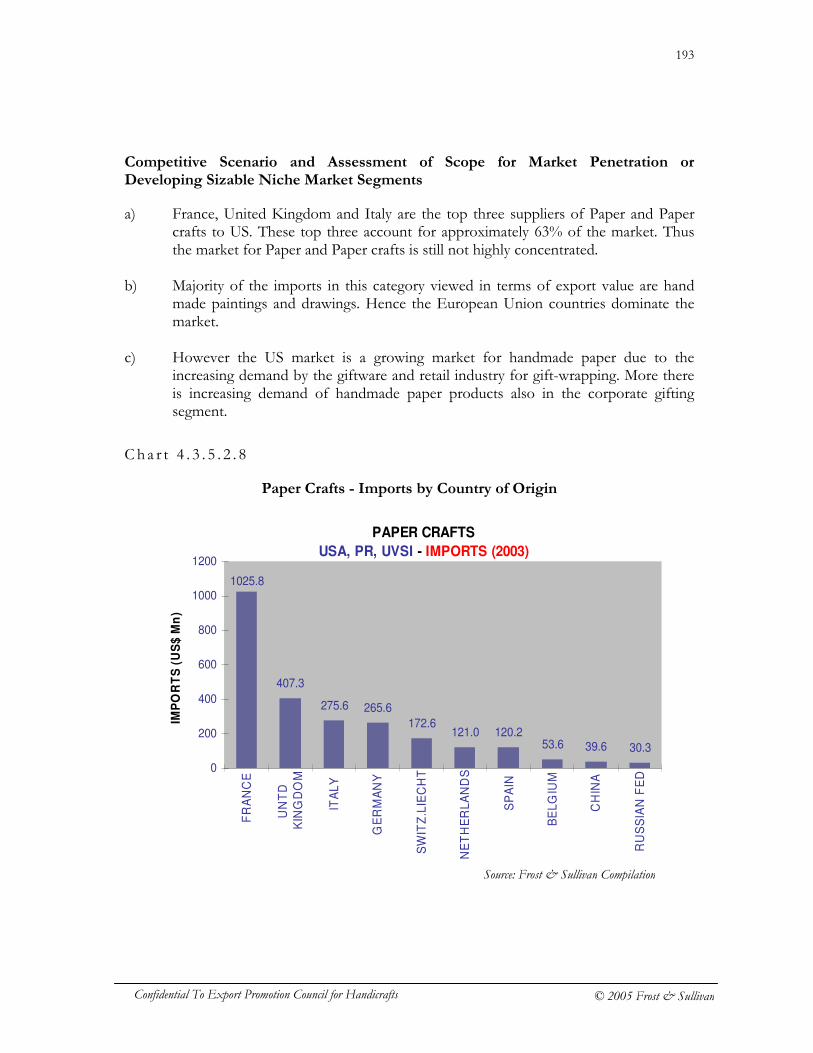
193
Confidential To Export Promotion Council for Handicrafts © 2005 Frost & Sullivan
Competitive Scenario and Assessment of Scope for Market Penetration or Developing Sizable Niche Market Segments
a) France, United Kingdom and Italy are the top three suppliers of Paper and Paper crafts to US. These top three account for approximately 63% of the market. Thus the market for Paper and Paper crafts is still not highly concentrated.
b) Majority of the imports in this category viewed in terms of export value are hand
made paintings and drawings. Hence the European Union countries dominate the market.
c) However the US market is a growing market for handmade paper due to the
increasing demand by the giftware and retail industry for gift-wrapping. More there is increasing demand of handmade paper products also in the corporate gifting segment.
Ch a r t 4 . 3 . 5 . 2 . 8
Paper Crafts - Imports by Country of Origin
PAPER CRAFTS
USA, PR, UVSI - IMPORTS (2003)
407.3
275.6 265.6
172.6121.0 120.2
53.6 39.6 30.3
1025.8
0
200
400
600
800
1000
1200
FR
AN
CE
UN
TD
KIN
GD
OM
ITA
LY
GE
RM
AN
Y
SW
ITZ
.LIE
CH
T
NE
TH
ER
LA
ND
S
SP
AIN
BE
LG
IUM
CH
INA
RU
SS
IAN
FE
D
IMP
OR
TS
(U
S$
Mn
)
Source: Frost & Sullivan Compilation
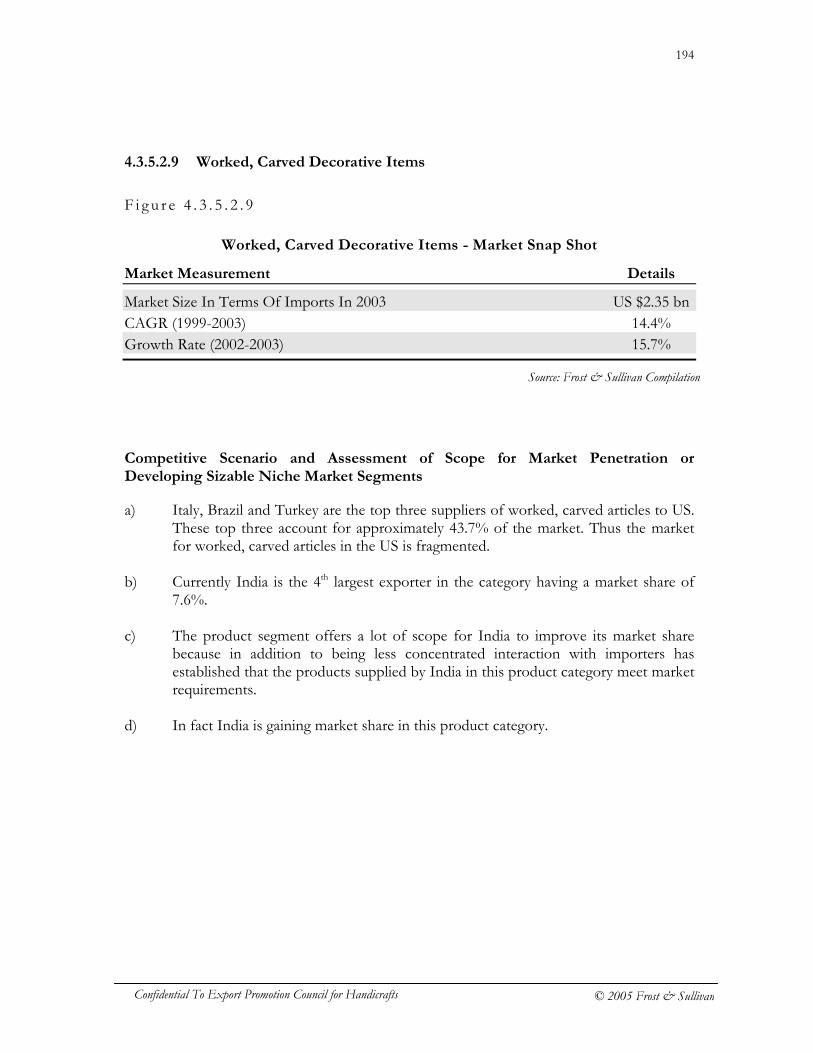
194
Confidential To Export Promotion Council for Handicrafts © 2005 Frost & Sullivan
4.3.5.2.9 Worked, Carved Decorative Items
F i g u r e 4 . 3 . 5 . 2 . 9
Worked, Carved Decorative Items - Market Snap Shot
Market Measurement Details
Market Size In Terms Of Imports In 2003 US $2.35 bn CAGR (1999-2003) 14.4% Growth Rate (2002-2003) 15.7%
Competitive Scenario and Assessment of Scope for Market Penetration or Developing Sizable Niche Market Segments
a) Italy, Brazil and Turkey are the top three suppliers of worked, carved articles to US. These top three account for approximately 43.7% of the market. Thus the market for worked, carved articles in the US is fragmented.
b) Currently India is the 4th largest exporter in the category having a market share of
7.6%. c) The product segment offers a lot of scope for India to improve its market share
because in addition to being less concentrated interaction with importers has established that the products supplied by India in this product category meet market requirements.
d) In fact India is gaining market share in this product category.
Source: Frost & Sullivan Compilation
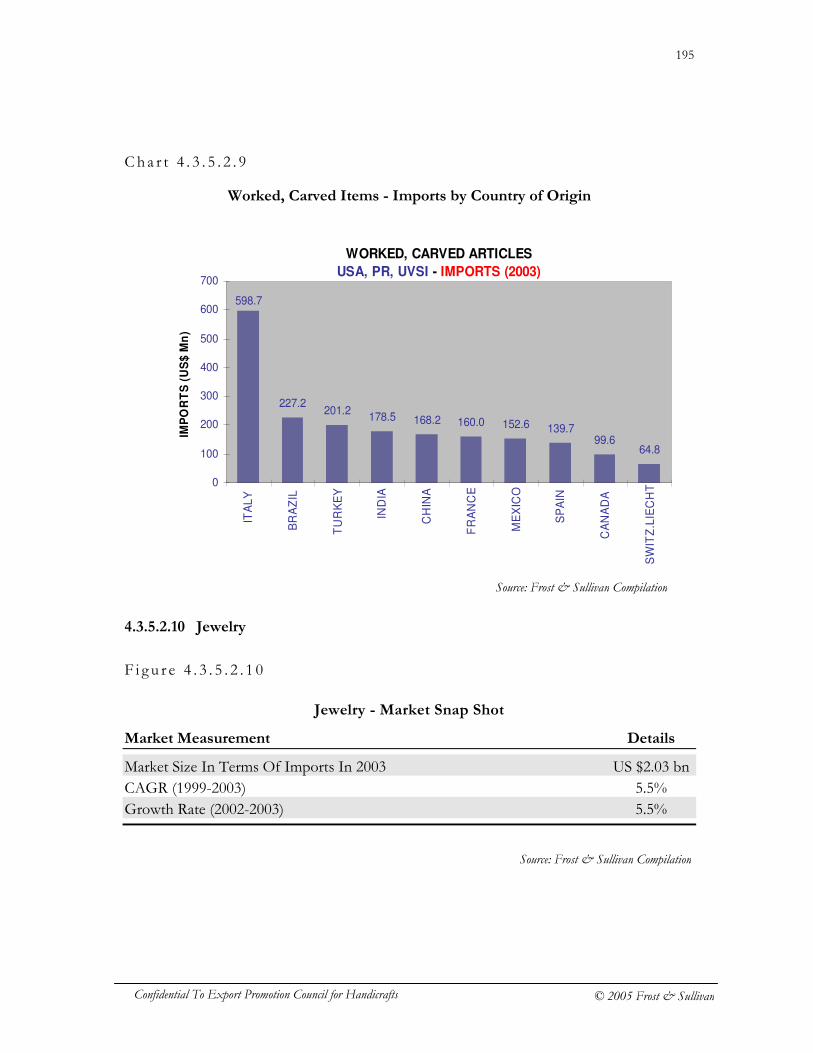
195
Confidential To Export Promotion Council for Handicrafts © 2005 Frost & Sullivan
Cha r t 4 . 3 . 5 . 2 . 9
Worked, Carved Items - Imports by Country of Origin 4.3.5.2.10 Jewelry
F i g u r e 4 . 3 . 5 . 2 . 1 0
Jewelry - Market Snap Shot
Market Measurement Details
Market Size In Terms Of Imports In 2003 US $2.03 bn CAGR (1999-2003) 5.5% Growth Rate (2002-2003) 5.5%
Source: Frost & Sullivan Compilation
Source: Frost & Sullivan Compilation
WORKED, CARVED ARTICLES
USA, PR, UVSI - IMPORTS (2003)
227.2201.2
178.5 168.2 160.0 152.6 139.799.6
64.8
598.7
0
100
200
300
400
500
600
700
ITA
LY
BR
AZ
IL
TU
RK
EY
IND
IA
CH
INA
FR
AN
CE
ME
XIC
O
SP
AIN
CA
NA
DA
SW
ITZ
.LIE
CH
T
IMP
OR
TS
(U
S$
Mn
)
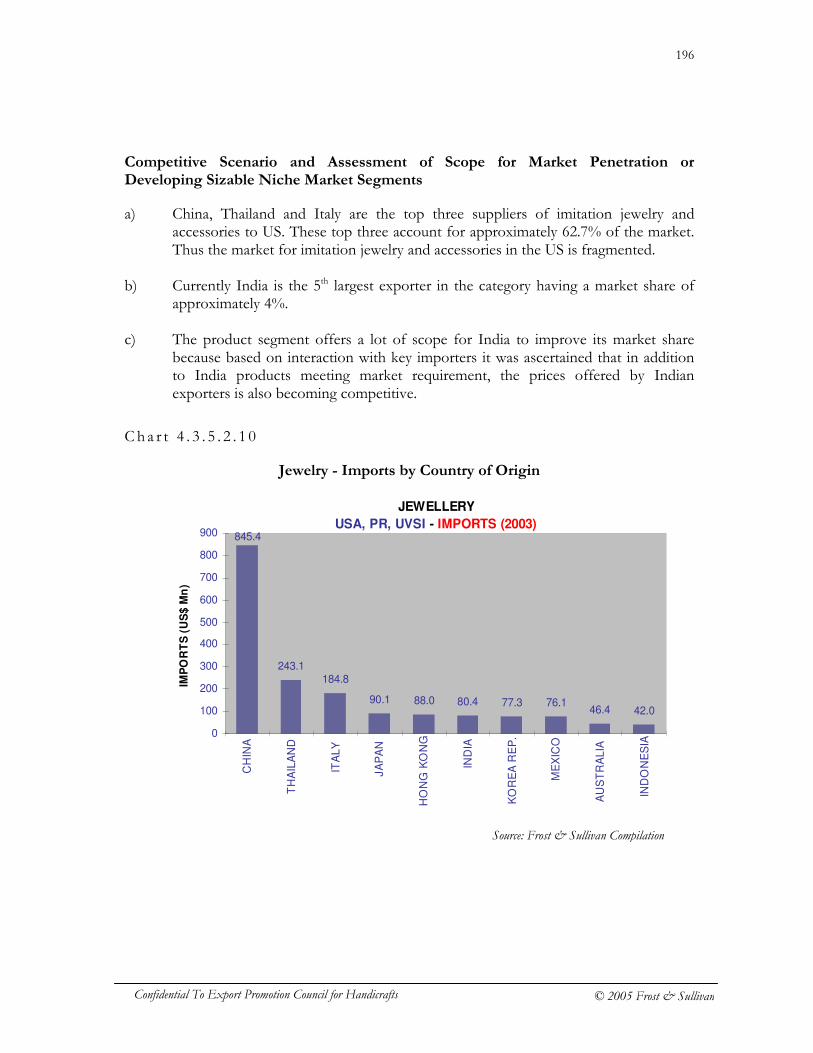
196
Confidential To Export Promotion Council for Handicrafts © 2005 Frost & Sullivan
Competitive Scenario and Assessment of Scope for Market Penetration or Developing Sizable Niche Market Segments
a) China, Thailand and Italy are the top three suppliers of imitation jewelry and accessories to US. These top three account for approximately 62.7% of the market. Thus the market for imitation jewelry and accessories in the US is fragmented.
b) Currently India is the 5th largest exporter in the category having a market share of
approximately 4%. c) The product segment offers a lot of scope for India to improve its market share
because based on interaction with key importers it was ascertained that in addition to India products meeting market requirement, the prices offered by Indian exporters is also becoming competitive.
Ch a r t 4 . 3 . 5 . 2 . 1 0
Jewelry - Imports by Country of Origin
Source: Frost & Sullivan Compilation
JEWELLERY
USA, PR, UVSI - IMPORTS (2003)
243.1184.8
90.1 88.0 80.4 77.3 76.146.4 42.0
845.4
0
100
200
300
400
500
600
700
800
900
CH
INA
TH
AIL
AN
D
ITA
LY
JA
PA
N
HO
NG
KO
NG
IND
IA
KO
RE
A R
EP
.
ME
XIC
O
AU
ST
RA
LIA
IND
ON
ES
IA
IMP
OR
TS
(U
S$
Mn
)
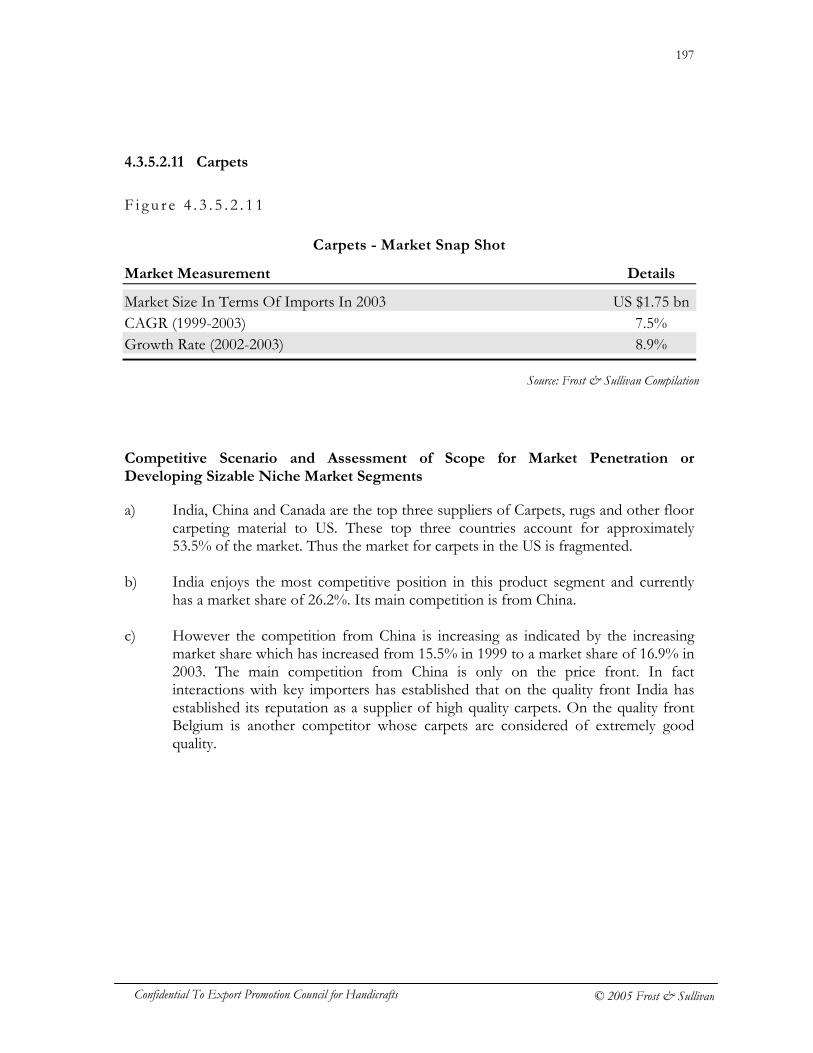
197
Confidential To Export Promotion Council for Handicrafts © 2005 Frost & Sullivan
4.3.5.2.11 Carpets
F i g u r e 4 . 3 . 5 . 2 . 1 1
Carpets - Market Snap Shot
Market Measurement Details
Market Size In Terms Of Imports In 2003 US $1.75 bn CAGR (1999-2003) 7.5% Growth Rate (2002-2003) 8.9%
Competitive Scenario and Assessment of Scope for Market Penetration or Developing Sizable Niche Market Segments
a) India, China and Canada are the top three suppliers of Carpets, rugs and other floor carpeting material to US. These top three countries account for approximately 53.5% of the market. Thus the market for carpets in the US is fragmented.
b) India enjoys the most competitive position in this product segment and currently
has a market share of 26.2%. Its main competition is from China. c) However the competition from China is increasing as indicated by the increasing
market share which has increased from 15.5% in 1999 to a market share of 16.9% in 2003. The main competition from China is only on the price front. In fact interactions with key importers has established that on the quality front India has established its reputation as a supplier of high quality carpets. On the quality front Belgium is another competitor whose carpets are considered of extremely good quality.
Source: Frost & Sullivan Compilation
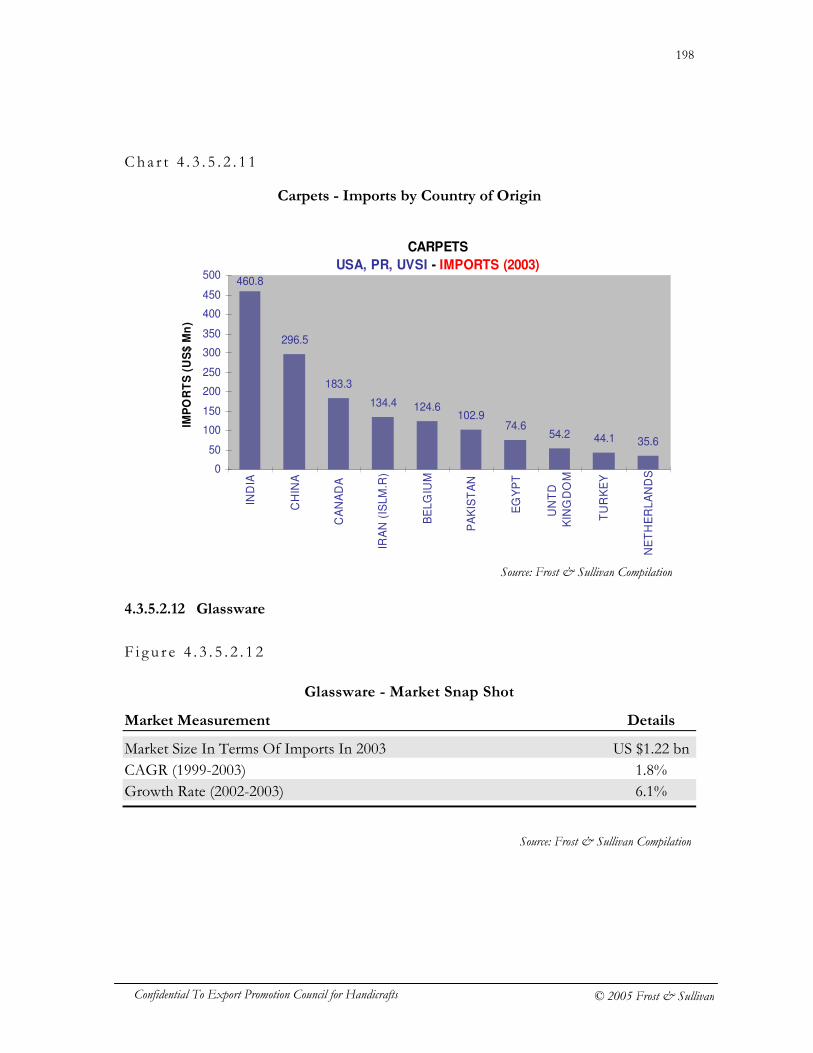
198
Confidential To Export Promotion Council for Handicrafts © 2005 Frost & Sullivan
Cha r t 4 . 3 . 5 . 2 . 1 1
Carpets - Imports by Country of Origin 4.3.5.2.12 Glassware
F i g u r e 4 . 3 . 5 . 2 . 1 2
Glassware - Market Snap Shot
Market Measurement Details
Market Size In Terms Of Imports In 2003 US $1.22 bn CAGR (1999-2003) 1.8% Growth Rate (2002-2003) 6.1%
Source: Frost & Sullivan Compilation
CARPETS
USA, PR, UVSI - IMPORTS (2003)
296.5
183.3
134.4 124.6102.9
74.654.2 44.1 35.6
460.8
0
50
100
150
200
250
300
350
400
450
500
IND
IA
CH
INA
CA
NA
DA
IRA
N (
ISL
M.R
)
BE
LG
IUM
PA
KIS
TA
N
EG
YP
T
UN
TD
KIN
GD
OM
TU
RK
EY
NE
TH
ER
LA
ND
S
IMP
OR
TS
(U
S$
Mn
)
Source: Frost & Sullivan Compilation
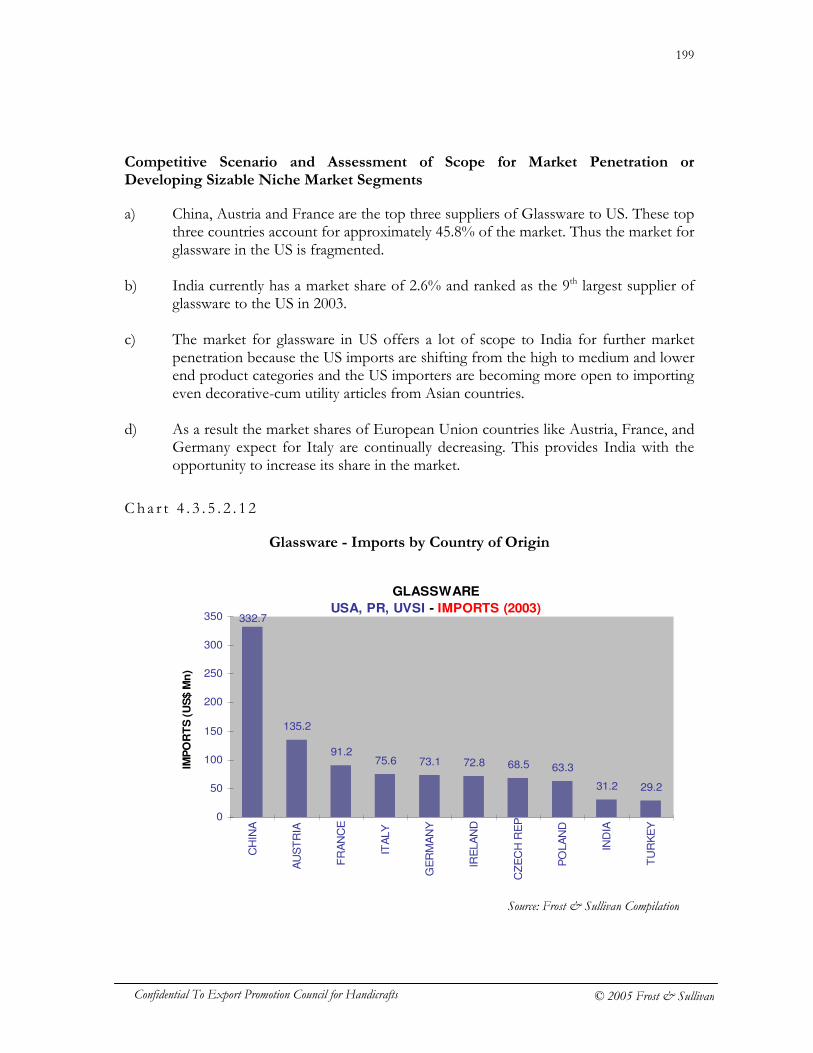
199
Confidential To Export Promotion Council for Handicrafts © 2005 Frost & Sullivan
Competitive Scenario and Assessment of Scope for Market Penetration or Developing Sizable Niche Market Segments
a) China, Austria and France are the top three suppliers of Glassware to US. These top three countries account for approximately 45.8% of the market. Thus the market for glassware in the US is fragmented.
b) India currently has a market share of 2.6% and ranked as the 9th largest supplier of
glassware to the US in 2003. c) The market for glassware in US offers a lot of scope to India for further market
penetration because the US imports are shifting from the high to medium and lower end product categories and the US importers are becoming more open to importing even decorative-cum utility articles from Asian countries.
d) As a result the market shares of European Union countries like Austria, France, and
Germany expect for Italy are continually decreasing. This provides India with the opportunity to increase its share in the market.
C h a r t 4 . 3 . 5 . 2 . 1 2
Glassware - Imports by Country of Origin
GLASSWARE
USA, PR, UVSI - IMPORTS (2003)
135.2
91.275.6 73.1 72.8 68.5 63.3
31.2 29.2
332.7
0
50
100
150
200
250
300
350
CH
INA
AU
ST
RIA
FR
AN
CE
ITA
LY
GE
RM
AN
Y
IRE
LA
ND
CZ
EC
H R
EP
PO
LA
ND
IND
IA
TU
RK
EY
IMP
OR
TS
(U
S$ M
n)
Source: Frost & Sullivan Compilation
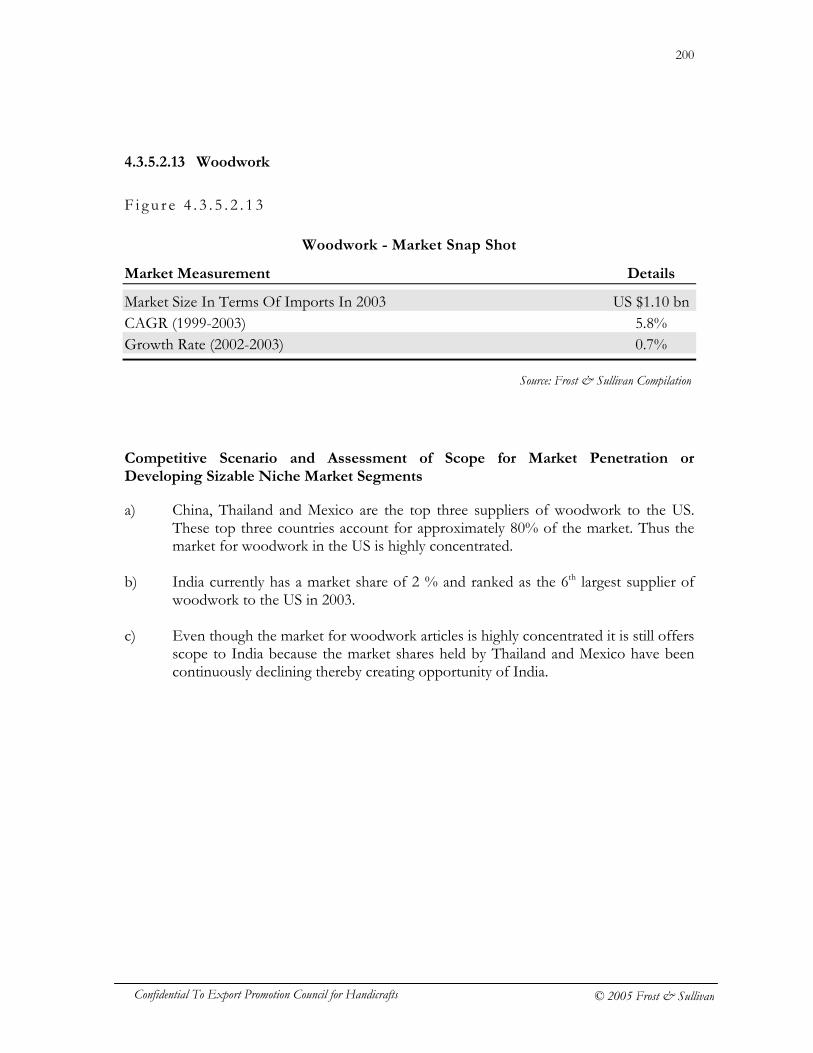
200
Confidential To Export Promotion Council for Handicrafts © 2005 Frost & Sullivan
4.3.5.2.13 Woodwork
F i g u r e 4 . 3 . 5 . 2 . 1 3
Woodwork - Market Snap Shot
Market Measurement Details
Market Size In Terms Of Imports In 2003 US $1.10 bn CAGR (1999-2003) 5.8% Growth Rate (2002-2003) 0.7%
Competitive Scenario and Assessment of Scope for Market Penetration or Developing Sizable Niche Market Segments
a) China, Thailand and Mexico are the top three suppliers of woodwork to the US. These top three countries account for approximately 80% of the market. Thus the market for woodwork in the US is highly concentrated.
b) India currently has a market share of 2 % and ranked as the 6th largest supplier of
woodwork to the US in 2003. c) Even though the market for woodwork articles is highly concentrated it is still offers
scope to India because the market shares held by Thailand and Mexico have been continuously declining thereby creating opportunity of India.
Source: Frost & Sullivan Compilation
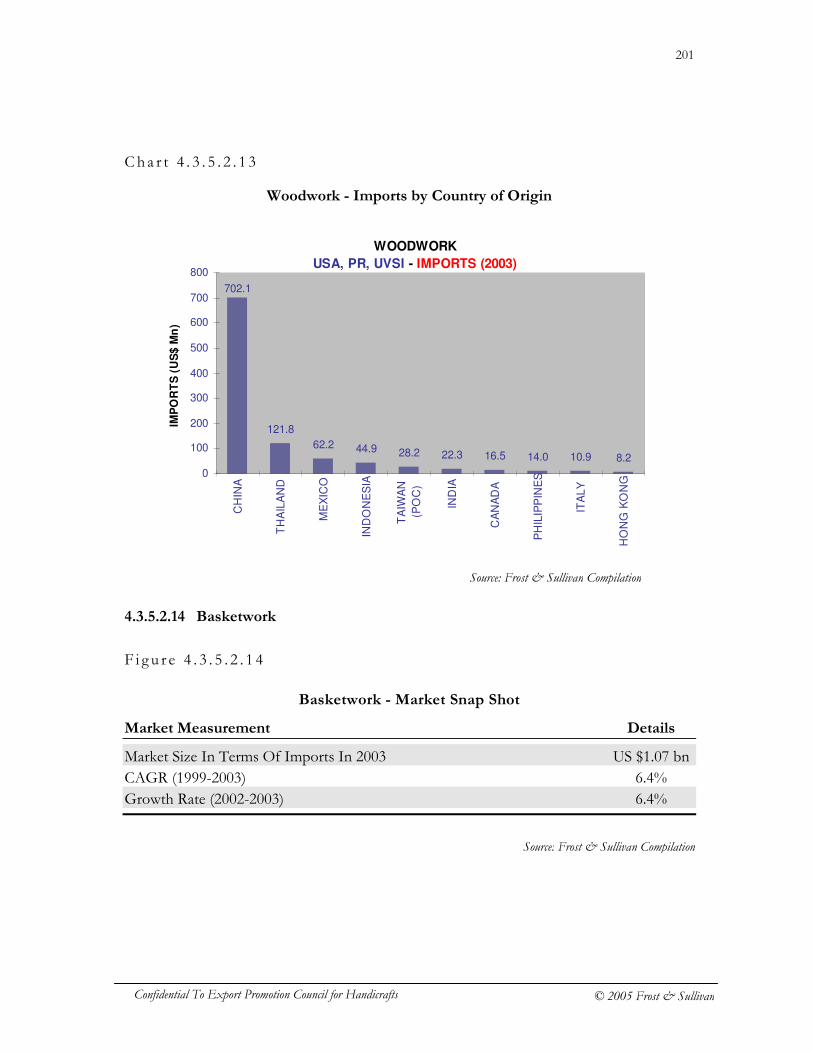
201
Confidential To Export Promotion Council for Handicrafts © 2005 Frost & Sullivan
Cha r t 4 . 3 . 5 . 2 . 1 3
Woodwork - Imports by Country of Origin
4.3.5.2.14 Basketwork
F i g u r e 4 . 3 . 5 . 2 . 1 4
Basketwork - Market Snap Shot
Market Measurement Details
Market Size In Terms Of Imports In 2003 US $1.07 bn CAGR (1999-2003) 6.4% Growth Rate (2002-2003) 6.4%
Source: Frost & Sullivan Compilation
Source: Frost & Sullivan Compilation
WOODWORK
USA, PR, UVSI - IMPORTS (2003)
121.8
62.2 44.9 28.2 22.3 16.5 14.0 10.9 8.2
702.1
0
100
200
300
400
500
600
700
800
CH
INA
TH
AIL
AN
D
ME
XIC
O
IND
ON
ES
IA
TA
IWA
N
(PO
C)
IND
IA
CA
NA
DA
PH
ILIP
PIN
ES
ITA
LY
HO
NG
KO
NG
IMP
OR
TS
(U
S$
Mn
)
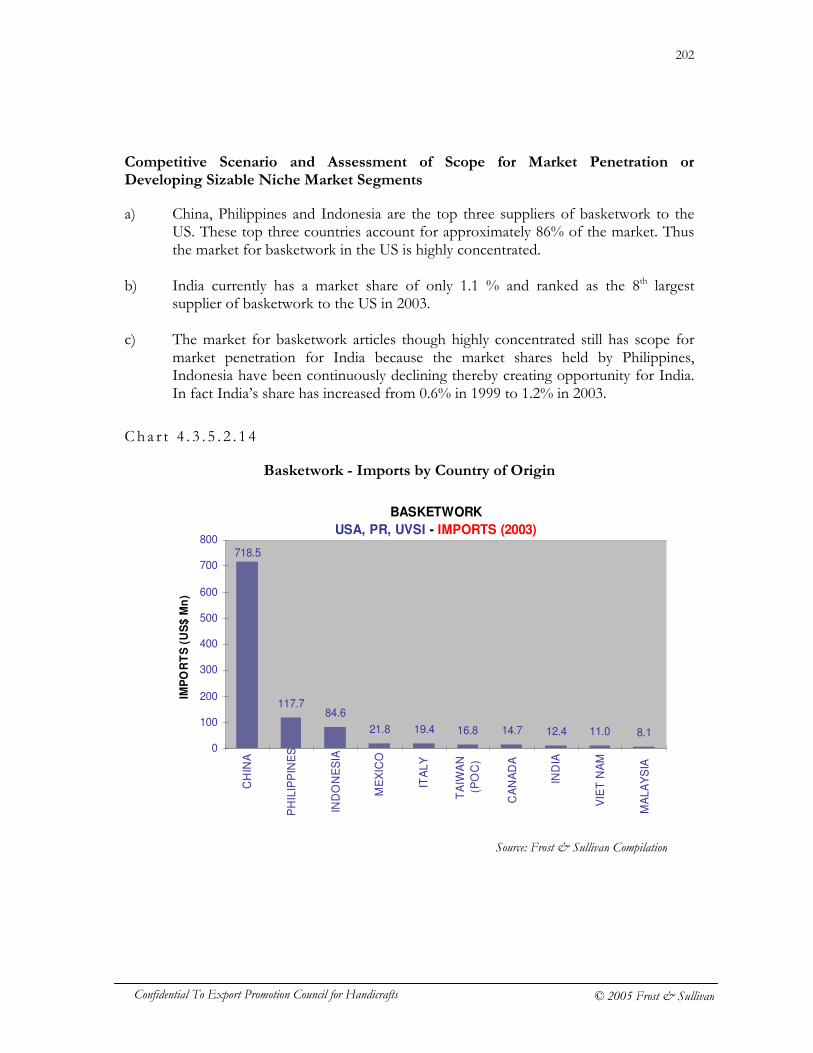
202
Confidential To Export Promotion Council for Handicrafts © 2005 Frost & Sullivan
Competitive Scenario and Assessment of Scope for Market Penetration or Developing Sizable Niche Market Segments
a) China, Philippines and Indonesia are the top three suppliers of basketwork to the US. These top three countries account for approximately 86% of the market. Thus the market for basketwork in the US is highly concentrated.
b) India currently has a market share of only 1.1 % and ranked as the 8th largest
supplier of basketwork to the US in 2003. c) The market for basketwork articles though highly concentrated still has scope for
market penetration for India because the market shares held by Philippines, Indonesia have been continuously declining thereby creating opportunity for India. In fact India’s share has increased from 0.6% in 1999 to 1.2% in 2003.
Ch a r t 4 . 3 . 5 . 2 . 1 4
Basketwork - Imports by Country of Origin
BASKETWORK
USA, PR, UVSI - IMPORTS (2003)
117.784.6
21.8 19.4 16.8 14.7 12.4 11.0 8.1
718.5
0
100
200
300
400
500
600
700
800
CH
INA
PH
ILIP
PIN
ES
IND
ON
ES
IA
ME
XIC
O
ITA
LY
TA
IWA
N
(PO
C)
CA
NA
DA
IND
IA
VIE
T N
AM
MA
LA
YS
IA
IMP
OR
TS
(U
S$
Mn
)
Source: Frost & Sullivan Compilation
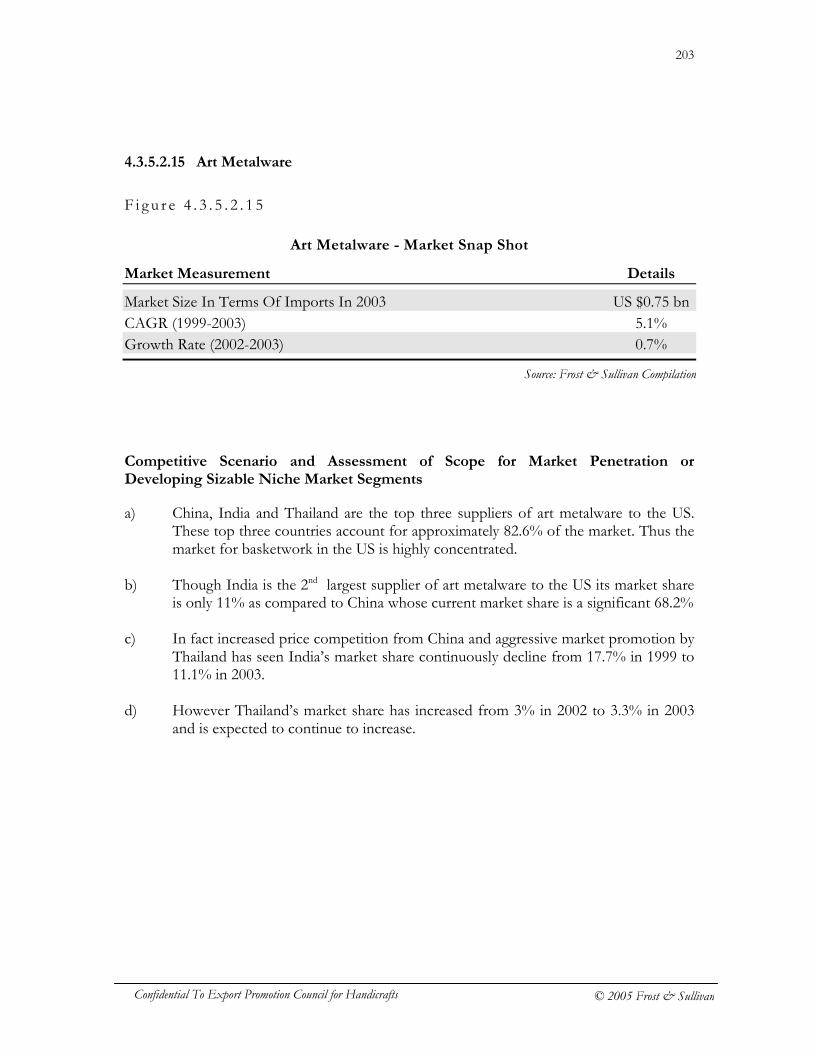
203
Confidential To Export Promotion Council for Handicrafts © 2005 Frost & Sullivan
4.3.5.2.15 Art Metalware
F i g u r e 4 . 3 . 5 . 2 . 1 5
Art Metalware - Market Snap Shot
Market Measurement Details
Market Size In Terms Of Imports In 2003 US $0.75 bn CAGR (1999-2003) 5.1% Growth Rate (2002-2003) 0.7%
Competitive Scenario and Assessment of Scope for Market Penetration or Developing Sizable Niche Market Segments
a) China, India and Thailand are the top three suppliers of art metalware to the US. These top three countries account for approximately 82.6% of the market. Thus the market for basketwork in the US is highly concentrated.
b) Though India is the 2nd largest supplier of art metalware to the US its market share
is only 11% as compared to China whose current market share is a significant 68.2% c) In fact increased price competition from China and aggressive market promotion by
Thailand has seen India’s market share continuously decline from 17.7% in 1999 to 11.1% in 2003.
d) However Thailand’s market share has increased from 3% in 2002 to 3.3% in 2003
and is expected to continue to increase.
Source: Frost & Sullivan Compilation
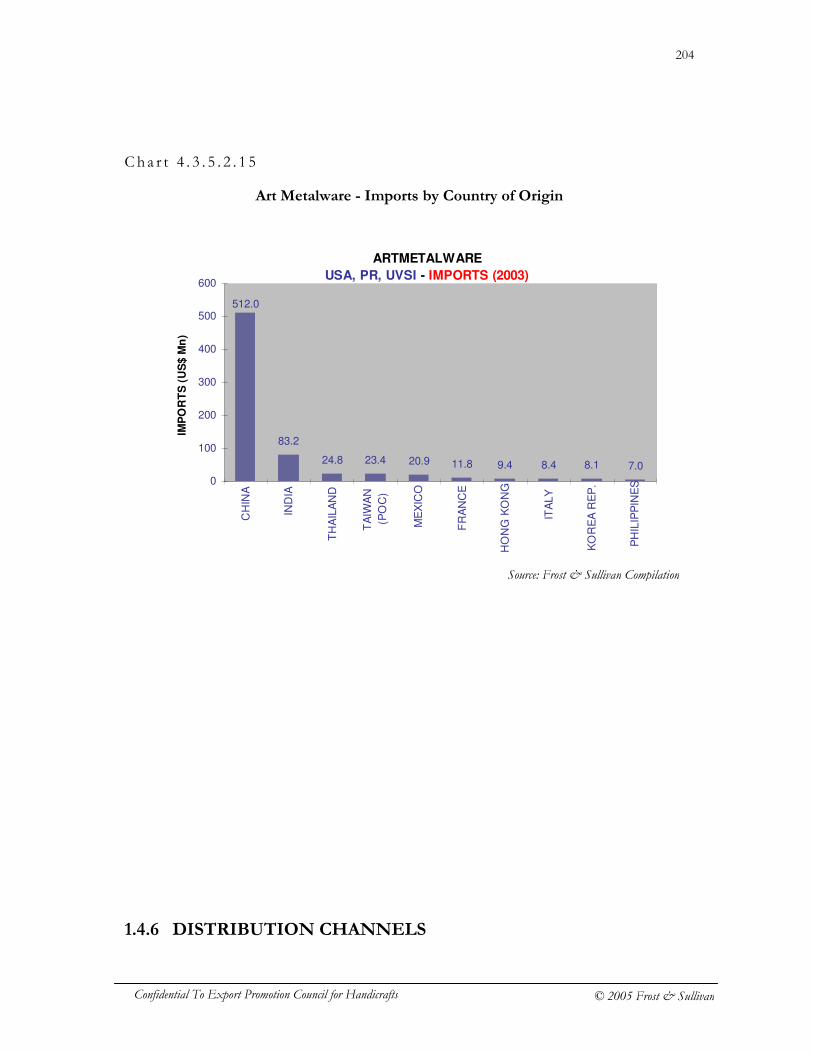
204
Confidential To Export Promotion Council for Handicrafts © 2005 Frost & Sullivan
Cha r t 4 . 3 . 5 . 2 . 1 5
Art Metalware - Imports by Country of Origin
1.4.6 DISTRIBUTION CHANNELS
ARTMETALWARE
USA, PR, UVSI - IMPORTS (2003)
83.2
24.8 23.4 20.9 11.8 9.4 8.4 8.1 7.0
512.0
0
100
200
300
400
500
600
CH
INA
IND
IA
TH
AIL
AN
D
TA
IWA
N
(PO
C)
ME
XIC
O
FR
AN
CE
HO
NG
KO
NG
ITA
LY
KO
RE
A R
EP
.
PH
ILIP
PIN
ES
IMP
OR
TS
(U
S$ M
n)
Source: Frost & Sullivan Compilation
205
Confidential To Export Promotion Council for Handicrafts © 2005 Frost & Sullivan
a) There is a definite trend in the US market towards flattening of the distribution channels for crafts and decorative products. The reason being, importers/ wholesalers and large retailers want a closer relationship with production in order to implement customized product development, an essential for staying competitive in the US market. As such the importers/wholesalers are increasingly buying from producers with export marketing capacity, thus eliminating the need for an independent exporter and as they are working less with sales representatives.
b) Secondly, there has been a rapid growth in the increase of crafts and decorative
products sales through large retailers like national and chain stores and mail order catalogue which has further accelerated the flattening of the distribution channels. This is mainly because the large retail chains prefer to import directly from the producers and thus eliminate the role of the importers/wholesaler. Direct import-retailers that work with more than one supplier in a given country often opt to work with an independent agent or an overseas export consolidator who is responsible for coordinating orders and shipments. Mass Merchant Retailers like Wal-Mart, K-Mart have their own sourcing offices in important supplying nations.
c) The small importers/wholesalers are also no longer working with sales
representatives so as to keep price margins competitive & because sales representatives are geared to work with large wholesale companies that have greater volumes and higher price margins than small to medium-sized companies.
d) The initial point of interaction is mostly International Giftware, Craft and Toys
shows/exhibitions or US wholesale trade shows and the percentage of retail trade buyers attending these shows has gone up considerably with approximately above 8% of giftware retailers attending Foreign Trade shows.
e) Due to above mentioned changes taking place in the distribution scenario, the crafts
and decorative products move from the manufacturer/exporter through their agents to large importers/wholesalers or directly to large retailers. The agents become convenient for exporters as well as importers as they have their warehouses for effective storage and distribution.
f) Small retailers however purchase their goods primarily through manufacturer's
representatives and prefer to work with local warehousing resources for fulfillment and delivery of product orders. Many of the manufacturer's representatives in the home decor and gift related market have permanent showrooms in which they display current product lines and introduce new products.
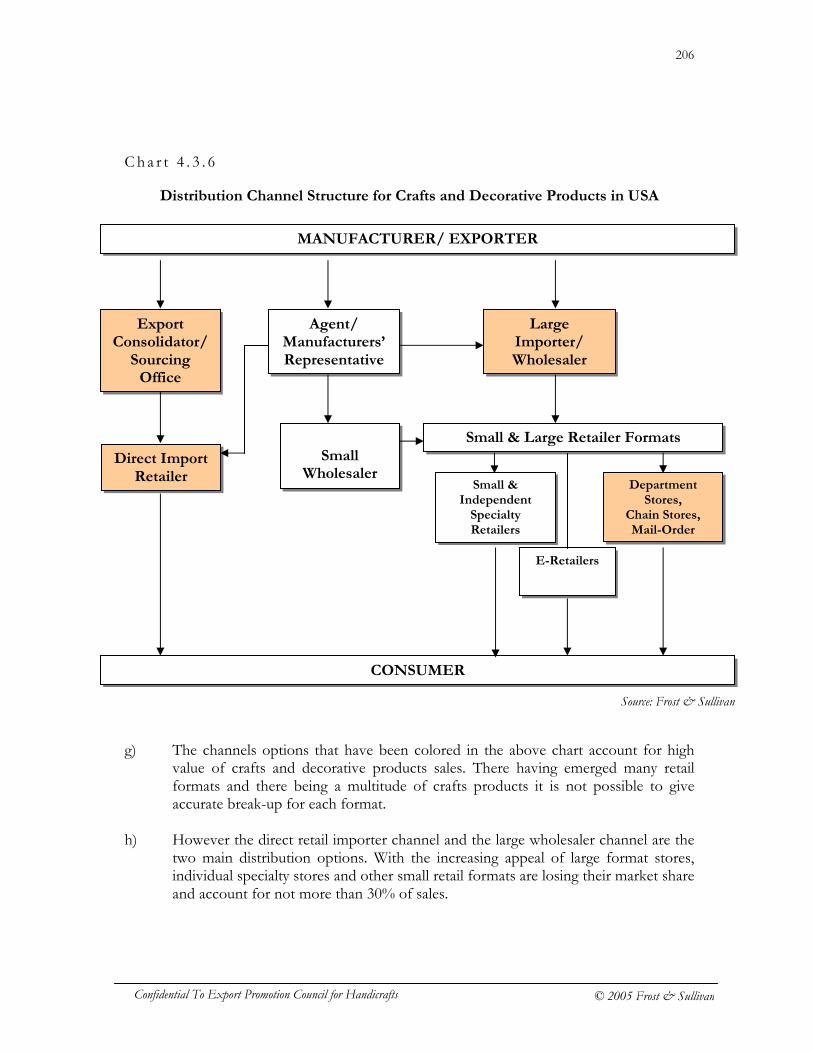
206
Confidential To Export Promotion Council for Handicrafts © 2005 Frost & Sullivan
MANUFACTURER/ EXPORTER
Export Consolidator/
Sourcing Office
CONSUMER
Direct Import Retailer
Agent/ Manufacturers’ Representative
Large Importer/ Wholesaler
Small
Wholesaler
Small & Large Retailer Formats
E-Retailers
Small & Independent
Specialty Retailers
Department Stores,
Chain Stores, Mail-Order
Cha r t 4 . 3 . 6
Distribution Channel Structure for Crafts and Decorative Products in USA
g) The channels options that have been colored in the above chart account for high
value of crafts and decorative products sales. There having emerged many retail formats and there being a multitude of crafts products it is not possible to give accurate break-up for each format.
h) However the direct retail importer channel and the large wholesaler channel are the
two main distribution options. With the increasing appeal of large format stores, individual specialty stores and other small retail formats are losing their market share and account for not more than 30% of sales.
Source: Frost & Sullivan
207
Confidential To Export Promotion Council for Handicrafts © 2005 Frost & Sullivan
i) However according to US Giftware reports the Mail-order retail format accounts for 7% and their share is expected to continue to increase.
j) The alternate distribution channels of Fair-Trade and E-retail account for 0.5 and
0.5 percent respectively. 1.4.7 MARKET ACCESS REQUIREMENTS AND NON-TARIFF
BARRIERS a) The general non-tariff barriers that are encountered while exporting to the US are
related to Packaging, Labeling, and certain other product specific requirements.
Requirements in terms of packaging b) Presently there are no specific restraining requirements in terms of packaging;
however considering that the distribution channels are flattening, a majority of the buyers interviewed expressed that in addition to the shipping boxes being durable they should also be capable to ensure that the buyer can directly re-ship the product to his customer.
c) An increasing number of buyers also are asking for decorative packaging including
the use of lighter weight boxes with custom printing of the company logo, product name, use and instructions.
Requirements in terms of labeling d) As a standard requirement all products that enter the US market must be labeled
with the country of origin e) In addition non food-safe products that will come in direct contact with food
particularly hot food, must be labeled as “decorative use only” f) In case of textiles the fiber content labeling is mandatory where as washing
instructions are recommended. g) Even in case of tabletop items of ceramics, glassware etc, the washing instructions
are recommended.
208
Confidential To Export Promotion Council for Handicrafts © 2005 Frost & Sullivan
Product Specific Requirements h) Products like glassware, ceramics kitchenware and wooden utensils that come in
direct contact with food are subject to stringent Food and Drug Administration (FDA) regulations. However these regulations vary from state to state and currently the state of California has toughest FDA requirements. The importer will be required to submit the products for FDA testing and if a product doesn’t meet FDA standards then it must be labeled as “Decorative Use Only”
i) In addition non food-safe products that will come in direct contact with food
particularly hot food, must be labeled as “decorative use only” j) In case of textiles, in addition to the country of origin which is mandatory, also the
fiber content has to be indicated as a percentage and can be in sewn-in label or as a direct print onto the textile.
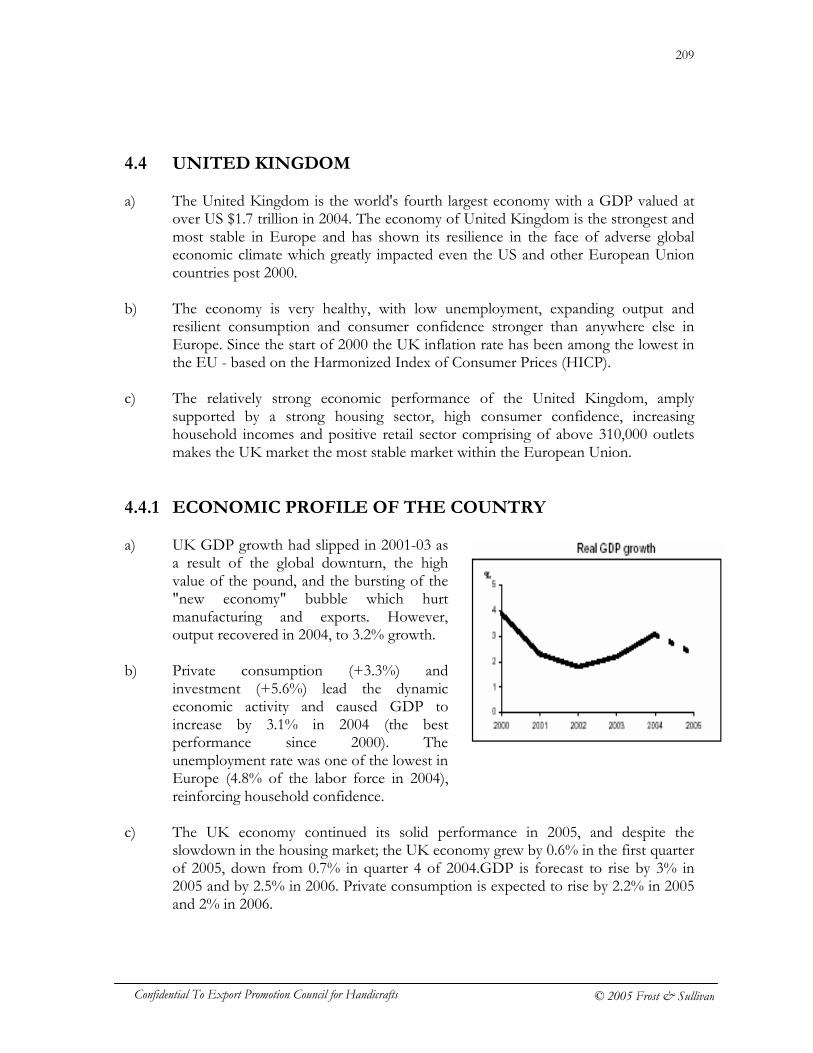
209
Confidential To Export Promotion Council for Handicrafts © 2005 Frost & Sullivan
4.4 UNITED KINGDOM a) The United Kingdom is the world's fourth largest economy with a GDP valued at
over US $1.7 trillion in 2004. The economy of United Kingdom is the strongest and most stable in Europe and has shown its resilience in the face of adverse global economic climate which greatly impacted even the US and other European Union countries post 2000.
b) The economy is very healthy, with low unemployment, expanding output and
resilient consumption and consumer confidence stronger than anywhere else in Europe. Since the start of 2000 the UK inflation rate has been among the lowest in the EU - based on the Harmonized Index of Consumer Prices (HICP).
c) The relatively strong economic performance of the United Kingdom, amply
supported by a strong housing sector, high consumer confidence, increasing household incomes and positive retail sector comprising of above 310,000 outlets makes the UK market the most stable market within the European Union.
4.4.1 ECONOMIC PROFILE OF THE COUNTRY a) UK GDP growth had slipped in 2001-03 as
a result of the global downturn, the high value of the pound, and the bursting of the "new economy" bubble which hurt manufacturing and exports. However, output recovered in 2004, to 3.2% growth.
b) Private consumption (+3.3%) and
investment (+5.6%) lead the dynamic economic activity and caused GDP to increase by 3.1% in 2004 (the best performance since 2000). The unemployment rate was one of the lowest in Europe (4.8% of the labor force in 2004), reinforcing household confidence.
c) The UK economy continued its solid performance in 2005, and despite the
slowdown in the housing market; the UK economy grew by 0.6% in the first quarter of 2005, down from 0.7% in quarter 4 of 2004.GDP is forecast to rise by 3% in 2005 and by 2.5% in 2006. Private consumption is expected to rise by 2.2% in 2005 and 2% in 2006.
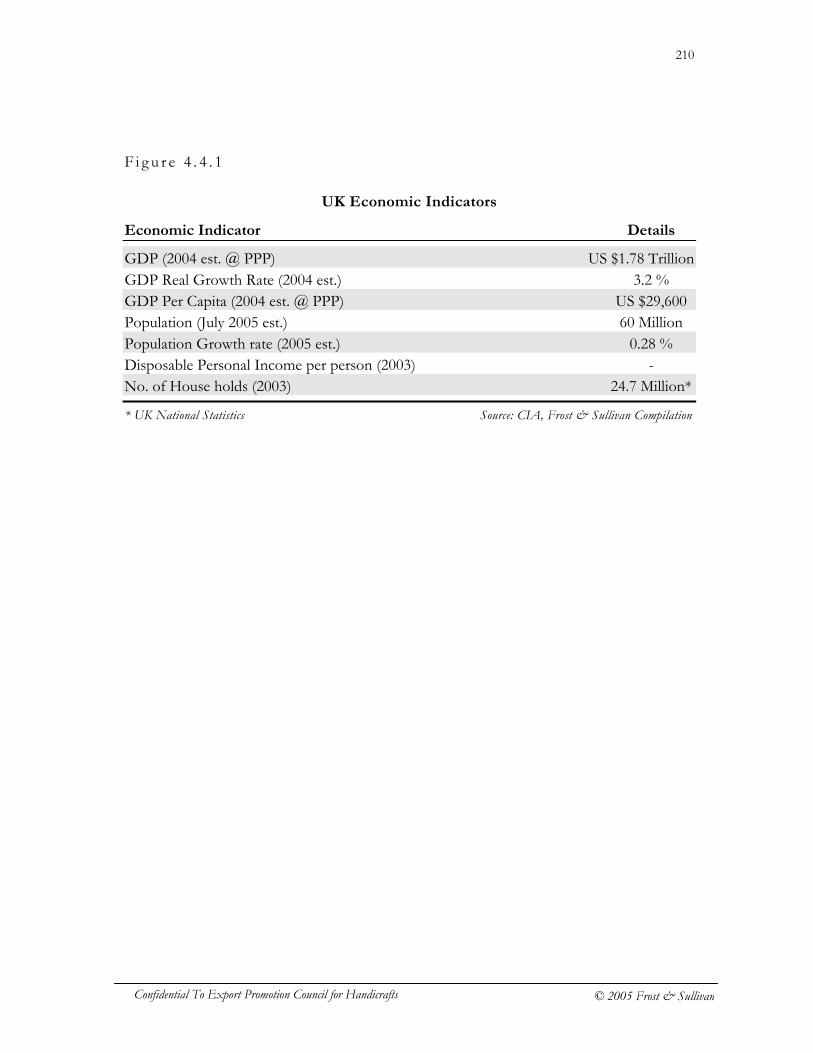
210
Confidential To Export Promotion Council for Handicrafts © 2005 Frost & Sullivan
F i g u r e 4 . 4 . 1
UK Economic Indicators
Economic Indicator Details
GDP (2004 est. @ PPP) US $1.78 Trillion GDP Real Growth Rate (2004 est.) 3.2 % GDP Per Capita (2004 est. @ PPP) US $29,600 Population (July 2005 est.) 60 Million Population Growth rate (2005 est.) 0.28 % Disposable Personal Income per person (2003) - No. of House holds (2003) 24.7 Million*
* UK National Statistics Source: CIA, Frost & Sullivan Compilation
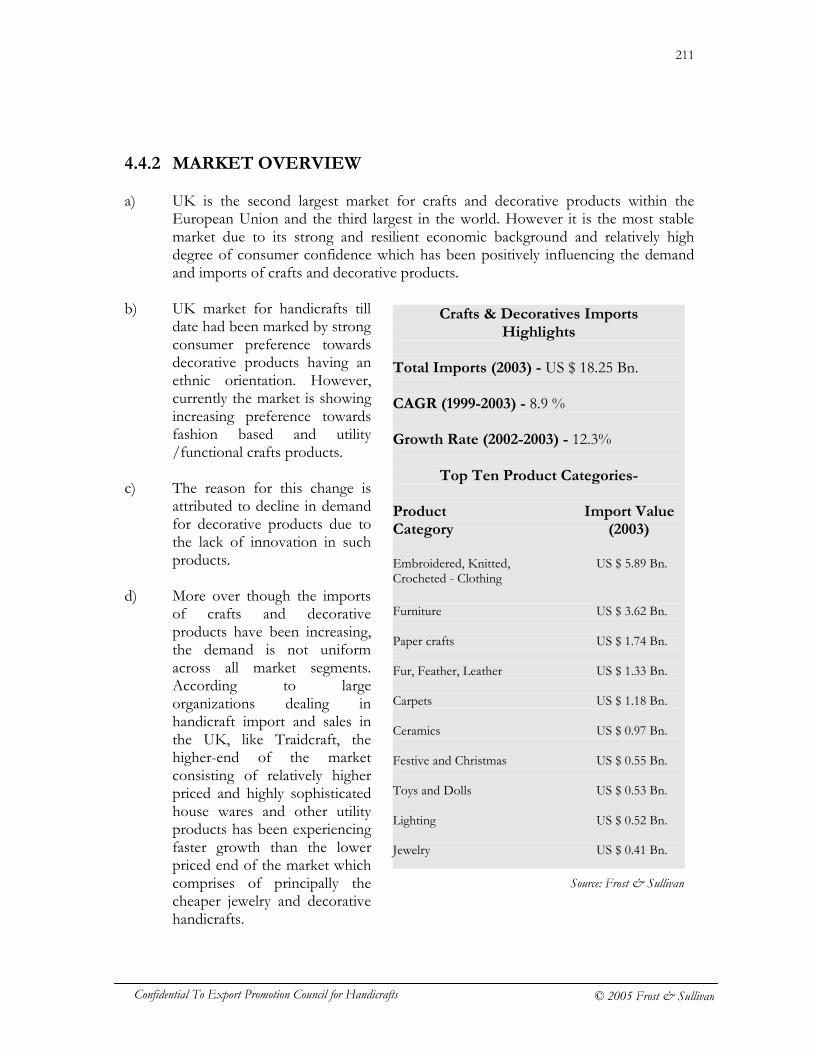
211
Confidential To Export Promotion Council for Handicrafts © 2005 Frost & Sullivan
4.4.2 MARKET OVERVIEW a) UK is the second largest market for crafts and decorative products within the
European Union and the third largest in the world. However it is the most stable market due to its strong and resilient economic background and relatively high degree of consumer confidence which has been positively influencing the demand and imports of crafts and decorative products.
b) UK market for handicrafts till
date had been marked by strong consumer preference towards decorative products having an ethnic orientation. However, currently the market is showing increasing preference towards fashion based and utility /functional crafts products.
c) The reason for this change is
attributed to decline in demand for decorative products due to the lack of innovation in such products.
d) More over though the imports
of crafts and decorative products have been increasing, the demand is not uniform across all market segments. According to large organizations dealing in handicraft import and sales in the UK, like Traidcraft, the higher-end of the market consisting of relatively higher priced and highly sophisticated house wares and other utility products has been experiencing faster growth than the lower priced end of the market which comprises of principally the cheaper jewelry and decorative handicrafts.
Crafts & Decoratives Imports Highlights
Total Imports (2003) - US $ 18.25 Bn. CAGR (1999-2003) - 8.9 % Growth Rate (2002-2003) - 12.3%
Top Ten Product Categories-
Product Import Value Category (2003) Embroidered, Knitted, US $ 5.89 Bn. Crocheted - Clothing Furniture US $ 3.62 Bn. Paper crafts US $ 1.74 Bn. Fur, Feather, Leather US $ 1.33 Bn. Carpets US $ 1.18 Bn. Ceramics US $ 0.97 Bn. Festive and Christmas US $ 0.55 Bn. Toys and Dolls US $ 0.53 Bn. Lighting US $ 0.52 Bn. Jewelry US $ 0.41 Bn.
Source: Frost & Sullivan
212
Confidential To Export Promotion Council for Handicrafts © 2005 Frost & Sullivan
e) This is mainly because of the fact that though price is still an influencer, the focus has shifted on quality of the imported product. Customers are prepared to pay for quality and good design, and there is increasingly strong demand for fashionable and designer goods for the home and garden. The interest at the higher end of the gift and house wares sector can in part be attributed to the popularity of home, garden and DIY shows on British television, which has stimulated demand.
f) This fast is also reflected in the import trend where in large value of imports in
almost all product categories are from the European Union countries like Italy, Belgium, Germany, and Spain who are producers of high quality crafts and decorative products mainly for the higher end markets.
g) However according to reports by Giftware Trade Federation and interaction with
handicraft trade support organizations like Traidcraft, the general opinion was that there was a major North-South divide in UK in terms of consumer purchasing with the South preferring higher-end fashionable products and consumers from the North being very price conscious.
h) In terms of products, the product category that has the highest CAGR of imports
over 1999-2003 is mainly Furniture which has grown by a CAGR of 18.2% and a year on year growth of 31.4% in 2003. In fact according to surveys by Euro monitor UK has the highest per capita consumption of Furniture with a large preference for wooden furniture.
i) Like Germany, UK too has a strong culture of gardening and also continued
importance is given to the home and home décor. In fact till date UK economy has had a strong housing market. As a result products required for the home and garden décor have been very much in demand. As a result worked, carved decorative articles and textile based home furnishings have been products that have been growing at a relatively high CAGR of 17.6% and 13.6% respectively over the period from 1999-2003.
j) The other product categories that have been showing a high degree of sustained
growth are jewelry and basketwork, the supplies of both of which are dominated by the developing Asian countries and China.
k) The other categories that hold potential for Asian exporting nations are woodwork,
embroidered, knitted, crocheted clothing and toys and dolls with majority of the toys and dolls being sourced from overseas contract manufacturers mainly from China and Indonesia.
213
Confidential To Export Promotion Council for Handicrafts © 2005 Frost & Sullivan
4.4.3 KEY FACTORS THAT DRIVE THE MARKET a) Economic and demographic factors that have helped drive demand for crafts and
decorative products in UK are :-
� The UK market for crafts and decorative products has been showing increasing demand due to the strong economy and high consumer confidence that is a major driver on which the industry is heavily dependent.
� The strong housing market scenario has also helped the demand for product
categories like furniture and home furnishings.
� The decreasing unemployment and increasing purchasing power due to increase in household incomes and easy availability of credit facilities has also helped to increase retail purchases of higher-end good quality crafts and decorative products.
b) Consumer and other market specific factors such as,
� The positive attitude of consumers towards home and garden décor has been an important driver for product categories like furniture, home furnishings and other items that can be used to decorate homes.
� The popularity of home, garden and DIY shows on British television has
stimulated demand for higher end products especially in the home décor segment.
� The fact that most UK importers and retailers prefer to deal with locally based
firms had resulted in majority imports from neighboring European Union countries. However the increasing use of a local UK based distributor by Asian countries has resulted in driving imports from Asian countries.
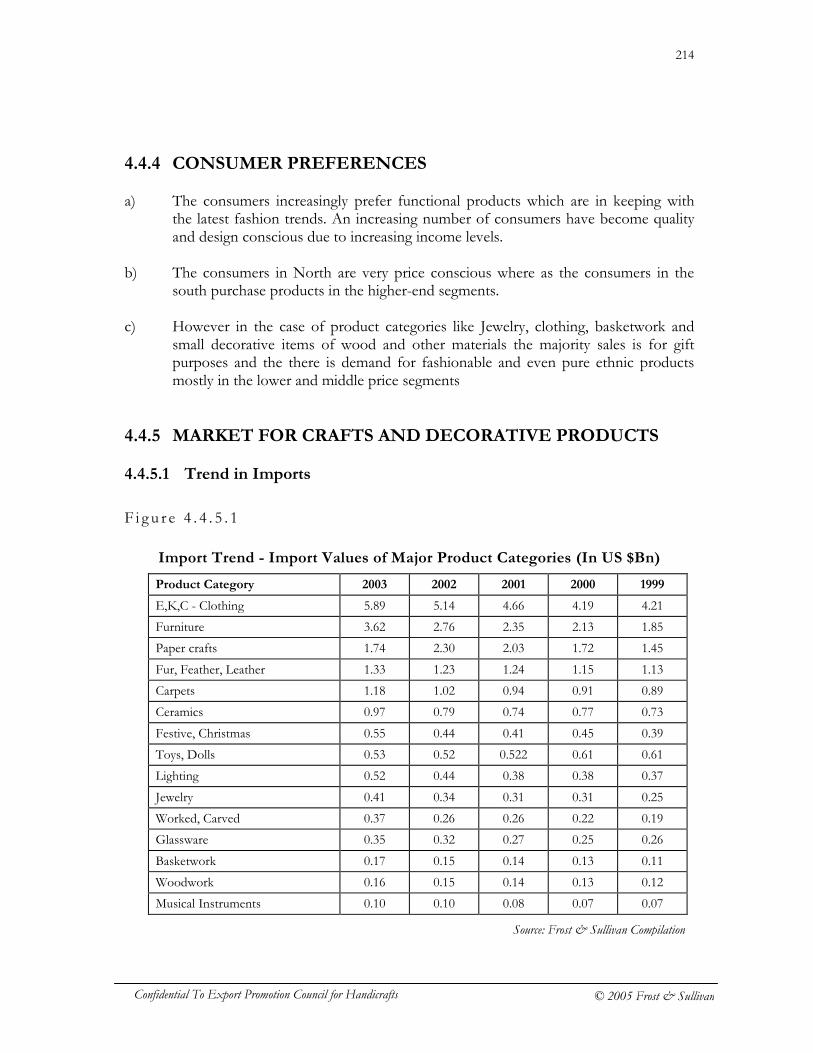
214
Confidential To Export Promotion Council for Handicrafts © 2005 Frost & Sullivan
4.4.4 CONSUMER PREFERENCES a) The consumers increasingly prefer functional products which are in keeping with
the latest fashion trends. An increasing number of consumers have become quality and design conscious due to increasing income levels.
b) The consumers in North are very price conscious where as the consumers in the south purchase products in the higher-end segments.
c) However in the case of product categories like Jewelry, clothing, basketwork and
small decorative items of wood and other materials the majority sales is for gift purposes and the there is demand for fashionable and even pure ethnic products mostly in the lower and middle price segments
4.4.5 MARKET FOR CRAFTS AND DECORATIVE PRODUCTS
4.4.5.1 Trend in Imports
F i g u r e 4 . 4 . 5 . 1
Import Trend - Import Values of Major Product Categories (In US $Bn)
Product Category 2003 2002 2001 2000 1999
E,K,C - Clothing 5.89 5.14 4.66 4.19 4.21
Furniture 3.62 2.76 2.35 2.13 1.85
Paper crafts 1.74 2.30 2.03 1.72 1.45
Fur, Feather, Leather 1.33 1.23 1.24 1.15 1.13
Carpets 1.18 1.02 0.94 0.91 0.89
Ceramics 0.97 0.79 0.74 0.77 0.73
Festive, Christmas 0.55 0.44 0.41 0.45 0.39
Toys, Dolls 0.53 0.52 0.522 0.61 0.61
Lighting 0.52 0.44 0.38 0.38 0.37
Jewelry 0.41 0.34 0.31 0.31 0.25
Worked, Carved 0.37 0.26 0.26 0.22 0.19
Glassware 0.35 0.32 0.27 0.25 0.26
Basketwork 0.17 0.15 0.14 0.13 0.11
Woodwork 0.16 0.15 0.14 0.13 0.12
Musical Instruments 0.10 0.10 0.08 0.07 0.07
Source: Frost & Sullivan Compilation
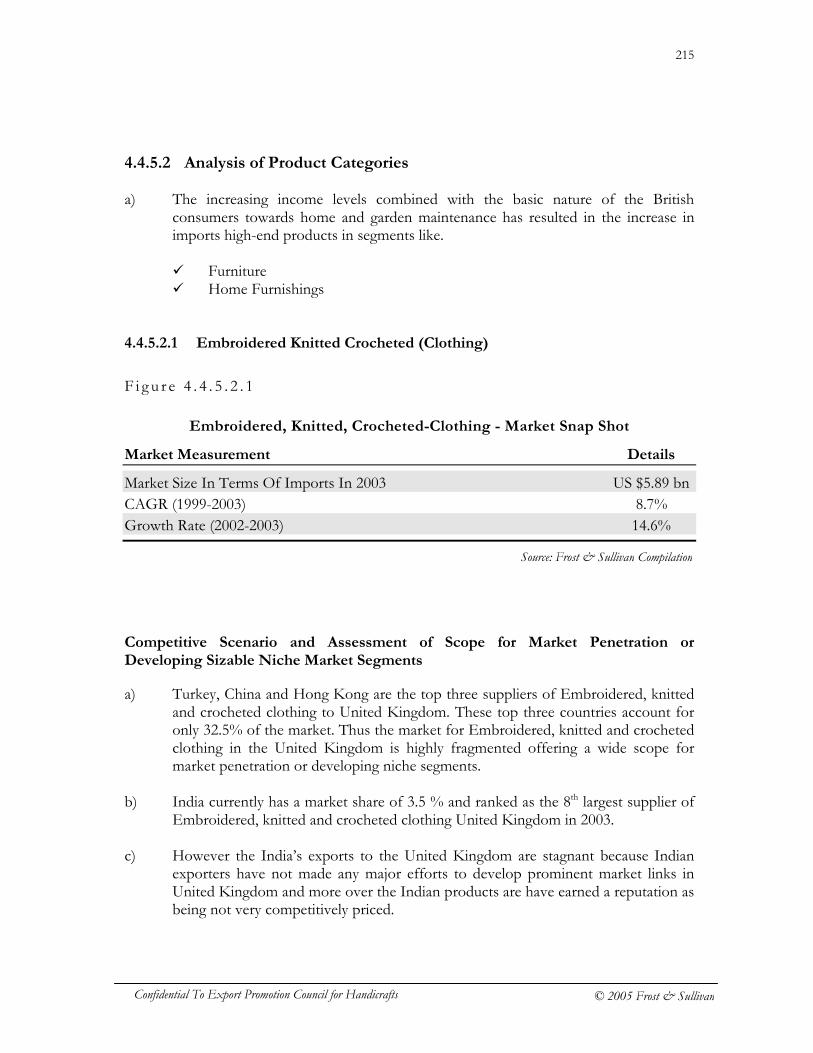
215
Confidential To Export Promotion Council for Handicrafts © 2005 Frost & Sullivan
4.4.5.2 Analysis of Product Categories a) The increasing income levels combined with the basic nature of the British
consumers towards home and garden maintenance has resulted in the increase in imports high-end products in segments like.
� Furniture � Home Furnishings
4.4.5.2.1 Embroidered Knitted Crocheted (Clothing)
F i g u r e 4 . 4 . 5 . 2 . 1
Embroidered, Knitted, Crocheted-Clothing - Market Snap Shot
Market Measurement Details
Market Size In Terms Of Imports In 2003 US $5.89 bn CAGR (1999-2003) 8.7% Growth Rate (2002-2003) 14.6%
Competitive Scenario and Assessment of Scope for Market Penetration or Developing Sizable Niche Market Segments
a) Turkey, China and Hong Kong are the top three suppliers of Embroidered, knitted and crocheted clothing to United Kingdom. These top three countries account for only 32.5% of the market. Thus the market for Embroidered, knitted and crocheted clothing in the United Kingdom is highly fragmented offering a wide scope for market penetration or developing niche segments.
b) India currently has a market share of 3.5 % and ranked as the 8th largest supplier of
Embroidered, knitted and crocheted clothing United Kingdom in 2003. c) However the India’s exports to the United Kingdom are stagnant because Indian
exporters have not made any major efforts to develop prominent market links in United Kingdom and more over the Indian products are have earned a reputation as being not very competitively priced.
Source: Frost & Sullivan Compilation
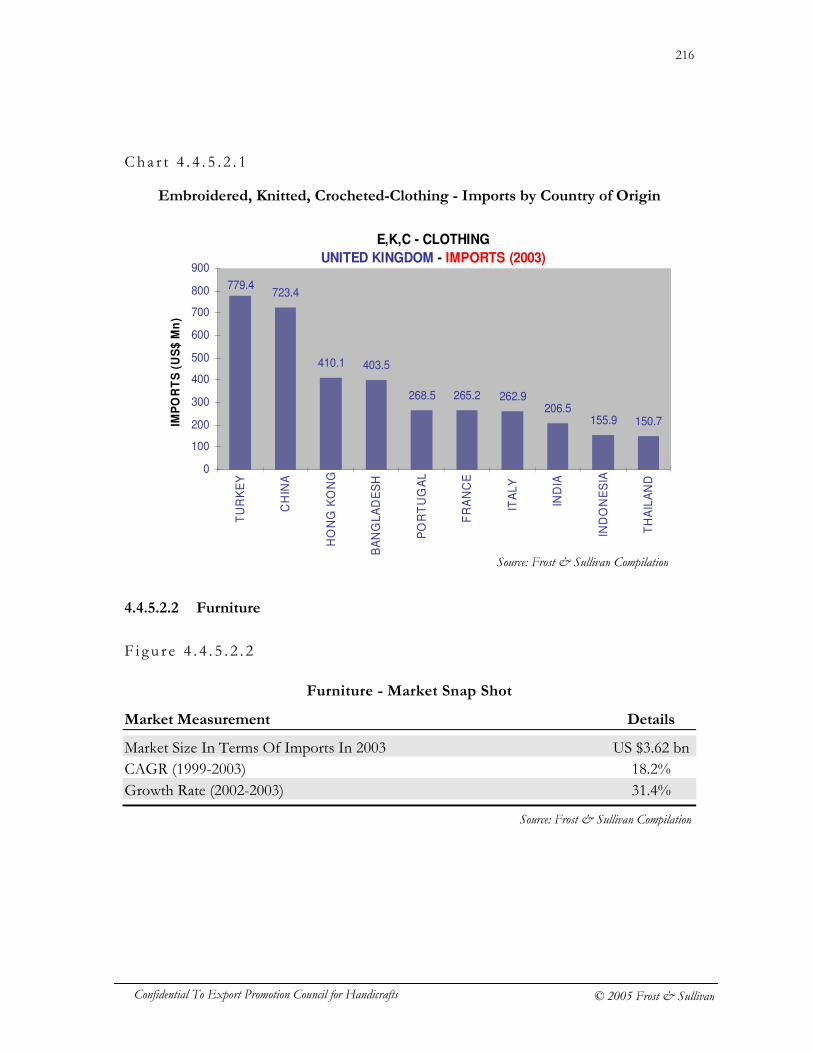
216
Confidential To Export Promotion Council for Handicrafts © 2005 Frost & Sullivan
Cha r t 4 . 4 . 5 . 2 . 1
Embroidered, Knitted, Crocheted-Clothing - Imports by Country of Origin
4.4.5.2.2 Furniture
F i g u r e 4 . 4 . 5 . 2 . 2
Furniture - Market Snap Shot
Market Measurement Details
Market Size In Terms Of Imports In 2003 US $3.62 bn CAGR (1999-2003) 18.2% Growth Rate (2002-2003) 31.4%
E,K,C - CLOTHING
UNITED KINGDOM - IMPORTS (2003)
723.4
410.1 403.5
268.5 265.2 262.9206.5
155.9 150.7
779.4
0
100
200
300
400
500
600
700
800
900
TU
RK
EY
CH
INA
HO
NG
KO
NG
BA
NG
LA
DE
SH
PO
RT
UG
AL
FR
AN
CE
ITA
LY
IND
IA
IND
ON
ES
IA
TH
AIL
AN
D
IMP
OR
TS
(U
S$
Mn
)
Source: Frost & Sullivan Compilation
Source: Frost & Sullivan Compilation
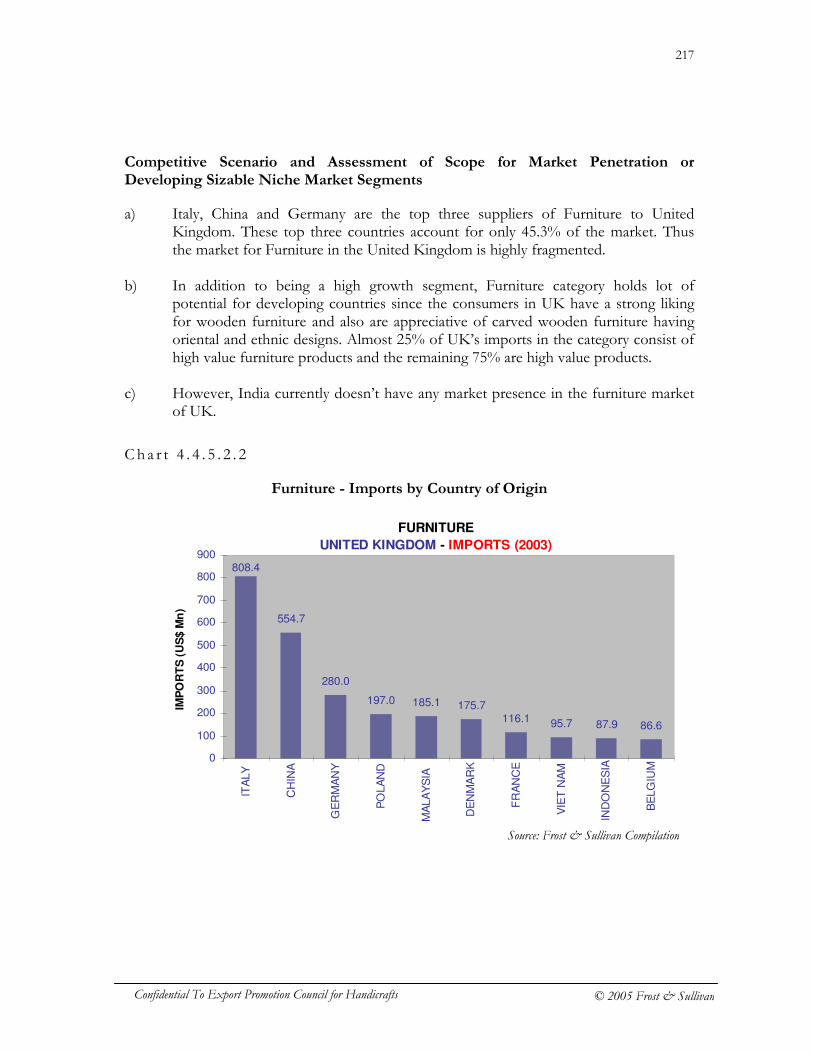
217
Confidential To Export Promotion Council for Handicrafts © 2005 Frost & Sullivan
Competitive Scenario and Assessment of Scope for Market Penetration or Developing Sizable Niche Market Segments
a) Italy, China and Germany are the top three suppliers of Furniture to United Kingdom. These top three countries account for only 45.3% of the market. Thus the market for Furniture in the United Kingdom is highly fragmented.
b) In addition to being a high growth segment, Furniture category holds lot of
potential for developing countries since the consumers in UK have a strong liking for wooden furniture and also are appreciative of carved wooden furniture having oriental and ethnic designs. Almost 25% of UK’s imports in the category consist of high value furniture products and the remaining 75% are high value products.
c) However, India currently doesn’t have any market presence in the furniture market
of UK.
Ch a r t 4 . 4 . 5 . 2 . 2
Furniture - Imports by Country of Origin
FURNITURE
UNITED KINGDOM - IMPORTS (2003)
554.7
280.0
197.0 185.1 175.7116.1 95.7 87.9 86.6
808.4
0
100
200
300
400
500
600
700
800
900
ITA
LY
CH
INA
GE
RM
AN
Y
PO
LA
ND
MA
LA
YS
IA
DE
NM
AR
K
FR
AN
CE
VIE
T N
AM
IND
ON
ES
IA
BE
LG
IUM
IMP
OR
TS
(U
S$ M
n)
Source: Frost & Sullivan Compilation
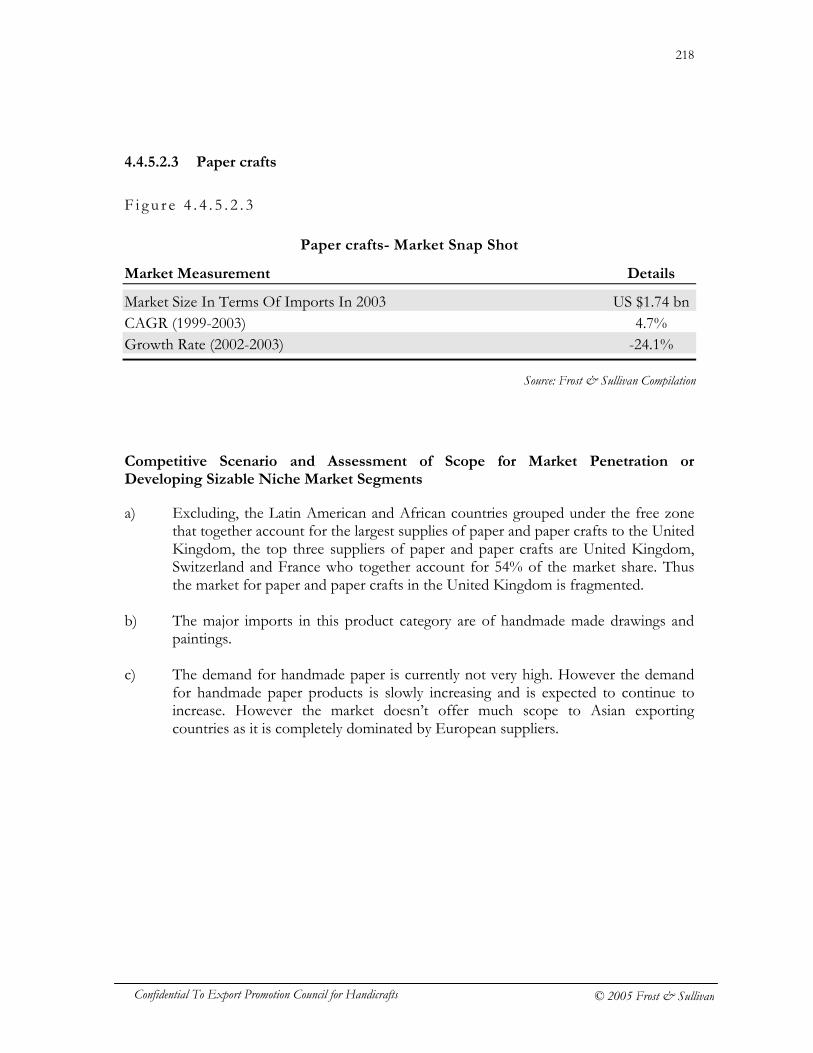
218
Confidential To Export Promotion Council for Handicrafts © 2005 Frost & Sullivan
4.4.5.2.3 Paper crafts
F i g u r e 4 . 4 . 5 . 2 . 3
Paper crafts- Market Snap Shot
Market Measurement Details
Market Size In Terms Of Imports In 2003 US $1.74 bn CAGR (1999-2003) 4.7% Growth Rate (2002-2003) -24.1%
Competitive Scenario and Assessment of Scope for Market Penetration or Developing Sizable Niche Market Segments
a) Excluding, the Latin American and African countries grouped under the free zone that together account for the largest supplies of paper and paper crafts to the United Kingdom, the top three suppliers of paper and paper crafts are United Kingdom, Switzerland and France who together account for 54% of the market share. Thus the market for paper and paper crafts in the United Kingdom is fragmented.
b) The major imports in this product category are of handmade made drawings and
paintings. c) The demand for handmade paper is currently not very high. However the demand
for handmade paper products is slowly increasing and is expected to continue to increase. However the market doesn’t offer much scope to Asian exporting countries as it is completely dominated by European suppliers.
Source: Frost & Sullivan Compilation
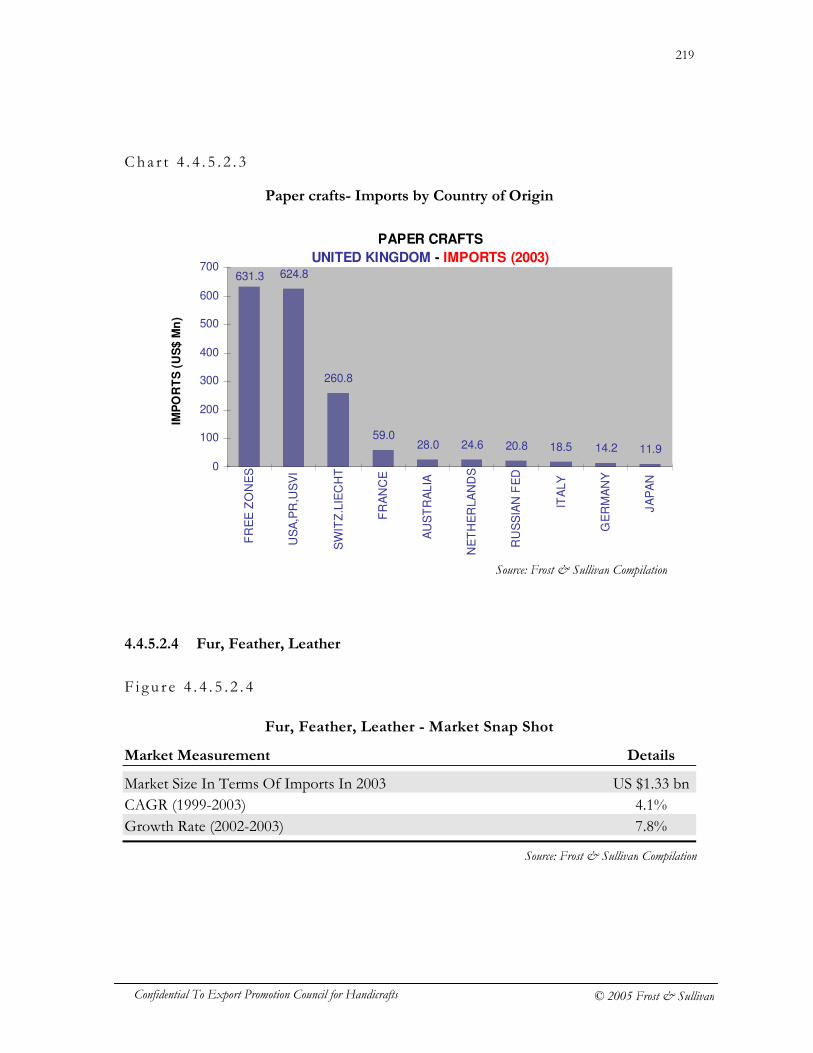
219
Confidential To Export Promotion Council for Handicrafts © 2005 Frost & Sullivan
Cha r t 4 . 4 . 5 . 2 . 3
Paper crafts- Imports by Country of Origin
4.4.5.2.4 Fur, Feather, Leather
F i g u r e 4 . 4 . 5 . 2 . 4
Fur, Feather, Leather - Market Snap Shot
Market Measurement Details
Market Size In Terms Of Imports In 2003 US $1.33 bn CAGR (1999-2003) 4.1% Growth Rate (2002-2003) 7.8%
PAPER CRAFTS
UNITED KINGDOM - IMPORTS (2003)624.8
260.8
59.028.0 24.6 20.8 18.5 14.2 11.9
631.3
0
100
200
300
400
500
600
700
FR
EE
ZO
NE
S
US
A,P
R,U
SV
I
SW
ITZ
.LIE
CH
T
FR
AN
CE
AU
ST
RA
LIA
NE
TH
ER
LA
ND
S
RU
SS
IAN
FE
D
ITA
LY
GE
RM
AN
Y
JA
PA
N
IMP
OR
TS
(U
S$
Mn
)
Source: Frost & Sullivan Compilation
Source: Frost & Sullivan Compilation
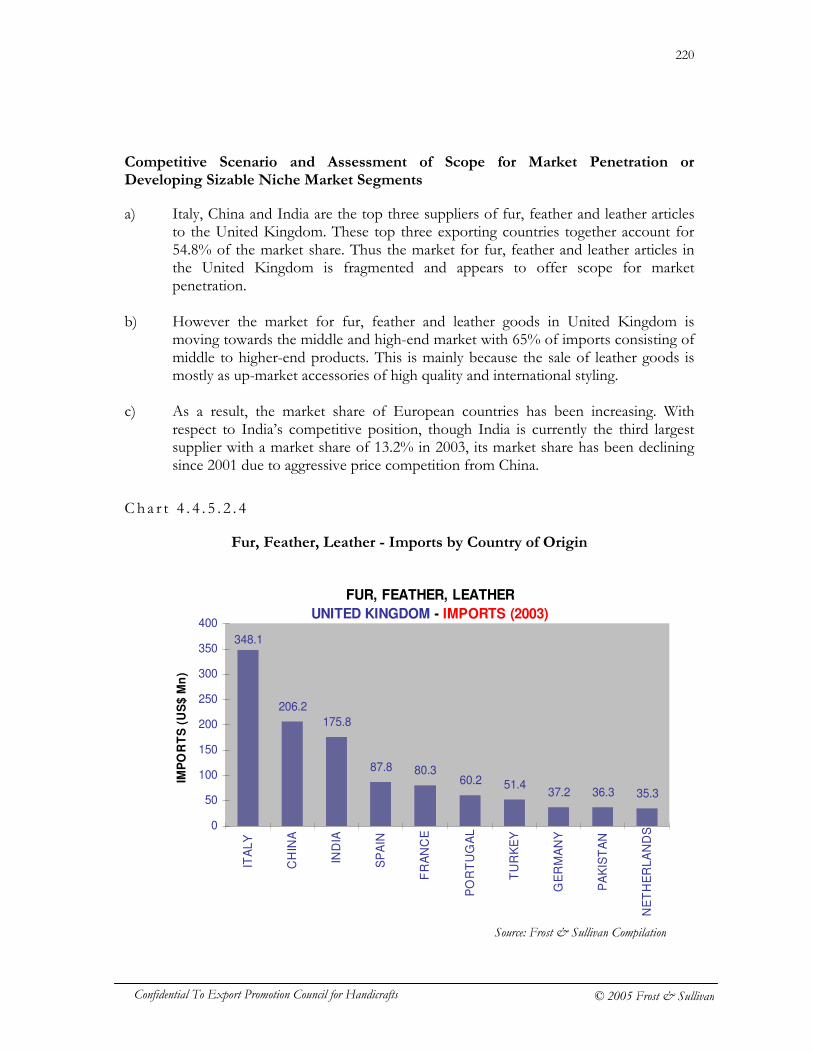
220
Confidential To Export Promotion Council for Handicrafts © 2005 Frost & Sullivan
Competitive Scenario and Assessment of Scope for Market Penetration or Developing Sizable Niche Market Segments
a) Italy, China and India are the top three suppliers of fur, feather and leather articles to the United Kingdom. These top three exporting countries together account for 54.8% of the market share. Thus the market for fur, feather and leather articles in the United Kingdom is fragmented and appears to offer scope for market penetration.
b) However the market for fur, feather and leather goods in United Kingdom is
moving towards the middle and high-end market with 65% of imports consisting of middle to higher-end products. This is mainly because the sale of leather goods is mostly as up-market accessories of high quality and international styling.
c) As a result, the market share of European countries has been increasing. With
respect to India’s competitive position, though India is currently the third largest supplier with a market share of 13.2% in 2003, its market share has been declining since 2001 due to aggressive price competition from China.
C h a r t 4 . 4 . 5 . 2 . 4
Fur, Feather, Leather - Imports by Country of Origin
FUR, FEATHER, LEATHER
UNITED KINGDOM - IMPORTS (2003)
206.2
175.8
87.8 80.360.2 51.4
37.2 36.3 35.3
348.1
0
50
100
150
200
250
300
350
400
ITA
LY
CH
INA
IND
IA
SP
AIN
FR
AN
CE
PO
RT
UG
AL
TU
RK
EY
GE
RM
AN
Y
PA
KIS
TA
N
NE
TH
ER
LA
ND
S
IMP
OR
TS
(U
S$
Mn
)
Source: Frost & Sullivan Compilation
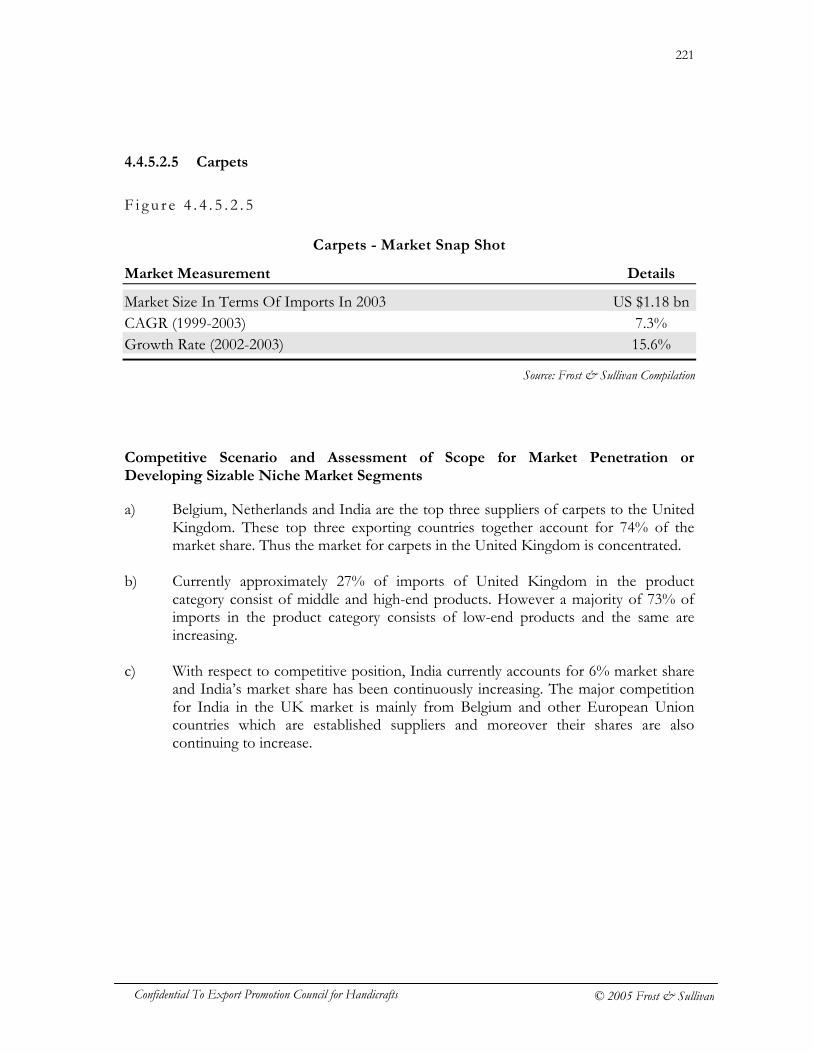
221
Confidential To Export Promotion Council for Handicrafts © 2005 Frost & Sullivan
4.4.5.2.5 Carpets
F i g u r e 4 . 4 . 5 . 2 . 5
Carpets - Market Snap Shot
Market Measurement Details
Market Size In Terms Of Imports In 2003 US $1.18 bn CAGR (1999-2003) 7.3% Growth Rate (2002-2003) 15.6%
Competitive Scenario and Assessment of Scope for Market Penetration or Developing Sizable Niche Market Segments
a) Belgium, Netherlands and India are the top three suppliers of carpets to the United Kingdom. These top three exporting countries together account for 74% of the market share. Thus the market for carpets in the United Kingdom is concentrated.
b) Currently approximately 27% of imports of United Kingdom in the product
category consist of middle and high-end products. However a majority of 73% of imports in the product category consists of low-end products and the same are increasing.
c) With respect to competitive position, India currently accounts for 6% market share
and India’s market share has been continuously increasing. The major competition for India in the UK market is mainly from Belgium and other European Union countries which are established suppliers and moreover their shares are also continuing to increase.
Source: Frost & Sullivan Compilation
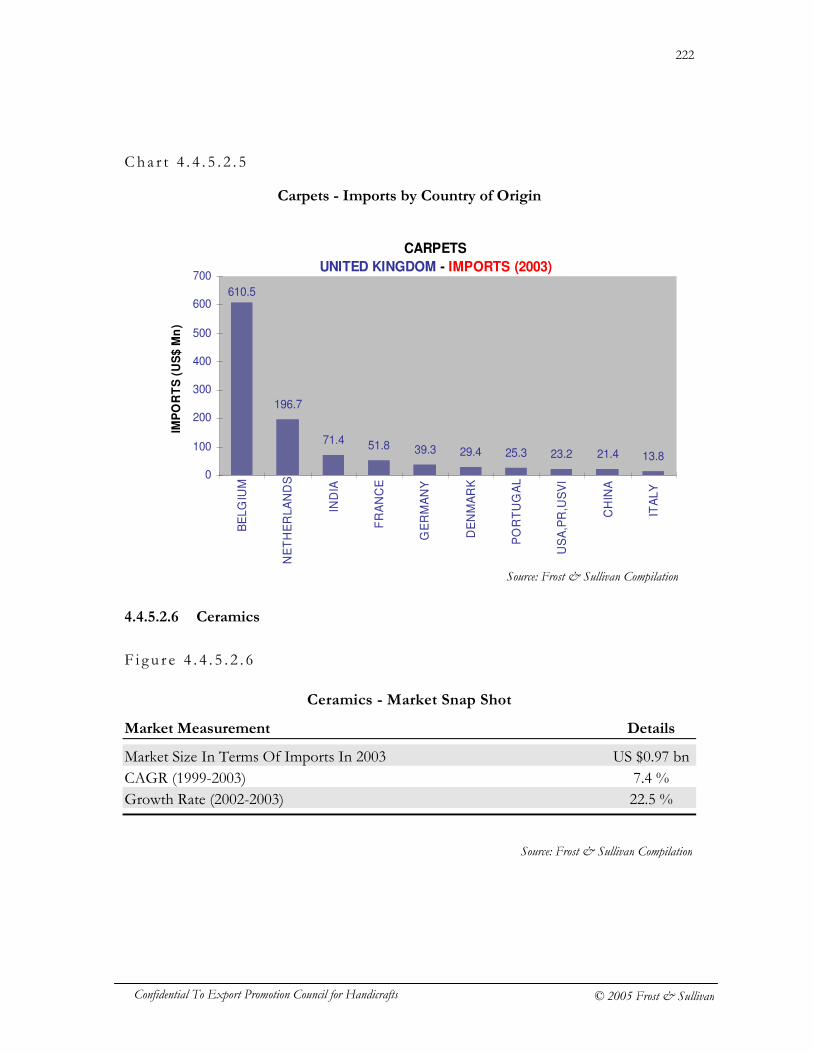
222
Confidential To Export Promotion Council for Handicrafts © 2005 Frost & Sullivan
Cha r t 4 . 4 . 5 . 2 . 5
Carpets - Imports by Country of Origin
4.4.5.2.6 Ceramics
F i g u r e 4 . 4 . 5 . 2 . 6
Ceramics - Market Snap Shot
Market Measurement Details
Market Size In Terms Of Imports In 2003 US $0.97 bn CAGR (1999-2003) 7.4 % Growth Rate (2002-2003) 22.5 %
CARPETS
UNITED KINGDOM - IMPORTS (2003)
196.7
71.4 51.8 39.3 29.4 25.3 23.2 21.4 13.8
610.5
0
100
200
300
400
500
600
700
BE
LG
IUM
NE
TH
ER
LA
ND
S
IND
IA
FR
AN
CE
GE
RM
AN
Y
DE
NM
AR
K
PO
RT
UG
AL
US
A,P
R,U
SV
I
CH
INA
ITA
LY
IMP
OR
TS
(U
S$
Mn
)
Source: Frost & Sullivan Compilation
Source: Frost & Sullivan Compilation

223
Confidential To Export Promotion Council for Handicrafts © 2005 Frost & Sullivan
Competitive Scenario and Assessment of Scope for Market Penetration or Developing Sizable Niche Market Segments
a) Spain, Italy and China are the top three suppliers of Ceramics to the United Kingdom. These top three supplying countries together account for 55.5% of the market. Thus the market for ceramics articles in the United Kingdom is fragmented and appears to offer scope for market penetration.
b) Currently the market share of European countries is continuing to increase. Almost
27% of imports in the category consist of products in the middle and higher-end categories. These are mostly the utility articles.
c) With respect to India’s competitive position, India currently doesn’t have any
presence in the market. However the fact that the market is highly fragmented gives lots of opportunities for market penetration as well as scope for establishing attractive niches for decorative ceramics.
Ch a r t 4 . 4 . 5 . 2 . 6
Ceramics - Imports by Country of Origin
CERAMICS
UNITED KINGDOM - IMPORTS (2003)
205.5
78.265.9
52.4 50.3 42.934.0
24.716.7
256.8
0
50
100
150
200
250
300
SP
AIN
ITA
LY
CH
INA
PO
RT
UG
AL
TH
AIL
AN
D
TU
RK
EY
GE
RM
AN
Y
MA
LA
YS
IA
VIE
T N
AM
FR
AN
CE
IMP
OR
TS
(U
S$ M
n)
Source: Frost & Sullivan Compilation
224
Confidential To Export Promotion Council for Handicrafts © 2005 Frost & Sullivan
4.4.5.2.7 Festive and Christmas Articles
F i g u r e 4 . 4 . 5 . 2 . 7
Festive and Christmas Articles - Market Snap Shot
Market Measurement Details
Market Size In Terms Of Imports In 2003 US $0.55 bn CAGR (1999-2003) 8.9% Growth Rate (2002-2003) 24.6%
Competitive Scenario and Assessment of Scope for Market Penetration or Developing Sizable Niche Market Segments
a) China, Hong Kong and USA are the top three suppliers of festive and Christmas articles to the United Kingdom. These top three supplying countries together account for 79.5% of the market. Thus the market for festive and Christmas articles in the United Kingdom is highly concentrated.
b) China is fast emerging as the most dominant supplier in the category, and currently
has a market share of 70%; however the market shares of the other European countries is also continuing increase where as that of other Asian suppliers like Taiwan and Thailand is continuing to decrease.
c) With respect to India’s competitive position, India currently doesn’t have any
significant presence in the market. In fact currently India currently ranks as the 12th largest supplier with a market share of just 0.7%.
Source: Frost & Sullivan Compilation

225
Confidential To Export Promotion Council for Handicrafts © 2005 Frost & Sullivan
Cha r t 4 . 4 . 5 . 2 . 7
Festive and Christmas Articles - Imports by Country of Origin
4.4.5.2.8 Toys and Dolls
F i g u r e 4 . 4 . 5 . 2 . 8
Toys and Dolls - Market Snap Shot
Market Measurement Details
Market Size In Terms Of Imports In 2003 US $0.53 bn CAGR (1999-2003) -3.6% Growth Rate (2002-2003) 2.1%
FESTIVE, CHRISTMAS
UNITED KINGDOM - IMPORTS (2003)
33.818.2 17.2 11.2 8.6 8.5 8.2 5.9 4.1
386.2
0
50
100
150
200
250
300
350
400
450
CH
INA
HO
NG
KO
NG
US
A,P
R,U
SV
I
GE
RM
AN
Y
NE
TH
ER
LA
ND
S
BE
LG
IUM
TA
IWA
N (
PO
C)
FR
AN
CE
TH
AIL
AN
D
ITA
LY
IMP
OR
TS
(U
S$
Mn
)
Source: Frost & Sullivan Compilation
Source: Frost & Sullivan Compilation
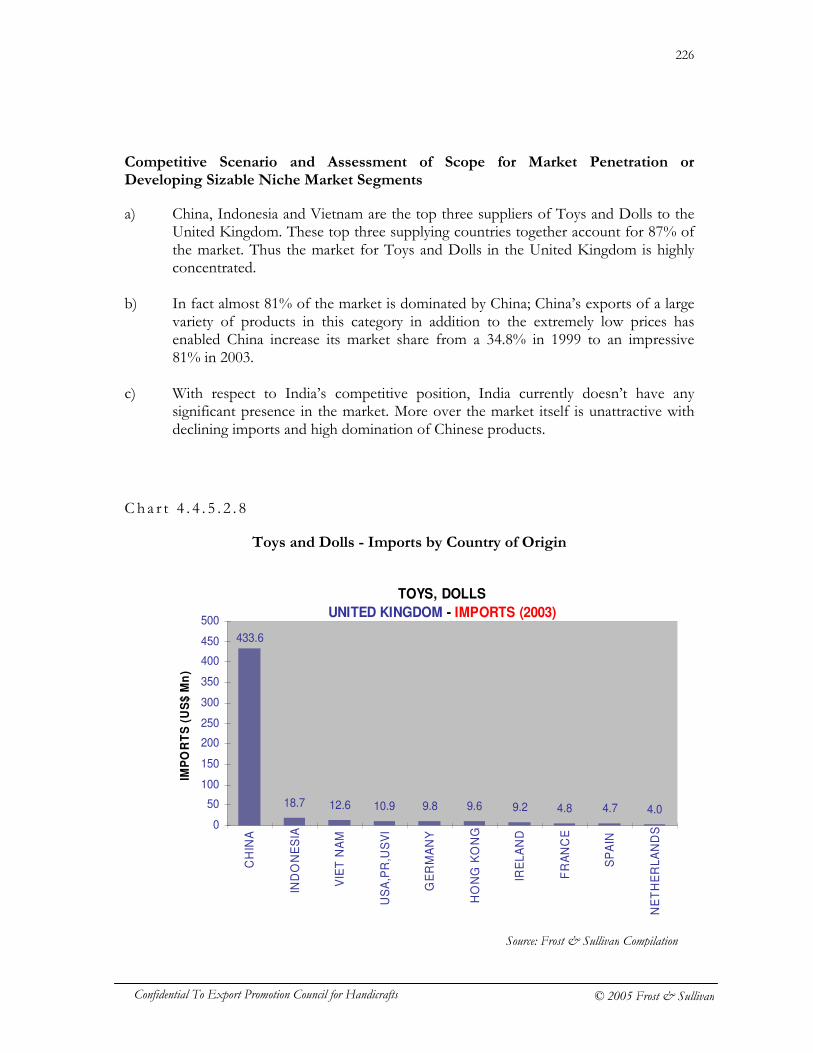
226
Confidential To Export Promotion Council for Handicrafts © 2005 Frost & Sullivan
Competitive Scenario and Assessment of Scope for Market Penetration or Developing Sizable Niche Market Segments
a) China, Indonesia and Vietnam are the top three suppliers of Toys and Dolls to the United Kingdom. These top three supplying countries together account for 87% of the market. Thus the market for Toys and Dolls in the United Kingdom is highly concentrated.
b) In fact almost 81% of the market is dominated by China; China’s exports of a large
variety of products in this category in addition to the extremely low prices has enabled China increase its market share from a 34.8% in 1999 to an impressive 81% in 2003.
c) With respect to India’s competitive position, India currently doesn’t have any
significant presence in the market. More over the market itself is unattractive with declining imports and high domination of Chinese products.
C h a r t 4 . 4 . 5 . 2 . 8
Toys and Dolls - Imports by Country of Origin
Source: Frost & Sullivan Compilation
TOYS, DOLLS
UNITED KINGDOM - IMPORTS (2003)
18.7 12.6 10.9 9.8 9.6 9.2 4.8 4.7 4.0
433.6
0
50
100
150
200
250
300
350
400
450
500
CH
INA
IND
ON
ES
IA
VIE
T N
AM
US
A,P
R,U
SV
I
GE
RM
AN
Y
HO
NG
KO
NG
IRE
LA
ND
FR
AN
CE
SP
AIN
NE
TH
ER
LA
ND
S
IMP
OR
TS
(U
S$
Mn
)
227
Confidential To Export Promotion Council for Handicrafts © 2005 Frost & Sullivan
4.4.5.2.9 Lighting
F i g u r e 4 . 4 . 5 . 2 . 9
Lighting - Market Snap Shot
Market Measurement Details
Market Size In Terms Of Imports In 2003 US $0.52 bn CAGR (1999-2003) 9.0% Growth Rate (2002-2003) 19.2%
Competitive Scenario and Assessment of Scope for Market Penetration or Developing Sizable Niche Market Segments
a) China, Italy and Germany are the top three suppliers of Lighting and lighting accessories to the United Kingdom. These top three supplying countries together account for 66.9% of the market. Thus the market for Lighting and lighting accessories in the United Kingdom is just becoming concentrated.
b) Almost 55% of the imports in this category consist of medium to higher-end
products that are supplied by the European countries. c) With respect to India’s competitive position, India currently ranks as the 10th largest
supplier and has a market share of 1.8%. The market however does offer scope to establish niche segments in case of decorative glass lighting and lighting accessories.
Source: Frost & Sullivan Compilation

228
Confidential To Export Promotion Council for Handicrafts © 2005 Frost & Sullivan
Cha r t 4 . 4 . 5 . 2 . 9
Lighting - Imports by Country of Origin
4.4.5.2.10 Jewelry
F i g u r e 4 . 4 . 5 . 2 . 1 0
Jewelry - Market Snap Shot
Market Measurement Details
Market Size In Terms Of Imports In 2003 US $0.41 bn CAGR (1999-2003) 12.9% Growth Rate (2002-2003) 22.0%
LIGHTING
UNITED KINGDOM - IMPORTS (2003)
64.0
30.1 23.7 22.412.8 11.1 10.3 10.2 9.7
258.4
0
50
100
150
200
250
300
CH
INA
ITA
LY
GE
RM
AN
Y
SP
AIN
FR
AN
CE
US
A,P
R,U
SV
I
BE
LG
IUM
TA
IWA
N
(PO
C)
DE
NM
AR
K
IND
IA
IMP
OR
TS
(U
S$ M
n)
Source: Frost & Sullivan Compilation
Source: Frost & Sullivan Compilation
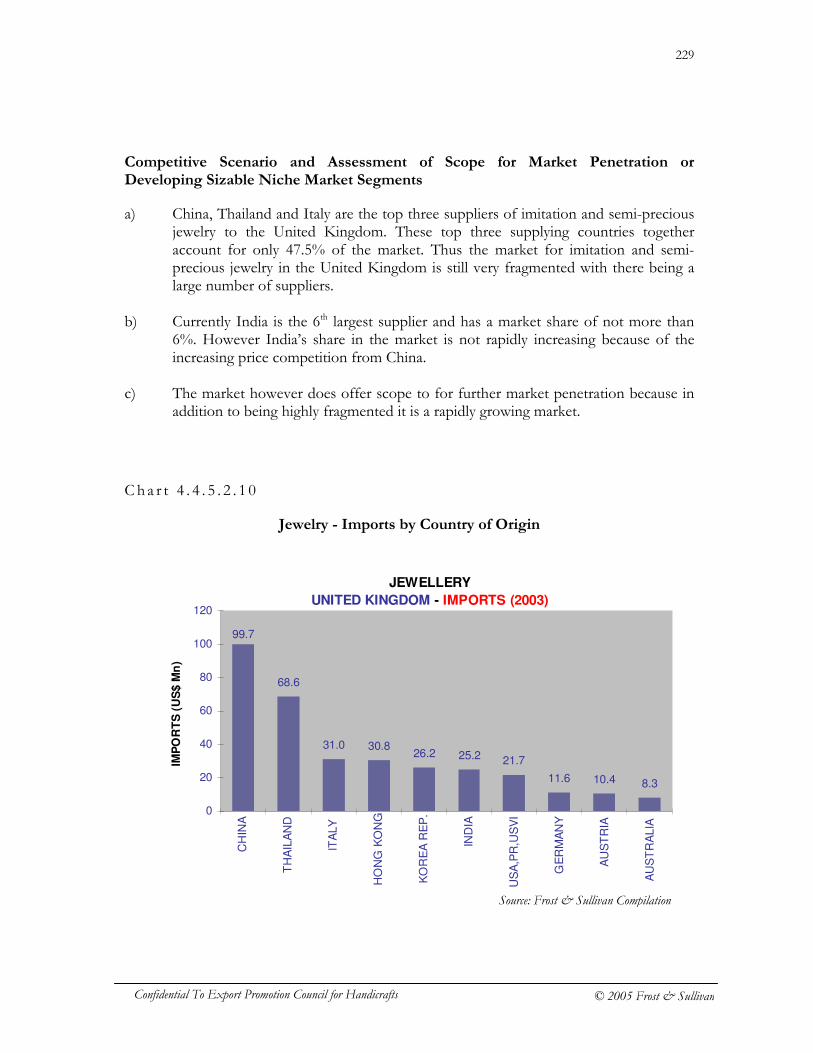
229
Confidential To Export Promotion Council for Handicrafts © 2005 Frost & Sullivan
Competitive Scenario and Assessment of Scope for Market Penetration or Developing Sizable Niche Market Segments
a) China, Thailand and Italy are the top three suppliers of imitation and semi-precious jewelry to the United Kingdom. These top three supplying countries together account for only 47.5% of the market. Thus the market for imitation and semi-precious jewelry in the United Kingdom is still very fragmented with there being a large number of suppliers.
b) Currently India is the 6th largest supplier and has a market share of not more than
6%. However India’s share in the market is not rapidly increasing because of the increasing price competition from China.
c) The market however does offer scope to for further market penetration because in
addition to being highly fragmented it is a rapidly growing market.
C h a r t 4 . 4 . 5 . 2 . 1 0
Jewelry - Imports by Country of Origin
JEWELLERY
UNITED KINGDOM - IMPORTS (2003)
68.6
31.0 30.826.2 25.2 21.7
11.6 10.4 8.3
99.7
0
20
40
60
80
100
120
CH
INA
TH
AIL
AN
D
ITA
LY
HO
NG
KO
NG
KO
RE
A R
EP
.
IND
IA
US
A,P
R,U
SV
I
GE
RM
AN
Y
AU
ST
RIA
AU
ST
RA
LIA
IMP
OR
TS
(U
S$ M
n)
Source: Frost & Sullivan Compilation
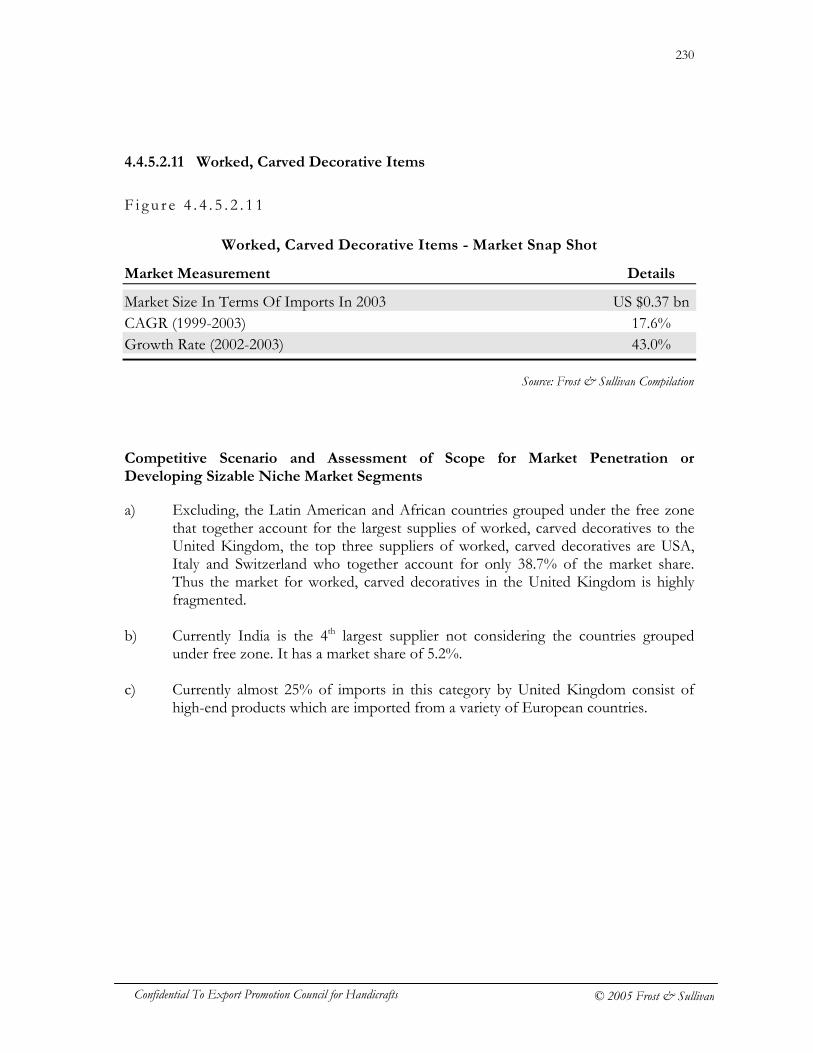
230
Confidential To Export Promotion Council for Handicrafts © 2005 Frost & Sullivan
4.4.5.2.11 Worked, Carved Decorative Items
F i g u r e 4 . 4 . 5 . 2 . 1 1
Worked, Carved Decorative Items - Market Snap Shot
Market Measurement Details
Market Size In Terms Of Imports In 2003 US $0.37 bn CAGR (1999-2003) 17.6% Growth Rate (2002-2003) 43.0%
Competitive Scenario and Assessment of Scope for Market Penetration or Developing Sizable Niche Market Segments
a) Excluding, the Latin American and African countries grouped under the free zone that together account for the largest supplies of worked, carved decoratives to the United Kingdom, the top three suppliers of worked, carved decoratives are USA, Italy and Switzerland who together account for only 38.7% of the market share. Thus the market for worked, carved decoratives in the United Kingdom is highly fragmented.
b) Currently India is the 4th largest supplier not considering the countries grouped
under free zone. It has a market share of 5.2%. c) Currently almost 25% of imports in this category by United Kingdom consist of
high-end products which are imported from a variety of European countries.
Source: Frost & Sullivan Compilation
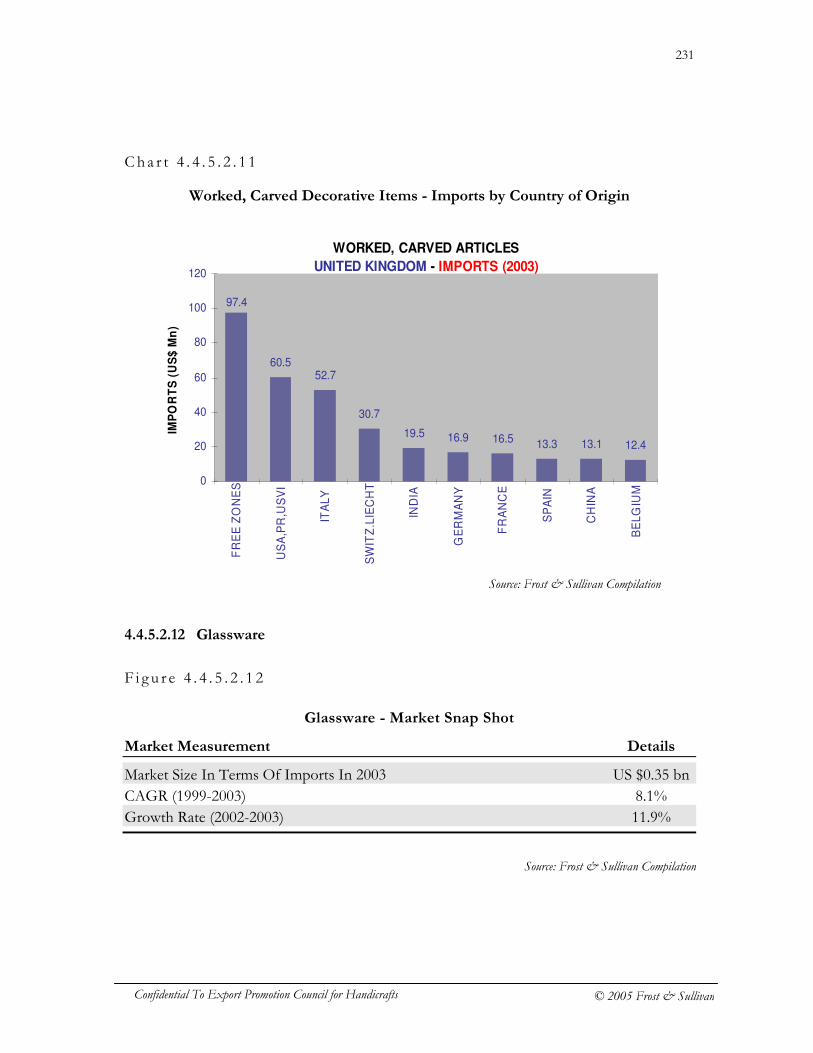
231
Confidential To Export Promotion Council for Handicrafts © 2005 Frost & Sullivan
Cha r t 4 . 4 . 5 . 2 . 1 1
Worked, Carved Decorative Items - Imports by Country of Origin
4.4.5.2.12 Glassware
F i g u r e 4 . 4 . 5 . 2 . 1 2
Glassware - Market Snap Shot
Market Measurement Details
Market Size In Terms Of Imports In 2003 US $0.35 bn CAGR (1999-2003) 8.1% Growth Rate (2002-2003) 11.9%
Source: Frost & Sullivan Compilation
Source: Frost & Sullivan Compilation
WORKED, CARVED ARTICLES
UNITED KINGDOM - IMPORTS (2003)
60.552.7
30.7
19.5 16.9 16.5 13.3 13.1 12.4
97.4
0
20
40
60
80
100
120
FR
EE
ZO
NE
S
US
A,P
R,U
SV
I
ITA
LY
SW
ITZ
.LIE
CH
T
IND
IA
GE
RM
AN
Y
FR
AN
CE
SP
AIN
CH
INA
BE
LG
IUM
IMP
OR
TS
(U
S$
Mn
)
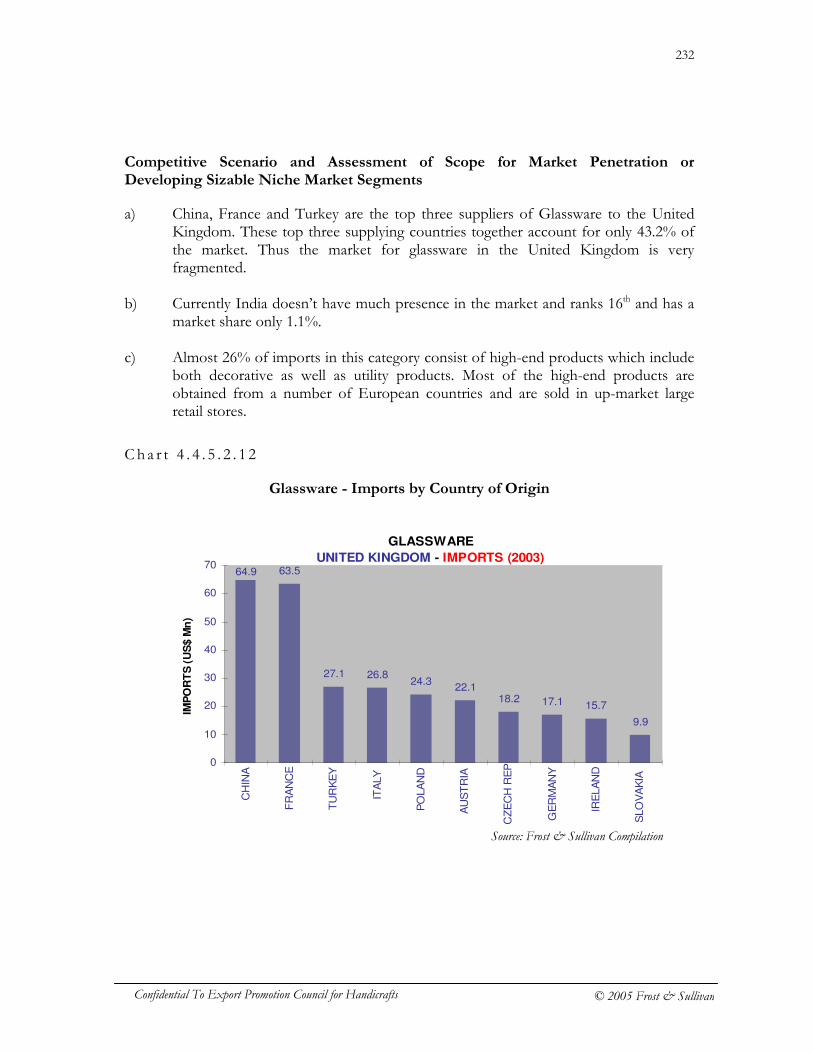
232
Confidential To Export Promotion Council for Handicrafts © 2005 Frost & Sullivan
Competitive Scenario and Assessment of Scope for Market Penetration or Developing Sizable Niche Market Segments
a) China, France and Turkey are the top three suppliers of Glassware to the United Kingdom. These top three supplying countries together account for only 43.2% of the market. Thus the market for glassware in the United Kingdom is very fragmented.
b) Currently India doesn’t have much presence in the market and ranks 16th and has a
market share only 1.1%. c) Almost 26% of imports in this category consist of high-end products which include
both decorative as well as utility products. Most of the high-end products are obtained from a number of European countries and are sold in up-market large retail stores.
C h a r t 4 . 4 . 5 . 2 . 1 2
Glassware - Imports by Country of Origin
GLASSWARE
UNITED KINGDOM - IMPORTS (2003)63.5
27.1 26.824.3
22.118.2 17.1 15.7
9.9
64.9
0
10
20
30
40
50
60
70
CH
INA
FR
AN
CE
TU
RK
EY
ITA
LY
PO
LA
ND
AU
ST
RIA
CZ
EC
H R
EP
GE
RM
AN
Y
IRE
LA
ND
SLO
VA
KIA
IMP
OR
TS
(U
S$ M
n)
Source: Frost & Sullivan Compilation
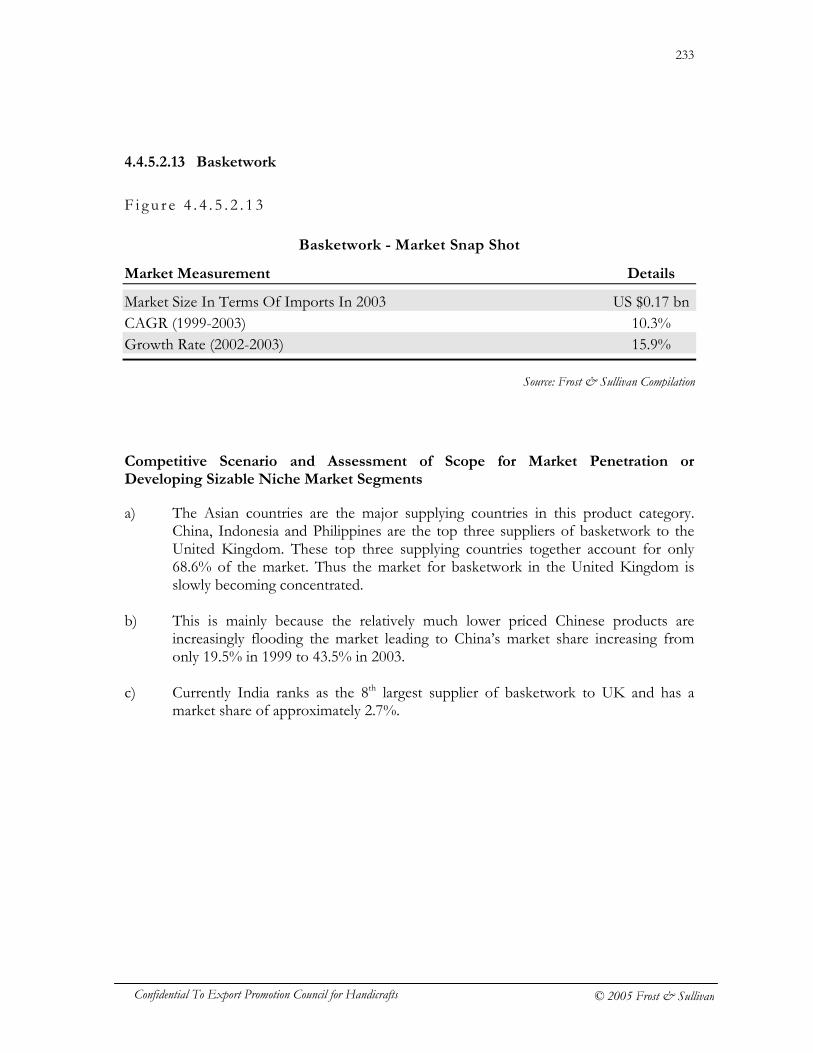
233
Confidential To Export Promotion Council for Handicrafts © 2005 Frost & Sullivan
4.4.5.2.13 Basketwork
F i g u r e 4 . 4 . 5 . 2 . 1 3
Basketwork - Market Snap Shot
Market Measurement Details
Market Size In Terms Of Imports In 2003 US $0.17 bn CAGR (1999-2003) 10.3% Growth Rate (2002-2003) 15.9%
Competitive Scenario and Assessment of Scope for Market Penetration or Developing Sizable Niche Market Segments
a) The Asian countries are the major supplying countries in this product category. China, Indonesia and Philippines are the top three suppliers of basketwork to the United Kingdom. These top three supplying countries together account for only 68.6% of the market. Thus the market for basketwork in the United Kingdom is slowly becoming concentrated.
b) This is mainly because the relatively much lower priced Chinese products are
increasingly flooding the market leading to China’s market share increasing from only 19.5% in 1999 to 43.5% in 2003.
c) Currently India ranks as the 8th largest supplier of basketwork to UK and has a
market share of approximately 2.7%.
Source: Frost & Sullivan Compilation
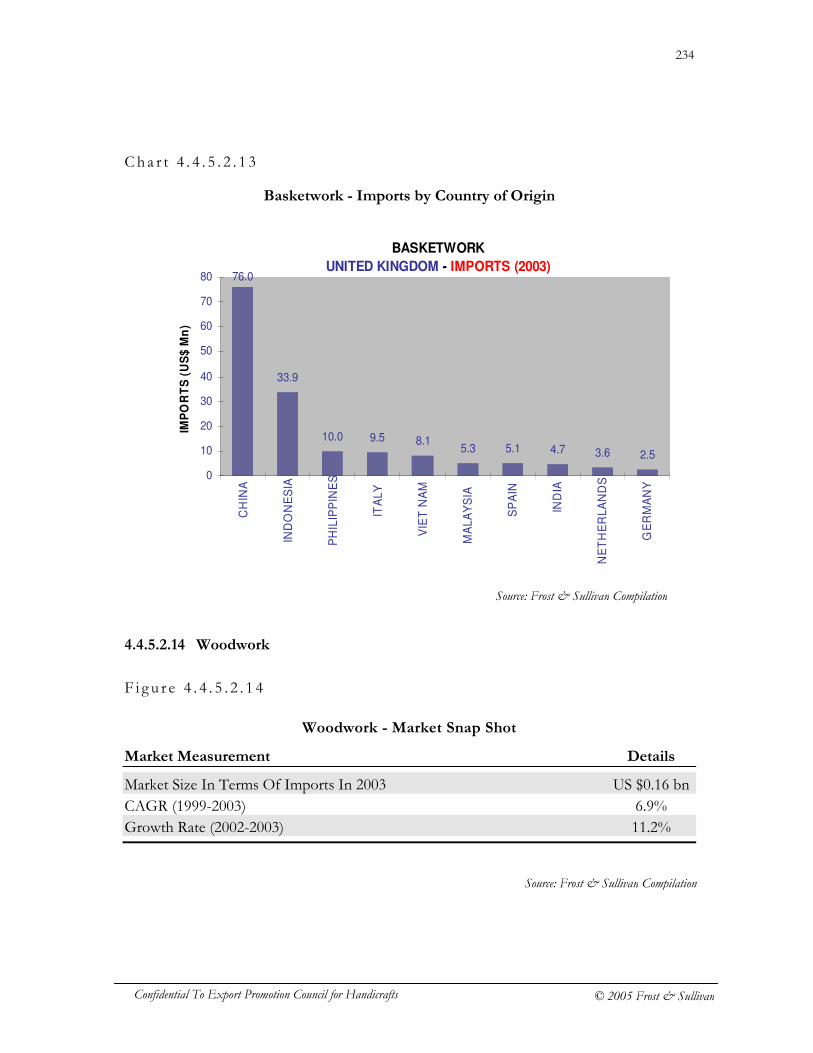
234
Confidential To Export Promotion Council for Handicrafts © 2005 Frost & Sullivan
Cha r t 4 . 4 . 5 . 2 . 1 3
Basketwork - Imports by Country of Origin 4.4.5.2.14 Woodwork
F i g u r e 4 . 4 . 5 . 2 . 1 4
Woodwork - Market Snap Shot
Market Measurement Details
Market Size In Terms Of Imports In 2003 US $0.16 bn CAGR (1999-2003) 6.9% Growth Rate (2002-2003) 11.2%
BASKETWORK
UNITED KINGDOM - IMPORTS (2003)
33.9
10.0 9.5 8.15.3 5.1 4.7 3.6 2.5
76.0
0
10
20
30
40
50
60
70
80
CH
INA
IND
ON
ES
IA
PH
ILIP
PIN
ES
ITA
LY
VIE
T N
AM
MA
LA
YS
IA
SP
AIN
IND
IA
NE
TH
ER
LA
ND
S
GE
RM
AN
Y
IMP
OR
TS
(U
S$
Mn
)
Source: Frost & Sullivan Compilation
Source: Frost & Sullivan Compilation
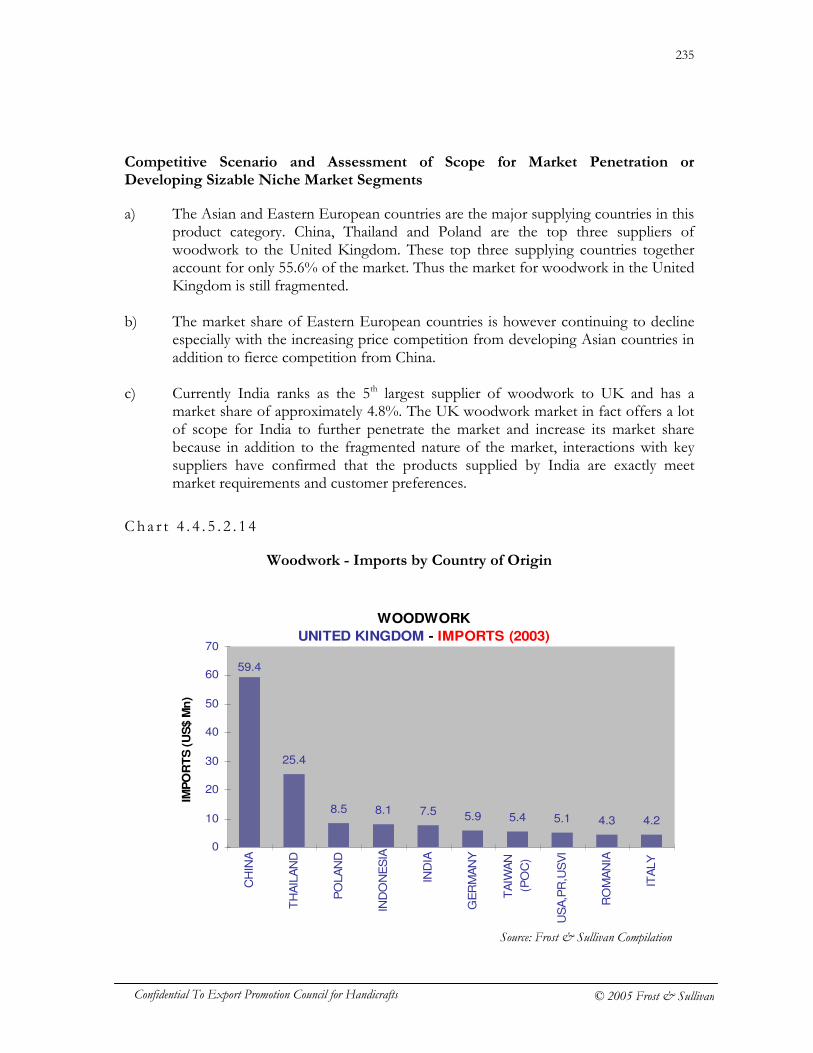
235
Confidential To Export Promotion Council for Handicrafts © 2005 Frost & Sullivan
Competitive Scenario and Assessment of Scope for Market Penetration or Developing Sizable Niche Market Segments
a) The Asian and Eastern European countries are the major supplying countries in this product category. China, Thailand and Poland are the top three suppliers of woodwork to the United Kingdom. These top three supplying countries together account for only 55.6% of the market. Thus the market for woodwork in the United Kingdom is still fragmented.
b) The market share of Eastern European countries is however continuing to decline
especially with the increasing price competition from developing Asian countries in addition to fierce competition from China.
c) Currently India ranks as the 5th largest supplier of woodwork to UK and has a
market share of approximately 4.8%. The UK woodwork market in fact offers a lot of scope for India to further penetrate the market and increase its market share because in addition to the fragmented nature of the market, interactions with key suppliers have confirmed that the products supplied by India are exactly meet market requirements and customer preferences.
Ch a r t 4 . 4 . 5 . 2 . 1 4
Woodwork - Imports by Country of Origin
WOODWORK
UNITED KINGDOM - IMPORTS (2003)
25.4
8.5 8.1 7.5 5.9 5.4 5.1 4.3 4.2
59.4
0
10
20
30
40
50
60
70
CH
INA
TH
AIL
AN
D
PO
LA
ND
IND
ON
ES
IA
IND
IA
GE
RM
AN
Y
TA
IWA
N
(PO
C)
US
A,P
R,U
SV
I
RO
MA
NIA
ITA
LY
IMP
OR
TS
(U
S$ M
n)
Source: Frost & Sullivan Compilation
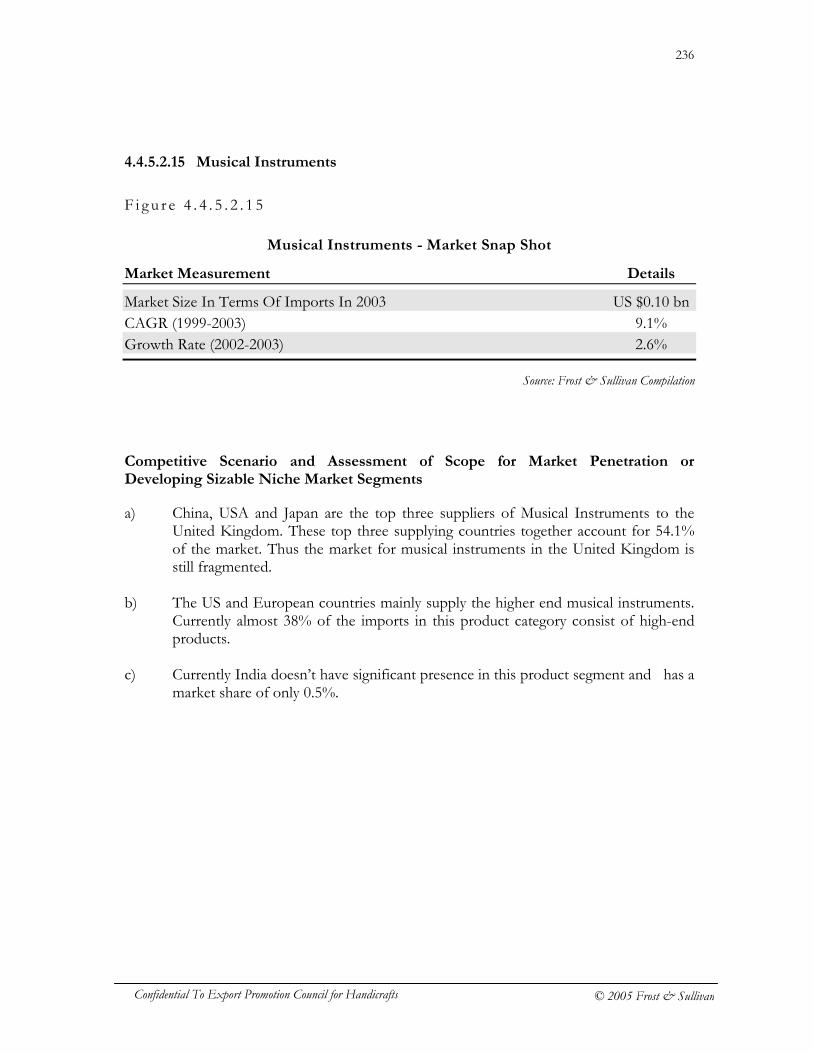
236
Confidential To Export Promotion Council for Handicrafts © 2005 Frost & Sullivan
4.4.5.2.15 Musical Instruments
F i g u r e 4 . 4 . 5 . 2 . 1 5
Musical Instruments - Market Snap Shot
Market Measurement Details
Market Size In Terms Of Imports In 2003 US $0.10 bn CAGR (1999-2003) 9.1% Growth Rate (2002-2003) 2.6%
Competitive Scenario and Assessment of Scope for Market Penetration or Developing Sizable Niche Market Segments
a) China, USA and Japan are the top three suppliers of Musical Instruments to the United Kingdom. These top three supplying countries together account for 54.1% of the market. Thus the market for musical instruments in the United Kingdom is still fragmented.
b) The US and European countries mainly supply the higher end musical instruments.
Currently almost 38% of the imports in this product category consist of high-end products.
c) Currently India doesn’t have significant presence in this product segment and has a
market share of only 0.5%.
Source: Frost & Sullivan Compilation
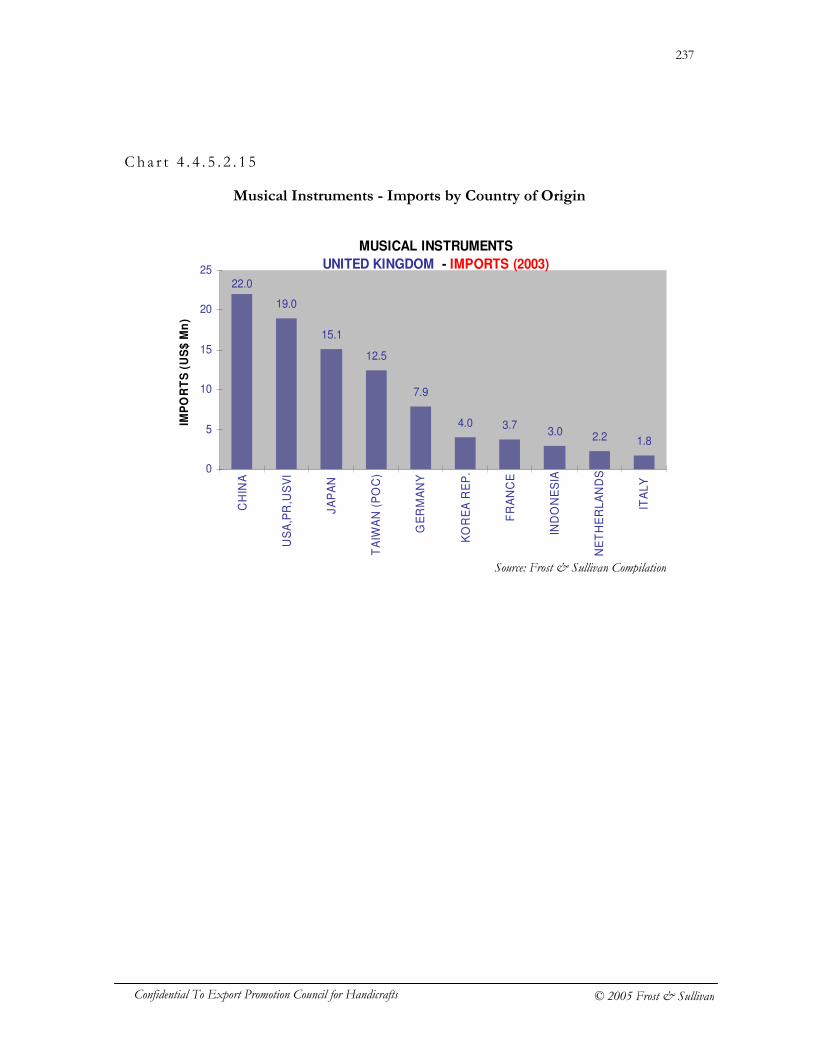
237
Confidential To Export Promotion Council for Handicrafts © 2005 Frost & Sullivan
Cha r t 4 . 4 . 5 . 2 . 1 5
Musical Instruments - Imports by Country of Origin
MUSICAL INSTRUMENTS
UNITED KINGDOM - IMPORTS (2003)
19.0
15.1
12.5
7.9
4.0 3.73.0 2.2 1.8
22.0
0
5
10
15
20
25
CH
INA
US
A,P
R,U
SV
I
JA
PA
N
TA
IWA
N (
PO
C)
GE
RM
AN
Y
KO
RE
A R
EP
.
FR
AN
CE
IND
ON
ES
IA
NE
TH
ER
LA
ND
S
ITA
LY
IMP
OR
TS
(U
S$
Mn
)
Source: Frost & Sullivan Compilation
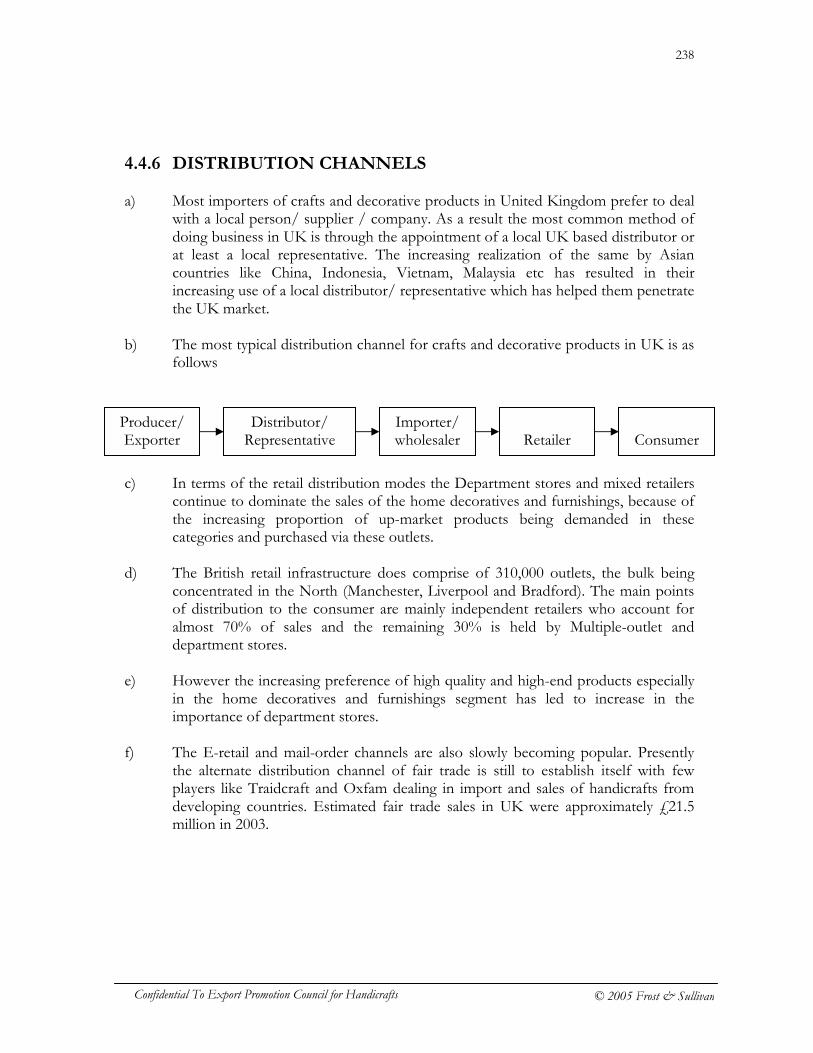
238
Confidential To Export Promotion Council for Handicrafts © 2005 Frost & Sullivan
4.4.6 DISTRIBUTION CHANNELS a) Most importers of crafts and decorative products in United Kingdom prefer to deal
with a local person/ supplier / company. As a result the most common method of doing business in UK is through the appointment of a local UK based distributor or at least a local representative. The increasing realization of the same by Asian countries like China, Indonesia, Vietnam, Malaysia etc has resulted in their increasing use of a local distributor/ representative which has helped them penetrate the UK market.
b) The most typical distribution channel for crafts and decorative products in UK is as
follows
c) In terms of the retail distribution modes the Department stores and mixed retailers
continue to dominate the sales of the home decoratives and furnishings, because of the increasing proportion of up-market products being demanded in these categories and purchased via these outlets.
d) The British retail infrastructure does comprise of 310,000 outlets, the bulk being
concentrated in the North (Manchester, Liverpool and Bradford). The main points of distribution to the consumer are mainly independent retailers who account for almost 70% of sales and the remaining 30% is held by Multiple-outlet and department stores.
e) However the increasing preference of high quality and high-end products especially
in the home decoratives and furnishings segment has led to increase in the importance of department stores.
f) The E-retail and mail-order channels are also slowly becoming popular. Presently
the alternate distribution channel of fair trade is still to establish itself with few players like Traidcraft and Oxfam dealing in import and sales of handicrafts from developing countries. Estimated fair trade sales in UK were approximately £21.5 million in 2003.
Producer/ Exporter
Distributor/ Representative
Importer/ wholesaler
Retailer
Consumer
239
Confidential To Export Promotion Council for Handicrafts © 2005 Frost & Sullivan
4.4.7 MARKET ACCESS REQUIREMENTS AND NON-TARIFF BARRIERS
a) As UK is part of the harmonized trade system of the European Union, Common
Customs Tariff is applicable to goods from non-EU countries unless there is special trade agreement in force. However most developing countries are guaranteed granted special trade preferences; these countries usually benefit from zero duties through preferential treatment under the Generalized System of Preferences (GSP) or under the fourth Lomé Convention for the African, Caribbean and Pacific (ACP) countries. Currently most duties are ad valorem, based on the GATT Valuation Code (approximate CIF value) and VAT applicable is at the standard rate of 17.5 per cent.
b) With regard to non-tariff barriers in terms of labeling, packaging and other specific
product requirements, the rules applicable to the European Union countries are enforced by United Kingdom
c) However the main form of non-tariff barrier is the product legislation concerning
the content of hazardous substances for many categories of handicrafts as well as other decoratives that has been laid down by European Committee for Standardization (CEN). Some of the most important legislations relate to the use of the following -
� Azo dyes and pigments used mainly in textile and leather articles � Benzene used as a stabilizer in plastics � Formaldehyde used as glazing or bonding agent applied in textile, leather
and resins � Pentachlorophenol (PCP) used to prevent fungal growth and decay by
bacteria in wooden toys � Polychlorinated biphenyles (PCB) and terphenyles (PCT) used as softeners
in plastic products � Flame retardants used in textiles, leather products and plastics to reduce the
flammability � Asbestos used as filling material in plastics � Cadmium present as a pigment or stabilizer in paints, plastics, ceramics and
glassware and as a fixing agent in textile and leather � Phthalates added to PVC as a softener used in toys � Nickel used in alloys for toys or other articles � CFCs and halons used as foaming agents � Mercury used in toys, ceramic and glass
Other requirements are those pertaining to CE marking which is required foe most of the Utility category products.
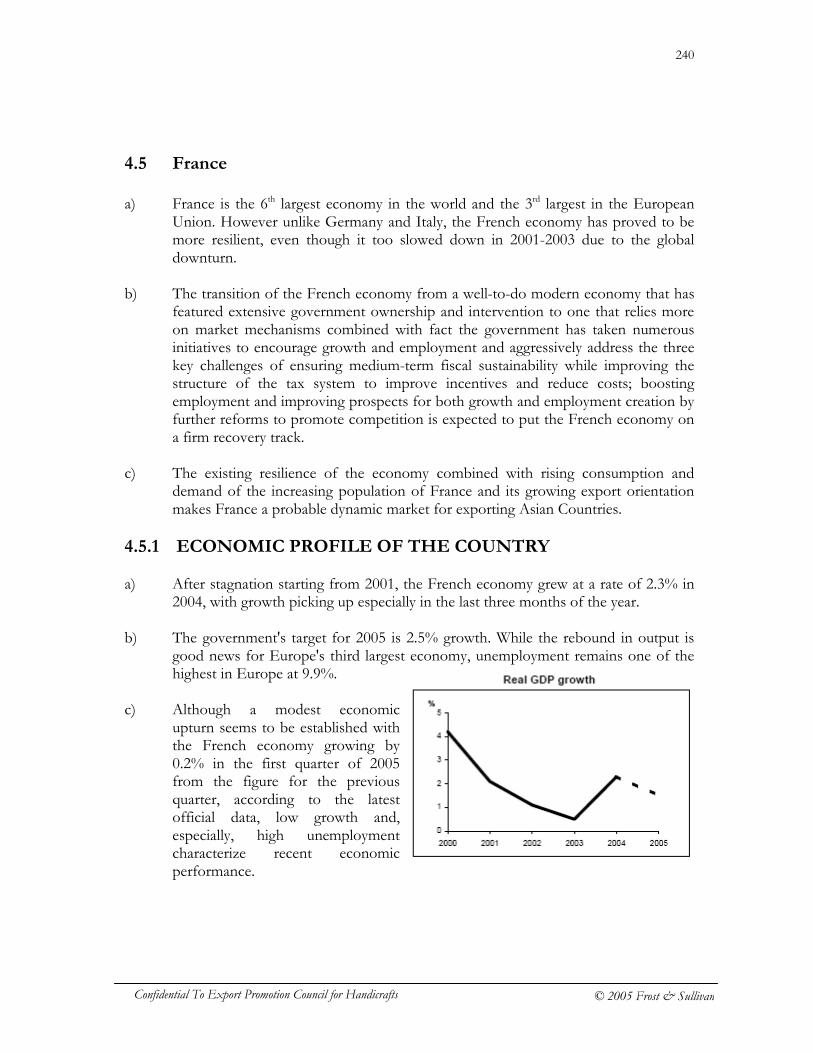
240
Confidential To Export Promotion Council for Handicrafts © 2005 Frost & Sullivan
4.5 France a) France is the 6th largest economy in the world and the 3rd largest in the European
Union. However unlike Germany and Italy, the French economy has proved to be more resilient, even though it too slowed down in 2001-2003 due to the global downturn.
b) The transition of the French economy from a well-to-do modern economy that has
featured extensive government ownership and intervention to one that relies more on market mechanisms combined with fact the government has taken numerous initiatives to encourage growth and employment and aggressively address the three key challenges of ensuring medium-term fiscal sustainability while improving the structure of the tax system to improve incentives and reduce costs; boosting employment and improving prospects for both growth and employment creation by further reforms to promote competition is expected to put the French economy on a firm recovery track.
c) The existing resilience of the economy combined with rising consumption and
demand of the increasing population of France and its growing export orientation makes France a probable dynamic market for exporting Asian Countries.
4.5.1 ECONOMIC PROFILE OF THE COUNTRY a) After stagnation starting from 2001, the French economy grew at a rate of 2.3% in
2004, with growth picking up especially in the last three months of the year. b) The government's target for 2005 is 2.5% growth. While the rebound in output is
good news for Europe's third largest economy, unemployment remains one of the highest in Europe at 9.9%.
c) Although a modest economic
upturn seems to be established with the French economy growing by 0.2% in the first quarter of 2005 from the figure for the previous quarter, according to the latest official data, low growth and, especially, high unemployment characterize recent economic performance.
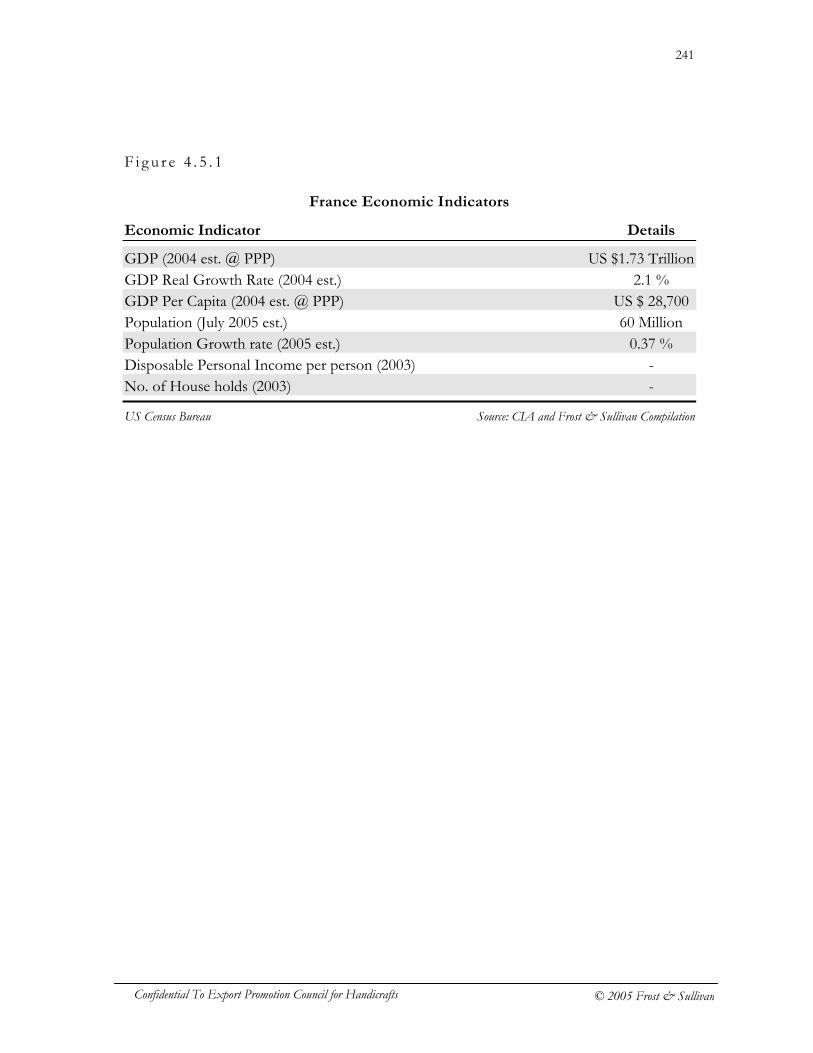
241
Confidential To Export Promotion Council for Handicrafts © 2005 Frost & Sullivan
F i g u r e 4 . 5 . 1
France Economic Indicators
Economic Indicator Details
GDP (2004 est. @ PPP) US $1.73 Trillion GDP Real Growth Rate (2004 est.) 2.1 % GDP Per Capita (2004 est. @ PPP) US $ 28,700 Population (July 2005 est.) 60 Million Population Growth rate (2005 est.) 0.37 % Disposable Personal Income per person (2003) - No. of House holds (2003) -
Source: CIA and Frost & Sullivan Compilation US Census Bureau
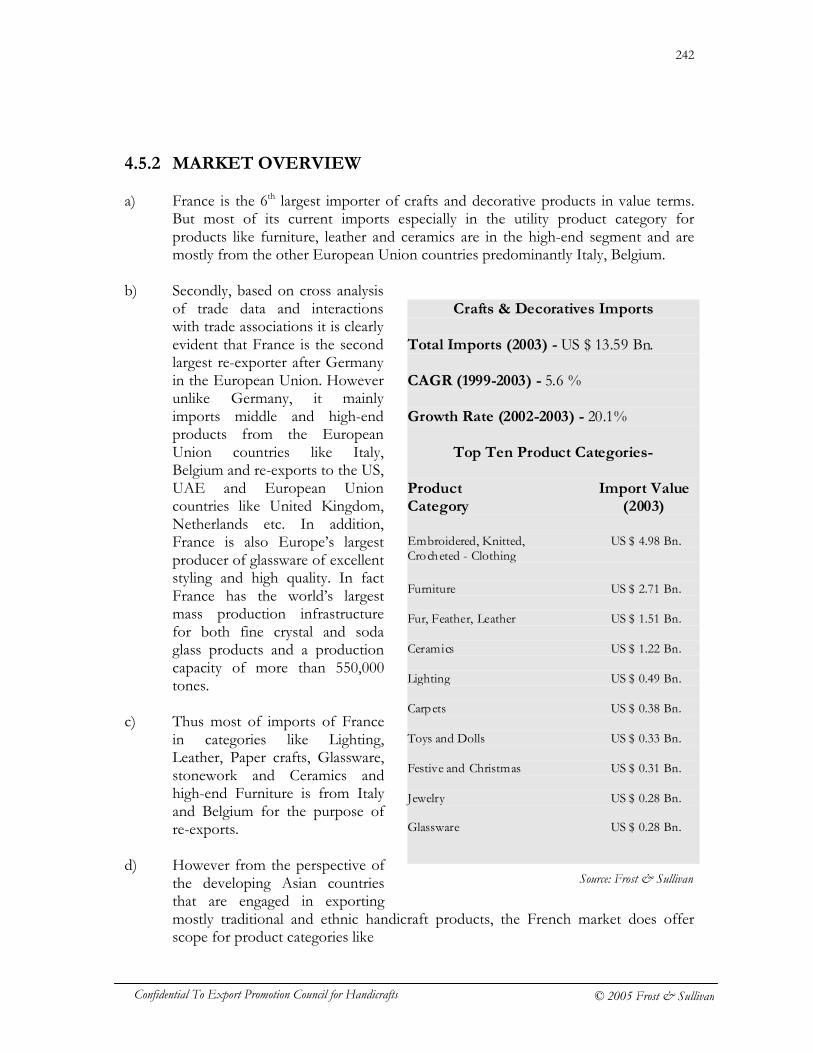
242
Confidential To Export Promotion Council for Handicrafts © 2005 Frost & Sullivan
4.5.2 MARKET OVERVIEW a) France is the 6th largest importer of crafts and decorative products in value terms.
But most of its current imports especially in the utility product category for products like furniture, leather and ceramics are in the high-end segment and are mostly from the other European Union countries predominantly Italy, Belgium.
b) Secondly, based on cross analysis
of trade data and interactions with trade associations it is clearly evident that France is the second largest re-exporter after Germany in the European Union. However unlike Germany, it mainly imports middle and high-end products from the European Union countries like Italy, Belgium and re-exports to the US, UAE and European Union countries like United Kingdom, Netherlands etc. In addition, France is also Europe’s largest producer of glassware of excellent styling and high quality. In fact France has the world’s largest mass production infrastructure for both fine crystal and soda glass products and a production capacity of more than 550,000 tones.
c) Thus most of imports of France
in categories like Lighting, Leather, Paper crafts, Glassware, stonework and Ceramics and high-end Furniture is from Italy and Belgium for the purpose of re-exports.
d) However from the perspective of
the developing Asian countries that are engaged in exporting mostly traditional and ethnic handicraft products, the French market does offer scope for product categories like
Crafts & Decoratives Imports Total Imports (2003) - US $ 13.59 Bn. CAGR (1999-2003) - 5.6 % Growth Rate (2002-2003) - 20.1%
Top Ten Product Categories-
Product Import Value Category (2003) Embroidered, Knitted, US $ 4.98 Bn. Crocheted - Clothing Furniture US $ 2.71 Bn. Fur, Feather, Leather US $ 1.51 Bn. Ceramics US $ 1.22 Bn. Lighting US $ 0.49 Bn. Carpets US $ 0.38 Bn. Toys and Dolls US $ 0.33 Bn. Festive and Christmas US $ 0.31 Bn. Jewelry US $ 0.28 Bn. Glassware US $ 0.28 Bn.
Source: Frost & Sullivan
243
Confidential To Export Promotion Council for Handicrafts © 2005 Frost & Sullivan
� Furniture, especially carved wooden furniture which had a growth rate of 21% in 2003.
� Embroidered, Knitted, Crocheted - clothing which had a growth rate of 20.6% in 2003
� Small Leather goods which had a growth rate of 17.7% in 2003. � Ceramics and especially earthenware/pottery which had growth rate of
22.4% in 2003. � Carpets which had growth rate of 15% in 2003. � Basketwork which had growth rate of 19% in 2003. � Woodwork which had growth rate of 11.6% in 2003. � The other product categories that offer potential to Asian exporting
nations are mainly Jewelry, candles and artificial flowers.
e) Secondly the fact that countries like China and Turkey are slowly penetrating the French market not only in case of traditional categories like embroidered, knitted, crocheted-clothing, basketwork, woodwork, art metalware but also in case of the other categories like Leather, Ceramics, Lighting, and Carpets makes France a potential target market where in there seems to be latent demand that can be leveraged through proper market development efforts.
f) With respect to the import trend of France, as crafts and decorative products
imports of France include categories for the purpose of re-exports, the overall imports of crafts and decorative products post 2000 especially the higher-end products had shown negative growth rates due to the reduction in re-export potential as a result of the global downturn.
g) However due to the global upturn, though the economic performance of France
was at its lowest in 2003, the overall imports of crafts and decorative products increased by a remarkable 20%. This increase is mainly attributed to two reasons � The improvement of the world economy revived re-exports potential and
thereby led to increase in imports of higher-end products form Italy and Belgium for the purpose of re-exports.
� Secondly, the imports of product categories like basketwork, woodwork
and other decoratives for domestic consumption increased though the French economy was at its lowest in 2003 with high structural unemployment and the resultant adverse impact on incomes and consumer confidence. The reason behind the same being the increase in consumer expenditure that was a result of rise in real disposable incomes due to reduction in savings and lower tax rates.
244
Confidential To Export Promotion Council for Handicrafts © 2005 Frost & Sullivan
h) For Asian exporting nations the betterment of the French economy per se along with the reduction in unemployment levels, increased consumer confidence and spending power will mark the continued imports of products like basketwork, woodwork, embroidered, knitted, crocheted clothing/furnishing, small leather articles and other decoratives like jewelry and artificial flowers.
245
Confidential To Export Promotion Council for Handicrafts © 2005 Frost & Sullivan
4.5.3 KEY FACTORS THAT DRIVE THE MARKET a) Economic & demographic factors that have helped drive demand for crafts and
decorative products in France are
� Betterment in overall economic scenario as reflected by the improving GDP growth rates post 2003 is causing a revival of domestic demand for crafts and decorative products in product categories like basketwork, woodwork, art metalware, small leather articles, embroidered, knitted, crocheted-clothing, carved wooden furniture and decorative items for home and garden including earthenware/pottery, and other carved wood products.
b) Consumer and Market specific factors
� The increasing re-export potential due to upturn in global economy especially US and UK in particular has led to increased imports of higher-end ceramics, furniture etc for the purpose of re-exports.
� The increasing level of Fairtrade activity due to the large number of
“world shops” that sell crafts and decorative products imported from the developing Asian and African countries has also has also positively impacted the appeal of ethnic decoratives.
� The fact that France is the second largest decorative garden market,
behind Germany and ahead of Britain and that gardening is one of the most popular leisure activities in France has also led to a large demand for garden décor including large pottery/earthenware and decorative metal articles.
� Lastly the increasing efforts of China and Vietnam to penetrate the market
by supplying innovative and large variety of small decoratives and other ethnic articles is also slowly creating increased demand.
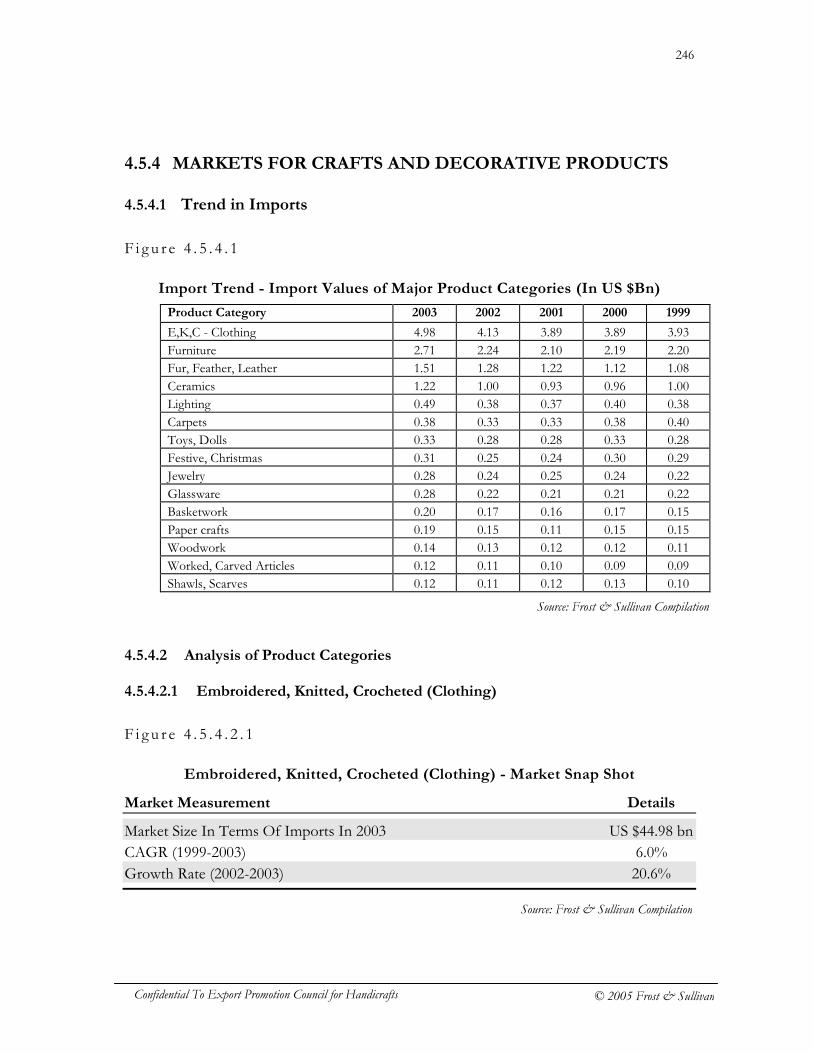
246
Confidential To Export Promotion Council for Handicrafts © 2005 Frost & Sullivan
4.5.4 MARKETS FOR CRAFTS AND DECORATIVE PRODUCTS 4.5.4.1 Trend in Imports
F i g u r e 4 . 5 . 4 . 1
Import Trend - Import Values of Major Product Categories (In US $Bn)
Product Category 2003 2002 2001 2000 1999
E,K,C - Clothing 4.98 4.13 3.89 3.89 3.93 Furniture 2.71 2.24 2.10 2.19 2.20 Fur, Feather, Leather 1.51 1.28 1.22 1.12 1.08 Ceramics 1.22 1.00 0.93 0.96 1.00 Lighting 0.49 0.38 0.37 0.40 0.38 Carpets 0.38 0.33 0.33 0.38 0.40 Toys, Dolls 0.33 0.28 0.28 0.33 0.28 Festive, Christmas 0.31 0.25 0.24 0.30 0.29 Jewelry 0.28 0.24 0.25 0.24 0.22 Glassware 0.28 0.22 0.21 0.21 0.22 Basketwork 0.20 0.17 0.16 0.17 0.15 Paper crafts 0.19 0.15 0.11 0.15 0.15 Woodwork 0.14 0.13 0.12 0.12 0.11 Worked, Carved Articles 0.12 0.11 0.10 0.09 0.09 Shawls, Scarves 0.12 0.11 0.12 0.13 0.10
4.5.4.2 Analysis of Product Categories 4.5.4.2.1 Embroidered, Knitted, Crocheted (Clothing)
F i g u r e 4 . 5 . 4 . 2 . 1
Embroidered, Knitted, Crocheted (Clothing) - Market Snap Shot
Market Measurement Details
Market Size In Terms Of Imports In 2003 US $44.98 bn CAGR (1999-2003) 6.0% Growth Rate (2002-2003) 20.6%
Source: Frost & Sullivan Compilation
Source: Frost & Sullivan Compilation
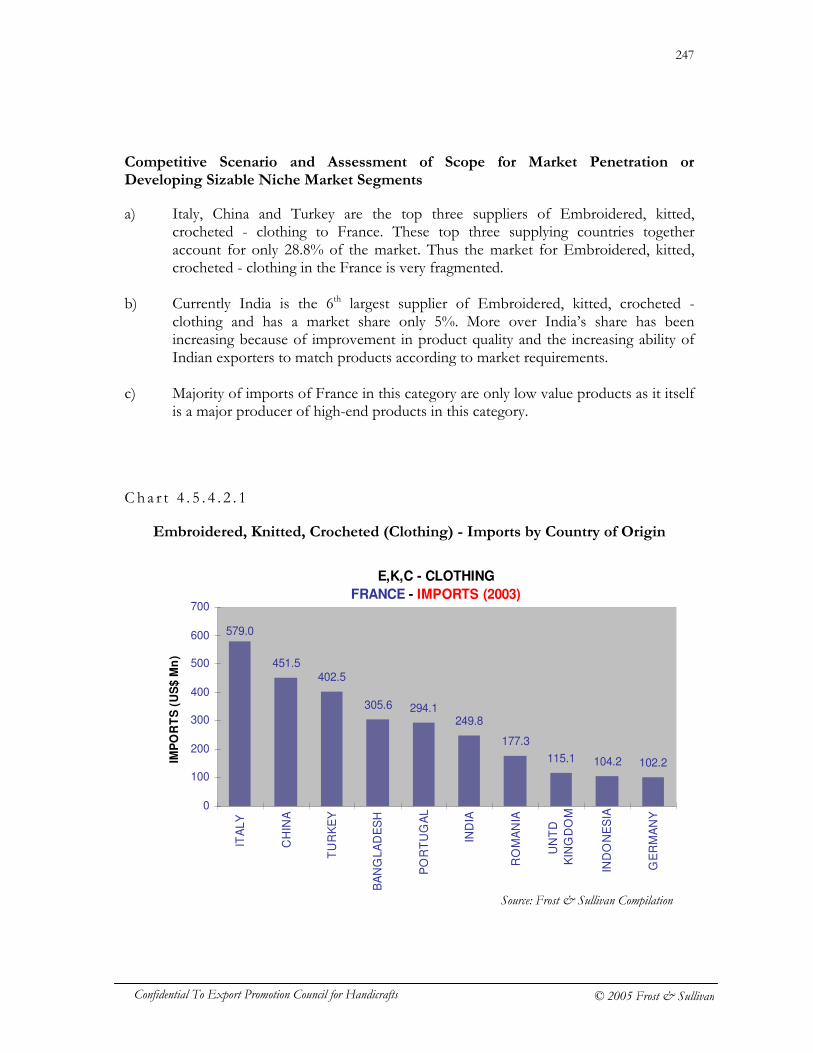
247
Confidential To Export Promotion Council for Handicrafts © 2005 Frost & Sullivan
Competitive Scenario and Assessment of Scope for Market Penetration or Developing Sizable Niche Market Segments
a) Italy, China and Turkey are the top three suppliers of Embroidered, kitted, crocheted - clothing to France. These top three supplying countries together account for only 28.8% of the market. Thus the market for Embroidered, kitted, crocheted - clothing in the France is very fragmented.
b) Currently India is the 6th largest supplier of Embroidered, kitted, crocheted -
clothing and has a market share only 5%. More over India’s share has been increasing because of improvement in product quality and the increasing ability of Indian exporters to match products according to market requirements.
c) Majority of imports of France in this category are only low value products as it itself
is a major producer of high-end products in this category.
C h a r t 4 . 5 . 4 . 2 . 1
Embroidered, Knitted, Crocheted (Clothing) - Imports by Country of Origin
E,K,C - CLOTHING
FRANCE - IMPORTS (2003)
451.5402.5
305.6 294.1249.8
177.3
115.1 104.2 102.2
579.0
0
100
200
300
400
500
600
700
ITA
LY
CH
INA
TU
RK
EY
BA
NG
LA
DE
SH
PO
RT
UG
AL
IND
IA
RO
MA
NIA
UN
TD
KIN
GD
OM
IND
ON
ES
IA
GE
RM
AN
Y
IMP
OR
TS
(U
S$
Mn
)
Source: Frost & Sullivan Compilation
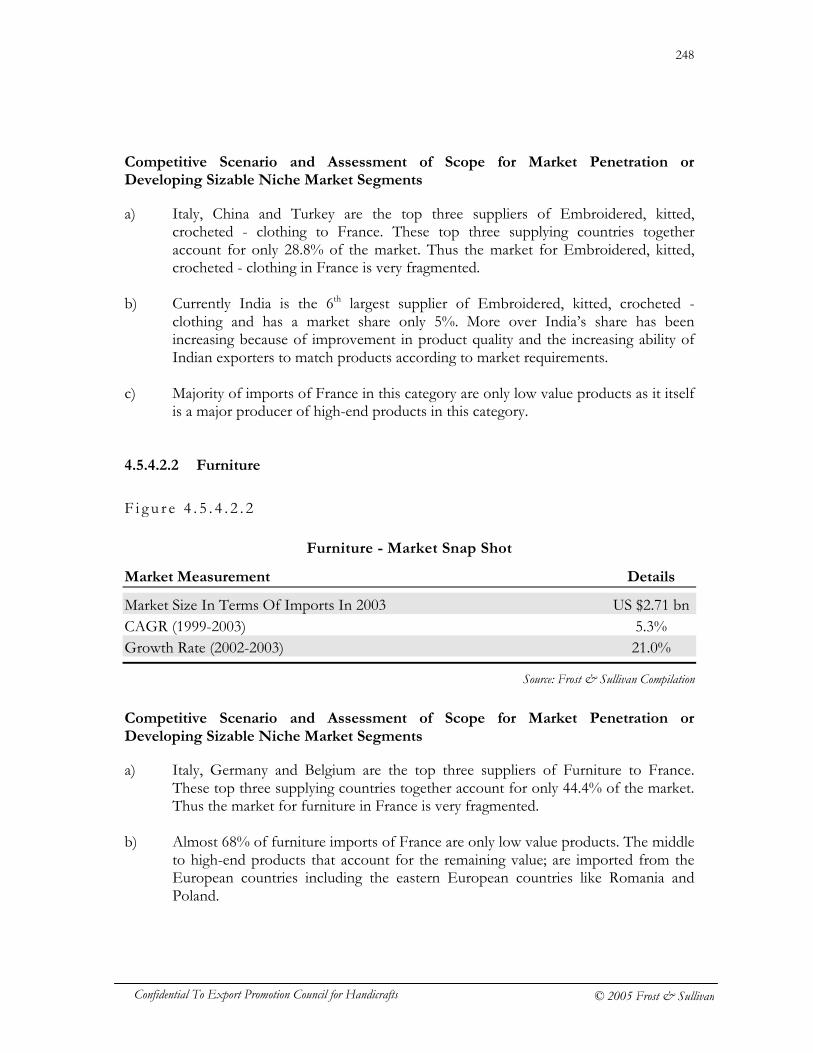
248
Confidential To Export Promotion Council for Handicrafts © 2005 Frost & Sullivan
Competitive Scenario and Assessment of Scope for Market Penetration or Developing Sizable Niche Market Segments
a) Italy, China and Turkey are the top three suppliers of Embroidered, kitted, crocheted - clothing to France. These top three supplying countries together account for only 28.8% of the market. Thus the market for Embroidered, kitted, crocheted - clothing in France is very fragmented.
b) Currently India is the 6th largest supplier of Embroidered, kitted, crocheted -
clothing and has a market share only 5%. More over India’s share has been increasing because of improvement in product quality and the increasing ability of Indian exporters to match products according to market requirements.
c) Majority of imports of France in this category are only low value products as it itself
is a major producer of high-end products in this category. 4.5.4.2.2 Furniture
F i g u r e 4 . 5 . 4 . 2 . 2
Furniture - Market Snap Shot
Market Measurement Details
Market Size In Terms Of Imports In 2003 US $2.71 bn CAGR (1999-2003) 5.3% Growth Rate (2002-2003) 21.0%
Competitive Scenario and Assessment of Scope for Market Penetration or Developing Sizable Niche Market Segments
a) Italy, Germany and Belgium are the top three suppliers of Furniture to France. These top three supplying countries together account for only 44.4% of the market. Thus the market for furniture in France is very fragmented.
b) Almost 68% of furniture imports of France are only low value products. The middle
to high-end products that account for the remaining value; are imported from the European countries including the eastern European countries like Romania and Poland.
Source: Frost & Sullivan Compilation
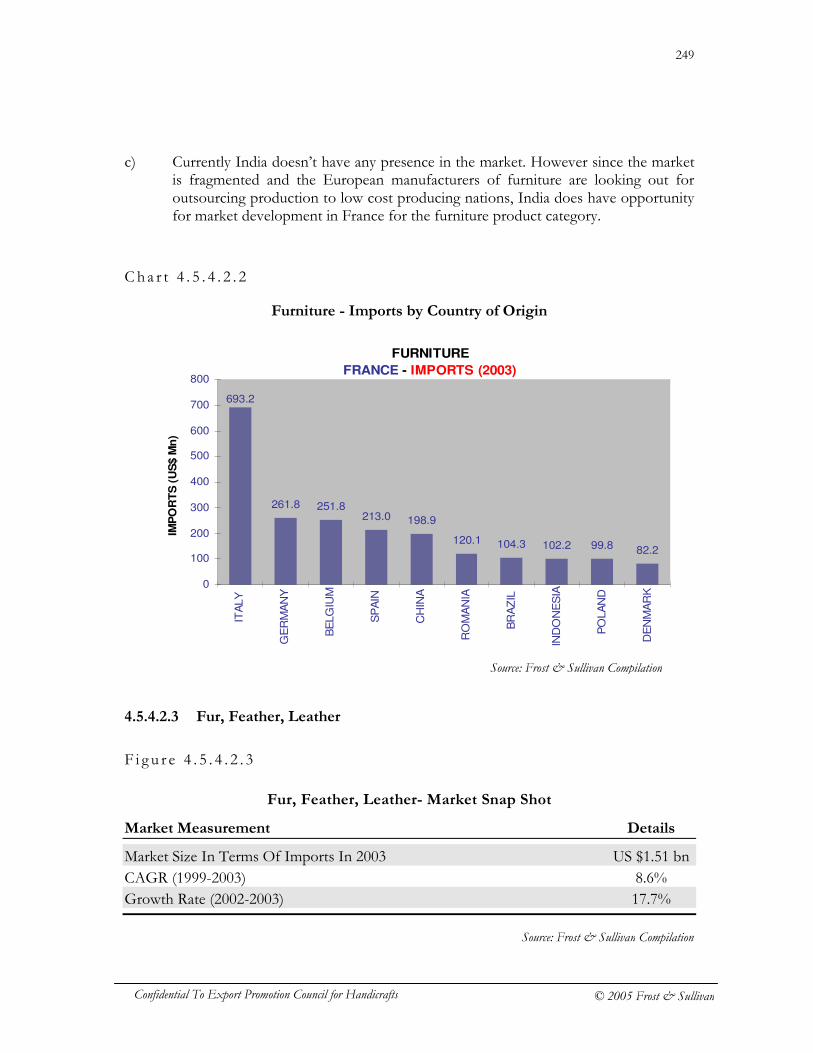
249
Confidential To Export Promotion Council for Handicrafts © 2005 Frost & Sullivan
c) Currently India doesn’t have any presence in the market. However since the market is fragmented and the European manufacturers of furniture are looking out for outsourcing production to low cost producing nations, India does have opportunity for market development in France for the furniture product category.
C h a r t 4 . 5 . 4 . 2 . 2
Furniture - Imports by Country of Origin
4.5.4.2.3 Fur, Feather, Leather
F i g u r e 4 . 5 . 4 . 2 . 3
Fur, Feather, Leather- Market Snap Shot
Market Measurement Details
Market Size In Terms Of Imports In 2003 US $1.51 bn CAGR (1999-2003) 8.6% Growth Rate (2002-2003) 17.7%
FURNITURE
FRANCE - IMPORTS (2003)
261.8 251.8213.0 198.9
120.1 104.3 102.2 99.8 82.2
693.2
0
100
200
300
400
500
600
700
800
ITA
LY
GE
RM
AN
Y
BE
LG
IUM
SP
AIN
CH
INA
RO
MA
NIA
BR
AZ
IL
IND
ON
ES
IA
PO
LA
ND
DE
NM
AR
K
IMP
OR
TS
(U
S$ M
n)
Source: Frost & Sullivan Compilation
Source: Frost & Sullivan Compilation
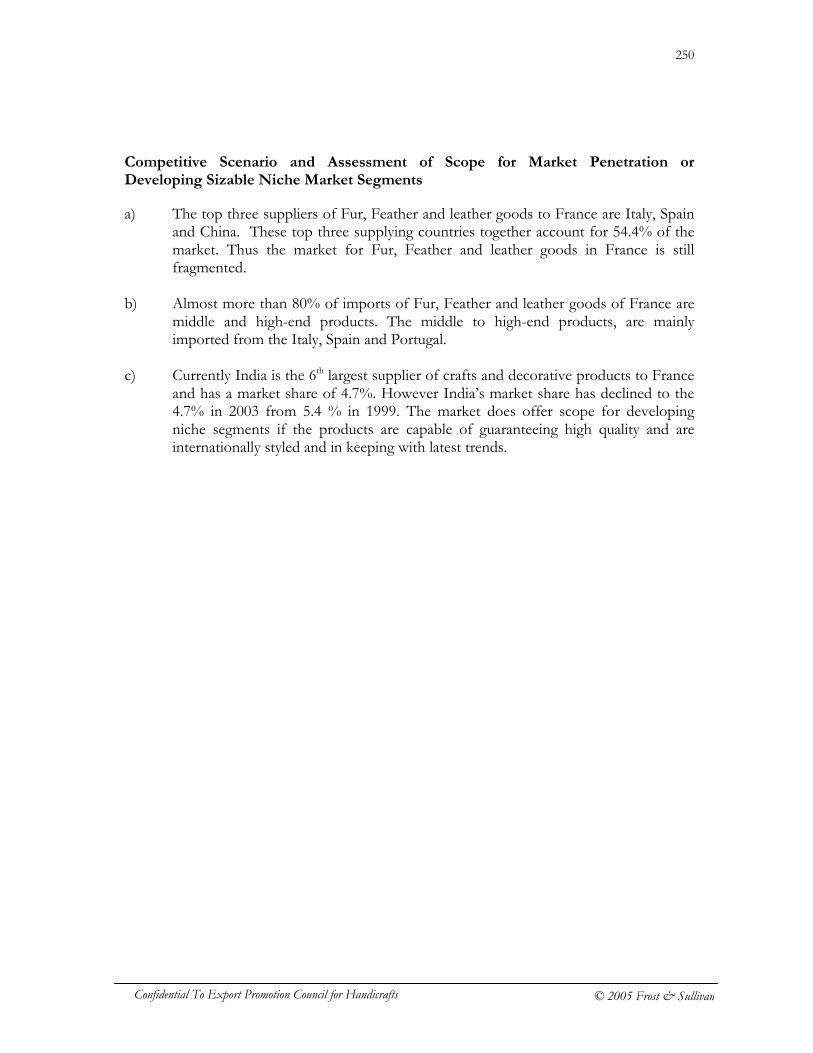
250
Confidential To Export Promotion Council for Handicrafts © 2005 Frost & Sullivan
Competitive Scenario and Assessment of Scope for Market Penetration or Developing Sizable Niche Market Segments
a) The top three suppliers of Fur, Feather and leather goods to France are Italy, Spain and China. These top three supplying countries together account for 54.4% of the market. Thus the market for Fur, Feather and leather goods in France is still fragmented.
b) Almost more than 80% of imports of Fur, Feather and leather goods of France are
middle and high-end products. The middle to high-end products, are mainly imported from the Italy, Spain and Portugal.
c) Currently India is the 6th largest supplier of crafts and decorative products to France
and has a market share of 4.7%. However India’s market share has declined to the 4.7% in 2003 from 5.4 % in 1999. The market does offer scope for developing niche segments if the products are capable of guaranteeing high quality and are internationally styled and in keeping with latest trends.
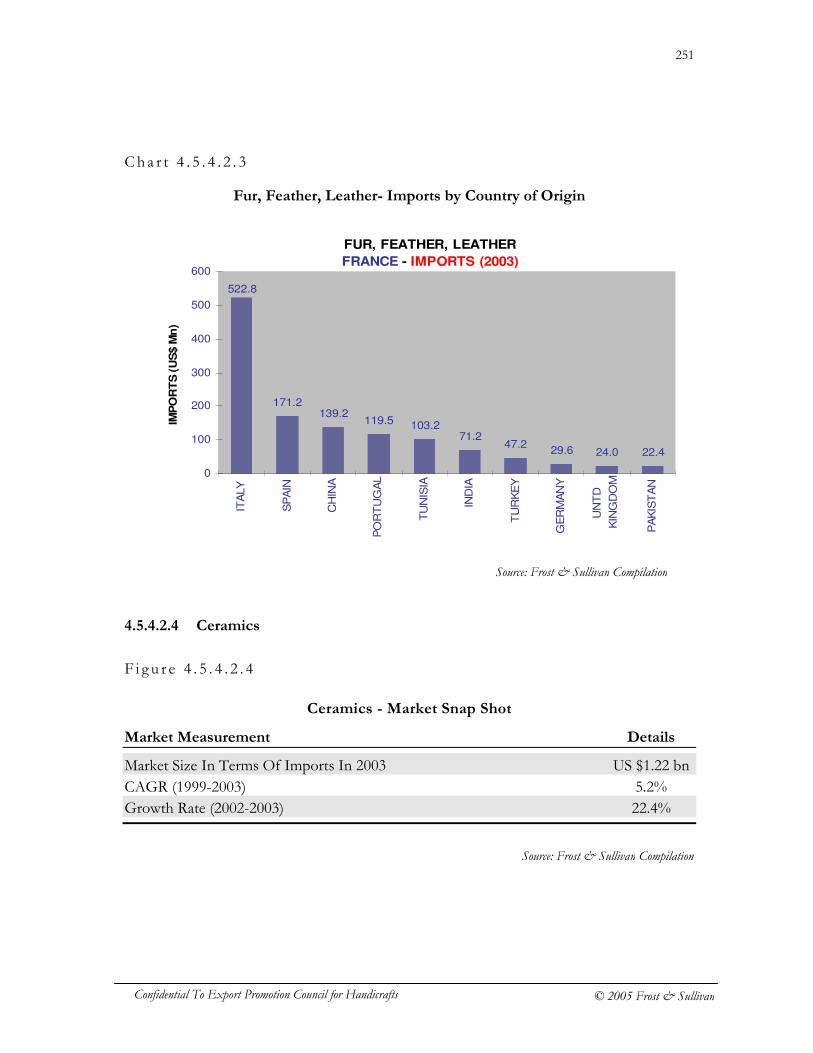
251
Confidential To Export Promotion Council for Handicrafts © 2005 Frost & Sullivan
Cha r t 4 . 5 . 4 . 2 . 3
Fur, Feather, Leather- Imports by Country of Origin
4.5.4.2.4 Ceramics
F i g u r e 4 . 5 . 4 . 2 . 4
Ceramics - Market Snap Shot
Market Measurement Details
Market Size In Terms Of Imports In 2003 US $1.22 bn CAGR (1999-2003) 5.2% Growth Rate (2002-2003) 22.4%
FUR, FEATHER, LEATHER
FRANCE - IMPORTS (2003)
171.2139.2
119.5 103.271.2
47.229.6 24.0 22.4
522.8
0
100
200
300
400
500
600
ITA
LY
SP
AIN
CH
INA
PO
RT
UG
AL
TU
NIS
IA
IND
IA
TU
RK
EY
GE
RM
AN
Y
UN
TD
KIN
GD
OM
PA
KIS
TA
N
IMP
OR
TS
(U
S$ M
n)
Source: Frost & Sullivan Compilation
Source: Frost & Sullivan Compilation
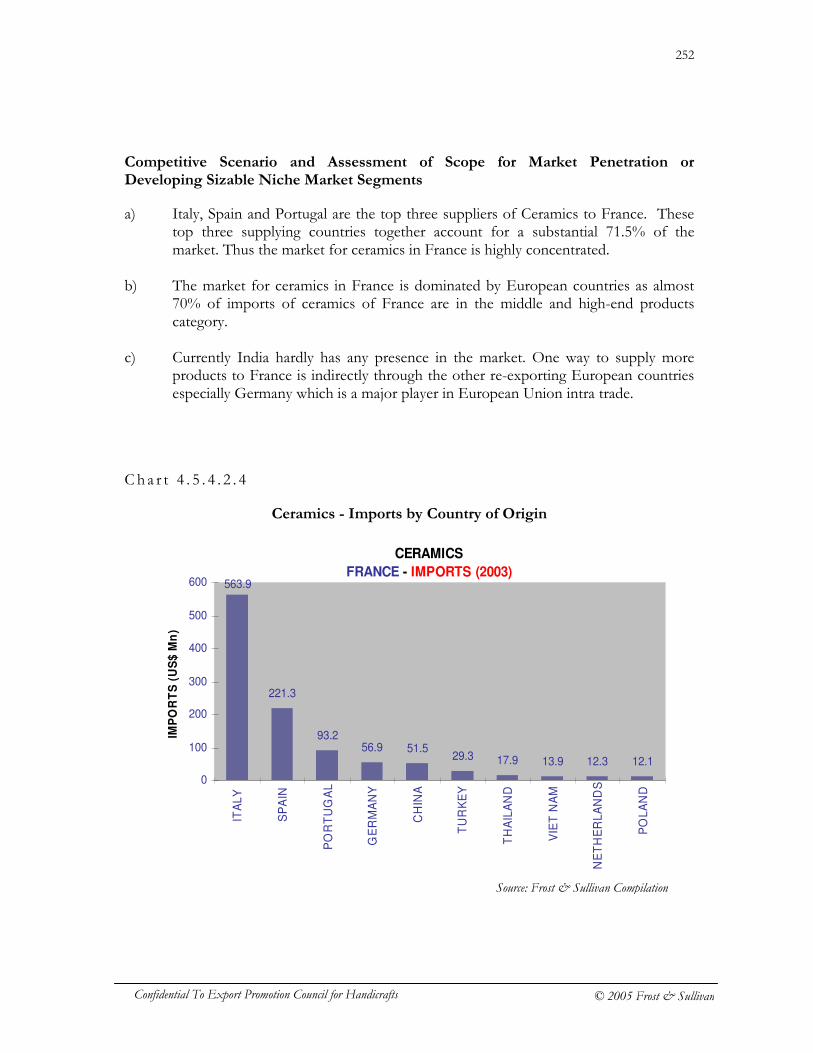
252
Confidential To Export Promotion Council for Handicrafts © 2005 Frost & Sullivan
Competitive Scenario and Assessment of Scope for Market Penetration or Developing Sizable Niche Market Segments
a) Italy, Spain and Portugal are the top three suppliers of Ceramics to France. These top three supplying countries together account for a substantial 71.5% of the market. Thus the market for ceramics in France is highly concentrated.
b) The market for ceramics in France is dominated by European countries as almost
70% of imports of ceramics of France are in the middle and high-end products category.
c) Currently India hardly has any presence in the market. One way to supply more
products to France is indirectly through the other re-exporting European countries especially Germany which is a major player in European Union intra trade.
C h a r t 4 . 5 . 4 . 2 . 4
Ceramics - Imports by Country of Origin
CERAMICS
FRANCE - IMPORTS (2003)
221.3
93.256.9 51.5
29.3 17.9 13.9 12.3 12.1
563.9
0
100
200
300
400
500
600
ITA
LY
SP
AIN
PO
RT
UG
AL
GE
RM
AN
Y
CH
INA
TU
RK
EY
TH
AIL
AN
D
VIE
T N
AM
NE
TH
ER
LA
ND
S
PO
LA
ND
IMP
OR
TS
(U
S$
Mn
)
Source: Frost & Sullivan Compilation

253
Confidential To Export Promotion Council for Handicrafts © 2005 Frost & Sullivan
4.5.4.2.5 Lighting
F i g u r e 4 . 5 . 4 . 2 . 5
Lighting - Market Snap Shot
Market Measurement Details
Market Size In Terms Of Imports In 2003 US $0.49 bn CAGR (1999-2003) 6.6% Growth Rate (2002-2003) 27.3%
Competitive Scenario and Assessment of Scope for Market Penetration or Developing Sizable Niche Market Segments
a) Italy, China and Germany are the top three suppliers of lighting and lighting accessories to France. These top three supplying countries together account for a substantial 58.6% of the market. Thus the market for lighting and lighting accessories in France is still fragmented.
b) Almost 90% of the imports in this category consist of middle and high-end
products. As a result the market for lighting and lighting accessories in France is dominated by European countries. However China has been making rapid inroads in the market and as a result its market share has increased from 15.7% in 1999 to 20.4% in 2003.
c) Currently India is the 10th largest supplier of lighting and lighting accessories to
France and has a market share of only 1.3%.
Source: Frost & Sullivan Compilation
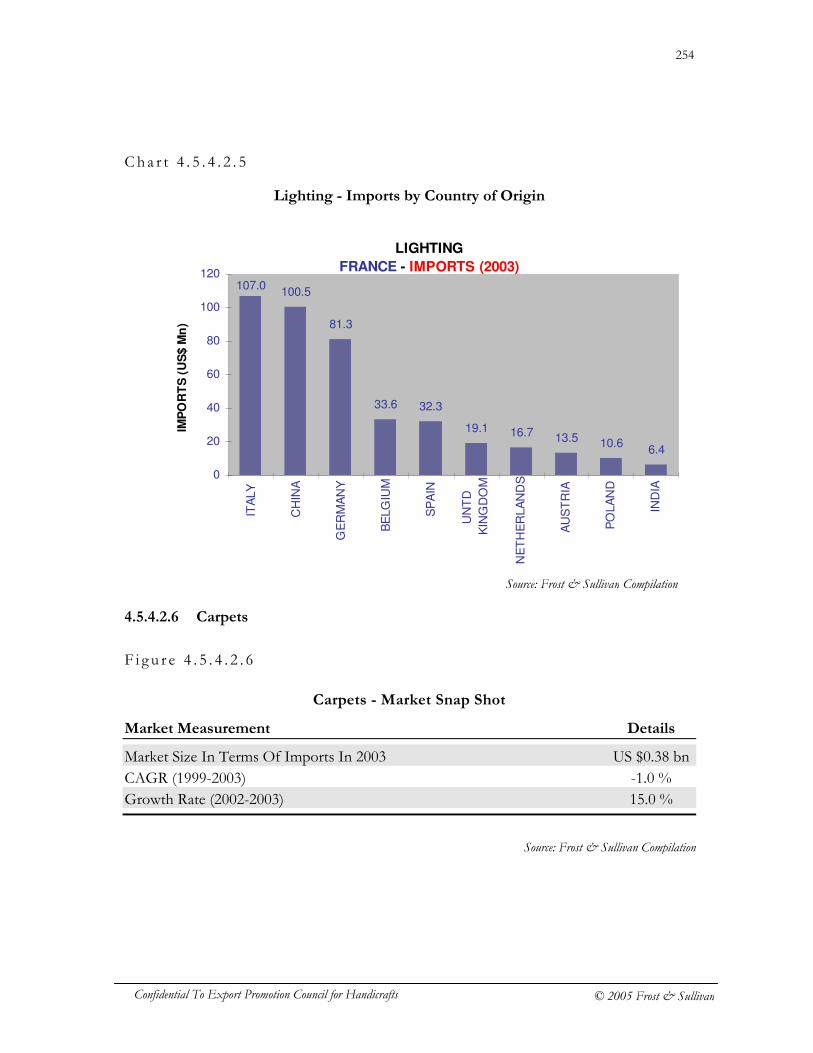
254
Confidential To Export Promotion Council for Handicrafts © 2005 Frost & Sullivan
Cha r t 4 . 5 . 4 . 2 . 5
Lighting - Imports by Country of Origin
4.5.4.2.6 Carpets
F i g u r e 4 . 5 . 4 . 2 . 6
Carpets - Market Snap Shot
Market Measurement Details
Market Size In Terms Of Imports In 2003 US $0.38 bn CAGR (1999-2003) -1.0 % Growth Rate (2002-2003) 15.0 %
Source: Frost & Sullivan Compilation
Source: Frost & Sullivan Compilation
LIGHTING
FRANCE - IMPORTS (2003)
100.5
81.3
33.6 32.3
19.1 16.7 13.5 10.66.4
107.0
0
20
40
60
80
100
120
ITA
LY
CH
INA
GE
RM
AN
Y
BE
LG
IUM
SP
AIN
UN
TD
KIN
GD
OM
NE
TH
ER
LA
ND
S
AU
ST
RIA
PO
LA
ND
IND
IA
IMP
OR
TS
(U
S$ M
n)
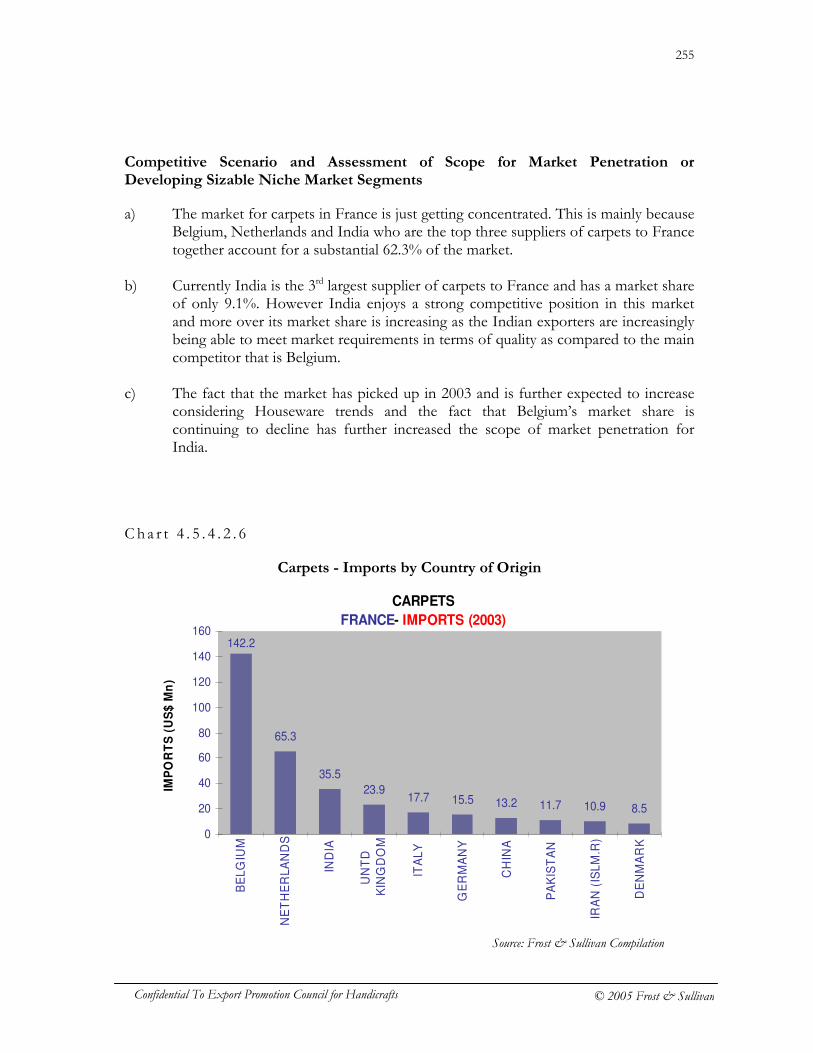
255
Confidential To Export Promotion Council for Handicrafts © 2005 Frost & Sullivan
Competitive Scenario and Assessment of Scope for Market Penetration or Developing Sizable Niche Market Segments
a) The market for carpets in France is just getting concentrated. This is mainly because Belgium, Netherlands and India who are the top three suppliers of carpets to France together account for a substantial 62.3% of the market.
b) Currently India is the 3rd largest supplier of carpets to France and has a market share
of only 9.1%. However India enjoys a strong competitive position in this market and more over its market share is increasing as the Indian exporters are increasingly being able to meet market requirements in terms of quality as compared to the main competitor that is Belgium.
c) The fact that the market has picked up in 2003 and is further expected to increase
considering Houseware trends and the fact that Belgium’s market share is continuing to decline has further increased the scope of market penetration for India.
C h a r t 4 . 5 . 4 . 2 . 6
Carpets - Imports by Country of Origin
CARPETS
FRANCE- IMPORTS (2003)
65.3
35.5
23.917.7 15.5 13.2 11.7 10.9 8.5
142.2
0
20
40
60
80
100
120
140
160
BE
LG
IUM
NE
TH
ER
LA
ND
S
IND
IA
UN
TD
KIN
GD
OM
ITA
LY
GE
RM
AN
Y
CH
INA
PA
KIS
TA
N
IRA
N (
ISL
M.R
)
DE
NM
AR
K
IMP
OR
TS
(U
S$
Mn
)
Source: Frost & Sullivan Compilation
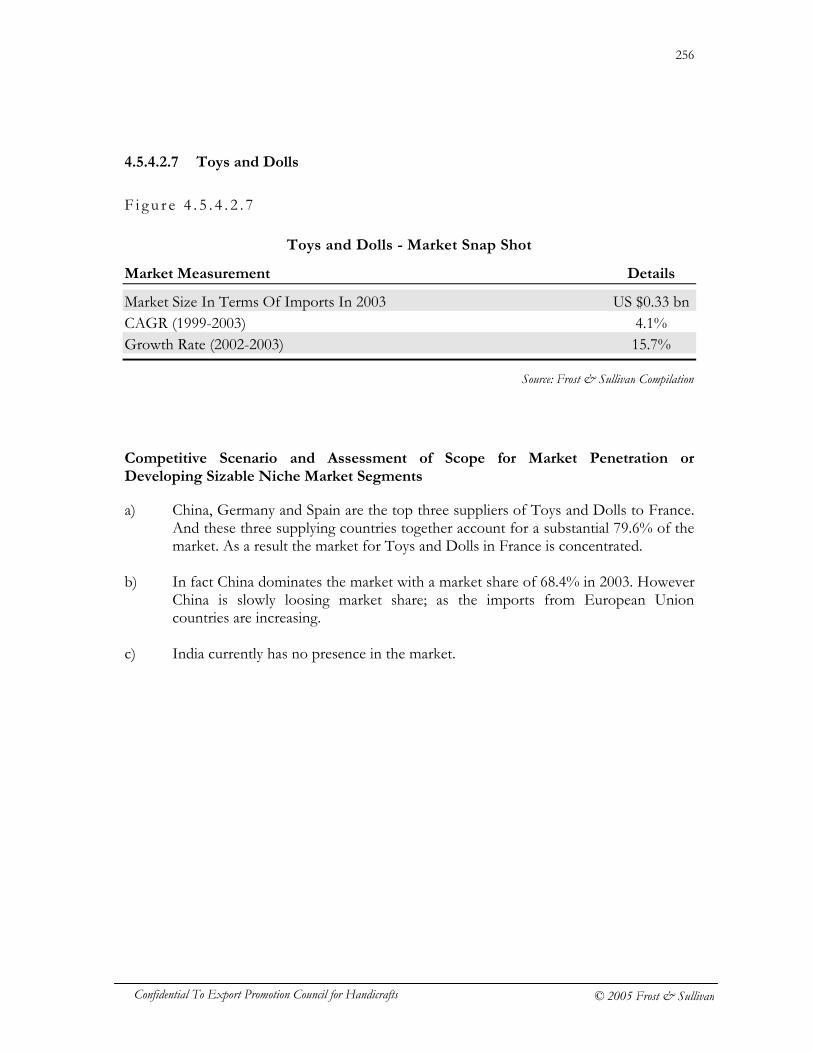
256
Confidential To Export Promotion Council for Handicrafts © 2005 Frost & Sullivan
4.5.4.2.7 Toys and Dolls
F i g u r e 4 . 5 . 4 . 2 . 7
Toys and Dolls - Market Snap Shot
Market Measurement Details
Market Size In Terms Of Imports In 2003 US $0.33 bn CAGR (1999-2003) 4.1% Growth Rate (2002-2003) 15.7%
Competitive Scenario and Assessment of Scope for Market Penetration or Developing Sizable Niche Market Segments
a) China, Germany and Spain are the top three suppliers of Toys and Dolls to France. And these three supplying countries together account for a substantial 79.6% of the market. As a result the market for Toys and Dolls in France is concentrated.
b) In fact China dominates the market with a market share of 68.4% in 2003. However
China is slowly loosing market share; as the imports from European Union countries are increasing.
c) India currently has no presence in the market.
Source: Frost & Sullivan Compilation

257
Confidential To Export Promotion Council for Handicrafts © 2005 Frost & Sullivan
Cha r t 4 . 5 . 4 . 2 . 7
Toys and Dolls - Imports by Country of Origin
4.5.4.2.8 Festive and Christmas Articles
F i g u r e 4 . 5 . 4 . 2 . 8
Festive and Christmas Articles- Market Snap Shot
Market Measurement Details
Market Size In Terms Of Imports In 2003 US $0.31 bn CAGR (1999-2003) 2.0% Growth Rate (2002-2003) 23.7%
TOYS, DOLLS
FRANCE - IMPORTS (2003)
19.5 17.8 14.7 11.2 10.1 5.5 4.8 4.0 2.8
228.0
0
50
100
150
200
250
CH
INA
GE
RM
AN
Y
SP
AIN
BE
LG
IUM
UN
TD
KIN
GD
OM
IND
ON
ES
IA
ITA
LY
VIE
T N
AM
FR
EE
ZO
NE
S
NE
TH
ER
LA
ND
S
IMP
OR
TS
(U
S$ M
n)
Source: Frost & Sullivan Compilation
Source: Frost & Sullivan Compilation
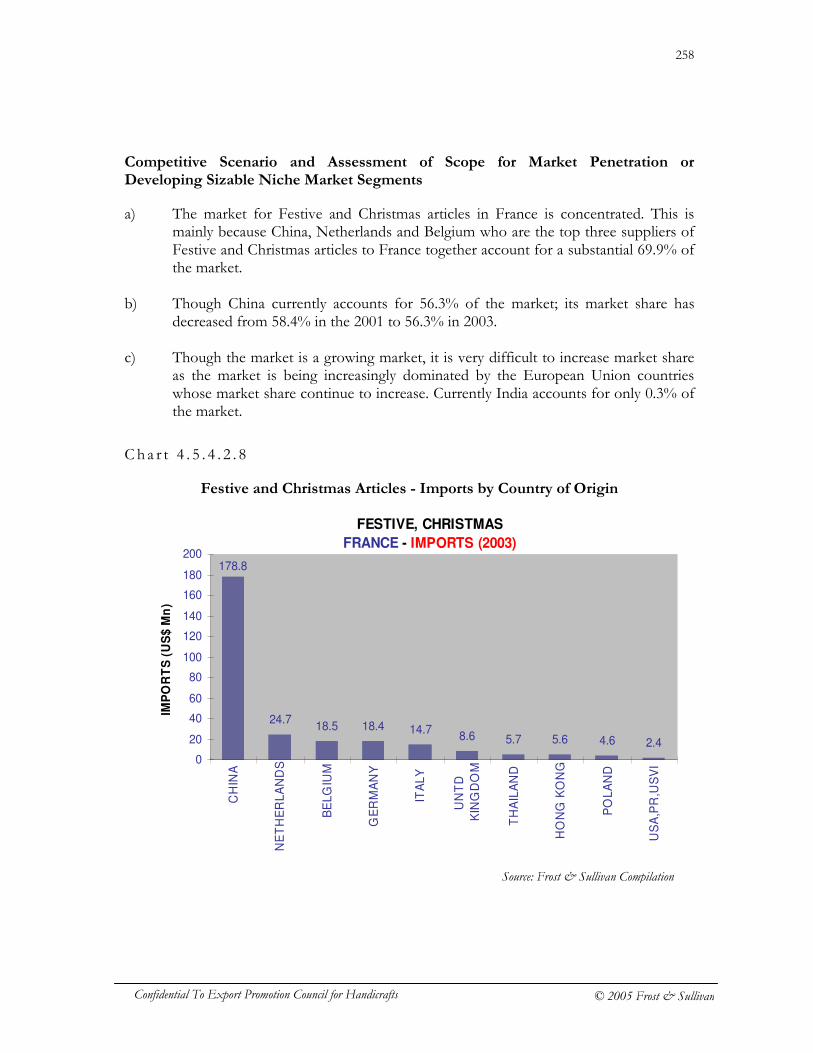
258
Confidential To Export Promotion Council for Handicrafts © 2005 Frost & Sullivan
Competitive Scenario and Assessment of Scope for Market Penetration or Developing Sizable Niche Market Segments
a) The market for Festive and Christmas articles in France is concentrated. This is mainly because China, Netherlands and Belgium who are the top three suppliers of Festive and Christmas articles to France together account for a substantial 69.9% of the market.
b) Though China currently accounts for 56.3% of the market; its market share has
decreased from 58.4% in the 2001 to 56.3% in 2003. c) Though the market is a growing market, it is very difficult to increase market share
as the market is being increasingly dominated by the European Union countries whose market share continue to increase. Currently India accounts for only 0.3% of the market.
C h a r t 4 . 5 . 4 . 2 . 8
Festive and Christmas Articles - Imports by Country of Origin
FESTIVE, CHRISTMAS
FRANCE - IMPORTS (2003)
24.718.5 18.4 14.7
8.6 5.7 5.6 4.6 2.4
178.8
0
20
40
60
80
100
120
140
160
180
200
CH
INA
NE
TH
ER
LA
ND
S
BE
LG
IUM
GE
RM
AN
Y
ITA
LY
UN
TD
KIN
GD
OM
TH
AIL
AN
D
HO
NG
KO
NG
PO
LA
ND
US
A,P
R,U
SV
I
IMP
OR
TS
(U
S$
Mn
)
Source: Frost & Sullivan Compilation
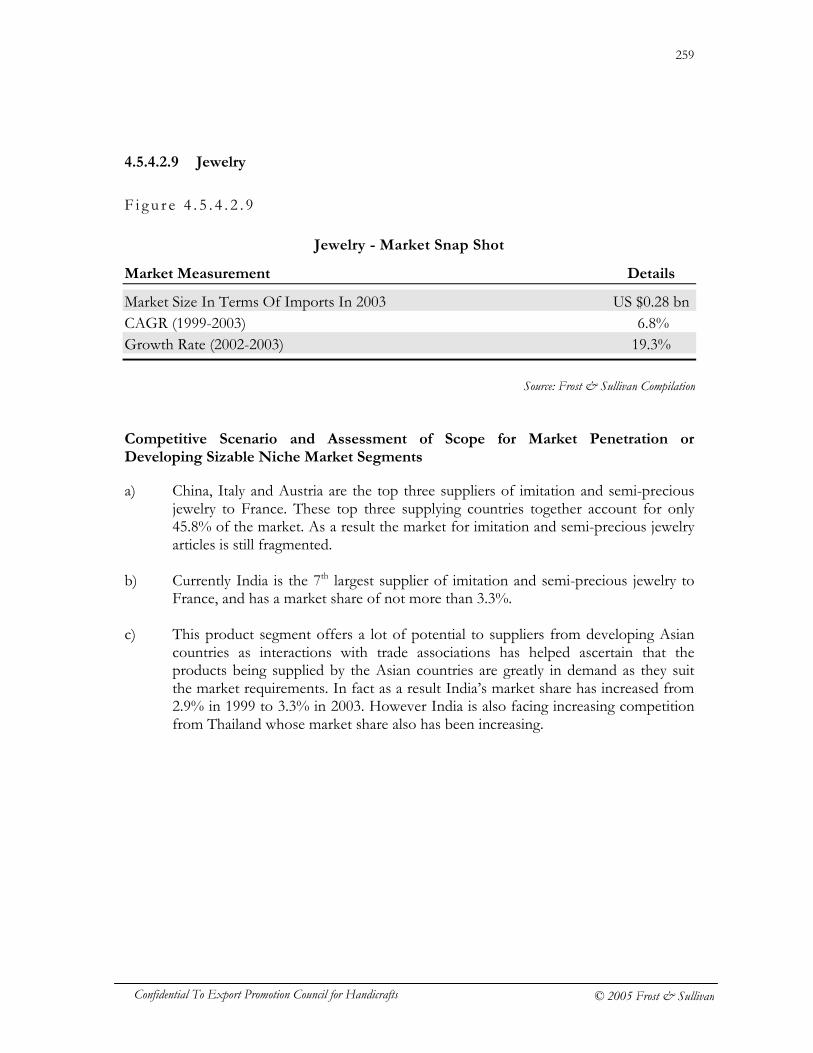
259
Confidential To Export Promotion Council for Handicrafts © 2005 Frost & Sullivan
4.5.4.2.9 Jewelry
F i g u r e 4 . 5 . 4 . 2 . 9
Jewelry - Market Snap Shot
Market Measurement Details
Market Size In Terms Of Imports In 2003 US $0.28 bn CAGR (1999-2003) 6.8% Growth Rate (2002-2003) 19.3%
Competitive Scenario and Assessment of Scope for Market Penetration or Developing Sizable Niche Market Segments
a) China, Italy and Austria are the top three suppliers of imitation and semi-precious jewelry to France. These top three supplying countries together account for only 45.8% of the market. As a result the market for imitation and semi-precious jewelry articles is still fragmented.
b) Currently India is the 7th largest supplier of imitation and semi-precious jewelry to
France, and has a market share of not more than 3.3%. c) This product segment offers a lot of potential to suppliers from developing Asian
countries as interactions with trade associations has helped ascertain that the products being supplied by the Asian countries are greatly in demand as they suit the market requirements. In fact as a result India’s market share has increased from 2.9% in 1999 to 3.3% in 2003. However India is also facing increasing competition from Thailand whose market share also has been increasing.
Source: Frost & Sullivan Compilation

260
Confidential To Export Promotion Council for Handicrafts © 2005 Frost & Sullivan
Cha r t 4 . 5 . 4 . 2 . 9
Jewelry - Imports by Country of Origin
4.5.4.2.10 Glassware
F i g u r e 4 . 5 . 4 . 2 . 1 0
Glassware - Market Snap Shot
Market Measurement Details
Market Size In Terms Of Imports In 2003 US $0.28 bn CAGR (1999-2003) 5.5% Growth Rate (2002-2003) 24.0%
JEWELLERY
FRANCE - IMPORTS (2003)
33.730.3 28.5
17.414.6
9.4 9.3 9.2 8.7
67.7
0
10
20
30
40
50
60
70
80
CH
INA
ITA
LY
AU
ST
RIA
TH
AIL
AN
D
GE
RM
AN
Y
SP
AIN
IND
IA
SW
ITZ
.LIE
CH
T
HO
NG
KO
NG
KO
RE
A R
EP
.
IMP
OR
TS
(U
S$ M
n)
Source: Frost & Sullivan Compilation
Source: Frost & Sullivan Compilation
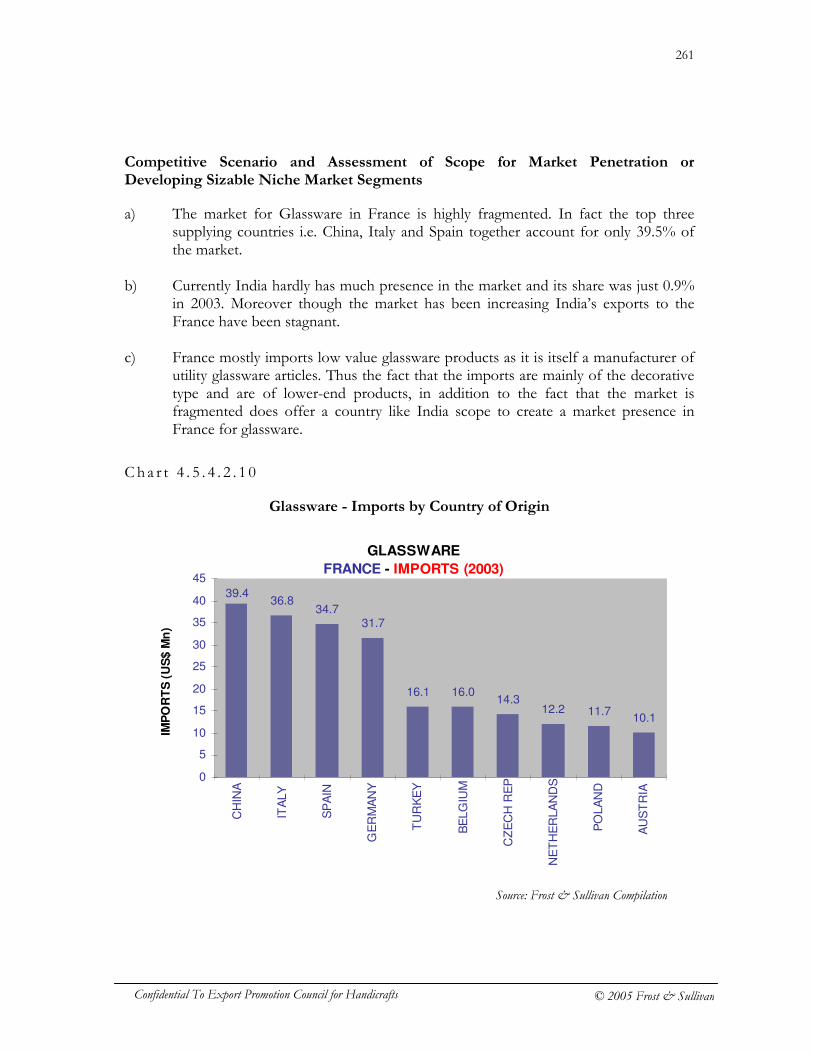
261
Confidential To Export Promotion Council for Handicrafts © 2005 Frost & Sullivan
Competitive Scenario and Assessment of Scope for Market Penetration or Developing Sizable Niche Market Segments
a) The market for Glassware in France is highly fragmented. In fact the top three supplying countries i.e. China, Italy and Spain together account for only 39.5% of the market.
b) Currently India hardly has much presence in the market and its share was just 0.9%
in 2003. Moreover though the market has been increasing India’s exports to the France have been stagnant.
c) France mostly imports low value glassware products as it is itself a manufacturer of
utility glassware articles. Thus the fact that the imports are mainly of the decorative type and are of lower-end products, in addition to the fact that the market is fragmented does offer a country like India scope to create a market presence in France for glassware.
Ch a r t 4 . 5 . 4 . 2 . 1 0
Glassware - Imports by Country of Origin
GLASSWARE
FRANCE - IMPORTS (2003)
36.834.7
31.7
16.1 16.014.3
12.2 11.710.1
39.4
0
5
10
15
20
25
30
35
40
45
CH
INA
ITA
LY
SP
AIN
GE
RM
AN
Y
TU
RK
EY
BE
LG
IUM
CZ
EC
H R
EP
NE
TH
ER
LA
ND
S
PO
LA
ND
AU
ST
RIA
IMP
OR
TS
(U
S$ M
n)
Source: Frost & Sullivan Compilation
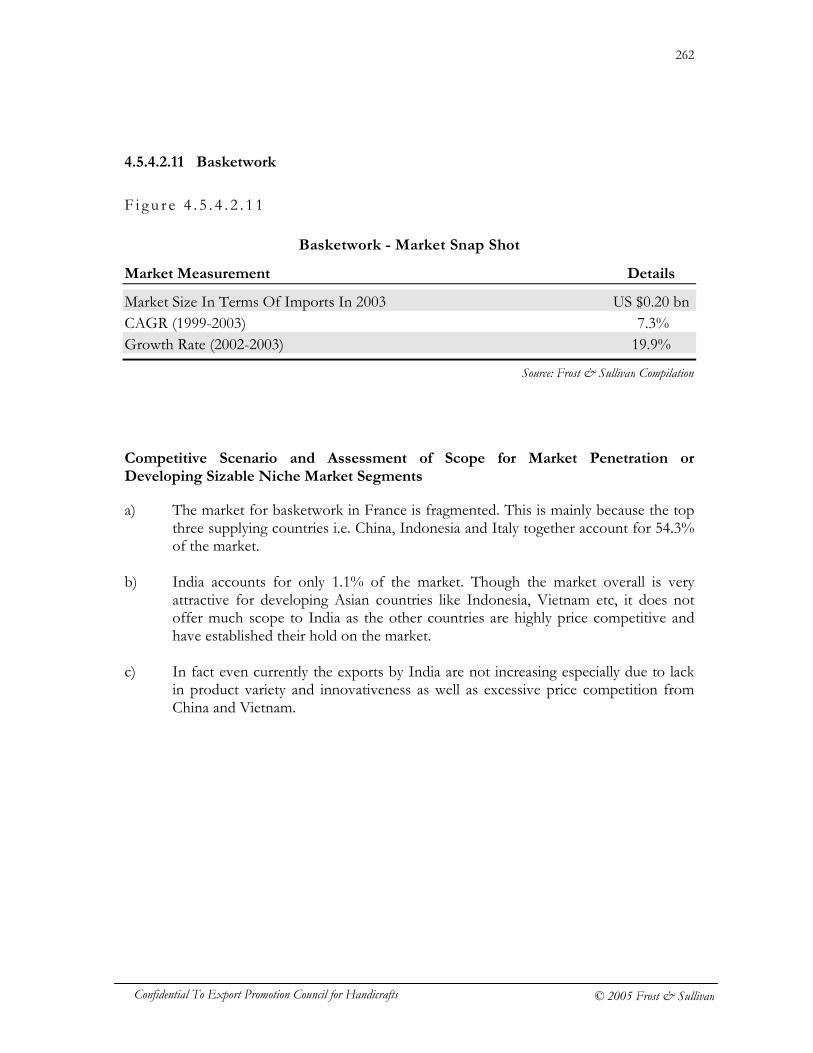
262
Confidential To Export Promotion Council for Handicrafts © 2005 Frost & Sullivan
4.5.4.2.11 Basketwork
F i g u r e 4 . 5 . 4 . 2 . 1 1
Basketwork - Market Snap Shot
Market Measurement Details
Market Size In Terms Of Imports In 2003 US $0.20 bn CAGR (1999-2003) 7.3% Growth Rate (2002-2003) 19.9%
Competitive Scenario and Assessment of Scope for Market Penetration or Developing Sizable Niche Market Segments
a) The market for basketwork in France is fragmented. This is mainly because the top three supplying countries i.e. China, Indonesia and Italy together account for 54.3% of the market.
b) India accounts for only 1.1% of the market. Though the market overall is very
attractive for developing Asian countries like Indonesia, Vietnam etc, it does not offer much scope to India as the other countries are highly price competitive and have established their hold on the market.
c) In fact even currently the exports by India are not increasing especially due to lack
in product variety and innovativeness as well as excessive price competition from China and Vietnam.
Source: Frost & Sullivan Compilation
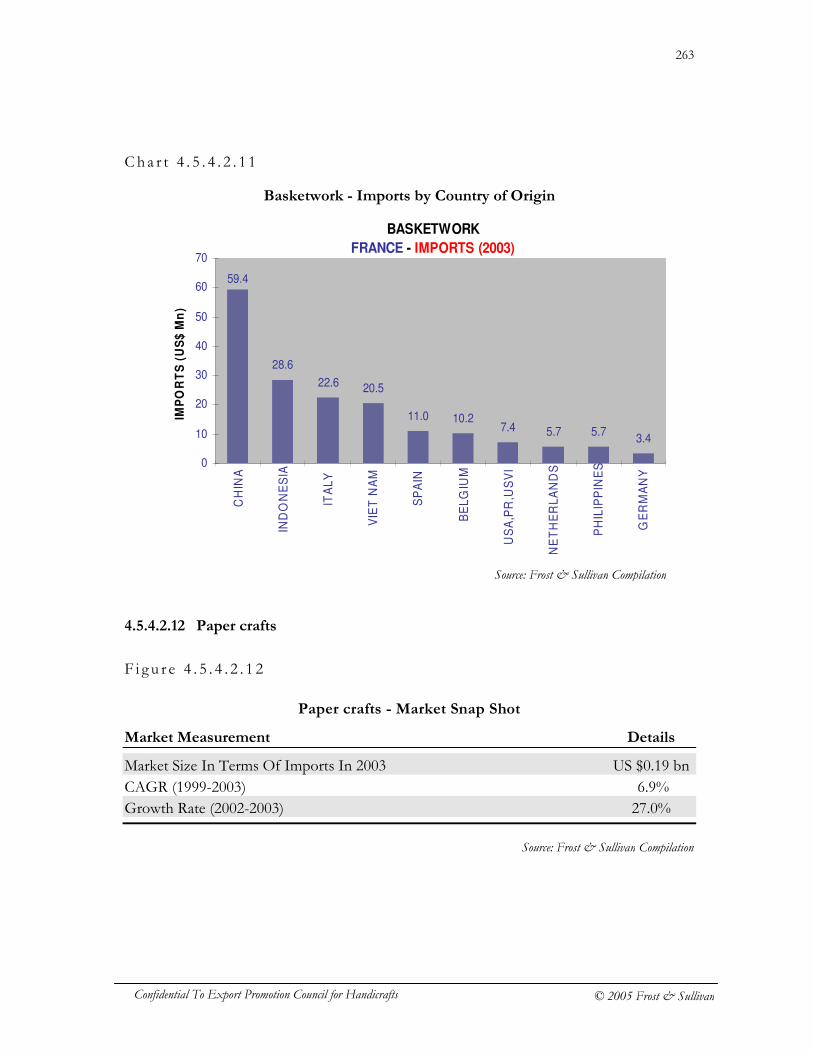
263
Confidential To Export Promotion Council for Handicrafts © 2005 Frost & Sullivan
Cha r t 4 . 5 . 4 . 2 . 1 1
Basketwork - Imports by Country of Origin
4.5.4.2.12 Paper crafts
F i g u r e 4 . 5 . 4 . 2 . 1 2
Paper crafts - Market Snap Shot
Market Measurement Details
Market Size In Terms Of Imports In 2003 US $0.19 bn CAGR (1999-2003) 6.9% Growth Rate (2002-2003) 27.0%
BASKETWORK
FRANCE - IMPORTS (2003)
28.6
22.6 20.5
11.0 10.27.4 5.7 5.7
3.4
59.4
0
10
20
30
40
50
60
70
CH
INA
IND
ON
ES
IA
ITA
LY
VIE
T N
AM
SP
AIN
BE
LG
IUM
US
A,P
R,U
SV
I
NE
TH
ER
LA
ND
S
PH
ILIP
PIN
ES
GE
RM
AN
Y
IMP
OR
TS
(U
S$
Mn
)
Source: Frost & Sullivan Compilation
Source: Frost & Sullivan Compilation
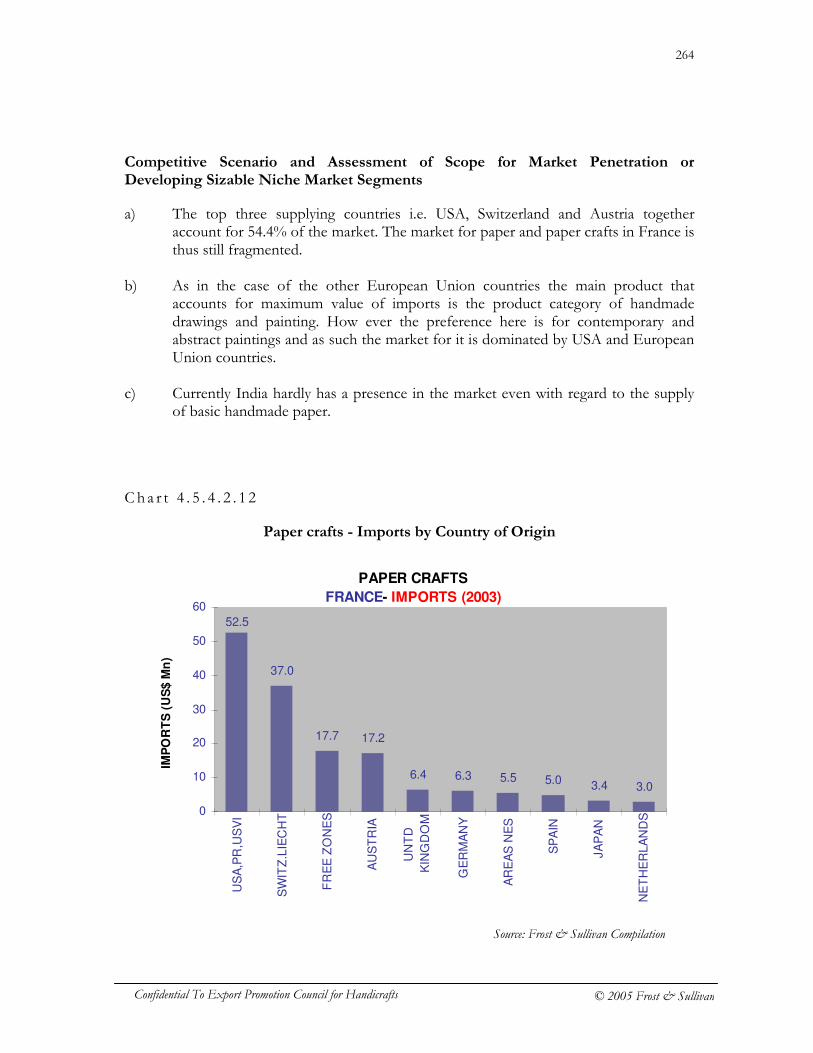
264
Confidential To Export Promotion Council for Handicrafts © 2005 Frost & Sullivan
Competitive Scenario and Assessment of Scope for Market Penetration or Developing Sizable Niche Market Segments
a) The top three supplying countries i.e. USA, Switzerland and Austria together account for 54.4% of the market. The market for paper and paper crafts in France is thus still fragmented.
b) As in the case of the other European Union countries the main product that
accounts for maximum value of imports is the product category of handmade drawings and painting. How ever the preference here is for contemporary and abstract paintings and as such the market for it is dominated by USA and European Union countries.
c) Currently India hardly has a presence in the market even with regard to the supply
of basic handmade paper.
C h a r t 4 . 5 . 4 . 2 . 1 2
Paper crafts - Imports by Country of Origin
PAPER CRAFTS
FRANCE- IMPORTS (2003)
37.0
17.7 17.2
6.4 6.3 5.5 5.0 3.4 3.0
52.5
0
10
20
30
40
50
60
US
A,P
R,U
SV
I
SW
ITZ
.LIE
CH
T
FR
EE
ZO
NE
S
AU
ST
RIA
UN
TD
KIN
GD
OM
GE
RM
AN
Y
AR
EA
S N
ES
SP
AIN
JA
PA
N
NE
TH
ER
LA
ND
S
IMP
OR
TS
(U
S$ M
n)
Source: Frost & Sullivan Compilation
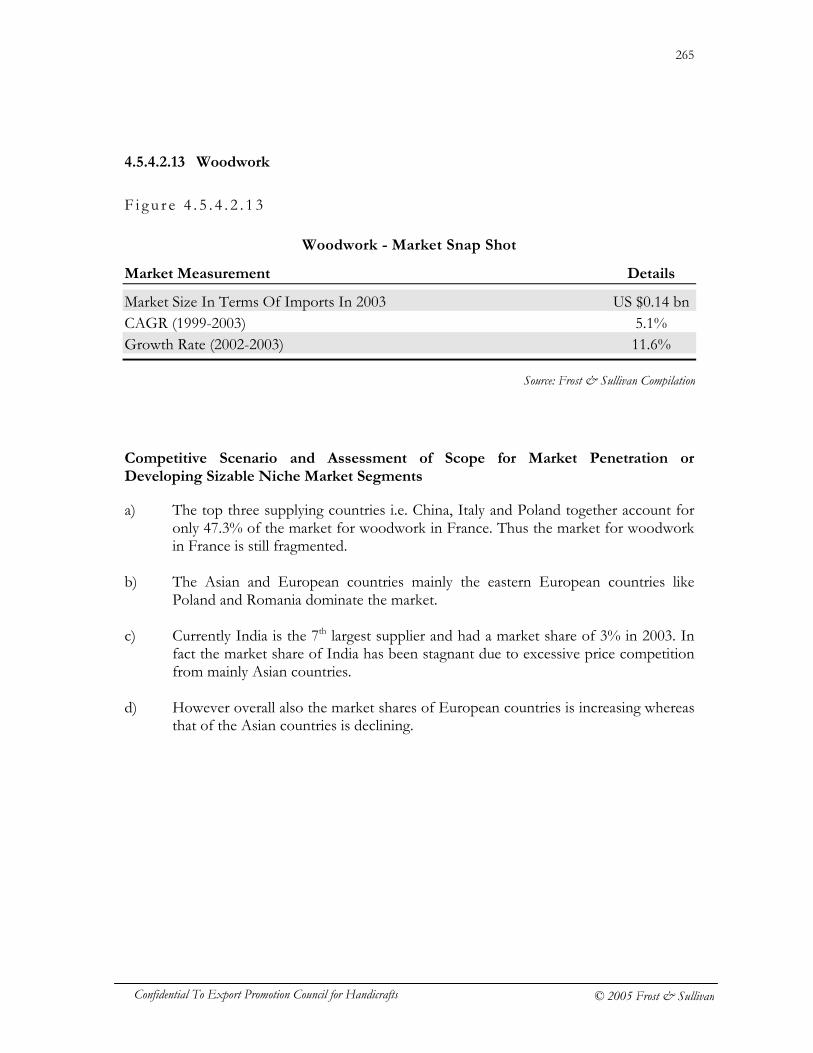
265
Confidential To Export Promotion Council for Handicrafts © 2005 Frost & Sullivan
4.5.4.2.13 Woodwork
F i g u r e 4 . 5 . 4 . 2 . 1 3
Woodwork - Market Snap Shot
Market Measurement Details
Market Size In Terms Of Imports In 2003 US $0.14 bn CAGR (1999-2003) 5.1% Growth Rate (2002-2003) 11.6%
Competitive Scenario and Assessment of Scope for Market Penetration or Developing Sizable Niche Market Segments
a) The top three supplying countries i.e. China, Italy and Poland together account for only 47.3% of the market for woodwork in France. Thus the market for woodwork in France is still fragmented.
b) The Asian and European countries mainly the eastern European countries like
Poland and Romania dominate the market. c) Currently India is the 7th largest supplier and had a market share of 3% in 2003. In
fact the market share of India has been stagnant due to excessive price competition from mainly Asian countries.
d) However overall also the market shares of European countries is increasing whereas
that of the Asian countries is declining.
Source: Frost & Sullivan Compilation
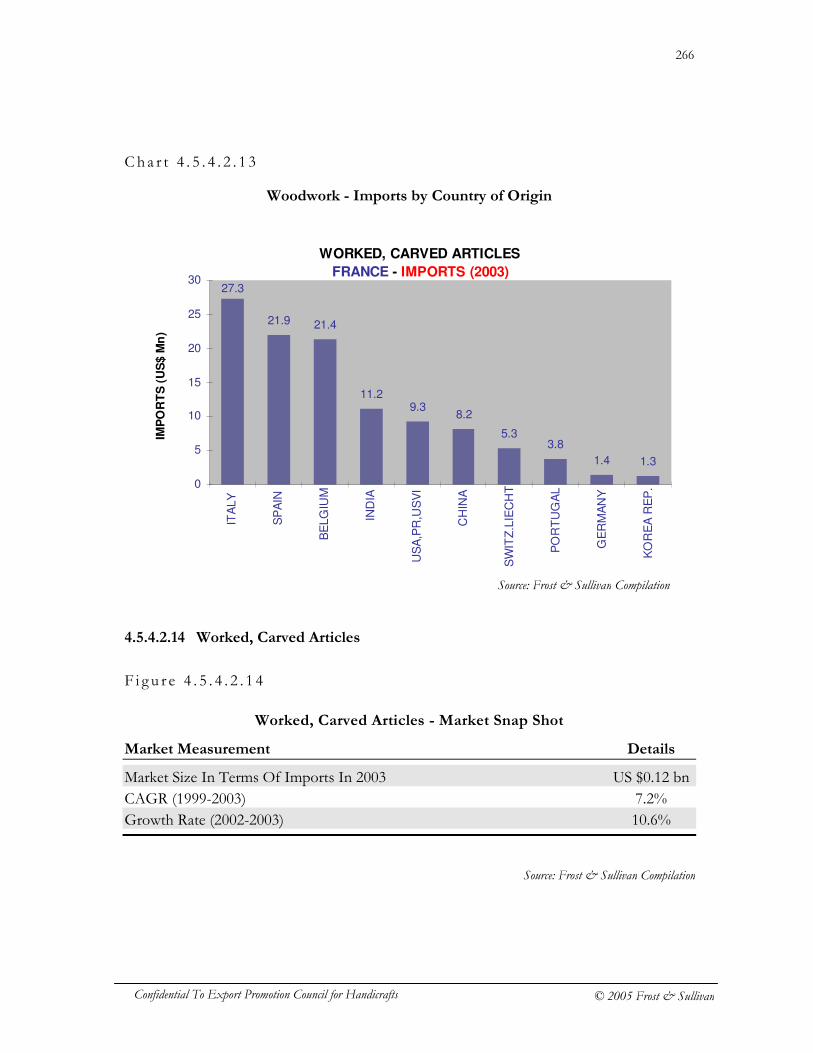
266
Confidential To Export Promotion Council for Handicrafts © 2005 Frost & Sullivan
Cha r t 4 . 5 . 4 . 2 . 1 3
Woodwork - Imports by Country of Origin
4.5.4.2.14 Worked, Carved Articles
F i g u r e 4 . 5 . 4 . 2 . 1 4
Worked, Carved Articles - Market Snap Shot
Market Measurement Details
Market Size In Terms Of Imports In 2003 US $0.12 bn CAGR (1999-2003) 7.2% Growth Rate (2002-2003) 10.6%
WORKED, CARVED ARTICLES
FRANCE - IMPORTS (2003)
21.9 21.4
11.29.3
8.2
5.33.8
1.4 1.3
27.3
0
5
10
15
20
25
30
ITA
LY
SP
AIN
BE
LG
IUM
IND
IA
US
A,P
R,U
SV
I
CH
INA
SW
ITZ
.LIE
CH
T
PO
RT
UG
AL
GE
RM
AN
Y
KO
RE
A R
EP
.
IMP
OR
TS
(U
S$ M
n)
Source: Frost & Sullivan Compilation
Source: Frost & Sullivan Compilation
267
Confidential To Export Promotion Council for Handicrafts © 2005 Frost & Sullivan
Competitive Scenario and Assessment of Scope for Market Penetration or Developing Sizable Niche Market Segments
a) The top three supplying countries i.e. Italy, Spain and Belgium together account for only 55.3% of the market for worked, carved articles in France. Thus the market for worked, carved articles in France is still fragmented.
b) Currently India is the 4th largest supplier and had a market share of 8.8% in 2003.
The market offers good potential to India as the products being supplied by India match market requirements.
c) As a result India’s share has increased from a mere 2.2% in 1999 to 8.8% in 2003.
C h a r t 4 . 5 . 4 . 2 . 1 4
Worked, Carved Articles - Imports by Country of Origin
Source: Frost & Sullivan Compilation
WOODWORK
FRANCE- IMPORTS (2003)
16.3
9.3 8.56.7 6.4
4.4 4.4 3.3 3.1
43.5
0
5
10
15
20
25
30
35
40
45
50
CH
INA
ITA
LY
PO
LA
ND
TH
AIL
AN
D
IND
ON
ES
IA
SW
ITZ
.LIE
CH
T
IND
IA
VIE
T N
AM
GE
RM
AN
Y
RO
MA
NIA
IMP
OR
TS
(U
S$ M
n)
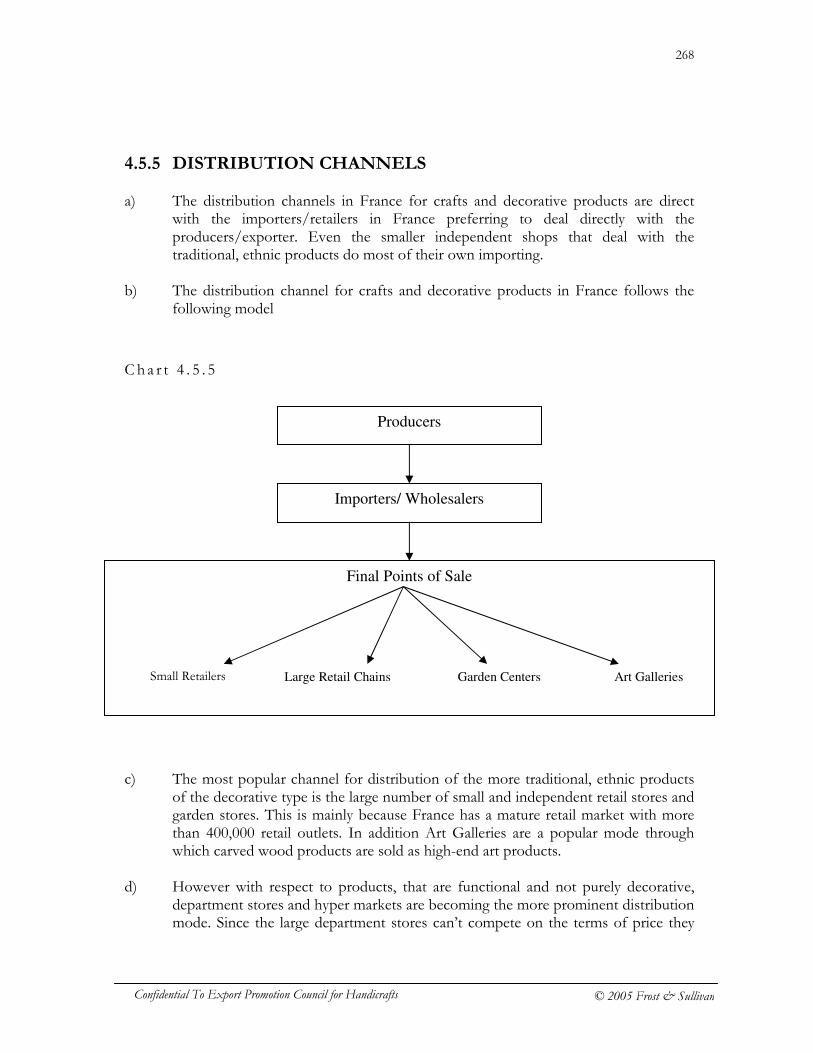
268
Confidential To Export Promotion Council for Handicrafts © 2005 Frost & Sullivan
4.5.5 DISTRIBUTION CHANNELS a) The distribution channels in France for crafts and decorative products are direct
with the importers/retailers in France preferring to deal directly with the producers/exporter. Even the smaller independent shops that deal with the traditional, ethnic products do most of their own importing.
b) The distribution channel for crafts and decorative products in France follows the
following model
C h a r t 4 . 5 . 5
c) The most popular channel for distribution of the more traditional, ethnic products
of the decorative type is the large number of small and independent retail stores and garden stores. This is mainly because France has a mature retail market with more than 400,000 retail outlets. In addition Art Galleries are a popular mode through which carved wood products are sold as high-end art products.
d) However with respect to products, that are functional and not purely decorative,
department stores and hyper markets are becoming the more prominent distribution mode. Since the large department stores can’t compete on the terms of price they
Producers
Importers/ Wholesalers
Final Points of Sale
Small Retailers Large Retail Chains Garden Centers Art Galleries
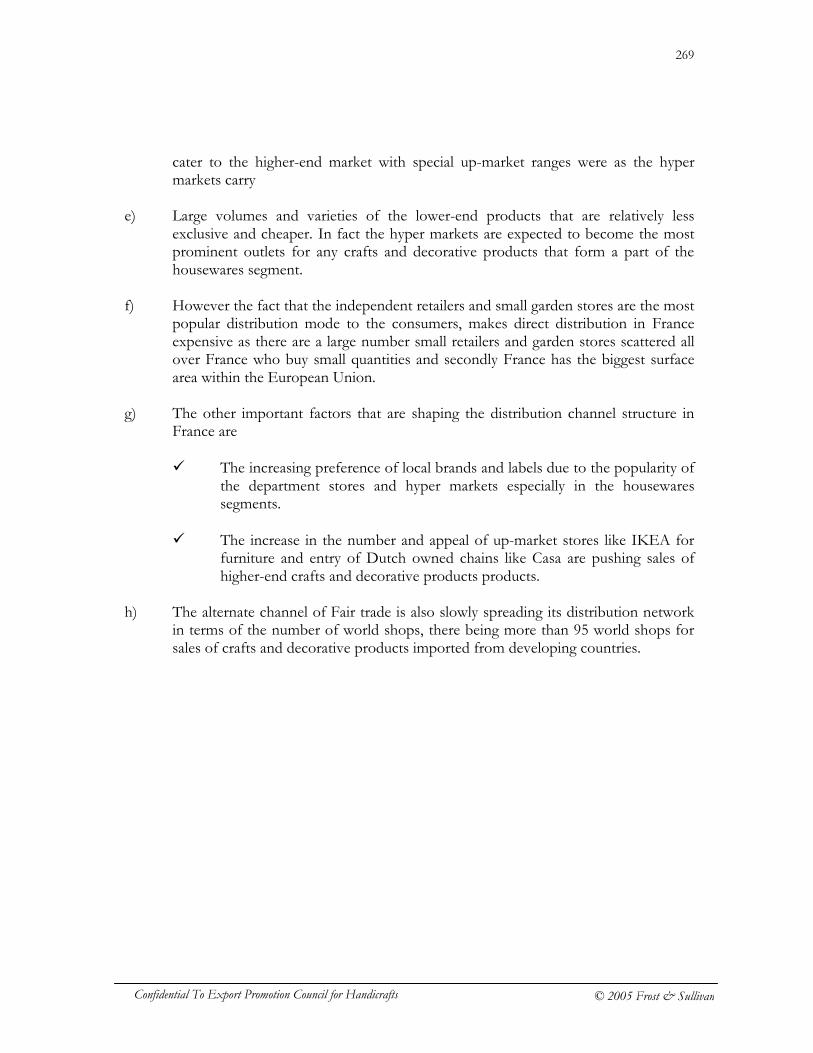
269
Confidential To Export Promotion Council for Handicrafts © 2005 Frost & Sullivan
cater to the higher-end market with special up-market ranges were as the hyper markets carry
e) Large volumes and varieties of the lower-end products that are relatively less
exclusive and cheaper. In fact the hyper markets are expected to become the most prominent outlets for any crafts and decorative products that form a part of the housewares segment.
f) However the fact that the independent retailers and small garden stores are the most
popular distribution mode to the consumers, makes direct distribution in France expensive as there are a large number small retailers and garden stores scattered all over France who buy small quantities and secondly France has the biggest surface area within the European Union.
g) The other important factors that are shaping the distribution channel structure in
France are
� The increasing preference of local brands and labels due to the popularity of the department stores and hyper markets especially in the housewares segments.
� The increase in the number and appeal of up-market stores like IKEA for
furniture and entry of Dutch owned chains like Casa are pushing sales of higher-end crafts and decorative products products.
h) The alternate channel of Fair trade is also slowly spreading its distribution network
in terms of the number of world shops, there being more than 95 world shops for sales of crafts and decorative products imported from developing countries.
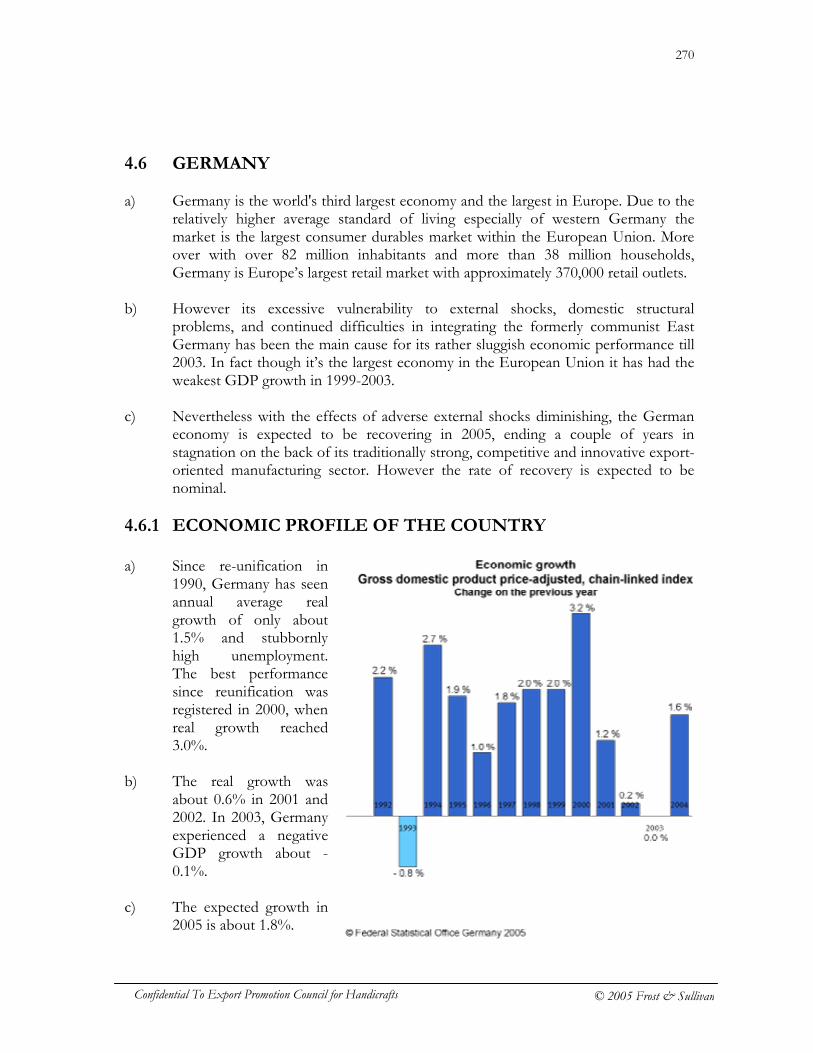
270
Confidential To Export Promotion Council for Handicrafts © 2005 Frost & Sullivan
4.6 GERMANY a) Germany is the world's third largest economy and the largest in Europe. Due to the
relatively higher average standard of living especially of western Germany the market is the largest consumer durables market within the European Union. More over with over 82 million inhabitants and more than 38 million households, Germany is Europe’s largest retail market with approximately 370,000 retail outlets.
b) However its excessive vulnerability to external shocks, domestic structural
problems, and continued difficulties in integrating the formerly communist East Germany has been the main cause for its rather sluggish economic performance till 2003. In fact though it’s the largest economy in the European Union it has had the weakest GDP growth in 1999-2003.
c) Nevertheless with the effects of adverse external shocks diminishing, the German
economy is expected to be recovering in 2005, ending a couple of years in stagnation on the back of its traditionally strong, competitive and innovative export-oriented manufacturing sector. However the rate of recovery is expected to be nominal.
4.6.1 ECONOMIC PROFILE OF THE COUNTRY a) Since re-unification in
1990, Germany has seen annual average real growth of only about 1.5% and stubbornly high unemployment. The best performance since reunification was registered in 2000, when real growth reached 3.0%.
b) The real growth was
about 0.6% in 2001 and 2002. In 2003, Germany experienced a negative GDP growth about -0.1%.
c) The expected growth in
2005 is about 1.8%.
271
Confidential To Export Promotion Council for Handicrafts © 2005 Frost & Sullivan
d) However in spite of continued economic pessimism, the relatively higher standard of living of the Germans especially the persons of West Germany and the slowly improving conditions of former East Germany is expected to drive imports of consumer durables especially gifts, crafts and decorative products.
F i g u r e 4 . 6 . 1
Germany Economic Indicators
Economic Indicator Details
GDP (2004 est. @ PPP) US $2.36 Trillion GDP Real Growth Rate (2004 est.) 1.7 % GDP Per Capita (2004 est. @ PPP) US $ 28,700 Population (July 2005 est.) 82 Million Population Growth rate (2005 est.) 0 % Disposable Personal Income per person (2003) - No. of House holds (2003) 38. 9 Million*
* Federal Statistical Office Germany Source: CIA
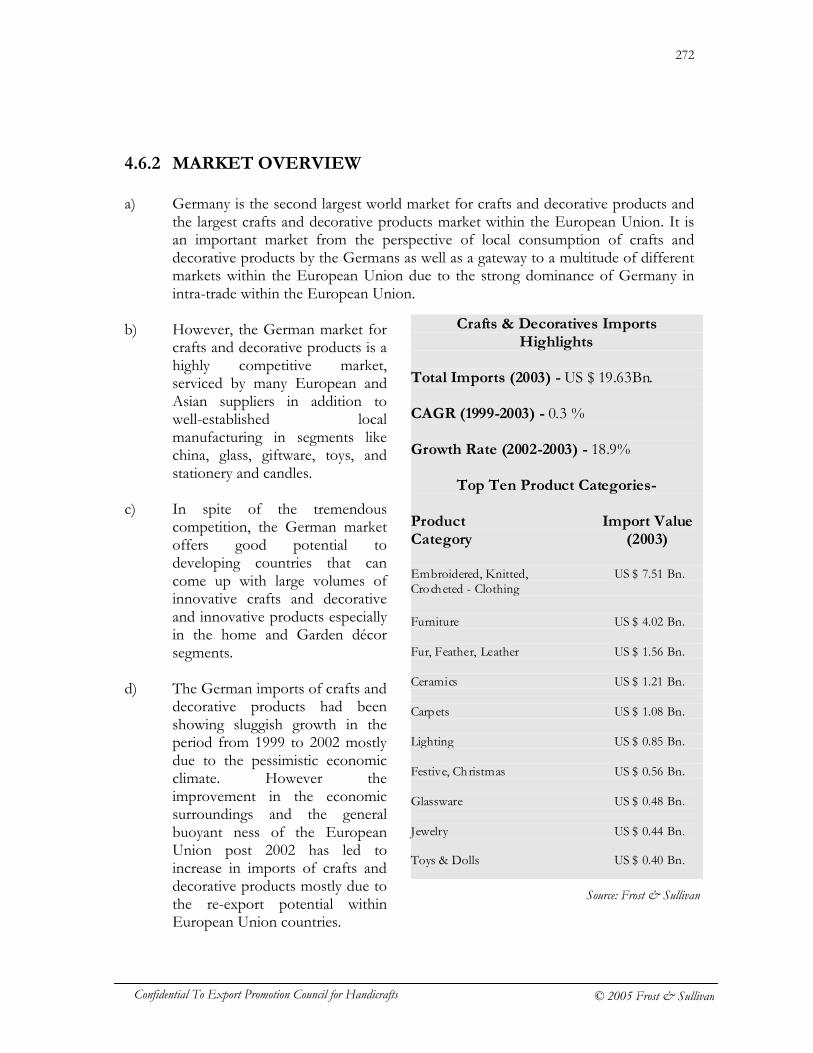
272
Confidential To Export Promotion Council for Handicrafts © 2005 Frost & Sullivan
4.6.2 MARKET OVERVIEW a) Germany is the second largest world market for crafts and decorative products and
the largest crafts and decorative products market within the European Union. It is an important market from the perspective of local consumption of crafts and decorative products by the Germans as well as a gateway to a multitude of different markets within the European Union due to the strong dominance of Germany in intra-trade within the European Union.
b) However, the German market for
crafts and decorative products is a highly competitive market, serviced by many European and Asian suppliers in addition to well-established local manufacturing in segments like china, glass, giftware, toys, and stationery and candles.
c) In spite of the tremendous
competition, the German market offers good potential to developing countries that can come up with large volumes of innovative crafts and decorative and innovative products especially in the home and Garden décor segments.
d) The German imports of crafts and
decorative products had been showing sluggish growth in the period from 1999 to 2002 mostly due to the pessimistic economic climate. However the improvement in the economic surroundings and the general buoyant ness of the European Union post 2002 has led to increase in imports of crafts and decorative products mostly due to the re-export potential within European Union countries.
Crafts & Decoratives Imports Highlights
Total Imports (2003) - US $ 19.63Bn. CAGR (1999-2003) - 0.3 % Growth Rate (2002-2003) - 18.9%
Top Ten Product Categories-
Product Import Value Category (2003) Embroidered, Knitted, US $ 7.51 Bn. Crocheted - Clothing Furniture US $ 4.02 Bn. Fur, Feather, Leather US $ 1.56 Bn. Ceramics US $ 1.21 Bn. Carpets US $ 1.08 Bn. Lighting US $ 0.85 Bn. Festive, Christmas US $ 0.56 Bn. Glassware US $ 0.48 Bn. Jewelry US $ 0.44 Bn. Toys & Dolls US $ 0.40 Bn.
Source: Frost & Sullivan
273
Confidential To Export Promotion Council for Handicrafts © 2005 Frost & Sullivan
e) German import of crafts and decorative products grew at a rate of 0.3% from 1999-2003. However in 2003 the imports showed a fantastic increase of 18.9% due to increase in domestic consumption as well as re-export potential within European Union countries.
f) The main growth in imports over the period 1999-2003 has been in product
categories like home furnishings, and decoratives including art metal ware, basketwork and pottery that can be used to decorate homes and Gardens.
g) Especially garden and home décor articles are expected to continue to be demand
because the home and the garden is a symbol for privacy, individuality and wellbeing in Germany, and thus most Germans are willing to spend a considerable amount of money to improve their well-being at home. This is, for example, reflected by furniture consumption per capita, which amounted to € 484.24 in 2003, 43.6 percent higher than the European Union average for furniture consumption. Even when it comes to the consumption of decorative garden articles, Germany is considered the leading gardening market in the EU. Mostly because gardens have an important social, ecological and cultural function for the Germans and Germans’ positive attitude towards nature, environment and recreation will continue to drive the interest in gardening and related décor products in the future.
h) The other products that have shown increase in demand in 2003 and are expected
to continue to increase are Festive and Christmas, Lighting and glassware. The imports of product categories like glassware and ceramics are increasing mainly because the domestic production of the same has continued to decline due to the increase in outsourcing their production to countries like China to reduce the cost of high domestic wages.
i) However the crafts and decorative products market in Germany is slowly becoming
very quality consciousness across range of product groups along with an increasing interest in new-to-market innovative products.
j) The German consumers have always been very price conscious as reflected by the
importance of discount stores in Germany; however an increasing number of consumers especially from West Germany are ready to pay better prices for one-of-a-kind decorative articles.
k) With respect to the retail scenario for crafts and decorative products in Germany,
the mail-order stores are the most important distribution mode due to the rapid increase in number of large mail-order stores and their increasing reach and appeal among the German consumers.
l) The purchase of crafts and decorative products in Germany however varies on a
seasonal basis with November/December being the period in which the greatest
274
Confidential To Export Promotion Council for Handicrafts © 2005 Frost & Sullivan
sales volume is experienced. After Christmas, Easter is the second-most significant gift-giving occasion. May is also a period of reasonable crafts and decorative products sales.
4.6.3 KEY FACTORS THAT DRIVE THE MARKET a) There has been a decline in domestic production of products like glassware,
ceramics and metalware due to increase in outsourcing of manufacturing to countries like China in order to reduce the high domestic wage cost. This has led to increase in imports of such products from other European Union countries as well as Asian countries.
b) The German economy has always been export-driven. Even now though due to
price competition from Asian and Eastern European countries the domestic production of crafts and decorative products is declining in Germany, it is taking the advantage of the unification of European Union and the resulting free trade within European Union by importing low cost products from Asian countries and selling the same to other European Union countries after little value addition.
c) The increasing importance given by the German consumers to their homes and
especially gardens has resulted in the increase in demand and thereby imports of home and garden décor articles. More over the continued positive attitude towards nature and environment is expected to maintain the demand for products that have an ethnic or environmental friendly orientation.
275
Confidential To Export Promotion Council for Handicrafts © 2005 Frost & Sullivan
4.6.4 MARKETS FOR CRAFTS AND DECORATIVE PRODUCTS
4.6.4.1 Trend in Imports
F i g u r e 4 . 6 . 4 . 1
Import Trend - Import Values of Major Product Categories (In US $Bn)
Product Category 2003 2002 2001 2000 1999
E,K,C - Clothing 7.51 6.12 6.21 6.38 6.84 Furniture 4.02 3.29 3.39 3.25 3.70 Fur, Feather, Leather 1.56 1.48 1.66 1.59 1.83 Ceramics 1.21 1.03 1.14 1.13 1.47 Carpets 1.08 1.01 1.15 1.11 1.38 Lighting 0.85 0.71 0.80 0.76 0.80 Festive, Christmas 0.56 0.43 0.45 0.50 0.53 Glassware 0.48 0.35 0.37 0.37 0.42 Jewelry 0.44 0.37 0.36 0.37 0.40 Toys, Dolls 0.40 0.36 0.34 0.39 0.44 Worked, Carved 0.31 0.29 0.32 0.33 0.39 E,K,C - Furnishing 0.28 0.19 0.19 0.19 0.21 Basketwork 0.21 0.15 0.16 0.16 0.17 Woodwork 0.18 0.14 0.15 0.16 0.18 Paper crafts 0.13 0.18 0.35 0.24 0.17
4.6.4.2 Analysis of Product Categories a) The increasing importance of homes and especially gardens has led to the increase
in demand and imports of articles that can be used to decorate and personalize homes and Gardens like
� Home Furnishings � Lightings especially garden lighting � Festive and Christmas decorations especially candles
b) More over with decline in domestic production of glassware, ceramics and metal
ware, the imports of these products have also been on an increase since 2002 c) However since 2003, the imports of many other low value decorative products from
Asian countries has increased due to the same being imported in increasing quantities for the purpose of re-exports within the European Union.
Source: Frost & Sullivan Compilation
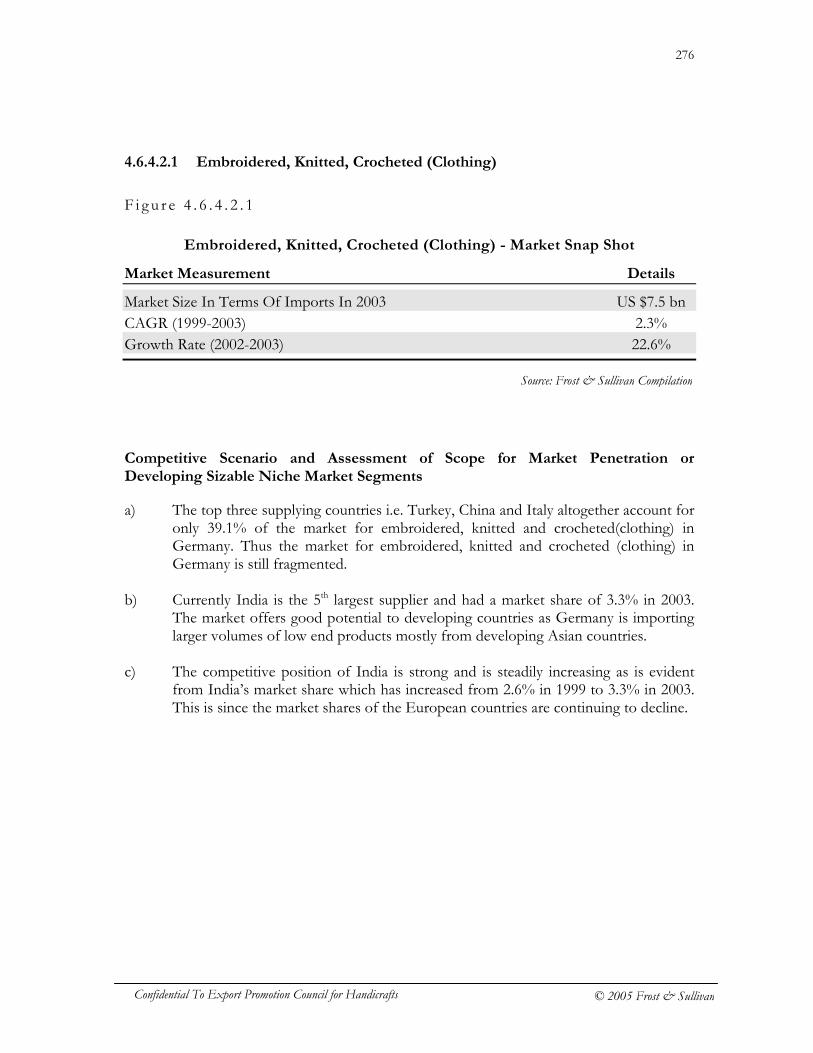
276
Confidential To Export Promotion Council for Handicrafts © 2005 Frost & Sullivan
4.6.4.2.1 Embroidered, Knitted, Crocheted (Clothing)
F i g u r e 4 . 6 . 4 . 2 . 1
Embroidered, Knitted, Crocheted (Clothing) - Market Snap Shot
Market Measurement Details
Market Size In Terms Of Imports In 2003 US $7.5 bn CAGR (1999-2003) 2.3% Growth Rate (2002-2003) 22.6%
Competitive Scenario and Assessment of Scope for Market Penetration or Developing Sizable Niche Market Segments
a) The top three supplying countries i.e. Turkey, China and Italy altogether account for only 39.1% of the market for embroidered, knitted and crocheted(clothing) in Germany. Thus the market for embroidered, knitted and crocheted (clothing) in Germany is still fragmented.
b) Currently India is the 5th largest supplier and had a market share of 3.3% in 2003.
The market offers good potential to developing countries as Germany is importing larger volumes of low end products mostly from developing Asian countries.
c) The competitive position of India is strong and is steadily increasing as is evident
from India’s market share which has increased from 2.6% in 1999 to 3.3% in 2003. This is since the market shares of the European countries are continuing to decline.
Source: Frost & Sullivan Compilation

277
Confidential To Export Promotion Council for Handicrafts © 2005 Frost & Sullivan
Cha r t 4 . 6 . 4 . 2 . 1
Embroidered, Knitted, Crocheted (Clothing) - Imports by Country of Origin
4.6.4.2.2 Furniture
F i g u r e 4 . 6 . 4 . 2 . 2
Furniture - Market Snap Shot
Market Measurement Details
Market Size In Terms Of Imports In 2003 US $4.02 bn CAGR (1999-2003) 2.0% Growth Rate (2002-2003) 22.0%
E,K,C - CLOTHING
GERMANY - IMPORTS (2003)
597.7 581.4 547.8
246.3 245.3 208.6 201.8 179.1 162.4
1756.9
0
200
400
600
800
1000
1200
1400
1600
1800
2000
TU
RK
EY
CH
INA
ITA
LY
BA
NG
LA
DE
SH
IND
IA
HO
NG
KO
NG
IND
ON
ES
IA
PO
RT
UG
AL
RO
MA
NIA
FR
AN
CE
IMP
OR
TS
(U
S$
Mn
)
Source: Frost & Sullivan Compilation
Source: Frost & Sullivan Compilation
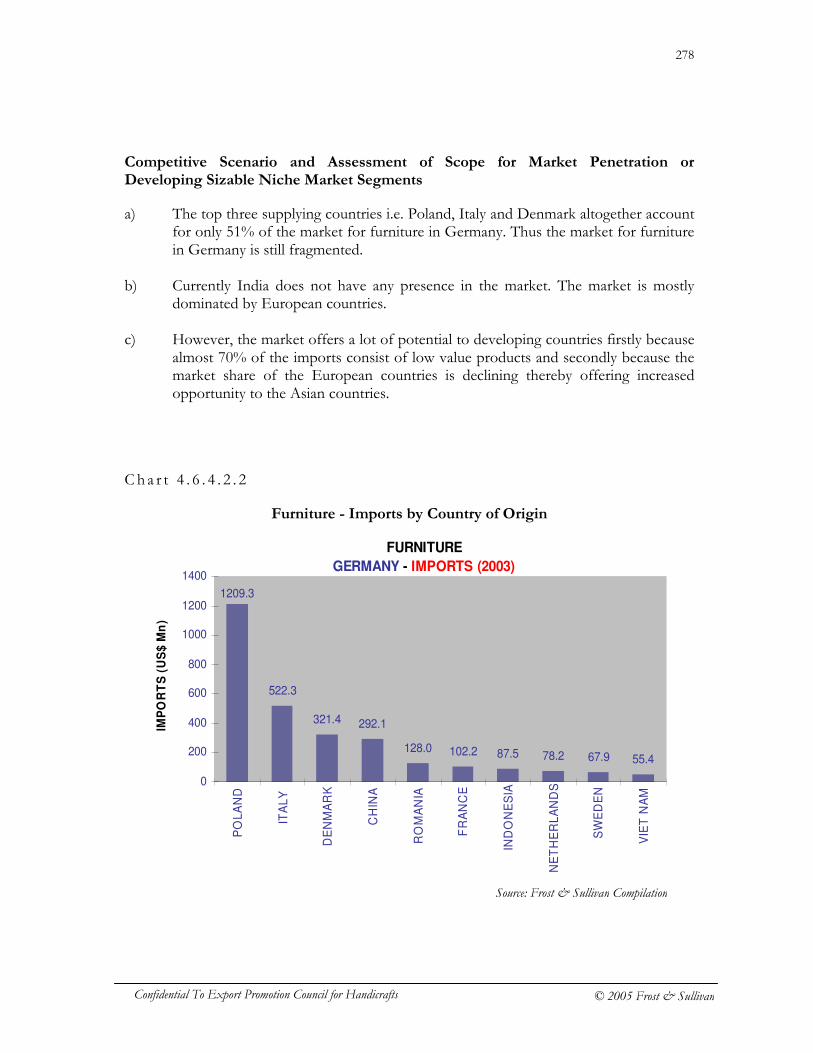
278
Confidential To Export Promotion Council for Handicrafts © 2005 Frost & Sullivan
Competitive Scenario and Assessment of Scope for Market Penetration or Developing Sizable Niche Market Segments
a) The top three supplying countries i.e. Poland, Italy and Denmark altogether account for only 51% of the market for furniture in Germany. Thus the market for furniture in Germany is still fragmented.
b) Currently India does not have any presence in the market. The market is mostly
dominated by European countries. c) However, the market offers a lot of potential to developing countries firstly because
almost 70% of the imports consist of low value products and secondly because the market share of the European countries is declining thereby offering increased opportunity to the Asian countries.
C h a r t 4 . 6 . 4 . 2 . 2
Furniture - Imports by Country of Origin
FURNITURE
GERMANY - IMPORTS (2003)
522.3
321.4 292.1
128.0 102.2 87.5 78.2 67.9 55.4
1209.3
0
200
400
600
800
1000
1200
1400
PO
LA
ND
ITA
LY
DE
NM
AR
K
CH
INA
RO
MA
NIA
FR
AN
CE
IND
ON
ES
IA
NE
TH
ER
LA
ND
S
SW
ED
EN
VIE
T N
AM
IMP
OR
TS
(U
S$
Mn
)
Source: Frost & Sullivan Compilation
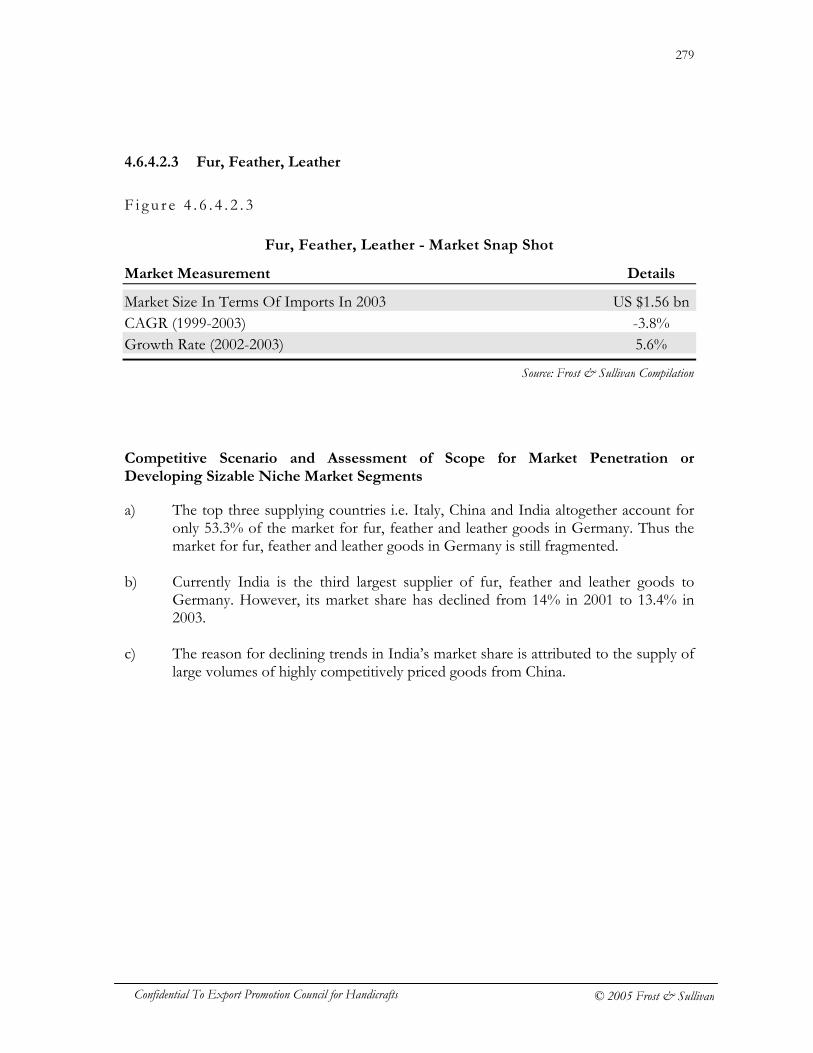
279
Confidential To Export Promotion Council for Handicrafts © 2005 Frost & Sullivan
4.6.4.2.3 Fur, Feather, Leather
F i g u r e 4 . 6 . 4 . 2 . 3
Fur, Feather, Leather - Market Snap Shot
Market Measurement Details
Market Size In Terms Of Imports In 2003 US $1.56 bn CAGR (1999-2003) -3.8% Growth Rate (2002-2003) 5.6%
Competitive Scenario and Assessment of Scope for Market Penetration or Developing Sizable Niche Market Segments
a) The top three supplying countries i.e. Italy, China and India altogether account for only 53.3% of the market for fur, feather and leather goods in Germany. Thus the market for fur, feather and leather goods in Germany is still fragmented.
b) Currently India is the third largest supplier of fur, feather and leather goods to
Germany. However, its market share has declined from 14% in 2001 to 13.4% in 2003.
c) The reason for declining trends in India’s market share is attributed to the supply of
large volumes of highly competitively priced goods from China.
Source: Frost & Sullivan Compilation
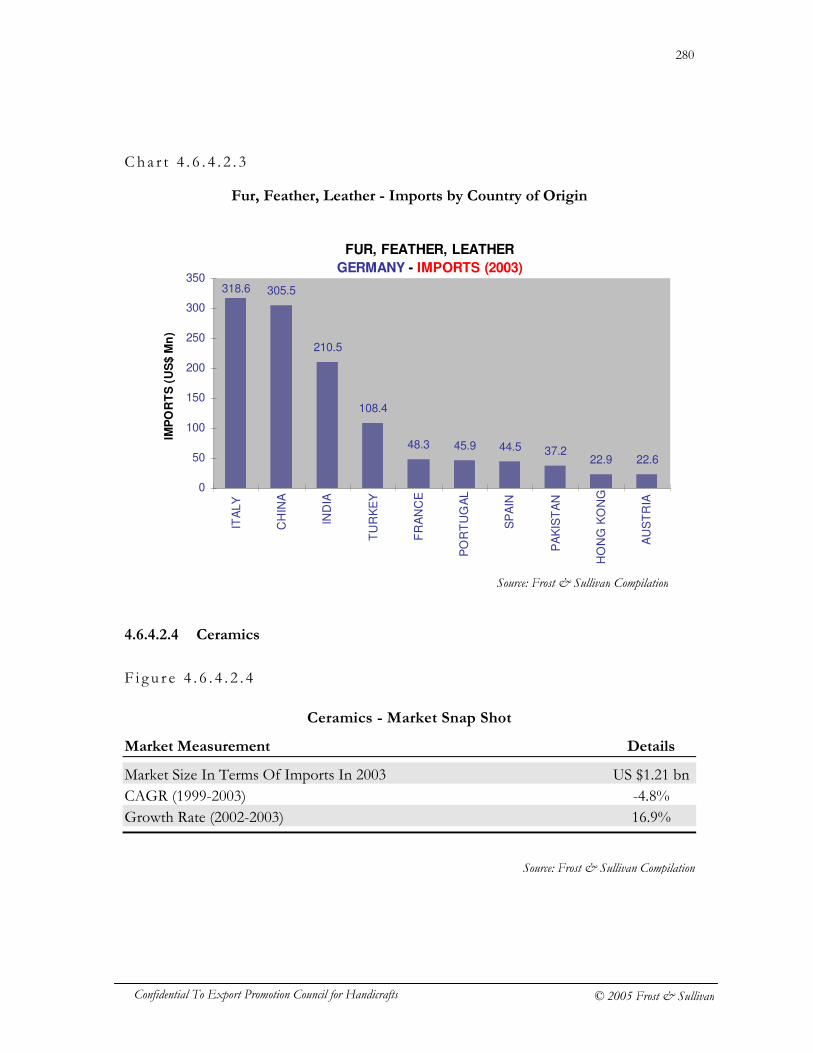
280
Confidential To Export Promotion Council for Handicrafts © 2005 Frost & Sullivan
Cha r t 4 . 6 . 4 . 2 . 3
Fur, Feather, Leather - Imports by Country of Origin
4.6.4.2.4 Ceramics
F i g u r e 4 . 6 . 4 . 2 . 4
Ceramics - Market Snap Shot
Market Measurement Details
Market Size In Terms Of Imports In 2003 US $1.21 bn CAGR (1999-2003) -4.8% Growth Rate (2002-2003) 16.9%
FUR, FEATHER, LEATHER
GERMANY - IMPORTS (2003)
305.5
210.5
108.4
48.3 45.9 44.5 37.222.9 22.6
318.6
0
50
100
150
200
250
300
350
ITA
LY
CH
INA
IND
IA
TU
RK
EY
FR
AN
CE
PO
RT
UG
AL
SP
AIN
PA
KIS
TA
N
HO
NG
KO
NG
AU
ST
RIA
IMP
OR
TS
(U
S$ M
n)
Source: Frost & Sullivan Compilation
Source: Frost & Sullivan Compilation
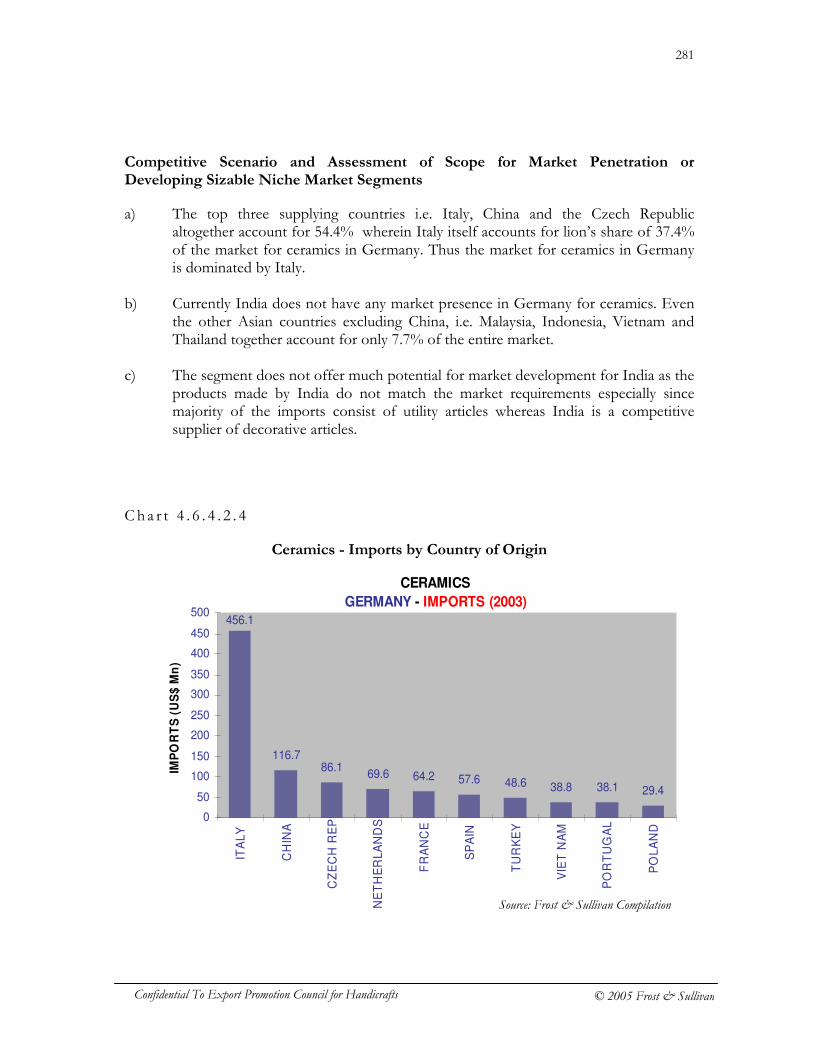
281
Confidential To Export Promotion Council for Handicrafts © 2005 Frost & Sullivan
Competitive Scenario and Assessment of Scope for Market Penetration or Developing Sizable Niche Market Segments
a) The top three supplying countries i.e. Italy, China and the Czech Republic altogether account for 54.4% wherein Italy itself accounts for lion’s share of 37.4% of the market for ceramics in Germany. Thus the market for ceramics in Germany is dominated by Italy.
b) Currently India does not have any market presence in Germany for ceramics. Even
the other Asian countries excluding China, i.e. Malaysia, Indonesia, Vietnam and Thailand together account for only 7.7% of the entire market.
c) The segment does not offer much potential for market development for India as the
products made by India do not match the market requirements especially since majority of the imports consist of utility articles whereas India is a competitive supplier of decorative articles.
C h a r t 4 . 6 . 4 . 2 . 4
Ceramics - Imports by Country of Origin
CERAMICS
GERMANY - IMPORTS (2003)
116.786.1
69.6 64.2 57.6 48.6 38.8 38.1 29.4
456.1
0
50
100
150
200
250
300
350
400
450
500
ITA
LY
CH
INA
CZ
EC
H R
EP
NE
TH
ER
LA
ND
S
FR
AN
CE
SP
AIN
TU
RK
EY
VIE
T N
AM
PO
RT
UG
AL
PO
LA
ND
IMP
OR
TS
(U
S$
Mn
)
Source: Frost & Sullivan Compilation
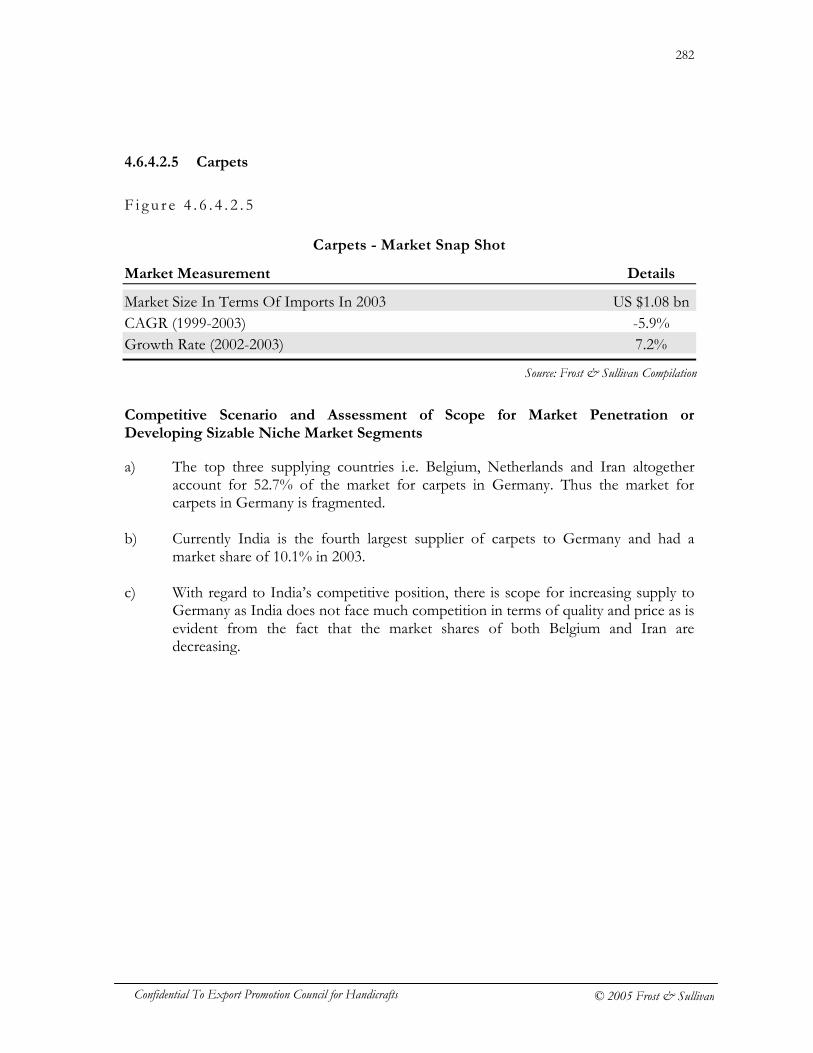
282
Confidential To Export Promotion Council for Handicrafts © 2005 Frost & Sullivan
4.6.4.2.5 Carpets
F i g u r e 4 . 6 . 4 . 2 . 5
Carpets - Market Snap Shot
Market Measurement Details
Market Size In Terms Of Imports In 2003 US $1.08 bn CAGR (1999-2003) -5.9% Growth Rate (2002-2003) 7.2%
Competitive Scenario and Assessment of Scope for Market Penetration or Developing Sizable Niche Market Segments
a) The top three supplying countries i.e. Belgium, Netherlands and Iran altogether account for 52.7% of the market for carpets in Germany. Thus the market for carpets in Germany is fragmented.
b) Currently India is the fourth largest supplier of carpets to Germany and had a
market share of 10.1% in 2003. c) With regard to India’s competitive position, there is scope for increasing supply to
Germany as India does not face much competition in terms of quality and price as is evident from the fact that the market shares of both Belgium and Iran are decreasing.
Source: Frost & Sullivan Compilation
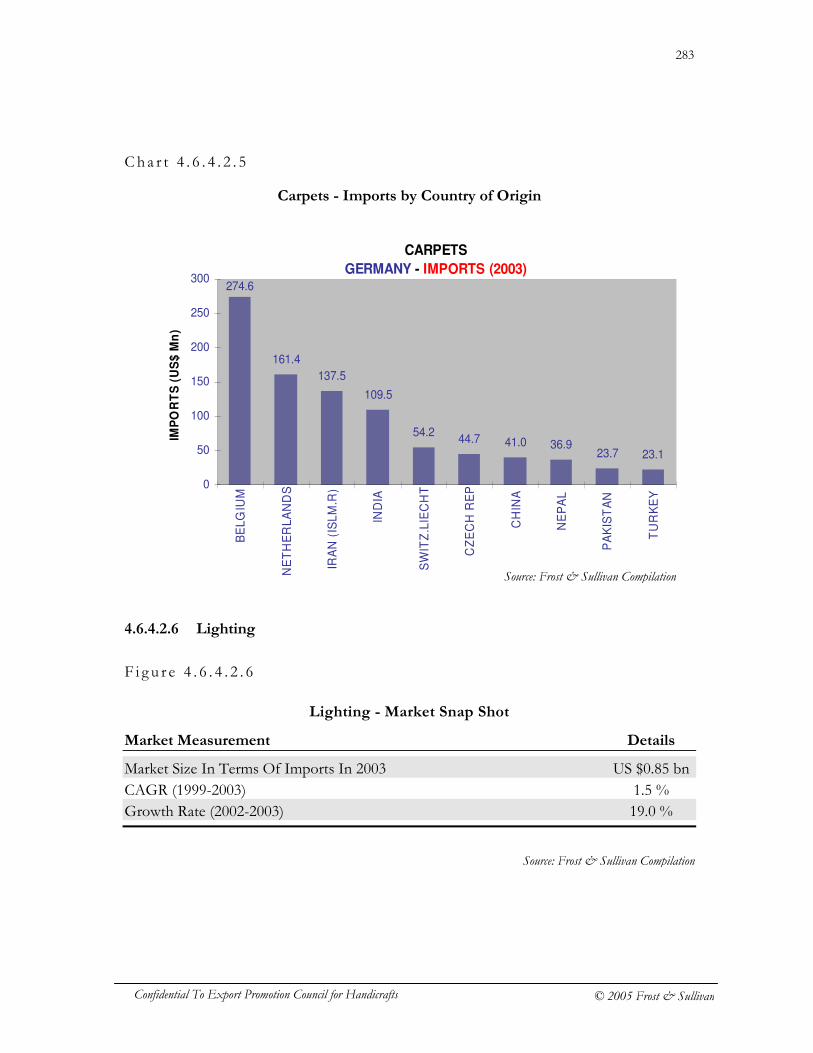
283
Confidential To Export Promotion Council for Handicrafts © 2005 Frost & Sullivan
Cha r t 4 . 6 . 4 . 2 . 5
Carpets - Imports by Country of Origin
4.6.4.2.6 Lighting
F i g u r e 4 . 6 . 4 . 2 . 6
Lighting - Market Snap Shot
Market Measurement Details
Market Size In Terms Of Imports In 2003 US $0.85 bn CAGR (1999-2003) 1.5 % Growth Rate (2002-2003) 19.0 %
CARPETS
GERMANY - IMPORTS (2003)
161.4
137.5
109.5
54.244.7 41.0 36.9
23.7 23.1
274.6
0
50
100
150
200
250
300
BE
LG
IUM
NE
TH
ER
LA
ND
S
IRA
N (
ISL
M.R
)
IND
IA
SW
ITZ
.LIE
CH
T
CZ
EC
H R
EP
CH
INA
NE
PA
L
PA
KIS
TA
N
TU
RK
EY
IMP
OR
TS
(U
S$
Mn
)
Source: Frost & Sullivan Compilation
Source: Frost & Sullivan Compilation
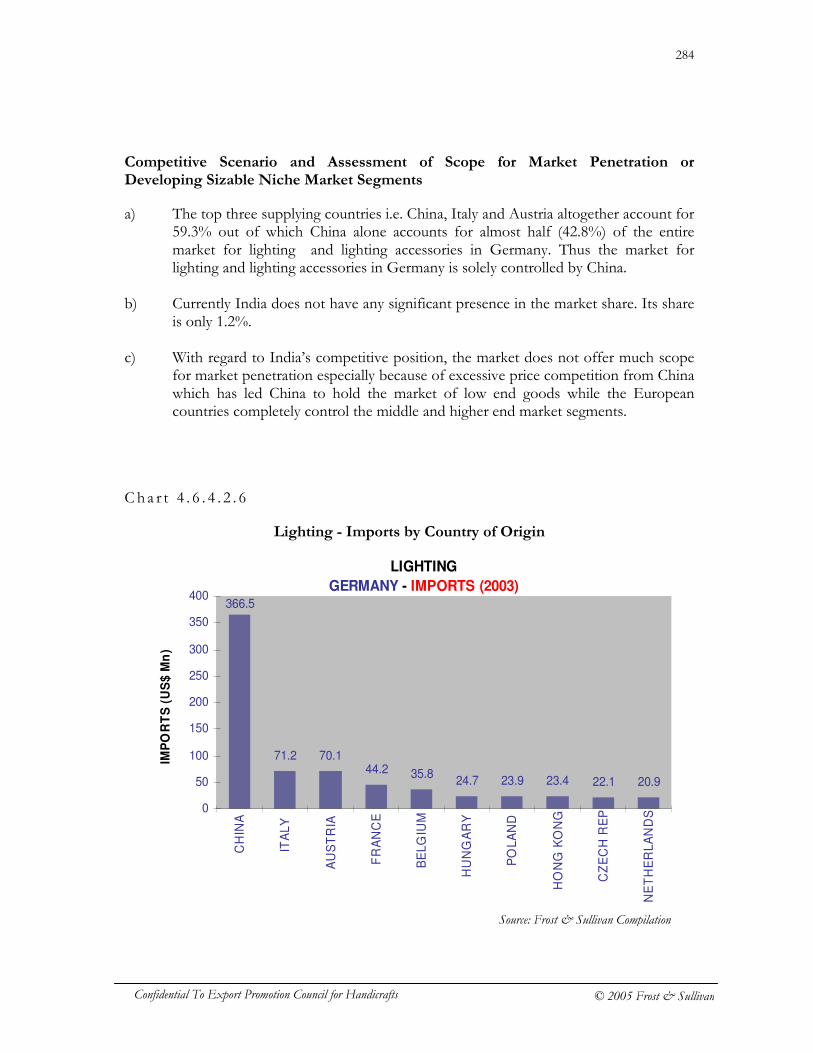
284
Confidential To Export Promotion Council for Handicrafts © 2005 Frost & Sullivan
Competitive Scenario and Assessment of Scope for Market Penetration or Developing Sizable Niche Market Segments
a) The top three supplying countries i.e. China, Italy and Austria altogether account for 59.3% out of which China alone accounts for almost half (42.8%) of the entire market for lighting and lighting accessories in Germany. Thus the market for lighting and lighting accessories in Germany is solely controlled by China.
b) Currently India does not have any significant presence in the market share. Its share
is only 1.2%. c) With regard to India’s competitive position, the market does not offer much scope
for market penetration especially because of excessive price competition from China which has led China to hold the market of low end goods while the European countries completely control the middle and higher end market segments.
C h a r t 4 . 6 . 4 . 2 . 6
Lighting - Imports by Country of Origin
LIGHTING
GERMANY - IMPORTS (2003)
71.2 70.144.2 35.8
24.7 23.9 23.4 22.1 20.9
366.5
0
50
100
150
200
250
300
350
400
CH
INA
ITA
LY
AU
ST
RIA
FR
AN
CE
BE
LG
IUM
HU
NG
AR
Y
PO
LA
ND
HO
NG
KO
NG
CZ
EC
H R
EP
NE
TH
ER
LA
ND
S
IMP
OR
TS
(U
S$
Mn
)
Source: Frost & Sullivan Compilation
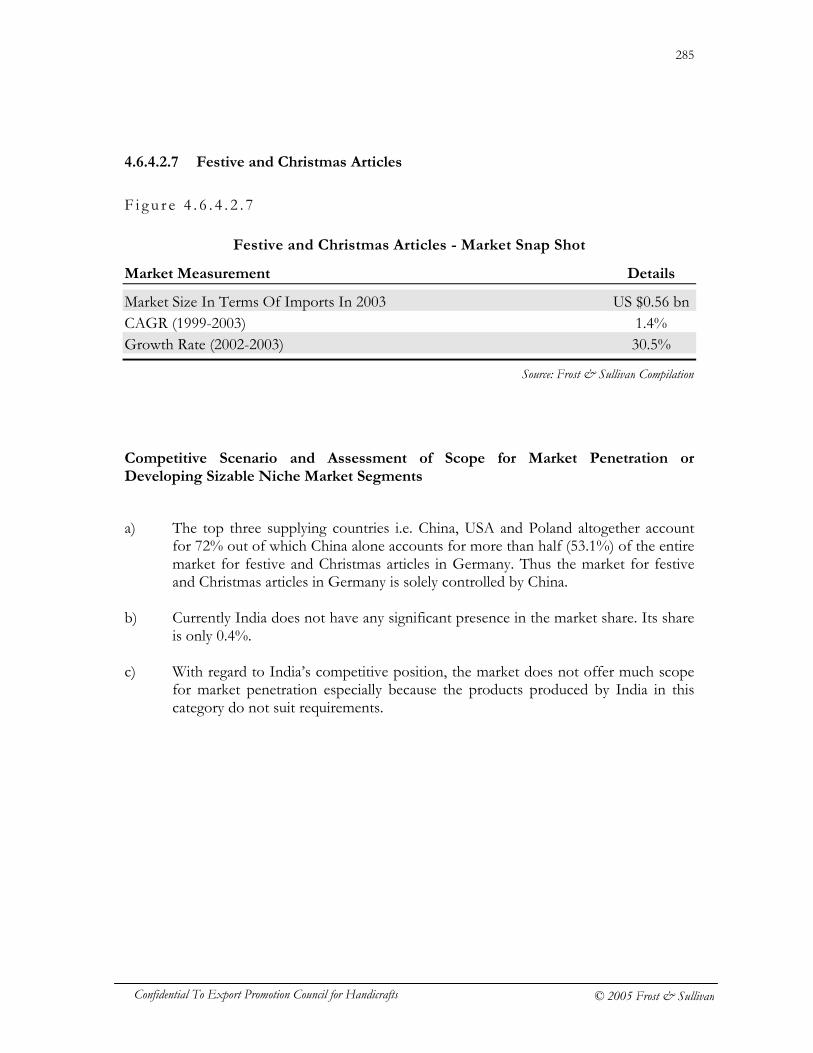
285
Confidential To Export Promotion Council for Handicrafts © 2005 Frost & Sullivan
4.6.4.2.7 Festive and Christmas Articles
F i g u r e 4 . 6 . 4 . 2 . 7
Festive and Christmas Articles - Market Snap Shot
Market Measurement Details
Market Size In Terms Of Imports In 2003 US $0.56 bn CAGR (1999-2003) 1.4% Growth Rate (2002-2003) 30.5%
Competitive Scenario and Assessment of Scope for Market Penetration or Developing Sizable Niche Market Segments
a) The top three supplying countries i.e. China, USA and Poland altogether account
for 72% out of which China alone accounts for more than half (53.1%) of the entire market for festive and Christmas articles in Germany. Thus the market for festive and Christmas articles in Germany is solely controlled by China.
b) Currently India does not have any significant presence in the market share. Its share
is only 0.4%. c) With regard to India’s competitive position, the market does not offer much scope
for market penetration especially because the products produced by India in this category do not suit requirements.
Source: Frost & Sullivan Compilation
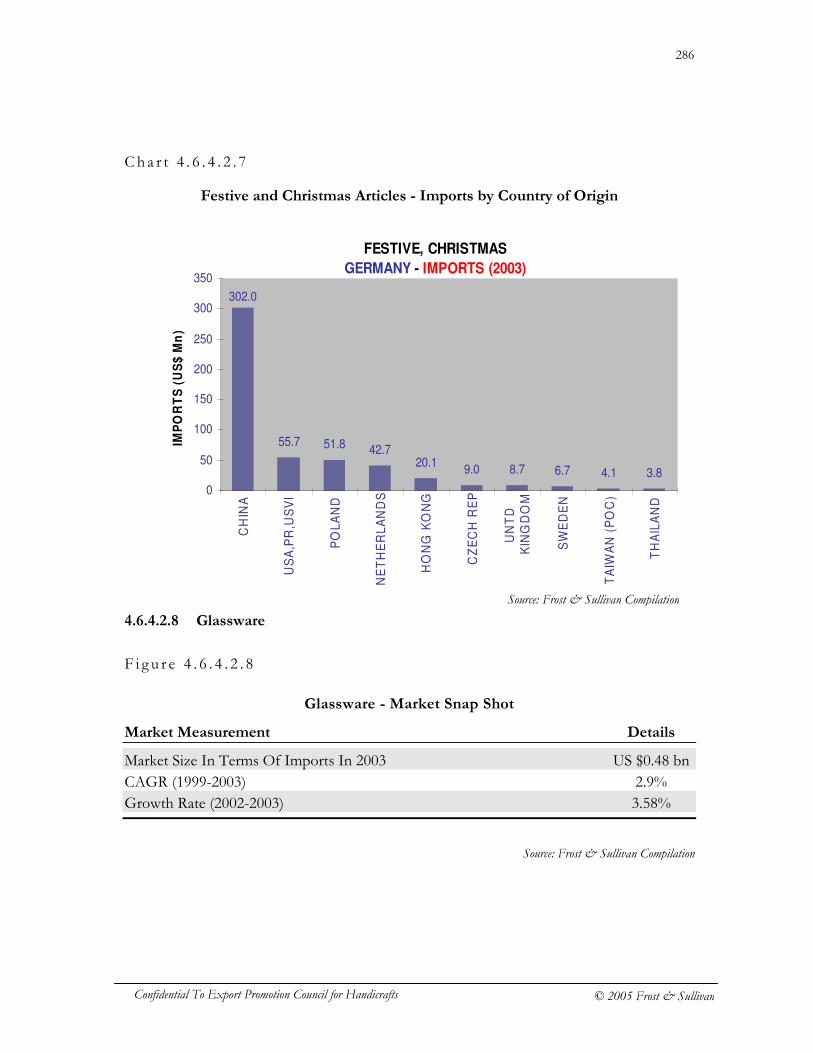
286
Confidential To Export Promotion Council for Handicrafts © 2005 Frost & Sullivan
Cha r t 4 . 6 . 4 . 2 . 7
Festive and Christmas Articles - Imports by Country of Origin
4.6.4.2.8 Glassware
F i g u r e 4 . 6 . 4 . 2 . 8
Glassware - Market Snap Shot
Market Measurement Details
Market Size In Terms Of Imports In 2003 US $0.48 bn CAGR (1999-2003) 2.9% Growth Rate (2002-2003) 3.58%
FESTIVE, CHRISTMAS
GERMANY - IMPORTS (2003)
55.7 51.8 42.720.1
9.0 8.7 6.7 4.1 3.8
302.0
0
50
100
150
200
250
300
350
CH
INA
US
A,P
R,U
SV
I
PO
LA
ND
NE
TH
ER
LA
ND
S
HO
NG
KO
NG
CZ
EC
H R
EP
UN
TD
KIN
GD
OM
SW
ED
EN
TA
IWA
N (
PO
C)
TH
AIL
AN
D
IMP
OR
TS
(U
S$
Mn
)
Source: Frost & Sullivan Compilation
Source: Frost & Sullivan Compilation
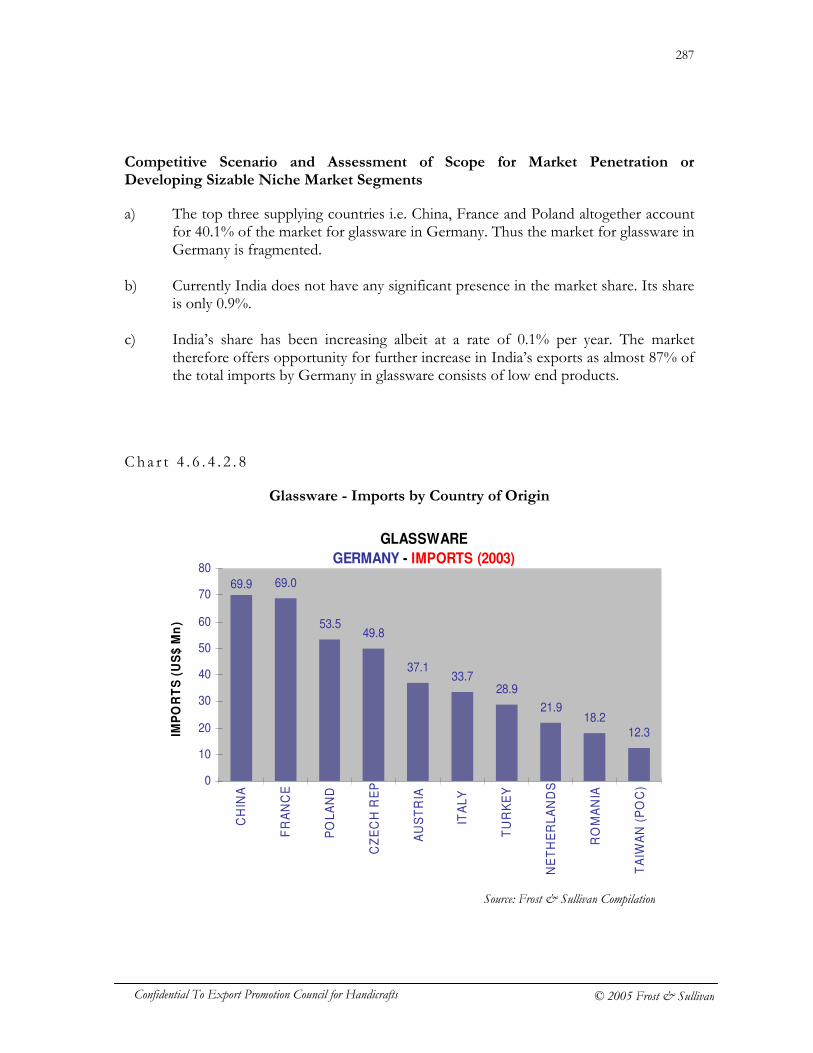
287
Confidential To Export Promotion Council for Handicrafts © 2005 Frost & Sullivan
Competitive Scenario and Assessment of Scope for Market Penetration or Developing Sizable Niche Market Segments
a) The top three supplying countries i.e. China, France and Poland altogether account for 40.1% of the market for glassware in Germany. Thus the market for glassware in Germany is fragmented.
b) Currently India does not have any significant presence in the market share. Its share
is only 0.9%. c) India’s share has been increasing albeit at a rate of 0.1% per year. The market
therefore offers opportunity for further increase in India’s exports as almost 87% of the total imports by Germany in glassware consists of low end products.
C h a r t 4 . 6 . 4 . 2 . 8
Glassware - Imports by Country of Origin
GLASSWARE
GERMANY - IMPORTS (2003)
69.0
53.549.8
37.133.7
28.9
21.918.2
12.3
69.9
0
10
20
30
40
50
60
70
80
CH
INA
FR
AN
CE
PO
LA
ND
CZ
EC
H R
EP
AU
ST
RIA
ITA
LY
TU
RK
EY
NE
TH
ER
LA
ND
S
RO
MA
NIA
TA
IWA
N (
PO
C)
IMP
OR
TS
(U
S$
Mn
)
Source: Frost & Sullivan Compilation
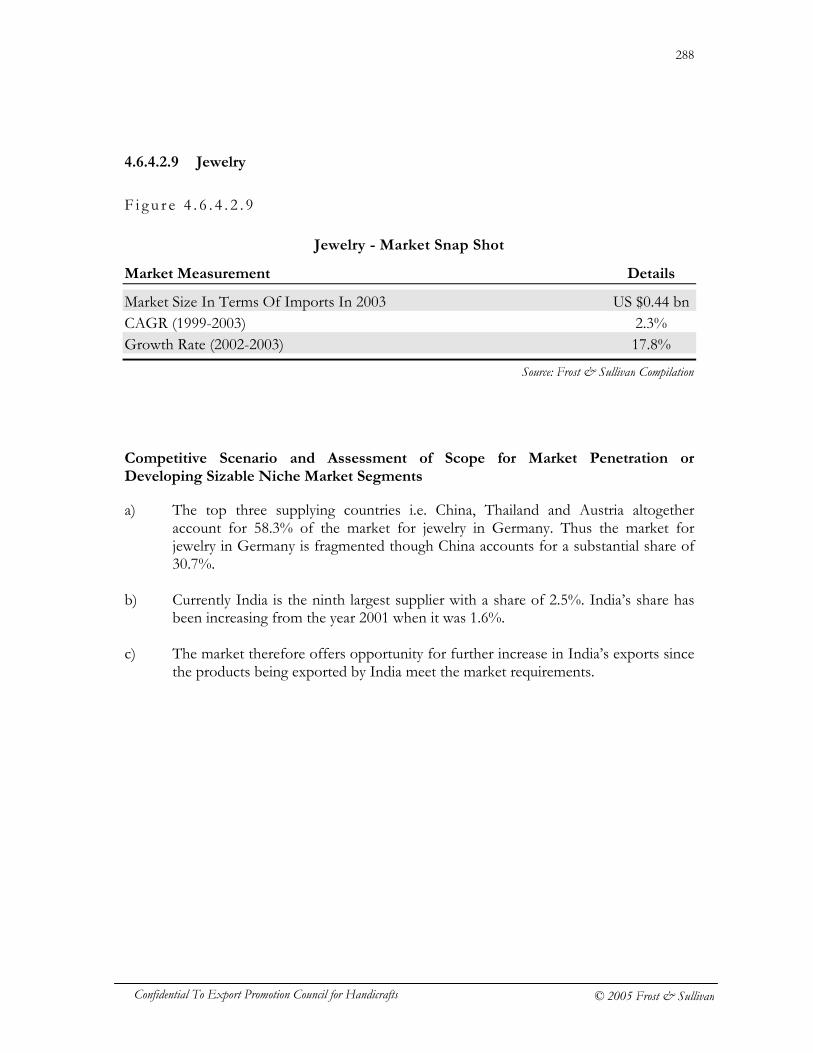
288
Confidential To Export Promotion Council for Handicrafts © 2005 Frost & Sullivan
4.6.4.2.9 Jewelry
F i g u r e 4 . 6 . 4 . 2 . 9
Jewelry - Market Snap Shot
Market Measurement Details
Market Size In Terms Of Imports In 2003 US $0.44 bn CAGR (1999-2003) 2.3% Growth Rate (2002-2003) 17.8%
Competitive Scenario and Assessment of Scope for Market Penetration or Developing Sizable Niche Market Segments
a) The top three supplying countries i.e. China, Thailand and Austria altogether account for 58.3% of the market for jewelry in Germany. Thus the market for jewelry in Germany is fragmented though China accounts for a substantial share of 30.7%.
b) Currently India is the ninth largest supplier with a share of 2.5%. India’s share has
been increasing from the year 2001 when it was 1.6%. c) The market therefore offers opportunity for further increase in India’s exports since
the products being exported by India meet the market requirements.
Source: Frost & Sullivan Compilation
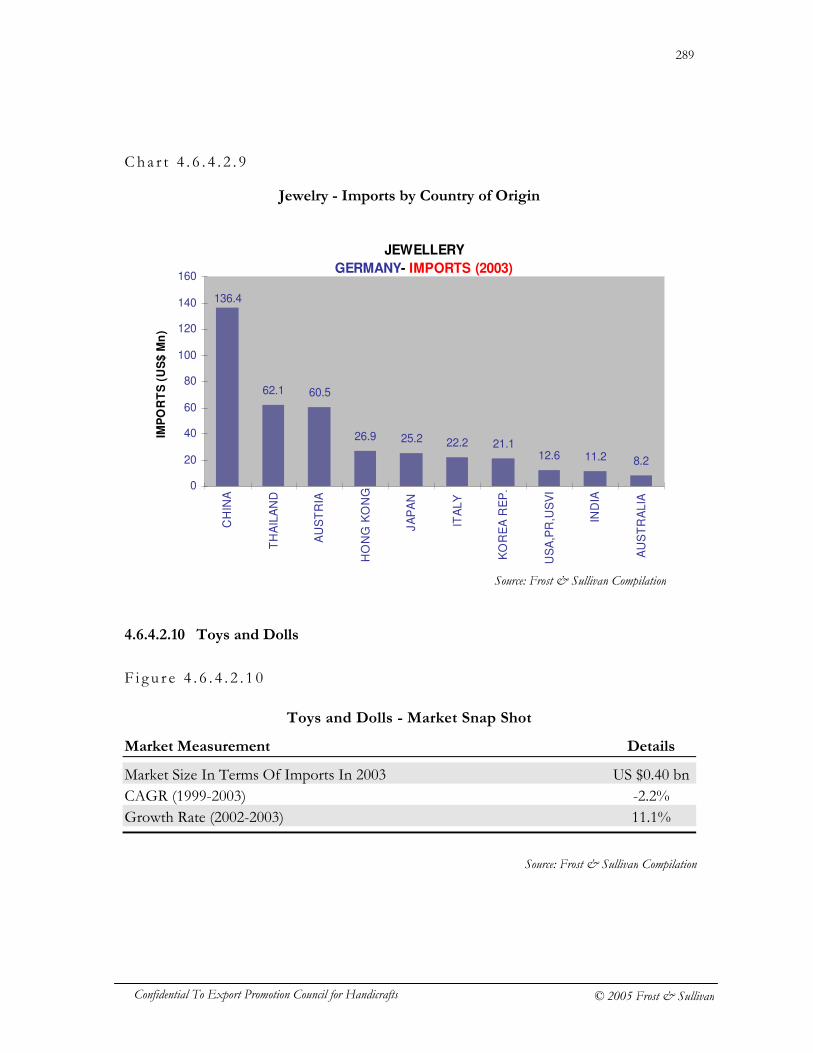
289
Confidential To Export Promotion Council for Handicrafts © 2005 Frost & Sullivan
Cha r t 4 . 6 . 4 . 2 . 9
Jewelry - Imports by Country of Origin
4.6.4.2.10 Toys and Dolls
F i g u r e 4 . 6 . 4 . 2 . 1 0
Toys and Dolls - Market Snap Shot
Market Measurement Details
Market Size In Terms Of Imports In 2003 US $0.40 bn CAGR (1999-2003) -2.2% Growth Rate (2002-2003) 11.1%
JEWELLERY
GERMANY- IMPORTS (2003)
62.1 60.5
26.9 25.2 22.2 21.112.6 11.2 8.2
136.4
0
20
40
60
80
100
120
140
160
CH
INA
TH
AIL
AN
D
AU
ST
RIA
HO
NG
KO
NG
JA
PA
N
ITA
LY
KO
RE
A R
EP
.
US
A,P
R,U
SV
I
IND
IA
AU
ST
RA
LIA
IMP
OR
TS
(U
S$
Mn
)
Source: Frost & Sullivan Compilation
Source: Frost & Sullivan Compilation
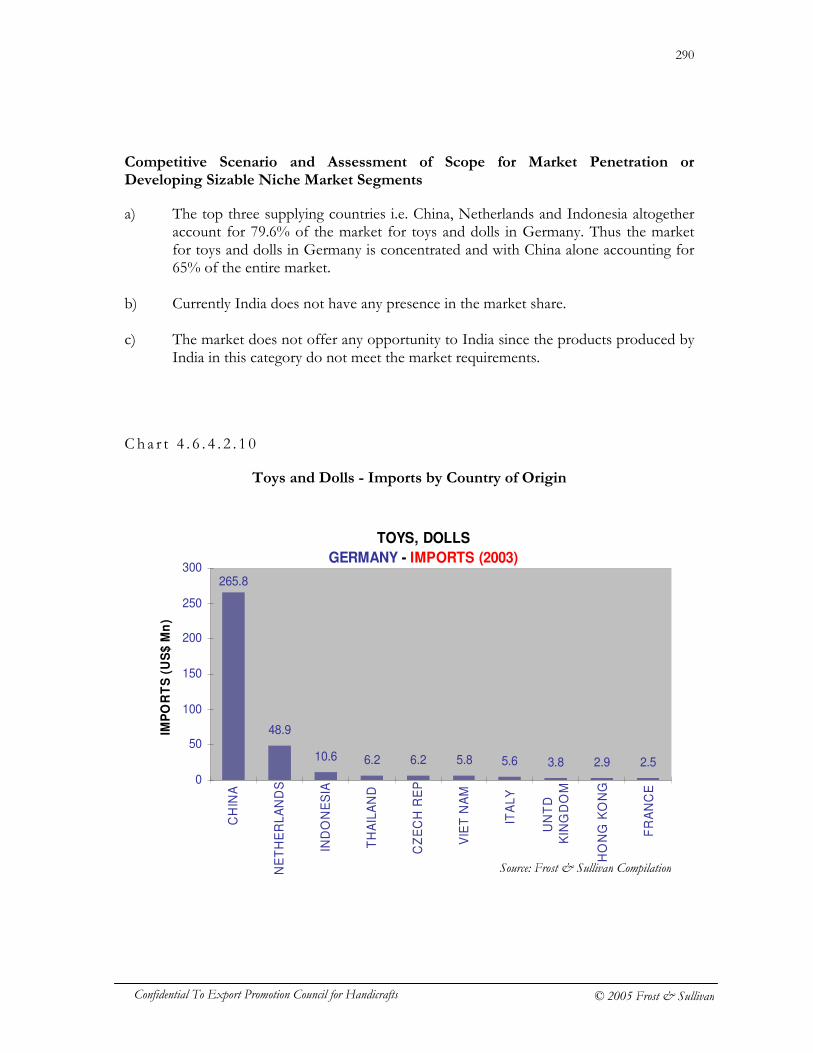
290
Confidential To Export Promotion Council for Handicrafts © 2005 Frost & Sullivan
Competitive Scenario and Assessment of Scope for Market Penetration or Developing Sizable Niche Market Segments
a) The top three supplying countries i.e. China, Netherlands and Indonesia altogether account for 79.6% of the market for toys and dolls in Germany. Thus the market for toys and dolls in Germany is concentrated and with China alone accounting for 65% of the entire market.
b) Currently India does not have any presence in the market share. c) The market does not offer any opportunity to India since the products produced by
India in this category do not meet the market requirements.
C h a r t 4 . 6 . 4 . 2 . 1 0
Toys and Dolls - Imports by Country of Origin
TOYS, DOLLS
GERMANY - IMPORTS (2003)
48.9
10.6 6.2 6.2 5.8 5.6 3.8 2.9 2.5
265.8
0
50
100
150
200
250
300
CH
INA
NE
TH
ER
LA
ND
S
IND
ON
ES
IA
TH
AIL
AN
D
CZ
EC
H R
EP
VIE
T N
AM
ITA
LY
UN
TD
KIN
GD
OM
HO
NG
KO
NG
FR
AN
CE
IMP
OR
TS
(U
S$
Mn
)
Source: Frost & Sullivan Compilation

291
Confidential To Export Promotion Council for Handicrafts © 2005 Frost & Sullivan
4.6.4.2.11 Worked, Carved Decorative Items
F i g u r e 4 . 6 . 4 . 2 . 1 1
Worked, Carved Decorative Items - Market Snap Shot
Market Measurement Details
Market Size In Terms Of Imports In 2003 US $0.31 bn CAGR (1999-2003) -5.6% Growth Rate (2002-2003) 4.5%
Competitive Scenario and Assessment of Scope for Market Penetration or Developing Sizable Niche Market Segments
a) The top three supplying countries i.e. Italy, China and India altogether account for 67% of the market for worked and carved decorative items in Germany. Thus the market for worked and carved decorative items in Germany is concentrated with Italy which alone accounts for 38.8% of the entire market.
b) India is the third largest exporter to Germany with a share of 11.7%. Its share has
been steadily increasing since 1999 when its share was 7%. c) The market offers further scope to increase India’s market share since low end
products account for 83% of the total imports. And though India faces competition from China in the low end category itself, Indian exporters have already established themselves on the quality front.
Source: Frost & Sullivan Compilation
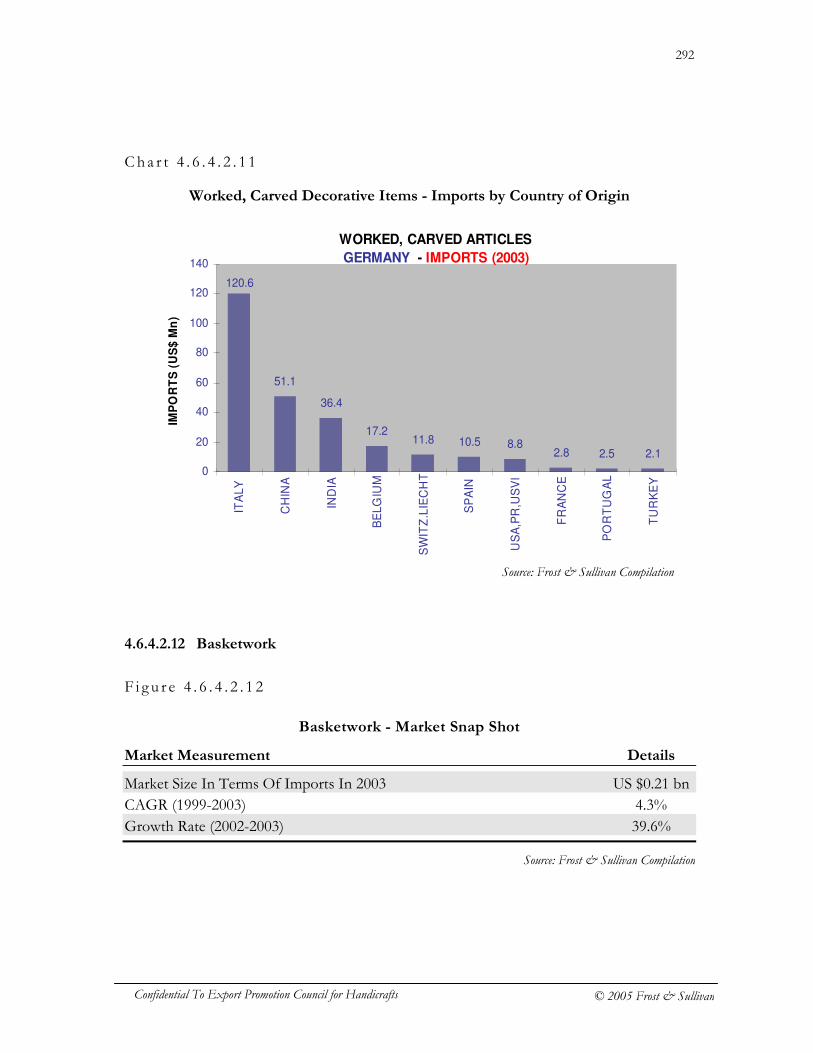
292
Confidential To Export Promotion Council for Handicrafts © 2005 Frost & Sullivan
Cha r t 4 . 6 . 4 . 2 . 1 1
Worked, Carved Decorative Items - Imports by Country of Origin
4.6.4.2.12 Basketwork
F i g u r e 4 . 6 . 4 . 2 . 1 2
Basketwork - Market Snap Shot
Market Measurement Details
Market Size In Terms Of Imports In 2003 US $0.21 bn CAGR (1999-2003) 4.3% Growth Rate (2002-2003) 39.6%
WORKED, CARVED ARTICLES
GERMANY - IMPORTS (2003)
51.1
36.4
17.211.8 10.5 8.8
2.8 2.5 2.1
120.6
0
20
40
60
80
100
120
140
ITA
LY
CH
INA
IND
IA
BE
LG
IUM
SW
ITZ
.LIE
CH
T
SP
AIN
US
A,P
R,U
SV
I
FR
AN
CE
PO
RT
UG
AL
TU
RK
EY
IMP
OR
TS
(U
S$
Mn
)
Source: Frost & Sullivan Compilation
Source: Frost & Sullivan Compilation
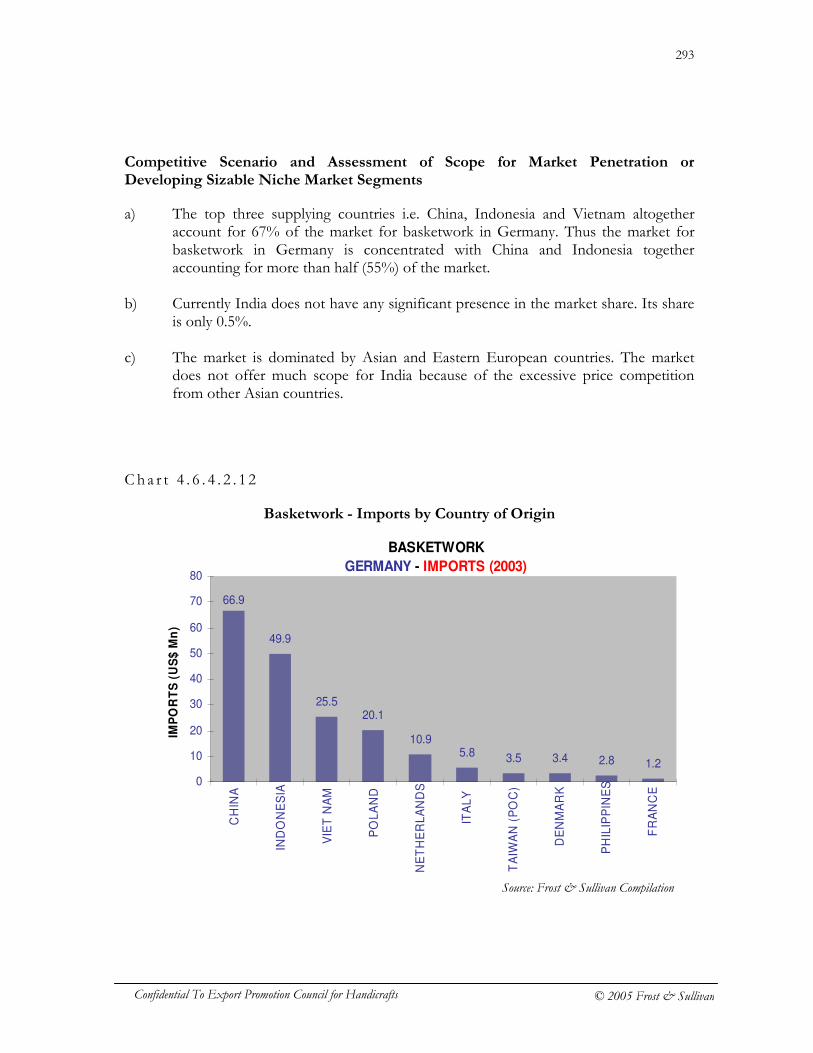
293
Confidential To Export Promotion Council for Handicrafts © 2005 Frost & Sullivan
Competitive Scenario and Assessment of Scope for Market Penetration or Developing Sizable Niche Market Segments
a) The top three supplying countries i.e. China, Indonesia and Vietnam altogether account for 67% of the market for basketwork in Germany. Thus the market for basketwork in Germany is concentrated with China and Indonesia together accounting for more than half (55%) of the market.
b) Currently India does not have any significant presence in the market share. Its share
is only 0.5%. c) The market is dominated by Asian and Eastern European countries. The market
does not offer much scope for India because of the excessive price competition from other Asian countries.
C h a r t 4 . 6 . 4 . 2 . 1 2
Basketwork - Imports by Country of Origin
BASKETWORK
GERMANY - IMPORTS (2003)
49.9
25.520.1
10.95.8 3.5 3.4 2.8 1.2
66.9
0
10
20
30
40
50
60
70
80
CH
INA
IND
ON
ES
IA
VIE
T N
AM
PO
LA
ND
NE
TH
ER
LA
ND
S
ITA
LY
TA
IWA
N (
PO
C)
DE
NM
AR
K
PH
ILIP
PIN
ES
FR
AN
CE
IMP
OR
TS
(U
S$
Mn
)
Source: Frost & Sullivan Compilation
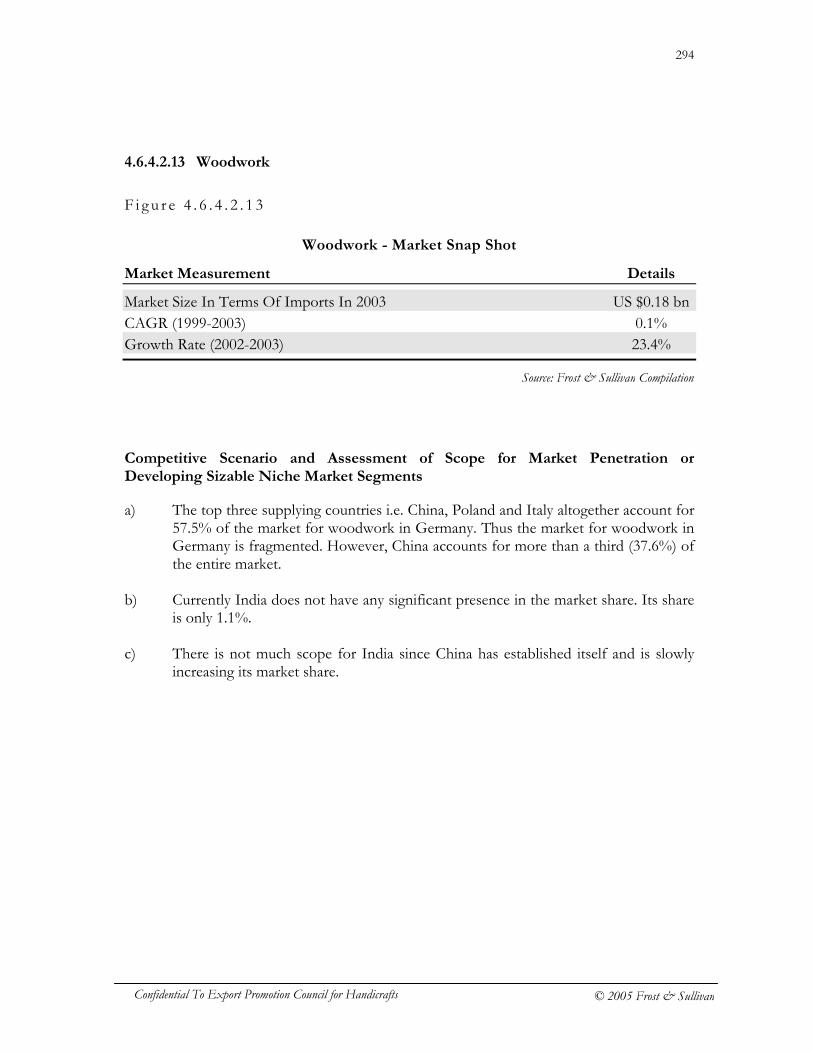
294
Confidential To Export Promotion Council for Handicrafts © 2005 Frost & Sullivan
4.6.4.2.13 Woodwork
F i g u r e 4 . 6 . 4 . 2 . 1 3
Woodwork - Market Snap Shot
Market Measurement Details
Market Size In Terms Of Imports In 2003 US $0.18 bn CAGR (1999-2003) 0.1% Growth Rate (2002-2003) 23.4%
Competitive Scenario and Assessment of Scope for Market Penetration or Developing Sizable Niche Market Segments
a) The top three supplying countries i.e. China, Poland and Italy altogether account for 57.5% of the market for woodwork in Germany. Thus the market for woodwork in Germany is fragmented. However, China accounts for more than a third (37.6%) of the entire market.
b) Currently India does not have any significant presence in the market share. Its share
is only 1.1%. c) There is not much scope for India since China has established itself and is slowly
increasing its market share.
Source: Frost & Sullivan Compilation
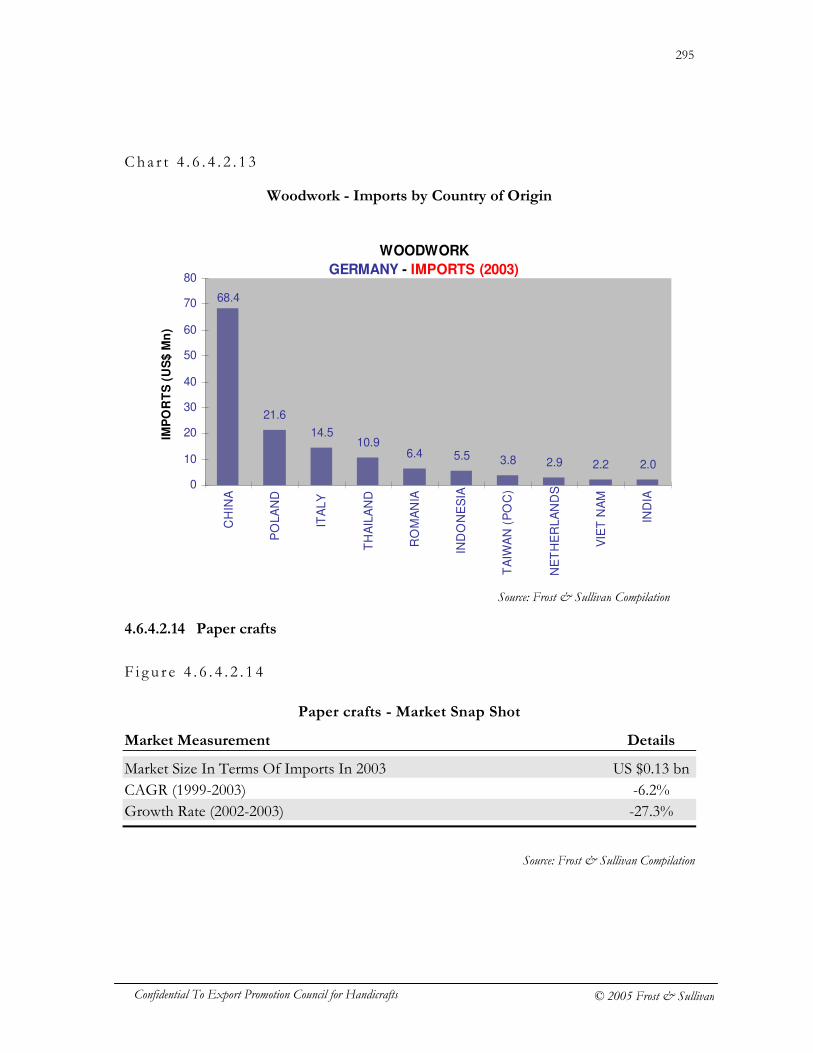
295
Confidential To Export Promotion Council for Handicrafts © 2005 Frost & Sullivan
Cha r t 4 . 6 . 4 . 2 . 1 3
Woodwork - Imports by Country of Origin
4.6.4.2.14 Paper crafts
F i g u r e 4 . 6 . 4 . 2 . 1 4
Paper crafts - Market Snap Shot
Market Measurement Details
Market Size In Terms Of Imports In 2003 US $0.13 bn CAGR (1999-2003) -6.2% Growth Rate (2002-2003) -27.3%
WOODWORK
GERMANY - IMPORTS (2003)
21.6
14.510.9
6.4 5.5 3.8 2.9 2.2 2.0
68.4
0
10
20
30
40
50
60
70
80
CH
INA
PO
LA
ND
ITA
LY
TH
AIL
AN
D
RO
MA
NIA
IND
ON
ES
IA
TA
IWA
N (
PO
C)
NE
TH
ER
LA
ND
S
VIE
T N
AM
IND
IA
IMP
OR
TS
(U
S$
Mn
)
Source: Frost & Sullivan Compilation
Source: Frost & Sullivan Compilation
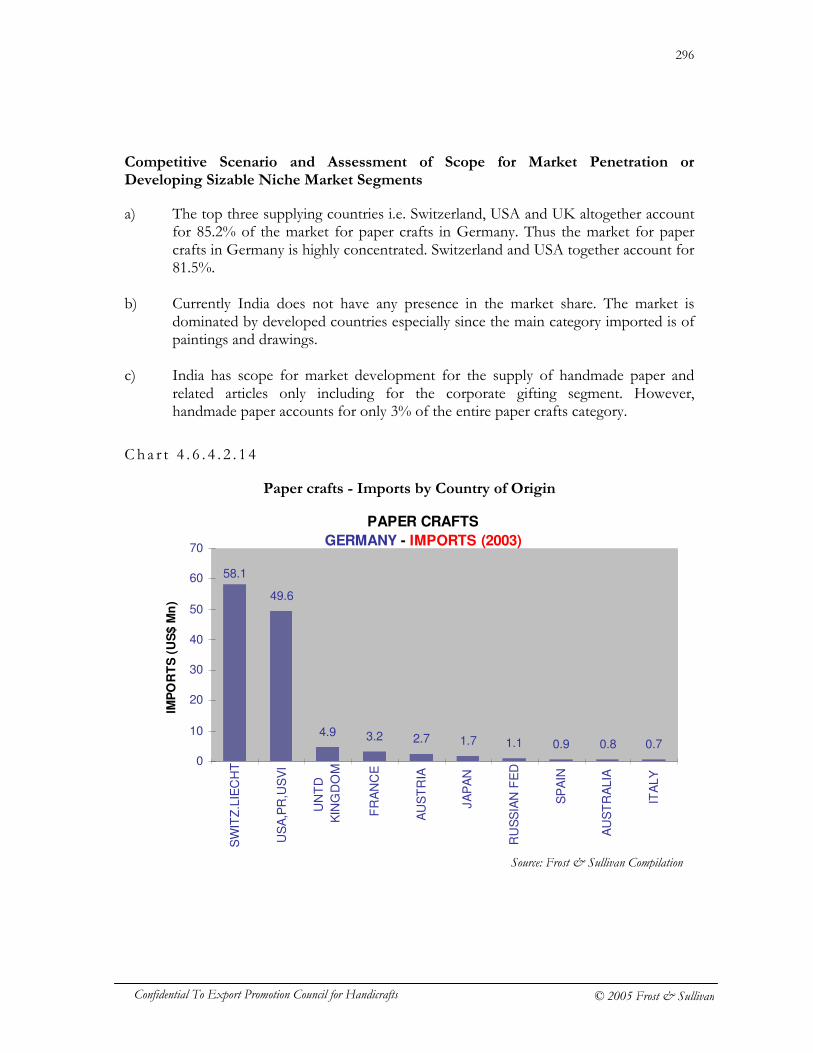
296
Confidential To Export Promotion Council for Handicrafts © 2005 Frost & Sullivan
Competitive Scenario and Assessment of Scope for Market Penetration or Developing Sizable Niche Market Segments
a) The top three supplying countries i.e. Switzerland, USA and UK altogether account for 85.2% of the market for paper crafts in Germany. Thus the market for paper crafts in Germany is highly concentrated. Switzerland and USA together account for 81.5%.
b) Currently India does not have any presence in the market share. The market is
dominated by developed countries especially since the main category imported is of paintings and drawings.
c) India has scope for market development for the supply of handmade paper and
related articles only including for the corporate gifting segment. However, handmade paper accounts for only 3% of the entire paper crafts category.
C h a r t 4 . 6 . 4 . 2 . 1 4
Paper crafts - Imports by Country of Origin
PAPER CRAFTS
GERMANY - IMPORTS (2003)
49.6
4.9 3.2 2.7 1.7 1.1 0.9 0.8 0.7
58.1
0
10
20
30
40
50
60
70
SW
ITZ
.LIE
CH
T
US
A,P
R,U
SV
I
UN
TD
KIN
GD
OM
FR
AN
CE
AU
ST
RIA
JA
PA
N
RU
SS
IAN
FE
D
SP
AIN
AU
ST
RA
LIA
ITA
LY
IMP
OR
TS
(U
S$ M
n)
Source: Frost & Sullivan Compilation
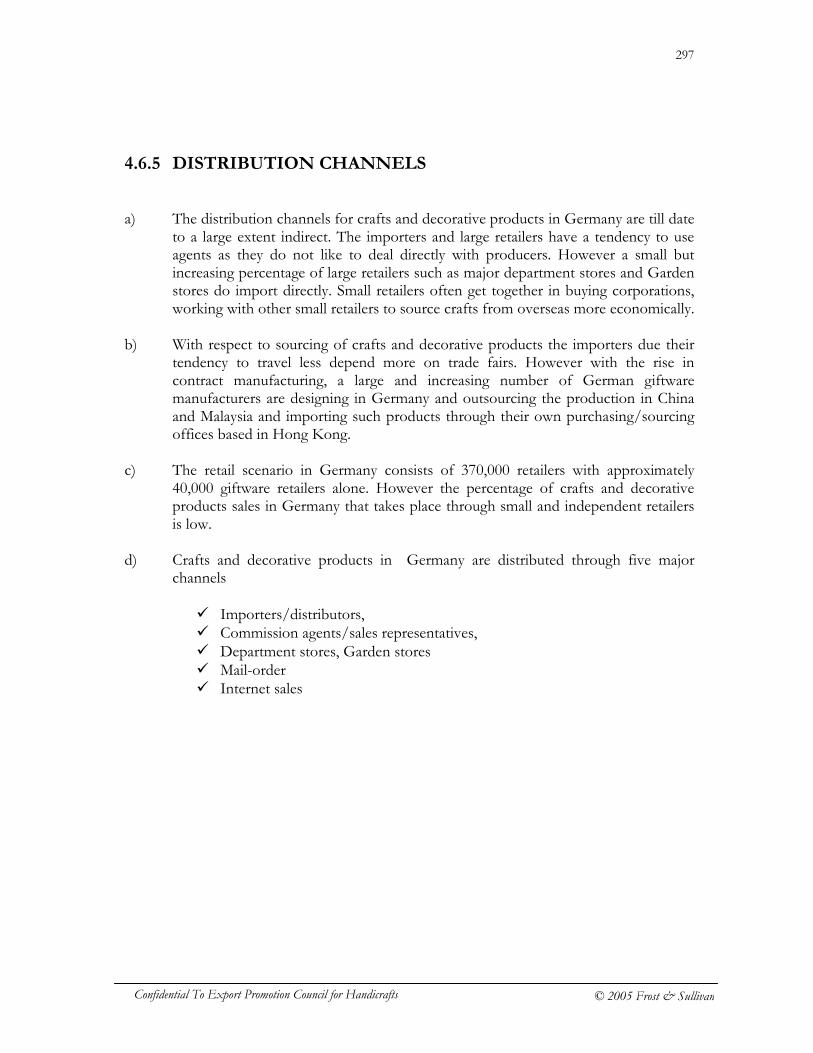
297
Confidential To Export Promotion Council for Handicrafts © 2005 Frost & Sullivan
4.6.5 DISTRIBUTION CHANNELS a) The distribution channels for crafts and decorative products in Germany are till date
to a large extent indirect. The importers and large retailers have a tendency to use agents as they do not like to deal directly with producers. However a small but increasing percentage of large retailers such as major department stores and Garden stores do import directly. Small retailers often get together in buying corporations, working with other small retailers to source crafts from overseas more economically.
b) With respect to sourcing of crafts and decorative products the importers due their
tendency to travel less depend more on trade fairs. However with the rise in contract manufacturing, a large and increasing number of German giftware manufacturers are designing in Germany and outsourcing the production in China and Malaysia and importing such products through their own purchasing/sourcing offices based in Hong Kong.
c) The retail scenario in Germany consists of 370,000 retailers with approximately
40,000 giftware retailers alone. However the percentage of crafts and decorative products sales in Germany that takes place through small and independent retailers is low.
d) Crafts and decorative products in Germany are distributed through five major
channels
� Importers/distributors, � Commission agents/sales representatives, � Department stores, Garden stores � Mail-order � Internet sales
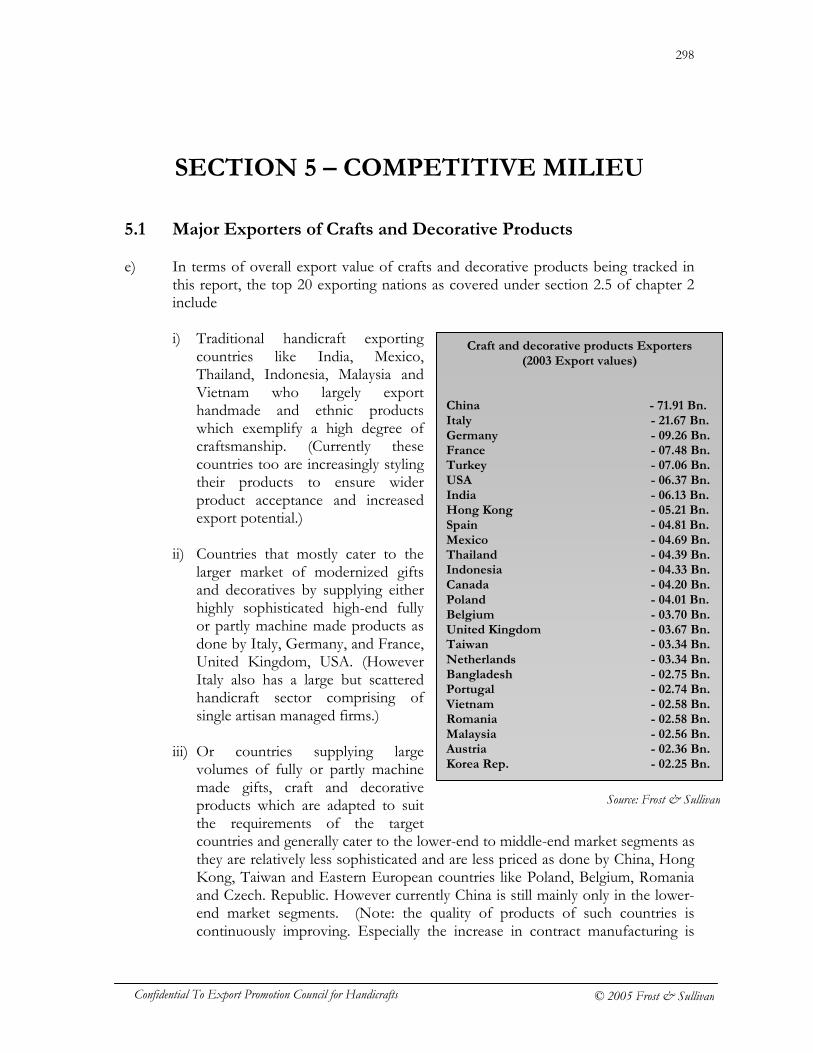
298
Confidential To Export Promotion Council for Handicrafts © 2005 Frost & Sullivan
SECTION 5 – COMPETITIVE MILIEU 5.1 Major Exporters of Crafts and Decorative Products e) In terms of overall export value of crafts and decorative products being tracked in
this report, the top 20 exporting nations as covered under section 2.5 of chapter 2 include
i) Traditional handicraft exporting
countries like India, Mexico, Thailand, Indonesia, Malaysia and Vietnam who largely export handmade and ethnic products which exemplify a high degree of craftsmanship. (Currently these countries too are increasingly styling their products to ensure wider product acceptance and increased export potential.)
ii) Countries that mostly cater to the
larger market of modernized gifts and decoratives by supplying either highly sophisticated high-end fully or partly machine made products as done by Italy, Germany, and France, United Kingdom, USA. (However Italy also has a large but scattered handicraft sector comprising of single artisan managed firms.)
iii) Or countries supplying large
volumes of fully or partly machine made gifts, craft and decorative products which are adapted to suit the requirements of the target countries and generally cater to the lower-end to middle-end market segments as they are relatively less sophisticated and are less priced as done by China, Hong Kong, Taiwan and Eastern European countries like Poland, Belgium, Romania and Czech. Republic. However currently China is still mainly only in the lower-end market segments. (Note: the quality of products of such countries is continuously improving. Especially the increase in contract manufacturing is
Craft and decorative products Exporters (2003 Export values)
China - 71.91 Bn. Italy - 21.67 Bn. Germany - 09.26 Bn. France - 07.48 Bn. Turkey - 07.06 Bn. USA - 06.37 Bn. India - 06.13 Bn. Hong Kong - 05.21 Bn. Spain - 04.81 Bn. Mexico - 04.69 Bn. Thailand - 04.39 Bn. Indonesia - 04.33 Bn. Canada - 04.20 Bn. Poland - 04.01 Bn. Belgium - 03.70 Bn. United Kingdom - 03.67 Bn. Taiwan - 03.34 Bn. Netherlands - 03.34 Bn. Bangladesh - 02.75 Bn. Portugal - 02.74 Bn. Vietnam - 02.58 Bn. Romania - 02.58 Bn. Malaysia - 02.56 Bn. Austria - 02.36 Bn. Korea Rep. - 02.25 Bn.
Source: Frost & Sullivan
299
Confidential To Export Promotion Council for Handicrafts © 2005 Frost & Sullivan
reducing the quality gap between the products of the higher-end exporting nations and those of countries like China, Hong Kong and Taiwan etc.)
5.2 Analysis of World Crafts and Decorative Products Exports a) The crafts and decorative products covered under the report include a large
spectrum of products spread across different market segments and niches. As such Frost & Sullivan takes into account the following two factors to map the dynamics of export trade for the crafts and decorative products sector and establish an accurate picture of the competition for enabling further competition analysis and competitive benchmarking.
5.2.1 Country-Product leadership a) The overall consolidated export value of craft and decorative products gives a very
broad idea as to the leading craft and decorative products exporting nations. However a detailed product category analysis of crafts and decorative exports for all countries ascertains that though certain countries like China, Italy, France, India and Thailand are significant competitors almost across all product categories certain countries like Bangladesh are large manufacturers and key competitors in one or two product categories only.
b) As such the export portfolio of the top 25 countries accounting for a maximum of
82% of total world exports of craft and decorative products was analyzed to establish the country-product leadership relation.
c) Based on the analysis of export portfolios, countries that have significant exports in
more than 3 product categories and feature as the top ten exporters in case of three or more than two product categories are selected as notable competitors of craft and decorative products per se.
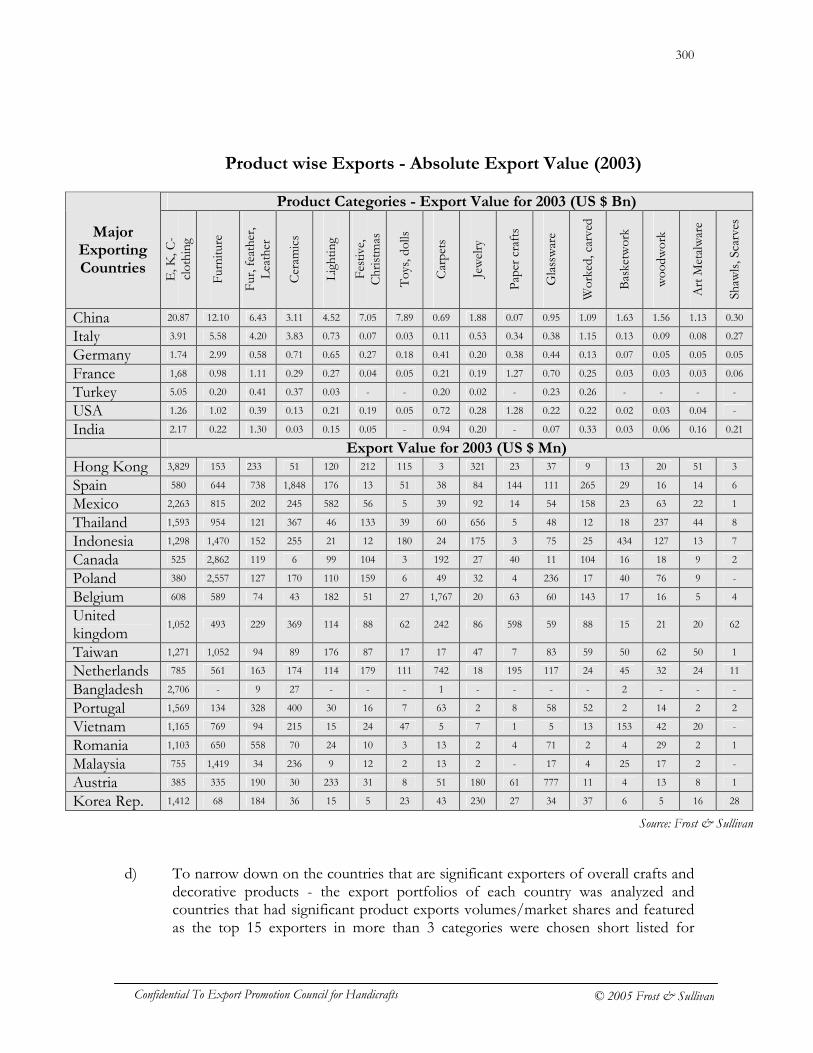
300
Confidential To Export Promotion Council for Handicrafts © 2005 Frost & Sullivan
Product wise Exports - Absolute Export Value (2003)
Product Categories - Export Value for 2003 (US $ Bn)
Major Exporting Countries
E, K
, C-
clothing
Furniture
Fur, feather,
Leather
Ceram
ics
Lighting
Festive,
Christm
as
Toys, dolls
Carpets
Jewelry
Paper crafts
Glassware
Worked, carved
Basketwork
woo
dwork
Art M
etalware
Shaw
ls, Scarves
China 20.87 12.10 6.43 3.11 4.52 7.05 7.89 0.69 1.88 0.07 0.95 1.09 1.63 1.56 1.13 0.30
Italy 3.91 5.58 4.20 3.83 0.73 0.07 0.03 0.11 0.53 0.34 0.38 1.15 0.13 0.09 0.08 0.27
Germany 1.74 2.99 0.58 0.71 0.65 0.27 0.18 0.41 0.20 0.38 0.44 0.13 0.07 0.05 0.05 0.05
France 1,68 0.98 1.11 0.29 0.27 0.04 0.05 0.21 0.19 1.27 0.70 0.25 0.03 0.03 0.03 0.06
Turkey 5.05 0.20 0.41 0.37 0.03 - - 0.20 0.02 - 0.23 0.26 - - - -
USA 1.26 1.02 0.39 0.13 0.21 0.19 0.05 0.72 0.28 1.28 0.22 0.22 0.02 0.03 0.04 -
India 2.17 0.22 1.30 0.03 0.15 0.05 - 0.94 0.20 - 0.07 0.33 0.03 0.06 0.16 0.21
Export Value for 2003 (US $ Mn) Hong Kong 3,829 153 233 51 120 212 115 3 321 23 37 9 13 20 51 3
Spain 580 644 738 1,848 176 13 51 38 84 144 111 265 29 16 14 6
Mexico 2,263 815 202 245 582 56 5 39 92 14 54 158 23 63 22 1
Thailand 1,593 954 121 367 46 133 39 60 656 5 48 12 18 237 44 8
Indonesia 1,298 1,470 152 255 21 12 180 24 175 3 75 25 434 127 13 7
Canada 525 2,862 119 6 99 104 3 192 27 40 11 104 16 18 9 2
Poland 380 2,557 127 170 110 159 6 49 32 4 236 17 40 76 9 -
Belgium 608 589 74 43 182 51 27 1,767 20 63 60 143 17 16 5 4
United kingdom
1,052 493 229 369 114 88 62 242 86 598 59 88 15 21 20 62
Taiwan 1,271 1,052 94 89 176 87 17 17 47 7 83 59 50 62 50 1
Netherlands 785 561 163 174 114 179 111 742 18 195 117 24 45 32 24 11
Bangladesh 2,706 - 9 27 - - - 1 - - - - 2 - - -
Portugal 1,569 134 328 400 30 16 7 63 2 8 58 52 2 14 2 2
Vietnam 1,165 769 94 215 15 24 47 5 7 1 5 13 153 42 20 -
Romania 1,103 650 558 70 24 10 3 13 2 4 71 2 4 29 2 1
Malaysia 755 1,419 34 236 9 12 2 13 2 - 17 4 25 17 2 -
Austria 385 335 190 30 233 31 8 51 180 61 777 11 4 13 8 1
Korea Rep. 1,412 68 184 36 15 5 23 43 230 27 34 37 6 5 16 28
d) To narrow down on the countries that are significant exporters of overall crafts and
decorative products - the export portfolios of each country was analyzed and countries that had significant product exports volumes/market shares and featured as the top 15 exporters in more than 3 categories were chosen short listed for
Source: Frost & Sullivan
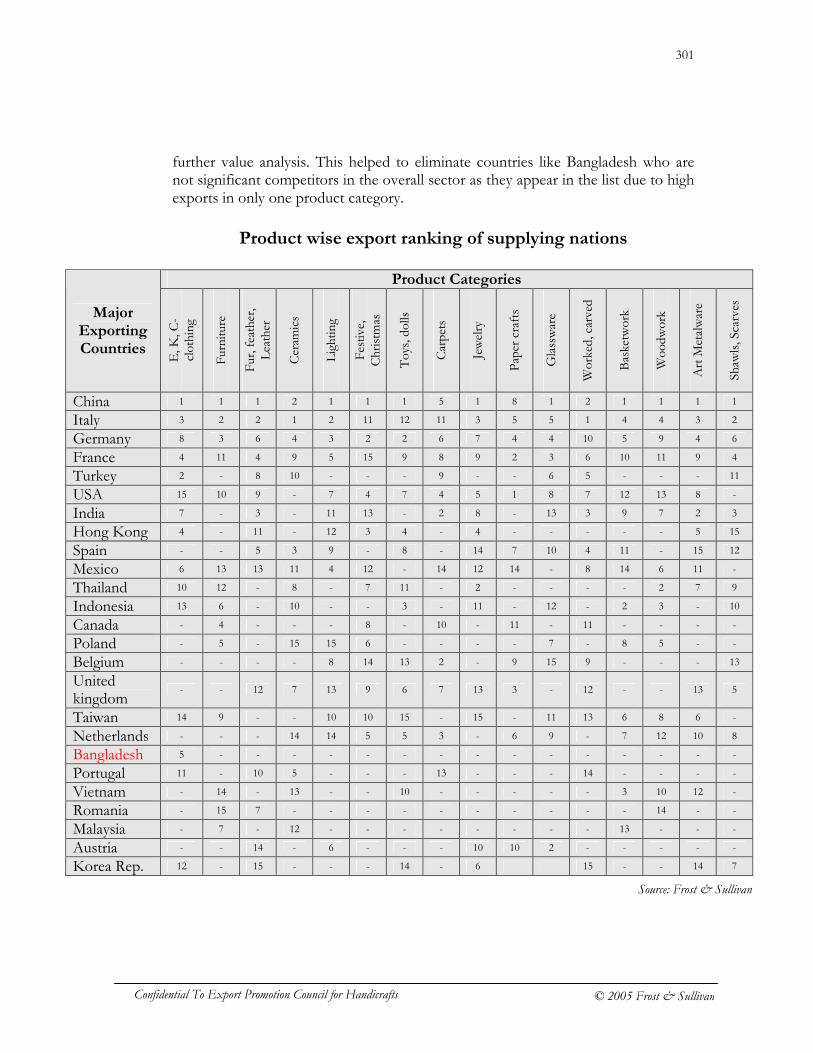
301
Confidential To Export Promotion Council for Handicrafts © 2005 Frost & Sullivan
further value analysis. This helped to eliminate countries like Bangladesh who are not significant competitors in the overall sector as they appear in the list due to high exports in only one product category.
Product wise export ranking of supplying nations
Product Categories
Major Exporting Countries
E, K
, C-
clothing
Furniture
Fur, feather,
Leather
Ceram
ics
Lighting
Festive,
Christm
as
Toys, dolls
Carpets
Jewelry
Paper crafts
Glassware
Worked, carved
Basketwork
Woodw
ork
Art M
etalware
Shaw
ls, Scarves
China 1 1 1 2 1 1 1 5 1 8 1 2 1 1 1 1
Italy 3 2 2 1 2 11 12 11 3 5 5 1 4 4 3 2
Germany 8 3 6 4 3 2 2 6 7 4 4 10 5 9 4 6
France 4 11 4 9 5 15 9 8 9 2 3 6 10 11 9 4
Turkey 2 - 8 10 - - - 9 - - 6 5 - - - 11
USA 15 10 9 - 7 4 7 4 5 1 8 7 12 13 8 -
India 7 - 3 - 11 13 - 2 8 - 13 3 9 7 2 3
Hong Kong 4 - 11 - 12 3 4 - 4 - - - - - 5 15
Spain - - 5 3 9 - 8 - 14 7 10 4 11 - 15 12
Mexico 6 13 13 11 4 12 - 14 12 14 - 8 14 6 11 -
Thailand 10 12 - 8 - 7 11 - 2 - - - - 2 7 9
Indonesia 13 6 - 10 - - 3 - 11 - 12 - 2 3 - 10
Canada - 4 - - - 8 - 10 - 11 - 11 - - - -
Poland - 5 - 15 15 6 - - - - 7 - 8 5 - -
Belgium - - - - 8 14 13 2 - 9 15 9 - - - 13
United kingdom
- - 12 7 13 9 6 7 13 3 - 12 - - 13 5
Taiwan 14 9 - - 10 10 15 - 15 - 11 13 6 8 6 -
Netherlands - - - 14 14 5 5 3 - 6 9 - 7 12 10 8
Bangladesh 5 - - - - - - - - - - - - - - -
Portugal 11 - 10 5 - - - 13 - - - 14 - - - -
Vietnam - 14 - 13 - - 10 - - - - - 3 10 12 -
Romania - 15 7 - - - - - - - - - - 14 - -
Malaysia - 7 - 12 - - - - - - - - 13 - - -
Austria - - 14 - 6 - - - 10 10 2 - - - - -
Korea Rep. 12 - 15 - - - 14 - 6 15 - - 14 7
Source: Frost & Sullivan
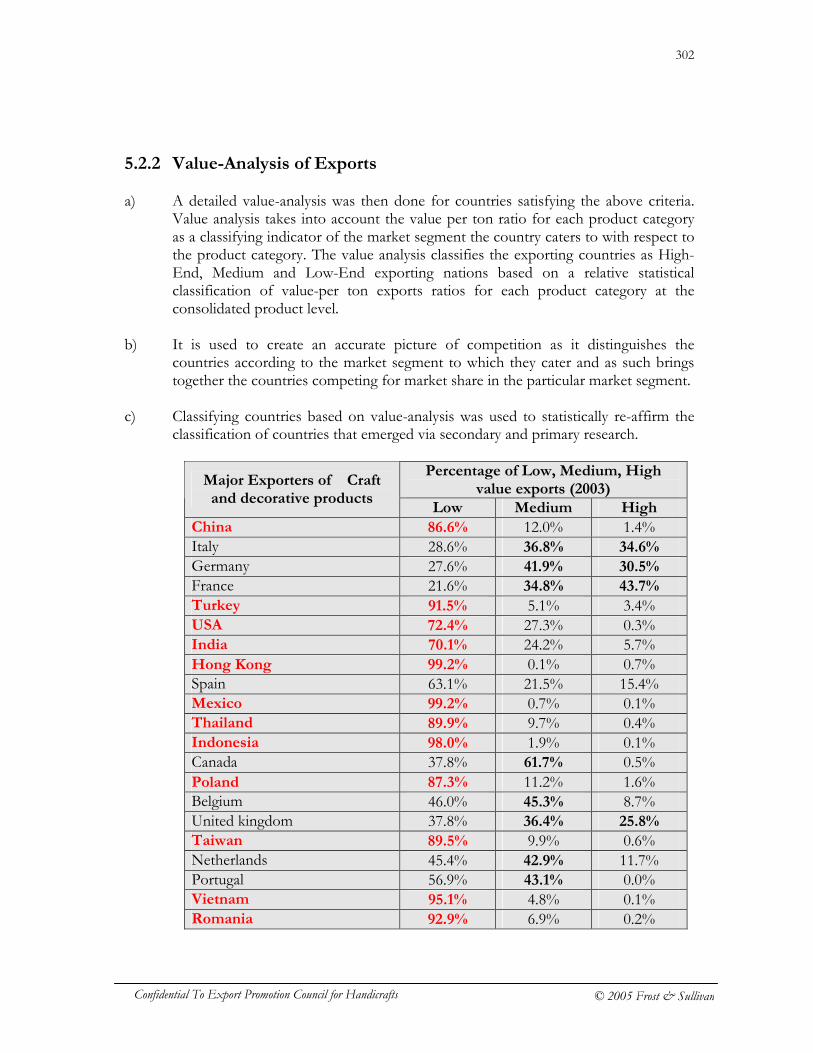
302
Confidential To Export Promotion Council for Handicrafts © 2005 Frost & Sullivan
5.2.2 Value-Analysis of Exports a) A detailed value-analysis was then done for countries satisfying the above criteria.
Value analysis takes into account the value per ton ratio for each product category as a classifying indicator of the market segment the country caters to with respect to the product category. The value analysis classifies the exporting countries as High-End, Medium and Low-End exporting nations based on a relative statistical classification of value-per ton exports ratios for each product category at the consolidated product level.
b) It is used to create an accurate picture of competition as it distinguishes the
countries according to the market segment to which they cater and as such brings together the countries competing for market share in the particular market segment.
c) Classifying countries based on value-analysis was used to statistically re-affirm the
classification of countries that emerged via secondary and primary research.
Percentage of Low, Medium, High value exports (2003)
Major Exporters of Craft and decorative products
Low Medium High
China 86.6% 12.0% 1.4% Italy 28.6% 36.8% 34.6%
Germany 27.6% 41.9% 30.5%
France 21.6% 34.8% 43.7%
Turkey 91.5% 5.1% 3.4% USA 72.4% 27.3% 0.3% India 70.1% 24.2% 5.7% Hong Kong 99.2% 0.1% 0.7% Spain 63.1% 21.5% 15.4% Mexico 99.2% 0.7% 0.1% Thailand 89.9% 9.7% 0.4% Indonesia 98.0% 1.9% 0.1% Canada 37.8% 61.7% 0.5% Poland 87.3% 11.2% 1.6% Belgium 46.0% 45.3% 8.7% United kingdom 37.8% 36.4% 25.8%
Taiwan 89.5% 9.9% 0.6% Netherlands 45.4% 42.9% 11.7% Portugal 56.9% 43.1% 0.0% Vietnam 95.1% 4.8% 0.1% Romania 92.9% 6.9% 0.2%
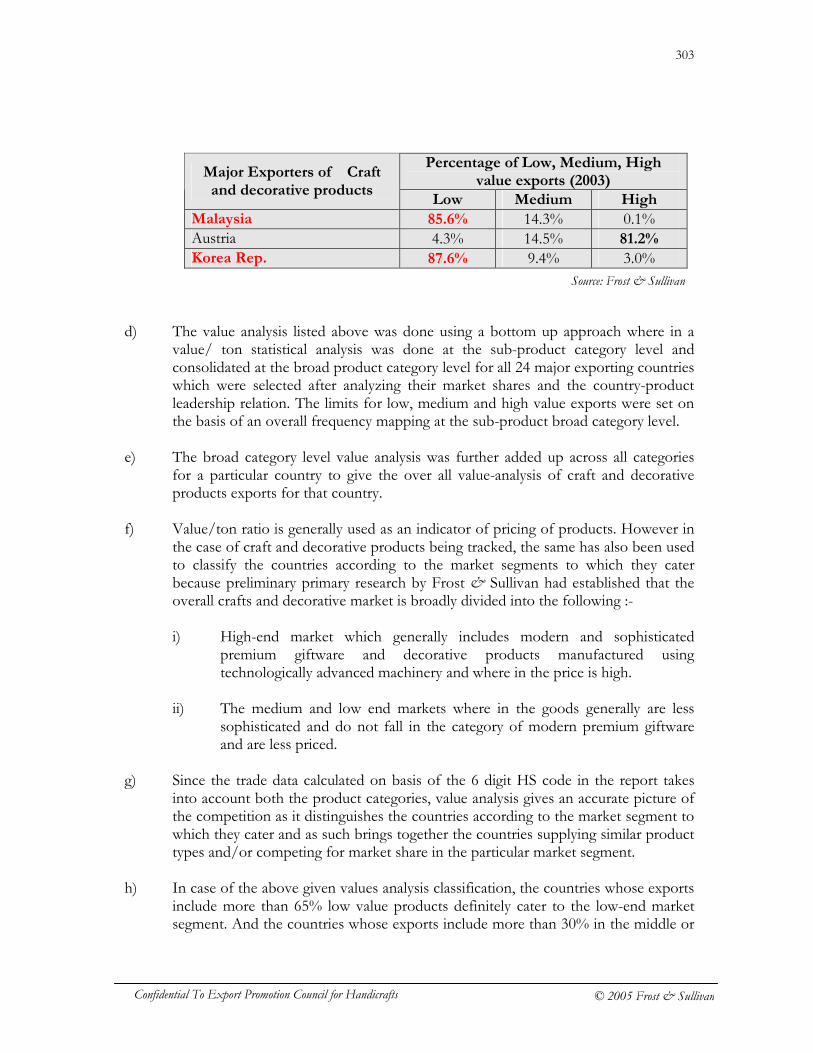
303
Confidential To Export Promotion Council for Handicrafts © 2005 Frost & Sullivan
Percentage of Low, Medium, High value exports (2003)
Major Exporters of Craft and decorative products
Low Medium High
Malaysia 85.6% 14.3% 0.1% Austria 4.3% 14.5% 81.2%
Korea Rep. 87.6% 9.4% 3.0% d) The value analysis listed above was done using a bottom up approach where in a
value/ ton statistical analysis was done at the sub-product category level and consolidated at the broad product category level for all 24 major exporting countries which were selected after analyzing their market shares and the country-product leadership relation. The limits for low, medium and high value exports were set on the basis of an overall frequency mapping at the sub-product broad category level.
e) The broad category level value analysis was further added up across all categories
for a particular country to give the over all value-analysis of craft and decorative products exports for that country.
f) Value/ton ratio is generally used as an indicator of pricing of products. However in
the case of craft and decorative products being tracked, the same has also been used to classify the countries according to the market segments to which they cater because preliminary primary research by Frost & Sullivan had established that the overall crafts and decorative market is broadly divided into the following :-
i) High-end market which generally includes modern and sophisticated
premium giftware and decorative products manufactured using technologically advanced machinery and where in the price is high.
ii) The medium and low end markets where in the goods generally are less
sophisticated and do not fall in the category of modern premium giftware and are less priced.
g) Since the trade data calculated on basis of the 6 digit HS code in the report takes
into account both the product categories, value analysis gives an accurate picture of the competition as it distinguishes the countries according to the market segment to which they cater and as such brings together the countries supplying similar product types and/or competing for market share in the particular market segment.
h) In case of the above given values analysis classification, the countries whose exports include more than 65% low value products definitely cater to the low-end market segment. And the countries whose exports include more than 30% in the middle or
Source: Frost & Sullivan
304
Confidential To Export Promotion Council for Handicrafts © 2005 Frost & Sullivan
higher value products category or middle and higher together total more than 35%; are countries that definitely cater to the upper-end markets.
i) Thus Italy, Germany, France, Canada, Spain, Belgium, United Kingdom,
Netherlands, Portugal and Austria cater to the upper-end market segment. j) And China, India, Turkey, USA, Mexico, Thailand, Indonesia, Poland, Taiwan,
Vietnam, Romania, Malaysia, and Korea Rep. cater to the middle and lower end markets and are therefore competitors. However USA mostly features in the list because it is re-exporter to Canada, Mexico and other Latin American countries. As such it can’t be viewed as a significant competitor.
k) More over from India’s perspective Hong Kong and Taiwan are not significant
competitors because Hong Kong is in fact a re-exporter of most categories of goods and manufactures only a small amount of gifts and decoratives of which majority are made under contract manufacturing agreements and are mostly of the premium variety.
l) More over after the retrocession of Hong Kong and Taiwan as Special
Administrative Regions of China most of the industries in these countries are shifting to the Chinese mainland to leverage benefits of ample resources and low costs. Even Korea is hardly a major competitor as it doesn’t offer any competition to India in any product category and more over it doesn’t have a significant craft or giftware sector.
m) Thus China, Turkey, Mexico, Thailand, Indonesia, Poland, Taiwan, Vietnam,
Romania, and Malaysia are the most significant competitors for India because these countries excluding China have established handicraft sectors and are mostly into the making of handmade products similar to India in terms of craftsmanship. However China is the most significant competitor due to its ability to make machine made cheaply priced copies of handmade products as well as producing and exporting a large variety of target market adapted crafts products which offer the same utility/ function or decorative value as Indian handmade products.
n) In the succeeding chapters the most significant of India’s Asian competitors have
been profiled in detail for the purpose of detailed benchmarking and best practices.
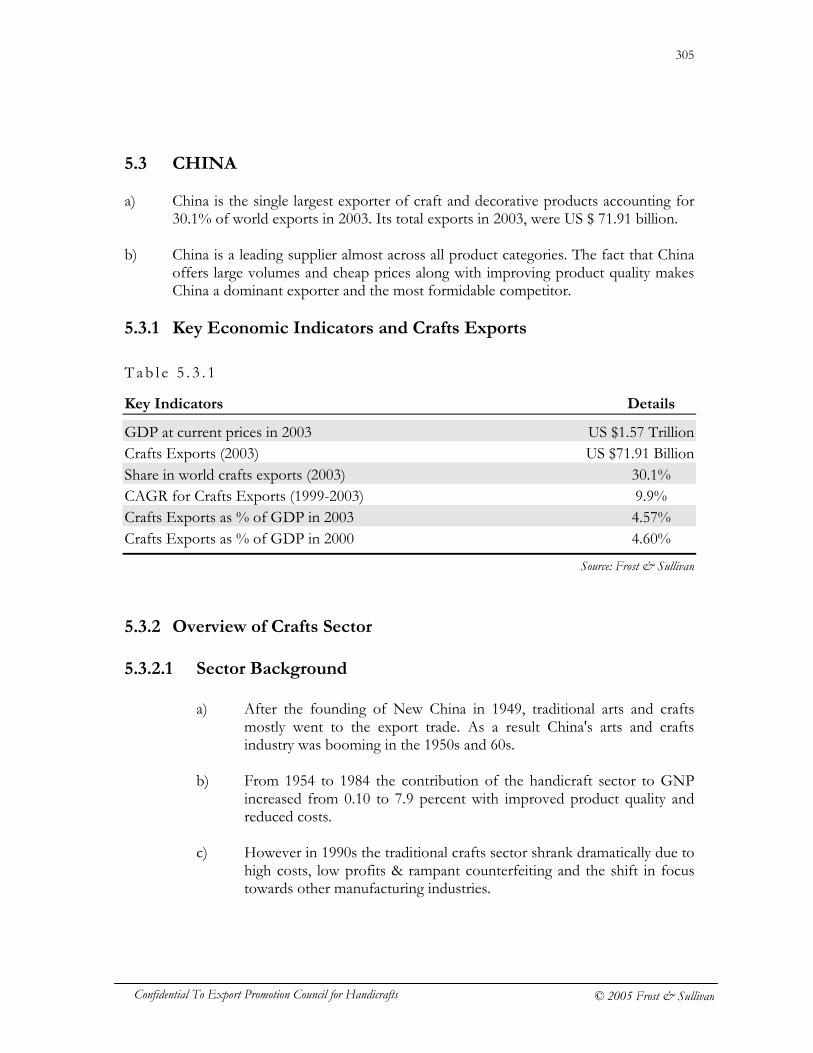
305
Confidential To Export Promotion Council for Handicrafts © 2005 Frost & Sullivan
5.3 CHINA a) China is the single largest exporter of craft and decorative products accounting for
30.1% of world exports in 2003. Its total exports in 2003, were US $ 71.91 billion. b) China is a leading supplier almost across all product categories. The fact that China
offers large volumes and cheap prices along with improving product quality makes China a dominant exporter and the most formidable competitor.
5.3.1 Key Economic Indicators and Crafts Exports
Tab l e 5 . 3 . 1
Key Indicators Details
GDP at current prices in 2003 US $1.57 Trillion Crafts Exports (2003) US $71.91 Billion Share in world crafts exports (2003) 30.1% CAGR for Crafts Exports (1999-2003) 9.9% Crafts Exports as % of GDP in 2003 4.57% Crafts Exports as % of GDP in 2000 4.60%
5.3.2 Overview of Crafts Sector 5.3.2.1 Sector Background
a) After the founding of New China in 1949, traditional arts and crafts mostly went to the export trade. As a result China's arts and crafts industry was booming in the 1950s and 60s.
b) From 1954 to 1984 the contribution of the handicraft sector to GNP
increased from 0.10 to 7.9 percent with improved product quality and reduced costs.
c) However in 1990s the traditional crafts sector shrank dramatically due to
high costs, low profits & rampant counterfeiting and the shift in focus towards other manufacturing industries.
Source: Frost & Sullivan
306
Confidential To Export Promotion Council for Handicrafts © 2005 Frost & Sullivan
d) This was also because from 1990s onward the handicraft sector in China was oriented towards giftware & target market adapted goods. Mainly because by 1995, there were an estimated 900 foreign controlled firms producing traditional Chinese handicrafts; with an average foreign equity share of 88%. However majority of these Foreign Invested Enterprises by overseas Chinese from Hong Kong, Taiwan, Macao.
e) The late 1990s also marked another important development in the sector
in terms of growth of contract manufacturing initially from Hong Kong firms .The WTO entry of China in 2001 saw an increase in the OEM manufacturing for European countries as well as a growing number of foreign firms setting up subsidiaries on the mainland.
f) Moreover many manufacturers from Hong Kong, Japan and Taiwan
have invested in and re-located their production facilities to the Chinese Mainland in order to benefit from low land and labor costs to achieve price competitiveness.
g) Lastly the retrocession of Hong Kong and Taiwan as Special
Administrative Regions of China has further given an impetus to the craft and decorative products export trade of China mainly because
� Hong Kong and Taiwan already had established their reputation as suppliers of craft and decorative products. In fact Hong Kong is a major hub for contract manufacturing of giftware due to the access to the European Union market close economic connection with Britain prior to its retrocession and has been a large re-exporter of Chinese craft and decorative products.
� As such the consequent increased economic co-operation between
the three regions has resulted in the better trade prospects for China firstly due the shifting of technologically advanced giftware manufacturing firms to the Chinese mainland and secondly the subsequent increase in production and direct exports of craft and decorative products from the Chinese mainland.
307
Confidential To Export Promotion Council for Handicrafts © 2005 Frost & Sullivan
5.3.2.2 Current Profile a) Presently the crafts sector in China comes under the Light Industry
which includes 40-odd sectors, including paper-making, daily-use mechanical devices, foodstuffs, plastics, metal products, household appliances, and leathers and furs-a total of more than 300,000 varieties.
b) The large amount of FDI investment in the sector combined with the shifting of giftware manufacturing firms from Hong Kong and Taiwan has resulted in the transition of the traditional crafts sector towards giftware manufacturing and manufacturing of decoratives to cater to the larger market of gifts and decoratives and housewares.
c) As a result almost 85% of craft and decorative products manufactured in
China are largely machine made with the products being either machine made replicas of the traditional products or consisting of those that are suitably adapted to meet the target market requirements.
d) Currently the gifts and decoratives industry in China is composed of a
large number of units of various production scales in China, approximately running into 80,000. This includes the traditional handicraft sector enterprises as well as the modernized gifts and decoratives manufacturing firms.
e) The sector comprises of almost 30% upwards Foreign Invested
Enterprises, However majority of these Foreign Invested Enterprises are by overseas Chinese from Hong Kong, Taiwan, Macao.
f) The past five years have also witnessed an increase in contract
manufacturing from European Union countries especially in products like glassware, leather, and ceramics.
g) Thus presently the modern gifts and decoratives manufacturing firms
are the main contributors of exports in the sector as the traditional units continue to decline. According to official Chinese estimates for the traditional handicraft sector, there are only 6000 registered units in eight core handicraft sectors of furniture manufacturing, Sculpture manufacturing, Metal craftworks, Lacquer work, artificial flower manufacturing, basketwork, wickerwork and other natural plant fiber plaited craftwork, yarn embroidery, Jewelry and related articles and carpet making.
h) Thus the large volume exports of craft and decorative products of China
has been at the cost of the traditional handicraft industry and temporary displacement of skilled master artisans caused due to the transition of
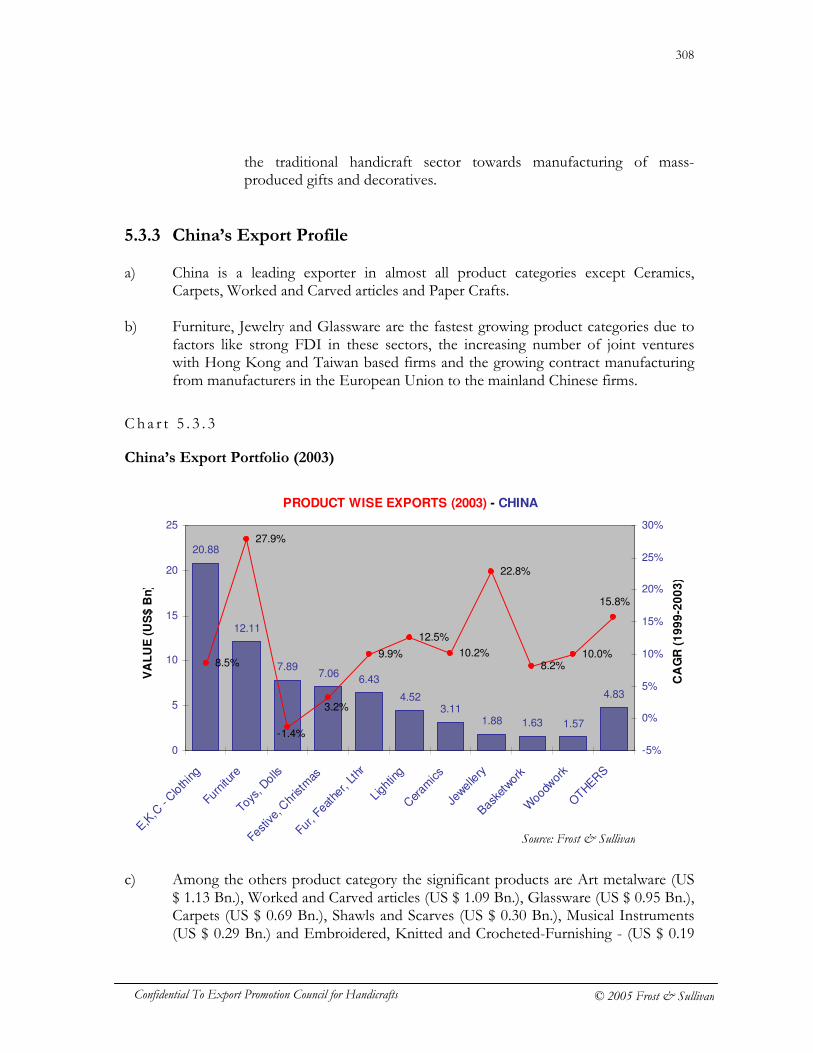
308
Confidential To Export Promotion Council for Handicrafts © 2005 Frost & Sullivan
the traditional handicraft sector towards manufacturing of mass-produced gifts and decoratives.
5.3.3 China’s Export Profile a) China is a leading exporter in almost all product categories except Ceramics,
Carpets, Worked and Carved articles and Paper Crafts.
b) Furniture, Jewelry and Glassware are the fastest growing product categories due to factors like strong FDI in these sectors, the increasing number of joint ventures with Hong Kong and Taiwan based firms and the growing contract manufacturing from manufacturers in the European Union to the mainland Chinese firms.
Ch a r t 5 . 3 . 3
China’s Export Portfolio (2003)
c) Among the others product category the significant products are Art metalware (US
$ 1.13 Bn.), Worked and Carved articles (US $ 1.09 Bn.), Glassware (US $ 0.95 Bn.), Carpets (US $ 0.69 Bn.), Shawls and Scarves (US $ 0.30 Bn.), Musical Instruments (US $ 0.29 Bn.) and Embroidered, Knitted and Crocheted-Furnishing - (US $ 0.19
PRODUCT WISE EXPORTS (2003) - CHINA
20.88
12.11
7.897.06
6.43
4.523.11
1.88 1.63 1.57
4.83
8.5%
27.9%
9.9%
12.5%
10.2%
22.8%
8.2%10.0%
-1.4%
3.2%
15.8%
0
5
10
15
20
25
E,K,C
- Cloth
ing
Furnitu
re
Toys
, Dolls
Festiv
e, C
hrist
mas
Fur, F
eath
er, Lt
hr
Ligh
ting
Cer
amics
Jewel
lery
Basket
work
Woo
dwork
OTHER
S
VA
LU
E (
US
$ B
n)
-5%
0%
5%
10%
15%
20%
25%
30%
CA
GR
(1
99
9-2
00
3)
Source: Frost & Sullivan
309
Confidential To Export Promotion Council for Handicrafts © 2005 Frost & Sullivan
Bn.). The remaining export value is contributed by paper crafts, Attar and Agarbatti and Zari.
5.3.4 Profile of China’s Crafts Sector, Its Structure and Characteristics 5.3.4.1 Industry Profile and Competency
a) The traditional Chinese industry for handicrafts has been continually decreasing. This is mainly because of the shift towards gift manufacturing. The gifts & decoratives industry in China is composed of a large number of units of various production scales in China, approximately running into 80,000. The overall composition of the industry in China in 2003 was estimated to comprise of around 50,000 Furniture manufacturing enterprises (out of these only around 1400 are estimated to be traditional furniture manufacturing industries), 1080 carpet manufacturing enterprises, 200 metalware manufacturing enterprises, 460 basketwork and other natural plant fiber & plaited craft manufacturing enterprises, 400 embroidery manufacturing enterprises, around 560 sculpture manufacturing enterprises, 150 flower & picture craftwork manufacturing enterprises, 50 lacquer work manufacturing enterprises, around 230 traditional imitation jewelry & other related product manufacturing enterprises and 2000 plus leather goods manufacturing enterprises.
b) The industry structure across all product categories comprises of mainly
30% upwards Foreign Invested Enterprises (the rage varies from 30% to 50%), around 1% upwards State owned enterprises (the range varies from 1% to 8%), around 30% upwards private enterprises (the range varies from 30% to 55%), around 6% upwards collective owned enterprises (the range varies from 6% to 12%), 7% upwards Share co-operatives (the range varies from 7% to 15%).
c) Majority of the units are located in south & east China. The main
regions where most of the industries are concentrated are Guangdong, Shandong, Zhejiang, Fujian, Shandong, Jiangsu, Shanghai, Beijing, Tianjin, Hebei, Liaoning, Heilongjiang, Fujian and Henan.
d) Basic raw material used for handicraft manufacturing like wood, metal
(silver, copper, brass and tin), paper, stone, cotton, silk, and leather is available abundantly & according to reports by local Chinese associations, most handicraft & related industries rely almost 90% on domestic sources of raw material.
310
Confidential To Export Promotion Council for Handicrafts © 2005 Frost & Sullivan
e) The traditional handicraft sector in China employs above 1 million full time employees (2003 estimates). Apart from these there are many temporary employees who are available to meet seasonal demands. However in terms of skilled artisans, the available number of master craftsman is declining as per reporting by China Chamber of Commerce for Import & Export of Light Industrial Arts & Crafts and China Council. However this has not affected the export competitiveness of the industry as it is now oriented towards semi & fully mechanized large volume based decoratives & gifts manufacturing.
f) In fact it is the increase in the number of Foreign Invested Enterprises
(both Wholly Owned Enterprises and Foreign Joint Venture enterprises) that not only gave the necessary impetus but also facilitated the modernization & mechanization of the Chinese traditional handicraft sector. Presently there is a high degree of mechanization in the textile based crafts, leather goods, metalware and furniture industry sector. Some of the examples of technological developments are CAD/CAM enabled design machines, large textile screen printing machinery for reproduction of batik designs & also wood processing machinery.
g) As the Chinese crafts & decoratives manufacturing firms are mainly
volume manufacturers, the relatively high levels of mechanization as well as large & consistent labor supply enable most manufacturing firms in the sector to reap the benefits of economies of scale.
5.3.4.2 Product variety and quality
a) The availability of sufficient resources in terms of raw material as well as ample and continuous supply of reliable labor combined with the high degree of mechanization has enabled China to produce large volumes of target market adapted craft and decorative products including the large number of machine made replicas of traditional arts and crafts products.
b) Secondly the increasing contract manufacturing and joint ventures with
Hong Kong and Taiwanese firms which have superior design and technological capabilities has also enabled China to produce and supply a variety of products.
c) In addition the fact that significant volume of exports takes place
through large state-owned enterprises or large private companies & Foreign Invested Enterprises makes the supply of large variety of goods possible because these firms are capable of supplying the required varieties due to diversification into gifts & decoratives field as well as
311
Confidential To Export Promotion Council for Handicrafts © 2005 Frost & Sullivan
having the required production and design capacities to meet the demand for variety goods.
d) With respect to quality of products, the Chinese products are slowly
improving in terms of quality. Since majority of the products are utility oriented and mass produced they do not display the superior craftsmanship as exhibited by traditional handicraft producing countries like Vietnam, Malaysia, Indonesia and India.
e) Presently the perceived quality of Chinese crafts and decorative products
is considered to be below the European Union and US suppliers with respect to especially the functional category products. And with respect to the decorative category products, as an increasing number of products are machine made replicas of traditional handicrafts the design and especially craftsmanship is inferior as compared to the completely hand made products.
f) But overall the quality of Chinese made crafts and decorative is steadily
improving especially in terms of adherence to the target market quality standards. Moreover as the Chinese industry is to a large extent geared towards catering to the fashion based USA gifts & decoratives market, it has to supply a continual variety in terms of product design. The awareness of this need has resulted in many private manufacturing firms as well as the Foreign Invested Enterprises setting up in-house design departments and employing experienced local and foreign design personnel which is also positively impacting the design quality of Chinese products.
g) Besides the quality of all products to be exported out of China is
authenticated by the Quality Authentication Center for Export & Import Goods in China. In addition to this, many Chinese exporters are recently adhering to the quality standards to be observed for exports of decorative-cum-utility products to US & EU countries. For example the requirements, like complying with FDA standards in case of products like Ceramics, wooden articles, textiles and furniture.
h) Even with respect to the product packaging, labeling and product
information and traceability, interaction with both Chinese manufacturers as well as the importers has confirmed that a majority of Chinese manufacturers and exporters are very careful with regard to product packaging and labeling. In fact most Chinese manufacturers make their products undergo a ‘Drop Test’ to check the strength of the packing materials used.
312
Confidential To Export Promotion Council for Handicrafts © 2005 Frost & Sullivan
5.3.4.3 Logistics & Infrastructure a) 75% to 80% of the craft manufacturing firms are set up in the south &
east of China as these regions form the base of the traditional handicraft Industry in China. These regions have the traditionally formed utility clusters which are now supporting the growth of the craft & decoratives manufacturing industry.
b) Since majority of the manufacturing firms are located at eastern & south
China, inland & international transportation is not much of a problem since these regions are favored with easier access to ports and trading/logistic/export facilities. The average cost of inland transportation is approximately USD 300 to USD 400 for a 40 ft container.
c) With regard to the communication infrastructure and facilities, again
interaction with the Chinese manufacturers as well as the importers from US and European Union has confirmed that Chinese manufacturers and exporters have access to latest communication infrastructure and facilities especially since majority of the large firms in the sector are situated in Special Economic Zones in the Guangdong region. Even the smaller exporting firms are increasing using fast communication means like the net (emails) for prompt communication.
d) More over as per most of the US and European Union importers
interviewed, the Chinese manufacturers and exporters are very prompt in their responses and correspondence with the importers.
e) Factors like warehousing is not a problem for Chinese exporters because
there are sufficient number of domestic warehouse facilities available within the country till the goods are loaded on the ship and even with respect to warehousing in the target country, most of the Chinese manufacturers do not face any problem as they generally have agents/distributors in the importing countries, which have their own warehouses.
f) There are also large State-owned exporting units in China, through
whom exports are done. However, most private owned firms have agents particularly in the US through whom the products are then distributed to the Retail Chains or department stores.
313
Confidential To Export Promotion Council for Handicrafts © 2005 Frost & Sullivan
5.3.4.4 Government Policy & Regulatory Environment
a) The handicraft sector in China falls under the category of Light Industry. Presently the country doesn’t have a well defined long term policy for handicrafts per se. However at the provincial level the local governments are taking steps towards the development of crafts sector. The policy mainly aims at developing the crafts sector through training and export promotion support.
b) Incidences of regional efforts for development of core handicraft sector
have increased since 2001. For example a fund was set up by Beijing Municipal Economic committee in 2003, with an annual input of 3 million Yuan (US$360,000). Master craftspeople are able to draw allowances of up to 800 Yuan (US$98) every month for use in training apprentices, in a bid to promote the education of skilled personnel and encourage the imparting of traditional crafting skills.
c) The Government is also promoting exports of craft and decorative
products by providing financial aid and benefits like there is 5% VAT rebate available incase of exports of crafts products. In addition a lot of financial concessions and subsidized rates are available for using various modes of market development and methods of export promotion.
d) Lastly the Chinese Government has also established trade agreements
between with mainly Hong Kong, and Taiwan. These agreements mainly aim to facilitate the giftware trade between China & its special administrative regions of Hong Kong & Taiwan which already had established trade links in the giftware sector.
e) The Chinese Government till date continues to negotiate with the US
and various European Union countries which have imposed heavy anti-dumping duties on various different crafts and decorative products of Chinese origin.
5.3.4.5 Policy towards FIE’s, joint ventures, OEM developments in
craft sector - a) The Chinese government has been encouraging the setting up of
Foreign Invested Enterprises in the Crafts & decoratives sector from 1997 onwards in a very aggressive manner. The Foreign Invested Enterprises can be in the form of Wholly- owned foreign enterprises or Sino-foreign joint ventures. The favorable policy of the Government
314
Confidential To Export Promotion Council for Handicrafts © 2005 Frost & Sullivan
towards Foreign Invested Enterprises is evident from the fact that the crafts & giftware sector in China has a minimum of 30% FIE presence across all its crafts sub-sectors. The Government has given the Foreign Invested Enterprises many benefits like repatriation of profits, flexible labor policy. Apart from these incentives the Foreign Invested Enterprises that are set-up in SEZ’s, coastal areas and other designated zones are subject to income tax at concession rates of 15% to 24%.
5.3.4.6 Government & NGOs support to the Sector
a) The Chinese Government including its various bodies at central and regional levels is supporting the development of the traditional crafts sector as well as the modernized giftware manufacturing sector through the setting-up of various development associations and training centers for imparting the traditional crafting skills. Examples of such development associations include the China National Arts & Crafts Association which was set up in 1988 mainly for the purpose of promoting development of arts and crafts industry and acting as a bridge & link between government & enterprise.
b) Additionally Regional level Government bodies in China have set up
craft training & development centers like Beijing Baigongfang, which is the largest handicraft development and production center in China set up in the Chongwen District in 2003. This centre is basically created to create tourist interest & resultant sales. It covers 4,000 square meters and has a total investment of nearly 200 million Yuan (US$24 million).Each unit has a retail shop in front and a workshop in the back. Baigongfang has established more than 30 specialty workshops and 100 studios for masters for the production of traditional folk arts and crafts.
c) However the most significant support mode by the Government in
China is by promotion of cultural exchanges & setting up many showrooms in Taiwan and especially Hong Kong which is the gateway for crafts & decoratives trade for China. Also the Chinese government supports the Chinese producers and exporters of craft and decorative products in their market development and trade promotion efforts by organizing many Trade Fairs and also providing the exporters with subsidized rates and financial aid for attending overseas Trade Fairs including large housewares exhibitions especially in the US and European Union countries.
315
Confidential To Export Promotion Council for Handicrafts © 2005 Frost & Sullivan
5.3.4.7 Market Development & export trade promotion efforts a) China has been aggressively involved in market development efforts in
both the key markets of US as well as the EU. The mode of market development used by China ranges form promotion of Sino-foreign cultural exchanges by organizing expositions/ exhibitions like China National Arts & Crafts Exposition, International Trade Fairs to setting up distribution networks in target markets, showrooms in the country as well as in foreign countries, product promotion through association run websites and advertisement in important women’s and housewares magazines, to attracting FDI, joint ventures and contract manufacturing.
b) An important exhibition currently being used for promotion of Chinese
handicrafts and gifts is the China International Handicrafts Exposition (CIHEX) which is co-sponsored by China Chamber of Commerce for Import & Export of Light Industrial Arts & Crafts and China Council for the Promotion of International Trade (CCPIT) Xiamen Sub-council. The Exposition, which is hyped as the first professional handicrafts exhibition since China's accession into WTO, second only to the Canton Fair as China's most important handicraft venue, integrates both import and export trade.
c) At the country level the Government and export trade promotion
bodies have contributed towards market development efforts for craft and decorative products products by establishing economic and trade co-operation treaties with especially Hong Kong like the Mainland and Hong Kong Closer Economic Partnership Arrangement (CEPA) which enables free movement of crafts and decorative products between the two regions and also removes all barriers to the relocating of large giftware manufacturing firms to mainland China.
d) As such this helps China in its market development efforts in two ways
i.e. firstly it helps Chinese manufacturers and their products to have greater access to the Hong Kong market which is slowly itself becoming a important market for middle to high-end giftware due to its westernization and improved and high standards of living causing increased demand for craft and decorative products that are used for home décor and gift purpose.
e) And secondly it has created a gateway for Chinas’ exports as Hong
Kong is also an established gifts and decoratives supplier and contract manufacturer for European Union manufacturing firms. These routes are now accessible to Chinese firms for furthering their own direct
316
Confidential To Export Promotion Council for Handicrafts © 2005 Frost & Sullivan
exports as they offer more competitive prices than Hong Kong based firms.
f) More over China has also set-up its own large showrooms in Hong
Kong to display craft and decorative products produced in China. As Hong Kong has a larger number of tourists, the setting up of Chinese showrooms has helped create interest in Chinese craft and decorative products through the medium of tourists.
g) Another mode of market development used by Chinese exporters is the
appointment of distributors and agents in the target countries which has helped them to slowly create trade contacts and increase their exports.
h) Market specific market development efforts include creating demand for
Chinese crafts and decorative products as was done in case of most European Union and Asian countries by building up hype through cultural elements like ‘fenshui’ etc which in turn creates a strong demand for Chinese- art & culture inspired giftware. Moreover the same is then aggressively marketed by heavyweight importers such as the Ackerman Group, Sifcon International, Salco and PMS International Group due to the excellent tie-up with these importers.
i) However the most widespread form of market development being used
by China is the effort towards market penetration by dumping of cheaply priced large volumes of craft and decorative products products in the target market. This has helped China create its presence even in European Union markets which mostly imports high-end products from within the European Union itself.
317
Confidential To Export Promotion Council for Handicrafts © 2005 Frost & Sullivan
5.4 Thailand a) In terms of ranking, Thailand is the 11th largest exporter in value terms with its total
crafts and decorative exports being US $ 4.39 Billion in 2003. b) Unlike China, majority of Thailand exports of craft and decorative products are
handmade. In fact Thailand can be considered as one of the important Asian countries that still have a significant traditional handicraft sector with there being large number of artisans spread across the country and each village having many household craft production units with generally a particular village specializing in the production of a particular craft.
5.4.1 Key Economic Indicators and Crafts Exports
Tab l e 5 . 4 . 1
Key Indicators Details
GDP at current prices in 2003 US $143 Bn Crafts Exports (2003) US $4.39 Bn Share in world crafts exports (2003) 1.8% CAGR for Crafts Exports (1999-2003) 4.3% Crafts Exports as % of GDP in 2003 3.07% Crafts Exports as % of GDP in 2000 3.42%
5.4.2 Overview of Crafts Sector 5.4.2.1 Sector Background
a) The handicraft industry in Thailand is strongly woven in with the culture and daily life of the people of Thailand. Almost all of Thailand’s 7,252 districts are involved in some form of handicraft production.
b) As such it covers a variety of crafts products, but the most prominent
crafts that have been recognized by the National Identity Office, Office of the Prime Minister, Royal Thai government, include pottery, wood carving, silver carving, lacquer ware, leather carving, basketry, reed mat making, nielloware, umbrella making, mother of pearl inlay, fine
Source: Frost & Sullivan
318
Confidential To Export Promotion Council for Handicrafts © 2005 Frost & Sullivan
embroidered cloths/ articles, dolls & other toy making, cloth weaving and silk making.
c) The sector initially only comprised of many small household production
units due it being an integral part of the culture of Thailand. However the sector also has a large number of small and medium-sized manufacturing units which have continued to increase over the years.
d) Generally handicrafts were produced by rural families in their homes
with the raw materials that were available in the local area. The production and sale of handicrafts would provide rural families with incomes and the handicraft products were also used within the household and rural community.
e) As such, till 1995 the production of handicrafts in Thailand was mostly
to cater to the local demand and to a small extent to demand from Asian countries like Japan. However from 1995 onwards exports especially of wood and textile based handicrafts to the US and European Union increased.
f) However the 1997-1998 economic crises of the country adversely
affected the handicraft sector leading to reduced local consumption and production and therefore decline in exports.
g) But during 1999-2000, the sector was benefited by strong export led
growth due to stronger overseas demand and increased purchasing power. In addition, the sharp decline of the baht helped to boost the international competitiveness and export value. During this period Thailand craft manufacturers and exporters were also able to make inroads in the European Union and Middle East markets.
h) The overall slump in the global economy in 2001 badly affected the
domestic crafts industry in Thailand as it had increasingly started depending on exports. It created problems like oversupply and piled up stocks.
i) But the efforts being put in by the Government of Thailand and
specifically by the Department of Export Promotion (DEP) and other NGO’s has resulted in improvement in the handicraft sector at the grass root levels itself.
j) The recent years have in fact witnessed an increasing awareness among
local manufacturers of international demand, market requirements and customer preferences. This increased awareness amply supported by the
319
Confidential To Export Promotion Council for Handicrafts © 2005 Frost & Sullivan
Government of Thailand has led to the sector trying to increase its export competitiveness through better production techniques and designs, improved quality control, market development efforts and promotion.
k) Lastly, Government programs like the “OTOP - One Tambon One
Product” that aim to support and develop the rural industries have given a definite impetus to the traditional handicraft sector and will continue to ensure its sustenance and development.
5.4.2.2 Current Profile
a) The craft and decorative products manufacturing sector in Thailand,
unlike China has not experienced a complete transition to the modernized mass-produced giftware and decoratives manufacturing, and is still traditional in its outlook along with being a prominent part of the economy of Thailand.
b) The sector even today is comprised primarily of many household
production units and a large number of small and medium size manufacturing firms. In fact the sector comes under the Bureau of Cottage and Handicraft Industries Development which is in turn a part of the Department of Industrial Promotion (DIP).
c) The recent years have nevertheless seen a lot of improvement especially
in specific sub-sectors like textile crafts, silk making, ceramics, pottery and furniture making of wood and natural plaited material due to the increased support of the Government of Thailand and especially the DEP. As a result of these efforts and the awareness of increased export potential there have emerged some large manufacturing firms in these segments.
d) In fact though the main focus of the sector is still production of
traditional crafts like Lacquer ware, Celadon, nielloware and umbrella making, there has been an increase in the number of medium to large firms involved in the manufacture of target market adapted products including manufacture of artificial fruits/ flowers/ plants , Christmas decorative items , other modern glass decorative items, garden accessories , corporate gifts , miniatures , frames , ornaments , paper mache , pot pourrie , printing picture , shell craft , stationary , wicker work , gems and jewelry and toys.
320
Confidential To Export Promotion Council for Handicrafts © 2005 Frost & Sullivan
e) Most of these new medium to large firms manufacturing decoratives are located in Chiangmai which has long been known as the Thailand's City of Handicrafts.
f) However most of the medium and large firms are into OEM/ contract
manufacturing of products like furniture, ceramics, leather goods and glassware.
g) The crafts sector in Thailand is thus continuing to emerge stronger with
the development of sector considered ideal because � It is an all round development that is benefiting the core
handicraft sector at the District/Village level through the OTOP program. ( Note: The details of the OTOP program are covered under section 6.5.4)
� While the SME’s in the crafts sector are supported by the DIP and
the DEP which are proactively helping them to increase their export competitiveness by helping them to attract and obtain contract manufacturing which aids technology transfers. They are also aggressively supporting market development activities through bilateral trade-agreements with Asian countries like Japan and other major markets like US, Middle East, and European Union and other promotion modes including international Trade Fairs, domestic exhibitions etc.
h) In sum the crafts sector in Thailand, though mostly comprising of
household production units and SME’s is slowly emerging as an important export oriented sector. This has become possible because the country already was rich in terms of domestic resources especially abundant labor including skilled master craftsmen having high degree of craftsmanship and secondly due to its access to raw material from Southeast Asian countries.
i) Thus with the strong Government support and long term sector
development plans in place, Thailand has been able to leverage it resources to become the third largest Asian exporter of handicrafts per se and the largest Asian exporter subsequent to China in categories like Ceramics, Festive and Christmas decoratives, woodwork, and Jewelry. In fact overall exports of craft and decorative products increased by a remarkable 7% in 2003.
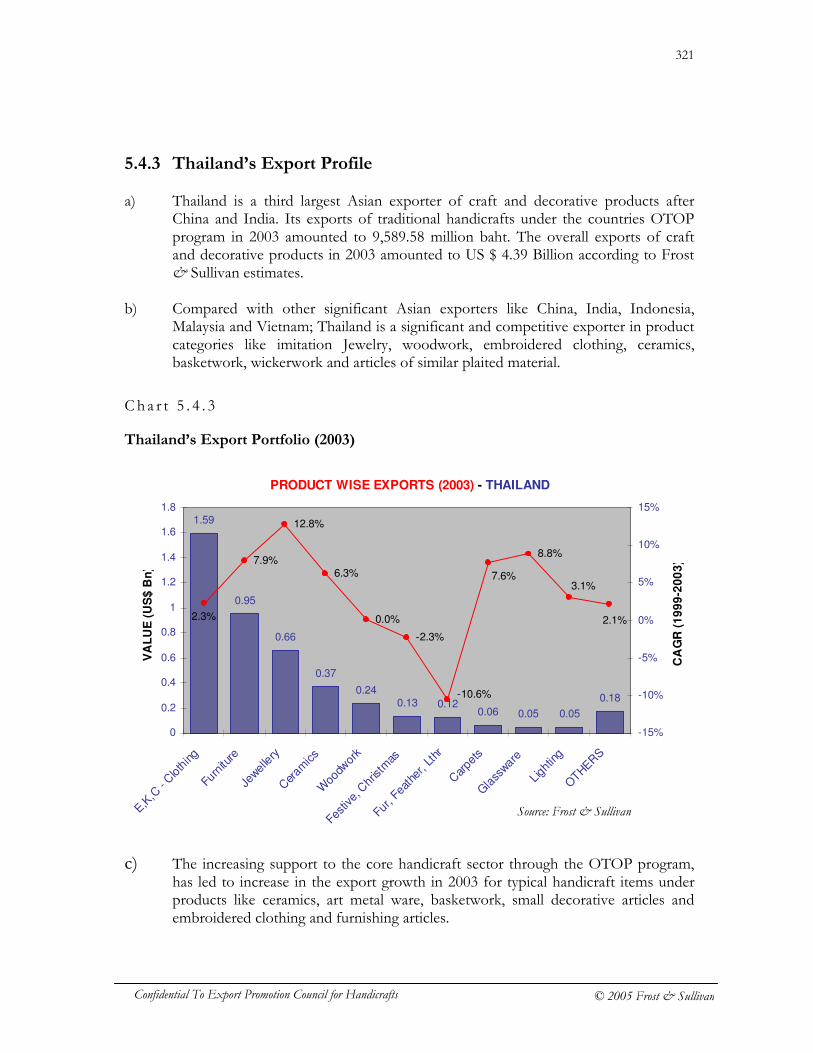
321
Confidential To Export Promotion Council for Handicrafts © 2005 Frost & Sullivan
5.4.3 Thailand’s Export Profile a) Thailand is a third largest Asian exporter of craft and decorative products after
China and India. Its exports of traditional handicrafts under the countries OTOP program in 2003 amounted to 9,589.58 million baht. The overall exports of craft and decorative products in 2003 amounted to US $ 4.39 Billion according to Frost & Sullivan estimates.
b) Compared with other significant Asian exporters like China, India, Indonesia, Malaysia and Vietnam; Thailand is a significant and competitive exporter in product categories like imitation Jewelry, woodwork, embroidered clothing, ceramics, basketwork, wickerwork and articles of similar plaited material.
C h a r t 5 . 4 . 3
Thailand’s Export Portfolio (2003)
c) The increasing support to the core handicraft sector through the OTOP program,
has led to increase in the export growth in 2003 for typical handicraft items under products like ceramics, art metal ware, basketwork, small decorative articles and embroidered clothing and furnishing articles.
PRODUCT WISE EXPORTS (2003) - THAILAND
1.59
0.95
0.66
0.37
0.240.13 0.12
0.06 0.05 0.05
0.18
7.9%
12.8%
6.3%
0.0%
-2.3%
8.8%
7.6%
-10.6%
3.1%
2.1%2.3%
0
0.2
0.4
0.6
0.8
1
1.2
1.4
1.6
1.8
E,K,C
- Cloth
ing
Furn
iture
Jewel
lery
Cer
amics
Woo
dwork
Festiv
e, C
hrist
mas
Fur, F
eath
er, L
thr
Car
pets
Gla
ssware
Light
ing
OTHER
S
VA
LU
E (
US
$ B
n)
-15%
-10%
-5%
0%
5%
10%
15%
CA
GR
(1
99
9-2
00
3)
Source: Frost & Sullivan
322
Confidential To Export Promotion Council for Handicrafts © 2005 Frost & Sullivan
d) Secondly the awareness of customer preferences, support to SME’s in the craft sector and the increase in contract manufacturing has resulted in increased exports of product categories like Jewelry, glassware, lighting, and Festive and Christmas articles.
e) In fact Thailand is the world’s second largest producer and exporter of imitation and semi-precious jewelry and accessories including silver jewelry. It is also the second largest Asian exporter of Festive and Christmas articles and Ceramics.
5.4.4 Profile of Thailand’s Crafts Sector, Its Structure and
Characteristics 5.4.4.1 Industry Profile and Competency
a) As discussed under the section ‘current profile’, the handicraft sector in Thailand is traditional in its outlook with there being a large number of household crafts manufacturing units and small & medium crafts manufacturers in Thailand. As per rough estimates there are approximately 5500 to 6000 small & medium scale enterprises in the crafts sector excluding furniture manufacturing. The furniture manufacturing sector alone accounts for approximately 8000 small and medium sized firms.
b) The past five years have witnessed the emergence of some large
manufacturers & exporters; however most of these are OEM manufacturers focusing on product segments like Ceramics, Glassware, jewelry, furniture, festive and Christmas articles, decorative lighting products and corporate giftware.
c) In fact it is the increased market development efforts through
government bodies like DEP that has resulted in attracting contract manufacturing and an increasing number of joint ventures with Hong Kong, Japan, Korea, USA and German based firms.
d) In terms of resources needed for the crafts sector, Thailand was initially
endowed with substantial raw material resources like wood, bamboo, reed, metals like silver and even gem stones. However their continuous exploitation and mismanagement has caused the supply to be inadequate to meet increasing demand for export production. Thailand as a result needs to import most of the raw material required for handicraft & decoratives manufacturing especially hardwood including teak, pine and
323
Confidential To Export Promotion Council for Handicrafts © 2005 Frost & Sullivan
oak and even gemstones. Most of the raw material requirement of Thailand is obtained from the South East Asian countries.
e) Though Thailand crafts industry is likely to face problems with respect
to raw material, the industry strength lies in its large and skilled labor force, currently there being approximately 0.6 million people employed in the craft, decoratives & related industry in Thailand, including furniture making. The support given to the household craft producing units in rural Thailand has ensured that age old craft techniques are still thriving. However as compared to other craft exporting Asian countries especially China and Vietnam the labor cost is relatively high in Thailand with the average wage charge being 1000-2000 baht per week. The general minimum wage in Thailand is currently 162 baht per day (US$4.38) in Bangkok, and between 130-140 baht in the provinces.
f) With respect to the level of mechanization and use of technology, most
house-hold manufacturing units & SME’s employ low to medium technology. However the OEM firms as well as the large enterprises catering to the larger market of gifts & decoratives have recently started employing better technology especially in product categories like ceramics, glassware, jewelry and textile based crafts.
g) However as most of the firms are small & medium scale & do not use
much technology; they don’t reap any benefits in terms of economies of scale. This is one of the reasons that adversely impacts price competitiveness of Thailand craft and decorative products products especially as compared with China.
h) Based on interaction with Thailand manufacturing firms it was
ascertained that cost of raw material (40% to 45%) and labor (25% to 30%) are the two major costs incurred by Thailand craft manufacturers. Inland transport costs come to approximately 6000 baht per ton.
5.4.4.2 Product variety and quality
a) The decorative products produced by Thailand are of excellent design quality and high degree of craftsmanship. But almost 80% the utility cum decorative products/functional products of Thailand are of low to medium quality when compared with international standards.
b) However from 2002 onwards, all handicraft products exported under
the OTOP program have to meet stringent quality requirements and are selected for exports under the OTOP program and allowed to use the
324
Confidential To Export Promotion Council for Handicrafts © 2005 Frost & Sullivan
OTOP label only if they clear the rigorous quality tests and checks which also cover product packaging.
c) Even with respect to variety of products offered; Thailand
manufacturers and exporters, do offer a variety of different products. However though the Thailand artisans produce a large variety in terms of product designs; interaction with importing nations has established that many-a-times the designs do not meet the changing fashions and trends of international consumers resulting in the market for Thailand based handicrafts being restricted to the niche segments and consumers who prefer traditional, ethnic and oriental designs.
d) More over as majority of the manufacturers and exporters are small to
medium sized they are unable to supply large volumes of products. e) With respect to product testing presently the country doesn’t have any
agencies in the domestic country that are responsible for crafts product testing for the purpose of exports. However for the purpose of increasing the appeal and competitiveness of Thailand craft and decorative products, the Department of Industrial Promotion (DIP) has started offering free testing facilities for both raw materials and finished products of certain categories e.g. metals, textiles, furniture, ceramics, etc., to ensure that they are of required quality and standards for export purpose.
f) With respect to product packaging, labeling and traceability, interviews
of manufacturers and exporters in Thailand has revealed that an increasing number of Thai exporters of crafts products are using recyclable & eco-friendly packing to cash in on the rising environmental awareness & concern by consumers.
g) Additionally, the increasing awareness of export requirements as well as
advice, support, training and facilities given by DEP of Thailand has resulted in improved packaging.
5.4.4.3 Logistics & Infrastructure
a) The mostly rural set-up of majority of the crafts manufacturers makes both inbound and outbound logistics a major hindrance as the overall logistics support for the industry is not very strong. Secondly this translates into further troubles like delivery problems due to inadequacy of freight ships and higher transportation costs with the Inland
325
Confidential To Export Promotion Council for Handicrafts © 2005 Frost & Sullivan
transportation costs to domestic ports being on an average around 6000 baht per ton.
b) More over presently, there are only eight international deep-sea ports in
operation, of which only four private ports are permitted to handle container cargo. Laem Chabang Commercial Port and Map Ta Phut Industrial Port serve Eastern Seabord Region. Songkhla and Phuket Ports have been developed to serve Southern Thailand. However Phuket is not serviced by the more than 4,000 km rail network that links the other major regions of the country. Bangkok Commercial port is the largest port in Thailand.
c) To compensate for the infrastructural bottlenecks, the DEP has been
making efforts to solve the logistics problems of the scattered household production units by arranging for transport and shipping facilities under the OTOP program.
d) However even though the overall logistics infrastructure is not very
strong, certain sub-sectors within the craft and decorative products sector like the ceramics, woodwork, furniture and jewelry are well supported by the presence of ancillary and supporting industries which has helped these sectors to expand.
e) With respect to communication facilities and their usage, interaction
with both Thailand exporters as well as target market importers has confirmed the Thailand exporters especially most of the small and medium sized firms have access to modern communication means. And more over the increased awareness of prompt and responsive communication in export trade has led many SME’s to increasingly use the internet for prompt communication. Almost 60% of the SME’s use email and internet for business communication with an increasing number of firms hosting their own websites.
f) In fact the small & medium sized firms in industrially developed areas of
Thailand are increasingly using the e-commerce model for direct sales.
g) However the major distribution channel is selling goods to importers through trading forums & buying agents. But a fast emerging channel - is sales of Thailand crafts products through showrooms, which are being been set-up by the DEP of Thailand in the target countries for example showrooms in Houston, LA and Hong Kong for promotion of Thai handicraft products.
326
Confidential To Export Promotion Council for Handicrafts © 2005 Frost & Sullivan
h) In other target countries where Thailand doesn’t have its own showrooms, it has made arrangements with department stores and galleries to display their products.
i) Thailand however has a strong network of domestic showrooms and
display areas at prominent locations like Bangkok and other important tourist areas that are used to attract visiting importers.
5.4.4.4 Government Policy & Regulatory Environment
a) The government has been following its national ‘Dual Track policy’ by reviving, strengthening and making more competitive the foreign investment-fueled and export-based sectors including jewelry, textiles, ceramics, glassware, furniture and giftware manufacturing by supporting the SME’s through various measures implemented by the DIP . And simultaneously energizing and empowering the grassroots - small village artisans and entrepreneurs, rural communities-by transforming them into globally competitive producers’ through complete support through the OTOP program.
b) Thus the Government of Thailand has in place a well structured policy
towards the development of the core handicrafts sector and has started implementing the same from the year 2001 onwards when it planned the OTOP project. Under the OTOP (i.e. One Tambon One Product) villages having traditional expertise in a particular crafts product were identified & are being given continued support in the forms of training and marketing support for developing & increasing the exports of those specific products.
c) Thus, under the program, the government provides a full cycle of
assistance ranging from assigning professionals to improve product designs, making them more attuned to international tastes and requirements, to providing skills and management training, to organizing trade shows for international buyers, to building databases and systems on marketing channels, and so on.
d) Apart from assisting the development and improving export
competitiveness of the core handicraft sector at the grass root levels, it is also framed supportive policies to support the SME’s involved in handicrafts and other decoratives including housewares and furniture.
e) The Government does extend financial support to the sector in terms of
soft loans and other subsidies and free marketing and promotion
327
Confidential To Export Promotion Council for Handicrafts © 2005 Frost & Sullivan
facilities as well as full rebates on imports of raw material that are used for production of goods that are to be exported. However the present rate of applicable tax is 7% VAT & 20% tax on net profit for the sector.
f) In addition to its general sector development policy, Thailand presently
has signed various agreements with China, Japan & USA which aid the development & exports of the crafts sector in Thailand. The terms of these agreements are in respect of training, technical & export promotion support to Thailand crafts sector.
5.4.4.5 Policy towards FIE’s, joint ventures, OEM developments in
craft sector
a) Thailand allows joint ventures in the crafts sector & related gifts & decoratives sector. However, presently the joint ventures in the sector are of Korean & Japanese origin with few US ones. However the Government of Thailand has lately beefed up its efforts to attract FDI but it has not been very successful as it doesn’t have in place a very attractive package to attract FDI.
5.4.4.6 Government & NGOs support to the Sector
a) From the year 2001 the government of Thailand is actively supporting the handicrafts sector of the country. The government support is provided via different programs and different Government bodies.
b) The SME’s engaged in the manufacture of craft and decorative products
are proactively supported via the Department of Industrial Promotion (DIP) which offers a variety of services which includes
� Marketing support including advice regarding the marketing of
handicraft products including ceramics, textiles, imitation jewelry, etc. as well as assistance in participating in trade fairs in order to test markets for their products and to determine market trends and requirements of each consumer group.
� Testing facilities for both raw materials and finished products of
certain categories viz. metals, textiles, furniture, ceramics, etc., to ensure that they are of required quality and standards.
328
Confidential To Export Promotion Council for Handicrafts © 2005 Frost & Sullivan
� Product & packaging and design development support for handicraft products.
� Export promotion support for handicraft products by helping the
SME’s participate in the exhibition organized by the SUPPORT foundation at Bang Sai once a year during February and organizing an annual handicraft gift fair in December.
c) In fact the Government has set up Bureau of Cottage and Handicraft
Industries Development under the DIP, who plays the key role in the development of handicraft production in Thailand. The Handicrafts Division per se is responsible for promoting and developing Thai handicraft products with major support activities which cover research into current situation of Thai handicrafts in terms of production and market, information service, advisory service in production and product design development, products promotion, etc.
d) In addition to the support to the SME’s engaged in manufacture of craft
and decorative products, the Government is also supporting the core handicraft sector at the grass root levels through the OTOP program which provides a full cycle of assistance ranging from assigning professionals to improve product designs, making them more attuned to international tastes and requirements, to providing skills and management training, to helping in actual exports and promotion activities.
e) The Royal Thai Government also supports the handicraft sector by
encouraging and enabling the establishment of large co-operatives like Bangkok Community Handicraft Promotion Centre (BCHPC) which improve production capacities and marketing and bargaining/ negotiating strength as well as a joint venture between the Royal Thai Government and the private sector viz. Narayana Phand which has become a large manufacturing and handicraft exporting organization.
f) Other local associations that aid the sector are Northern Handicrafts
Manufacturers and Exporters Association (NOHMEX), Australian-based Pedersen Group which has even established a Thai Culture Center of Excellence to create an export center for Thai handicrafts and ThaiCraft which is a registered non-profit association working with groups of village artisans and help economically poor artisans to achieve self-reliance by providing them with guided training and experience in marketing as well as preserving and promoting their traditional craft skills.
329
Confidential To Export Promotion Council for Handicrafts © 2005 Frost & Sullivan
g) Other important organizations are the Japanese External Trade Organization (JETRO) which has been supporting the Thai handicraft sector by providing export promotion support by showcasing Thai OTOP and other Handicraft products in exhibitions in the country especially in Tokyo. In addition the Japanese Foreign Trade Promotion Office is supporting the Thai handicraft sector especially the handicraft merchandisers in Chiang Mai, Thailand under the Koto Project where in the Chiang Mai entrepreneurs of Sa paper, silk, carved wood and ceramics products, from both small and medium enterprises and OTOP (One Tambon One Product) projects will be trained in useful new techniques on product design and administration from Japan. They will be given; full design and technology support to manufacture handicraft products with modern design and patterns desirable to the Japanese market so that the same will then be imported into Japan.
h) Lastly the Thai government also indirectly provides financial support by
proving soft loans. In fact Exporters' Loan can be taken in cooperation with Thai Toy Industry Association, Thai Gifts and Premiums Association, Thai Housewares Trade Association, Northern Handicrafts Manufacturers and Exporters Association, and Design & Objects Association. Packing credit of up to 3 million baht per borrower is provided, as well as fast loan of up to 1 million baht per borrower for participation in trade exhibitions and sale activities in foreign markets. The scheme was started in August 2003.
5.4.4.7 Market Development & export trade promotion efforts
a) Thailand exports of craft and decorative products in the medium and low-end segments had been declining due to the increased promotion and competition from other Asian countries especially China, Indonesia and Vietnam. To counter their adverse effects, the Thailand Government through bodies like DEP and DIP has been engaging in a variety of market development and export promotion efforts.
b) The Department of Export Promotion (DEP) in Thailand is aggressively
helping in the market development efforts of crafts exporters by organizing events like the Bangkok International Gift and Houseware (BIG) exhibition to promote Thai-made crafts as new, innovate, cost-effective alternatives to products of dominant exporting nations like China & India.
c) In fact the Department of Industrial Promotion (DIP) through the
medium of the Bureau of Cottage and Handicraft Industries
330
Confidential To Export Promotion Council for Handicrafts © 2005 Frost & Sullivan
Development works together with manufacturers for design and quality development and then leads such Thai manufacturers of handicraft products to participate in many international exhibitions where in the DIP is responsible for all expenses in bringing Thai manufacturers to test markets excluding only personal air ticket.
d) Another mode being used for market development is economic and
business level agreements with importing countries like Japan, US and Germany where in deals are signed for design and technology support for manufacturing crafts products as per the requirements of the target market and the same products are then to be imported by the target market as was done in case Japan.
e) Simultaneously, the growing importance of brands has led the trade
promotion bodies in Thailand to work towards developing a strong brand for Thailand crafts products itself. This includes propagations to promote the quality of the products as done through the OTOP program where in the handicraft products having the OTOP label are promoted as being of extremely high quality so as to slowly create a strong OTOP brand that is associated with high quality handicrafts products.
f) This is expected to be achieved by constantly displaying such selected
OTOP products at trade fairs in Thailand and overseas, as well as participating in in-store promotions and Thailand Exhibitions in other countries including Houston (USA), and Sharjah (UAE).
g) In fact the Export Promotion Department, Tourism Authority of
Thailand and the Board of Investment are working collectively in locating appropriate places to display goods from the OTOP so that they even become more popular among foreigners visiting the country itself.
h) Currently the Thailand government is displaying OTOP products in
trade fairs such as BIFF, BIG, Thai fex & Thai mex , HBS etc. i) Additionally the DEP has also set-up showrooms in important target
markets like Houston (USA) and in Hong Kong to showcase and sell Thai crafts products. And has entered into agreements with various other galleries and large department stores in the target countries to showcase and/or sell Thai crafts products.
j) Other market development efforts include using various new promotion
mediums like internet and websites for promoting Thai Handicraft
331
Confidential To Export Promotion Council for Handicrafts © 2005 Frost & Sullivan
products including a special service of Free Web Hosting for handicraft entrepreneurs, where in at no costs, the entrepreneurs can request for their business homepage to appear on the DIP website.
k) In fact the Thai Government has even established the
www.thaitambon.com website as a non-profit venture to assist in creating a comprehensive database of Thai villages and also to market Thai village products through the Internet.
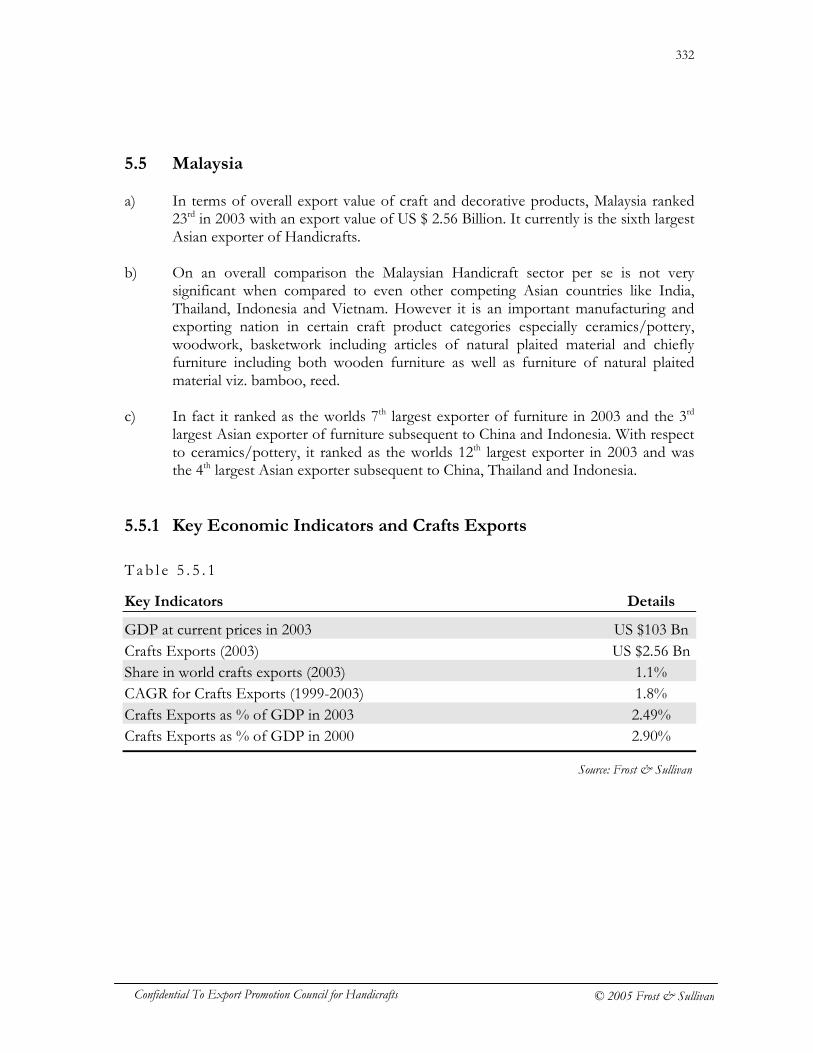
332
Confidential To Export Promotion Council for Handicrafts © 2005 Frost & Sullivan
5.5 Malaysia a) In terms of overall export value of craft and decorative products, Malaysia ranked
23rd in 2003 with an export value of US $ 2.56 Billion. It currently is the sixth largest Asian exporter of Handicrafts.
b) On an overall comparison the Malaysian Handicraft sector per se is not very
significant when compared to even other competing Asian countries like India, Thailand, Indonesia and Vietnam. However it is an important manufacturing and exporting nation in certain craft product categories especially ceramics/pottery, woodwork, basketwork including articles of natural plaited material and chiefly furniture including both wooden furniture as well as furniture of natural plaited material viz. bamboo, reed.
c) In fact it ranked as the worlds 7th largest exporter of furniture in 2003 and the 3rd
largest Asian exporter of furniture subsequent to China and Indonesia. With respect to ceramics/pottery, it ranked as the worlds 12th largest exporter in 2003 and was the 4th largest Asian exporter subsequent to China, Thailand and Indonesia.
5.5.1 Key Economic Indicators and Crafts Exports
Tab l e 5 . 5 . 1
Key Indicators Details
GDP at current prices in 2003 US $103 Bn Crafts Exports (2003) US $2.56 Bn Share in world crafts exports (2003) 1.1% CAGR for Crafts Exports (1999-2003) 1.8% Crafts Exports as % of GDP in 2003 2.49% Crafts Exports as % of GDP in 2000 2.90%
Source: Frost & Sullivan
333
Confidential To Export Promotion Council for Handicrafts © 2005 Frost & Sullivan
5.5.2 Overview of Crafts Sector 5.5.2.1 Sector Background
a) Till the late 1960s the traditional handicraft sector in Malaysia was a
totally unorganized and unrecognized industry that was relegated to the “backyard” of Malaysia’s economy. This was in spite of the fact that an estimated 0.3 Million Malaysians, mostly rural folk, had ventured full-time into handicraft-making to earn a living. The sector consisted of only household production units.
b) Artisans were scattered over different areas and the only market for their
products was the local bazaar. The products made included mostly textile based crafts like batik making, songket and other clothes woven by typical Malaysian methods like the Pua Kumbu, unglazed pottery making as well as ceramic making, woodcarving and carved wooden furniture making, furniture making of rattan, bamboo and reed, and making decorative metal articles of silver and pewter. In addition there were other typical ethnic products like the Wayang Kulit leather puppets etc.
c) However, the establishment of the Malaysian Handicraft Development
Corporation (MHDC) in 1979 led to promotion of the traditional skills and helped the handicrafts sector to expand and become commercially viable. In fact it helped organize the sector through training potential handicraft-makers, setting up small factories them, providing raw materials, and collecting and marketing the finished products through Karyaneka which is the Government handicraft marketing company.
d) Actually between 1980 and 1995 both Karyaneka and the MHDC under
the National and Rural Development Ministry spent nearly 13 million Ringgit (US$7.3million) to beef up the countries handicraft industry. They encouraged and helped setting up small and medium sized firms in the sector and spent another 14 million Ringgit (US$7.9 million) to purchase machines for government-assisted handicraft workshops through the Ministry’s cottage industry division.
e) They also tried to improve the export demand for Malaysian handicrafts
which was till then solely dependent on local demand and demand by tourists. Efforts to create export demand saw the setting up at least 60 handicraft making workshops through out the country to improve product quality without compromising on style or craftsmanship. In addition aggressive promotion and market development measures were
334
Confidential To Export Promotion Council for Handicrafts © 2005 Frost & Sullivan
also started to woo new buyers not only in big markets like the United States, Japan, and Europe, but also smaller consumer markets such as the Pacific islands.
f) As a result of the Government support, and the Malaysian handicraft
exports of and wooden, ceramics, art metalware and especially textile crafts like batik increased as many small manufacturers were able to meet the demand and challenges posed in the international market by producing new and innovative products. For example Batik techniques and designs were used on a variety of new types of fabrics such as superfine cotton, jersey, velvet and silk. New designs, colours and product presentation ideas were also introduced.
g) Such adaptation by producers to the fashion trends and demands for
“ethnic” product led to the export of products to Australia, UK and Europe in the late 1970’s and the 1980’s.
h) However, the economic downturn in 1987, adversely affected the sector
especially the textile based crafts due to reduced local demand. More over the increased competition from neighboring countries such as Indonesia and Thailand negatively impacted exports. Such factors caused the sector especially the textile crafts sector to decline.
i) The continued effort by MHDC since 1990 to revitalize the sector has
helped arrest decline. However the over all sector is still not completely competitive and has reduced export orientation.
j) But certain sub-sectors especially ceramics, woodwork and most
importantly wooden furniture have not only sustained adversities but also have emerged as significant export oriented sectors.
5.5.2.2 Current Profile
a) The handicraft and related craft and decorative products sector in
Malaysia today is a significant contributor to the Malaysian economy in terms of employment, export earning capacity as well the upholder of Malaysian culture for the tourism oriented country. In fact wooden as well as bamboo and rattan furniture making has emerged as a major export earner and is one of the targeted industries in the sector for further development and support.
b) The sector currently comprises of almost 85% to 90% family owned
craft producing units having less then 10 artisans, 7% to 10% small sized
335
Confidential To Export Promotion Council for Handicrafts © 2005 Frost & Sullivan
manufacturing units, 2% to 4% medium sized manufacturing units and less than 1% of large units. More over the large units are mostly joint ventures in product categories like furniture and ceramics.
c) Majority of the producing units are concentrated around states like
Terengganu, Sabah, Perak, Kelantan, Kedah, Pahang, Sarawak, N.Sembilan, Selangor and Johor with the furniture making industry in Malaysia being mainly having developed around the state of Johor, followed by Selangor, Perak, and Kedah.
d) The development of the sector comes under the purview of the Malaysian Handicraft Development Corporation (MHDC) which has divided the sector under broad categories like Forest-based (including mainly wood carved and worked decoratives and functional products including basketwork, and small furniture of rattan, bamboo and reed), Textile-based (batik, songket, silk, and other textile based crafts including embroidered, knitted and crocheted clothing and furnishings and small decoratives like artificial cloth flowers etc), Ceramics (including glassed ceramics, glassware and unglazed pottery), Metal-based(silverware, brassware and pewter) and other Ethnic-oriented products.
e) Though the sector has the complete support of the government and
aggressive export promotion support from MHDC, factors discussed under sector background, like reduced number of enterprises and labor problems coupled with competition from Thailand, Indonesia and Vietnam has resulted in the sector not being competitive on an overall basis.
f) Currently, viewed from the perspective of sector competitiveness only
sub-sectors like ceramics, woodwork and especially wooden, rattan and bamboo furniture making are important due to inherent sector strengths like stable industry set-up, abundant labor, raw materials and established export demand and markets.
g) The other sectors especially textile-based crafts sector are sustaining
based on local demand and tourist demand due to increase in the arrival of foreign tourists in Malaysia who are spending increasing amounts on Malaysian handicrafts with the purchasing pattern favoring textile products (39%), followed by forest-based products (32%), ceramics (14.5%), metal- based products (12%) and ethnic products (2.5%).
h) In fact even for the overall handicraft sector per se excluding furniture
manufacturing, the domestic and tourist demand accounts for 80% sales with exports accounting for only 20%.
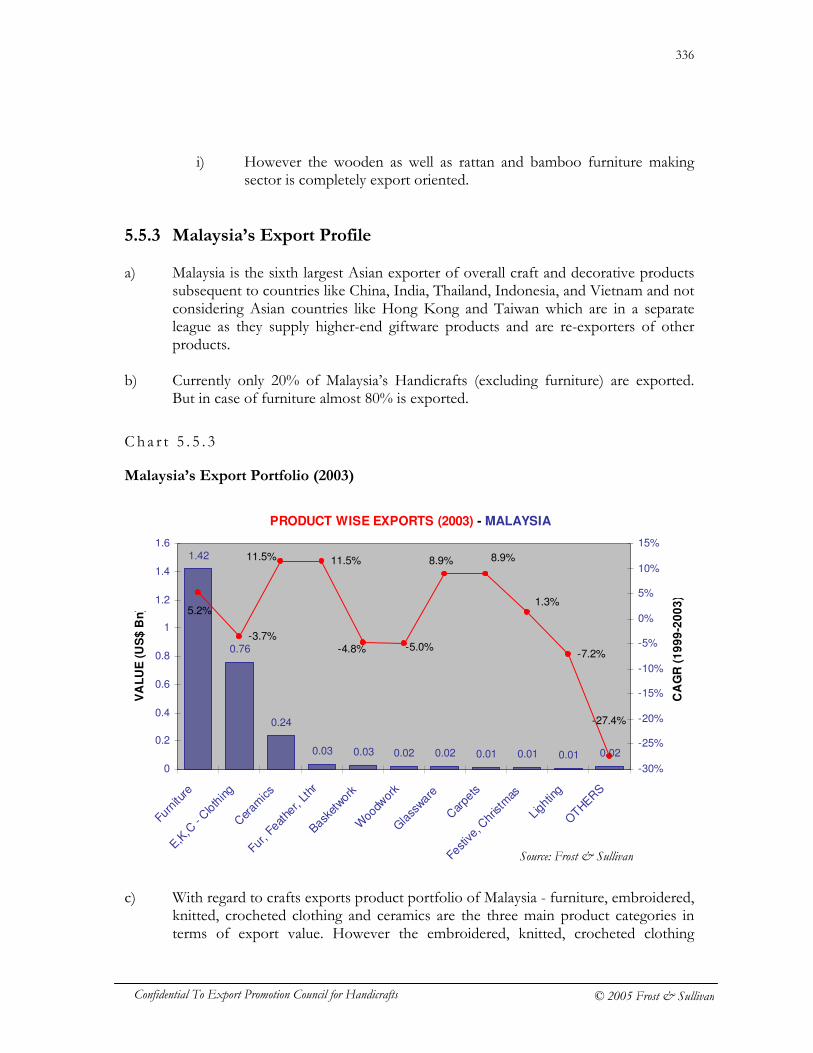
336
Confidential To Export Promotion Council for Handicrafts © 2005 Frost & Sullivan
i) However the wooden as well as rattan and bamboo furniture making sector is completely export oriented.
5.5.3 Malaysia’s Export Profile a) Malaysia is the sixth largest Asian exporter of overall craft and decorative products
subsequent to countries like China, India, Thailand, Indonesia, and Vietnam and not considering Asian countries like Hong Kong and Taiwan which are in a separate league as they supply higher-end giftware products and are re-exporters of other products.
b) Currently only 20% of Malaysia’s Handicrafts (excluding furniture) are exported. But in case of furniture almost 80% is exported.
Ch a r t 5 . 5 . 3
Malaysia’s Export Portfolio (2003)
c) With regard to crafts exports product portfolio of Malaysia - furniture, embroidered,
knitted, crocheted clothing and ceramics are the three main product categories in terms of export value. However the embroidered, knitted, crocheted clothing
PRODUCT WISE EXPORTS (2003) - MALAYSIA
1.42
0.76
0.24
0.03 0.03 0.02 0.02 0.01 0.01 0.01 0.02
-3.7%
11.5%
-7.2%
11.5%
5.2%
-27.4%
1.3%
8.9%8.9%
-4.8% -5.0%
0
0.2
0.4
0.6
0.8
1
1.2
1.4
1.6
Furn
iture
E,K,C
- Cloth
ing
Cer
amics
Fur, F
eathe
r, Lt
hr
Basket
work
Woo
dwor
k
Gla
ssware
Car
pets
Festive, C
hrist
mas
Ligh
ting
OTHER
S
VA
LU
E (
US
$ B
n)
-30%
-25%
-20%
-15%
-10%
-5%
0%
5%
10%
15%
CA
GR
(1
99
9-2
00
3)
Source: Frost & Sullivan
337
Confidential To Export Promotion Council for Handicrafts © 2005 Frost & Sullivan
product segment has been showing continued decline in exports with the export growth rate in 2003 declining by 11.8%. The reason for this is attributed to the increasing competition from Thailand, Indonesia and Vietnam.
d) The other important product categories considering export values are leather goods,
basketwork, woodwork and glassware. Of these leather goods and glassware are the only two product categories that have shown consistent increase in exports with exports increasing in by 30.6% and 12.7% respectively in 2003.
e) With regard to basketwork/other items of natural plaited material and woodwork
which are the other two important product categories forming part of the traditional handicraft sector
1. Woodwork products have shown improvement in exports post 2002 due
to increased promotion by MHDC. In fact in 2003 the exports of woodwork products increased by 2.6% in 2003 in spite of cut-throat competition from Thailand and Vietnam.
2. But the product category of basketwork/other items of natural plaited
material continue to decline in spite of increased promotional support due to the competition from Thailand and Vietnam.
f) The other product categories apart from Furniture, Embroidered, knitted,
crocheted-clothing, Ceramics, Leather, Basketwork, Woodwork and Glassware though are showing increased exports post 2002, are not significant in terms of export value as well as sector capabilities in case of those products.
5.5.4 Profile of Malaysia’s Crafts Sector, Its Structure and
Characteristics 5.5.4.1 Industry Profile and Competency
a) As discussed under the section Current profile, the traditional crafts sector in Malaysia mainly includes approximately 4000 manufacturing units including the approximately 2000 furniture manufacturing units. These estimates are based on actual product sector wise data obtained from the Department of statistics, Malaysia.
b) The industry is mostly comprised of household/ family-owned units &
small and medium manufacturing firms. The household sector accounts for 85% to 90% family owned craft producing units having less then 10 artisans. The small sized manufacturing units account for 7% to 10% of
338
Confidential To Export Promotion Council for Handicrafts © 2005 Frost & Sullivan
the sector, medium sized manufacturing units account for 2% to 4% and large units account for less than 1% of sector. More over the large units are mostly joint ventures and units having FDI in product categories like furniture and ceramics.
c) With respect to availability of raw materials which is important factor
determining sector capability and impacting competitiveness, Malaysia has been fortunate to be endowed with plenty of raw materials from its forests especially wood. In fact raw materials for Malaysia's wood-based industry are obtained from natural forests, rubber plantations and forest plantations. The country's supply of logs is expected to stabilize at 18 million cubic meters per annum, with the government's implementation of the International Tropical Timber Organization’s (ITTO) objective of sustainable forest management.
d) Thus excluding textile based crafts almost 90% to 95% of the crafts
products are produced using domestic raw material. However for producing textile based crafts like batik, majority of the raw material (cotton, rayon, silk, organza, wax and dye) is imported. This has been one of the factors that have negatively impacted the textile-based crafts sector.
e) In terms of availability of skilled labor, the Malaysian crafts sector till the
late 1980s employed approximately 0.3 million artisans with the majority being involved in textile-based crafts sector. However the declining domestic consumption and exports being limited due to stagnant and niche markets being available for especially the textile based crafts, has resulted in the Malaysian handicraft sector (including furniture making) comprising only 0.2 million laborers with majority being employed in the export oriented furniture, woodwork and ceramics sectors. The average monthly wage is in the range of RM 1500 to RM 2000.
f) With regard to technology, except for the Malaysian furniture industry,
the remaining crafts industries use simple & labor intensive methods of production. However the significant product segments especially ceramics/pottery and woodwork and furniture making industry are increasingly using modern technology like metal mould with hydraulic pressure for pottery making. Computerized 2D and 3D engraving machines, two spindle pantographs; log turning machines, modern wood kilns, mobile and permanent warmer apparatus and hydraulic clamping etc are used for improving the quality of woodwork products. Even the batik industry per se is trying to compete with the machine-made cheap screen printed batik replicas from countries like Indonesia by using a batik tjanting system known as Integrated Computer Aided Tjanting
339
Confidential To Export Promotion Council for Handicrafts © 2005 Frost & Sullivan
System (ICATS M1.0-1) developed by SIRIM (Standards and Industrial Research Institute of Malaysia) which utilizes the state-of -the-art-computer aided design and computer aided manufacturing (CAD/CAM) technology which was specially developed to improve the speed of the tjanting process in batik making.
g) However as majority of the craft manufacturers in Malaysia are small &
medium scale firms employing less than 50 employees, they aren’t in a position to use higher technology mentioned above. These factors also result in most firms not being able to enjoy any substantial economies of scale.
5.5.4.2 Product variety and quality
a) With respect to the product variety offered by Malaysia, interaction with Malaysian craft manufacturers and exporters has established that since the Malaysian handicraft sector is relatively much smaller and does not include a vast variety of product types, the country manufacturers/ exporters are capable of supplying only few product types and product varieties as compared to countries like India, Thailand, Indonesia and Vietnam which have large and diversified handicraft sectors covering variety of product categories and product types. The same has been confirmed during interaction with prominent importers and associations in target markets.
b) However from 2003 onwards, the increased exposure to international
trade fairs and target market requirement information being given by MHDC has resulted in increase in supply of products meeting international design requirements especially in product categories like metalware, ceramics and woodwork. Even designs of batik & other textile crafts are increasingly trying to cater to international demand in terms of product styling and design.
c) Even in terms of product volumes, since majority of the craft sector
firms are family-owned and small and medium sized firms, they are not capable of supplying large volumes directly to the importers.
d) In terms of quality of craftsmanship, the Malaysian products are highly
rated but this does not translate to quality in terms of products meeting the generally accepted international product standards especially in case of functional articles. Even interaction with importers and associations in target markets has endorsed Frost & Sullivan’s opinion that
340
Confidential To Export Promotion Council for Handicrafts © 2005 Frost & Sullivan
compared to other competing countries the overall quality of Malaysian handicrafts is not very high.
e) However Malaysian made wooden furniture meets international quality
standards due to the overall development of the wood based industry and improving production methods due to joint ventures and OEM/ contract manufacturing in the sector.
f) But, post 2002 however the Malaysian crafts sector is trying to build up
a reputation as manufacturers and suppliers of high quality crafts products. This is being made possible by the Malaysian Handicraft Development Corporation (which comes under the Ministry of Entrepreneur Development and is responsible for promoting the development of the national crafts industry), by ensuring strict quality control of exported crafts products. This is being achieved by ensuring that an increased number of crafts to be exported meet certain ISO standards. These quality checks are done by institutes like SIRIM which is one of the leading training and quality certification body in the country.
5.5.4.3 Logistics & Infrastructure
a) The fact that Malaysia has been developed as a tourist destination has helped in the rapid development of basic infrastructure like transport. More over the fact that the handicraft industry and handmade products are considered an important extension of the cultural heritage of the country, the important handicraft manufacturing states like Terengganu, Sabah, Perak, Kelantan, Kedah, Pahang, Sarawak, N.Sembilan, Selangor and Johor have been well linked with good basic infrastructure as they are gaining importance from visiting tourists who visit these places due to their cultural heritage.
b) In fact the furniture making industry in Malaysia has mainly developed
around the state of Johor, followed by Selangor, Perak, and Kedah and the proximity of these areas to the supply sources, export exit points, access to labors, and the availability of good infrastructure, supporting industries, and facilities has helped the furniture industry in Malaysia to become the 7th largest in the world.
c) Thus inbound and outbound logistic infrastructure within the country is
not a major hindrance. In fact to further develop the export potential of important sub-sectors like ceramics and especially the wood based furniture making industry, the governments plan of developing the
341
Confidential To Export Promotion Council for Handicrafts © 2005 Frost & Sullivan
industry as a whole value chain ranging from forest cultivation, development of related and supporting industry, and design development has led to these sectors having a strong infrastructure in place resulting in increased export competitiveness and exports.
d) More over the inland & international transport for most household &
small scale manufacturing firms in the crafts sector is taken care off by the MHDC which arranges for distribution and exports through the government owned marketing company called Karyaneka.
e) In fact the main distribution channel for most household and small scale
crafts manufacturers is through the governments marketing company called Karyaneka. Other private marketing companies export products to importers/ buying association/ department chains etc.
f) However for the majority of the crafts exporters the main distribution
channel is via Agents as they have their own warehouses in target markets. Also distributors & agencies are a part of the distribution channel used. In fact Large metal ware companies like Royal Selangor and Temasek Pewter have their own showrooms & in places where there do not have their own showrooms they try to operate through exclusive distributorships.
g) Lastly in terms of setting up of domestic and international showrooms
and warehouses, the MHDC has been very active. In fact it has already set up many workshops cum showrooms on a nationwide basis including in Pahang and Terengganu & especially showrooms in important tourist centers viz. JL. Conlay in Kuala Lumpur.
h) In fact Karyaneka has a major handicraft marketing centre set-up in the
Malaysian federal capital of Kuala Lumpur. It is designed to look like a traditional village. And has 14 huts on slits one for each village of the Malaysian states. Each state runs its own outlet and is responsible for selling its indigenous handicrafts.
i) In respect of the warehouses, the exporters use warehouses belonging to
their agents in importing countries.
5.5.4.4 Government Policy & Regulatory Environment a) The national policy towards development of Malaysian crafts sector is to
develop the sector from within before increasing its exposure to foreign investment. As part of this plan, efforts are being made to develop the
342
Confidential To Export Promotion Council for Handicrafts © 2005 Frost & Sullivan
crafts industry through training and increasing the quality of exported crafts. In fact for textile based crafts like batik manufacturing, ceramics & for furniture manufacturing, the plan entails developing the industry in the whole as a value chain ranging from sourcing raw material, development of related and supporting industry, tariff reduction, labor skill development, design development to encouraging entrepreneurs to upgrade their business from Original Equipment Manufacturing (OEM) to Original Design Manufacturing (ODM) and Original Brand Manufacturing (OBM) in order to add value to the whole industry.
b) Moreover under the Malaysian handicrafts act, the government gives
funds on a yearly basis for developing R&D, marketing and other essential services, promotion of domestic as well as international exposure. Skill training is undertaken by the various training institutes like the National Craft institute and other 19 training institutes. Conservation and preservation is also what the govt. is looking at for the handicrafts sector. They plan to activate the dying craft by allowing the old master craftsmen, who are old and dying, to teach the younger generation.
c) With regard to taxation and related policy, exporters are entitled to
double tax deduction for expenses incurred at various promotional shows. Tax exemption is granted on taking part in trade fairs and exhibitions. That is the income from fairs is not taxed. The Malaysian government also assists handicraft producers by giving tax and duty exemptions on imports of raw materials for handicrafts. For example, the import duty (20%) and the sales tax (10%) are not levied on white cloth for the batik industry. However the Government does not provide export incentives for the industry but provides support and funding for product promotion overseas through government agencies. The applicable sales tax rate is 10% presently.
d) Malaysia has also entered into bilateral agreements with Thailand,
Indonesia and Japan on technical support services for the crafts sector.
5.5.4.5 Policy towards FIE’s, joint ventures, OEM developments in craft sector
a) The Malaysian Government plans to slowly increase the exposure of the
crafts sector to foreign investment but only after ensuring that the handicraft industry is strong to hold out its own against foreign firms. Even in terms of OEM/ contract manufacturing in case of giftware,
343
Confidential To Export Promotion Council for Handicrafts © 2005 Frost & Sullivan
ceramics and mainly furniture, the government is encouraging & aiding the manufacturers to develop their own brands & to move from OEM to ODM to OBM.
5.5.4.6 Government & NGOs support to the Sector
b) The government provides a lot of support to develop the crafts sector & increase its export competitiveness. Though it does not provide direct financing to handicraft producers, it provides extension services such as giving them advice on how to go about promoting handicrafts the world over, holding talks , seminars , exhibitions and inviting producers “(local and private individuals ) for a dialogue with the government to suggest means like tax reductions etc.
c) The government has set up MHDC and through it provides
� Product Design Assistance and services - .i.e. MHDC provides
consultancy service in product development to craft entrepreneurs on a cost sharing basis. The consultancy costs are borne by MHDC whilst the entrepreneur is responsible for other related costs. The service is offered on a project basis. The entrepreneur can apply for such a service through the Research and Development Division.
� Craft development through Production Incubator Center – i.e.
MHDC provides production work space on rental basis to craft entrepreneurs at nine Craft Development Centers. Besides the usage of common facilities such as machinery and equipment, participants are given support services in product development and promotion as well as entrepreneurial courses.
� Imparting of Craft Skills & Academic Training, where in training
courses are offered for a three year period at the Institut Kraf Negara (The National Craft Institute).
� Technical Skill & Management Training is also provided to craft
entrepreneurs in the fields of design, skill, technology, production, management.
� Additionally the MHDC also holds Regional Crafts Improvement
workshops from time to time.
344
Confidential To Export Promotion Council for Handicrafts © 2005 Frost & Sullivan
d) Additionally through MATRADE the government organizes seminars and workshops to nurture and update craft exporters on trade developments and business opportunities in international markets. The seminars and workshops are focused on topics such as: � Export opportunities in new and emerging markets � Understanding the Overseas Distribution Systems � E-Commerce in international business � Enhancing product image through branding, packaging and
labeling as well as visual merchandising � Technical requirements such as CE Mark and FDA Food Import
Regulations � Effective participation in international trade fairs
e) The government also provides a lot of promotional support to the crafts
sector by actually helping the exporters to promote their products through various domestic and international trade fairs and exhibitions.
f) With respect to NGO support, apart from some Fair Trade
organizations, there is not much NGO support to the Malaysian handicraft sector.
5.5.4.7 Market Development & export trade promotion efforts
a) The Malaysian government through the MHDC has taken a lot of initiative & implemented various measures to help the Malaysian craft exporters in their efforts towards market development. The measures mainly relate to trade promotion incentives & schemes as covered under
� The government promotes product of all companies (especially
small companies who do not have enough available funds) at trade fairs and exhibitions like Tokyo Gift Show, Hong Kong Gift Fair, Frankfurt Gift Fair, Spring Fair, and Birmingham, UK.
� More over handicraft entrepreneurs are encouraged to participate in
trade fairs on a cost-sharing basis. Where in the MHDC covers the cost of hiring exhibition space, equipment and one-way transport and insurance costs and the craft entrepreneur is expected to cover all other costs.
345
Confidential To Export Promotion Council for Handicrafts © 2005 Frost & Sullivan
� Even the Ministry of International Trade and Industries (MITI) encourages handicraft producers to participate in major trade events overseas such as the Frankfurt International Gift Fair and the California Gift Show, and at events which promote Malaysian products overseas. In fact with the establishment of the Malaysian External Trade Development Corporation (MATRADE) under the aegis of the Ministry of International Trade and Industry, more opportunities for craft entrepreneurs are available to promote their products through trade missions and international trade fairs overseas. Events such as the Malaysian Products Exhibition held in the United Arab Emirates, Europe, South Africa, USA and other regions, are used for facilitating "face-to-face" meetings with importers and in obtaining direct feedback from potential buyers/customers.
� Other trade fairs in which Malaysian products are promoted
include: � Hong Kong Gifts & Premium Fair � Singapore Gifts & Premium Show � Ethnic Furniture, Fabric & Decorative Arts Exhibition
(EFFDA), London � NEC Birmingham Gift Show, London
� In fact efforts are also made to improve the exposure of Malaysian
crafts via foreign tourists by holding exhibitions from time to time in important tourist centers within the country. In case of such domestic promotion schemes, MHDC supports 80% of the costs of renting the exhibition space.
� Realizing the growing importance of internet based promotion &
marketing, MHDC has is also tapping this mode of promotion by setting-up E-Commerce Service where-in craft entrepreneurs are invited to advertise their products in MHDC’s website by contacting the Trade Promoting Division.
� The MHDC is also trying to promote the high quality Malaysian
crafts products through various campaigns & trade propagations. This is accomplished by MHDC by firstly helping crafts manufacturers in ensuring high degree of product quality by enabling the craft exporters in obtaining Licensing Services and secondly developing campaigns to propagate the product and its quality like the national campaign to promote the theme, Malaysia Batik: Crafted for the World, initiated in 2003 by the Yayasan Budi Penyayang
346
Confidential To Export Promotion Council for Handicrafts © 2005 Frost & Sullivan
Malaysia (PENYAYANG) with the enthusiastic support of the private sector and the then newly-established Batik Guild.
� In fact taking the example of the impressive export performance of
the Thailand handicraft industry under the OTOP product program, former Prime Minister Tun Dr Mahathir Mohamad, initiated the “one village, one product” program in Malaysia whereby talented craftsmen would be given education, training and exposure on the global handicraft market. The program is currently supported by the Ministry of Rural Development, which identifies deserving candidates and provides funding for a program to raise the quality and profile of Malaysian handicraft. The Federal Land Consolidation and Rehabilitation Agency, now known as Felcra Bhd, markets the products.
� In fact the program also registers the growing importance of adding
value to traditional craft products and projecting a modern face for traditional Malaysian crafts by updating the designs with value-added features to cater to current international tastes and to attract the up market buyers.
� This is achieved by Felcra officials who go out and meet the
individual craftsmen and to help them improve their skills by showing them pictures of the latest handicraft found overseas. They then also source modern raw materials for the craftsmen and give them new tools and equipment to produce more innovative designs. One example of this is the beaded cushion, which incorporates the famous Sarawakian beadwork.
� Through this process Malaysia hopes to carve out attractive and
suitable niche markets for its products in the highly competitive global market for craft and decorative products which is increasingly being dominated by modern, stylized target market adapted craft and decorative products products.
� More over new methods are being using to promote and sell such
modernized craft products like setting up of special stores like Desa in Kula Lumpur which are up market stores which come up with refreshing ways to display traditional handicraft and thus create a impressive and modernized profile of the country’s crafts to especially the visiting tourists and importers.
� Many of these modernized and value added crafts products are sold
along with video clips that showcase how the products are made and
347
Confidential To Export Promotion Council for Handicrafts © 2005 Frost & Sullivan
pamphlets about the artisans who created it. Thus Malaysian exporters are resorting to novel promotion methods to entice consumers.
� Other modes of market development include helping the craft
entrepreneurs who wish to export products to obtain the certificate of authentication for their craft products from MHDC and assisting them in meeting required quality standards for expanding exports to many other countries.
348
Confidential To Export Promotion Council for Handicrafts © 2005 Frost & Sullivan
5.6 Vietnam a) Vietnam’s share in world craft and decorative products exports was 1.1% in 2003
with the country ranking 21st in terms of export value which was US $ 2.58 Billion in 2003.
b) Though the country currently is a much smaller player in the larger craft and
decorative products market, it is fast emerging as one of the most competitive exporters due its strong and diversified handicraft sector, abundant and skilled labor, and availability of ample raw material.
c) In fact the inherent strength’s of the sector in addition to the fact that it is one of
the lowest cost producers has attracted a lot of FDI in the traditional crafts sector in Vietnam.
d) All these factors have led to rapid increase in Vietnam’s export competitiveness
resulting in Vietnams total craft and decorative products exports showing a CARG of nearly 34% in the period from 1999-2003 with its exports in 2003 increasing by a remarkable 67.8%. Even its world market share has increased from 0.4% in 1999 to a substantial 1.1% in 2003, considering that established Asian crafts supplying nations like Thailand, Indonesia and India also do not hold a market share greater than 3%.
5.6.1 Key Economic Indicators and Crafts Exports
Tab l e 5 . 6 . 1
Key Indicators Details
GDP at current prices in 2003 US $39.15 Bn Crafts Exports (2003) US $2.58 Bn Share in world crafts exports (2003) 1.1% CAGR for Crafts Exports (1999-2003) 34% Crafts Exports as % of GDP in 2003 6.61% Crafts Exports as % of GDP in 2000 3.18%
Source: Frost & Sullivan
349
Confidential To Export Promotion Council for Handicrafts © 2005 Frost & Sullivan
5.6.2 Overview of Crafts Sector 5.6.2.1 Sector Background
a) The Vietnamese handicraft sector has a long history and is an indispensable part of the nation's cultural identity. In fact the handicraft industry is spread across the entire country with each of the seven main regions having a least one craft village specializing in the production of one or more handicraft product categories.
b) As a result the Vietnamese handicraft industry has always been one of
the most diversified with there being a large variety of traditional craft products including Mat Weaving, Silk, Brocade, Traditional Paper, Inlay, Encrusted Products, Bamboo and Rattan, Bronze Shaping, Ceramic and Pottery, Leaf Hat Products, Drum Products, Embroidery, Lacquer Wares, Folk Pictures and many other ethnic craft products.
c) In fact handicraft production has been a major source of employment
and income generation for the largely rural and agrarian country with even the farmers being involved in handicraft production on part-time basis to supplement incomes and full time in between harvests.
d) The sector has always been export oriented with production for export
purpose in the sector having continued to increase from the early 1970s. In fact till 1990s it enjoyed substantial exports especially of rattan and textile products to mainly Russia, Europe and also some Asian countries. However in the period from 1990-1997, the collapse of Eastern European and USSR markets led to continuous decline in crafts exports and therefore production.
e) But the opening of the economy for foreign direct investment in 1998
finally revived the sector due to increasing FDI in the sector which improved its export competitiveness. As a result of the increasing FDI in the sector as well the government and NGO support, the sector has been able to stabilize and strengthen itself and as a result exports have increased.
f) In fact the year 2000 marked a strong recovery of Vietnam's handicraft
exports with even the number of markets for its handicrafts exports increasing from 50 in 1998 to the 133 in 2002. In fact Vietnamese exports of craft and decorative products have continued to increase at more than 40% excluding 2001 during which the world imports itself had decreased due to the global downturn.
350
Confidential To Export Promotion Council for Handicrafts © 2005 Frost & Sullivan
5.6.2.2 Current Profile a) Vietnam today has one of the most strong and diversified craft sector
with the current production including a variety of craft and decorative products from (A) typical artisan crafts like textiles, baskets etc produced using traditional technology and techniques inherited from generation to generation among ethnic minorities (B) to modernized craft and decorative products made using a mix of traditional techniques and sophisticated technology/techniques/skills and produced according to the buyer's taste.
b) The sector is completely export oriented with exports of traditional
handicrafts excluding furniture contributing to almost 3% of the countries exports and handicraft and fine-art product exports being ranked among the ten largest key products in terms of value of export following crude oil, garments, Footwear, Seafood, Rice, Coffee, Electronics & computers. In fact almost 85% of the craft and decorative products manufactured in Vietnam are for export purpose.
c) Though the traditional crafts include a large variety of products the 11
most significant product categories that enjoy domestic and international demand and are mapped under the crafts survey of Vietnam include rush weaving, bamboo and rattan, lacquer ware, ceramics, embroidery, weaving/textiles, wood carving, stone carving, paper and paper based crafts, woodblock printing and metalwork. Of these products the five strong product categories with respect to exports are - fine art ceramics & pottery, rattan & bamboo products, embroideries/ brocade, fine art wooden products and its lacquer ware.
d) Currently the craft and decorative products sector in Vietnam comprises
of, more than thirty 100% FDI companies, state owned companies, private enterprises (mostly small & medium scale enterprises), joint stock companies, joint ventures and also some large co-operatives in addition to having 1.42 Million craft manufacturing households spread across 2017 craft villages including 1,594 in the North, 111 in the Center and 312 in the South. Rattan and bamboo weaving is the trade practiced by most villages (713), followed by cloth weaving, wooden furniture, embroidery, jute weaving and metal products.
e) Though the private domestic companies and the 100% FDI companies
together account for approximately 70% of export value, the core of the industry in terms of manufacturing and employment generation still remains the 1.42 Million craft manufacturing households spread across
351
Confidential To Export Promotion Council for Handicrafts © 2005 Frost & Sullivan
2017 craft villages and employing an estimated 1.4 Million people according to the Vietnam craft mapping survey of 2002.
f) As a result the Vietnamese government through various government
agencies has taken steps towards developing the craft villages itself and improving their current status.
g) A firm effort in this direction was the initiation of a long term plan to
develop handicrafts in Vietnam especially the craft villages in the direction of industrialisation and modernisation which was initiated by the Ministry of Agriculture and Rural Development (MARD) with the support of the Japanese International Cooperation Agency (JICA) in 2002. The plan that started with the National crafts mapping survey in 2002 has helped in evaluating the status of 11 prominent handicrafts in the country and proposing strategies and action plans for the sustainable development of handicrafts.
h) The efforts being put in by the various government agencies to develop
the core crafts sector as well as the increasing market orientation of larger manufacturing units like 100% FDI companies, private enterprises and co-operatives and their aggressive market development efforts combined with rising contract manufacturing and joint ventures with European, Japanese, Korean and US firms has made the overall craft and decorative products sector in Vietnam the most competitive.
i) In sum, Vietnam has a large, diversified and strong core handicraft
sector with the necessary resources like skilled labor and raw material. More over the core sector is continuing to emerge stronger due to government/NGO support, and the graduating of household production units to small and medium scale export oriented enterprises as a result of the increased export exposure and support. Secondly it also has an increasing number of firms with FDI and other medium sized firms and large co-operatives also engaged in contract manufacturing which is enhancing the sectors over all ability to make modernized craft and decorative products using a mix of traditional techniques and sophisticated technology/techniques/skills and thus meet international demand, preferences and requirements.
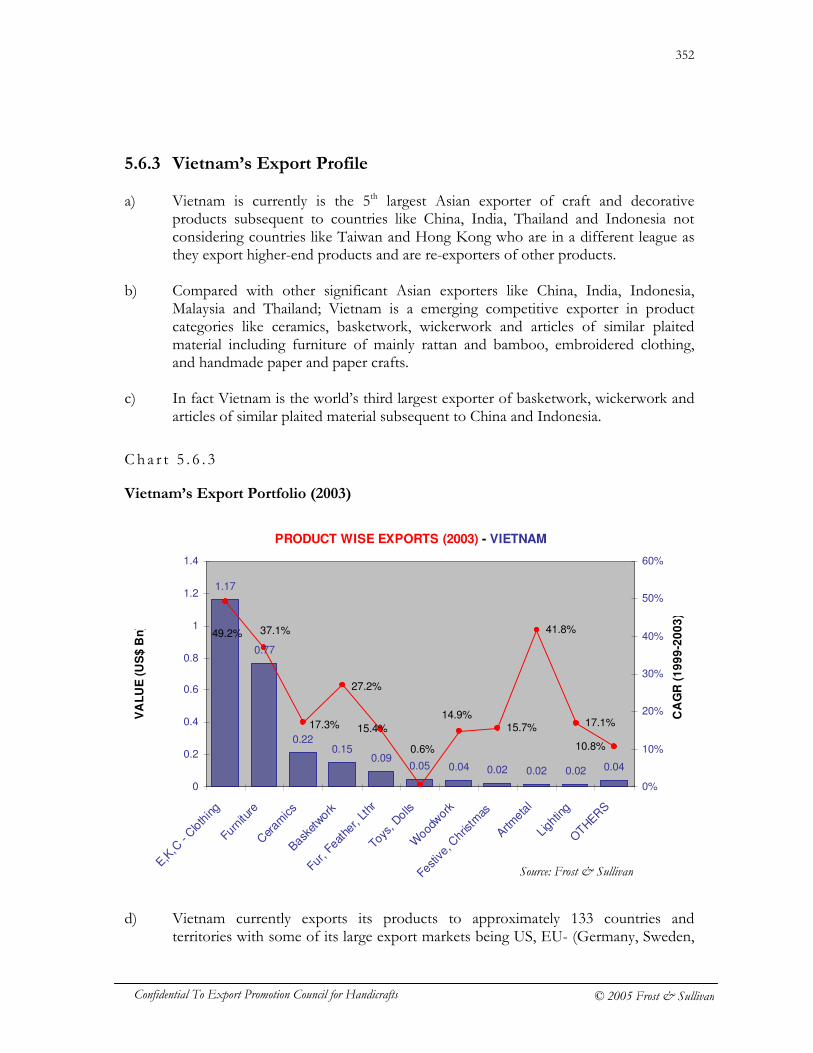
352
Confidential To Export Promotion Council for Handicrafts © 2005 Frost & Sullivan
5.6.3 Vietnam’s Export Profile a) Vietnam is currently is the 5th largest Asian exporter of craft and decorative
products subsequent to countries like China, India, Thailand and Indonesia not considering countries like Taiwan and Hong Kong who are in a different league as they export higher-end products and are re-exporters of other products.
b) Compared with other significant Asian exporters like China, India, Indonesia, Malaysia and Thailand; Vietnam is a emerging competitive exporter in product categories like ceramics, basketwork, wickerwork and articles of similar plaited material including furniture of mainly rattan and bamboo, embroidered clothing, and handmade paper and paper crafts.
c) In fact Vietnam is the world’s third largest exporter of basketwork, wickerwork and
articles of similar plaited material subsequent to China and Indonesia.
C h a r t 5 . 6 . 3
Vietnam’s Export Portfolio (2003)
d) Vietnam currently exports its products to approximately 133 countries and
territories with some of its large export markets being US, EU- (Germany, Sweden,
PRODUCT WISE EXPORTS (2003) - VIETNAM
1.17
0.77
0.220.15
0.090.05 0.04 0.02 0.02 0.02 0.04
15.7%
41.8%
17.1%
10.8%
14.9%
15.4%
0.6%
27.2%
17.3%
37.1%49.2%
0
0.2
0.4
0.6
0.8
1
1.2
1.4
E,K,C
- Cloth
ing
Furn
iture
Cer
amics
Basket
work
Fur, F
eath
er, L
thr
Toys
, Dolls
Wood
work
Festiv
e, C
hristm
as
Artmeta
l
Ligh
ting
OTHER
S
VA
LU
E (
US
$ B
n)
0%
10%
20%
30%
40%
50%
60%
CA
GR
(1
99
9-2
00
3)
Source: Frost & Sullivan
353
Confidential To Export Promotion Council for Handicrafts © 2005 Frost & Sullivan
France, Italy, Spain, UK, and Holland), Japan, Australia, Taiwan, Korea, Hong Kong, and the Middle East.
5.6.4 Profile of Vietnam’s Crafts Sector, Its Structure and
Characteristics 5.6.4.1 Industry Profile and Competency
a) Currently the craft and decorative products sector in Vietnam comprises of, thirty 100% Foreign invested companies, state owned companies, private enterprises (mostly medium scale enterprises), joint stock companies, joint ventures and also some large co-operatives in addition to having 1.42 Million craft manufacturing households spread across 2017 craft villages including 1,594 in the North, 111 in the Center and 312 in the South according to National Craft Mapping survey by Vietnams Ministry of Agriculture and Rural Development (MARD). In addition Vietnam currently has around 1,200 wood processing enterprises, of which over 300 enterprises producing wooden furniture products for export.
b) Of the thirty 100% Foreign invested companies 17 are Asia-based, from
countries such as Taiwan, Japan, South-Korea etc., rest are from Europe with the exception of one firm from Russia and another from the British Virgin Islands. According to official data published by Vietnam’s Handicraft Research and Promotion Center (HRPC), there are 15 state owned enterprises in the traditional handicraft sector who accounts for 18% of exports value where as the 100% Foreign invested companies account for 39% of export value and the private enterprises including medium scale unit’s account for 39% of exports. In 2002 there were only 15 registered private enterprises of medium scale according to HRPC.
c) Vietnam has abundant resources of certain wood categories, metal,
bamboo, reed and jute. For the production of ceramics and porcelain there are kaolin mines which are more than capable of satisfying present and future requirements. Vietnam produces up to 400 tons of lacquer per year. Even with regard to stone; the country has precious stones and marble; however, excavation is made through blasting and the discarded material is rejected for lack of grinding equipment; regarding stone the gravel is dealt with directly in the gravel pits by workers using sledge hammers.
354
Confidential To Export Promotion Council for Handicrafts © 2005 Frost & Sullivan
d) Wood of many types is available in large quantities. However other productions of precious wood which were destroyed during the conflict period are still in the growing stage in the newly planted forests, and as such are required to be imported from Laos, Cambodia, Indonesia and Malaysia. However, Indonesia’s policy to ban the export of rolled timber and the Vietnamese trade ministry’s directive to prohibit the import of wood and half-finished wood products from China has affected the rapidly growing Vietnamese woodwork industry which is requiring large and increasing amounts to wood to meet export demand. Some metalware companies import (silver) from Sweden and also from China at $180 per kilo (100%), bronze is at $4. based on interactions with manufacturers and exporters in Vietnam, it was ascertained that the cost of imported raw material for handicrafts production has increased from 10% to 20% in 2003.
e) In terms of availability of skilled labor there were an estimated 1.5
million persons employed in the traditional crafts sector according to the crafts mapping survey 2002. The overall craft and decorative products sector consists of approximately 2 million persons. The average monthly income in the traditional craft sector is between VND 300,000 to VND 400,000 with the average monthly income for the craft household being approximately VND 905,000.
f) Most of the production in the house-hold production units is handmade
as there are large numbers of highly skilled workers. However there is a total lack of machinery & hence technology. Even the machinery that is in use presently in the sector is very simple & outdated. But from the year 2002 onwards, the Vietnamese government has been working in collaboration with the Japanese government for developing the crafts sector. As a result there has been a slow trend towards modernization of production techniques & better machinery. Some of the technological improvement that have been made in some craft villages include technology for adapting clay, metal knife machines, saw machines, chisel machine, gas furnace, (comminute machine, automated potter's wheel, glaze spray in case of ceramics).
g) However the large firms especially those engaged in contract
manufacturing for European firms as well as the 27 Foreign invested firms have better technology and use more improved machines for production.
h) In fact the 27 foreign invested enterprises had a registered investment
capital of USD 25 million in 2002. Many private firms which account for 38% to 42% of the countries exports are recently increasing their
355
Confidential To Export Promotion Council for Handicrafts © 2005 Frost & Sullivan
investment in machinery realizing the necessity to do so to cater to the large export markets and product requirements. The investment is mainly in the range of, USD 100,000 to USD 650,000 in case of most firms.
i) Most of the exporting firms in Vietnam are small to medium sized firms
who mostly sub-contract their work to many house-hold production units in the 2017 craft villages in the country. As a result the firms do not have much scope for economies of scale in terms of production especially as production organization and design work are fragmented, and dependent heavily on individual efforts with traditional experience.
j) Based on interactions with Vietnamese crafts manufacturers/ exporters
it was ascertained that raw material & transport are the major cost elements. Raw wood costs VND 3 million a cubic meter. For producing better quality product most of the large export oriented firms import good quality raw material especially incase of textiles from Japan & EU. The cost of the imported raw material has increased from 10% to 20% in 2003.
5.6.4.2 Product variety and quality
a) The Vietnamese decorative articles exhibit fantastic designs and expert craftsmanship as well as meet the overall quality requirements and standards. But in terms of utility crafts products other than ceramics and basketwork, the quality is yet not considered up to the grade of the middle to upper end market segments of the European & US markets. However the overall quality is considered to be above average based on opinion of importers and associations in the target markets.
b) As the Vietnamese crafts industry is diversified and spread across
various crafts product categories, the Vietnamese exporters are able to supply a variety of decorative products. But the variety is available only across some product categories like basketwork, wickerwork, wood work. However in case of product categories like textile based crafts etc which are of the utility crafts product category, the general perception of European & US importers is that the product variety is not exactly as per the requirements of the European market, as the designs & colors cater more to the domestic market.
c) With respect to large export volumes, the co-operatives as well firms
having FDI have the ability to export large volumes and this is also
356
Confidential To Export Promotion Council for Handicrafts © 2005 Frost & Sullivan
reflected in their securing of large contracts from European and US firms.
5.6.4.3 Logistics & Infrastructure
a) The main production of handicrafts is concentrated around crafts villages that specialize in manufacturing a specific craft. As a result, the logistics & other infrastructure required for development is not available to majority of the small house-hold production units who are sub-contracted by larger firms & exporters for crafts manufacturing. However under the long term plan for development of the core handicraft sector the government is planning to improve infrastructure to the crafts villages.
b) However as majority of the main exporting firms are presently located in
major cities like Ha Noi and HCM City they do not face any logistics problems in terms basic infrastructure and especially outbound logistics and shipping of goods for exports especially as the Hai Phong Port in the North and HCMC Port in the South are the two main ports. However over all the country currently does not have very strong basic infrastructure.
c) To provide industries basic infrastructure for development and to also
attract FDI, Vietnam has set-up a total of 110 EPZs and industrial parks of which 60 are well developed industrial zones with three important exports processing zones (EPZ) and one high-tech zone (HTZ).
d) Even with regard to availability of fast and modern communication
facilities, as most of the main exporting firms are located in regions like Ha Noi and HCM City, they have access to latest and fast modes of communication including internet. In fact most Vietnamese handicraft exporters are increasingly using the internet (mail) for communication with importers from US & EU countries. More over interaction with key importers and association in target markets has ascertained that Vietnamese exporters are very prompt and responsive in their communication and more over even in respect of meeting delivery deadlines.
e) The distribution channel for handicrafts in Vietnam begins with craft
households acting as subcontractors, then it goes up to the small-scale production groups, to in-village private enterprises then to the private enterprises in urban centers or provincial capitals, then to the export companies in the urban centers. Some large manufacturing companies
357
Confidential To Export Promotion Council for Handicrafts © 2005 Frost & Sullivan
sell the products directly to importers/ retail chains in Japan, Taiwan, US and EU.
f) However in almost 80% to 85 % of the exports, the distribution channel
involves many intermediaries in the domestic market as well as in the importing country.
5.6.4.4 Government Policy & Regulatory Environment
a) Currently the governments policy towards development of craft sector is to help the craft sector through various governmental agencies and NGOs especially as there is no single national agency in charge of developing the handicraft sector
b) The government has initiated efforts towards formalizing a complete
and comprehensive policy for development of the crafts sector in 2002. The policy aims at developing the core handicraft sector in the direction of industrialization & modernization so as to increase its overall export competitiveness. The policy measures are being implemented by the Ministry of Agriculture and Rural Development (MARD) with JICA support since 2002. As part of the initial process, a comprehensive mapping of the crafts & crafts villages nationwide was undertaken to evaluate the status of 11 prominent handicrafts in the country and propose strategies and action plans for the sustainable development of handicrafts. The policy includes infrastructure development & providing training and export promotion support to the handicrafts sector.
c) The government has also given various incentives & subsides to develop
the handicrafts sector as well as increase the handicraft exports. These include measures like handicrafts that are sold to foreigners in Vietnam attract a zero tax rate. The Ministry of Trade is in the process of drafting a project to provide incentives for producers of ceramic, wooden, rattan, bamboo, embroidery and carved fine-art goods. The draft will offer reductions or exemption on land rent and corporation income taxes and allow these businesses to borrow long-term soft loans. It will also support producers to seek markets abroad. It will subsidize half of the costs they make for hiring exhibition space.
d) With the bid to promote market development for the crafts sector, the
Vietnamese Government has signed various co-operation agreements with Japan, Korea and Thailand for support in terms of training, technology & export promotion for the Vietnamese Handicraft sector. More over the Vietnam Bilateral Trade Agreement, with US has
358
Confidential To Export Promotion Council for Handicrafts © 2005 Frost & Sullivan
established normal trade relations between the two countries. As a result, tariffs imposed on goods imported into the United States from Vietnam have been dramatically reduced. Duties charged on imported goods from Vietnam, previously averaging 40%, now fall to an average of 4%, similar to the rate enjoyed by most trading nations. In fact this has helped boost Vietnamese handicraft exports especially ceramics. Similarly the Vietnamese government is continuing to sign various bilateral trade agreements with European countries to secure preferential tariff rates for craft products as well as for technology support.
5.6.4.5 Policy towards FIE’s, joint ventures, OEM developments in craft sector a) The government is encouraging the setting up of foreign firms in the
handicraft sector as this will lead to developing the technological & design capabilities of the sector to enable it to cater to crafts & decoratives demand of US & EU countries. It plans to increase the number of foreign firms in handicraft sector from 27 to 33 by the end of 2005. However currently the efforts by the government have resulted in attracting majority of the FDI from Korea, Japan and Taiwan especially in the craft sector.
5.6.4.6 Government & NGOs support to the Sector
a) The Vietnamese government support to the handicraft sector and those involved in related giftware and furniture manufacturing and exports is through the medium of various government and non-governmental agencies and bodies which individually contribute to the sectors development and export promotion efforts and co-ordinate and co-operate with each other from time to time for implementing schemes and measures to aid overall sector development.
b) These agencies include government bodies at national level like Vietnam
Chamber of Commerce & Industry, (MARD) Ministry of Agriculture & Rural Development, Ministry of Trade - Vietnam, etc who are working in co-operation with various state level bodies, associations(Fine Arts and Furniture Association, Association for Small and Medium Enterprises in Hanoi (ASME)), as well as the international trade promotion bodies like JETRO- Japanese Trade promotion Organization, JICA-Japanese International co-operation Agency, Australian Agency for International Development (AusAID) for development of the Crafts sector.
359
Confidential To Export Promotion Council for Handicrafts © 2005 Frost & Sullivan
c) The support is manly in terms of training facilities & technology development. It also includes measures to increase export competitiveness of the crafts sector in terms of organizing trade fairs at national level, supporting craft exporters in participating in international trade fairs & exhibitions, setting up online handicraft exchange & websites for international exposure as well as facilitating of dispersion of market information, holding workshops, and setting up duty free shops to sell to travelers.
d) The individual initiatives taken by VCCI - Vietnam Chamber of
Commerce and Industry to promote Vietnams’ Handicraft Industry include- � Setting Up of Online handicraft exchange � Creating & maintaining the website www.vncrqfi.com.vn to
provide information about Vietnam's handicraft villages, knowledge of foreign trade, online marketing skills, and information about the demand and tastes of consumers in major import countries.
e) The Ministry of Agriculture and Rural Development MARD has helped
the development of the handicraft sector by launching a project to develop handicrafts in Vietnam in the direction of industrialization and modernization with JICA support since 2002. It has helped complete the mapping of crafts and craft villages nationwide, evaluate the status of 11 prominent handicrafts in the country and propose strategies and action plans for the sustainable development of handicrafts.
f) Ministry of Trade, Vietnam has also aided the development of the crafts
sector through measures like � Piloting direct online sales project � Inviting and hosting foreign experienced designers to help
craftspeople diversify their products so that these products will suit the tastes of customers
� It has also drafted a project to provide incentives for producers of
ceramic, wooden, rattan, bamboo, embroidery and carved fine-art goods. The draft proposes reductions or exemption on land rent and corporation income taxes and allows craft businesses to borrow long-term soft loans. It also proposes various measures to support producers to seek markets abroad some of which have
360
Confidential To Export Promotion Council for Handicrafts © 2005 Frost & Sullivan
been implemented like subsidizing half of the costs incurred for hiring exhibition space.
g) Vietrade i.e. Viet Nam Trade Promotion Agency is supporting and
encouraging the sector to improve product quality by initiating “Golden - V" which is an award dedicated to products created by Vietnamese companies and designers displaying excellent design. It organises competition has with an aim to discover new talents in the design field, as well as promote the use of these designs in business activities.
h) Moreover realizing the need to develop infrastructure in order to
develop the rural industries and craft households the government has been able to secure the support the Organization of Petroleum Exporting Countries (OPEC) who have agreed to loan US$10 million to the central Quang Nam province's project to restore traditional craft villages. The beneficiaries will be 15,000 households doing traditional occupations in the Dong Son weaving village in Dien Ban district, the Ban Thach rush mat-weaving village in Duy Xuyen district and the Tam Vinh village in Tam Ky township. The project, is to be carried out by 2008, and will focus on building basic infrastructure for transport, electricity, irrigation facilities, as well as establishing workshops, developing material supply areas, purchasing production lines, organizing training courses and marketing activities for the villagers' products.
i) Other organizations and NGO’s include JETRO, JICA, Australian
Agency for International Development (AusAID), and Craftlink etc. j) JETRO, i.e. the Japanese trade promotion organization, supports the
local handicraft industry by providing consultancy regarding the Japanese market. JETRO targets ceramic and lacquer ware. The organization invites Japanese experts to Vietnam to support selected local producers in HCM City, Binh Duong and Bat Trang.
k) JICA Japanese International Cooperation Agency has been supporting
MARD in its initiative to develop handicrafts in Vietnam and has also helped in holding workshops, where in representatives of handicraft development organizations from Japan and Thailand exchanged experience in organizing and developing craft villages as well as promoting handicrafts to world markets.
l) Craftlink is a non-profit organization in Hanoi that works with ethnic
minority craftspeople in cooperation with the Vietnam Museum of
361
Confidential To Export Promotion Council for Handicrafts © 2005 Frost & Sullivan
Ethnology & is committed to cultural preservation through Fair Trade. They also provide assistance with training in business skills, quality control and product development for craft producers.
m) Australian Agency for International Development (AusAID) working
with another local association .i.e. ASME i.e. Association for Small and Medium Enterprises in Hanoi to has helped to organize master training courses for traditional handicraft villages in the north. Resulting in around 124 handicraft masters having graduated in 2002 with the ability to design new models for export. It is also working towards establishing close coordination between producers, traders, designers and researchers in order to support small handicraft villages.
5.6.4.7 Market Development & export trade promotion efforts
a) Promotion activities - From the year 2002 onwards the Vietnamese government as well as private & handicraft co-operatives have initiated various promotion measures like organizing an Annual international fair of wood products, fine arts and handicrafts, organizing of cultural exchange programs with Japanese buying firms, as they are the main consumers of Vietnamese handicraft products, as well as initiating various promotion measures including use of websites and e-trading floors.
b) In fact the Vietnamese Chamber of Commerce and Industry (VCCI)
launched a new online exchange centre to help handicraft producers sell their wares. The move is part of the handicraft export promotion project which aims to improve product quality and boost advertising in overseas markets by displaying goods online and providing detailed information on the products, legal requirements and foreign partners. In fact the VCCI also assists handicraft makers in accessing financial resources, conducting online transactions and improving marketing and management skills.
c) Moreover realizing the need to diversify product designs to suit
customer need and there by ensure market development and expansion, the MoT is hosting foreign experienced designers to help craftspeople diversify their products
d) Brand & quality development & promotion-Many private firms have
been slowly building up efforts through product development and promotion to develop their reputation as suppliers of high quality craft products. As a result the trademarks of Ba Nhat, Hoa Hiep, Truong My,
362
Confidential To Export Promotion Council for Handicrafts © 2005 Frost & Sullivan
AISA Lac Phuong Nam, Vietnamese Village, and names of production establishments such as Thu Dau Mot, Binh Duong, Dong Nai, Bat Trang and Kim Boi have become familiar to foreign handicrafts dealers especially the European countries. The Vietnamese Government has also taken steps to develop a reputation & brand for high quality crafts products being exported by Vietnamese craft firms. The steps in this direction include the “Golden-V” contest sponsored by the project Vietnam Competitiveness Improvement (VNCI). In the contest, Vietnamese craft exporters for contest for best designs of crafts products. After the contest, VNCI continues assists these exporters in promoting their products by free display of winning products in a number of showrooms in Europe, the U.S, Japan, etc.
e) Establishment of local & international Showrooms, warehouses - There
are presently arrangements for display of Vietnamese crafts products in Japan & Thailand. However there are plans to aid the promotion of Vietnamese crafts by increasing the number of national & international showrooms. By 2010, there are plans to set up seven fine arts handicraft village centers nationwide, which will showcase regular exhibitions on handicraft products from both home and abroad.
f) Thus the government is implementing measures to link craftspeople and
professional households with customers. Especially since most of Vietnam's fine art handicraft producers are small enterprises with poor financial capabilities, the ministry has focused on the organization of trade promotion exhibitions to help enterprises gain access and find customers.
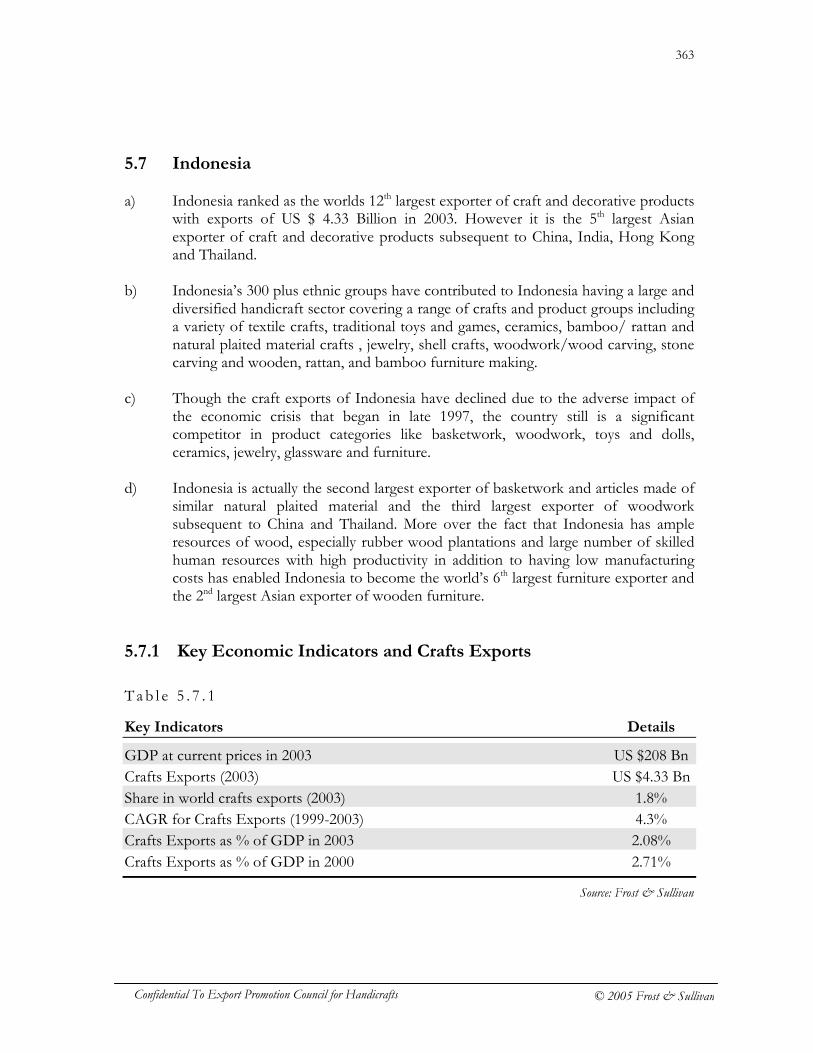
363
Confidential To Export Promotion Council for Handicrafts © 2005 Frost & Sullivan
5.7 Indonesia a) Indonesia ranked as the worlds 12th largest exporter of craft and decorative products
with exports of US $ 4.33 Billion in 2003. However it is the 5th largest Asian exporter of craft and decorative products subsequent to China, India, Hong Kong and Thailand.
b) Indonesia’s 300 plus ethnic groups have contributed to Indonesia having a large and diversified handicraft sector covering a range of crafts and product groups including a variety of textile crafts, traditional toys and games, ceramics, bamboo/ rattan and natural plaited material crafts , jewelry, shell crafts, woodwork/wood carving, stone carving and wooden, rattan, and bamboo furniture making.
c) Though the craft exports of Indonesia have declined due to the adverse impact of
the economic crisis that began in late 1997, the country still is a significant competitor in product categories like basketwork, woodwork, toys and dolls, ceramics, jewelry, glassware and furniture.
d) Indonesia is actually the second largest exporter of basketwork and articles made of
similar natural plaited material and the third largest exporter of woodwork subsequent to China and Thailand. More over the fact that Indonesia has ample resources of wood, especially rubber wood plantations and large number of skilled human resources with high productivity in addition to having low manufacturing costs has enabled Indonesia to become the world’s 6th largest furniture exporter and the 2nd largest Asian exporter of wooden furniture.
5.7.1 Key Economic Indicators and Crafts Exports
Tab l e 5 . 7 . 1
Key Indicators Details
GDP at current prices in 2003 US $208 Bn Crafts Exports (2003) US $4.33 Bn Share in world crafts exports (2003) 1.8% CAGR for Crafts Exports (1999-2003) 4.3% Crafts Exports as % of GDP in 2003 2.08% Crafts Exports as % of GDP in 2000 2.71%
Source: Frost & Sullivan
364
Confidential To Export Promotion Council for Handicrafts © 2005 Frost & Sullivan
5.7.2 Overview of Crafts Sector 5.7.2.1 Sector Background
a) The cultural diversity of Indonesia has led to the emergence of a large
and diversified core handicraft sector spread out in many parts of the country, and which has always been an important part of the country’s socio-economic structure.
b) In fact the handicraft products of Indonesia include a variety of
products like the wooden crafts of the Asmat tribe in the eastern part of the archipelago; the embroidered goods of Aceh in the far west; the shell crafts of Halmahera, which is Indonesia’s most northern island; and finally, carved sandalwood from the most southern part of the island complex which makes up Indonesia in addition to there being a large variety of craft products in between such as: � “Songket” cloth from South Sumatera; � “Tapis” cloth from Lampung; � Ceramic earthenware from Lombok; � “Wayang golek” puppets and wooden masks from Java; � Leather puppets, batiks, and silver crafts from Central Java and
Yogyakarta; � Various carvings from Bali and Java; � ikat weaving from South Sulawesi and Lombok; � Ethnic furniture from Jepara; and � Interior décor items and other unique crafts products.
c) The high-quality handicraft products with solid craftsmanship have
always enjoyed good domestic as well as export demand, including demand in the ASEAN market.
d) The sectors export orientation grew rapidly in the 1990s with exports
almost doubling in the period between 1995 and 1998, boosted significantly by a depreciation of the Indonesian rupiah. In fact the exports of completely handmade handicrafts including carved wooden furniture itself reached the 2 Billion mark in 1998. However the economic crisis that began in late 1997, adversely affected the sector and more over cut-throat competition from China led to exports continuing to decline till nearly 2002.
e) However, increased governmental support to the sector and increasing
export promotion activities have led to arresting further decline since 2002.
365
Confidential To Export Promotion Council for Handicrafts © 2005 Frost & Sullivan
5.7.2.2 Current Profile a) The handicraft industry in Indonesia is predominantly a small-scale
industry consisting of over 2 million units throughout Indonesia, and employing approximately 10 million workers. The two million units include mostly a large number of household manufacturing units situated in the rural areas close to the source of raw material, many small and medium sized firms scattered all over the country and a few large firms engaged in large exports of mostly wood-based products and wooden/ rattan furniture.
b) The small firms and household manufacturing units are situated in
mostly remote villages and don’t have the capacity or access for direct exports, so most of the firms that exports handicrafts outsource production to smaller firms incase of furniture and household manufacturing units incase of handicrafts.
c) Currently the Indonesian handicraft and furniture manufacturing
industry which was adversely affected due the economic crises that began in late 1997 is also suffering from many problems which include: � Lack of ability by many producers to deliver stable and reliable
quantities � Lack of knowledge of trends, product preferences, and import
regulations in foreign markets � Concerns about political stability discouraging foreign buyers � Not many direct links to the largest markets (such as the United
States or Europe) either in terms of direct connection to importers or in terms of direct information on market trends.
� Heavy competition from China and Thailand d) In sum, the handicraft and furniture making industry in Indonesia has a
strong base in terms of large number of skilled craftsmen and ample raw materials especially wood as Indonesia’s tropical forests are the most extensive in Southeast Asia and as result have led to the rapid growth of its wood processing industries such as furniture, wood-based panels, wood composite products and mostly wooden handicrafts. More over the increasing OEM manufacturing form Europe, Australia and Asia in the furniture making sector has led to increased production and exports of furniture.
e) Thus considering the present status, the wood based industry especially
furniture making which has the basic infrastructure to fuel exports will offer stiff competition. However it can be said that the industry today is
366
Confidential To Export Promotion Council for Handicrafts © 2005 Frost & Sullivan
at crossroads especially due to growing pressure from two sides: competitive strategies from other Asian countries such as China, Thailand, the Philippines and Vietnam that are cheaper and more responsive to global buyers' needs for quality, delivery and close customer relations, and secondly an unsustainable rate of logging in the Indonesian teak plantations that, if left unchecked, will undermine this industry's supply of teak and mahogany in the next five years.
f) More over the success of the overall craft and decorative products
industry will depend on the nature and quantum of support being given by the Indonesian government to the sector in terms of sector development as well as market development and export promotion; especially if it has to compete in the present international scenario which is marked by excessive price competition and driven by volume exports of internationally styled high quality decoratives for housewares and gift sectors.
5.7.3 Indonesia’s Export Profile a) Indonesia currently has a market share of 1.8% in the world craft and decorative
products market which has actually slipped by 0.1% compared to1999 due to the adverse effect of the country’s economic crisis that began in 1997 and also increased competition especially from China and Thailand.
b) However Indonesia continues to be a competitive exporter of wood based and natural plaited material like bamboo and rattan products especially carved wooden decoratives and furniture of rattan, bamboo as well as wood.
c) Indonesia is actually the second largest exporter of basketwork and articles made of
similar natural plaited material, the third largest exporter of woodwork subsequent to China and Thailand, the world’s 6th largest furniture exporter and the 2nd largest Asian exporter of wooden furniture in addition to being the third largest exporter of toys and dolls subsequent to countries like China and Germany.
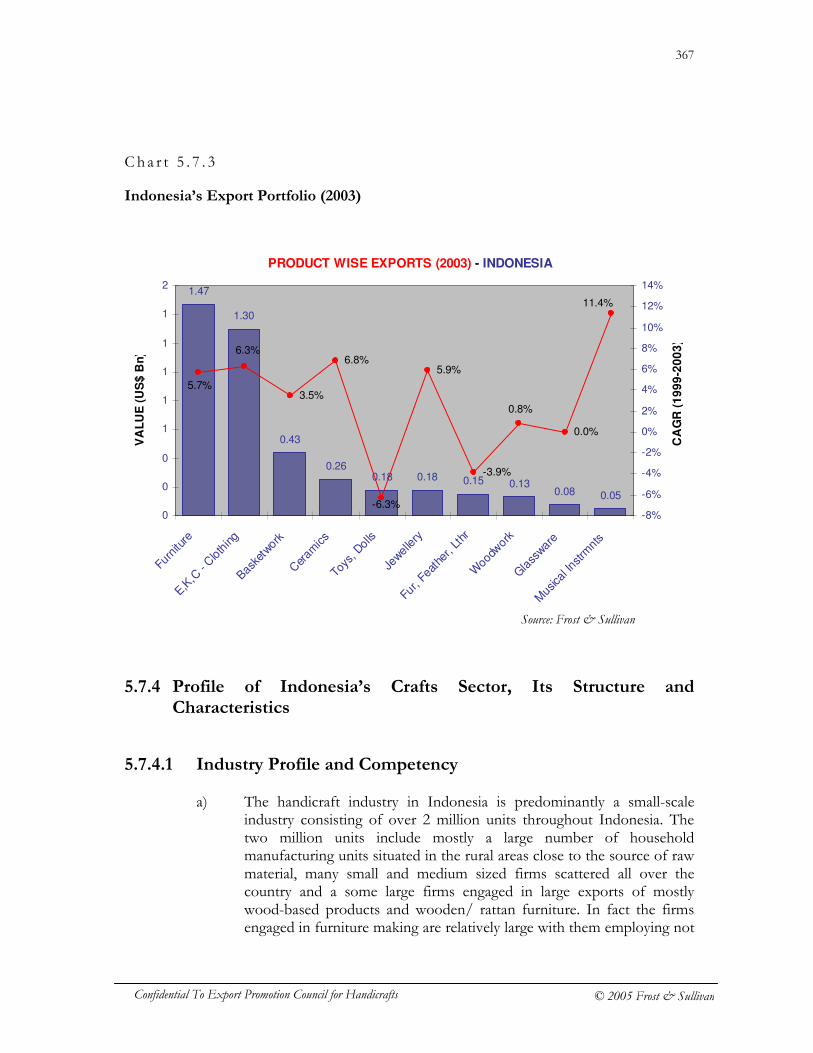
367
Confidential To Export Promotion Council for Handicrafts © 2005 Frost & Sullivan
Cha r t 5 . 7 . 3
Indonesia’s Export Portfolio (2003)
5.7.4 Profile of Indonesia’s Crafts Sector, Its Structure and
Characteristics 5.7.4.1 Industry Profile and Competency
a) The handicraft industry in Indonesia is predominantly a small-scale
industry consisting of over 2 million units throughout Indonesia. The two million units include mostly a large number of household manufacturing units situated in the rural areas close to the source of raw material, many small and medium sized firms scattered all over the country and a some large firms engaged in large exports of mostly wood-based products and wooden/ rattan furniture. In fact the firms engaged in furniture making are relatively large with them employing not
PRODUCT WISE EXPORTS (2003) - INDONESIA
1.47
1.30
0.43
0.260.18 0.18 0.15 0.13
0.08 0.05
3.5%
6.8%5.9%
-3.9%
0.0%
11.4%
0.8%
5.7%
6.3%
-6.3%0
0
0
1
1
1
1
1
2
Furn
iture
E,K,C
- Cloth
ing
Basket
work
Cer
amics
Toys
, Dol
ls
Jewel
lery
Fur,
Feat
her,
Lthr
Woo
dwork
Gla
ssware
Music
al In
strm
nts
VA
LU
E (
US
$ B
n)
-8%
-6%
-4%
-2%
0%
2%
4%
6%
8%
10%
12%
14%
CA
GR
(1
99
9-2
00
3)
Source: Frost & Sullivan
368
Confidential To Export Promotion Council for Handicrafts © 2005 Frost & Sullivan
less than 100 employees per firm. Such large firms are estimated to be more than 4000 in number.
b) The small firms and household manufacturing units are situated in
mostly remote villages and don’t have the capacity or access for direct exports, so most of the firms that exports handicrafts outsource production to smaller firms incase of furniture and household manufacturing units incase of handicrafts.
c) In terms of labor availability, the Indonesian handicraft and furniture
manufacturing sector has abundant labor. As per estimates of the Association of Exporters and Producers of Indonesian Handicraft (ASEPHI) currently there are more than 10 million persons employed in the handicraft and furniture manufacturing sector of the country. More over these people are highly skilled and have high labor productivity and even the average wage is relatively lesser as compared to countries like India, Malaysia, Hong Kong, Taiwan, Korea and Thailand.
d) With regard to raw materials, Indonesia has abundant supply of raw
materials especially wood. In fact Indonesia has the biggest rubber wood plantation in Asia, the most extensive forests in Southeast Asia and is the world's second largest supplier of wood. It also has large resources of bamboo, rattan and reed. According to the Indonesian Furniture Industry and Handicraft Association (Asmindo) and Indonesian Furniture Club (IFC), an association of furniture exporters, the furniture industry itself needs 4.5 million cubic meters every year if it has to meet the increasing export demand. However the government has reduced the annual logging quota, from 5.7 million cubic meters in 2003 to 5.4 million cubic meters in 2004. More over though the Indonesian government has banned exports of wood as raw material, Illegal logging and timber smuggling have caused price rises for wood domestically. As a result local furniture manufacturers had to bear 15 percent to 20 percent rises in wood prices in 2003 and 2004.
e) Even with regard to use of machinery and technology, only a few large
firms engaged in manufacturing and export of furniture have access to better machinery which is being imported in increasing numbers. However majority of industry is labor and resource-intensive.
369
Confidential To Export Promotion Council for Handicrafts © 2005 Frost & Sullivan
5.7.4.2 Product variety and quality
a) The Indonesian handicrafts exhibit intricate designs and expert craftsmanship as well as meet the overall quality requirements and standards. Indonesia has however not ventured much into production of target market adapted decoratives. But the high degree of craftsmanship and the general good finish and designs of the traditionally made handicraft products are itself popular in Europe, US, Australia and Asian and have established a niche for themselves.
b) More over interactions with important trade bodies and importers and
associations in the target markets has confirmed that overall the quality of Indonesian products is good and that the products meet general quality requirements.
c) Furthermore the fact that the United Nations Educational, Scientific and
Cultural Organization (UNESCO) and the ASEAN Handicraft Promotion and Development Association (Ahpada) recently awarded the 2004 Seal of Excellence to a maximum of 11 Indonesian handicraft entrepreneurs is proof of the quality of Indonesia’s handicrafts as the seal is given annually to craft products from 10 Southeast Asian countries displaying excellent quality and innovation. It is guarantees that a handicraft product meets the highest standards of quality and has been produced with careful regard to cultural authenticity and environmental conservation.
d) However excluding furniture, the Indonesian craft manufacturers and
exporters still do not have the quality of products that can be marketed as part of the growing housewares markets in Europe and US and which are presently the main growth areas.
e) In terms of product variety, as the Indonesian crafts industry is
diversified and spread across various crafts product categories, the Indonesian exporters are able to supply a variety of decorative products especially in the wood, rattan, stone and ceramics category.
f) However the major drawback of the industry is the inability to supply
large volumes of handicrafts especially since the production of handicrafts for exports is mainly outsourced to the small firms and households in villages/areas having expertise in the production of those crafts and such a system is not very reliable as there is no direct control over basic production and therefore on time delivery.
370
Confidential To Export Promotion Council for Handicrafts © 2005 Frost & Sullivan
g) But there are certain large firms like Out Of Asia which are into the manufacturing of home accessories and furniture and have workshops in Java, Bali and Lombok and a result have a capacity to send at least one container of goods per day to the United States, Europe, Japan and Australia.
h) Nevertheless a majority of the firms that are into manufacturing of
handicrafts excluding furniture are small and not capable of supplying large volumes as required by the international markets and are therefore not able to obtain large contracts of retail chains and large importers.
5.7.4.3 Logistics & Infrastructure
a) The handicraft and furniture making sector in Indonesia does face transportation problems especially inbound logistics as most of the raw material requirement has to be bought in from areas like Sumatra and Kalimantan. More over a large number of small manufacturing units as well as household production units are in remote areas of Java, Bali, Lombok etc and as these units are outsourced the main production of handicrafts by larger exporting units, there are problems of transporting the finished or semi-finished goods from these areas to the exporting units who are generally situated in urban areas which have access to facilities for exports.
b) Even on an over all basis, the country currently does not have very
strong basic infrastructure not only in terms of transportation facilities but also supportive facilities to promote exports including the availability of finance and access to better technology and training facilities necessary for product development to improve export potential.
c) As transport and communication infrastructure available to the majority
of the small and medium sized handicraft manufacturing and exporting firms is small, the firms are not very prompt and responsive in their communication and more over even in respect of meeting delivery deadlines. The same findings were ascertained during interactions with important importers and associations in target markets.
371
Confidential To Export Promotion Council for Handicrafts © 2005 Frost & Sullivan
5.7.4.4 Government Policy & Regulatory Environment
a) The government policy towards the development of the sector is to develop the sector through developing the small and medium scale sector through various long term and short term measures. The long term measures include development of better infrastructure with the aim of attracting more FDI in the sector as it will take care of building production and design capabilities and also expand export potential and market links. The other policy measures towards the development of the sector have been in terms of banning exports of raw logs and other raw material so and simultaneously encouraging the manufacturing and exporting of products mainly decoratives and furniture made from the raw materials.
b) An example of a major instance of institutional assistance to the industry
was as early as 1967 when the government established a Unit for Technical Assistance (UPT for Unit Pelaksana Teknis) in Jepara. - to promote the production and the marketing of handicrafts products; help household manufacturers and small-scale firms improve processing techniques and business management skills; train crafts persons in the use of machinery; improve the design and quality of wood handicrafts; and to assist with funds and licensing and other problems.
c) The government is currently also helping the sector by improving
export-import regulations and simplifying export procedures especially for craft and furniture exports. More over the government is also trying to aid the small firms by helping them to avail finance through various finance schemes that have been initiated.
d) However compared to other competing countries the Indonesian
government has not been very active in its support for the sector. 5.7.4.5 Policy towards FIE’s, joint ventures, OEM developments in
craft sector a) The government is encouraging the setting up of foreign firms in the
handicraft sector especially the export oriented wood based industry including wood carving and furniture making as this will lead to developing the technological & design capabilities of the sector to enable it to cater to crafts & decoratives demand of US & EU countries. However the socio-political instability of the country after 1997 and the
372
Confidential To Export Promotion Council for Handicrafts © 2005 Frost & Sullivan
existence of government red tape have resulted in the country not being able to attract much FDI investment.
5.7.4.6 Government & NGOs support to the Sector
a) The main support to the handicraft and furniture making industry in Indonesia is from Association of Exporters and Producers of Indonesian Handicraft (ASEPHI), Indonesian Furniture Industry and Handicraft Association (Asmindo) and Indonesian Furniture Club (IFC).
b) ASEPHI is a national business association whose members are
companies or organizations interested or involved in the handicraft industry. ASEPHI works towards improving the positioning of Indonesian handicrafts in the global market, ensuring a conducive business climate for the handicraft community, developing a relevant economic network through the handicraft community and, within the handicraft community, and to develop business relationships between members and improve the quality of human resources.
c) In fact the association has also been supporting the sector by organizing
training, workshops (in collaboration with government organizations like NAFED (the National Agency for Export Development), and overseas trade promotion through offices like INA (Indonesian Netherlands Association), JETRO (Japan External Trade Organization), and others.
d) The Indonesian Furniture Industry and Handicraft Association
(Asmindo) and Indonesian Furniture Club (IFC) also support the sector by working together with industry persons as well garnering support from the government for furthering the interests of the sector and also helping in trade promotion and sector development schemes.
e) Outside support to the sector has been in form of financial, technical
and marketing assistance from Australia’s Technical Assistance Management Facility (TAMF), as well as international support bodies like the International Finance Corporation, CHF International etc.
f) In fact Australia has also provided direct assistance to Balinese firms to
assist them in increasing their exports. Australia’s Technical Assistance Management Facility (TAMF) has assisted the National Agency for Export Development in a pilot program to determine the export readiness of a group of about 50 potential Balinese handicraft and furniture exporters. This activity, funded in July 2003, provided the
373
Confidential To Export Promotion Council for Handicrafts © 2005 Frost & Sullivan
opportunity for handicraft producers to better align their product designs to global customer preferences. Australia is also contributing $4 million to the Indonesian Enterprise Development Facility (IEDF), which aims to help develop the small and medium enterprise (SME) sector in Eastern Indonesia; where in the Bali arm of the IEDF, the Trade and Export Program (TEP), will work with producers in the furniture and handicraft sector
g) Even the International Finance Corporation’s under its Program for
Eastern Indonesia Small and Medium Enterprise Development, or PENSA, has signed a memorandum of understanding with the Association of Exporters and Producers of Indonesian Handicraft (ASEPHI) to strengthen its capacity to serve its members in a more professional and beneficial manner.
h) CHF International is another organization that has also been helping the Association of Exporters and Producers of Indonesian Handicraft (ASEPHI) to assist Indonesian entrepreneurs and producers in the handicraft industry by providing opportunities for selected Acehenese and Sumatran artisans and small handicraft business owners to directly market their wares.
5.7.4.7 Market Development & export trade promotion efforts
a) ASEPHI has been the main association that has been working with various other national and international bodies to promote the exports of Indonesian handicrafts and furniture.
b) To promote Indonesian handicrafts in the export market, ASEPHI has
participated at handicraft trade fairs in potential markets like the United States, Europe, Japan, Malaysia, Brunei, Thailand, and Vietnam.
c) Even in the domestic market, ASEPHI has established a venue for
worldwide craftsmen to promote and market their genuine handicraft products.
d) The effort was started five years ago at the First Jakarta International
Handicraft Trade Fair 1999 (INACRAFT ’99) with 102 Indonesian handicraft companies. Sales contracts achieved then were valued at US $195,495.
374
Confidential To Export Promotion Council for Handicrafts © 2005 Frost & Sullivan
e) Since then ASEPHI has been annually holding this fair and promoting it through various measures. Thus the only modes of promotion used by Indonesian Handicraft and furniture making industry has been participating in various International Trade Fairs as well as holding a major crafts fair in Jakarta to promote exports. Other modes of promotion are through increased advertising in international trade magazines.
375
Confidential To Export Promotion Council for Handicrafts © 2005 Frost & Sullivan
5.8 COMPETITIVE BENCHMARKING 5.8.1 Comparative analysis of export competitiveness across nations a) The extensive study of major importing nations for crafts and decorative products
by Frost & Sullivan, established that the main factors that determine export competitiveness in the target markets are factors like delivery time, product spread/variety & product innovation, product quality, price and marketing & service.
b) The ability of an exporting nation to perform on the above criterion is dependant on a host of factors which are country and sector specific. In fact more than the countries present performance in terms of delivery time, product spread/variety & product innovation, product quality, price and marketing & service; the country and sector specific factors, from which the ability of the country to perform on the above criterion is derived, will determine its long term export competitiveness.
c) Taking the above into consideration, Frost & Sullivan listed out the factors
leading to long term export competitiveness in addition to the factors like delivery time, product spread/variety & product innovation, product quality, price and marketing & service that are dependent factors and the same were then classified into the following categories: (a) Internal Factors These basically include all the factors that are inherent part of the country, sector and industry per se and included a host of factors which were listed as below:
� Economies of Scale � Labor-Availability of abundant, reliable and quality labor � Availability of good manufacturing facilities, latest technology � Raw material-Availability of abundant and quality raw material � Achieve low manufacturing costs � Industry composition/structure � Training Institutes � Facilities-Design, Testing � Number of manufacturing units � Designs Matching market preferences � Good quality products � Range of products offered - product spread
376
Confidential To Export Promotion Council for Handicrafts © 2005 Frost & Sullivan
� Packaging, labeling (information and traceability) � Established quality systems, product testing � Product variety/ design range � Product innovation and design development � Structured inbound logistic system � Structured outbound logistic system (including C&F) � Inland transport facilities (efficient, well networked) � Warehouse facilities - well networked (inland) � Warehouse facilities - well networked (overseas) � Policies towards development of crafts sector � Taxes and Duties � Incentives and subsidies � Policy to promote entry of Foreign Invested Enterprises � Government support for trade promotion and business development � Supportive Bilateral agreements � Ability to spot business opportunities � Promptness in responding to client requirements � Deliver products in short lead time � Deliver in product designs or custom designs in short lead time
(b) External Factors
These basically refer to the market development & promotion and other marketing efforts especially adopted for the target markets. They are,
� Trade Channels-current � Schemes and effectiveness of product promotion measures � Showrooms - overseas/external � Advertisement - scale and channels � Brand Development - country of origin � Prices � Nature and quantum of market development efforts � Brand Development - Companies � Showrooms - internal � Trade channels - Emerging � Use of new and innovative platforms of promotion
377
Confidential To Export Promotion Council for Handicrafts © 2005 Frost & Sullivan
5.8.2 The Benchmarking Process -
a) The key factors leading to long term export competitiveness where listed out in addition to the factors like delivery time, product spread/variety & product innovation, product quality, price and marketing & service that are dependent factors. These factors were then classified under the categories of Industry Competency, Product Variety and Quality, Logistics and Infrastructure, Government Policy and Regulatory Environment, Hygiene Factors and target market related market development & promotion efforts.
b) The next step involved using a proprietary analysis model that helps in
understanding the relative importance of each factor and the underlying relationship between each factor.
c) Once we were able to understand the relationship between each of the factors and
the importance structure or rank order of these factors, importance weights were assigned to each factor ;
d) This done, a score (points out of 100) was given for each of listed factor for each
country ; e) In this fashion, a rating for all the selected competing countries in terms of each of
the listed factors was computed with the calculation of the weight and score by using a base weight of 1.0 and each factor then being able to get a maximum possible rating of 100. The total “competitiveness rating” for each competing country was then calculated by adding all ratings for all the listed factors and the final rating being in the range of 1-100. Based on the ratings each country was given relative ranks.
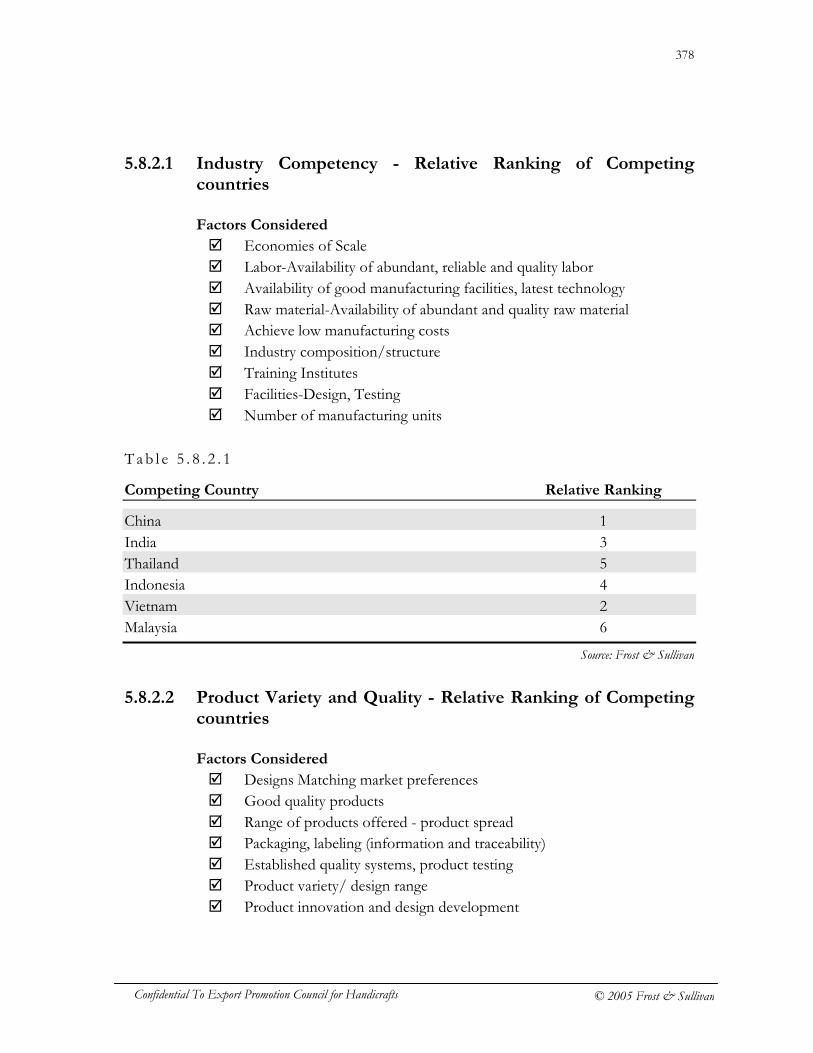
378
Confidential To Export Promotion Council for Handicrafts © 2005 Frost & Sullivan
5.8.2.1 Industry Competency - Relative Ranking of Competing countries
Factors Considered
� Economies of Scale � Labor-Availability of abundant, reliable and quality labor � Availability of good manufacturing facilities, latest technology � Raw material-Availability of abundant and quality raw material � Achieve low manufacturing costs � Industry composition/structure � Training Institutes � Facilities-Design, Testing � Number of manufacturing units
T a b l e 5 . 8 . 2 . 1
Competing Country Relative Ranking
China 1 India 3 Thailand 5 Indonesia 4 Vietnam 2 Malaysia 6
5.8.2.2 Product Variety and Quality - Relative Ranking of Competing
countries
Factors Considered
� Designs Matching market preferences � Good quality products � Range of products offered - product spread � Packaging, labeling (information and traceability) � Established quality systems, product testing � Product variety/ design range � Product innovation and design development
Source: Frost & Sullivan
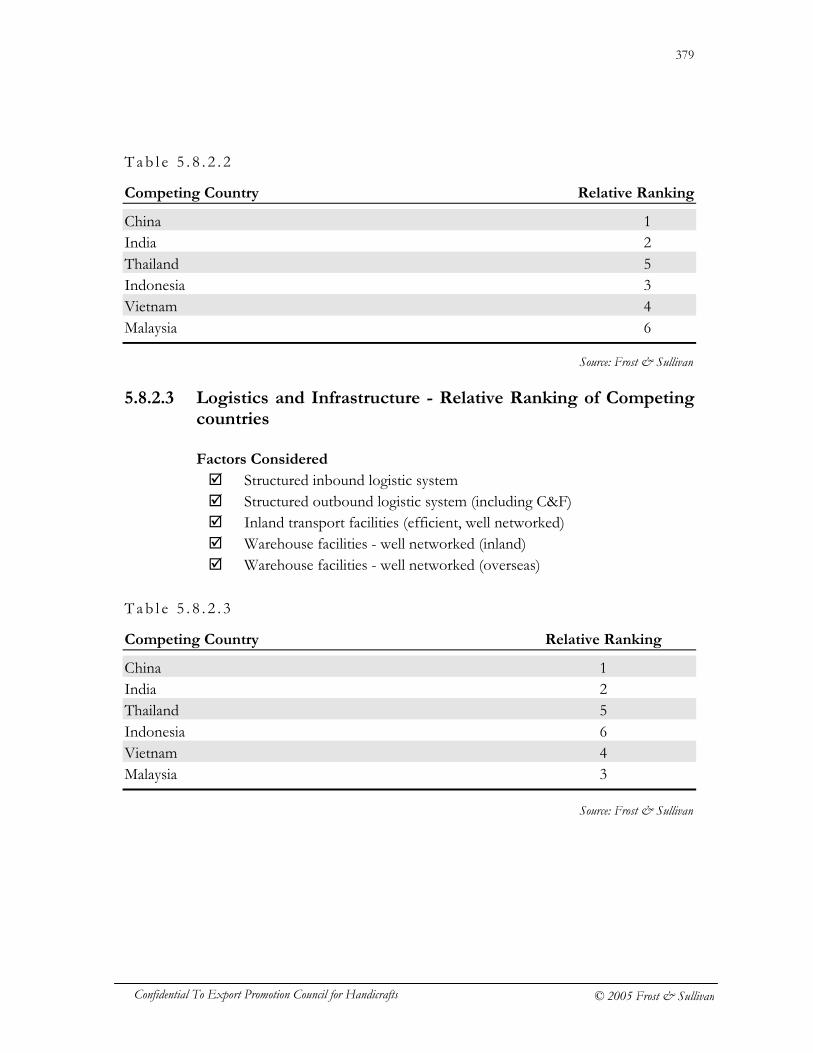
379
Confidential To Export Promotion Council for Handicrafts © 2005 Frost & Sullivan
Tab l e 5 . 8 . 2 . 2
Competing Country Relative Ranking
China 1 India 2 Thailand 5 Indonesia 3 Vietnam 4 Malaysia 6
5.8.2.3 Logistics and Infrastructure - Relative Ranking of Competing
countries
Factors Considered
� Structured inbound logistic system � Structured outbound logistic system (including C&F) � Inland transport facilities (efficient, well networked) � Warehouse facilities - well networked (inland) � Warehouse facilities - well networked (overseas)
T a b l e 5 . 8 . 2 . 3
Competing Country Relative Ranking
China 1 India 2 Thailand 5 Indonesia 6 Vietnam 4 Malaysia 3
Source: Frost & Sullivan
Source: Frost & Sullivan
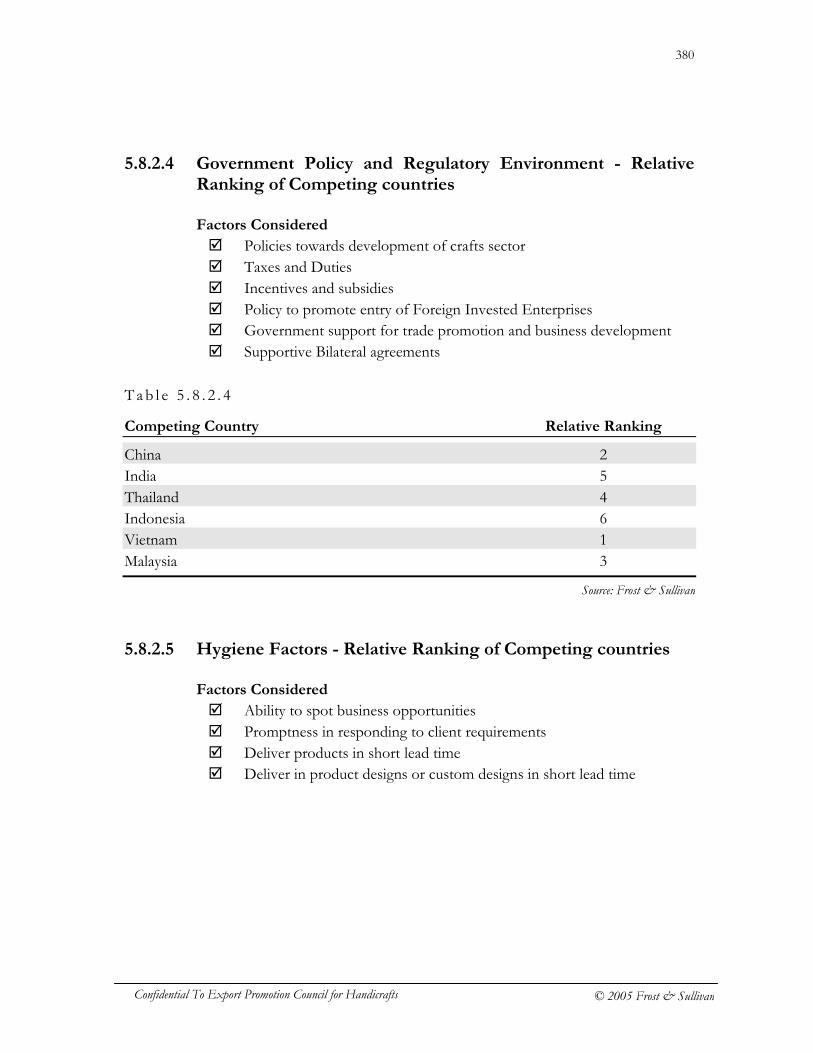
380
Confidential To Export Promotion Council for Handicrafts © 2005 Frost & Sullivan
5.8.2.4 Government Policy and Regulatory Environment - Relative Ranking of Competing countries
Factors Considered
� Policies towards development of crafts sector � Taxes and Duties � Incentives and subsidies � Policy to promote entry of Foreign Invested Enterprises � Government support for trade promotion and business development � Supportive Bilateral agreements
T a b l e 5 . 8 . 2 . 4
Competing Country Relative Ranking
China 2 India 5 Thailand 4 Indonesia 6 Vietnam 1 Malaysia 3
5.8.2.5 Hygiene Factors - Relative Ranking of Competing countries
Factors Considered
� Ability to spot business opportunities � Promptness in responding to client requirements � Deliver products in short lead time � Deliver in product designs or custom designs in short lead time
Source: Frost & Sullivan
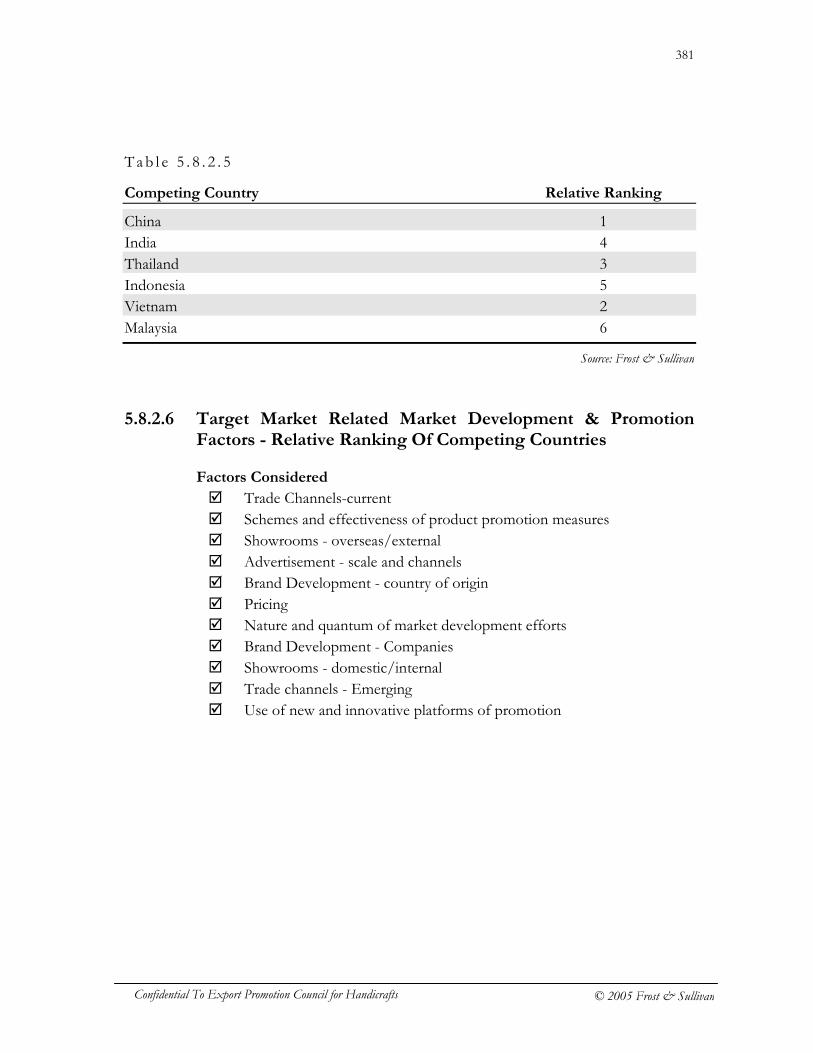
381
Confidential To Export Promotion Council for Handicrafts © 2005 Frost & Sullivan
Tab l e 5 . 8 . 2 . 5
Competing Country Relative Ranking
China 1 India 4 Thailand 3 Indonesia 5 Vietnam 2 Malaysia 6
5.8.2.6 Target Market Related Market Development & Promotion
Factors - Relative Ranking Of Competing Countries
Factors Considered
� Trade Channels-current � Schemes and effectiveness of product promotion measures � Showrooms - overseas/external � Advertisement - scale and channels � Brand Development - country of origin � Pricing � Nature and quantum of market development efforts � Brand Development - Companies � Showrooms - domestic/internal � Trade channels - Emerging � Use of new and innovative platforms of promotion
Source: Frost & Sullivan
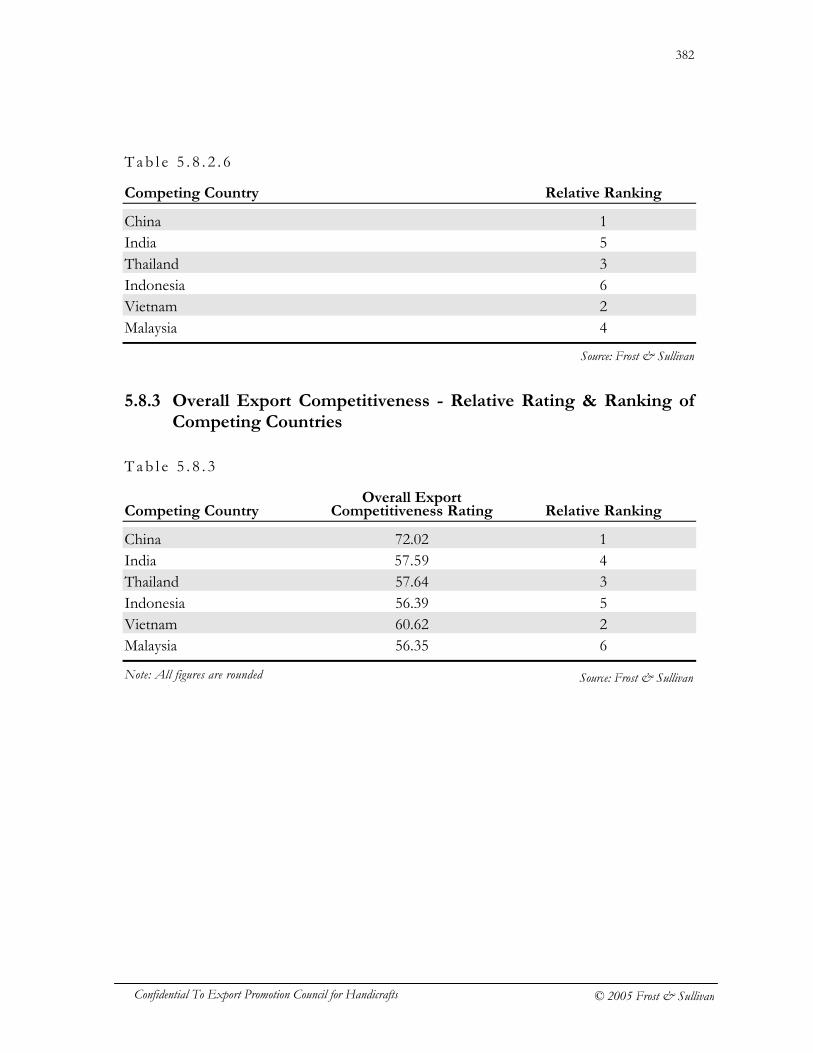
382
Confidential To Export Promotion Council for Handicrafts © 2005 Frost & Sullivan
Tab l e 5 . 8 . 2 . 6
Competing Country Relative Ranking
China 1 India 5 Thailand 3 Indonesia 6 Vietnam 2 Malaysia 4
5.8.3 Overall Export Competitiveness - Relative Rating & Ranking of
Competing Countries
Tab l e 5 . 8 . 3
Overall Export Competing Country Competitiveness Rating Relative Ranking
China 72.02 1 India 57.59 4 Thailand 57.64 3 Indonesia 56.39 5 Vietnam 60.62 2 Malaysia 56.35 6
Note: All figures are rounded
Source: Frost & Sullivan
Source: Frost & Sullivan
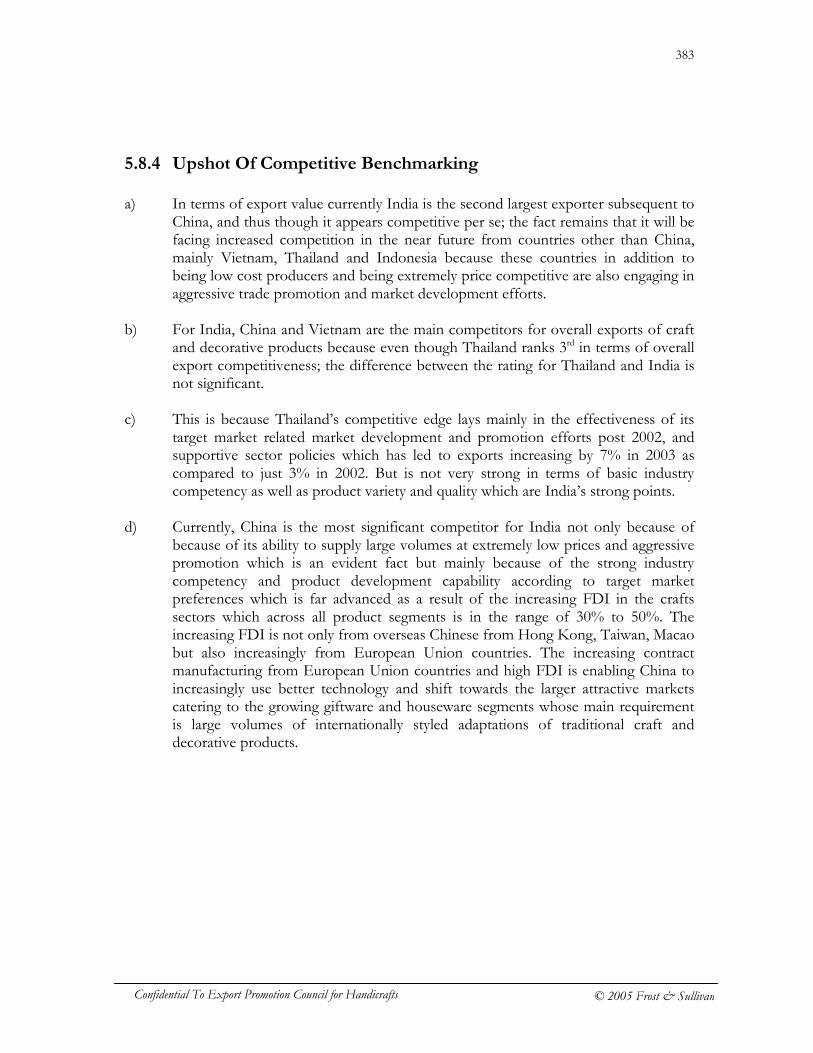
383
Confidential To Export Promotion Council for Handicrafts © 2005 Frost & Sullivan
5.8.4 Upshot Of Competitive Benchmarking a) In terms of export value currently India is the second largest exporter subsequent to
China, and thus though it appears competitive per se; the fact remains that it will be facing increased competition in the near future from countries other than China, mainly Vietnam, Thailand and Indonesia because these countries in addition to being low cost producers and being extremely price competitive are also engaging in aggressive trade promotion and market development efforts.
b) For India, China and Vietnam are the main competitors for overall exports of craft
and decorative products because even though Thailand ranks 3rd in terms of overall export competitiveness; the difference between the rating for Thailand and India is not significant.
c) This is because Thailand’s competitive edge lays mainly in the effectiveness of its
target market related market development and promotion efforts post 2002, and supportive sector policies which has led to exports increasing by 7% in 2003 as compared to just 3% in 2002. But is not very strong in terms of basic industry competency as well as product variety and quality which are India’s strong points.
d) Currently, China is the most significant competitor for India not only because of
because of its ability to supply large volumes at extremely low prices and aggressive promotion which is an evident fact but mainly because of the strong industry competency and product development capability according to target market preferences which is far advanced as a result of the increasing FDI in the crafts sectors which across all product segments is in the range of 30% to 50%. The increasing FDI is not only from overseas Chinese from Hong Kong, Taiwan, Macao but also increasingly from European Union countries. The increasing contract manufacturing from European Union countries and high FDI is enabling China to increasingly use better technology and shift towards the larger attractive markets catering to the growing giftware and houseware segments whose main requirement is large volumes of internationally styled adaptations of traditional craft and decorative products.
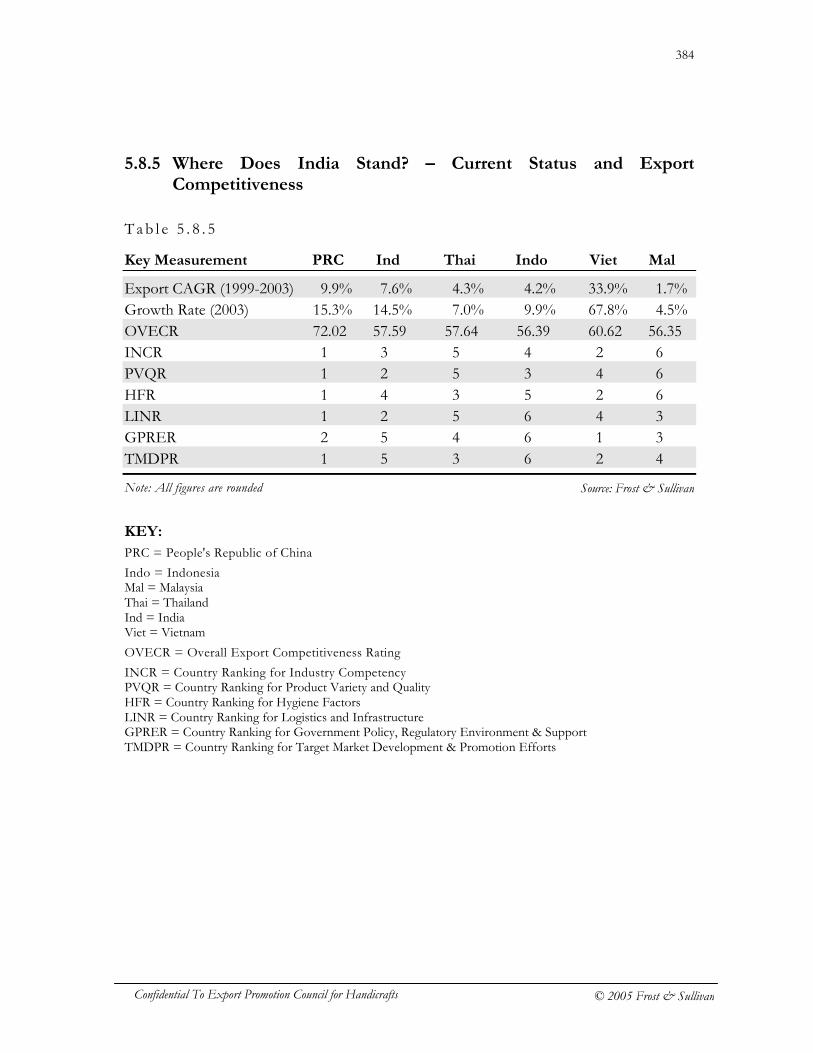
384
Confidential To Export Promotion Council for Handicrafts © 2005 Frost & Sullivan
5.8.5 Where Does India Stand? – Current Status and Export Competitiveness
Tab l e 5 . 8 . 5
Key Measurement PRC Ind Thai Indo Viet Mal
Export CAGR (1999-2003) 9.9% 7.6% 4.3% 4.2% 33.9% 1.7% Growth Rate (2003) 15.3% 14.5% 7.0% 9.9% 67.8% 4.5% OVECR 72.02 57.59 57.64 56.39 60.62 56.35 INCR 1 3 5 4 2 6 PVQR 1 2 5 3 4 6 HFR 1 4 3 5 2 6 LINR 1 2 5 6 4 3 GPRER 2 5 4 6 1 3 TMDPR 1 5 3 6 2 4
Note: All figures are rounded
KEY:
PRC = People's Republic of China
Indo = Indonesia Mal = Malaysia Thai = Thailand Ind = India Viet = Vietnam
OVECR = Overall Export Competitiveness Rating
INCR = Country Ranking for Industry Competency PVQR = Country Ranking for Product Variety and Quality HFR = Country Ranking for Hygiene Factors LINR = Country Ranking for Logistics and Infrastructure GPRER = Country Ranking for Government Policy, Regulatory Environment & Support TMDPR = Country Ranking for Target Market Development & Promotion Efforts
Source: Frost & Sullivan
385
Confidential To Export Promotion Council for Handicrafts © 2005 Frost & Sullivan
SECTION 6 – ANALYSIS OF MARKET OPPORTUNITIES
The chapter builds-upon the previous chapters that established the complete landscape for world crafts and decorative products trade and ascertained India’s export competitiveness vis-à-vis competition, by further narrowing down on realistic market opportunities for India in terms of :-
� Products � Country Markets � Niches or market segments in country markets
6.1 ISSUES INVOLVED IN ASSESSING NATURE AND
QUANTUM OF MARKET OPPORTUNITIES a) Analysis of India’s crafts export product portfolio to identify product categories
wherein India has
� High export potential � Medium export potential � Low export potential
(This takes into consideration factors like current export value, market share, year-on-year growth rate, CAGR (1999-2003). It also takes into consideration India’s craft sector capabilities in terms of products and manufacturing capabilities based on the latest available handicraft census 1996-97 and primary interviews conducted with major Indian manufacturers and exporters).
b) Analysis of market potential of importing countries to identify markets that offers
the highest potential to India. This includes the identification and classification of country markets as - � Large markets that offer high market potential and are best suited for India’s
present product portfolio � Large markets that have high market potential as markets for crafts and
decorative products but currently are relatively less suited to India’s present product portfolio
� Relatively smaller markets that offer good potential to India and are best suited for India’s present product portfolio
� Emerging markets that can be tapped
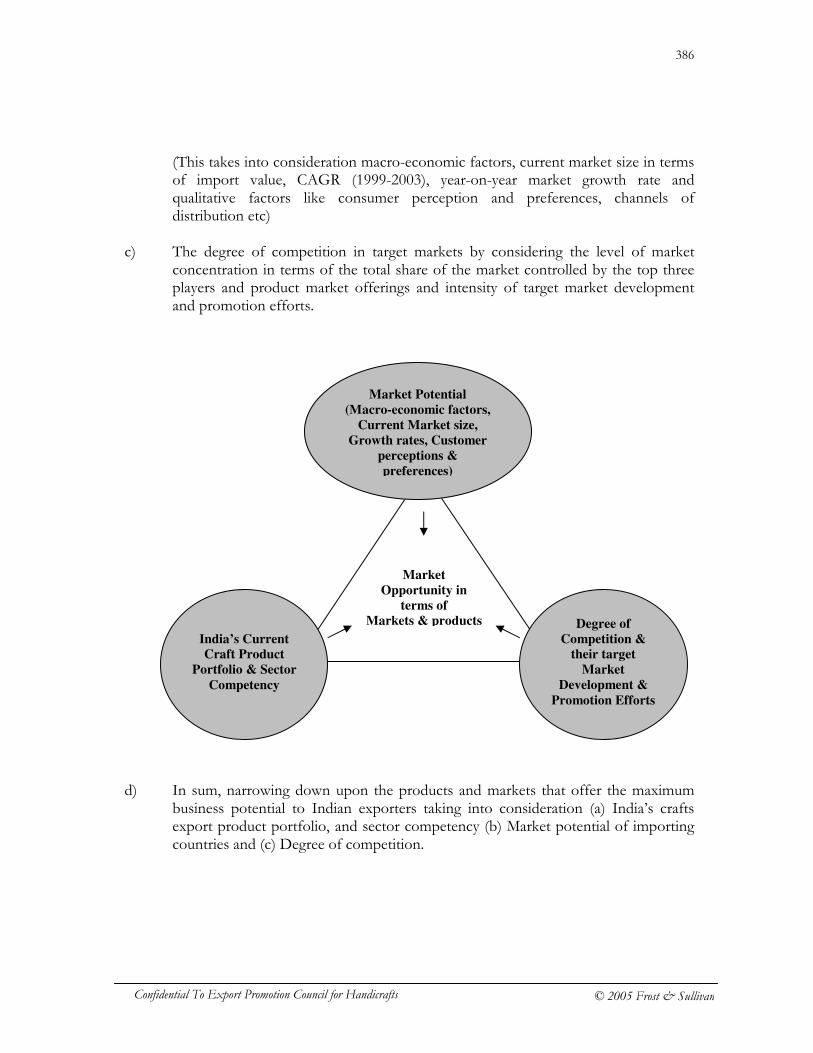
386
Confidential To Export Promotion Council for Handicrafts © 2005 Frost & Sullivan
(This takes into consideration macro-economic factors, current market size in terms of import value, CAGR (1999-2003), year-on-year market growth rate and qualitative factors like consumer perception and preferences, channels of distribution etc)
c) The degree of competition in target markets by considering the level of market
concentration in terms of the total share of the market controlled by the top three players and product market offerings and intensity of target market development and promotion efforts.
d) In sum, narrowing down upon the products and markets that offer the maximum
business potential to Indian exporters taking into consideration (a) India’s crafts export product portfolio, and sector competency (b) Market potential of importing countries and (c) Degree of competition.
Market
Opportunity in
terms of Markets & products
India’s Current Craft Product
Portfolio & Sector
Competency
Market Potential
(Macro-economic factors,
Current Market size,
Growth rates, Customer
perceptions &
preferences)
Degree of
Competition & their target
Market
Development &
Promotion Efforts
387
Confidential To Export Promotion Council for Handicrafts © 2005 Frost & Sullivan
6.2 UPSHOT OF THE ANALYSIS
Based on our analysis of the above listed issues our reading of the market opportunity suggests: a) There basically exist three market segments or niches in important target
markets like US, Japan and especially Europe where in Indian Handicraft producers can compete:
� Ethnic/Traditional Handicrafts - This first category refers to the
market segment for ethnic and traditional handicrafts like hand woven or hand painted or embroidered textiles and clothing, and other mostly decorative items that closely represent the culture, deities, people etc of the country of origin.
� Handicrafts that have been adapted for international markets -
This second category refers to the market segment wherein the products have been slightly westernized and given a functional purpose or utility that is in demand in the target country. Like for example the batik prints that have been slightly modified and used to manufacture sarongs, shirts and other casual dresses or beachwear to suit European and US markets. Or say purely decorative statuettes that have been transformed into useful products popular in the target markets like salad servers etc. Thus in this segment the designs and craftsmanship specific to a country of origin may still be evident even though the products are adapted for the target market. However in this case the main attraction to the customer is the rustic and handcrafted look of the product rather than the country of origin.
� Handicrafts designed by foreign buyers and manufactured under
OEM/ contract manufacturing arrangements - This third category refers to the manufacturing of handicraft products for foreign companies/ buyers under what is referred to as “OEM - Original Equipment Manufacturing” or “Contract Manufacturing”. Here, the products are designed by foreign companies and the same are manufactured in a traditional handicraft supplying country.
b) Currently, the market segment for ethnic/traditional products is small in
value terms with limited growth. The main channels for distribution of such products are agents and importers who sell these products to a number of independent retail shops, boutiques and a few galleries. And also the alternate distribution channel of “Fair Trade”; which is currently very active in European countries mainly Netherlands, UK and Germany.
388
Confidential To Export Promotion Council for Handicrafts © 2005 Frost & Sullivan
c) The market segment that includes handicrafts that have been adapted for the international markets is large in value terms and is the main growth segment. The main channels for distribution of these products are large retail chains (especially in the US) who are increasingly importing large volumes of such products and also some importers who sell to a large variety of smaller retail formats.
d) The OEM/contract manufacturing segment described above is the segment
offering the highest market potential especially for the European Union countries like Italy, France, Germany, Spain and UK.
6.3 ANALYSIS OF INDIA’S CRAFTS EXPORT PRODUCT
PORTFOLIO
ISSUES INVOLVED IN ASSESSING THE EXPORT POTENTIAL OF CRAFT PRODUCTS
� Absolute size of the world market for a product category � Market growth rate for a product category � Degree of market concentration for a product category � Effectiveness of market development efforts of competitors for a
product category � World market share of India for a product category � India’s export growth rate for a product category � Absolute export value for a product category � Effectiveness of India’s market development efforts for a product
category � Manufacturing and sector capabilities for a product category � Current product suitability in world market for crafts and decorative
products for a product category
The analysis framework developed by Frost & Sullivan to identify product categories wherein India has good export potential has been done on the overall level taking into consideration the world market for crafts and decorative products and consists of two broad phases:-
For each product category, the first step involved assessing the market opportunities, per se, that is not taking into account the strengths, weaknesses of the Indian crafts exporters & sector itself, but looking at the market opportunity, in isolation, from the point of view of market expansion and market penetration. The next step involved, finding out how strong and competent, are Indian exporters and the Indian craft sector itself in case of each product category.
389
Confidential To Export Promotion Council for Handicrafts © 2005 Frost & Sullivan
The specific activities were split into two phases. These were:- PHASE I – ASSESSING MARKET ATTRACTIVENESS FOR EACH PRODUCT CATEGORY a) We listed out the key factors that help in assessing the market opportunities for
market expansion and market penetration in case of each product category. This was done to look at the overall market attractiveness for each product category, regardless how strong and competent, are Indian exporters and the Indian craft sector itself in case of each product category;
b) The next step involved using a proprietary analysis model that helps in
understanding the relative importance of each factor and the underlying relationship between each factor.
c) Once we were able to understand the relationship between each of the factors and
the importance structure or rank order of these factors, importance weights were assigned to each factor;
d) This done, each product category was assessed in terms of overall market
opportunity by giving a score (points out of 100) for each factor; e) In this fashion, a rating in terms of each of the listed factors was computed with the
calculation of the weight and score by using a base weight of 1.0 and each factor then being able to get a maximum possible rating of 100. The total “Attractiveness Rating” for each product category was then calculated by adding all ratings for all the listed factors and the final rating being in the range of 1-100. Based on the ratings each product category was given relative ranks.
PHASE II – ASSESSING BUSINESS STRENGTH OF INDIAN CRAFT SECTOR AND INDIAN CRAFT EXPORTERS a) Listing out the key factors to assess how strong and competent, are Indian exporters
and the Indian craft sector itself in case of each product category b) The next step involved using a proprietary analysis model that helps in
understanding the relative importance of each factor and the underlying relationship between each factor. This done, importance weight were assigned to each factor;
c) Then, a score was assigned to each factor; d) In this fashion, a rating in terms of each of the listed factors was computed with the
calculation of the weight and score by using a base weight of 1.0 and each factor then being able to get a maximum possible rating of 100. The total “Business
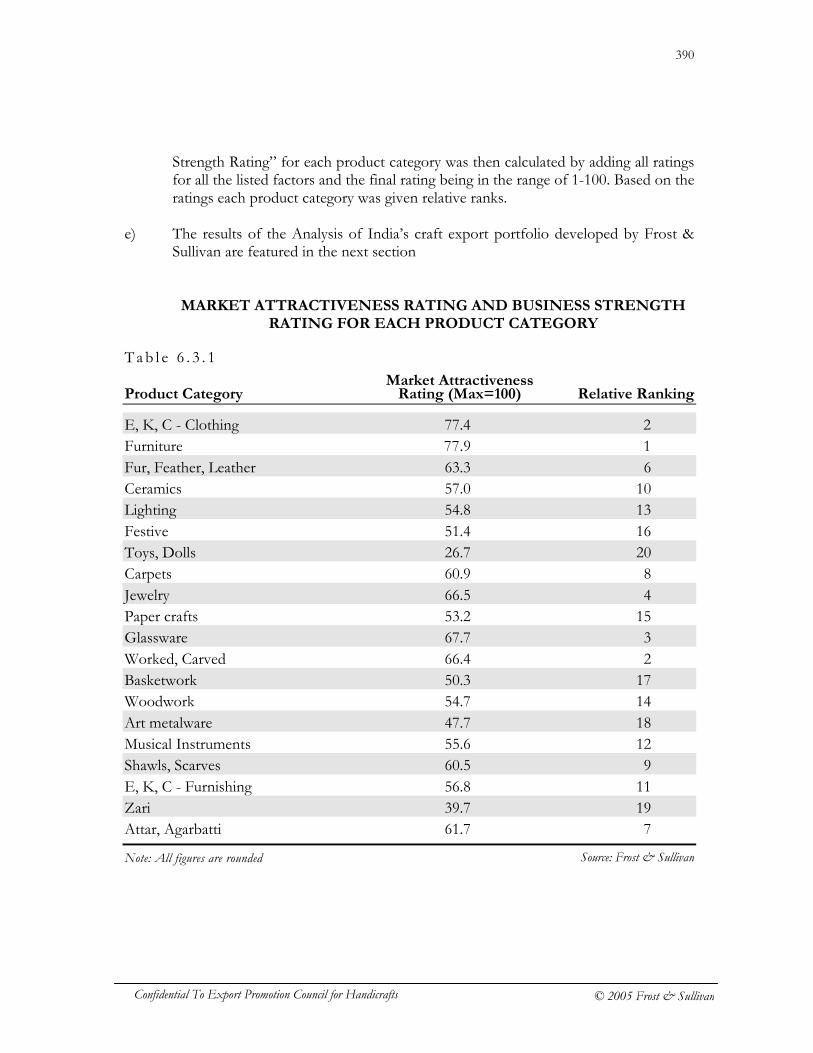
390
Confidential To Export Promotion Council for Handicrafts © 2005 Frost & Sullivan
Strength Rating” for each product category was then calculated by adding all ratings for all the listed factors and the final rating being in the range of 1-100. Based on the ratings each product category was given relative ranks.
e) The results of the Analysis of India’s craft export portfolio developed by Frost &
Sullivan are featured in the next section
MARKET ATTRACTIVENESS RATING AND BUSINESS STRENGTH RATING FOR EACH PRODUCT CATEGORY
Tab l e 6 . 3 . 1
Market Attractiveness Product Category Rating (Max=100) Relative Ranking
E, K, C - Clothing 77.4 2 Furniture 77.9 1 Fur, Feather, Leather 63.3 6 Ceramics 57.0 10 Lighting 54.8 13 Festive 51.4 16 Toys, Dolls 26.7 20 Carpets 60.9 8 Jewelry 66.5 4 Paper crafts 53.2 15 Glassware 67.7 3 Worked, Carved 66.4 2 Basketwork 50.3 17 Woodwork 54.7 14 Art metalware 47.7 18 Musical Instruments 55.6 12 Shawls, Scarves 60.5 9 E, K, C - Furnishing 56.8 11 Zari 39.7 19 Attar, Agarbatti 61.7 7
Note: All figures are rounded
Source: Frost & Sullivan
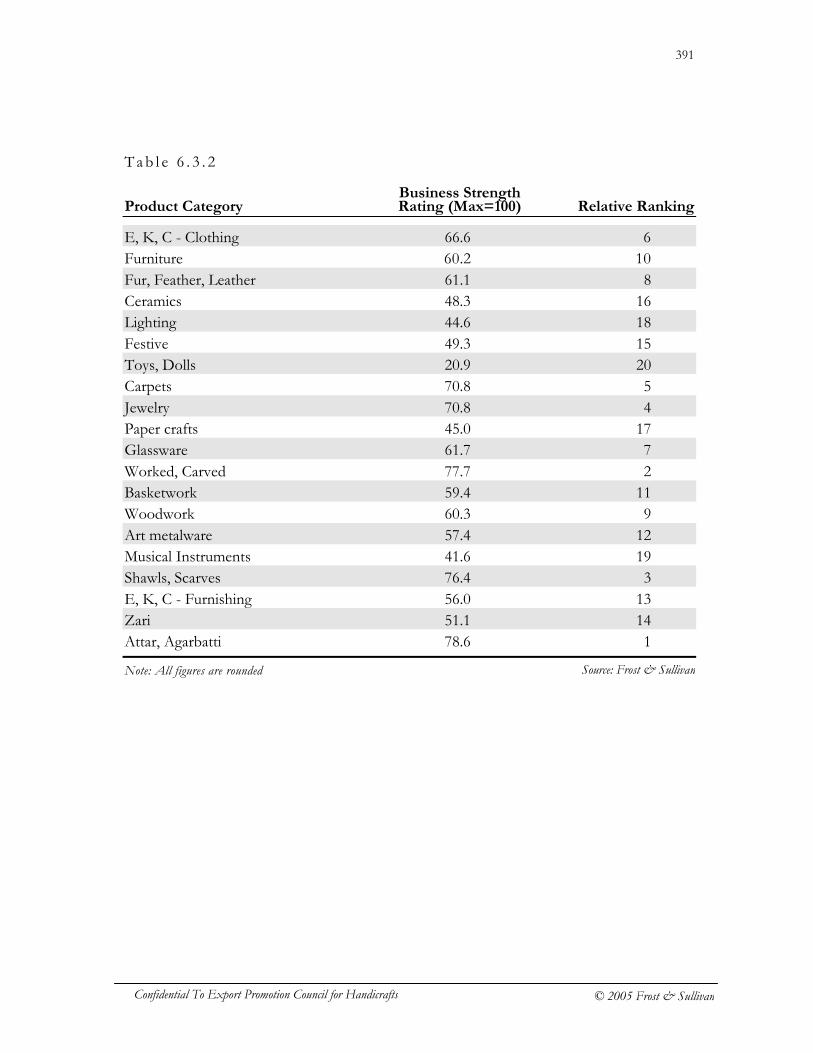
391
Confidential To Export Promotion Council for Handicrafts © 2005 Frost & Sullivan
Tab l e 6 . 3 . 2
Business Strength Product Category Rating (Max=100) Relative Ranking
E, K, C - Clothing 66.6 6 Furniture 60.2 10 Fur, Feather, Leather 61.1 8 Ceramics 48.3 16 Lighting 44.6 18 Festive 49.3 15 Toys, Dolls 20.9 20 Carpets 70.8 5 Jewelry 70.8 4 Paper crafts 45.0 17 Glassware 61.7 7 Worked, Carved 77.7 2 Basketwork 59.4 11 Woodwork 60.3 9 Art metalware 57.4 12 Musical Instruments 41.6 19 Shawls, Scarves 76.4 3 E, K, C - Furnishing 56.0 13 Zari 51.1 14 Attar, Agarbatti 78.6 1
Note: All figures are rounded
Source: Frost & Sullivan
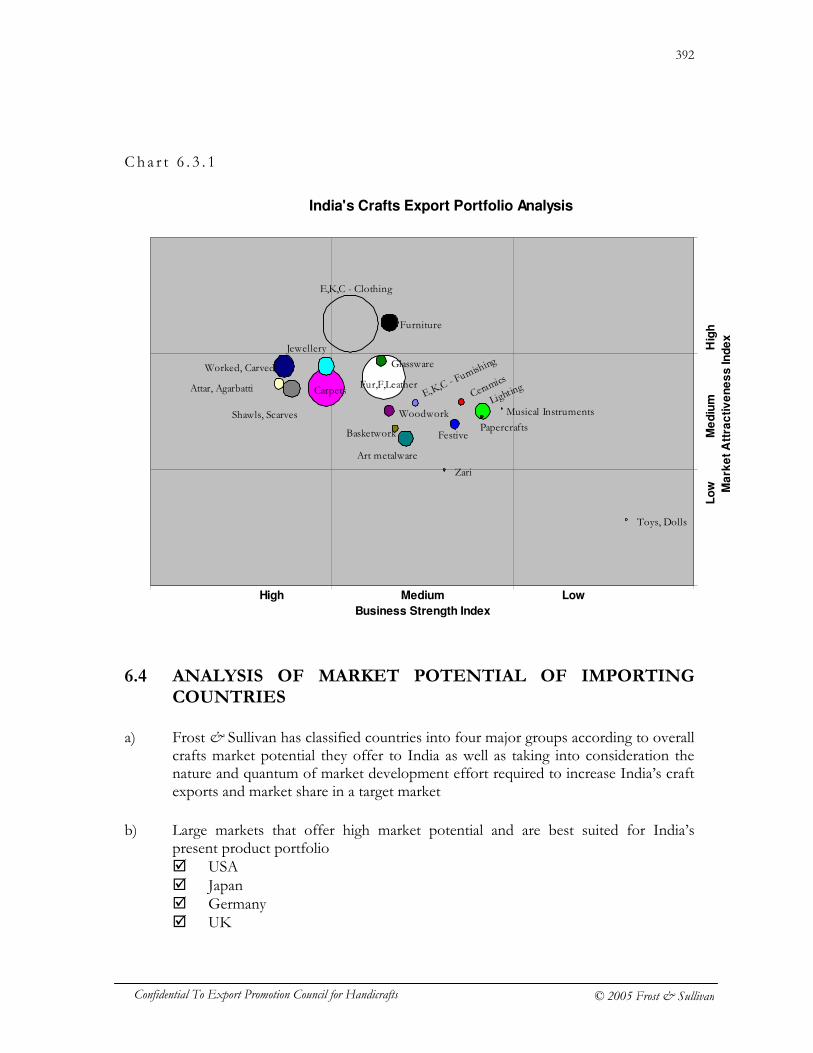
392
Confidential To Export Promotion Council for Handicrafts © 2005 Frost & Sullivan
Cha r t 6 . 3 . 1
6.4 ANALYSIS OF MARKET POTENTIAL OF IMPORTING COUNTRIES
a) Frost & Sullivan has classified countries into four major groups according to overall
crafts market potential they offer to India as well as taking into consideration the nature and quantum of market development effort required to increase India’s craft exports and market share in a target market
b) Large markets that offer high market potential and are best suited for India’s
present product portfolio � USA � Japan � Germany � UK
India's Crafts Export Portfolio Analysis
E,K,C - Clothing
Furniture
Fur,F,LeatherCer
amics
Lighting
Festive
Toys, Dolls
Carpets
Jewellery
Papercrafts
GlasswareWorked, Carved
Basketwork
Woodwork
Art metalware
Musical InstrumentsShawls, Scarves
E,K,C -
Furnis
hing
Zari
Attar, Agarbatti
High Medium Low
Business Strength Index
Lo
w
M
ed
ium
Hig
h
Ma
rke
t A
ttra
cti
ve
ne
ss
In
de
x
393
Confidential To Export Promotion Council for Handicrafts © 2005 Frost & Sullivan
� Canada � Belgium � Spain � Netherlands � Mexico � Australia
c) Large markets that have high market potential as markets for crafts and decorative
products but currently are relatively less suited to India’s present product portfolio � France � Italy � Switzerland � Austria
d) Relatively smaller markets that offer good potential to India and are best suited for
India’s present product portfolio � Sweden � Denmark � Singapore � Norway � Saudi Arabia � UAE � Ireland � Russian Federation � South Africa
e) Emerging markets that can be tapped
� Norway � Greece � Poland � Hungary � Czech Rep. � Finland � Israel � Romania � New Zealand � Turkey
Note: A sequential road-map for export market development has been developed by Frost & Sullivan for the short term and medium term and is included under Section 7.
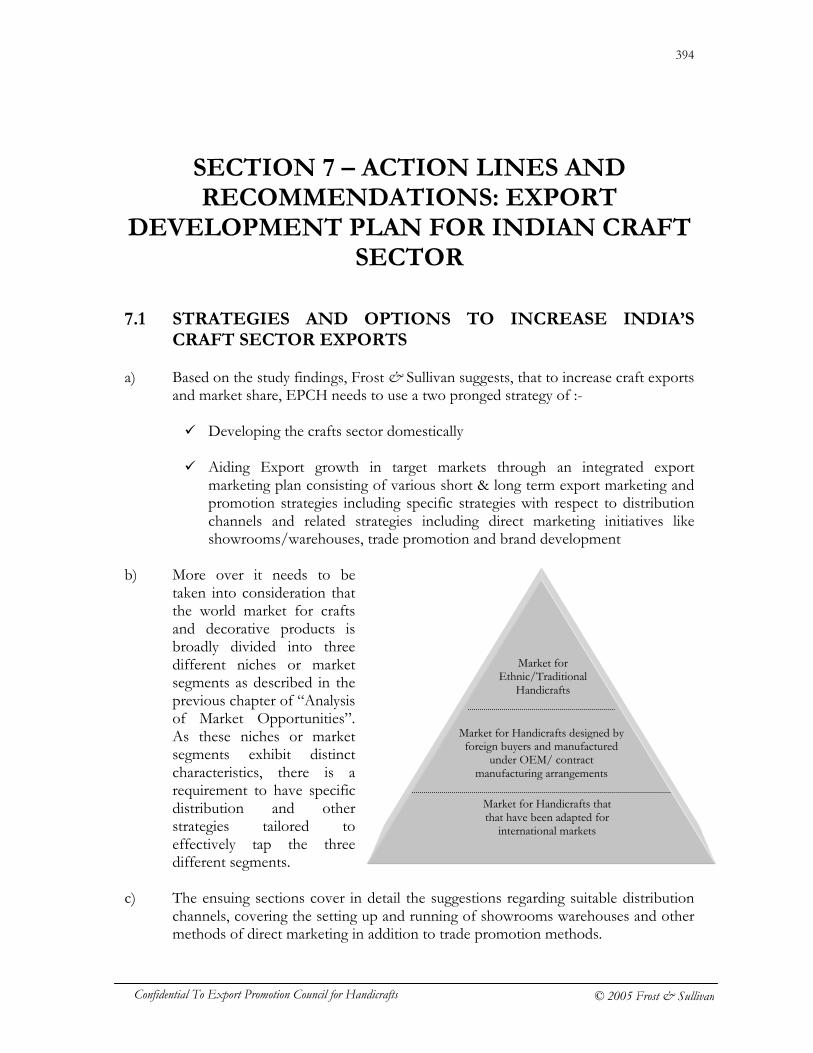
394
Confidential To Export Promotion Council for Handicrafts © 2005 Frost & Sullivan
Market for Ethnic/Traditional
Handicrafts
Market for Handicrafts that that have been adapted for
international markets
Market for Handicrafts designed by foreign buyers and manufactured
under OEM/ contract manufacturing arrangements
SECTION 7 – ACTION LINES AND RECOMMENDATIONS: EXPORT
DEVELOPMENT PLAN FOR INDIAN CRAFT SECTOR
7.1 STRATEGIES AND OPTIONS TO INCREASE INDIA’S
CRAFT SECTOR EXPORTS a) Based on the study findings, Frost & Sullivan suggests, that to increase craft exports
and market share, EPCH needs to use a two pronged strategy of :- � Developing the crafts sector domestically
� Aiding Export growth in target markets through an integrated export
marketing plan consisting of various short & long term export marketing and promotion strategies including specific strategies with respect to distribution channels and related strategies including direct marketing initiatives like showrooms/warehouses, trade promotion and brand development
b) More over it needs to be
taken into consideration that the world market for crafts and decorative products is broadly divided into three different niches or market segments as described in the previous chapter of “Analysis of Market Opportunities”. As these niches or market segments exhibit distinct characteristics, there is a requirement to have specific distribution and other strategies tailored to effectively tap the three different segments.
c) The ensuing sections cover in detail the suggestions regarding suitable distribution
channels, covering the setting up and running of showrooms warehouses and other methods of direct marketing in addition to trade promotion methods.
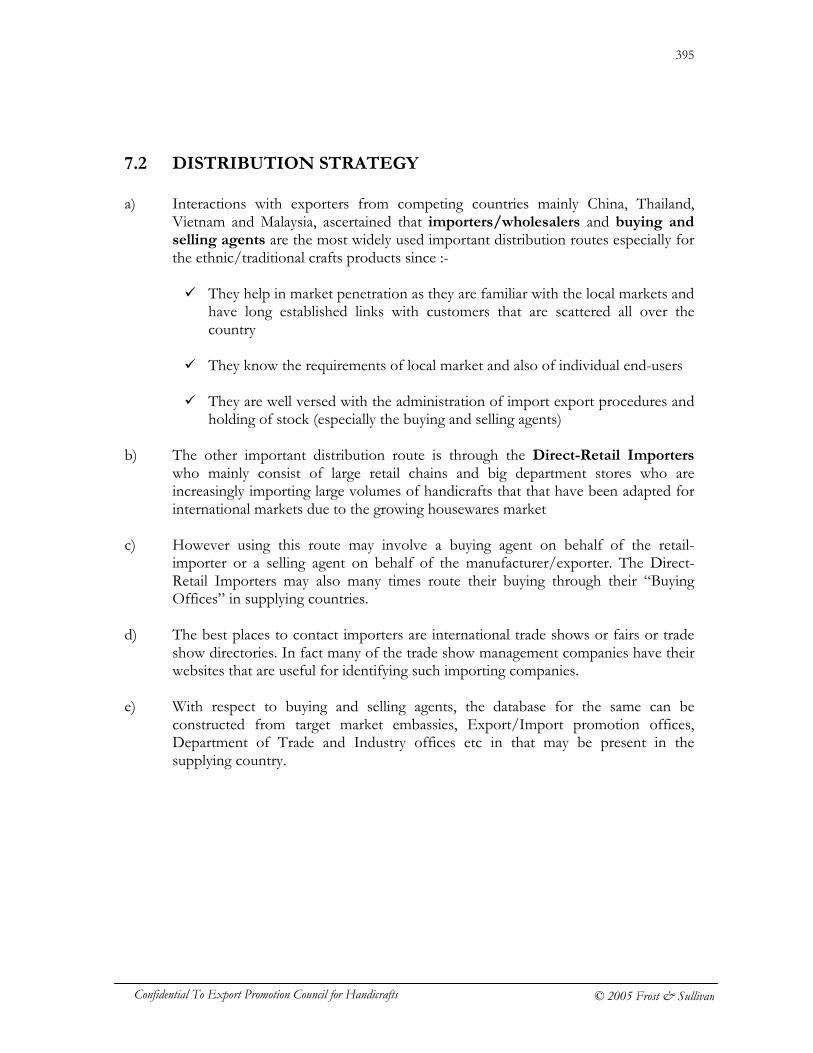
395
Confidential To Export Promotion Council for Handicrafts © 2005 Frost & Sullivan
7.2 DISTRIBUTION STRATEGY a) Interactions with exporters from competing countries mainly China, Thailand,
Vietnam and Malaysia, ascertained that importers/wholesalers and buying and selling agents are the most widely used important distribution routes especially for the ethnic/traditional crafts products since :-
� They help in market penetration as they are familiar with the local markets and
have long established links with customers that are scattered all over the country
� They know the requirements of local market and also of individual end-users
� They are well versed with the administration of import export procedures and
holding of stock (especially the buying and selling agents) b) The other important distribution route is through the Direct-Retail Importers
who mainly consist of large retail chains and big department stores who are increasingly importing large volumes of handicrafts that that have been adapted for international markets due to the growing housewares market
c) However using this route may involve a buying agent on behalf of the retail-
importer or a selling agent on behalf of the manufacturer/exporter. The Direct-Retail Importers may also many times route their buying through their “Buying Offices” in supplying countries.
d) The best places to contact importers are international trade shows or fairs or trade
show directories. In fact many of the trade show management companies have their websites that are useful for identifying such importing companies.
e) With respect to buying and selling agents, the database for the same can be
constructed from target market embassies, Export/Import promotion offices, Department of Trade and Industry offices etc in that may be present in the supplying country.
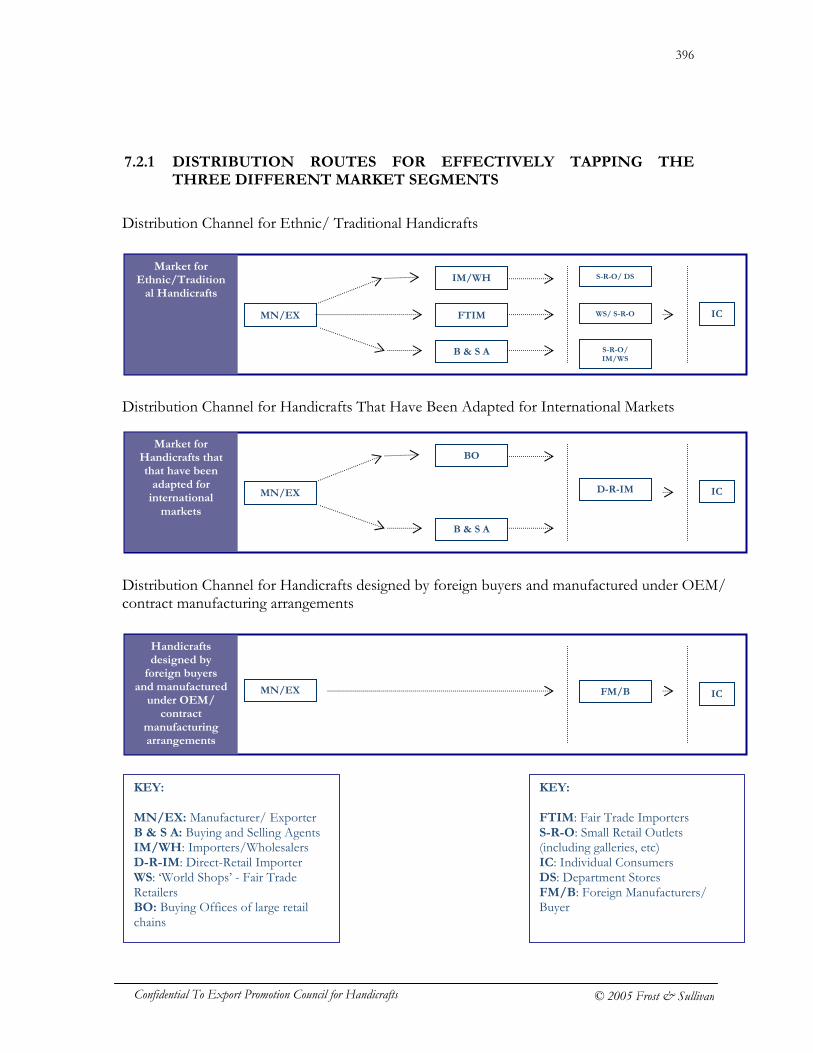
396
Confidential To Export Promotion Council for Handicrafts © 2005 Frost & Sullivan
7.2.1 DISTRIBUTION ROUTES FOR EFFECTIVELY TAPPING THE THREE DIFFERENT MARKET SEGMENTS
Distribution Channel for Handicrafts That Have Been Adapted for International Markets
Market for Handicrafts that that have been
adapted for international
markets
BO
MN/EX
B & S A
D-R-IM IC
Distribution Channel for Handicrafts designed by foreign buyers and manufactured under OEM/ contract manufacturing arrangements
Handicrafts designed by
foreign buyers and manufactured
under OEM/ contract
manufacturing arrangements
MN/EX FM/B IC
KEY: MN/EX: Manufacturer/ Exporter B & S A: Buying and Selling Agents IM/WH: Importers/Wholesalers D-R-IM: Direct-Retail Importer WS: ‘World Shops’ - Fair Trade Retailers BO: Buying Offices of large retail chains
KEY: FTIM: Fair Trade Importers S-R-O: Small Retail Outlets (including galleries, etc) IC: Individual Consumers DS: Department Stores FM/B: Foreign Manufacturers/ Buyer
Distribution Channel for Ethnic/ Traditional Handicrafts
Market for Ethnic/Tradition
al Handicrafts
IM/WH
MN/EX
B & S A
S-R-O/ DS
WS/ S-R-O
S-R-O/ IM/WS
IC FTIM
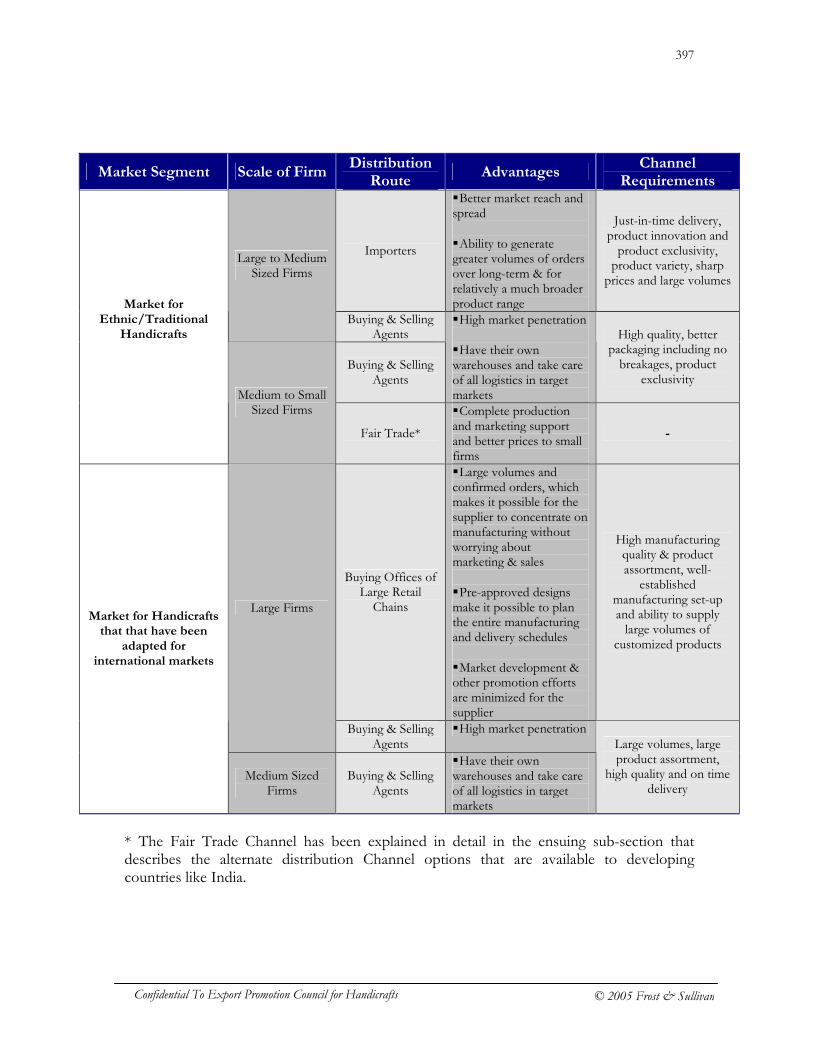
397
Confidential To Export Promotion Council for Handicrafts © 2005 Frost & Sullivan
Market Segment Scale of Firm Distribution
Route Advantages
Channel Requirements
Importers
� Better market reach and spread � Ability to generate greater volumes of orders over long-term & for relatively a much broader product range
Just-in-time delivery, product innovation and product exclusivity, product variety, sharp
prices and large volumes
Large to Medium Sized Firms
Buying & Selling Agents
Buying & Selling Agents
� High market penetration � Have their own warehouses and take care of all logistics in target markets
High quality, better packaging including no breakages, product
exclusivity
Market for Ethnic/Traditional
Handicrafts
Medium to Small Sized Firms
Fair Trade*
� Complete production and marketing support and better prices to small firms
-
Buying Offices of Large Retail Chains
� Large volumes and confirmed orders, which makes it possible for the supplier to concentrate on manufacturing without worrying about marketing & sales � Pre-approved designs make it possible to plan the entire manufacturing and delivery schedules � Market development & other promotion efforts are minimized for the supplier
High manufacturing quality & product assortment, well-
established manufacturing set-up and ability to supply large volumes of
customized products
Large Firms
Buying & Selling Agents
� High market penetration
Market for Handicrafts that that have been
adapted for international markets
Medium Sized Firms
Buying & Selling Agents
� Have their own warehouses and take care of all logistics in target markets
Large volumes, large product assortment,
high quality and on time delivery
* The Fair Trade Channel has been explained in detail in the ensuing sub-section that describes the alternate distribution Channel options that are available to developing countries like India.
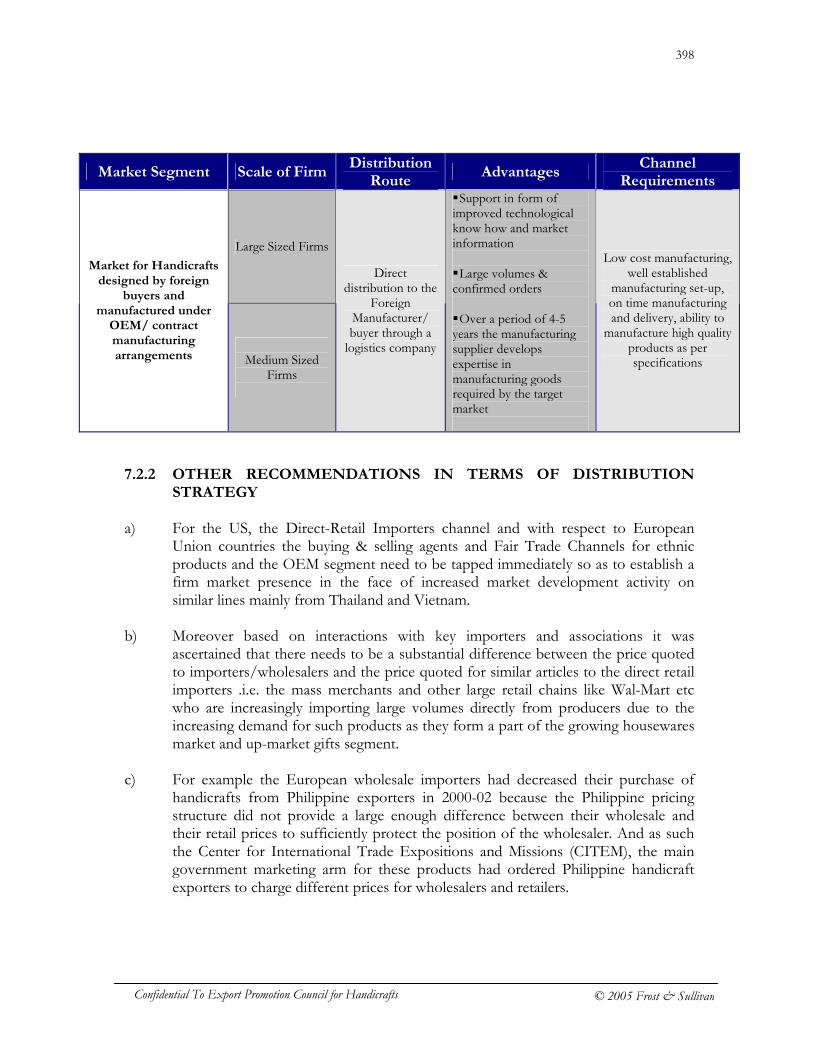
398
Confidential To Export Promotion Council for Handicrafts © 2005 Frost & Sullivan
Market Segment Scale of Firm Distribution
Route Advantages
Channel Requirements
Large Sized Firms
Market for Handicrafts designed by foreign
buyers and manufactured under
OEM/ contract manufacturing arrangements
Medium Sized
Firms
Direct distribution to the
Foreign Manufacturer/ buyer through a logistics company
� Support in form of improved technological know how and market information � Large volumes & confirmed orders � Over a period of 4-5 years the manufacturing supplier develops expertise in manufacturing goods required by the target market
Low cost manufacturing, well established
manufacturing set-up, on time manufacturing and delivery, ability to
manufacture high quality products as per specifications
7.2.2 OTHER RECOMMENDATIONS IN TERMS OF DISTRIBUTION
STRATEGY a) For the US, the Direct-Retail Importers channel and with respect to European
Union countries the buying & selling agents and Fair Trade Channels for ethnic products and the OEM segment need to be tapped immediately so as to establish a firm market presence in the face of increased market development activity on similar lines mainly from Thailand and Vietnam.
b) Moreover based on interactions with key importers and associations it was
ascertained that there needs to be a substantial difference between the price quoted to importers/wholesalers and the price quoted for similar articles to the direct retail importers .i.e. the mass merchants and other large retail chains like Wal-Mart etc who are increasingly importing large volumes directly from producers due to the increasing demand for such products as they form a part of the growing housewares market and up-market gifts segment.
c) For example the European wholesale importers had decreased their purchase of
handicrafts from Philippine exporters in 2000-02 because the Philippine pricing structure did not provide a large enough difference between their wholesale and their retail prices to sufficiently protect the position of the wholesaler. And as such the Center for International Trade Expositions and Missions (CITEM), the main government marketing arm for these products had ordered Philippine handicraft exporters to charge different prices for wholesalers and retailers.
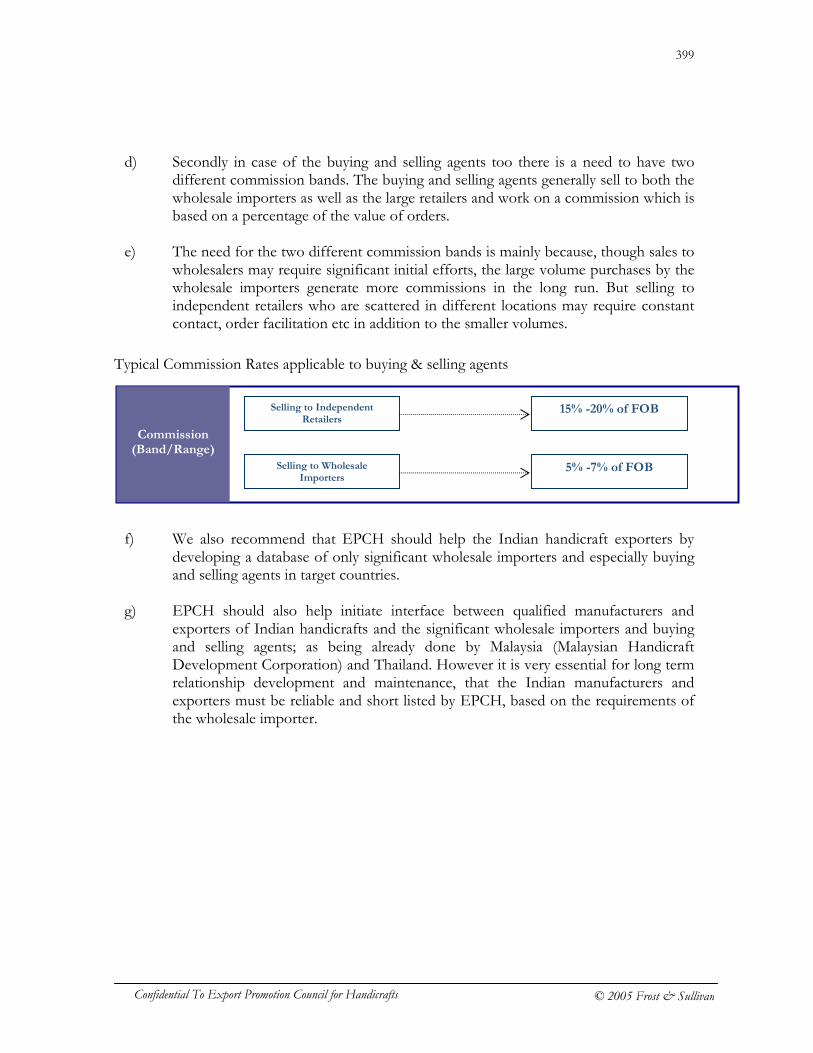
399
Confidential To Export Promotion Council for Handicrafts © 2005 Frost & Sullivan
d) Secondly in case of the buying and selling agents too there is a need to have two different commission bands. The buying and selling agents generally sell to both the wholesale importers as well as the large retailers and work on a commission which is based on a percentage of the value of orders.
e) The need for the two different commission bands is mainly because, though sales to
wholesalers may require significant initial efforts, the large volume purchases by the wholesale importers generate more commissions in the long run. But selling to independent retailers who are scattered in different locations may require constant contact, order facilitation etc in addition to the smaller volumes.
f) We also recommend that EPCH should help the Indian handicraft exporters by
developing a database of only significant wholesale importers and especially buying and selling agents in target countries.
g) EPCH should also help initiate interface between qualified manufacturers and exporters of Indian handicrafts and the significant wholesale importers and buying and selling agents; as being already done by Malaysia (Malaysian Handicraft Development Corporation) and Thailand. However it is very essential for long term relationship development and maintenance, that the Indian manufacturers and exporters must be reliable and short listed by EPCH, based on the requirements of the wholesale importer.
Typical Commission Rates applicable to buying & selling agents
Commission (Band/Range)
Selling to Wholesale Importers
Selling to Independent Retailers
15% -20% of FOB
5% -7% of FOB
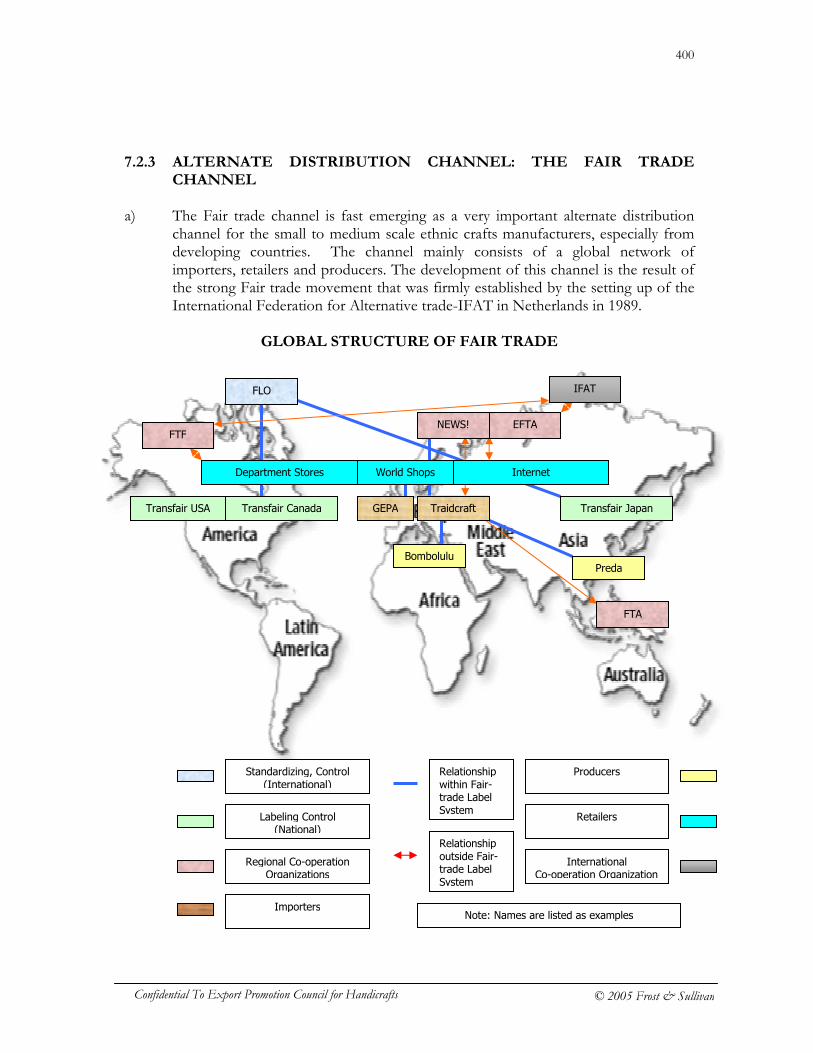
400
Confidential To Export Promotion Council for Handicrafts © 2005 Frost & Sullivan
7.2.3 ALTERNATE DISTRIBUTION CHANNEL: THE FAIR TRADE CHANNEL
a) The Fair trade channel is fast emerging as a very important alternate distribution
channel for the small to medium scale ethnic crafts manufacturers, especially from developing countries. The channel mainly consists of a global network of importers, retailers and producers. The development of this channel is the result of the strong Fair trade movement that was firmly established by the setting up of the International Federation for Alternative trade-IFAT in Netherlands in 1989.
GLOBAL STRUCTURE OF FAIR TRADE
Standardizing, Control (International)
Labeling Control (National)
Regional Co-operation Organizations
Importers
Producers
Retailers
International Co-operation Organization
Relationship within Fair-trade Label System
Relationship outside Fair-trade Label System
Transfair USA Transfair Canada
IFAT
EFTA NEWS!
FTA
Preda
Transfair Japan
Bombolulu
GEPA Traidcraft
Department Stores Internet World Shops
FLO
FTF
Note: Names are listed as examples
401
Confidential To Export Promotion Council for Handicrafts © 2005 Frost & Sullivan
b) The Fair Trade Channel is focused on building equitable trading relationships between consumers and the world’s most economically disadvantaged artisans through a structured trade channel which includes
� Producer and export organizations (organized into co-operatives and
associations) � Importing organizations and wholesalers � Retailers - "World shops" � Accrediting bodies (providing the Fair Trade "guarantee")
7.2.2.1 ENTITIES IN THE FAIR TRADE CHANNEL FOR HANDICRAFTS a) Producer/ Exporter Organizations - These refer to crafts people from
developing countries organized into co-operatives & associations viz. Preda the producer crafts co-operative from Philippines, Bombolulu the producer co-operative of Arts & Crafts from Kenya.
b) Fair Trade Importing Organizations - Import organizations act as a bridge
between producers and consumers, purchasing directly from the suppliers (either directly from producer associations, or from exporters) and supplying to “World shops” and other retailers in the mainstream. Importers may also operate their own retail outlets. Many of them also use other sales channels such as commercial stores, shops, gift shops, supermarkets, and mail order catalogues.
c) Fair Trade Retail Organization - Fair trade retailers are stores, either brick and
mortar or Internet-based, or mail order catalogs, that carry fairly trade items, bought directly from Fair Trade Producer Organizations or from Fair Trade Importers and Wholesalers. Fair Trade Retailers often import and wholesale as well. These are also referred to as World Shops.
7.2.2.2 MAIN INTERNATIONAL, REGIONAL & NATIONAL LEVEL
ACCREDITING ORGANIZATIONS INVOLVED IN FAIR TRADE
The two main Organizations at the International level are the IFAT & FLO-I a) IFAT - International Federation for Alternative Trade - IFAT is the only global
membership association of Fair Trade Organizations, currently with around 250 members in 59 countries. It was established in 1989 as a global coalition of organizations involved in Fair Trade. It brings together producer groups from Africa, Asia and Latin America with importing organizations and Fair Trade support organizations from Europe, Japan and North America. IFAT supports its members in their efforts to expand the Fair Trade market. It does so by the collection and
402
Confidential To Export Promotion Council for Handicrafts © 2005 Frost & Sullivan
dissemination of market information, by acting as an information point, and by providing advice and guidance on such issues as monitoring.
b) FLO-I - Fair trade Labeling Organization International - Fairtrade Labeling
Organization-International (FLO-I) is the official worldwide Fair Trade certification organization, administering the Fair Trade label via nineteen national initiatives (The Fairtrade foundation-UK, Transfair-US, Canada, Japan, Max Havelaar –the Netherlands. FLO exists to improve the position of the poor and disadvantaged producers in the developing world, by setting the Fairtrade standards and by creating a framework that enables trade to take place at conditions respecting their interests. FLO-I acts as an umbrella organization to these national initiatives, mainly in the developed world.
7.2.2.3 IMPORTANT REGIONAL LEVEL FAIR TRADE ORGANIZATIONS a) FTF- Fair Trade Federation - FTF is an association of fair trade wholesalers,
retailers, and producers whose members are committed to providing fair wages and good employment opportunities to economically disadvantaged artisans and farmers worldwide. Although membership is open to groups from all over the world, FTF's network is mostly made up of North American organizations.
b) EFTA- European Fair Trade Association - EFTA is a network of 11 Fair Trade
organizations in nine European countries which import Fair Trade products from some 400 economically disadvantaged producer groups in Africa, Asia and Latin America.
c) NEWS! - Network of European world Shops - NEWS was established in 1994,
as a network of national associations of world shops, representing more than 2,700 shops in 13 countries. NEWS facilitates cooperation and networking between its members by providing information (newsletters, website, workshops, etc.) and by organizing a biannual European world shops conference. It develops and coordinates European-wide campaign activities and provides members with the materials needed to participate.
d) FTA - Fair Trade Association - The FTA was established in 2003 in Australia. It
is an association of importing & wholesaling associations from Australia & New Zealand.
403
Confidential To Export Promotion Council for Handicrafts © 2005 Frost & Sullivan
7.2.2.4 SIGNIFICANCE OF FAIR TRADE CHANNEL FOR INDIA a) The Fair Trade Channel for crafts products will offer small disadvantaged artisans
and craft producers in India an access to international markets with complete support right from product development and manufacturing to export marketing.
b) The Fair Trade Channel is currently very strong in European Union countries
mainly Netherlands, UK, Germany, Italy and Switzerland. c) According to the sales figures published by EFTA i.e. European Fair Trade
Association the sales of handicrafts through the channel is approximately 45 to 50 Million. In North America the estimated sales of handicrafts through the channel is approximately 15 to 20 Million.
d) Though the channel does not currently account for a large volume of sales it still is
an important channel for small and medium scale artisans and manufacturers who otherwise have no export access or exposure.
e) The starting of handicraft manufacturing and/or exporting co-operatives who are
registered with the prominent international and regional level Fair Trade Associations mentioned above will boost the exports of ethnic/ traditional handicrafts from small households and individual artisans engaged in manufacture of crafts products in India.
f) More over the fact that Fair Trade labeled crafts products are also finding a place in
the mainstream distribution (especially products that are exclusive but affordably priced); will also enable the producers to slowly penetrate the larger mainstream market.
g) Frost & Sullivan is thus of the opinion that the Fair Trade channel can be used to
develop the capability and market exposure of the core of the handicraft industry .i.e. the artisans and crafts households in the rural areas. It can also be leveraged to increase the foothold and market presence gradually, especially in the European Union countries.
404
Confidential To Export Promotion Council for Handicrafts © 2005 Frost & Sullivan
7.3 DIRECT MARKETING INITIATIVE - SHOWROOM AND WAREHOUSING INFRASTRUCTURE
a) Based on interactions with associations especially Department of Export
Promotion, Thailand and Malaysian Handicraft Development Corporation (MHDC) it was ascertained that other competing countries too have already established or are planning to establish showrooms in significant importing countries mainly USA and European Union countries to showcase their country’s crafts products.
b) As such considering market development efforts of competing countries and keeping in mind the long term market development, it is necessary that EPCH goes ahead with its “Three Phase Strategy” and opens showrooms and warehouses in the selected countries.
c) The selected countries viz. USA, Germany, U.K, and Netherlands are appropriate
taking into account their current market size, import values and potential market in terms of growth rate of imports. In fact Germany is a key country for the market development efforts for European Union in view of the German market being a major hub for crafts re-exports to other European Union countries as well as major Trade Fairs that are held in Germany viz. the Frankfurt Trade Fair which attracts many importers from all over Europe. Establishing warehouses and especially showrooms in Germany will act like a gateway to the other European Union countries.
d) However, though the market development efforts call for the setting up of
showrooms and warehouses, a first hand study of the showroom - India Pavilion set up in Dallas, USA under the first phase of the plan; calls for leveraging such a place and making active use of the place as a centre for continuous market development rather than a passive showcase for Indian handicraft products.
e) The ensuing section covers a detailed location analysis that will help EPCH narrow
down upon the appropriate locations for setting up showrooms in the selected countries.
f) A detailed profile of 10 major cities considered for showroom location has
been furnished as Annexure A
405
Confidential To Export Promotion Council for Handicrafts © 2005 Frost & Sullivan
7.4 PROMOTION a) The current competitive scenario requires India to have a continuous and well-
planned promotion program with promotional activities in India and target markets scheduled well in advance for the whole year.
b) The promotion program should be separately planned for the two main phases � Pre-importation � Post-importation
c) Pre-importation promotion program: This basically should be aimed at generating sufficient interest and consequent enquiries and confirmed orders and deals from importers especially large wholesale importers and Direct - Retail - Importers (large mass merchants). � Such promotion programs need to create a positive image of Indian crafts
sector and manufacturers per se, as suppliers of high quality, varied products that can be adapted to suit needs of the target market, if necessary. And convince the importers that Indian craft exporters will be able to supply the required volumes and offer the best value (perceived value) with respect to product and trade terms.
� The pre-importation promotion program should use a mix of different promotion tools and advertising avenues.
� In our opinion Local handicraft Fairs (India Shows), Select International Fairs and Internet and magazine advertising in select international trade magazines are the most effective forms of pre-importation promotion.
d) Post-importation promotion program: The Post-Importation Promotion
Program should be customized keeping in mind the market dynamics and consumer perceptions of the country in which the goods have been imported and it should be aimed at increasing sales, consumer interest and demand in the foreign market. � Generally the post-importation promotion is taken care of by the importer.
However considering the increasing post-importation promotional activities of competing countries mainly China, Vietnam and Thailand and viewing the increased sales and consumer demand of their products as an indicator of the effectiveness of their efforts; it is necessary that India too must step up efforts on this front.
406
Confidential To Export Promotion Council for Handicrafts © 2005 Frost & Sullivan
� Moreover when the importers run promotion programs they generally do not help in creating long term impact or sustained interest as different importers run independent promotion programs to suit their own requirements.
� We are of the opinion that the post-importation promotion program by Indian exporters as well as EPCH therefore calls for foreign country tailored magazine advertising, brand building, India road shows, craft festivals in target countries and also point of sale publicity through attractive display and banners and innovative and appealing packaging.
� The point of sale publicity applies to the sales in Indian showrooms set-up
abroad as well as sales through other foreign retailers by helping them in promotion by providing adequate labeling and product literature and also display banners.
� The ensuing sections cover specific details relating to the different pre and
post importation promotional and advertising tools mentioned above.
407
Confidential To Export Promotion Council for Handicrafts © 2005 Frost & Sullivan
7.5 TRADE FAIRS
a) Both US and European Union importers that have been interviewed, have stated that the crafts manufacturers and exporters from China, Hong Kong and recently from Thailand and also Vietnam are present in larger numbers at International Trade Fairs as compared to Indian manufacturers and exporters and moreover they are relatively better equipped with company and product literature as well as product samples. This leads to immediate orders.
b) As per current perception; the Indian manufacturers and exporters do not have
regular attendance at important International Fairs nor are they well equipped to generate sufficient and sustained interest.
� To address this issue, EPCH will have to encourage more numbers of reliable
Indian manufacturers and exporters to attend important select international trade fairs.
� It may be of help for EPCH to develop a database of reliable Indian
manufacturers and exporters and this also requires to be updated from time-to-time based on the track record of the export performance and related feedback from importers.
� The display and product samples available at the stalls of Indian crafts
exporters also must be very appealing. c) It is also very necessary that the International Trade Fairs be carefully selected based
on their turnout of important large importers from different importing countries as well as their ability to help Indian exporters to generate enquiries/orders.
d) This is important because interaction with some of the key exporters from India
revealed that at times the International Trade Fairs suggested by EPCH were not significant enough to help generate enquiries/orders.
e) Frost & Sullivan will provide a basic list of important International Trade Fairs
based on interaction with a few key importers, exporters from competing countries as well as feedback and opinion of important related associations in the field.
f) However it is essential that EPCH should keep updating the list of important
International Trade Fairs using the figures related to sales enquiries and confirmed orders generated at the trade fair.
NOTE: Please refer to the Annexure C for the list of important International Trade Fairs.
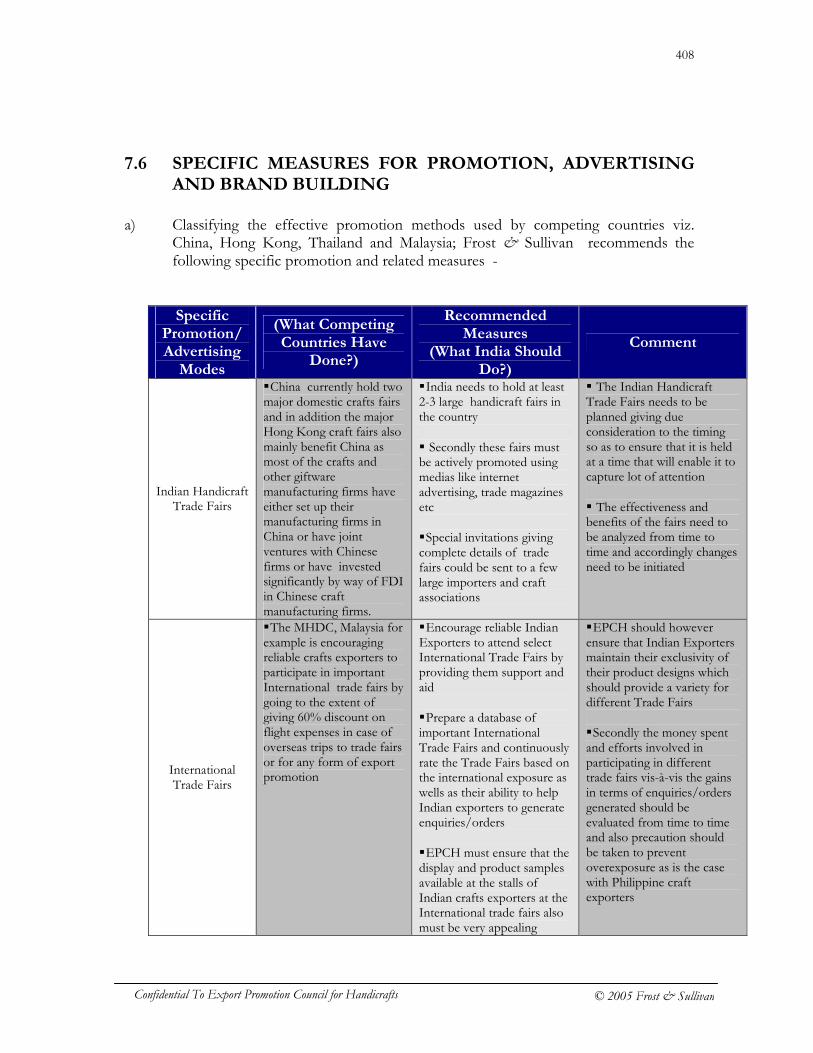
408
Confidential To Export Promotion Council for Handicrafts © 2005 Frost & Sullivan
7.6 SPECIFIC MEASURES FOR PROMOTION, ADVERTISING AND BRAND BUILDING
a) Classifying the effective promotion methods used by competing countries viz.
China, Hong Kong, Thailand and Malaysia; Frost & Sullivan recommends the following specific promotion and related measures -
Specific Promotion/ Advertising
Modes
(What Competing Countries Have
Done?)
Recommended Measures
(What India Should Do?)
Comment
Indian Handicraft Trade Fairs
� China currently hold two major domestic crafts fairs and in addition the major Hong Kong craft fairs also mainly benefit China as most of the crafts and other giftware manufacturing firms have either set up their manufacturing firms in China or have joint ventures with Chinese firms or have invested significantly by way of FDI in Chinese craft manufacturing firms.
� India needs to hold at least 2-3 large handicraft fairs in the country � Secondly these fairs must be actively promoted using medias like internet advertising, trade magazines etc � Special invitations giving complete details of trade fairs could be sent to a few large importers and craft associations
� The Indian Handicraft Trade Fairs needs to be planned giving due consideration to the timing so as to ensure that it is held at a time that will enable it to capture lot of attention � The effectiveness and benefits of the fairs need to be analyzed from time to time and accordingly changes need to be initiated
International Trade Fairs
� The MHDC, Malaysia for example is encouraging reliable crafts exporters to participate in important International trade fairs by going to the extent of giving 60% discount on flight expenses in case of overseas trips to trade fairs or for any form of export promotion
� Encourage reliable Indian Exporters to attend select International Trade Fairs by providing them support and aid � Prepare a database of important International Trade Fairs and continuously rate the Trade Fairs based on the international exposure as wells as their ability to help Indian exporters to generate enquiries/orders � EPCH must ensure that the display and product samples available at the stalls of Indian crafts exporters at the International trade fairs also must be very appealing
� EPCH should however ensure that Indian Exporters maintain their exclusivity of their product designs which should provide a variety for different Trade Fairs � Secondly the money spent and efforts involved in participating in different trade fairs vis-à-vis the gains in terms of enquiries/orders generated should be evaluated from time to time and also precaution should be taken to prevent overexposure as is the case with Philippine craft exporters
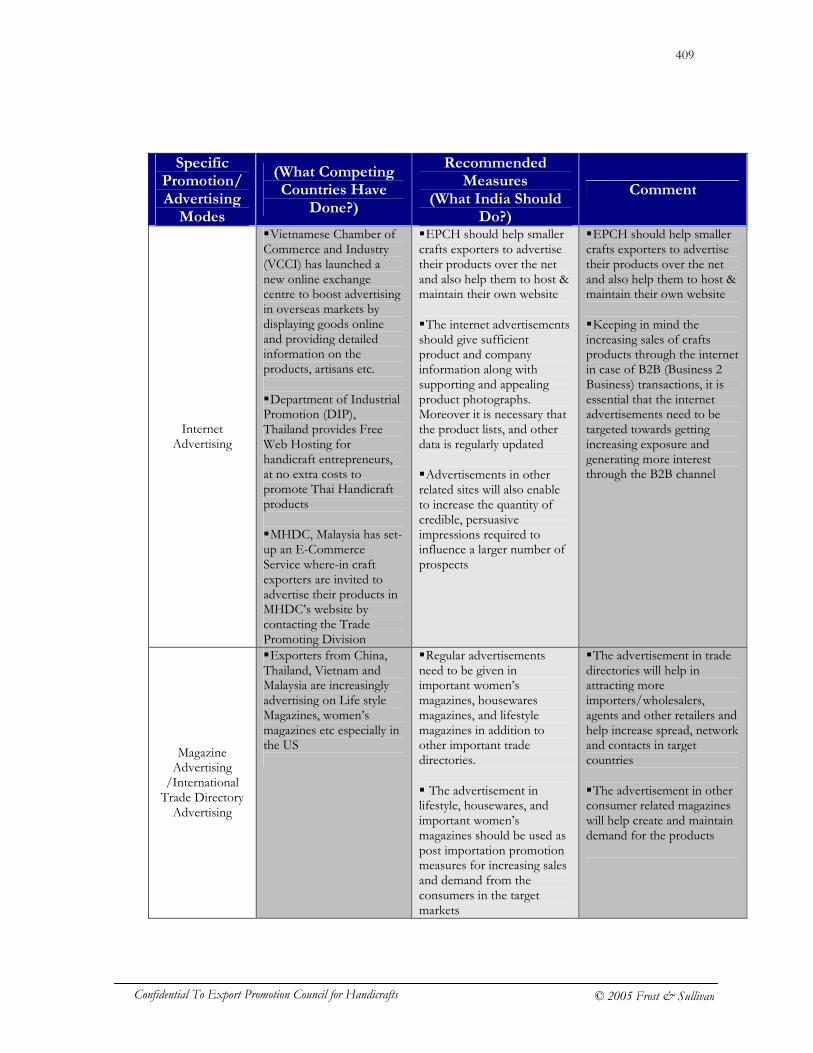
409
Confidential To Export Promotion Council for Handicrafts © 2005 Frost & Sullivan
Specific Promotion/ Advertising
Modes
(What Competing Countries Have
Done?)
Recommended Measures
(What India Should Do?)
Comment
Internet Advertising
� Vietnamese Chamber of Commerce and Industry (VCCI) has launched a new online exchange centre to boost advertising in overseas markets by displaying goods online and providing detailed information on the products, artisans etc. � Department of Industrial Promotion (DIP), Thailand provides Free Web Hosting for handicraft entrepreneurs, at no extra costs to promote Thai Handicraft products � MHDC, Malaysia has set-up an E-Commerce Service where-in craft exporters are invited to advertise their products in MHDC’s website by contacting the Trade Promoting Division
� EPCH should help smaller crafts exporters to advertise their products over the net and also help them to host & maintain their own website � The internet advertisements should give sufficient product and company information along with supporting and appealing product photographs. Moreover it is necessary that the product lists, and other data is regularly updated � Advertisements in other related sites will also enable to increase the quantity of credible, persuasive impressions required to influence a larger number of prospects
� EPCH should help smaller crafts exporters to advertise their products over the net and also help them to host & maintain their own website � Keeping in mind the increasing sales of crafts products through the internet in case of B2B (Business 2 Business) transactions, it is essential that the internet advertisements need to be targeted towards getting increasing exposure and generating more interest through the B2B channel
Magazine Advertising
/International Trade Directory Advertising
� Exporters from China, Thailand, Vietnam and Malaysia are increasingly advertising on Life style Magazines, women’s magazines etc especially in the US
� Regular advertisements need to be given in important women’s magazines, housewares magazines, and lifestyle magazines in addition to other important trade directories. � The advertisement in lifestyle, housewares, and important women’s magazines should be used as post importation promotion measures for increasing sales and demand from the consumers in the target markets
� The advertisement in trade directories will help in attracting more importers/wholesalers, agents and other retailers and help increase spread, network and contacts in target countries � The advertisement in other consumer related magazines will help create and maintain demand for the products
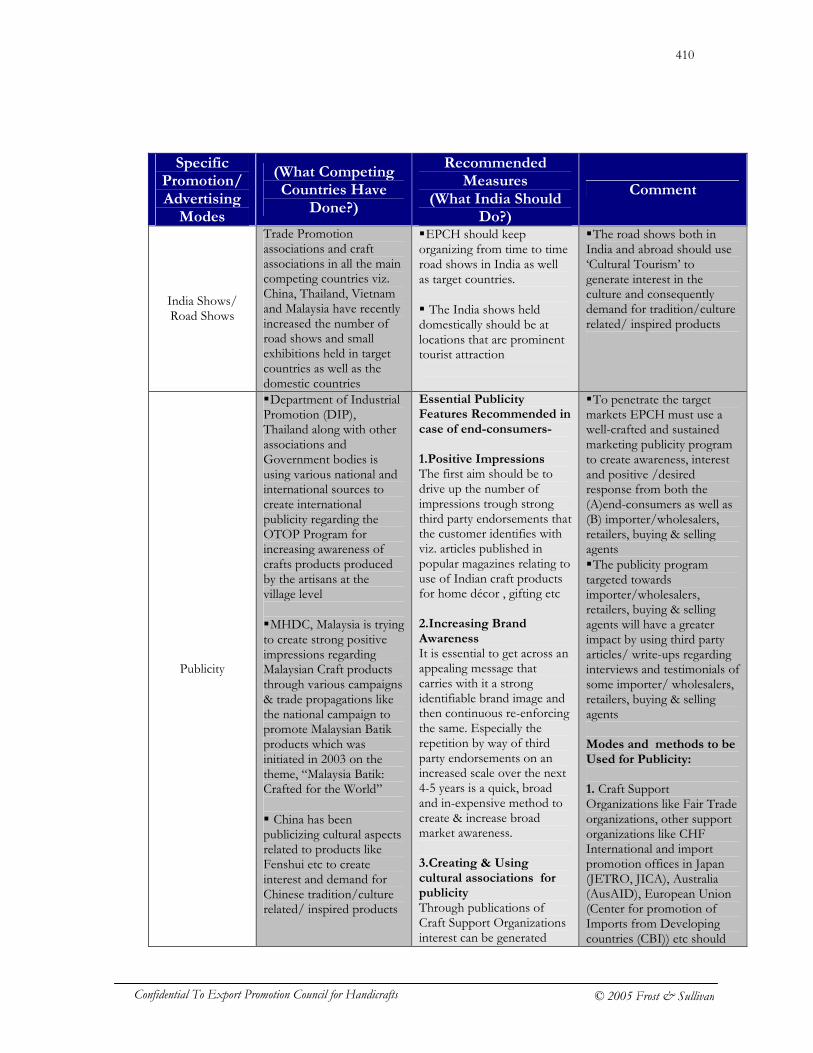
410
Confidential To Export Promotion Council for Handicrafts © 2005 Frost & Sullivan
Specific Promotion/ Advertising
Modes
(What Competing Countries Have
Done?)
Recommended Measures
(What India Should Do?)
Comment
India Shows/ Road Shows
Trade Promotion associations and craft associations in all the main competing countries viz. China, Thailand, Vietnam and Malaysia have recently increased the number of road shows and small exhibitions held in target countries as well as the domestic countries
� EPCH should keep organizing from time to time road shows in India as well as target countries. � The India shows held domestically should be at locations that are prominent tourist attraction
� The road shows both in India and abroad should use ‘Cultural Tourism’ to generate interest in the culture and consequently demand for tradition/culture related/ inspired products
Publicity
� Department of Industrial Promotion (DIP), Thailand along with other associations and Government bodies is using various national and international sources to create international publicity regarding the OTOP Program for increasing awareness of crafts products produced by the artisans at the village level � MHDC, Malaysia is trying to create strong positive impressions regarding Malaysian Craft products through various campaigns & trade propagations like the national campaign to promote Malaysian Batik products which was initiated in 2003 on the theme, “Malaysia Batik: Crafted for the World” � China has been publicizing cultural aspects related to products like Fenshui etc to create interest and demand for Chinese tradition/culture related/ inspired products
Essential Publicity Features Recommended in case of end-consumers- 1.Positive Impressions The first aim should be to drive up the number of impressions trough strong third party endorsements that the customer identifies with viz. articles published in popular magazines relating to use of Indian craft products for home décor , gifting etc 2.Increasing Brand Awareness It is essential to get across an appealing message that carries with it a strong identifiable brand image and then continuous re-enforcing the same. Especially the repetition by way of third party endorsements on an increased scale over the next 4-5 years is a quick, broad and in-expensive method to create & increase broad market awareness. 3.Creating & Using cultural associations for publicity Through publications of Craft Support Organizations interest can be generated
� To penetrate the target markets EPCH must use a well-crafted and sustained marketing publicity program to create awareness, interest and positive /desired response from both the (A)end-consumers as well as (B) importer/wholesalers, retailers, buying & selling agents � The publicity program targeted towards importer/wholesalers, retailers, buying & selling agents will have a greater impact by using third party articles/ write-ups regarding interviews and testimonials of some importer/ wholesalers, retailers, buying & selling agents Modes and methods to be Used for Publicity: 1. Craft Support Organizations like Fair Trade organizations, other support organizations like CHF International and import promotion offices in Japan (JETRO, JICA), Australia (AusAID), European Union (Center for promotion of Imports from Developing countries (CBI)) etc should
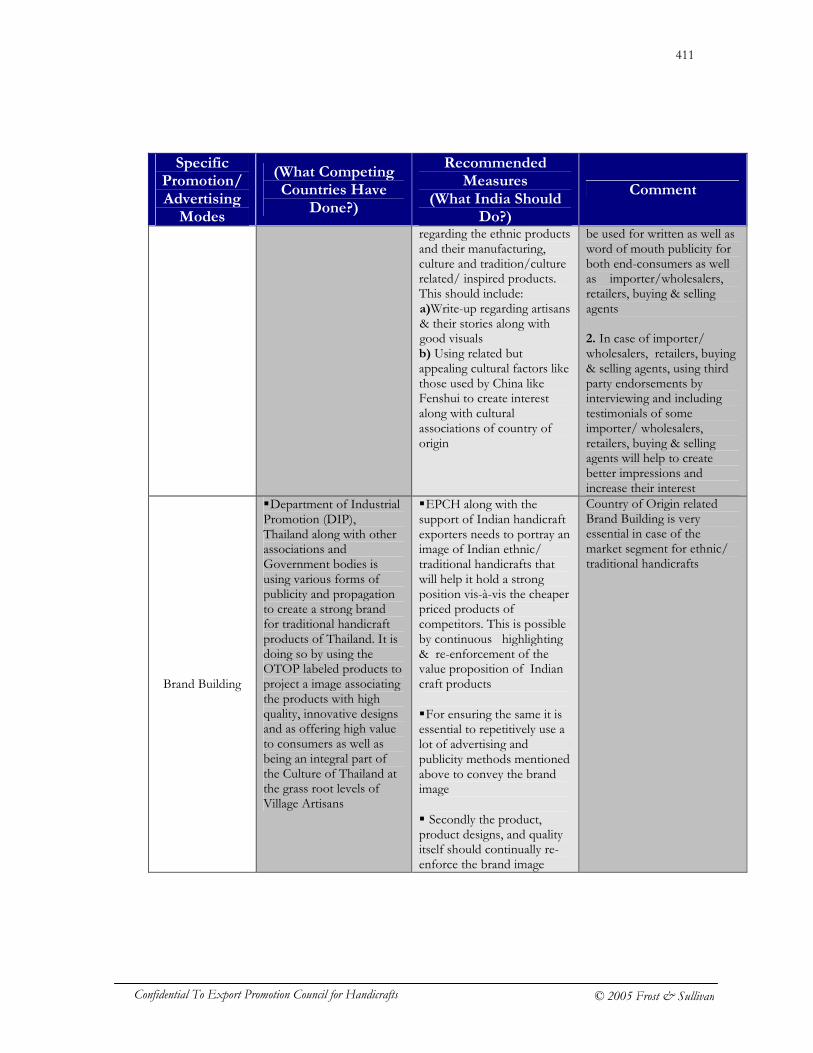
411
Confidential To Export Promotion Council for Handicrafts © 2005 Frost & Sullivan
Specific Promotion/ Advertising
Modes
(What Competing Countries Have
Done?)
Recommended Measures
(What India Should Do?)
Comment
regarding the ethnic products and their manufacturing, culture and tradition/culture related/ inspired products. This should include: a)Write-up regarding artisans & their stories along with good visuals b) Using related but appealing cultural factors like those used by China like Fenshui to create interest along with cultural associations of country of origin
be used for written as well as word of mouth publicity for both end-consumers as well as importer/wholesalers, retailers, buying & selling agents 2. In case of importer/ wholesalers, retailers, buying & selling agents, using third party endorsements by interviewing and including testimonials of some importer/ wholesalers, retailers, buying & selling agents will help to create better impressions and increase their interest
Brand Building
� Department of Industrial Promotion (DIP), Thailand along with other associations and Government bodies is using various forms of publicity and propagation to create a strong brand for traditional handicraft products of Thailand. It is doing so by using the OTOP labeled products to project a image associating the products with high quality, innovative designs and as offering high value to consumers as well as being an integral part of the Culture of Thailand at the grass root levels of Village Artisans
� EPCH along with the support of Indian handicraft exporters needs to portray an image of Indian ethnic/ traditional handicrafts that will help it hold a strong position vis-à-vis the cheaper priced products of competitors. This is possible by continuous highlighting & re-enforcement of the value proposition of Indian craft products � For ensuring the same it is essential to repetitively use a lot of advertising and publicity methods mentioned above to convey the brand image � Secondly the product, product designs, and quality itself should continually re-enforce the brand image
Country of Origin related Brand Building is very essential in case of the market segment for ethnic/ traditional handicrafts
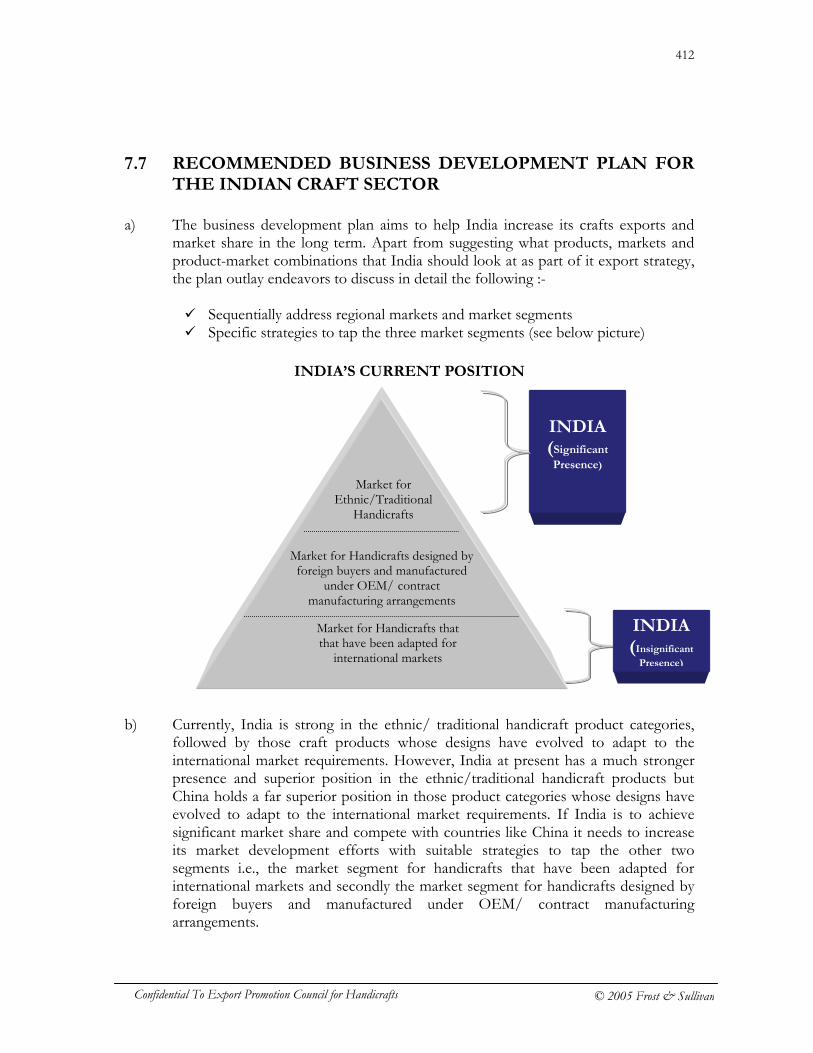
412
Confidential To Export Promotion Council for Handicrafts © 2005 Frost & Sullivan
7.7 RECOMMENDED BUSINESS DEVELOPMENT PLAN FOR THE INDIAN CRAFT SECTOR
a) The business development plan aims to help India increase its crafts exports and
market share in the long term. Apart from suggesting what products, markets and product-market combinations that India should look at as part of it export strategy, the plan outlay endeavors to discuss in detail the following :-
� Sequentially address regional markets and market segments � Specific strategies to tap the three market segments (see below picture)
INDIA’S CURRENT POSITION
b) Currently, India is strong in the ethnic/ traditional handicraft product categories,
followed by those craft products whose designs have evolved to adapt to the international market requirements. However, India at present has a much stronger presence and superior position in the ethnic/traditional handicraft products but China holds a far superior position in those product categories whose designs have evolved to adapt to the international market requirements. If India is to achieve significant market share and compete with countries like China it needs to increase its market development efforts with suitable strategies to tap the other two segments i.e., the market segment for handicrafts that have been adapted for international markets and secondly the market segment for handicrafts designed by foreign buyers and manufactured under OEM/ contract manufacturing arrangements.
Market for Ethnic/Traditional
Handicrafts
Market for Handicrafts that that have been adapted for
international markets
Market for Handicrafts designed by foreign buyers and manufactured
under OEM/ contract manufacturing arrangements
INDIA (Significant
Presence)
INDIA (Insignificant
Presence)
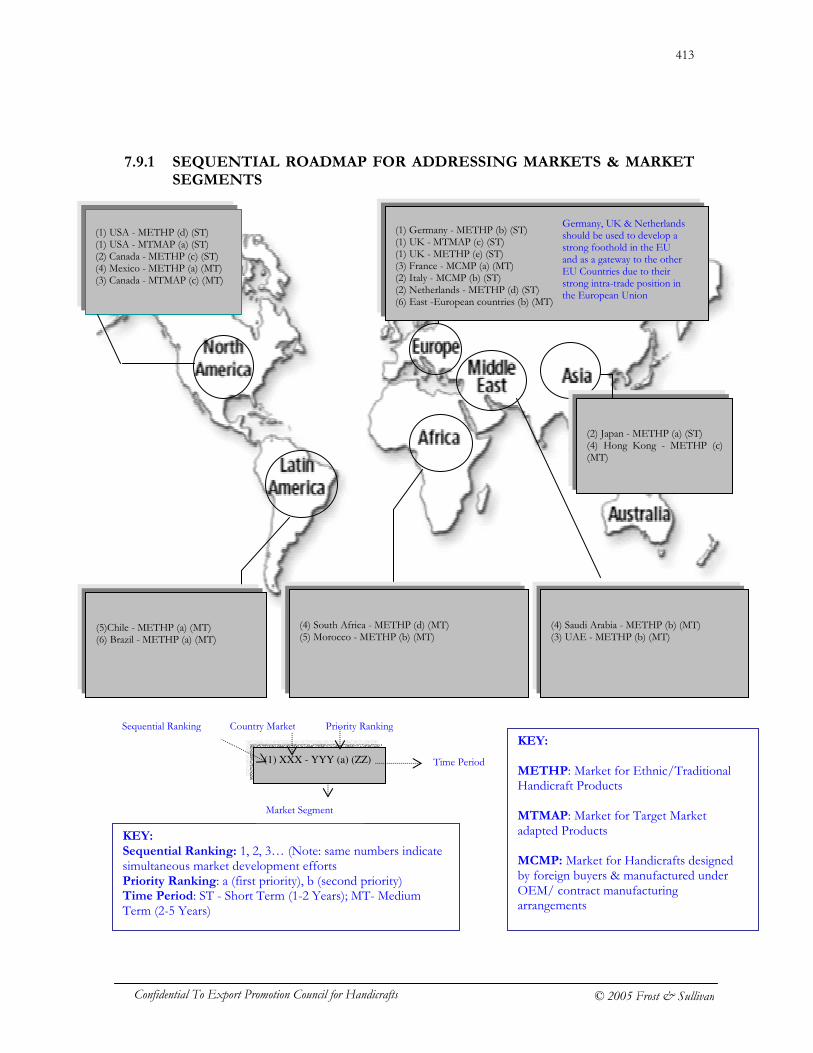
413
Confidential To Export Promotion Council for Handicrafts © 2005 Frost & Sullivan
7.9.1 SEQUENTIAL ROADMAP FOR ADDRESSING MARKETS & MARKET SEGMENTS
KEY: METHP: Market for Ethnic/Traditional Handicraft Products MTMAP: Market for Target Market adapted Products MCMP: Market for Handicrafts designed by foreign buyers & manufactured under OEM/ contract manufacturing arrangements
KEY: Sequential Ranking: 1, 2, 3… (Note: same numbers indicate simultaneous market development efforts Priority Ranking: a (first priority), b (second priority) Time Period: ST - Short Term (1-2 Years); MT- Medium Term (2-5 Years)
Market Segment
(1) XXX - YYY (a) (ZZ)
Sequential Ranking Country Market Priority Ranking
Time Period
(1) USA - METHP (d) (ST) (1) USA - MTMAP (a) (ST) (2) Canada - METHP (c) (ST) (4) Mexico - METHP (a) (MT) (3) Canada - MTMAP (c) (MT)
(1) Germany - METHP (b) (ST) (1) UK - MTMAP (c) (ST) (1) UK - METHP (e) (ST) (3) France - MCMP (a) (MT) (2) Italy - MCMP (b) (ST) (2) Netherlands - METHP (d) (ST) (6) East -European countries (b) (MT)
(5)Chile - METHP (a) (MT) (6) Brazil - METHP (a) (MT)
(4) Saudi Arabia - METHP (b) (MT) (3) UAE - METHP (b) (MT)
(2) Japan - METHP (a) (ST) (4) Hong Kong - METHP (c) (MT)
(4) South Africa - METHP (d) (MT) (5) Morocco - METHP (b) (MT)
Germany, UK & Netherlands should be used to develop a strong foothold in the EU and as a gateway to the other EU Countries due to their strong intra-trade position in the European Union
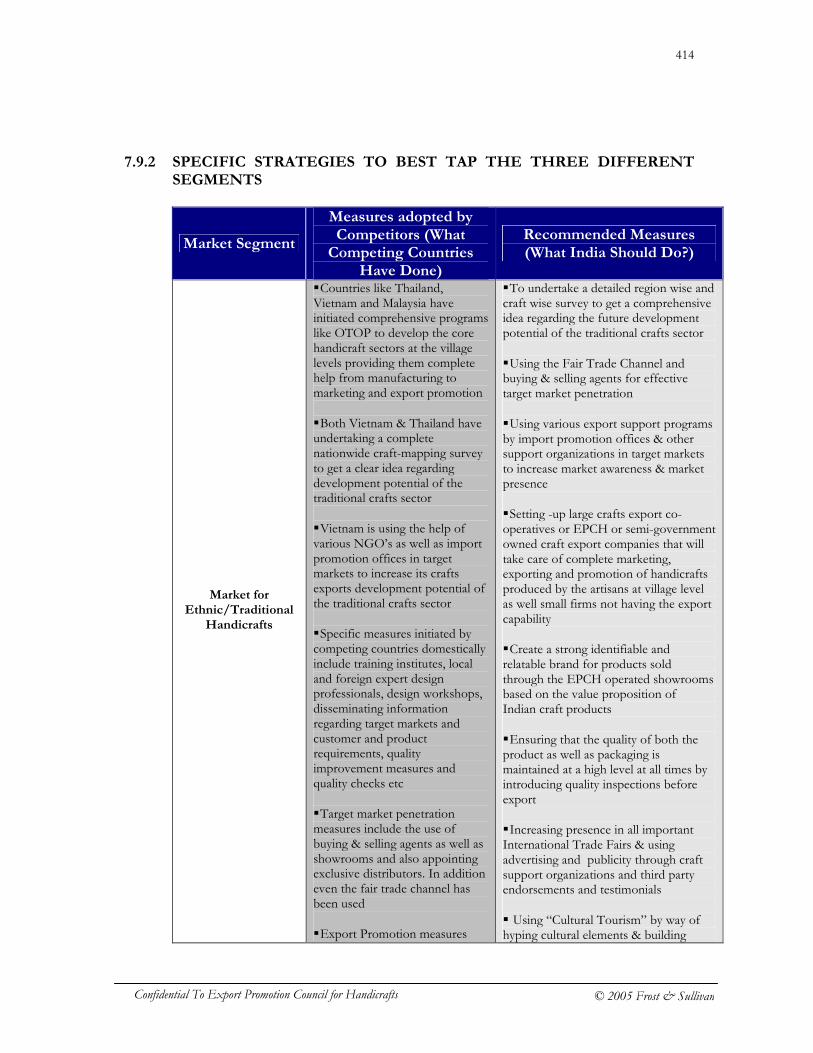
414
Confidential To Export Promotion Council for Handicrafts © 2005 Frost & Sullivan
7.9.2 SPECIFIC STRATEGIES TO BEST TAP THE THREE DIFFERENT SEGMENTS
Market Segment
Measures adopted by Competitors (What
Competing Countries Have Done)
Recommended Measures (What India Should Do?)
Market for
Ethnic/Traditional Handicrafts
� Countries like Thailand, Vietnam and Malaysia have initiated comprehensive programs like OTOP to develop the core handicraft sectors at the village levels providing them complete help from manufacturing to marketing and export promotion � Both Vietnam & Thailand have undertaking a complete nationwide craft-mapping survey to get a clear idea regarding development potential of the traditional crafts sector � Vietnam is using the help of various NGO’s as well as import promotion offices in target markets to increase its crafts exports development potential of the traditional crafts sector � Specific measures initiated by competing countries domestically include training institutes, local and foreign expert design professionals, design workshops, disseminating information regarding target markets and customer and product requirements, quality improvement measures and quality checks etc � Target market penetration measures include the use of buying & selling agents as well as showrooms and also appointing exclusive distributors. In addition even the fair trade channel has been used � Export Promotion measures
� To undertake a detailed region wise and craft wise survey to get a comprehensive idea regarding the future development potential of the traditional crafts sector � Using the Fair Trade Channel and buying & selling agents for effective target market penetration � Using various export support programs by import promotion offices & other support organizations in target markets to increase market awareness & market presence � Setting -up large crafts export co-operatives or EPCH or semi-government owned craft export companies that will take care of complete marketing, exporting and promotion of handicrafts produced by the artisans at village level as well small firms not having the export capability � Create a strong identifiable and relatable brand for products sold through the EPCH operated showrooms based on the value proposition of Indian craft products � Ensuring that the quality of both the product as well as packaging is maintained at a high level at all times by introducing quality inspections before export � Increasing presence in all important International Trade Fairs & using advertising and publicity through craft support organizations and third party endorsements and testimonials � Using “Cultural Tourism” by way of hyping cultural elements & building
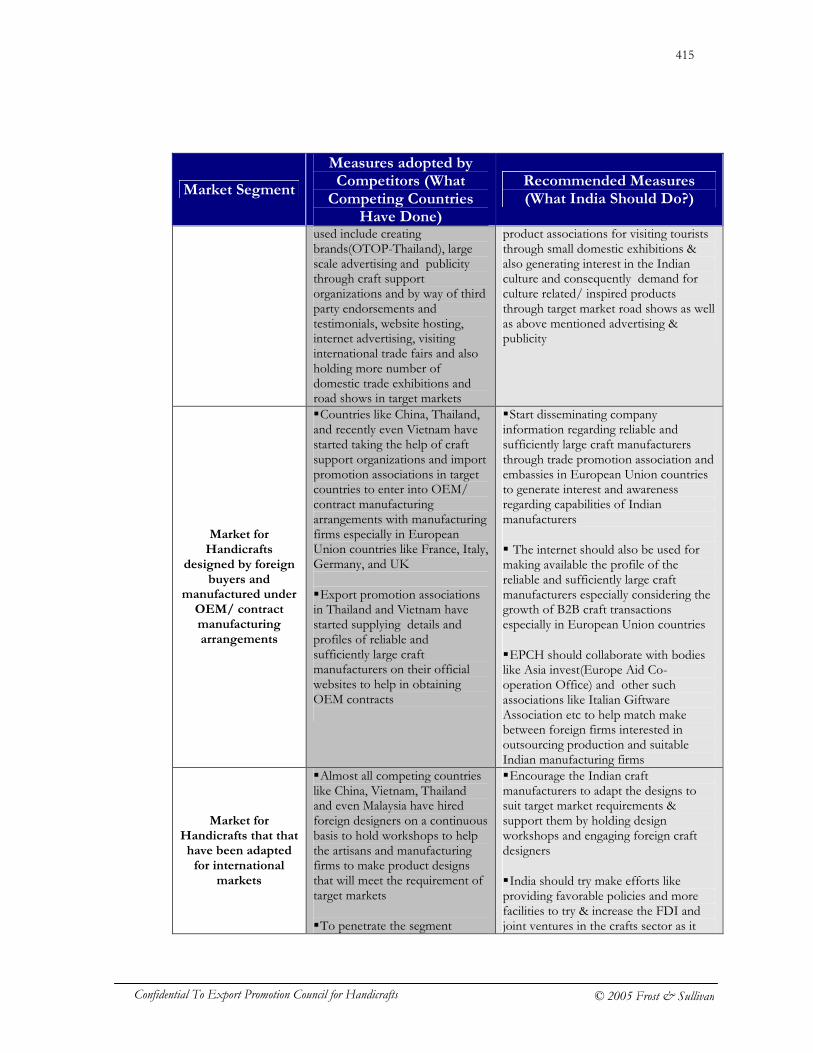
415
Confidential To Export Promotion Council for Handicrafts © 2005 Frost & Sullivan
Market Segment
Measures adopted by Competitors (What
Competing Countries Have Done)
Recommended Measures (What India Should Do?)
used include creating brands(OTOP-Thailand), large scale advertising and publicity through craft support organizations and by way of third party endorsements and testimonials, website hosting, internet advertising, visiting international trade fairs and also holding more number of domestic trade exhibitions and road shows in target markets
product associations for visiting tourists through small domestic exhibitions & also generating interest in the Indian culture and consequently demand for culture related/ inspired products through target market road shows as well as above mentioned advertising & publicity
Market for Handicrafts
designed by foreign buyers and
manufactured under OEM/ contract manufacturing arrangements
� Countries like China, Thailand, and recently even Vietnam have started taking the help of craft support organizations and import promotion associations in target countries to enter into OEM/ contract manufacturing arrangements with manufacturing firms especially in European Union countries like France, Italy, Germany, and UK � Export promotion associations in Thailand and Vietnam have started supplying details and profiles of reliable and sufficiently large craft manufacturers on their official websites to help in obtaining OEM contracts
� Start disseminating company information regarding reliable and sufficiently large craft manufacturers through trade promotion association and embassies in European Union countries to generate interest and awareness regarding capabilities of Indian manufacturers � The internet should also be used for making available the profile of the reliable and sufficiently large craft manufacturers especially considering the growth of B2B craft transactions especially in European Union countries � EPCH should collaborate with bodies like Asia invest(Europe Aid Co-operation Office) and other such associations like Italian Giftware Association etc to help match make between foreign firms interested in outsourcing production and suitable Indian manufacturing firms
Market for Handicrafts that that have been adapted
for international markets
� Almost all competing countries like China, Vietnam, Thailand and even Malaysia have hired foreign designers on a continuous basis to hold workshops to help the artisans and manufacturing firms to make product designs that will meet the requirement of target markets � To penetrate the segment
� Encourage the Indian craft manufacturers to adapt the designs to suit target market requirements & support them by holding design workshops and engaging foreign craft designers � India should try make efforts like providing favorable policies and more facilities to try & increase the FDI and joint ventures in the crafts sector as it
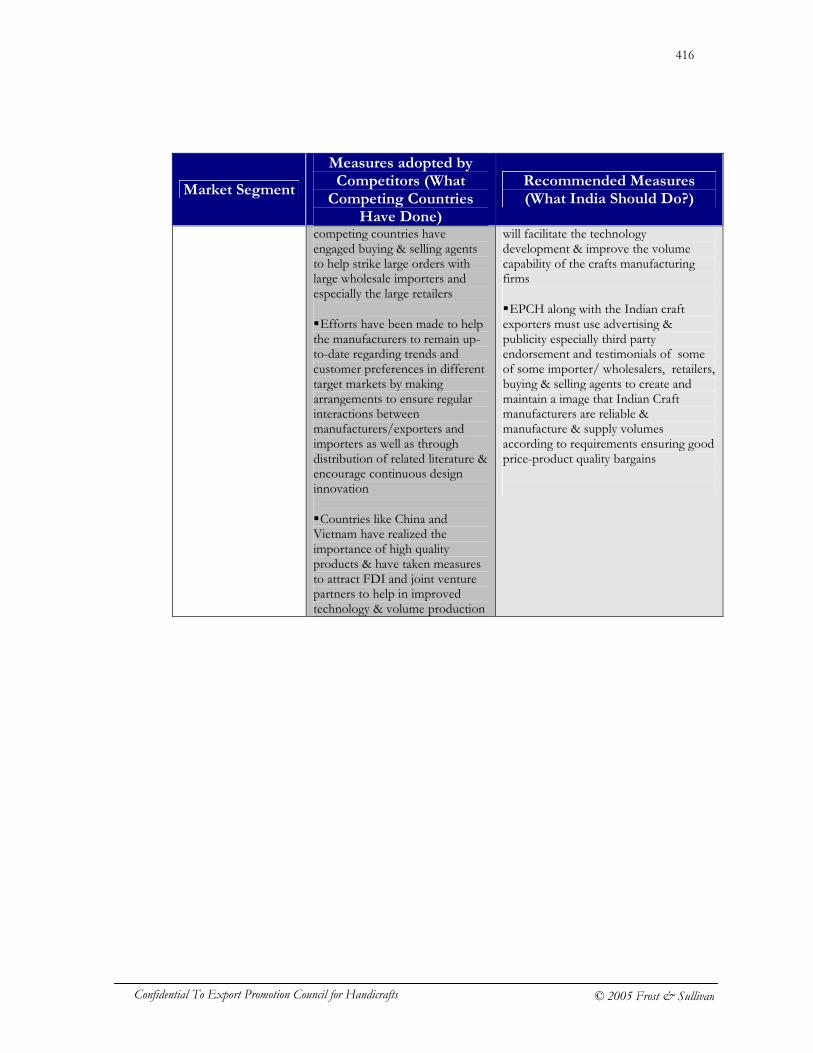
416
Confidential To Export Promotion Council for Handicrafts © 2005 Frost & Sullivan
Market Segment
Measures adopted by Competitors (What
Competing Countries Have Done)
Recommended Measures (What India Should Do?)
competing countries have engaged buying & selling agents to help strike large orders with large wholesale importers and especially the large retailers � Efforts have been made to help the manufacturers to remain up-to-date regarding trends and customer preferences in different target markets by making arrangements to ensure regular interactions between manufacturers/exporters and importers as well as through distribution of related literature & encourage continuous design innovation � Countries like China and Vietnam have realized the importance of high quality products & have taken measures to attract FDI and joint venture partners to help in improved technology & volume production
will facilitate the technology development & improve the volume capability of the crafts manufacturing firms � EPCH along with the Indian craft exporters must use advertising & publicity especially third party endorsement and testimonials of some of some importer/ wholesalers, retailers, buying & selling agents to create and maintain a image that Indian Craft manufacturers are reliable & manufacture & supply volumes according to requirements ensuring good price-product quality bargains
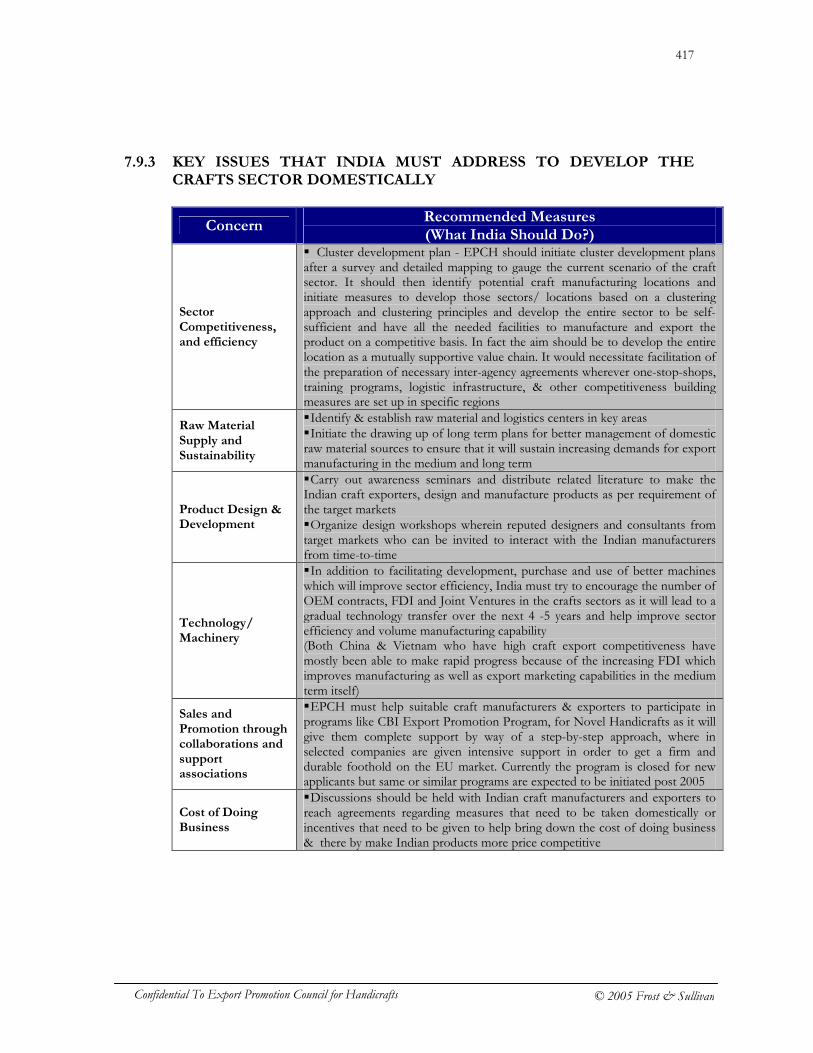
417
Confidential To Export Promotion Council for Handicrafts © 2005 Frost & Sullivan
7.9.3 KEY ISSUES THAT INDIA MUST ADDRESS TO DEVELOP THE CRAFTS SECTOR DOMESTICALLY
Concern Recommended Measures (What India Should Do?)
Sector Competitiveness, and efficiency
� Cluster development plan - EPCH should initiate cluster development plans after a survey and detailed mapping to gauge the current scenario of the craft sector. It should then identify potential craft manufacturing locations and initiate measures to develop those sectors/ locations based on a clustering approach and clustering principles and develop the entire sector to be self-sufficient and have all the needed facilities to manufacture and export the product on a competitive basis. In fact the aim should be to develop the entire location as a mutually supportive value chain. It would necessitate facilitation of the preparation of necessary inter-agency agreements wherever one-stop-shops, training programs, logistic infrastructure, & other competitiveness building measures are set up in specific regions
Raw Material Supply and Sustainability
� Identify & establish raw material and logistics centers in key areas � Initiate the drawing up of long term plans for better management of domestic raw material sources to ensure that it will sustain increasing demands for export manufacturing in the medium and long term
Product Design & Development
� Carry out awareness seminars and distribute related literature to make the Indian craft exporters, design and manufacture products as per requirement of the target markets � Organize design workshops wherein reputed designers and consultants from target markets who can be invited to interact with the Indian manufacturers from time-to-time
Technology/ Machinery
� In addition to facilitating development, purchase and use of better machines which will improve sector efficiency, India must try to encourage the number of OEM contracts, FDI and Joint Ventures in the crafts sectors as it will lead to a gradual technology transfer over the next 4 -5 years and help improve sector efficiency and volume manufacturing capability (Both China & Vietnam who have high craft export competitiveness have mostly been able to make rapid progress because of the increasing FDI which improves manufacturing as well as export marketing capabilities in the medium term itself)
Sales and Promotion through collaborations and support associations
� EPCH must help suitable craft manufacturers & exporters to participate in programs like CBI Export Promotion Program, for Novel Handicrafts as it will give them complete support by way of a step-by-step approach, where in selected companies are given intensive support in order to get a firm and durable foothold on the EU market. Currently the program is closed for new applicants but same or similar programs are expected to be initiated post 2005
Cost of Doing Business
� Discussions should be held with Indian craft manufacturers and exporters to reach agreements regarding measures that need to be taken domestically or incentives that need to be given to help bring down the cost of doing business & there by make Indian products more price competitive
418
Confidential To Export Promotion Council for Handicrafts © 2005 Frost & Sullivan
ANNEXURE – CITY PROFILES
419
Confidential To Export Promotion Council for Handicrafts © 2005 Frost & Sullivan
PROFILE OF TOP 10 CITIES FOR SETTING UP SHOWROOMS
a) The aim of opening stores worldwide by Export Promotion Council for Handicrafts
(EPCH) is to promote Indian handicrafts and to project India's image abroad as a reliable supplier of high quality of handicraft goods and services and to ensure that the international standards and specifications are fulfilled.
b) Analyzing the market share of export of handicrafts (with a total of Rs.10465.14
crores) for the year 2003-2004, the largest is of USA, UK, Germany, France, Netherlands, Italy, Japan and Canada. Consequently, Los Angeles, San Francisco, Dallas and Atlanta (USA), London (UK), Frankfurt (Germany), Paris (France), Amsterdam (Netherlands), Milan (Italy) and Tokyo (Japan) have been selected as locations for setting up of these exclusive stores which will showcase our handicrafts in the select markets.
c) For setting up retail stores, we need to be selective about the city, the markets we
plan to go into, the target segment in each city and finally the location of the retail outlet. Location is the most important parameter for the success of any retail enterprise. Even the kind of handicrafts sold whether it would be targeted to exclusive clientele or to the mass public determines the location where the retail store should be.
d) An ideal location for a retail store should fulfill the following criteria:
� High visibility. � Easily Approachable. � On main retail streets or popular markets as a stand-alone or in a mall. � Near tourist destinations, art galleries and museums, airports and
business centers (areas with high footfalls). � Where the handicrafts can be positioned as works of exquisite art (but not as
priceless commodities). Also it should not be in an ambience where day-to-day buying happens. If someone wants Indian artifacts or handicrafts one would go there as a destination store.
e) The locations short listed as per the requirements above would be:
� Tourist Destinations. � Shopping Areas, incl. Markets. � Business Centers, Convention Halls and Exhibition Halls. � Airports.
420
Confidential To Export Promotion Council for Handicrafts © 2005 Frost & Sullivan
f) As each city has its own dynamics and areas of visitors’ influx, so the location preference would vary from city-to-city. The cities with world’s busiest airports- handling maximum passengers could have the stores at airports while the ones popular for the conventions and fairs could have the retail outlets near the business centers.
g) We have further analyzed each of the selected cities in terms of what kind of retail
opportunity the city is offering, what are the major retail markets and where are they located and then analyzing what kinds of real estate pricing is available there.
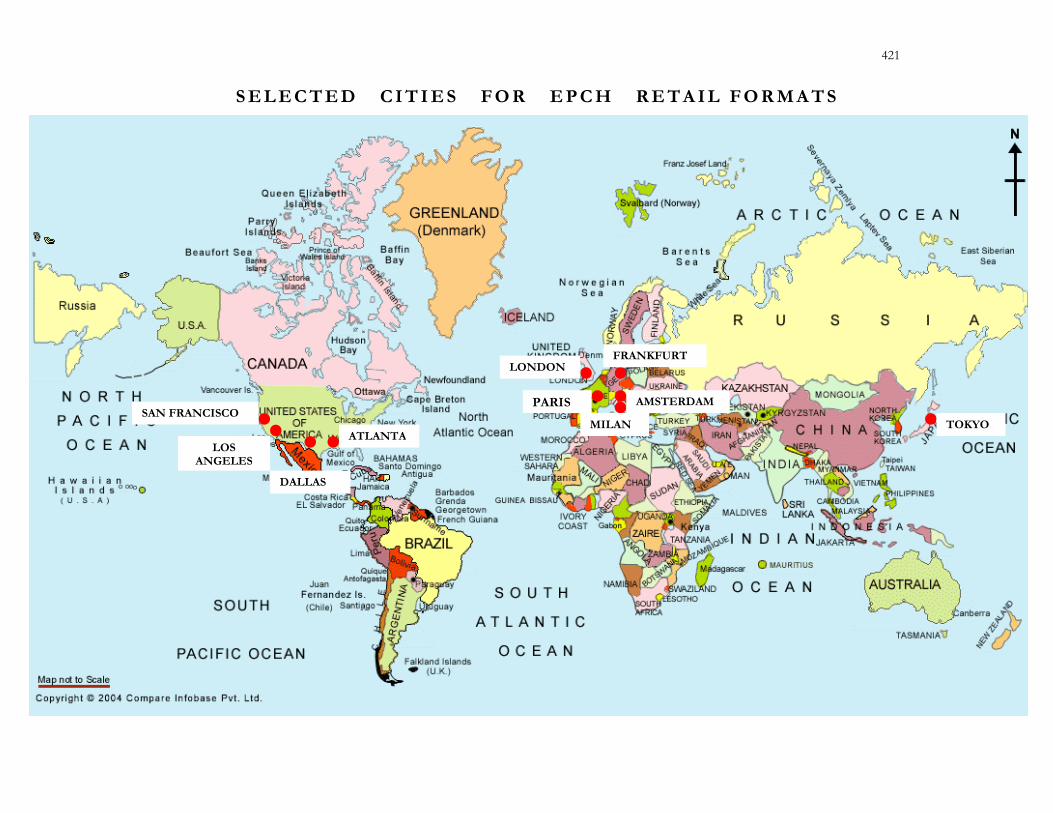
421
FRANKFURT
MILAN
AMSTERDAM PARIS
LONDON
SAN FRANCISCO
LOS ANGELES
DALLAS
ATLANTA TOKYO
S E L E C T E D C I T I E S F O R E P C H R E T A I L F O R M A T S
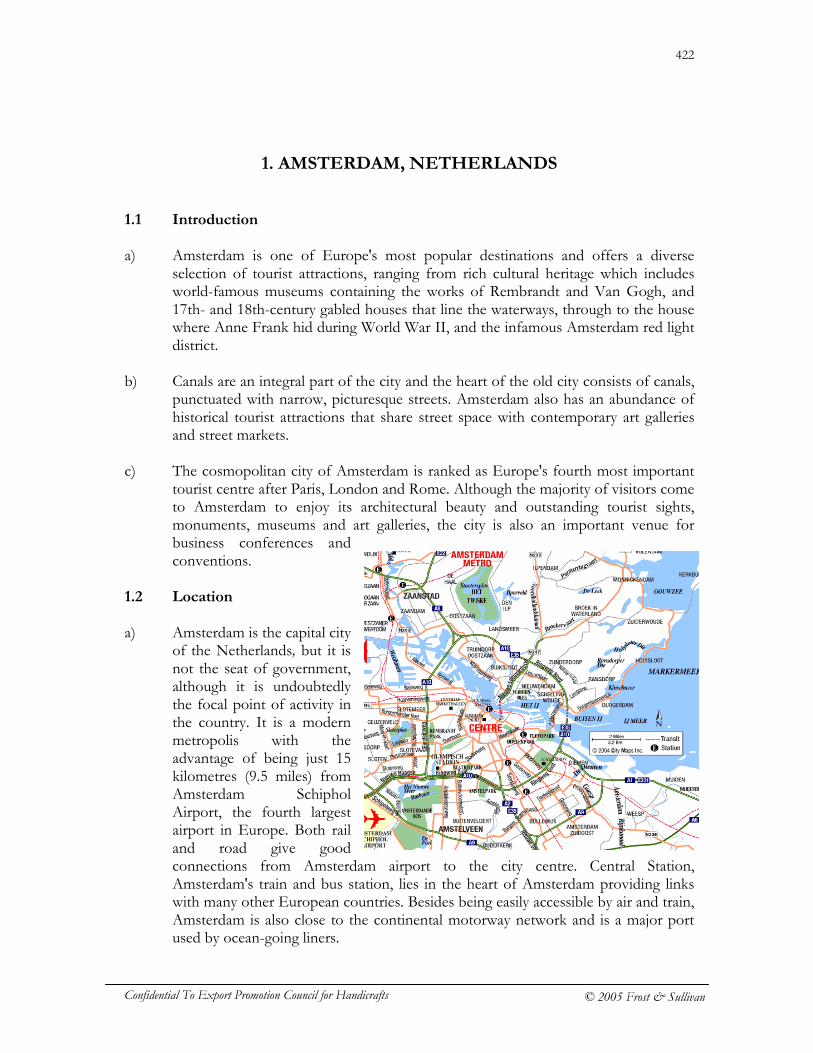
422
Confidential To Export Promotion Council for Handicrafts © 2005 Frost & Sullivan
1. AMSTERDAM, NETHERLANDS
1.1 Introduction a) Amsterdam is one of Europe's most popular destinations and offers a diverse
selection of tourist attractions, ranging from rich cultural heritage which includes world-famous museums containing the works of Rembrandt and Van Gogh, and 17th- and 18th-century gabled houses that line the waterways, through to the house where Anne Frank hid during World War II, and the infamous Amsterdam red light district.
b) Canals are an integral part of the city and the heart of the old city consists of canals,
punctuated with narrow, picturesque streets. Amsterdam also has an abundance of historical tourist attractions that share street space with contemporary art galleries and street markets.
c) The cosmopolitan city of Amsterdam is ranked as Europe's fourth most important
tourist centre after Paris, London and Rome. Although the majority of visitors come to Amsterdam to enjoy its architectural beauty and outstanding tourist sights, monuments, museums and art galleries, the city is also an important venue for business conferences and conventions.
1.2 Location a) Amsterdam is the capital city
of the Netherlands, but it is not the seat of government, although it is undoubtedly the focal point of activity in the country. It is a modern metropolis with the advantage of being just 15 kilometres (9.5 miles) from Amsterdam Schiphol Airport, the fourth largest airport in Europe. Both rail and road give good connections from Amsterdam airport to the city centre. Central Station, Amsterdam's train and bus station, lies in the heart of Amsterdam providing links with many other European countries. Besides being easily accessible by air and train, Amsterdam is also close to the continental motorway network and is a major port used by ocean-going liners.
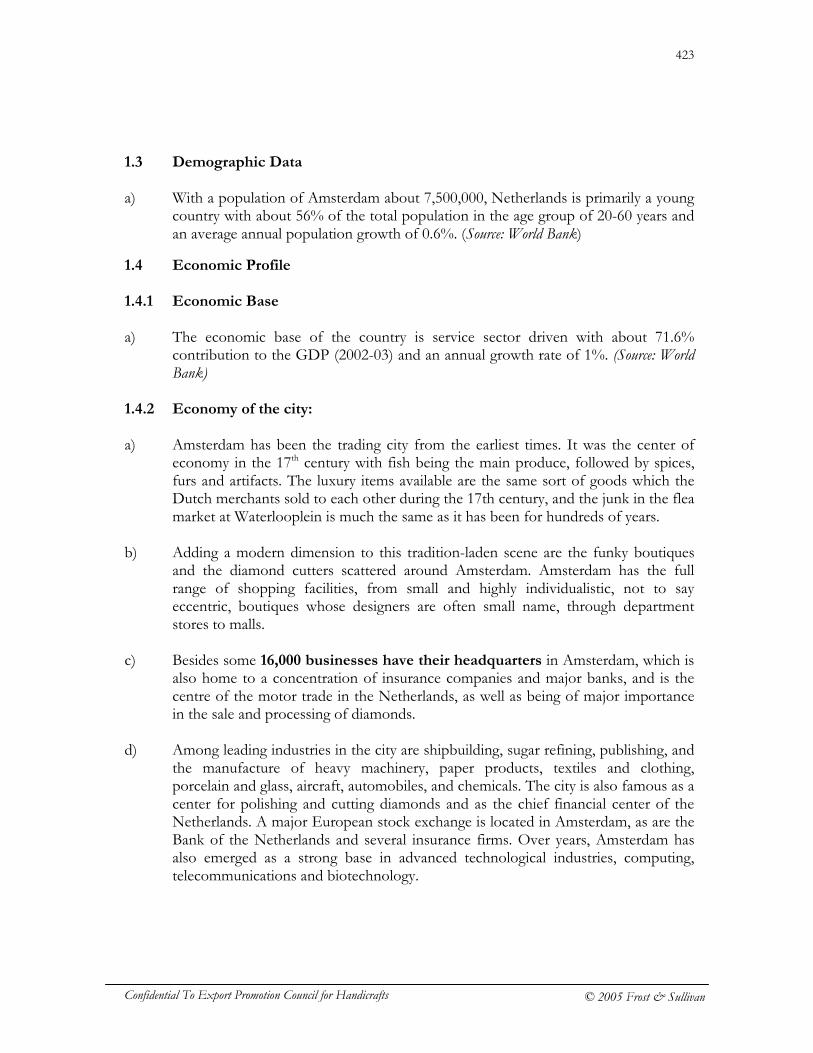
423
Confidential To Export Promotion Council for Handicrafts © 2005 Frost & Sullivan
1.3 Demographic Data a) With a population of Amsterdam about 7,500,000, Netherlands is primarily a young
country with about 56% of the total population in the age group of 20-60 years and an average annual population growth of 0.6%. (Source: World Bank)
1.4 Economic Profile 1.4.1 Economic Base a) The economic base of the country is service sector driven with about 71.6%
contribution to the GDP (2002-03) and an annual growth rate of 1%. (Source: World Bank)
1.4.2 Economy of the city: a) Amsterdam has been the trading city from the earliest times. It was the center of
economy in the 17th century with fish being the main produce, followed by spices, furs and artifacts. The luxury items available are the same sort of goods which the Dutch merchants sold to each other during the 17th century, and the junk in the flea market at Waterlooplein is much the same as it has been for hundreds of years.
b) Adding a modern dimension to this tradition-laden scene are the funky boutiques
and the diamond cutters scattered around Amsterdam. Amsterdam has the full range of shopping facilities, from small and highly individualistic, not to say eccentric, boutiques whose designers are often small name, through department stores to malls.
c) Besides some 16,000 businesses have their headquarters in Amsterdam, which is
also home to a concentration of insurance companies and major banks, and is the centre of the motor trade in the Netherlands, as well as being of major importance in the sale and processing of diamonds.
d) Among leading industries in the city are shipbuilding, sugar refining, publishing, and
the manufacture of heavy machinery, paper products, textiles and clothing, porcelain and glass, aircraft, automobiles, and chemicals. The city is also famous as a center for polishing and cutting diamonds and as the chief financial center of the Netherlands. A major European stock exchange is located in Amsterdam, as are the Bank of the Netherlands and several insurance firms. Over years, Amsterdam has also emerged as a strong base in advanced technological industries, computing, telecommunications and biotechnology.
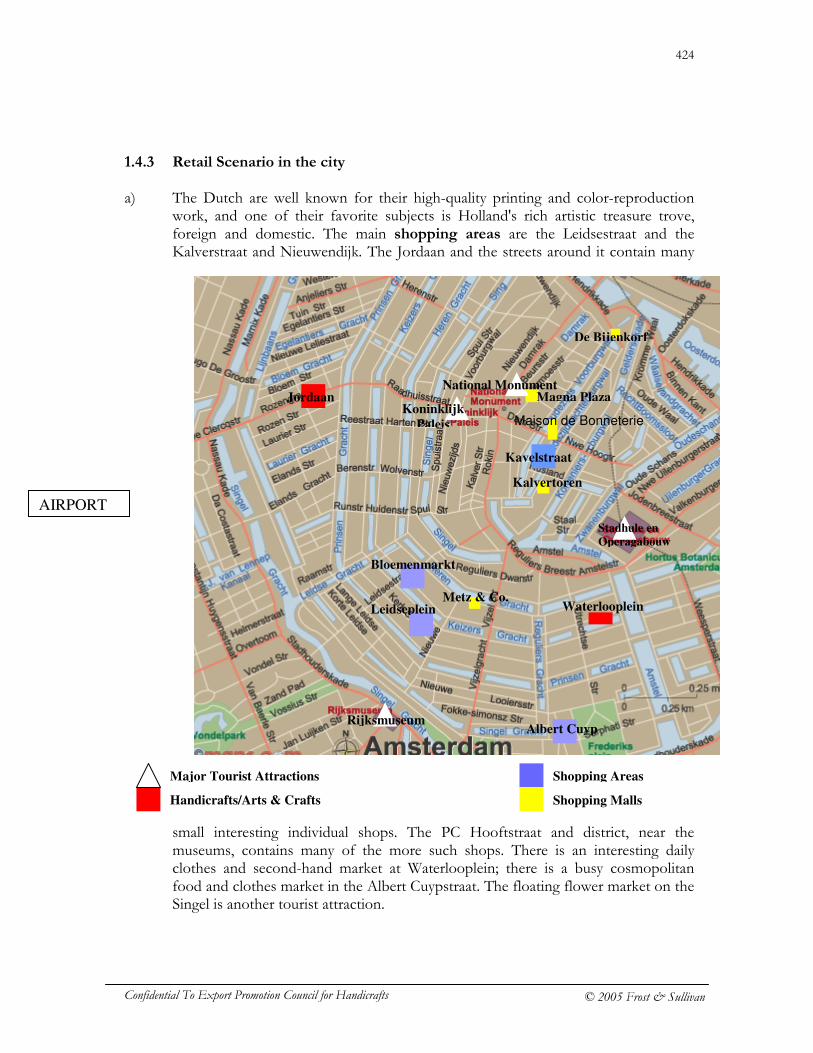
424
Confidential To Export Promotion Council for Handicrafts © 2005 Frost & Sullivan
1.4.3 Retail Scenario in the city a) The Dutch are well known for their high-quality printing and color-reproduction
work, and one of their favorite subjects is Holland's rich artistic treasure trove, foreign and domestic. The main shopping areas are the Leidsestraat and the Kalverstraat and Nieuwendijk. The Jordaan and the streets around it contain many
small interesting individual shops. The PC Hooftstraat and district, near the museums, contains many of the more such shops. There is an interesting daily clothes and second-hand market at Waterlooplein; there is a busy cosmopolitan food and clothes market in the Albert Cuypstraat. The floating flower market on the Singel is another tourist attraction.
Waterlooplein
Jordaan
Metz & Co.
De Bijenkorf
Maison de Bonneterie
AIRPORT
Kalvertoren
Albert Cuyp
Bloemenmarkt
Leidseplein
Magna Plaza National Monument
Koninklijk
Paleis
Stadhule en Operagabouw
Rijksmuseum
Major Tourist Attractions Shopping Areas
Handicrafts/Arts & Crafts
Shopping Malls
Kavelstraat
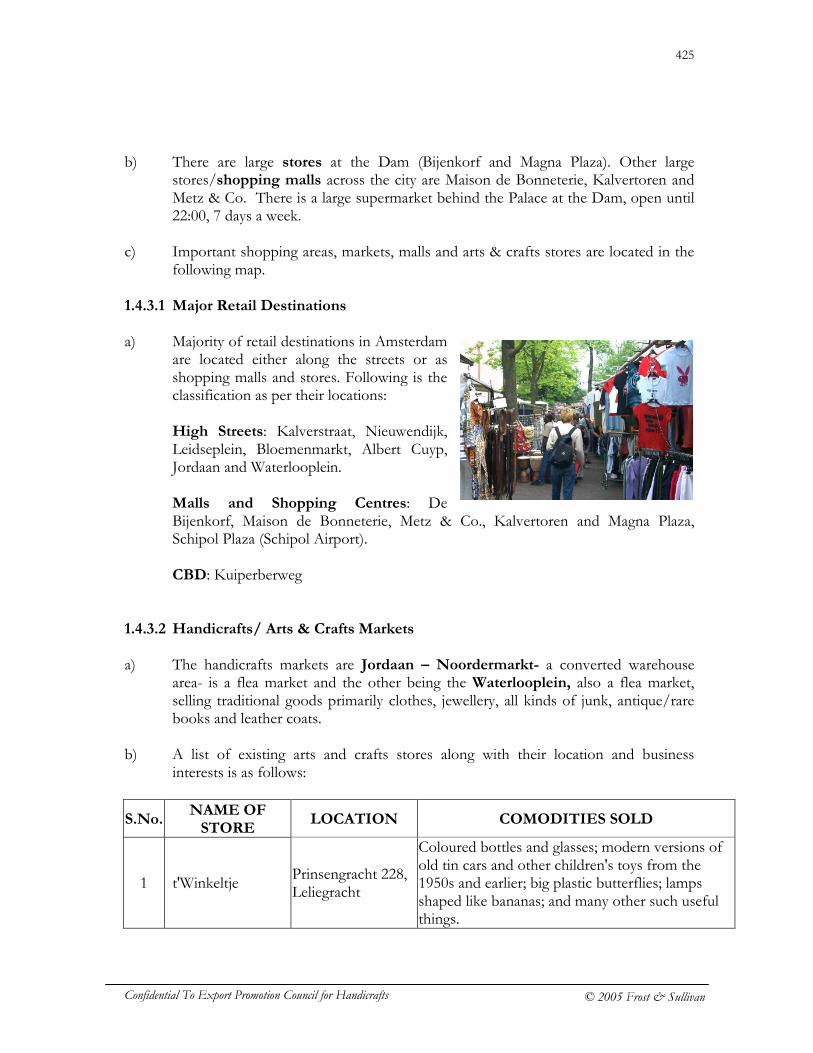
425
Confidential To Export Promotion Council for Handicrafts © 2005 Frost & Sullivan
b) There are large stores at the Dam (Bijenkorf and Magna Plaza). Other large stores/shopping malls across the city are Maison de Bonneterie, Kalvertoren and Metz & Co. There is a large supermarket behind the Palace at the Dam, open until 22:00, 7 days a week.
c) Important shopping areas, markets, malls and arts & crafts stores are located in the
following map.
1.4.3.1 Major Retail Destinations a) Majority of retail destinations in Amsterdam
are located either along the streets or as shopping malls and stores. Following is the classification as per their locations:
High Streets: Kalverstraat, Nieuwendijk, Leidseplein, Bloemenmarkt, Albert Cuyp, Jordaan and Waterlooplein. Malls and Shopping Centres: De Bijenkorf, Maison de Bonneterie, Metz & Co., Kalvertoren and Magna Plaza, Schipol Plaza (Schipol Airport). CBD: Kuiperberweg
1.4.3.2 Handicrafts/ Arts & Crafts Markets
a) The handicrafts markets are Jordaan – Noordermarkt- a converted warehouse area- is a flea market and the other being the Waterlooplein, also a flea market, selling traditional goods primarily clothes, jewellery, all kinds of junk, antique/rare books and leather coats.
b) A list of existing arts and crafts stores along with their location and business
interests is as follows:
S.No. NAME OF
STORE LOCATION COMODITIES SOLD
1 t'Winkeltje Prinsengracht 228, Leliegracht
Coloured bottles and glasses; modern versions of old tin cars and other children's toys from the 1950s and earlier; big plastic butterflies; lamps shaped like bananas; and many other such useful things.
426
Confidential To Export Promotion Council for Handicrafts © 2005 Frost & Sullivan
S.No. NAME OF
STORE LOCATION COMODITIES SOLD
2 Blue Gold Fish Rozengracht 17 Ceramics, jewellery, household items (including colourful lamps in the "Aladdin's Corner"), textiles
3 Cortina Papier Reestraat 22 Fancy notebooks, agendas and address books, and nice lines in writing paper, envelopes, and other such products.
4 E Kramer Candle Shop
Reestraat 20 Candles with little melting works of art, scented oils and incense, and even repairs dolls
5 La Savonnerie Prinsengracht 294 Artisanal soap in all kinds of shapes and sizes, also made on order
6 Nieuws Innovations
Prinsengracht 297
All kinds of offbeat souvenirs, such as pens in the shape of fish, lipsticks, and (perhaps too near the bone for Amsterdam) syringes; washcloths in the form of hand-glove puppets; spherical dice; finger massage sets; and many other
7 Pakhuis Amerika Prinsengracht 541 A kind of museum-souvenirs and antiques 8 Mattieu Hart Rokin Colour etchings of Dutch cities
1.5 Tourism a) Visited each year by over 3.5 million
foreigners as well as a similar number of Dutch with maximum footfalls from April through October, for visitors, shopping is an interesting extension to the experience of Amsterdam, precisely because the city center is small enough that stores and other attractions are often right beside each other. Whatever kind of shopping one prefers, one would be sure to be impressed with the range of shopping possibilities Amsterdam offers.
b) Galleries abound in Amsterdam, particularly in the canal area near the Rijksmuseum,
and a quick look at the listings of their exhibitions proves that Dutch painters are as prolific in the 20th century as they were in the Golden Age. Major tourist attractions are the Anne Frank’s House, Begijnhof, Artis Zoo, Rijksmuseum, Stedelijk, Rembrandt’s House and Van Gogh’s Museum.
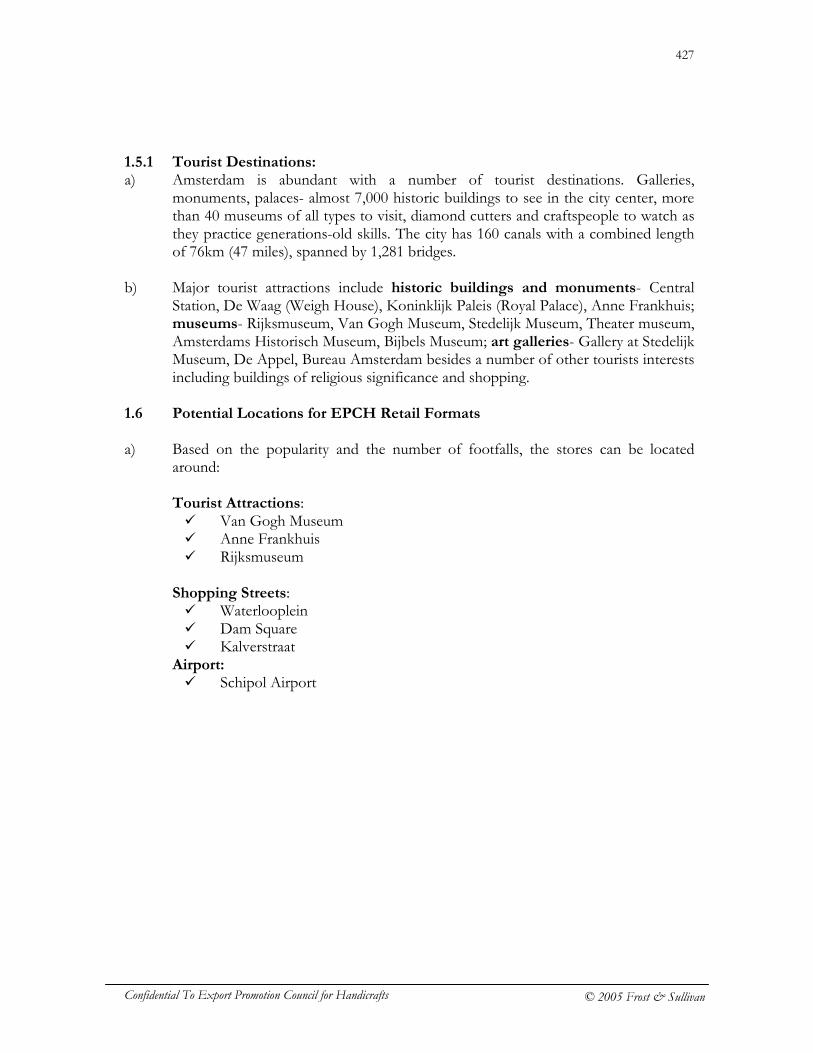
427
Confidential To Export Promotion Council for Handicrafts © 2005 Frost & Sullivan
1.5.1 Tourist Destinations: a) Amsterdam is abundant with a number of tourist destinations. Galleries,
monuments, palaces- almost 7,000 historic buildings to see in the city center, more than 40 museums of all types to visit, diamond cutters and craftspeople to watch as they practice generations-old skills. The city has 160 canals with a combined length of 76km (47 miles), spanned by 1,281 bridges.
b) Major tourist attractions include historic buildings and monuments- Central
Station, De Waag (Weigh House), Koninklijk Paleis (Royal Palace), Anne Frankhuis; museums- Rijksmuseum, Van Gogh Museum, Stedelijk Museum, Theater museum, Amsterdams Historisch Museum, Bijbels Museum; art galleries- Gallery at Stedelijk Museum, De Appel, Bureau Amsterdam besides a number of other tourists interests including buildings of religious significance and shopping.
1.6 Potential Locations for EPCH Retail Formats a) Based on the popularity and the number of footfalls, the stores can be located
around: Tourist Attractions: � Van Gogh Museum � Anne Frankhuis � Rijksmuseum
Shopping Streets: � Waterlooplein � Dam Square � Kalverstraat
Airport: � Schipol Airport
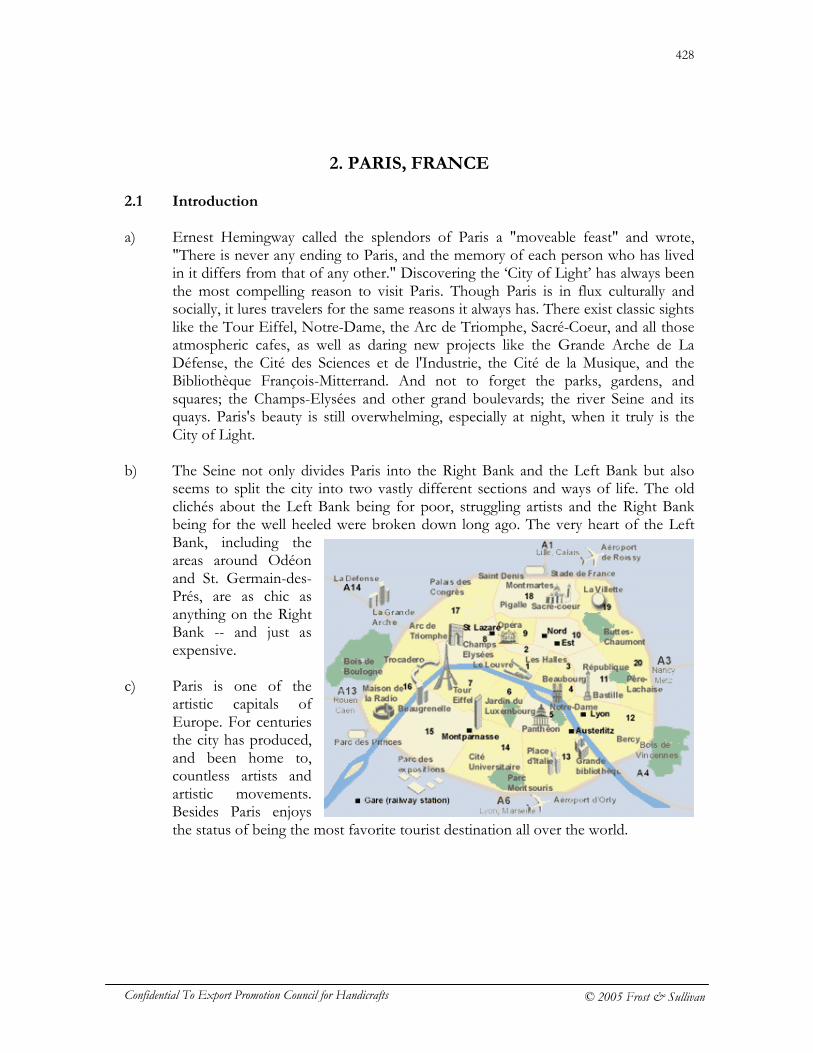
428
Confidential To Export Promotion Council for Handicrafts © 2005 Frost & Sullivan
2. PARIS, FRANCE 2.1 Introduction
a) Ernest Hemingway called the splendors of Paris a "moveable feast" and wrote,
"There is never any ending to Paris, and the memory of each person who has lived in it differs from that of any other." Discovering the ‘City of Light’ has always been the most compelling reason to visit Paris. Though Paris is in flux culturally and socially, it lures travelers for the same reasons it always has. There exist classic sights like the Tour Eiffel, Notre-Dame, the Arc de Triomphe, Sacré-Coeur, and all those atmospheric cafes, as well as daring new projects like the Grande Arche de La Défense, the Cité des Sciences et de l'Industrie, the Cité de la Musique, and the Bibliothèque François-Mitterrand. And not to forget the parks, gardens, and squares; the Champs-Elysées and other grand boulevards; the river Seine and its quays. Paris's beauty is still overwhelming, especially at night, when it truly is the City of Light.
b) The Seine not only divides Paris into the Right Bank and the Left Bank but also
seems to split the city into two vastly different sections and ways of life. The old clichés about the Left Bank being for poor, struggling artists and the Right Bank being for the well heeled were broken down long ago. The very heart of the Left Bank, including the areas around Odéon and St. Germain-des-Prés, are as chic as anything on the Right Bank -- and just as expensive.
c) Paris is one of the
artistic capitals of Europe. For centuries the city has produced, and been home to, countless artists and artistic movements. Besides Paris enjoys the status of being the most favorite tourist destination all over the world.
429
Confidential To Export Promotion Council for Handicrafts © 2005 Frost & Sullivan
2.2 Location a) Paris has two international airports: Orly, 14km (8 1/2 miles) south of the city, and
Charles de Gaulle (Roissy), 23km (14 miles) northeast. A shuttle bus (navette) links the terminals. The free shuttle bus also transports passengers to the Roissy rail station. An alternative method for reaching central Paris involves taking a monorail. The major highways into Paris are the A1 from the north (Great Britain and Benelux); A13 from Rouen, Normandy, and northwest France; A10 from Bordeaux, the Pyrenees, France's southwest, and Spain; A6 from Lyon, the French Alps, the Riviera, and Italy; and A4 from Metz, Nancy, and Strasbourg in eastern France.
b) With in Europe, one could travel to Paris by train (Eurorail) by using a Eurailpass.
Bus travel to Paris is available from London and many other cities on the Continent. By Ferry From England: Despite competition from the Chunnel, services aboard ferries and hydrofoils operate day and night in all seasons. Many channel crossings are timed to coincide with the arrival/departure of major trains (especially those between London and Paris). Under the Channel: One of the great engineering feats of the time, the $15 billion Channel Tunnel (Chunnel) opened in 1994, and the Eurostar Express has daily service from London to both Paris and Brussels. Stores selling duty-free goods, restaurants, service stations, and bilingual staffs are available to travelers on both sides of the Channel. Trains leave from London's Waterloo Station and arrive in Paris at the Gare du Nord.
2.3 Demographic Data a) With a population of Paris about 2,200,000, France is primarily a young country
with about 54% of the total population in the age group of 20-60 years, with an average annual population growth of 0.34%. (Source: World Bank)
2.4 Economic Profile 2.4.1 Economic Base: a) The economic base of the country is service sector driven with about 72.8%
contribution to the GDP (2003) and an annual growth rate of 0.5% (2003). (Source: World Bank)
2.4.2 Economy of the City a) Paris is the leading industrial center of France, with about one-quarter of the
nation's manufacturing concentrated in the metropolitan area. Principal manufactures are machinery, automobiles and other vehicles, chemicals, and electrical equipment. The cultural and artistic preeminence of Paris has attracted a large publishing industry and a wide range of luxury manufactures, such as high-
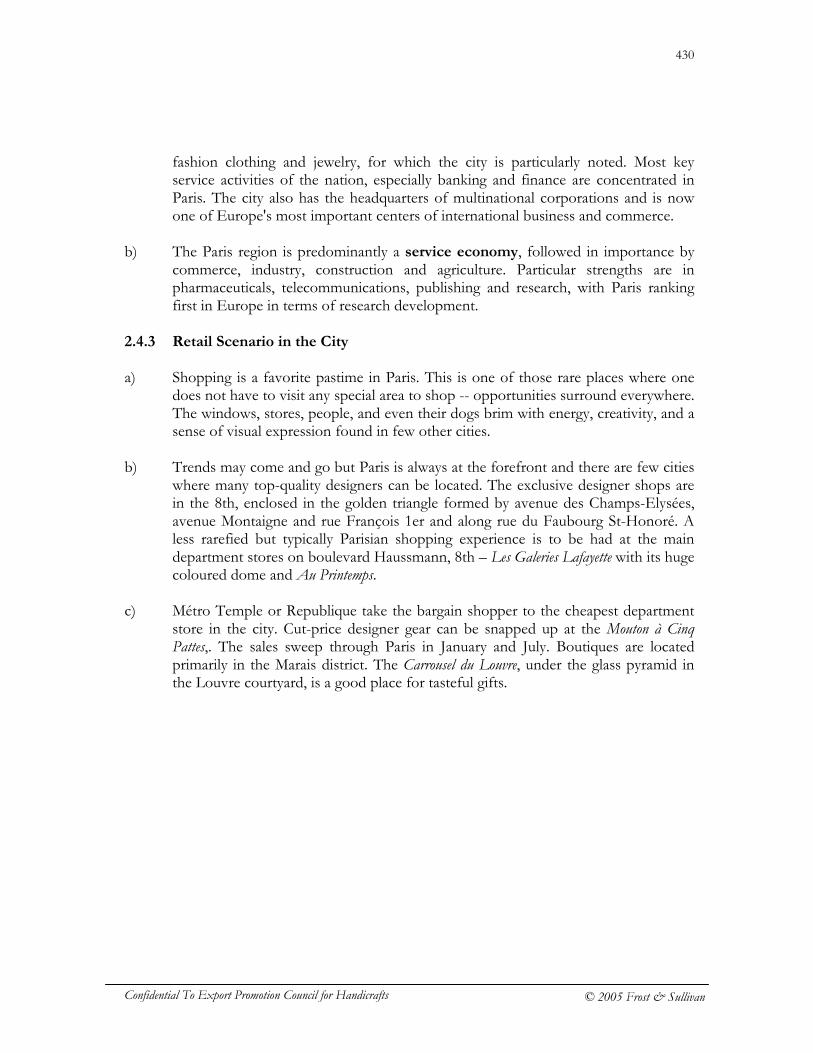
430
Confidential To Export Promotion Council for Handicrafts © 2005 Frost & Sullivan
fashion clothing and jewelry, for which the city is particularly noted. Most key service activities of the nation, especially banking and finance are concentrated in Paris. The city also has the headquarters of multinational corporations and is now one of Europe's most important centers of international business and commerce.
b) The Paris region is predominantly a service economy, followed in importance by
commerce, industry, construction and agriculture. Particular strengths are in pharmaceuticals, telecommunications, publishing and research, with Paris ranking first in Europe in terms of research development.
2.4.3 Retail Scenario in the City a) Shopping is a favorite pastime in Paris. This is one of those rare places where one
does not have to visit any special area to shop -- opportunities surround everywhere. The windows, stores, people, and even their dogs brim with energy, creativity, and a sense of visual expression found in few other cities.
b) Trends may come and go but Paris is always at the forefront and there are few cities
where many top-quality designers can be located. The exclusive designer shops are in the 8th, enclosed in the golden triangle formed by avenue des Champs-Elysées, avenue Montaigne and rue François 1er and along rue du Faubourg St-Honoré. A less rarefied but typically Parisian shopping experience is to be had at the main department stores on boulevard Haussmann, 8th – Les Galeries Lafayette with its huge coloured dome and Au Printemps.
c) Métro Temple or Republique take the bargain shopper to the cheapest department
store in the city. Cut-price designer gear can be snapped up at the Mouton à Cinq Pattes,. The sales sweep through Paris in January and July. Boutiques are located primarily in the Marais district. The Carrousel du Louvre, under the glass pyramid in the Louvre courtyard, is a good place for tasteful gifts.
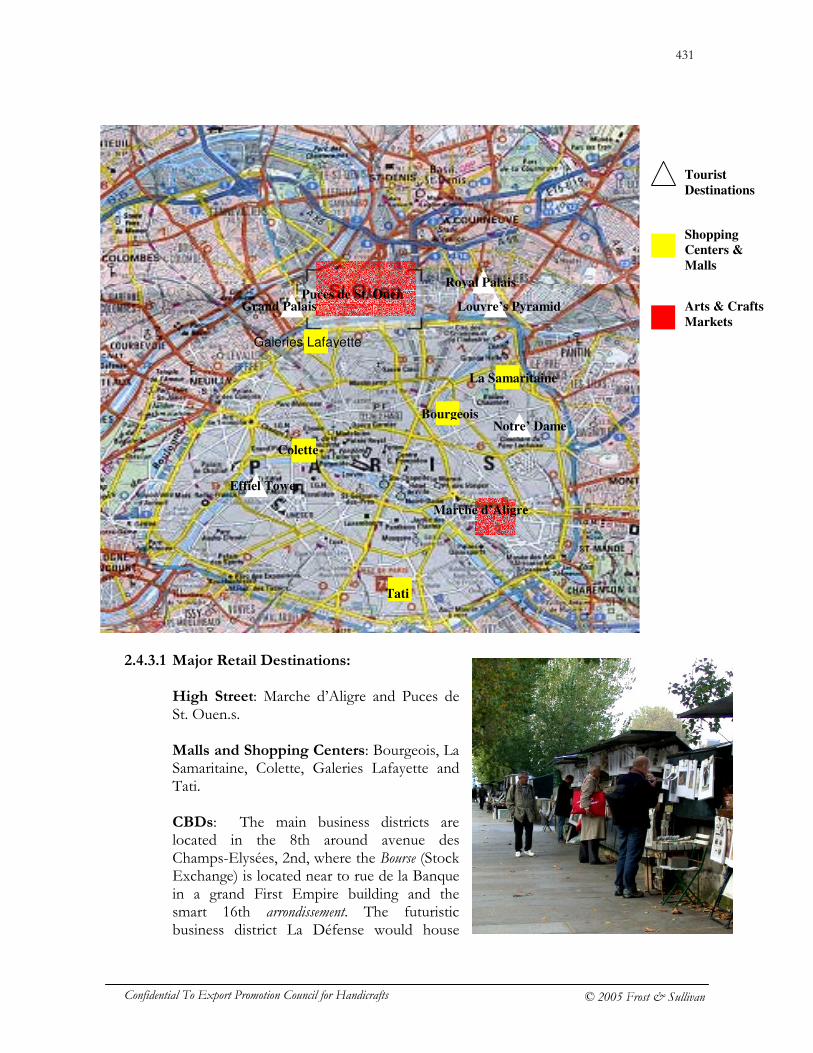
431
Confidential To Export Promotion Council for Handicrafts © 2005 Frost & Sullivan
Marche d’Aligre
Colette
Bourgeois
Tati
La Samaritaine
Puces de St. Ouen
Galeries Lafayette
Notre’ Dame
Grand Palais
Effiel Tower
Louvre’s Pyramid
Royal Palais
Tourist
Destinations
Shopping
Centers &
Malls
Arts & Crafts
Markets
2.4.3.1 Major Retail Destinations:
High Street: Marche d’Aligre and Puces de St. Ouen.s. Malls and Shopping Centers: Bourgeois, La Samaritaine, Colette, Galeries Lafayette and Tati. CBDs: The main business districts are located in the 8th around avenue des Champs-Elysées, 2nd, where the Bourse (Stock Exchange) is located near to rue de la Banque in a grand First Empire building and the smart 16th arrondissement. The futuristic business district La Défense would house
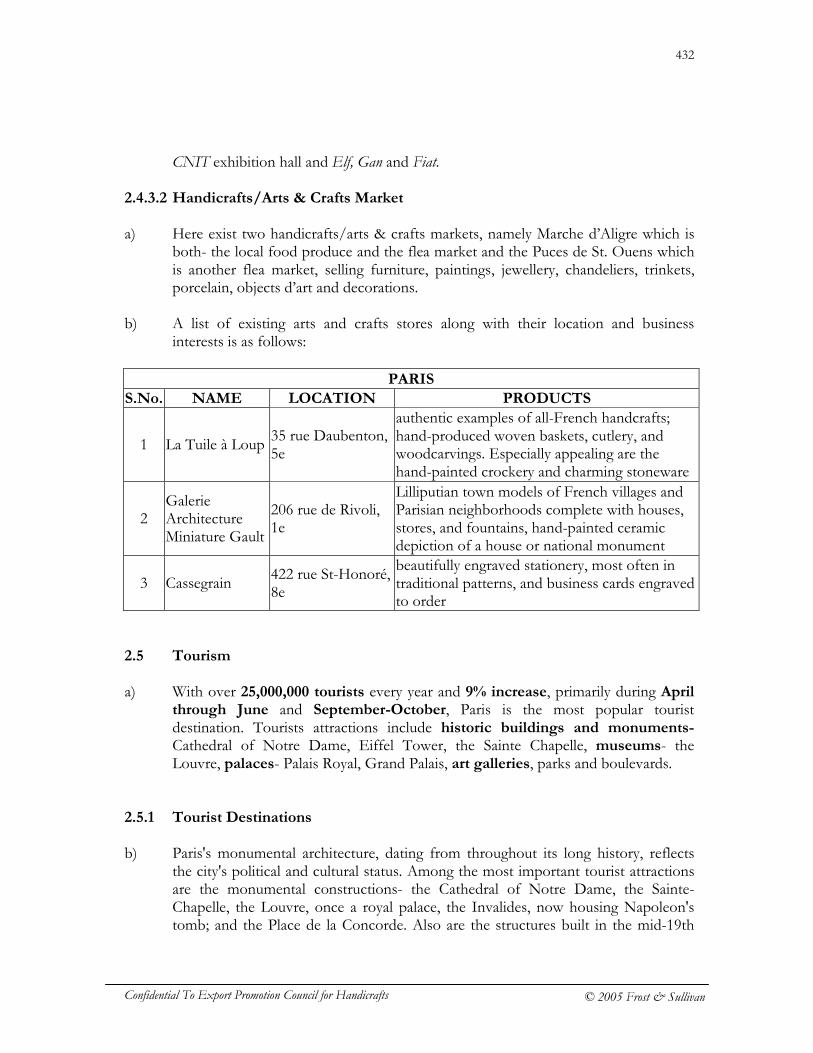
432
Confidential To Export Promotion Council for Handicrafts © 2005 Frost & Sullivan
CNIT exhibition hall and Elf, Gan and Fiat. 2.4.3.2 Handicrafts/Arts & Crafts Market a) Here exist two handicrafts/arts & crafts markets, namely Marche d’Aligre which is
both- the local food produce and the flea market and the Puces de St. Ouens which is another flea market, selling furniture, paintings, jewellery, chandeliers, trinkets, porcelain, objects d’art and decorations.
b) A list of existing arts and crafts stores along with their location and business
interests is as follows:
PARIS
S.No. NAME LOCATION PRODUCTS
1 La Tuile à Loup 35 rue Daubenton, 5e
authentic examples of all-French handcrafts; hand-produced woven baskets, cutlery, and woodcarvings. Especially appealing are the hand-painted crockery and charming stoneware
2 Galerie Architecture Miniature Gault
206 rue de Rivoli, 1e
Lilliputian town models of French villages and Parisian neighborhoods complete with houses, stores, and fountains, hand-painted ceramic depiction of a house or national monument
3 Cassegrain 422 rue St-Honoré, 8e
beautifully engraved stationery, most often in traditional patterns, and business cards engraved to order
2.5 Tourism a) With over 25,000,000 tourists every year and 9% increase, primarily during April
through June and September-October, Paris is the most popular tourist destination. Tourists attractions include historic buildings and monuments- Cathedral of Notre Dame, Eiffel Tower, the Sainte Chapelle, museums- the Louvre, palaces- Palais Royal, Grand Palais, art galleries, parks and boulevards.
2.5.1 Tourist Destinations b) Paris's monumental architecture, dating from throughout its long history, reflects
the city's political and cultural status. Among the most important tourist attractions are the monumental constructions- the Cathedral of Notre Dame, the Sainte-Chapelle, the Louvre, once a royal palace, the Invalides, now housing Napoleon's tomb; and the Place de la Concorde. Also are the structures built in the mid-19th
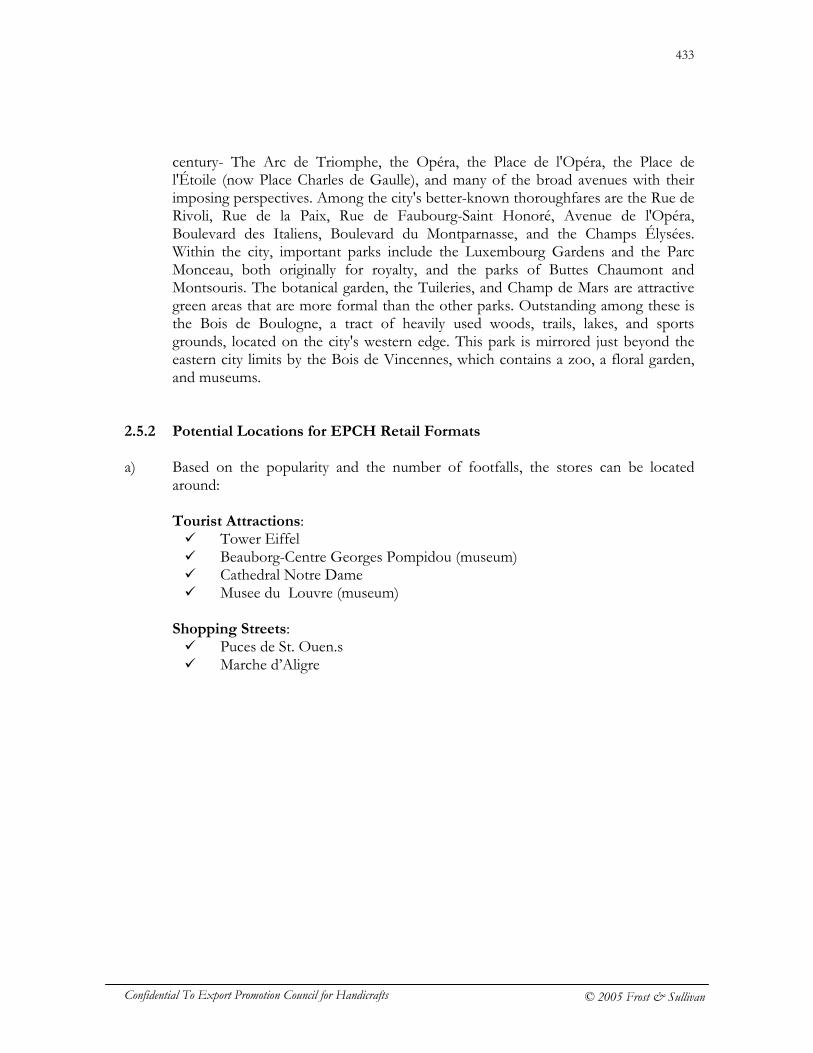
433
Confidential To Export Promotion Council for Handicrafts © 2005 Frost & Sullivan
century- The Arc de Triomphe, the Opéra, the Place de l'Opéra, the Place de l'Étoile (now Place Charles de Gaulle), and many of the broad avenues with their imposing perspectives. Among the city's better-known thoroughfares are the Rue de Rivoli, Rue de la Paix, Rue de Faubourg-Saint Honoré, Avenue de l'Opéra, Boulevard des Italiens, Boulevard du Montparnasse, and the Champs Élysées. Within the city, important parks include the Luxembourg Gardens and the Parc Monceau, both originally for royalty, and the parks of Buttes Chaumont and Montsouris. The botanical garden, the Tuileries, and Champ de Mars are attractive green areas that are more formal than the other parks. Outstanding among these is the Bois de Boulogne, a tract of heavily used woods, trails, lakes, and sports grounds, located on the city's western edge. This park is mirrored just beyond the eastern city limits by the Bois de Vincennes, which contains a zoo, a floral garden, and museums.
2.5.2 Potential Locations for EPCH Retail Formats
a) Based on the popularity and the number of footfalls, the stores can be located
around: Tourist Attractions: � Tower Eiffel � Beauborg-Centre Georges Pompidou (museum) � Cathedral Notre Dame � Musee du Louvre (museum)
Shopping Streets: � Puces de St. Ouen.s � Marche d’Aligre
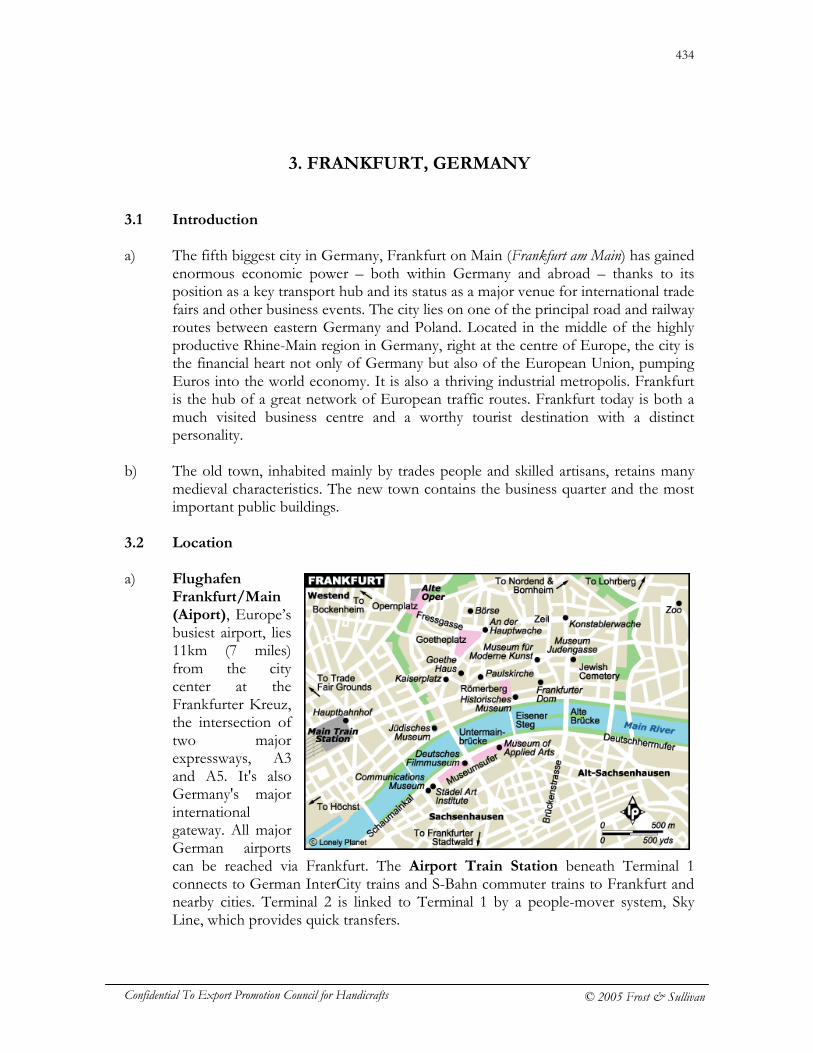
434
Confidential To Export Promotion Council for Handicrafts © 2005 Frost & Sullivan
3. FRANKFURT, GERMANY
3.1 Introduction
a) The fifth biggest city in Germany, Frankfurt on Main (Frankfurt am Main) has gained
enormous economic power – both within Germany and abroad – thanks to its position as a key transport hub and its status as a major venue for international trade fairs and other business events. The city lies on one of the principal road and railway routes between eastern Germany and Poland. Located in the middle of the highly productive Rhine-Main region in Germany, right at the centre of Europe, the city is the financial heart not only of Germany but also of the European Union, pumping Euros into the world economy. It is also a thriving industrial metropolis. Frankfurt is the hub of a great network of European traffic routes. Frankfurt today is both a much visited business centre and a worthy tourist destination with a distinct personality.
b) The old town, inhabited mainly by trades people and skilled artisans, retains many
medieval characteristics. The new town contains the business quarter and the most important public buildings.
3.2 Location a) Flughafen
Frankfurt/Main (Aiport), Europe’s busiest airport, lies 11km (7 miles) from the city center at the Frankfurter Kreuz, the intersection of two major expressways, A3 and A5. It's also Germany's major international gateway. All major German airports can be reached via Frankfurt. The Airport Train Station beneath Terminal 1 connects to German InterCity trains and S-Bahn commuter trains to Frankfurt and nearby cities. Terminal 2 is linked to Terminal 1 by a people-mover system, Sky Line, which provides quick transfers.
435
Confidential To Export Promotion Council for Handicrafts © 2005 Frost & Sullivan
By Train: Frankfurt's main rail station, the Hauptbahnhof, the busiest in Europe, is the arrival point for some 1,600 trains per day carrying about 255,000 passengers. A train arrives from most major cities of Germany every hour until 8pm. Many other European cities also have direct rail links with Frankfurt. By Bus: Frankfurt has long-distance bus service to about 800 German and European cities. Buses depart from the south side of the Hauptbahnhof. By Car: The A3 and A5 Autobahns intersect at Frankfurt. The A3 comes in from the Netherlands, Cologne, and Bonn, and continues east and south to Würzburg, Nürnberg, and Munich. The A5 comes from the northeast (Hannover and Bad Hersfeld) and continues south to Heidelberg, Mannheim, and Basel (Switzerland). From the west, the A60 connects with the A66, which leads to Frankfurt and the inner city, hooking up with the A3.
3.3 Demographic Data a) With a population of Frankfurt about 655,000, Germany is primarily a young
country with about 56% of the total population in the age group of 20-60 years and an average annual population growth of 0.1%. (Source: World Bank)
3.4 Economic Profile 3.4.1 Economic Base:
a) The economic base of the country is service sector driven with about 69.4%
contribution to the GDP (2003) and an annual increase of 0.2%. (Source: World Bank)
3.4.2 Economy of the city:
a) Frankfurt ranks fourth with New York, London and Tokyo as one of the world’s most important business cities. Some 42,000 businesses, generating more than €46 billion GDP, are registered in Frankfurt. Of the total jobs, 83% are in the service sector.
b) As the home of the Bundesbank, Germany's central bank, Frankfurt is also the
country's financial center. It's been a major banking city ever since the Rothschilds opened their first bank here in 1798. The city is home to a number of key national and international financial organizations, with 329 banks and 166 insurance companies generating business of over two billion Euros. Frankfurt also has a leading stock exchange. International trade fairs, including the world's largest annual book fair, are held in the city every year.
436
Confidential To Export Promotion Council for Handicrafts © 2005 Frost & Sullivan
c) Besides, Frankfurt is heavily industrial city, with more than 2,450 factories. The leading products manufactured in the city include iron castings, agricultural machinery, hardware, chemicals (notably in the Höchst district), textiles, and foodstuffs. Manufactures also include electrical equipment, pharmaceuticals, motor vehicles, clothing, and printed materials. Manufacturing products contribute 17% GDP per annum the city’s economy. The high technology sector is also increasingly important. Research flourishes in the city’s scientific institutions.
3.4.3 Retail Scenario in the City a) When it comes to shopping, Frankfurt has everything. In Frankfurt, the shopping
scene is divided into different regions. On "The Golden Mile," the Zeil are department stores, clothing shops, shoe stores, and furniture outlets. It was once one of the most famous shopping streets on the Continent, and still it has the highest sales of any shopping area in Germany. Nearby is the Kleinmarkthalle, a covered market with international grocery products.
b) The Hauptwache, in the center of Frankfurt, has two shopping areas, one above
and one below ground. Groceries, book dealers, flowers, clothing, tobacco, photo supplies, recordings, and sporting equipment abound. In the Hauptwache-Passage are restaurants, travel agencies, and banks. Schillerstrasse, near the stock exchange, has many elegant boutiques and specialty shops. Kaiserstrasse is also known for its large selection of stores selling clothing, audio and photography equipment, and stainless-steel ware. The heart of the fur trade in Frankfurt is Düsseldorfer Strasse. Most book dealers are located around the Hauptwache and Goetheplatz.
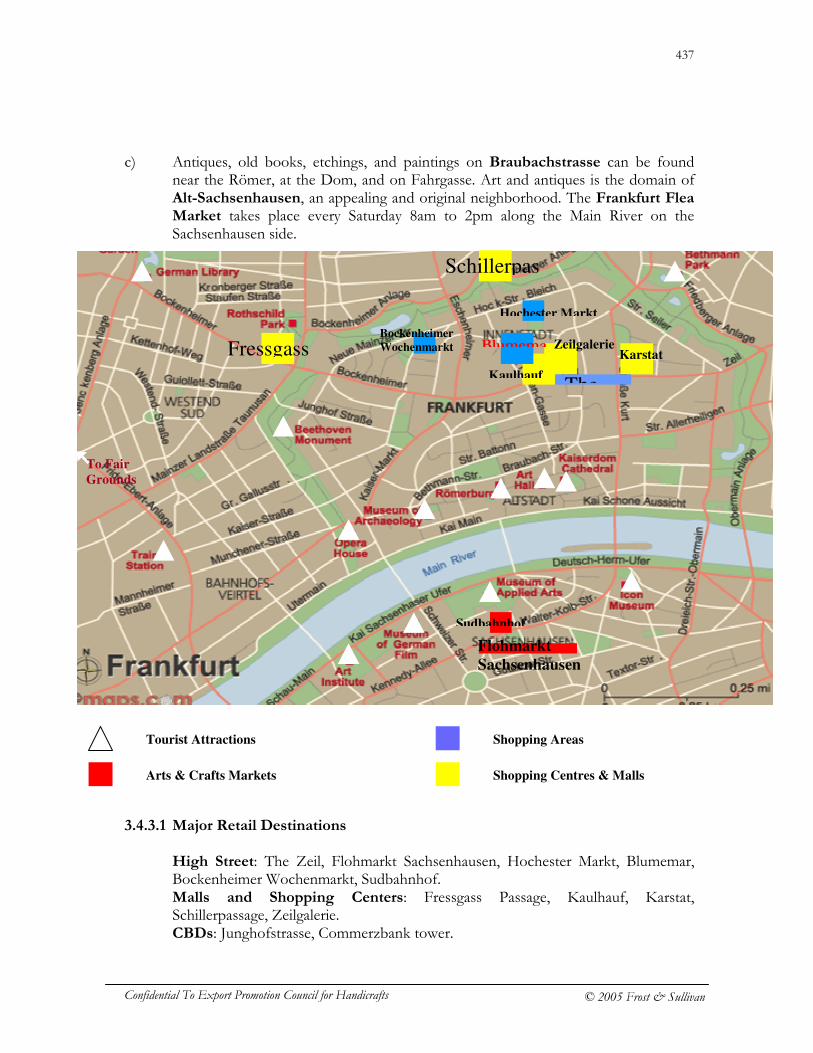
437
Confidential To Export Promotion Council for Handicrafts © 2005 Frost & Sullivan
c) Antiques, old books, etchings, and paintings on Braubachstrasse can be found near the Römer, at the Dom, and on Fahrgasse. Art and antiques is the domain of Alt-Sachsenhausen, an appealing and original neighborhood. The Frankfurt Flea Market takes place every Saturday 8am to 2pm along the Main River on the Sachsenhausen side.
3.4.3.1 Major Retail Destinations
High Street: The Zeil, Flohmarkt Sachsenhausen, Hochester Markt, Blumemar, Bockenheimer Wochenmarkt, Sudbahnhof. Malls and Shopping Centers: Fressgass Passage, Kaulhauf, Karstat, Schillerpassage, Zeilgalerie. CBDs: Junghofstrasse, Commerzbank tower.
The
Karstat
Flohmarkt
Sachsenhausen
Sudbahnhof
Kaulhauf
Zeilgalerie Fressgass
Schillerpas
BlumemaBockenheimer
Wochenmarkt
Hochester Markt
Arts & Crafts Markets Shopping Centres & Malls
Tourist Attractions Shopping Areas
To Fair
Grounds
438
Confidential To Export Promotion Council for Handicrafts © 2005 Frost & Sullivan
3.4.3.2 Handicrafts/ Arts & Crafts Market a) Frankfurt has two handicrafts market and a weekly flea market. One being the
Sudbahnhof Wochenmarkt where one can find local produce and crafts. The other is Braubachstrasse where shops and stores of antiques, old books, etchings, and paintings are located. Art and antiques can also be found in the domain of Alt-Sachsenhausen. The Frankfurt Flea Market- Flohmarkt Sachsenhausen- takes place every Saturday along the Main River on the Sachsenhausen side and the primary business interest here is clothes, household appliances, CDs and antique furniture.
b) The following store in Frankfurt deals in local art and crafts.
S.No. NAME LOCATION PRODUCTS
1 Farben Jenisch Königsberger Straße artists' accessories, wallpaper and carpets
3.5 Tourism a) With over 2,350,000 tourists (about 45% foreign tourists) every year and 9.5%
increase, primarily during February and August through October, Frankfurt draws the maximum number of tourists for numerous trade fairs, exhibitions and congresses it organizes. Besides the International fairs, Frankfurt has many tourist attractions as well.
3.5.1 Tourist Destinations a) Frankfurt's international trade fairs in spring and autumn bring some 1.5 million
visitors to the city and its Messe Frankfurt (fairgrounds). Fairs include the Book Fair, the Motor Show, the Textile Fair, the Chemical Industries Fair, and the Cookery Fair. Among the largest on the international circuit are the International Book Fair (Buchmesse Frankfurt) and ACHEMA (chemical engineering, environmental protection and biotechnology). The International Book Fair draws some 5,500 publishers from nearly 100 countries and is the most important meeting place in the world for the acquisition and sale of book rights and translations.
b) Although Frankfurt doesn't have the monuments or museums to equal Munich or
Berlin, its exhibition halls and museums, high-calibre performance groups and local festivals entice some 2 million visitors annually. As the birthplace of Germany’s most revered writer, Johann Wolfgang von Goethe (1749-1832), the city is at pains to impress with its cultural pedigree.
c) Frankfurt has a lot of parks. Locals like to point out that while the city has no
Central Park as New York does, it is itself a central park. A botanic city ring has
439
Confidential To Export Promotion Council for Handicrafts © 2005 Frost & Sullivan
replaced the enclosing city walls of old Frankfurt. The Palmengarten is a park and a botanical garden. During the last decade, the gardens have been renewed and the conservatories and historic greenhouses completely reconstructed. A huge gallery that serves as an exhibition hall for flower shows and other botanical exhibitions surrounds the 1869 palm house. Collections of orchids, palms, succulents, water lilies, and many others are also on display.
d) In summer, concerts are given in the band shell; evening events include open-air
dancing, jazz, and fountain illumination. There are some facilities for food. Bethmann Park, with its Chinese gardens, is another interesting park.
e) Most of Frankfurt's sights, nightlife, restaurants, and hotels lie in the Stadmitte
(town center). Most of the heart of Frankfurt can be covered on foot. Nearly all the main sights lie within the boundaries of the old town walls, which today form a stretch of narrow parkland, almost a perfect half-moon around the Altstadt or old city. A good place to start exploring Frankfurt is at the Römerberg, or historical core of the city. In medieval times, the Römerberg was the marketplace of Frankfurt.
f) The most important building in the Stadmitte is the red-sandstone church of St.
Bartholomäus, often called "the Dom" although it isn't a cathedral. The Goethe-Haus and Goethe-Museum are at a short distance from the north of the center in the northern Altstadt. To the north of this is Zeil- one of Europe's greatest shopping streets. Another landmark of the Stadmitte is Hauptwache, an 18th-century baroque building. Northwest of the Hauptwache is the Börse, the stock exchange of Frankfurt.
3.6 Potential Locations for EPCH Retail Formats:
a) Based on the popularity and the number of footfalls, the stores can be located
around: Tourist Attractions: � Römerberg � Goethe-Haus and Goethe-Museum � Kaiserstrasse � The Zeil
Shopping Areas: � The Zeil � Alt-Sachsenhausen
Business Centers: � Frankfurt Fairgrounds
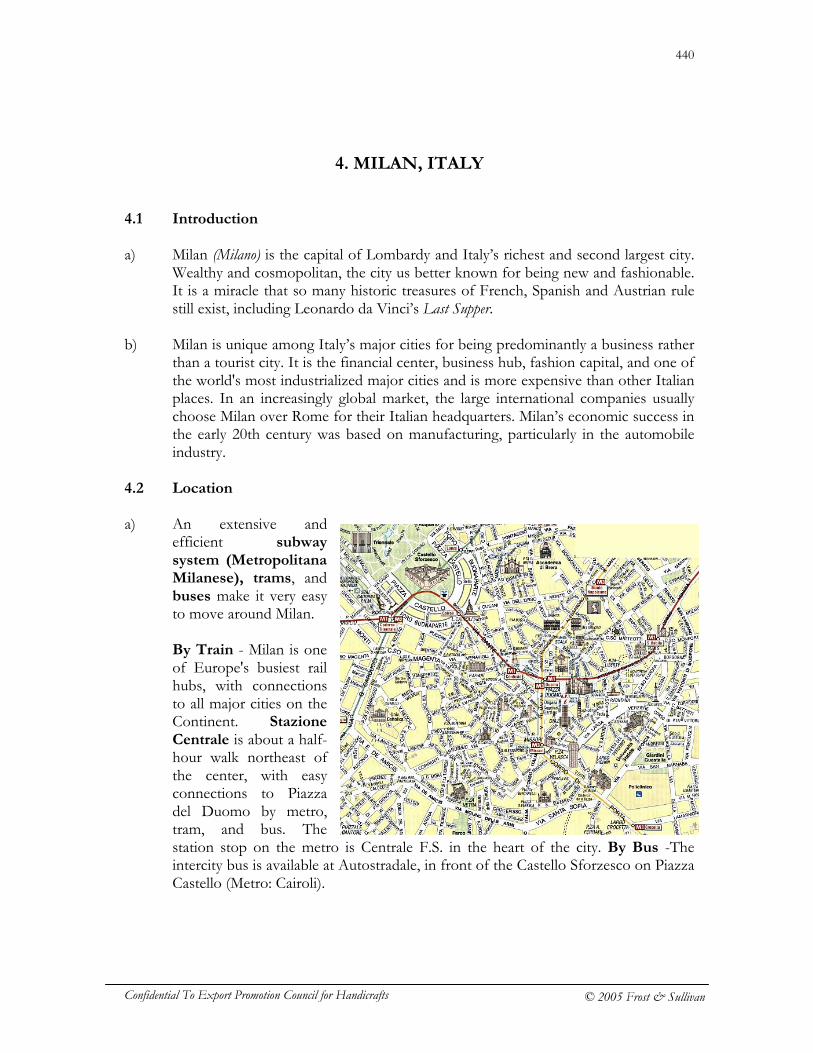
440
Confidential To Export Promotion Council for Handicrafts © 2005 Frost & Sullivan
4. MILAN, ITALY 4.1 Introduction
a) Milan (Milano) is the capital of Lombardy and Italy’s richest and second largest city.
Wealthy and cosmopolitan, the city us better known for being new and fashionable. It is a miracle that so many historic treasures of French, Spanish and Austrian rule still exist, including Leonardo da Vinci’s Last Supper.
b) Milan is unique among Italy’s major cities for being predominantly a business rather
than a tourist city. It is the financial center, business hub, fashion capital, and one of the world's most industrialized major cities and is more expensive than other Italian places. In an increasingly global market, the large international companies usually choose Milan over Rome for their Italian headquarters. Milan’s economic success in the early 20th century was based on manufacturing, particularly in the automobile industry.
4.2 Location a) An extensive and
efficient subway system (Metropolitana Milanese), trams, and buses make it very easy to move around Milan. By Train - Milan is one of Europe's busiest rail hubs, with connections to all major cities on the Continent. Stazione Centrale is about a half-hour walk northeast of the center, with easy connections to Piazza del Duomo by metro, tram, and bus. The station stop on the metro is Centrale F.S. in the heart of the city. By Bus -The intercity bus is available at Autostradale, in front of the Castello Sforzesco on Piazza Castello (Metro: Cairoli).
441
Confidential To Export Promotion Council for Handicrafts © 2005 Frost & Sullivan
By Car -- Milan is well served by Italy's superhighway (autostrada) system. The A1 links Milan with Florence and Rome, and the A4 connects Milan with Verona and Venice to the east and Turin to the west. By Plane -- Milan Malpensa, 45km (28 miles) west of the center, is Milan's new international airport. A 40-minute express train heads half-hourly to Cadorna train station in western Milan rather than the larger and more central Stazione Centrale from which most trains onward to other northern Italian points. More convenient, perhaps, are the Malpensa shuttle buses, which will take directly to that central downtown rail station. Milan Linate, only 7km (4 1/4 miles) east of the center, handles some European flights (which are increasingly being moved to Malpensa) and domestic flights.
4.3 Demographic Data a) With a population of Milan about 1,272,000, Italy is primarily a young country with
about 56% of the total population in the age group of 20-60 years and average annual growth of (-) 0.1%. (Source: World Bank)
4.4 Economic Profile 4.3.1 Economic Base a) The economic base of the country is service sector driven with about 69.5%
contribution to the GDP (2003) and an annual growth of 0.5% in this sector. (Source: World Bank)
4.3.2 Economy of the City:
a) Milan is a Mecca for business travelers who annually spend over 100 billion Euros
in the city. Not only is the city well located but it also has a modern infrastructure, efficient transport network and offers a well-educated, dynamic labor force. It is a leading commercial, financial, and manufacturing center of Italy and a major center of intellectual and artistic life. Milan is mainly a modern city, surrounded by industrial suburbs. It has many tall apartment and office buildings in the business district and extensive residential and industrial sections.
b) Since the 1970s, Milan has remained the capital of Italy’s automobile industry and its
financial markets, but the limelight is dominated by the fashion houses, who, in turn, have drawn media and advertising agencies to the city. Milan remains the marketplace for Italian fashion – fashion aficionados, supermodels and international paparazzi. Valentino, Versace and Armani design and manufacture their clothes elsewhere but Milan, which has carefully guarded its reputation for flair, drama and creativity, is Italy’s natural stage.
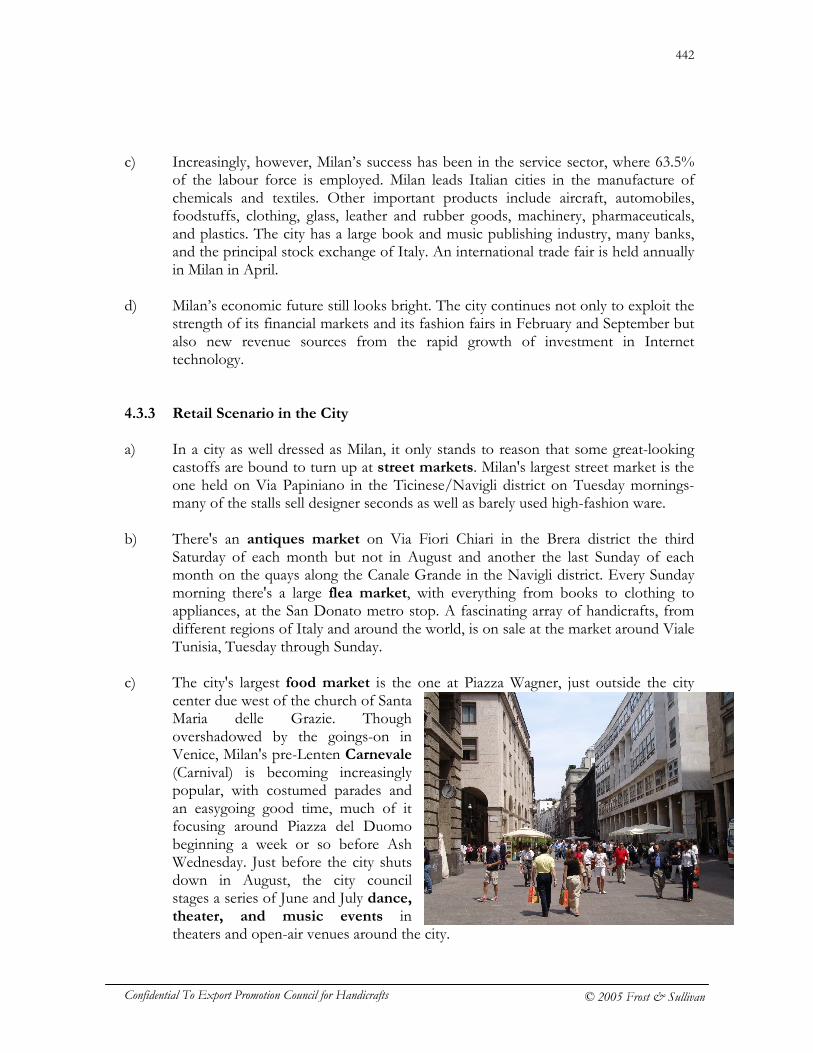
442
Confidential To Export Promotion Council for Handicrafts © 2005 Frost & Sullivan
c) Increasingly, however, Milan’s success has been in the service sector, where 63.5% of the labour force is employed. Milan leads Italian cities in the manufacture of chemicals and textiles. Other important products include aircraft, automobiles, foodstuffs, clothing, glass, leather and rubber goods, machinery, pharmaceuticals, and plastics. The city has a large book and music publishing industry, many banks, and the principal stock exchange of Italy. An international trade fair is held annually in Milan in April.
d) Milan’s economic future still looks bright. The city continues not only to exploit the
strength of its financial markets and its fashion fairs in February and September but also new revenue sources from the rapid growth of investment in Internet technology.
4.3.3 Retail Scenario in the City a) In a city as well dressed as Milan, it only stands to reason that some great-looking
castoffs are bound to turn up at street markets. Milan's largest street market is the one held on Via Papiniano in the Ticinese/Navigli district on Tuesday mornings- many of the stalls sell designer seconds as well as barely used high-fashion ware.
b) There's an antiques market on Via Fiori Chiari in the Brera district the third
Saturday of each month but not in August and another the last Sunday of each month on the quays along the Canale Grande in the Navigli district. Every Sunday morning there's a large flea market, with everything from books to clothing to appliances, at the San Donato metro stop. A fascinating array of handicrafts, from different regions of Italy and around the world, is on sale at the market around Viale Tunisia, Tuesday through Sunday.
c) The city's largest food market is the one at Piazza Wagner, just outside the city
center due west of the church of Santa Maria delle Grazie. Though overshadowed by the goings-on in Venice, Milan's pre-Lenten Carnevale (Carnival) is becoming increasingly popular, with costumed parades and an easygoing good time, much of it focusing around Piazza del Duomo beginning a week or so before Ash Wednesday. Just before the city shuts down in August, the city council stages a series of June and July dance, theater, and music events in theaters and open-air venues around the city.
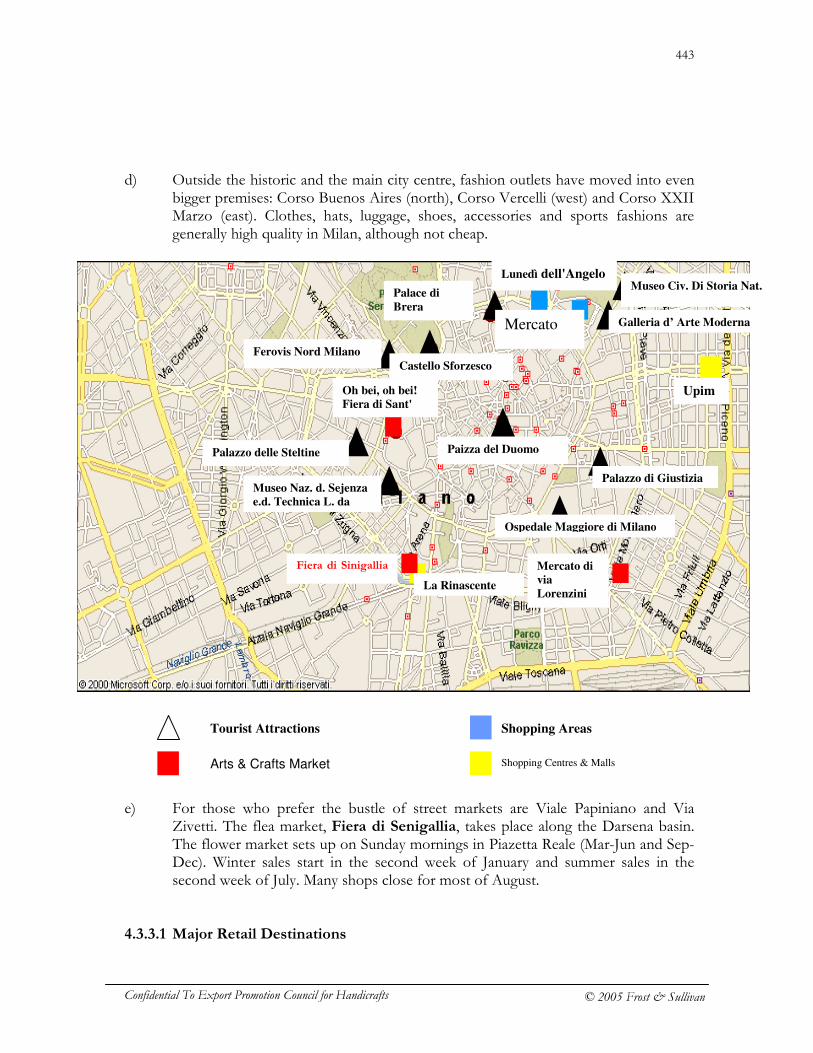
443
Confidential To Export Promotion Council for Handicrafts © 2005 Frost & Sullivan
Oh bei, oh bei! Fiera di Sant'
Ambrogio
Fiera di Sinigallia
Mercato di via
Lorenzini
Mercato
Lunedì dell'Angelo
Upim
La Rinascente
Paizza del Duomo
Castello Sforzesco
Ferovis Nord Milano
Museo Civ. Di Storia Nat.
Galleria d’ Arte Moderna
Palazzo di Giustizia
Ospedale Maggiore di Milano
Museo Naz. d. Sejenza e.d. Technica L. da
Palazzo delle Steltine
Palace di
Brera
Arts & Crafts Market
Tourist Attractions Shopping Areas
Shopping Centres & Malls
d) Outside the historic and the main city centre, fashion outlets have moved into even
bigger premises: Corso Buenos Aires (north), Corso Vercelli (west) and Corso XXII Marzo (east). Clothes, hats, luggage, shoes, accessories and sports fashions are generally high quality in Milan, although not cheap.
e) For those who prefer the bustle of street markets are Viale Papiniano and Via Zivetti. The flea market, Fiera di Senigallia, takes place along the Darsena basin. The flower market sets up on Sunday mornings in Piazetta Reale (Mar-Jun and Sep-Dec). Winter sales start in the second week of January and summer sales in the second week of July. Many shops close for most of August.
4.3.3.1 Major Retail Destinations
444
Confidential To Export Promotion Council for Handicrafts © 2005 Frost & Sullivan
High Street: Lunedì dell'Angelo, Mercato dei fiori e delle piante, Oh bei, oh bei! Fiera di Sant' Ambrogio, Fiera di Sinigallia, Mercato di via Lorenzini. Malls and Shopping Centers: La Rinascente, Upim, Coin, Centro Commerciale Metropoli.
4.3.3.2 Handicrafts/ Arts & Crafts Market a) The handicrafts/arts & crafts markets in Milan are Fiera di Sinigallia, a flea
market, primarily selling clothes, military gear, costumes and jewellery, Mercato di via Lorenzini- an area with shops selling period goods and Oh bei, oh bei! Fiera di Sant' Ambrogio- a traditional and handicrafts market.
4.5 Tourism a) With over 3,200,000 tourists every year, spending over 2.71 billion USD (on an
average 209 euros/person/day), primarily during April-June and September-October, Milan is a pleasant shopping experience esp. for the fashion conscious.
b) The basic layout with the popular tourist destinations can be traced as follows. The
modern civic centre lies to the northwest, around Mussolini’s central station, and is dominated by the Pirelli skyscraper- one of the first skyscrapers in Italy. The trade and fashion fairs take place in the Fiera district, west of the nucleus around the Porta Genova station. Though Milan’s position at the heart of a network of canals, which provided the irrigation for the Lombard plains and the important trade links between the north and south, these were filled in to make way for roads. A few canals remain in the Navigli district near the Bocconi University, a fashionable area in which to drink and listen to jazz and other live music, especially during the warm summers of Milan’s typically continental climate.
4.5.1 Tourist Destinations a) Milan is a series of concentric circles radiating from the Piazza del Duomo at the
center. The city's major neighborhoods encircle the hub, Piazza del Duomo. Looking west from the Duomo is the imposing Castello Sforzesco at one end of the well-heeled Magenta neighborhood. The other major tourist draw in Magenta is the church of Santa Maria delle Grazie.
b) Heading north from the Piazza del Duomo is the city's glass-enclosed shopping
center (the world's 1st), the Galleria Vittorio Emanuele II. Emerging from the northern end of the Galleria are Piazza della Scala and Milan's famous opera house. Along Via Manzoni on to Via Montenapoleone is the city's high-fashion
445
Confidential To Export Promotion Council for Handicrafts © 2005 Frost & Sullivan
shopping district, the epicenter of Italian design. North of Piazza della Scala along Via Brera is the Brera neighborhood, where cobblestone streets and old palazzos surround the city's major art collection, the Pinacoteca di Brera.
c) Another neighborhood is Ticinese/Navigli. Beyond the central city and due south
of Piazza del Duomo, the Navigli's old quays follow what remains of an elaborate canal system, designed in part by Leonardo da Vinci.
d) Despite Milan's size and sprawl, many of its museums, churches, and other sights
are within easy walking distance of one another in the vicinity of the Duomo and Castello Sforzesco.
4.6 Potential Locations for EPCH Retail Formats a) Based on the popularity and the number of footfalls, the stores can be located
around: Tourist Attractions: � Piazza del Duomo � Castello Sforzesco
Shopping Areas: � Fiera di Senigallia � Galleria Vittorio Emanuele II � Pinacoteca di Brera
446
Confidential To Export Promotion Council for Handicrafts © 2005 Frost & Sullivan
5. AMSTERDAM, NETHERLANDS 5.1 Introduction a) Vast, vibrant and truly multicultural, London is one of the world’s great cities.
Located in the southeast of England, on the River Thames, it is the capital of the United Kingdom (UK) and has been the heart of its political, cultural and business life for centuries.
b) Over the centuries, London has developed and expanded. Nowadays, the sheer
scale of Greater London can be daunting at first, as it sprawls 1500sq km (580 square miles) across a voluminous plain. However, it is a city that is surprisingly easy to get around, with the comprehensive and easily navigated London Underground or ‘Tube’. The twin axis on which London rests is the Houses of Parliament to the west and the City of London to the east. The seat of government (not far from the home of the royal family) is connected to the City (the financial engine room of London and the whole of the UK) by the River Thames. In between lie most of the tourist attractions and the busiest, liveliest different entertainment areas, such as Knightsbridge and Soho.
c) The actual City of London proper is 1 square mile (2.6 sq. km) of very expensive
real estate around the Bank of England. All of the gargantuan rest of the city is made up of separate villages, boroughs, and corporations- each with its own mayor and administration. Together, however, they add up to a mammoth metropolis.
5.2 Location a) London is located at a busy route connection the East with the West.
By Plane: Heathrow is closer to central London than Gatwick, but there is fast train service from both of the airports to the West End. London Heathrow Airport - Located west of London in Hounslow, Heathrow is one of the world's busiest airports. It has four terminals, each relatively self-contained. Gatwick Airport - While Heathrow still dominates, more and more scheduled flights land at relatively remote Gatwick, located some 40km (25 miles) south of London in West Sussex. London Stansted Airport- Located some 80km (50 miles) northeast of London's West End, Stansted, in Essex, handles mostly flights to and from the European continent. London City Airport - Located just 5km (3 miles) east of the bustling business community of Canary Wharf and 9.5km (6 miles) east of the City.
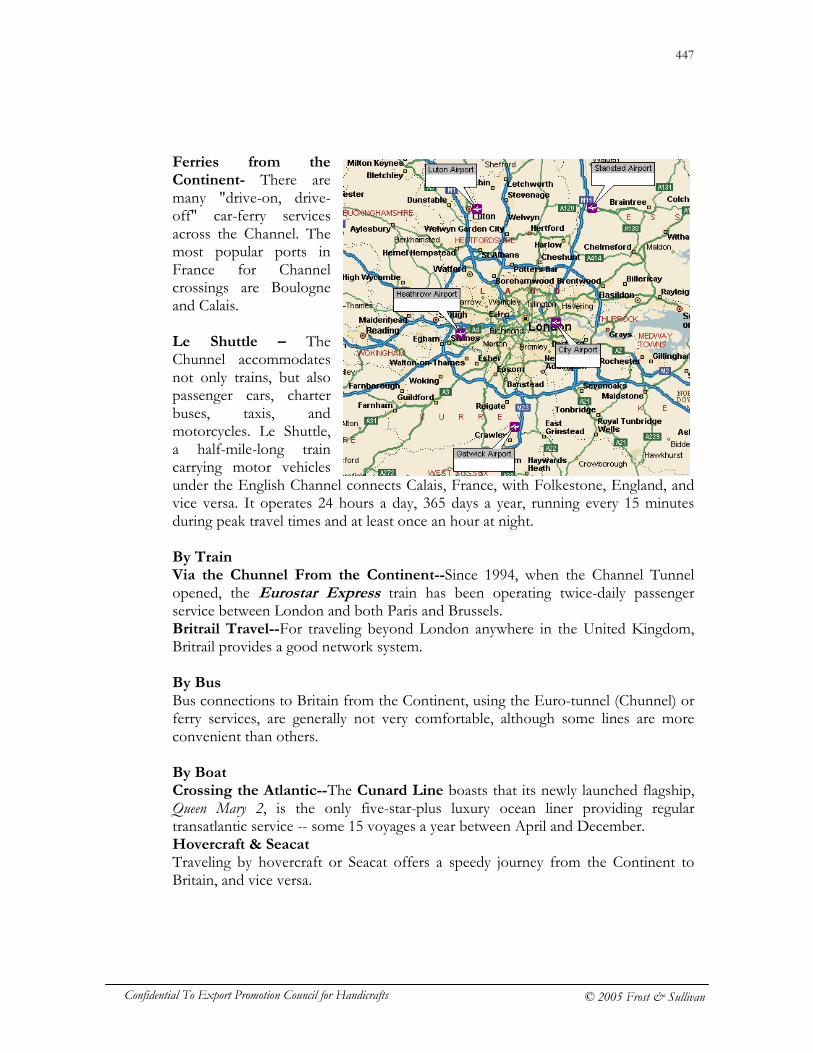
447
Confidential To Export Promotion Council for Handicrafts © 2005 Frost & Sullivan
Ferries from the Continent- There are many "drive-on, drive-off" car-ferry services across the Channel. The most popular ports in France for Channel crossings are Boulogne and Calais. Le Shuttle – The Chunnel accommodates not only trains, but also passenger cars, charter buses, taxis, and motorcycles. Le Shuttle, a half-mile-long train carrying motor vehicles under the English Channel connects Calais, France, with Folkestone, England, and vice versa. It operates 24 hours a day, 365 days a year, running every 15 minutes during peak travel times and at least once an hour at night.
By Train Via the Chunnel From the Continent--Since 1994, when the Channel Tunnel opened, the Eurostar Express train has been operating twice-daily passenger service between London and both Paris and Brussels. Britrail Travel--For traveling beyond London anywhere in the United Kingdom, Britrail provides a good network system. By Bus Bus connections to Britain from the Continent, using the Euro-tunnel (Chunnel) or ferry services, are generally not very comfortable, although some lines are more convenient than others. By Boat Crossing the Atlantic--The Cunard Line boasts that its newly launched flagship, Queen Mary 2, is the only five-star-plus luxury ocean liner providing regular transatlantic service -- some 15 voyages a year between April and December. Hovercraft & Seacat Traveling by hovercraft or Seacat offers a speedy journey from the Continent to Britain, and vice versa.
448
Confidential To Export Promotion Council for Handicrafts © 2005 Frost & Sullivan
5.3 Demographic Data a) With a population of London about 7,172,900, United Kingdom is primarily a
young country with about 54% of the total population in the age group of 20-60 years and average annual growth of 0.2%. (Source: World Bank)
5.4 Economic Profile 5.4.1 Economic Base a) The economic base of the country is service sector driven with about 72.4%
contribution to the GDP (2003) and an annual growth of 0.4% in this sector. (Source: World Bank)
5.4.2 Economy of the city a) London is at the heart of Britain's economy. More than one-third of Britain's
population and economic activity is concentrated in south-eastern England, in and around London. At £162 billion, London's economy accounts for 17% of the UK's GDP. More than a hundred of the world's major companies have their headquarters in London. What Londoners do for a living has changed considerably since the city was a commercial and industrial center in the 19th century. Manufacturing has steadily declined and today accounts for only 10 percent of total employment. The printing and publishing industry is now a leading employer. Also important are electrical and electronic engineering; food, drink, and tobacco; and chemicals and synthetic fibers.
b) Known as ‘the City’, the square mile located on the eastern side of central London,
the City of London, is the epicentre of British financial life and one of the world’s leading international financial centres. It boasts an impressive concentration and variety of banks, insurance companies and other business services. In fact, financial and business services throughout London employ around a third of the Greater London workforce.
c) London is Europe's most successful city at attracting overseas companies. London
in the 1980s and 1990s saw a decline in production and manufacturing jobs and a growth in the service sector. However, strengths remain in modern product-based manufacturing (specialist firms producing niche products) and high-tech companies. New light industry parks have sprung up out of town, although many businesses (such as computing) still prefer to stay closer to the City. For the more fashionable industries, such as media and design Soho is a sought-after address. To the east of the City, the Docklands has come of age and is now a credible and popular business location with good public transport links and modern office complexes. The centrepiece is Canary Wharf, Britain’s tallest building, which has been joined
449
Confidential To Export Promotion Council for Handicrafts © 2005 Frost & Sullivan
recently by two neighbouring skyscrapers. A stone's throw away from Canary Wharf, the state-of-the-art ExCel with the traditional conference venues and the world’s largest travel exhibition, World Travel Market is another prime venue.
5.4.3 Retail Scenario in the City a) Visiting one or more of London’s markets is a way of combining shopping with a
cultural experience. London is one of the world’s great shopping cities, with over 30,000 retail outlets dotted across the capital (3,000 of which in Central London alone). Typically for London, particular areas of the city have their own shopping characters. In the west, The King’s Road in Chelsea has a long-standing reputation for fashion, although is now mainly high-street chains, while the Notting Hill area, once primarily antiques, is now also very popular for fashion boutiques. In the east, the Brick Lane area has long been home to up-and-coming fashion designers’ studios but now the area is really taking off, with many designers opening shops alongside shops selling vintage furniture, second-hand clothes, design objects and other quirky finds (Cheshire Street is especially good for this).
b) More centrally, Oxford Street (the busiest shopping street in Europe, with 200
million visitors a year and a turnover of £5 billion) and Regent Street attract swarms of shoppers to well-known high-street clothing shops and megastores. Department stores are mostly located along Oxford Street, although the high-fashion stores are just down Regent Street. Carnaby Street is mostly filled now with chains. The parallel Newburgh Street has independent trendy boutiques.
c) Tottenham Court Road is lined with electrical shops, while directly south, Charing
Cross Road has long been the centre for bookshops in London, with enticing second-hand shops and bigger chains. London’s largest bookshop, Waterstones, is situated on Piccadilly. Covent Garden is one of the most popular shopping areas. Its Piazza, once the site of the fruit and vegetable market, is now filled with specialist shops, cafés, craft stalls and street performers, while Floral Street is home to trendy clothes shops and Neal Street trendy shoe shops. Old and New Bond Streets are home to the flagship stores for big international designers, such as Prada and Gucci, with nearby Conduit Street providing a home to more off-the-wall designers. High-powered art galleries are scattered throughout Cork Street Harrods, Knightsbridge sells more upmarket souvenirs and attracts huge numbers of tourists (and locals) every year, with its legendary sales and heavenly food hall.
d) High-street shopping still dominates in the city centre, however, out-of-town
shopping centres are becoming increasingly popular. Visitors also flock to the antiques and flea market on the Portobello Road. Spitalfields Market focuses around organic produce stalls, there are also stalls selling arts and crafts, antiques, records and clothes. Antiques are available on Camden Passage and Greenwich Market.
450
Confidential To Export Promotion Council for Handicrafts © 2005 Frost & Sullivan
5.4.3.1 Major Real Estate Destinations
High Street: Bond Street, Camden Market, Piccadilly, Brixton, Greenwich Mkt, Portobello, Hamleys. Malls and Shopping Centres: Antiquarius, Harvey Nichols, Marks & Spencer, Harrods, Oriental City, O2 Center. CBDs: Known as ‘the City’, the square mile located on the eastern side of central London, is the epicentre of British financial life and one of the world’s leading international financial centres.
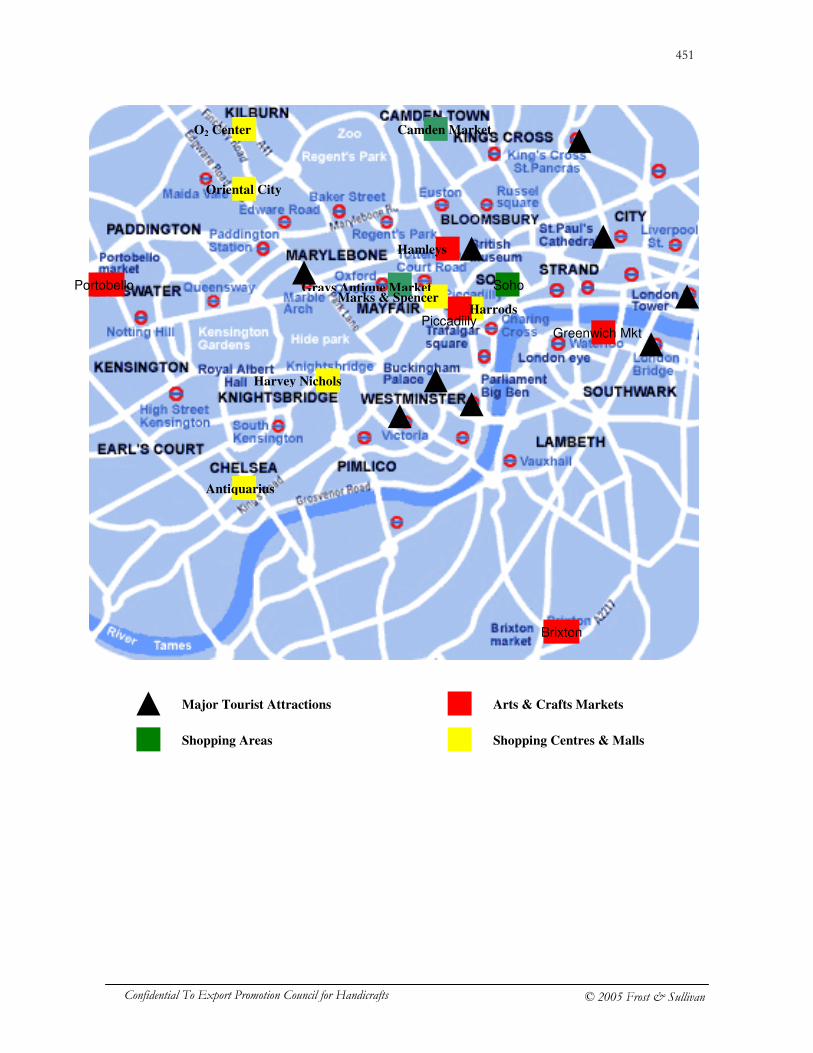
451
Confidential To Export Promotion Council for Handicrafts © 2005 Frost & Sullivan
Portobello
Brixton
Antiquarius
O2 Center
Oriental City
Piccadilly
Marks & Spencer
Harvey Nichols
Camden Market
Hamleys
Harrods
Grays Antique Market Soho
Greenwich Mkt
Major Tourist Attractions
Shopping Areas
Arts & Crafts Markets
Shopping Centres & Malls
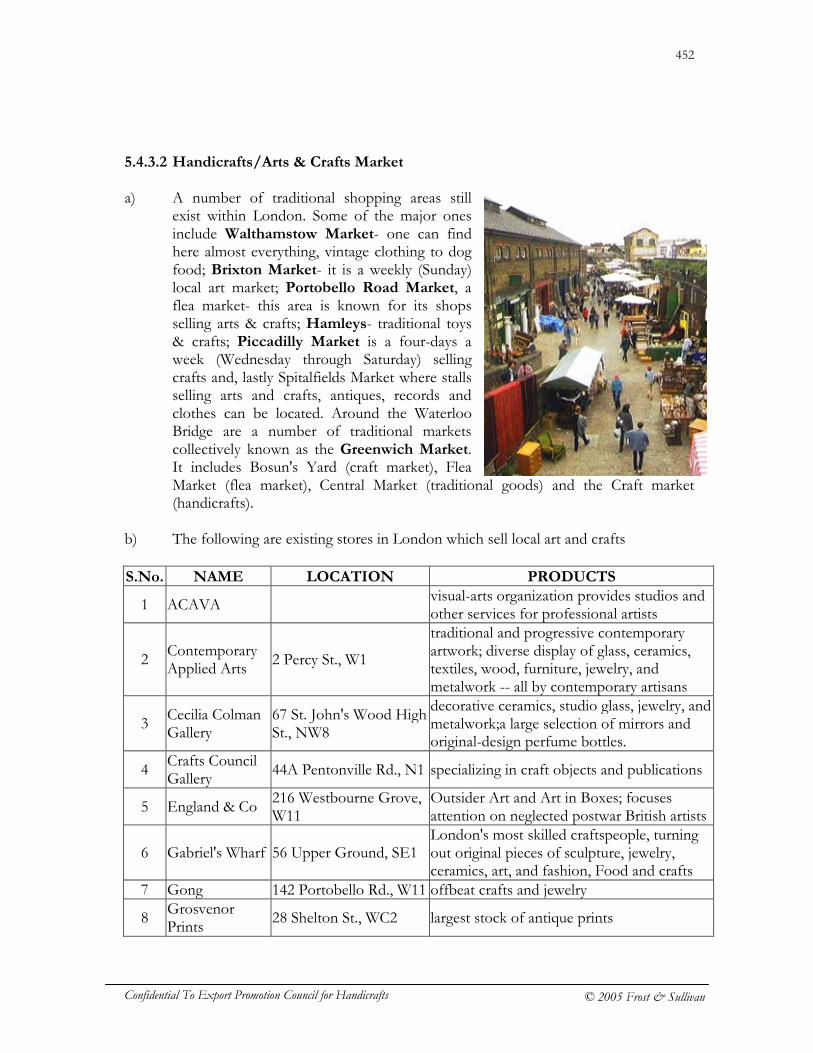
452
Confidential To Export Promotion Council for Handicrafts © 2005 Frost & Sullivan
5.4.3.2 Handicrafts/Arts & Crafts Market a) A number of traditional shopping areas still
exist within London. Some of the major ones include Walthamstow Market- one can find here almost everything, vintage clothing to dog food; Brixton Market- it is a weekly (Sunday) local art market; Portobello Road Market, a flea market- this area is known for its shops selling arts & crafts; Hamleys- traditional toys & crafts; Piccadilly Market is a four-days a week (Wednesday through Saturday) selling crafts and, lastly Spitalfields Market where stalls selling arts and crafts, antiques, records and clothes can be located. Around the Waterloo Bridge are a number of traditional markets collectively known as the Greenwich Market. It includes Bosun's Yard (craft market), Flea Market (flea market), Central Market (traditional goods) and the Craft market (handicrafts).
b) The following are existing stores in London which sell local art and crafts S.No. NAME LOCATION PRODUCTS
1 ACAVA visual-arts organization provides studios and other services for professional artists
2 Contemporary Applied Arts
2 Percy St., W1
traditional and progressive contemporary artwork; diverse display of glass, ceramics, textiles, wood, furniture, jewelry, and metalwork -- all by contemporary artisans
3 Cecilia Colman Gallery
67 St. John's Wood High St., NW8
decorative ceramics, studio glass, jewelry, and metalwork;a large selection of mirrors and original-design perfume bottles.
4 Crafts Council Gallery
44A Pentonville Rd., N1 specializing in craft objects and publications
5 England & Co 216 Westbourne Grove, W11
Outsider Art and Art in Boxes; focuses attention on neglected postwar British artists
6 Gabriel's Wharf 56 Upper Ground, SE1 London's most skilled craftspeople, turning out original pieces of sculpture, jewelry, ceramics, art, and fashion, Food and crafts
7 Gong 142 Portobello Rd., W11 offbeat crafts and jewelry
8 Grosvenor Prints
28 Shelton St., WC2 largest stock of antique prints
453
Confidential To Export Promotion Council for Handicrafts © 2005 Frost & Sullivan
S.No. NAME LOCATION PRODUCTS
9 Kelly Hoppen 175-177 Fulham Rd., SW3
ceramics (some designed for Wedgwood), furniture, and original accessories
10 Whitechapel Art Gallery
80-81 Whitechapel High St., E1
The gallery maintains its cutting edge; to some, it's the incubation chamber for some of the most talented of east London's artists
5.5 Tourism a) About 27 million tourists (2003) visited London, augmenting tourism by 1.76%
with maximum number from May through October. Shopping being the primary attraction, of the total 15 billion pounds spent by the tourists, approximately 6.65 billion pounds were spent on it. London accounts for about 50% of all overseas visits to the UK. The tourism sector employs approximately 350,000 people, accounting for 10% of all jobs in London.
5.5.1 Tourist Destinations a) London itself is a living museum, with more than 2000 years of history and culture.
With a huge concentration of tourist attractions including, cathedrals, palaces, museums, galleries and monuments, it’s a city that serves everyone. A huge number of visitors in London are drawn to Cathedrals and Churches- Westminster Abbey, St. Paul’s Church; important buildings- Buckingham Palace, 10-Downing Street; monumental buildings- Chelsea Royal Hospital, St. Pancras Station besides monuments and galleries. London has over 100 museums, the highest in any city in the world. The jewel in this cultural crown is the British Museum more than 4 million exhibits. The collections range from Egyptian and classical antiquities to exhibits on Roman and Anglo-Saxon Britain, China, Japan, India, and Mesopotamia. The Victoria and Albert Museum displays an important and varied collection of applied arts. The Natural History Museum with its dinosaurs, and the Science Museum, which includes a renowned section on the history of medicine, The Museum of London which effectively introduces visitors to London's history by walking them through successive eras chronologically and Madame Tussaud’s Wax Museum are some other attractions. The National Gallery on Trafalgar Square contains Britain's premier art collection, with holdings from every major European art school. Next door is the National Portrait Gallery, with thousands of striking portraits of Britons, both the well known and the unfamiliar. Also are a number of parks and gardens, Hyde Park, Kensington Garden, the London Zoo which attract a number of tourists.
454
Confidential To Export Promotion Council for Handicrafts © 2005 Frost & Sullivan
5.6 Potential Locations for EPCH Retail Formats a) Based on the popularity and the number of footfalls, the stores can be located
Tourist Attractions: � Westminster Abbey � British Museum � Victoria and Albert Museum � National Gallery
Shopping Streets:
� Bond Street � Portobello Road Market � Piccadilly Market
Airport: � Heathrow International Airport
Business Centres and Exhibition Halls: � ExCel
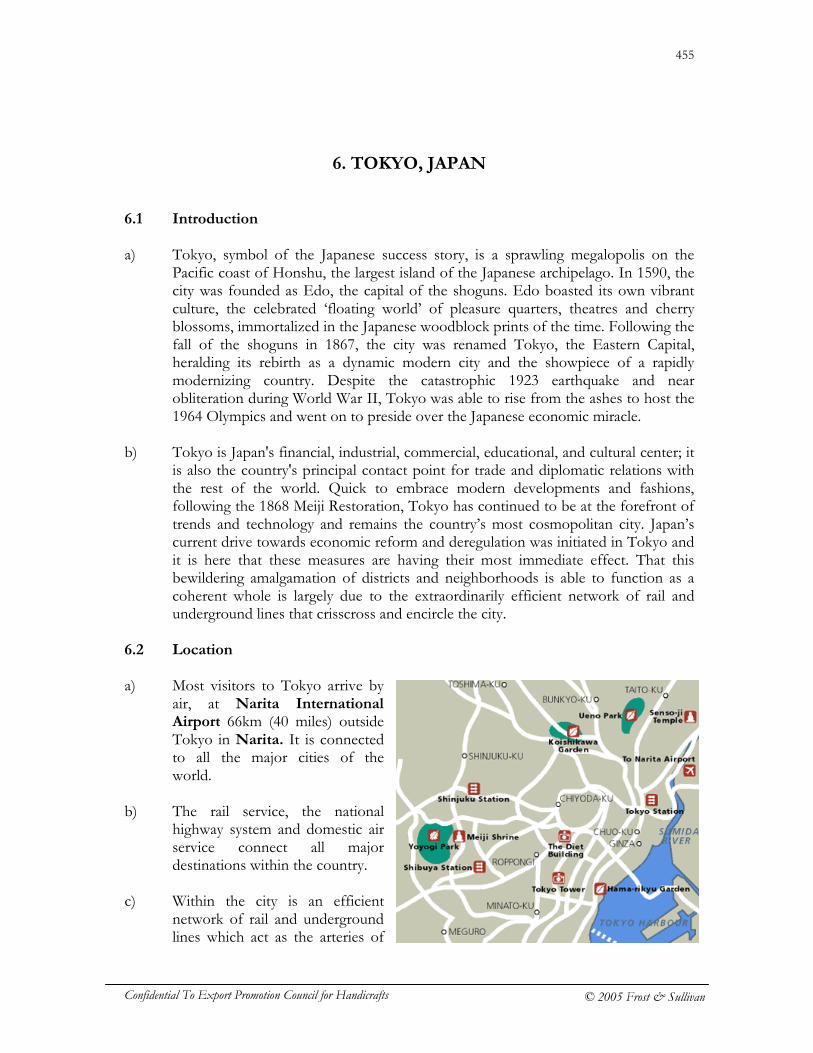
455
Confidential To Export Promotion Council for Handicrafts © 2005 Frost & Sullivan
6. TOKYO, JAPAN 6.1 Introduction a) Tokyo, symbol of the Japanese success story, is a sprawling megalopolis on the
Pacific coast of Honshu, the largest island of the Japanese archipelago. In 1590, the city was founded as Edo, the capital of the shoguns. Edo boasted its own vibrant culture, the celebrated ‘floating world’ of pleasure quarters, theatres and cherry blossoms, immortalized in the Japanese woodblock prints of the time. Following the fall of the shoguns in 1867, the city was renamed Tokyo, the Eastern Capital, heralding its rebirth as a dynamic modern city and the showpiece of a rapidly modernizing country. Despite the catastrophic 1923 earthquake and near obliteration during World War II, Tokyo was able to rise from the ashes to host the 1964 Olympics and went on to preside over the Japanese economic miracle.
b) Tokyo is Japan's financial, industrial, commercial, educational, and cultural center; it
is also the country's principal contact point for trade and diplomatic relations with the rest of the world. Quick to embrace modern developments and fashions, following the 1868 Meiji Restoration, Tokyo has continued to be at the forefront of trends and technology and remains the country’s most cosmopolitan city. Japan’s current drive towards economic reform and deregulation was initiated in Tokyo and it is here that these measures are having their most immediate effect. That this bewildering amalgamation of districts and neighborhoods is able to function as a coherent whole is largely due to the extraordinarily efficient network of rail and underground lines that crisscross and encircle the city.
6.2 Location a) Most visitors to Tokyo arrive by
air, at Narita International Airport 66km (40 miles) outside Tokyo in Narita. It is connected to all the major cities of the world.
b) The rail service, the national
highway system and domestic air service connect all major destinations within the country.
c) Within the city is an efficient
network of rail and underground lines which act as the arteries of
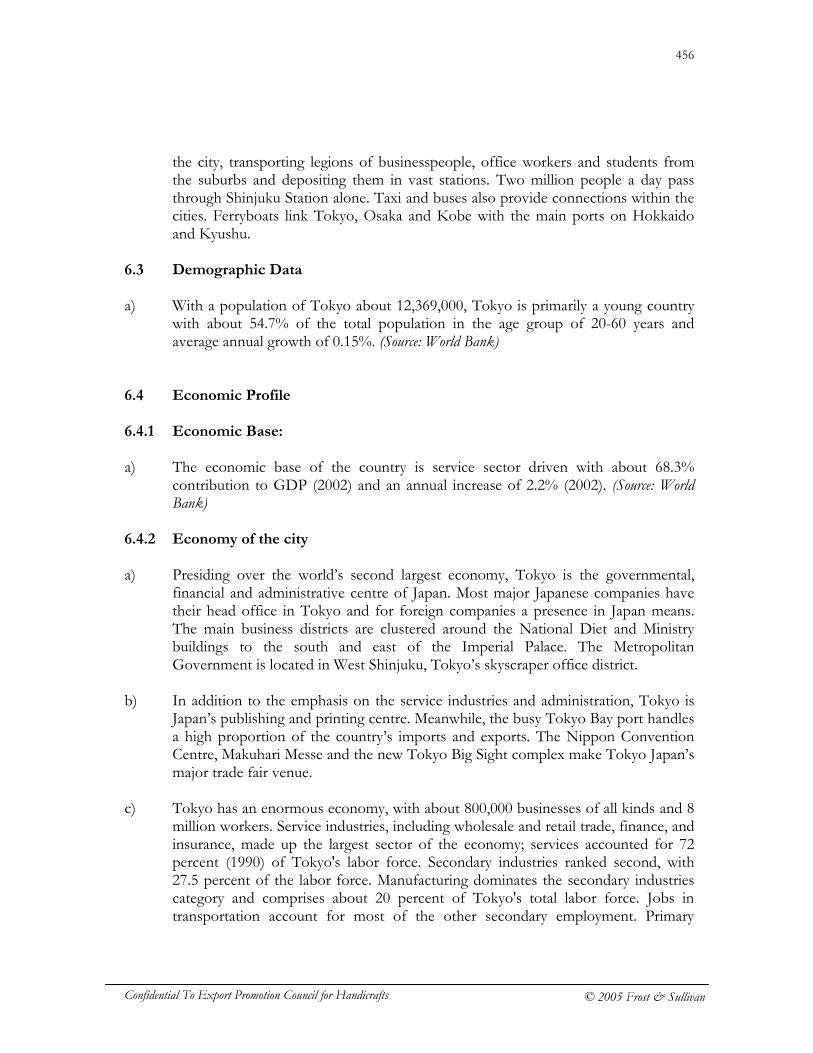
456
Confidential To Export Promotion Council for Handicrafts © 2005 Frost & Sullivan
the city, transporting legions of businesspeople, office workers and students from the suburbs and depositing them in vast stations. Two million people a day pass through Shinjuku Station alone. Taxi and buses also provide connections within the cities. Ferryboats link Tokyo, Osaka and Kobe with the main ports on Hokkaido and Kyushu.
6.3 Demographic Data a) With a population of Tokyo about 12,369,000, Tokyo is primarily a young country
with about 54.7% of the total population in the age group of 20-60 years and average annual growth of 0.15%. (Source: World Bank)
6.4 Economic Profile
6.4.1 Economic Base: a) The economic base of the country is service sector driven with about 68.3%
contribution to GDP (2002) and an annual increase of 2.2% (2002). (Source: World Bank)
6.4.2 Economy of the city a) Presiding over the world’s second largest economy, Tokyo is the governmental,
financial and administrative centre of Japan. Most major Japanese companies have their head office in Tokyo and for foreign companies a presence in Japan means. The main business districts are clustered around the National Diet and Ministry buildings to the south and east of the Imperial Palace. The Metropolitan Government is located in West Shinjuku, Tokyo’s skyscraper office district.
b) In addition to the emphasis on the service industries and administration, Tokyo is
Japan’s publishing and printing centre. Meanwhile, the busy Tokyo Bay port handles a high proportion of the country’s imports and exports. The Nippon Convention Centre, Makuhari Messe and the new Tokyo Big Sight complex make Tokyo Japan’s major trade fair venue.
c) Tokyo has an enormous economy, with about 800,000 businesses of all kinds and 8
million workers. Service industries, including wholesale and retail trade, finance, and insurance, made up the largest sector of the economy; services accounted for 72 percent (1990) of Tokyo's labor force. Secondary industries ranked second, with 27.5 percent of the labor force. Manufacturing dominates the secondary industries category and comprises about 20 percent of Tokyo's total labor force. Jobs in transportation account for most of the other secondary employment. Primary
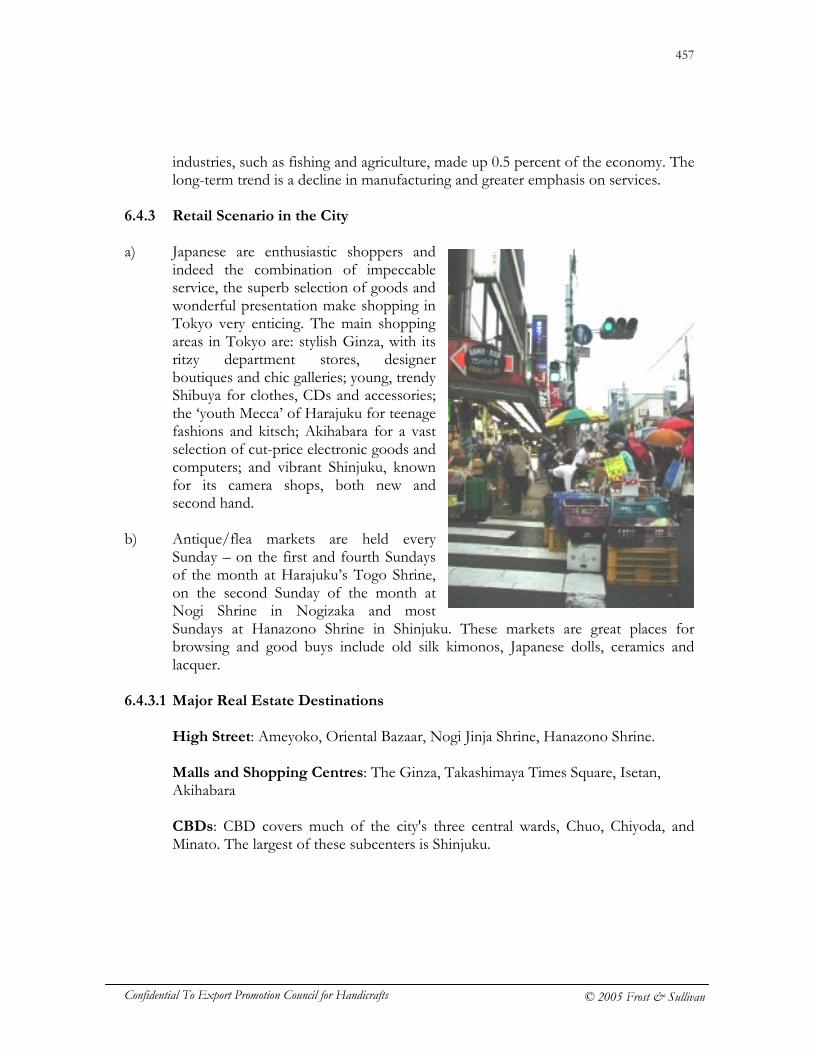
457
Confidential To Export Promotion Council for Handicrafts © 2005 Frost & Sullivan
industries, such as fishing and agriculture, made up 0.5 percent of the economy. The long-term trend is a decline in manufacturing and greater emphasis on services.
6.4.3 Retail Scenario in the City a) Japanese are enthusiastic shoppers and
indeed the combination of impeccable service, the superb selection of goods and wonderful presentation make shopping in Tokyo very enticing. The main shopping areas in Tokyo are: stylish Ginza, with its ritzy department stores, designer boutiques and chic galleries; young, trendy Shibuya for clothes, CDs and accessories; the ‘youth Mecca’ of Harajuku for teenage fashions and kitsch; Akihabara for a vast selection of cut-price electronic goods and computers; and vibrant Shinjuku, known for its camera shops, both new and second hand.
b) Antique/flea markets are held every
Sunday – on the first and fourth Sundays of the month at Harajuku’s Togo Shrine, on the second Sunday of the month at Nogi Shrine in Nogizaka and most Sundays at Hanazono Shrine in Shinjuku. These markets are great places for browsing and good buys include old silk kimonos, Japanese dolls, ceramics and lacquer.
6.4.3.1 Major Real Estate Destinations
High Street: Ameyoko, Oriental Bazaar, Nogi Jinja Shrine, Hanazono Shrine. Malls and Shopping Centres: The Ginza, Takashimaya Times Square, Isetan, Akihabara CBDs: CBD covers much of the city's three central wards, Chuo, Chiyoda, and Minato. The largest of these subcenters is Shinjuku.
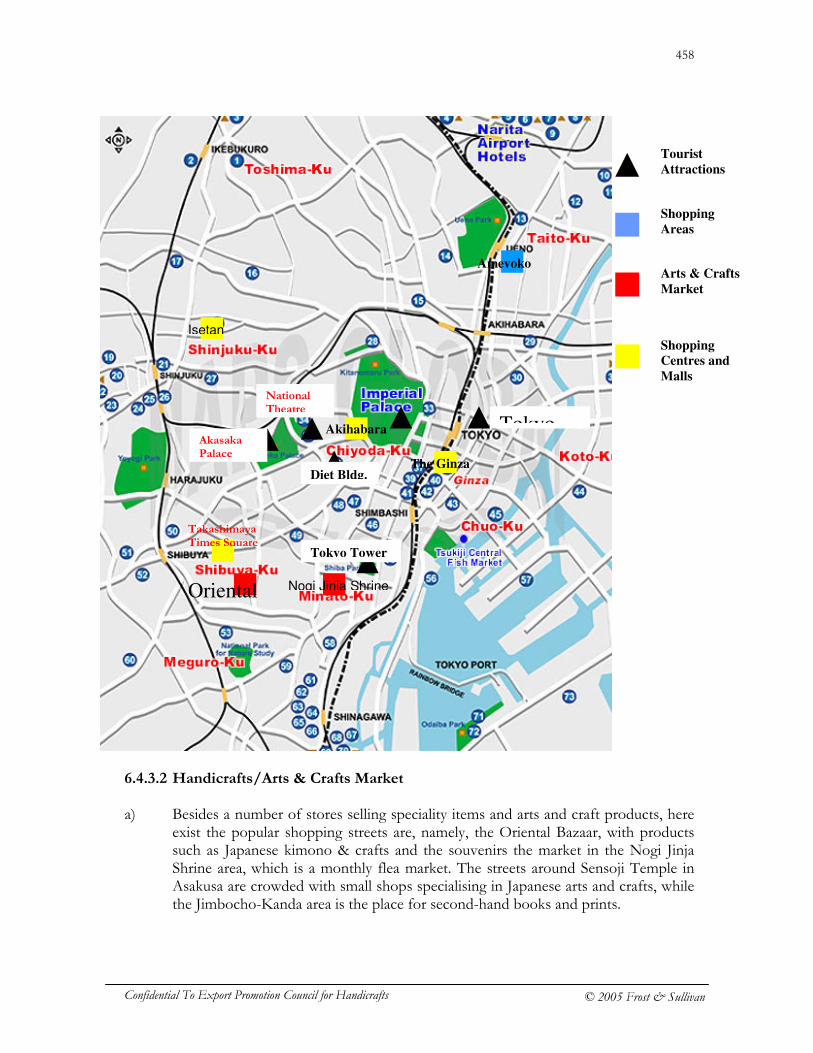
458
Confidential To Export Promotion Council for Handicrafts © 2005 Frost & Sullivan
6.4.3.2 Handicrafts/Arts & Crafts Market a) Besides a number of stores selling speciality items and arts and craft products, here
exist the popular shopping streets are, namely, the Oriental Bazaar, with products such as Japanese kimono & crafts and the souvenirs the market in the Nogi Jinja Shrine area, which is a monthly flea market. The streets around Sensoji Temple in Asakusa are crowded with small shops specialising in Japanese arts and crafts, while the Jimbocho-Kanda area is the place for second-hand books and prints.
The Ginza
Takashimaya Times Square
Isetan
Oriental Nogi Jinja Shrine
Ameyoko
Akasaka Palace
Tokyo Tower
Tokyo
Diet Bldg.
National Theatre
Tourist
Attractions
Shopping
Areas
Arts & Crafts
Market
Shopping
Centres and
Malls
Akihabara
459
Confidential To Export Promotion Council for Handicrafts © 2005 Frost & Sullivan
b) A list of the existing arts & crafts and handicrafts stores in Tokyo has been provided below:
S.No. NAME LOCATION PRODUCTS
1 Ando Ginza Japanese cloisonné, including jewelry, vases, and plates
2 Bengara Asakusa Traditional and modern noren of various sizes and colors, including those bearing kanji (Chinese characters) or scenes from famous woodblock prints.
3 Blue & White Azabu Juban
Japanese modern and traditional crafts, including textiles, yukata, porcelain, candles, picture frames, notebooks, fans, and more, mostly in colors of indigo-dyed blue and white.
4 Fujiya Asakusa
Towels are elevated to works of art, designed by a father-and-son team and featuring traditional motifs, including Kabuki actors, festivals, masks, flowers, and much more. Inexpensive gifts, they can be fashioned into scarves, framed as pictures, or used in countless other ways
5 Hyakusuke Asakusa traditional Japanese cosmetics
6 Ichy's Minami Aoyama
High-quality, hand-carved wooden Noh masks are sold here, as well as wood carvings of animals, religious figures, and other objects
7 Japan Sword Toranomon an outstanding collection of fine swords, daggers, sword guards, fittings, and other sword accessories, as well as antique samurai armor
8
Japan Traditional Craft Center (Zenkoku Dentoteki Kogeihin Senta)
1st floor of Metropolitan Plaza Building
Crafts for sale usually include lacquerware, ceramics, fabrics, paper products, bamboo items, writing brushes, ink stones, metalwork, furniture, and sometimes even stone lanterns or Buddhist family altars
9 Kanesoh Asakusa Knives and scissors (including gardening scissors)
10 Kotobukiya
Minato-ku, On Aoyama Dori, opposite Omotesando Dori
vases and accessories for flower arranging, of mostly contemporary designs. It also features objects used in tea ceremonies, including cast-iron tea pots
11 Kurodaya Taito-ku, Next to Kaminarimon
traditional Japanese paper and paper products, including kites, papier-mâché masks, boxes, and more
460
Confidential To Export Promotion Council for Handicrafts © 2005 Frost & Sullivan
S.No. NAME LOCATION PRODUCTS
Gate, to the east
12 Kyugetsu Taito-ku
Both modern and traditional dolls; its Japanese dolls range from elegant creatures with porcelain faces, delicate coiffures, and silk kimono to wooden dolls called kokeshi
13 Sukeroku Nakamise Dori, Asakusa
Handmade figures of traditional Japanese characters, from mythological figures to priests, farmers, entertainers, and animals
14 Tsutaya Minato-ku, On Kotto Dori
Materials for ikebana (flower arranging) or the Japanese tea ceremony, including vases of unusual shapes and sizes, scissors, and tea whisks
15 Yamamoto Soroban Ten
Taito-ku English-language explanations of how an abacus works are available
16 Yonoya Taito-ku handmade boxwood combs, crafted by a seventh-generation comb maker
17 Yoshitoku Taito-ku Tokyo's oldest wholesale doll and traditional crafts store
6.5 Tourism a) Of over 5.24 million visitors to Japan every year, majority have their destination as
Tokyo. It must be noted that the majority of tourists in Tokyo are for business purposes. The peak season is March through May and September through November. New Year is another occasion when another high in the number of tourists is recorded. Tourist attractions include Sensoji Temple, Tokyo National Museum, Edo-Tokyo Museum, Tokyo Metropolitan Government Office, Tokyo Disneyland and the National Diet.
6.5.1 Tourist Destinations a) Beneath Tokyo's concrete shell is a cultural life left very much intact. In fact, Tokyo
is the best place in the world to experience- Japanese performing arts, like Kabuki, as well as diverse activities such as the tea ceremony and flower arranging. It's also the nation's foremost repository of Japanese arts and crafts and boasts a wide range of both first-class and unique museums.
b) Major tourist attractions include everything, from temples and shrines to palaces,
museums, gardens, government buildings, markets etc. Sensoji Temple, Tokyo National Museum, National Museum of Modern Art, Edo-Tokyo Museum, Hara Museum of Contemporary Art, Tokyo Metropolitan Government Office, Tokyo
461
Confidential To Export Promotion Council for Handicrafts © 2005 Frost & Sullivan
Disneyland, Tsukiji Fish Market, Shinjuku Gyoen, The Imperial Palace, Open-Air Folk House Museum, East Garden and the National Diet are a few main tourism spots .
6.6 Potential Locations for EPCH Retail Formats a) Based on the popularity and the number of footfalls, the stores can be located
around:
Tourist Attractions: � Sensoji Temple � Tokyo National Museum � Edo-Tokyo Museum
Shopping Areas: � The Ginza � Oriental Bazaar
Business Centres and Exhibition Venues: � Shinjuku Gyoen � Nippon Convention Centre, Makuhari Messe and Tokyo Big Sight.
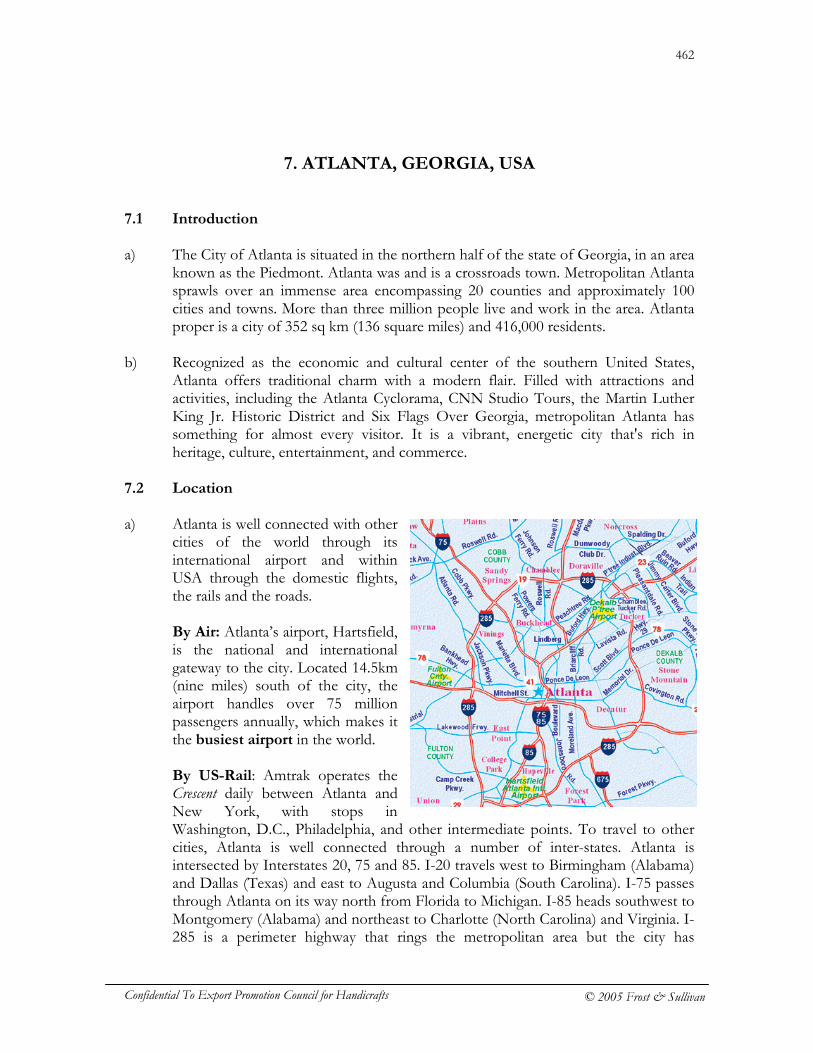
462
Confidential To Export Promotion Council for Handicrafts © 2005 Frost & Sullivan
7. ATLANTA, GEORGIA, USA
7.1 Introduction a) The City of Atlanta is situated in the northern half of the state of Georgia, in an area
known as the Piedmont. Atlanta was and is a crossroads town. Metropolitan Atlanta sprawls over an immense area encompassing 20 counties and approximately 100 cities and towns. More than three million people live and work in the area. Atlanta proper is a city of 352 sq km (136 square miles) and 416,000 residents.
b) Recognized as the economic and cultural center of the southern United States,
Atlanta offers traditional charm with a modern flair. Filled with attractions and activities, including the Atlanta Cyclorama, CNN Studio Tours, the Martin Luther King Jr. Historic District and Six Flags Over Georgia, metropolitan Atlanta has something for almost every visitor. It is a vibrant, energetic city that's rich in heritage, culture, entertainment, and commerce.
7.2 Location a) Atlanta is well connected with other
cities of the world through its international airport and within USA through the domestic flights, the rails and the roads. By Air: Atlanta’s airport, Hartsfield, is the national and international gateway to the city. Located 14.5km (nine miles) south of the city, the airport handles over 75 million passengers annually, which makes it the busiest airport in the world. By US-Rail: Amtrak operates the Crescent daily between Atlanta and New York, with stops in Washington, D.C., Philadelphia, and other intermediate points. To travel to other cities, Atlanta is well connected through a number of inter-states. Atlanta is intersected by Interstates 20, 75 and 85. I-20 travels west to Birmingham (Alabama) and Dallas (Texas) and east to Augusta and Columbia (South Carolina). I-75 passes through Atlanta on its way north from Florida to Michigan. I-85 heads southwest to Montgomery (Alabama) and northeast to Charlotte (North Carolina) and Virginia. I-285 is a perimeter highway that rings the metropolitan area but the city has
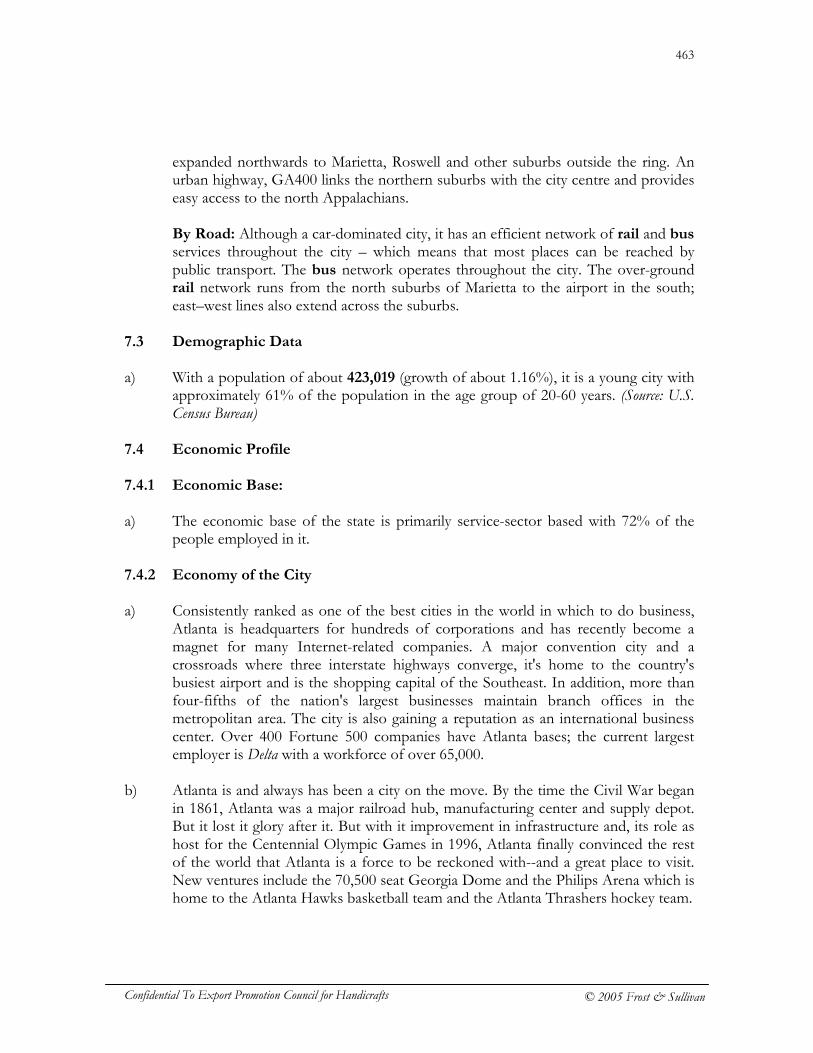
463
Confidential To Export Promotion Council for Handicrafts © 2005 Frost & Sullivan
expanded northwards to Marietta, Roswell and other suburbs outside the ring. An urban highway, GA400 links the northern suburbs with the city centre and provides easy access to the north Appalachians. By Road: Although a car-dominated city, it has an efficient network of rail and bus services throughout the city – which means that most places can be reached by public transport. The bus network operates throughout the city. The over-ground rail network runs from the north suburbs of Marietta to the airport in the south; east–west lines also extend across the suburbs.
7.3 Demographic Data a) With a population of about 423,019 (growth of about 1.16%), it is a young city with
approximately 61% of the population in the age group of 20-60 years. (Source: U.S. Census Bureau)
7.4 Economic Profile
7.4.1 Economic Base:
a) The economic base of the state is primarily service-sector based with 72% of the
people employed in it. 7.4.2 Economy of the City a) Consistently ranked as one of the best cities in the world in which to do business,
Atlanta is headquarters for hundreds of corporations and has recently become a magnet for many Internet-related companies. A major convention city and a crossroads where three interstate highways converge, it's home to the country's busiest airport and is the shopping capital of the Southeast. In addition, more than four-fifths of the nation's largest businesses maintain branch offices in the metropolitan area. The city is also gaining a reputation as an international business center. Over 400 Fortune 500 companies have Atlanta bases; the current largest employer is Delta with a workforce of over 65,000.
b) Atlanta is and always has been a city on the move. By the time the Civil War began
in 1861, Atlanta was a major railroad hub, manufacturing center and supply depot. But it lost it glory after it. But with it improvement in infrastructure and, its role as host for the Centennial Olympic Games in 1996, Atlanta finally convinced the rest of the world that Atlanta is a force to be reckoned with--and a great place to visit. New ventures include the 70,500 seat Georgia Dome and the Philips Arena which is home to the Atlanta Hawks basketball team and the Atlanta Thrashers hockey team.
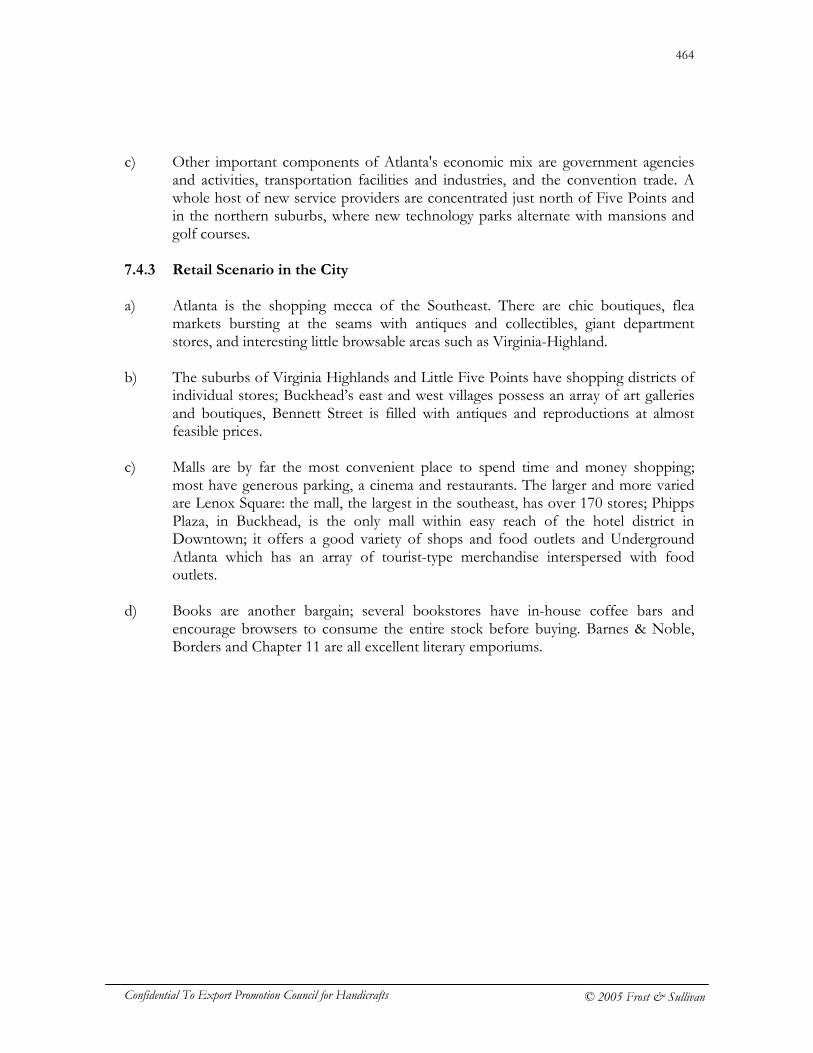
464
Confidential To Export Promotion Council for Handicrafts © 2005 Frost & Sullivan
c) Other important components of Atlanta's economic mix are government agencies and activities, transportation facilities and industries, and the convention trade. A whole host of new service providers are concentrated just north of Five Points and in the northern suburbs, where new technology parks alternate with mansions and golf courses.
7.4.3 Retail Scenario in the City a) Atlanta is the shopping mecca of the Southeast. There are chic boutiques, flea
markets bursting at the seams with antiques and collectibles, giant department stores, and interesting little browsable areas such as Virginia-Highland.
b) The suburbs of Virginia Highlands and Little Five Points have shopping districts of
individual stores; Buckhead’s east and west villages possess an array of art galleries and boutiques, Bennett Street is filled with antiques and reproductions at almost feasible prices.
c) Malls are by far the most convenient place to spend time and money shopping;
most have generous parking, a cinema and restaurants. The larger and more varied are Lenox Square: the mall, the largest in the southeast, has over 170 stores; Phipps Plaza, in Buckhead, is the only mall within easy reach of the hotel district in Downtown; it offers a good variety of shops and food outlets and Underground Atlanta which has an array of tourist-type merchandise interspersed with food outlets.
d) Books are another bargain; several bookstores have in-house coffee bars and
encourage browsers to consume the entire stock before buying. Barnes & Noble, Borders and Chapter 11 are all excellent literary emporiums.
465
Confidential To Export Promotion Council for Handicrafts © 2005 Frost & Sullivan
7.4.3.1 Major Retail Destinations
High Street: Intl. Farmers Market, Dekalb Farmer’s Market, Plaza Latina, Buckhead. Malls and Shopping Centres: Underground Atlanta, Cumberland Mall, Perimeter Mall, Phipps Plaza CBDs: Primarily concentrated towards the north of Five Points and in the northern suburbs of the city.
7.4.3.2 Handicrafts/Arts & Crafts Markets a) Shopping in metropolis Atlanta is mainly dominated by malls. Though flea markets
exist but it is the suburbs of Virginia Highlands and Little Five Points which are the shopping areas. The Flea market within the metropolis is the Plaza Latina where majority of the shops and stores sell Mexican handicrafts.
Perimeter Mall Cumberland Mall
Underground
Phipps Plaza
Dekalb Farmer’s Market
Intl. Farmers Market
Plaza
1 2
3
4
5
6
7
8
10 9
1. Georgia State Capitol
2. Atlanta Zoo
3. Georgia Dome
4. Martin Luther King Jr.
National Historic site
5. Jimmy Carter
Presidential Center
and Library
6. Donna Van Gogh’s
Artists’ Market
7. Fernbank Museum of
Natural History
8. Modern Primitive
Gallery
9. Atlanta Botanical
Garden
10. High Museum of Art
Tourist Attractions
Shopping Areas
Arts and Crafts Markets
Shopping Centres and Malls
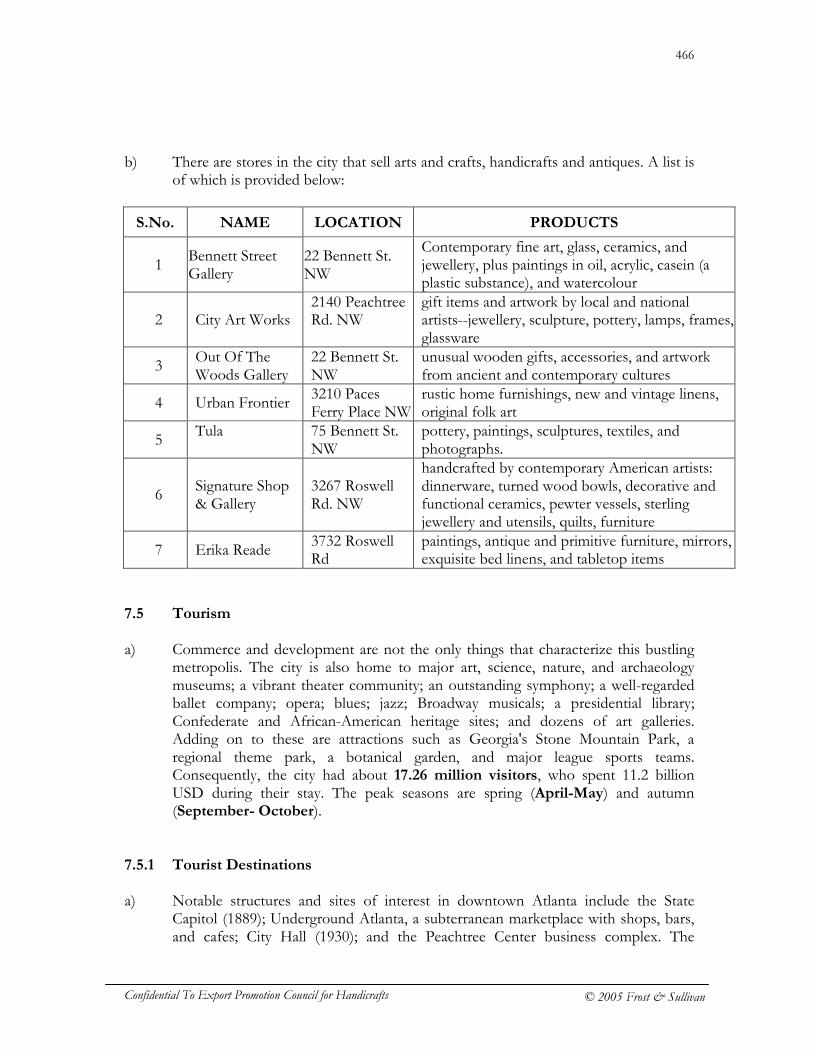
466
Confidential To Export Promotion Council for Handicrafts © 2005 Frost & Sullivan
b) There are stores in the city that sell arts and crafts, handicrafts and antiques. A list is of which is provided below:
S.No. NAME LOCATION PRODUCTS
1 Bennett Street Gallery
22 Bennett St. NW
Contemporary fine art, glass, ceramics, and jewellery, plus paintings in oil, acrylic, casein (a plastic substance), and watercolour
2 City Art Works 2140 Peachtree Rd. NW
gift items and artwork by local and national artists--jewellery, sculpture, pottery, lamps, frames, glassware
3 Out Of The Woods Gallery
22 Bennett St. NW
unusual wooden gifts, accessories, and artwork from ancient and contemporary cultures
4 Urban Frontier 3210 Paces Ferry Place NW
rustic home furnishings, new and vintage linens, original folk art
5 Tula 75 Bennett St.
NW pottery, paintings, sculptures, textiles, and photographs.
6 Signature Shop & Gallery
3267 Roswell Rd. NW
handcrafted by contemporary American artists: dinnerware, turned wood bowls, decorative and functional ceramics, pewter vessels, sterling jewellery and utensils, quilts, furniture
7 Erika Reade 3732 Roswell Rd
paintings, antique and primitive furniture, mirrors, exquisite bed linens, and tabletop items
7.5 Tourism a) Commerce and development are not the only things that characterize this bustling
metropolis. The city is also home to major art, science, nature, and archaeology museums; a vibrant theater community; an outstanding symphony; a well-regarded ballet company; opera; blues; jazz; Broadway musicals; a presidential library; Confederate and African-American heritage sites; and dozens of art galleries. Adding on to these are attractions such as Georgia's Stone Mountain Park, a regional theme park, a botanical garden, and major league sports teams. Consequently, the city had about 17.26 million visitors, who spent 11.2 billion USD during their stay. The peak seasons are spring (April-May) and autumn (September- October).
7.5.1 Tourist Destinations a) Notable structures and sites of interest in downtown Atlanta include the State
Capitol (1889); Underground Atlanta, a subterranean marketplace with shops, bars, and cafes; City Hall (1930); and the Peachtree Center business complex. The
467
Confidential To Export Promotion Council for Handicrafts © 2005 Frost & Sullivan
Georgia Dome, the home of the Atlanta Falcons football team, and the Philips Arena are also located downtown. Points of interest in southern Atlanta include the Atlanta Zoo; the Cyclorama (a 109-m/358-ft mural depicting the Civil War Battle of Atlanta); The Wren's Nest (former home of 19th and early-20th century writer Joel Chandler Harris); and Turner Field, home of the Atlanta Braves baseball team, which opened in 1997. Northern Atlanta is the site of Ansley Park residential community, the governor's mansion, and the Atlanta Botanical Gardens. Atlanta is known to offer a world-class botanical garden, picnic in scenic parks, raft down a river, visits to major art museum, splash through the Olympic ring fountains, take in an enchanting puppet show, and more.
7.6 Potential Locations for EPCH Retail Formats a) Based on the popularity and the number of footfalls, the stores can be located
around
Tourist Attractions: � Atlanta Cyclorama and Civil War Museum � Centennial Olympic Park � Georgia’s Stone Mountain Park � Georgia Dome
Shopping Areas: � Underground Atlanta � Five Points
Business Centers and Exhibition Halls � Peachtree Center Business Complex
468
Confidential To Export Promotion Council for Handicrafts © 2005 Frost & Sullivan
8. DALLAS, TEXAS, USA 8.1 Introduction a) Dallas, city in north central Texas is the third largest city in Texas and is the center
of the largest consolidated metropolitan area in the state. Dallas is a young city with all the vigor of youth. As a frontier post of the Western USA, Dallas established its reputation as a place for entrepreneurs and go-getters. As with so many great cities in the USA, railways were the key to a sudden blossoming of a former outpost. In the 1870s, two railroads – the Missouri, Kansas and Texas Line and the Texas and Pacific Railroad – met at Dallas, creating the catalyst for the city’s rapid development as a trade center.
b) At just over 1.2 million inhabitants, the city grew from a little Republic of Texas
pioneer outpost in the mid-19th century into a major center for banking, finance, and oil. In the city shopping is a religion, and mega-malls fan out in every direction, part of an endless commercial sprawl.
c) Dallas is the top business and leisure destination in Texas and the second most
popular convention site in the country. The city can't yet boast a cultural life on a par with business opportunities, but a recent burst of arts philanthropy is finally allowing Dallas to play catch-up. Still, Dallas has plenty to entertain visitors, many of whom come on business: great hotels, eclectic restaurants, thriving nightlife, and even a pretty robust alternative music scene.
d) Dallas has more shopping centers than any other US city, while the world’s largest
bronze monument stands at the Dallas Convention Center. And with a tenth of its workforce in the hospitality industry, Dallas is always a welcoming city.
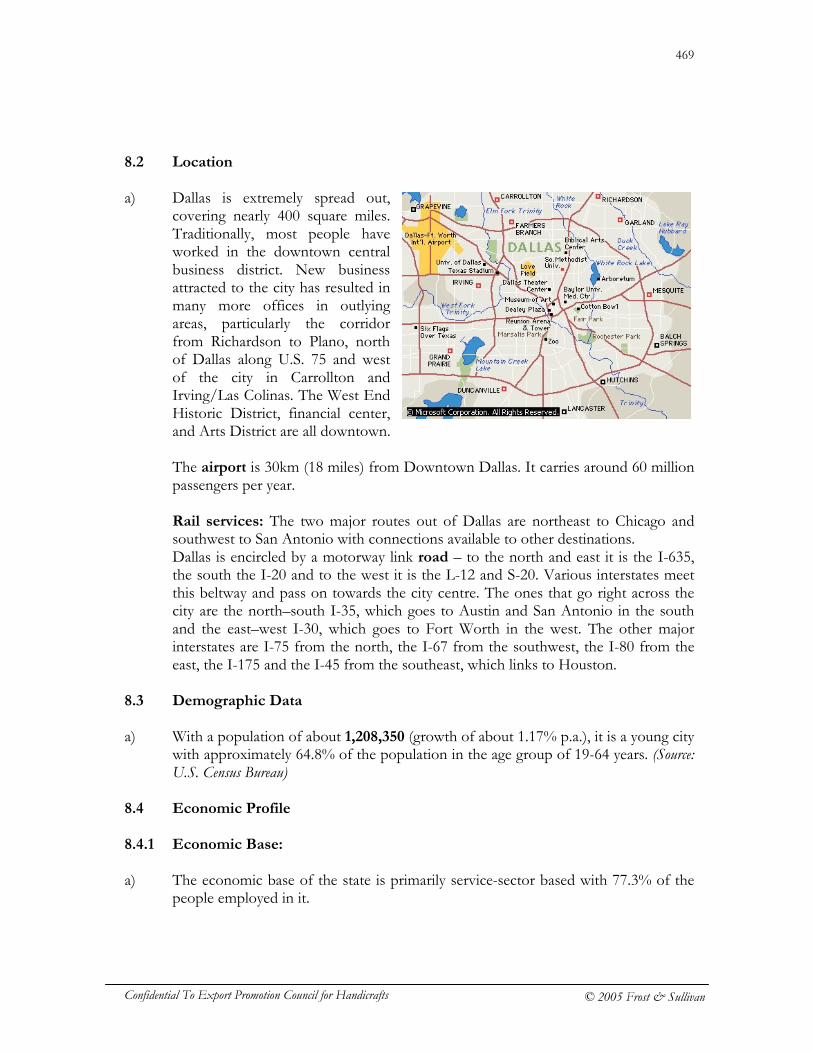
469
Confidential To Export Promotion Council for Handicrafts © 2005 Frost & Sullivan
8.2 Location a) Dallas is extremely spread out,
covering nearly 400 square miles. Traditionally, most people have worked in the downtown central business district. New business attracted to the city has resulted in many more offices in outlying areas, particularly the corridor from Richardson to Plano, north of Dallas along U.S. 75 and west of the city in Carrollton and Irving/Las Colinas. The West End Historic District, financial center, and Arts District are all downtown. The airport is 30km (18 miles) from Downtown Dallas. It carries around 60 million passengers per year. Rail services: The two major routes out of Dallas are northeast to Chicago and southwest to San Antonio with connections available to other destinations. Dallas is encircled by a motorway link road – to the north and east it is the I-635, the south the I-20 and to the west it is the L-12 and S-20. Various interstates meet this beltway and pass on towards the city centre. The ones that go right across the city are the north–south I-35, which goes to Austin and San Antonio in the south and the east–west I-30, which goes to Fort Worth in the west. The other major interstates are I-75 from the north, the I-67 from the southwest, the I-80 from the east, the I-175 and the I-45 from the southeast, which links to Houston.
8.3 Demographic Data a) With a population of about 1,208,350 (growth of about 1.17% p.a.), it is a young city
with approximately 64.8% of the population in the age group of 19-64 years. (Source: U.S. Census Bureau)
8.4 Economic Profile
8.4.1 Economic Base: a) The economic base of the state is primarily service-sector based with 77.3% of the
people employed in it.
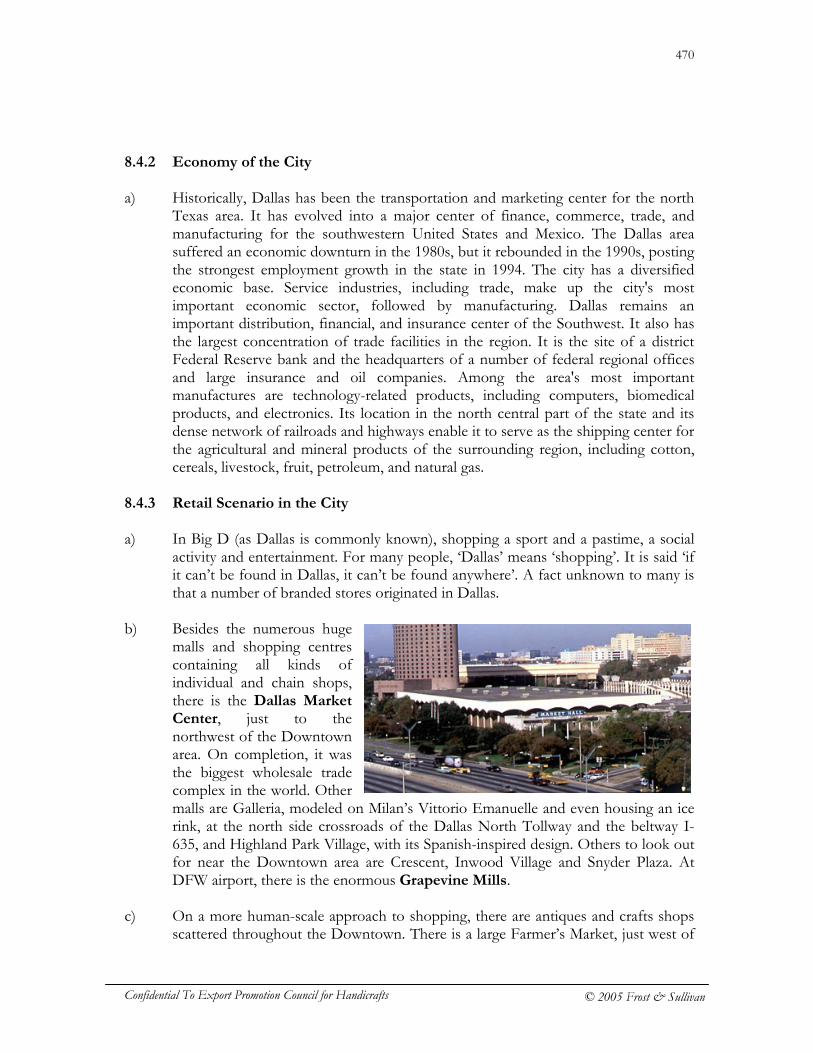
470
Confidential To Export Promotion Council for Handicrafts © 2005 Frost & Sullivan
8.4.2 Economy of the City a) Historically, Dallas has been the transportation and marketing center for the north
Texas area. It has evolved into a major center of finance, commerce, trade, and manufacturing for the southwestern United States and Mexico. The Dallas area suffered an economic downturn in the 1980s, but it rebounded in the 1990s, posting the strongest employment growth in the state in 1994. The city has a diversified economic base. Service industries, including trade, make up the city's most important economic sector, followed by manufacturing. Dallas remains an important distribution, financial, and insurance center of the Southwest. It also has the largest concentration of trade facilities in the region. It is the site of a district Federal Reserve bank and the headquarters of a number of federal regional offices and large insurance and oil companies. Among the area's most important manufactures are technology-related products, including computers, biomedical products, and electronics. Its location in the north central part of the state and its dense network of railroads and highways enable it to serve as the shipping center for the agricultural and mineral products of the surrounding region, including cotton, cereals, livestock, fruit, petroleum, and natural gas.
8.4.3 Retail Scenario in the City a) In Big D (as Dallas is commonly known), shopping a sport and a pastime, a social
activity and entertainment. For many people, ‘Dallas’ means ‘shopping’. It is said ‘if it can’t be found in Dallas, it can’t be found anywhere’. A fact unknown to many is that a number of branded stores originated in Dallas.
b) Besides the numerous huge
malls and shopping centres containing all kinds of individual and chain shops, there is the Dallas Market Center, just to the northwest of the Downtown area. On completion, it was the biggest wholesale trade complex in the world. Other malls are Galleria, modeled on Milan’s Vittorio Emanuelle and even housing an ice rink, at the north side crossroads of the Dallas North Tollway and the beltway I-635, and Highland Park Village, with its Spanish-inspired design. Others to look out for near the Downtown area are Crescent, Inwood Village and Snyder Plaza. At DFW airport, there is the enormous Grapevine Mills.
c) On a more human-scale approach to shopping, there are antiques and crafts shops
scattered throughout the Downtown. There is a large Farmer’s Market, just west of
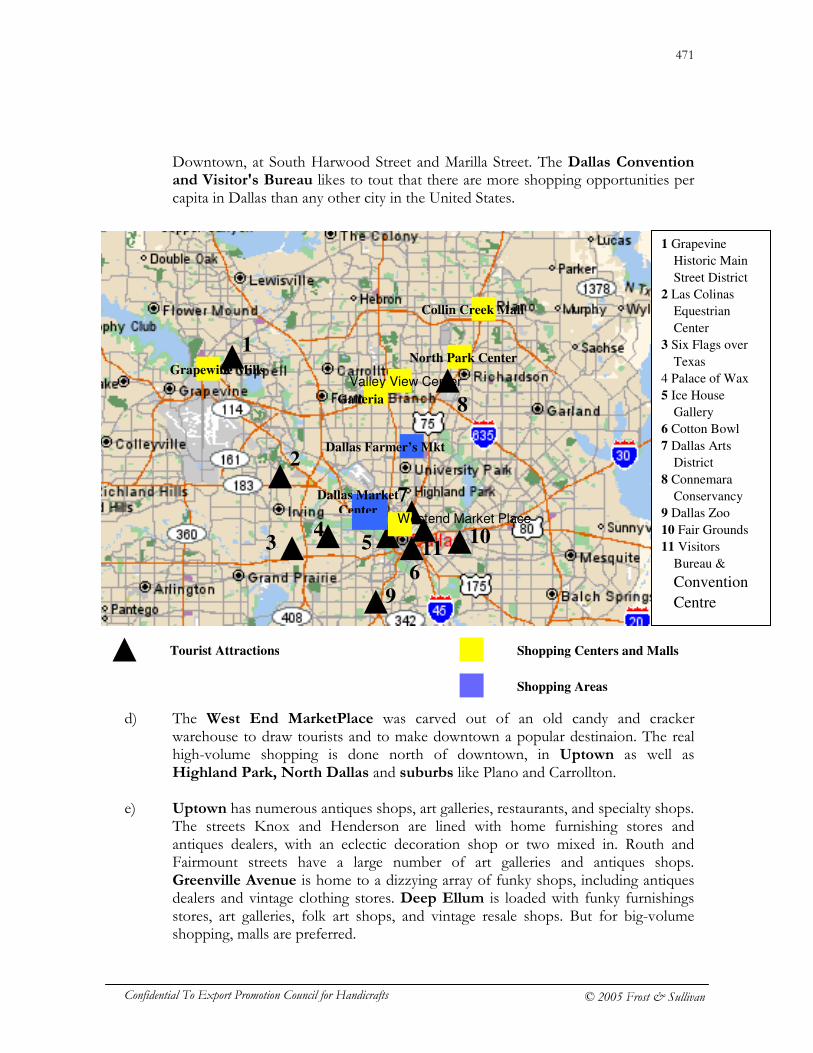
471
Confidential To Export Promotion Council for Handicrafts © 2005 Frost & Sullivan
Westend Market Place
North Park Center Grapewine Mills
Valley View Center
Collin Creek Mall
1
2
3 5
6
7
4
Galleria 8
Dallas Market Center
9
10
Dallas Farmer’s Mkt
1 Grapevine
Historic Main
Street District
2 Las Colinas
Equestrian
Center
3 Six Flags over
Texas
4 Palace of Wax
5 Ice House
Gallery
6 Cotton Bowl
7 Dallas Arts
District
8 Connemara
Conservancy
9 Dallas Zoo
10 Fair Grounds
11 Visitors
Bureau &
Convention
Centre
11
Tourist Attractions
Shopping Areas
Shopping Centers and Malls
Downtown, at South Harwood Street and Marilla Street. The Dallas Convention and Visitor's Bureau likes to tout that there are more shopping opportunities per capita in Dallas than any other city in the United States.
d) The West End MarketPlace was carved out of an old candy and cracker
warehouse to draw tourists and to make downtown a popular destinaion. The real high-volume shopping is done north of downtown, in Uptown as well as Highland Park, North Dallas and suburbs like Plano and Carrollton.
e) Uptown has numerous antiques shops, art galleries, restaurants, and specialty shops.
The streets Knox and Henderson are lined with home furnishing stores and antiques dealers, with an eclectic decoration shop or two mixed in. Routh and Fairmount streets have a large number of art galleries and antiques shops. Greenville Avenue is home to a dizzying array of funky shops, including antiques dealers and vintage clothing stores. Deep Ellum is loaded with funky furnishings stores, art galleries, folk art shops, and vintage resale shops. But for big-volume shopping, malls are preferred.
472
Confidential To Export Promotion Council for Handicrafts © 2005 Frost & Sullivan
8.4.3.1 Major Retail Destinations High Street: Dallas Market Center, Dallas Farmers’ Market. Shopping Centers and Malls: Westend Market Place, Valley View Center, Grapewine Mills, Collin Creek Mall. CBDs: Visitors Bureau & Convention Centre, the corridor from Richardson to Plano, Carrollton and Irving/Las Colinas, downtown financial center.
8.4.3.2 Handicrafts/Arts & Crafts Markets a) Although here exist no dedicated markets for handicrafts and traditional shopping, a
number of stores and retail outlets can be located at the various markets- Dallas Market Center and the shopping centers and malls- Grapewine Mills.
8.5 Tourism a) With annual visitors about 12.7 million visitors (2004), who spent 7.4billion USD
during their stay, the city has a number of must-see attractions. The peak season is December-March. Dallas has long been better known for its business and banking instincts than its cultural treasures and tourist destinations. Tourist attractions include fairgrounds and exposition halls, museums, parks, shopping centers etc.
8.5.1 Tourist Destinations a) Dallas is a ‘high-tech’ center. It offers its visitors with a wide variety of options
including. Plenty of visitors simply come to Dallas and go native: shop during the day, eat and drink and attend big-time sporting events at night and on weekends. Fair Park contains a number of museums, the city aquarium, and the Cotton Bowl stadium, as well as the fairgrounds and exposition halls that are the site of the annual State Fair of Texas. With the opening of Nasher Sculpture Center has finally put Dallas on the art map. For art lovers there is the Arts District.
b) Dallas contains more than 400 parks that cover a total of about 20,000 hectares.
Notable parks include Marsalis Park, which contains the Dallas Zoo, and the parks surrounding White Rock Lake, Bachman Lake, and Lake Cliff. City-owned greenbelts parallel White Rock Creek, Turtle Creek, and the Trinity River.
8.6 Potential Locations for EPCH Retail Formats
473
Confidential To Export Promotion Council for Handicrafts © 2005 Frost & Sullivan
a) Based on the popularity and the number of footfalls, the following locations have been short listed as the potential sites for EPCH retail formats:
Tourist Attractions: � Cotton Bowl � Dallas Arts District
Shopping Areas: � Dallas Market Center (already EPCH retail store exists here) � Grapewine Mills � Westend Market Place
Airport: � Dallas/Fort Worth (DFW) International Airport.
Business Centers: � Visitors Bureau & Convention Centre � Fair Grounds
9. LOS ANGELES, CALIFORNIA, USA
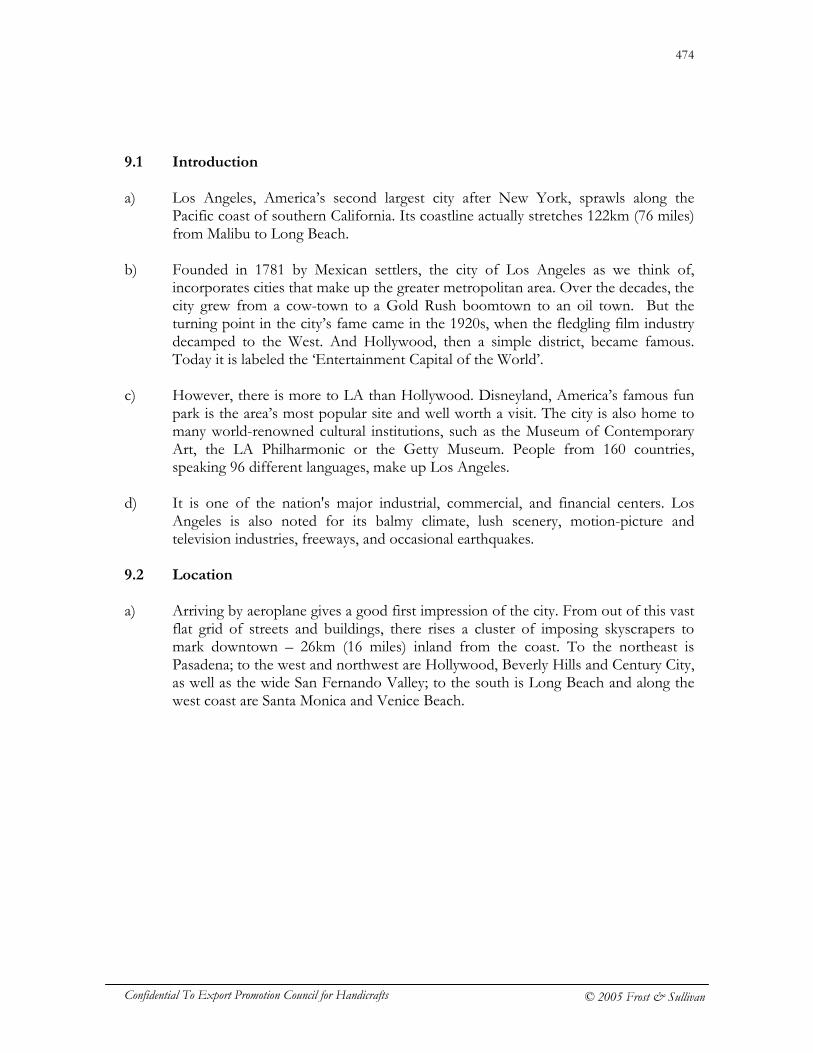
474
Confidential To Export Promotion Council for Handicrafts © 2005 Frost & Sullivan
9.1 Introduction a) Los Angeles, America’s second largest city after New York, sprawls along the
Pacific coast of southern California. Its coastline actually stretches 122km (76 miles) from Malibu to Long Beach.
b) Founded in 1781 by Mexican settlers, the city of Los Angeles as we think of,
incorporates cities that make up the greater metropolitan area. Over the decades, the city grew from a cow-town to a Gold Rush boomtown to an oil town. But the turning point in the city’s fame came in the 1920s, when the fledgling film industry decamped to the West. And Hollywood, then a simple district, became famous. Today it is labeled the ‘Entertainment Capital of the World’.
c) However, there is more to LA than Hollywood. Disneyland, America’s famous fun
park is the area’s most popular site and well worth a visit. The city is also home to many world-renowned cultural institutions, such as the Museum of Contemporary Art, the LA Philharmonic or the Getty Museum. People from 160 countries, speaking 96 different languages, make up Los Angeles.
d) It is one of the nation's major industrial, commercial, and financial centers. Los
Angeles is also noted for its balmy climate, lush scenery, motion-picture and television industries, freeways, and occasional earthquakes.
9.2 Location a) Arriving by aeroplane gives a good first impression of the city. From out of this vast
flat grid of streets and buildings, there rises a cluster of imposing skyscrapers to mark downtown – 26km (16 miles) inland from the coast. To the northeast is Pasadena; to the west and northwest are Hollywood, Beverly Hills and Century City, as well as the wide San Fernando Valley; to the south is Long Beach and along the west coast are Santa Monica and Venice Beach.
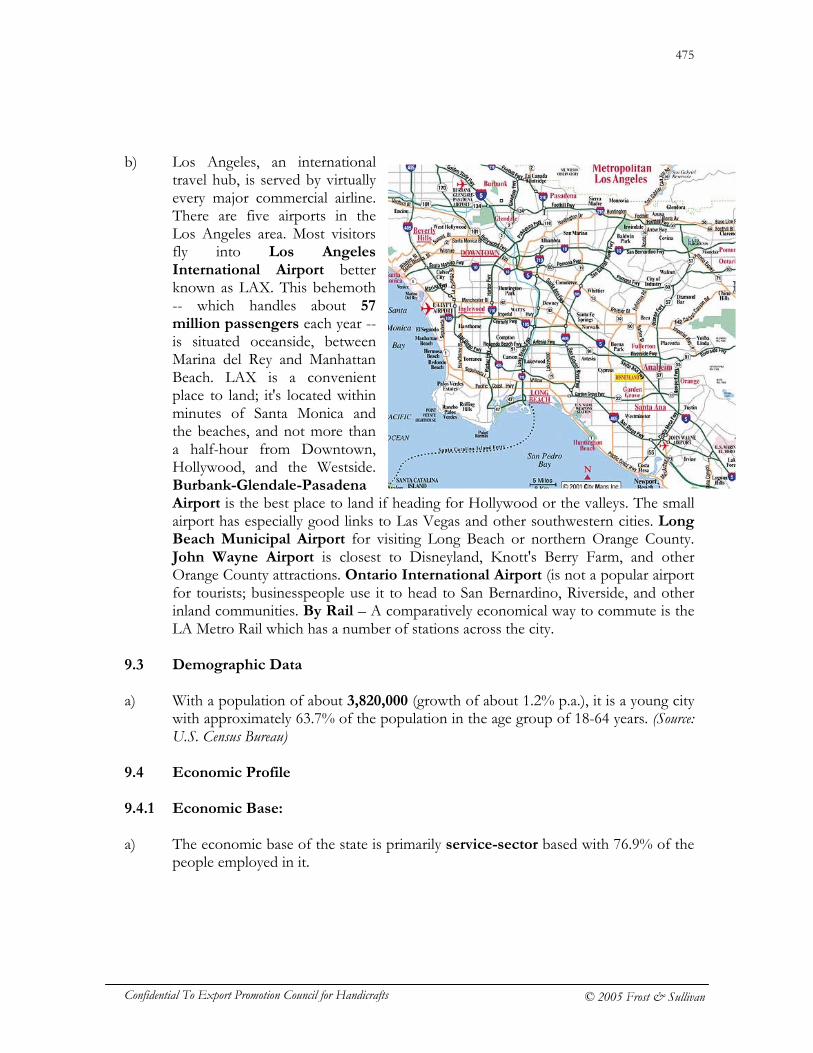
475
Confidential To Export Promotion Council for Handicrafts © 2005 Frost & Sullivan
b) Los Angeles, an international travel hub, is served by virtually every major commercial airline. There are five airports in the Los Angeles area. Most visitors fly into Los Angeles International Airport better known as LAX. This behemoth -- which handles about 57 million passengers each year -- is situated oceanside, between Marina del Rey and Manhattan Beach. LAX is a convenient place to land; it's located within minutes of Santa Monica and the beaches, and not more than a half-hour from Downtown, Hollywood, and the Westside. Burbank-Glendale-Pasadena Airport is the best place to land if heading for Hollywood or the valleys. The small airport has especially good links to Las Vegas and other southwestern cities. Long Beach Municipal Airport for visiting Long Beach or northern Orange County. John Wayne Airport is closest to Disneyland, Knott's Berry Farm, and other Orange County attractions. Ontario International Airport (is not a popular airport for tourists; businesspeople use it to head to San Bernardino, Riverside, and other inland communities. By Rail – A comparatively economical way to commute is the LA Metro Rail which has a number of stations across the city.
9.3 Demographic Data a) With a population of about 3,820,000 (growth of about 1.2% p.a.), it is a young city
with approximately 63.7% of the population in the age group of 18-64 years. (Source: U.S. Census Bureau)
9.4 Economic Profile
9.4.1 Economic Base:
a) The economic base of the state is primarily service-sector based with 76.9% of the
people employed in it.
476
Confidential To Export Promotion Council for Handicrafts © 2005 Frost & Sullivan
9.4.2 Economy of the City a) Long established as the financial, commercial, and industrial capital of southern
California, the sprawling Los Angeles metropolitan area is among the nations leading urban-industrial complexes. The size of its population alone makes the Los Angeles metropolitan area California's biggest economic center, employing 30 percent of the state's workforce. It generates nearly one-third of the value of goods manufactured in the state and accounts for more than one-quarter of all retail and wholesale sales. The city also is a financial center for the western United States and a principal importer and exporter of international trade goods. A number of Fortune 500 companies have their headquarters and offices here.
b) Although it directly employs only a small portion of the labor force, the motion-
picture, television, and musical entertainment industry is one of Los Angeles's most famous activities. The region is also home to many of the country's recorded-music businesses.
c) Surprisingly, however, although the industry is the leading supplier of entertainment
to the world and generates 31 billion US Dollars annually, entertainment ranks seventh among the city’s major enterprises. In terms of number employed, the leading business sector in the five-county Los Angeles area is actually business services (a category that includes management services, advertising, computer programming, legal services and engineering). It is followed by tourism with over 500,000 employed in the sector, then health services (including medical manufacturing), direct international trade and then wholesale trade. Finally, just above the entertainment industry is technology/aerospace.
d) The Los Angeles metropolitan area is often called the ‘Digital Coast’ and multimedia
jobs are included in the 277,000 technology jobs that also include bio-med, digital information technology and advanced transportation technology. The region is also the country’s second largest manufacturing centre.
e) LA is the leading import/export port in the United States- includes the Port of Los
Angeles, Port of Long Beach, LAX and smaller ports. LA’s main port is located at San Pedro and is the largest man-made port in the world. Major exports include integrated circuits, aircraft, spacecraft, computers, aircraft parts and parts for office machines. Imports include computers, passenger vehicles, integrated circuits, office machine parts and reception apparatus.
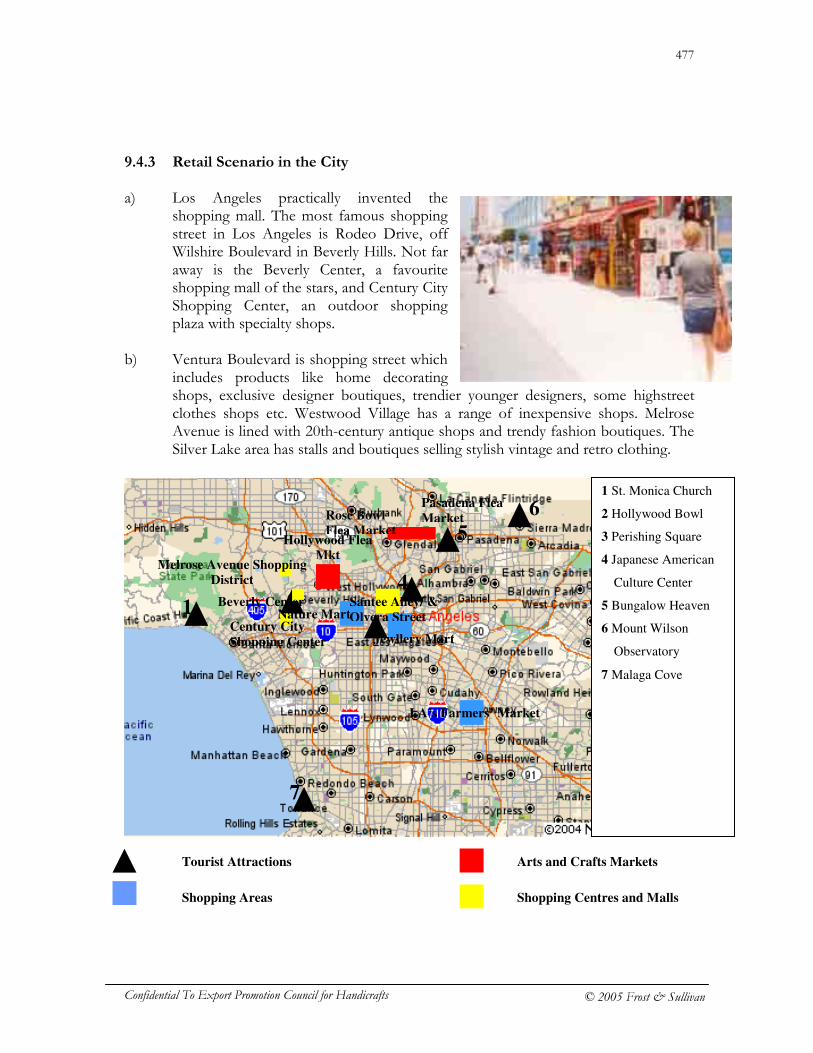
477
Confidential To Export Promotion Council for Handicrafts © 2005 Frost & Sullivan
9.4.3 Retail Scenario in the City a) Los Angeles practically invented the
shopping mall. The most famous shopping street in Los Angeles is Rodeo Drive, off Wilshire Boulevard in Beverly Hills. Not far away is the Beverly Center, a favourite shopping mall of the stars, and Century City Shopping Center, an outdoor shopping plaza with specialty shops.
b) Ventura Boulevard is shopping street which
includes products like home decorating shops, exclusive designer boutiques, trendier younger designers, some highstreet clothes shops etc. Westwood Village has a range of inexpensive shops. Melrose Avenue is lined with 20th-century antique shops and trendy fashion boutiques. The Silver Lake area has stalls and boutiques selling stylish vintage and retro clothing.
Santee Alley/ &
Olvera Street
Melrose Avenue Shopping District
Century City
Shopping Center
LA’s Farmers’ Market
Jewllery Mart
Nature Mart 1
7
4
5
6
Beverly Center
Pasadena Flea
Market
Hollywood Flea Mkt
Rose Bowl Flea Market
1 St. Monica Church
2 Hollywood Bowl
3 Perishing Square
4 Japanese American
Culture Center
5 Bungalow Heaven
6 Mount Wilson
Observatory
7 Malaga Cove
Tourist Attractions
Shopping Areas
Arts and Crafts Markets
Shopping Centres and Malls
478
Confidential To Export Promotion Council for Handicrafts © 2005 Frost & Sullivan
c) Santa Monica’s Third Street Promenade is a pedestrianized mall that runs for several blocks and is lined with shops and outdoor cafés. At one end is Santa Monica Place, an indoor mall with department stores and boutiques. Chic shopping can be found nearby on Montana Avenue. Downtown has various shopping complexes and gallerias. In the Jewelry District visitors can find good bargains, while the Fashion District is a real shopping experience-a 56-block mix of wholesalers, manufacturers and retailers selling merchandise at discounts. The kitsch shops along Hollywood Boulevard are best for the
9.4.3.1 Major Retail Destinations
High Street: Ventura Boulevard, LA’s Farmers’ Market, Rose Bowl Flea Market, Pasadena Flea Market, Hollywood Farmer’s Flea Market. Shopping Centers and Malls: Santee Alley & Olvera Street, Melrose Avenue Shopping District, Beverly Center, Century City Shopping Center, Jewllery Mart. CBDs: Los Angeles metropolitan area (the Digital Coast).
9.4.3.2 Handicrafts/Arts & Crafts Markets a) Primarily in the city are three handicrafts/arts and crafts markets. These are Rose
Bowl Flea Market- arts & crafts, Pasadena City College Flea Market and Hollywood Farmer's Flea Market- handmade items & goods. Of these the Rose Bowl Flea Market and the Pasadena Flea Market are closely located within quick reach of each other.
b) Some of the handicrafts/arts and crafts stores currently operational in Los Angeles
are:
S.No. NAME LOCATION PRODUCTS
1 Arte de Mexico
The San Fernando Valley
Seven warehouses full of carved furniture and wrought iron
2 Bergamot Station
Santa Monica
Santa Monica Museum of Art, plus two dozen art galleries- whimsical furniture constructed entirely of corrugated cardboard, furniture, lighting, bathroom fixtures, and other functional art pieces, jewelry, flatware, ceramics, and glass
3 Del Mano Brentwood crafts gallery- glass, wood, ceramics, or jewelry.
4 Memory Lane Orlando collectibles features suchas Formica dinette sets, Bakelite radios, cocktail shakers and sets, unusual lamps, and a few well-chosen coats, dresses, and accessories
479
Confidential To Export Promotion Council for Handicrafts © 2005 Frost & Sullivan
S.No. NAME LOCATION PRODUCTS
5 Off The Wall Melrose Ave kitschy statues, Art Deco furnishings, carved wall reliefs, Wurlitzer jukeboxes, giant restaurant and gas-station signs, pinball machines, and lots and lots of neon.
6 Indian Arts Center
Ventura Boulevard Native American arts and crafts
9.5 Tourism a) Nearly 48 million people visited Los Angeles in 2004, mostly during April through
June and September-October. With the total expenditure by them amounted to approximately USD 15.13 billion, a third was spent exclusively on shopping. Tourist attractions in and around Los Angeles include Hollywood, the beaches, the Walt Disney besides shopping interests.
9.5.1 Tourist Destinations a) There's plenty for the visitor to see and do in L.A. -- traditional tourist draws such
as Hollywood Boulevard, Venice Beach, and the Santa Monica Pier are being spruced up at considerable expense, and newer ones such as the Walt Disney Concert Hall are continually being added to the city's repertoire.
b) Other tourist attractions include St. Monica Church, Hollywood Bowl, Perishing
Square, Japanese American Culture Center, Bungalow Heaven, Mount Wilson Observatory and Malaga Cove besides a number of beaches.
9.6 Potential Locations for EPCH Retail Formats a) Based on the number of footfalls of tourists the following locations have been short
listed as potential sites for EPCH retail outlets:
Tourist Attractions: � St. Monica Church � Hollywood Bowl
Shopping Areas:
� Beverly Center. � Pasadena Flea Market. � Hollywood Farmer’s Flea Market. � Century City Shopping Center.
Airport:
� Los Angeles International Airport
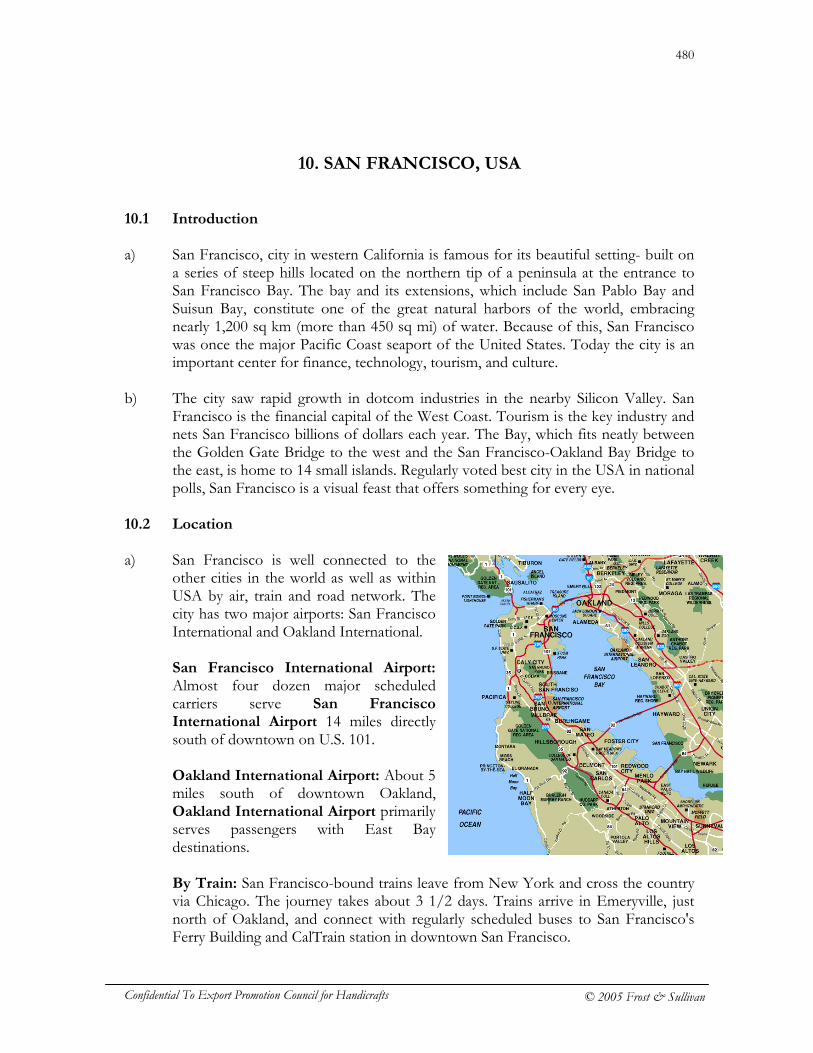
480
Confidential To Export Promotion Council for Handicrafts © 2005 Frost & Sullivan
10. SAN FRANCISCO, USA 10.1 Introduction a) San Francisco, city in western California is famous for its beautiful setting- built on
a series of steep hills located on the northern tip of a peninsula at the entrance to San Francisco Bay. The bay and its extensions, which include San Pablo Bay and Suisun Bay, constitute one of the great natural harbors of the world, embracing nearly 1,200 sq km (more than 450 sq mi) of water. Because of this, San Francisco was once the major Pacific Coast seaport of the United States. Today the city is an important center for finance, technology, tourism, and culture.
b) The city saw rapid growth in dotcom industries in the nearby Silicon Valley. San
Francisco is the financial capital of the West Coast. Tourism is the key industry and nets San Francisco billions of dollars each year. The Bay, which fits neatly between the Golden Gate Bridge to the west and the San Francisco-Oakland Bay Bridge to the east, is home to 14 small islands. Regularly voted best city in the USA in national polls, San Francisco is a visual feast that offers something for every eye.
10.2 Location a) San Francisco is well connected to the
other cities in the world as well as within USA by air, train and road network. The city has two major airports: San Francisco International and Oakland International.
San Francisco International Airport: Almost four dozen major scheduled carriers serve San Francisco International Airport 14 miles directly south of downtown on U.S. 101.
Oakland International Airport: About 5 miles south of downtown Oakland, Oakland International Airport primarily serves passengers with East Bay destinations.
By Train: San Francisco-bound trains leave from New York and cross the country via Chicago. The journey takes about 3 1/2 days. Trains arrive in Emeryville, just north of Oakland, and connect with regularly scheduled buses to San Francisco's Ferry Building and CalTrain station in downtown San Francisco.
481
Confidential To Export Promotion Council for Handicrafts © 2005 Frost & Sullivan
By Car: San Francisco is easily accessible by major highways: Interstate 5, from the north, and U.S. 101, which cuts south-north through the peninsula from San Jose and across the Golden Gate Bridge to points north.
10.3 Demographic Data a) With a population of about 751,700 (growth of about 1.13% p.a.), it is a young city
with approximately 71.8% of the population in the age group of 18-64 years. (Source: U.S. Census Bureau)
10.4 Economic Profile
10.4.1 Economic Base:
a) The economic base of the state is primarily service-sector based with 82.1% of the
people employed in it. 10.4.2 Economy of the City
a) San Francisco emerged as important shipping and manufacturing center during the
mid-19th century. For more than 100 years, the city's economy was centered on its waterfront. The city became an important center of manufacturing, producing sugar, canned fruits and vegetables, flour, beer, printed goods, clothing, and furniture. San Francisco's foundries and machine shops made a variety of metal products, including locomotives, large-scale farm equipment, ships, and some of the world's most advanced mining equipment. The importance of the port in San Francisco's economy has declined. A similar transformation occurred in San Francisco's manufacturing sector, as many companies moved their operations to less expensive locations. As a result, manufacturing is of limited importance in the city today. The remaining major industries include food processing, clothing manufacturing, and printing and publishing.
10.4.3 Tourism a) With annual tourists about 20,700,000 spending USD 6.12 billion, approximately
USD 2 billion on shopping, tourism industry in San Francisco is at its peak during April and October. Attractions include bay vistas, Victorian architecture, boutiques, restaurants, beaches, cable cars etc. In particular, Museum of Modern Art, Yerba Buena Gardens and, most influential, dot.com companies besides the tourist and shopping mecca Union Square.
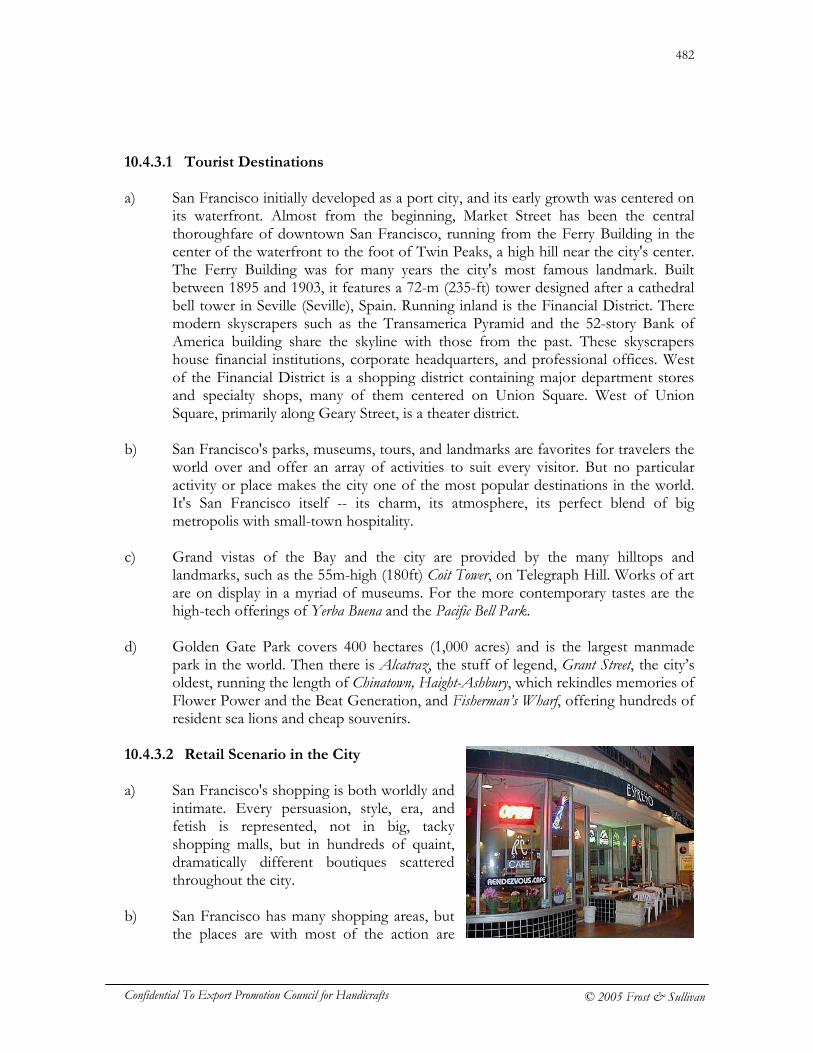
482
Confidential To Export Promotion Council for Handicrafts © 2005 Frost & Sullivan
10.4.3.1 Tourist Destinations a) San Francisco initially developed as a port city, and its early growth was centered on
its waterfront. Almost from the beginning, Market Street has been the central thoroughfare of downtown San Francisco, running from the Ferry Building in the center of the waterfront to the foot of Twin Peaks, a high hill near the city's center. The Ferry Building was for many years the city's most famous landmark. Built between 1895 and 1903, it features a 72-m (235-ft) tower designed after a cathedral bell tower in Seville (Seville), Spain. Running inland is the Financial District. There modern skyscrapers such as the Transamerica Pyramid and the 52-story Bank of America building share the skyline with those from the past. These skyscrapers house financial institutions, corporate headquarters, and professional offices. West of the Financial District is a shopping district containing major department stores and specialty shops, many of them centered on Union Square. West of Union Square, primarily along Geary Street, is a theater district.
b) San Francisco's parks, museums, tours, and landmarks are favorites for travelers the
world over and offer an array of activities to suit every visitor. But no particular activity or place makes the city one of the most popular destinations in the world. It's San Francisco itself -- its charm, its atmosphere, its perfect blend of big metropolis with small-town hospitality.
c) Grand vistas of the Bay and the city are provided by the many hilltops and
landmarks, such as the 55m-high (180ft) Coit Tower, on Telegraph Hill. Works of art are on display in a myriad of museums. For the more contemporary tastes are the high-tech offerings of Yerba Buena and the Pacific Bell Park.
d) Golden Gate Park covers 400 hectares (1,000 acres) and is the largest manmade
park in the world. Then there is Alcatraz, the stuff of legend, Grant Street, the city’s oldest, running the length of Chinatown, Haight-Ashbury, which rekindles memories of Flower Power and the Beat Generation, and Fisherman’s Wharf, offering hundreds of resident sea lions and cheap souvenirs.
10.4.3.2 Retail Scenario in the City a) San Francisco's shopping is both worldly and
intimate. Every persuasion, style, era, and fetish is represented, not in big, tacky shopping malls, but in hundreds of quaint, dramatically different boutiques scattered throughout the city.
b) San Francisco has many shopping areas, but
the places are with most of the action are
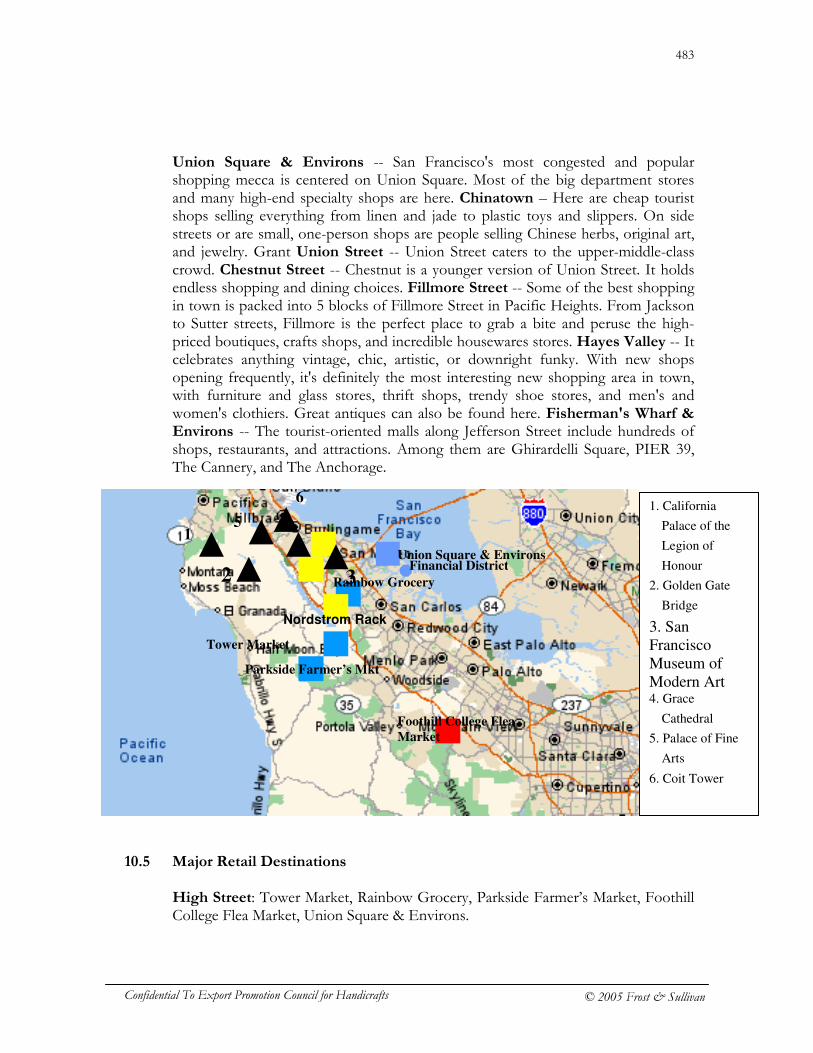
483
Confidential To Export Promotion Council for Handicrafts © 2005 Frost & Sullivan
Union Square & Environs -- San Francisco's most congested and popular shopping mecca is centered on Union Square. Most of the big department stores and many high-end specialty shops are here. Chinatown – Here are cheap tourist shops selling everything from linen and jade to plastic toys and slippers. On side streets or are small, one-person shops are people selling Chinese herbs, original art, and jewelry. Grant Union Street -- Union Street caters to the upper-middle-class crowd. Chestnut Street -- Chestnut is a younger version of Union Street. It holds endless shopping and dining choices. Fillmore Street -- Some of the best shopping in town is packed into 5 blocks of Fillmore Street in Pacific Heights. From Jackson to Sutter streets, Fillmore is the perfect place to grab a bite and peruse the high-priced boutiques, crafts shops, and incredible housewares stores. Hayes Valley -- It celebrates anything vintage, chic, artistic, or downright funky. With new shops opening frequently, it's definitely the most interesting new shopping area in town, with furniture and glass stores, thrift shops, trendy shoe stores, and men's and women's clothiers. Great antiques can also be found here. Fisherman's Wharf & Environs -- The tourist-oriented malls along Jefferson Street include hundreds of shops, restaurants, and attractions. Among them are Ghirardelli Square, PIER 39, The Cannery, and The Anchorage.
10.5 Major Retail Destinations High Street: Tower Market, Rainbow Grocery, Parkside Farmer’s Market, Foothill College Flea Market, Union Square & Environs.
Nordstrom Rack
Rainbow Grocery
Parkside Farmer’s Mkt
1
2
6
5
Tower Market
3
1. California
Palace of the
Legion of
Honour
2. Golden Gate
Bridge
3. San
Francisco
Museum of
Modern Art 4. Grace
Cathedral
5. Palace of Fine
Arts
6. Coit Tower
Foothill College Flea
Market
Financial District Union Square & Environs
484
Confidential To Export Promotion Council for Handicrafts © 2005 Frost & Sullivan
Shopping Centers and Malls: Nordstrom Rack, Stonestown Galleria, San Francisco Shopping Center and Metreon. CBDs: The Financial District.
10.5.1 Handicrafts/Arts & Crafts Markets a) Analyzing the shopping streets and hubs in San Francisco, the existing
handicrafts/arts and crafts market is the Foothill College Flea Market. Stores and retail outlets specializing in the same are as mentioned below:
S.No. NAME LOCATION PRODUCTS
1 Alabaster 597 Hayes St Local home accessories trends
2 Art of China 839-843 Grant Ave Exquisite, hand-carved Chinese figurines, Pink-quartz dogs, jade figurines, porcelain vases, cache pots, and blue-and-white barrels etc
3 Cost Plus Imports
2552 Taylor St A vast warehouse crammed to the rafters with Chinese baskets, Indian camel bells, Malaysian batik scarves, and innumerable other items
4 Dandelion 55 Potrero Ave Indian, Japanese, and Western styles-gifts, collectibles, and furnishings
5 Flax 1699 Market St Art and design supplies, an amazing collection of local arts and crafts, blank bound books, children's art supplies, frames, calendars etc
6 Images of the North
2036 Union St Native American masks and jewellery.
7 Silk route International
3119 Fillmore St Afghanistan's fascinating wares (old and new)- Oriental and tribal rugs, kilims, dhurries, textiles, jewellery, clothing, pillows, art, and antiques.
10.6 Potential Locations for EPCH Retail Formats a) The prospective locations for EPCH stores, based on the analysis of the city are:
Tourist Attractions: � Golden Gate Bridge. � Coit Tower. � San Francisco Museum of Modern Art.
Shopping Areas: � Union Square & Environs.
Business Centers: � Financial District.