Embed Size (px)
Citation preview
E-BOOK
In this E-BOOK you will find information about BI4Dynamics standard application areas: Sales, Finance, Receivables, Inventory, Purchase, Payables, Manufacturing and Jobs.
EXCEL
All tables and charts have been created in Excel 2010. Using slicers and many formatting features greatly improves productivity. All predefined Excel sheets are structured by business areas and are explain the concept of how to analyze data: starting with an overview (few sheets only) and then moving to operational (many sheets) ad-hoc analysis.

RECEIVABLES
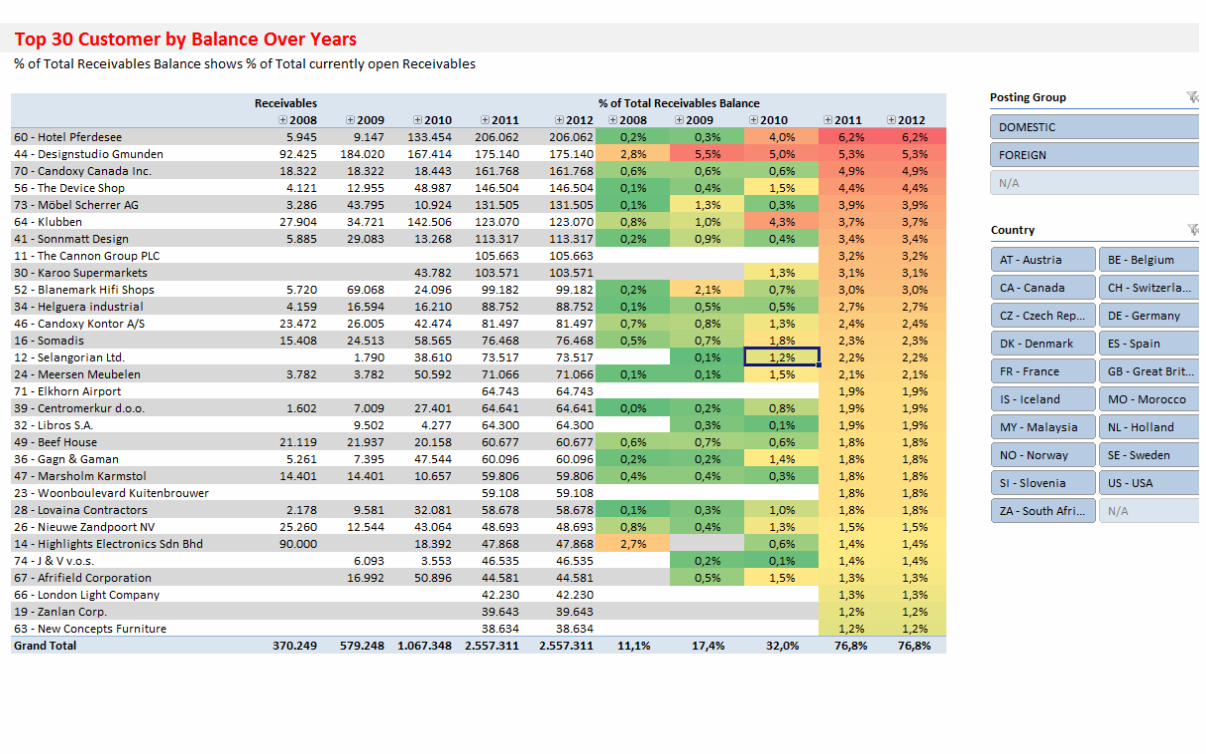
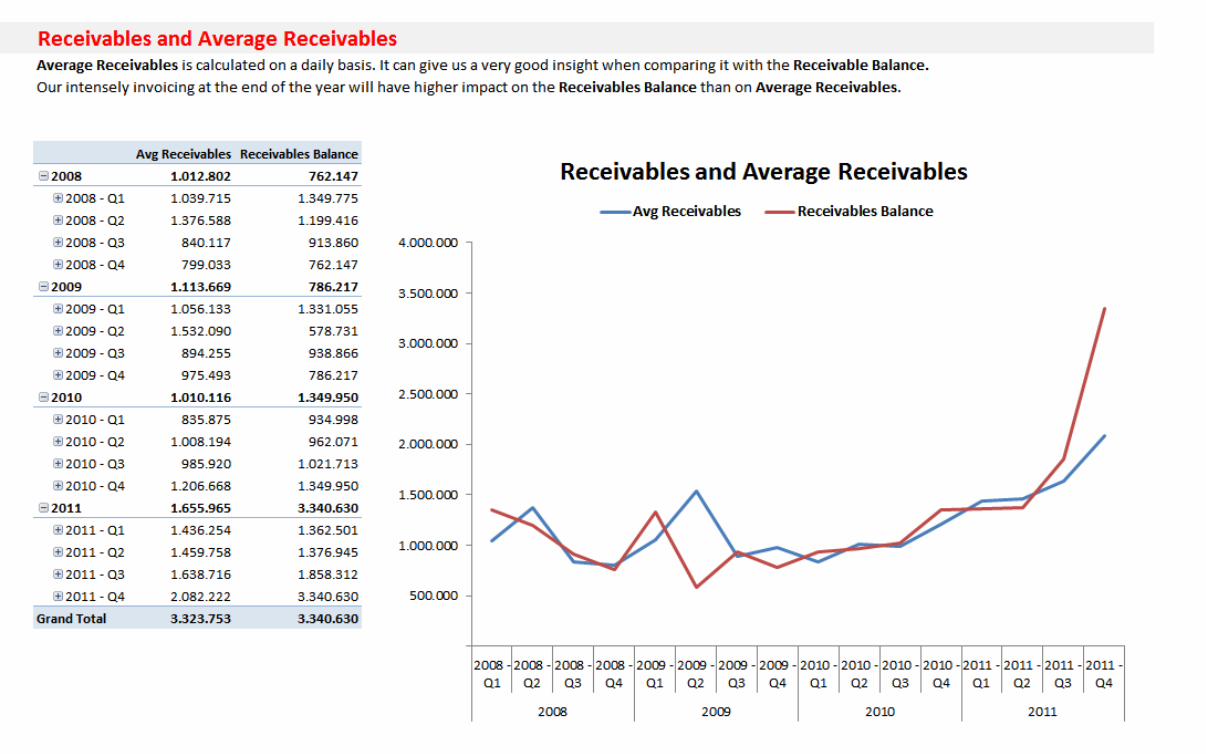
This is one of the simplest business areas that most organizations use. It comes with standard measures like Balance, Payment terms, Overdue and more specific area like Average Balance, Sales on Credit and Balance % of Total.


¸¸


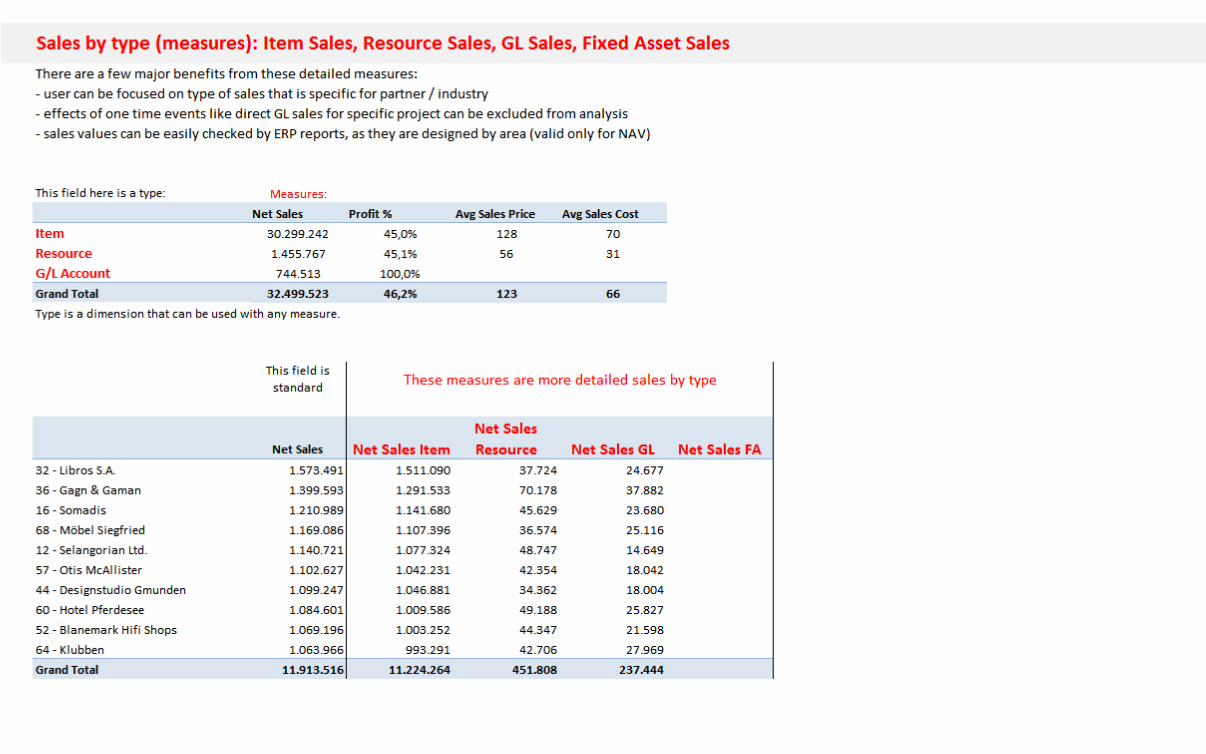
SALES
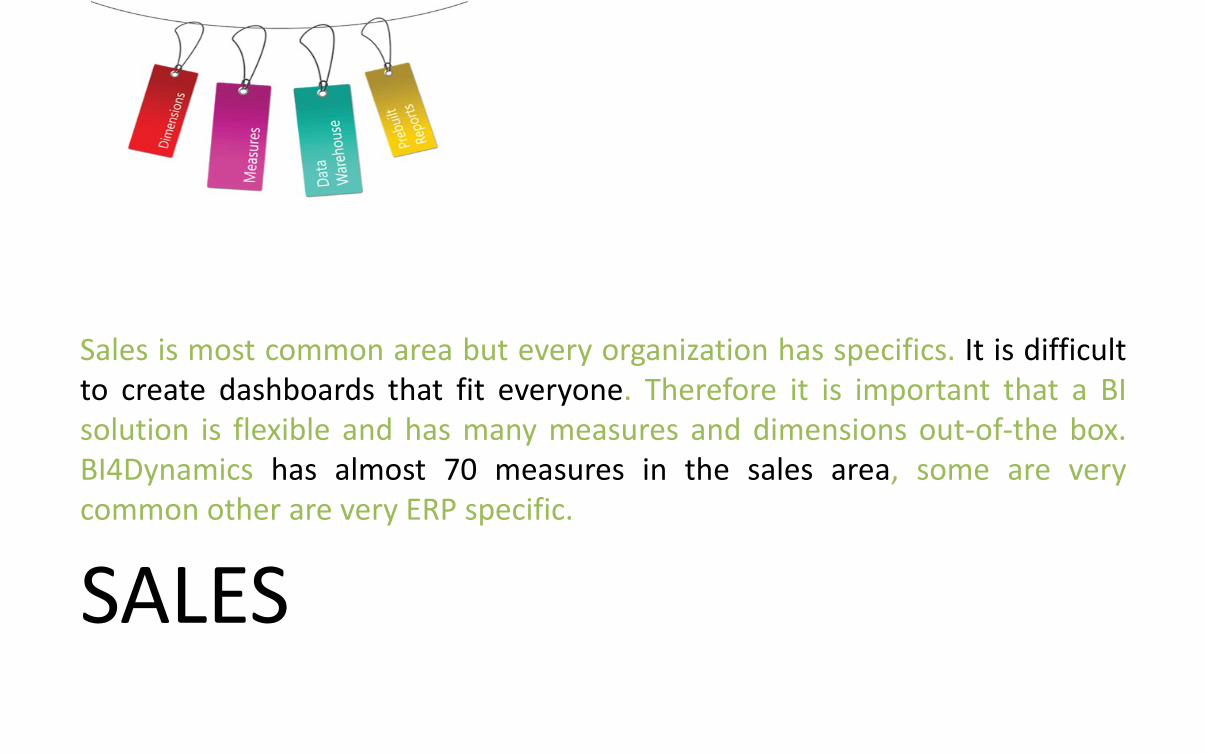
Sales is most common area but every organization has specifics. It is difficult to create dashboards that fit everyone. Therefore it is important that a BI solution is flexible and has many measures and dimensions out-of-the box. BI4Dynamics has almost 70 measures in the sales area, some are very common other are very ERP specific.

Nice and clean dashboard is very informative. Any redesign to this dashboard can be done in few minutes.


We can analyze all the possible combinations: Customers by item, Item by Customer, Salesperson by Customer etc.
There are almost limitless possibilities to create specific report or dashboard.


SALES ORDERS
Daily snapshot of sales (or purchase) documents are taken into specially designed data warehouse where all information are kept even after quotes and orders are changed, processed or deleted. These data are a part of sales cube.


SALES + RECEIVABLES
Connecting cubes takes a few minutes. Basic need for joining cubes is to view data across business areas. When connecting cube into one virtual cube no additional disk space or processing time is required.

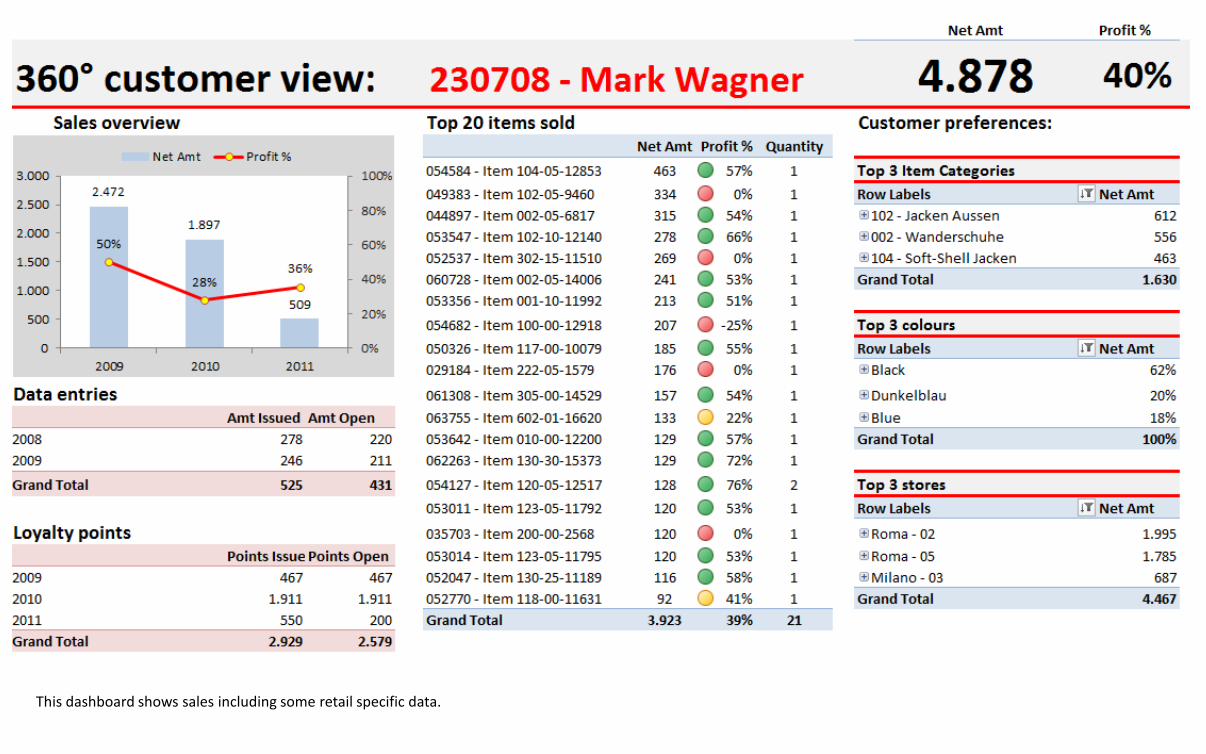
This dashboard shows sales including some retail specific data.

LOGISTICS
The architecture of data warehouse and cubes enables or disables creation of virtual cubes. With BI4Dynamisc design it is possible.
(SALES + PURCHASE + INVENTORY)
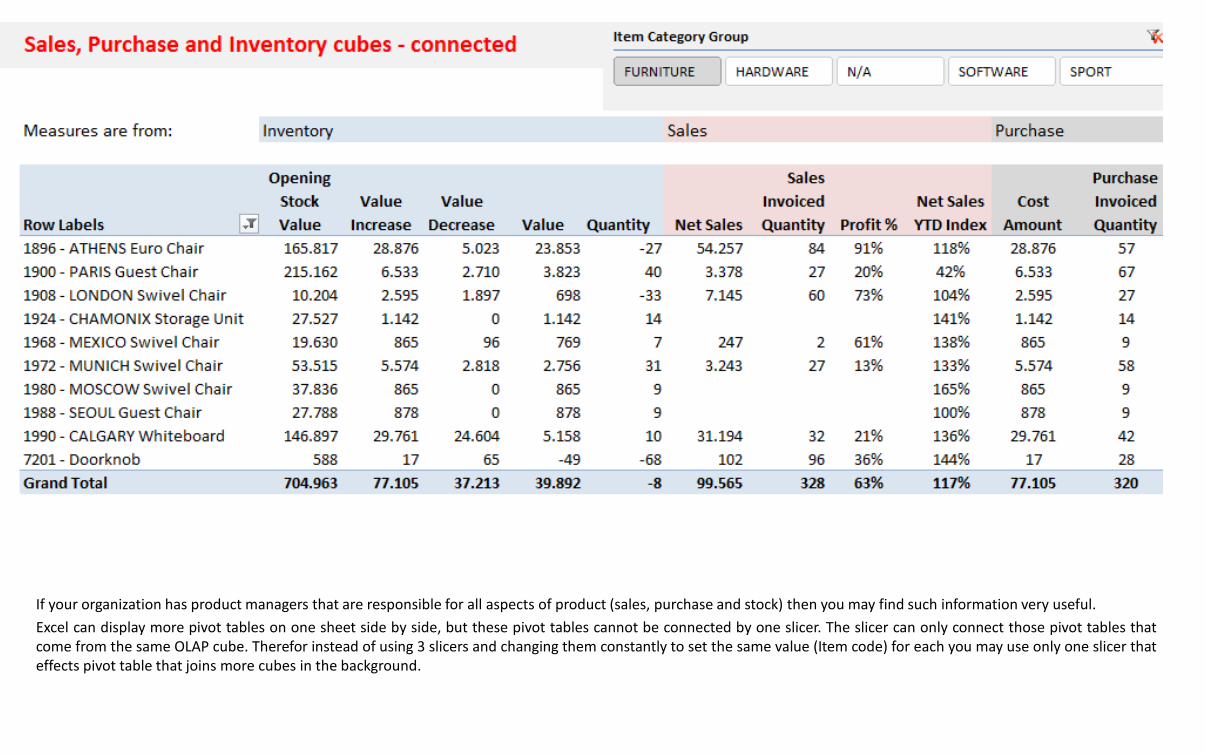
If your organization has product managers that are responsible for all aspects of product (sales, purchase and stock) then you may find such information very useful.
Excel can display more pivot tables on one sheet side by side, but these pivot tables cannot be connected by one slicer. The slicer can only connect those pivot tables that come from the same OLAP cube. Therefor instead of using 3 slicers and changing them constantly to set the same value (Item code) for each you may use only one slicer that effects pivot table that joins more cubes in the background.

Are you selling old or new items from the inventory? When you decide to transfer the purchase cost may affect your average inventory or how this may affect your average inventory value?

FINANCE
Reports based on Chart of Accounts are mostly used in accounting. Real powerful business reports can be created by Account Schedules (NAV) or Financial Statements (AX).


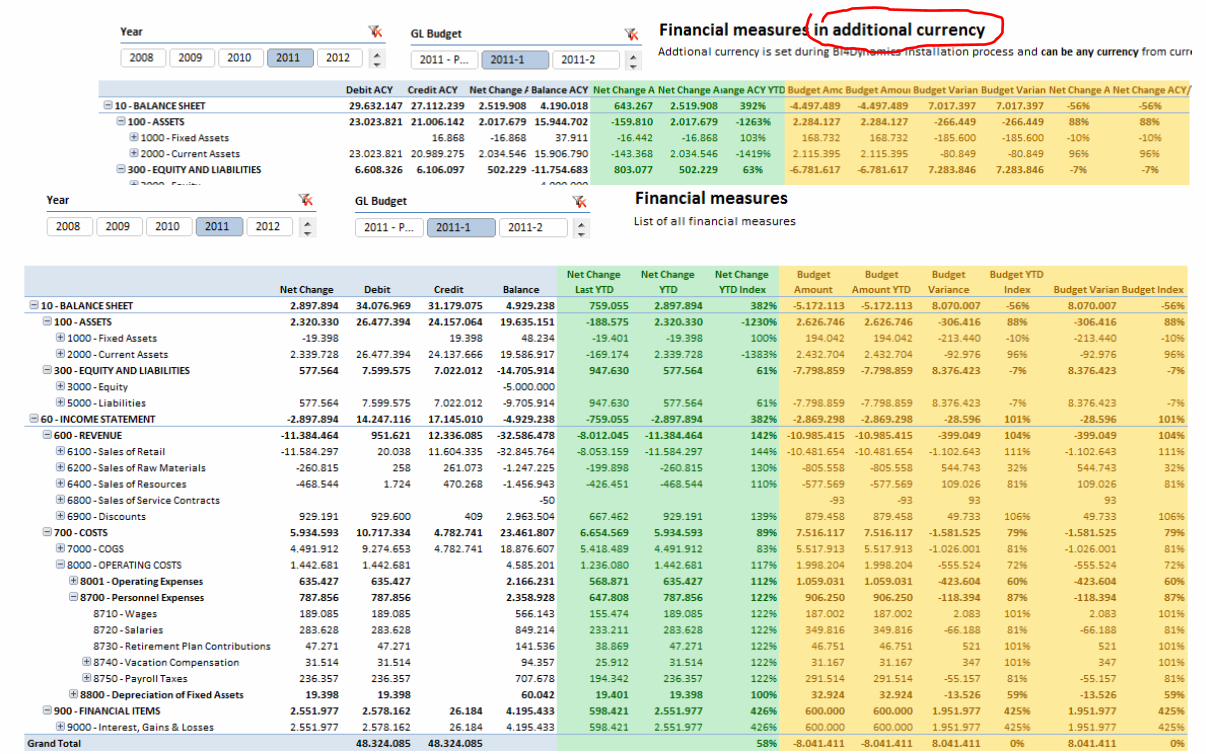
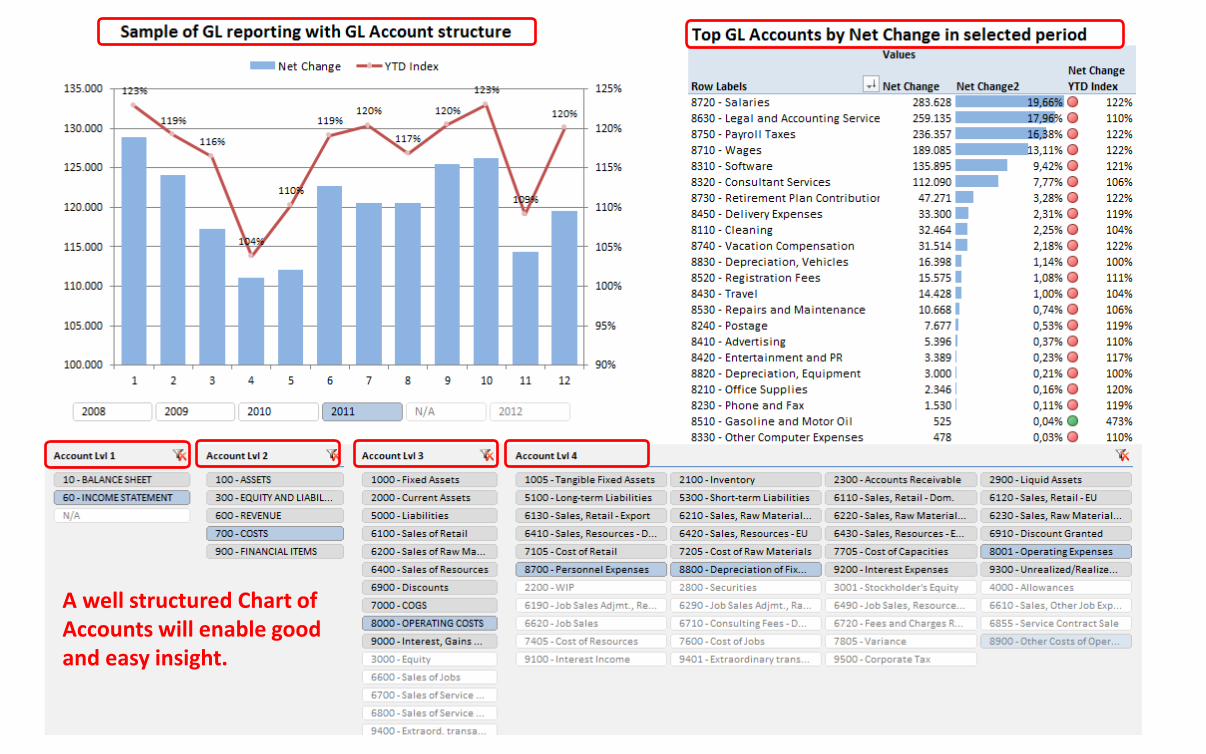
A well structured Chart of Accounts will enable good and easy insight.

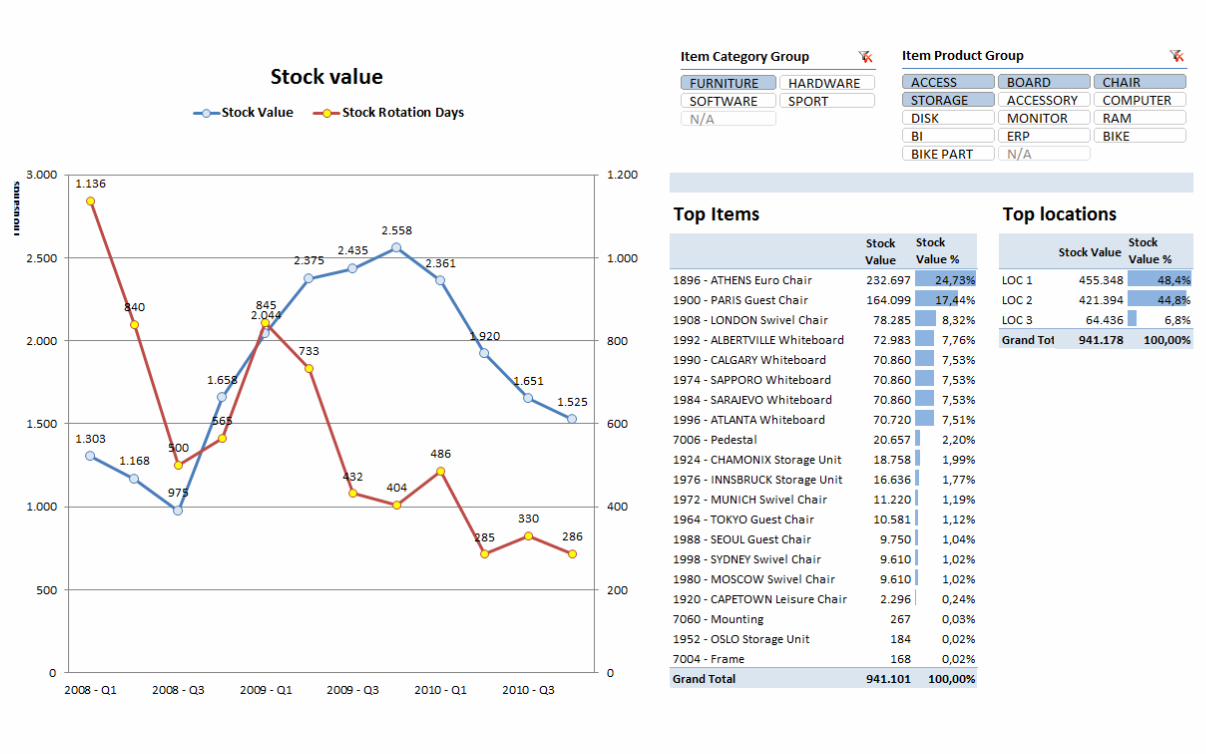
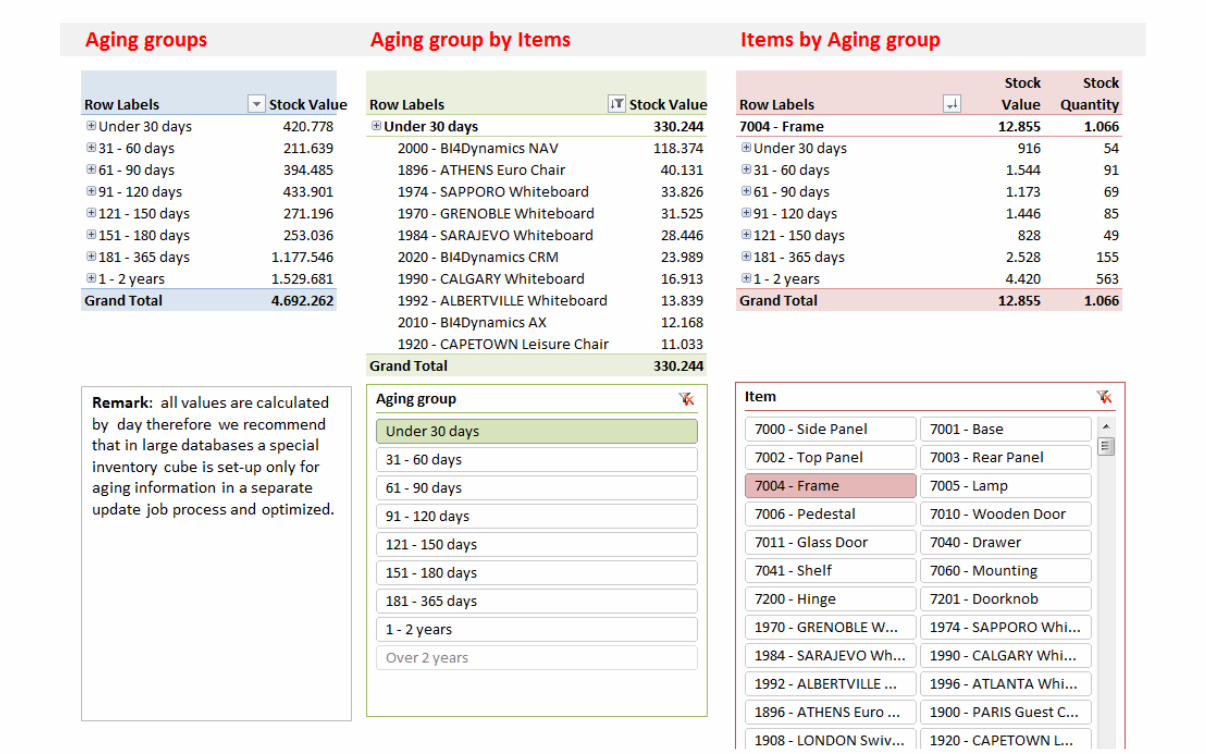
INVENTORY Many measures and KPIs enable powerful and easy analysis.

PURCHASE
Purchase area contains the same functionality as sales area: standard measures that everyone would expect, YTD, budgets, purchase orders and much more.


PAYABLES
This area is very similar to Receivables, which has been shown with more details in the beginning of this e-book.


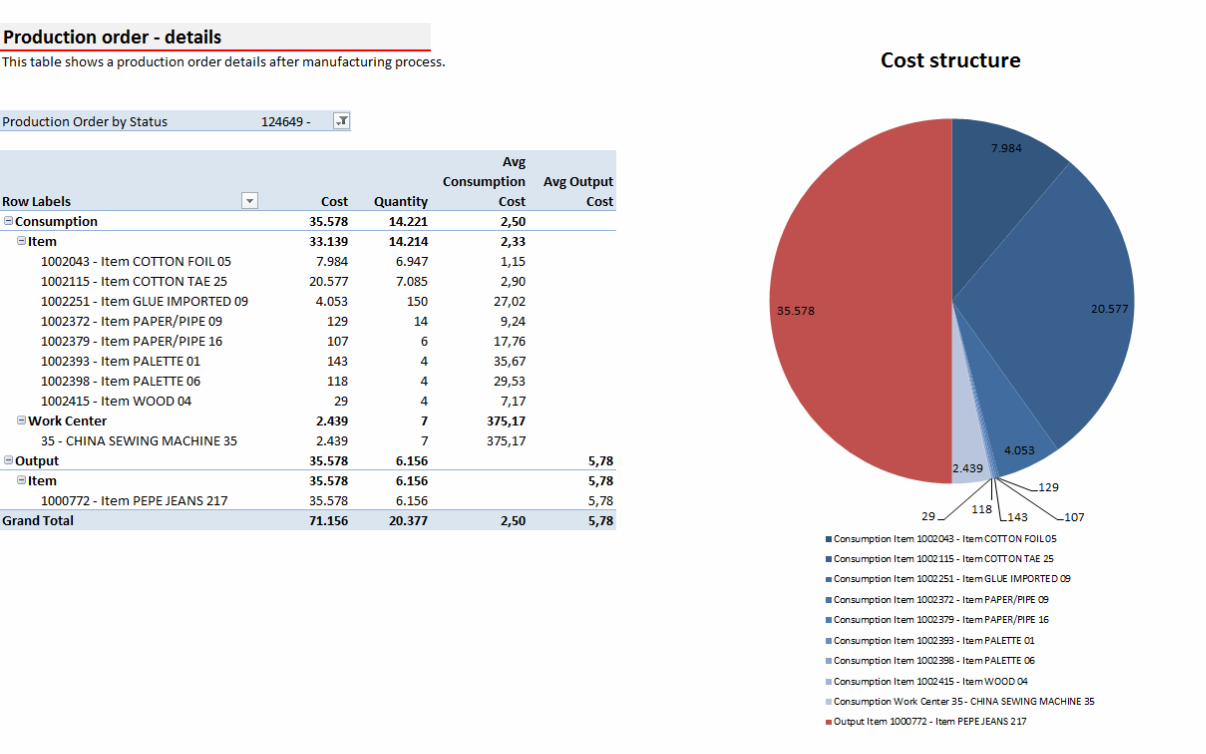
MANUFACTURING
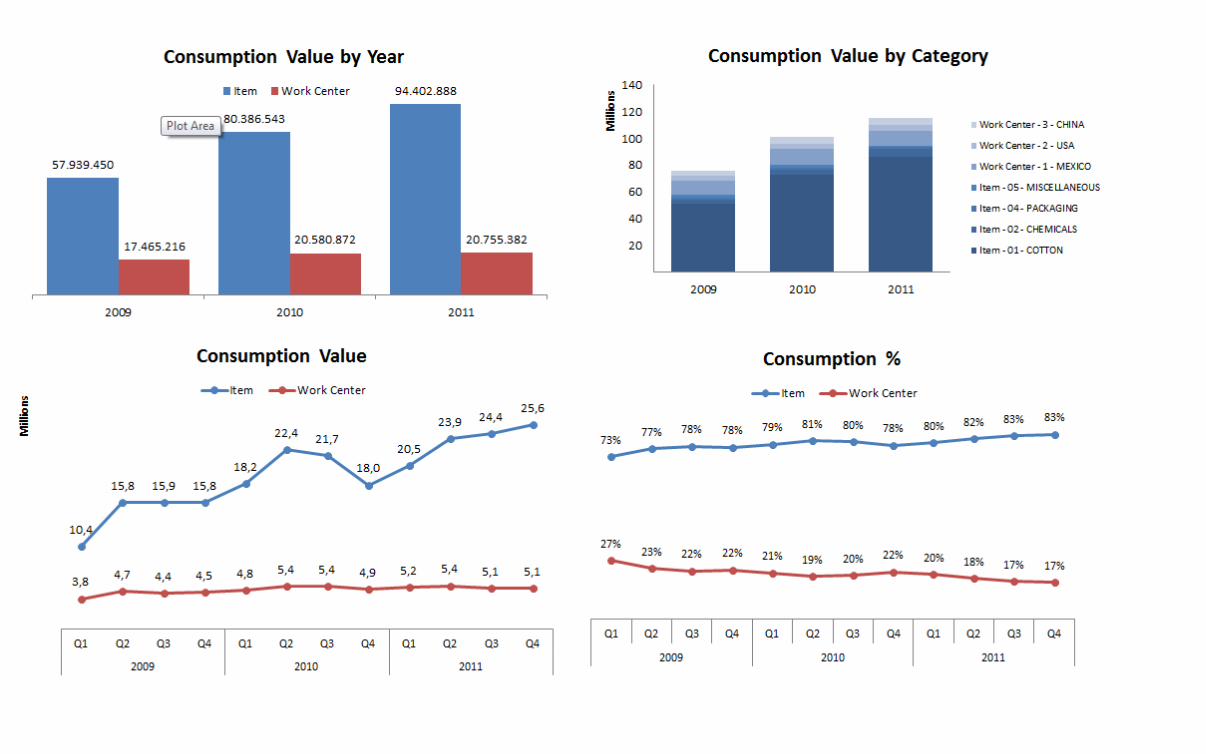
Monitor production orders, Item composition and consumption, Actual and expected quantities with variance. Analyse Average costs and work in progress over many dimensions and hierarchies.
Powerful, agile, simple analyzing across multiple sites and geographies!


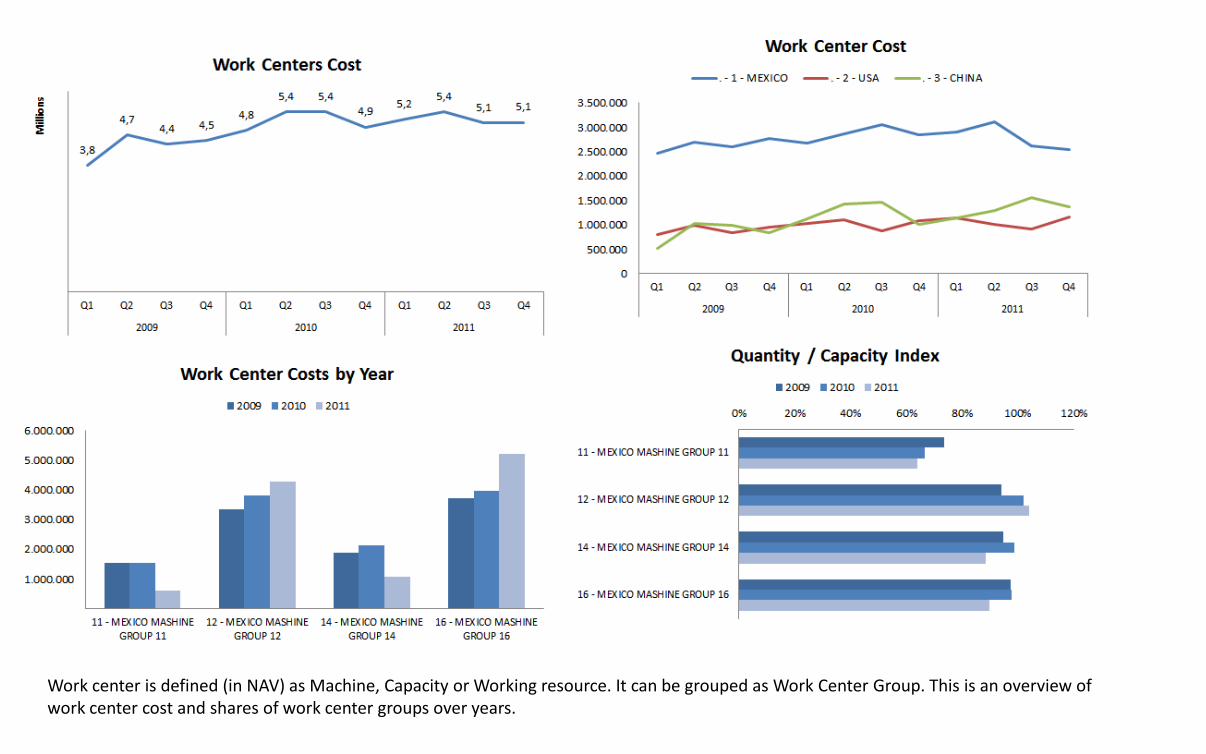
Work center is defined (in NAV) as Machine, Capacity or Working resource. It can be grouped as Work Center Group. This is an overview of work center cost and shares of work center groups over years.

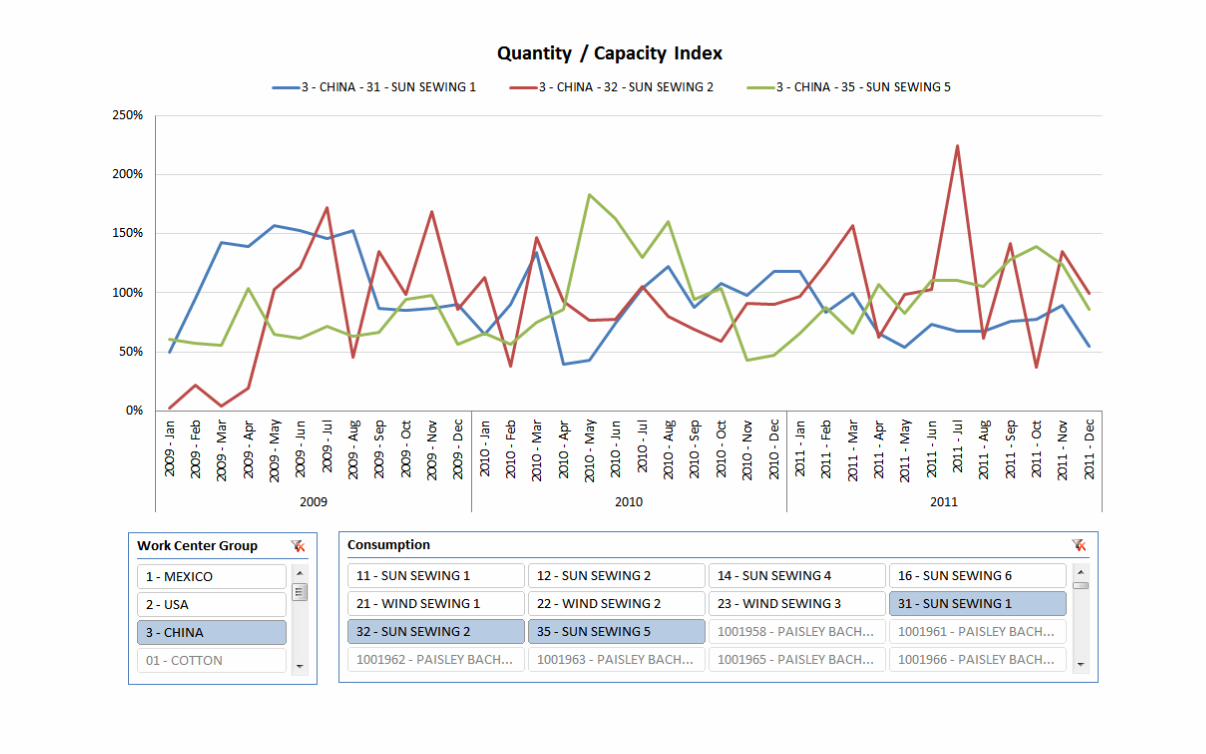


It can be a great help to know where an item or work center has been consumed.


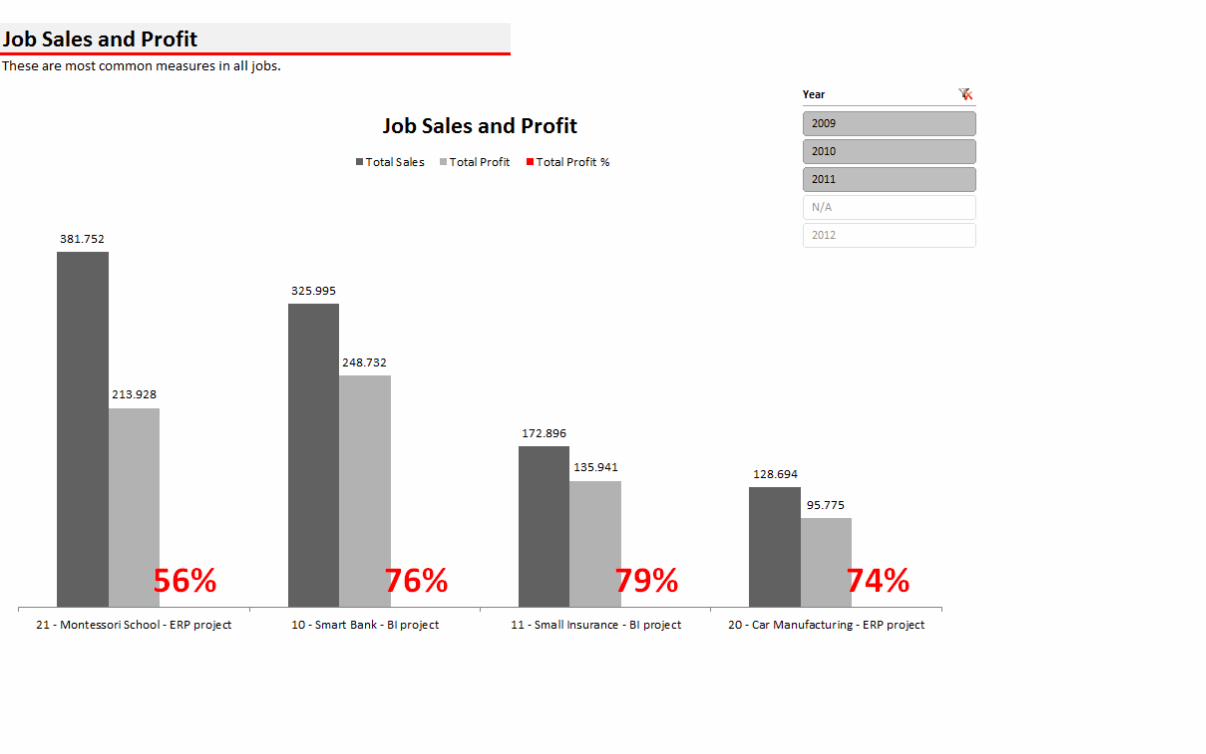
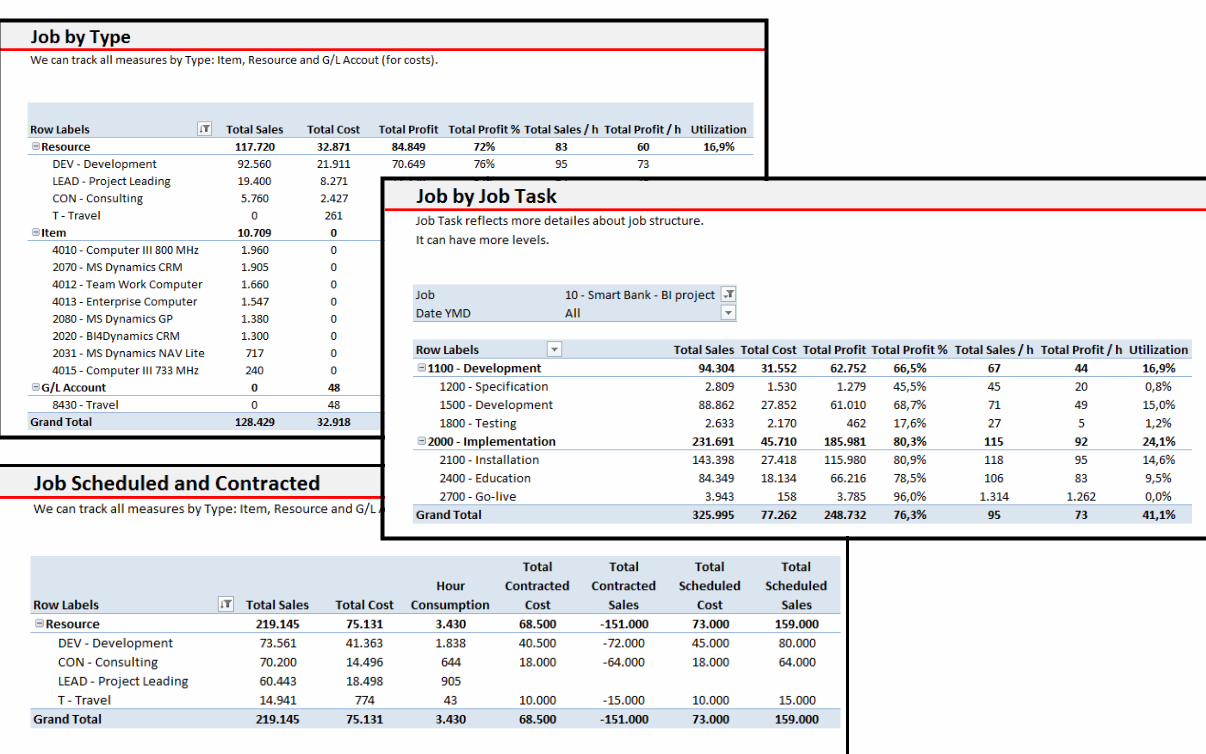
JOB AND RESOURCES
Powerful analysis of jobs and resources, which can give answers about budgets, costs and profits on different open jobs in just one report. Job and resources module provides the ability to compare budgets, costs and profit at the same time in one report for a specific project.


BUSINESS VALUE
BI4Dynamics is a complete BI solution that covers out of the box:
• Standard and additional NAV & AX application areas
• Data Warehouse + OLAP Cubes
• Vertical Solutions
• Predefined Excel reports with best practice concepts

ASK FOR FREE 30 DAYS TRIAL Next step: