Embed Size (px)
Citation preview
IN WHAT CITY DO METRO CARS HAVE CARPET FLOORING?
A) Beijing, China
B) Bucharest, Romania
C) Washington, D.C, USA
Subway's Wireless Network Design #iBwaveTalks
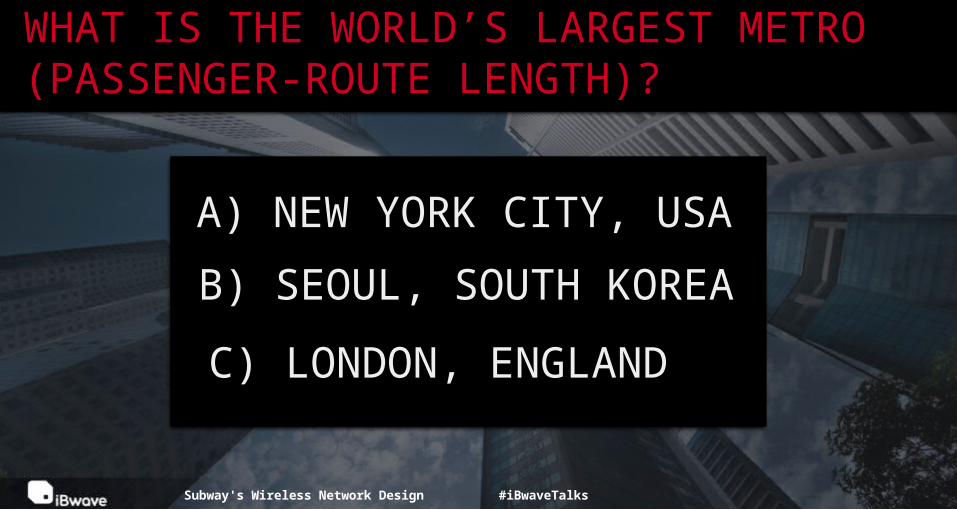
A) NEW YORK CITY, USA
WHAT IS THE WORLD’S LARGEST METRO (PASSENGER-ROUTE LENGTH)?
B) SEOUL, SOUTH KOREA
C) LONDON, ENGLAND
Subway's Wireless Network Design #iBwaveTalks
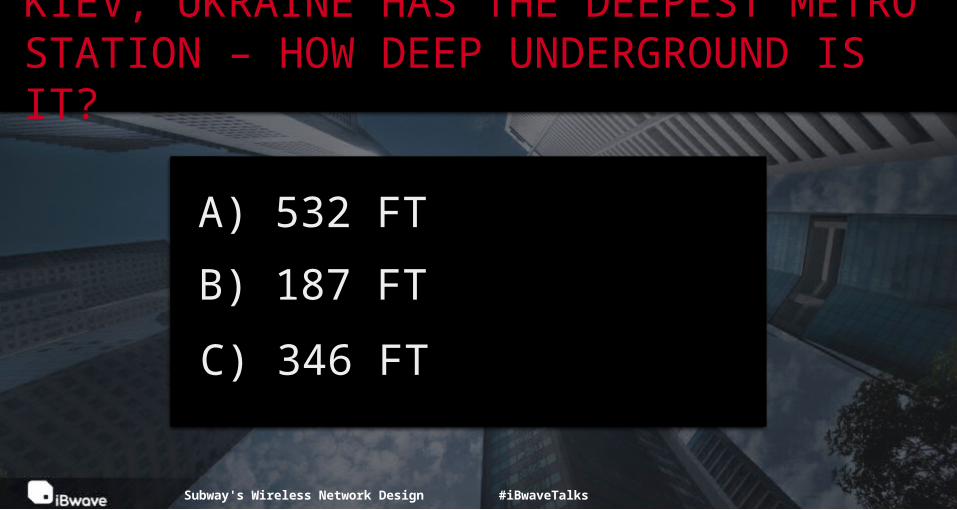
A) 532 FT
KIEV, UKRAINE HAS THE DEEPEST METRO STATION – HOW DEEP UNDERGROUND IS IT?
B) 187 FT
C) 346 FT
Subway's Wireless Network Design #iBwaveTalks
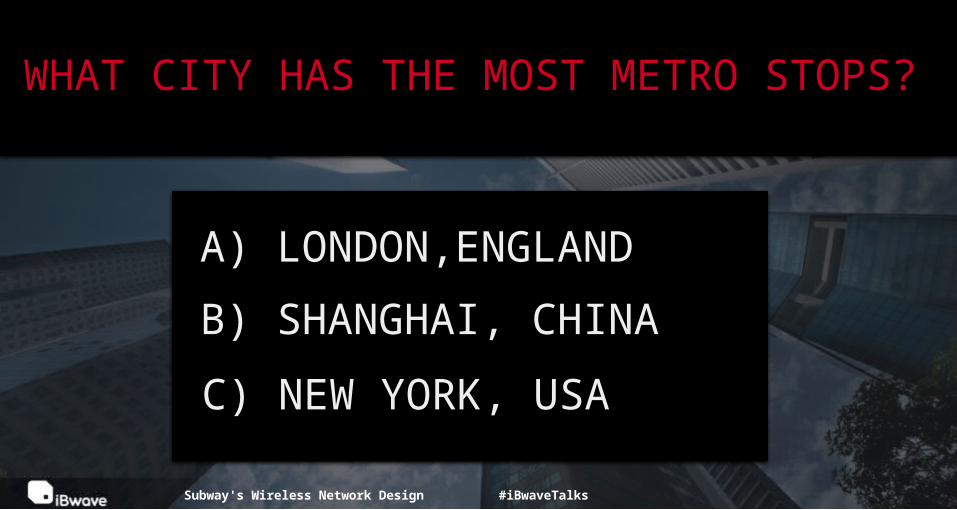
A) LONDON,ENGLAND
WHAT CITY HAS THE MOST METRO STOPS?
B) SHANGHAI, CHINA
C) NEW YORK, USA
Subway's Wireless Network Design #iBwaveTalks
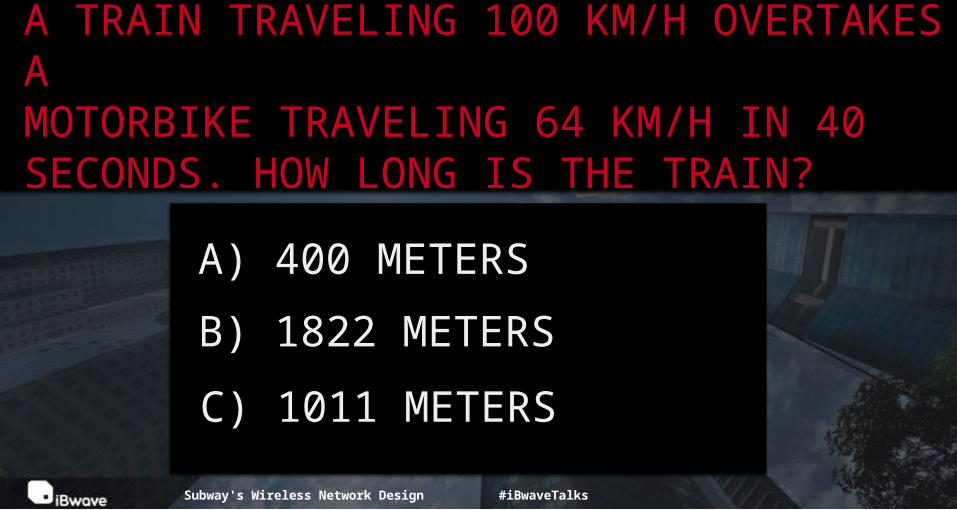
A) 400 METERS
A TRAIN TRAVELING 100 KM/H OVERTAKES AMOTORBIKE TRAVELING 64 KM/H IN 40 SECONDS. HOW LONG IS THE TRAIN?
B) 1822 METERS
C) 1011 METERS
Subway's Wireless Network Design #iBwaveTalks
A) NEW YORK CITY, USA
WHAT CITY HAD THE WORLD’S FIRST METRO?
B) LONDON, ENGLAND
C) MOSCOW, RUSSIA
Subway's Wireless Network Design #iBwaveTalks
A) SHANGHAI, CHINA
WHAT CITY HAS THE BUSIEST METRO SYSTEM?
B) TOKYO, JAPAN
C) MOSCOW, RUSSIA
Subway's Wireless Network Design #iBwaveTalks
A) 14
HOW MANY OF THE WORLD’S 180 METRO SYSTEMS HAVE DRIVERLESS TRAINS?
B) 30
C) 46
Subway's Wireless Network Design #iBwaveTalks
A) MONTREAL, CANADA
WHAT CITY HAS WHAT’S CONSIDERED THE MOST BEAUTIFUL STATIONS IN THE WORLD?
B) TOKYO, JAPAN
C) MOSCOW, RUSSIA
Subway's Wireless Network Design #iBwaveTalks
A) CHICAGO, USA
IN WHAT CITY ARE THERE METRO CARS RESERVED SPECIFICALLY JUST FOR WOMEN?
B) ISTANBUL, TURKEY
C) TOKYO, JAPAN
Subway's Wireless Network Design #iBwaveTalks
A) 2 CENTS
HOW MUCH DID IT COST TO RIDE THE NYC SUBWAY WHEN IT OPENED IN 1904?
B) 10 CENTS
C) 5 CENTS
Subway's Wireless Network Design #iBwaveTalks
A) 10 CENTS
AND WHAT DID IT COST TO RIDE THE NYC SUBWAY 44 YRS LATER, IN 1948?
B) 25 CENTS
C) 50 CENTS
Subway's Wireless Network Design #iBwaveTalks
A) THIRD RAIL
WHAT IS THE COMMON NAME GIVEN TO THE SOURCE OF ELECTRICAL POWER FOR A SUBWAY CAR?
B) SECOND RAIL
C) WHITEBOX
Subway's Wireless Network Design #iBwaveTalks
A) BUDAPEST, HUNGARY
IN WHAT CITY DO THE SUBWAY TRAINS RIDE ON RUBBER WHEELS?
B) NEW YORK, USA
C) PARIS, FRANCE
Subway's Wireless Network Design #iBwaveTalks
The webinar will begin shortly. Join the webinar conversation on Twitter
#iBwaveTalksPRESENTED BY: VLADAN JEVREMOVIC, PhD RESEARCH DIRECTOR
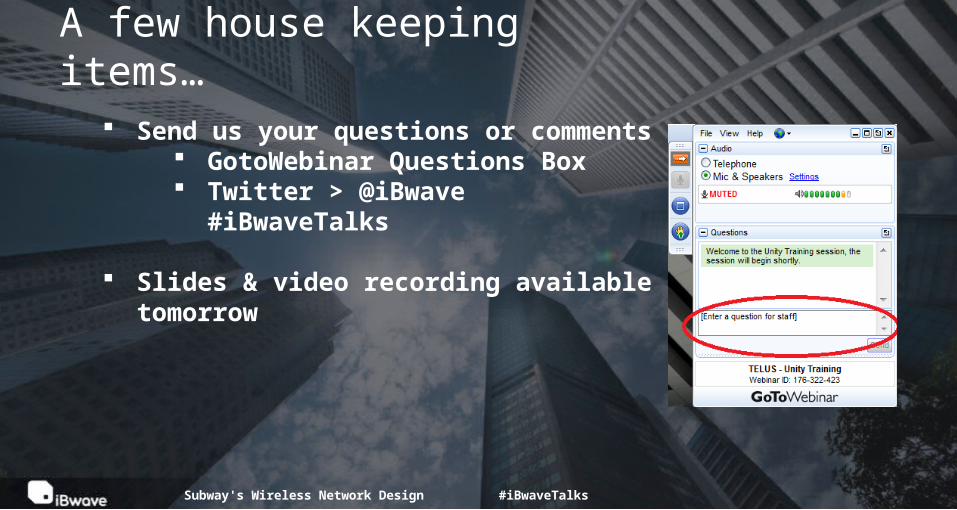
Send us your questions or comments
GotoWebinar Questions Box Twitter > @iBwave
#iBwaveTalks
Slides & video recording available tomorrow
A few house keeping items…
Subway's Wireless Network Design #iBwaveTalks
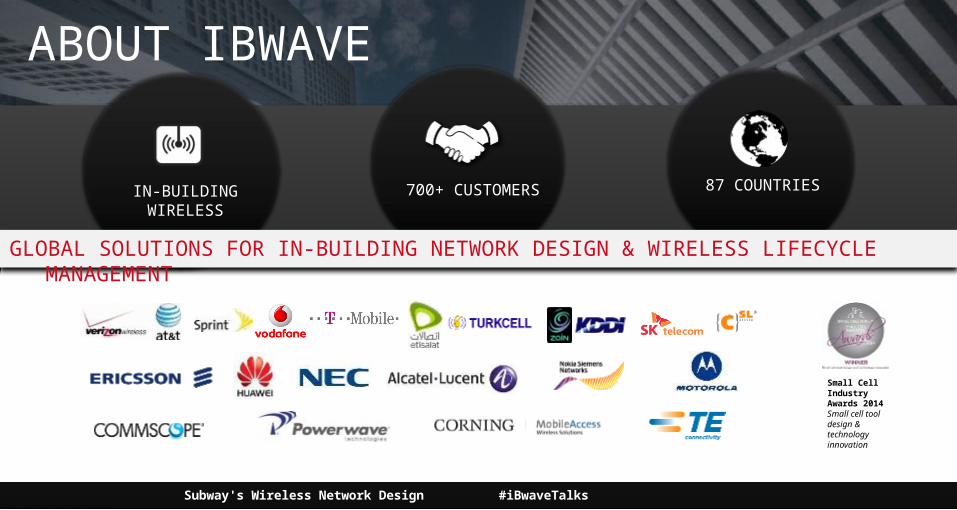
Small Cell Industry Awards 2014Small cell tool design & technology innovation
IN-BUILDING WIRELESS
700+ CUSTOMERS 87 COUNTRIES
ABOUT IBWAVE
GLOBAL SOLUTIONS FOR IN-BUILDING NETWORK DESIGN & WIRELESS LIFECYCLE MANAGEMENT
Subway's Wireless Network Design #iBwaveTalks
Subway's Wireless Network Design #iBwaveTalks
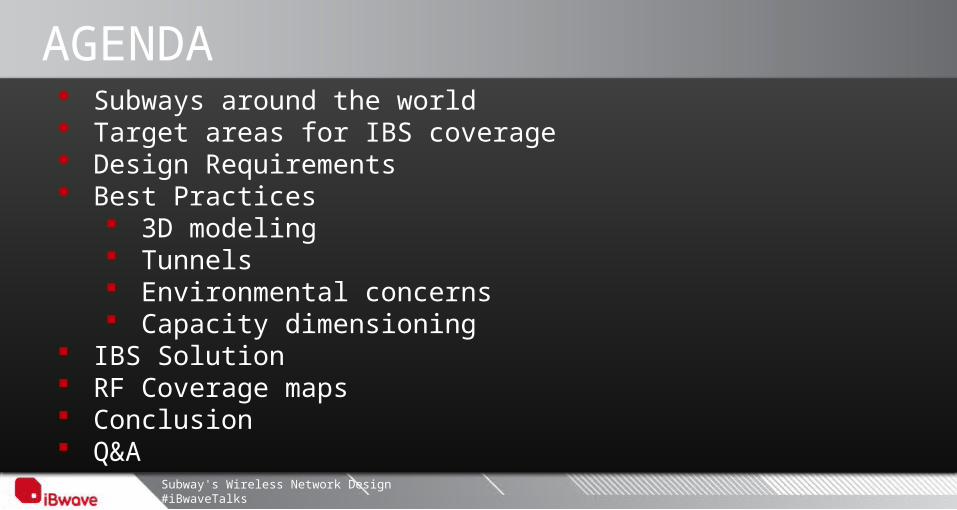
Subways around the world Target areas for IBS coverage Design Requirements Best Practices
3D modeling Tunnels Environmental concerns Capacity dimensioning
IBS Solution RF Coverage maps Conclusion Q&A
AGENDA
Subway's Wireless Network Design #iBwaveTalks
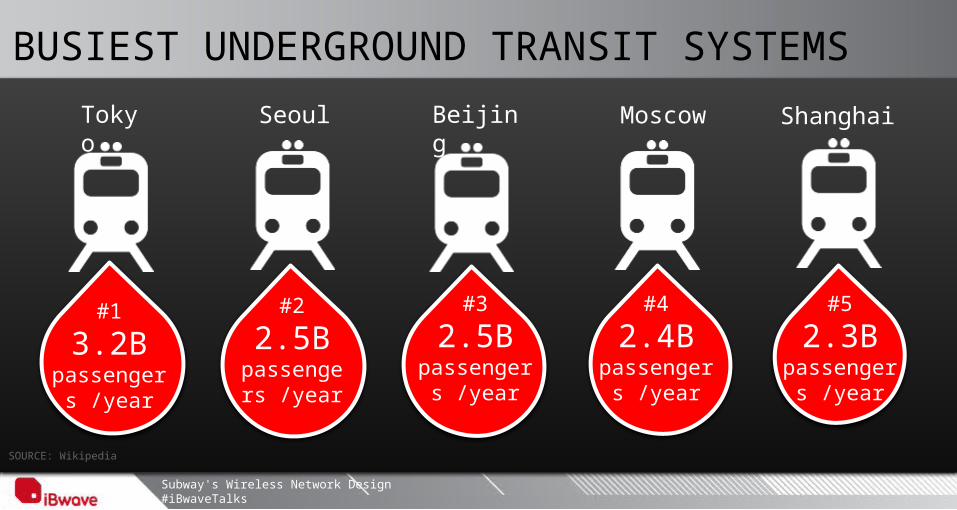
BUSIEST UNDERGROUND TRANSIT SYSTEMS
#2
2.5Bpassenger
s /year
#3
2.5Bpassengers
/year
Tokyo Seoul Beijing Shanghai
#5
2.3Bpassenger
s /year
#1
3.2Bpassenger
s /year
#4
2.4Bpassengers
/year
Moscow
SOURCE: Wikipedia
Subway's Wireless Network Design #iBwaveTalks
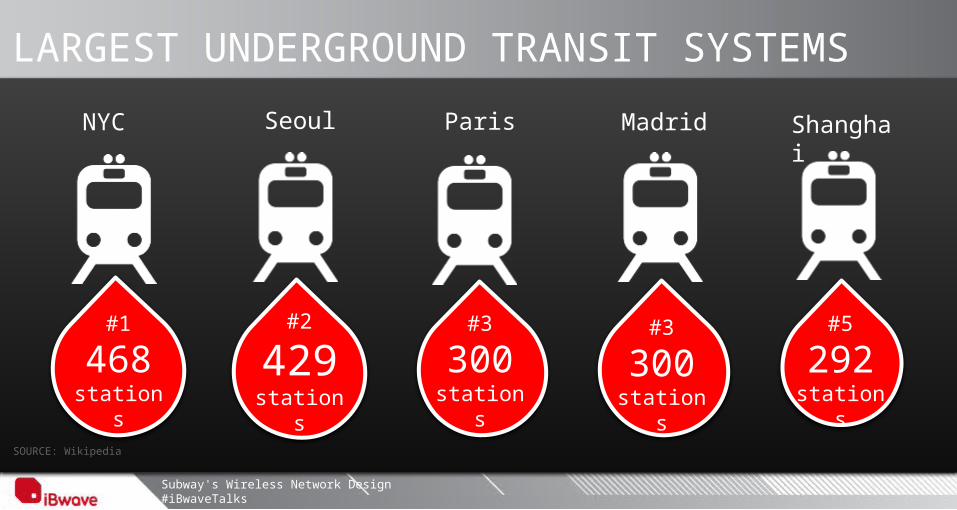
LARGEST UNDERGROUND TRANSIT SYSTEMS
#2
429stations
#3
300stations
NYC Seoul Paris Shanghai
#5
292stations
#1
468stations
#3
300stations
Madrid
SOURCE: Wikipedia
Subway's Wireless Network Design #iBwaveTalks
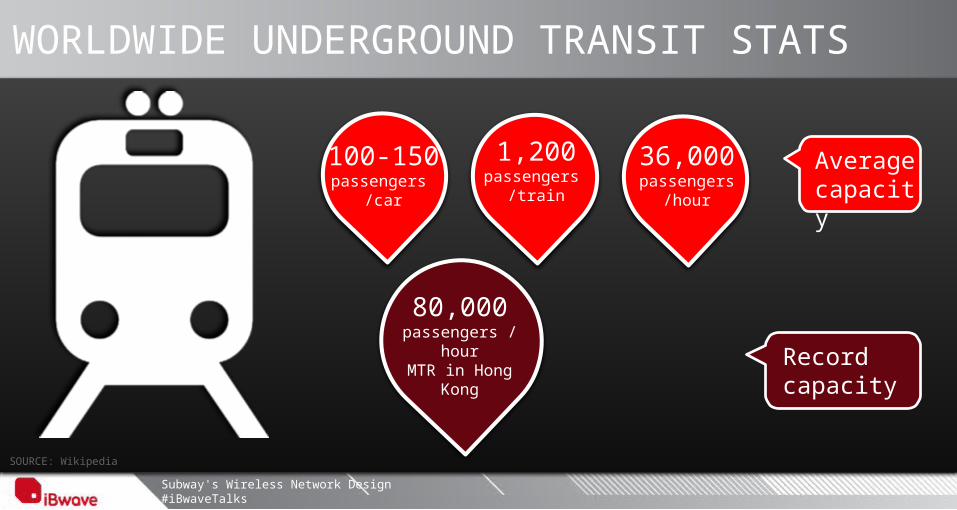
100-150passengers
/car
1,200passengers
/train
36,000passengers
/hour
80,000passengers
/hourMTR in Hong
Kong
Average capacity
Record capacity
WORLDWIDE UNDERGROUND TRANSIT STATS
SOURCE: Wikipedia
Subway's Wireless Network Design #iBwaveTalks
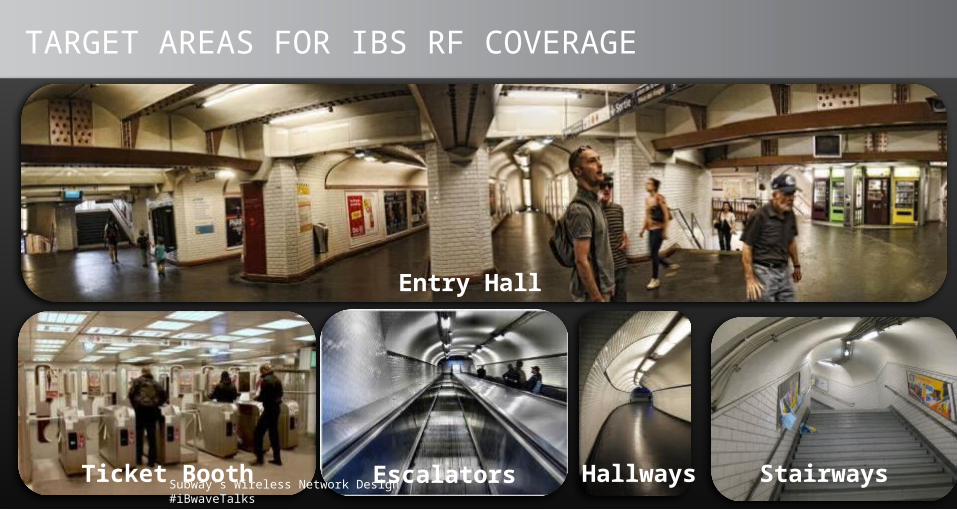
TARGET AREAS FOR IBS RF COVERAGE
Entry Hall
Ticket Booth Escalators Hallways Stairways
Subway's Wireless Network Design #iBwaveTalks
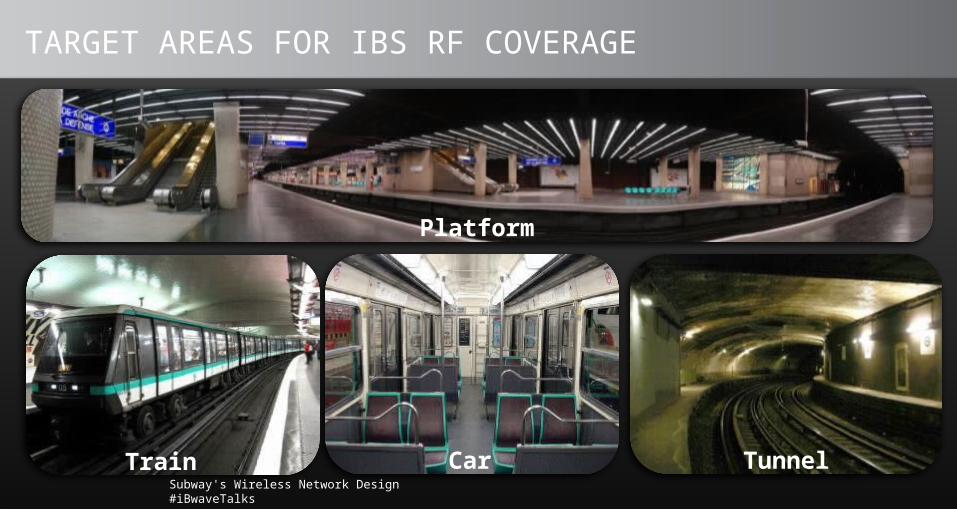
Car
Platform
TunnelTrain
TARGET AREAS FOR IBS RF COVERAGE
Subway's Wireless Network Design #iBwaveTalks
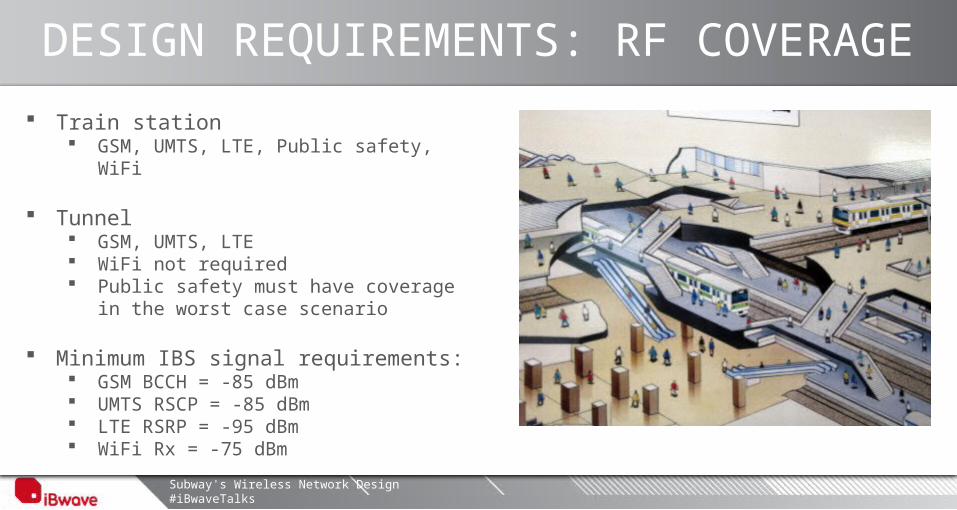
DESIGN REQUIREMENTS: RF COVERAGE
Train station GSM, UMTS, LTE, Public safety, WiFi
Tunnel GSM, UMTS, LTE WiFi not required Public safety must have coverage in
the worst case scenario
Minimum IBS signal requirements: GSM BCCH = -85 dBm UMTS RSCP = -85 dBm LTE RSRP = -95 dBm WiFi Rx = -75 dBm
Subway's Wireless Network Design #iBwaveTalks
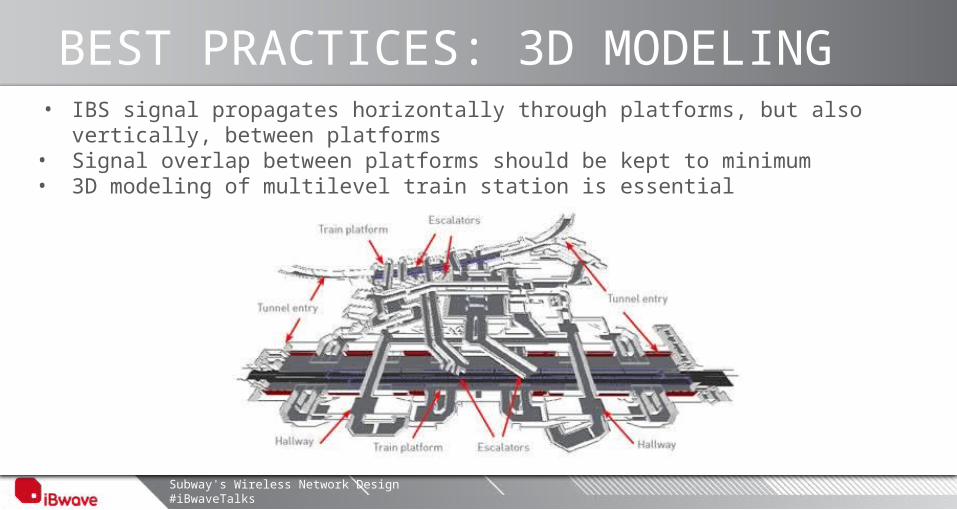
BEST PRACTICES: 3D MODELING
Video stream
• IBS signal propagates horizontally through platforms, but also vertically, between platforms
• Signal overlap between platforms should be kept to minimum• 3D modeling of multilevel train station is essential
Subway's Wireless Network Design #iBwaveTalks
BEST PRACTICES: 3D MODELING
Video stream
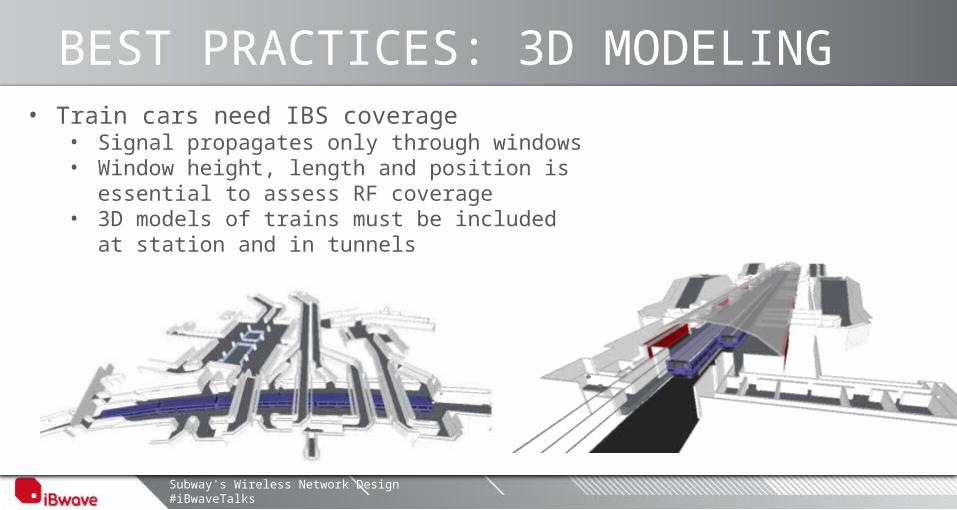
• Train cars need IBS coverage• Signal propagates only through windows• Window height, length and position is
essential to assess RF coverage • 3D models of trains must be included at
station and in tunnels
Subway's Wireless Network Design #iBwaveTalks
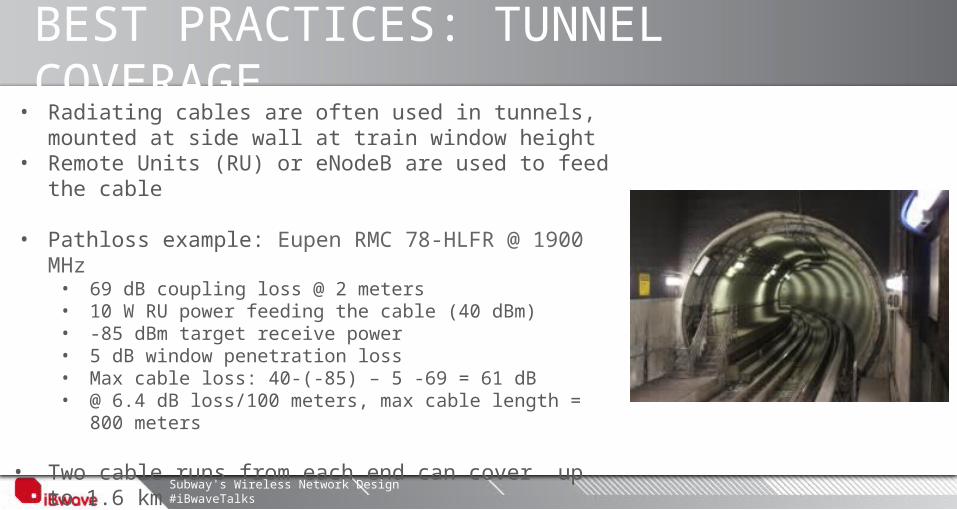
BEST PRACTICES: TUNNEL COVERAGE• Radiating cables are often used in tunnels, mounted
at side wall at train window height• Remote Units (RU) or eNodeB are used to feed the
cable
• Pathloss example: Eupen RMC 78-HLFR @ 1900 MHz• 69 dB coupling loss @ 2 meters• 10 W RU power feeding the cable (40 dBm)• -85 dBm target receive power • 5 dB window penetration loss• Max cable loss: 40-(-85) – 5 -69 = 61 dB• @ 6.4 dB loss/100 meters, max cable length = 800
meters
• Two cable runs from each end can cover up to 1.6 km
• If a tunnel is longer, then cascading RUs may be used to extend the coverage (but watch out for UL noise!)
Subway's Wireless Network Design #iBwaveTalks
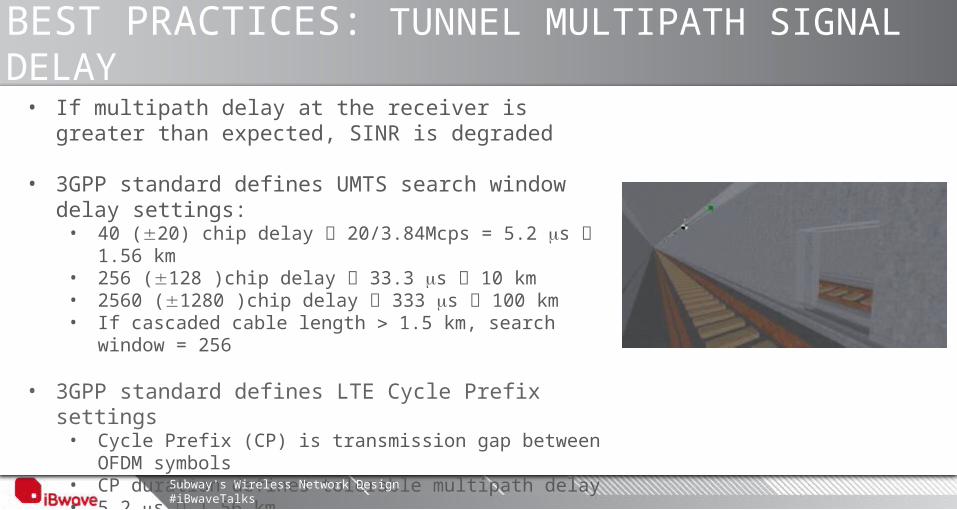
BEST PRACTICES: TUNNEL MULTIPATH SIGNAL DELAY• If multipath delay at the receiver is greater than
expected, SINR is degraded
• 3GPP standard defines UMTS search window delay settings:• 40 (20) chip delay 20/3.84Mcps = 5.2 ms 1.56 km• 256 (128 )chip delay 33.3 ms 10 km• 2560 (1280 )chip delay 333 ms 100 km• If cascaded cable length 1.5 km, search window = 256
• 3GPP standard defines LTE Cycle Prefix settings• Cycle Prefix (CP) is transmission gap between OFDM
symbols• CP duration defines tolerable multipath delay• 5.2 ms 1.56 km • 16.7 ms 5 km• If cascaded cable length 1.5 km, CP =16.7 ms
Subway's Wireless Network Design #iBwaveTalks
BEST PRACTICES: TUNNEL HANDOFF
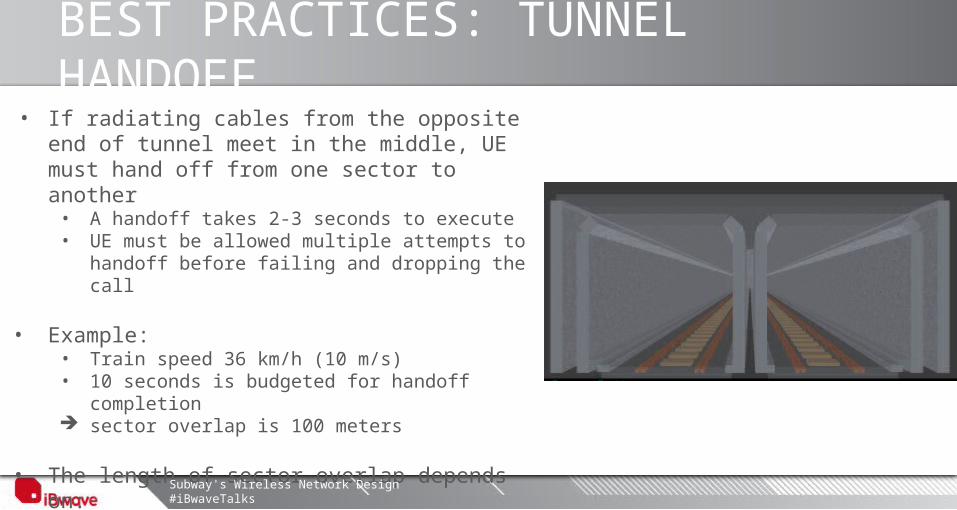
• If radiating cables from the opposite end of tunnel meet in the middle, UE must hand off from one sector to another• A handoff takes 2-3 seconds to execute• UE must be allowed multiple attempts to
handoff before failing and dropping the call
• Example: • Train speed 36 km/h (10 m/s)• 10 seconds is budgeted for handoff completion sector overlap is 100 meters
• The length of sector overlap depends on:• Train speed• The number of allowed handoff attempts
Subway's Wireless Network Design #iBwaveTalks
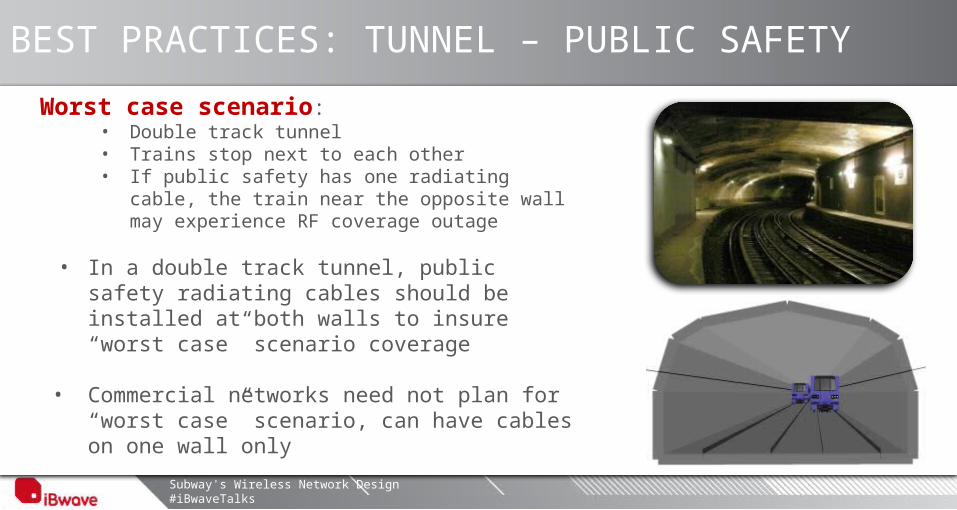
BEST PRACTICES: TUNNEL – PUBLIC SAFETY
Worst case scenario:• Double track tunnel• Trains stop next to each other• If public safety has one radiating cable, the
train near the opposite wall may experience RF coverage outage
• In a double track tunnel, public safety radiating cables should be installed at both walls to insure “worst case” scenario coverage
• Commercial networks need not plan for “worst case” scenario, can have cables on one wall only
Subway's Wireless Network Design #iBwaveTalks
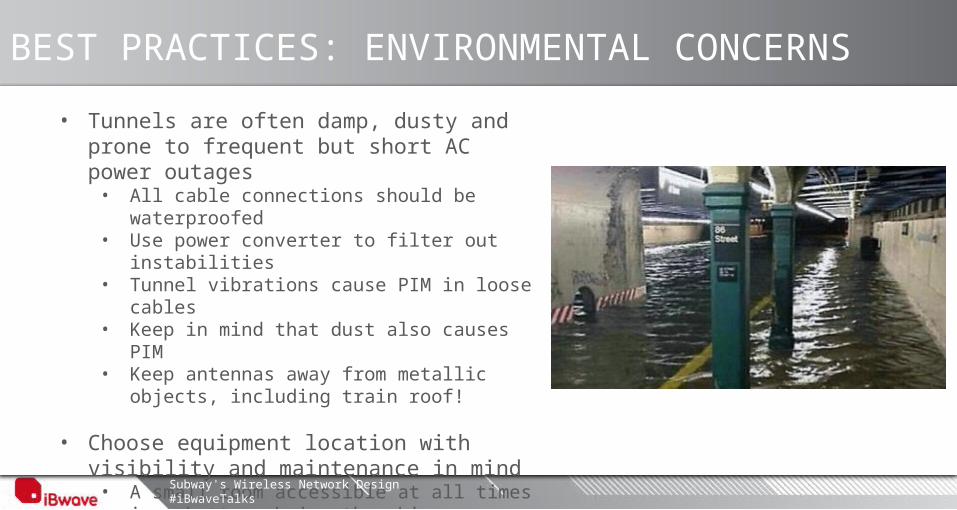
BEST PRACTICES: ENVIRONMENTAL CONCERNS
Video stream
• Tunnels are often damp, dusty and prone to frequent but short AC power outages• All cable connections should be
waterproofed• Use power converter to filter out
instabilities• Tunnel vibrations cause PIM in loose cables • Keep in mind that dust also causes PIM• Keep antennas away from metallic objects,
including train roof!
• Choose equipment location with visibility and maintenance in mind• A small room accessible at all times is a
better choice than big room accessible only after hours
• If rush hour commuters can see IBS equipment, so can late night vandals
Subway's Wireless Network Design #iBwaveTalks
BEST PRACTICES: CAPACITY DIMENSIONING
Video stream
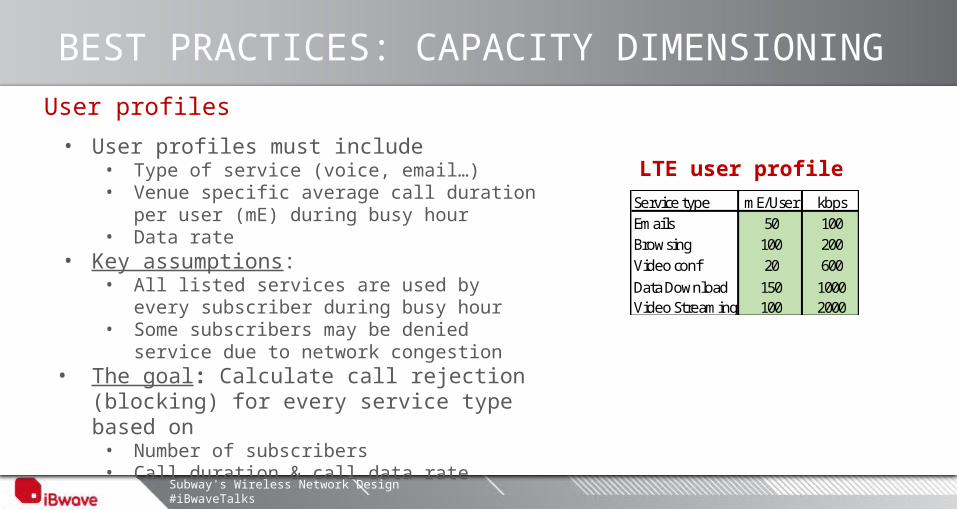
User profiles
• User profiles must include• Type of service (voice, email…)• Venue specific average call duration per
user (mE) during busy hour• Data rate
• Key assumptions: • All listed services are used by every
subscriber during busy hour • Some subscribers may be denied service
due to network congestion• The goal: Calculate call rejection
(blocking) for every service type based on• Number of subscribers • Call duration & call data rate
LTE user profileService type mE/User kbpsEmails 50 100Browsing 100 200Video conf 20 600Data Download 150 1000Video Streaming 100 2000
Subway's Wireless Network Design #iBwaveTalks
BEST PRACTICES: CAPACITY DIMENSIONING
Video stream
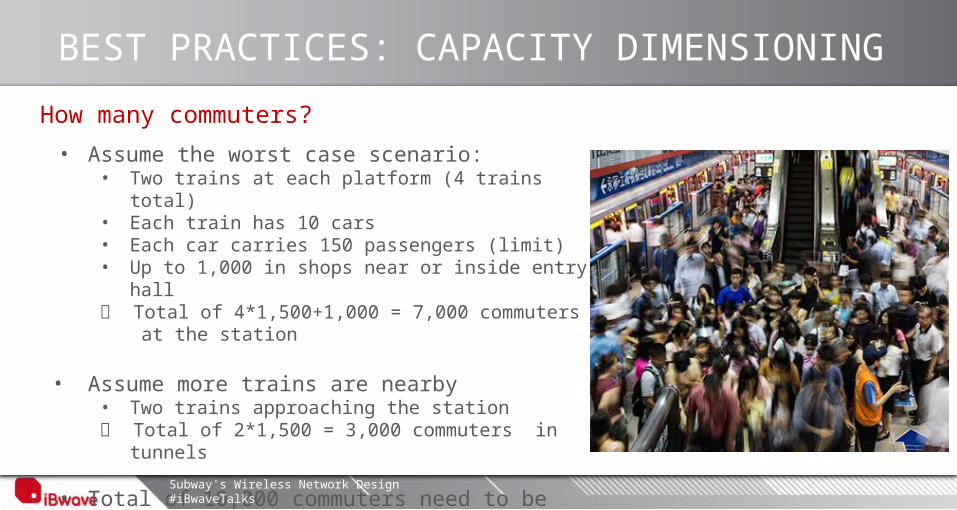
How many commuters?
• Assume the worst case scenario:• Two trains at each platform (4 trains total)• Each train has 10 cars• Each car carries 150 passengers (limit)• Up to 1,000 in shops near or inside entry hall Total of 4*1,500+1,000 = 7,000 commuters at
the station
• Assume more trains are nearby• Two trains approaching the station Total of 2*1,500 = 3,000 commuters in tunnels
• Total of 10,000 commuters need to be supported by IBS at the station
Subway's Wireless Network Design #iBwaveTalks
BEST PRACTICES: CAPACITY DIMENSIONING
Video stream
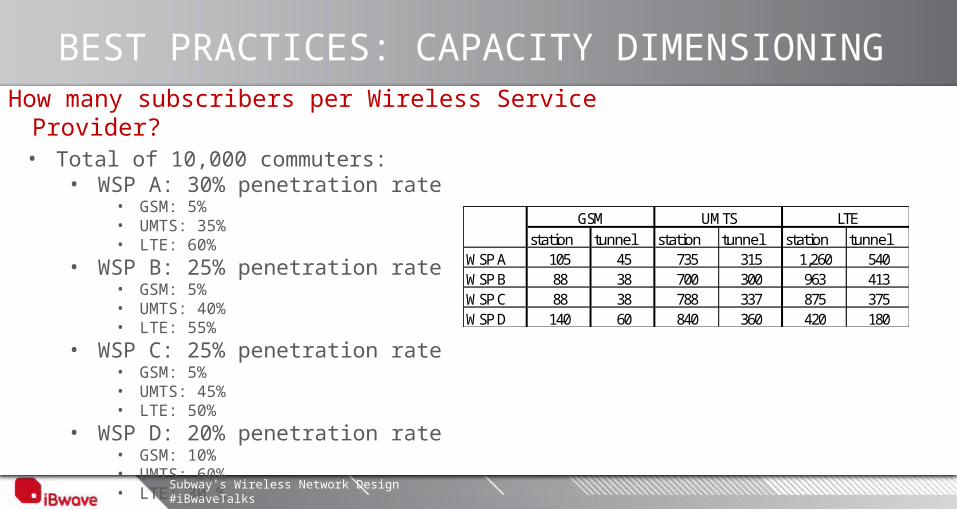
How many subscribers per Wireless Service Provider? • Total of 10,000 commuters:
• WSP A: 30% penetration rate• GSM: 5%• UMTS: 35%• LTE: 60%
• WSP B: 25% penetration rate• GSM: 5%• UMTS: 40%• LTE: 55%
• WSP C: 25% penetration rate• GSM: 5%• UMTS: 45%• LTE: 50%
• WSP D: 20% penetration rate• GSM: 10%• UMTS: 60%• LTE: 30 %
station tunnel station tunnel station tunnelWSP A 105 45 735 315 1,260 540WSP B 88 38 700 300 963 413WSP C 88 38 788 337 875 375WSP D 140 60 840 360 420 180
GSM UMTS LTE
Subway's Wireless Network Design #iBwaveTalks
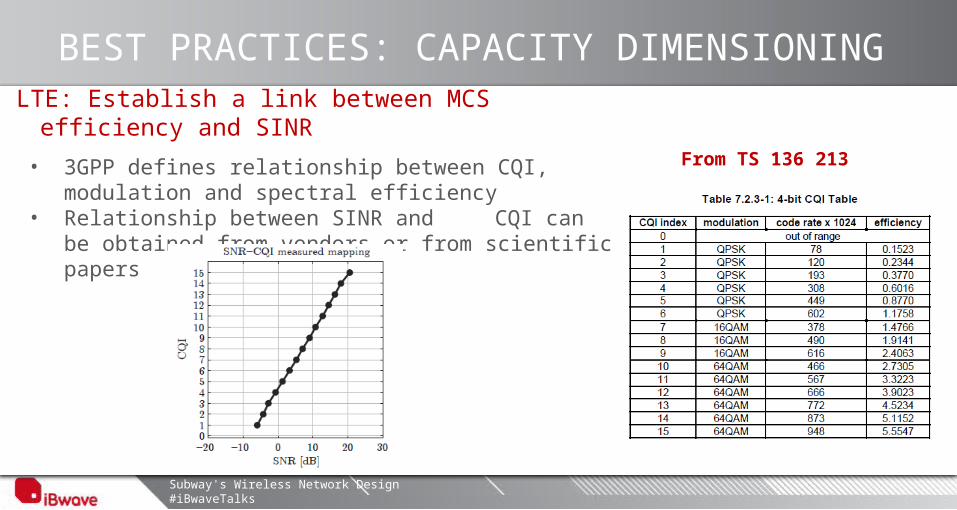
BEST PRACTICES: CAPACITY DIMENSIONINGLTE: Establish a link between MCS efficiency and
SINR
• 3GPP defines relationship between CQI, modulation and spectral efficiency
• Relationship between SINR and CQI can be obtained from vendors or from scientific papers
From TS 136 213
Subway's Wireless Network Design #iBwaveTalks
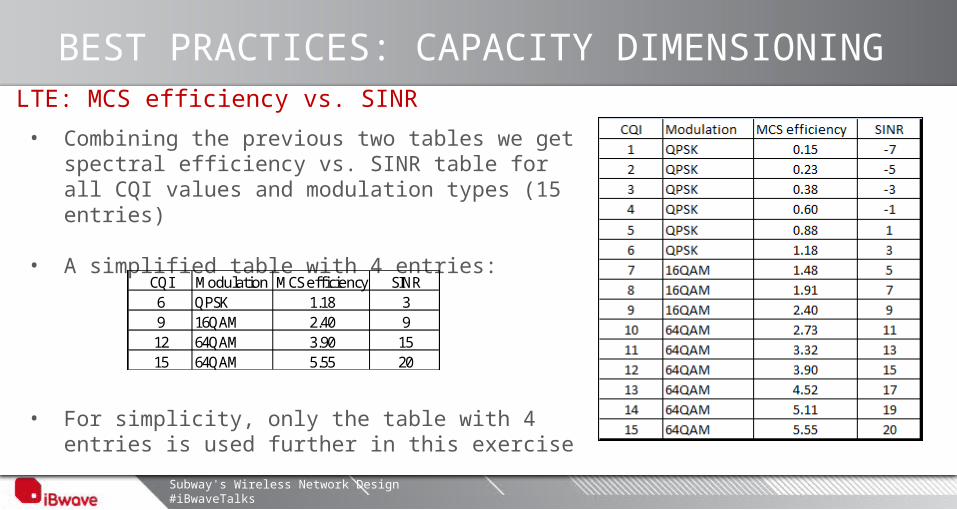
BEST PRACTICES: CAPACITY DIMENSIONINGLTE: MCS efficiency vs. SINR
• Combining the previous two tables we get spectral efficiency vs. SINR table for all CQI values and modulation types (15 entries)
• A simplified table with 4 entries:
• For simplicity, only the table with 4 entries is used further in this exercise
CQI Modulation MCS effi ciency SINR6 QPSK 1.18 39 16QAM 2.40 912 64QAM 3.90 1515 64QAM 5.55 20
Subway's Wireless Network Design #iBwaveTalks
BEST PRACTICES: CAPACITY DIMENSIONING
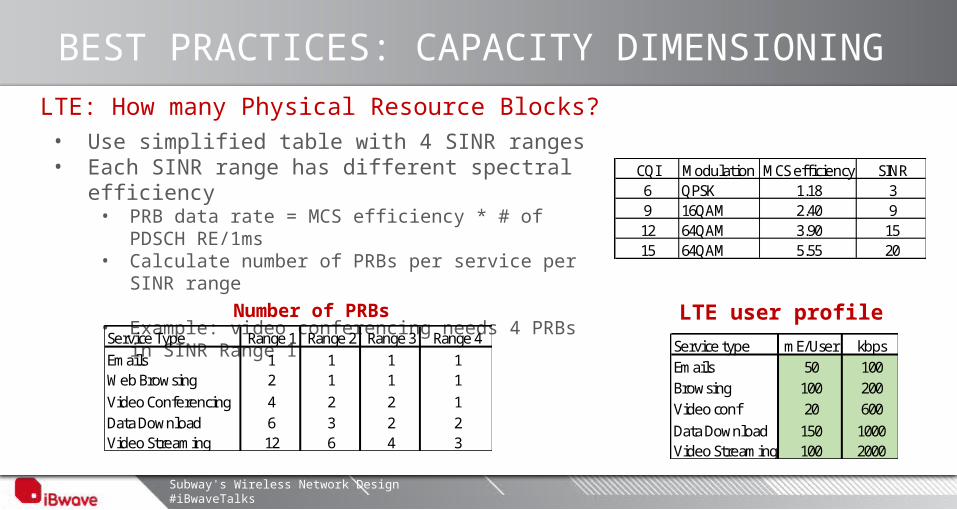
LTE: How many Physical Resource Blocks?• Use simplified table with 4 SINR ranges• Each SINR range has different spectral
efficiency• PRB data rate = MCS efficiency * # of PDSCH
RE/1ms • Calculate number of PRBs per service per SINR
range
• Example: video conferencing needs 4 PRBs in SINR Range 1
Number of PRBs
CQI Modulation MCS effi ciency SINR6 QPSK 1.18 39 16QAM 2.40 912 64QAM 3.90 1515 64QAM 5.55 20
Service Type Range 1 Range 2 Range 3 Range 4Emails 1 1 1 1Web Browsing 2 1 1 1Video Conferencing 4 2 2 1Data Download 6 3 2 2Video Streaming 12 6 4 3
LTE user profileService type mE/User kbpsEmails 50 100Browsing 100 200Video conf 20 600Data Download 150 1000Video Streaming 100 2000
Subway's Wireless Network Design #iBwaveTalks
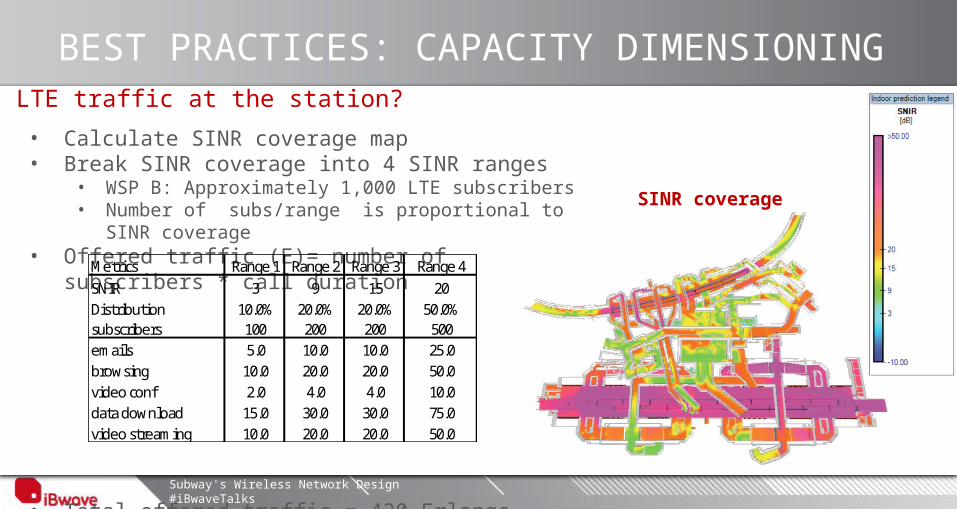
BEST PRACTICES: CAPACITY DIMENSIONINGLTE traffic at the station?
• Calculate SINR coverage map• Break SINR coverage into 4 SINR ranges
• WSP B: Approximately 1,000 LTE subscribers • Number of subs/range is proportional to SINR
coverage • Offered traffic (E)= number of subscribers * call
duration
• Total offered traffic = 420 Erlangs
SINR coverage
Metrics Range 1 Range 2 Range 3 Range 4SNIR 3 9 15 20Distribution 10.0% 20.0% 20.0% 50.0%subscribers 100 200 200 500emails 5.0 10.0 10.0 25.0browsing 10.0 20.0 20.0 50.0video conf 2.0 4.0 4.0 10.0data download 15.0 30.0 30.0 75.0video streaming 10.0 20.0 20.0 50.0
Subway's Wireless Network Design #iBwaveTalks
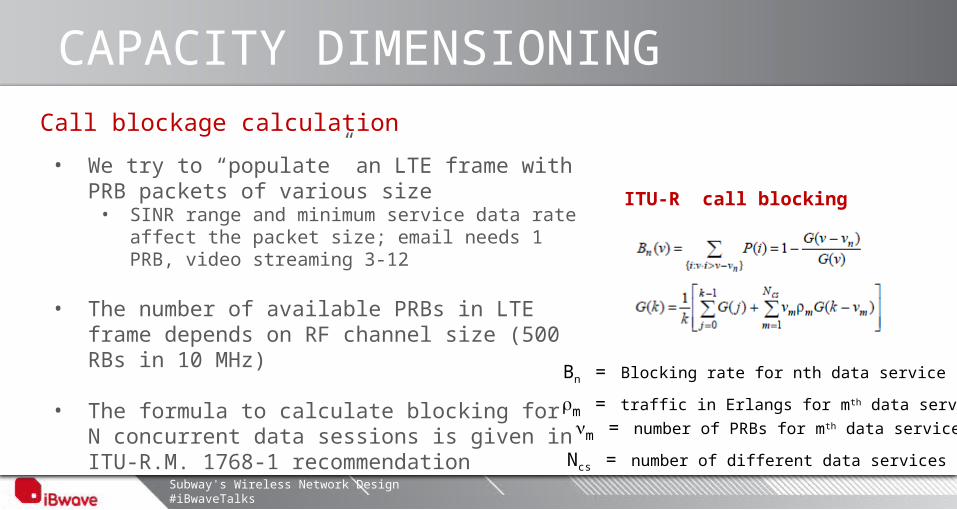
CAPACITY DIMENSIONINGCall blockage calculation
• We try to “populate” an LTE frame with PRB packets of various size • SINR range and minimum service data rate
affect the packet size; email needs 1 PRB, video streaming 3-12
• The number of available PRBs in LTE frame depends on RF channel size (500 RBs in 10 MHz)
• The formula to calculate blocking for N concurrent data sessions is given in ITU-R.M. 1768-1 recommendation
rm = traffic in Erlangs for mth data service
nm = number of PRBs for mth data service
Ncs = number of different data services
ITU-R call blocking
Bn = Blocking rate for nth data service
Subway's Wireless Network Design #iBwaveTalks
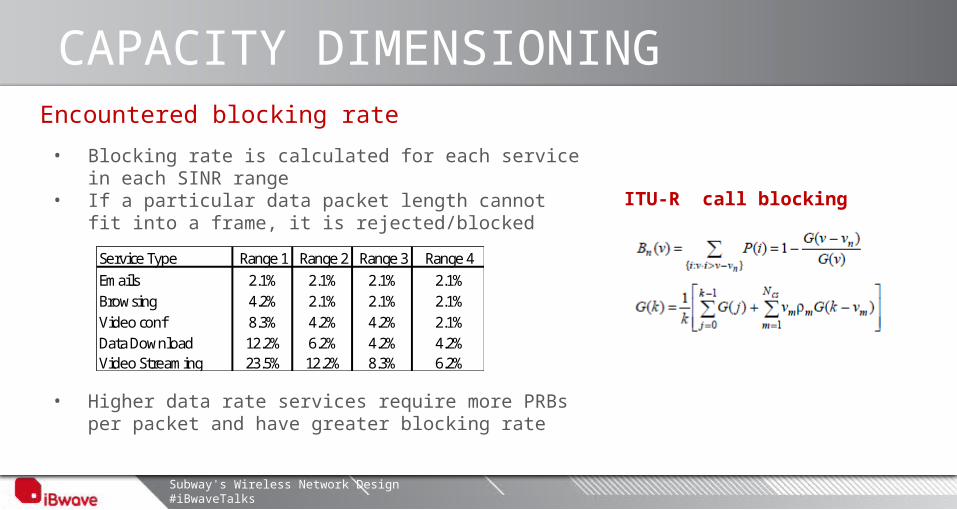
CAPACITY DIMENSIONINGEncountered blocking rate
• Blocking rate is calculated for each service in each SINR range
• If a particular data packet length cannot fit into a frame, it is rejected/blocked
• Higher data rate services require more PRBs per packet and have greater blocking rate
ITU-R call blocking
Service Type Range 1 Range 2 Range 3 Range 4Emails 2.1% 2.1% 2.1% 2.1%Browsing 4.2% 2.1% 2.1% 2.1%Video conf 8.3% 4.2% 4.2% 2.1%Data Download 12.2% 6.2% 4.2% 4.2%Video Streaming 23.5% 12.2% 8.3% 6.2%
Subway's Wireless Network Design #iBwaveTalks
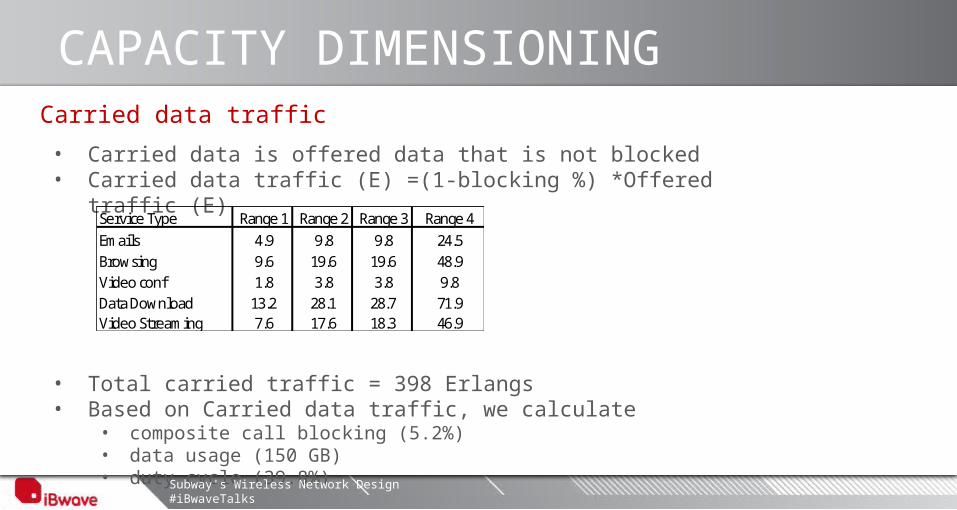
CAPACITY DIMENSIONINGCarried data traffic
• Carried data is offered data that is not blocked• Carried data traffic (E) =(1-blocking %) *Offered traffic (E)
• Total carried traffic = 398 Erlangs• Based on Carried data traffic, we calculate
• composite call blocking (5.2%) • data usage (150 GB)• duty cycle (39.8%)
Service Type Range 1 Range 2 Range 3 Range 4Emails 4.9 9.8 9.8 24.5Browsing 9.6 19.6 19.6 48.9Video conf 1.8 3.8 3.8 9.8Data Download 13.2 28.1 28.7 71.9Video Streaming 7.6 17.6 18.3 46.9
Subway's Wireless Network Design #iBwaveTalks
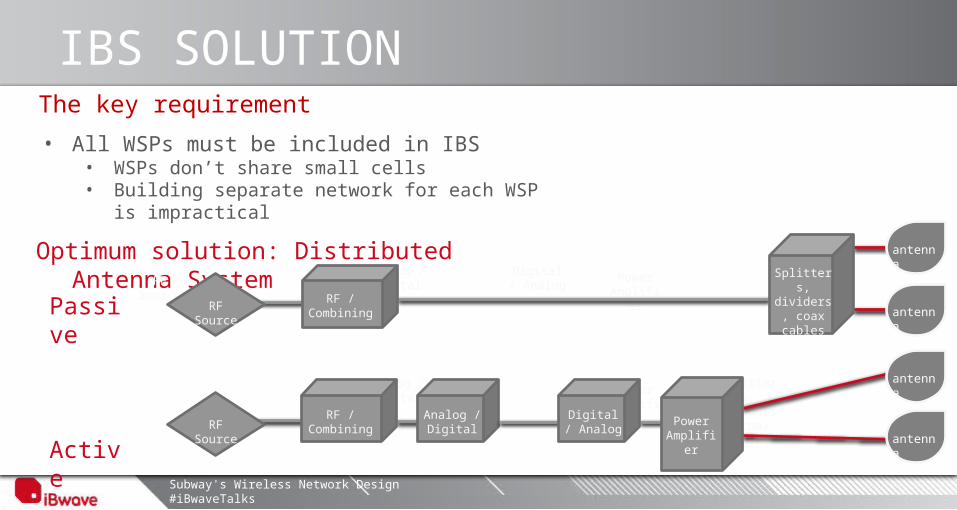
IBS SOLUTION The key requirement
• All WSPs must be included in IBS • WSPs don’t share small cells• Building separate network for each WSP is
impractical
Optimum solution: Distributed Antenna System
Video streamAnalog / Digital
Power Amplifier
Splitters, dividers,
coax cables
Analog / Digital
Digital / Analog
Power Amplifier
RF Source
Passive
Active
Splitters, dividers,
coax cables
antenna
antenna
RF / Combining
RF Source
Analog / Digital
Digital / Analog
Power Amplifier
antenna
antenna
RF Source
RF / Combining
Subway's Wireless Network Design #iBwaveTalks
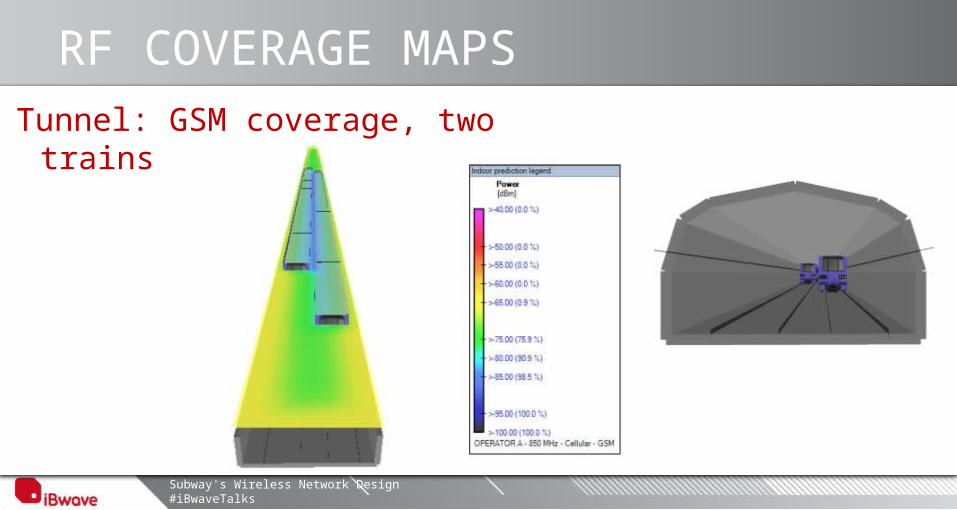
RF COVERAGE MAPSTunnel: GSM coverage, two trains
Subway's Wireless Network Design #iBwaveTalks
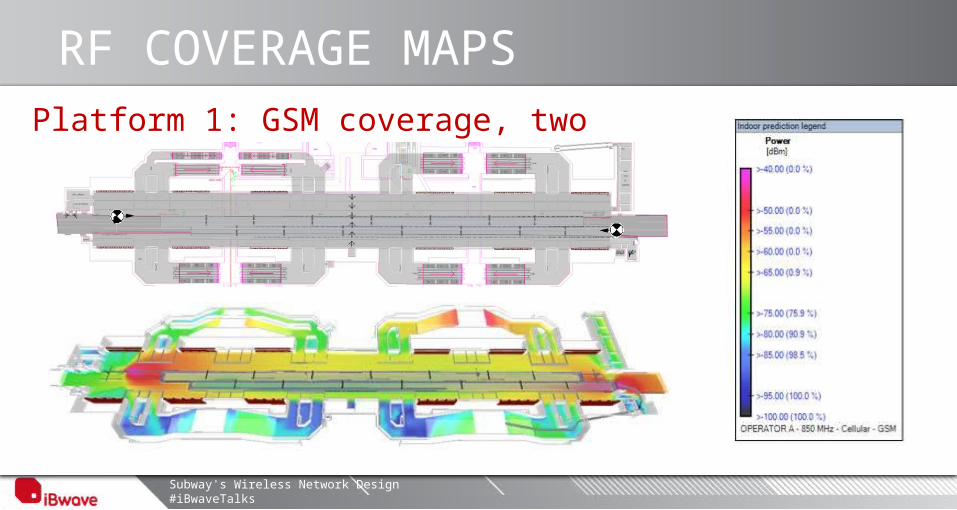
RF COVERAGE MAPSPlatform 1: GSM coverage, two
trains
Subway's Wireless Network Design #iBwaveTalks
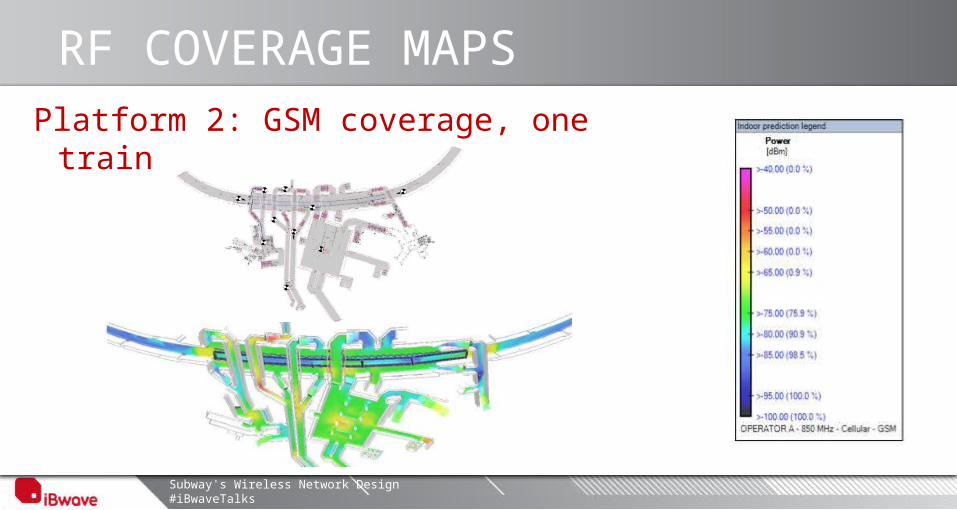
RF COVERAGE MAPSPlatform 2: GSM coverage, one train
Subway's Wireless Network Design #iBwaveTalks
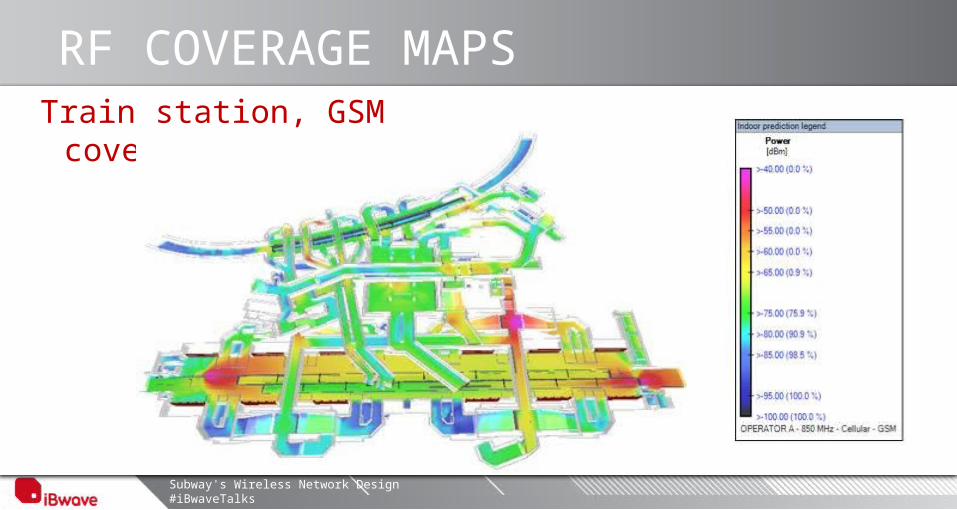
RF COVERAGE MAPSTrain station, GSM coverage
Subway's Wireless Network Design #iBwaveTalks
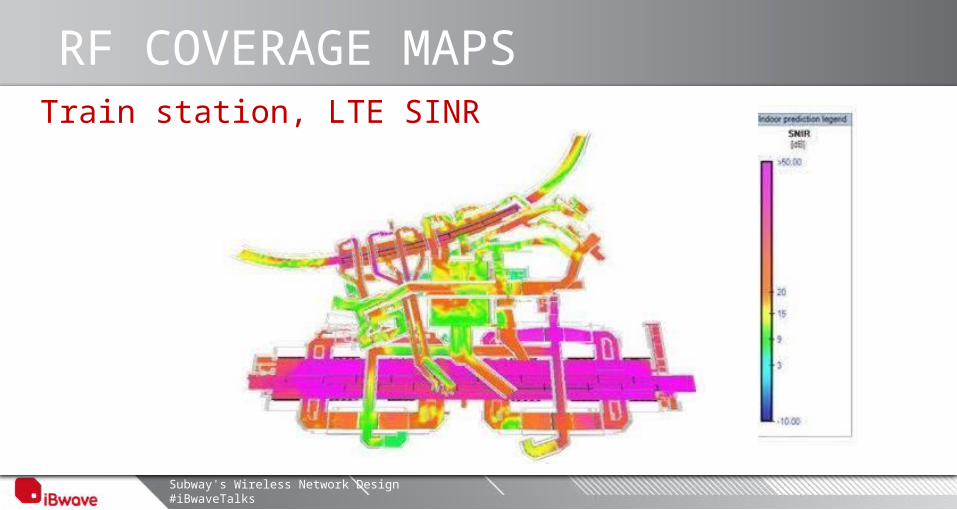
RF COVERAGE MAPSTrain station, LTE SINR
Subway's Wireless Network Design #iBwaveTalks
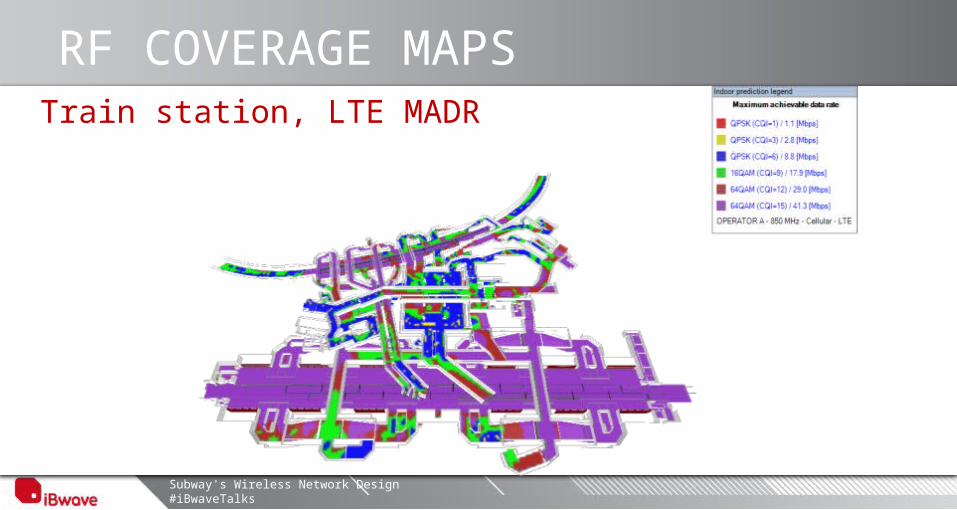
RF COVERAGE MAPSTrain station, LTE MADR
Subway's Wireless Network Design #iBwaveTalks
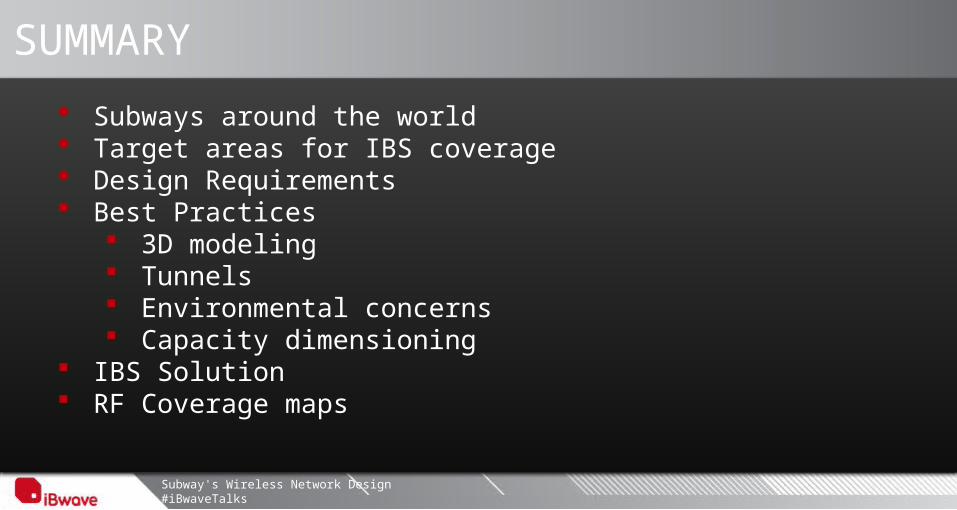
SUMMARY
Subways around the world Target areas for IBS coverage Design Requirements Best Practices
3D modeling Tunnels Environmental concerns Capacity dimensioning
IBS Solution RF Coverage maps
-Join the webinar conversation on twitter #ibwavetalks -
THANK YOUConnect on LinkedIn
Follow @ibwave
Watch youtube.com/ibwavesolutions
Join facebook.com/ibwave
Contact Vladan Jevremovic, Research Director at [email protected]