Embed Size (px)
Citation preview

Valeant
Pharmaceuticals
International, Inc.
Q3 2015 Financial Results
October 19, 2015

1
Forward-looking Statements Forward-looking Statements Certain statements made in this presentation may constitute forward-looking statements, including, but not limited to, statements regarding
marketing efforts, portfolio expansion, debt reduction, future acquisitions and dispositions, share repurchases, future price increases and the mix of
volume and price with respect to future growth, the relative mix of the components of our future business, expectations with respect to litigation and
government investigations, expected future performance, including guidance with respect to revenue, Cash EPS, adjusted cash flow from operations
and organic growth, future inventory levels, and expectations with respect to the timing of and outcome of development programs, regulatory
approvals and commercial plans with respect to product candidates. Forward-looking statements may generally be identified by the use of the
words “anticipates,” “expects,” “intends,” “plans,” “should,” “could,” “would,” “may,” “will,” “believes,” “estimates,” “potential,” “target,” or “continue”
and variations or similar expressions. These statements are based upon the current expectations and beliefs of management and are subject to
certain risks and uncertainties that could cause actual results to differ materially from those described in the forward-looking statements. These risks
and uncertainties include, but are not limited to, risks and uncertainties discussed in the Company's most recent annual or quarterly report and
detailed from time to time in Valeant’s other filings with the Securities and Exchange Commission and the Canadian Securities Administrators, which
factors are incorporated herein by reference. Readers are cautioned not to place undue reliance on any of these forward-looking statements. These
forward-looking statements speak only as of the date hereof. Valeant undertakes no obligation to update any of these forward-looking statements to
reflect events or circumstances after the date of this presentation or to reflect actual outcomes.
Non-GAAP Information To supplement the financial measures prepared in accordance with U.S. generally accepted accounting principles (GAAP), the company uses non-GAAP financial measures that exclude certain items, such as amortization of inventory step-up, amortization of alliance product assets & property, plant and equipment step up, stock-based compensation step-up, contingent consideration fair value adjustments, restructuring, integration, acquisition-related and other costs, In-process research and development, impairments and other charges, ("IPR&D"), legal settlements outside the ordinary course of business, the impact of currency fluctuations, amortization including intangible asset impairments and other non-cash charges, amortization and write-down of deferred financing costs, debt discounts and ASC 470-20 (FSP APB 14-1) interest, loss on extinguishment of debt, (gain) loss on assets sold/held for sale/impairment, net, (gain) loss on investments, net, and adjusts tax expense to cash taxes. Management uses non-GAAP financial measures internally for strategic decision making, forecasting future results and evaluating current performance. By disclosing non-GAAP financial measures, management intends to provide investors with a meaningful, consistent comparison of the company’s core operating results and trends for the periods presented. Non-GAAP financial measures are not prepared in accordance with GAAP. Therefore, the information is not necessarily comparable to other companies and should be considered as a supplement to, not a substitute for, or superior to, the corresponding measures calculated in accordance with GAAP.
Note 1: The guidance in this presentation is only effective as of the date given,
October 19, 2015, and will not be updated or affirmed unless and until the
Company publicly announces updated or affirmed guidance.

2
Exceeded top line and bottom line Q3 guidance; 5th consecutive quarter of >10%
organic growth
Includes negative FX impact of $172M revenues and $0.13 Cash EPS
Continued outperformance of U.S. businesses, particularly dermatology and
contact lens
Strong organic growth in China (23%), South Korea (15%), and Mexico (10%)
Continued strong Salix performance
IBS-D indication for Xifaxan (including DTC campaign)
Salix inventories reduced to 8-10 weeks
Addyi launched 10/17
Four deals closed in October
Brodalumab
Sprout
Synergetics
Amoun (expected to close today)
Strong cash flow from operations
GAAP cash flow from operations $737M
90% cash conversion
Q3 2015 Highlights

3
Q3 2015 Financial Results
Q3 2015
Q3 2014
Y/Y%
Adjusted
Y/Y% (a)
Total Revenue $2.8 B
(guidance $2.6 – 2.8B) $2.1 B 36% 44%
Cash EPS $2.74
(guidance $2.60 – 2.70) $2.11 30% 36%
GAAP Cash Flow
from Operations $737M $619M 19% 26%
Adjusted Cash Flow
from Operations $865M $771M 12% 18%
a) Negative FX Y/Y Impact: Revenue $172M, Cash EPS $0.13
4
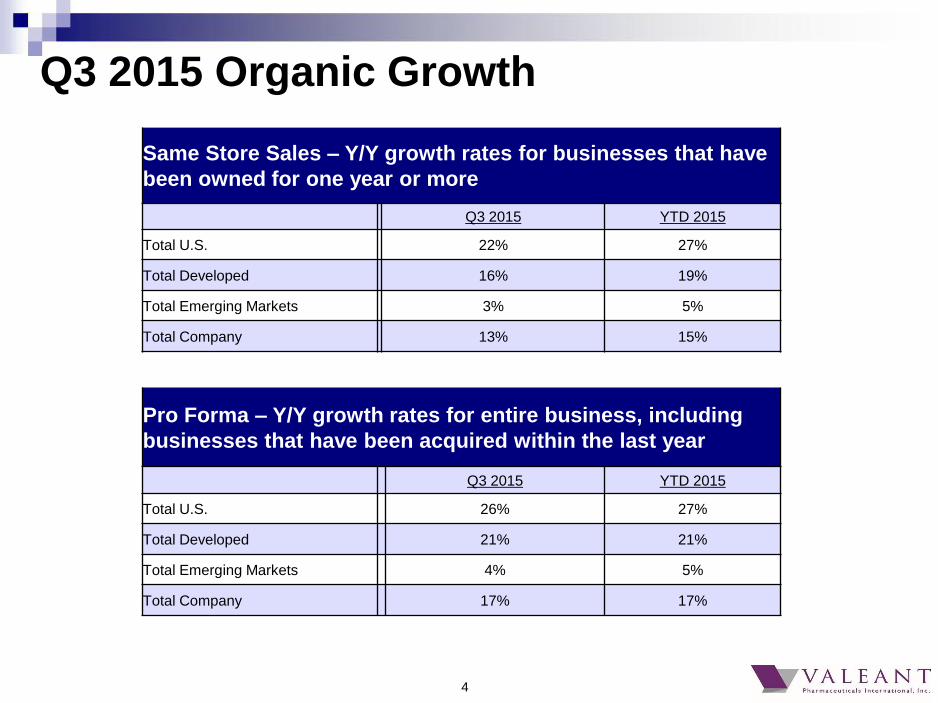
Same Store Sales – Y/Y growth rates for businesses that have
been owned for one year or more
Q3 2015 YTD 2015
Total U.S. 22% 27%
Total Developed 16% 19%
Total Emerging Markets 3% 5%
Total Company 13% 15%
Pro Forma – Y/Y growth rates for entire business, including
businesses that have been acquired within the last year
Q3 2015 YTD 2015
Total U.S. 26% 27%
Total Developed 21% 21%
Total Emerging Markets 4% 5%
Total Company 17% 17%
Q3 2015 Organic Growth

5
Product Q3
2014
Q4
2014
Q1
2015
Q2
2015
Q3
2015
1) Xifaxan - - - 148 220
2) Jublia 13 53 62 102 106
3) Wellbutrin XL* 80 82 68 67 92
4) SofLens* 95 89 81 84 84
5) Xenazine 56 52 57 66 73
6) Provenge - - 30 74 69
7) Solodyn 54 61 57 65 66
8) Ocuvite / Preservision* 62 62 60 59 57
9) ReNu* 59 60 53 59 54
10) Glumetza - - - 26 53
Q3 2015 Top 30 Brands (1/3) ($M)
• Sales depressed on 12 of top 30 products due to FX impact
Top 30 represent 54% of total company revenue
6
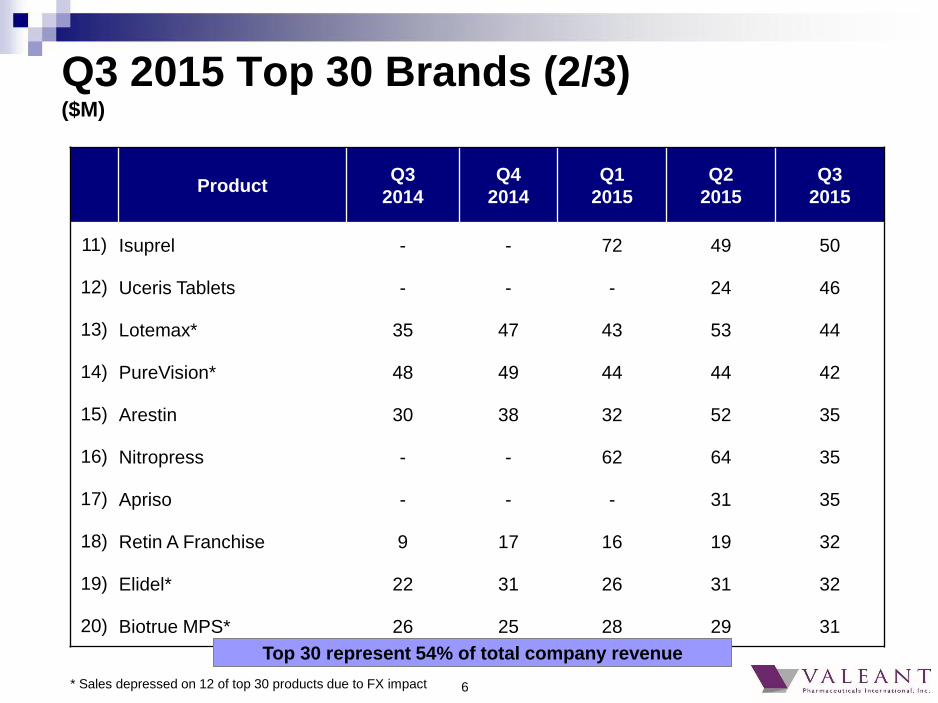
Product Q3
2014
Q4
2014
Q1
2015
Q2
2015
Q3
2015
11) Isuprel - - 72 49 50
12) Uceris Tablets - - - 24 46
13) Lotemax* 35 47 43 53 44
14) PureVision* 48 49 44 44 42
15) Arestin 30 38 32 52 35
16) Nitropress - - 62 64 35
17) Apriso - - - 31 35
18) Retin A Franchise 9 17 16 19 32
19) Elidel* 22 31 26 31 32
20) Biotrue MPS* 26 25 28 29 31
Q3 2015 Top 30 Brands (2/3) ($M)
Top 30 represent 54% of total company revenue
* Sales depressed on 12 of top 30 products due to FX impact
7
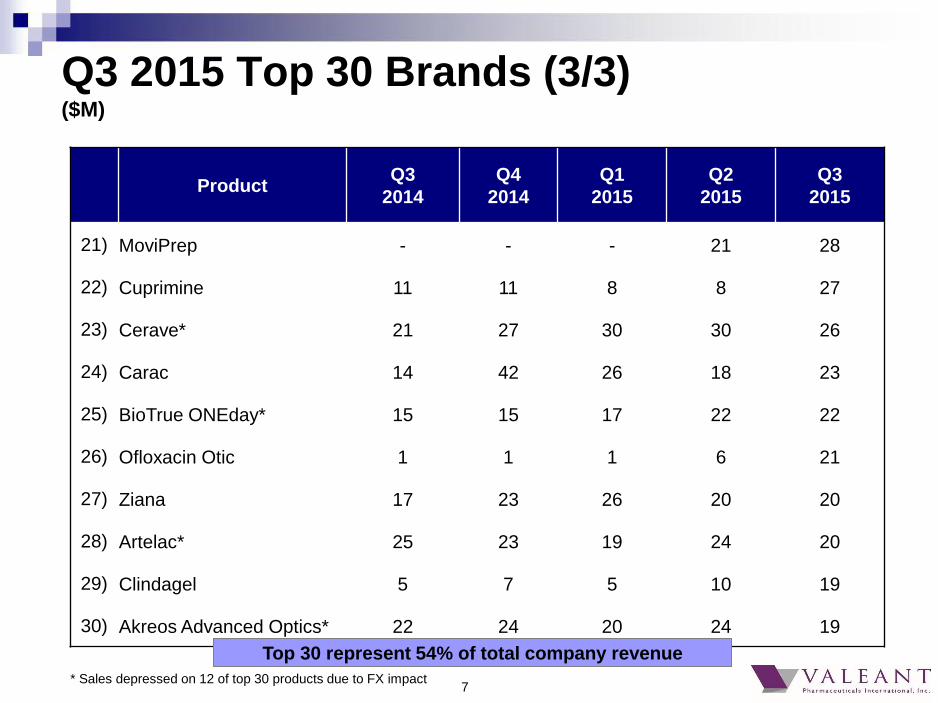
Product Q3
2014
Q4
2014
Q1
2015
Q2
2015
Q3
2015
21) MoviPrep - - - 21 28
22) Cuprimine 11 11 8 8 27
23) Cerave* 21 27 30 30 26
24) Carac 14 42 26 18 23
25) BioTrue ONEday* 15 15 17 22 22
26) Ofloxacin Otic 1 1 1 6 21
27) Ziana 17 23 26 20 20
28) Artelac* 25 23 19 24 20
29) Clindagel 5 7 5 10 19
30) Akreos Advanced Optics* 22 24 20 24 19
Q3 2015 Top 30 Brands (3/3) ($M)
Top 30 represent 54% of total company revenue
* Sales depressed on 12 of top 30 products due to FX impact
8
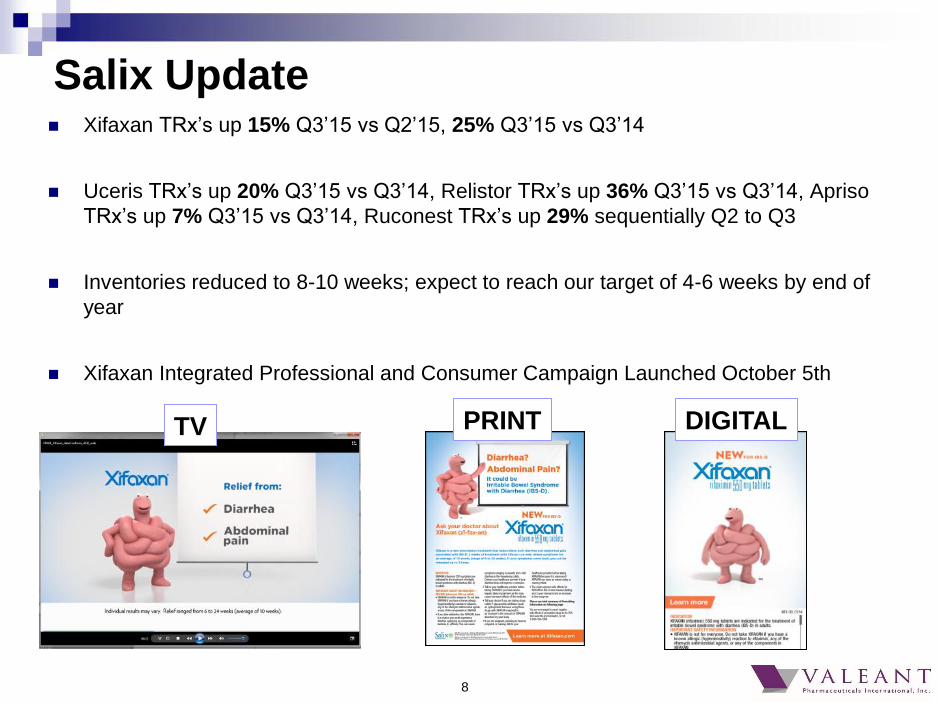
Xifaxan TRx’s up 15% Q3’15 vs Q2’15, 25% Q3’15 vs Q3’14
Uceris TRx’s up 20% Q3’15 vs Q3’14, Relistor TRx’s up 36% Q3’15 vs Q3’14, Apriso
TRx’s up 7% Q3’15 vs Q3’14, Ruconest TRx’s up 29% sequentially Q2 to Q3
Inventories reduced to 8-10 weeks; expect to reach our target of 4-6 weeks by end of
year
Xifaxan Integrated Professional and Consumer Campaign Launched October 5th
Salix Update
TV PRINT DIGITAL
9
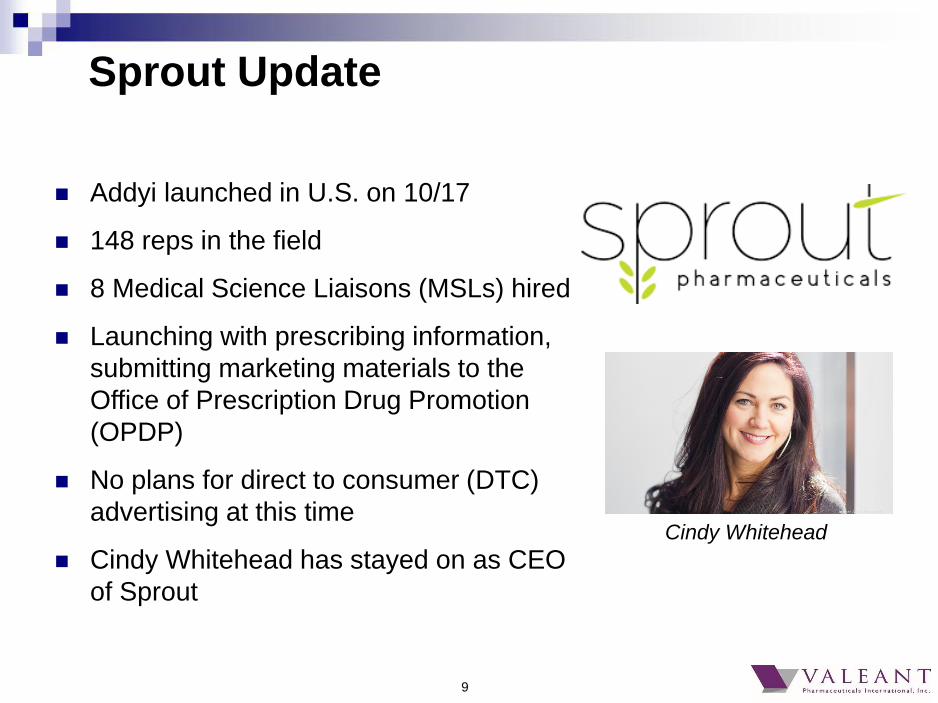
Sprout Update
Addyi launched in U.S. on 10/17
148 reps in the field
8 Medical Science Liaisons (MSLs) hired
Launching with prescribing information,
submitting marketing materials to the
Office of Prescription Drug Promotion
(OPDP)
No plans for direct to consumer (DTC)
advertising at this time
Cindy Whitehead has stayed on as CEO
of Sprout
Cindy Whitehead
10
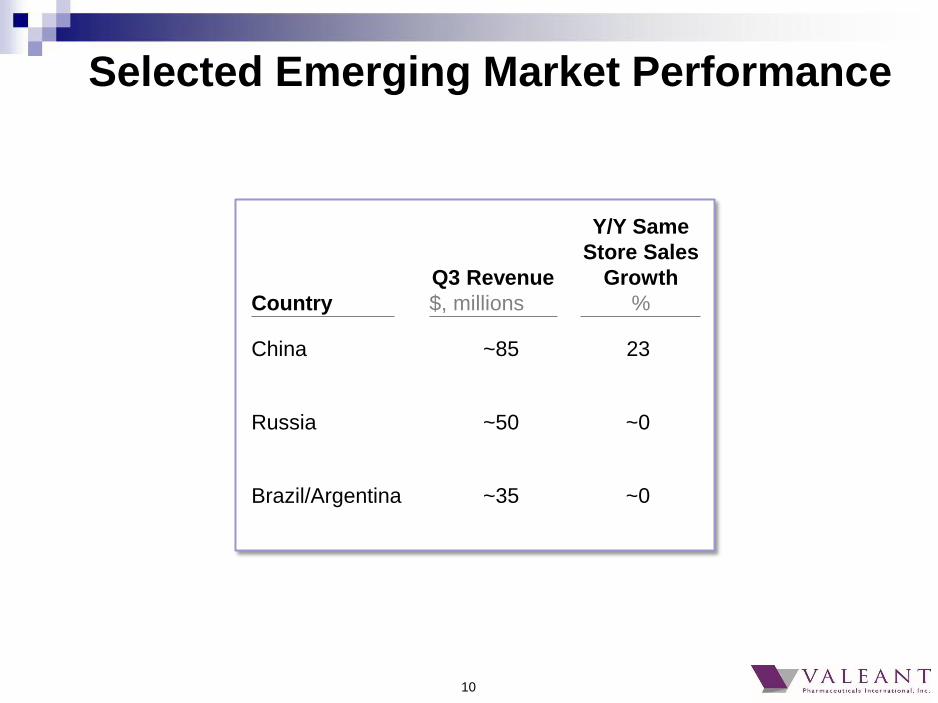
Selected Emerging Market Performance
Country
Q3 Revenue
$, millions
Y/Y Same
Store Sales
Growth
%
Brazil/Argentina ~35 ~0
Russia ~50 ~0
China ~85 23

11
China Continues to Outperform
Our China business is primarily a contact lens,
solutions, and OTC eye drop market – all consumer
pay
Our products are priced for the middle class
We have the leading market share position in contact
lenses (contact lens as a category is growing 3% and
we are gaining share by growing >20%)
~90% of products sold in China are manufactured
outside China
We are expanding our portfolio into aesthetics and
skin care

12
Q3 2014 Q4 2014 Q1 2015 Q2 2015 Q3 2015
Total Revenue $2,056M $2,280M $2,191M $2,732M $2,787
Cost of Goods Sold (% of product sales) 26% 24% 25% 23% 22%
SG&A (% of total revenue) 24% 23% 26% 25% 24%
R&D Expense $59M $59M $56M $81M $102M
Operating Margin (% of total revenue) (excluding amortization) 47% 50% 47% 49% 50%
Cash EPS (Reported) $2.11 $2.58 $2.36 $2.56 $2.74
GAAP Cash Flow from Operations $619M $816M $491M $411M $737M
Adjusted Cash Flow from Operations $771M $624M $708M $773M $865M
Fully Diluted Share Count 341M 342M 343M 351M 351M
Financial Summary

13
Cash Flow (Q1 2014 to Q3 2015)
*Q4 2014 included a one-time $287M gain from the sale of Allergan shares
2014 2015
Q1 Q2 Q3 Q4 Q1 Q2 Q3
GAAP cash flow from
operations
484 376 619 816* 491 411 737
Adjusted cash flow
from operations
636 500 771 624 708 773 865
Adjusted earnings 600 651 719 881 809 897 961
106% 107% Cash conversion 77% 71% 88% 86% 90%
14
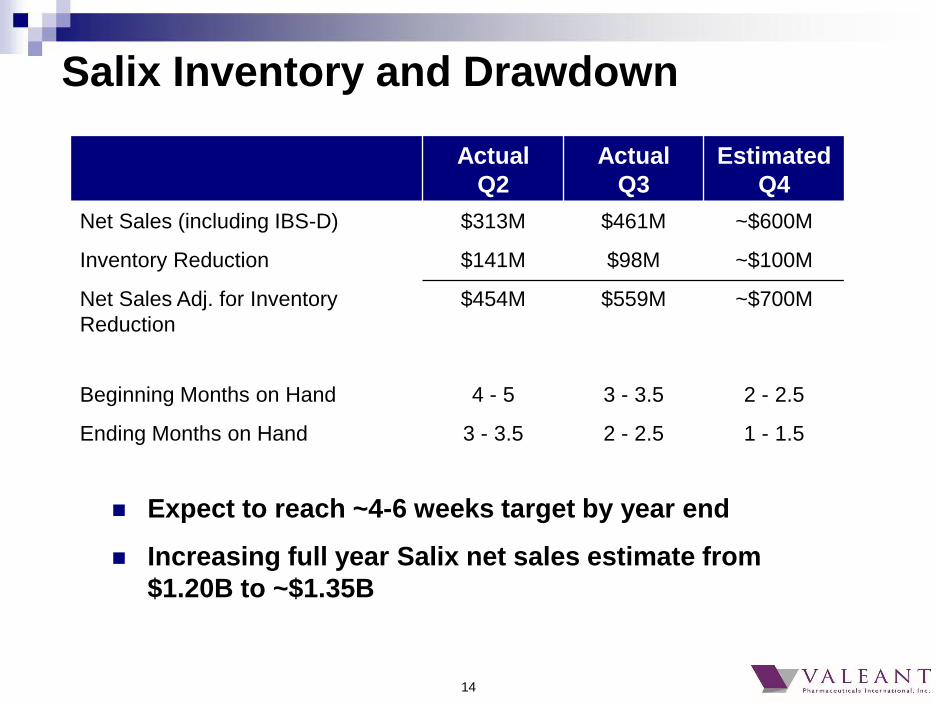
Expect to reach ~4-6 weeks target by year end
Increasing full year Salix net sales estimate from
$1.20B to ~$1.35B
Salix Inventory and Drawdown
Actual
Q2
Actual
Q3
Estimated
Q4
Net Sales (including IBS-D) $313M $461M ~$600M
Inventory Reduction $141M $98M ~$100M
Net Sales Adj. for Inventory
Reduction
$454M $559M ~$700M
Beginning Months on Hand 4 - 5 3 - 3.5 2 - 2.5
Ending Months on Hand 3 - 3.5 2 - 2.5 1 - 1.5
15
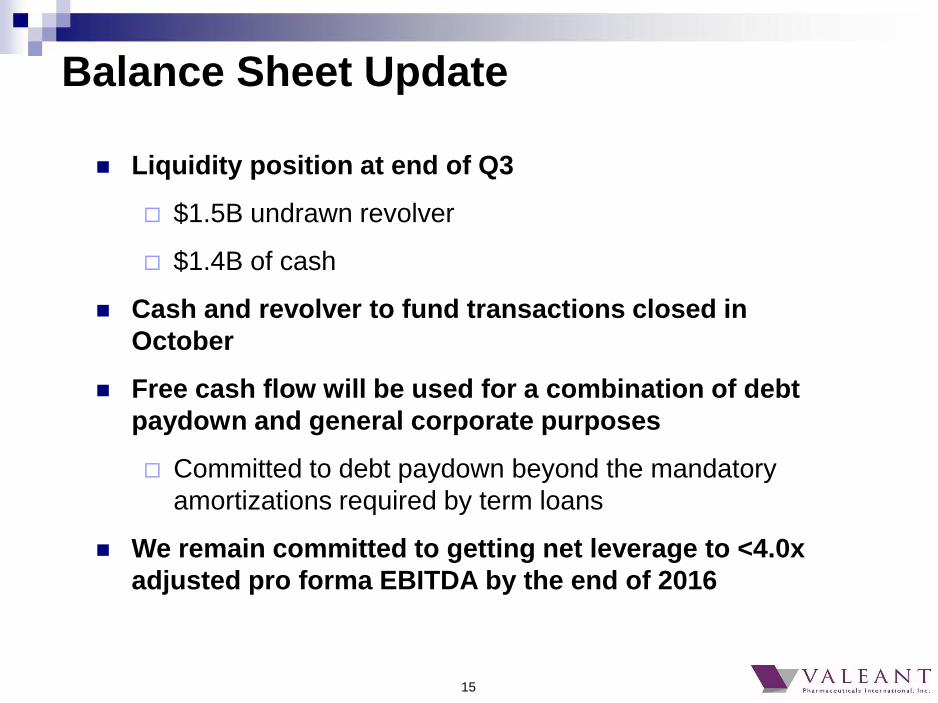
Liquidity position at end of Q3
$1.5B undrawn revolver
$1.4B of cash
Cash and revolver to fund transactions closed in
October
Free cash flow will be used for a combination of debt
paydown and general corporate purposes
Committed to debt paydown beyond the mandatory
amortizations required by term loans
We remain committed to getting net leverage to <4.0x
adjusted pro forma EBITDA by the end of 2016
Balance Sheet Update
16
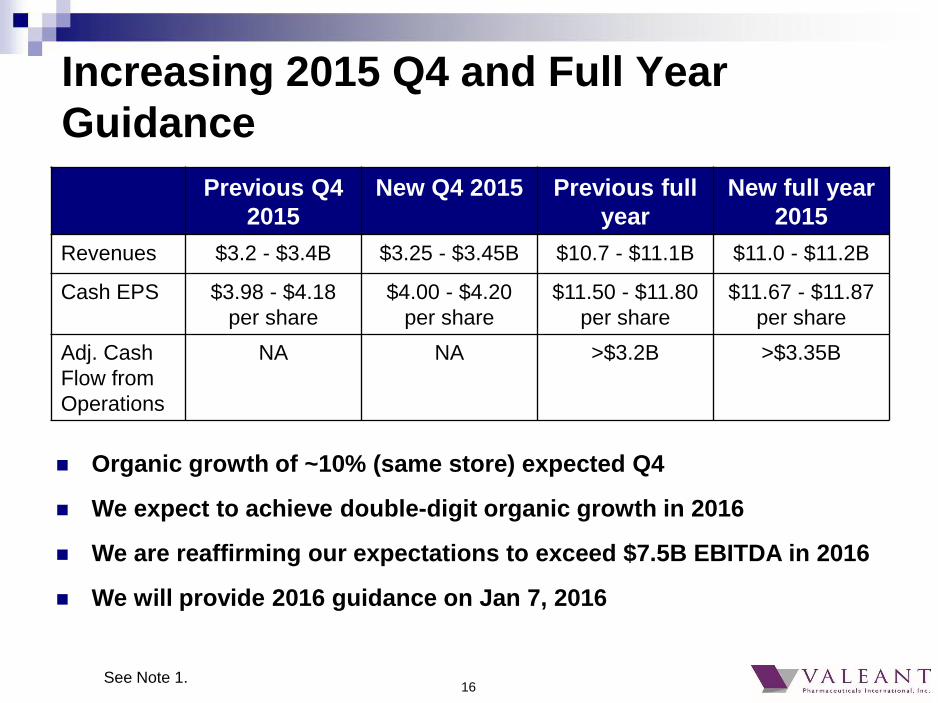
Increasing 2015 Q4 and Full Year
Guidance
Organic growth of ~10% (same store) expected Q4
We expect to achieve double-digit organic growth in 2016
We are reaffirming our expectations to exceed $7.5B EBITDA in 2016
We will provide 2016 guidance on Jan 7, 2016
Previous Q4
2015
New Q4 2015 Previous full
year
New full year
2015
Revenues $3.2 - $3.4B $3.25 - $3.45B $10.7 - $11.1B $11.0 - $11.2B
Cash EPS $3.98 - $4.18
per share
$4.00 - $4.20
per share
$11.50 - $11.80
per share
$11.67 - $11.87
per share
Adj. Cash
Flow from
Operations
NA NA >$3.2B >$3.35B
See Note 1.
17
Reflections on our Strategy (1/2) Our mission remains the same – we will always put patients and physicians first, while taking our
responsibility for our employees and the communities we work in very seriously
We will remain shareholder friendly – we know who our owners are, we listen to them, and work
hard for them every day
Our focus will remain on:
High growth markets: therapeutics areas and geographies
Durable assets
Concentrated specialist populations
Segments where physician education matters
Consumer pay/commercial insurance reimbursement
Remaining diversified where no one product or small set of products disproportionately impacts
our earnings
As our portfolio has shifted over time to newer, higher growth assets, pricing will become a less
important part of our growth
Given the evolution of our product mix, it is likely that we will pursue far fewer, if any, transactions
that are focused on mispriced products
Our Neuro & Other segment is comprised of more than 50 products -- primarily tail assets from
acquisitions. Because we expect Neuro & Other will represent only ~10% of our business going
forward, it is not core to our business or strategy and we have considered and are considering a
spinoff/sale of the entire segment
18
Reflections on our Strategy (2/2)
Due to our success in R&D – especially in the areas of dermatology, contact
lenses, surgical, and OTC products – internal R&D will become more of an
area of focus
If our stock price remains at current levels, share repurchases will be seriously
considered
Our strategy will remain agile and flexible in response to an ever-changing
world
19
Questions from Investors
1. How much of Valeant’s organic growth comes from price vs.
volume (looking back and looking forward)?
2. What is your approach to U.S. drug distribution?
3. How does Valeant work with specialty pharmacies and what is
Valeant’s relationship with Philidor?
4. Why did Valeant’s General Counsel send a letter inquiring
about the $69M owed to Valeant by R&O pharmacy?
5. How does Valeant ensure patients have access to its products?
6. What is the status of recent government inquiries and how do
you manage compliance, legal, and regulatory matters?

20
1. How much of Valeant’s organic growth comes
from price vs. volume (looking back and looking
forward)?
21
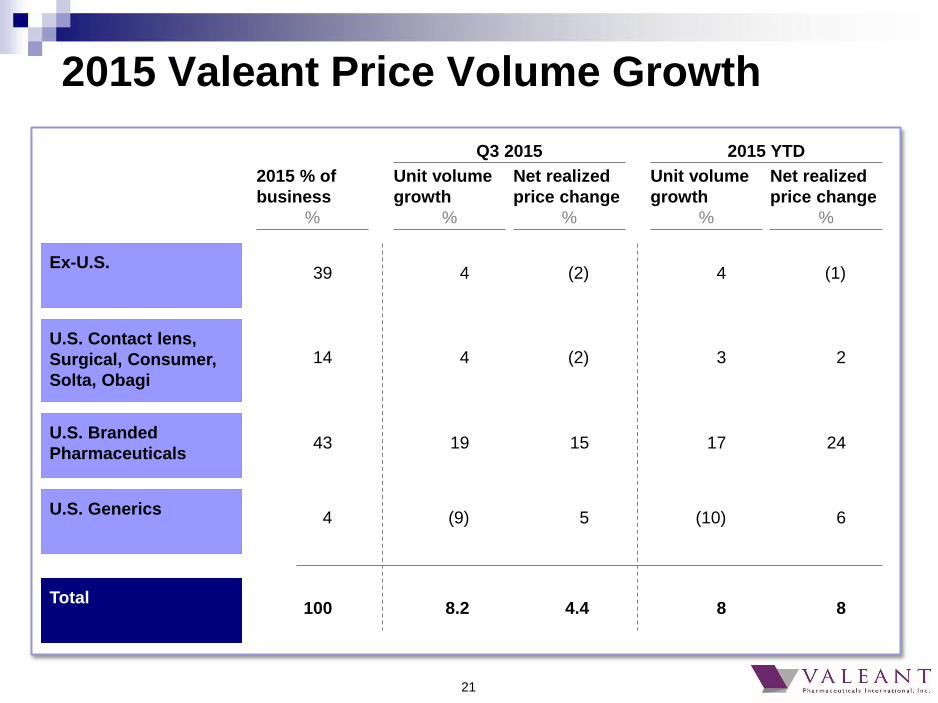
2015 Valeant Price Volume Growth
Ex-U.S.
U.S. Branded
Pharmaceuticals
U.S. Contact lens,
Surgical, Consumer,
Solta, Obagi
Total
U.S. Generics
Unit volume
growth
%
Net realized
price change
%
2015 YTD
4 (1)
17 24
3 2
8 8
(10) 6
2015 % of
business
%
39
43
14
100
4
Unit volume
growth
%
Net realized
price change
%
Q3 2015
4 (2)
19 15
4 (2)
8.2 4.4
(9) 5

22
Price Volume for U.S. Branded Rx
Portfolio Over Time
2014 2015 YTD 2015 Q3
Organic growth 20% 41% 34%
From net realized
price
12% 24% 15%
From Rx volume 8% 17% 19%
23
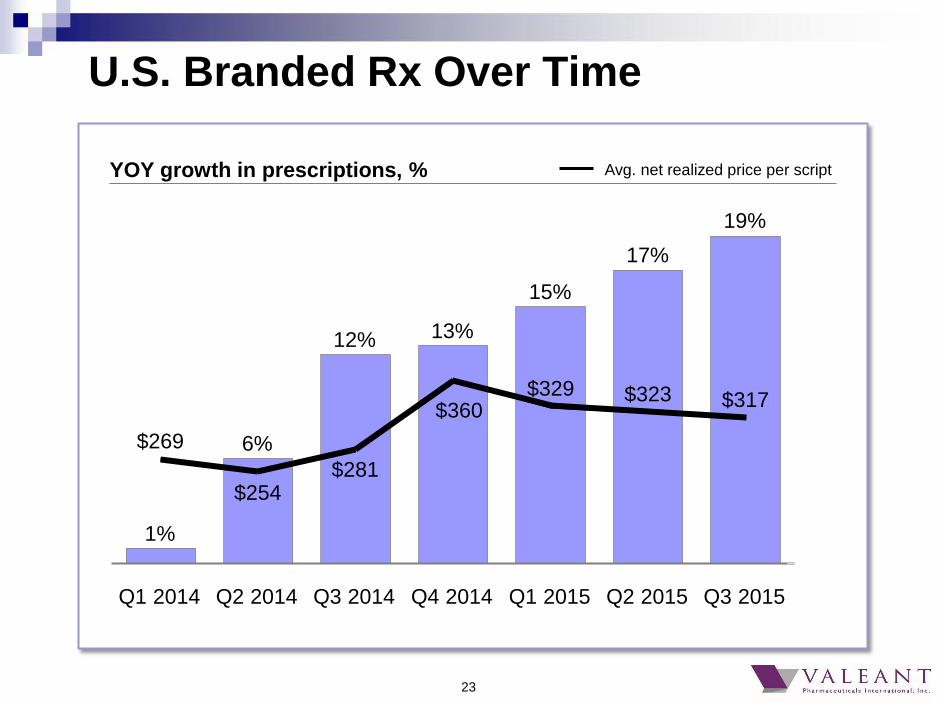
U.S. Branded Rx Over Time
YOY growth in prescriptions, %
19%
Q2 2015
17%
Q1 2015
15%
$329
13%
$360
Q3 2015
$323 $317
Q4 2014
$281
6%
Q1 2014
$254
Q3 2014
$269
Q2 2014
1%
12%
Avg. net realized price per script
24
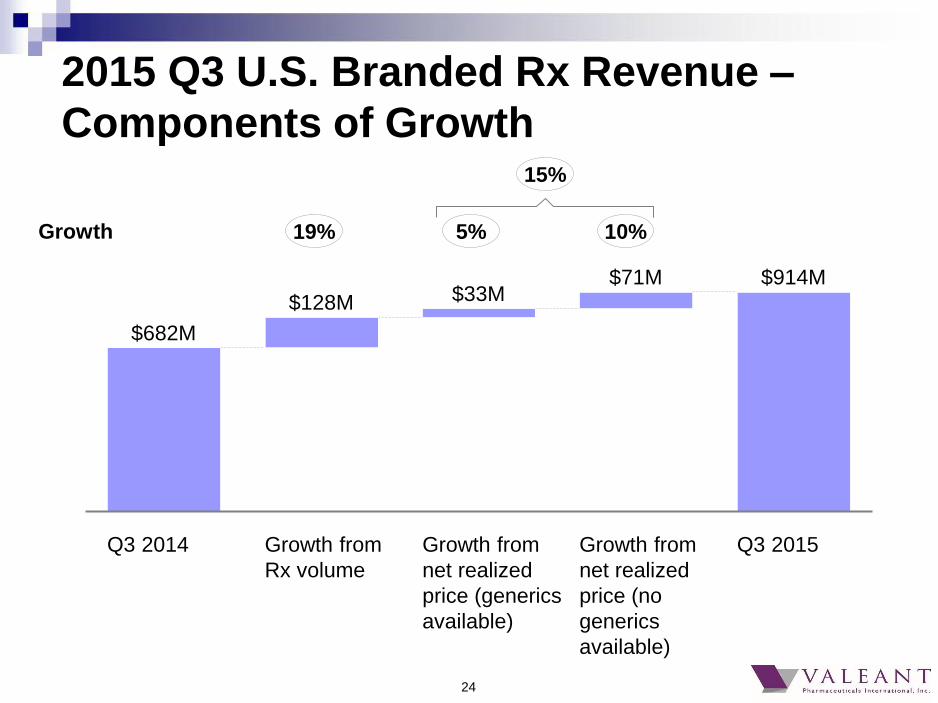
2015 Q3 U.S. Branded Rx Revenue –
Components of Growth
$128M
$914M
Growth from
net realized
price (generics
available)
Q3 2015 Growth from
net realized
price (no
generics
available)
Growth from
Rx volume
Q3 2014
$33M $71M
$682M
19% 5% 10% Growth
15%

25
2015 YTD Price Actions for Top 10 U.S.
Dermatology Products
Gross
pricing
action
%
Net realized
price
%
Jublia® 19.8 1 2.1 Solodyn® 9.9 2 0.7
Targretin® Caps 0.0 10 0.0
Elidel® 9.9 3 3.2 Ziana® 9.9 4 2.5 Acanya® 9.0 5 2.4 Onexton® 9.0 6 2.3 Zyclara® 15.0 7 1.7 RAM .08® 19.3 8 2.2 Atralin® 61.0 9 0.8
Revenue from these products represents ~62% of
our U.S. Dermatology business
Note: Reflects all price actions since January 1, 2015
Weighted average 14.0 1.7
26
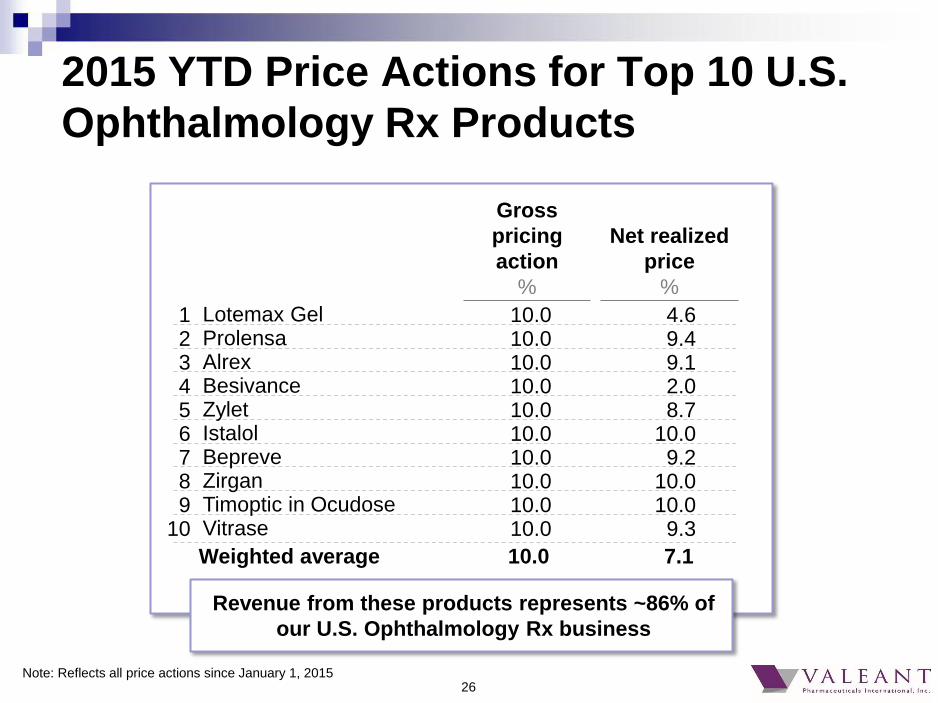
2015 YTD Price Actions for Top 10 U.S.
Ophthalmology Rx Products
Gross
pricing
action
%
Net realized
price
%
10.0 1 4.6 10.0 2 9.4
10.0 10 9.3
10.0 3 9.1 10.0 4 2.0 10.0 5 8.7 10.0 6 10.0 10.0 7 9.2 10.0 8 10.0 10.0 9 10.0
Lotemax Gel
Prolensa
Alrex
Besivance
Zylet
Istalol
Bepreve
Zirgan
Timoptic in Ocudose
Vitrase
Note: Reflects all price actions since January 1, 2015
Weighted average 10.0 7.1
Revenue from these products represents ~86% of
our U.S. Ophthalmology Rx business

27
Price/Volume for Neuro & Other
YTD Volume decline (7)%
YTD Net realized price 30%
% of Neuro revenue with
generic alternatives in
market
61%
% of 2016 U.S. business ~10%
28
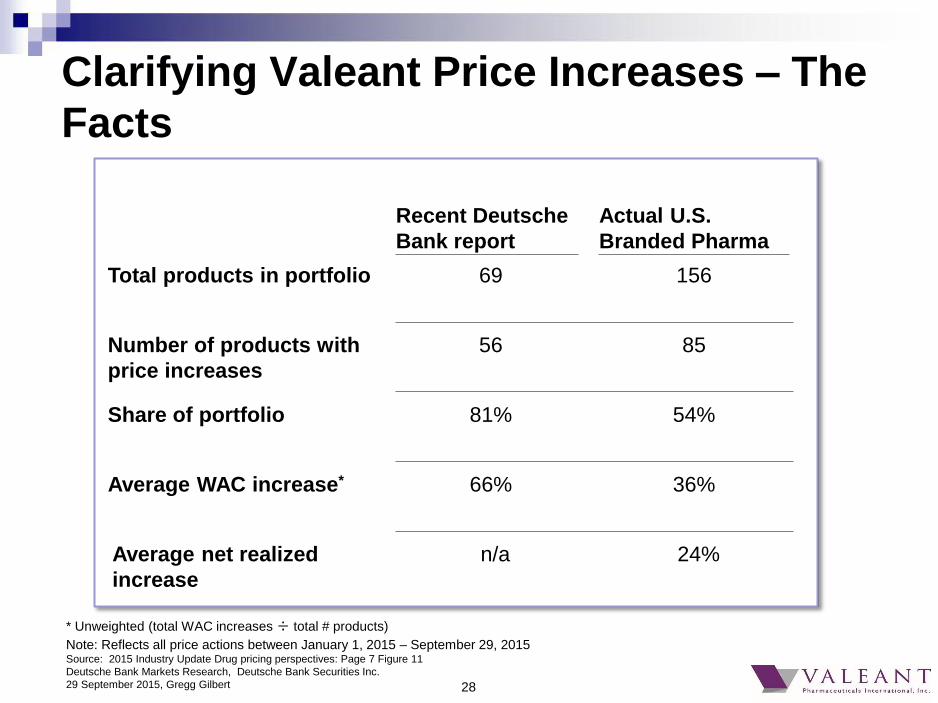
Clarifying Valeant Price Increases – The
Facts
Recent Deutsche
Bank report
Actual U.S.
Branded Pharma
* Unweighted (total WAC increases ÷ total # products)
56 Number of products with
price increases
85
Share of portfolio
81% 54%
Total products in portfolio
69 156
66% Average WAC increase*
36%
n/a Average net realized
increase
24%
Note: Reflects all price actions between January 1, 2015 – September 29, 2015 Source: 2015 Industry Update Drug pricing perspectives: Page 7 Figure 11
Deutsche Bank Markets Research, Deutsche Bank Securities Inc.
29 September 2015, Gregg Gilbert
29
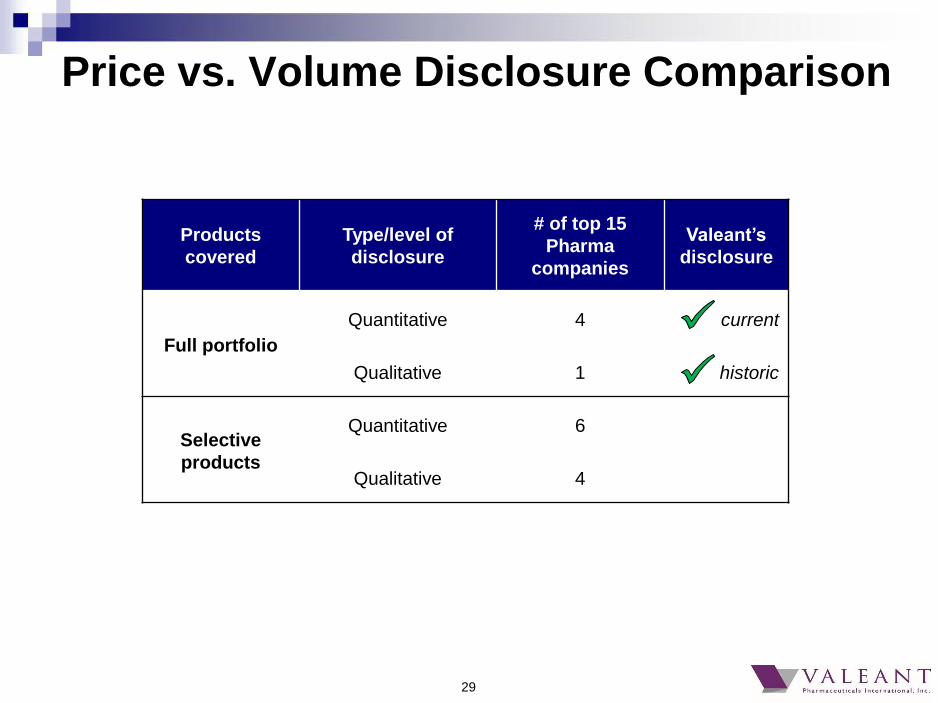
Price vs. Volume Disclosure Comparison
Products
covered
Type/level of
disclosure
# of top 15
Pharma
companies
Valeant’s
disclosure
Full portfolio
Quantitative 4 current
Qualitative 1 historic
Selective
products
Quantitative 6
Qualitative 4
30
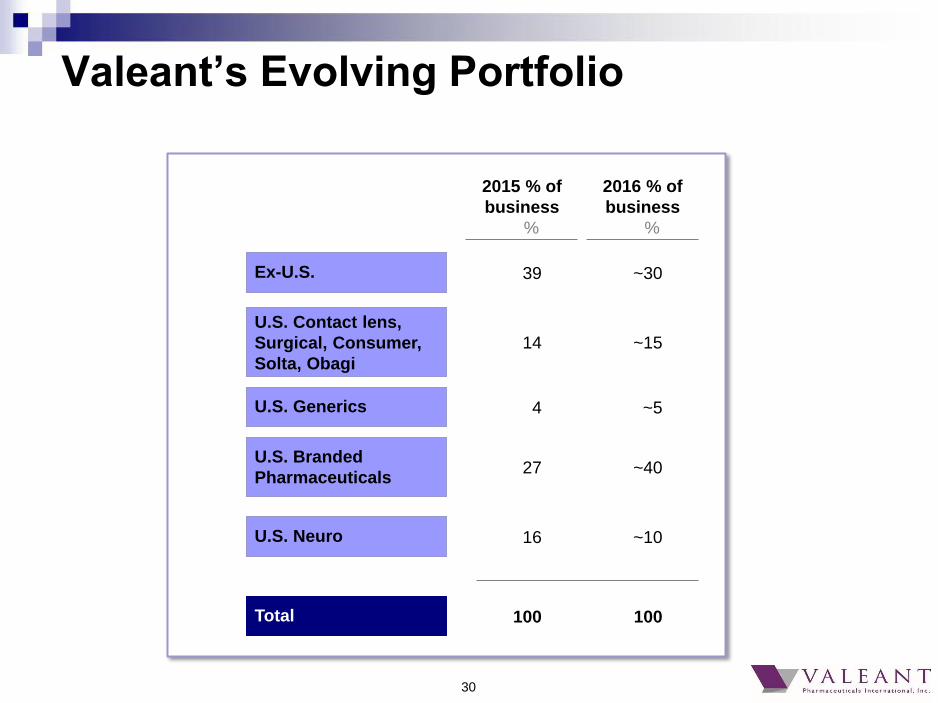
Valeant’s Evolving Portfolio
2015 % of
business
%
2016 % of
business
%
Ex-U.S. 39 ~30
U.S. Branded
Pharmaceuticals 27 ~40
U.S. Contact lens,
Surgical, Consumer,
Solta, Obagi
14 ~15
Total 100 100
U.S. Generics 4 ~5
U.S. Neuro 16 ~10

31
2. What is your approach to U.S. drug distribution?
32
Valeant’s U.S. Drug Distribution Strategy
Our drugs are available to all patients
Over 90% of our U.S. pharmaceutical products are
available through the big 3 distributors
Our distribution is not designed to restrict access to
our products

33
3. How does Valeant work with specialty
pharmacies and what is Valeant’s relationship
with Philidor?
34
Specialty Pharmacy (1/2)
We have viewed our relationship with Philidor and our other specialty
pharmacies as proprietary and as one of our competitive advantages
Similar to many pharmaceutical companies in the U.S., an increasing
percentage of our revenue is coming from products dispensed through multiple
specialty pharmacies
We find specialty pharmacies improve patients’ access to medicines at an
affordable price and help ensure physicians are able to prescribe the
medications they believe most appropriate for their patients
In almost all cases, our inventory with specialty pharmacies and the title for our
medicines only transfer to the pharmacy when the actual prescription is filled –
this significantly reduces our distribution fees and product returns. Less than
5% of our U.S. channel inventory sits in the specialty pharmacy channel
Philidor, one of our specialty pharmacy partners, provides prescription services
to patients across the country, and provides administrative services for our co-
pay cards and is a dispensary that fills prescriptions. We have a contractual
relationship with Philidor and late last year we purchased an option to acquire
Philidor
35
Specialty Pharmacy (2/2)
Based on a VIE (variable interest entity) assessment in accordance with ASC
810, we consolidate the financials of Philidor. Inventory held at Philidor
remains on Valeant’s books and is not included in the specialty pharmacy
channel inventory
For many of our dermatology products, many of our specialty pharmacies,
including Philidor, dispense Valeant medications before adjudication of the
reimbursement may be finalized. Patients get their medicines more quickly
and Valeant takes the risk for non-reimbursement
We understand that Philidor:
Provides services under our programs for commercially insured and cash-
paying claims only. Any claim that would be reimbursed in whole or in part by
government insurance is not eligible for our co-pay subsidy programs
Does not restrict prescriptions it fills to any particular manufacturers
(including Valeant)
Dispenses generic products as specified in patient’s prescription or as
requested by patient

36
4. Why did Valeant’s General Counsel send a
letter inquiring about the $69M owed to Valeant
by R&O pharmacy?
37
Why did Valeant Send a Letter to R&O
Pharmacy?
R&O is in one of the specialty pharmacies in our network
Valeant shipped approximately $69 million at WAC,
approximately $25 million in net revenue to Valeant
R&O sold a substantial amount of Valeant product. Any
products R&O dispensed to patients were recognized as our
revenues and are reflected in our receivables. Any products
still held by R&O are reflected in our inventory
R&O is improperly holding significant amounts it received from
payers
38
5. How does Valeant ensure patients have access
to its products?
39
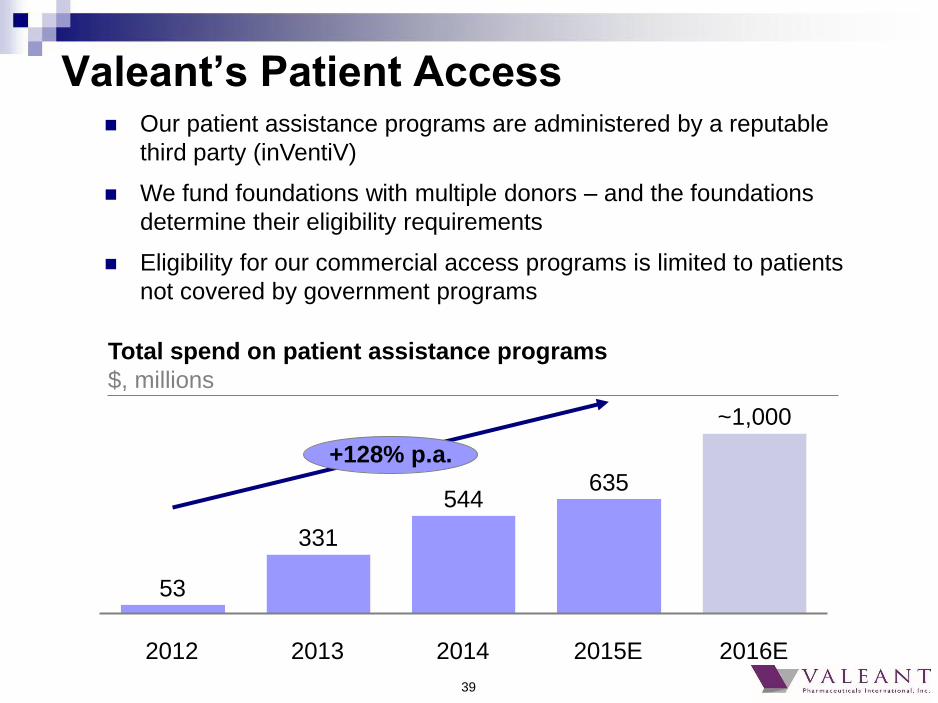
Valeant’s Patient Access
2014
544
2013
~1,000
+128% p.a.
2015E
635
2012
331
53
2016E
Total spend on patient assistance programs
$, millions
Our patient assistance programs are administered by a reputable
third party (inVentiV)
We fund foundations with multiple donors – and the foundations
determine their eligibility requirements
Eligibility for our commercial access programs is limited to patients
not covered by government programs
40
6. What is the status of recent government inquiries
and how do you manage compliance, legal, and
regulatory matters?
41
Recent Government Inquiries
On October 14, 2015, we responded to a letter from Senator
Claire McCaskill (Democrat-Missouri)
The letter addressed the history of Nitropress and Isuprel, the
reimbursement process for hospital procedures involving
Nitropress and Isuprel, the analysis and reasons underlying
Valeant's pricing decisions, and Valeant's programs designed to
improve patient access, among other topics
We are beginning outreach to hospitals where the impact of a
price change was significantly greater than the average
We received a subpoena from the U.S. Attorney's Office for the
District of Massachusetts and a subpoena from the U.S.
Attorney's Office for the Southern District of New York
We intend to cooperate with the investigations
42
Approach to Compliance & Legal
Valeant’s compliance program is consistent with Office of the Inspector General’s
(OIG) guidance on the operation of an effective compliance program
Recently concluded 5-year Corporate Integrity Agreement, which required that we
have (1) written policies and procedures and systems in place consistent with OIG
guidance on the operation of an effective compliance program, (2) significant
training related to these policies and procedures and all applicable laws, (3) a
functioning compliance committee and appropriate oversight of our compliance
function, (4) an annual audit by an independent review organization to review our
systems, policies and procedures as well as our transfers of value to healthcare
providers and sample and sales call activity
We filed 5 annual reports with OIG which included the reports of the Independent
Review Organization (Navigant). Our fifth and final report was filed in early 2015
In connection with the B+L acquisition, we assumed compliance commitments made
to the Department of Justice for the B+L business
Includes requirements to effectively maintain a compliance program consistent
with the OIG Guidance on an Effective Compliance Program
Requires that we certify compliance annually to the Department of Justice, which
has been made.
Valeant
Pharmaceuticals
International, Inc.
Q3 2015 Financial Results
October 19, 2015