Embed Size (px)
Citation preview
We are building a modern fuel and energy group
Q3, Q1-Q3 2015
Warsaw, 17 November 2015
2
Agenda
Energy market and key operating data
Enea CG's financial results in Q3 and Q1-Q3 2015
Acquisition of LW Bogdanka
Update of Strategy for 2015-2020
New unit in Kozienice Power Plant
Market and regulatory conditions are subject to dynamic changes
Energy market and key operating data
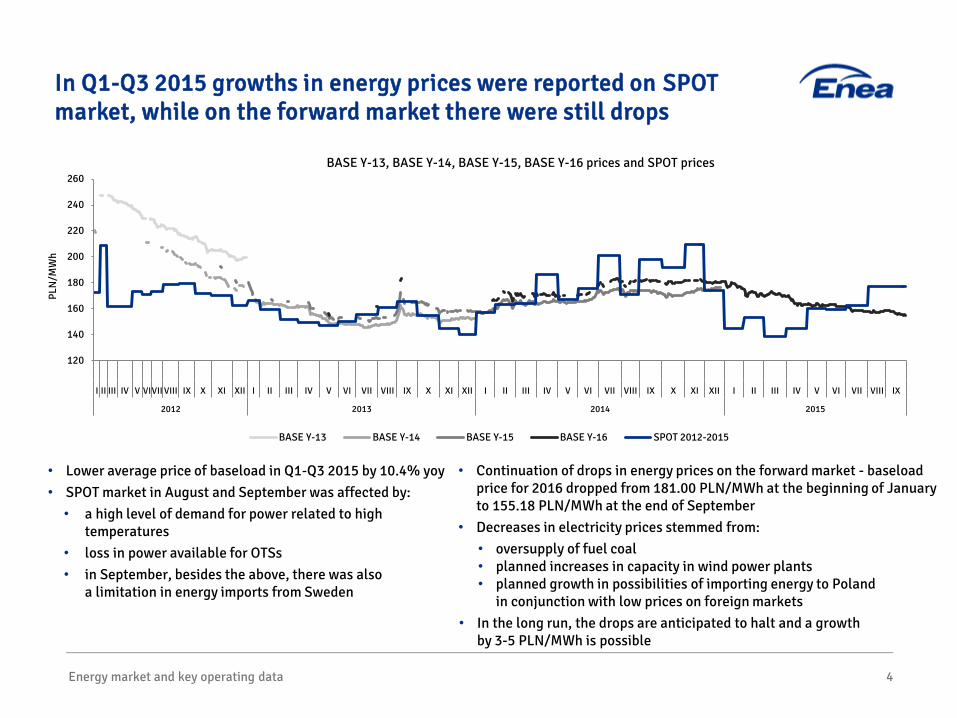
• Lower average price of baseload in Q1-Q3 2015 by 10.4% yoy• SPOT market in August and September was affected by:• a high level of demand for power related to high
temperatures• loss in power available for OTSs • in September, besides the above, there was also
a limitation in energy imports from Sweden
In Q1-Q3 2015 growths in energy prices were reported on SPOT market, while on the forward market there were still drops
4
• Continuation of drops in energy prices on the forward market - baseload price for 2016 dropped from 181.00 PLN/MWh at the beginning of January to 155.18 PLN/MWh at the end of September
• Decreases in electricity prices stemmed from:• oversupply of fuel coal• planned increases in capacity in wind power plants• planned growth in possibilities of importing energy to Poland
in conjunction with low prices on foreign markets• In the long run, the drops are anticipated to halt and a growth
by 3-5 PLN/MWh is possible
BASE Y-13, BASE Y-14, BASE Y-15, BASE Y-16 prices and SPOT prices
PLN
/MW
h
120
140
160
180
200
220
240
260
I II III IV V VIVII VIII IX X XI XII I II III IV V VI VII VIII IX X XI XII I II III IV V VI VII VIII IX X XI XII I II III IV V VI VII VIII IX
2012 2013 2014 2015
BASE Y-13 BASE Y-14 BASE Y-15 BASE Y-16 SPOT 2012-2015
Energy market and key operating data 5
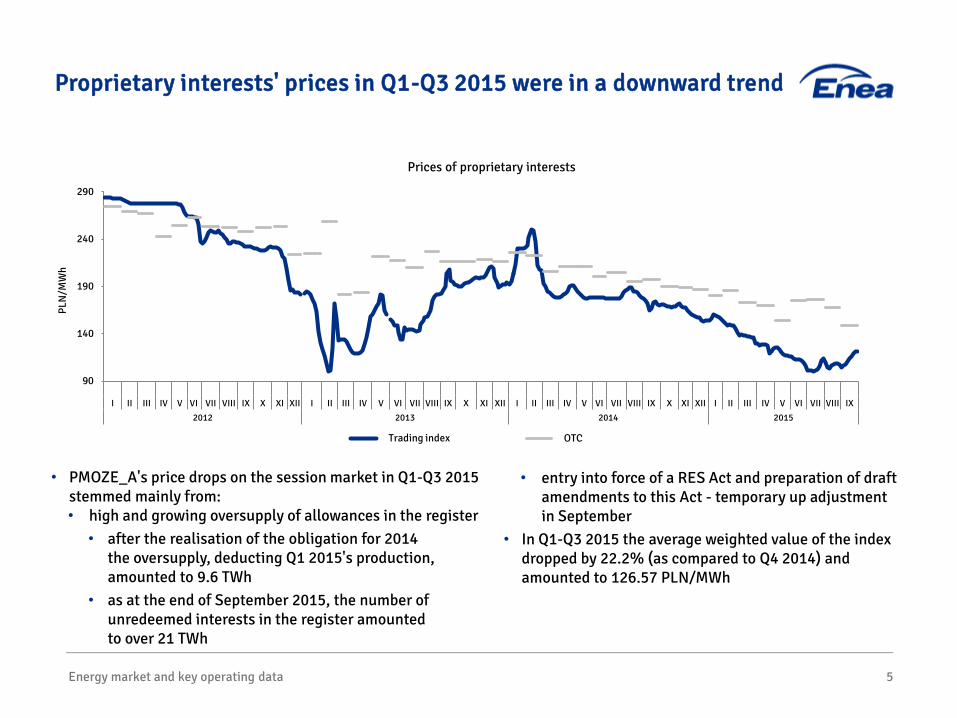
Proprietary interests' prices in Q1-Q3 2015 were in a downward trend
• PMOZE_A's price drops on the session market in Q1-Q3 2015 stemmed mainly from:• high and growing oversupply of allowances in the register
• after the realisation of the obligation for 2014 the oversupply, deducting Q1 2015's production, amounted to 9.6 TWh
• as at the end of September 2015, the number of unredeemed interests in the register amounted to over 21 TWh
• entry into force of a RES Act and preparation of draft amendments to this Act - temporary up adjustment in September
• In Q1-Q3 2015 the average weighted value of the index dropped by 22.2% (as compared to Q4 2014) and amounted to 126.57 PLN/MWh
Prices of proprietary interests
90
140
190
240
290
I II III IV V VI VII VIII IX X XI XII I II III IV V VI VII VIII IX X XI XII I II III IV V VI VII VIII IX X XI XII I II III IV V VI VII VIII IX
2012 2013 2014 2015
PLN
/MW
h
Indeks sesyjny OTCTrading index OTC
Energy market and key operating data
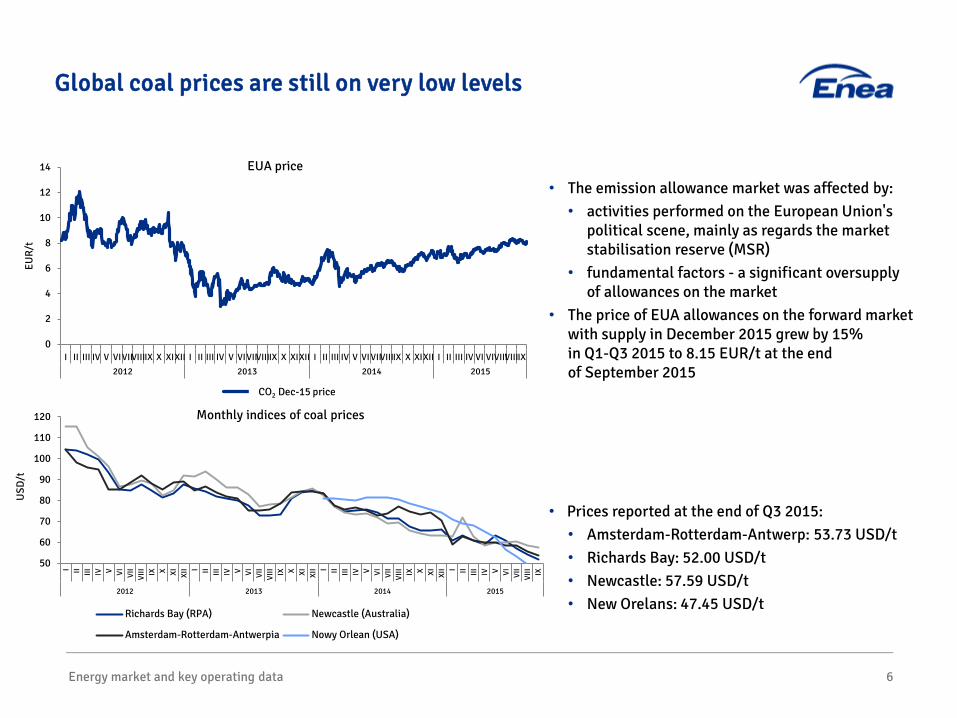
• The emission allowance market was affected by: • activities performed on the European Union's
political scene, mainly as regards the market stabilisation reserve (MSR)
• fundamental factors - a significant oversupply of allowances on the market
• The price of EUA allowances on the forward market with supply in December 2015 grew by 15% in Q1-Q3 2015 to 8.15 EUR/t at the end of September 2015
• Prices reported at the end of Q3 2015: • Amsterdam-Rotterdam-Antwerp: 53.73 USD/t• Richards Bay: 52.00 USD/t• Newcastle: 57.59 USD/t• New Orelans: 47.45 USD/t
Global coal prices are still on very low levels
6
0
2
4
6
8
10
12
14
I II III IV V VIVII VIIIIX X XIXII I II III IV V VIVIIVIIIIX X XIXII I II III IV V VI VIIVIIIIX X XIXII I II III IV VI VIVIIIVIIIIX
2012 2013 2014 2015
EUR/
t
EUA price
Cena CO2 gru-15
50
60
70
80
90
100
110
120
I II III IV V VI VII
VIII IX X XI XII I II III IV V VI VII
VIII IX X XI XII I II III IV V VI VII
VIII IX X XI XII I II III IV V VI VII
VIII IX
2012 2013 2014 2015
USD
/t
Monthly indices of coal prices
Richards Bay (RPA) Newcastle (Australia)
Amsterdam-Rotterdam-Antwerpia Nowy Orlean (USA)
CO2 Dec-15 price
Energy market and key operating data 7
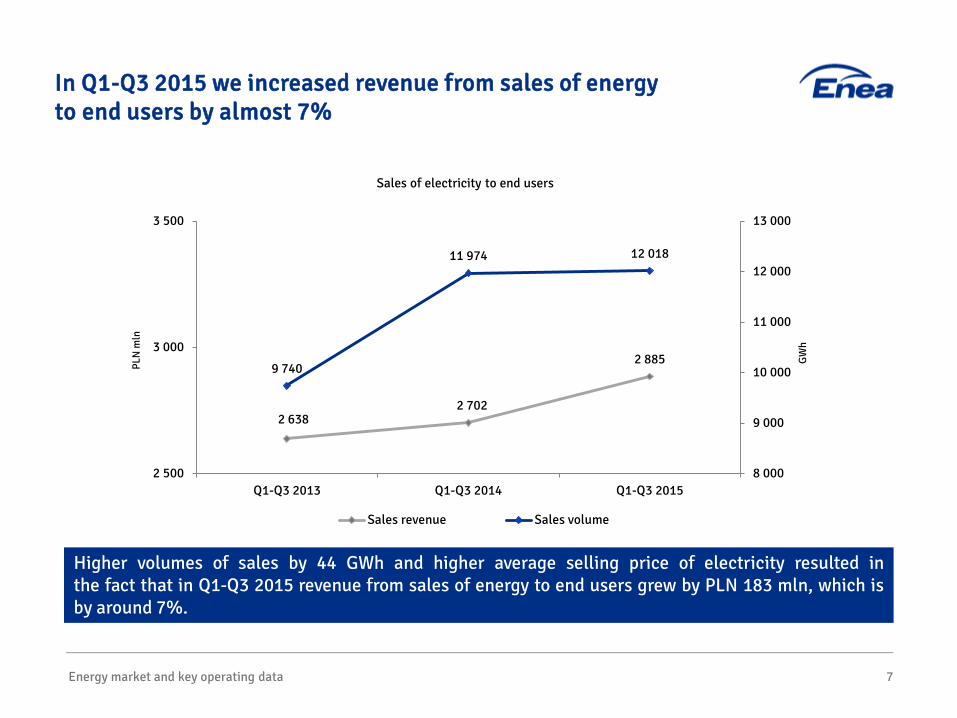
In Q1-Q3 2015 we increased revenue from sales of energy to end users by almost 7%
Higher volumes of sales by 44 GWh and higher average selling price of electricity resulted inthe fact that in Q1-Q3 2015 revenue from sales of energy to end users grew by PLN 183 mln, which isby around 7%.
Sales of electricity to end users
2 6382 702
2 8859 740
11 974 12 018
8 000
9 000
10 000
11 000
12 000
13 000
2 500
3 000
3 500
Q1-Q3 2013 Q1-Q3 2014 Q1-Q3 2015
PLN
mln
GW
h
Sales revenue Sales volume
8
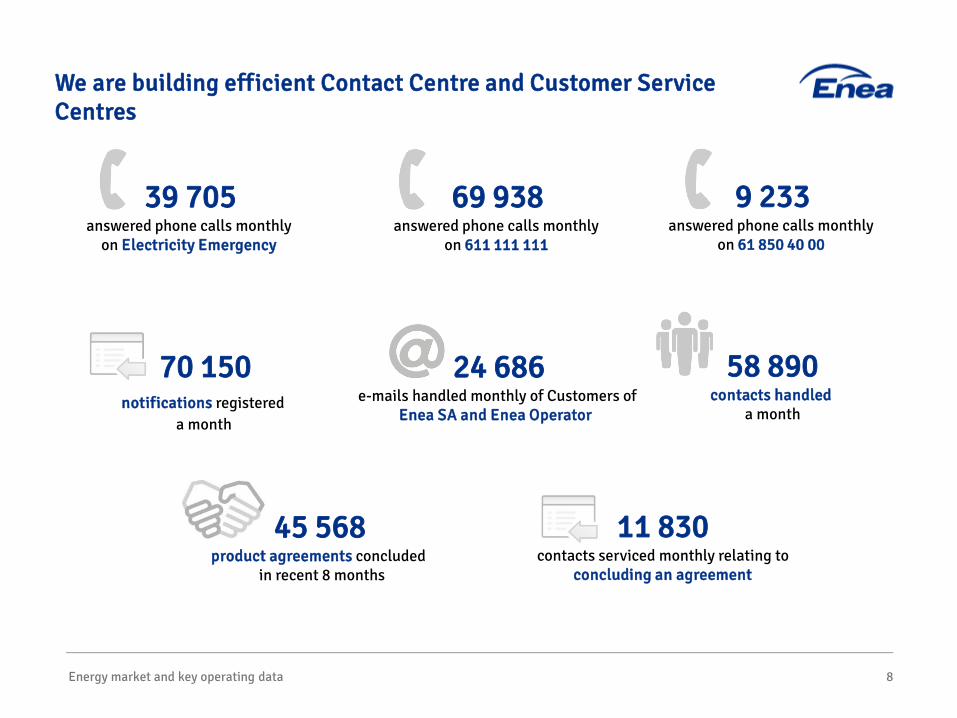
We are building efficient Contact Centre and Customer Service Centres
Energy market and key operating data
9 233answered phone calls monthly
on 61 850 40 00
69 938answered phone calls monthly
on 611 111 111
39 705answered phone calls monthly
on Electricity Emergency
70 150notifications registered
a month
24 686e-mails handled monthly of Customers of
Enea SA and Enea Operator
45 568product agreements concluded
in recent 8 months
58 890contacts handled
a month
11 830contacts serviced monthly relating to
concluding an agreement
9
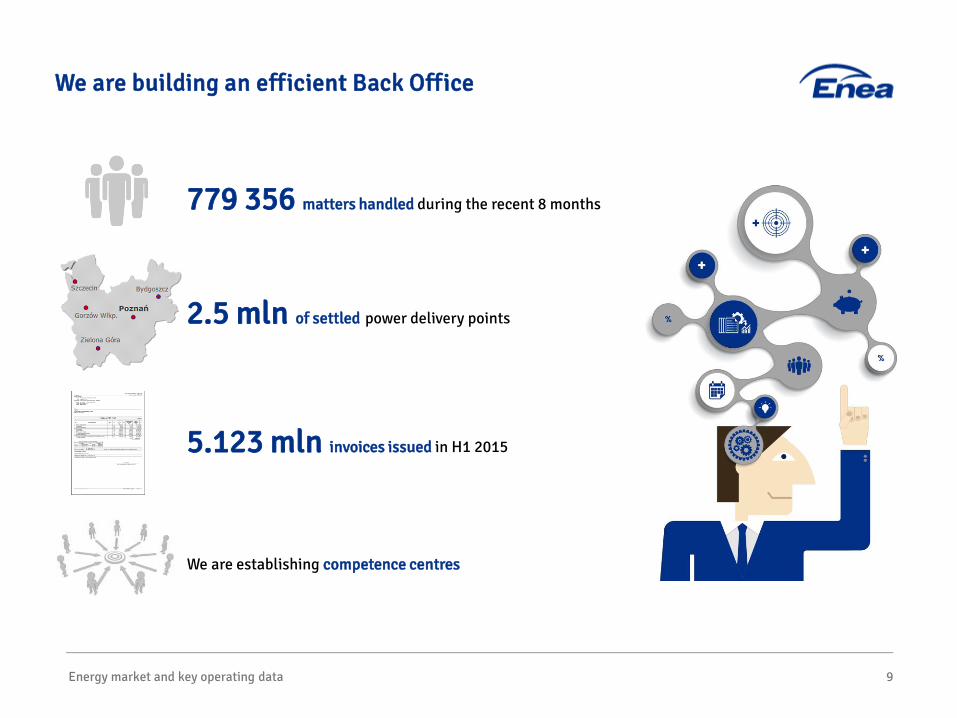
We are building an efficient Back Office
Energy market and key operating data
779 356 matters handled during the recent 8 months
We are establishing competence centres
2.5 mln of settled power delivery points
5.123 mln invoices issued in H1 2015
10
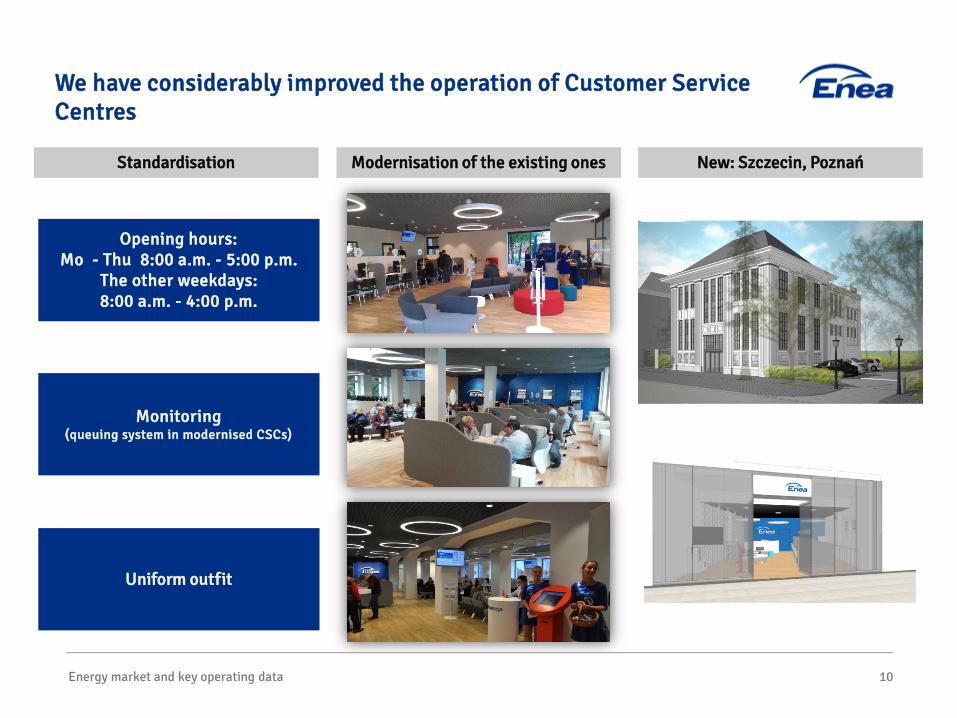
We have considerably improved the operation of Customer Service Centres
Energy market and key operating data
Modernisation of the existing onesStandardisation New: Szczecin, Poznań
Opening hours:Mo - Thu 8:00 a.m. - 5:00 p.m.
The other weekdays:8:00 a.m. - 4:00 p.m.
Monitoring (queuing system in modernised CSCs)
Uniform outfit
Energy market and key operating data 11
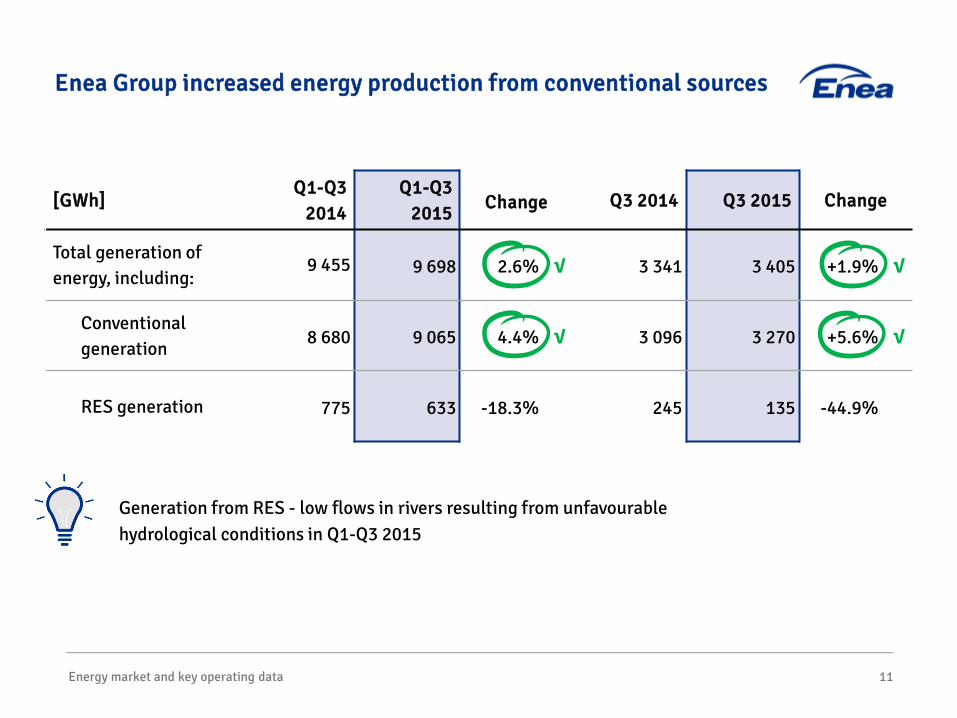
Enea Group increased energy production from conventional sources
[GWh]Q1-Q3
2014Q1-Q3
2015 Change Q3 2014 Q3 2015 Change
Total generation of energy, including:
9 455 9 698 2.6% √ 3 341 3 405 +1.9% √
Conventional generation
8 680 9 065 4.4% √ 3 096 3 270 +5.6% √
RES generation 775 633 -18.3% 245 135 -44.9%
Generation from RES - low flows in rivers resulting from unfavourable hydrological conditions in Q1-Q3 2015
12
Agenda
Energy market and key operating data
Enea CG's financial results in Q3 and Q1-Q3 2015
Acquisition of LW Bogdanka
Update of Strategy for 2015-2020
New unit in Kozienice Power Plant
Good financial results testify that Enea Group is developing in the right direction
[PLN mln] Q3 2014 Q3 2015 ChangeQ1-Q3
2014Q1-Q3
2015 Change
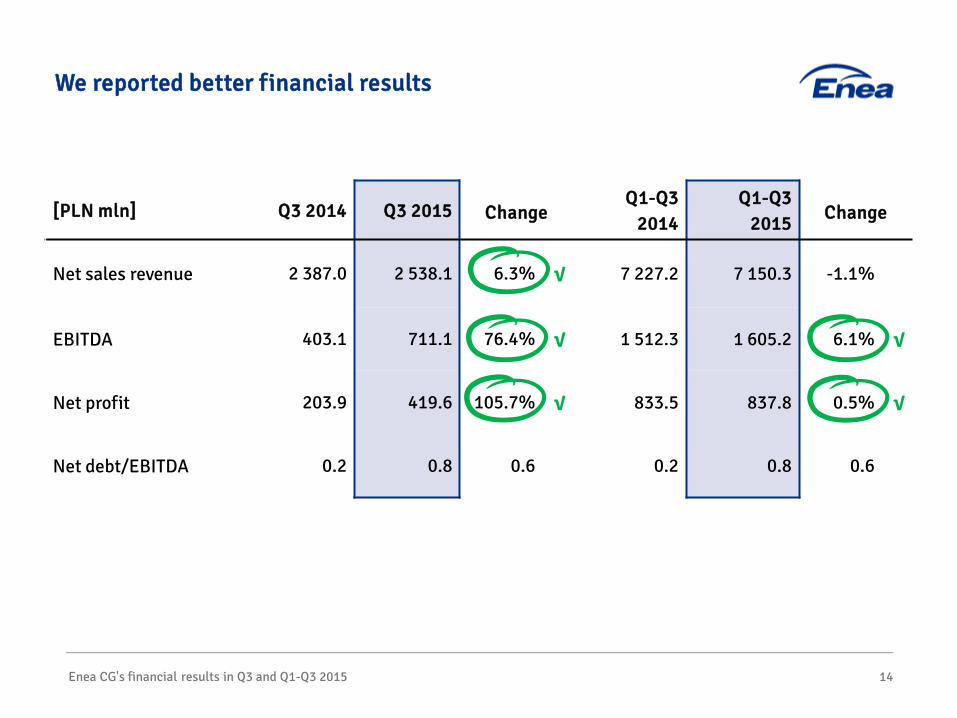
Net sales revenue 2 387.0 2 538.1 6.3% √ 7 227.2 7 150.3 -1.1%
EBITDA 403.1 711.1 76.4% √ 1 512.3 1 605.2 6.1% √
Net profit 203.9 419.6 105.7% √ 833.5 837.8 0.5% √
Net debt/EBITDA 0.2 0.8 0.6 0.2 0.8 0.6
Enea CG's financial results in Q3 and Q1-Q3 2015 14
We reported better financial results
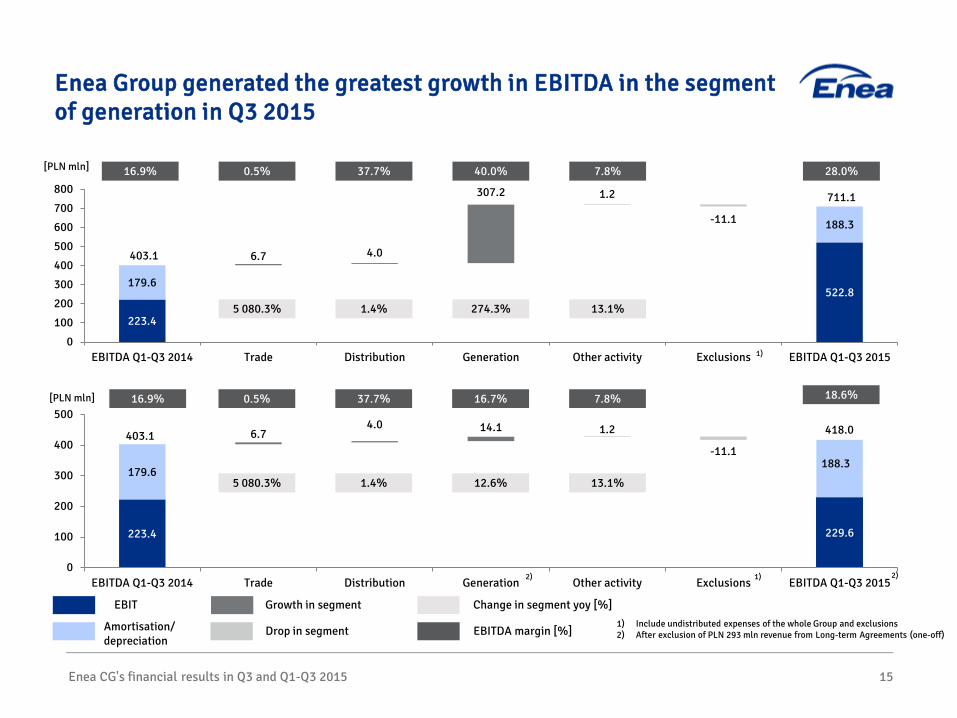
223.4 229.6
179.6188.3
6.74.0 14.1 1.2
-11.1
0
100
200
300
400
500
EBITDA Q1-Q3 2014 Trade Distribution Generation Other activity Exclusions EBITDA Q1-Q3 2015
[PLN mln] 16.9% 37.7% 16.7% 7.8% 18.6%0.5%
5 080.3% 1.4% 12.6% 13.1%
403.1 418.0
1)
Enea CG's financial results in Q3 and Q1-Q3 2015 15
Enea Group generated the greatest growth in EBITDA in the segment of generation in Q3 2015
EBIT Growth in segment Change in segment yoy [%]
Amortisation/depreciation
Drop in segment EBITDA margin [%]1) Include undistributed expenses of the whole Group and exclusions 2) After exclusion of PLN 293 mln revenue from Long-term Agreements (one-off)
223.4
522.8179.6
188.3
6.7 4.0
307.2 1.2
-11.1
0
100
200
300
400
500
600
700
800
EBITDA Q1-Q3 2014 Trade Distribution Generation Other activity Exclusions EBITDA Q1-Q3 2015
16.9% 37.7% 40.0% 7.8% 28.0%0.5%
5 080.3% 1.4% 274.3% 13.1%
403.1
711.1
[PLN mln]
1)
2) 2)
Enea CG's financial results in Q3 and Q1-Q3 2015
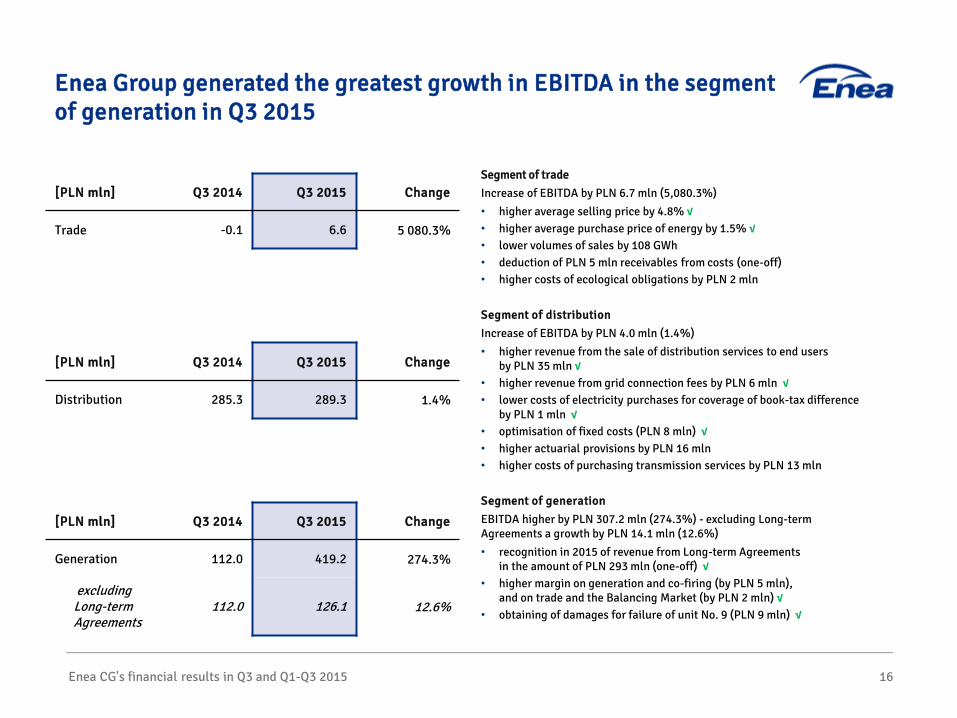
Segment of tradeIncrease of EBITDA by PLN 6.7 mln (5,080.3%)• higher average selling price by 4.8% √• higher average purchase price of energy by 1.5% √• lower volumes of sales by 108 GWh • deduction of PLN 5 mln receivables from costs (one-off)• higher costs of ecological obligations by PLN 2 mln
Segment of distributionIncrease of EBITDA by PLN 4.0 mln (1.4%)• higher revenue from the sale of distribution services to end users
by PLN 35 mln √• higher revenue from grid connection fees by PLN 6 mln √
• lower costs of electricity purchases for coverage of book-tax difference by PLN 1 mln √
• optimisation of fixed costs (PLN 8 mln) √• higher actuarial provisions by PLN 16 mln• higher costs of purchasing transmission services by PLN 13 mln
Segment of generationEBITDA higher by PLN 307.2 mln (274.3%) - excluding Long-term Agreements a growth by PLN 14.1 mln (12.6%)• recognition in 2015 of revenue from Long-term Agreements
in the amount of PLN 293 mln (one-off) å higher margin on generation and co-firing (by PLN 5 mln),
and on trade and the Balancing Market (by PLN 2 mln) √• obtaining of damages for failure of unit No. 9 (PLN 9 mln) √
16
Enea Group generated the greatest growth in EBITDA in the segment of generation in Q3 2015
[PLN mln] Q3 2014 Q3 2015 Change
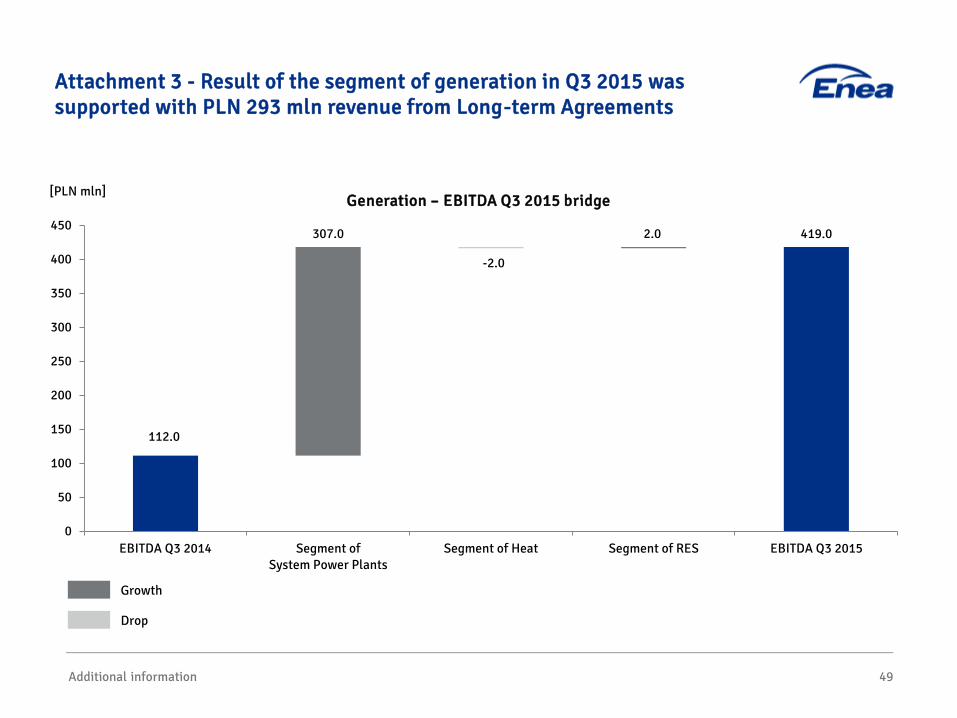
Generation 112.0 419.2 274.3%
excluding Long-term Agreements
112.0 126.1 12.6%
[PLN mln] Q3 2014 Q3 2015 Change
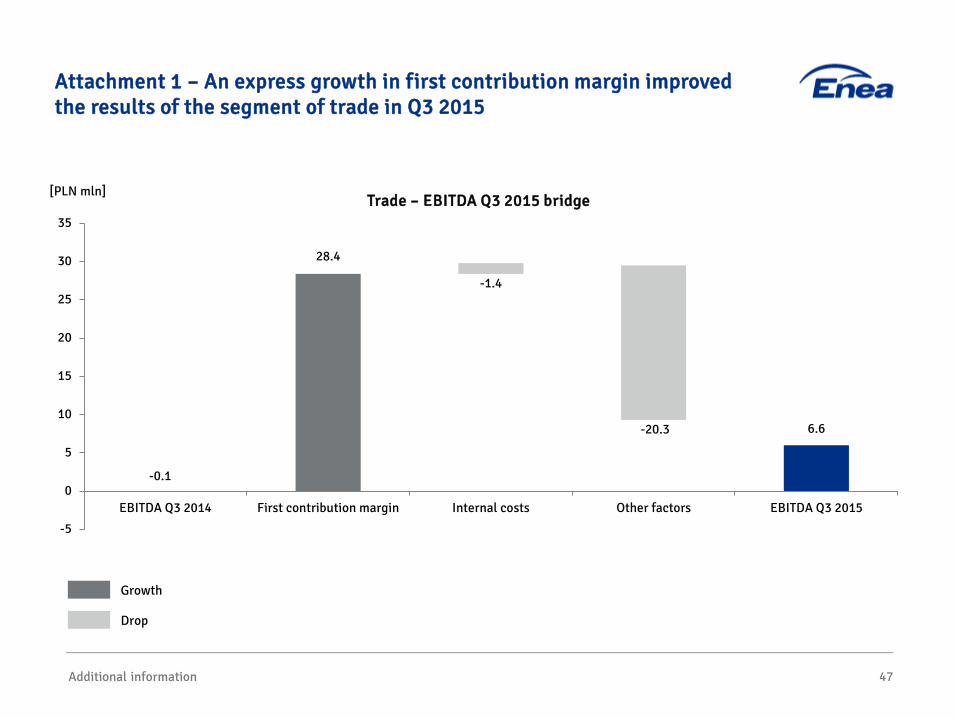
Trade -0.1 6.6 5 080.3%
[PLN mln] Q3 2014 Q3 2015 Change
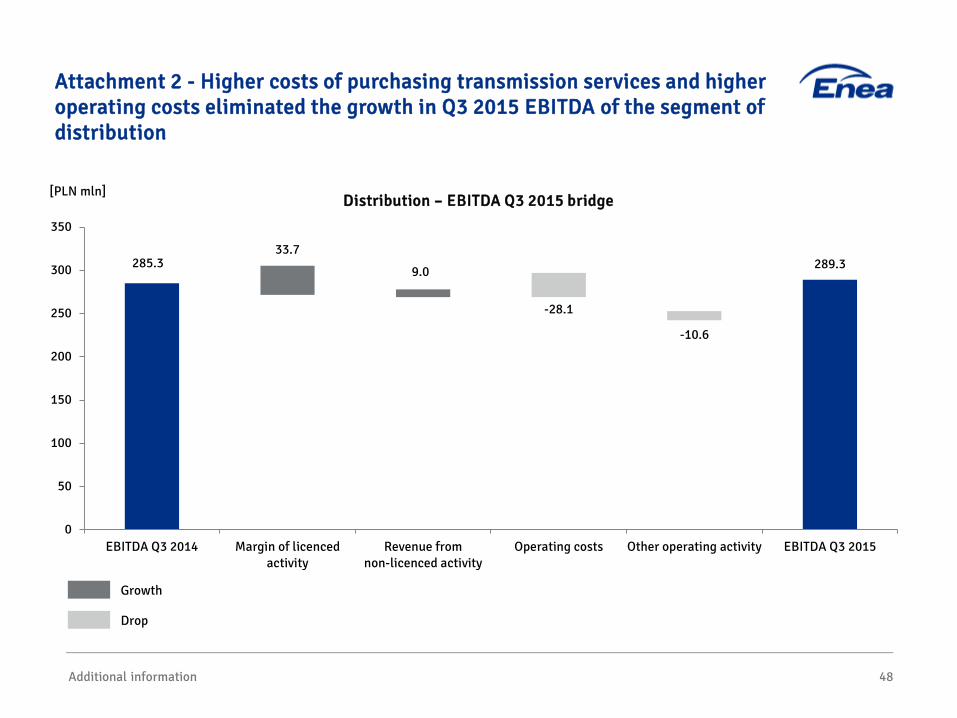
Distribution 285.3 289.3 1.4%
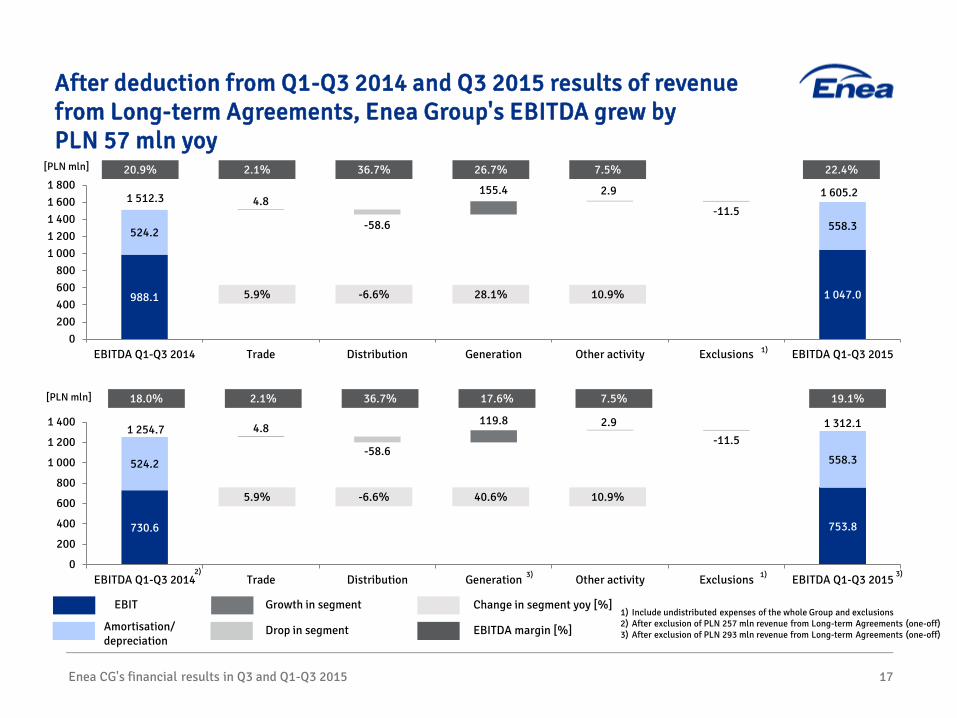
730.6 753.8
524.2 558.3
4.8119.8 2.9
-58.6-11.5
0
200
400
600
800
1 000
1 200
1 400
EBITDA Q1-Q3 2014 Trade Distribution Generation Other activity Exclusions EBITDA Q1-Q3 2015
Enea CG's financial results in Q3 and Q1-Q3 2015 17
After deduction from Q1-Q3 2014 and Q3 2015 results of revenue from Long-term Agreements, Enea Group's EBITDA grew by PLN 57 mln yoy
EBIT Growth in segment Change in segment yoy [%]
Amortisation/depreciation
Drop in segment EBITDA margin [%]
1)
1) Include undistributed expenses of the whole Group and exclusions 2) After exclusion of PLN 257 mln revenue from Long-term Agreements (one-off)3) After exclusion of PLN 293 mln revenue from Long-term Agreements (one-off)
18.0% 36.7% 17.6% 7.5% 19.1%2.1%
5.9% -6.6% 40.6% 10.9%
1 254.7 1 312.1
[PLN mln]
988.1 1 047.0
524.2 558.3
4.8155.4 2.9
-58.6-11.5
0200400600800
1 0001 2001 4001 6001 800
EBITDA Q1-Q3 2014 Trade Distribution Generation Other activity Exclusions EBITDA Q1-Q3 2015
20.9% 36.7% 26.7% 7.5% 22.4%2.1%
5.9% -6.6% 28.1% 10.9%
1 512.3 1 605.2
1)
[PLN mln]
2) 3) 3)
Enea CG's financial results in Q3 and Q1-Q3 2015 18
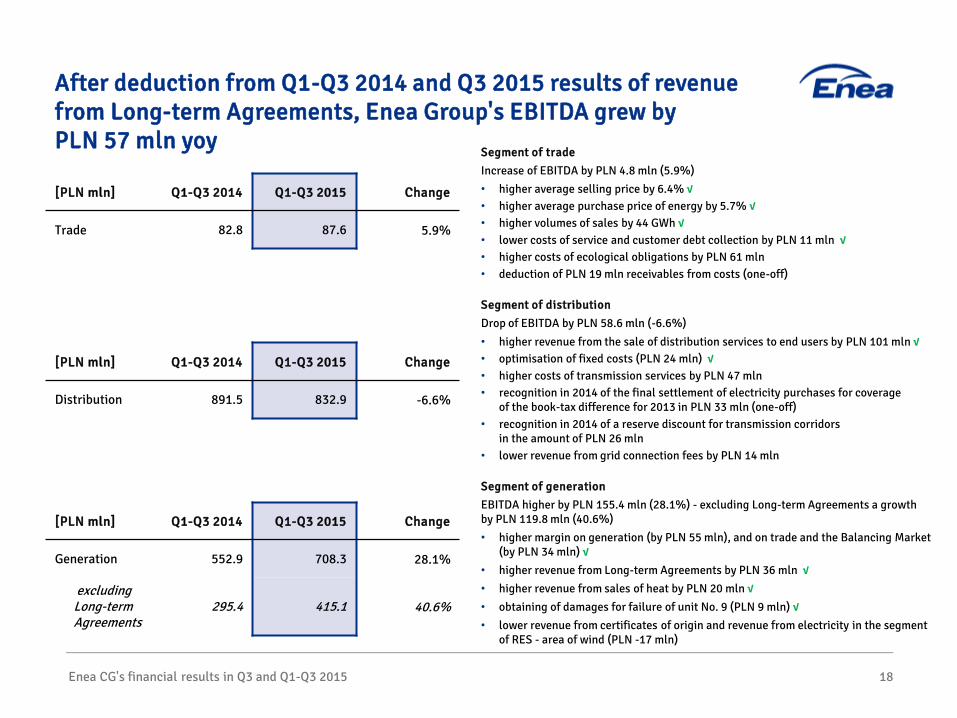
After deduction from Q1-Q3 2014 and Q3 2015 results of revenue from Long-term Agreements, Enea Group's EBITDA grew by PLN 57 mln yoy
Segment of tradeIncrease of EBITDA by PLN 4.8 mln (5.9%)• higher average selling price by 6.4% √• higher average purchase price of energy by 5.7% √• higher volumes of sales by 44 GWh √• lower costs of service and customer debt collection by PLN 11 mln √• higher costs of ecological obligations by PLN 61 mln • deduction of PLN 19 mln receivables from costs (one-off)
Segment of distributionDrop of EBITDA by PLN 58.6 mln (-6.6%)
• higher revenue from the sale of distribution services to end users by PLN 101 mln √• optimisation of fixed costs (PLN 24 mln) √• higher costs of transmission services by PLN 47 mln • recognition in 2014 of the final settlement of electricity purchases for coverage
of the book-tax difference for 2013 in PLN 33 mln (one-off)• recognition in 2014 of a reserve discount for transmission corridors
in the amount of PLN 26 mln • lower revenue from grid connection fees by PLN 14 mln
Segment of generationEBITDA higher by PLN 155.4 mln (28.1%) - excluding Long-term Agreements a growth by PLN 119.8 mln (40.6%)• higher margin on generation (by PLN 55 mln), and on trade and the Balancing Market
(by PLN 34 mln) å higher revenue from Long-term Agreements by PLN 36 mln å higher revenue from sales of heat by PLN 20 mln å obtaining of damages for failure of unit No. 9 (PLN 9 mln) å lower revenue from certificates of origin and revenue from electricity in the segment
of RES - area of wind (PLN -17 mln)
[PLN mln] Q1-Q3 2014 Q1-Q3 2015 Change
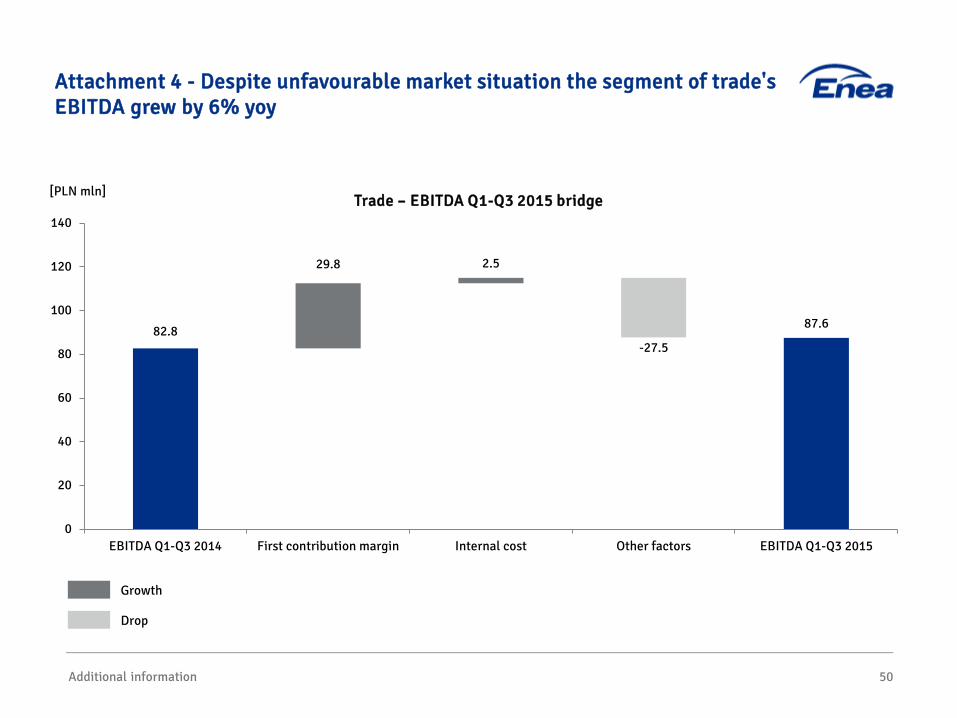
Trade 82.8 87.6 5.9%
[PLN mln] Q1-Q3 2014 Q1-Q3 2015 Change
Distribution 891.5 832.9 -6.6%
[PLN mln] Q1-Q3 2014 Q1-Q3 2015 Change
Generation 552.9 708.3 28.1%
excluding Long-term Agreements
295.4 415.1 40.6%
Enea CG's financial results in Q3 and Q1-Q3 2015 19
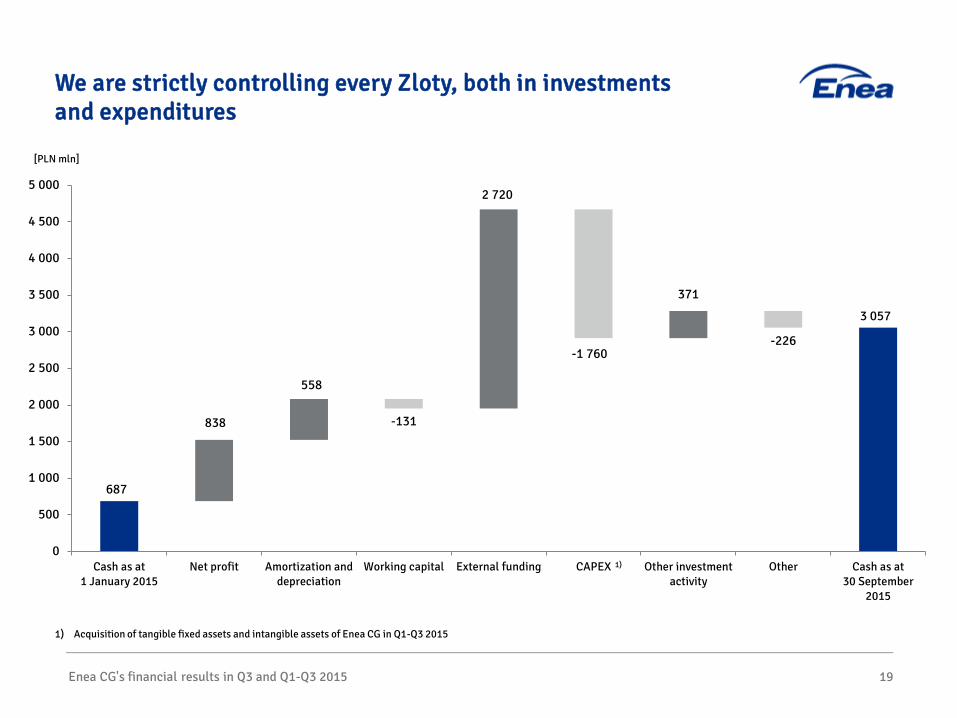
We are strictly controlling every Zloty, both in investments and expenditures
687
3 057
838
558
2 720
371
-131
-1 760-226
0
500
1 000
1 500
2 000
2 500
3 000
3 500
4 000
4 500
5 000
Cash as at1 January 2015
Net profit Amortization anddepreciation
Working capital External funding CAPEX Other investmentactivity
Other Cash as at30 September
2015
1)
1) Acquisition of tangible fixed assets and intangible assets of Enea CG in Q1-Q3 2015
[PLN mln]
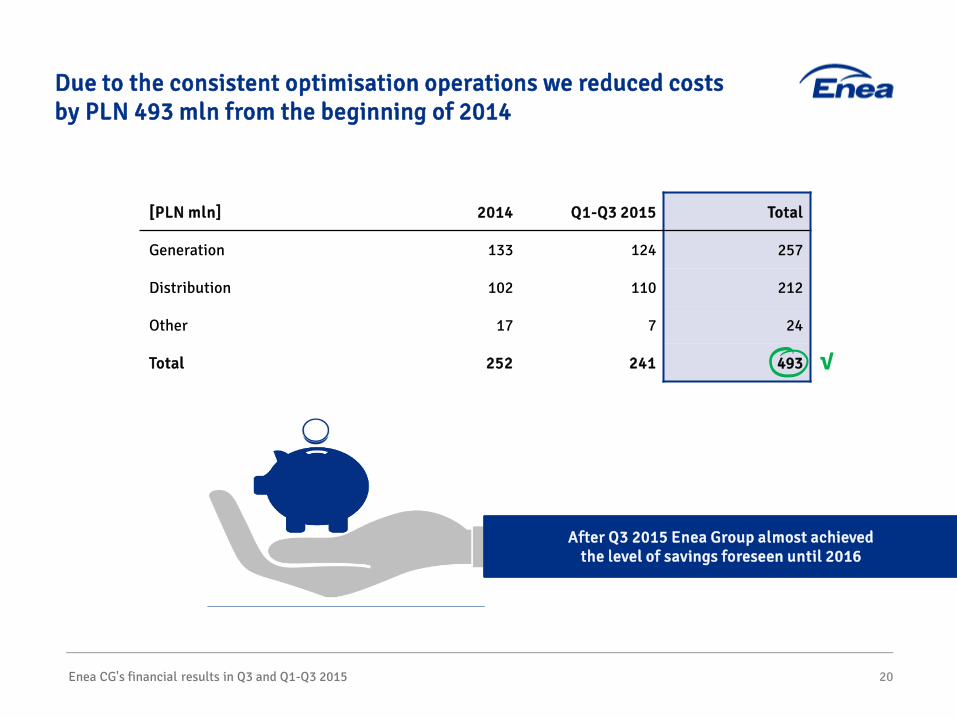
After Q3 2015 Enea Group almost achieved the level of savings foreseen until 2016
Enea CG's financial results in Q3 and Q1-Q3 2015 20
Due to the consistent optimisation operations we reduced costs by PLN 493 mln from the beginning of 2014
[PLN mln] 2014 Q1-Q3 2015 Total
Generation 133 124 257
Distribution 102 110 212
Other 17 7 24
Total 252 241 493 √
Enea CG's financial results in Q3 and Q1-Q3 2015 21
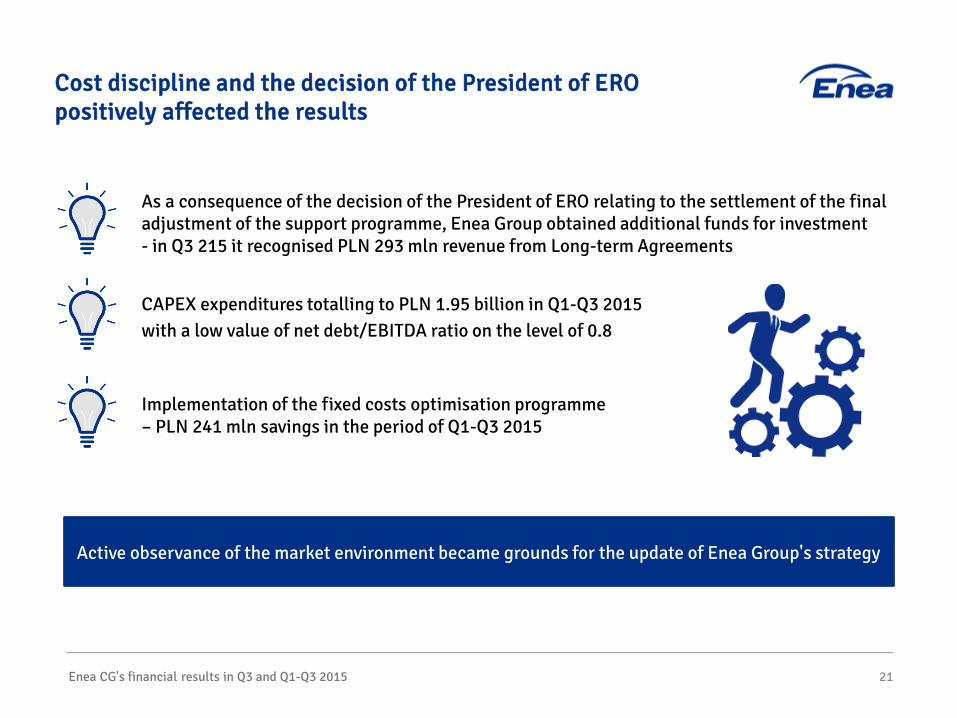
Cost discipline and the decision of the President of ERO positively affected the results
As a consequence of the decision of the President of ERO relating to the settlement of the final adjustment of the support programme, Enea Group obtained additional funds for investment - in Q3 215 it recognised PLN 293 mln revenue from Long-term Agreements
CAPEX expenditures totalling to PLN 1.95 billion in Q1-Q3 2015 with a low value of net debt/EBITDA ratio on the level of 0.8
Implementation of the fixed costs optimisation programme – PLN 241 mln savings in the period of Q1-Q3 2015
Active observance of the market environment became grounds for the update of Enea Group's strategy
22
Agenda
Update of Strategy for 2015-2020
Energy market and key operating data
Enea CG's financial results in Q3 and Q1-Q3 2015
Acquisition of LW Bogdanka
New unit in Kozienice Power Plant
The updated strategy sets the directions for increasing the Group's operating efficiency
Strategy update 24
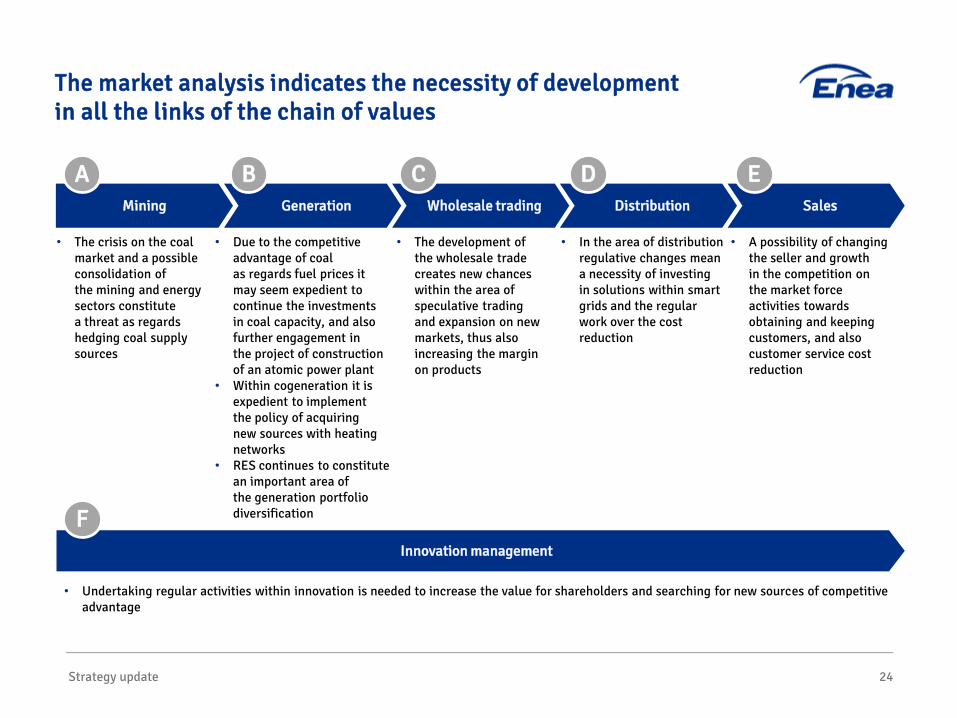
The market analysis indicates the necessity of development in all the links of the chain of values
Innovation management
• Due to the competitive advantage of coal as regards fuel prices it may seem expedient to continue the investments in coal capacity, and also further engagement in the project of construction of an atomic power plant
• Within cogeneration it is expedient to implement the policy of acquiring new sources with heating networks
• RES continues to constitute an important area of the generation portfolio diversification
• The crisis on the coal market and a possible consolidation of the mining and energy sectors constitute a threat as regards hedging coal supply sources
• In the area of distribution regulative changes mean a necessity of investing in solutions within smart grids and the regular work over the cost reduction
• The development of the wholesale trade creates new chances within the area of speculative trading and expansion on new markets, thus also increasing the margin on products
• A possibility of changing the seller and growth in the competition on the market force activities towards obtaining and keeping customers, and also customer service cost reduction
Wholesale trading DistributionGenerationMining Sales
• Undertaking regular activities within innovation is needed to increase the value for shareholders and searching for new sources of competitive advantage
BA DC E
F
25
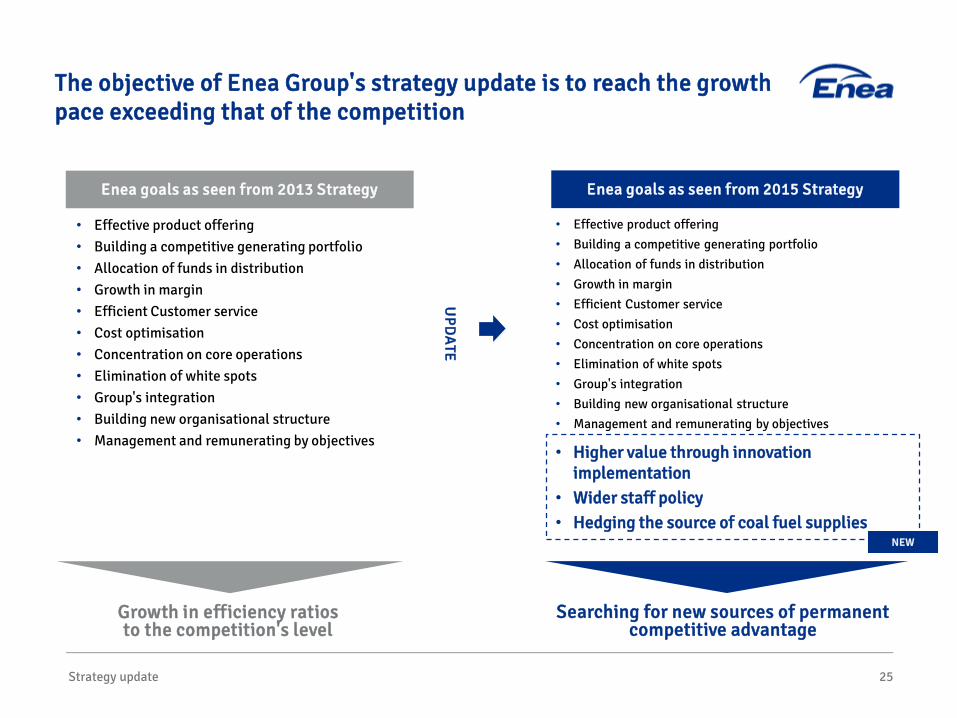
The objective of Enea Group's strategy update is to reach the growth pace exceeding that of the competition
• Effective product offering• Building a competitive generating portfolio• Allocation of funds in distribution • Growth in margin • Efficient Customer service• Cost optimisation• Concentration on core operations• Elimination of white spots• Group's integration• Building new organisational structure• Management and remunerating by objectives
• Effective product offering• Building a competitive generating portfolio• Allocation of funds in distribution • Growth in margin • Efficient Customer service• Cost optimisation• Concentration on core operations• Elimination of white spots• Group's integration• Building new organisational structure• Management and remunerating by objectives
Growth in efficiency ratios to the competition's level
Searching for new sources of permanent competitive advantage
UPD
ATE
• Higher value through innovationimplementation
• Wider staff policy• Hedging the source of coal fuel supplies
NEW
Strategy update
Enea goals as seen from 2015 StrategyEnea goals as seen from 2013 Strategy
Strategy update
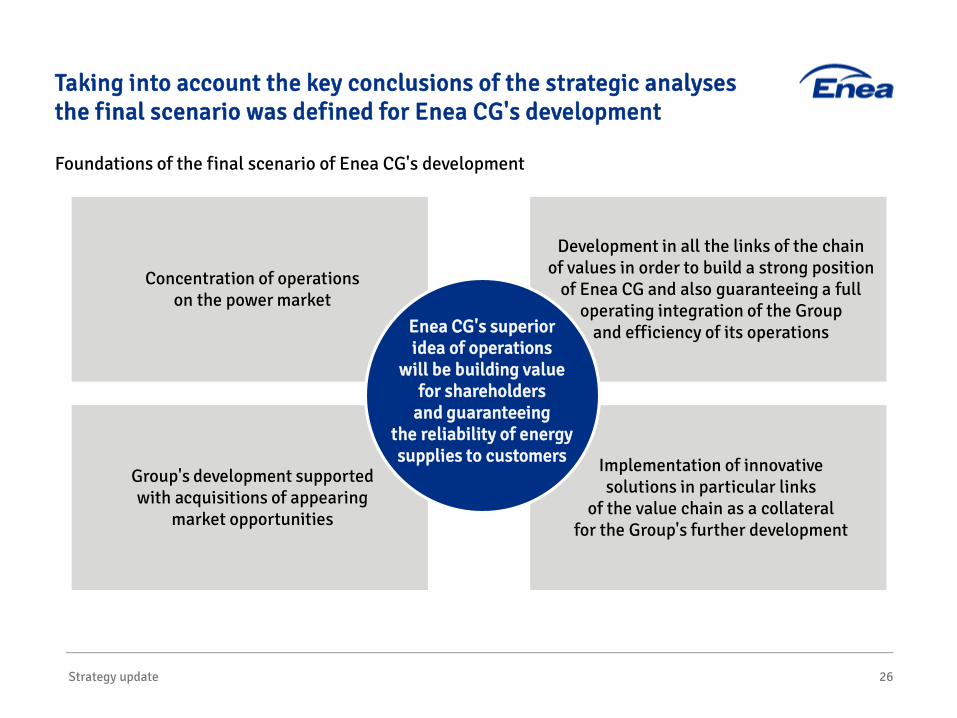
Foundations of the final scenario of Enea CG's development
26
Taking into account the key conclusions of the strategic analyses the final scenario was defined for Enea CG's development
Concentration of operations on the power market
Development in all the links of the chain of values in order to build a strong position
of Enea CG and also guaranteeing a full operating integration of the Group
and efficiency of its operations
Group's development supported with acquisitions of appearing
market opportunities
Implementation of innovative solutions in particular links
of the value chain as a collateral for the Group's further development
Enea CG's superior idea of operations
will be building value for shareholders
and guaranteeing the reliability of energy supplies to customers
Strategy update 27
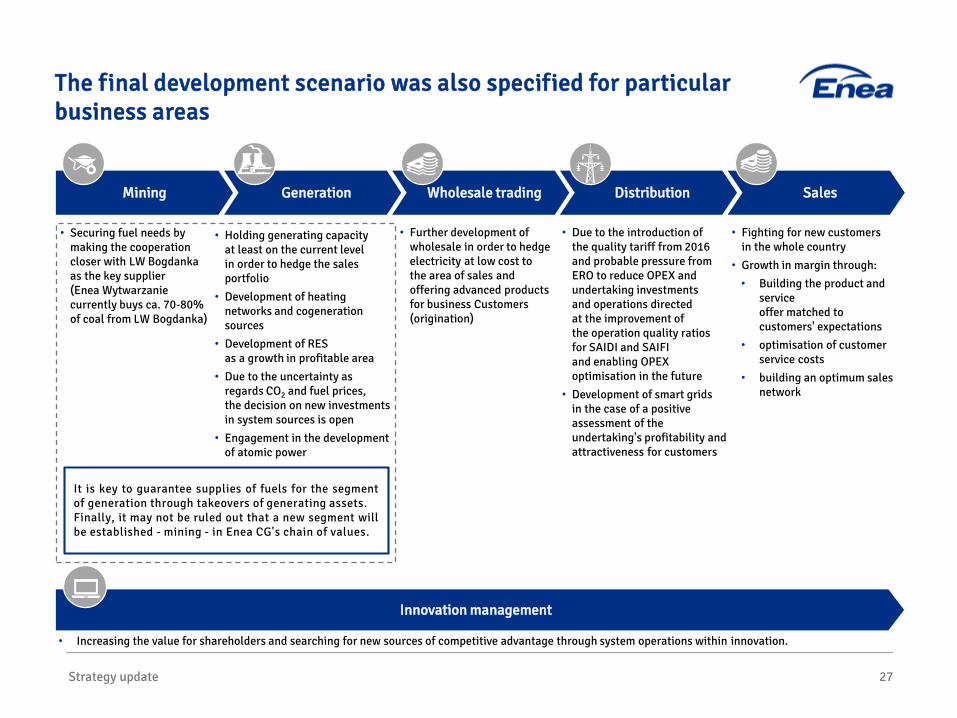
The final development scenario was also specified for particular business areas
• Holding generating capacity at least on the current level in order to hedge the sales portfolio
• Development of heating networks and cogeneration sources
• Development of RES as a growth in profitable area
• Due to the uncertainty as regards CO2 and fuel prices, the decision on new investments in system sources is open
• Engagement in the development of atomic power
• Further development of wholesale in order to hedge electricity at low cost to the area of sales and offering advanced products for business Customers (origination)
• Due to the introduction of the quality tariff from 2016 and probable pressure from ERO to reduce OPEX and undertaking investments and operations directed at the improvement of the operation quality ratios for SAIDI and SAIFI and enabling OPEX optimisation in the future
• Development of smart grids in the case of a positive assessment of the undertaking's profitability and attractiveness for customers
• Fighting for new customers in the whole country
• Growth in margin through:• Building the product and
serviceoffer matched to customers' expectations
• optimisation of customer service costs
• building an optimum sales network
• Securing fuel needs by making the cooperation closer with LW Bogdankaas the key supplier (Enea Wytwarzanie currently buys ca. 70-80% of coal from LW Bogdanka)
Wholesale trading DistributionGenerationMining Sales
It is key to guarantee supplies of fuels for the segmentof generation through takeovers of generating assets.Finally, it may not be ruled out that a new segment willbe established - mining - in Enea CG's chain of values.
Innovation management
• Increasing the value for shareholders and searching for new sources of competitive advantage through system operations within innovation.
28
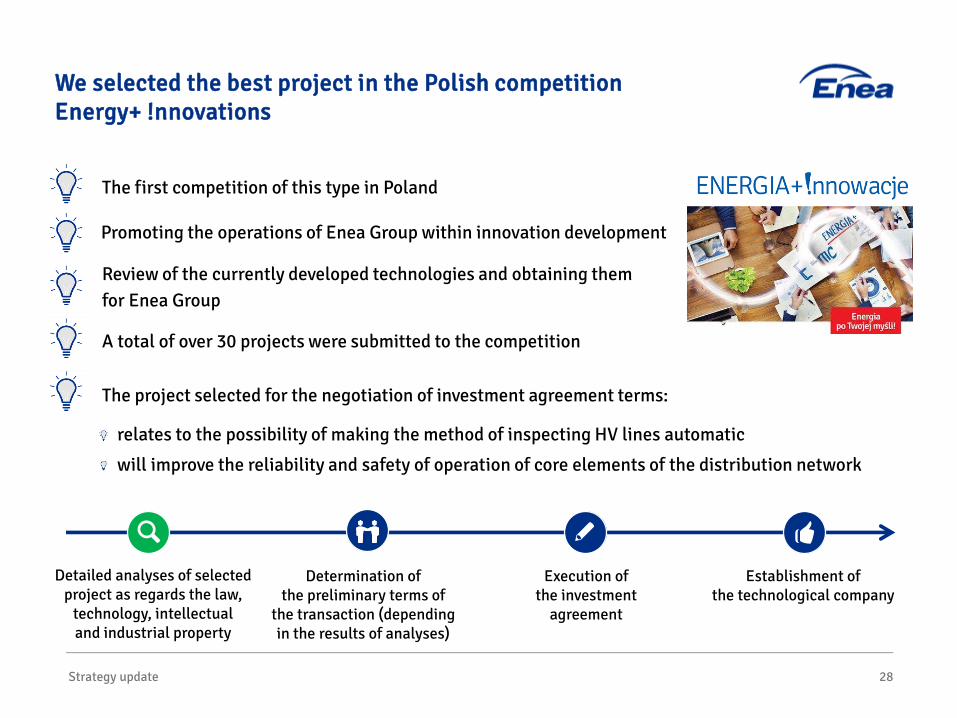
We selected the best project in the Polish competitionEnergy+ !nnovations
Promoting the operations of Enea Group within innovation development
The first competition of this type in Poland
A total of over 30 projects were submitted to the competition
Review of the currently developed technologies and obtaining them for Enea Group
Strategy update
The project selected for the negotiation of investment agreement terms:
relates to the possibility of making the method of inspecting HV lines automatic
will improve the reliability and safety of operation of core elements of the distribution network
Detailed analyses of selected project as regards the law,
technology, intellectual and industrial property
Determination of the preliminary terms of
the transaction (depending in the results of analyses)
Execution of the investment
agreement
Establishment of the technological company
Strategy update 29
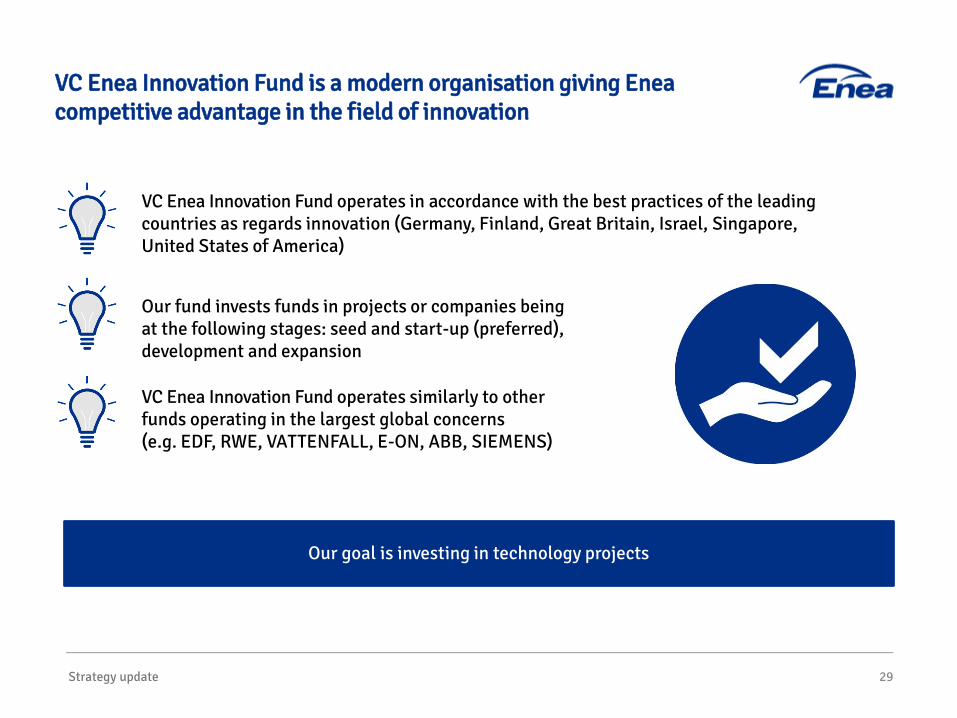
VC Enea Innovation Fund is a modern organisation giving Enea competitive advantage in the field of innovation
VC Enea Innovation Fund operates in accordance with the best practices of the leading countries as regards innovation (Germany, Finland, Great Britain, Israel, Singapore, United States of America)
Our fund invests funds in projects or companies being at the following stages: seed and start-up (preferred), development and expansion
VC Enea Innovation Fund operates similarly to other funds operating in the largest global concerns(e.g. EDF, RWE, VATTENFALL, E-ON, ABB, SIEMENS)
Our goal is investing in technology projects
Strategy update 30
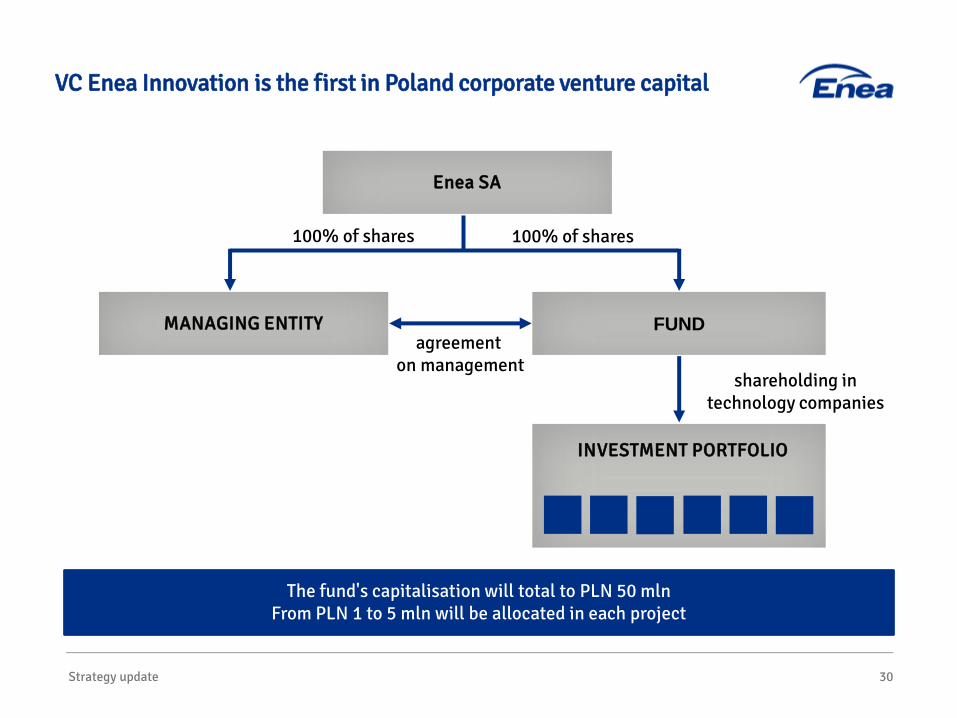
VC Enea Innovation is the first in Poland corporate venture capital
The fund's capitalisation will total to PLN 50 mlnFrom PLN 1 to 5 mln will be allocated in each project
MANAGING ENTITY FUND
INVESTMENT PORTFOLIO
Enea SA
100% of shares 100% of shares
agreement on management
shareholding in technology companies
31
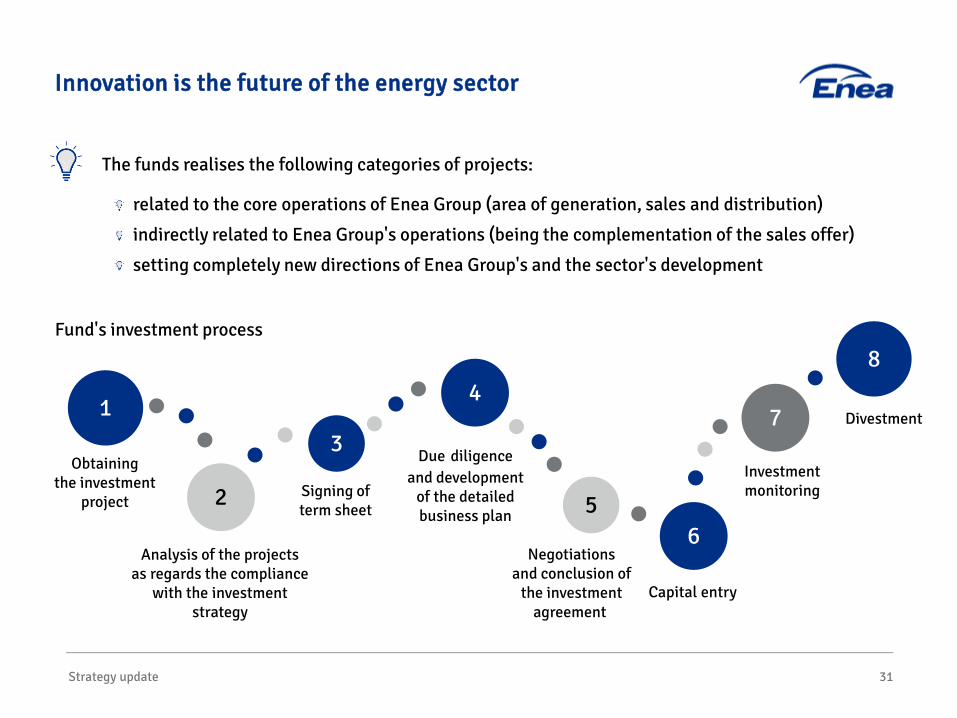
Innovation is the future of the energy sector
The funds realises the following categories of projects:
related to the core operations of Enea Group (area of generation, sales and distribution)
indirectly related to Enea Group's operations (being the complementation of the sales offer)
setting completely new directions of Enea Group's and the sector's development
Strategy update
1
2
3
4
56
8
7
Analysis of the projects as regards the compliance
with the investmentstrategy
Divestment
Investment monitoring
Capital entry
Negotiations and conclusion of
the investment agreement
Due diligenceand development
of the detailed business plan
Signing of term sheet
Fund's investment process
Obtaining the investment
project
Strategy update 32
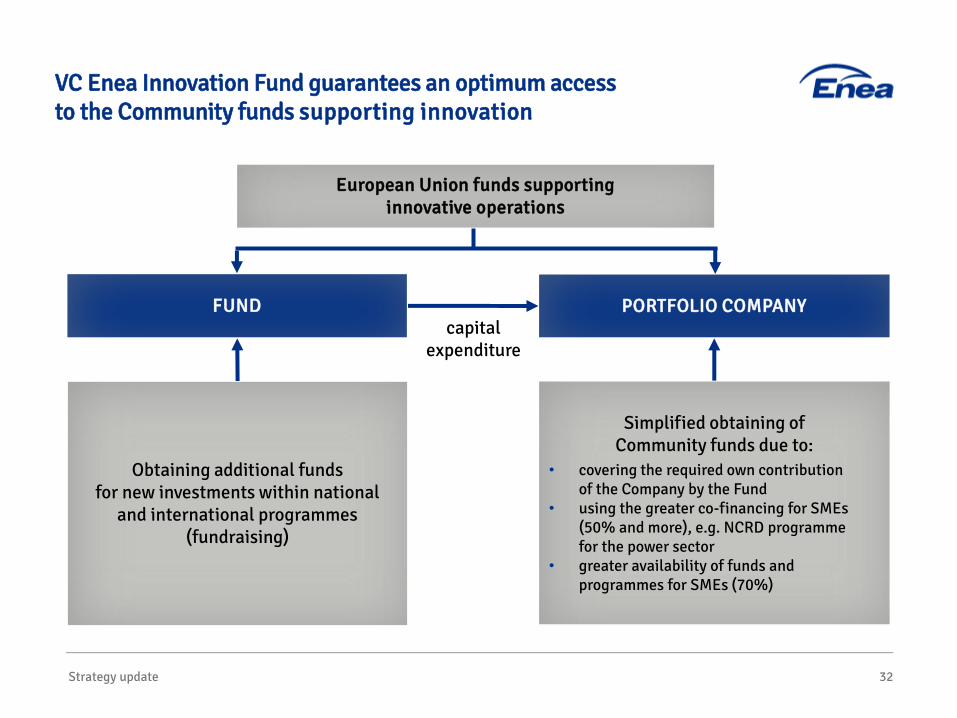
VC Enea Innovation Fund guarantees an optimum access to the Community funds supporting innovation
FUND PORTFOLIO COMPANYcapital
expenditure
Obtaining additional funds for new investments within national
and international programmes (fundraising)
Simplified obtaining of Community funds due to:
• covering the required own contribution of the Company by the Fund
• using the greater co-financing for SMEs (50% and more), e.g. NCRD programme for the power sector
• greater availability of funds and programmes for SMEs (70%)
European Union funds supporting innovative operations
33
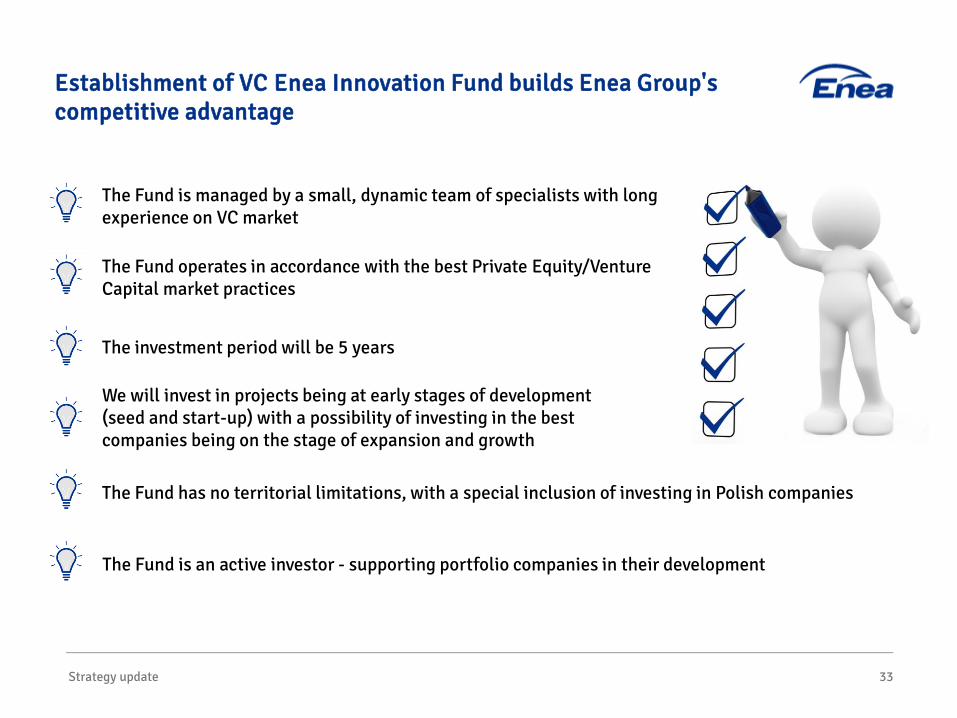
Establishment of VC Enea Innovation Fund builds Enea Group's competitive advantage
The Fund operates in accordance with the best Private Equity/Venture Capital market practices
The Fund is managed by a small, dynamic team of specialists with long experience on VC market
The Fund has no territorial limitations, with a special inclusion of investing in Polish companies
We will invest in projects being at early stages of development (seed and start-up) with a possibility of investing in the best companies being on the stage of expansion and growth
The investment period will be 5 years
The Fund is an active investor - supporting portfolio companies in their development
Strategy update
Strategy update 34
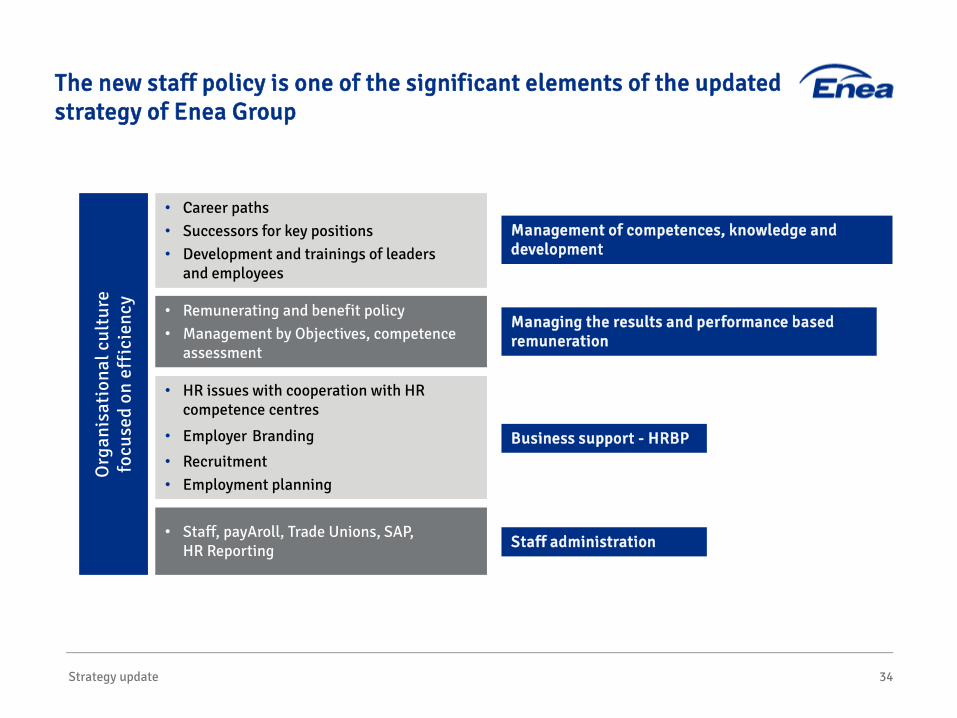
The new staff policy is one of the significant elements of the updated strategy of Enea Group
• Career paths• Successors for key positions• Development and trainings of leaders
and employees
• Remunerating and benefit policy• Management by Objectives, competence
assessment
• HR issues with cooperation with HR competence centres
• Employer Branding
• Recruitment• Employment planning
• Staff, payAroll, Trade Unions, SAP, HR Reporting
Managing the results and performance based remuneration
Business support - HRBP
Management of competences, knowledge and development
Staff administration
Org
anis
atio
nal c
ultu
refo
cuse
d on
eff
icie
ncy
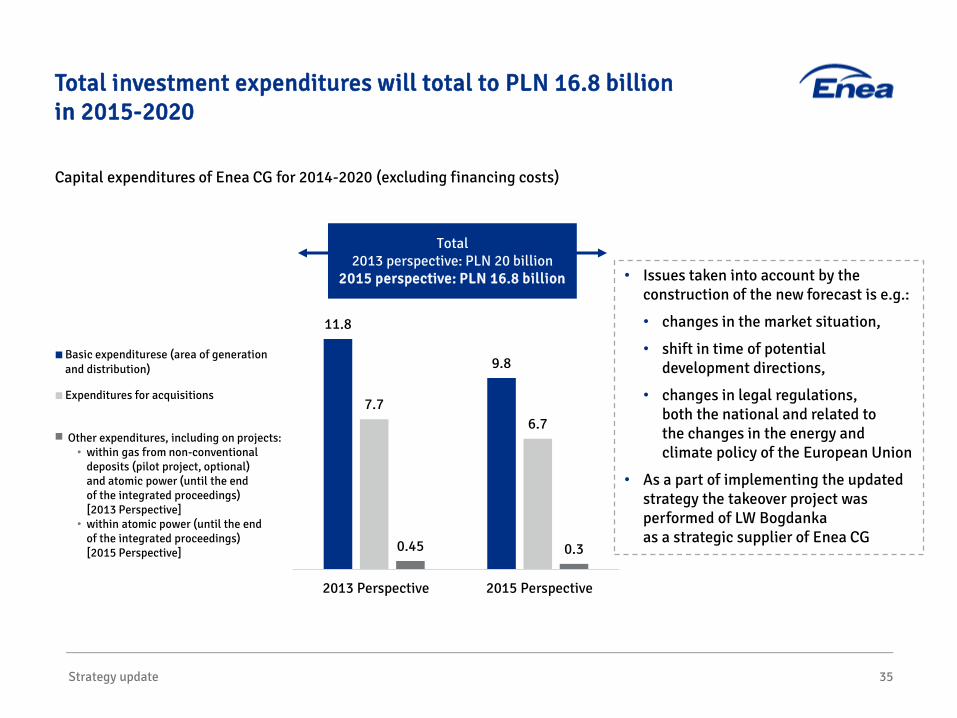
Capital expenditures of Enea CG for 2014-2020 (excluding financing costs)
11.8
9.8
7.76.7
0.45 0.3
2013 Perspective 2015 Perspective
Basic expenditurese (area of generationand distribution)
Expenditures for acquisitions
Nakłady pozostałe, w tym na projekty:
Strategy update 35
Total investment expenditures will total to PLN 16.8 billion in 2015-2020
Total2013 perspective: PLN 20 billion
2015 perspective: PLN 16.8 billion
Other expenditures, including on projects:• within gas from non-conventional
deposits (pilot project, optional) and atomic power (until the end of the integrated proceedings) [2013 Perspective]
• within atomic power (until the end of the integrated proceedings) [2015 Perspective]
• Issues taken into account by the construction of the new forecast is e.g.:
• changes in the market situation,
• shift in time of potential development directions,
• changes in legal regulations,both the national and related to the changes in the energy and climate policy of the European Union
• As a part of implementing the updated strategy the takeover project was performed of LW Bogdanka as a strategic supplier of Enea CG
36
Agenda
Energy market and key operating data
Enea CG's financial results in Q3 and Q1-Q3 2015
Acquisition of LW Bogdanka
New unit in Kozienice Power Plant
Update of Strategy for 2015-2020
New unit in Kozienice Power Plant 37
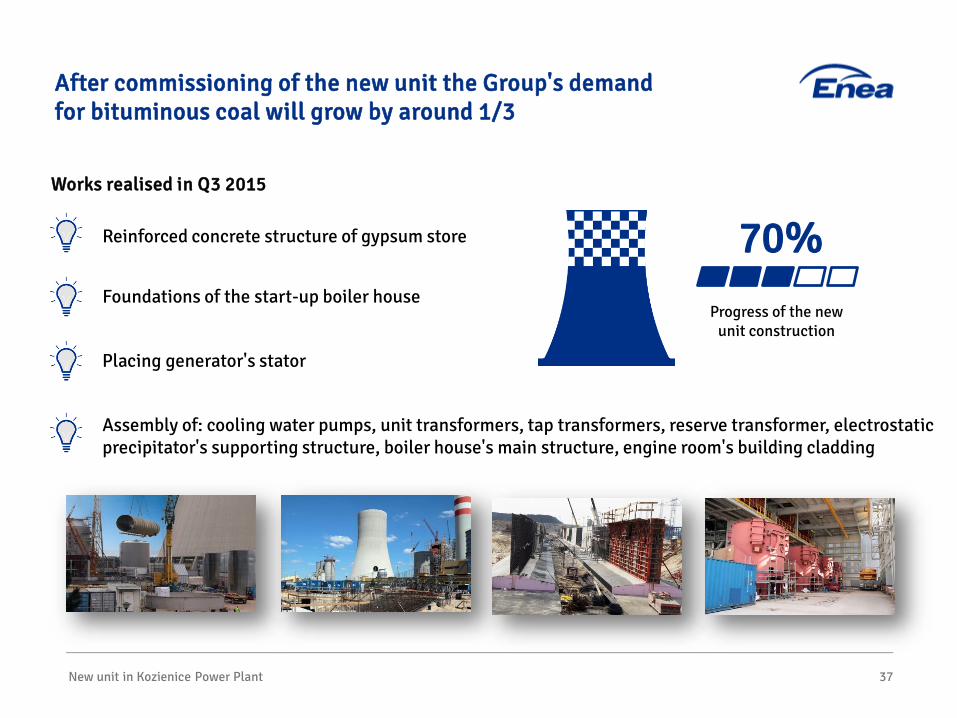
After commissioning of the new unit the Group's demand for bituminous coal will grow by around 1/3
Assembly of: cooling water pumps, unit transformers, tap transformers, reserve transformer, electrostatic precipitator's supporting structure, boiler house's main structure, engine room's building cladding
Works realised in Q3 2015
Placing generator's stator
70%Progress of the new
unit construction
Reinforced concrete structure of gypsum store
Foundations of the start-up boiler house
38
Agenda
Energy market and key operating data
Enea CG's financial results in Q3 and Q1-Q3 2015
Acquisition of LW Bogdanka
Update of Strategy for 2015-2020
New unit in Kozienice Power Plant
The most efficient coal mining company in Poland became a part of Enea Group
Acquisition of LW Bogdanka 40
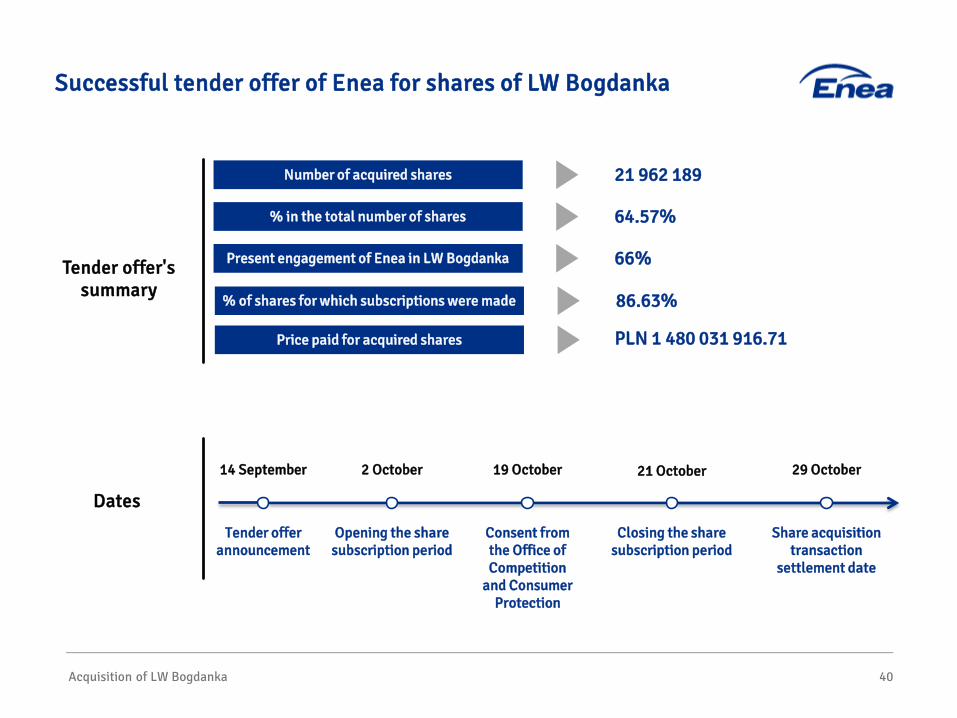
Successful tender offer of Enea for shares of LW Bogdanka
2 October
Opening the share subscription period
14 September
Tender offer announcement
19 October
Consent from the Office of Competition
and Consumer Protection
21 October
Closing the share subscription period
29 October
Share acquisition transaction
settlement date
Price paid for acquired shares
Number of acquired shares
% in the total number of shares
Present engagement of Enea in LW BogdankaTender offer's summary
Dates
21 962 189
64.57%
66%
% of shares for which subscriptions were made 86.63%
PLN 1 480 031 916.71
Acquisition of LW Bogdanka 41
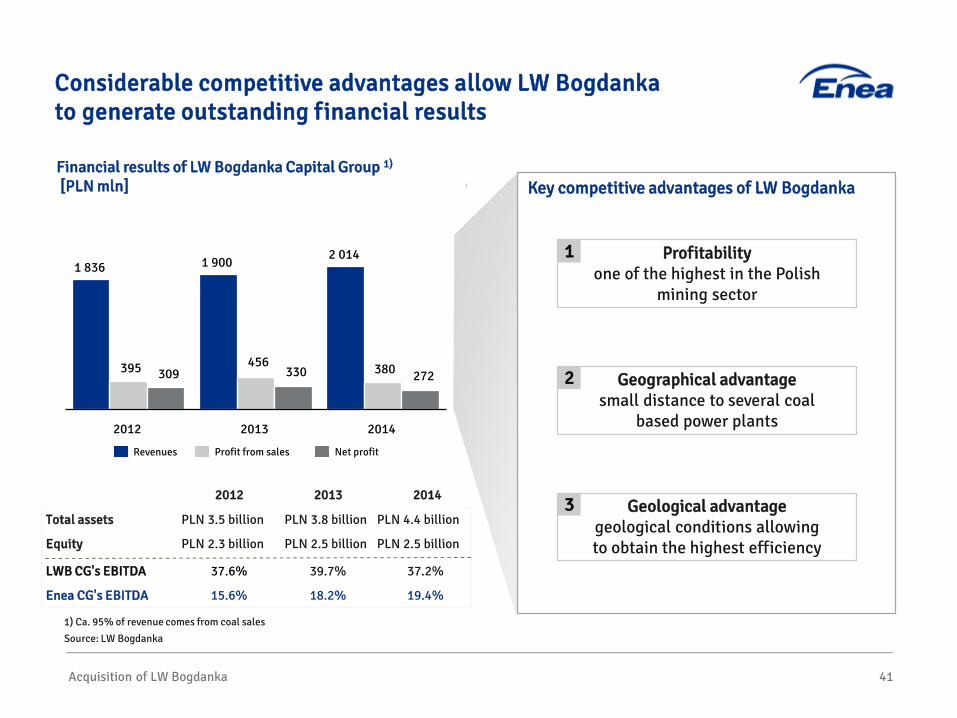
Considerable competitive advantages allow LW Bogdanka to generate outstanding financial results
Financial results of LW Bogdanka Capital Group 1)
[PLN mln]
395 456 380309 330 272
1 900
2012
1 836
2014
2 014
2013
Profit from salesRevenues Net profit
1) Ca. 95% of revenue comes from coal sales
Source: LW Bogdanka
Key competitive advantages of LW Bogdanka
2013 2014
Equity
LWB CG's EBITDA
PLN 2.5 billion
Total assets PLN 4.4 billion
PLN 2.5 billion
PLN 3.8 billion
Enea CG's EBITDA 19.4%
37.2%
18.2%
39.7%
2012
PLN 2.3 billion
PLN 3.5 billion
15.6%
37.6%
Profitabilityone of the highest in the Polish
mining sector
Geographical advantagesmall distance to several coal
based power plants
Geological advantagegeological conditions allowing to obtain the highest efficiency
1
2
3
Acquisition of LW Bogdanka 42
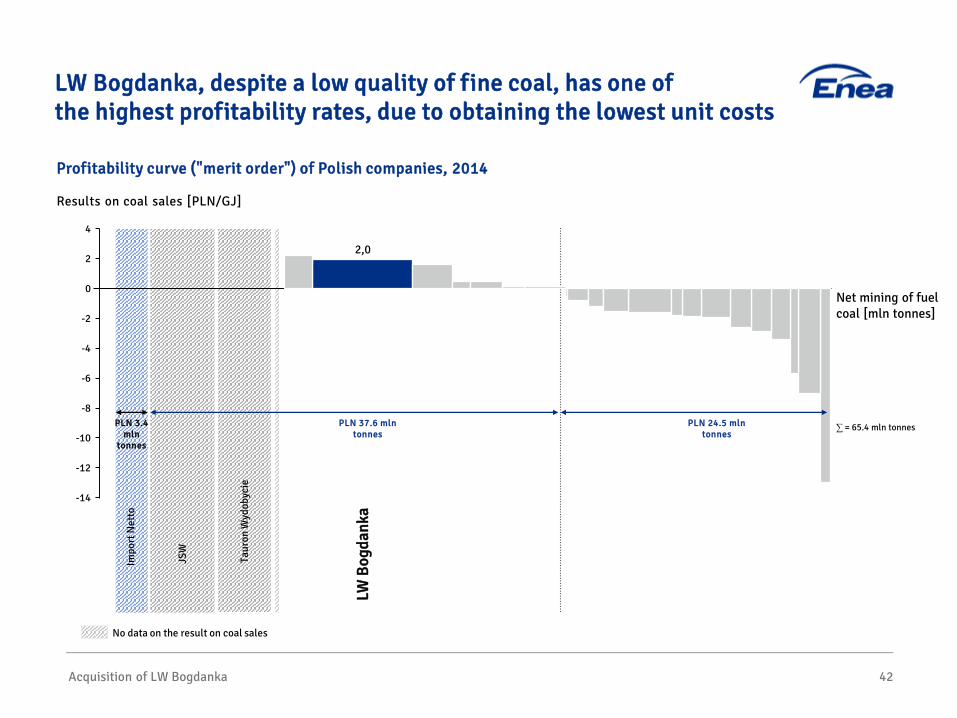
LW Bogdanka, despite a low quality of fine coal, has one of the highest profitability rates, due to obtaining the lowest unit costs
Results on coal sales [PLN/GJ]
No data on the result on coal sales
Net mining of fuel coal [mln tonnes]
-12
0
-10
-8
-14
-4
2
-6
4
-2
Impo
rt N
etto
Taur
on W
ydob
ycie
LW B
ogda
nka
JSW
2,0
PLN 37.6 mln tonnes
PLN 3.4 mln
tonnes
∑ = 65.4 mln tonnes PLN 24.5 mln tonnes
Profitability curve ("merit order") of Polish companies, 2014
Acquisition of LW Bogdanka 43
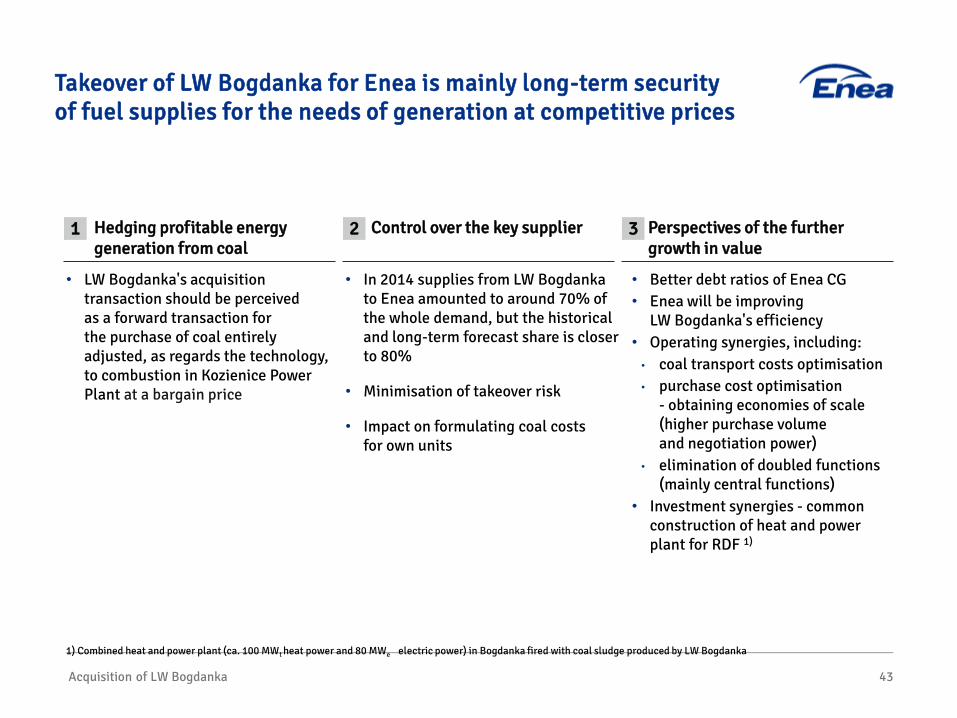
Takeover of LW Bogdanka for Enea is mainly long-term security of fuel supplies for the needs of generation at competitive prices
Control over the key supplier Perspectives of the further growth in value
Hedging profitable energy generation from coal
• LW Bogdanka's acquisition transaction should be perceived as a forward transaction for the purchase of coal entirely adjusted, as regards the technology, to combustion in Kozienice Power Plant at a bargain price
• In 2014 supplies from LW Bogdanka to Enea amounted to around 70% of the whole demand, but the historical and long-term forecast share is closer to 80%
• Minimisation of takeover risk
• Impact on formulating coal costs for own units
1 2 3
• Better debt ratios of Enea CG• Enea will be improving
LW Bogdanka's efficiency• Operating synergies, including:• coal transport costs optimisation• purchase cost optimisation
- obtaining economies of scale (higher purchase volume and negotiation power)
• elimination of doubled functions (mainly central functions)
• Investment synergies - common construction of heat and power plant for RDF 1)
1) Combined heat and power plant (ca. 100 MWt heat power and 80 MWe electric power) in Bogdanka fired with coal sludge produced by LW Bogdanka
Acquisition of LW Bogdanka 44
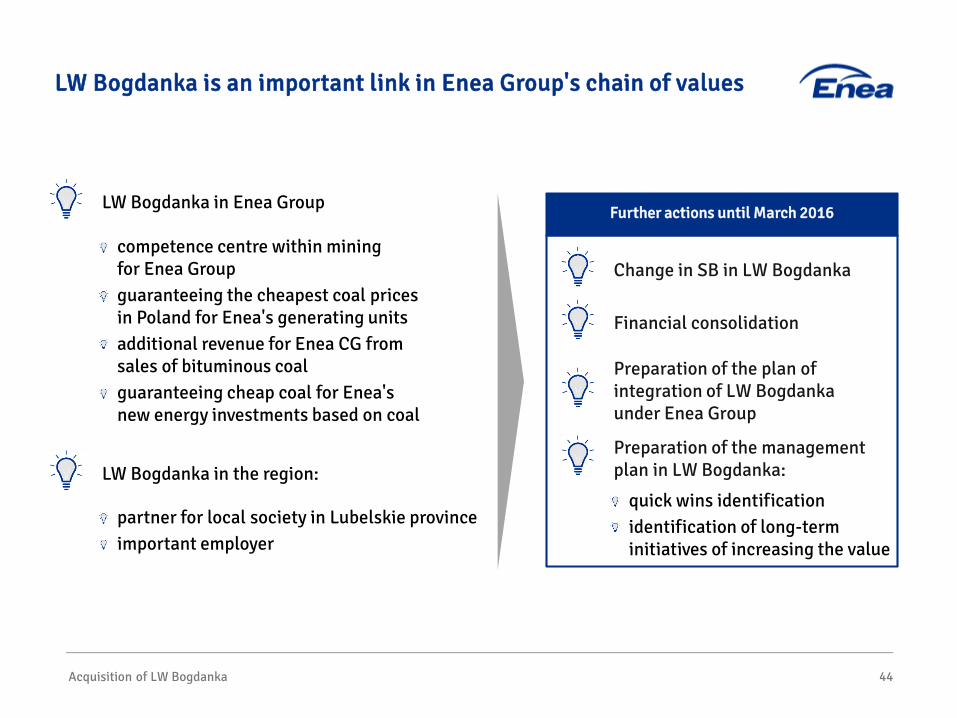
LW Bogdanka is an important link in Enea Group's chain of values
Further actions until March 2016LW Bogdanka in Enea Group
competence centre within mining for Enea Group guaranteeing the cheapest coal prices in Poland for Enea's generating unitsadditional revenue for Enea CG from sales of bituminous coalguaranteeing cheap coal for Enea's new energy investments based on coal
LW Bogdanka in the region:
partner for local society in Lubelskie provinceimportant employer
Change in SB in LW Bogdanka
Financial consolidation
Preparation of the plan of integration of LW Bogdanka under Enea Group
Preparation of the management plan in LW Bogdanka:
quick wins identificationidentification of long-term initiatives of increasing the value
Additional information
Additional information 47
Attachment 1 – An express growth in first contribution margin improved the results of the segment of trade in Q3 2015
28.4
-1.4
-20.3
-0.1
6.6
-5
0
5
10
15
20
25
30
35
EBITDA Q3 2014 First contribution margin Internal costs Other factors EBITDA Q3 2015
[PLN mln]Trade – EBITDA Q3 2015 bridge
Growth
Drop
Additional information 48
Attachment 2 - Higher costs of purchasing transmission services and higher operating costs eliminated the growth in Q3 2015 EBITDA of the segment of distribution
33.7
9.0
-10.6
-28.1
285.3 289.3
0
50
100
150
200
250
300
350
EBITDA Q3 2014 Margin of licencedactivity
Revenue fromnon-licenced activity
Operating costs Other operating activity EBITDA Q3 2015
[PLN mln]Distribution – EBITDA Q3 2015 bridge
Growth
Drop
Additional information 49
Attachment 3 - Result of the segment of generation in Q3 2015 was supported with PLN 293 mln revenue from Long-term Agreements
-2.0
307.0 2.0
112.0
419.0
0
50
100
150
200
250
300
350
400
450
EBITDA Q3 2014 Segment ofSystem Power Plants
Segment of Heat Segment of RES EBITDA Q3 2015
[PLN mln]Generation – EBITDA Q3 2015 bridge
Growth
Drop
Additional information 50
Attachment 4 - Despite unfavourable market situation the segment of trade's EBITDA grew by 6% yoy
29.8 2.5
-27.582.8 87.6
0
20
40
60
80
100
120
140
EBITDA Q1-Q3 2014 First contribution margin Internal cost Other factors EBITDA Q1-Q3 2015
[PLN mln]Trade – EBITDA Q1-Q3 2015 bridge
Growth
Drop
Additional information 51
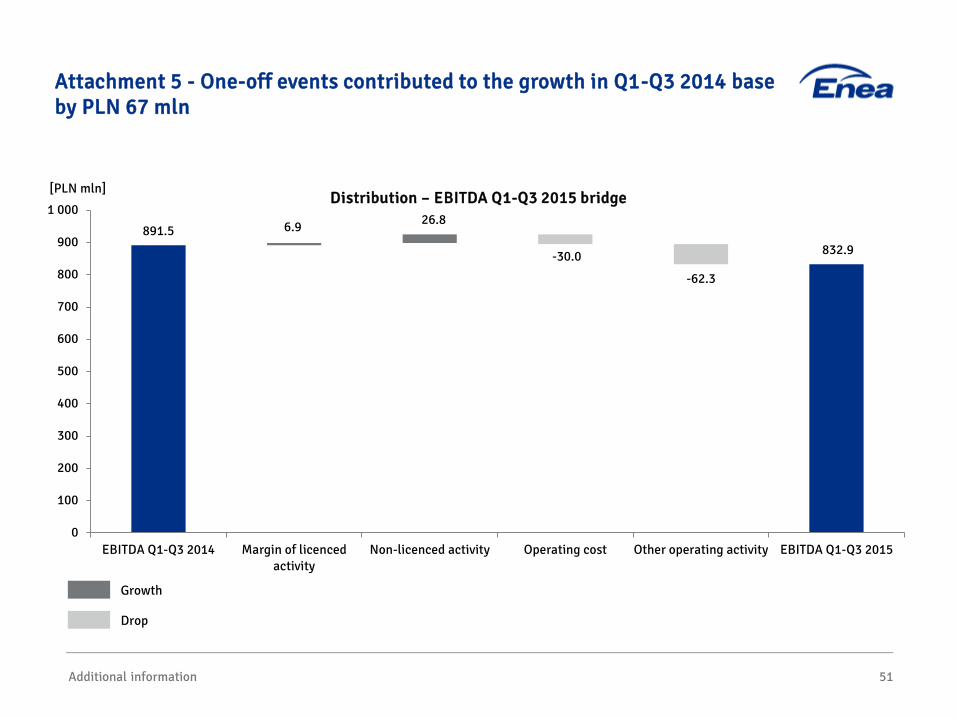
Attachment 5 - One-off events contributed to the growth in Q1-Q3 2014 base by PLN 67 mln
-30.0
6.9 26.8
-62.3
891.5832.9
0
100
200
300
400
500
600
700
800
900
1 000
EBITDA Q1-Q3 2014 Margin of licencedactivity
Non-licenced activity Operating cost Other operating activity EBITDA Q1-Q3 2015
[PLN mln]Distribution – EBITDA Q1-Q3 2015 bridge
Growth
Drop
Additional information 52
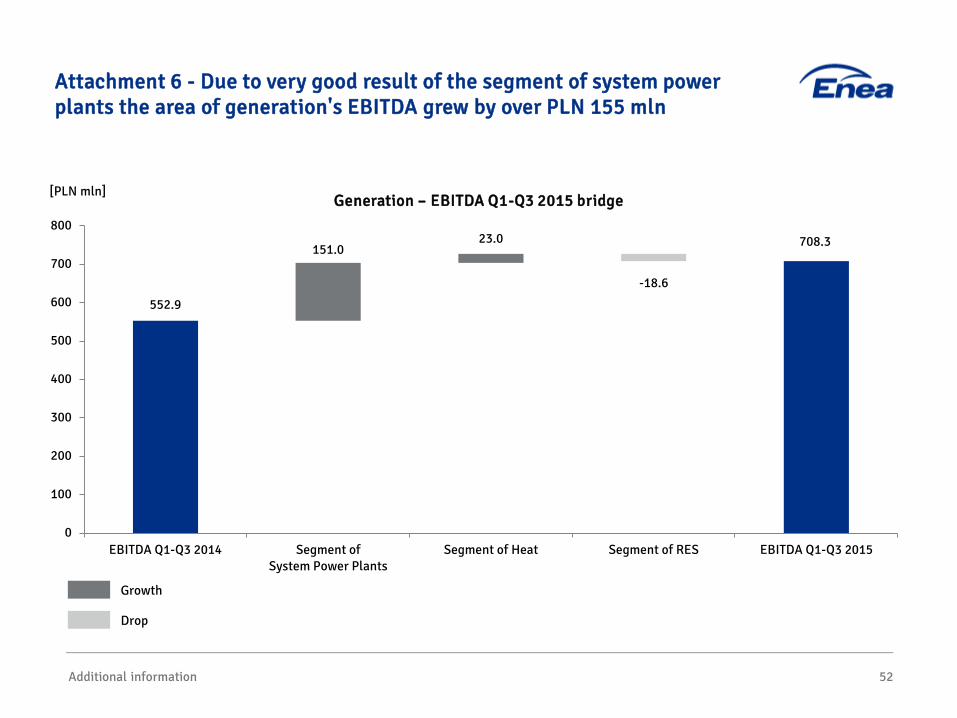
Attachment 6 - Due to very good result of the segment of system power plants the area of generation's EBITDA grew by over PLN 155 mln
23.0151.0
-18.6
552.9
708.3
0
100
200
300
400
500
600
700
800
EBITDA Q1-Q3 2014 Segment ofSystem Power Plants
Segment of Heat Segment of RES EBITDA Q1-Q3 2015
[PLN mln]Generation – EBITDA Q1-Q3 2015 bridge
Growth
Drop