Embed Size (px)
Citation preview

Page
Erste Group posts net profit of EUR 276.9m in Q3 15 supported by loan growth and improving asset quality Andreas Treichl, CEO Erste Group Gernot Mittendorfer, CFO Erste Group Andreas Gottschling, CRO Erste Group
6 November 2015
Erste Group investor presentation Q3 2015 results

Page
Disclaimer – Cautionary note regarding forward-looking statements
2
• THE INFORMATION CONTAINED IN THIS DOCUMENT HAS NOT BEEN INDEPENDENTLY VERIFIED AND NO REPRESENTATION OR WARRANTY EXPRESSED OR IMPLIED IS MADE AS TO, AND NO RELIANCE SHOULD BE PLACED ON, THE FAIRNESS, ACCURACY, COMPLETENESS OR CORRECTNESS OF THIS INFORMATION OR OPINIONS CONTAINED HEREIN.
• CERTAIN STATEMENTS CONTAINED IN THIS DOCUMENT MAY BE STATEMENTS OF FUTURE EXPECTATIONS AND OTHER FORWARD-LOOKING STATEMENTS THAT ARE BASED ON MANAGEMENT’S CURRENT VIEWS AND ASSUMPTIONS AND INVOLVE KNOWN AND UNKNOWN RISKS AND UNCERTAINTIES THAT COULD CAUSE ACTUAL RESULTS, PERFORMANCE OR EVENTS TO DIFFER MATERIALLY FROM THOSE EXPRESSED OR IMPLIED IN SUCH STATEMENTS.
• NONE OF ERSTE GROUP OR ANY OF ITS AFFILIATES, ADVISORS OR REPRESENTATIVES SHALL HAVE ANY LIABILITY WHATSOEVER (IN NEGLIGENCE OR OTHERWISE) FOR ANY LOSS HOWSOEVER ARISING FROM ANY USE OF THIS DOCUMENT OR ITS CONTENT OR OTHERWISE ARISING IN CONNECTION WITH THIS DOCUMENT.
• THIS DOCUMENT DOES NOT CONSTITUTE AN OFFER OR INVITATION TO PURCHASE OR SUBSCRIBE FOR ANY SHARES AND NEITHER IT NOR ANY PART OF IT SHALL FORM THE BASIS OF OR BE RELIED UPON IN CONNECTION WITH ANY CONTRACT OR COMMITMENT WHATSOEVER.

Page
Presentation topics
3
• Executive summary • Business environment • Business performance • Assets and liabilities • Outlook • Additional information

Page
Executive summary – Group income statement performance
QoQ net profit reconciliation (EUR m)
YoY net profit reconciliation (EUR m)
4
• Erste Group Q3 15 net profit rose to EUR 276.9m despite negative one-off related to Croatian CHF conversion (EUR 144.9m pre-tax, pre-minorities), partly offset by lower minorities and tax charges and one-off income of EUR 38.3m (pre-tax) from participation sale
• Q3 15 result supported by broadly stable operating result vs Q2 15 and a significant reduction in risk costs to historically low levels
• Quarterly post-provision operating result at all-time high
• Erste Group 1-9 15 net profit equalled EUR 764.2m; turnaround driven by strongly improved other result (limited one-offs compared to 1-9 14), significantly lower risk costs, lower tax rate
• Slight decline in operating performance, as revenues held up well despite low interest rate environment; costs increased slightly
• Historically high minority charge due to exceptional risk performance at the savings banks and turnaround in Romania
19 46
132
66
61
277261
Q3 15 Minorities Taxes on income
Other result
Risk costs Operating expenses
7
Operating income
Q2 15
764176
-1.425
1-9 15 Minorities Taxes on income
84
Other result
1.296
Risk costs
1.081
Operating expenses
69
Operating income
27
1-9 14
Page
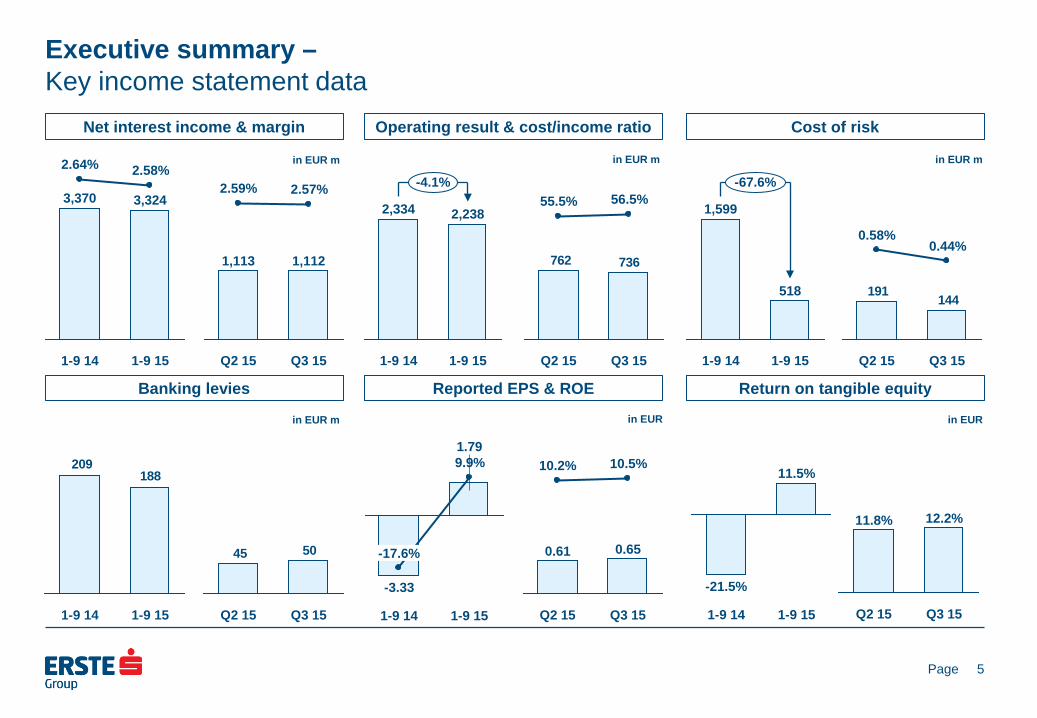
Executive summary – Key income statement data
Net interest income & margin
5
Operating result & cost/income ratio Cost of risk
Banking levies
Reported EPS & ROE
Return on tangible equity
-4.1%
1-9 15
2,238
1-9 14
2,334
144191
Q3 15
0.44%
Q2 15
0.58%
-67.6%
1-9 15
518
1-9 14
1,599
736762
Q3 15
56.5%
Q2 15
55.5%
Q3 15
1,112
2.57%
Q2 15
1,113
2.59%
5045
Q3 15 Q2 15
188209
1-9 15 1-9 14 1-9 15
1.79 9.9%
1-9 14
-3.33
-17.6%
Q3 15
0.65
10.5%
Q2 15
0.61
10.2%
1-9 15
3,324
2.58%
1-9 14
3,370
2.64% in EUR m
in EUR m
in EUR m in EUR m
in EUR in EUR
1-9 15
11.5%
1-9 14
-21.5%
Q3 15
12.2%
Q2 15
11.8%

Page
Executive summary – Group balance sheet performance
YTD total asset reconciliation (EUR m)
YTD equity & total liability reconciliation (EUR m)
6
• Balance sheet total rises by 2.5% ytd, driven by net loans and higher cash position, which was partly offset by lower stock of trading and financial assets
• Net customer loans rise by 3.1% ytd, supported mainly by solid demand in Slovakia, Czech Republic and Austria and stabilisation in Romania
• 2.3% ytd increase in customer deposits was main driver for expanding liabilities
• Decline in trading liabilities more than offset by temporarily higher bank deposits
• 7.4% ytd rise in total equity mainly driven by turnaround in profitability
737
942
Other assets
Intangibles
48
Net loans
3,687
Loans to banks
Trading, financial assets
2,222
Cash
3,262
31/12/14
196,287
30/09/15
201,171 994201,171
30/09/15 Equity Other liabilities
324
Debt securities
519
Customer deposits
2,857
Bank deposits
2,611
Trading liabilities
1,382
31/12/14
196,287

Page
Executive summary – Key balance sheet data
Loan/deposit & loan/TA ratio
7
Net loans & credit RWA NPL coverage ratio & NPL ratio
B3FL capital ratios
B3FL capital & tangible equity*
Liquidity coverage & leverage ratio
+3.1%
Credit RWA
85.8 87.1
Net loans
124.5 120.8
30/09/15 31/12/14
NPL ratio
7.4% 8.5%
NPL coverage
69.2% 68.9%
Loans/total assets
61.9% 61.6%
Loan/deposit ratio
99.3% 98.6%
Tangible equity
9.3 8.4
CET1
11.4 10.8
CET 1
11.2% 10.6%
Total capital
16.3% 15.6%
* Based on shareholders’ equity, not total equity. LR (B3FL)
5.4% 5.3%
LCR
119.6%
106.6%
in EUR bn
in EUR bn

Page
Presentation topics
8
• Executive summary • Business environment • Business performance • Assets and liabilities • Outlook • Additional information

Page
Business environment – Solid domestic demand expected to drive economic growth in 2015 & 2016
Real GDP growth (in %)
9
Dom. demand contribution* (in %) Net export contribution* (in %)
Unemployment rate (eop, in %)
Current account balance (% of GDP)
Gen gov balance (% of GDP)
Consumer price inflation (ave, in %)
Public debt (% of GDP)
• Erste Group’s core CEE markets expected to grow by more than 3% in 2015, with continued positive outlook for 2016 • Domestic demand is expected to be main driver of economic growth in 2015 and 2016 • Consumption is supported by wage increase across the region and deflationary environment in Romania, Slovakia and Hungary
• Solid public finances across Erste Group‘s core CEE markets: almost all countries fulfill Maastricht criteria • Sustainable current account balances, supported by competitive economies with decreasing unemployment rates
HR
0.2
0.0
HU
1.7 1.2
RO
3.7 3.3
SK
2.8 3.0
CZ
1.9
4.4
AT
1.3 0.7
2016 2015
HR
1.2 0.7
HU
2.4 2.8
RO
3.5 3.2
SK
3.5 3.2
CZ
2.5
4.3
AT
1.5 0.7
HR
1.4
-0.2
HU
2.1
0.0
RO
0.4
-0.7
SK
0.8
-0.2
CZ
1.3
0.4
AT
1.5 1.0
HR
17.0 17.2
HU
6.7 7.0
RO
6.5 6.6
SK
10.7 11.5
CZ
4.8 4.8
AT
5.9 5.8
HR
1.7 2.0
HU
5.5 4.8
RO
-0.8 -0.7
SK
2.1 1.8
CZ
1.5 1.4
AT
1.4 1.4 -2.4
RO
-2.8 -1.6
SK
-2.0 -2.7
CZ
-1.3 -1.6
AT
-1.4 -1.9
HR
-4.8 -5.5
HU
-2.0
9077
3853
41
87 9375
3952
41
85
HR HU RO SK CZ AT
* Contribution to real GDP growth. Domestic demand contribution includes inventory change. Source: Erste Group Research.
SK
0.0
RO
-0.1
1.6
HR AT
0.2
CZ
0.0
1.0
HU
0.1 0.3
-0.2
0.5 0.7 0.5

Page
Business environment – Slightly rising long-term interest rates in Q3 15, yoy down
Austria
10
Czech Republic Romania
Slovakia
Hungary
Croatia
• ECB cut discount rate to 0.05% in Sept 14 • Maintains expansionary monetary policy
stance
• National bank maintains ultra-low interest rates since November 2012 at 0.05%
• Central bank cut policy rate to historic low of 1.75% in May 2015
• As part of euro zone ECB rates are applicable in SK
• National bank restarted easing cycle in Feb 2015; cutting base rate to 1.35% in July 2015, completing easing cycle
• Central bank maintains discount rate at 7.0% since mid-2011
1.15%
0.12%
1.66%
0.25%
1-9 15 1-9 14
10YR GOV 3M Interbank
1.20%
0.34%
1.78%
0.36%
1-9 14 1-9 15
4.10%
1.81%
4.81%
2.45%
1-9 14 1-9 15
1.47%
0.12%
2.14%
0.25%
1-9 14 1-9 15
4.23%
2.10%
5.12%
2.51%
1-9 14 1-9 15 1-9 14 1-9 15
0.80% 0.68%
Q3 15
1.00%
-0.03%
Q2 15
0.68%
-0.01%
Q3 15
0.90%
0.31%
Q2 15
0.76%
0.31%
Q3 15
3.81%
1.14%
Q2 15
3.58%
1.12%
-0.03%
Q2 15
0.82%
-0.01%
Q3 15
0.98%
Q3 15
3.61%
1.37%
Q2 15
3.59%
1.65%
Q3 15
1.13%
Q2 15
0.72%
Source: Bloomberg.

Page
Business environment – Limited currency volatility in CEE
EUR/CZK
11
EUR/RON
EUR/HUF
EUR/HRK
• Czech National Bank maintains exchange rate stability; discount rate also stable at 0.05% in Q3 15
• RON movements marked by limited volatility, despite decreasing interest rates: policy rate cut to 1.75% in Q2 15
• Stable currency development, despite expansionary monetary stance of the national bank; easing cycle completed
• Strong grip of national bank on HRK is reflected in lack of volatility
-0.1%
1-9 15
27.5
1-9 14
27.5
-1.1%
Q3 15
27.1
Q2 15
27.4
-1.9%
30/09/15
27.2
31/12/14
27.7
-0.1%
1-9 15
4.44
1-9 14
4.45
-0.3%
Q3 15
4.43
Q2 15
4.44 4.42
31/12/14
4.48
-1.4%
30/09/15
+0.1%
1-9 15
308.8
1-9 14
308.6
+2.0%
Q3 15
312.1
Q2 15
306.1
-0.8%
30/09/15
313.8
31/12/14
316.3
0.0%
1-9 15
7.62
1-9 14
7.62
0.0%
Q3 15
7.58
Q2 15
7.57
31/12/14
7.66
-0.2%
30/09/15
7.65
Source: Bloomberg.

Page
Business environment – Market shares: mostly stable, RO corporate impacted by NPL sales
Gross retail loans
12
• SK: steady market share gains in a growing market
• CZ: stable qoq market share in a growing market
• RS: market share expansion driven by higher new business volumes
Gross corporate loans
• RO: continued pressure on gross loan based market share due to NPL sales
• SK: qoq increase driven mainly by high share in new investment loans
Retail deposits
• RO: successful qoq stabilisation of market share
• CZ: yoy decline in line with normal volatility, qoq stable
Corporate deposits
• Stable or improving market shares in almost all CEE markets; changes mainly due to normal quarterly volatility in corporate business
RS 4.2% 4.0% 3.5%
HR 13.9% 13.9% 13.8%
HU 14.2% 14.6% 15.2%
RO 17.8% 17.7% 18.2%
SK 27.5% 27.4% 26.7%
CZ 22.8% 22.8% 23.4%
AT 19.4% 19.1%
30/09/15 30/06/15 30/09/14
RS 3.7% 3.5%
2.8%
HR 15.0% 15.0% 15.8%
HU 5.4% 5.4% 5.8%
RO 16.0% 16.2%
18.0%
SK 11.8%
11.2% 11.3%
CZ 18.8% 18.6% 18.8%
AT 18.6% 17.7%
RS 3.2% 3.0% 3.0%
HR 13.0% 13.0% 12.8%
HU 6.5% 6.6% 6.3%
RO 16.6% 16.6% 16.9%
SK 26.3% 26.4% 26.4%
CZ 25.4% 25.5% 26.1%
AT 18.4% 18.1%
5.0% 5.0%
RS 4.1%
6.3%
HR 11.8% 11.4% 11.2%
HU 5.9% 5.8%
SK
RO 13.5% 13.4%
14.5% 12.9%
12.1% 10.6%
CZ 12.3% 11.8%
10.6%
AT 19.3% 20.1%
AT market shares for 30/09/2015 not yet available

Page
Presentation topics
13
• Executive summary • Business environment • Business performance • Assets and liabilities • Outlook • Additional information

Page
Business performance: performing loan stock & growth – Performing loan volume increases by 4% yoy, up 1% qoq
Business line view (BL)
Geographic view (geo)
14
• Sixth consecutive quarter with rising performing loan volume, due to qoq increases in CZ, SK and EBOe which more than offset declines in HU and AT/AO in line with exposure reductions
• Retail: solid yoy and qoq growth driven mainly by mortgage business and also supported by consumer loans
• LC: yoy increase driven by holding business and SK • CRE: stabilsation qoq following exposure reduction
• SK: remains growth driver based on continued Retail strength • CZ: growth (yoy and qoq) predominantly in Retail mortgages • EBOe: yoy and qoq increase driven by Retail and SME • HU: yoy decline mainly attributable to FX Retail loan conversion,
qoq decrease on early repayments mainly in Retail
RS 0.6 0.5 0.5
HR 5.7 5.6 5.5
HU 2.8 3.0 3.6
SK 9.0 8.6 7.8
RO 7.0 7.0 7.0
CZ 19.1 18.6
17.7
AT/OA 11.2 11.3 11.0
AT/EBOe 29.0 28.6
27.6
19.9 19.4 18.9
Retail 46.0 45.4 43.9
Group 121.5 120.3
116.9
OC 1.4 1.4 2.0
CRE 7.0 6.9 7.5
LC 9.7 9.5 8.1
AT/SB 36.9 36.7 35.9
SME
-2.0% -29.0%
1.8% -5.9%
2.0% 20.0%
0.4% 2.9%
2.2% 5.0%
1.4% 4.7%
1.0% 4.0%
2.4% 16.0%
0.8% 3.1%
-5.0% -21.6%
4.5% 15.6%
1.3% 0.2%
2.9% 8.2%
-1.3% 2.0%
1.4% 5.1%
QoQ YoY
in EUR bn in EUR bn
30/09/15 30/06/15 30/09/14

Page
Business performance: customer deposit stock & growth – Deposits grow by 4.5% yoy, moderately up qoq
Business line view (BL)
Geographic view (geo)
15
• Customer deposits up 2.3% ytd, qoq only slight growth, mainly driven by Retail, SME and large corporates business lines
• Retail: well balanced yoy growth across all geographies, qoq decline in EBOe
• SME: yoy inflows mainly driven by Czech Republic, partially off-set by decrease of volumes in HR and EBOe
• LC: yoy increase in SK and EBOe off-set deposit outflows on holding level, qoq growth mainly in CZ and HU
• AT/OA: qoq and yoy driven by LC and CRE outflows • CZ: yoy increase predominantly in SME, whereas qoq growth mainly
in Retail and LC • SK: yoy deposit growth broadly in line with loan growth • RO: yoy increase driven by Retail, qoq up in SME business • HR: yoy and qoq customer deposits growth mainly in Retail
RS 0.6 0.6 0.5
HR 5.5 5.2 5.1
HU 4.0 3.9 3.7
SK 10.4 10.4
9.5
RO 9.0 8.8 8.5
CZ 26.0 25.3
24.2
AT/OA 3.9 4.0 4.1
AT/EBOe 30.0 29.9 29.7
OC 0.0 0.0 0.1
CRE 1.3 1.4 1.3
LC 4.1 3.7 3.9
AT/SB 36.4 36.6 34.8
SME 11.5 11.3 10.6
Retail 66.0 65.8 63.2
Group 125.4 124.5
120.1
-54.5% -60.8%
-8.1% -0.1%
11.7% 5.1%
-0.6% 4.4%
2.0% 8.8%
0.4% 4.5%
0.7% 4.5%
5.4% 15.7%
6.0% 9.2%
2.2% 8.4%
0.5% 10.0%
2.3% 5.4%
2.5% 7.4%
-3.3% -7.1%
0.3% 1.1%
QoQ YoY
in EUR bn in EUR bn
30/09/14 30/06/15 30/09/15

Page
Business performance: NII and NIM – Stable qoq NII in Q3 15 supported by loan growth
Business line view (BL)
Geographic view (geo)
16
• Group NII marked by stability qoq supported by higher loan volumes, which were offset by lower margins (yoy and qoq)
• Retail: increase qoq and yoy on higher loan volumes, especially in CZ and SK and change in deposit structure
• SME: yoy improvements mainly in AT on higher volumes • CRE: stable yoy, decline qoq due to one-off income in Q2 15
• CZ: Improvements qoq as higher mortgage volumes in Retail off-set negative effects of persistent low interest rates
• RO: yoy and to a lesser extent qoq decrease driven by significantly lower average loan volumes and lower unwinding impact
• AT/OA: qoq decline primarily in CRE • HU: yoy decline driven by CHF conversion induced lower volumes;
qoq reduction due to early repayments mainly in Retail
105
9
64
67
116
117
230
104
152
10
68
56
114
109
228
159
10
67
47
116
106
232
100
160
RS
HR
HU
SK
RO
CZ
AT/OA
AT/EBOe
52
18
37
55
219
29
142
18
57
227
13
140
552
18
38
59
226
-7
145
558
OC
CRE
LC
AT/SB
ALM&LCC
SME
Retail 550
Group 1.112 1.113 1.126
Q3 15 Q2 15 Q3 14
2.32% 2.19% 2.16%
1.88% 2.52%
1.76% 2.26% 2.18% 2.35%
1.82% 1.83%
1.68% -0.04% 0.26%
0.41% 2.61% 2.56% 2.57%
4.44% 4.43% 4.53%
2.57% 2.59% 2.68%
3.33%
3.14%
1.45%
4.86%
4.01%
5.74%
1.40%
3.35%
3.68% 4.18%
5.66%
3.92%
3.73%
3.41%
3.24%
3.71% 3.73% 3.99%
3.13% 3.13%
1.38%
1.83% 1.86% 1.73%
in EUR m in EUR m

Page
Business performance: operating income – Q3 15 operating income stable yoy, slightly down qoq
Business line view (BL)
Geographic view (geo)
17
Highlights • Qoq decline due to net trading result and dividend
income in Q3 15 while NII stabilises; yoy flat
• Retail: NII grows slightly yoy and qoq, while qoq improvement is mainly due to fee income and net trading result
• ALM&LCC: yoy decline in NII on lower structural contribution while qoq improvement mainly due to net trading and fair value result on the back of derivatives valuations
• CRE: qoq down on one-off income in Q2 15, yoy up on improved net trading and fair value result
• GCC (prior to intragroup elimination): NII declined qoq mainly due to lower contributions from businesses not allocated to other business lines
• CZ: yoy stable as NII off-set fee pressure, qoq up on
negative impact from valuation of financial liabilities in Q2 15
• AT/OA: yoy and qoq on lower NII and dividend income, qoq down also on fee income and net trading and fair value result
• AT/SBs: yoy increase driven by fee income and NII as a result of higher loan volumes and lower interest expense, qoq down on net trading and fair value result
• AT/EBOe: up yoy and qoq on increased NII (higher loan volumes, change in deposit structure) and improved fee income
• RO: stable yoy and up qoq on strong net trading and fair value result despite decline in NII (lower unwinding, lower volumes and lower market interest rates)
• HU: yoy decline due to lower NII on shrinking loan volumes as a result of CHF conversion; qoq down due to early repayments mainly in Retail
• HR: yoy and qoq up on better fees (mainly from payment transfers and card business)
152
1457
13
103
106
153
178
354
151
326
255
43
14
103
92
152
165
342
176
365
258
54
107
86
177
358
138
342
264
Other
RS
HR
HU
SK
RO
CZ
AT/OA
AT/SB
AT/EBOe
Group 1,692 1,710 1,696
14
73
106
850
32
94
25
52
83
326
25
205
840
-8
86
20
85
365
-51
207
827
-12
46
95
17
55
83
342
6
209
IC
GCC
GM
OC
CRE
LC
AT/SB
ALM&LCC
SME
Retail
Group 1,692 1,710 1,696
Q2 15 Q3 15
Q3 14
in EUR m in EUR m

Page
Business performance: operating expenses – Q3 15 stable qoq despite EU deposit insurance contributions
Business line view (BL)
Geographic view (geo)
18
Highlights • Qoq costs almost stable despite booking of
EU deposit insurance contributions (Austria only) of EUR 17.4m in Q3 15; yoy up due to rise in personnel and IT expenses
• Retail: yoy and qoq increase due to payments in deposit insurance in AT and other administrative expenses (IT, office space)
• GCC: yoy increase mainly due to higher personnel and other administrative expenses
• AT/SB: costs up yoy on payments into deposit insurance fund and IT
• RO: yoy increase mainly due to higher personnel expenses, qoq up on IT expenses
• CZ: qoq improved on the back of lower personnel expenses
• Other: in general mirrors GCC and IC business line developments
240
161
65
1027
9
45
43
66
79
165
79
220
154
56
10
47
44
65
82
170
83
152
59
46
45
87
168
77
239
Other
RS
HR
HU
SK
RO
CZ
AT/OA
AT/SB
AT/EBOe
Group 956 949
887
24
46
-127
150
43
15
21
21
220
15
72
457
-128
180
45
15
23
240
14
77
460
-127
182
14
19
24
239
12
81
466
IC
GCC
GM
OC
CRE
LC
AT/SB
ALM&LCC
SME
Retail
Group 956 949
887
Q3 15
Q3 14 Q2 15
in EUR m in EUR m

Page
Business performance: operating result and CIR – Operating result decreases by 3.4% qoq
Business line view (BL)
Geographic view (geo)
19
63
125
87
30
3
58
87
99
190
72
105
102
-13
4
57
48
87
83
171
93
107
-5
5
61
41
90
189
61
103
103
Other
RS
HR
HU
SK
RO
CZ
AT/OA
AT/SB
AT/EBOe
Group 736
762 808
141
125
61
385
59
-118
51
10
31
62
105
10
133
383
121
-93
5
49
62
-64
130
367
114
-136
50
3
36
103
-6
128
IC
GCC
GM
OC
CRE
LC
AT/SB
ALM&LCC
SME
Retail
Group 736 762
808
Q3 15 Q2 15 Q3 14
67.1% 69.3% 73.4%
42.7% 45.2% 43.9%
52.4% 47.5%
40.6% 42.5% 43.0% 43.3%
49.1% 49.8%
44.3% 47.0% 49.8%
46.5% 55.7%
47.0% 52.4%
69.9% 65.9% 67.6%
60.9% 58.8% 60.2%
56.5% 55.5%
52.3%
42.4% 45.9%
47.8%
81.8%
28.9%
73.8% 58.5%
34.9% 32.7%
39.9%
27.4% 25.6%
35.2%
69.9% 65.9% 67.6%
38.5% 37.0%
54.8% 55.7% 54.4% 56.5% 55.5%
52.3%
in EUR m in EUR m
Not meaningful
Not meaningful
Not meaningful Not meaningful

Page
Business performance: risk costs (abs/rel*) – Risk costs decline further in Q3 15 to 44bps
Business line view (BL)
Geographic view (geo)
20
• Continued strong risk performance in Q3 15 supported by improvements in Retail and LC
• Retail: yoy improvement mainly attributable to RO, qoq also CZ, HU, SK • SME: yoy decline driven by RO, qoq increase in AT/EBOe after low Q2 15 • LC: improvements yoy almost solely in RO, qoq in Holding and CZ • CRE: yoy improvements mainly in holding CRE portfolio and at Immorent
and in RO, lower releases qoq • AT/SB: across the board historically low provisioning requirements year-to-
date
• RO: significant decline yoy and qoq in provisioning following extra provisions booked for accelerated NPL resolution in 2014
• AT/EBOe: qoq driven by SME, after releases in Q2 15 • AT/OA: yoy improvement driven by CRE (see left) • CZ: yoy and qoq down across all major business lines • HU: Return to normalised provisioning in Q3 15 • SK: yoy improvements mainly in Retail, qoq on release of provisions • HR: up yoy and qoq on difficult economic situation
4
36
40
17
36
10
3
41
61
9
19
-8
2
45
34
1
18
0
15
RS
HR
HU
SK
RO 7 15
618
CZ
AT/OA 7 70
AT/EBOe 879
184
191
27
81
57
19
91
140
43
398
21
-27
16
5
3
-10
-3
17
144
OC
CRE
LC
AT/SB
SME
Retail 113
Group
0.61% 4.69% 5.15%
-0.43% -1.15%
3.72% -0.11%
0.58% 5.74%
0.17% 0.05% 0.44%
0.98% 0.47%
3.19% 0.67% 0.95%
3.40% 0.44% 0.58%
2.75%
1.24% 1.77% 2.92% 2.57% 2.35% 2.13% 3.64%
6.13% 3.24%
0.06% 0.41% 0.82% 0.29% 0.66%
25.24% 0.37% 0.40% 0.77%
-0.01% 0.20% 2.23%
0.20% -0.11%
0.14%
Q3 15 Q2 15 Q3 14
in EUR m in EUR m
*) Relative risk costs are defined as annualised quarterly risk costs over average gross customer loans.

Page
Business performance: non-performing loans and NPL ratio – NPL ratio improves to 7.4%, reaches 5-year low
Business line view (BL)
Geographic view (geo)
21
• Continued decline of group NPL volume in Q3 15 mainly due to lower NPL inflows across all major business lines and geographic segments
• Continued improvement in migration trends with low risk share reaching pre-crisis levels at 79.0%
• Limited NPL sales of EUR 94.9m in Q3 15 (Q1 15: EUR 149.9m) • Retail: EUR 43.5m (Q2 15: EUR 51.0m ) • Corporate: EUR 51.3m (Q2 15: EUR 98.9m)
• NPL sales mainly in HR (29.0m), holding (EUR 24.5m), and RO (EUR 17.3m), minor sales in HU, SK and CZ
83 81 101
HR 1,257 1,303 1,263
HU 789 821
1,279
SK 407 413 422
RS
1,786 1,860
2,538
CZ 789 806 867
AT/OA 1,402 1,445 1,431
AT/EBOe 895 942 1,002
RO
OC 102 95 143
CRE 1,735 1,825 1,847
LC 1,030 1,072 1,164
AT/SB 2,225 2,380 2,446
SME 2,126 2,189 2,472
Retail 2,416 2,487
3,291
Group 9,717 10,102
11,422
6.7% 6.2% 6.7%
20.0% 20.9%
19.8% 9.6% 10.2%
12.6% 5.7% 6.1% 6.4%
9.7% 10.1% 11.5%
5.0% 5.2%
7.0% 7.4% 7.7% 8.9%
21.7%
4.7%
13.0% 13.0%
17.4% 18.1%
21.9%
11.1%
18.7% 18.8%
26.3% 4.3% 4.6% 5.1%
20.2%
4.0% 4.2%
26.5% 21.1%
11.3% 11.5%
3.0% 3.2% 3.5%
30/06/15 30/09/15
30/09/14
in EUR m in EUR m

Page
Business performance: allowances for loans and NPL coverage – NPL coverage excluding collateral edges up to 7-year high at 69.2%
Business line view (BL)
Geographic view (geo)
22
• NPL coverage at highest level since 2008 at 69.2% • Yoy coverage increase mainly in AT/OA and HR, qoq increase
across all geographies
• AT/EBOe: yoy drop in coverage driven by releases in Q2 15 on the back of solid collateralisation
• AT/SB: continued low provisioning requirements and solid collateralisation lead to slight decline in coverage
• HU: qoq increase following sharp yoy decline as a result of FX retail loan conversion
746769
RS
HR 813 820
743
HU 421 404
807
SK 353 353 358
RO 1,557 1,570
2,084
CZ 645 650 682
AT/OA 894 922
829
AT/EBOe 561 583 682
8753OC 76
CRE 1,024 1,090 1,102
LC 906 910 872
AT/SB 1,357 1,461 1,561
SME 1,419 1,389 1,639
Retail 1,925 1,926
2,578
Group 6,721 6,887
7,864
74.0% 55.2%
60.9% 59.0% 59.7% 59.6%
87.9% 84.9%
74.9% 61.0% 61.4% 63.8% 66.7%
63.5% 66.3%
79.7% 77.5% 78.4%
69.2% 68.2% 68.8%
83.2% 82.5%
73.0% 64.7% 62.9%
58.8% 53.4% 49.2%
63.1% 86.7% 85.6% 84.7% 87.2%
84.4% 82.1% 81.7% 80.7% 78.7%
63.7% 63.8%
57.9% 62.7% 61.9% 68.1%
30/09/14 30/06/15 30/09/15
in EUR m in EUR m

Page
Business performance: other result – Q3 15 other result burdened by CHF conversion in HR
Business line view
Geographic view
23
Highlights • Yoy improvement in group other result mainly due
to lower one-offs in Q3 15 (CHF conversion in HR in Q3 15 vs FX conversion in HU in Q3 14)
• Qoq deterioration almost solely due to provisions for CHF loan conversion in HR
• Retail: yoy improvement mainly on non-recurrence of provisions related to FX conversion charges in HU, qoq deterioration due to Croatian CHF conversion scheme
• ALM&LCC: yoy and qoq improvements mainly on participation sale in AT
• CRE: yoy and qoq improvement mainly due to lower provisions for commitments and guarantees in Q3 15
• GCC: qoq and yoy changes mainly driven by technical effects; GCC has to be read in conjunction with IC elimination
• HU: yoy improvement as Q3 14 was affected by additional provisions related to FX conversion
• RO: yoy improvement due to lower impairments • AT/OA: yoy and qoq mainly on lower provisions
for contingent credit risk liabilities • Other: see GCC explanation; Other segment
mirrors developments in GCC and IC elimination
17
0
-1
-12
-50
-11
-22
30
-8
0
-1
-9
-3
3
-24
17
-15
-14
0
-17
-4
-9
-5
-5
23
Other 14 -23
RS
HR -140
HU -4 -247
SK
RO
CZ
AT/OA
AT/SB
AT/EBOe
Group -154
-22 -344
30
-1
1
-26
-9
-6
0
17
-40
-12
17
-4
96
0
1
7
-11
23
-9
-169
IC -114 -121
-155
GCC 129 137
GM
OC
CRE
LC
AT/SB
ALM&LCC 24 -3
-40
SME
Retail -6 -273
Group -154
-22 -344
Q3 15
Q3 14 Q2 15
in EUR m in EUR m

Page
Business performance: net result – Q3 15 net result up yoy and qoq on lower risk costs, one-offs
Net result by business line
Net result by geography
24
Highlights • Continued turn-around in profitability driven by
lower risk costs and significantly reduced one-offs
• Retail: yoy stable and qoq improving underlying operating performance, Q3 14 was burdened by HU consumer loan law and higher risk costs in RO, Q3 15 impacted by CHF conversion in HR
• SME: net result driven by risk costs development • ALM&LCC: qoq improvement due to sale of non-
core participation in AT
• RO: big swing in profitability in 2015 confirmed as risk costs remain low
• HR: Q3 15 loss solely due to CHF conversion • HU: yoy improvement due to FX conversion
charges, which did not recur in Q3 15; qoq slightly up on lower risk costs
• Return on equity at 10.5% in Q3 15, following 10.2% in Q2 15 and -21.7% in Q3 14
• Cash return on equity at 10.6% in Q3 15, following 10.2% in Q2 15 and -23.3% in Q3 14
15
277
133
2-1
11
-228
44
115
-26
3
65
1
7
-19
52
51
125
43
75
261
-27
-68
-12
63
59
43
8
76
Other -90 -80
RS
HR
HU
SK
RO -458
CZ
AT/OA
AT/SB
AT/EBOe
Group -554
43
-2
39
-6
-78
-69
3
-33
-49
0
49
1
23
25
15
-51
75
0
-41
39
1
35
8
12
46
IC
GCC -64 -80
GM
OC
CRE
LC
AT/SB
ALM&LCC
SME
Retail 133
188 -279
Group 277
261 -554
Q3 15 Q2 15 Q3 14
in EUR m in EUR m

Page
Presentation topics
25
• Executive summary • Business environment • Business performance • Assets and liabilities • Outlook • Additional information

Page
Assets and liabilities: YTD overview – Loan/deposit ratio stable at 99.3% (Dec 14: 98.6%)
Assets (EUR bn)
26
Assets (in %)
Liabilities & equity (EUR bn)
Liabilities & equity (in %)
30/09/15
201.2
7.9 1.4
124.5
8.4
47.9
11.1
31/12/14
196.3
8.6 1.4
120.8
7.4
50.1
7.8
Other assets Intangibles Net loans Loans to banks Trading, financial assets Cash
30/09/15
201.2
14.4 6.9
30.6
125.4
17.4 6.4
31/12/14
196.3
13.4 6.6
31.1
122.6
14.8 7.7
Equity Other liabilities Debt securities Customer deposits Bank deposits Trading liabilities
100%
30/09/15
3.9% 0.7%
61.9%
4.2%
23.8%
5.5%
31/12/14
4.4% 0.7%
61.6%
3.8%
25.5%
4.0% 100%
30/09/15
7.2% 3.4%
15.2%
62.4%
8.7% 3.2%
31/12/14
6.8% 3.3%
15.9%
62.5%
7.5% 3.9%

Page
Assets and liabilities: customer loans by country of risk – Performing loans up 3.3% yoy, NPLs down 14.9%
Net customer loans (EUR bn)
Performing loans (EUR bn)
27
Non-performing loans (EUR bn)
• Performing loan growth accelerates, driven by Austria, Slovakia and Czech Republic, Other EU: • Main contributing business lines: Retail, SME and Large Corporates • Continued stabilisation in performing loans in Romania, continued decline in Hungary
• 14.9% yoy decline in NPL stock mainly driven by NPL sales and positive migration trends across most geographies
+3.3%
30/09/15
124.5
66.6
20.0
9.6 8.0
4.0 6.6 0.7 5.9
3.2
31/12/14
120.8
64.7
7.9 4.3
6.6 0.8 5.7 3.2
30/09/14
120.5
63.9
19.0
8.3 8.2
4.8 6.5 0.9 5.8 3.2
19.1
8.5
AT CZ SK RO HU HR RS Other EU Other
0.8 5.4 3.2
30/09/14
116.9
62.9
18.7
8.2 7.7
4.2 5.9 0.8 5.3 3.1
+4.0%
30/09/15
121.5
65.5
19.8
9.5 7.7
3.5 6.0 0.6 5.6
3.2
31/12/14
117.4
63.7
18.8
8.3 7.5
3.8 6.0
-14.9%
30/09/15
9.7
2.6
1.0 0.6
1.9
0.9
1.5 0.2 0.6 0.5
31/12/14
10.9
2.9
1.0 0.5
2.3
1.3
1.6 0.2
0.7 0.5
30/09/14
11.4
2.9
1.0 0.5
2.7
1.4
1.5 0.1
0.8 0.4

Page
Assets and liabilities: allowances for customer loans – Decrease in allowances mainly due to continued NPL reduction in Q3 15
Quarterly development (EUR m)
28
Highlights • Low gross NPL inflows result in lower
allocations and lower risk costs in Q3 15 • Moderate level of NPL sales in Q3 15 • P&L unwinding impact = interest income
from impaired loans = EUR 39m in Q3 15 (Q3 14: EUR 46m, Q2 15: EUR 47m)
22
638158
989
417572
385
58043
305428
581491
428
675
30/09/15
6,717 39 23
30/06/15
47
31/03/15
7,170 39 6,882
31/12/14
7,487
30/09/14
7,864
108
Exchange-rate and other changes (+/-) Releases
Interest income from impaired loans Use Allocations
• Erste Group does not accrue interest on NPLs • When a loan turns NPL Erste Group estimates
the recoverable amount and the time frame of recovery
• The recoverable amount is discounted to present (at the effective interest rate of the underlying contract) and a provision reflecting the time value of money is created, ie a higher provision than without discounting
• The time value is released through NII until recovery realisation
Unwinding impact explained

Page
Assets and liabilities: financial and trading assets * – LCR at comfortable 120%
By geography (EUR bn)
By debtor type
29
Liquidity buffer (EUR bn)
• Liquidity buffer is defined as unencumbered collateral plus cash
• Total liabilities are defined as total on balance sheet liabilities excluding total equity
-2.9%
30/09/15
42.2
11.5
8.4
6.3
4.5 1.5 1.3
8.7
31/12/14
43.5
11.8
8.6
6.0
4.8 1.2 2.1
9.1
30/09/14
43.4
12.1
8.4
6.3
5.0 1.3 2.1
8.2
AT CZ SK
RO HU DE Other
100%
30/09/15
80.5%
9.5% 10.1%
31/12/14
77.2%
11.2%
11.6%
30/09/14
76.7%
12.1%
11.2%
Sovereign Banks Other
30/09/15
45.7
24.5%
31/12/14
45.4
24.8%
31/12/13
39.8
21.5%
31/12/12
40.1
20.3%
Liquidity buffer as % of total liabilities Liquidity buffer
* Excludes derivatives held for trading.

Page
Assets and liabilities: customer deposit funding – Customer deposits grow by 2.3% ytd, up 4.5% yoy
By customer type
By product type
30
Highlights • Erste Group benefits from excellent funding
position in retail segment • Decline in corporate deposits ytd driven by
significantly higher volatility than in retail • Increasing share of overnight deposits
provides a cost effective funding source
30/09/15
125.4
70.7
53.9
0.6 0.2
31/12/14
122.6
65.1
56.6
0.6 0.3
30/09/14
120.1
59.8
59.4
0.5 0.4
Overnight deposits Term deposits Repurchase agreements FV deposits
+4.5%
30/09/15
125.4
89.9
21.5
7.9 5.9 0.2
31/12/14
122.6
87.9
21.5
8.0 4.9 0.3
30/09/14
120.1
86.1
19.1
8.4 6.1 0.4
Households
Other financial corporations Non-financial corporations
General governments FV deposits

Page
Assets and liabilities: debt vs interbank funding – Stable wholesale funding base
Debt securities issued (EUR bn)
Interbank deposits (EUR bn)
31
• Qoq increase in mortgage covered bonds after issuance of a EUR 500m 5y CB at MS+3bp
• Decline in senior unsecured bonds due to maturities
• Qoq and yoy increase in interbank deposits in line with increased placements to the Federal Reserve
30/09/15
30.6
0.2 1.8
8.2
1.2 0.5
12.5
0.4 0.4 5.4
30/06/15
31.1
0.3 2.8
7.2
0.7 0.3
14.1
0.4 0.9 4.5
30/09/14
-1.9%
0.3 2.8
7.2
0.9
31.2
13.9
0.4 1.1 4.0
0.5
Other Public sector CBs Mortgage CBs Other CDs, name cert’s Certificates of deposit Senior unsec. bonds Hybrid issues Suppl. capital Sub debt
+5.7%
30/09/15
17.4
1.5
12.8
3.1
30/06/15
15.7
1.5
10.3
3.9
30/09/14
16.5
1.5
9.6
5.4 Repurchase agreements Term deposits Overnight deposits

Page
Assets and liabilities: LT funding – Limited LT funding needs
Maturity profile of debt (EUR bn)
32
• In September Erste Group benefited from the favourable market environment to issue a 5y EUR denominated mortgage Pfandbrief at MS+3bp after January’s 10y transaction
• YTD issuance activities amount to more than EUR 2bn which leads to a comfortable liquidity situation in Q4 2015 • Next year’s redemptions translate in an ongoing need for Pfandbriefe
2027+
1.0
2026
0.4
2025
1.0
2024
0.7
2023
1.0
2022
2.7
2021
2.7
2020
2.6
2019
1.9
2018
2.7
2017
2.6
2016
4.2
2015
1.0
Senior unsec. bonds Covered bonds Debt CEE Capital exc Tier 1

Page
Assets and liabilities: capital position – Clean B3FL CET1 ratio at 11.6%
Basel 3 capital (phased-in)
Risk-weighted assets (phased-in)
33
Basel 3 capital ratios (phased-in)
• Increase in B3FL CET1 capital by EUR 611m ytd despite non-inclusion of Q3 15 retained earnings and deduction of Q3 15 risk costs
• Qoq stable credit RWA • Qoq increase in operational risk (driven by
property damage cases) accompanied by lower trading risk
• B3FL RWA stable at EUR 101.6bn
• B3FL CET1 ratio at 11.2% at 30 Sept 2015 (YE 2014: 10.6%) mainly driven by temporary capital effects (see left)
• B3FL total capital ratio at 16.3%
30/09/15
16.9
11.6
0.0
5.3
0.0
30/06/15
16.8
11.6
0.0
5.2
0.0
31/03/15
16.1
10.7
0.0
5.4
0.0
31/12/14
15.8
10.6
0.0
5.2
0.0
30/09/14
15.7
10.9
0.0
4.9
0.0
CET1 AT1 Tier 2 Tier 3
30/06/15
100.3
85.7
10.9 3.6
31/03/15
101.8
87.6
10.8 3.4
31/12/14
100.6
87.1
10.3 3.2
30/09/14
100.6
87.2
10.7 2.7
30/09/15
100.4
85.8
11.5 3.0
Credit RWA Op risk Trading risk
30/06/15
16.8
%
11.6
%
11.6
%
31/03/15
15.8
%
10.5
%
10.5
%
31/12/14
15.7
%
10.6
%
10.6
%
30/09/14
15.7
%
10.8
%
10.8
%
30/09/15
11.5
%
11.5
%
16.8
%
Total capital Tier 1 CET1

Page
Presentation topics
34
• Executive summary • Business environment • Business performance • Assets and liabilities • Outlook • Additional information

Page
Conclusion – Outlook • Operating environment anticipated to be conducive to credit expansion
• Real GDP growth of between 2-4% expected in 2015 in all major CEE markets, except Croatia • Real GDP growth to be driven by solid domestic demand • Real GDP growth in Austria expected at below 1% in 2015
• Return on tangible equity (ROTE) expected at about 10% in 2015
• Operating result expected to decline in the mid-single digits • Loan growth expected in the low single digits in 2015 • Risk costs guidance of EUR 750-950m reflects accounting treatment of Croatian CHF conversion
costs of EUR 144.9m in other operating result • Banking levies expected at about EUR 320m in 2015, including parallel contributions to national as
well as European bank resolution and deposit insurance funds; related discussions with Austrian government still ongoing
• Return on tangible equity (ROTE) expected at about 10-11% in 2016
• Risks to guidance • Consumer protection initiatives • Geopolitical risks resulting in potentially negative economic impacts
35

Page
Presentation topics
36
• Executive summary • Business environment • Business performance • Assets and liabilities • Outlook • Additional information

Page
Additional information: new segmentation – Business line and geographic view
Retail
Erste Group – Business segments
SME ALM &
Local CC (ALM&LCC)
Savings Banks
(AT/SB)
Large Corporates
(LC)
Commercial Real Estate
(CRE)
Other Corporate
(OC)
Group Markets
(GM)
Group Corporate
Center (GCC)
Intragroup Elimination
(IC)
Erste Group – Geographical segmentation
Austria Central and Eastern Europe Other
EBOe & Subsidiaries (AT/EBOe)
Savings Banks (AT/SB)
Other Austria
(AT/OA)
Czech Republic
(CZ)
Romania (RO)
Slovakia (SK)
Hungary (HU)
Croatia (HR)
Serbia (RS)
• Holding Business • Erste Group Immorent • Erste Asset Management
• Asset/Liability Management • Local Corporate Center
• Investment Banking • International Business
• Other Subsidiaries • Group bookings • Holding Corporate Center • Free Capital
• Holding ALM • Holding CC • Other Subsidiaries • Group bookings and
IC elimination • Free Capital
37

Page
Additional information: income statement – Year-to-date and quarterly view
38
in EUR million 1-9 14 1-9 15 YOY-Δ Q3 14 Q2 15 Q3 15 YOY-Δ QOQ-ΔNet interest income 3,369.6 3,324.3 -1.3% 1,126.0 1,113.4 1,112.3 -1.2% -0.1%Net fee and commission income 1,372.7 1,372.6 0.0% 465.8 456.3 455.2 -2.3% -0.2%Dividend income 62.9 43.3 -31.2% 33.0 24.8 11.2 -66.1% -54.8%Net trading and fair value result 166.5 193.0 15.9% 28.4 64.1 56.4 98.4% -12.1%Net result from equity method investments 11.6 14.4 24.1% 0.1 5.0 4.7 >100.0% -6.3%Rental income from investment properties & other operating leases 134.1 143.5 7.0% 42.5 46.6 51.7 21.8% 11.0%Personnel expenses -1,607.0 -1,667.5 3.8% -515.0 -559.9 -553.6 7.5% -1.1%Other administrative expenses -821.9 -855.2 4.1% -264.2 -278.5 -295.6 11.9% 6.2%Depreciation and amortisation -354.8 -329.7 -7.1% -108.0 -110.4 -106.4 -1.5% -3.6%Gains/losses from financial assets and liabilities not measured at fair value through profit or loss, net 14.3 58.8 >100.0% 13.2 25.2 22.8 73.0% -9.5%Net impairment loss on financial assets not measured at fair value through profit or loss -1,599.4 -518.4 -67.6% -878.8 -190.8 -144.4 -83.6% -24.3%Other operating result -1,628.6 -377.4 -76.8% -356.8 -47.1 -176.8 -50.4% >100.0%
Levies on banking activities -208.7 -187.7 -10.0% -54.6 -45.4 -50.5 -7.5% 11.2%Pre-tax result from continuing operations -879.9 1,401.5 n/a -414.0 548.8 437.4 n/a -20.3%Taxes on income -446.0 -362.3 -18.8% -98.3 -154.8 -88.9 -9.6% -42.6%Net result for the period -1,325.9 1,039.2 n/a -512.3 394.0 348.5 n/a -11.6%
Net result attributable to non-controlling interests 98.7 275.0 >100.0% 42.0 132.6 71.6 70.6% -46.0%Net result attributable to owners of the parent -1,424.6 764.2 n/a -554.2 261.4 276.9 n/a 5.9%
Operating income 5,117.5 5,090.9 -0.5% 1,695.8 1,710.3 1,691.6 -0.3% -1.1%Operating expenses -2,783.7 -2,852.4 2.5% -887.3 -948.7 -955.6 7.7% 0.7%Operating result 2,333.8 2,238.5 -4.1% 808.5 761.6 735.9 -9.0% -3.4%
Year-to-date view Quarterly view

Page
Additional information: group balance sheet – Assets
39
in EUR million Sep 14 Dec 14 Mar 15 Jun 15 Sep 15 YOY-Δ YTD-Δ QOQ-ΔCash and cash balances 8,010 7,835 8,223 7,011 11,097 38.5% 41.6% 58.3%Financial assets - held for trading 11,641 10,531 11,366 9,022 8,805 -24.4% -16.4% -2.4%
Derivatives 7,611 7,173 7,628 5,613 5,633 -26.0% -21.5% 0.4%Other trading assets 4,030 3,357 3,738 3,409 3,172 -21.3% -5.5% -6.9%
Financial assets - at fair value through profit or loss 444 350 271 269 332 -25.2% -5.1% 23.2%Financial assets - available for sale 21,940 22,373 23,187 21,804 21,187 -3.4% -5.3% -2.8%Financial assets - held to maturity 17,026 16,877 17,462 17,949 17,585 3.3% 4.2% -2.0%Loans and receivables to credit institutions 7,166 7,442 8,345 8,775 8,384 17.0% 12.7% -4.5%Loans and receivables to customers 120,451 120,834 123,437 123,504 124,521 3.4% 3.1% 0.8%Derivatives - hedge accounting 2,764 2,872 2,914 2,181 2,284 -17.4% -20.5% 4.7%Changes in fair value of portfolio hedged items 0 0 0 0 0 n/a n/a n/aProperty and equipment 2,356 2,264 2,340 2,330 2,368 0.5% 4.6% 1.6%Investment properties 952 950 947 805 751 -21.1% -20.9% -6.6%Intangible assets 1,456 1,441 1,415 1,395 1,393 -4.4% -3.4% -0.2%Investments in associates and joint ventures 191 195 190 194 164 -13.9% -15.8% -15.4%Current tax assets 107 107 107 150 166 55.6% 54.9% 10.5%Deferred tax assets 461 301 293 255 234 -49.1% -22.3% -8.2%Assets held for sale 150 291 229 429 487 >100.0% 67.1% 13.4%Other assets 1,859 1,623 1,844 1,457 1,411 -24.1% -13.0% -3.1%Total assets 196,973 196,287 202,570 197,532 201,171 2.1% 2.5% 1.8%
Quarterly data Change

Page
Additional information: group balance sheet – Liabilities and equity
40
in EUR million Sep 14 Dec 14 Mar 15 Jun 15 Sep 15 YOY-Δ YTD-Δ QOQ-ΔFinancial liabilities - held for trading 8,488 7,746 8,988 6,632 6,364 -25.0% -17.8% -4.0%
Derivatives 7,563 7,188 8,163 5,875 5,654 -25.2% -21.3% -3.8%Other trading liabilities 925 558 824 758 711 -23.2% 27.3% -6.2%
Financial liabilities - at fair value through profit or loss 2,161 2,073 1,966 1,881 1,907 -11.8% -8.0% 1.4%Deposits from banks 0 0 0 0 0 n/a n/a n/aDeposits from customers 363 320 257 237 197 -45.8% -38.4% -17.0%Debt securities issued 1,797 1,753 1,709 1,644 1,710 -4.9% -2.4% 4.0%Other financial liabilities 0 0 0 0 0 n/a n/a n/a
Financial liabilities measured at amortised cost 166,139 166,921 170,616 168,769 172,186 3.6% 3.2% 2.0%Deposits from banks 16,483 14,803 16,389 15,704 17,414 5.7% 17.6% 10.9%Deposits from customers 119,698 122,263 124,495 124,296 125,242 4.6% 2.4% 0.8%Debt securities issued 29,414 29,387 29,143 28,270 28,910 -1.7% -1.6% 2.3%Other financial liabilities 545 469 590 497 620 13.8% 32.1% 24.6%
Derivatives - hedge accounting 755 726 833 639 621 -17.8% -14.5% -2.8%Changes in fair value of portfolio hedged items 1,072 1,225 1,277 962 1,013 -5.5% -17.3% 5.3%Provisions 1,822 1,653 1,688 1,608 1,752 -3.9% 6.0% 8.9%Current tax liabilities 95 91 111 121 120 26.3% 31.7% -1.3%Deferred tax liabilities 199 99 140 85 92 -53.9% -7.0% 8.1%Liabilities associated with assets held for sale 0 0 0 33 33 n/a n/a -0.6%Other liabilities 2,590 2,310 2,996 2,786 2,647 2.2% 14.6% -5.0%Total equity 13,652 13,443 13,956 14,015 14,437 5.8% 7.4% 3.0%
Equity attributable to non-controlling interests 3,707 3,605 3,718 3,701 3,746 1.1% 3.9% 1.2%Equity attributable to owners of the parent 9,945 9,838 10,238 10,314 10,691 7.5% 8.7% 3.7%
Total liabilities and equity 196,973 196,287 202,570 197,532 201,171 2.1% 2.5% 1.8%
Quarterly data Change

Page
Additional information: gross customer loans – By risk category, by currency, by industry
Gross cust. loans by risk category (EUR bn)
41
Gross customer loans by currency (EUR bn) Gross customer loans by industry (EUR bn)
Gross customer loans by risk category in %
Gross customer loans by currency in %
30/06/15
130.4
102.0
15.5 2.8 10.1
31/03/15
130.6
100.9
16.0 3.1 10.6
31/12/14
128.3
98.9
30/09/14
128.3
97.3
16.1 3.5
11.4
30/09/15
131.2
103.6
15.2 2.7 9.7
3.0 10.9 15.6
Low risk
Management attention
Substandard
Non-performing
100%
30/06/15
78.2%
11.9% 2.1% 7.7%
31/03/15
77.3%
12.3% 2.4%
31/12/14
77.1%
12.1% 2.3% 8.5%
30/09/14
75.9%
12.5% 2.7%
8.9%
30/09/15
79.0%
11.6% 2.0% 7.4% 8.1%
130.6
92.4
25.8
8.1 1.8 2.5
31/12/14
128.3
91.6
23.8 9.1
1.7
92.5
30/09/14
128.3
90.6
24.1
9.9 1.8 2.0
30/06/15
130.4
26.1
7.8 1.7 2.4
31/03/15 30/09/15
131.2 2.2
26.5
7.1 1.6 2.4
93.6
EUR CEE-LCY CHF Other USD
30/06/15
70.9%
20.0% 6.0%
1.3% 1.8%
31/03/15
70.7%
19.8% 6.2% 1.4% 1.9%
31/12/14
71.4%
18.5% 7.1%
1.3% 1.7%
30/09/14
70.6%
18.8% 7.7%
1.4% 1.5%
30/09/15
71.3%
20.2% 5.4%
1.2% 1.8%
30/06/15
130.4
53.2
20.6
9.5
8.0
6.5 6.1
5.0 3.7
3.4 8.5
31/03/15
130.6
52.7
5.8
20.8
9.5
8.0
6.4 6.1 6.3 5.1
3.6 3.5
8.6
31/12/14
128.3
51.8
20.6
9.3
7.9 6.2 6.1 5.9 4.9
3.6 3.5 8.4
30/09/14
128.3
52.2
20.3
9.2
8.1
6.3 5.8 5.8 4.7
3.6 3.6 8.5
30/09/15
131.2
53.7
20.8
9.5
8.0 6.6 6.2 5.5 5.1
3.7 3.6 8.7
Manufacturing
Households
Real estate
Trade
Construction
Public admin
Financial inst.
Services
Tourism
Transport & comms
Other

Page
• Leading retail and corporate bank in 7 geographically connected countries
• Favourable mix of mature & emerging markets with low penetration rates
• Potential for cross selling and organic growth in CEE
Additional information: footprint – Customer banking in Austria and the eastern part of the EU
Erste Group footprint Highlights
42
Direct presence
Indirect presence
Customers: 0.8m
Hungary
Employees: 2,873
Branches: 128
Customers: 2.9m
Romania
Employees: 7,059
Branches: 508
Customers: 0.4m
Serbia
Employees: 981
Branches: 68
Customers : 1.2m
Croatia
Employees : 2,831
Branches: 158
Customers: 4.8m
Czech Republic
Employees: 10,522
Branches: 626
Customers: 2.3m
Slovakia
Employees: 4,243
Branches: 289
Customers: 3.4m
Austria
Employees: 15,646
Branches: 952
AT
CZ
SK
HU
RO HR
RS

Page
Additional information: strategy – A real customer need is the reason for all business
Retail banking
Corporate banking
Capital markets
Public sector
Interbank business
Customer banking in Central and Eastern Europe
Eastern part of EU Focus on CEE, limited exposure to other Europe
Focus on local currency mortgage and consumer loans funded by local deposits FX loans only in EUR for clients with EUR income (or equivalent) and where funded by local FX deposits (HR & RS) Savings products, asset management and pension products Potential future expansion into Poland
Focus on customer business, incl. customer-based trading activities In addition to core markets, presences in Poland, Turkey, Germany and London with institutional client focus and selected product mix Building debt and equity capital markets in CEE
Financing sovereigns and municipalities with focus on infrastructure development in core markets Any sovereign holdings are only held for market-making, liquidity or balance sheet management reasons
Large, local corporate and SME banking Advisory services, with focus on providing access to capital markets and corporate finance Real estate business that goes beyond financing Potential future expansion into Poland
Focus on banks that operate in the core markets Any bank exposure is only held for liquidity or balance sheet management reasons or to support client business
43

Page
Additional information: shareholder structure – Total number of shares: 429,800,000
By investor By region
44
* Including voting rights of Erste Foundation, savings banks, savings banks foundations and Wiener Städtische Wechselseitige Versicherungsverein
9.9%
Erste Stiftung indirect * 9.4%
Erste Stiftung direct
10.3% Harbor International Fund
54.6%
Employees 6.0%
Retail
4.1%
Institutional
0.9%
4.9%
Caixa
Uniqa Versicherungsverein Privatstiftung Other
Continental Europe 25.5%
38.2%
2.9%
North America
9.8%
23.6%
UK & Ireland
Austria

Page
Investor relations details
• Erste Group Bank AG, Milchgasse 1 (mezzanine floor), 1010 Vienna Fax : +43 (0)5 0100-13112 E-mail: [email protected] Internet: http://www.erstegroup.com/investorrelations
http://twitter.com/ErsteGroupIR http://www.slideshare.net/Erste_Group Erste Group IR App for iPad, iPhone and Android http://www.erstegroup.com/de/Investoren/IR_App
Reuters: ERST.VI Bloomberg: EBS AV Datastream: O:ERS ISIN: AT0000652011
• Contacts Thomas Sommerauer Tel: +43 (0)5 0100 17326 e-mail: [email protected] Peter Makray Tel: +43 (0)5 0100 16878 e-mail: [email protected] Simone Pilz Tel: +43 (0)5 0100 13036 e-mail: [email protected] Gerald Krames Tel: +43 (0)5 0100 12751 e-mail: [email protected]
45