Embed Size (px)
Citation preview

Financial Results Earnings Call Presentation
2015 September

Earnings Call Presentation 15Q3 results are in line with the strategic plan
2
1.103 1.094
1.354 1.236
14Q3 15Q3
Excluding MTPL business and non-
recurring businesses, Aksigorta
GWP growth in ’15Q3, YtD is -1%
Premium Production (million TL)
Excluding MTPL business and one-
off claims in fire, Combined Ratio
in ’15Q3, YtD is 98% 99% 98%
124%
14Q3 15Q3
Combined Ratio
Excluding MTPL business and one-off claims in fire, Net Profit in ’15Q3, YtD is 70 mTL
33
-109
51 70
14Q3 15Q3
Net Income/Loss (million TL)
-1%
-1pp
38%
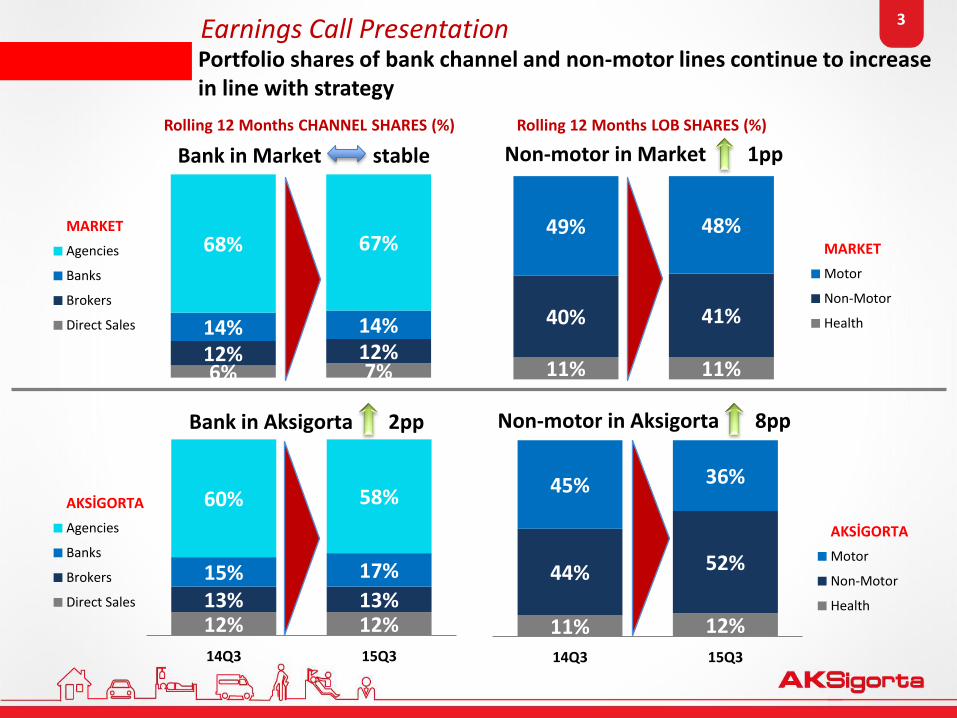
Earnings Call Presentation Portfolio shares of bank channel and non-motor lines continue to increase in line with strategy
3
6% 7% 12% 12% 14% 14%
68% 67% MARKET
Agencies
Banks
Brokers
Direct Sales
Bank in Market stable
12% 12% 13% 13% 15% 17%
60% 58%
14Q3 15Q3
AKSİGORTA
Agencies
Banks
Brokers
Direct Sales
Bank in Aksigorta 2pp
11% 11%
40% 41%
49% 48% MARKET
Motor
Non-Motor
Health
Non-motor in Market 1pp
11% 12%
44% 52%
45% 36%
14Q3 15Q3
AKSİGORTA
Motor
Non-Motor
Health
Non-motor in Aksigorta 8pp
Rolling 12 Months CHANNEL SHARES (%) Rolling 12 Months LOB SHARES (%)
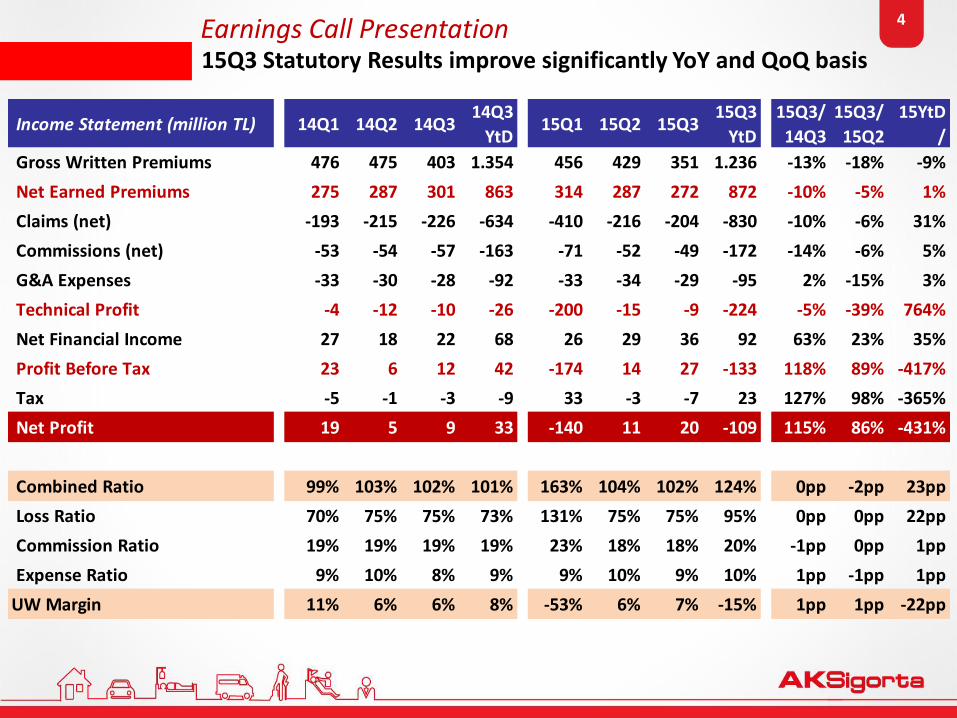
Earnings Call Presentation 15Q3 Statutory Results improve significantly YoY and QoQ basis
4
Income Statement (million TL) 14Q1 14Q2 14Q314Q3
YtD15Q1 15Q2 15Q3
15Q3
YtD
15Q3/
14Q3
15Q3/
15Q2
15YtD
/
Gross Written Premiums 476 475 403 1.354 456 429 351 1.236 -13% -18% -9%
Net Earned Premiums 275 287 301 863 314 287 272 872 -10% -5% 1%
Claims (net) -193 -215 -226 -634 -410 -216 -204 -830 -10% -6% 31%
Commissions (net) -53 -54 -57 -163 -71 -52 -49 -172 -14% -6% 5%
G&A Expenses -33 -30 -28 -92 -33 -34 -29 -95 2% -15% 3%
Technical Profit -4 -12 -10 -26 -200 -15 -9 -224 -5% -39% 764%
Net Financial Income 27 18 22 68 26 29 36 92 63% 23% 35%
Profit Before Tax 23 6 12 42 -174 14 27 -133 118% 89% -417%
Tax -5 -1 -3 -9 33 -3 -7 23 127% 98% -365%
Net Profit 19 5 9 33 -140 11 20 -109 115% 86% -431%
Combined Ratio 99% 103% 102% 101% 163% 104% 102% 124% 0pp -2pp 23pp
Loss Ratio 70% 75% 75% 73% 131% 75% 75% 95% 0pp 0pp 22pp
Commission Ratio 19% 19% 19% 19% 23% 18% 18% 20% -1pp 0pp 1pp
Expense Ratio 9% 10% 8% 9% 9% 10% 9% 10% 1pp -1pp 1pp
UW Margin 11% 6% 6% 8% -53% 6% 7% -15% 1pp 1pp -22pp
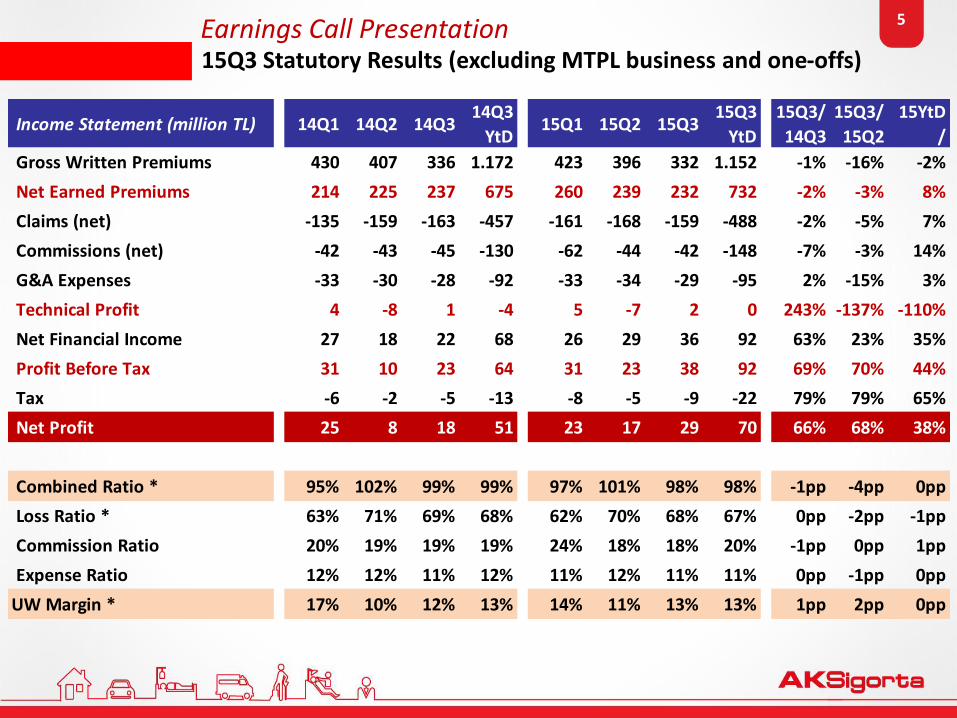
Earnings Call Presentation 15Q3 Statutory Results (excluding MTPL business and one-offs)
5
Income Statement (million TL) 14Q1 14Q2 14Q314Q3
YtD15Q1 15Q2 15Q3
15Q3
YtD
15Q3/
14Q3
15Q3/
15Q2
15YtD
/
Gross Written Premiums 430 407 336 1.172 423 396 332 1.152 -1% -16% -2%
Net Earned Premiums 214 225 237 675 260 239 232 732 -2% -3% 8%
Claims (net) -135 -159 -163 -457 -161 -168 -159 -488 -2% -5% 7%
Commissions (net) -42 -43 -45 -130 -62 -44 -42 -148 -7% -3% 14%
G&A Expenses -33 -30 -28 -92 -33 -34 -29 -95 2% -15% 3%
Technical Profit 4 -8 1 -4 5 -7 2 0 243% -137% -110%
Net Financial Income 27 18 22 68 26 29 36 92 63% 23% 35%
Profit Before Tax 31 10 23 64 31 23 38 92 69% 70% 44%
Tax -6 -2 -5 -13 -8 -5 -9 -22 79% 79% 65%
Net Profit 25 8 18 51 23 17 29 70 66% 68% 38%
Combined Ratio * 95% 102% 99% 99% 97% 101% 98% 98% -1pp -4pp 0pp
Loss Ratio * 63% 71% 69% 68% 62% 70% 68% 67% 0pp -2pp -1pp
Commission Ratio 20% 19% 19% 19% 24% 18% 18% 20% -1pp 0pp 1pp
Expense Ratio 12% 12% 11% 12% 11% 12% 11% 11% 0pp -1pp 0pp
UW Margin * 17% 10% 12% 13% 14% 11% 13% 13% 1pp 2pp 0pp

Earnings Call Presentation 15Q3 IFRS Results
6
Income Statement (million TL) 14Q1 14Q2 14Q314Q3
YtD15Q1 15Q2 15Q3
15Q3
YtD
15Q3/
14Q3
15Q3/
15Q2
15YtD
/
Gross Written Premiums 476 475 403 1.354 456 429 351 1.236 -13% -18% -9%
Net Earned Premiums 277 287 301 864 314 287 272 872 -10% -5% 1%
Claims (net) -165 -227 -239 -631 -235 -212 -200 -647 -16% -6% 3%
Commissions (net) -53 -54 -57 -163 -71 -52 -49 -172 -14% -6% 5%
G&A Expenses -33 -30 -28 -91 -33 -34 -28 -94 2% -16% 3%
Technical Profit 26 -25 -23 -21 -25 -11 -6 -41 -76% -48% 95%
Net Financial Income 27 18 22 68 26 29 36 92 63% 23% 35%
Profit Before Tax 54 -6 -1 47 1 18 30 50 -3512% 65% 8%
Tax -5 -3 -2 -10 -2 -4 -7 -13 230% 75% 39%
Net Profit 49 -9 -3 37 0 14 23 37 -836% 62% 0%
Combined Ratio 88% 108% 107% 101% 107% 102% 101% 104% -6pp -1pp 3pp
Loss Ratio 59% 79% 80% 73% 75% 74% 74% 74% -6pp 0pp 1pp
Commission Ratio 19% 19% 19% 19% 23% 18% 18% 20% -1pp 0pp 1pp
Expense Ratio 9% 10% 8% 9% 9% 10% 9% 10% 1pp -1pp 1pp
UW Margin 21% 2% 2% 8% 2% 8% 8% 6% 7pp 0pp -2pp

Earnings Call Presentation 15Q3 IFRS Results (excluding MTPL business and one-offs) gives guidance for Q4 and 2016 as monthly MTPL MS is at 0.1%
7
Income Statement (million TL) 14Q1 14Q2 14Q314Q3
YtD15Q1 15Q2 15Q3
15Q3
YtD
15Q3/
14Q3
15Q3/
15Q2
15YtD
/
Gross Written Premiums 430 407 336 1.172 423 396 332 1.152 -1% -16% -2%
Net Earned Premiums 215 224 237 676 260 239 232 732 -2% -3% 8%
Claims (net) -120 -163 -164 -447 -163 -167 -156 -487 -5% -7% 9%
Commissions (net) -42 -43 -45 -130 -62 -44 -42 -148 -7% -4% 14%
G&A Expenses -33 -30 -28 -91 -33 -34 -28 -94 2% -16% 3%
Technical Profit 19 -12 0 7 2 -6 6 2 -1449% -199% -72%
Net Financial Income 27 18 22 68 26 29 36 92 63% 23% 35%
Profit Before Tax 47 7 22 75 29 24 42 94 92% 77% 25%
Tax -3 -5 -7 -15 -7 -5 -10 -22 43% 84% 44%
Net Profit 44 1 15 60 21 18 32 72 115% 74% 20%
Combined Ratio * 87% 104% 99% 97% 98% 101% 96% 98% -3pp -4pp 1pp
Loss Ratio * 56% 72% 69% 66% 63% 70% 67% 67% -2pp -3pp 0pp
Commission Ratio 20% 19% 19% 19% 24% 18% 18% 20% -1pp 0pp 1pp
Expense Ratio 12% 12% 11% 12% 11% 12% 11% 11% 0pp -1pp 0pp
UW Margin * 24% 8% 12% 15% 13% 12% 15% 13% 3pp 3pp -1pp

Earnings Call Presentation 15Q3 Balance Sheet
8
*Excludng MTPL business and one offs
(TL Million) 14YE 15Q1 15Q2 15Q3 Cash and Marketable Securities 902 901 923 970 Receivables 523 559 615 564 Other Assets 155 216 199 173 Participations 8 8 8 8 Fixed Assets 51 54 58 58 Total Assets 1.640 1.738 1.803 1.774 Payables 134 172 238 230 Technical Reserves 921 1132 1121 1090 Taxes Payable 8 0 0 0 Other Liabilities 70 88 90 79 Total Shareholders' Equity 508 345 355 375 Total Liabilities and Equity 1.640 1.738 1.803 1.774
ROE * 16% 18% 21% 22%Capital Adequacy Ratio 147% 100% 106% 110%

Earnings Call Presentation 15Q3 IFRS Balance Sheet
9
*Excludng MTPL business and one offs
(TL Million) 14YE 15Q1 15Q2 15Q3 Cash and Marketable Securities 902 901 923 970 Receivables 523 559 615 564 Other Assets 184 208 192 166 Participations 8 8 8 8 Fixed Assets 51 54 58 58 Total Assets 1.669 1.730 1.796 1.766 Payables 134 172 238 230 Technical Reserves 1065 1100 1085 1051 Taxes Payable 8 0 0 0 Other Liabilities 70 88 90 79 Total Shareholders' Equity 392 369 383 405 Total Liabilities and Equity 1.669 1.730 1.796 1.766
ROE * 21% 18% 20% 24%Capital Adequacy Ratio 147% 100% 106% 110%
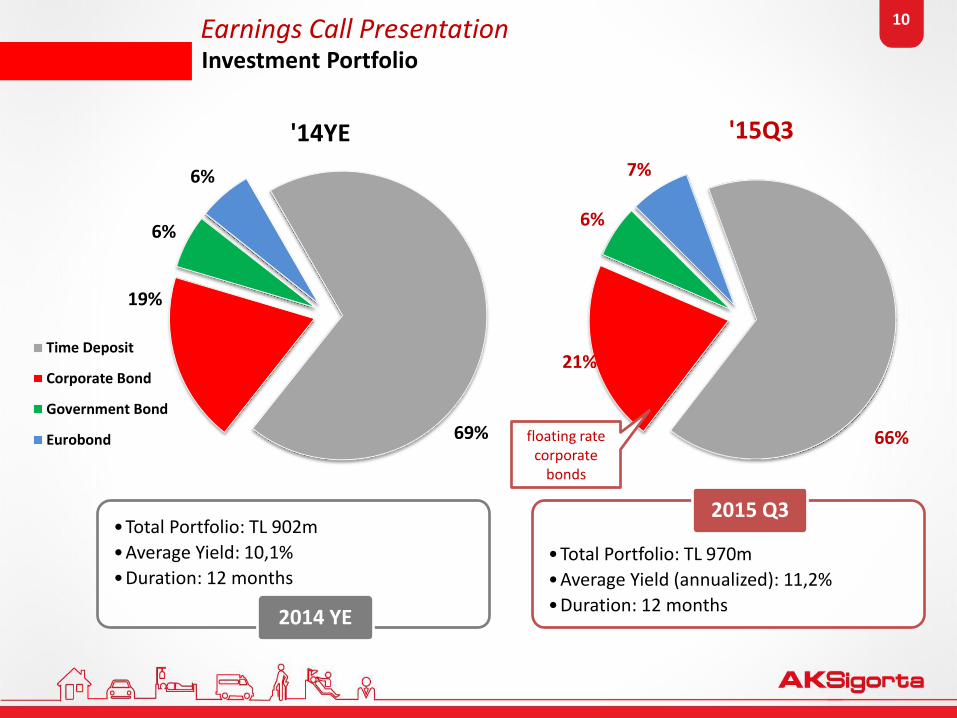
Earnings Call Presentation Investment Portfolio
10
69%
19%
6%
6%
'14YE
Time Deposit
Corporate Bond
Government Bond
Eurobond 66%
21%
6%
7%
'15Q3
•Total Portfolio: TL 902m
•Average Yield: 10,1%
•Duration: 12 months
2014 YE
•Total Portfolio: TL 970m
•Average Yield (annualized): 11,2%
•Duration: 12 months
2015 Q3
floating rate corporate
bonds
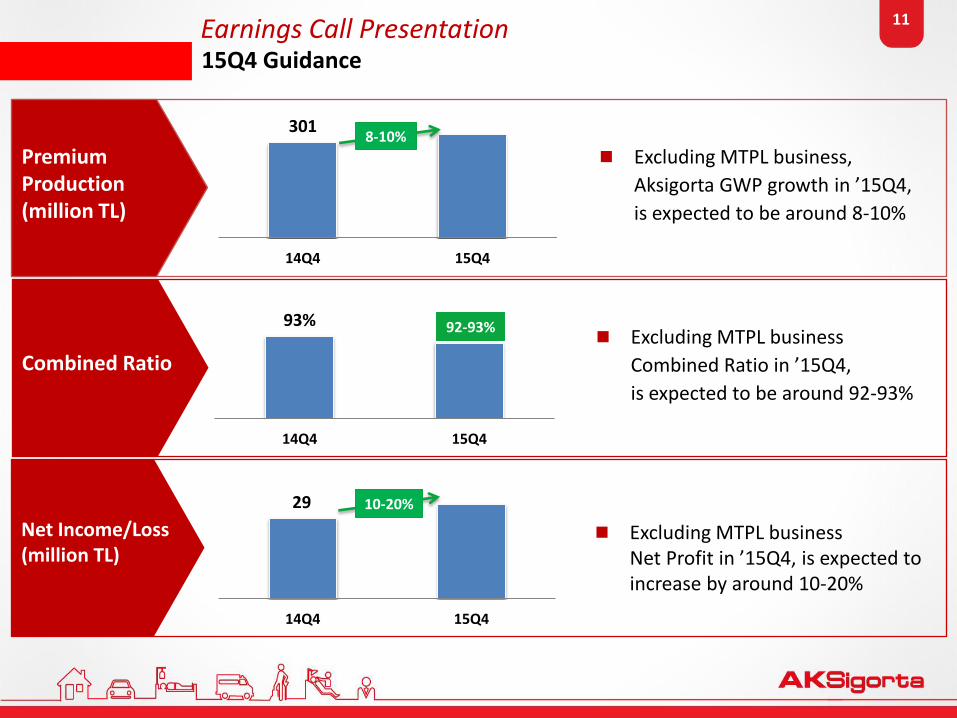
Earnings Call Presentation 15Q4 Guidance
11
301
14Q4 15Q4
Excluding MTPL business,
Aksigorta GWP growth in ’15Q4,
is expected to be around 8-10%
Premium Production (million TL)
Excluding MTPL business
Combined Ratio in ’15Q4,
is expected to be around 92-93%
93%
14Q4 15Q4
Combined Ratio
Excluding MTPL business Net Profit in ’15Q4, is expected to increase by around 10-20%
29
14Q4 15Q4
Net Income/Loss (million TL)
92-93%
8-10%
10-20%

Earnings Call Presentation Contact Information & Disclaimer
12
For further information please contact with;
(Mr.) Osman Akkoca, Financial Control Manager,
(T) +90 216 280 88 88
www.aksigorta.com.tr/en/yatirimci_iliskileri.php
Poligon Cad. Buyaka 2 Sitesi No:8, Kule:1, Kat:6 34771 Ümraniye İstanbul Türkiye
Disclaimer
The information and opinions contained in this document have been compiled by Aksigorta A.Ş. (“Company”) from sources believed to be reliable and in good faith, but no representation or warranty, expressed or implied, is made as to their accuracy, completeness or correctness. No undue reliance may be placed for any purposes whatsoever on the information contained in this document is published for the assistance of recipients , but is not to be relied upon as authoritative or taken in substitution for the exercise of judgment by any recipient. The Company does not accept any liability whatsoever for any direct or consequential loss arising from any use of this document or its contents. This document is strictly confidential and may not be reproduced, distributed or published for any purpose. The information and opinions contained in this document have been compiled by Aksigorta A.Ş. (“Company”) from sources believed to be reliable and in good faith, but no representation or warranty, expressed or implied, is made as to their accuracy, completeness or correctness. No undue reliance may be placed for any purposes whatsoever on the information contained in this presentation or on its completeness, accuracy or fairness. This document contains forward-looking statements by using such words as "may", "will", "expect", "believe", "plan" and other similar terminology that reflect the Company management’s current views, expectations, assumptions and forecasts with respect to certain future events. As the actual performance of the companies may be affected by risks and uncertainties, all opinions, information and estimates contained in this document constitute the Company’s current judgment and are subject to change, update, amend, supplement or otherwise alter without notice. Although it is believed that the information and analysis are correct and expectations reflected in this document are reasonable, they may be affected by a variety of variables and changes in underlying assumptions that could cause actual results to differ materially. Company does not undertake any obligation, and disclaims any duty to update or revise any forward looking statements, whether as a result of new information or future events. Neither this document nor the information contained within can construe any investment advice, invitation or an offer to buy or sell Company’s shares. Company cannot guarantee that the securities described in this document constitute a suitable investment for all investors and nothing shall be taken as an inducement to any person to invest in or otherwise deal with any shares of Company and its group companies. The information contained in this document is published for the assistance of recipients, but is not to be relied upon as authoritative or taken in substitution for the exercise of judgment by any recipient. You must not distribute the information in this document to, or cause it to be used by, any person or entity in a place where its distribution or use would be unlawful. Neither Company, its board of directors, directors, managers, nor any of Its employees shall have any liability whatsoever for any direct or consequential loss arising from any use of this document or its contents.

13
Evini güvenceye alır
Eşyanı güvenceye alır
Senin ve ailenin canını güvenceye alır
Komşunu ve çevreni, hatta
misafirini güvenceye alır
THANKS Published by AKSİGORTA Finance Team