Embed Size (px)
Citation preview
An Overview of TRI and OPRA
the risk-based monitoring company
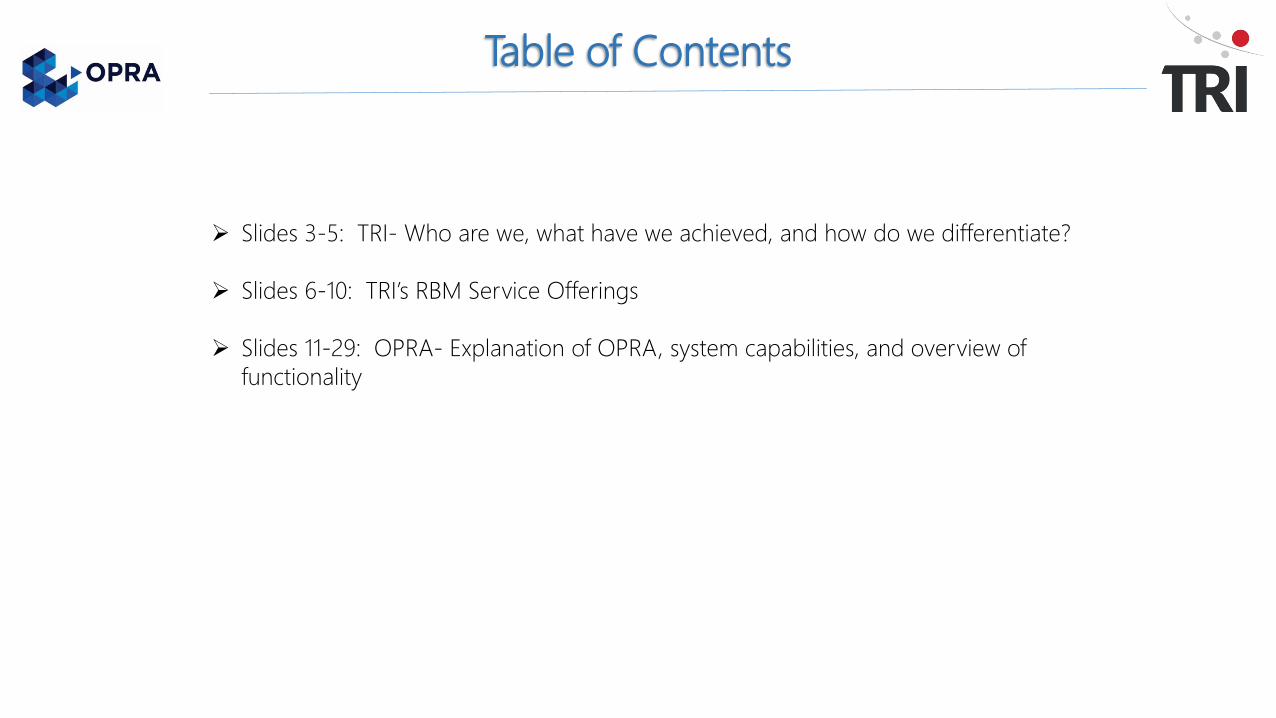
Table of Contents
Slides 3-5: TRI- Who are we, what have we achieved, and how do we differentiate?
Slides 6-10: TRI’s RBM Service Offerings
Slides 11-29: OPRA- Explanation of OPRA, system capabilities, and overview of
functionality
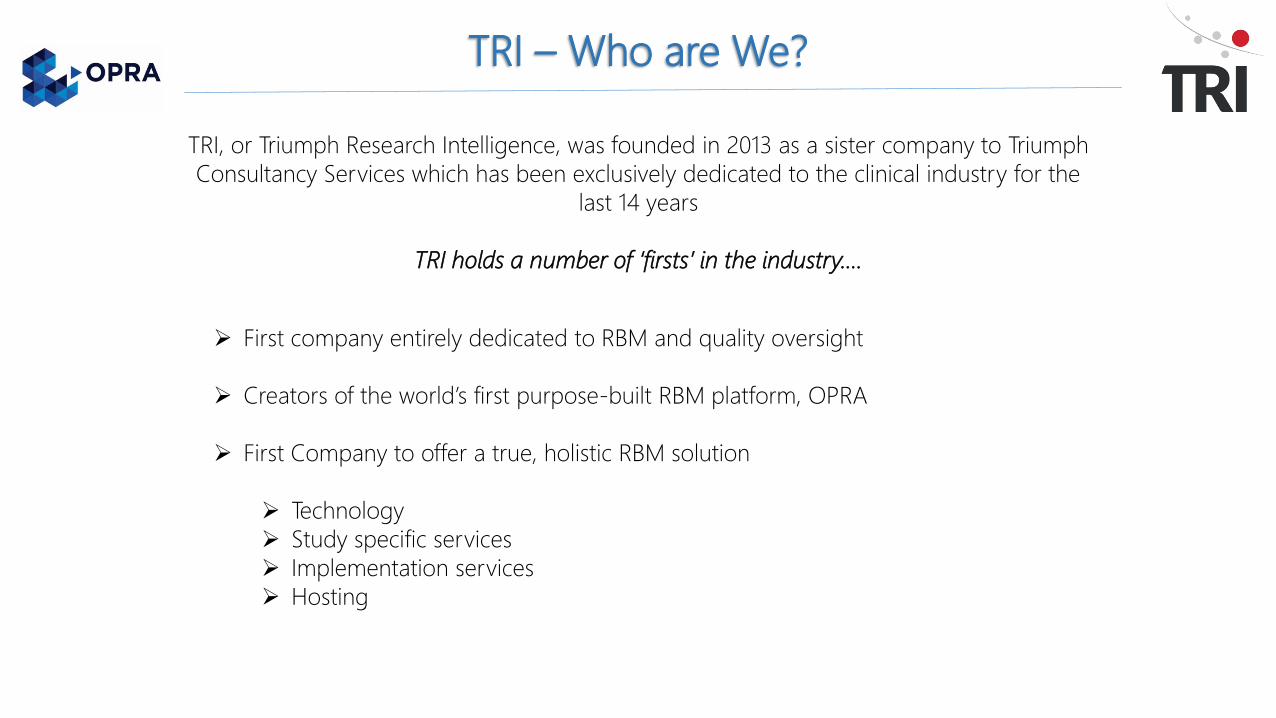
TRI – Who are We?
First company entirely dedicated to RBM and quality oversight
Creators of the world’s first purpose-built RBM platform, OPRA
First Company to offer a true, holistic RBM solution
Technology
Study specific services
Implementation services
Hosting
TRI, or Triumph Research Intelligence, was founded in 2013 as a sister company to Triumph
Consultancy Services which has been exclusively dedicated to the clinical industry for the
last 14 years
TRI holds a number of ‘firsts’ in the industry….
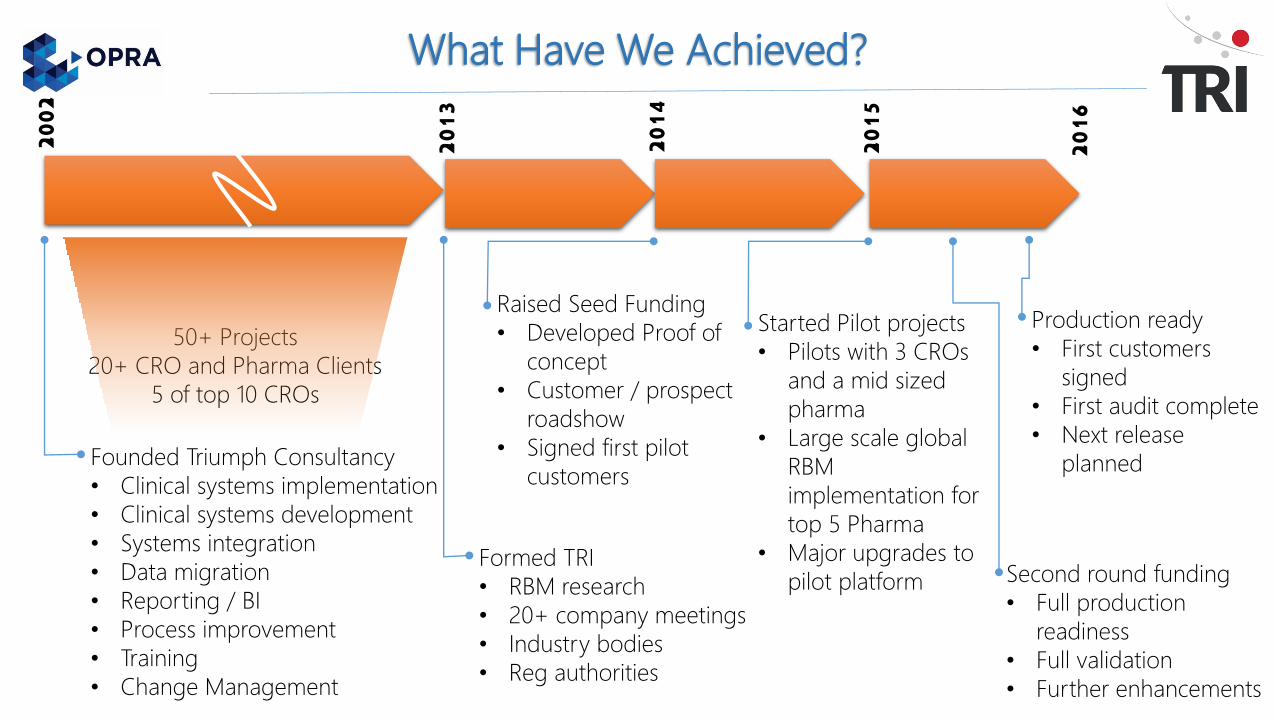
What Have We Achieved?2002
2013
Formed TRI
• RBM research
• 20+ company meetings
• Industry bodies
• Reg authorities
Founded Triumph Consultancy
• Clinical systems implementation
• Clinical systems development
• Systems integration
• Data migration
• Reporting / BI
• Process improvement
• Training
• Change Management
50+ Projects
20+ CRO and Pharma Clients
5 of top 10 CROs
2014
2015
Raised Seed Funding
• Developed Proof of
concept
• Customer / prospect
roadshow
• Signed first pilot
customers
Started Pilot projects
• Pilots with 3 CROs
and a mid sized
pharma
• Large scale global
RBM
implementation for
top 5 Pharma
• Major upgrades to
pilot platform
2016
Second round funding
• Full production
readiness
• Full validation
• Further enhancements
Production ready
• First customers
signed
• First audit complete
• Next release
planned
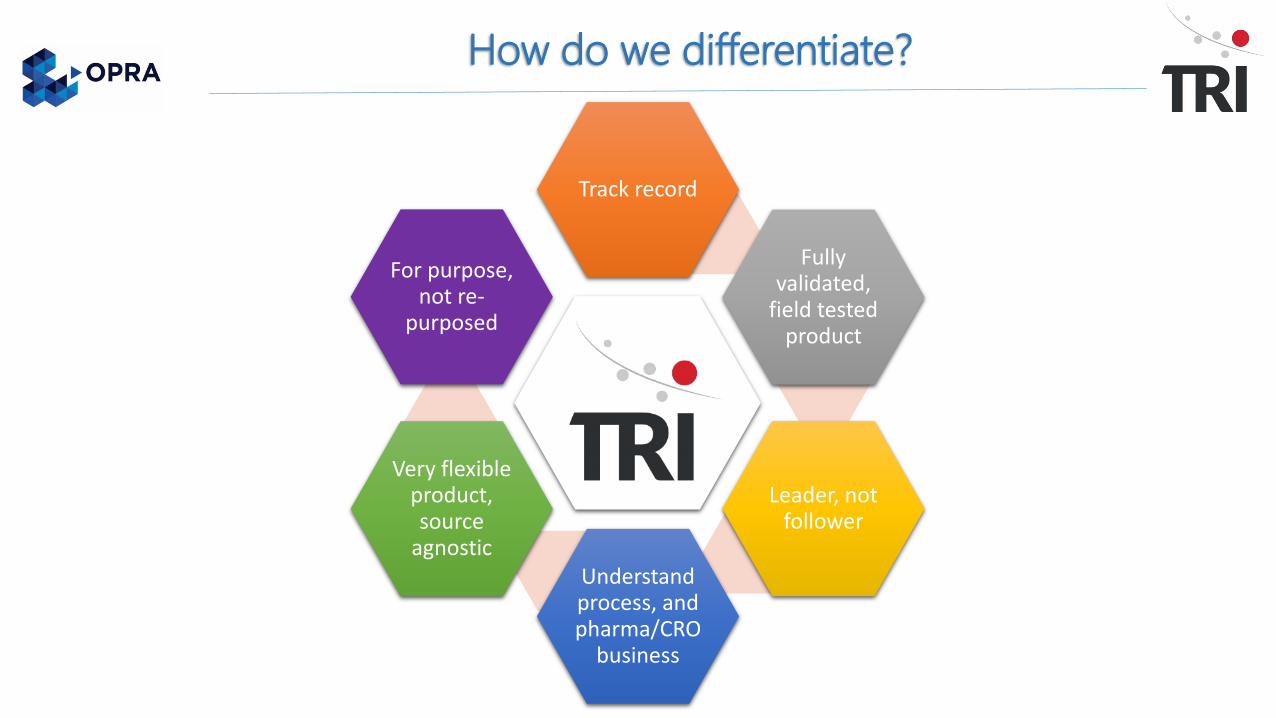
How do we differentiate?
.
Track record
Fully validated,
field tested product
Leader, not follower
Understand process, and pharma/CRO
business
Very flexible product, source
agnostic
For purpose, not re-
purposed
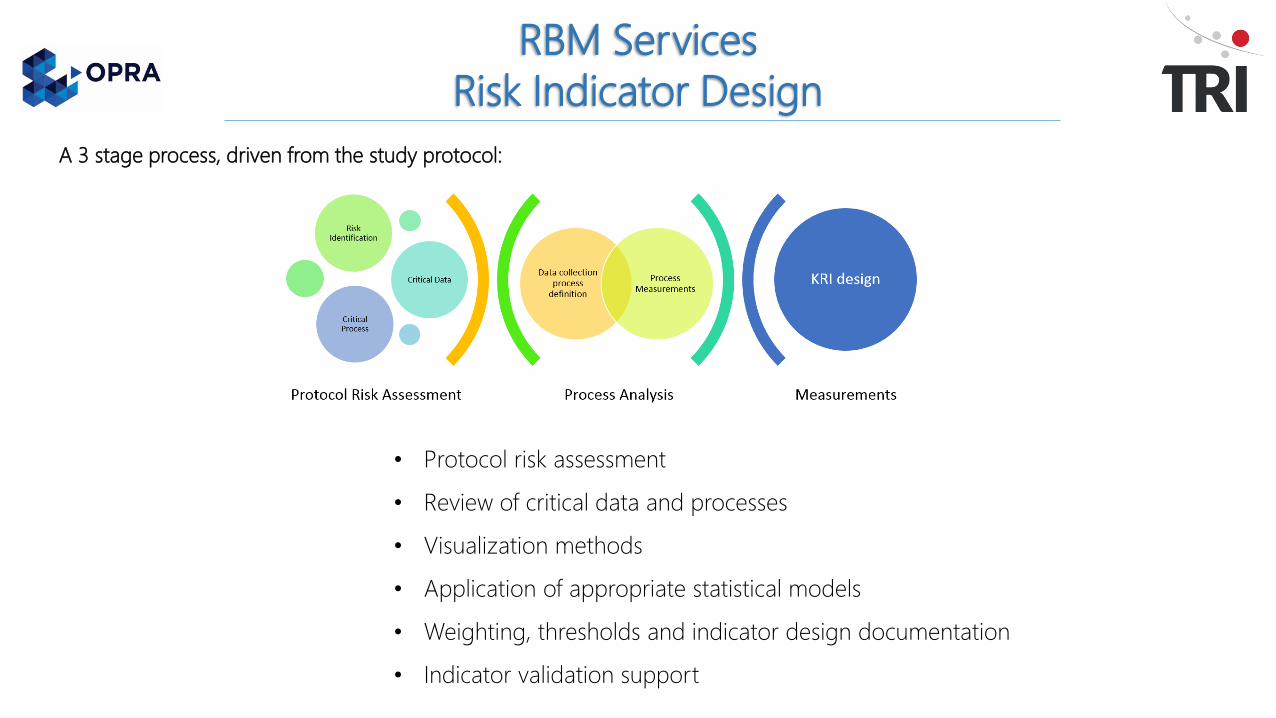
A 3 stage process, driven from the study protocol:
• Protocol risk assessment
• Review of critical data and processes
• Visualization methods
• Application of appropriate statistical models
• Weighting, thresholds and indicator design documentation
• Indicator validation support
RBM Services
Risk Indicator Design
RBM Services
RBM Assessment and Planning
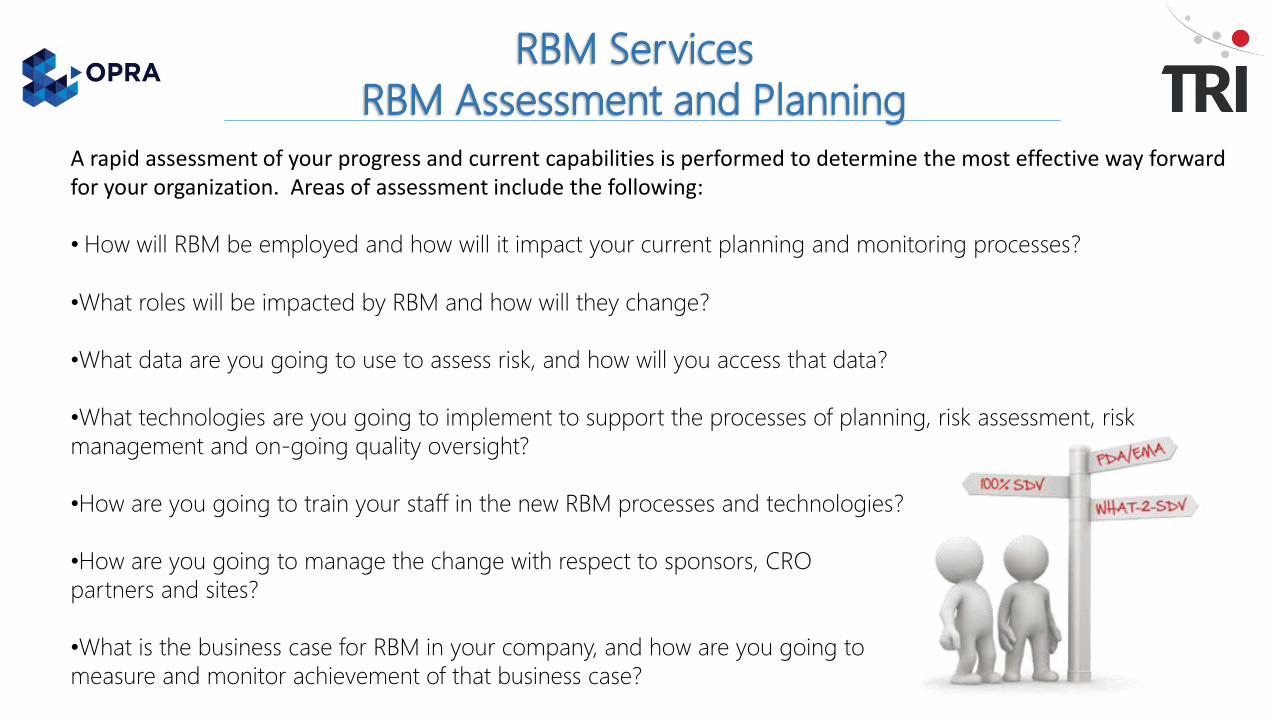
A rapid assessment of your progress and current capabilities is performed to determine the most effective way forward for your organization. Areas of assessment include the following:
• How will RBM be employed and how will it impact your current planning and monitoring processes?
•What roles will be impacted by RBM and how will they change?
•What data are you going to use to assess risk, and how will you access that data?
•What technologies are you going to implement to support the processes of planning, risk assessment, risk
management and on-going quality oversight?
•How are you going to train your staff in the new RBM processes and technologies?
•How are you going to manage the change with respect to sponsors, CRO
partners and sites?
•What is the business case for RBM in your company, and how are you going to
measure and monitor achievement of that business case?
RBM Services
RBM Technology Implementation
Choosing the best technology to suit your RBM strategy can be a challenge.
- Do I try to develop my own?
- Do I try to re-purpose something I already have?
- Do I implement purpose built RBM technology?
How do we evaluate RBM technology?
• Does your business intend to follow some or all of the TransCelerate methodology?
- If the answer to this is ‘yes’ then we have a pre-defined assessment tool based on the
TransCelerate functional requirements which will allow us to very quickly determine which
aspect of the methodology you want to follow and therefore what the core requirements of
your system should be.
- If the answer is ‘no’, then we take a more process driven approach, and start by understanding
the operational approach you intend to take to risk-based monitoring, the processes you will
want it to support and then ultimately to define the requirements for your RBM system.
RBM Services
RBM Training
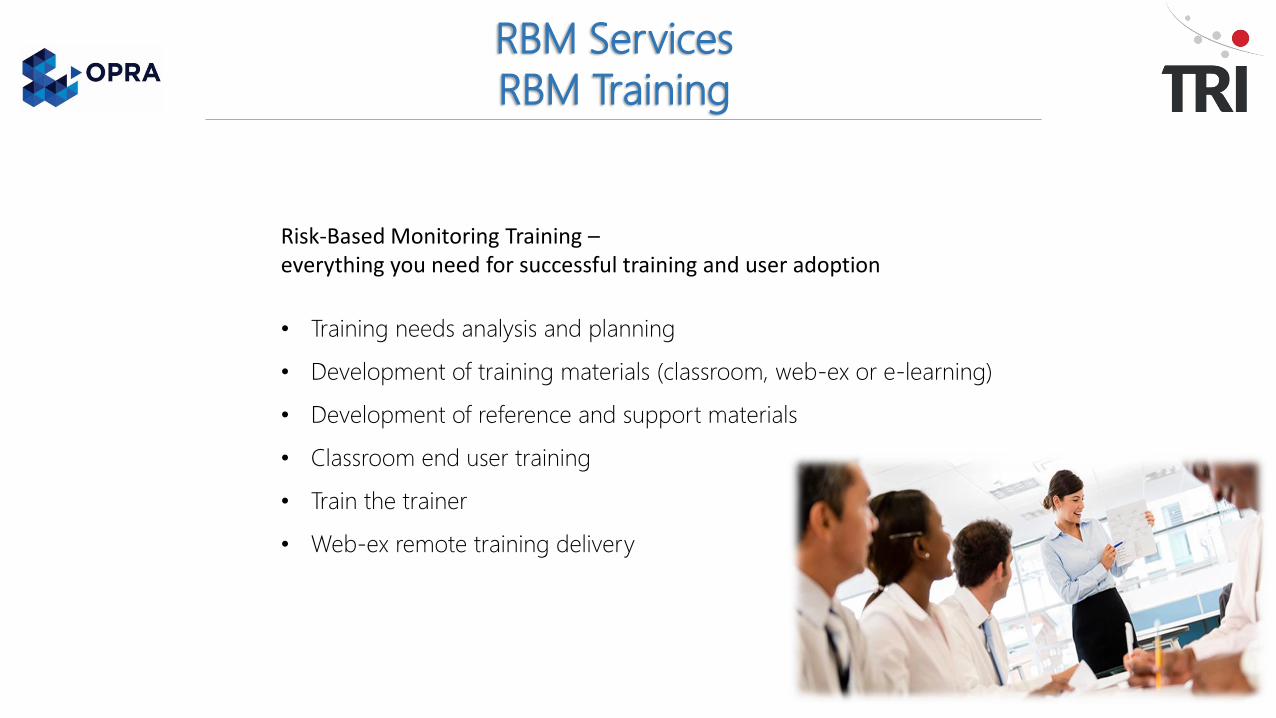
Risk-Based Monitoring Training –everything you need for successful training and user adoption
• Training needs analysis and planning
• Development of training materials (classroom, web-ex or e-learning)
• Development of reference and support materials
• Classroom end user training
• Train the trainer
• Web-ex remote training delivery
RBM Services
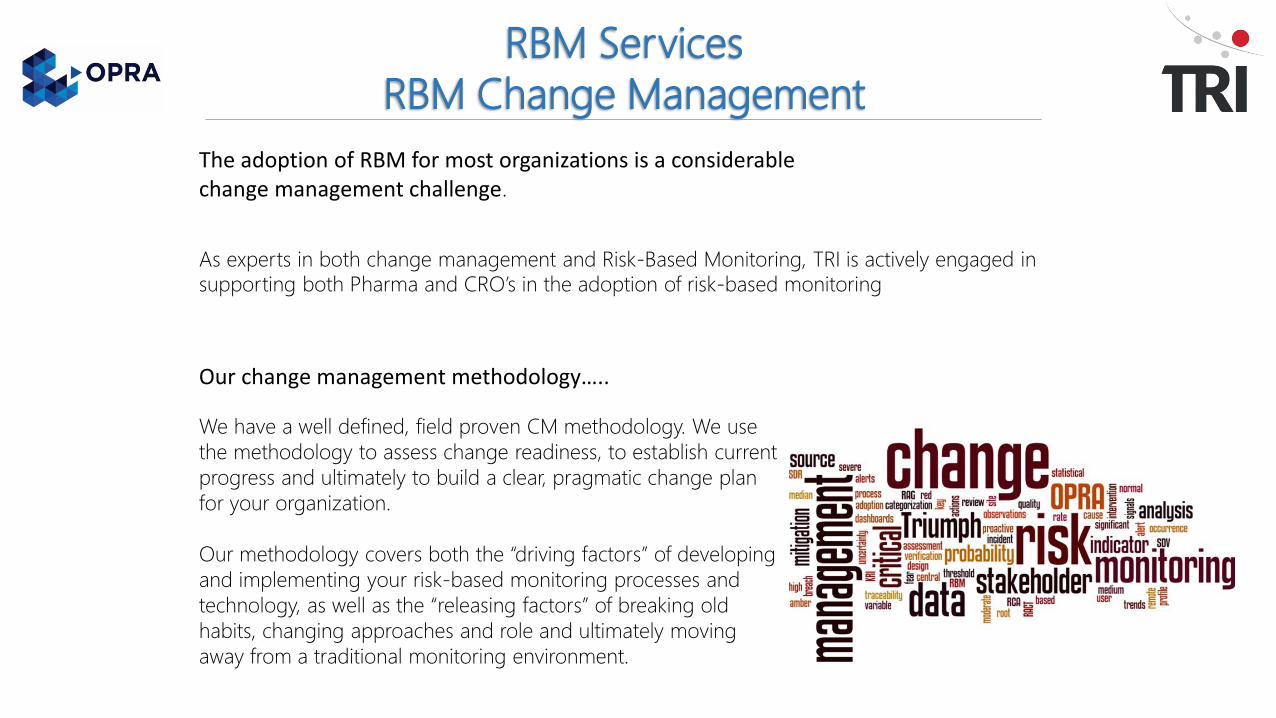
RBM Change Management
The adoption of RBM for most organizations is a considerable change management challenge.
As experts in both change management and Risk-Based Monitoring, TRI is actively engaged in
supporting both Pharma and CRO’s in the adoption of risk-based monitoring
Our change management methodology…..
We have a well defined, field proven CM methodology. We use
the methodology to assess change readiness, to establish current
progress and ultimately to build a clear, pragmatic change plan
for your organization.
Our methodology covers both the “driving factors” of developing
and implementing your risk-based monitoring processes and
technology, as well as the “releasing factors” of breaking old
habits, changing approaches and role and ultimately moving
away from a traditional monitoring environment.
What is OPRA?
OPRA is the first and only purpose-built
operational platform of it’s kind on the
market for
Risk-Based Monitoring and Quality
Oversight
What is OPRA?
OPRA is a cloud-based, fully validated 21 CFR Part 11 compliant system
Requires nothing more than an internet browser for user access
Source system agnostic – there are no limits on the number or types of
source systems
Completely user configurable-
Holds a library of KRIs
Ability to easily add customized, study-specific key risk indicators
Holds a unique statistical model used to create the data visualizations
Very simple to use dashboard and dynamic visual interface
Holds historic data and trending analysis at a site level as well as for
individual indicators.
Holds record of all observations and actions taken throughout the study,
so all activity is tracked and has the ability to be managed in the system
Keeps an audit trail for all actions performed as well as for the data
processed within the system
Keeps an audit trail for all actions performed as well as for the data
processed within the system
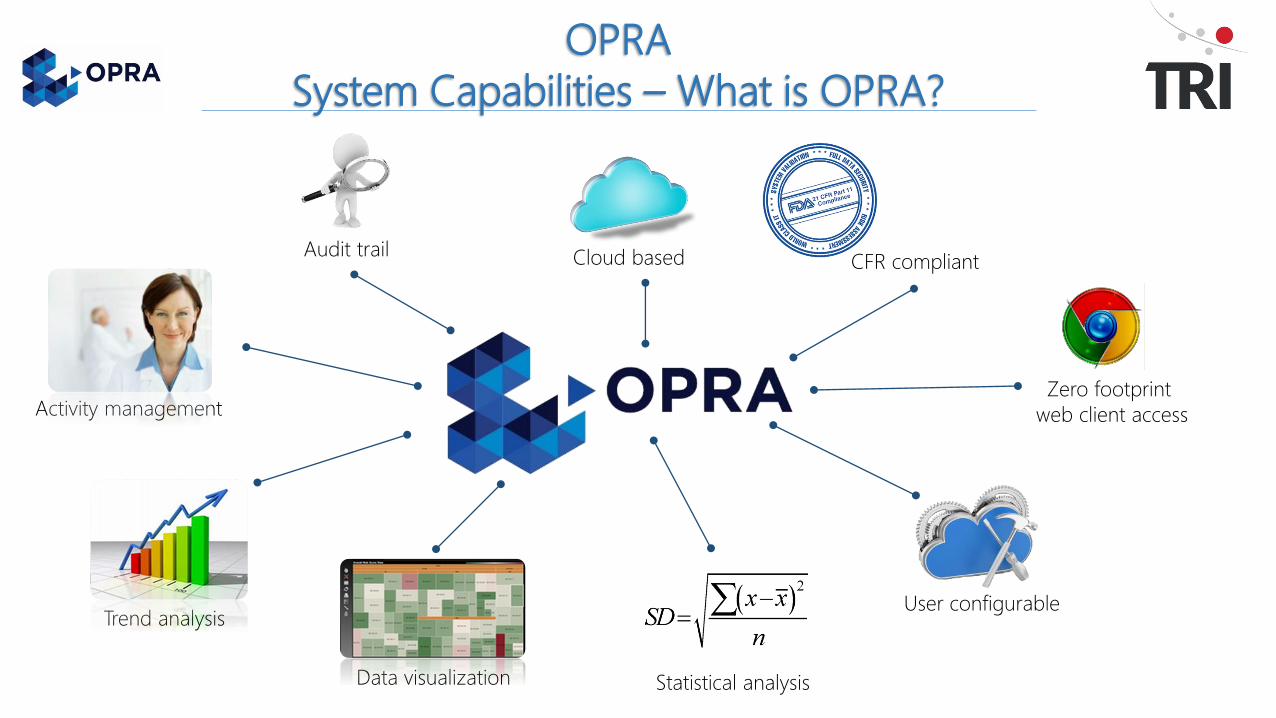
OPRA
System Capabilities – What is OPRA?
Cloud based
Data visualization Statistical analysis
Zero footprint
web client access
CFR compliantAudit trail
User configurable
Activity management
Trend analysis
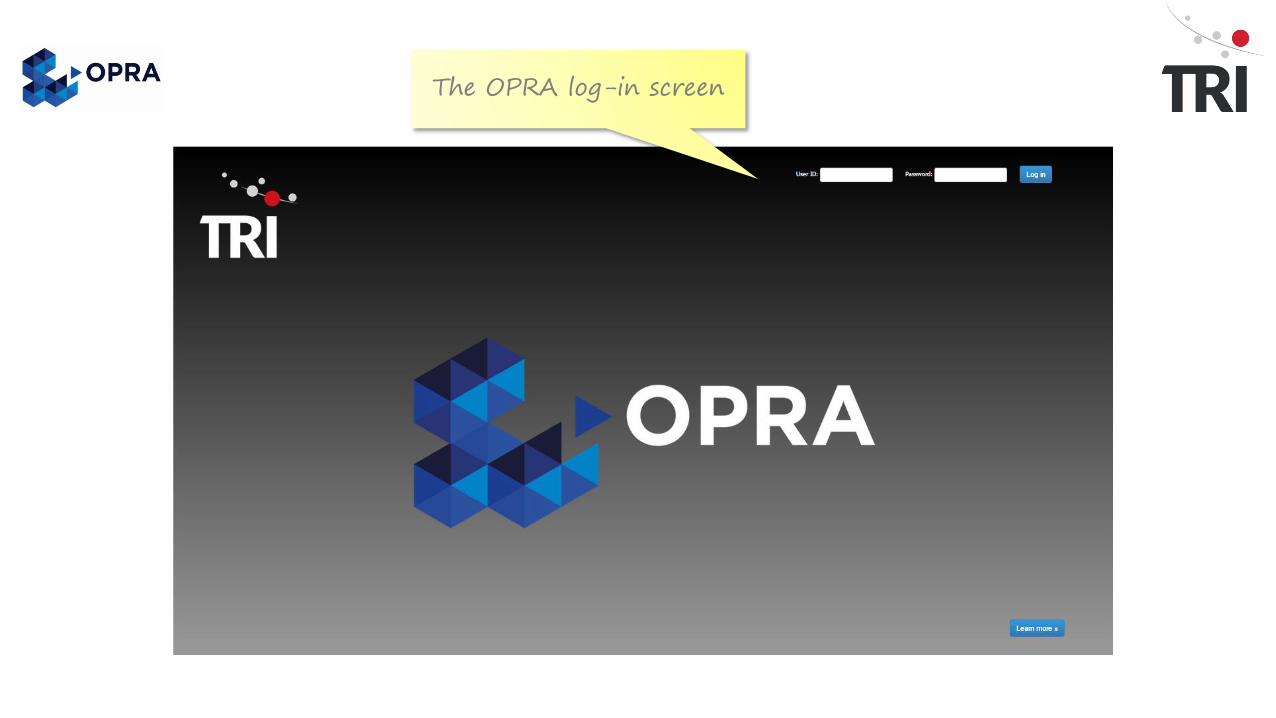
The OPRA log-in screen
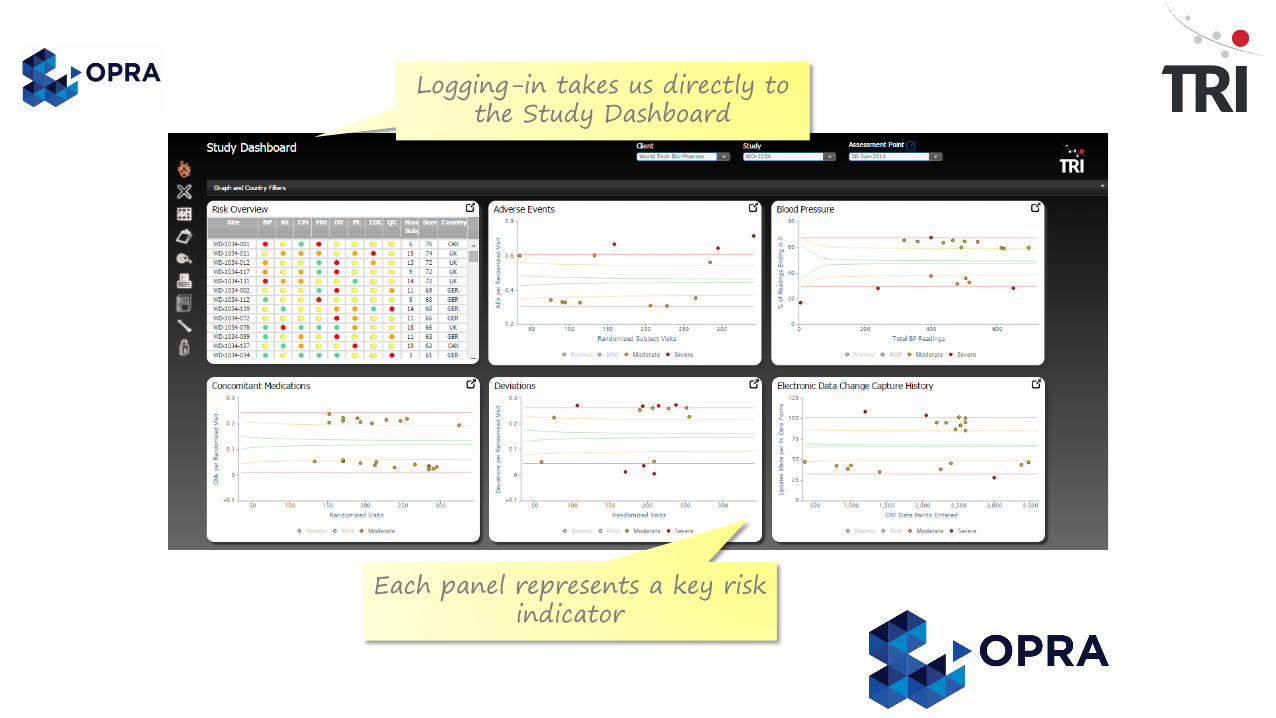
Logging-in takes us directly to the Study Dashboard
Each panel represents a key risk indicator
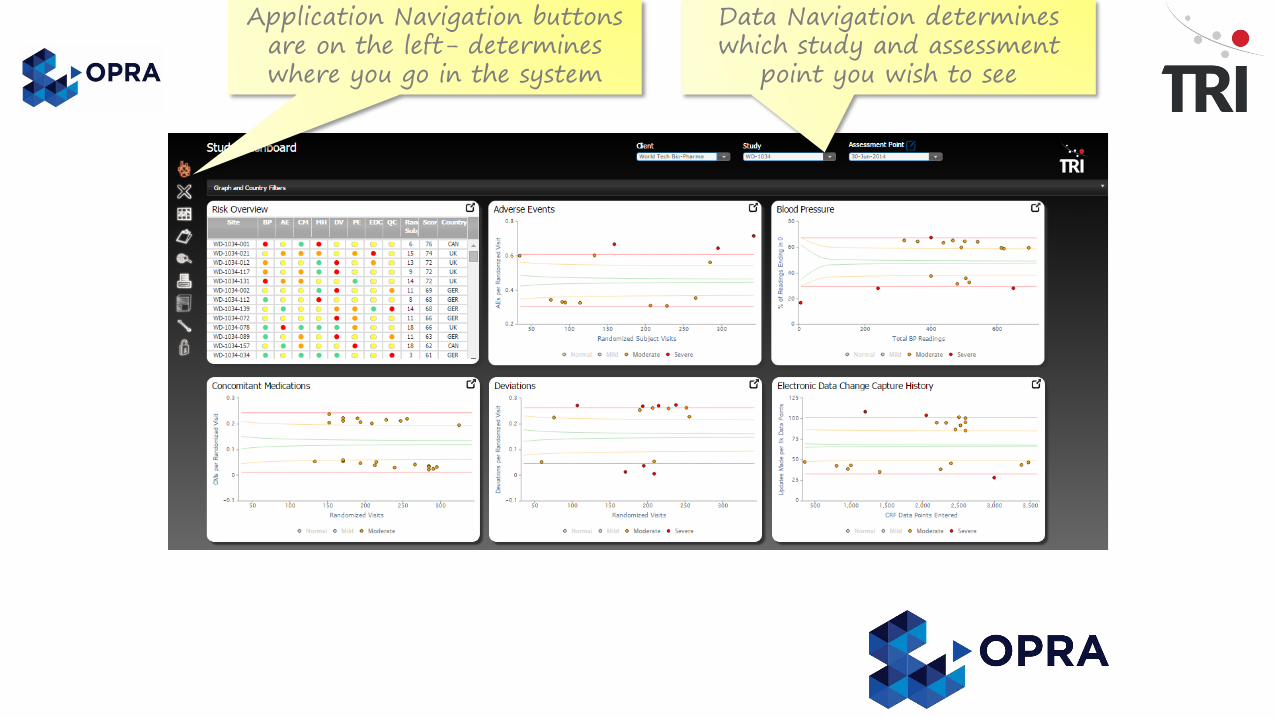
Application Navigation buttons are on the left- determines where you go in the system
Data Navigation determines which study and assessment
point you wish to see
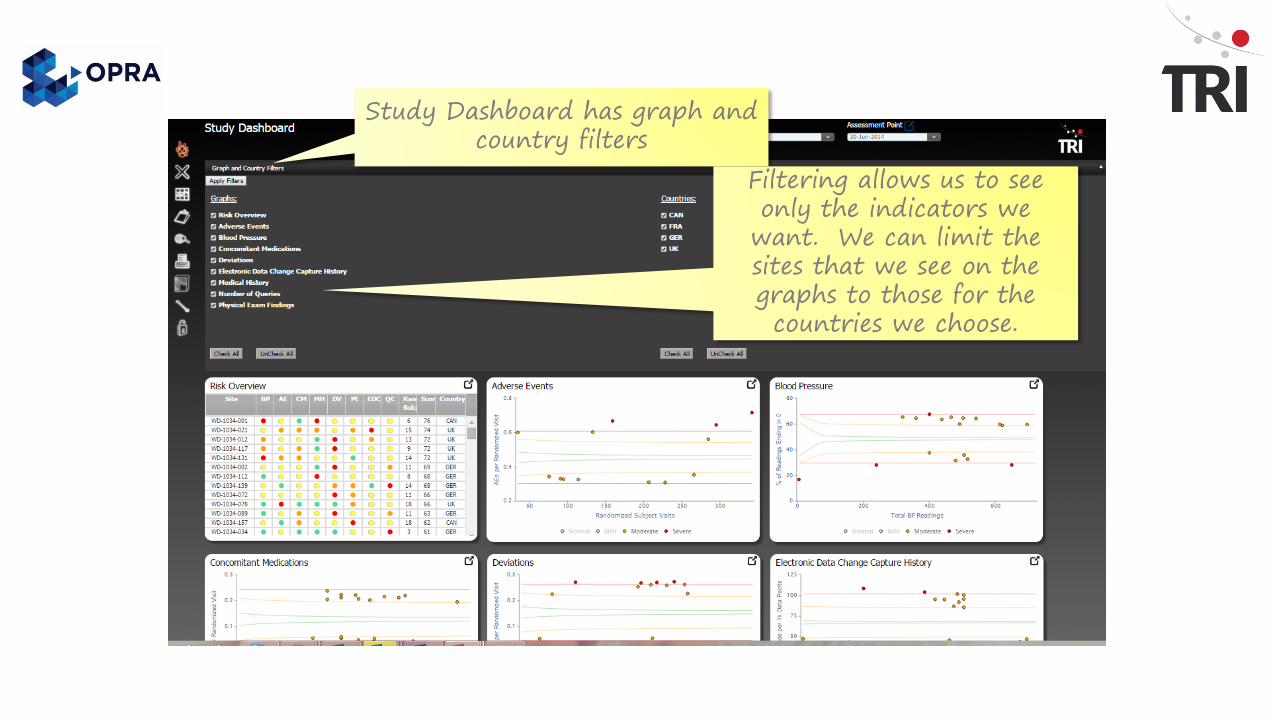
Study Dashboard has graph and country filters
Filtering allows us to see only the indicators we
want. We can limit the sites that we see on the graphs to those for the countries we choose.
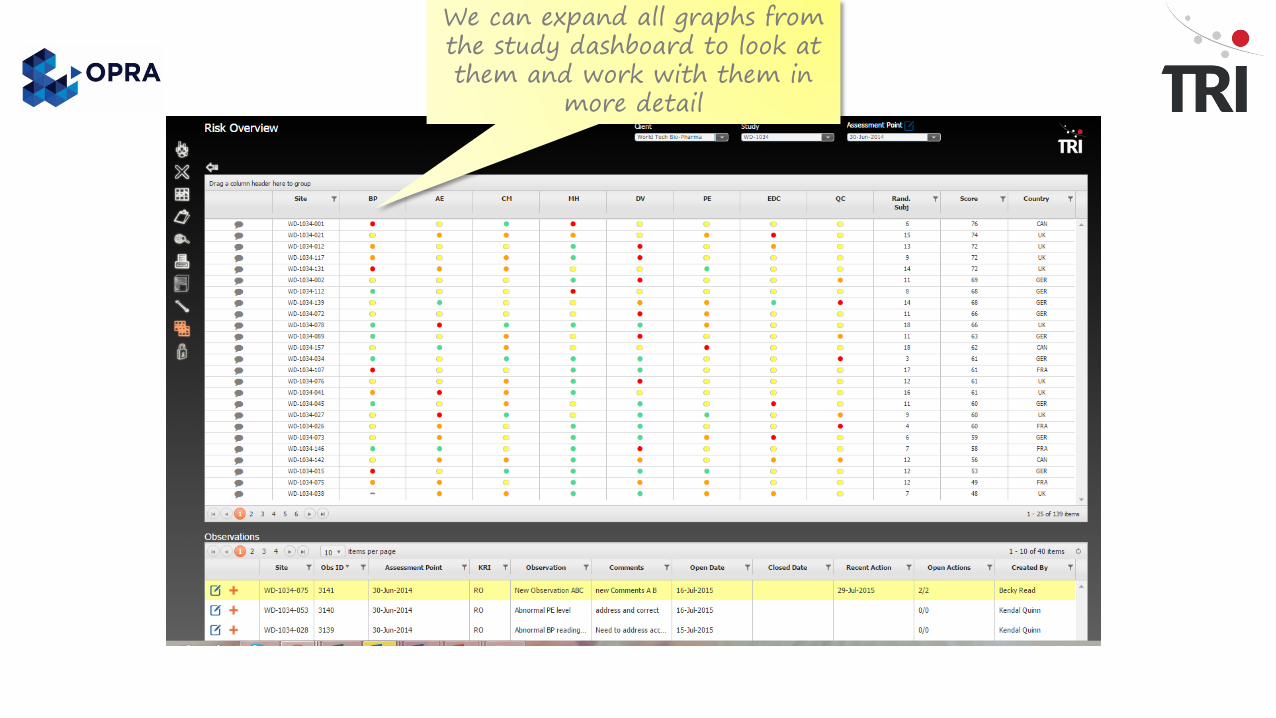
We can expand all graphs from the study dashboard to look at them and work with them in
more detail
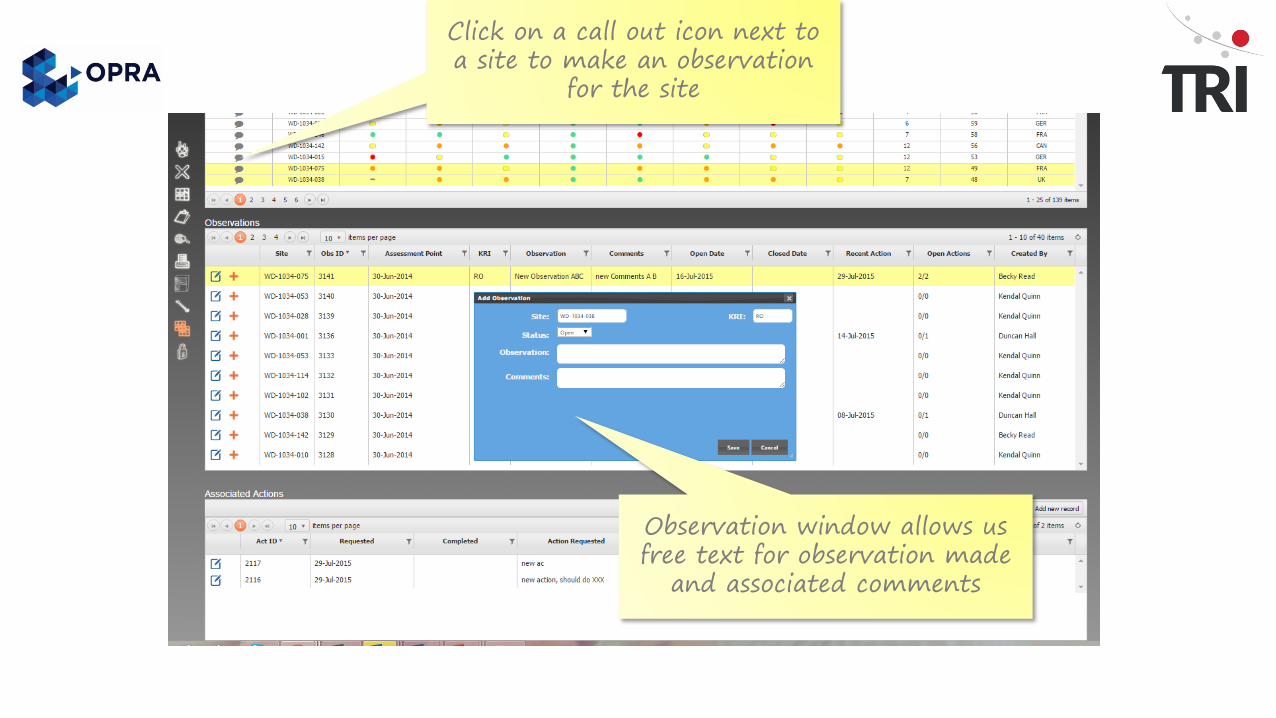
Click on a call out icon next to a site to make an observation
for the site
Observation window allows us free text for observation made
and associated comments
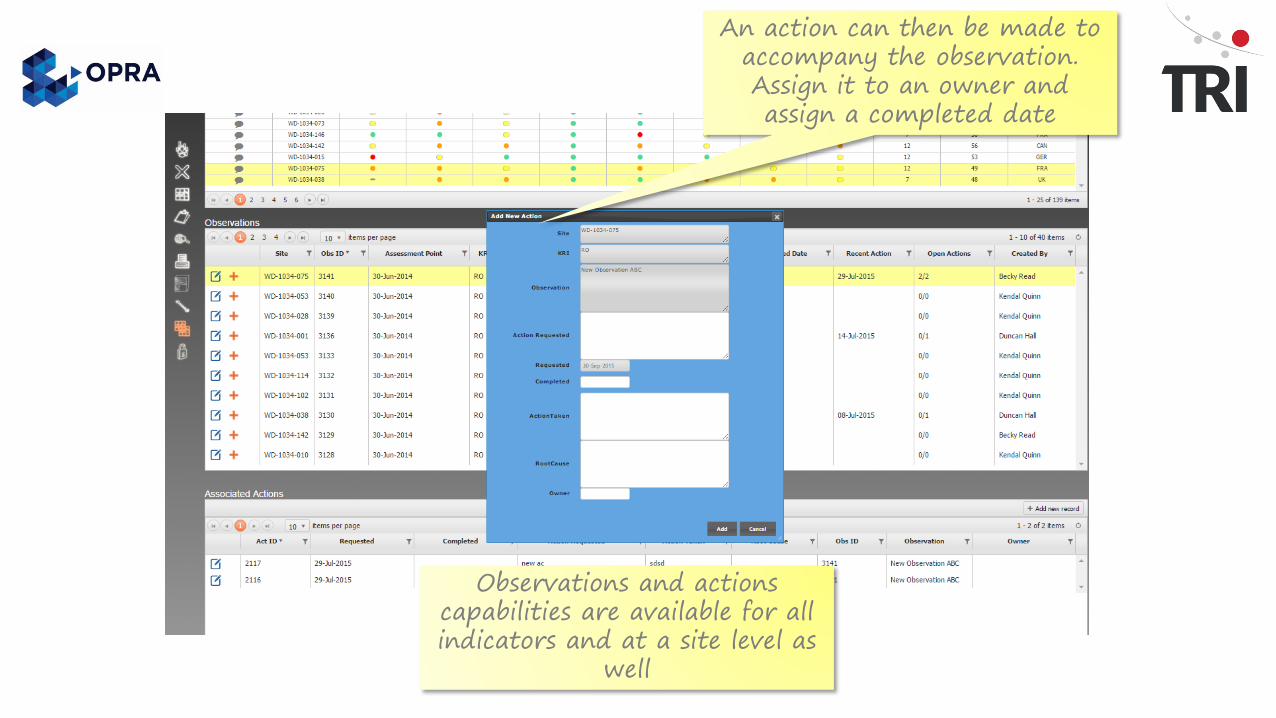
An action can then be made to accompany the observation. Assign it to an owner and assign a completed date
Observations and actions capabilities are available for all indicators and at a site level as
well
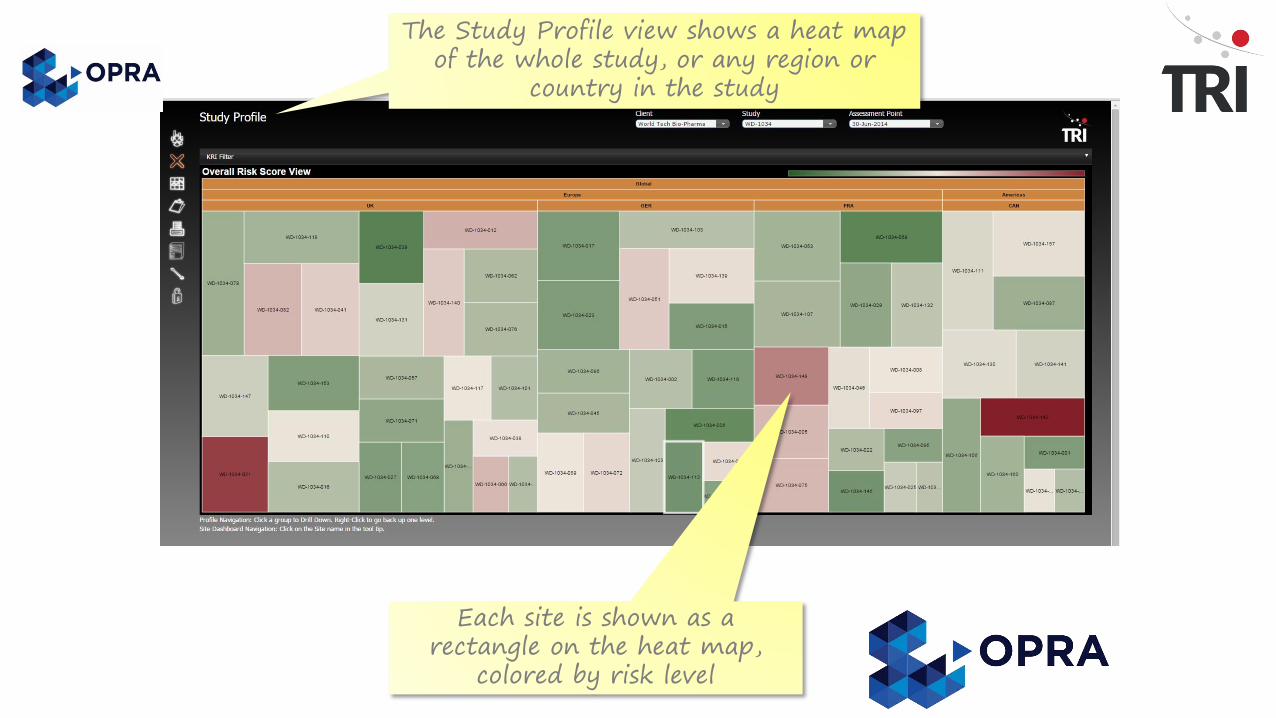
The Study Profile view shows a heat map of the whole study, or any region or
country in the study
Each site is shown as a rectangle on the heat map,
colored by risk level
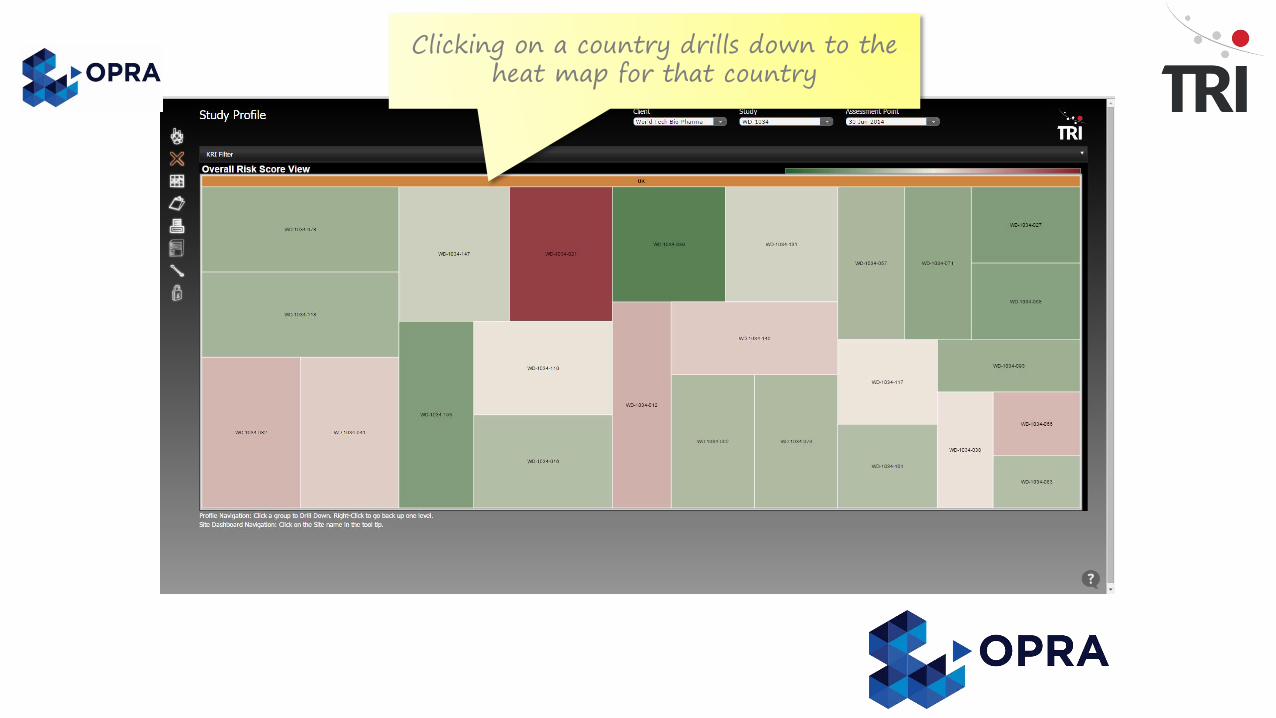
Clicking on a country drills down to the heat map for that country
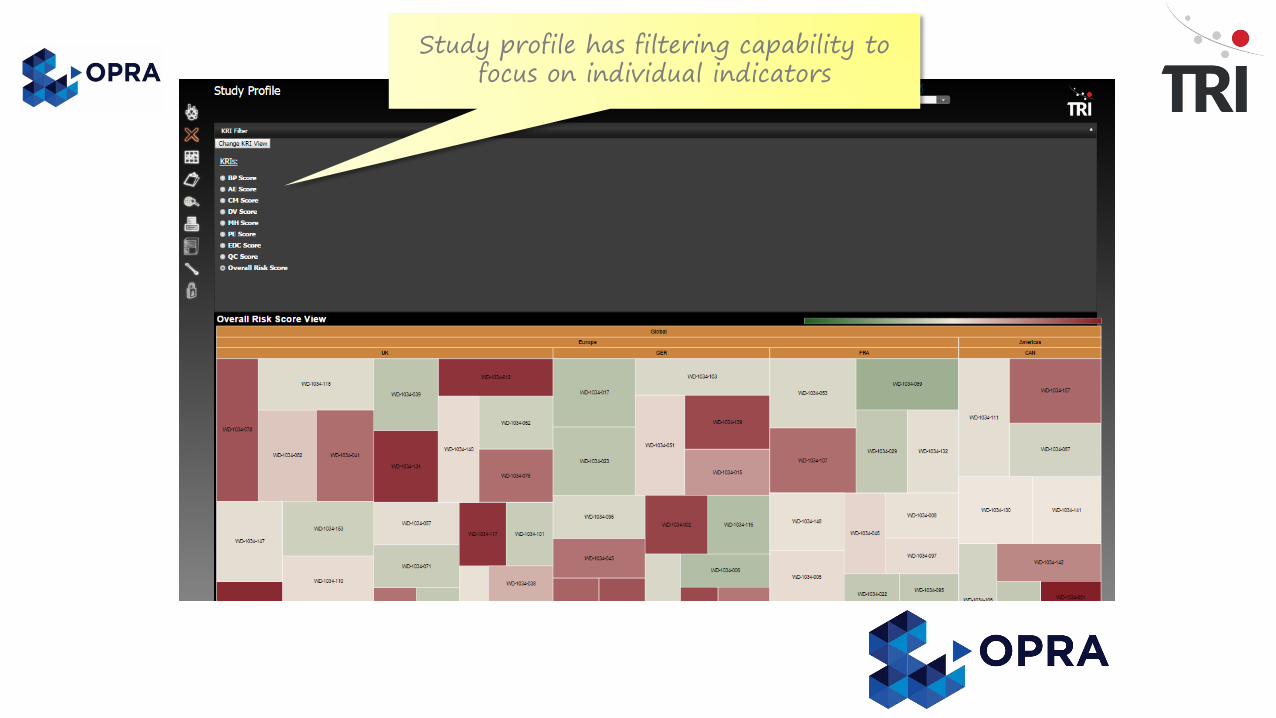
Study profile has filtering capability to focus on individual indicators
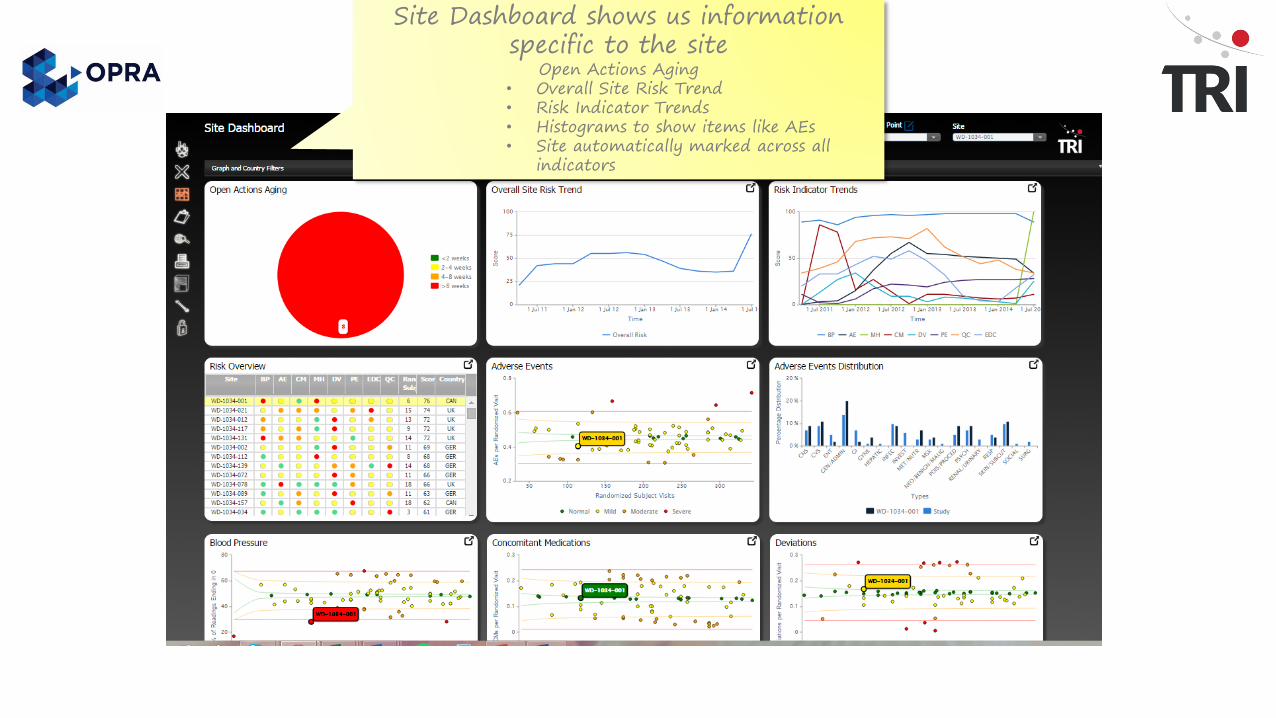
Site Dashboard shows us information specific to the site
Open Actions Aging• Overall Site Risk Trend• Risk Indicator Trends• Histograms to show items like AEs• Site automatically marked across all
indicators
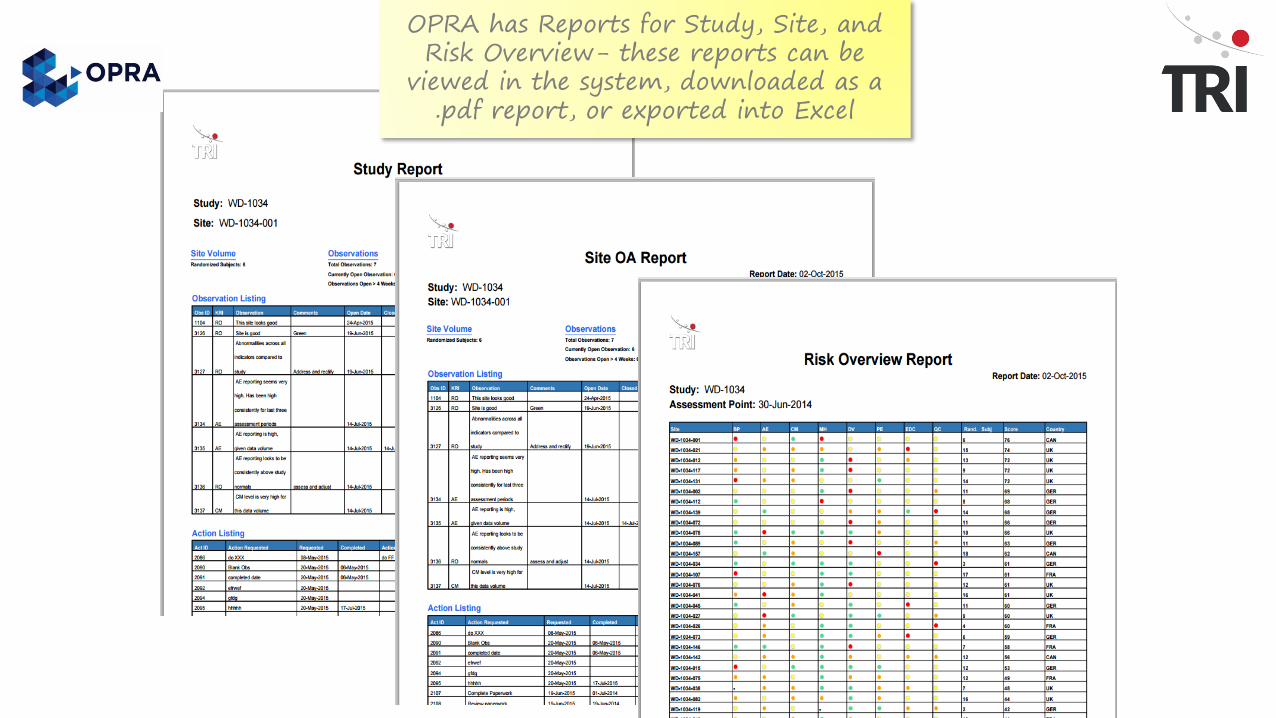
OPRA has Reports for Study, Site, and Risk Overview- these reports can be
viewed in the system, downloaded as a .pdf report, or exported into Excel
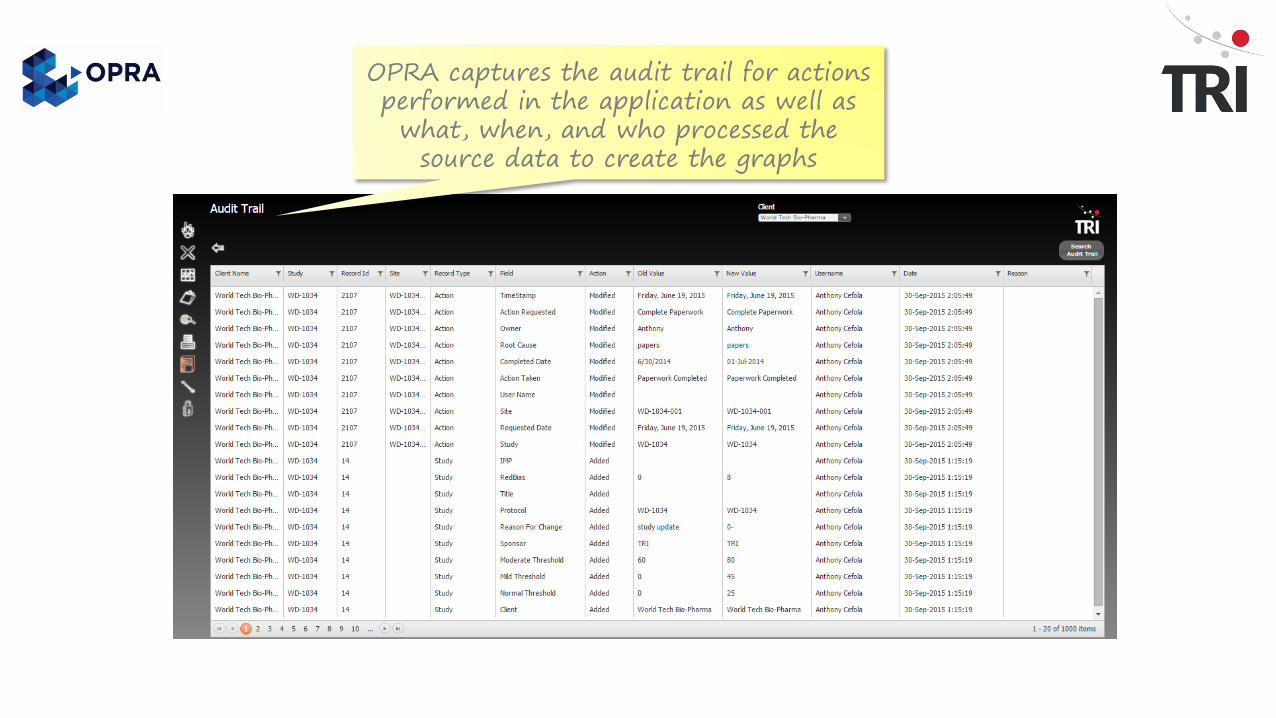
OPRA captures the audit trail for actions performed in the application as well as what, when, and who processed the
source data to create the graphs
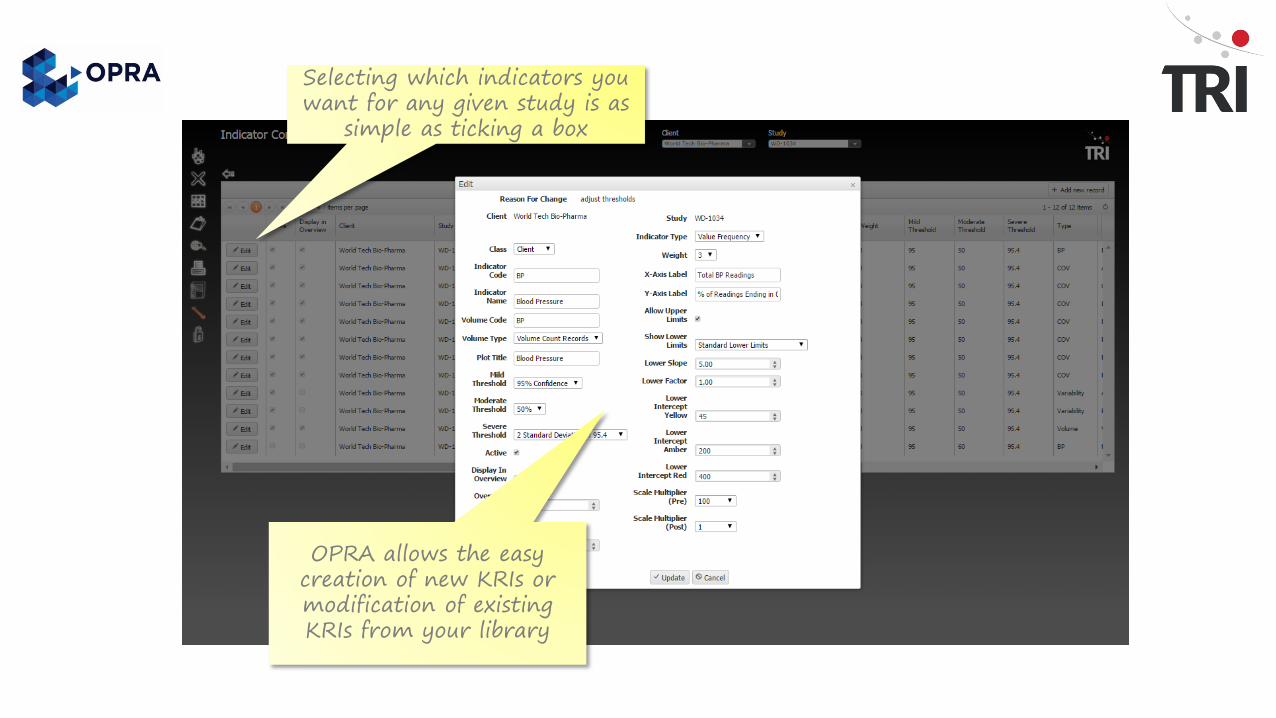
OPRA allows the easy creation of new KRIs or modification of existing KRIs from your library
Selecting which indicators you want for any given study is as
simple as ticking a box
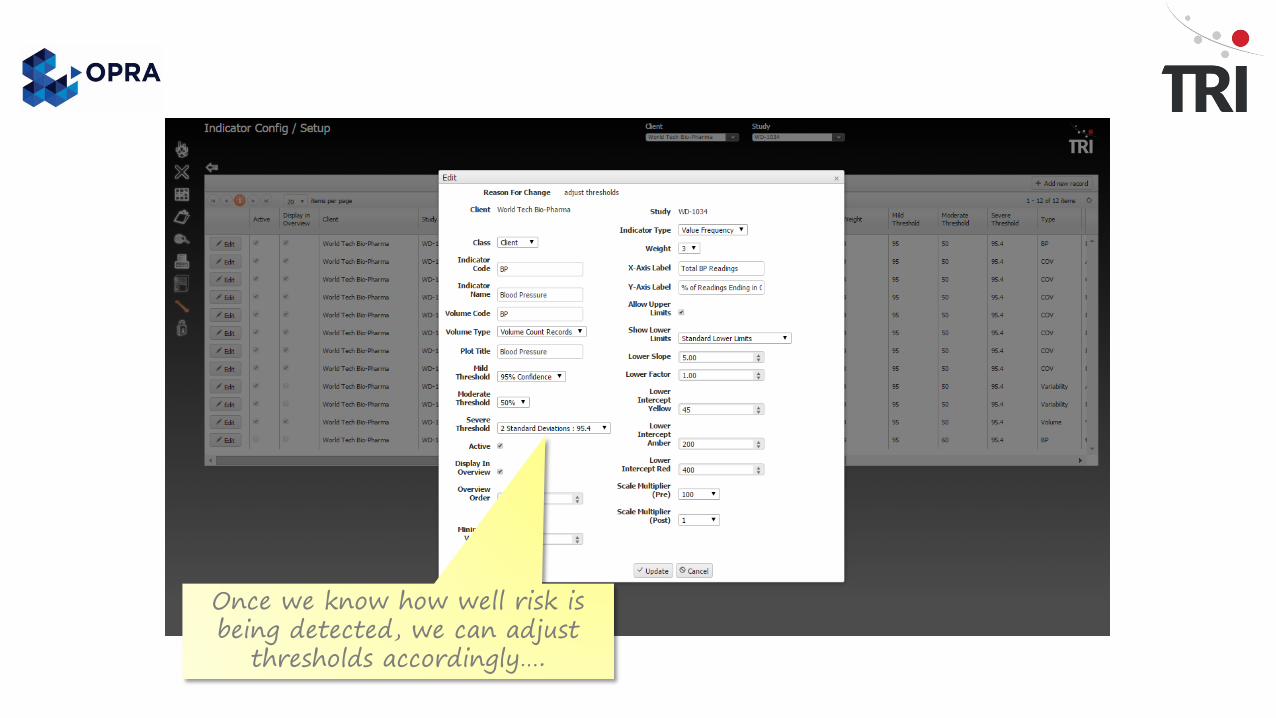
Once we know how well risk is being detected, we can adjust
thresholds accordingly….
So, why choose ?
Cloud based, per study model
Cost-effective, rapid deployment
Integrates with any data source
Library of KRIs
Include your own KRIs
Unique, built-in statistical models
Simple to use dashboard
Dynamic visual interface
Historic data analysis and trending
Centralized record of all observations and actions
Full service provider – consultation, risk assessment, change
management, indicator design, training, support
TRI - Where’s The Risk?
www.tritrials.com [email protected] the official LinkedIn RBM group, Risk-Based Monitoring in Clinical Trials, by copying/pasting
the link below into your web browser and requesting to join:
https://www.linkedin.com/groups/8180947