Embed Size (px)
Citation preview
Brought to you by:
TRI- Where’s the Risk?
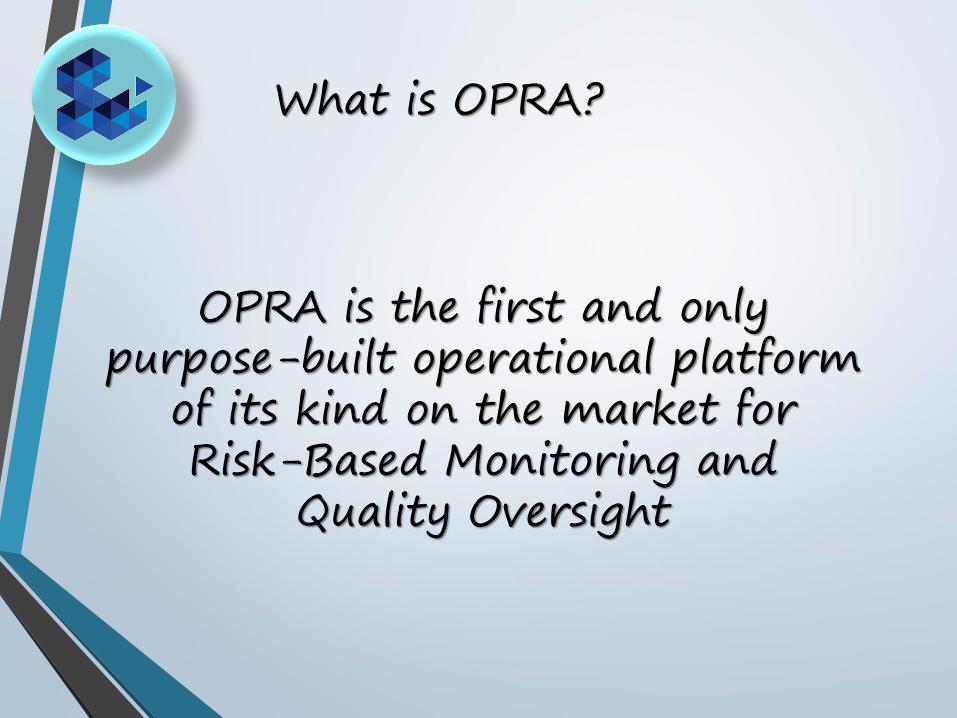
What is OPRA?
OPRA is the first and only purpose-built operational platform
of its kind on the market for Risk-Based Monitoring and
Quality Oversight
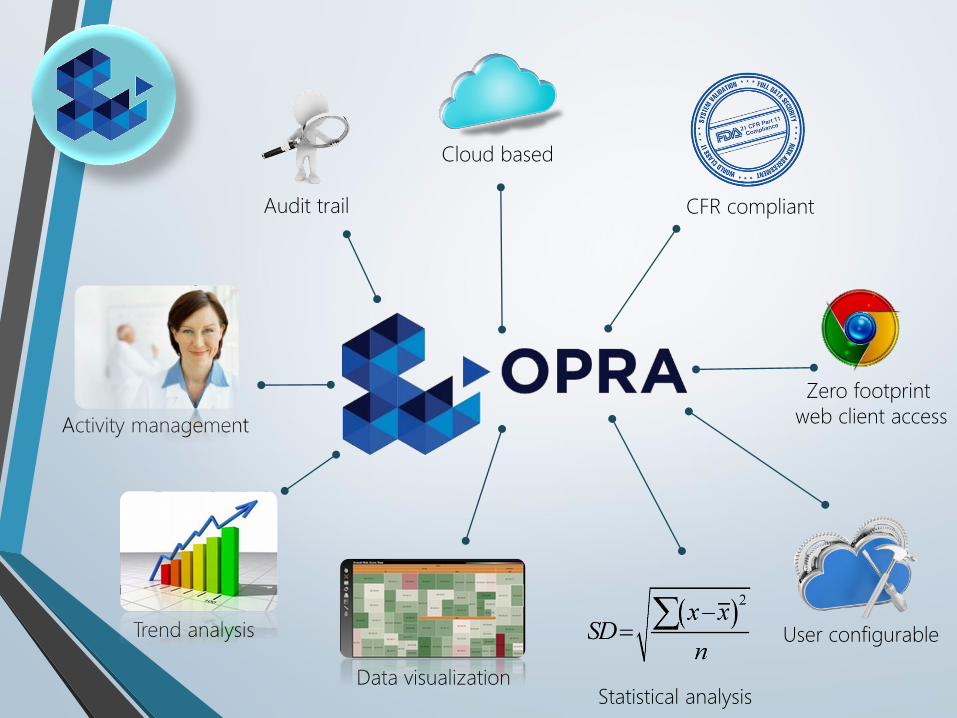
Cloud based
Data visualizationStatistical analysis
Zero footprint
web client access
CFR compliantAudit trail
User configurable
Activity management
Trend analysis
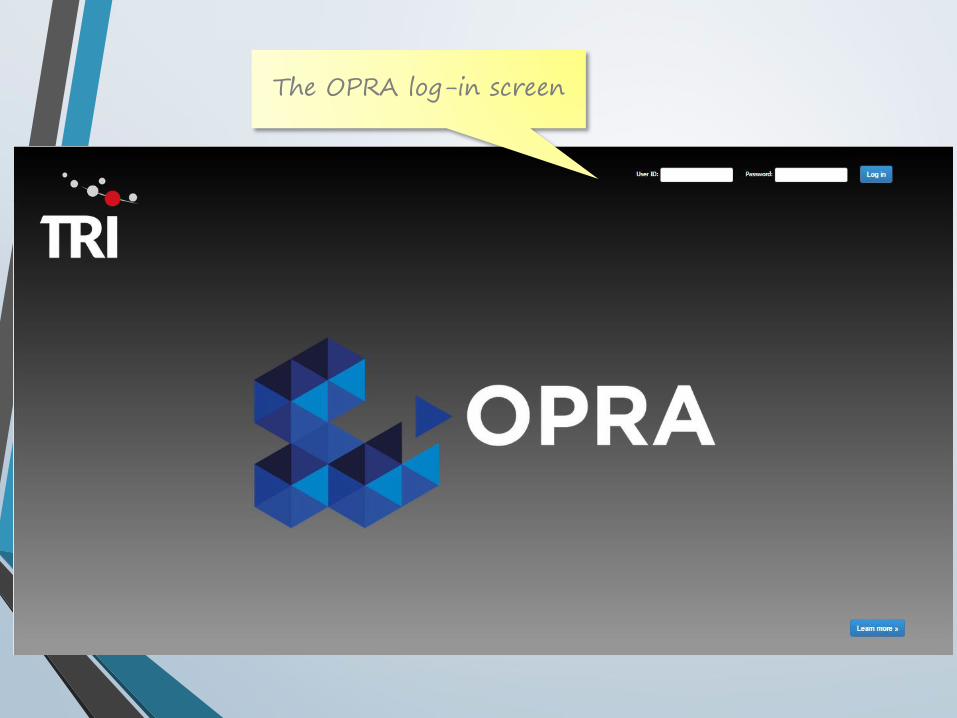
The OPRA log-in screen
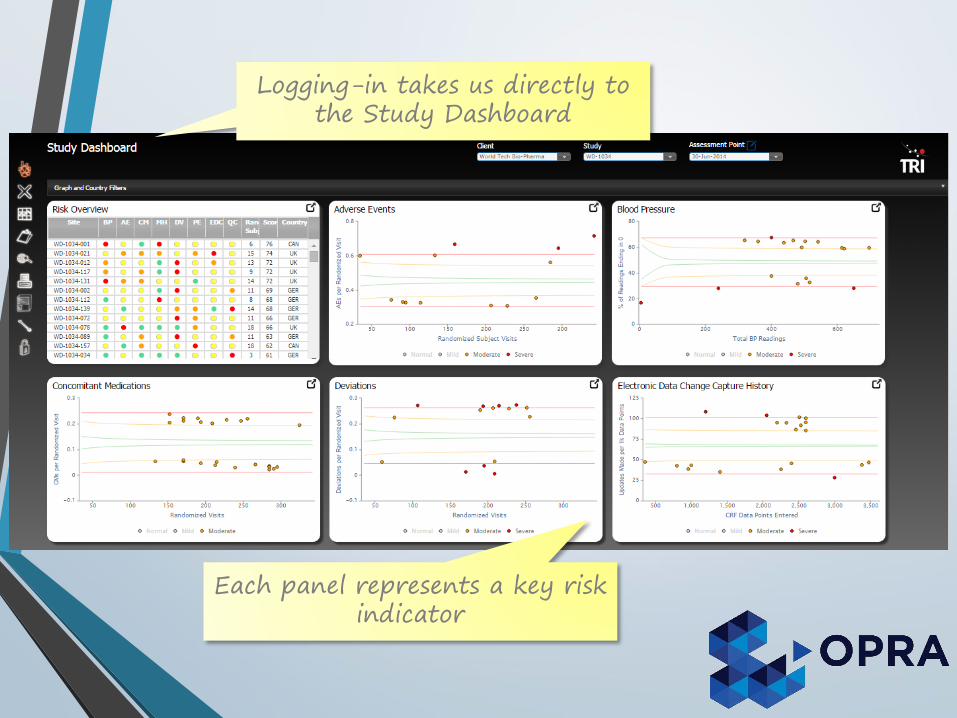
Logging-in takes us directly to the Study Dashboard
Each panel represents a key risk indicator
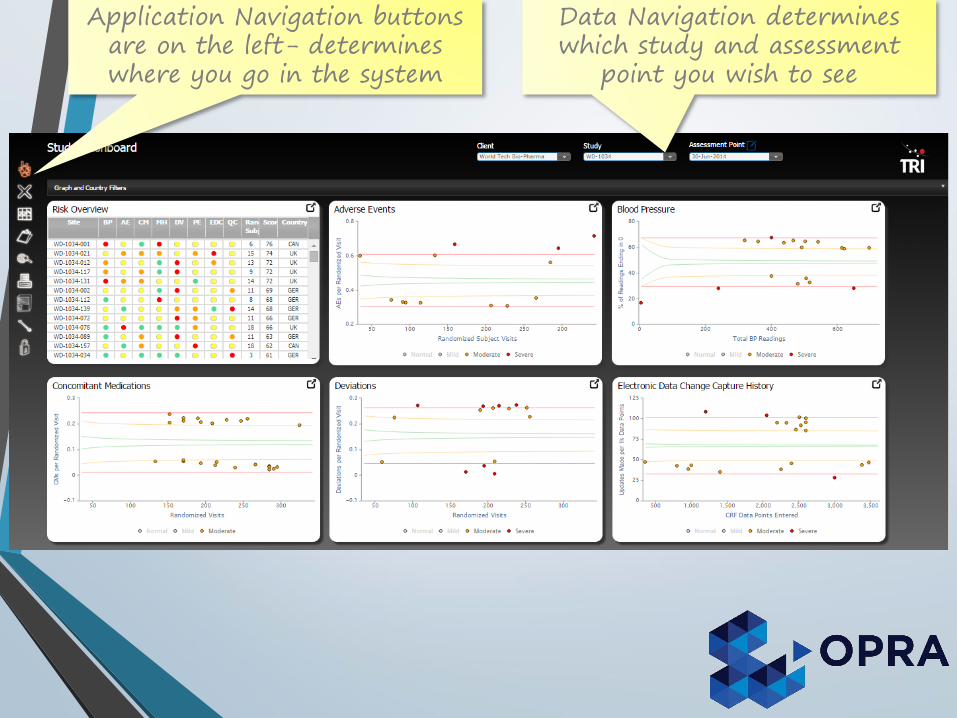
Application Navigation buttons are on the left- determines where you go in the system
Data Navigation determines which study and assessment
point you wish to see
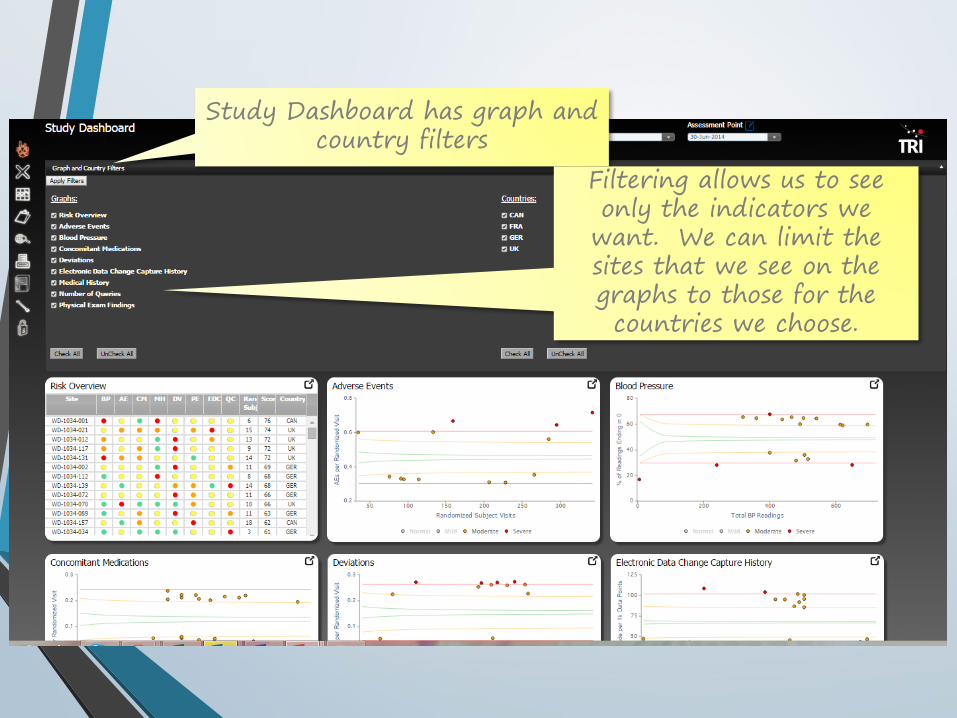
Study Dashboard has graph and country filters
Filtering allows us to see only the indicators we
want. We can limit the sites that we see on the graphs to those for the countries we choose.
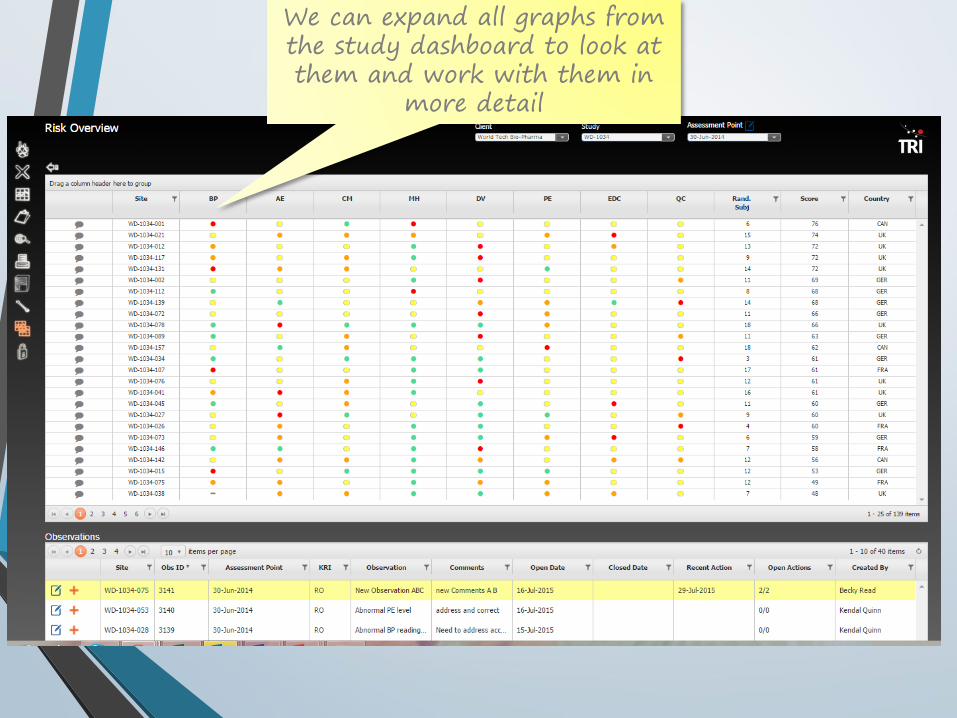
We can expand all graphs from the study dashboard to look at them and work with them in
more detail

Click on a call out icon next to a site to make an observation
for the site
Observation window allows us free text for observation made
and associated comments
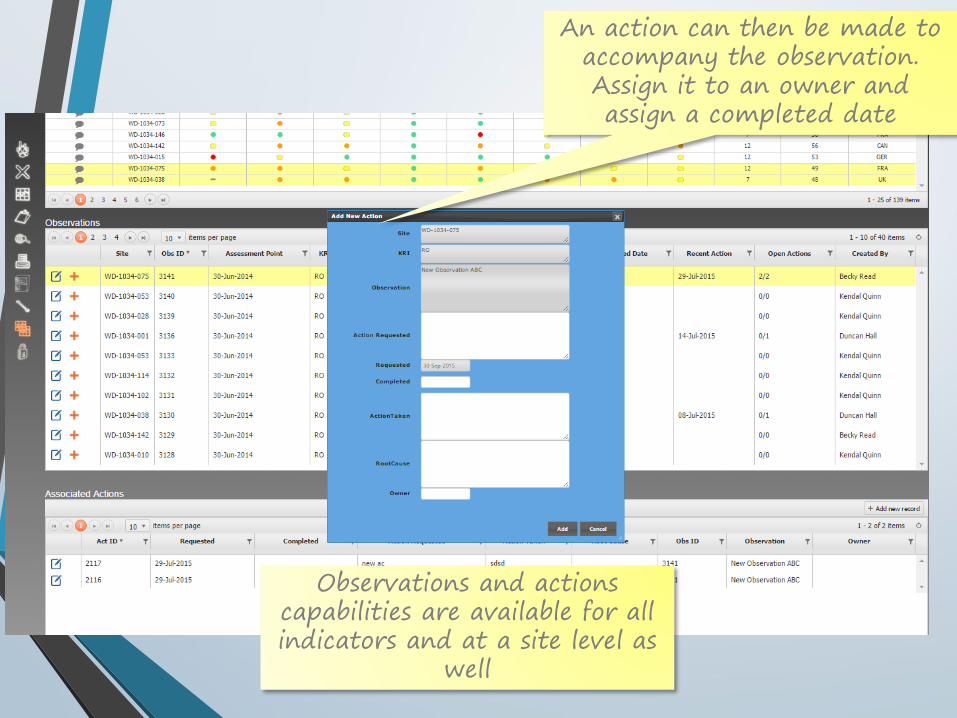
An action can then be made to accompany the observation. Assign it to an owner and assign a completed date
Observations and actions capabilities are available for all indicators and at a site level as
well
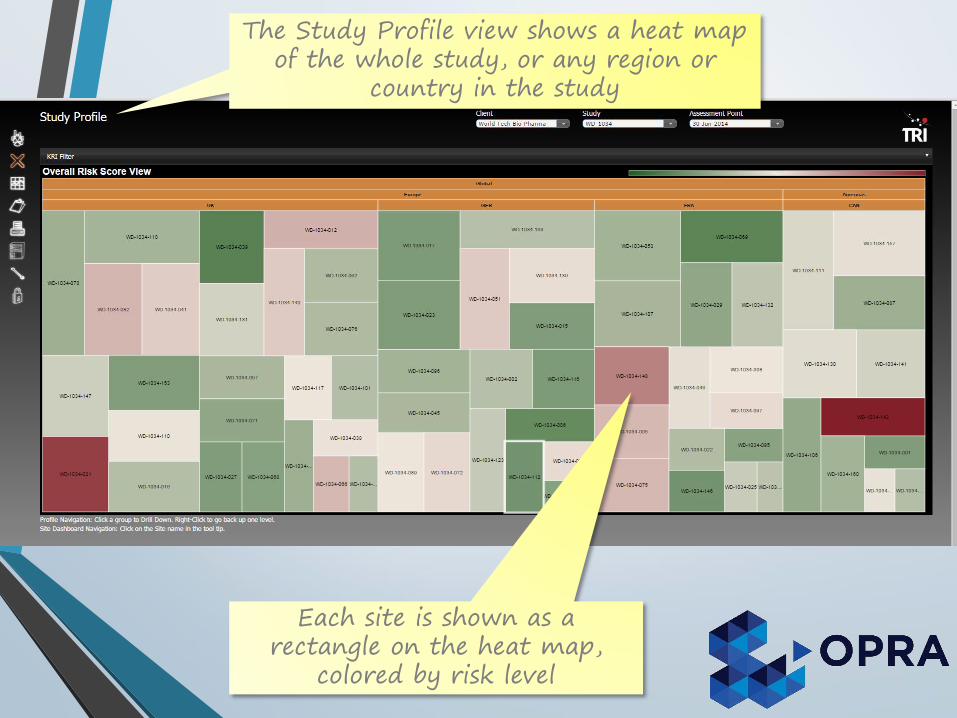
The Study Profile view shows a heat map of the whole study, or any region or
country in the study
Each site is shown as a rectangle on the heat map,
colored by risk level
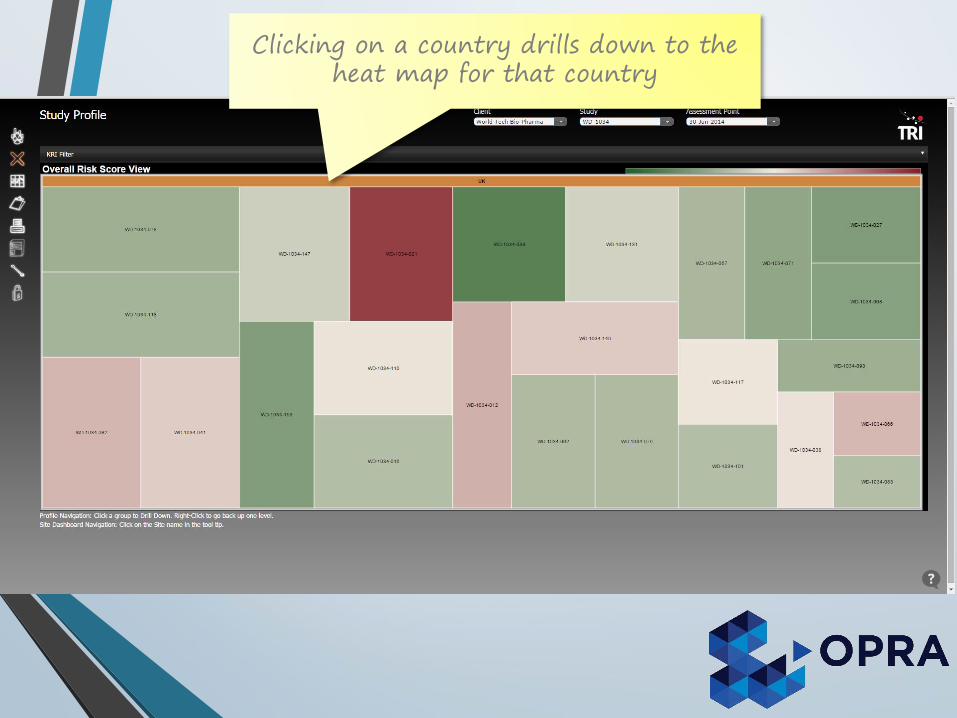
Clicking on a country drills down to the heat map for that country
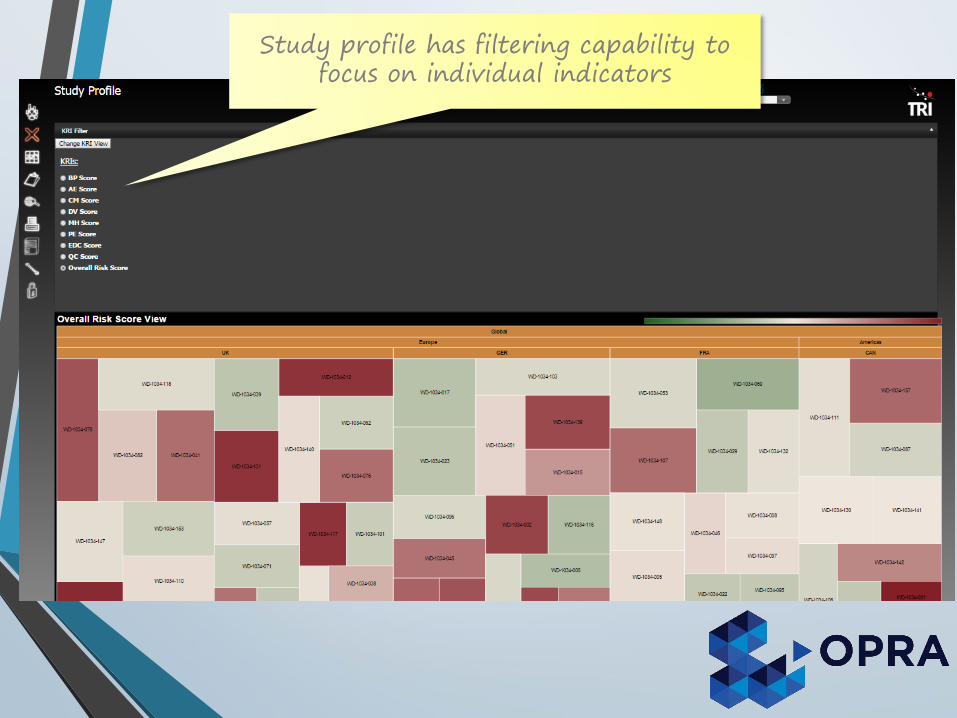
Study profile has filtering capability to focus on individual indicators
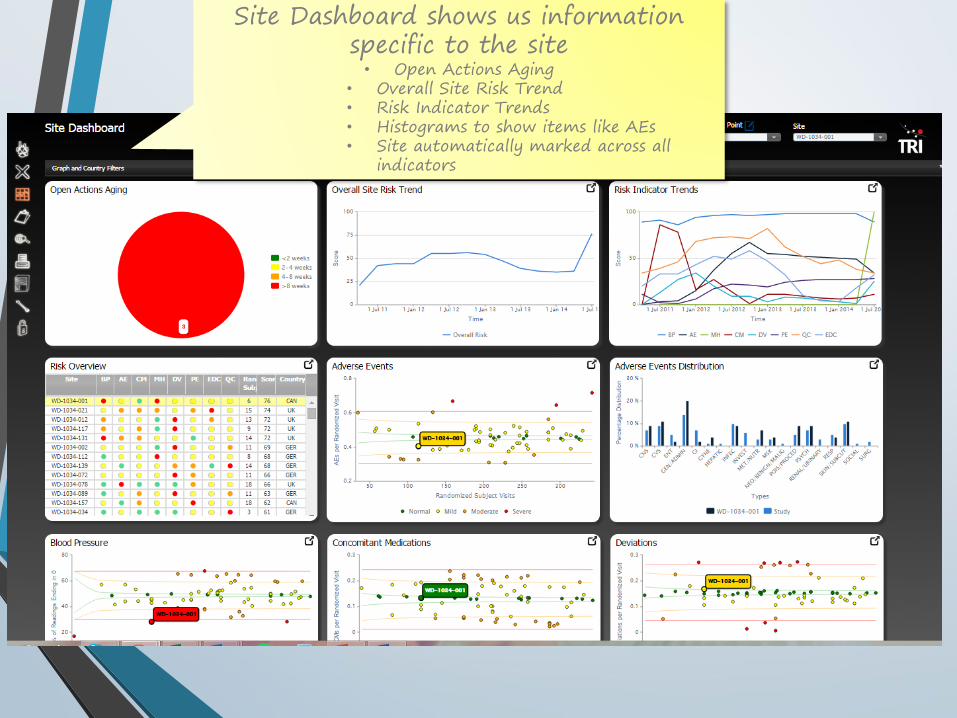
Site Dashboard shows us information specific to the site• Open Actions Aging
• Overall Site Risk Trend• Risk Indicator Trends• Histograms to show items like AEs• Site automatically marked across all
indicators
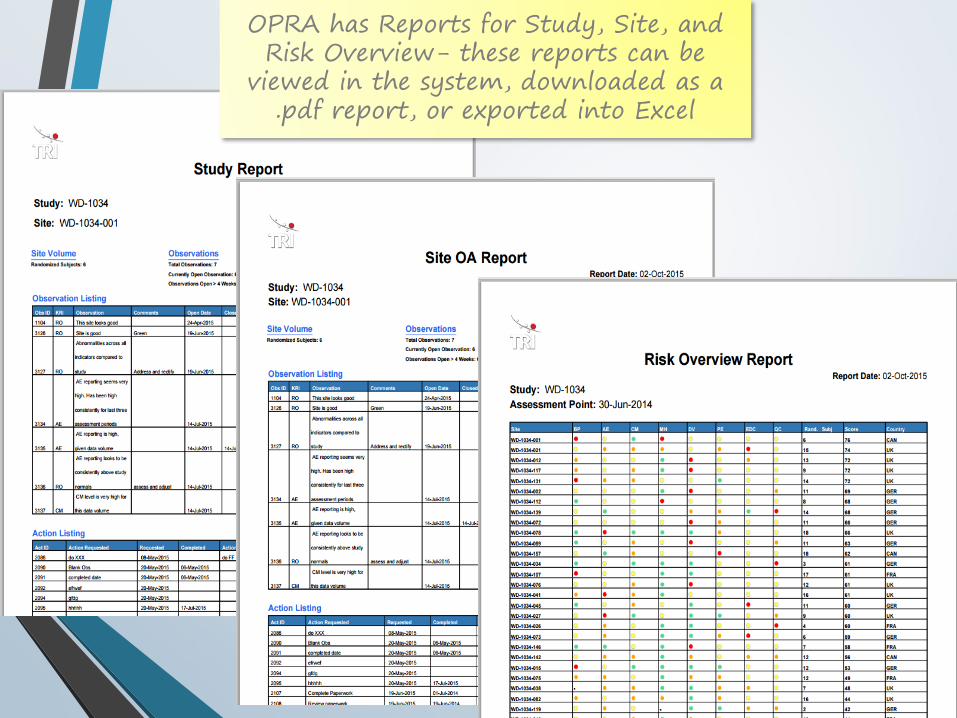
OPRA has Reports for Study, Site, and Risk Overview- these reports can be
viewed in the system, downloaded as a .pdf report, or exported into Excel
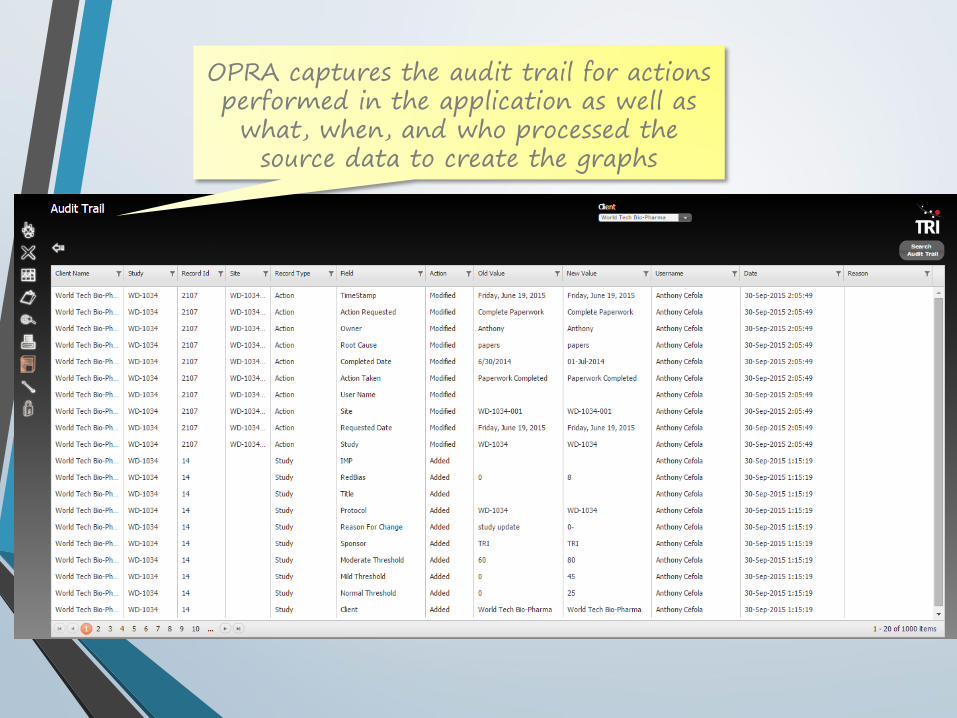
OPRA captures the audit trail for actions performed in the application as well as what, when, and who processed the
source data to create the graphs
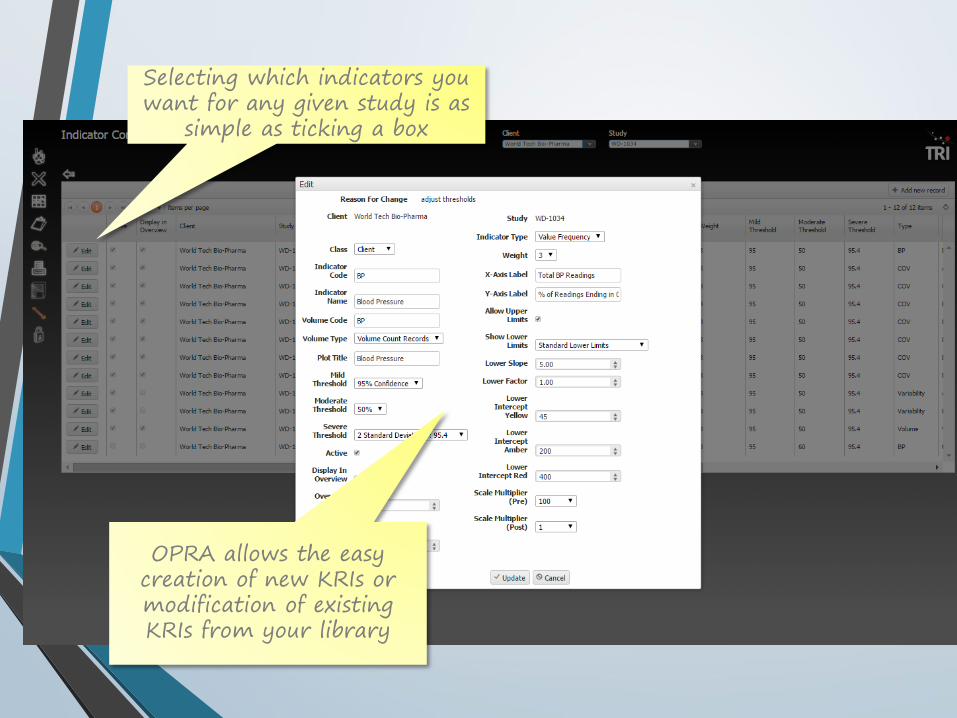
OPRA allows the easy creation of new KRIs or modification of existing KRIs from your library
Selecting which indicators you want for any given study is as
simple as ticking a box
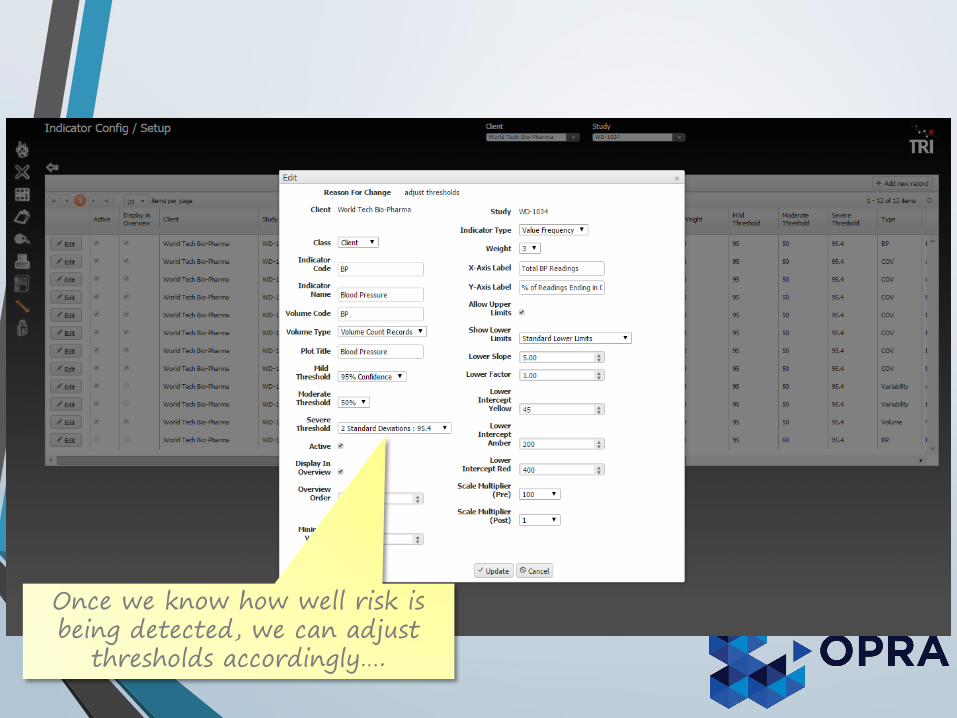
Once we know how well risk is being detected, we can adjust
thresholds accordingly….
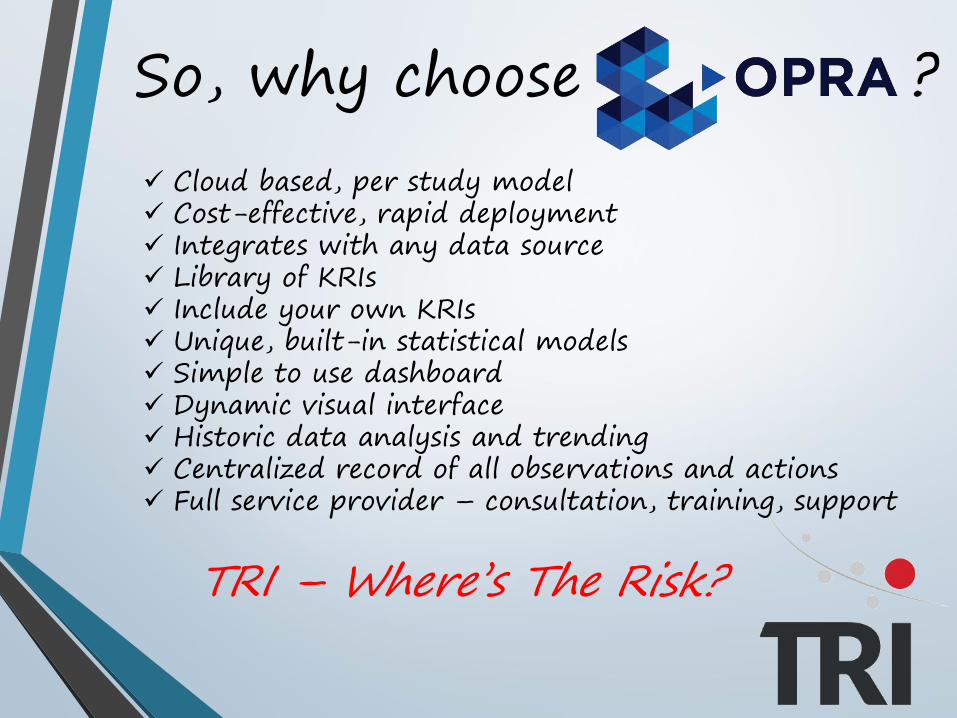
So, why choose ?
Cloud based, per study model Cost-effective, rapid deployment Integrates with any data source Library of KRIs Include your own KRIs Unique, built-in statistical models Simple to use dashboard Dynamic visual interface Historic data analysis and trending Centralized record of all observations and actions Full service provider – consultation, training, support
TRI – Where’s The Risk?

To learn more about OPRA, TRI’s accompanying RBM services and how you can apply such expertise to your organization to instantly improve study quality- we'd love to talk further with you….
Kendal QuinnGlobal Head, Business Development
[email protected] [email protected]
919.747.9400 (Work) 919.879.4458 (Cell)
www.tritrials.com
TRI – Where’s The Risk?