Embed Size (px)
Citation preview
Teaching Statistics in Primary school
A focus on the project developed by the territorial network of Italian National Institute of Statistics (Istat)
Authors: S. Da Valle*, P. F. Cortese, S. Osti, A. Valentini
* Speaker
2° ConferenceBrussels, 24-26 October 2014

In a knowledge-based society, being able to read, interpret, evaluate data and use data for decisions is as necessary as the ability to read and write. Statistical literacy allows us to discriminate meaningful messages from misleading ones; that is…
to extract knowledge from quantitative information
12
2
1,4
8
⅓
8
1,1
- 0,3
725
333
0,2
7
5
900
0,3
8
11
20
1
-0,21
3%
44
6,2
2
0,5
785
The data deluge - The Economist february25th 2010
1 23
Data can influence and transform individual and social decision-making
Preface: the data deluge
Teaching Statistics in Primary school, Silvia Da Valle – Brussels, 24-26 October 2014
1

Cultural context: key competences for lifelong learning
Mathematical competence and basic competences in science and technology
EU Member States have to make it their goal to develop educational systems aimed at promoting the acquisition of the key competencies needed by all citizens to exercise their right to a participated citizenship.
Knowledge, skills and attitudes to face the challenges of the new cultural context
Statistics plays a central role
2
Teaching Statistics in Primary school, Silvia Da Valle – Brussels, 24-26 October 2014

Sequence of targets for the development of statistical literacy among children in primary school curricula (6-11 years old):
Statistics in Italian school curricula: primary school
She/he is able to use data representations to extract information for decision making
She/He is able to read and represent data using graphs and tables
She/He is able to summarize data (frequency, mode and arithmetic mean)
3
Teaching Statistics in Primary school, Silvia Da Valle – Brussels, 24-26 October 2014

Italian national Institute of statistics: role
DATA QUANTITATIVE INFORMATION
Knowledge
Serves the community by producing and communicating high-quality statistical information
Promotes statistical literacyto support decision making at all levels
Istat is a public research body which:
4
Teaching Statistics in Primary school, Silvia Da Valle – Brussels, 24-26 October 2014
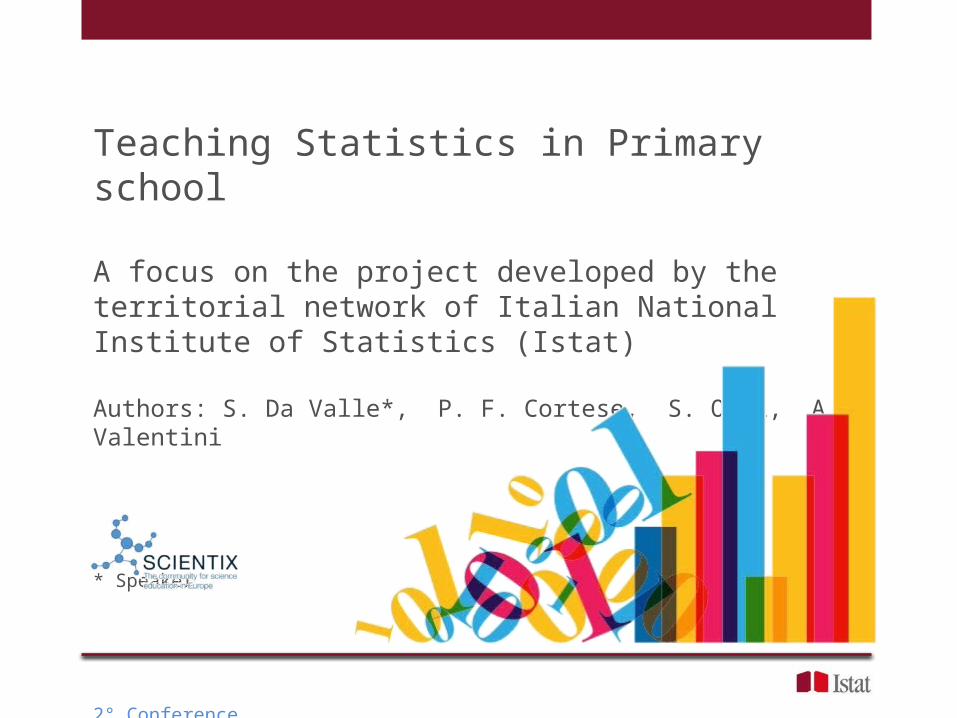
Active citizenship in the knowledge
society
Particular attention on younger generations
Istat for young generations and school system
Strategic role ofthe school system
5
Teaching Statistics in Primary school, Silvia Da Valle – Brussels, 24-26 October 2014

How to realize the project: the territorial network of experts (NPSL)
6
NPSL is a team of about 80 people who work in Istat’s Regional Offices with the aim of:
the school system promoting statistical literacy within
the whole society assessing implementation of proposals
Teaching Statistics in Primary school, Silvia Da Valle – Brussels, October, 24-26 2014
It is within this group that new
working ideas for younger
generations through the school
system were initiated

The driving idea: learning tools
Address children through their teachers,
by providing them learning tools ready to be used in the classes.
Tools must be a concrete support for the teachers, ready to be used,
flexible, and particularly attractive for young children.
7
Teaching Statistics in Primary school, Silvia Da Valle – Brussels, 24-26 October 2014

Careful analysis of school curricula in force in primary schools precise references to core topics to propose.
Six curricular topics covered: one-way and two-way frequency tables, pictograms, bar charts, arithmetic mean, mode + additional exercises
Extra materials to introduce children to the activity of statisticians and to the role of Istat are also available
Methods - Step one: choice of topics
8
Design of learning tools in accordance with three basic requirements: the need to pay particular attention to the presentation, considering the
age of the target group
the possibility of doing exercises on the topics, to reinforce concepts through application
the possibility of using them in different learning contexts
Methods - Step two: intrinsic requirements
Teaching Statistics in Primary school, Silvia Da Valle – Brussels, 24-26 October 2014

Tools are devised as thematic folders, one for each topic, and each folder is structured in the same format
Methods – Step three: formats
9 A concise guide for the correct use of the tools is also available.
Teaching Statistics in Primary school, Silvia Da Valle – Brussels, 24-26 October 2014
Description of the structure of each dossier target tool
Interactive presentationto introduce the topic in a friendly way to pupils.
10/15 minutes long
Thematic exerciseswith control cells for the children's responses
flexible in use: on PC, with IWB or on paper
Technical notefor additional information to teachers
methodological references, ideas for further activities
Students/ Teachers
Power Point file
Students/ Teachers
Excel file
Teachers pdf file

10
Results
Tools are created to be used with students in various learning contexts
in a traditional classroom, with paper and pen; for individual or group activities, in a computer lab for lessons with interactive whiteboards (IWB).
In addition, tools can be used with pupils for different kinds of activities:
to reinforce, to consolidate, children's competences to strengthen
This ensures the highest level of freedom for the teacher and takes into account the recent innovations in teaching due to the introduction of ICT.
Teaching Statistics in Primary school, Silvia Da Valle – Brussels, 24-26 October 2014

Easily managed (by teachers or pupils)
animations to capture attention
flow of the animations supported by specific icons
introduces the topic through a situation familiar to children
introduces technical aspects gradually, with methodological rigour
friendly language, suited to the audience
ends with some indications for further activities
11
Extract from a presentation
Teaching Statistics in Primary school, Silvia Da Valle – Brussels, 24-26 October 2014
WHO WON THE GAME?TO FIND OUT IT QUIKLY,
WE CAN LINE UP ALL THE TOWERS
YELLOW WINS!

THE TEACHER HAS ASKED THE CHILDREN IN HER CLASS
WHICH IS THEIR FAVOURETE FRUIT.
SHE HAS COLLECTED THE DATA IN A TABLE
FRUITNUMBER OF
CHILDREN
APPLE 12
PEAR 3
STRAWBERRY 12
WATERMELON 6
BANANA 16
GRAPES 2
MELON 11
PINEAPPLE 1
KIWI 2
WHAT IS THE MODE?CHECK YOUR ANSWER WRITING CORRECTLY IN THE BLUE BOX.
BANANA OK!
Example of an exercise
use of evocative pictures to support the comprehension of the text
input cells for the children's responses and output cells for automatic control of the answers
printable version of the exercise in order to give the opportunity to work on paper
Teaching Statistics in Primary school, Silvia Da Valle – Brussels, 24-26 October 2014
12

13
Where to find the learning tools: www.istat.it
http://www.istat.it/it/istituto-nazionale-di-statistica/attivit%C3%A0/scuola-superiore-di-statistica/under-21/pacchetti-didattici
Teaching Statistics in Primary school, Silvia Da Valle – Brussels, 24-26 October 2014
http://tinyurl.com/istat-school

Outlook for the future
14
- Supporting teaching of statistics in all school levels, with learning tools;
- providing specialized training for teachers together with all Institutions involved in advanced training for teachers (i.e. universities or other research Institutions);
- Activating networks of teachers, to gather useful information to realize further activities.
The active contribution of Official Statistic will be crucial to promote statistical literacy in the school system
How could Istat contribute?
Teaching Statistics in Primary school, Silvia Da Valle – Brussels, 24-26 October 2014
Istat, on the basis of its mandate with the aim of being an active
part in the service of citizens and of democratic decision
processes, is ready to sustain an high quality education system.

Thank youfor listening!
Paola Francesca Cortese [email protected]
Silvia Da Valle [email protected]
Susi Osti [email protected]
Alessandro Valentini [email protected]
2 ConferenceBrussels, 24-26 October 2014
Teaching Statistics in Primary school, Silvia Da Valle – Brussels, 24-26 October 2014

References1. Cortese P. F., Valentini A., 2013, Cultura statistica sul territorio: nuove modalità e nuovi attori (Statistical literacy at
the local level: new modalities and new actors), News stat 9, dicembre 2013, p. 132. EUROPEAN PARLIAMENT (2006). Recommendation of the European Parliament and of the Council of 18
December 2006 on key competences for lifelong learning (2006/962/EC) 3. GAL I. (2002), Adults’ statistical literacy: Meanings, components, responsibilities, International Statistical Review,
70, 1-514. ISTAT. 2006, Il valore dei dati, Istituto Nazionale di Statistica, Roma, http://www3.istat.it/servizi/studenti/valoredati/5. IMR, Italian Ministerial Regulation for school curricula in primary school (2009). Regolamento recante indicazioni
nazionali per il curricolo della scuola dell'infanzia e del primo ciclo d'istruzione, a norma dell'articolo 1, comma 4, del decreto del Presidente della Repubblica 20 marzo 2009, n. 89.: D. M. 16 novembre 2012, n. 254.
6. Maggino F., Trapani M., 2009c, Presentare e comunicare le statistiche: principi, componenti e valutazione della loro qualità - parte 3. Rappresentazione delle statistiche: i tool. (Presenting and communicating statistics: principles, components, and evaluation of their quality - part 3. Representation of statistics: tools) Sis-Magazine - Online Magazine della Società Italiana di Statistica
7. Ottaviani M.G. 2008, Statistica e Matematica a scuola: due discipline e un solo insegnamento. Confronto culturale e opportunità interdisciplinare. (Statistics and Mathematics at school: two disciplines and one teaching. Cultural comparisons and interdisciplinary opportunities) Induzioni, 36, 1, 2008, (p. 17-38) – Pisa
8. Peci M., 2013, La Scuola superiore di statistica dell’Istat al servizio delle scuole. (The Advanced School of Statistic of Istat for the school system) Induzioni, 45, 2012, pp. 117-120
9. SHIELD M (2011), Statistical Literacy: A new mission for data producers, Statistical Journal of the IAOS 27 (2011) 173-183 IOS Press
10. THE ECONOMIST (2010). The data deluge. http://www.economist.com/node/1557971711. UNECE. 2012, Making data meaningful. Part 4 : A guide to improving statistical literacy, United Nation Economic
Commission for Europe, Geneva.12. WADE B., GOODFELLOW M. (2009), Confronting statistical literacy in the undergraduated social science
curriculum, Sociological Viewpoints, October 1, 200913. WALLMAN K.K (1993), Enhancing Statistical Literacy: Enriching Our Society, Journal of the American Statistical
Association, Vol 88, No 421.
Teaching Statistics in Primary school, Silvia Da Valle – Brussels, 24-26 October 2014