Embed Size (px)
Citation preview
EVALUATION OF COLD IN-PLACE RECYCLING FOR
REHABILITATION OF TRANSVERSE CRACKING ON
US 412
By
YATISH ARVIND JAKATIMATH
Bachelor of Engineering
Karnatak University
Dharwad, India
2000
Submitted to the Faculty of the Graduate College of the
Oklahoma State University In partial fulfillment of
the requirements for the Degree of
MASTER OF SCIENCE May, 2007
ii
EVALUATION OF COLD IN-PLACE RECYCLING FOR
REHABILITATION OF TRANSVERSE CRACKING ON
US 412
Thesis Approved:
Dr. Stephen A. Cross Thesis Advisor
Dr. Garold D. Oberlender
Dr. Hyung Seok Jeong
Dr. A. Gordon Emslie Dean of the Graduate College

iii
TABLE OF CONTENTS
CHAPTER
1 INTRODUCTION ................................................................................................1
PROBLEM STATEMENT ..............................................................................1
OBJECTIVE ....................................................................................................2
SCOPE .............................................................................................................2
2 LITERATURE REVIEW ....................................................................................4
RECYCLING ...................................................................................................4
Cold Planning ...................................................................................................5
Hot Recycling ..................................................................................................5
Hot Inplace Recycling .....................................................................................6
Full Depth Reclamation ...................................................................................6
Cold Recycling ................................................................................................6
Cold Central Plant Recycling ....................................................................6
Cold Inplace Recycling ..............................................................................7
CIR CONSTRUCTION PROCESS .................................................................7
CIR EQUIPMENT ...........................................................................................8
Single Unit CIR Trains ...............................................................................8
Two-Unit CIR Trains ...............................................................................12
Multi-Unit CIR Trains ..............................................................................13
ADDITIVES ...................................................................................................17
Asphalt Emulsions ....................................................................................17
Rejuvenators .............................................................................................18

iv
Chemical Additives ..................................................................................19
Cutback Asphalts ......................................................................................19
MIX DESIGN .................................................................................................20
Mix Design Procedures .............................................................................20
AASHTO-AGC Task Force 38 ..................................................................20
Modified Marshall and Oregon State Mix Design Method ......................20
Modified SuperPave Mix Design Methods ...............................................21
SemMaterials Reflex CIR Design Method ................................................22
WHY RECYCLING .......................................................................................22
Limitations of CIR ..........................................................................................24
MECHANISTIC-EMPIRICAL PAVEMENT DESIGN GUIDE ..................25
Need for the Design Guide .......................................................................25
M-EPDG ...................................................................................................25
3 MATERIALS AND TESTING PLAN ..............................................................27
INTRODUCTION ..........................................................................................27
MATERIALS ..................................................................................................27
RAP ...........................................................................................................27
Asphalt Emulsion ......................................................................................27
Lime ..........................................................................................................28
TEST PLAN ....................................................................................................28
RAP Properties ..........................................................................................28
Emulsion Properties ..................................................................................30
Hydrated Lime Slurry ...............................................................................30
Preparation of Dynamic Modulus Test Specimen ....................................31
v
Sample Requirements ....................................................................31
Batching ........................................................................................33
Emulsion Content ..........................................................................33
Mixing ...........................................................................................33
Compaction ...................................................................................34
Curing ...........................................................................................34
Coring & Sawing ..........................................................................34
Testing ...........................................................................................37
4 TEST RESULTS .................................................................................................40
DYNAMIC MODULUS TESTING RESULTS .......................................40
Volumetric Properties ...............................................................................45
5 ANALYSIS OF EXPERIMENTAL AND PREDICTED RESULTS .............47
ANALYSIS OF VARIANCE (ANOVA) .................................................47
MASTER CURVES .................................................................................49
Extrapolated Results for E* at 54.4°C ......................................................51
E* PREDICTED EQUATION .................................................................59
Comparison of Experimental and Predicted Master Curves .....................67
M-EPDG ...................................................................................................69
Input Parameters .......................................................................................70
Design Trials and Results .........................................................................72
6 CONCLUSIONS AND RECOMMENDATIONS ...........................................75
CONCLUSIONS ......................................................................................75
RECOMMENDATIONS .........................................................................76
7 REFERENCES ...................................................................................................78
vi
LIST OF TABLES
TABLE 3-1 Gradation of RAP and Recovered Aggregate from US-412 ........................29
TABLE 3-2 Residual Asphalt Cement Content in Emulsions ..........................................30
TABLE 3-3 Test Specimen Matrix ...................................................................................31
TABLE 3-4 Criteria for Acceptance of Dynamic Modulus Test Specimen .....................32
TABLE 3-5 Percentages of Water and Emulsions Based on Dry Weight of RAP ...........33
TABLE 3-6 Test Parameters for Dynamic Modulus Test ................................................39
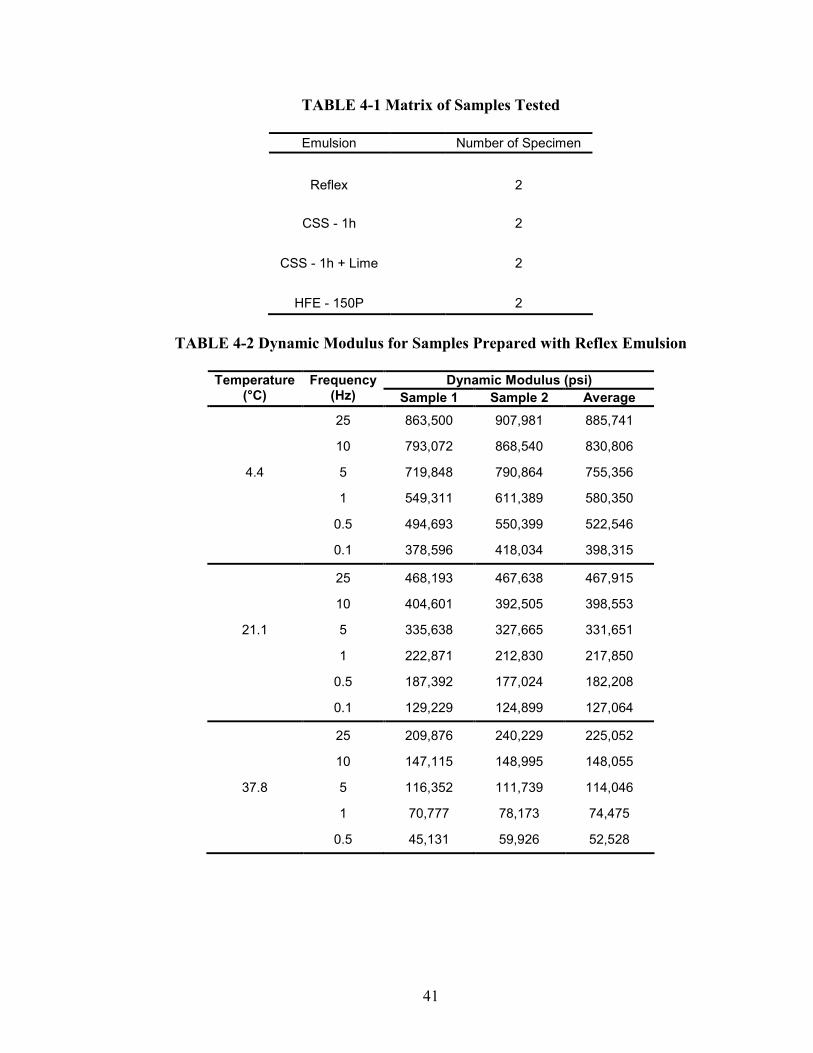
TABLE 4-1 Matrix of Samples Tested .............................................................................41
TABLE 4-2 Dynamic Modulus for Samples Prepared with Reflex Emulsion .................41
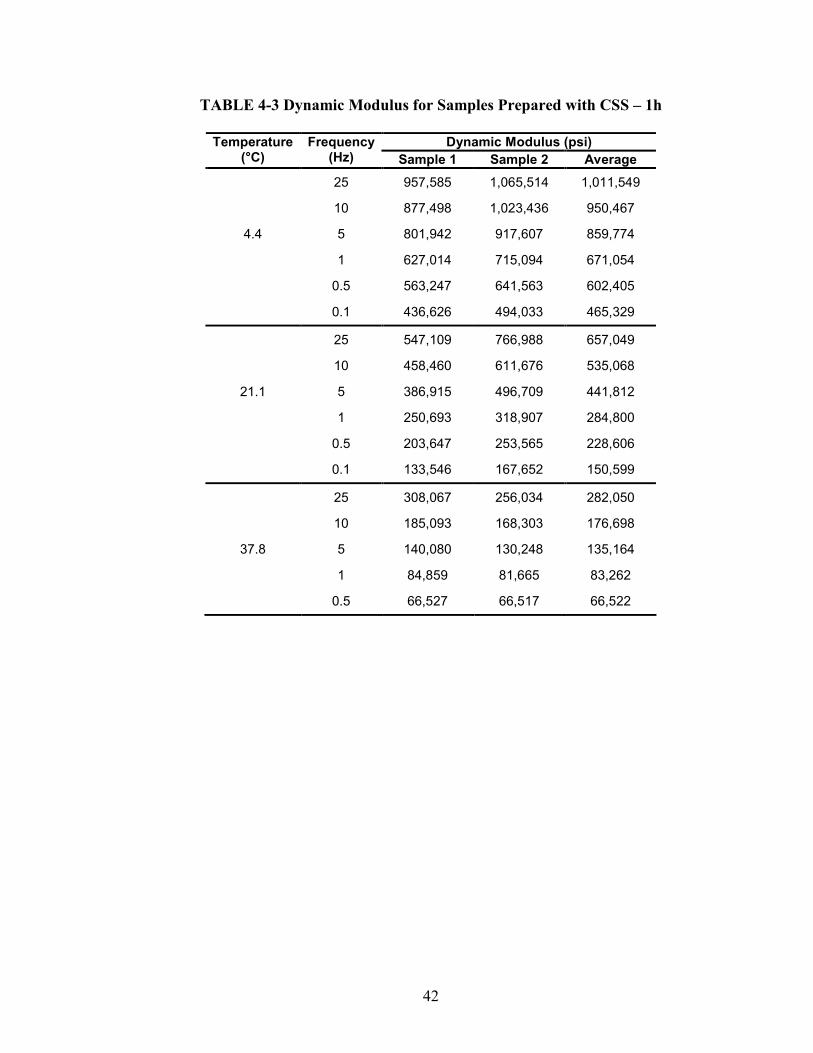
TABLE 4-3 Dynamic Modulus for Samples Prepared with CSS – 1h .............................42
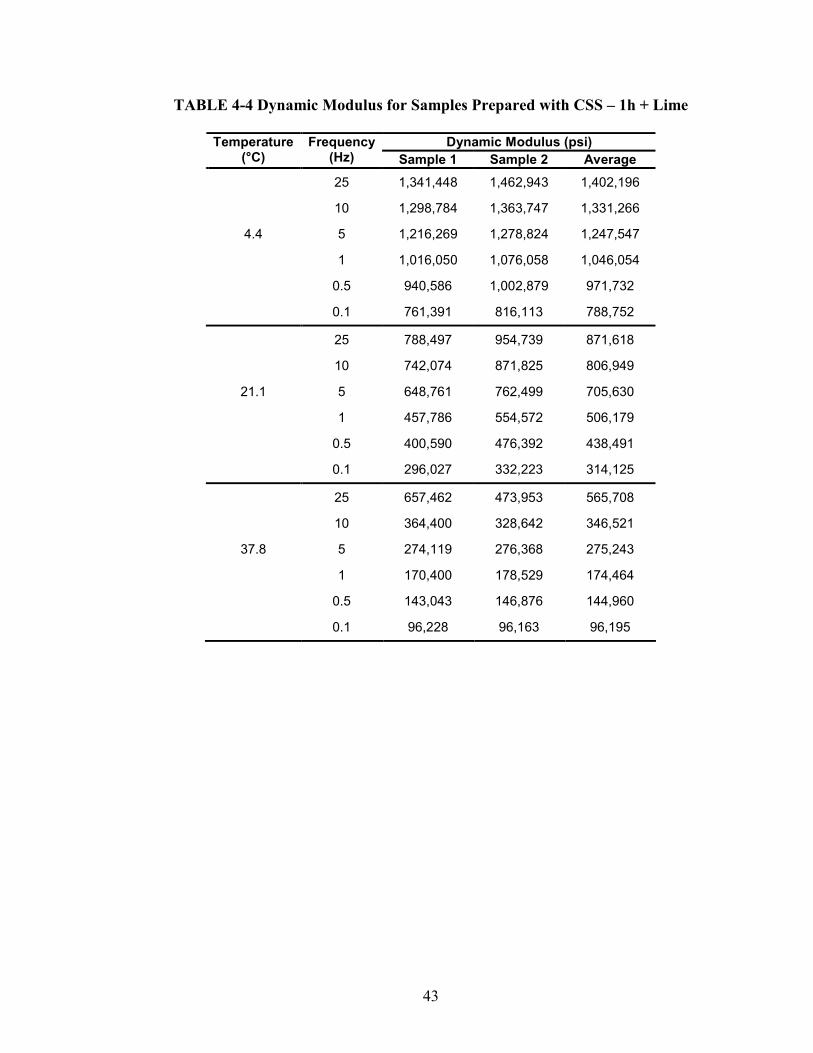
TABLE 4-4 Dynamic Modulus for Samples Prepared with CSS – 1h + Lime ................43
TABLE 4-5 Dynamic Modulus for Samples prepared with HFE – 150P ........................44
TABLE 4-6 Volumetric and Mix Design Properties ........................................................46
TABLE 5-1 ANOVA for CIR Dynamic Modulus ............................................................48
TABLE 5-2 Results of Duncan’s Multiple Range Test for CIR Dynamic Modulus at
4.4°C (40°F) Test Temperature ........................................................................................48
TABLE 5-3 Results of Duncan’s Multiple Range Test for CIR Dynamic Modulus at
21.1°C (70°F) Test Temperature ......................................................................................49
TABLE 5-4 Results of Duncan’s Multiple Range Test for CIR Dynamic Modulus at
37.8°C (100°F) Test Temperature ....................................................................................49
TABLE 5-5 Dynamic Modulus for Samples Prepared with Reflex Emulsion .................53
TABLE 5-6 Dynamic Modulus for Samples Prepared with CSS – 1h .............................54
TABLE 5-7 Dynamic Modulus for Samples Prepared with CSS – 1h + Lime ................55
vii
TABLE 5-8 Dynamic Modulus for Samples Prepared with HFE – 150P ........................56
TABLE 5-9 Predicted Dynamic Modulus for US-412 RAP and Reflex Emulsion ..........61
TABLE 5-10 Predicted Dynamic Modulus for US-412 and CSS-1h Emulsion ...............62
TABLE 5-11 Predicted Dynamic Modulus for US-412 and CSS-1h+Lime ....................63
TABLE 5-12 Predicted Dynamic Modulus for US-412 and HFE-150P ..........................64
TABLE 5-13 Default Performance Criteria ......................................................................70
TABLE 5-13 Trials Run in the M-EPDG to Arrive at a Economical Thickness for HMA
Overlay ..............................................................................................................................73
TABLE 5-14 Minimum HMA Overlay Thickness ...........................................................74
viii
LIST OF FIGURES
FIGURE 2-1 A Self Contained Single Unit CIR Train ......................................................9
FIGURE 2-2 Traditional Single Unit CIR Train and Sectional View of the Process .......10
FIGURE 2-3 Super Single Unit CIR Train .......................................................................11
FIGURE 2-4 A Single Unit CIR Train Deposits the Recycled Mixture in a Windrow ....11
FIGURE 2-5 Schematic View of the Two-Unit CIR Train ..............................................12
FIGURE 2-6 A Paver Mixer Two-Unit CIR Train ...........................................................13
FIGURE 2-7 A Schematic of a Multi-Unit CIR Train .....................................................14
FIGURE 2-8 Portable Crusher Attached to a Cold Milling Machine ...............................15
FIGURE 2-9 Cold Milling Machine .................................................................................15
FIGURE 2-10 Travel Plant Mixer ....................................................................................16
FIGURE 2-11 Laydown Machine ....................................................................................16
FIGURE 2-12 Multi-Unit CIR Train ...............................................................................17
FIGURE 2-13 Multi-Unit Train Performing CIR ............................................................17
FIGURE 3-1 Gradation of RAP and Recovered Aggregate ............................................30
FIGURE 3-2 Sample Being Cored to Required Test Diameter .......................................35
FIGURE 3-3 Sample is Sawed to Obtain Parallel Faces .................................................36
FIGURE 3-4 Test Specimens for Dynamic Modulus Testing .........................................36
FIGURE 3-5 Test Procedure for Dynamic Modulus of CIR Samples ............................38
FIGURE 5-1 Master Curve for US-412 and Reflex ........................................................57
FIGURE 5-2 Master Curve for US-412 RAP and CSS-1h Emulsion .............................57
FIGURE 5-3 Master Curve for US-412 RAP and CSS-1h+Lime Emulsion ..................58
FIGURE 5-4 Master Curve for US-412 RAP and HFE-150P Emulsion ........................58
ix
FIGURE 5-5 Master Curve of Predicted Dynamic Modulus for US-412 RAP and Reflex
Emulsion ...........................................................................................................................65
FIGURE 5-6 Master Curve of Predicted Dynamic Modulus for US-412 RAP and
CSS-1h Emulsion ..............................................................................................................65
FIGURE 5-7 Master Curve of Predicted Dynamic Modulus for US-412 RAP and
CSS-1h+ Lime Emulsion ..................................................................................................66
FIGURE 5-8 Master Curve of Predicted Dynamic Modulus for US-412 and
HFE-150P Emulsion .........................................................................................................66
FIGURE 5-9 Master Curves of Experimental and Predicted Dynamic Modulus for US-
412 and Reflex Emulsion ..................................................................................................67
FIGURE 5-10 Master Curves of Experimental and Predicted Dynamic Modulus for US-
412 and CSS-1h Emulsion ................................................................................................68
FIGURE 5-11 Master Curves of Experimental and Predicted Dynamic Modulus for US-
412 and CSS-1h + Lime Emulsion ...................................................................................68
FIGURE 5-12 Master Curves of Experimental and Predicted Dynamic Modulus for US-
412 and HFE-150P Emulsion ...........................................................................................69
FIGURE 5-13 M-EPDG Trial Section .............................................................................72
FIGURE 5-14 Typical Performance Plot .........................................................................74
1
CHAPTER 1
INTRODUCTION
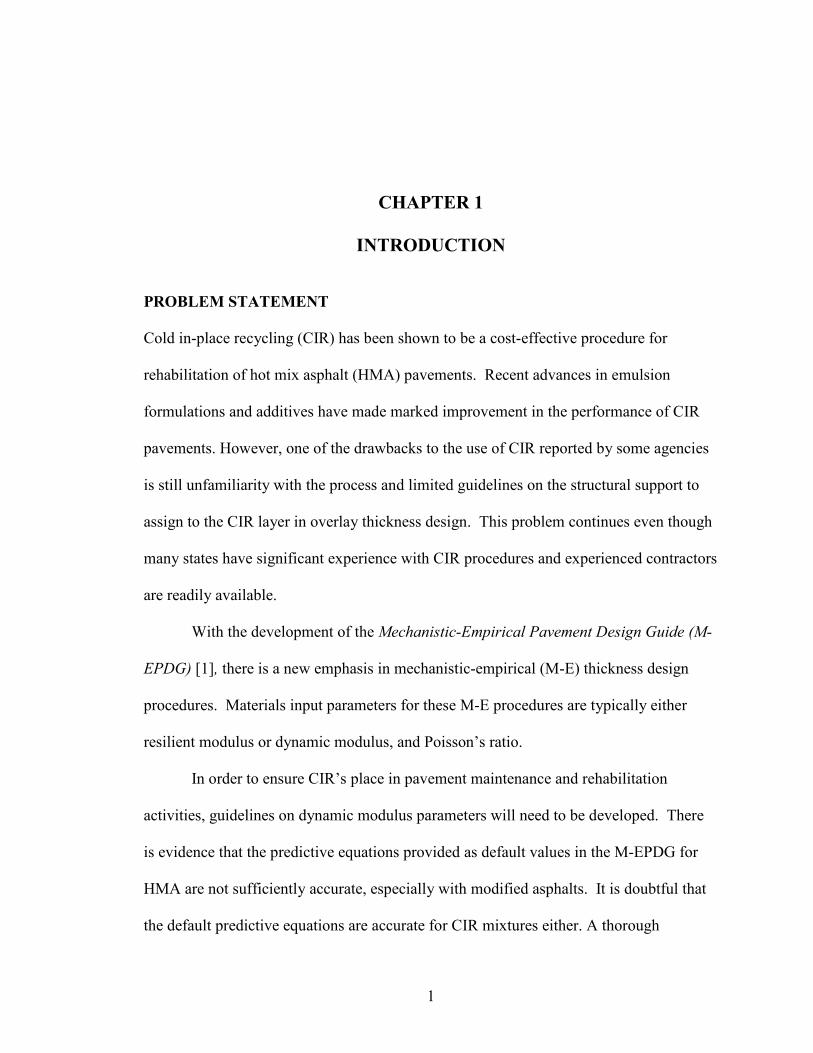
PROBLEM STATEMENT
Cold in-place recycling (CIR) has been shown to be a cost-effective procedure for
rehabilitation of hot mix asphalt (HMA) pavements. Recent advances in emulsion
formulations and additives have made marked improvement in the performance of CIR
pavements. However, one of the drawbacks to the use of CIR reported by some agencies
is still unfamiliarity with the process and limited guidelines on the structural support to
assign to the CIR layer in overlay thickness design. This problem continues even though
many states have significant experience with CIR procedures and experienced contractors
are readily available.
With the development of the Mechanistic-Empirical Pavement Design Guide (M-
EPDG) [1], there is a new emphasis in mechanistic-empirical (M-E) thickness design
procedures. Materials input parameters for these M-E procedures are typically either
resilient modulus or dynamic modulus, and Poisson’s ratio.
In order to ensure CIR’s place in pavement maintenance and rehabilitation
activities, guidelines on dynamic modulus parameters will need to be developed. There
is evidence that the predictive equations provided as default values in the M-EPDG for
HMA are not sufficiently accurate, especially with modified asphalts. It is doubtful that
the default predictive equations are accurate for CIR mixtures either. A thorough
2
laboratory evaluation of the dynamic modulus properties of CIR pavements is needed to
evaluate the input parameters required by the Mechanistic-Empirical Pavement Design
Guide.
A rehabilitation project using CIR, on US 412 in Beaver County, provided an
excellent opportunity to obtain samples for a laboratory evaluation of the dynamic
modulus properties of CIR pavements.
OBJECTIVE
The objectives of this thesis were to evaluate the dynamic modulus of CIR mixture made
with one reclaimed asphalt pavement (RAP) and four different emulsions and to compare
the results with the default values in the M-EPDG.
For bituminous materials, the M-EPDG uses a hierarchical approach with three
levels of materials characterization. The first level provides the highest design reliability,
using measured values, and each succeeding level is a drop in design reliability. The
second and third levels of material characterization use default master curves developed
from predictive equations for conventional hot mix asphalt mixtures [1]. The proposed
research project would provide an excellent opportunity to investigate the dynamic
modulus properties of CIR mixtures and evaluate the appropriateness of the default
dynamic modulus values.
SCOPE
During construction of the CIR on the western portion of US 412, samples of RAP were
obtained prior to the addition of the recycling agent. Samples of the recycling agent
(reflex emulsion) were obtained. The in-place density and mix water content of the
compacted CIR were determined immediately after final rolling.
3
Three additional emulsions were obtained, CSS-1h, CSS-1h with lime and HFE-
150P. Laboratory samples of the US-412 RAP mixture were prepared by mixing RAP to
the mix water and emulsion contents used in field and compacting to the field unit
weight. The Dynamic Modulus (E*) of each sample was determined in accordance with
AASHTO TP-62 [2]. The data was analyzed using analysis of variance (ANOVA)
procedures. Duncan’s multiple range test was used to determine which means were
significantly different when the ANOVA indicated a statistical difference in means. The
E* obtained was also used to develop Master Curves for CIR which were compared to
the master curves obtained from the Witczak’s predictive equation for HMA which are
used as default values in the M-EPDG.
4
CHAPTER 2
LITERATURE REVIEW
RECYCLING
Recycling of hot mix asphalt (HMA) has increased in popularity since the late 1970s.
Many different reasons led to the increased demand and awareness of recycling. Probably
the largest single factor was the oil embargo of the early 1970s and the subsequent
increase in the price of asphalt. The increase in the price of asphalt made any reclaimed
asphalt pavement (RAP) material a valuable asset. Before the oil embargo, the price of
asphalt cement was so low that the cost of removing, stockpiling, and recycling old
pavements was more than that for purchasing, mixing, and placing new material [3].
A second item that has had a great impact on recycling is the development of the
milling machine. Prior to the development of the milling machine, old asphalt pavement
had to be ripped from the roadway, and then crushed prior to using. This process often
required that the roadway be shut down for extended periods of time. Another process
that was used prior to the use of the milling machine was the heater planer. This process
required a large amount of fuel to heat the pavement, resulted in air pollution, and
damaged the removed HMA by overheating.
The milling machine has solved most of these problems. It can remove any
amount of material desired and does not produce appreciable pollution since heat is not
required. The material removed with a milling machine does not have to be crushed since
5
it is fine enough immediately after being removed to recycle. A milled surface can also
be opened to traffic temporarily until the overlay has been completed [3].
Asphalt recycling is broadly classified into five categories by Asphalt Recycling
and Reclaiming Association (ARRA) [4]. These categories are:
• Cold Planning (CP)
• Hot Recycling
• Hot In-Place Recycling (HIR)
• Full Depth Reclamation (FDR)
• Cold Recycling (CR)
Cold Planning (CP)
Cold Planning (CP) is the controlled removal of the surface of the existing HMA
pavement to a desired depth, longitudinal profile, and cross-slope, using specially
designed equipment (milling machine). CP can be used to remove part or all of the
existing pavement layers. The resulting textured pavement can be used immediately as a
driving surface. CP is more commonly used as a surface preparation for one of the other
rehabilitation techniques such as HIR, CR, FDR or HMA overlays. In addition, CP can be
used to roughen or texture pavements to restore low friction numbers and eliminate
slipperiness [4].
Hot Recycling
Hot Recycling is the process of combining RAP with new aggregates, new asphalt
binder, and/or recycling agents in a central plant to produce a recycled mix. Hot recycling
utilizes the heat-transfer method to soften the RAP to permit mixing with virgin
6
aggregates and asphalt binder and/or recycling agent. Hot recycling of RAP currently is
the most widely used asphalt recycling method in the world [4].
Hot Inplace Recycling (HIR)
Hot Inplace Recycling consists of heating and softening the existing HMA pavement,
permitting it to be scarified or hot rotary milled to a specified depth. The scarified or
loosened asphalt pavement is then thoroughly mixed and subsequently placed and
compacted with conventional HMA paving equipment. In this process, 100 percent
recycling of the existing HMA pavement is completed on site [4].
Full Depth Reclamation (FDR)
Full Depth Reclamation (FDR) is the process in which the full thickness of the HMA
pavement and a predetermined portion of the base, subbase and /or subgrade is uniformly
pulverized and blended to provide and upgraded, homogenous base material. Often this
blend of material alone, without any additional stabilizing additives, is sufficient to act as
the base for new surface course. FDR is performed on the roadway without the addition
of heat [4].
Cold Recycling (CR)
Cold Recycling consists of recycling HMA pavement without the application of heat
during the recycling process. CR is classified into two sub-categories based on the
process used. These processes are Cold Central Plant Recycling (CCPR) and Cold In
place Recycling (CIR).
Cold Central Plant Recycling (CCPR)
Cold Central Plant Recycling is the process in which the asphalt recycling takes place in
a central location using a stationary cold mix plant. The stationary plant could be a
7
specifically designed plant or a CIR train, minus the milling machine, set up in a
stationary configuration. The CCPR mix can be used immediately or it can be stockpiled
for later use in such applications as maintenance blade patching or pothole repair [4].
Cold Inplace Recycling (CIR)
ARRA defines Cold Inplace Recycling as a partial depth recycling process that
rehabilitates the upper portion of an existing pavement, normally between 2 and 4 inches.
The RAP material is obtained by milling, planning, or crushing the existing pavement.
Virgin aggregate or recycling agent or both are added to the RAP material which is then
laid and compacted [4, 5].
In the CIR process, the old pavement is milled, then crushed and screened to size,
and ultimately mixed with a liquid recycling agent. New aggregate and other additives
can be added, if needed. A paver following the CIR train lays the cold mix, and it is
compacted as soon as the emulsion or recycling agent breaks and sets up, releasing the
moisture from the mix (usually 15 to 90 minutes after paving) [4, 6, 7, 8]. The process is
completed with the laying of a wearing surface over the CIR mix. A minimum HMA
thickness of 1.5 inches is recommended, though low traffic volume roads sometimes are
treated with chip seals [4, 8].
CIR CONSTRUCTION PROCESS CIR consists of the following steps [4, 5, 6]:
• Preparation of construction area;
• Reclaiming the old bituminous concrete pavement;
• Crushing the reclaimed pavement and sizing the bituminous aggregate;
• Addition of virgin aggregate if required;
8
• Addition of new binder;
• Mixing of all the components;
• Laydown of the new mixture;
• Aeration of the mixture;
• Compaction of the mixture;
• Curing of the mixture; and
• Application of wearing course.
CIR EQUIPMENT
CIR equipment can differ in size and sophistication. They generally differ by the way the
RAP is removed and sized, how the additives are added and mixed and, finally, how the
mix is placed. Generally, CIR is carried out by single or multiple units called trains. The
different kinds of CIR trains, which vary depending on their operation and size, are
single, two unit and multiple unit trains [4, 6, 9].
Single Unit Trains
The traditional single-unit train consists of a machine that mills the pavement to the
specified depth and cross slope and blends the recycling additive. One of the unique
features of the single-unit recycler is the use of a down-cutting milling head (most mills
cut on the up cycle). The down-cutting milling head lets the operator control RAP size by
adjusting the forward speed of the machine [4, 6, 8].
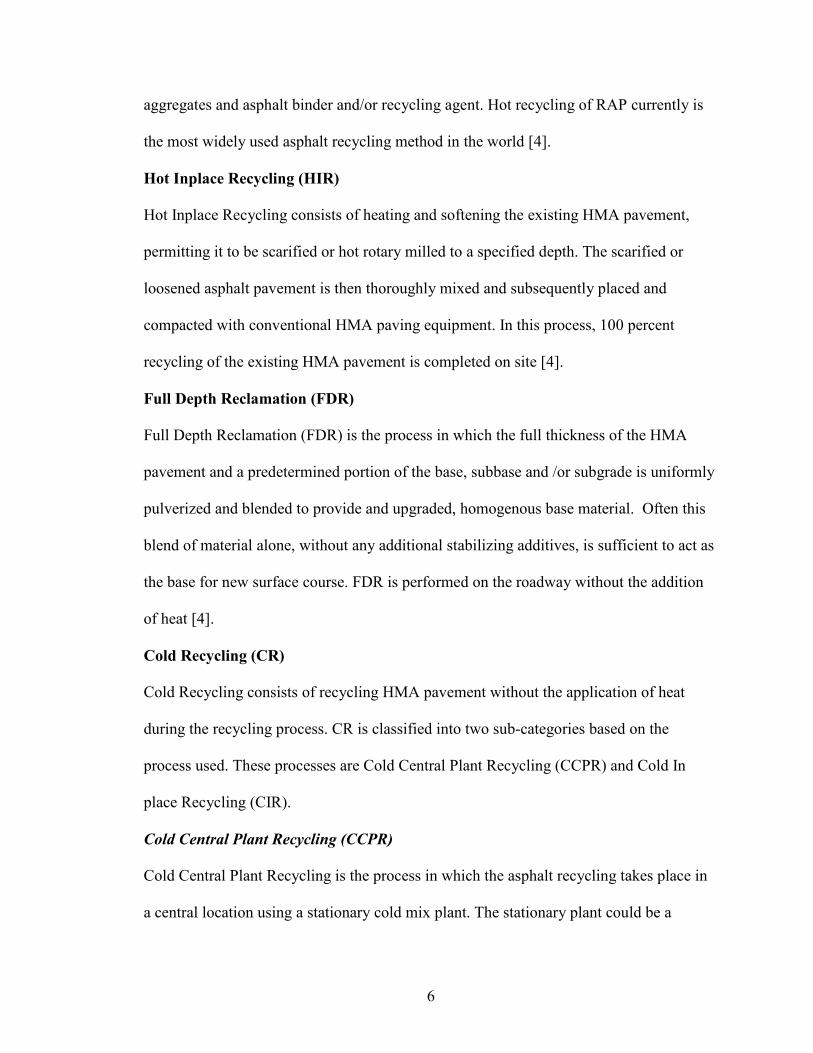
Figures 2-1 and 2-2 show a simple setup of a single unit train. In a single pass the
unit is capable of milling, adding recycling agent and paving the surface.
9
FIGURE 2-1 A Self Contained Single Unit CIR Train [10].
10
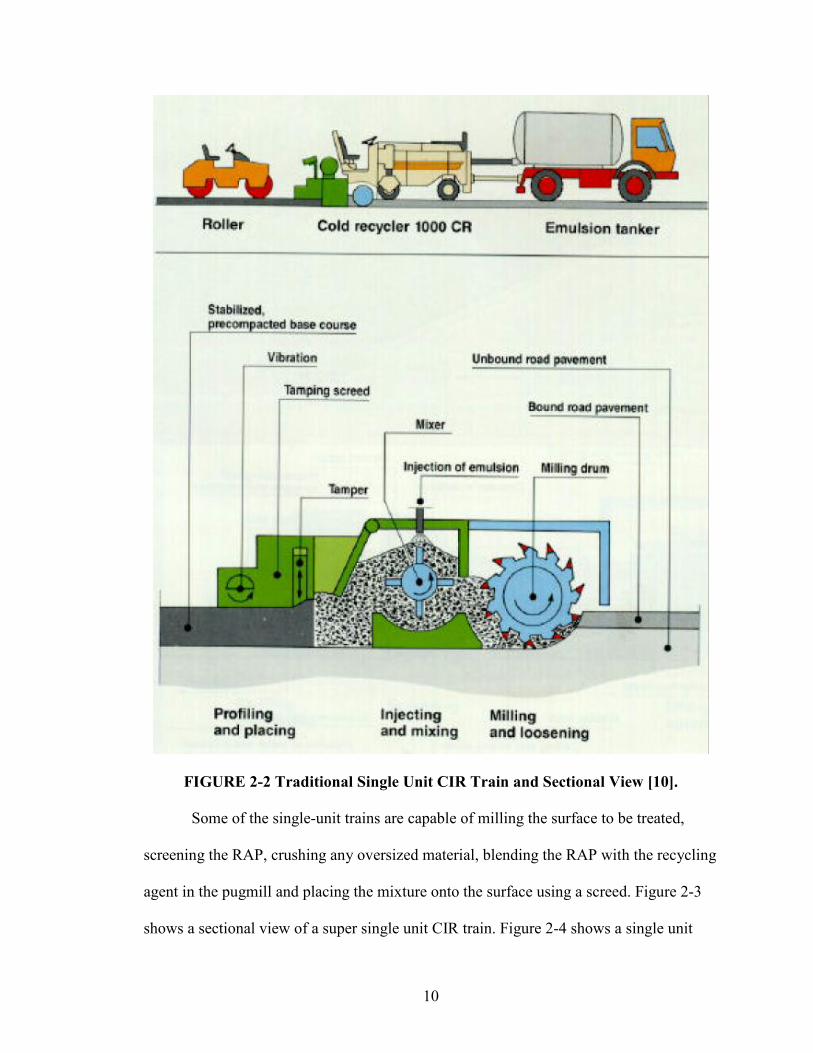
FIGURE 2-2 Traditional Single Unit CIR Train and Sectional View [10].
Some of the single-unit trains are capable of milling the surface to be treated,
screening the RAP, crushing any oversized material, blending the RAP with the recycling
agent in the pugmill and placing the mixture onto the surface using a screed. Figure 2-3
shows a sectional view of a super single unit CIR train. Figure 2-4 shows a single unit

11
CIR train depositing the recycled mixture in a windrow, which is being laid by a
conventional paver with a windrow pickup attachment.
FIGURE 2-3 Super Single Unit CIR Train [10].
FIGURE 2-4 A Single Unit CIR Train Deposits the CIR Mixture in a Windrow [10].
The advantages of the single-unit train are simplicity of operation and high
production capacity. The single-unit train may be preferred over a multi-unit train in
urban areas and on roads with short turning radius, due to its shorter length. The single-
12
unit CIR trains are less than 70 feet in length when compared to the multiple-unit CIR
trains which measure about 150 feet in length. [4].
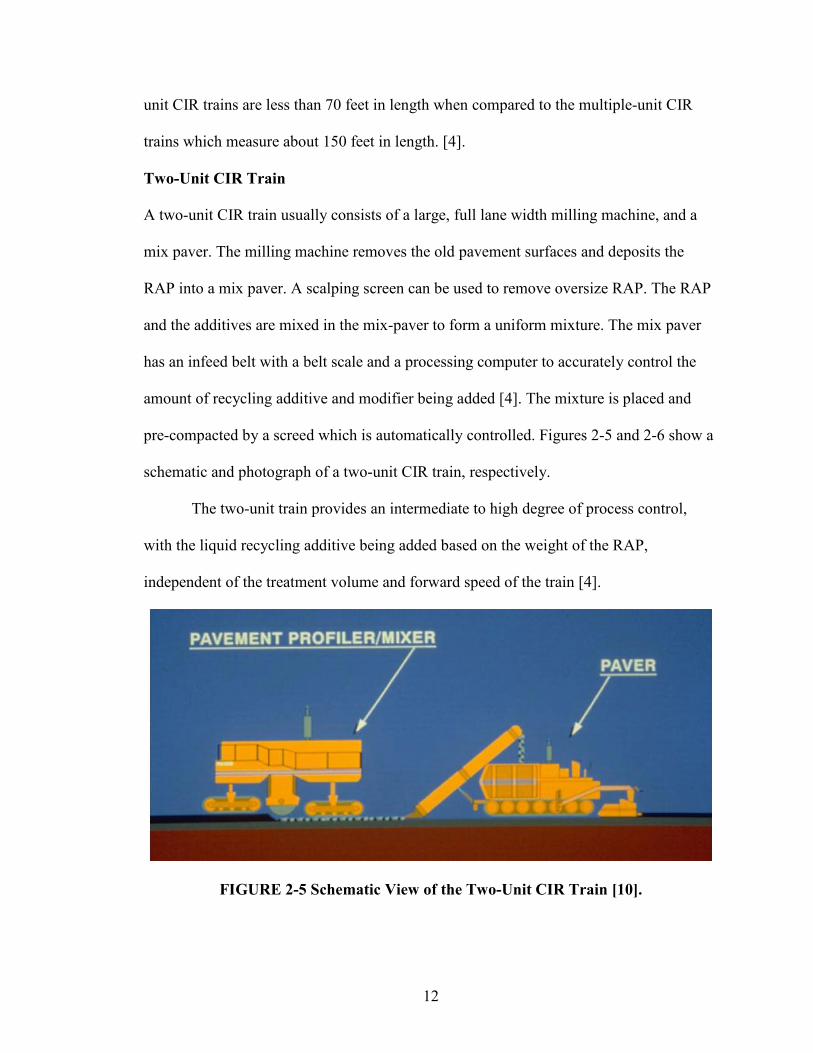
Two-Unit CIR Train
A two-unit CIR train usually consists of a large, full lane width milling machine, and a
mix paver. The milling machine removes the old pavement surfaces and deposits the
RAP into a mix paver. A scalping screen can be used to remove oversize RAP. The RAP
and the additives are mixed in the mix-paver to form a uniform mixture. The mix paver
has an infeed belt with a belt scale and a processing computer to accurately control the
amount of recycling additive and modifier being added [4]. The mixture is placed and
pre-compacted by a screed which is automatically controlled. Figures 2-5 and 2-6 show a
schematic and photograph of a two-unit CIR train, respectively.
The two-unit train provides an intermediate to high degree of process control,
with the liquid recycling additive being added based on the weight of the RAP,
independent of the treatment volume and forward speed of the train [4].
FIGURE 2-5 Schematic View of the Two-Unit CIR Train [10].

13
FIGURE 2-6 A Paver Mixer Two-Unit CIR Train.
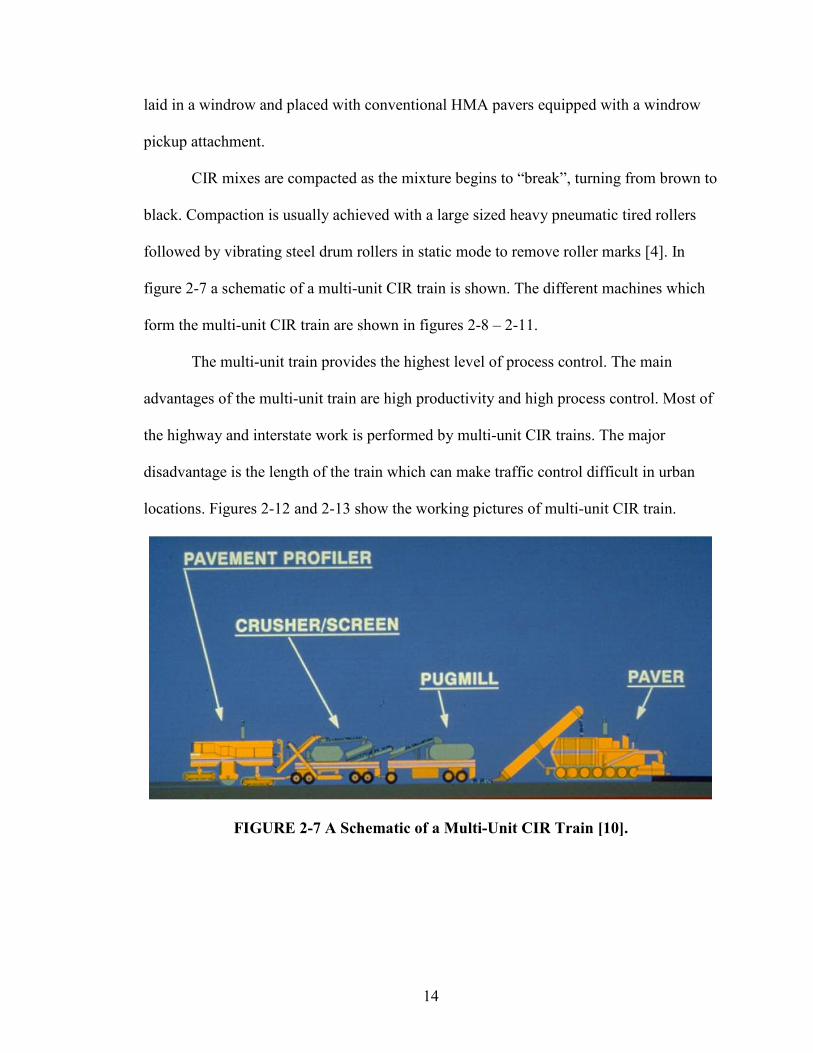
Multi-Unit CIR Trains
Multiple-unit CIR trains consists of a large milling machine which is capable of milling
the full lane width, a screening and crushing unit which is mounted on a separate trailer
unit, and a trailer mounted pugmill mixer. The milling machine removes the RAP and has
conveyer belts which move the millings to the crushing and screening unit.
The sizing and crushing of the oversized RAP is done in a separate
screening/crushing unit. The screening unit has a set of vibrating screens which are
stacked with larger sieve on the top. The crushed RAP from the milling machine is
passed through the set of screens. The oversized pieces of the RAP are retained and put
into a crushing machine for further crushing to the desired size.
The graded RAP is mixed with recycling additives in a separate pugmill unit.
RAP in the pugmill is mixed uniformly. The amount of additive is calculated by
computer, based on the mass of the RAP, and added to the pugmill. The mixture is then
14
laid in a windrow and placed with conventional HMA pavers equipped with a windrow
pickup attachment.
CIR mixes are compacted as the mixture begins to “break”, turning from brown to
black. Compaction is usually achieved with a large sized heavy pneumatic tired rollers
followed by vibrating steel drum rollers in static mode to remove roller marks [4]. In
figure 2-7 a schematic of a multi-unit CIR train is shown. The different machines which
form the multi-unit CIR train are shown in figures 2-8 – 2-11.
The multi-unit train provides the highest level of process control. The main
advantages of the multi-unit train are high productivity and high process control. Most of
the highway and interstate work is performed by multi-unit CIR trains. The major
disadvantage is the length of the train which can make traffic control difficult in urban
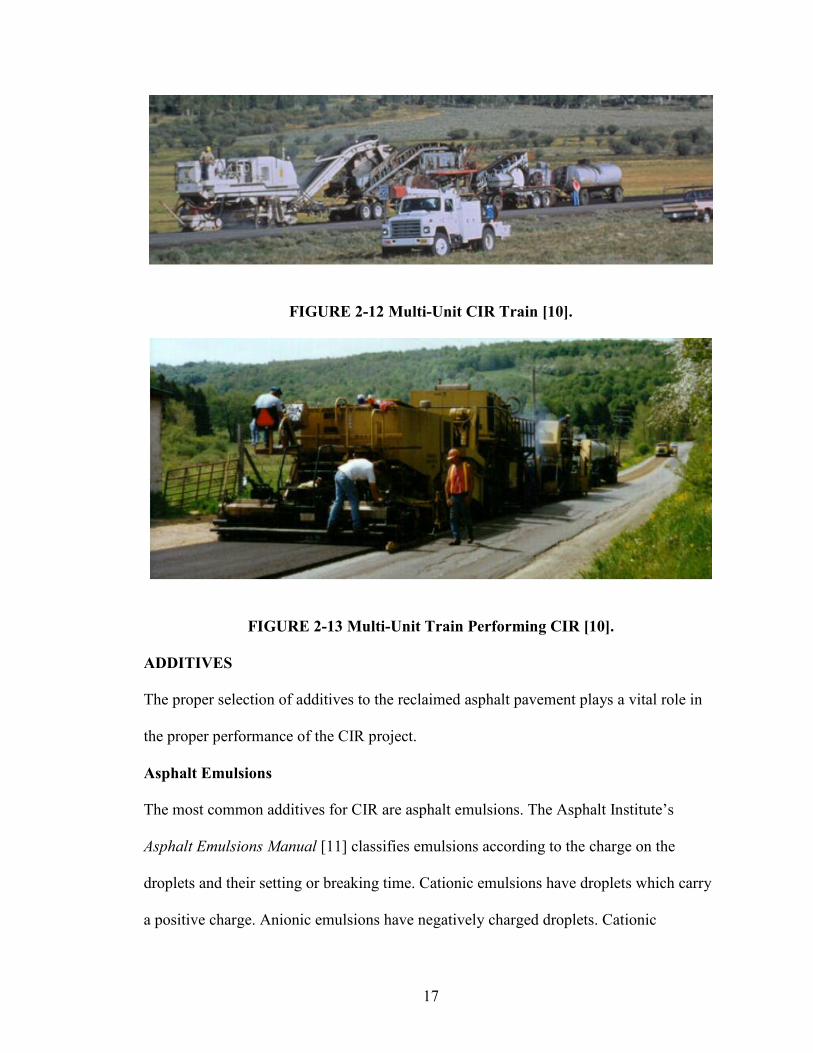
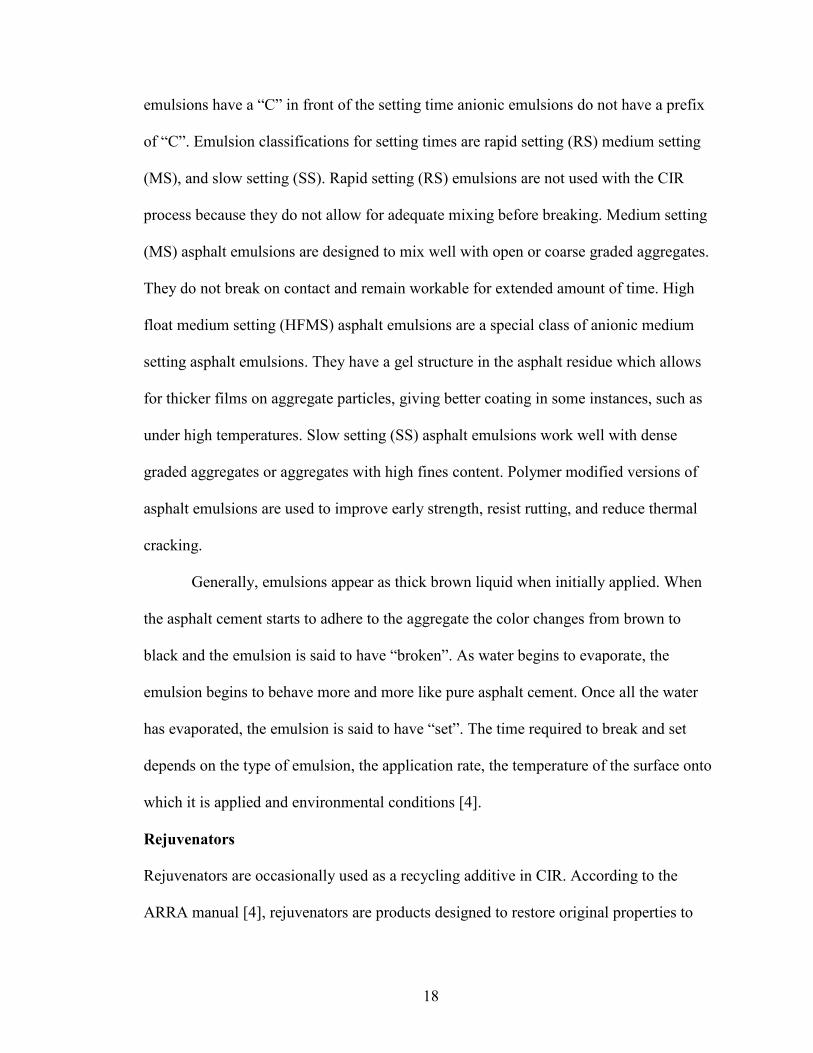
locations. Figures 2-12 and 2-13 show the working pictures of multi-unit CIR train.
FIGURE 2-7 A Schematic of a Multi-Unit CIR Train [10].
15
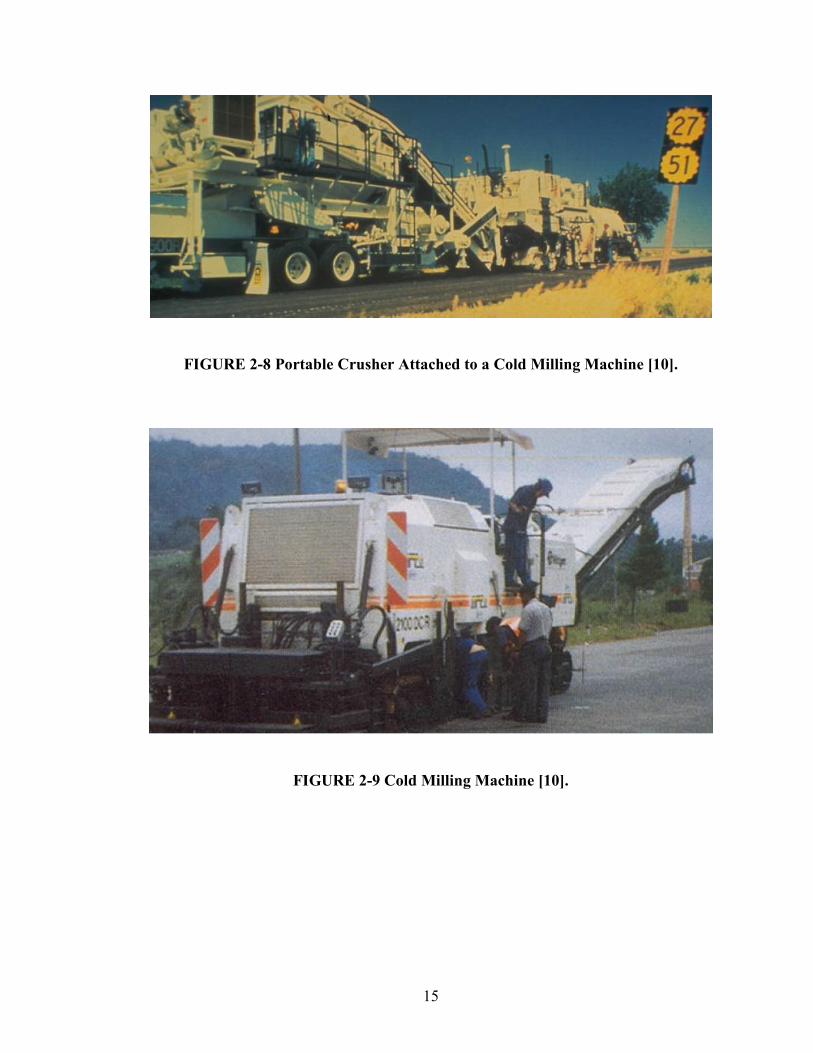
FIGURE 2-8 Portable Crusher Attached to a Cold Milling Machine [10].
FIGURE 2-9 Cold Milling Machine [10].

16
FIGURE 2-10 Travel Plant Mixer [10].
FIGURE 2-11 Laydown Machine.
17
FIGURE 2-12 Multi-Unit CIR Train [10].
FIGURE 2-13 Multi-Unit Train Performing CIR [10].
ADDITIVES
The proper selection of additives to the reclaimed asphalt pavement plays a vital role in
the proper performance of the CIR project.
Asphalt Emulsions
The most common additives for CIR are asphalt emulsions. The Asphalt Institute’s
Asphalt Emulsions Manual [11] classifies emulsions according to the charge on the
droplets and their setting or breaking time. Cationic emulsions have droplets which carry
a positive charge. Anionic emulsions have negatively charged droplets. Cationic
18
emulsions have a “C” in front of the setting time anionic emulsions do not have a prefix
of “C”. Emulsion classifications for setting times are rapid setting (RS) medium setting
(MS), and slow setting (SS). Rapid setting (RS) emulsions are not used with the CIR
process because they do not allow for adequate mixing before breaking. Medium setting
(MS) asphalt emulsions are designed to mix well with open or coarse graded aggregates.
They do not break on contact and remain workable for extended amount of time. High
float medium setting (HFMS) asphalt emulsions are a special class of anionic medium
setting asphalt emulsions. They have a gel structure in the asphalt residue which allows
for thicker films on aggregate particles, giving better coating in some instances, such as
under high temperatures. Slow setting (SS) asphalt emulsions work well with dense
graded aggregates or aggregates with high fines content. Polymer modified versions of
asphalt emulsions are used to improve early strength, resist rutting, and reduce thermal
cracking.
Generally, emulsions appear as thick brown liquid when initially applied. When
the asphalt cement starts to adhere to the aggregate the color changes from brown to
black and the emulsion is said to have “broken”. As water begins to evaporate, the
emulsion begins to behave more and more like pure asphalt cement. Once all the water
has evaporated, the emulsion is said to have “set”. The time required to break and set
depends on the type of emulsion, the application rate, the temperature of the surface onto
which it is applied and environmental conditions [4].
Rejuvenators
Rejuvenators are occasionally used as a recycling additive in CIR. According to the
ARRA manual [4], rejuvenators are products designed to restore original properties to

19
aged asphalt cement by restoring the original ratio of asphaltenes to maltenes. Many
rejuvenators are proprietary, making it difficult to offer a good generic description.
However, many rejuvenators contain maltenes because their quantity is reduced by
oxidation. Rejuvenators will retard the loss of surface fines and reduce the formation of
additional cracks, however they will also reduce pavement skid resistance for up to one
year. Because of this, they are appropriate for low volume, low speed roads or parking
lots [4].
Chemical Additives
Type C fly ash, lime and Portland cement, have been successfully utilized as a recycling
additive in CIR. These chemical additives can be used to improve early strength gain,
increase rutting resistance, and improve moisture resistance of CIR mixtures containing
rounded coarse aggregates and high percentage of natural sand. Typical hydrated lime
and Portland cement contents used have been 1 to 2 percent by weight of RAP. Fly ash
contents in the range of 8 to 12 percent have been reported. Type C fly ash is applied dry
by spreading in front of the recycling train. Portland cement and hydrated lime can be
added dry or as slurry.
Cutback Asphalts
Cutback asphalt cements have been successfully utilized in the past as a recycling agent
for CIR but are not currently recommended due to environmental and safety concerns.
The flash point of some cutbacks could be at or below the CIR application temperatures
[4].

20
MIX DESIGN Like HIR and FDR, there is no nationally accepted method for the design of cold
recycling mixtures, and most of the agencies which use cold recycling use their own
procedures [4]. Several agencies have developed a general design methods for CIR mixes
based on modifications to hot-mix asphalt methods. Such methods can serve as a starting
point for developing CIR mix design methods.
Mix Design Procedures
Recently, many mix design methods have emerged in an effort to improve the CIR
process as a viable method for pavement rehabilitation. A few of the more commonly
used methods are reviewed below.
AASHTO-AGC Task Force 38
They reviewed several Mix design procedures and recommended that the Marshall Mix
design method for HMA be adopted for CIR with minor modifications. Samples are
compacted at lower temperatures and Marshall stabilization is performed at a reduced
temperature. Optimum emulsion content is EAC that meets or exceeds minimum stability
required [7].
Modified Marshall and Oregon State Mix Design Methods
A cold in-placed recycled asphalt mix design approach has been adopted based on a cold
Marshall and Oregon State methods, including the important role of water, on a
laboratory scale. A key preliminary step in the mix design is obtaining representative
RAP samples of each section and determining the properties of these samples (moisture
21
content, asphalt cement content, gradation and Abson recovery asphalt cement
penetration and viscosity) [4, 7].
Modified SuperPave Mix Design Methods
A pilot volumetric mix design using the Superpave Gyratory Compactor (SGC) was
performed by Lee [12] using Kansas and Ontario RAPs. The method is based on the
AASHTO-AGC-ARTBA Task Force #38 modified Marshall Mix design method [7]
with some adjustments. The optimum emulsion content (OEC) can be obtained using
this method. The report indicated that SuperPave procedure could be used for CIR if
changes in compaction temperature were made.
Two additional studies were performed to determine compaction effort for CIR
mix designs using the SGC. The first was mix design guidelines for a CIR project in the
Regional Municipality of Ottawa-Carleton (RMOC) of Ontario were developed [13]. The
SuperPave Gyratory Compactor (SGC) was used in that study to produce field
representative specimens. Cores were obtained and evaluated to project field conditions
and adjust the number of Gyrations. The Ndesign or Nmax for the RMOC study was then
determined [13].
In another study [13], the mix design compactive effort (Ndesign) that is needed to
match the field density of CIR mixtures using the SGC was determined. The study
included RAP from seven CIR projects along with the emulsified asphalt cement for each
project. The laboratory testing protocol included testing the RAP and aggregate
properties, compaction of samples, permanent deformation, and indirect tensile strength.
Moreover, the Ndesign was determined to be between 30 and 35 gyrations.
22
SemMaterials Reflex CIR Design Method
Reflex is a new mix design protocol that includes a new emulsion formulated for cold
recycling, an engineered design procedure and four performance tests for raveling,
rutting resistance (strength), thermal cracking resistance, and moisture susceptibility
(stripping) [15].
The Reflex system uses the Marshall Stability test for rut resistance; a retained
stability test for moisture (or stripping) resistance, a raveling test, and an indirect tensile
test for low-temperature cracking. Three different RAP gradations: coarse, medium, and
fine are used in the design procedure and optimum asphalt emulsion content is
determined by establishing the asphalt emulsion content that passes the four
performance tests. The procedure also has a method to adjust asphalt emulsion contents
in the field based on changes in the RAP gradation. This mix design procedure, or slight
variations, has become the standard for CIR mix design [15].
WHY RECYCLING? [7, 9]
• CIR is not only an effective rehabilitation strategy to mitigate reflective cracking,
but also adds structural value to the recycled pavement;
• CIR primarily uses existing asphalt-bound materials and typically recycles 2 to 4
inches in depth. Higher-quality, more uniform paving mixtures are usually
produced from the CIR process;
• Cracked pavements with structurally sound, well drained bases and subgrades can
be rectified;
• Distress rectified by CIR are:
- raveling

23
- pot holes
- bleeding
- skid resistance
- rutting
- corrugation
- shoving
- fatigue, edge and block cracking
- slippage, longitudinal and transverse cracking
- poor ride quality caused by swells, bumps, sags and depressions
• CIR can restore old pavements to the desired profile, rejuvenate aged pavements,
correct poor aggregate gradations, eliminate existing wheel ruts, restore the crown
and cross slope, and fix irregularities and rough areas;
• CIR can retain overhead clearances, vertical and horizontal geometry, and without
reconstructing shoulders;
• CIR is fast, CIR crew’s average about two lane miles per day;
• CIR is non-intrusive, recycling trains use the same space as other full lane paving
operations, and so most roads can be kept open to traffic during the curing period
without having to wait for final wearing course application;
• CIR lasts longer, states and provinces that use CIR are reporting service lives of
15 years or more for CIR base;
• CIR- high production rate and potential of cost savings;
• CIR- minimum traffic disruption;
• CIR- reduction of environmental problems;

24
• CIR- growing concern for depleting petroleum reserves;
• CIR- recycled pavement can be recycled.
Limitations of CIR [7, 9]
• CIR, being porous in nature, requires a seal coat or HMA overlay;
• CIR is susceptible to rutting caused by high asphalt content;
• CIR is susceptible to failure caused by wet, unstable base, subbase or subgrade;
• CIR is susceptible to failure caused by heaving or swelling occurring in
underlying soils;
• Pavements that exhibit stripping of asphalt from aggregates are not good CIR
candidates;
• The minimum asphalt pavement thickness to be removed should be 2 inches;
• Addition of new aggregate to RAP to obtain the minimum treatment depth should
not exceed 25 percent by weight of the RAP. Otherwise, a significant increase in
the emulsion content thus higher associated cost will occur;
• Weather Limitations - CIR cannot be applied if there is a possibility of the
temperature falling below freezing within 24 hours;
• Site conditions that limit the effectiveness of CIR are;
- the presence of several manholes or drainage inlets within the pavement
area;
- long steep grades or those exceeding 5 percent and 2500 feet in length will
reduce production and may require extended traffic control;
- extensive heavily shaded areas where little or no sunlight reaches then the
section will require longer curing time.

25
MECHANISTIC-EMPIRICAL PAVEMENT DESIGN GUIDE (M-EPDG)
Need for the Design Guide
The various editions of the AASHTO Guide for Design of Pavement Structures have
served well for several decades; nevertheless, many serious limitations exist for their
continued use as the nation’s primary pavement design procedures. Listed below are
some of the major deficiencies of the existing design guide [1]:
- Traffic loading deficiencies
- Rehabilitation deficiencies.
- Climatic effects deficiencies
- Subgrade deficiencies
- Surface materials deficiencies
- Base course deficiencies
- Truck characterization deficiencies
- Construction and drainage deficiencies
- Design life deficiencies
- Performance deficiencies
- Reliability deficiencies
M-EPDG
The guide for the Mechanistic-Empirical Design of New and Rehabilitated pavement
Structures (referred to hereinafter as M-EPDG) was developed to provide the highway
community with the a state-of-the-practice tool for design of new and rehabilitated
pavement structures. The M-EPDG is a result of a large study sponsored by the
AASHTO in cooperation with the Federal Highway Administration and was conducted

26
through the National Cooperative Highway Research Program (NCHRP) [NCHRP-1-
37A]. The final product is design software and a user guide. The M-EPDG is based on a
comprehensive pavement design procedures that uses existing mechanistic-empirical
technologies. M-EPDG software is temporarily available on the web for trial use which
can be downloaded from www.trb.org/mepdg. It is a user oriented computational
software package and contains documentation based on the Design Guide procedure. The
Guide employs common design parameters for traffic, subgrade, environment, and
reliability for all pavement types [1].
27
CHAPTER 3
MATERIALS AND TESTING PLAN
INTRODUCTION The objective of the study was to determine the dynamic modulus of CIR mixes and
compare the laboratory values with the default values in the M-EPDG. In this project one
RAP and three emulsions were used. In this project one RAP was mixed with three
emulsions and the dynamic modulus obtained. The dynamic modulus values were
compared based on emulsion type to determine if emulsion had a significant effect on
dynamic modulus. The values were also compared to the default values calculated from
mix parameters by the M-EPDG. Finally, the effect of the emulsion type on pavement
performance was evaluated using the M-EPDG.
MATERIALS
RAP
RAP was obtained from a CIR project on US-412 in the Beaver County, OK. The
pavement was being rehabilitated to correct transverse cracking. During the construction
of the CIR on the western portion of US-412, samples of RAP were obtained prior to the
addition of any recycling agent.
Asphalt Emulsion
Three asphalt emulsions were used in the research project, the asphalt emulsion from the
US 412 project and two other asphalt emulsions. The emulsion from the job site was a
28
specially formulated CSS-1 emulsion (Reflex) supplied by SemMaterials. The other two
emulsions were a cationic slow set (CSS-1h); CSS-1h with lime, which is often used with
CSS-1 h and a polymer, modified high float emulsion (HFE-150P). The emulsions were
provided by Vance Brothers and the New Mexico Department of Transportation
(NMDOT), respectively.
Lime
Pebble quicklime was obtained from Brown and Brown Contractors Inc. The quicklime
was added to the mixtures in the form of slaked lime slurry. Lime is added to the CIR to
give initial stiffness and prevent the structure from moisture damage. In practice, lime is
routinely used with CSS-1h emulsions.
TEST PLAN
RAP Properties
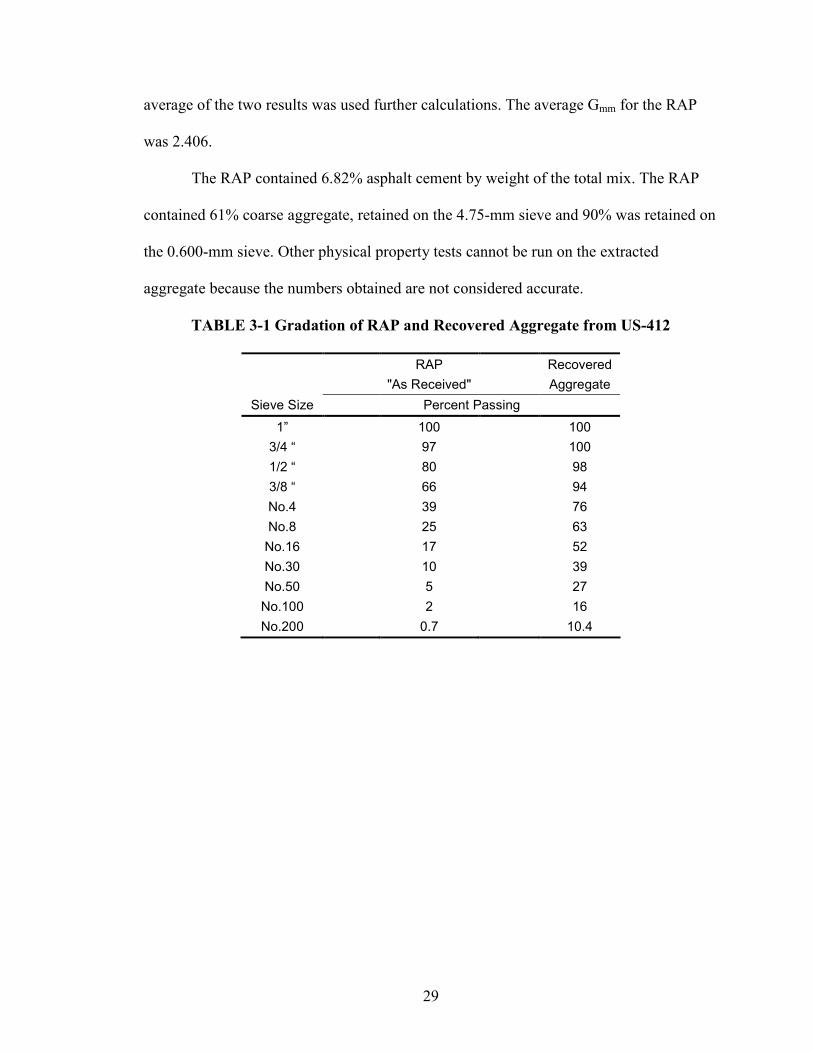
The as received gradation of the RAP was determined in accordance with AASHTO T
27. Two, 2000 gram RAP samples, batched to the as received gradation, were tested to
obtain the asphalt content using an extraction furnace in accordance with ODOT Test
Method OHD L – 26. The recovered aggregate was tested for gradation in accordance
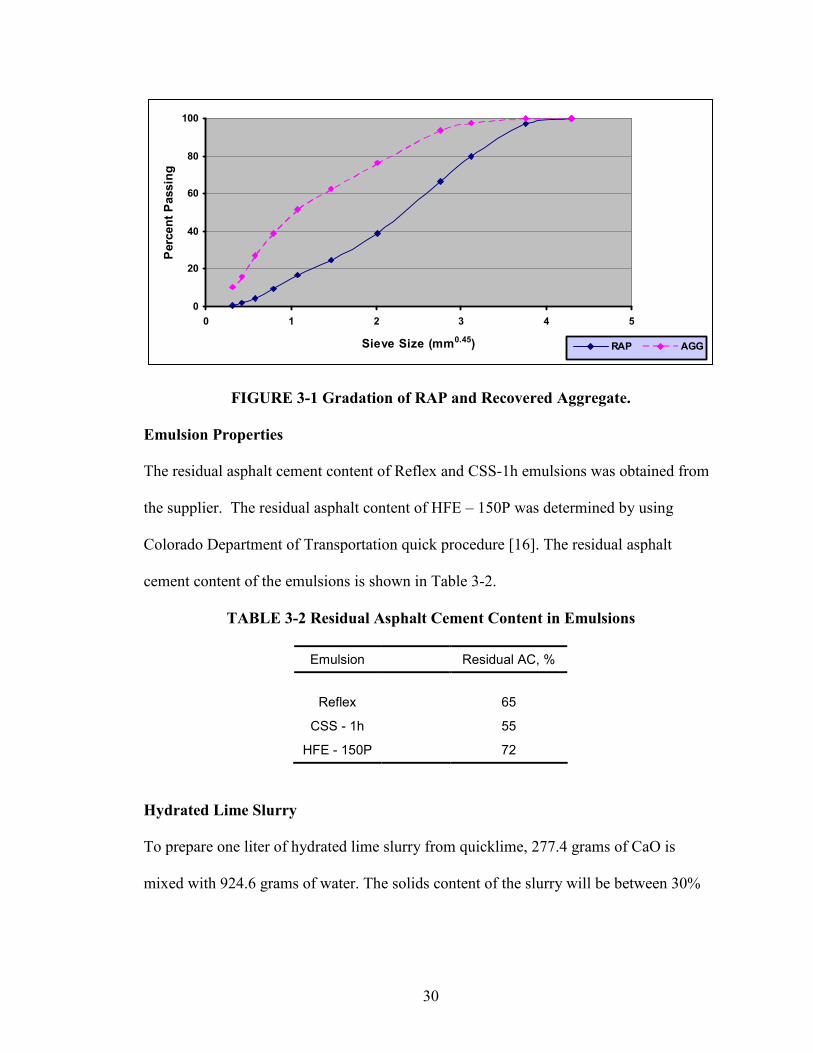
with AASHTO T 30. The results are shown in Table 3-1 and presented graphically in
Figure 3-1.
RAP was batched to the as received gradation to obtain two samples of 2000
grams each. The 2000 gram samples were mixed with reflex emulsion to the emulsion
content reported on the US 412 project. The mixed samples were cured and tested for
theoretical maximum specific gravity (Gmm) in accordance with AASHTO T 209. The
29
average of the two results was used further calculations. The average Gmm for the RAP
was 2.406.
The RAP contained 6.82% asphalt cement by weight of the total mix. The RAP
contained 61% coarse aggregate, retained on the 4.75-mm sieve and 90% was retained on
the 0.600-mm sieve. Other physical property tests cannot be run on the extracted
aggregate because the numbers obtained are not considered accurate.
TABLE 3-1 Gradation of RAP and Recovered Aggregate from US-412
RAP Recovered "As Received" Aggregate
Sieve Size Percent Passing
1” 100 100 3/4 “ 97 100 1/2 “ 80 98 3/8 “ 66 94 No.4 39 76 No.8 25 63 No.16 17 52 No.30 10 39 No.50 5 27 No.100 2 16 No.200 0.7 10.4
30
0
20
40
60
80
100
0 1 2 3 4 5
Sieve Size (mm0.45)
Per
cent
Pass
ing
RAP AGG
FIGURE 3-1 Gradation of RAP and Recovered Aggregate.
Emulsion Properties
The residual asphalt cement content of Reflex and CSS-1h emulsions was obtained from
the supplier. The residual asphalt content of HFE – 150P was determined by using
Colorado Department of Transportation quick procedure [16]. The residual asphalt
cement content of the emulsions is shown in Table 3-2.
TABLE 3-2 Residual Asphalt Cement Content in Emulsions
Emulsion Residual AC, %
Reflex 65
CSS - 1h 55
HFE - 150P 72
Hydrated Lime Slurry
To prepare one liter of hydrated lime slurry from quicklime, 277.4 grams of CaO is
mixed with 924.6 grams of water. The solids content of the slurry will be between 30%
31
and 35% depending on the amount of water lost to evaporation during the slaking
process.
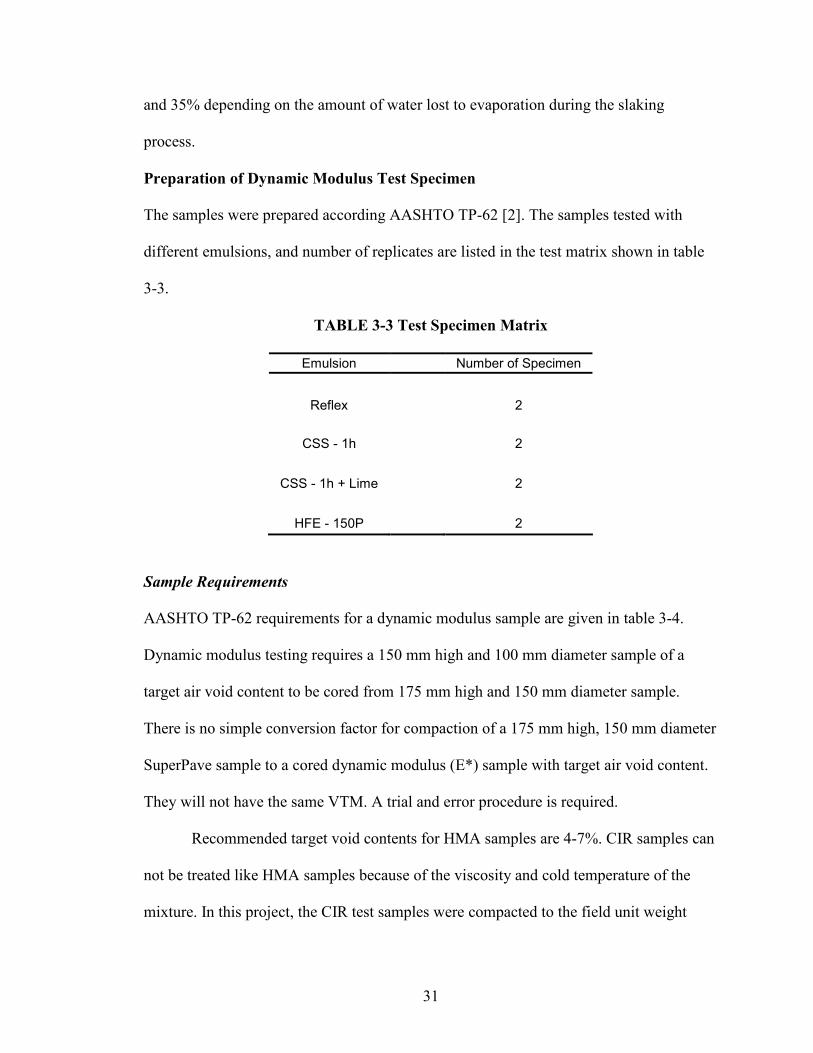
Preparation of Dynamic Modulus Test Specimen The samples were prepared according AASHTO TP-62 [2]. The samples tested with
different emulsions, and number of replicates are listed in the test matrix shown in table
3-3.
TABLE 3-3 Test Specimen Matrix
Emulsion Number of Specimen
Reflex 2
CSS - 1h 2
CSS - 1h + Lime 2
HFE - 150P 2
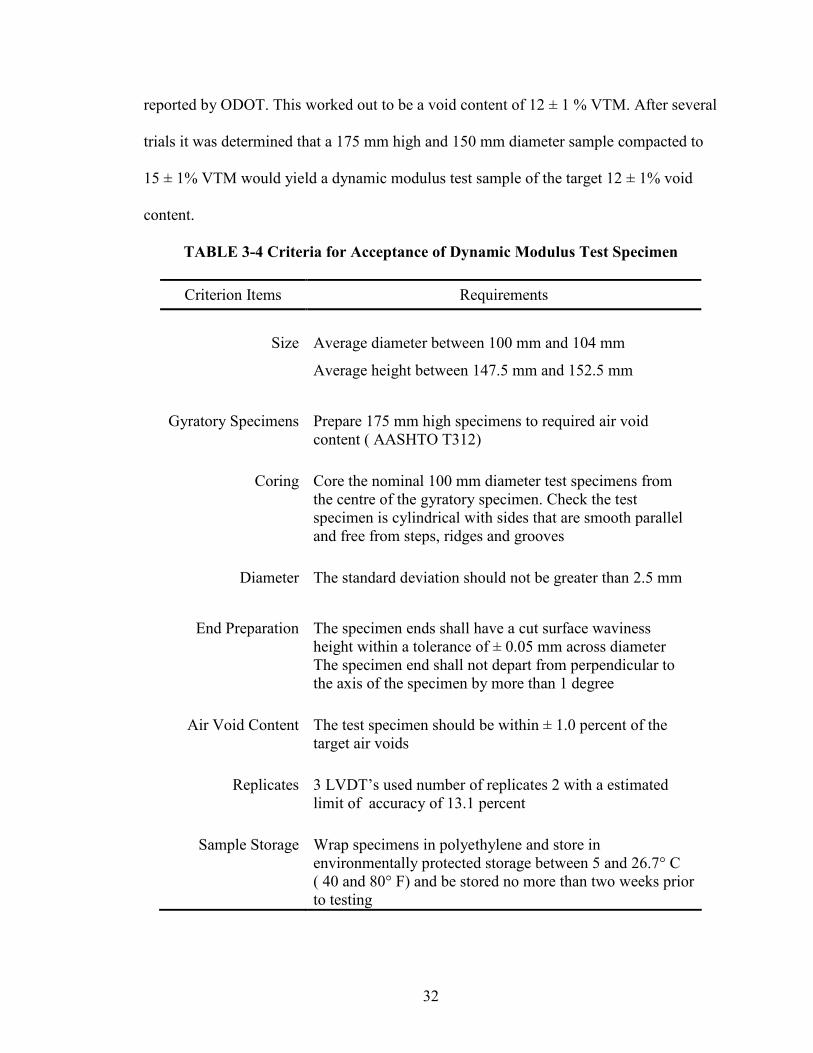
Sample Requirements
AASHTO TP-62 requirements for a dynamic modulus sample are given in table 3-4.
Dynamic modulus testing requires a 150 mm high and 100 mm diameter sample of a
target air void content to be cored from 175 mm high and 150 mm diameter sample.
There is no simple conversion factor for compaction of a 175 mm high, 150 mm diameter
SuperPave sample to a cored dynamic modulus (E*) sample with target air void content.
They will not have the same VTM. A trial and error procedure is required.
Recommended target void contents for HMA samples are 4-7%. CIR samples can
not be treated like HMA samples because of the viscosity and cold temperature of the
mixture. In this project, the CIR test samples were compacted to the field unit weight
32
reported by ODOT. This worked out to be a void content of 12 ± 1 % VTM. After several
trials it was determined that a 175 mm high and 150 mm diameter sample compacted to
15 ± 1% VTM would yield a dynamic modulus test sample of the target 12 ± 1% void
content.
TABLE 3-4 Criteria for Acceptance of Dynamic Modulus Test Specimen
Criterion Items Requirements
Size Average diameter between 100 mm and 104 mm
Average height between 147.5 mm and 152.5 mm
Gyratory Specimens Prepare 175 mm high specimens to required air void content ( AASHTO T312)
Coring Core the nominal 100 mm diameter test specimens from the centre of the gyratory specimen. Check the test specimen is cylindrical with sides that are smooth parallel and free from steps, ridges and grooves
Diameter The standard deviation should not be greater than 2.5 mm
End Preparation The specimen ends shall have a cut surface waviness height within a tolerance of ± 0.05 mm across diameter The specimen end shall not depart from perpendicular to the axis of the specimen by more than 1 degree
Air Void Content The test specimen should be within ± 1.0 percent of the target air voids
Replicates 3 LVDT’s used number of replicates 2 with a estimated limit of accuracy of 13.1 percent
Sample Storage Wrap specimens in polyethylene and store in environmentally protected storage between 5 and 26.7° C ( 40 and 80° F) and be stored no more than two weeks prior to testing
33
Batching
A 6112.9 gram batch of RAP, batched to the as received gradation was used to prepare a
175 mm high and 150 mm in diameter test specimen. When the compacted sample was
cored to 100 mm diameter and sawed to sample height of 150 mm, the required target
void content was obtained.
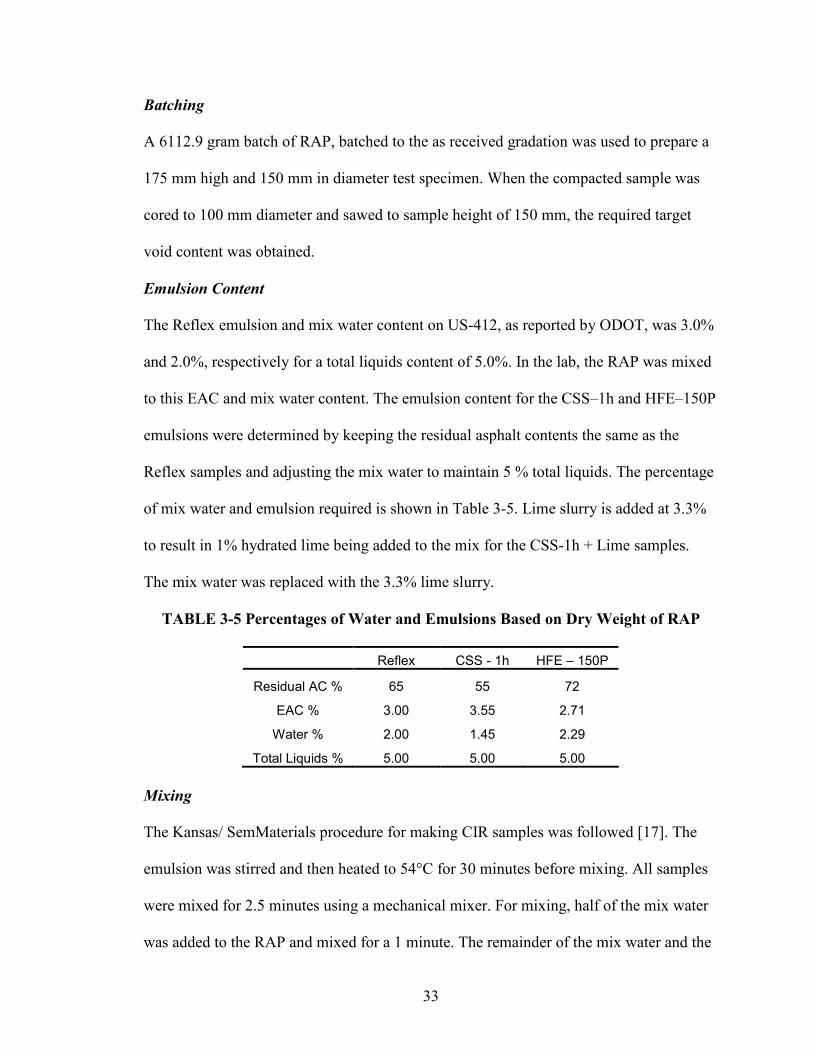
Emulsion Content
The Reflex emulsion and mix water content on US-412, as reported by ODOT, was 3.0%
and 2.0%, respectively for a total liquids content of 5.0%. In the lab, the RAP was mixed
to this EAC and mix water content. The emulsion content for the CSS–1h and HFE–150P
emulsions were determined by keeping the residual asphalt contents the same as the
Reflex samples and adjusting the mix water to maintain 5 % total liquids. The percentage
of mix water and emulsion required is shown in Table 3-5. Lime slurry is added at 3.3%
to result in 1% hydrated lime being added to the mix for the CSS-1h + Lime samples.
The mix water was replaced with the 3.3% lime slurry.
TABLE 3-5 Percentages of Water and Emulsions Based on Dry Weight of RAP
Reflex CSS - 1h HFE – 150P
Residual AC % 65 55 72
EAC % 3.00 3.55 2.71
Water % 2.00 1.45 2.29
Total Liquids % 5.00 5.00 5.00
Mixing
The Kansas/ SemMaterials procedure for making CIR samples was followed [17]. The
emulsion was stirred and then heated to 54°C for 30 minutes before mixing. All samples
were mixed for 2.5 minutes using a mechanical mixer. For mixing, half of the mix water
was added to the RAP and mixed for a 1 minute. The remainder of the mix water and the
34
asphalt emulsion was then added and the sample mixed for additional 1.5 minutes. Lime
samples were mixed in the same manner except that all of the lime slurry was added and
mixed for 1 minute then the EAC was added and mixed for 1.5 minute.
Compaction
The samples were compacted in a 150 mm diameter mold to a height of 175 mm using a
Pine gyratory compactor. 6112.9 grams of RAP were required to obtain a sample which
was 175 mm high and 150 mm in diameter with a void content of 15 ± 1 %. The
compacted samples were then cored and sawed to 150 mm high and 100 mm in diameter
which resulted in the target void content of 12 ±1%. The required amount of RAP was
more than would fit into the compaction mold. Therefore, it was necessary to lightly tamp
down the material with a tapping rod to get the mixture into the mold. Thirty to forty
gyrations were typically required to reach a height of 175 mm.
Curing
The samples were extruded immediately after compaction, labeled and placed in a pan.
The samples were placed in an oven at 60°C for a minimum of 48 hours. After 1 to 2
hours of curing, the paper discs on the top and bottom of the sample were removed. After
48 hours, the samples were checked every 2 hours until the mass loss was less than
0.05%, up to a maximum of 72 hours of oven curing [17].
Coring & Sawing
After curing, the samples were allowed to cool to room temperature. Next the compacted
samples were cored and sawed to obtain a test specimen of 150 mm tall and 100 mm in
diameter with 12 ± 1 % voids. The samples were cored using a coring machine to obtain
a diameter of 100 mm, as shown in Figure 3-2. The cored samples were sawed to obtain a

35
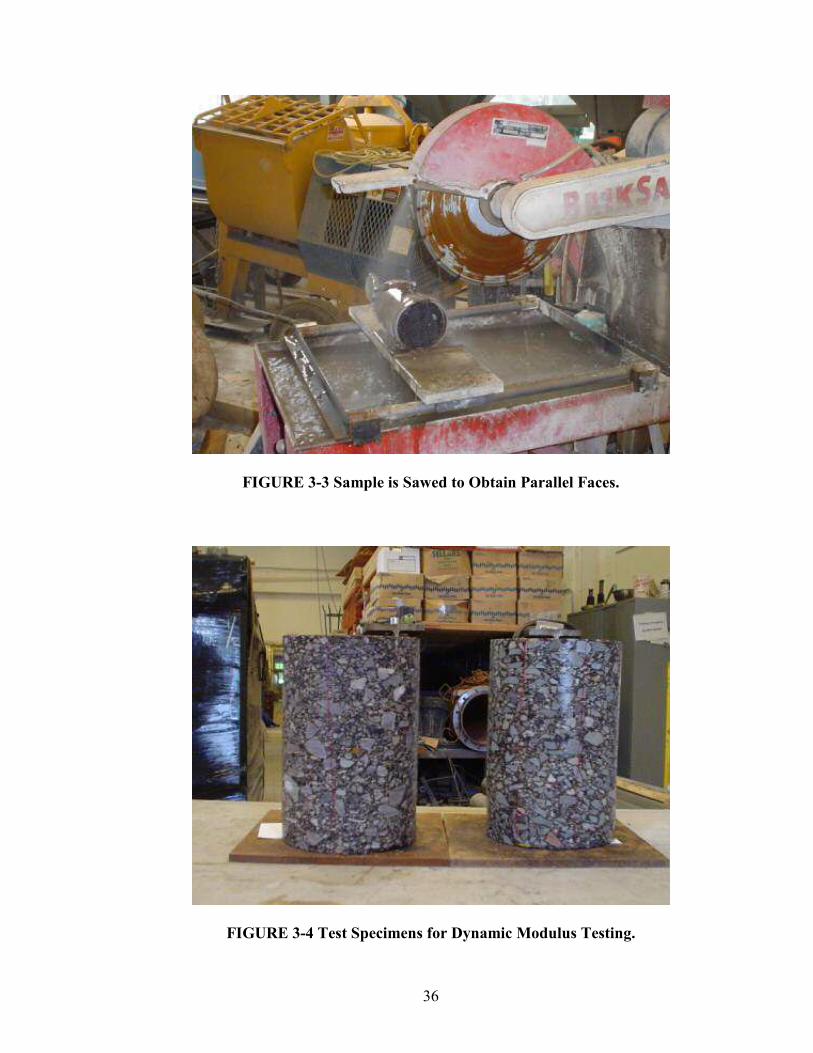
height of 150 mm, as shown in Figure 3-3. The cored and sawed samples were washed to
eliminate all loose debris. After cleaning, the samples were tested to get the submerged
and surface saturated mass according to AASHTO T 166. The dry mass was determined
by placing the samples at room temperature under a fan over night and allowed to dry to
constant mass and the void content was determined.
The dried samples were then checked to the sample requirements of AASHTO TP
62. The criterion for acceptance of the samples is listed in the Table 3-4. Samples which
met all criteria were fixed with six steel studs to hold three LVDT’s. The LVDT’s had a
gauge length of 4 inches. Care was taken to precisely position the studs at 4 inches apart
from each other and 2 inches from the centre of the sample. Once the epoxy was dry and
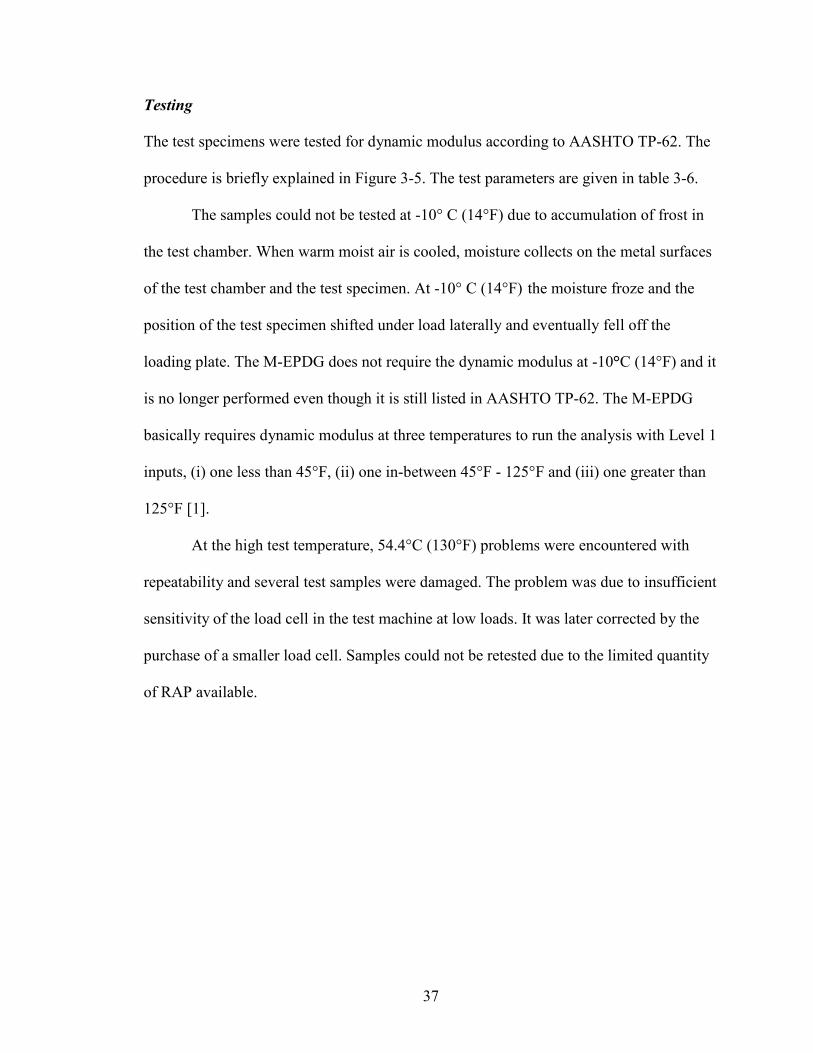
the studs were firmly attached to the sample, they were ready for testing. Figure 3-4
shows a sample prepared for dynamic modulus testing.
FIGURE 3-2 Sample Being Cored to Required Test Diameter.
36
FIGURE 3-3 Sample is Sawed to Obtain Parallel Faces.
FIGURE 3-4 Test Specimens for Dynamic Modulus Testing.
37
Testing
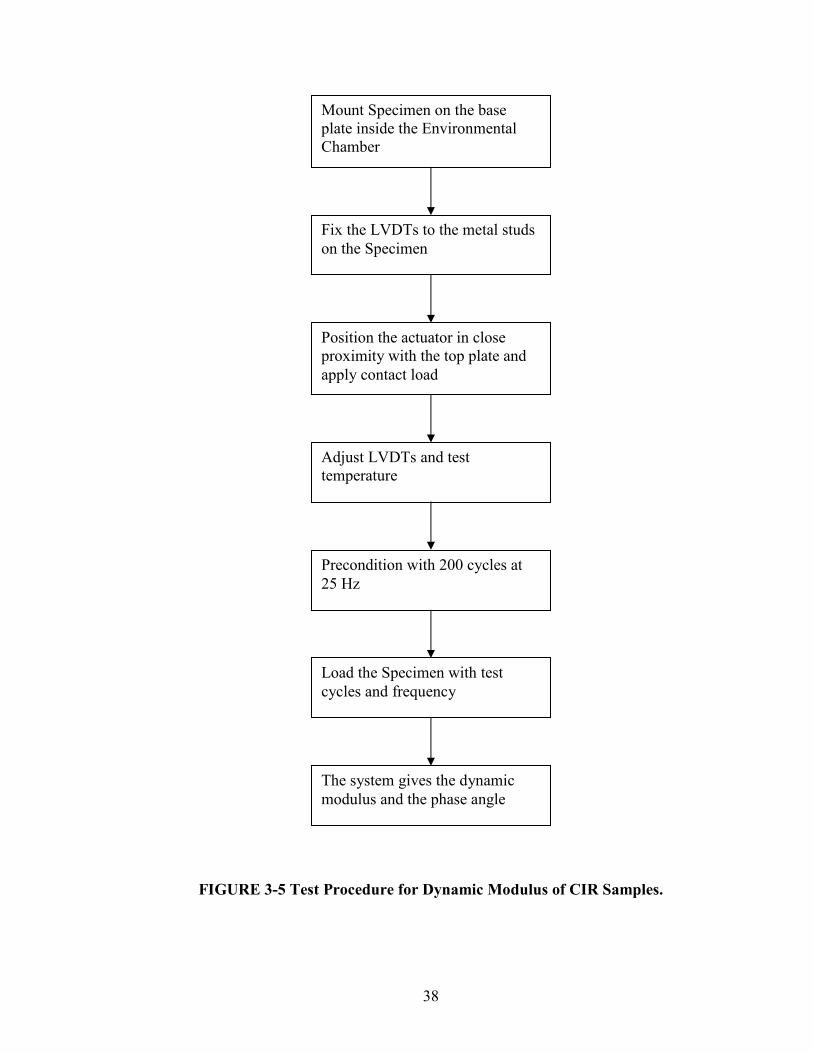
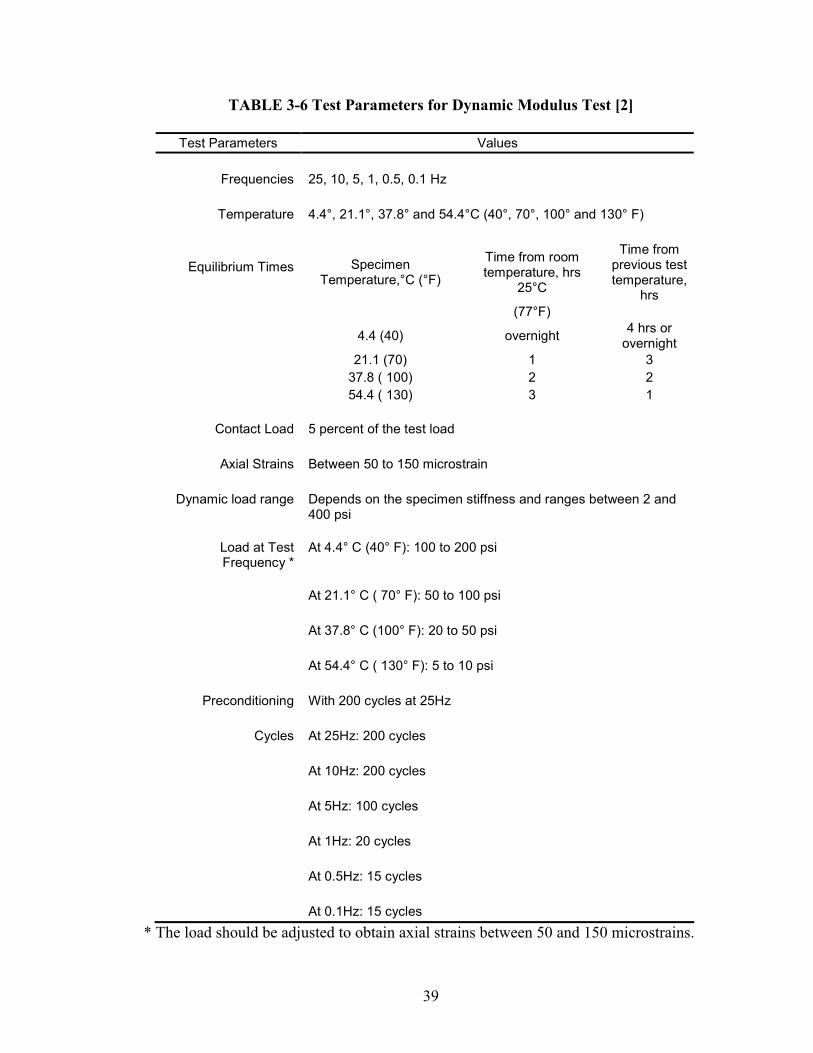
The test specimens were tested for dynamic modulus according to AASHTO TP-62. The
procedure is briefly explained in Figure 3-5. The test parameters are given in table 3-6.
The samples could not be tested at -10° C (14°F) due to accumulation of frost in
the test chamber. When warm moist air is cooled, moisture collects on the metal surfaces
of the test chamber and the test specimen. At -10° C (14°F) the moisture froze and the
position of the test specimen shifted under load laterally and eventually fell off the
loading plate. The M-EPDG does not require the dynamic modulus at -10°C (14°F) and it
is no longer performed even though it is still listed in AASHTO TP-62. The M-EPDG
basically requires dynamic modulus at three temperatures to run the analysis with Level 1
inputs, (i) one less than 45°F, (ii) one in-between 45°F - 125°F and (iii) one greater than
125°F [1].
At the high test temperature, 54.4°C (130°F) problems were encountered with
repeatability and several test samples were damaged. The problem was due to insufficient
sensitivity of the load cell in the test machine at low loads. It was later corrected by the
purchase of a smaller load cell. Samples could not be retested due to the limited quantity
of RAP available.
38
FIGURE 3-5 Test Procedure for Dynamic Modulus of CIR Samples.
Mount Specimen on the base plate inside the Environmental Chamber
Fix the LVDTs to the metal studs on the Specimen
Position the actuator in close proximity with the top plate and apply contact load
Adjust LVDTs and test temperature
Precondition with 200 cycles at 25 Hz
Load the Specimen with test cycles and frequency
The system gives the dynamic modulus and the phase angle
39
TABLE 3-6 Test Parameters for Dynamic Modulus Test [2]
Test Parameters Values
Frequencies 25, 10, 5, 1, 0.5, 0.1 Hz
Temperature 4.4°, 21.1°, 37.8° and 54.4°C (40°, 70°, 100° and 130° F)
Equilibrium Times Specimen Temperature,°C (°F)
Time from room temperature, hrs
25°C
Time from previous test temperature,
hrs (77°F)
4.4 (40) overnight 4 hrs or overnight
21.1 (70) 1 3 37.8 ( 100) 2 2 54.4 ( 130) 3 1
Contact Load 5 percent of the test load
Axial Strains Between 50 to 150 microstrain
Dynamic load range Depends on the specimen stiffness and ranges between 2 and 400 psi
Load at Test Frequency *
At 4.4° C (40° F): 100 to 200 psi
At 21.1° C ( 70° F): 50 to 100 psi
At 37.8° C (100° F): 20 to 50 psi
At 54.4° C ( 130° F): 5 to 10 psi
Preconditioning With 200 cycles at 25Hz
Cycles At 25Hz: 200 cycles
At 10Hz: 200 cycles
At 5Hz: 100 cycles
At 1Hz: 20 cycles
At 0.5Hz: 15 cycles
At 0.1Hz: 15 cycles * The load should be adjusted to obtain axial strains between 50 and 150 microstrains.
40
CHAPTER 4
TEST RESULTS
DYNAMIC MODULUS TESTING RESULTS
The main objective of this project was to obtain typical dynamic modulus values for CIR
mixture for use in the M-EPDG. RAP and emulsion were obtained from a CIR project on
the western portion of US 412, Beaver Co. OK. Two additional emulsions and quick lime
were obtained. Test samples were prepared using the RAP from US-412 and four
different combinations of the emulsions and lime. Table 4-1 shows the combinations and
the number of replicates prepared for testing. The test samples were prepared and tested
in accordance with AASHTO TP-62. The dynamic modulus of each sample was obtained
and the effect of emulsion on dynamic modulus evaluated. The measured dynamic
modulus values were compared to the default values in M-EPDG. Finally, the effect of
different emulsions on pavement thickness was evaluated using the M-EPDG. Results
from the dynamic modulus testing are provided in Tables 4-2 to 4-5.
As mentioned in chapter 3 the samples were not tested at -10°C (14°F) due to the
heavy accumulation of frost in the test chamber. The M-EPDG does not require the
dynamic modulus at this temperature. For samples at the high test temperature, 54.4°C
(130°F), problems were encountered with repeatability due to the sensitivity of the load
cell and several test samples were damaged. A new load cell was purchased to correct the
problem. However, only the samples prepared using HFE-150P emulsion were tested
with the new load cell.
41
TABLE 4-1 Matrix of Samples Tested
Emulsion Number of Specimen
Reflex 2
CSS - 1h 2
CSS - 1h + Lime 2
HFE - 150P 2
TABLE 4-2 Dynamic Modulus for Samples Prepared with Reflex Emulsion
Dynamic Modulus (psi) Temperature(°C)
Frequency(Hz) Sample 1 Sample 2 Average 25 863,500 907,981 885,741
10 793,072 868,540 830,806
4.4 5 719,848 790,864 755,356
1 549,311 611,389 580,350
0.5 494,693 550,399 522,546
0.1 378,596 418,034 398,315
25 468,193 467,638 467,915
10 404,601 392,505 398,553
21.1 5 335,638 327,665 331,651
1 222,871 212,830 217,850
0.5 187,392 177,024 182,208
0.1 129,229 124,899 127,064
25 209,876 240,229 225,052
10 147,115 148,995 148,055
37.8 5 116,352 111,739 114,046
1 70,777 78,173 74,475
0.5 45,131 59,926 52,528
42
TABLE 4-3 Dynamic Modulus for Samples Prepared with CSS – 1h
Dynamic Modulus (psi) Temperature(°C)
Frequency(Hz) Sample 1 Sample 2 Average 25 957,585 1,065,514 1,011,549
10 877,498 1,023,436 950,467
4.4 5 801,942 917,607 859,774
1 627,014 715,094 671,054
0.5 563,247 641,563 602,405
0.1 436,626 494,033 465,329
25 547,109 766,988 657,049
10 458,460 611,676 535,068
21.1 5 386,915 496,709 441,812
1 250,693 318,907 284,800
0.5 203,647 253,565 228,606
0.1 133,546 167,652 150,599
25 308,067 256,034 282,050
10 185,093 168,303 176,698
37.8 5 140,080 130,248 135,164
1 84,859 81,665 83,262
0.5 66,527 66,517 66,522
43
TABLE 4-4 Dynamic Modulus for Samples Prepared with CSS – 1h + Lime
Dynamic Modulus (psi) Temperature(°C)
Frequency(Hz) Sample 1 Sample 2 Average 25 1,341,448 1,462,943 1,402,196
10 1,298,784 1,363,747 1,331,266
4.4 5 1,216,269 1,278,824 1,247,547
1 1,016,050 1,076,058 1,046,054
0.5 940,586 1,002,879 971,732
0.1 761,391 816,113 788,752
25 788,497 954,739 871,618
10 742,074 871,825 806,949
21.1 5 648,761 762,499 705,630
1 457,786 554,572 506,179
0.5 400,590 476,392 438,491
0.1 296,027 332,223 314,125
25 657,462 473,953 565,708
10 364,400 328,642 346,521
37.8 5 274,119 276,368 275,243
1 170,400 178,529 174,464
0.5 143,043 146,876 144,960
0.1 96,228 96,163 96,195
44
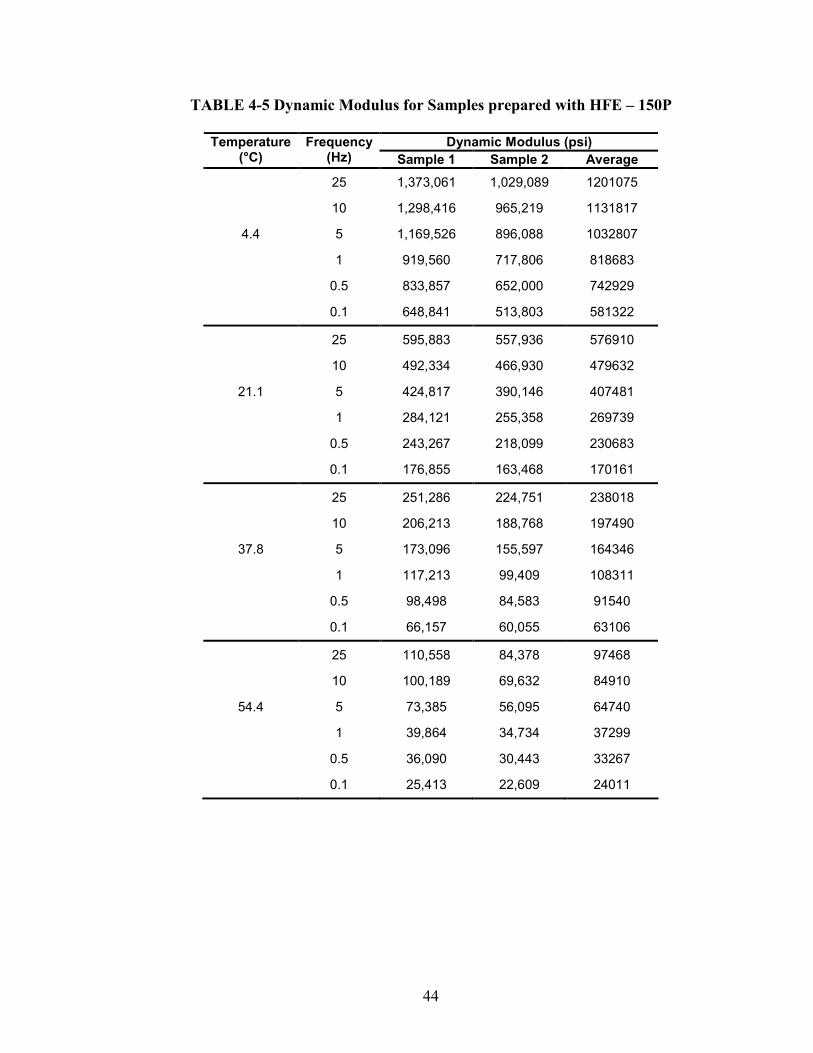
TABLE 4-5 Dynamic Modulus for Samples prepared with HFE – 150P
Dynamic Modulus (psi) Temperature(°C)
Frequency(Hz) Sample 1 Sample 2 Average 25 1,373,061 1,029,089 1201075
10 1,298,416 965,219 1131817
4.4 5 1,169,526 896,088 1032807
1 919,560 717,806 818683
0.5 833,857 652,000 742929
0.1 648,841 513,803 581322
25 595,883 557,936 576910
10 492,334 466,930 479632
21.1 5 424,817 390,146 407481
1 284,121 255,358 269739
0.5 243,267 218,099 230683
0.1 176,855 163,468 170161
25 251,286 224,751 238018
10 206,213 188,768 197490
37.8 5 173,096 155,597 164346
1 117,213 99,409 108311
0.5 98,498 84,583 91540
0.1 66,157 60,055 63106
25 110,558 84,378 97468
10 100,189 69,632 84910
54.4 5 73,385 56,095 64740
1 39,864 34,734 37299
0.5 36,090 30,443 33267
0.1 25,413 22,609 24011

45
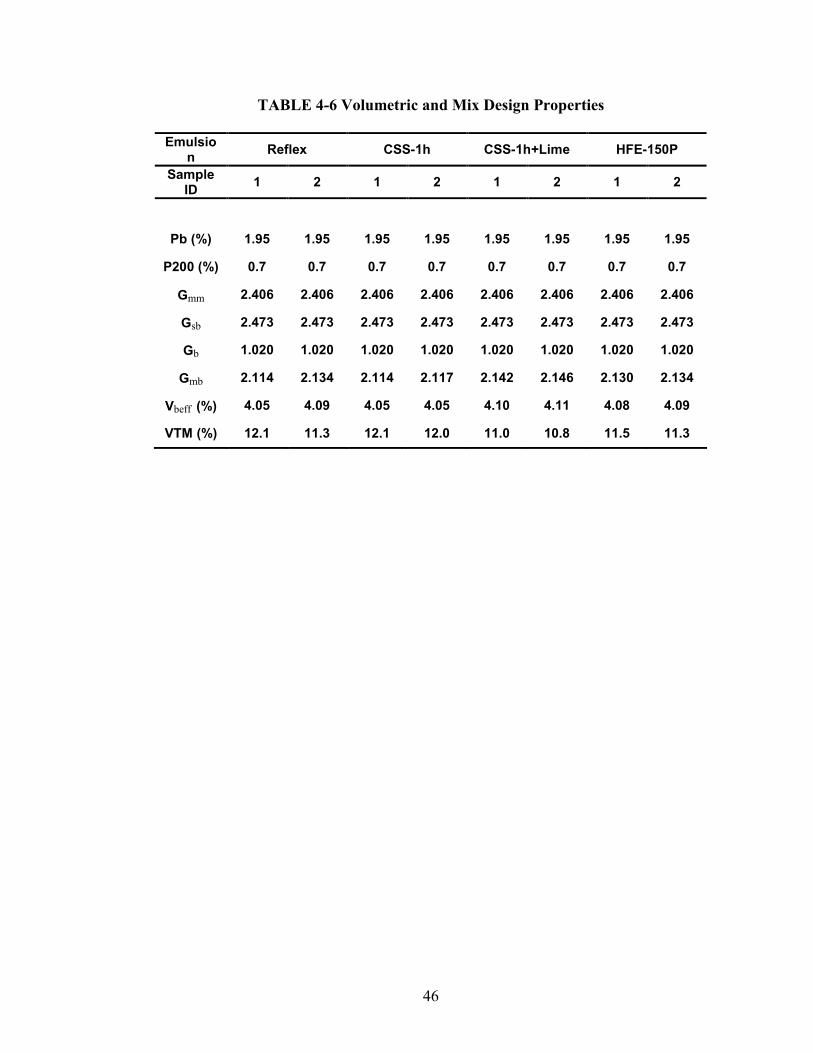
Volumetric Properties
The volumetric and mix design properties from test samples tested in the project are
listed in table 4-6. These values are used to determine the predicted dynamic modulus
values using Witczak’s equation [1] which is explained in chapter 5.
To use Witczak’s predictive equation, the following mix properties are
required; gradation of the mix, void properties, and effective volume of the binder. These
mix properties are all easily available for HMA, however, for CIR mixes several
assumptions must be made. With HMA, the properties of the asphalt and aggregate are
easily determined. With CIR the aggregate is coated with old, aged asphalt. New asphalt
is added and partial blending occurs, making determination of aggregate and asphalt
properties problematic.
Most researchers model CIR mixtures as a black rock where aggregate
properties are properties of RAP and asphalt properties are of new asphalt. This was our
approach; therefore, all gradation parameters were of the RAP and asphalt properties
were of the new asphalt in the emulsion. Effective specific gravity (Gse) of RAP was
obtained by AASHTO T-209 using the new asphalt in the emulsion. Specific gravity of
base binder (Gb) in the emulsion is difficult to obtain due to the blending. Therefore Gb of
1.020 was assumed. Bulk specific gravity (Gsb) of RAP, which is problematic to
determine, was obtained by assuming RAP has no absorption, so Gsb is equal to Gse of
RAP. The specific gravity of the RAP and binder were required to determine the
volumetric properties of the samples, which were used in the Witczak’s equation to
determine the predicted dynamic modulus.
46
TABLE 4-6 Volumetric and Mix Design Properties
Emulsion Reflex CSS-1h CSS-1h+Lime HFE-150P
Sample ID 1 2 1 2 1 2 1 2
Pb (%) 1.95 1.95 1.95 1.95 1.95 1.95 1.95 1.95
P200 (%) 0.7 0.7 0.7 0.7 0.7 0.7 0.7 0.7
Gmm 2.406 2.406 2.406 2.406 2.406 2.406 2.406 2.406
Gsb 2.473 2.473 2.473 2.473 2.473 2.473 2.473 2.473
Gb 1.020 1.020 1.020 1.020 1.020 1.020 1.020 1.020
Gmb 2.114 2.134 2.114 2.117 2.142 2.146 2.130 2.134
Vbeff (%) 4.05 4.09 4.05 4.05 4.10 4.11 4.08 4.09
VTM (%) 12.1 11.3 12.1 12.0 11.0 10.8 11.5 11.3
47
CHAPTER 5
ANALYSIS OF EXPERIMENTAL AND PREDICTED RESULTS
This chapter provides the analysis of the experimental data. The analysis was performed
to determine the effect of emulsion type on dynamic modulus of the mixture.
Experimentally determined dynamic modulus values were compared to values
determined using Witczak’s predictive equation used in the M-EPDG. Lastly, the impact
on the pavement thickness of any statistical difference found in dynamic modulus was
evaluated using the M-EPDG.
ANALYSIS OF VARIANCE (ANOVA)
Temperature and frequency have a significant effect on dynamic modulus of bituminous
mixtures. AASHTO TP-62 requires testing at different frequencies and temperatures. A
review of the test data indicated that frequency had a consistent effect on dynamic
modulus showing an increase in dynamic modulus with an increase in frequency.
Therefore, an ANOVA was performed to determine if there is a statistical difference in
dynamic modulus between EAC and temperature by using a single frequency. The
middle frequency (5Hz) was selected since all the frequencies showed a similar trend.
The results, shown in table 5-1 indicate that dynamic modulus values for CIR
between EAC and temperature were significantly different. The interaction of
EAC*Temp was not significant at a confidence limit of 95% ( α = 0.05) but was
significant at 93% ( α = 0.07). Because there was a slight interaction, the effect of EAC
on dynamic modulus was evaluated by temperature. Table 5-2 shows results from
48
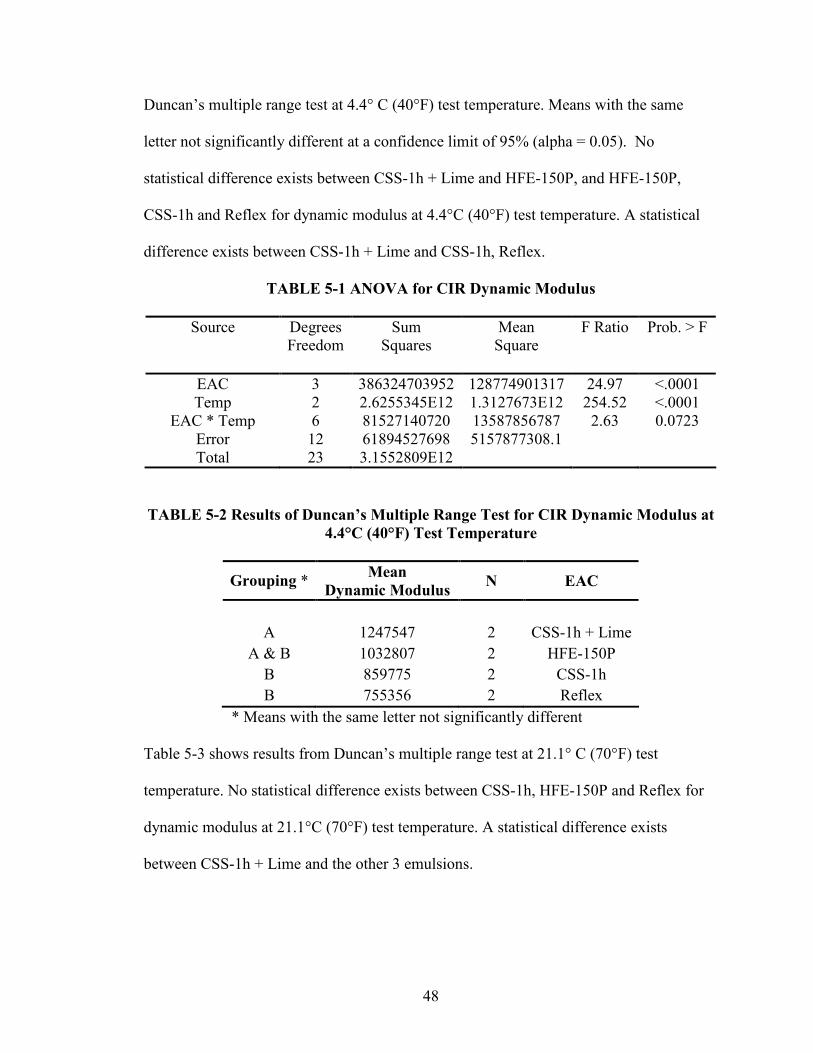
Duncan’s multiple range test at 4.4° C (40°F) test temperature. Means with the same
letter not significantly different at a confidence limit of 95% (alpha = 0.05). No
statistical difference exists between CSS-1h + Lime and HFE-150P, and HFE-150P,
CSS-1h and Reflex for dynamic modulus at 4.4°C (40°F) test temperature. A statistical
difference exists between CSS-1h + Lime and CSS-1h, Reflex.
TABLE 5-1 ANOVA for CIR Dynamic Modulus
Source Degrees Sum Mean F Ratio Prob. > F Freedom Squares Square
EAC 3 386324703952 128774901317 24.97 <.0001 Temp 2 2.6255345E12 1.3127673E12 254.52 <.0001
EAC * Temp 6 81527140720 13587856787 2.63 0.0723 Error 12 61894527698 5157877308.1 Total 23 3.1552809E12
TABLE 5-2 Results of Duncan’s Multiple Range Test for CIR Dynamic Modulus at 4.4°C (40°F) Test Temperature
Grouping * Mean Dynamic Modulus N EAC
A 1247547 2 CSS-1h + LimeA & B 1032807 2 HFE-150P
B 859775 2 CSS-1h B 755356 2 Reflex
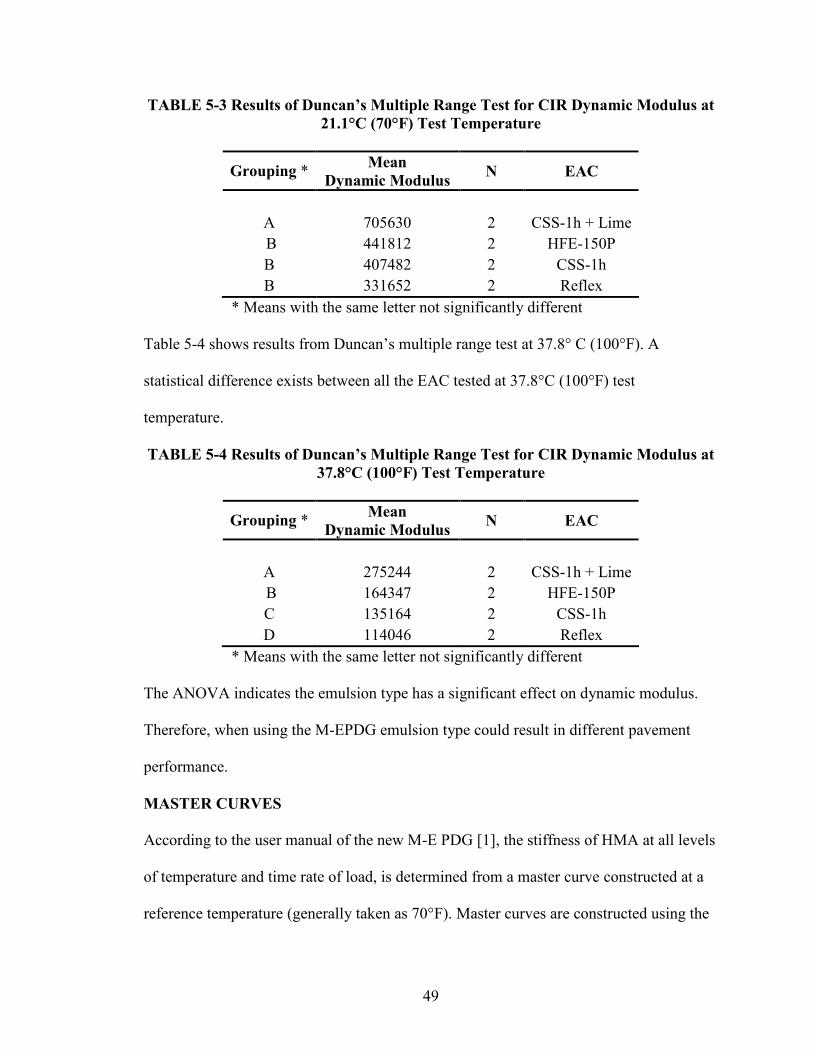
* Means with the same letter not significantly different Table 5-3 shows results from Duncan’s multiple range test at 21.1° C (70°F) test
temperature. No statistical difference exists between CSS-1h, HFE-150P and Reflex for
dynamic modulus at 21.1°C (70°F) test temperature. A statistical difference exists
between CSS-1h + Lime and the other 3 emulsions.
49
TABLE 5-3 Results of Duncan’s Multiple Range Test for CIR Dynamic Modulus at 21.1°C (70°F) Test Temperature
Grouping * Mean Dynamic Modulus N EAC
A 705630 2 CSS-1h + LimeB 441812 2 HFE-150P B 407482 2 CSS-1h B 331652 2 Reflex
* Means with the same letter not significantly different
Table 5-4 shows results from Duncan’s multiple range test at 37.8° C (100°F). A
statistical difference exists between all the EAC tested at 37.8°C (100°F) test
temperature.
TABLE 5-4 Results of Duncan’s Multiple Range Test for CIR Dynamic Modulus at 37.8°C (100°F) Test Temperature
Grouping * Mean Dynamic Modulus N EAC
A 275244 2 CSS-1h + LimeB 164347 2 HFE-150P C 135164 2 CSS-1h D 114046 2 Reflex
* Means with the same letter not significantly different
The ANOVA indicates the emulsion type has a significant effect on dynamic modulus.
Therefore, when using the M-EPDG emulsion type could result in different pavement
performance.
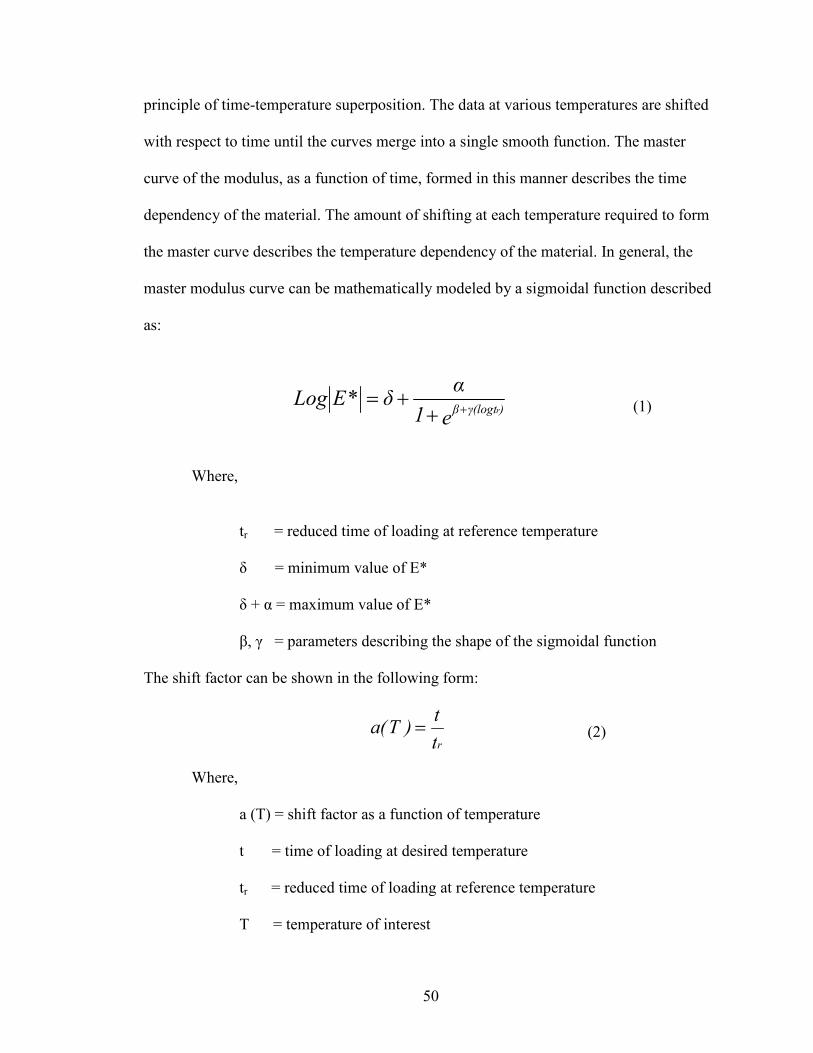
MASTER CURVES
According to the user manual of the new M-E PDG [1], the stiffness of HMA at all levels
of temperature and time rate of load, is determined from a master curve constructed at a
reference temperature (generally taken as 70°F). Master curves are constructed using the
50
principle of time-temperature superposition. The data at various temperatures are shifted
with respect to time until the curves merge into a single smooth function. The master
curve of the modulus, as a function of time, formed in this manner describes the time
dependency of the material. The amount of shifting at each temperature required to form
the master curve describes the temperature dependency of the material. In general, the
master modulus curve can be mathematically modeled by a sigmoidal function described
as:
e1αδ*ELog )γ(logtβ r++
+= (1)
Where,
tr = reduced time of loading at reference temperature
δ = minimum value of E*
δ + α = maximum value of E*
β, γ = parameters describing the shape of the sigmoidal function
The shift factor can be shown in the following form:
rtt)T(a = (2)
Where,
a (T) = shift factor as a function of temperature
t = time of loading at desired temperature
tr = reduced time of loading at reference temperature
T = temperature of interest
51
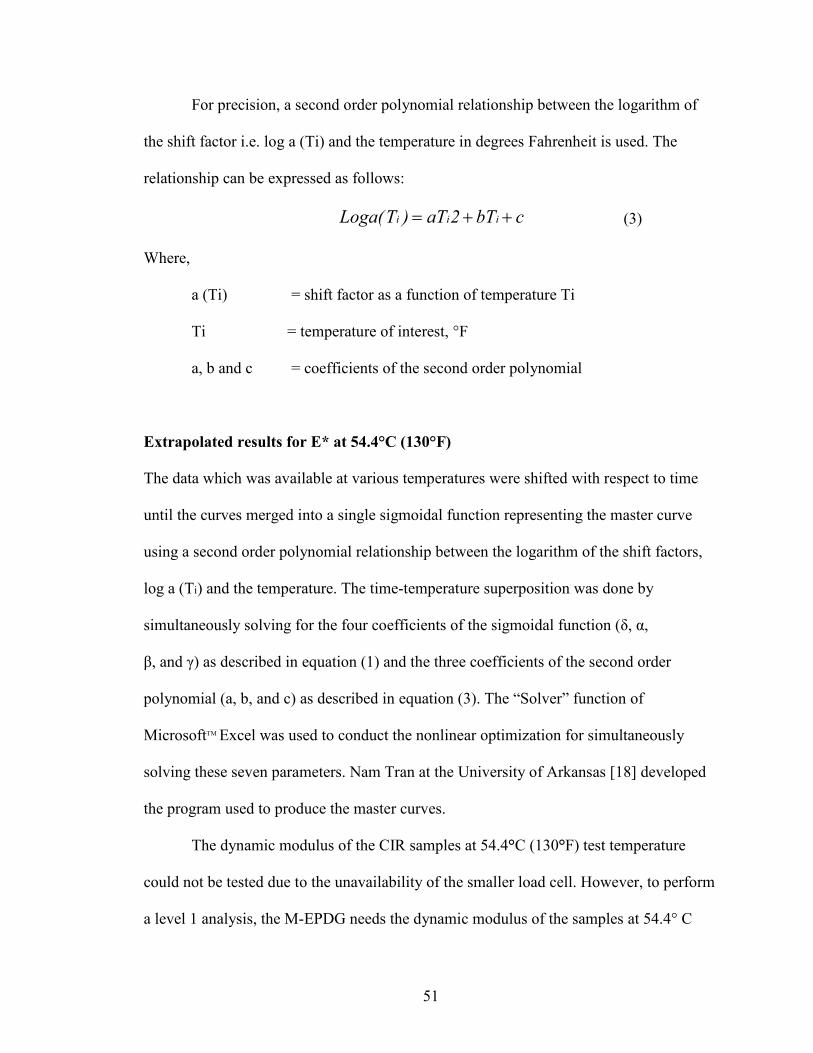
For precision, a second order polynomial relationship between the logarithm of
the shift factor i.e. log a (Ti) and the temperature in degrees Fahrenheit is used. The
relationship can be expressed as follows:
cbT2aT)T(Loga iii ++= (3)
Where,
a (Ti) = shift factor as a function of temperature Ti
Ti = temperature of interest, °F
a, b and c = coefficients of the second order polynomial
Extrapolated results for E* at 54.4°C (130°F)
The data which was available at various temperatures were shifted with respect to time
until the curves merged into a single sigmoidal function representing the master curve
using a second order polynomial relationship between the logarithm of the shift factors,
log a (Ti) and the temperature. The time-temperature superposition was done by
simultaneously solving for the four coefficients of the sigmoidal function (δ, α,
β, and γ) as described in equation (1) and the three coefficients of the second order
polynomial (a, b, and c) as described in equation (3). The “Solver” function of
MicrosoftTM Excel was used to conduct the nonlinear optimization for simultaneously
solving these seven parameters. Nam Tran at the University of Arkansas [18] developed
the program used to produce the master curves.
The dynamic modulus of the CIR samples at 54.4°C (130°F) test temperature
could not be tested due to the unavailability of the smaller load cell. However, to perform
a level 1 analysis, the M-EPDG needs the dynamic modulus of the samples at 54.4° C

52
(130°F). The dynamic modulus data for 54.4° C (130°F) was obtained by extrapolating
the master curve using the coefficients delta, alpha, beta and gamma, determined from the
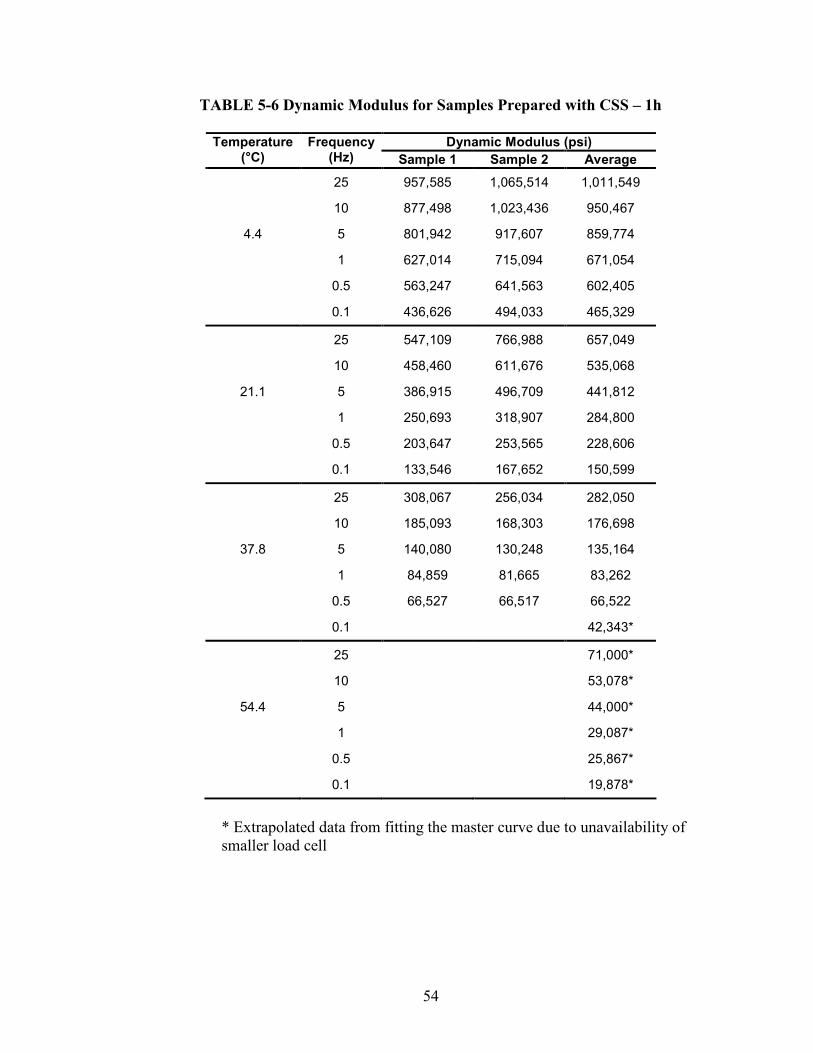
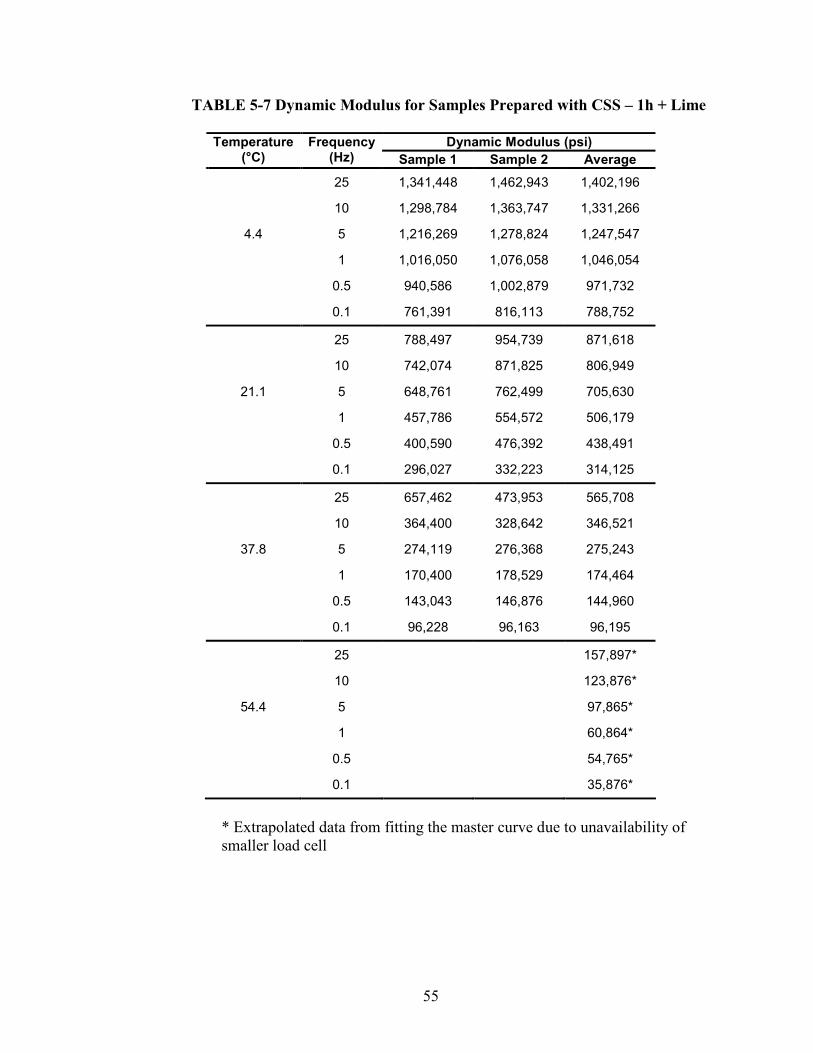
master curves developed for the three available test temperatures. Tables 5-5 – 5-8 show
the extrapolated dynamic modulus values for 54.4°C (130°F) test temperature and figures
5-1 – 5-4 show the complete master curves.
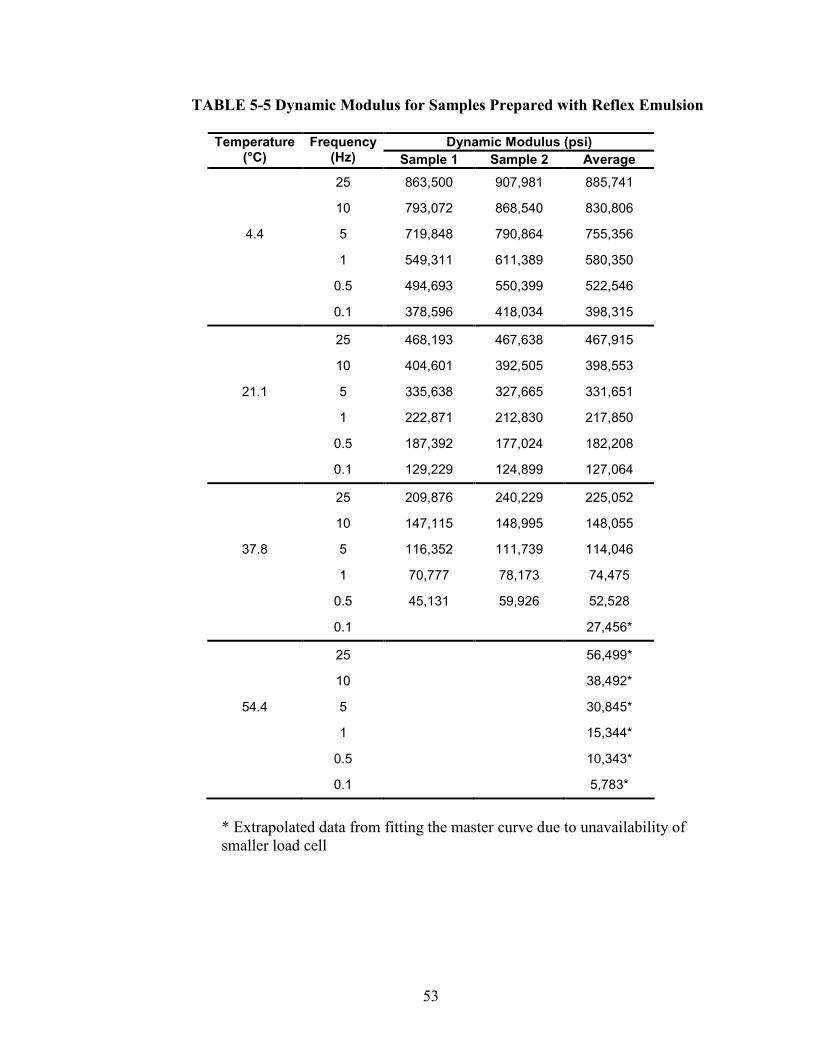
53
TABLE 5-5 Dynamic Modulus for Samples Prepared with Reflex Emulsion
Dynamic Modulus (psi) Temperature(°C)
Frequency(Hz) Sample 1 Sample 2 Average 25 863,500 907,981 885,741
10 793,072 868,540 830,806
4.4 5 719,848 790,864 755,356
1 549,311 611,389 580,350
0.5 494,693 550,399 522,546
0.1 378,596 418,034 398,315
25 468,193 467,638 467,915
10 404,601 392,505 398,553
21.1 5 335,638 327,665 331,651
1 222,871 212,830 217,850
0.5 187,392 177,024 182,208
0.1 129,229 124,899 127,064
25 209,876 240,229 225,052
10 147,115 148,995 148,055
37.8 5 116,352 111,739 114,046
1 70,777 78,173 74,475
0.5 45,131 59,926 52,528
0.1 27,456*
25 56,499*
10 38,492*
54.4 5 30,845*
1 15,344*
0.5 10,343*
0.1 5,783*
* Extrapolated data from fitting the master curve due to unavailability of smaller load cell
54
TABLE 5-6 Dynamic Modulus for Samples Prepared with CSS – 1h
Dynamic Modulus (psi) Temperature(°C)
Frequency(Hz) Sample 1 Sample 2 Average 25 957,585 1,065,514 1,011,549
10 877,498 1,023,436 950,467
4.4 5 801,942 917,607 859,774
1 627,014 715,094 671,054
0.5 563,247 641,563 602,405
0.1 436,626 494,033 465,329
25 547,109 766,988 657,049
10 458,460 611,676 535,068
21.1 5 386,915 496,709 441,812
1 250,693 318,907 284,800
0.5 203,647 253,565 228,606
0.1 133,546 167,652 150,599
25 308,067 256,034 282,050
10 185,093 168,303 176,698
37.8 5 140,080 130,248 135,164
1 84,859 81,665 83,262
0.5 66,527 66,517 66,522
0.1 42,343*
25 71,000*
10 53,078*
54.4 5 44,000*
1 29,087*
0.5 25,867*
0.1 19,878*
* Extrapolated data from fitting the master curve due to unavailability of smaller load cell
55
TABLE 5-7 Dynamic Modulus for Samples Prepared with CSS – 1h + Lime
Dynamic Modulus (psi) Temperature(°C)
Frequency(Hz) Sample 1 Sample 2 Average 25 1,341,448 1,462,943 1,402,196
10 1,298,784 1,363,747 1,331,266
4.4 5 1,216,269 1,278,824 1,247,547
1 1,016,050 1,076,058 1,046,054
0.5 940,586 1,002,879 971,732
0.1 761,391 816,113 788,752
25 788,497 954,739 871,618
10 742,074 871,825 806,949
21.1 5 648,761 762,499 705,630
1 457,786 554,572 506,179
0.5 400,590 476,392 438,491
0.1 296,027 332,223 314,125
25 657,462 473,953 565,708
10 364,400 328,642 346,521
37.8 5 274,119 276,368 275,243
1 170,400 178,529 174,464
0.5 143,043 146,876 144,960
0.1 96,228 96,163 96,195
25 157,897*
10 123,876*
54.4 5 97,865*
1 60,864*
0.5 54,765*
0.1 35,876*
* Extrapolated data from fitting the master curve due to unavailability of smaller load cell

56
TABLE 5-8 Dynamic Modulus for Samples Prepared with HFE – 150P
Dynamic Modulus (psi) Temperature(°C)
Frequency(Hz) Sample 1 Sample 2 Average 25 1,373,061 1,029,089 1201075
10 1,298,416 965,219 1131817
4.4 5 1,169,526 896,088 1032807
1 919,560 717,806 818683
0.5 833,857 652,000 742929
0.1 648,841 513,803 581322
25 595,883 557,936 576910
10 492,334 466,930 479632
21.1 5 424,817 390,146 407481
1 284,121 255,358 269739
0.5 243,267 218,099 230683
0.1 176,855 163,468 170161
25 251,286 224,751 238018
10 206,213 188,768 197490
37.8 5 173,096 155,597 164346
1 117,213 99,409 108311
0.5 98,498 84,583 91540
0.1 66,157 60,055 63106
25 110,558 84,378 97468
10 100,189 69,632 84910
54.4 5 73,385 56,095 64740
1 39,864 34,734 37299
0.5 36,090 30,443 33267
0.1 25,413 22,609 24011

57
Master Curve for US 412 RAP & Reflex Emulsion
1.0
10.0
100.0
1,000.0
-5.00 -4.00 -3.00 -2.00 -1.00 0.00 1.00 2.00 3.00 4.00Log Frequency, Hz
|E*|,
ksi
Fitted Curve Test Data
FIGURE 5-1 Master Curve for US-412 and Reflex.
Master Curve for US 412 RAP & CSS-1h Emulsion
10.0
100.0
1,000.0
10,000.0
-5.00 -4.00 -3.00 -2.00 -1.00 0.00 1.00 2.00 3.00 4.00Log Frequency, Hz
|E*|,
ksi
Fitted Curve Test Data
FIGURE 5-2 Master Curve for US-412 RAP and CSS-1h Emulsion.
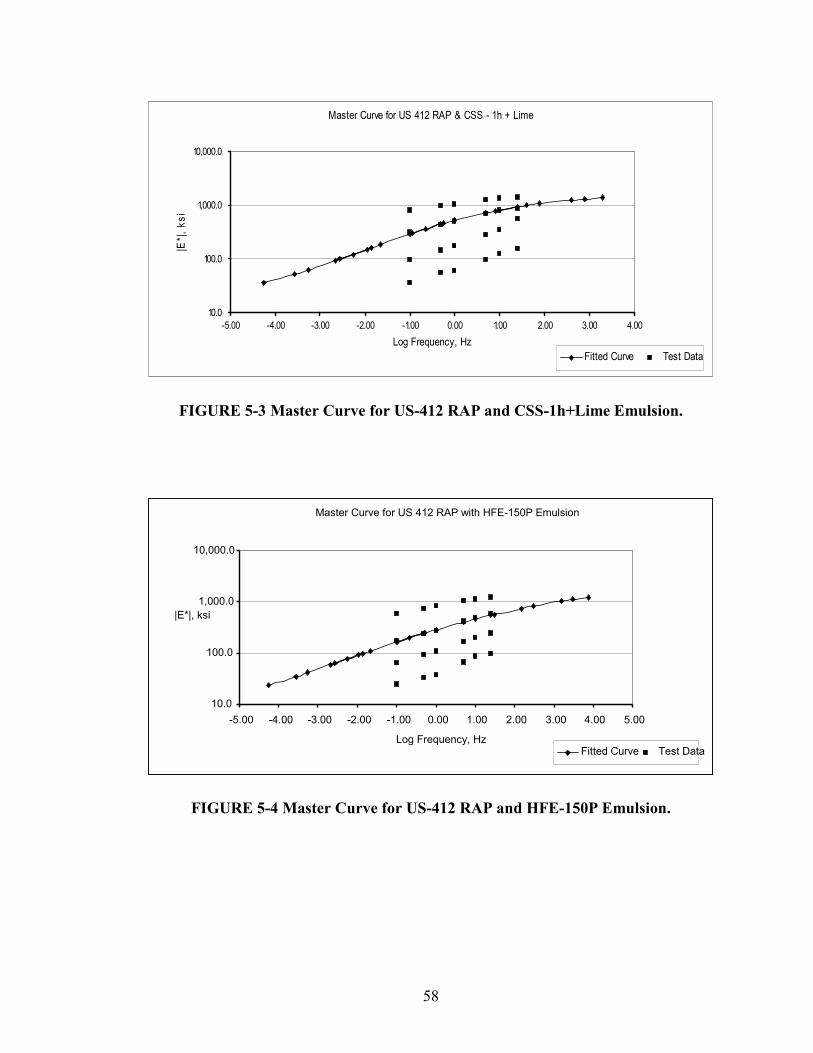
58
Master Curve for US 412 RAP & CSS - 1h + Lime
10.0
100.0
1,000.0
10,000.0
-5.00 -4.00 -3.00 -2.00 -1.00 0.00 1.00 2.00 3.00 4.00Log Frequency, Hz
|E*|,
ksi
Fitted Curve Test Data
FIGURE 5-3 Master Curve for US-412 RAP and CSS-1h+Lime Emulsion.
FIGURE 5-4 Master Curve for US-412 RAP and HFE-150P Emulsion.
Master Curve for US 412 RAP with HFE-150P Emulsion
10.0
100.0
1,000.0
10,000.0
-5.00 -4.00 -3.00 -2.00 -1.00 0.00 1.00 2.00 3.00 4.00 5.00
Log Frequency, Hz
|E*|, ksi
Fitted Curve Test Data
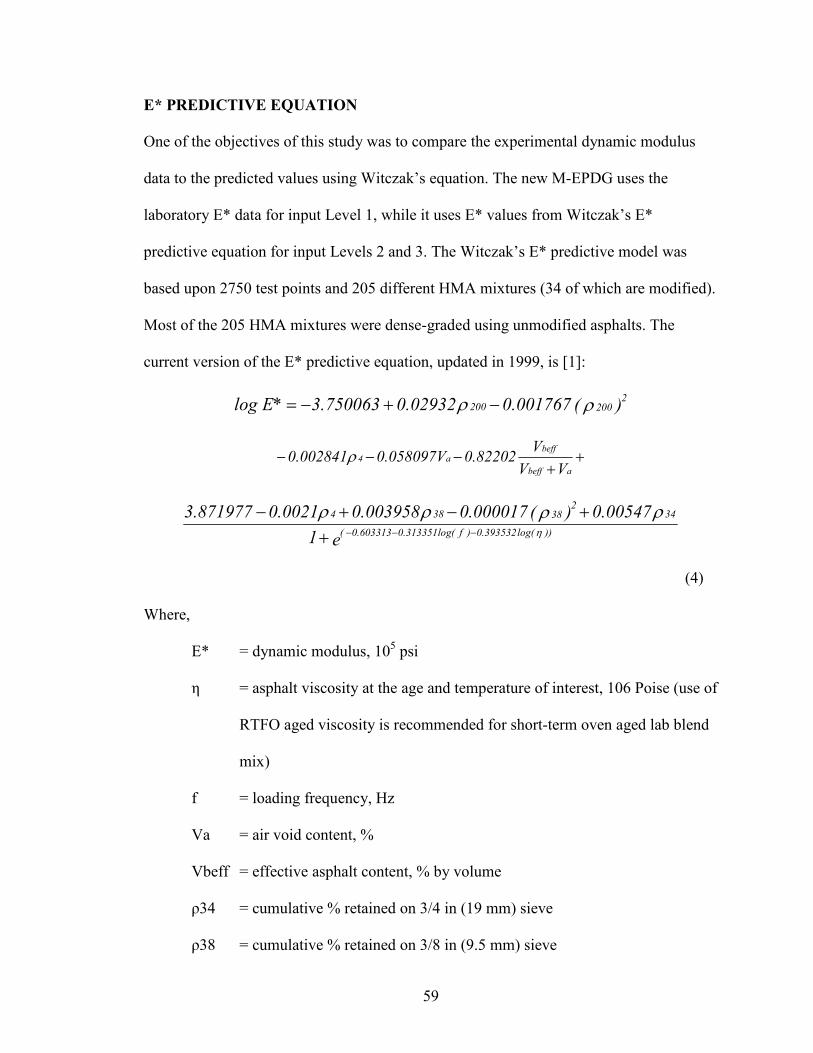
59
E* PREDICTIVE EQUATION
One of the objectives of this study was to compare the experimental dynamic modulus
data to the predicted values using Witczak’s equation. The new M-EPDG uses the
laboratory E* data for input Level 1, while it uses E* values from Witczak’s E*
predictive equation for input Levels 2 and 3. The Witczak’s E* predictive model was
based upon 2750 test points and 205 different HMA mixtures (34 of which are modified).
Most of the 205 HMA mixtures were dense-graded using unmodified asphalts. The
current version of the E* predictive equation, updated in 1999, is [1]:
)(001767.002932.0750063.3*Elog 2002
200 ρρ −+−=
++
−−−abeff
beffa4
VVV82202.0V058097.0002841.0 ρ
e100547.0)(000017.0003958.00021.0871977.3
))log(393532.0)flog(313351.0603313.0(
34382
384
η
ρρρρ−−−+
+−+−
(4)
Where,
E* = dynamic modulus, 105 psi
η = asphalt viscosity at the age and temperature of interest, 106 Poise (use of
RTFO aged viscosity is recommended for short-term oven aged lab blend
mix)
f = loading frequency, Hz
Va = air void content, %
Vbeff = effective asphalt content, % by volume
ρ34 = cumulative % retained on 3/4 in (19 mm) sieve
ρ38 = cumulative % retained on 3/8 in (9.5 mm) sieve

60
ρ4 = cumulative % retained on #4 (4.76 mm) sieve
ρ200 = % passing #200 (0.075 mm) sieve
The asphalt viscosity (η) required in equation (4) is calculated using equation (5)
shown below. Default values for A and VTS , measures of an asphalt’s temperature
susceptibility, were obtained only from a report by SemMaterials for Reflex emulsion
[19].
RTlogVTSAloglog +=η (5)
Where,
η = asphalt viscosity, cP
A, VTS = regression parameters
TR = temperature, ° Rankine
The Witczak’s equation, equation 4, was used to determine the predicted dynamic
modulus for each of the samples tested. The predicted dynamic modulus data for all the
samples tested is given in tables 5-9 – 5-12. The volumetric properties used to determine
the predicted dynamic modulus for each of the samples were listed in table 4-6 of chapter
4. The master curves constructed for the predicted data are shown in figures 5-5 – 5-8.
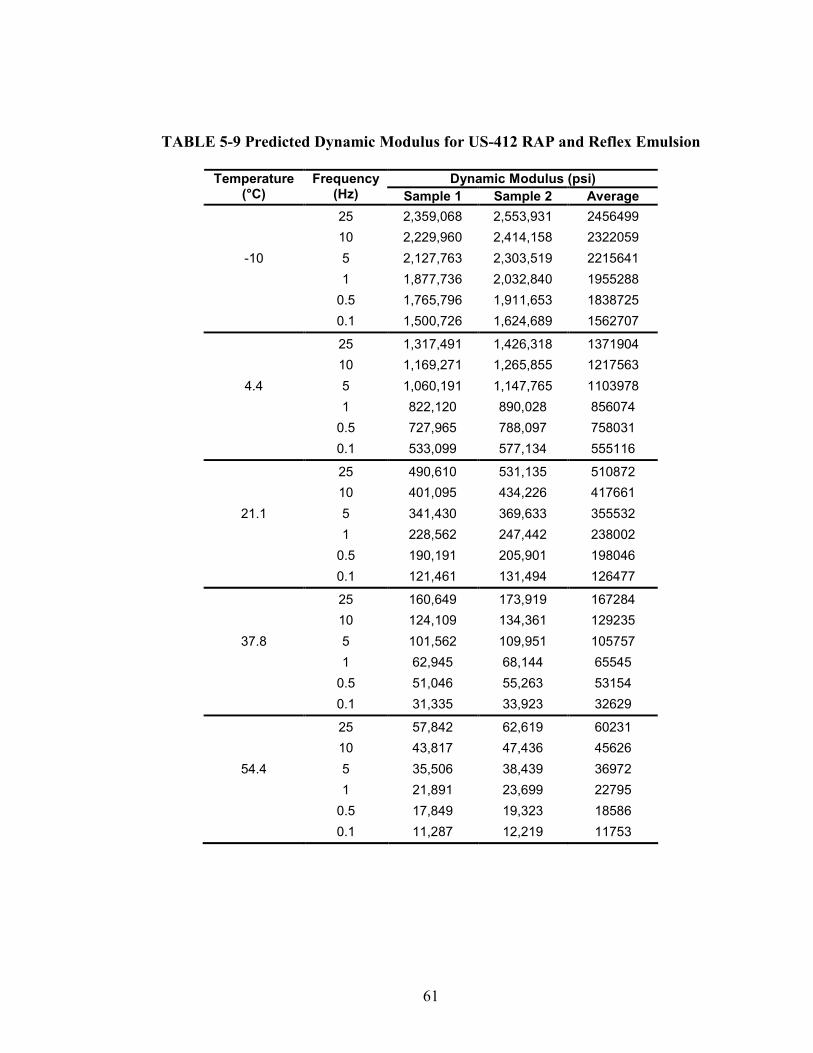
61
TABLE 5-9 Predicted Dynamic Modulus for US-412 RAP and Reflex Emulsion
Dynamic Modulus (psi) Temperature (°C)
Frequency (Hz) Sample 1 Sample 2 Average 25 2,359,068 2,553,931 2456499 10 2,229,960 2,414,158 2322059
-10 5 2,127,763 2,303,519 2215641 1 1,877,736 2,032,840 1955288 0.5 1,765,796 1,911,653 1838725 0.1 1,500,726 1,624,689 1562707
25 1,317,491 1,426,318 1371904 10 1,169,271 1,265,855 1217563
4.4 5 1,060,191 1,147,765 1103978 1 822,120 890,028 856074 0.5 727,965 788,097 758031 0.1 533,099 577,134 555116
25 490,610 531,135 510872 10 401,095 434,226 417661
21.1 5 341,430 369,633 355532 1 228,562 247,442 238002 0.5 190,191 205,901 198046 0.1 121,461 131,494 126477
25 160,649 173,919 167284 10 124,109 134,361 129235
37.8 5 101,562 109,951 105757 1 62,945 68,144 65545 0.5 51,046 55,263 53154 0.1 31,335 33,923 32629
25 57,842 62,619 60231 10 43,817 47,436 45626
54.4 5 35,506 38,439 36972 1 21,891 23,699 22795 0.5 17,849 19,323 18586 0.1 11,287 12,219 11753
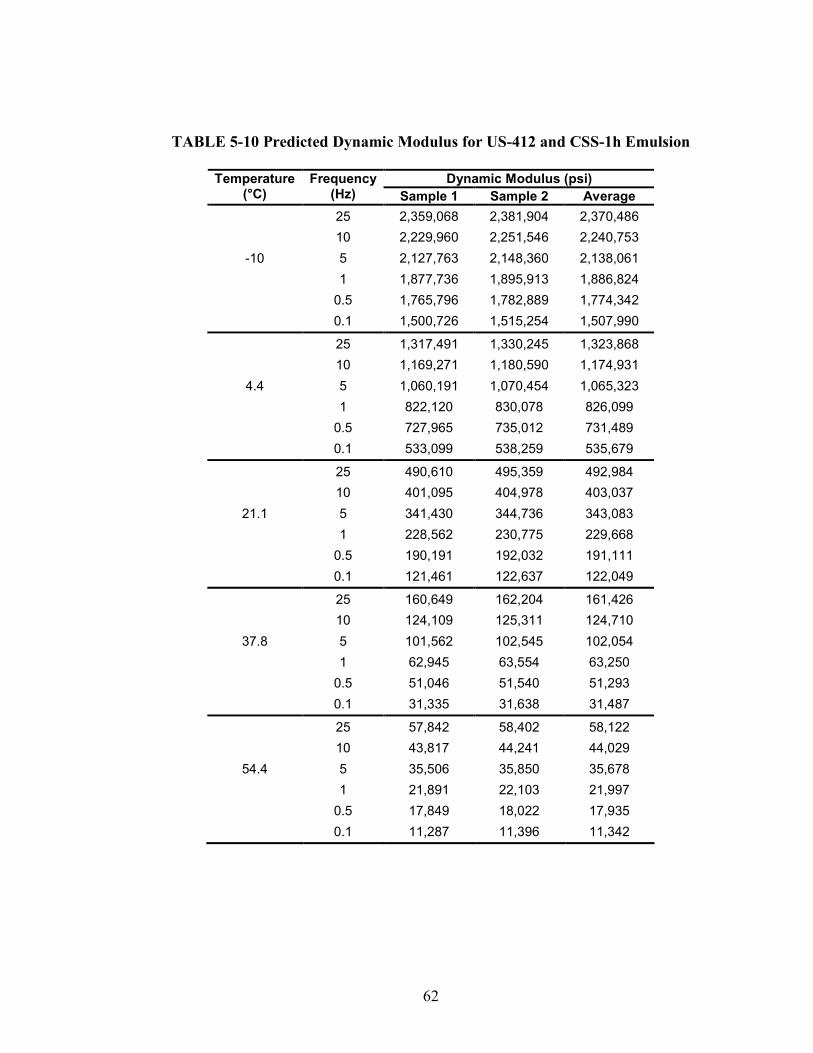
62
TABLE 5-10 Predicted Dynamic Modulus for US-412 and CSS-1h Emulsion
Dynamic Modulus (psi) Temperature(°C)
Frequency(Hz) Sample 1 Sample 2 Average 25 2,359,068 2,381,904 2,370,486 10 2,229,960 2,251,546 2,240,753
-10 5 2,127,763 2,148,360 2,138,061 1 1,877,736 1,895,913 1,886,824 0.5 1,765,796 1,782,889 1,774,342 0.1 1,500,726 1,515,254 1,507,990
25 1,317,491 1,330,245 1,323,868 10 1,169,271 1,180,590 1,174,931
4.4 5 1,060,191 1,070,454 1,065,323 1 822,120 830,078 826,099 0.5 727,965 735,012 731,489 0.1 533,099 538,259 535,679
25 490,610 495,359 492,984 10 401,095 404,978 403,037
21.1 5 341,430 344,736 343,083 1 228,562 230,775 229,668 0.5 190,191 192,032 191,111 0.1 121,461 122,637 122,049
25 160,649 162,204 161,426 10 124,109 125,311 124,710
37.8 5 101,562 102,545 102,054 1 62,945 63,554 63,250 0.5 51,046 51,540 51,293 0.1 31,335 31,638 31,487
25 57,842 58,402 58,122 10 43,817 44,241 44,029
54.4 5 35,506 35,850 35,678 1 21,891 22,103 21,997 0.5 17,849 18,022 17,935 0.1 11,287 11,396 11,342
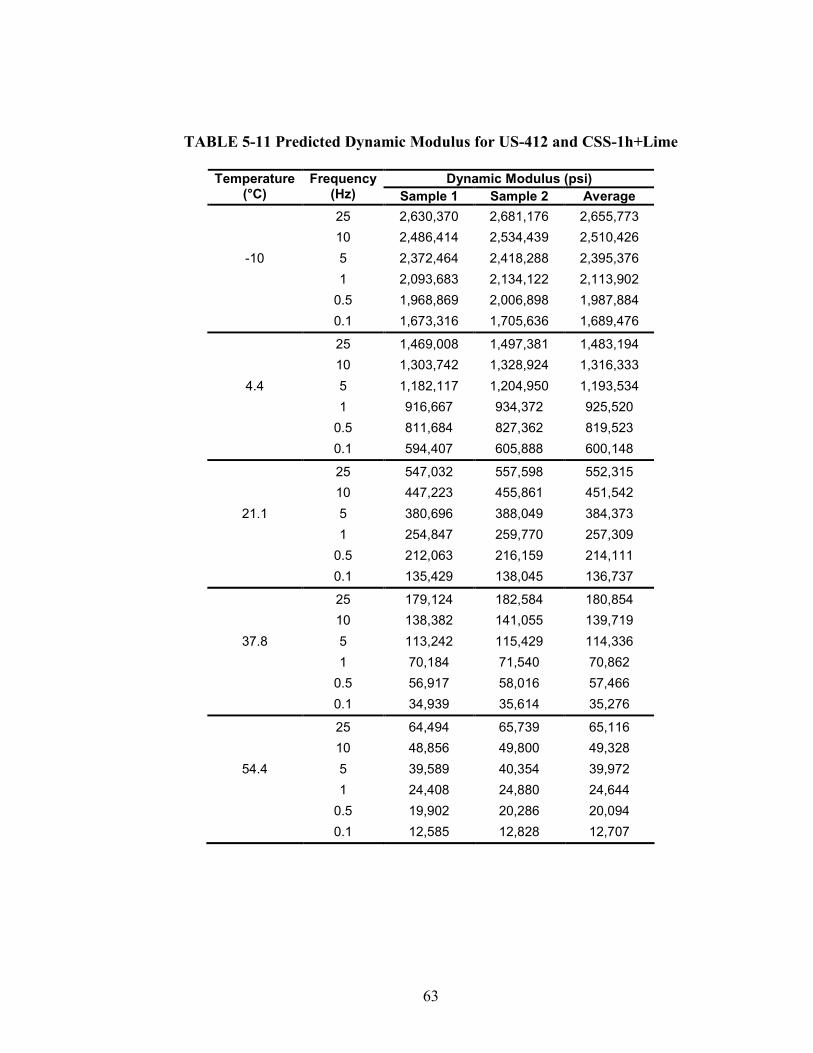
63
TABLE 5-11 Predicted Dynamic Modulus for US-412 and CSS-1h+Lime
Dynamic Modulus (psi) Temperature(°C)
Frequency(Hz) Sample 1 Sample 2 Average 25 2,630,370 2,681,176 2,655,773 10 2,486,414 2,534,439 2,510,426
-10 5 2,372,464 2,418,288 2,395,376 1 2,093,683 2,134,122 2,113,902 0.5 1,968,869 2,006,898 1,987,884 0.1 1,673,316 1,705,636 1,689,476
25 1,469,008 1,497,381 1,483,194 10 1,303,742 1,328,924 1,316,333
4.4 5 1,182,117 1,204,950 1,193,534 1 916,667 934,372 925,520 0.5 811,684 827,362 819,523 0.1 594,407 605,888 600,148
25 547,032 557,598 552,315 10 447,223 455,861 451,542
21.1 5 380,696 388,049 384,373 1 254,847 259,770 257,309 0.5 212,063 216,159 214,111 0.1 135,429 138,045 136,737
25 179,124 182,584 180,854 10 138,382 141,055 139,719
37.8 5 113,242 115,429 114,336 1 70,184 71,540 70,862 0.5 56,917 58,016 57,466 0.1 34,939 35,614 35,276
25 64,494 65,739 65,116 10 48,856 49,800 49,328
54.4 5 39,589 40,354 39,972 1 24,408 24,880 24,644 0.5 19,902 20,286 20,094 0.1 12,585 12,828 12,707
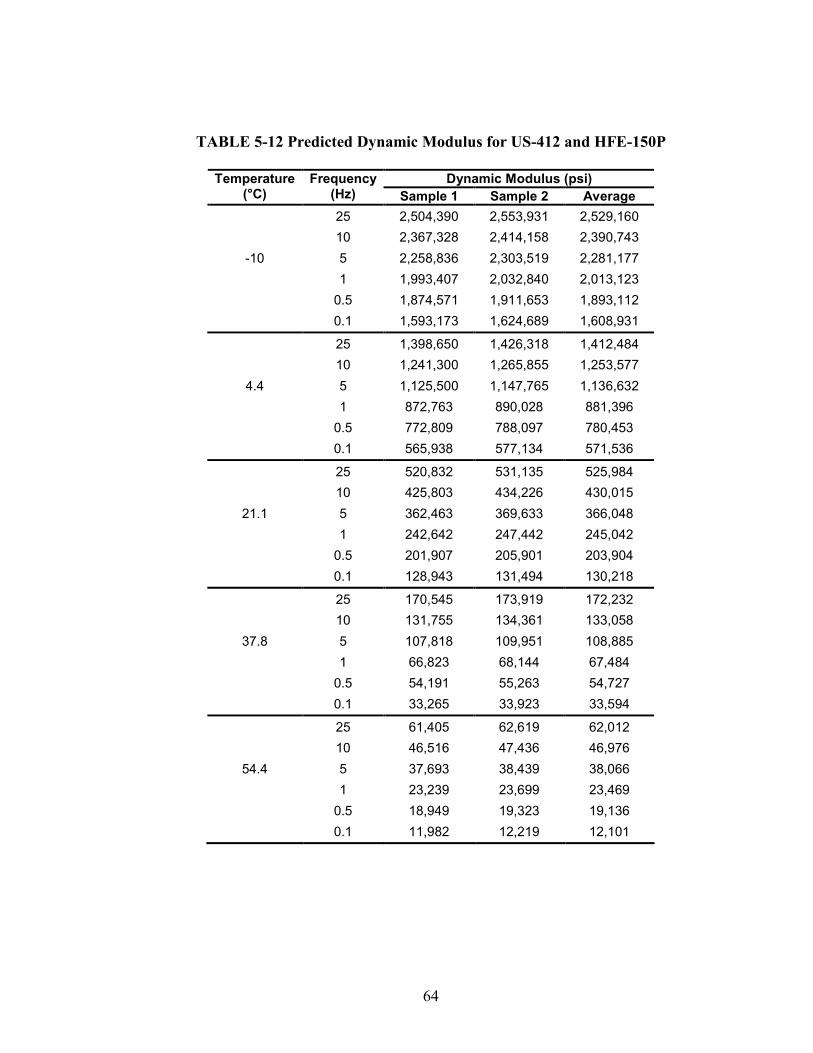
64
TABLE 5-12 Predicted Dynamic Modulus for US-412 and HFE-150P
Dynamic Modulus (psi) Temperature(°C)
Frequency(Hz) Sample 1 Sample 2 Average 25 2,504,390 2,553,931 2,529,160 10 2,367,328 2,414,158 2,390,743
-10 5 2,258,836 2,303,519 2,281,177 1 1,993,407 2,032,840 2,013,123 0.5 1,874,571 1,911,653 1,893,112 0.1 1,593,173 1,624,689 1,608,931
25 1,398,650 1,426,318 1,412,484 10 1,241,300 1,265,855 1,253,577
4.4 5 1,125,500 1,147,765 1,136,632 1 872,763 890,028 881,396 0.5 772,809 788,097 780,453 0.1 565,938 577,134 571,536
25 520,832 531,135 525,984 10 425,803 434,226 430,015
21.1 5 362,463 369,633 366,048 1 242,642 247,442 245,042 0.5 201,907 205,901 203,904 0.1 128,943 131,494 130,218
25 170,545 173,919 172,232 10 131,755 134,361 133,058
37.8 5 107,818 109,951 108,885 1 66,823 68,144 67,484 0.5 54,191 55,263 54,727 0.1 33,265 33,923 33,594
25 61,405 62,619 62,012 10 46,516 47,436 46,976
54.4 5 37,693 38,439 38,066 1 23,239 23,699 23,469 0.5 18,949 19,323 19,136 0.1 11,982 12,219 12,101
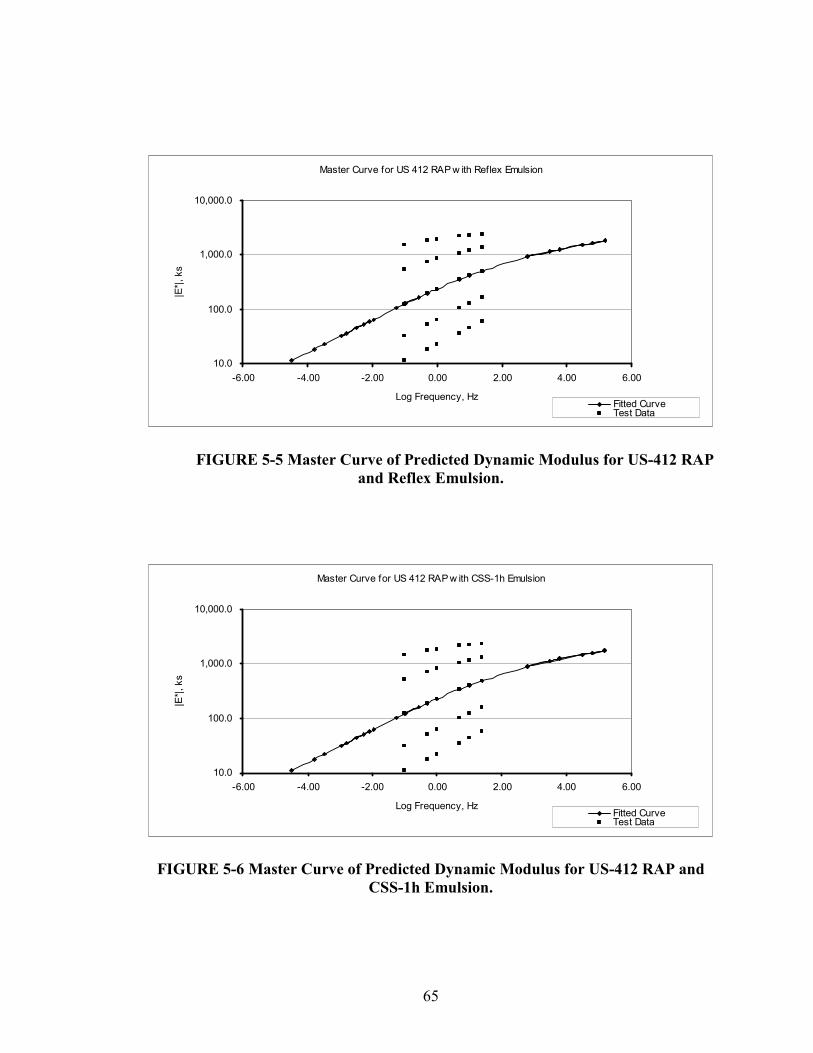
65
FIGURE 5-5 Master Curve of Predicted Dynamic Modulus for US-412 RAP and Reflex Emulsion.
Master Curve for US 412 RAP w ith CSS-1h Emulsion
10.0
100.0
1,000.0
10,000.0
-6.00 -4.00 -2.00 0.00 2.00 4.00 6.00
Log Frequency, Hz
|E*|,
ks
Fitted CurveTest Data
FIGURE 5-6 Master Curve of Predicted Dynamic Modulus for US-412 RAP and CSS-1h Emulsion.
Master Curve for US 412 RAP w ith Reflex Emulsion
10.0
100.0
1,000.0
10,000.0
-6.00 -4.00 -2.00 0.00 2.00 4.00 6.00
Log Frequency, Hz
|E*|,
ks
Fitted CurveTest Data

66
Master Curve for US 412 RAP w ith CSS-1h+Lime Emulsion
10.0
100.0
1,000.0
10,000.0
-6.00 -4.00 -2.00 0.00 2.00 4.00 6.00
Log Frequency, Hz
|E*|,
ks
Fitted CurveTest Data
FIGURE 5-7 Master Curve of Predicted Dynamic Modulus for US-412 RAP and CSS-1h+ Lime Emulsion.
Master Curve for US 412 RAP w ith HFE-150P Emulsion
10.0
100.0
1,000.0
10,000.0
-6.00 -4.00 -2.00 0.00 2.00 4.00 6.00
Log Frequency, Hz
|E*|,
ks
Fitted CurveTest Data
FIGURE 5-8 Master Curve of Predicted Dynamic Modulus for US-412 and HFE-150P Emulsion.
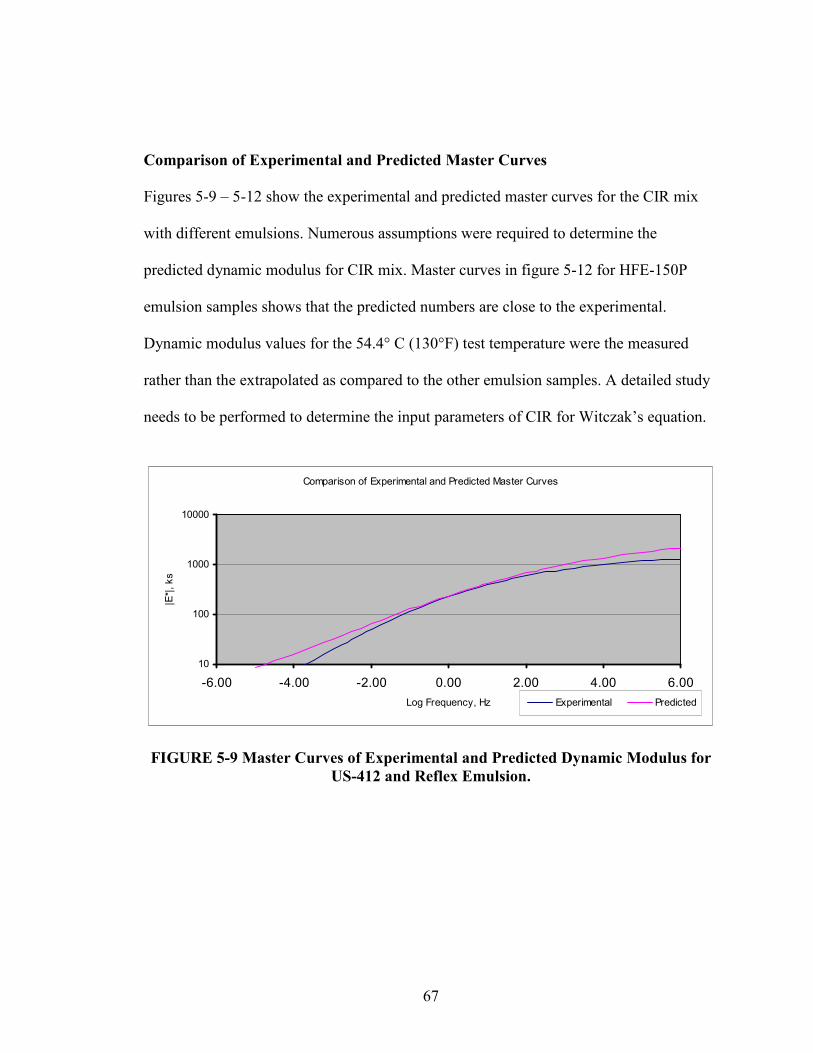
67
Comparison of Experimental and Predicted Master Curves
Figures 5-9 – 5-12 show the experimental and predicted master curves for the CIR mix
with different emulsions. Numerous assumptions were required to determine the
predicted dynamic modulus for CIR mix. Master curves in figure 5-12 for HFE-150P
emulsion samples shows that the predicted numbers are close to the experimental.
Dynamic modulus values for the 54.4° C (130°F) test temperature were the measured
rather than the extrapolated as compared to the other emulsion samples. A detailed study
needs to be performed to determine the input parameters of CIR for Witczak’s equation.
Comparison of Experimental and Predicted Master Curves
10
100
1000
10000
-6.00 -4.00 -2.00 0.00 2.00 4.00 6.00Log Frequency, Hz
|E*|,
ks
Experimental Predicted
FIGURE 5-9 Master Curves of Experimental and Predicted Dynamic Modulus for US-412 and Reflex Emulsion.
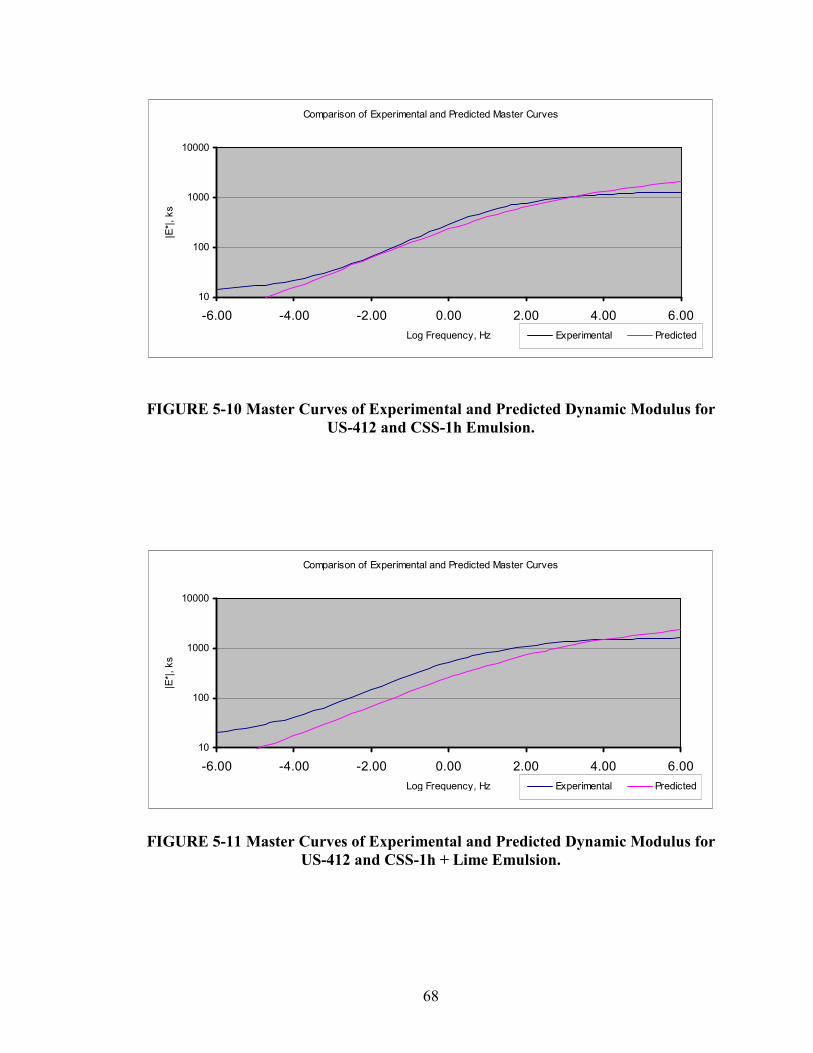
68
Comparison of Experimental and Predicted Master Curves
10
100
1000
10000
-6.00 -4.00 -2.00 0.00 2.00 4.00 6.00Log Frequency, Hz
|E*|,
ks
Experimental Predicted
FIGURE 5-10 Master Curves of Experimental and Predicted Dynamic Modulus for US-412 and CSS-1h Emulsion.
Comparison of Experimental and Predicted Master Curves
10
100
1000
10000
-6.00 -4.00 -2.00 0.00 2.00 4.00 6.00Log Frequency, Hz
|E*|,
ks
Experimental Predicted
FIGURE 5-11 Master Curves of Experimental and Predicted Dynamic Modulus for US-412 and CSS-1h + Lime Emulsion.
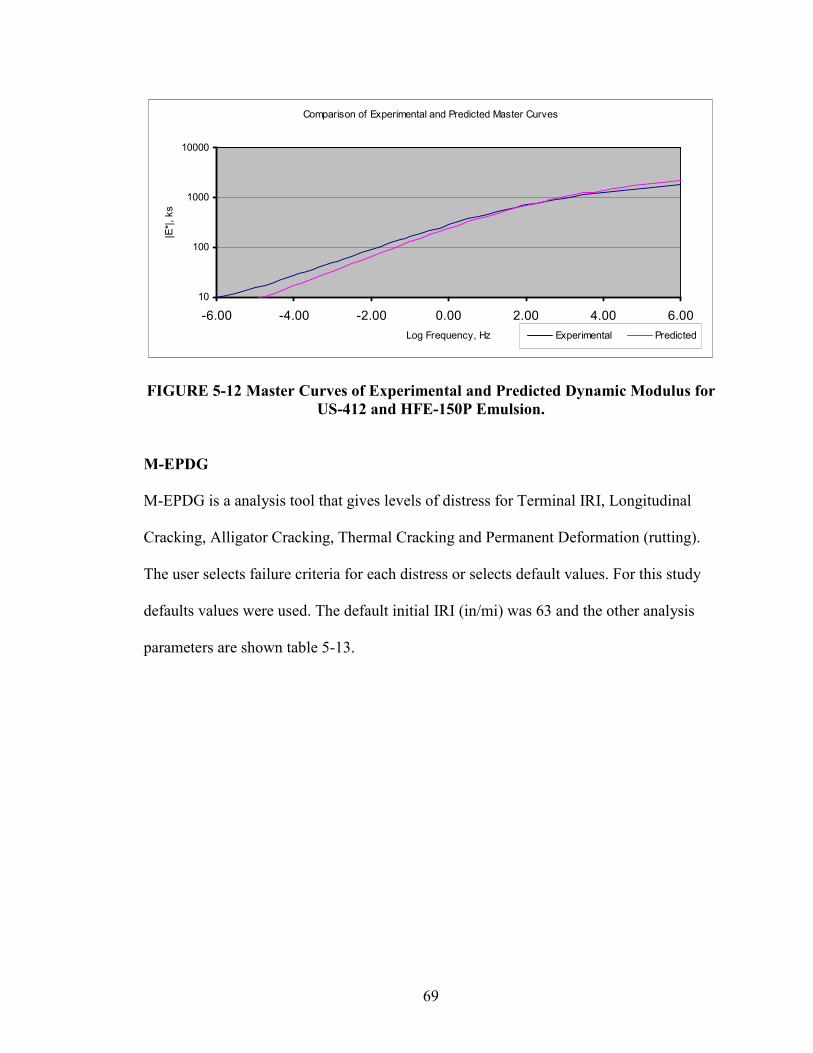
69
Comparison of Experimental and Predicted Master Curves
10
100
1000
10000
-6.00 -4.00 -2.00 0.00 2.00 4.00 6.00Log Frequency, Hz
|E*|,
ks
Experimental Predicted
FIGURE 5-12 Master Curves of Experimental and Predicted Dynamic Modulus for US-412 and HFE-150P Emulsion.
M-EPDG
M-EPDG is a analysis tool that gives levels of distress for Terminal IRI, Longitudinal
Cracking, Alligator Cracking, Thermal Cracking and Permanent Deformation (rutting).
The user selects failure criteria for each distress or selects default values. For this study
defaults values were used. The default initial IRI (in/mi) was 63 and the other analysis
parameters are shown table 5-13.
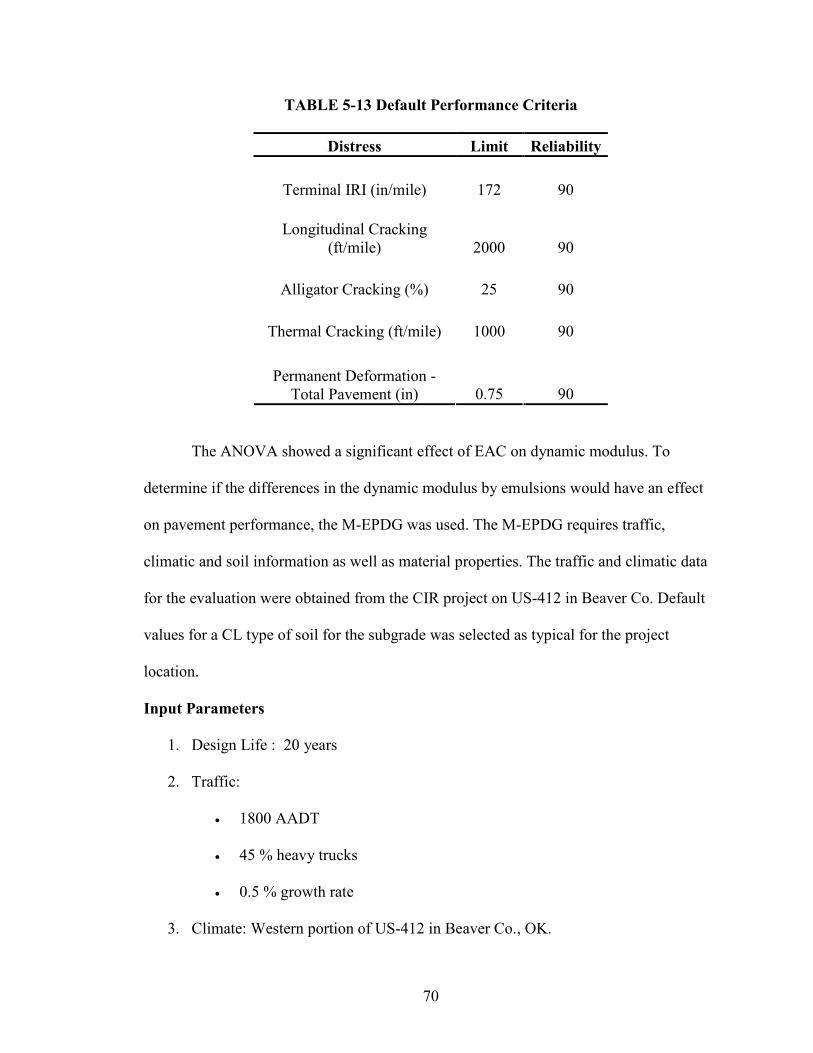
70
TABLE 5-13 Default Performance Criteria
Distress Limit Reliability
Terminal IRI (in/mile) 172 90
Longitudinal Cracking (ft/mile) 2000 90
Alligator Cracking (%) 25 90
Thermal Cracking (ft/mile) 1000 90
Permanent Deformation -
Total Pavement (in) 0.75 90
The ANOVA showed a significant effect of EAC on dynamic modulus. To
determine if the differences in the dynamic modulus by emulsions would have an effect
on pavement performance, the M-EPDG was used. The M-EPDG requires traffic,
climatic and soil information as well as material properties. The traffic and climatic data
for the evaluation were obtained from the CIR project on US-412 in Beaver Co. Default
values for a CL type of soil for the subgrade was selected as typical for the project
location.
Input Parameters
1. Design Life : 20 years
2. Traffic:
• 1800 AADT
• 45 % heavy trucks
• 0.5 % growth rate
3. Climate: Western portion of US-412 in Beaver Co., OK.
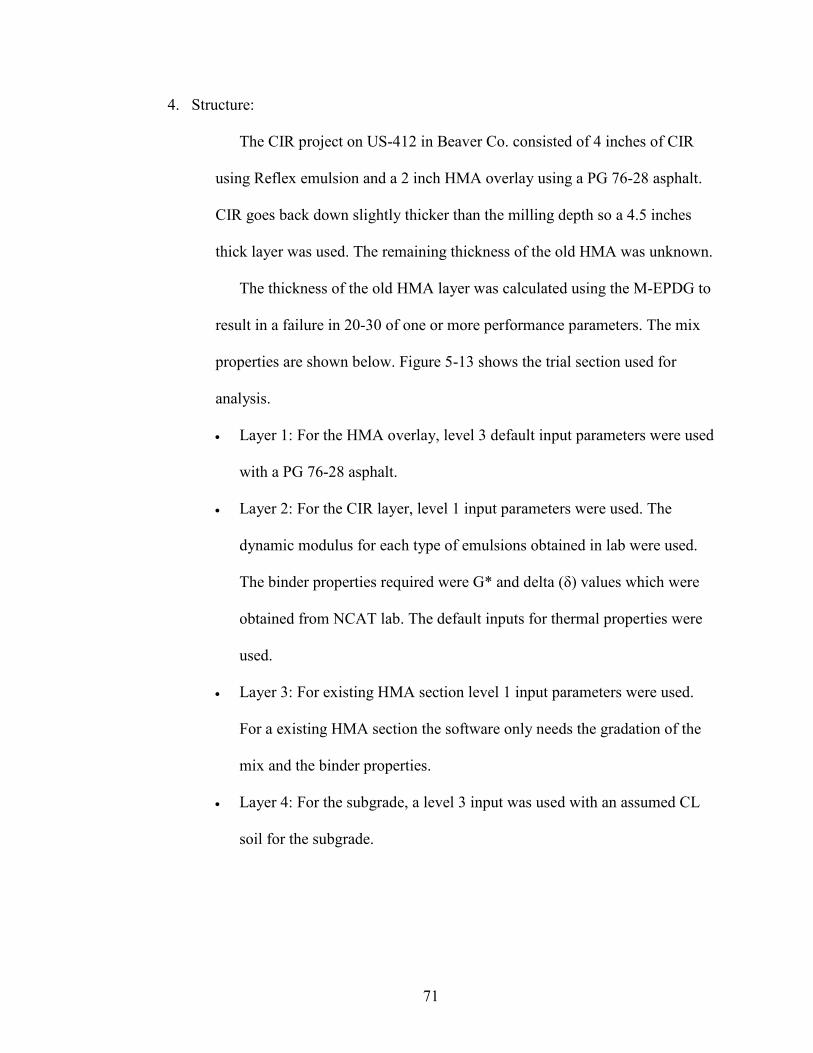
71
4. Structure:
The CIR project on US-412 in Beaver Co. consisted of 4 inches of CIR
using Reflex emulsion and a 2 inch HMA overlay using a PG 76-28 asphalt.
CIR goes back down slightly thicker than the milling depth so a 4.5 inches
thick layer was used. The remaining thickness of the old HMA was unknown.
The thickness of the old HMA layer was calculated using the M-EPDG to
result in a failure in 20-30 of one or more performance parameters. The mix
properties are shown below. Figure 5-13 shows the trial section used for
analysis.
• Layer 1: For the HMA overlay, level 3 default input parameters were used
with a PG 76-28 asphalt.
• Layer 2: For the CIR layer, level 1 input parameters were used. The
dynamic modulus for each type of emulsions obtained in lab were used.
The binder properties required were G* and delta (δ) values which were
obtained from NCAT lab. The default inputs for thermal properties were
used.
• Layer 3: For existing HMA section level 1 input parameters were used.
For a existing HMA section the software only needs the gradation of the
mix and the binder properties.
• Layer 4: For the subgrade, a level 3 input was used with an assumed CL
soil for the subgrade.
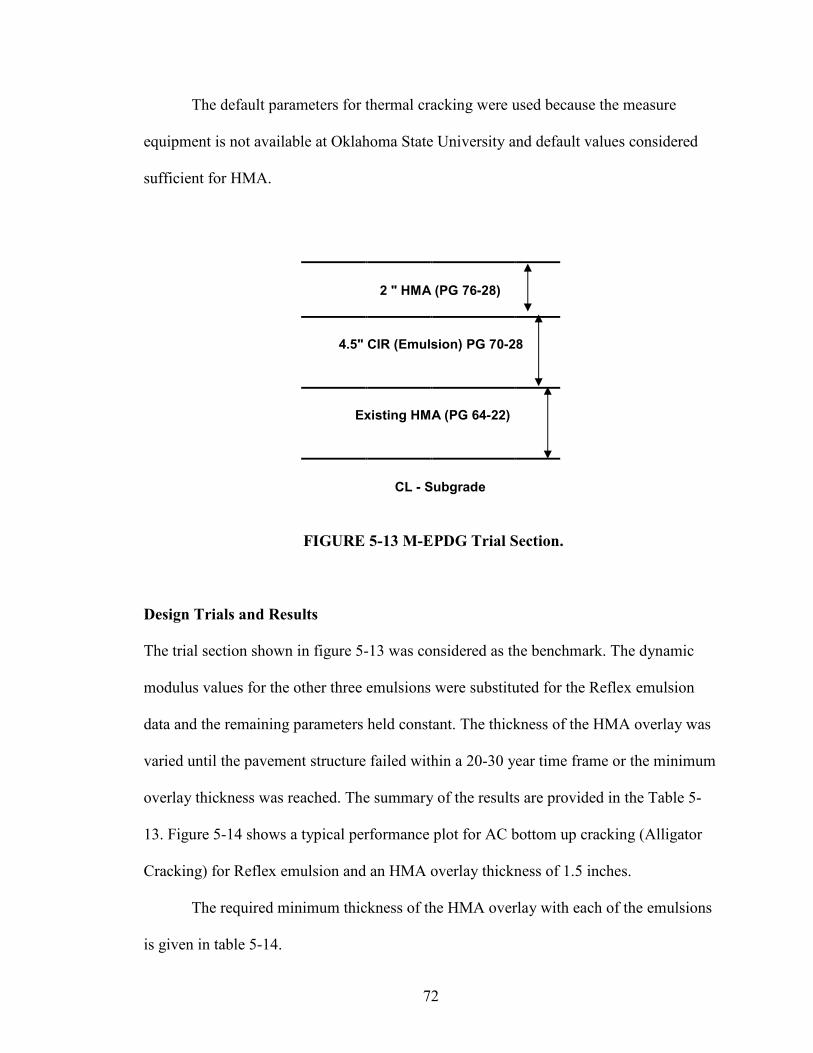
72
The default parameters for thermal cracking were used because the measure
equipment is not available at Oklahoma State University and default values considered
sufficient for HMA.
2 " HMA (PG 76-28)
4.5" CIR (Emulsion) PG 70-28
Existing HMA (PG 64-22)
CL - Subgrade
FIGURE 5-13 M-EPDG Trial Section.
Design Trials and Results
The trial section shown in figure 5-13 was considered as the benchmark. The dynamic
modulus values for the other three emulsions were substituted for the Reflex emulsion
data and the remaining parameters held constant. The thickness of the HMA overlay was
varied until the pavement structure failed within a 20-30 year time frame or the minimum
overlay thickness was reached. The summary of the results are provided in the Table 5-
13. Figure 5-14 shows a typical performance plot for AC bottom up cracking (Alligator
Cracking) for Reflex emulsion and an HMA overlay thickness of 1.5 inches.
The required minimum thickness of the HMA overlay with each of the emulsions
is given in table 5-14.
73
A trial was performed with a PG 58-28 base binder in the emulsion keeping all
the other input parameters the same to determine if this had any effect on performance
parameters. No major change in the performance was indicated. The base binder input
parameters (G*, δ) of the emulsion did not appear to have a major effect on the predicted
performance.
TABLE 5-13 Trials Run in the M-EPDG to Arrive at a Economical Thickness for HMA Overlay
IRI = Terminal IRI (in/mi), LC = AC Surface Down Cracking (Long. Cracking) (ft/mile), AC = AC Bottom Up Cracking (Alligator Cracking) (%), TC = AC Thermal Fracture (Transverse Cracking) (ft/mi), R = Permanent Deformation (Total Pavement) (in) √ = Pass, X = fail
Pavement Distresses Trial No. Emulsions
HMA Overlay
Thickness IRI LC AC TC R
1 Reflex 2.00" √ √ √ √ √
2 Reflex 1.75" √ √ √ √ √
3 Reflex 1.50" √ √ X √ √
4 CSS - 1h 2.00" √ √ √ √ √
5 CSS - 1h 1.75" √ √ √ √ √
6 CSS - 1h 1.50" √ √ √ √ √
7 CSS - 1h 1.25" √ √ √ √ √
8 CSS - 1h 1.00" √ √ X √ √
9 CSS-1h+Lime 2.00" √ √ √ √ √
10 CSS-1h+Lime 1.75" √ √ √ √ √
11 CSS-1h+Lime 1.50" √ √ √ √ √
12 CSS-1h+Lime 1.25" √ √ √ √ √
13 CSS-1h+Lime 1.00" √ √ √ √ √
14 HFE-150P 2.00" √ √ √ √ √
15 HFE-150P 1.75" √ √ √ √ √
16 HFE-150P 1.50" √ √ √ √ √
17 HFE-150P 1.25" √ √ √ √ √
18 HFE-150P 1.00" √ √ √ √ √
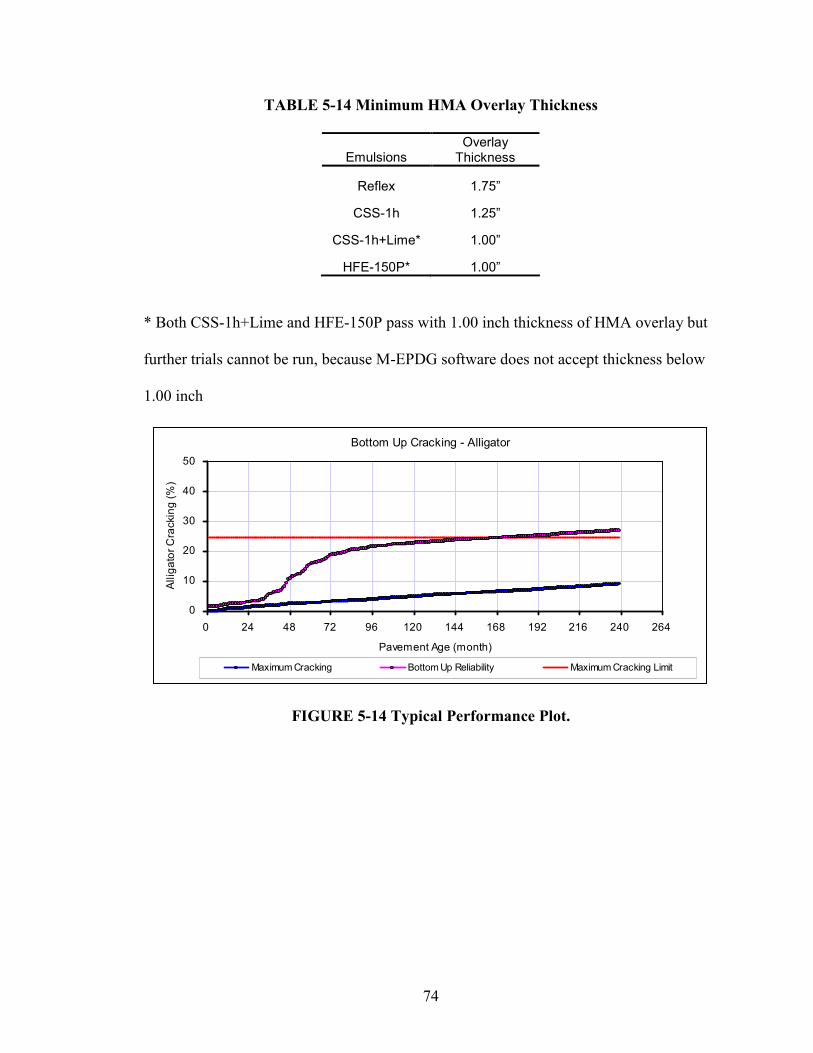
74
TABLE 5-14 Minimum HMA Overlay Thickness
Emulsions Overlay
Thickness
Reflex 1.75”
CSS-1h 1.25”
CSS-1h+Lime* 1.00”
HFE-150P* 1.00”
* Both CSS-1h+Lime and HFE-150P pass with 1.00 inch thickness of HMA overlay but
further trials cannot be run, because M-EPDG software does not accept thickness below
1.00 inch
Bottom Up Cracking - Alligator
0
10
20
30
40
50
0 24 48 72 96 120 144 168 192 216 240 264
Pavement Age (month)
Allig
ator
Cra
ckin
g(%
)
Maximum Cracking Bottom Up Reliability Maximum Cracking Limit
FIGURE 5-14 Typical Performance Plot.
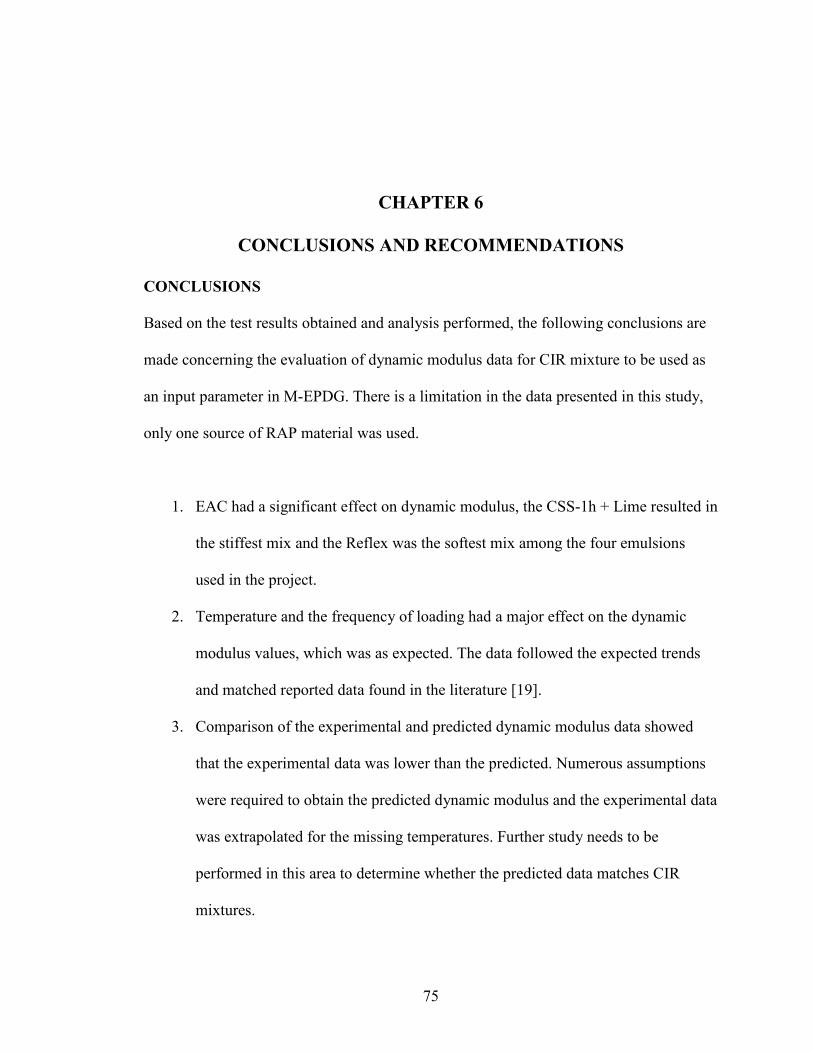
75
CHAPTER 6
CONCLUSIONS AND RECOMMENDATIONS
CONCLUSIONS
Based on the test results obtained and analysis performed, the following conclusions are
made concerning the evaluation of dynamic modulus data for CIR mixture to be used as
an input parameter in M-EPDG. There is a limitation in the data presented in this study,
only one source of RAP material was used.
1. EAC had a significant effect on dynamic modulus, the CSS-1h + Lime resulted in
the stiffest mix and the Reflex was the softest mix among the four emulsions
used in the project.
2. Temperature and the frequency of loading had a major effect on the dynamic
modulus values, which was as expected. The data followed the expected trends
and matched reported data found in the literature [19].
3. Comparison of the experimental and predicted dynamic modulus data showed
that the experimental data was lower than the predicted. Numerous assumptions
were required to obtain the predicted dynamic modulus and the experimental data
was extrapolated for the missing temperatures. Further study needs to be
performed in this area to determine whether the predicted data matches CIR
mixtures.
76
4. Witczak’s equation can be used for CIR. By assuming that RAP is a “Black
Rock” with negligible absorption, meaning Gse of the RAP can be used for Gsb to
determine the volumetric properties of the mixture. The as received gradation of
the RAP is used as aggregate gradation in the predictive equation.
5. Emulsion type had an effect on the thickness of the HMA overlay
RECOMMENDATIONS
1. Numerous assumptions were required to use CIR in the M-EPDG. These
assumptions need to be evaluated before the design guide can be used with
confidence. More research needs to be performed with different sources of RAP
to determine the effect of RAP, and the aggregate type in the RAP, on the
dynamic modulus.
2. Numerous binder input parameters are required to use the M-EPDG. These are
difficult to obtain because the binder in the RAP is already blended and oxidized
and cannot be easily recovered to determine the required input parameters. The
effect of the asphalt properties on the pavement performance from M-EPDG
needs to be evaluated.
3. There were occasionally problems with the software crashing and providing
inconsistent results with the same scenario. It is recommended that each scenario
or trial be run at least twice to verify the output for use.
The following recommendations are made for preparation and testing of CIR samples for
dynamic modulus testing
1. During CIR dynamic modulus sample preparation, mix water contents need to be
carefully measured as it influences mixing and workability of the mixture.

77
Another important point to remember during sample preparation is to stir the
emulsion completely to mix the settled asphalt or polymer.
2. Extra care should be taken when coring and sawing the CIR samples since they
are softer than HMA samples and can be easily damaged.
3. For the dynamic modulus testing, test chamber temperature and test specimen
temperature needs to be maintained and monitored within the tolerance limits as
temperature has a major effect on dynamic modulus.

78
REFERENCES
1. Mechanistic Empirical Pavement Design Guide. 1-37A NCHRP.
http://www.trb.org/mepdg/. Accessed June 15, 2006.
2. “Determining Dynamic Modulus of Hot-Mix Asphalt Concrete Mixtures, AASHTO
Designation: TP 62.” Standard Specifications for Transportation Materials and
Methods of Sampling and Testing, Twenty-fifth Edition, Part II A, Tests, American
Association of State Highway and Transportation Officials, Washington, D.C., 2005.
3. Hot Mix Asphalt Materials, Mixture Design and Construction. 2nd Edition, Roberts et
al., NAPA Education Foundation, Lanham, MD 1996.
4. Basic Asphalt Recycling Manual, Publication No. NHI01-022, Asphalt Recycling and
Reclaiming Association (ARRA), Annapolis, MD, 2001.
5. Epps, J., Cold-Recycled Bituminous Concrete Using Bituminous Materials, National
Cooperative Highway Research Program (NCHRP) Synthesis of Highway Practice
160, University of Nevada-Reno, Nevada, 1990.
6. Kandhal, P., and Malick, R., Pavement Recycling Guidelines for State and Local
Governments – Participant’s Reference Book, Report No. FHWA-SA-98-042,
Federal Highway Administration, Washington, D.C., 1997.
7. AASHTO-AGC-ARTBA Joint Committee, Task Force No. 38, “Report on Cold
Recycling of Asphalt Pavements,” American Association of State Highway and
Transportation Officials, Washington, D.C., 1998.
79
8. Landers, K., “Deep Rehab for Distressed Pavements,” Better Roads Magazine, July
Issue, Des Plaines, IL, 2002.
9. Kearney E., “Cold Mix Recycling: State of the Practice,” Journal of the Association
of Asphalt Paving Technologists, Volume 66, pp 760-802, Salt Lake City, UT, 1997.
10. Suleiman, Nabil., “A State-of-the-Art Review of Cold in-Place Recycling of Asphalt
Pavements in the Northern Plains Region” North Dakota Department of
Transportation, Bismarck, ND.
11. A Basic Asphalt Emulsion Manual. Manual Series No. 19 (MS-19), Third Edition,
The Asphalt Institute, Lexington, KY.
12. Lee, K., Brayton, T., Gress, D., and Harrington, J., “Laboratory Evaluation of Mix-
Design Methods for Cold In-Place Recycling,” MatCong5-5th Materials Engineering
Congress. ASCE Materials Engineering Division, American Society of Civil
Engineers, Racine, Virginia, 1999.
13. Lauter K. and Corbett M., “Developing Gyratory Compactor Guidelines for Use with
Cold In-Place Recycled Material,” Proceedings, Canadian Technical Asphalt
Association, Polyscience Publications, Inc., Morin Heights, Quebec, 1998.
14. Cross, Stephen A. Determination of Ndesign for CIR Mixtures Using the Superpave
Gyratory Compactor. RMRC Research Project No. 15. Recycled Materials Resource
Center, University of New Hampshire, Durham, New Hampshire, April 2002, 82 pp.
15. Koch Pavement Solutions: ReFlex Emulsion Cold In-place Recycling, Koch
Materials Company, Salina, KS, 2002.
80
16. “Residue by Evaporation of Asphalt Emulsion, Colorado Procedure – Laboratory
2212.” Laboratory Manual of Test Procedures 2005, Colorado Department of
Transportation, Denver, CO., 2005.
17. “5.18.04 Mix Design Procedures for CIR Material.” KDOT Construction Manual,
Part V – Materials, Kansas Department of Transportation, Topeka, KS, 2005.
18. Tran, Nam H., “Investigation of the Simple Performance Test for Measuring HMA
Dynamic Modulus”, University of Arkansas, Fayetteville, Arkansas, August 2003.
19. May, Richard W., “Implementation of the 200X AASHTO Guide- CIR”. Presented at
a workshop by SemMaterials at Wichita, KS on September 13, 2005.
VITA
Yatish Arvind Jakatimath
Candidate for the Degree of
Master of Science
Thesis: EVALUATION OF COLD IN-PLACE RECYCLING FOR REHABILITATION OF TRANSVERSE CRACKING ON US 412
Major Field: Civil Engineering Biographical:
Personal Data: Born in Dharwad, India, On July 4, 1977, the son of Arvind and Anupama Jakatimath.
Education: Graduated from St. Xavier’s High School, Belgaum, India in May
1993; received Bachelor of Science degree in Civil Engineering from Karnatak University, Dharwad, India in October 2000. Completed the requirements for the Master of Science degree with a major in Civil Engineering at Oklahoma State University in May 2007.
Experience: Raised in a family with engineering background in Belgaum, India;
employed as a intern during summer; worked as a field engineer for two years after Bachelor’s; employed by Oklahoma State University , Department of Civil and Environmental Engineering as a graduate research assistant; employed by Terracon Consultants, Inc. as a Project Manager February, 2007 to present.
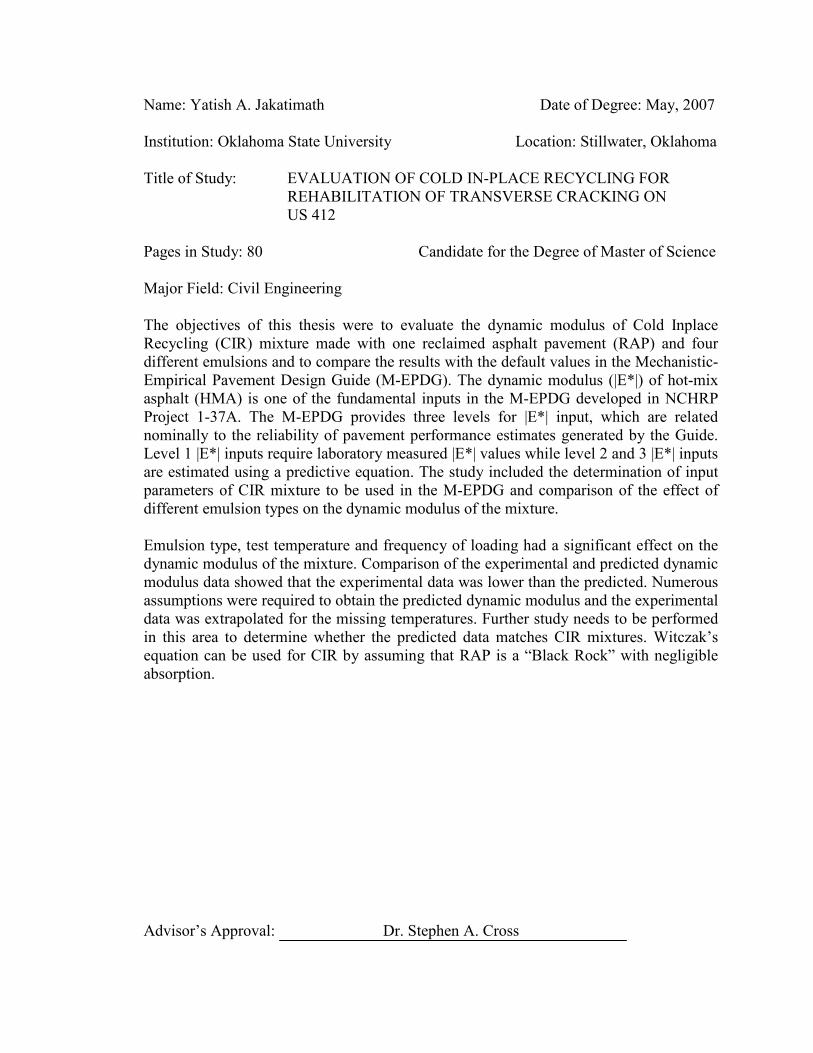
Name: Yatish A. Jakatimath Date of Degree: May, 2007 Institution: Oklahoma State University Location: Stillwater, Oklahoma Title of Study: EVALUATION OF COLD IN-PLACE RECYCLING FOR
REHABILITATION OF TRANSVERSE CRACKING ON US 412
Pages in Study: 80 Candidate for the Degree of Master of Science Major Field: Civil Engineering The objectives of this thesis were to evaluate the dynamic modulus of Cold Inplace Recycling (CIR) mixture made with one reclaimed asphalt pavement (RAP) and four different emulsions and to compare the results with the default values in the Mechanistic-Empirical Pavement Design Guide (M-EPDG). The dynamic modulus (|E*|) of hot-mix asphalt (HMA) is one of the fundamental inputs in the M-EPDG developed in NCHRP Project 1-37A. The M-EPDG provides three levels for |E*| input, which are related nominally to the reliability of pavement performance estimates generated by the Guide. Level 1 |E*| inputs require laboratory measured |E*| values while level 2 and 3 |E*| inputs are estimated using a predictive equation. The study included the determination of input parameters of CIR mixture to be used in the M-EPDG and comparison of the effect of different emulsion types on the dynamic modulus of the mixture. Emulsion type, test temperature and frequency of loading had a significant effect on the dynamic modulus of the mixture. Comparison of the experimental and predicted dynamic modulus data showed that the experimental data was lower than the predicted. Numerous assumptions were required to obtain the predicted dynamic modulus and the experimental data was extrapolated for the missing temperatures. Further study needs to be performed in this area to determine whether the predicted data matches CIR mixtures. Witczak’s equation can be used for CIR by assuming that RAP is a “Black Rock” with negligible absorption.
Advisor’s Approval: Dr. Stephen A. Cross