Embed Size (px)
Citation preview
WORLD STEEL IN FIGURES 2017

TABLE OF CONTENTS
This year we are celebrating our 50th anniversary but of course this publication will largely report on last year 2016. Much has changed in 50 years – back in 1967, the world produced just less than 500 million tonnes of steel. In 2016, the world produced just over 1,600 million tonnes. Most of the growth came from new industrialising nations – Brazil, China, India, Iran and Mexico.
Steel as a product is so versatile and fundamental to our lives that it is considered essential to economic growth. Consequently, for most of the past 50 years, the world has been producing increasingly more steel and sometimes more than was actually required – while at the same time, making the product universally affordable and promoting intense competition between its producers.
In the global markets we operate in, fierce competition for trade will remain, with the present push to protect domestic markets probably continuing for the next few years. But we believe that it is crucial for policies to continue to promote a level playing field between countries and regions. Trade based on free and fair access to markets have served society best in providing steel to build our economies at most affordable terms.
On page 4 and 5 you will find a spread outlining the many programmes we have managed since our start. It is interesting to note that innovation, sustainability and environmental standards have figured prominently as far back as 1967. The steel industry has always been at the forefront of driving efficiency and improvement through its manufacturing process and this will continue over the next 50 years.
This booklet provides a comprehensive overview of steel industry activities, stretching from production to steel use to some indications of global trade flows. If you have any comments, please do not hesitate to contact me.
FOREWORD
Dr Edwin Basson
Director General
Foreword ...........................................................................................3 Celebrating 50 years of the World Steel Association ............................4
CRUDE STEEL PRODUCTION World crude steel production, 1950 to 2016 ........................................7 Top steelmakers, 2016........................................................................8 Major steel-producing countries, 2015 and 2016 .................................9 Crude steel production by process, 2016 .......................................... 10
Continuously-cast steel output, 2014 to 2016 ................................... 11
Monthly crude steel production, 2013 to 2016 ................................... 12
STEEL USE Steel production and use: geographical distribution, 2006 ................. 14
Steel production and use: geographical distribution, 2016 ................. 15
Apparent steel use, 2010 to 2016...................................................... 16
Apparent steel use per capita, 2010 to 2016 ..................................... 17
RAW MATERIALS Pig iron, 2015 and 2016 .................................................................... 18
Direct reduced iron production, 2009 to 2016 ................................... 19
Iron ore, 2015 ...................................................................................20
World iron ore trade by area, 2016 .................................................... 21
Trade in ferrous scrap, 2015 and 2016 ..............................................22
World trade in ferrous scrap by area, 2016 ........................................ 23
STEEL TRADE World steel trade in products, 1975 to 2016 ....................................... 24
World volume of trade, 2000 to 2016 ................................................ 24
World steel exports, analysis by product, 2011 to 2016 ...................... 25
World steel trade by area, 2016 ......................................................... 26
Major importers and exporters of steel, 2016 ..................................... 27
INDIRECT TRADE Indirect trade in steel, 2000 to 2015 .................................................. 28
Major indirect importers and exporters of steel, 2015 ......................... 28
True steel use, 2009 to 2015 ............................................................29
Apparent and true steel use per capita, 2015 ....................................29
For details on the notation used in this publication, please refer to page 30.
3
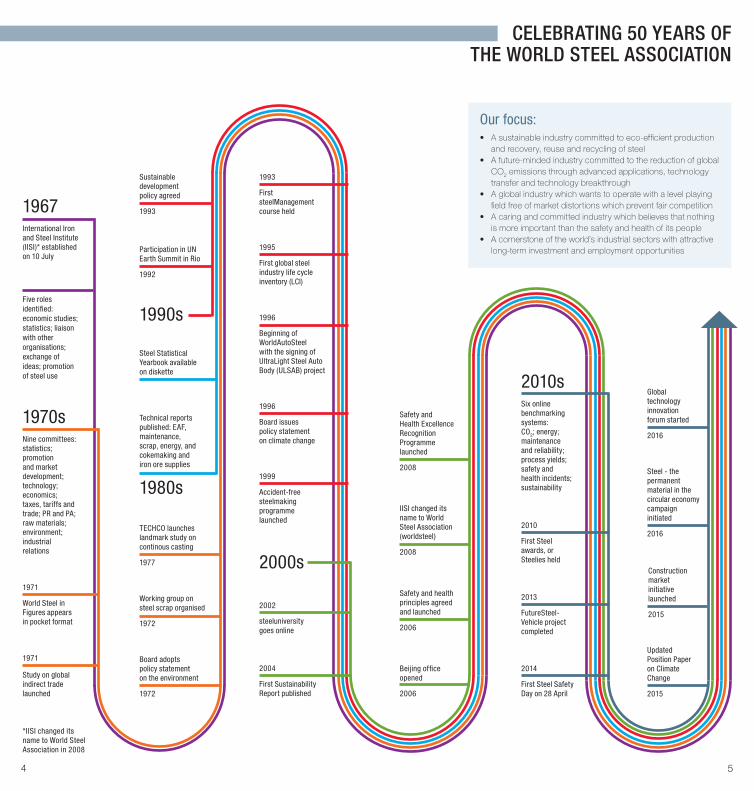
CELEBRATING 50 YEARS OF THE WORLD STEEL ASSOCIATION
International Iron and Steel Institute (IISI)* established on 10 July
Five roles identified: economic studies; statistics; liaison with other organisations; exchange of ideas; promotion of steel use
Nine committees: statistics; promotion and market development; technology; economics; taxes, tariffs and trade; PR and PA; raw materials; environment; industrial relations
Six online benchmarking systems: CO2; energy; maintenance and reliability; process yields; safety and health incidents; sustainability
Technical reports published: EAF, maintenance, scrap, energy, and cokemaking and iron ore supplies
1971
World Steel in Figures appears in pocket format
1971
Study on global indirect trade launched
Global technology innovation forum started
2016
Steel - the permanent material in the circular economy campaign initiated
2016
Steel Statistical Yearbook available on diskette
Board adopts policy statement on the environment
1972
Working group on steel scrap organised
1972
2002
steeluniversity goes online
2004
First Sustainability Report published
Safety and health principles agreed and launched
2006
Beijing office opened
2006
IISI changed its name to World Steel Association (worldsteel)
2008
Safety and Health Excellence Recognition Programme launched
2008
Participation in UN Earth Summit in Rio
1992
2010
First Steel awards, or Steelies held
2013
FutureSteel-Vehicle project completed
2014
First Steel Safety Day on 28 April
Updated Position Paper on Climate Change
2015
Construction market initiative launched
2015
Sustainable development policy agreed
1993
1996
Beginning of WorldAutoSteel with the signing of UltraLight Steel Auto Body (ULSAB) project
1996
Board issues policy statement on climate change
1999
Accident-free steelmaking programme launched
1995
First global steel industry life cycle inventory (LCI)
1993
First steelManagement course held1967
1970s
2010s
1980s
1990s
2000s
*IISI changed its name to World Steel Association in 2008
• A sustainable industry committed to eco-efficient productionand recovery, reuse and recycling of steel
• A future-minded industry committed to the reduction of globalCO2 emissions through advanced applications, technology transfer and technology breakthrough
• A global industry which wants to operate with a level playing field free of market distortions which prevent fair competition
• A caring and committed industry which believes that nothingis more important than the safety and health of its people
• A cornerstone of the world’s industrial sectors with attractivelong-term investment and employment opportunities
Our focus:
TECHCO launches landmark study on continous casting
1977
4 5

WORLD CRUDE STEEL PRODUCTION 1950 TO 2016
Years World1950 189
1955 270
1960 347
1965 456
1970 595
1975 644
1980 717
1985 719
1990 770
1995 753
1996 751
Years World1997 800
1998 779
1999 790
2000 850
2001 852
2002 905
2003 971
2004 1 063
2005 1 148
2006 1 250
2007 1 348
Years World2008 1 343
2009 1 239
2010 1 433
2011 1 538
2012 1 560
2013 1 650
2014 1 670
2015 1 620
2016 1 630
2000 2010199019801970196019500
200
400
600
800
1 000
1 200
1 400
1 600
1 800
million tonnesmillion tonnes crude steel production, 1967, 2000, 2016
Average growth rates % per annum
Years World
1950-551955-601960-651965-701970-751975-801980-851985-901990-951995-002000-052005-102010-152015-16
7.45.15.65.51.62.20.11.4
-0.52.56.24.52.50.6
Europe33.5%
Former U.S.S.R.20.7%
North America25.8%
South America 1.4%
Africa & Middle East
0.8%
China2.1%
India1.3%
Japan12.6%
South Korea0.1%
Other Asia & Oceania1.7%1967
2000
Europe12.3%
C.I.S.6.3%
North America6.8%
South America2.5%
Africa & Middle East2.7%
China49.6%
India5.9%
Japan6.4%
South Korea4.2%
Other Asia & Oceania3.4%
2016
Europe24.7%
C.I.S.11.6%
North America15.9%
South America4.6%
Africa & Middle East
2.9%
China15.1%
India3.2%
Japan12.5%
South Korea5.1%
Other Asia & Oceania4.4%
World total493
World total850
World total1 630
CELEBRATING 50 YEARS OF THE WORLD STEEL ASSOCIATION
6 7
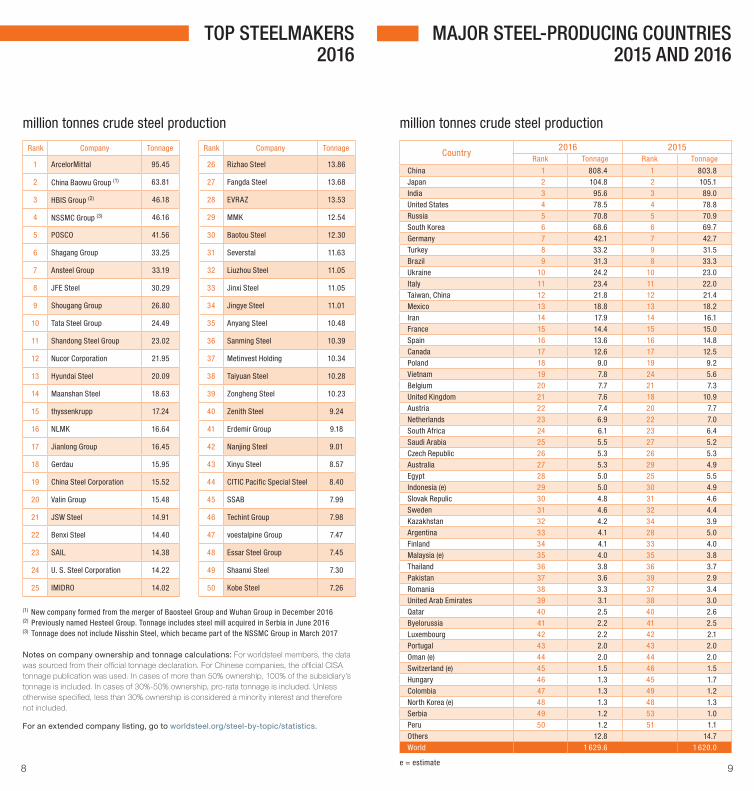
MAJOR STEEL-PRODUCING COUNTRIES 2015 AND 2016
million tonnes crude steel production
Country2016 2015
Rank Tonnage Rank Tonnage
China 1 808.4 1 803.8Japan 2 104.8 2 105.1India 3 95.6 3 89.0United States 4 78.5 4 78.8Russia 5 70.8 5 70.9South Korea 6 68.6 6 69.7Germany 7 42.1 7 42.7Turkey 8 33.2 9 31.5Brazil 9 31.3 8 33.3Ukraine 10 24.2 10 23.0Italy 11 23.4 11 22.0Taiwan, China 12 21.8 12 21.4Mexico 13 18.8 13 18.2Iran 14 17.9 14 16.1France 15 14.4 15 15.0Spain 16 13.6 16 14.8Canada 17 12.6 17 12.5Poland 18 9.0 19 9.2Vietnam 19 7.8 24 5.6Belgium 20 7.7 21 7.3United Kingdom 21 7.6 18 10.9Austria 22 7.4 20 7.7Netherlands 23 6.9 22 7.0South Africa 24 6.1 23 6.4Saudi Arabia 25 5.5 27 5.2Czech Republic 26 5.3 26 5.3Australia 27 5.3 29 4.9Egypt 28 5.0 25 5.5Indonesia (e) 29 5.0 30 4.9Slovak Repulic 30 4.8 31 4.6Sweden 31 4.6 32 4.4Kazakhstan 32 4.2 34 3.9Argentina 33 4.1 28 5.0Finland 34 4.1 33 4.0Malaysia (e) 35 4.0 35 3.8Thailand 36 3.8 36 3.7Pakistan 37 3.6 39 2.9Romania 38 3.3 37 3.4United Arab Emirates 39 3.1 38 3.0Qatar 40 2.5 40 2.6Byelorussia 41 2.2 41 2.5Luxembourg 42 2.2 42 2.1Portugal 43 2.0 43 2.0Oman (e) 44 2.0 44 2.0Switzerland (e) 45 1.5 46 1.5Hungary 46 1.3 45 1.7Colombia 47 1.3 49 1.2North Korea (e) 48 1.3 48 1.3Serbia 49 1.2 53 1.0Peru 50 1.2 51 1.1Others 12.8 14.7World 1 629.6 1 620.0
TOP STEELMAKERS 2016
million tonnes crude steel production
Rank Company Tonnage Rank Company Tonnage
1 ArcelorMittal 95.45 26 Rizhao Steel 13.86
2 China Baowu Group (1) 63.81 27 Fangda Steel 13.68
3 HBIS Group (2) 46.18 28 EVRAZ 13.53
4 NSSMC Group (3) 46.16 29 MMK 12.54
5 POSCO 41.56 30 Baotou Steel 12.30
6 Shagang Group 33.25 31 Severstal 11.63
7 Ansteel Group 33.19 32 Liuzhou Steel 11.05
8 JFE Steel 30.29 33 Jinxi Steel 11.05
9 Shougang Group 26.80 34 Jingye Steel 11.01
10 Tata Steel Group 24.49 35 Anyang Steel 10.48
11 Shandong Steel Group 23.02 36 Sanming Steel 10.39
12 Nucor Corporation 21.95 37 Metinvest Holding 10.34
13 Hyundai Steel 20.09 38 Taiyuan Steel 10.28
14 Maanshan Steel 18.63 39 Zongheng Steel 10.23
15 thyssenkrupp 17.24 40 Zenith Steel 9.24
16 NLMK 16.64 41 Erdemir Group 9.18
17 Jianlong Group 16.45 42 Nanjing Steel 9.01
18 Gerdau 15.95 43 Xinyu Steel 8.57
19 China Steel Corporation 15.52 44 CITIC Pacific Special Steel 8.40
20 Valin Group 15.48 45 SSAB 7.99
21 JSW Steel 14.91 46 Techint Group 7.98
22 Benxi Steel 14.40 47 voestalpine Group 7.47
23 SAIL 14.38 48 Essar Steel Group 7.45
24 U. S. Steel Corporation 14.22 49 Shaanxi Steel 7.30
25 IMIDRO 14.02 50 Kobe Steel 7.26
(1) New company formed from the merger of Baosteel Group and Wuhan Group in December 2016(2) Previously named Hesteel Group. Tonnage includes steel mill acquired in Serbia in June 2016(3) Tonnage does not include Nisshin Steel, which became part of the NSSMC Group in March 2017
Notes on company ownership and tonnage calculations: For worldsteel members, the data was sourced from their official tonnage declaration. For Chinese companies, the official CISA tonnage publication was used. In cases of more than 50% ownership, 100% of the subsidiary’s tonnage is included. In cases of 30%-50% ownership, pro-rata tonnage is included. Unless otherwise specified, less than 30% ownership is considered a minority interest and therefore not included.
For an extended company listing, go to worldsteel.org/steel-by-topic/statistics.
e = estimate8 9

CRUDE STEEL PRODUCTION BY PROCESS, 2016
Million tonnes
Oxygen % Electric %
Open hearth %
Other %
Total %
Austria 7.4 91.0 9.0 - - 100.0Belgium 7.7 69.3 30.7 - - 100.0Bulgaria 0.5 - 100.0 - - 100.0Croatia 0.0 - 100.0 - - 100.0Czech Republic 5.3 94.4 5.6 - - 100.0Finland 4.1 67.1 32.9 - - 100.0France 14.4 66.1 33.9 - - 100.0Germany 42.1 70.1 29.9 - - 100.0Greece 1.2 - 100.0 - - 100.0Hungary 1.3 81.8 18.2 - - 100.0Italy 23.4 24.3 75.7 - - 100.0Luxembourg 2.2 - 100.0 - - 100.0Netherlands 6.9 98.7 1.3 - - 100.0Poland 9.0 56.8 43.2 - - 100.0Portugal 2.0 - 100.0 - - 100.0Romania (e) 3.3 57.1 42.9 - - 100.0Slovak Republic 4.8 93.7 6.3 - - 100.0Slovenia 0.6 - 100.0 - - 100.0Spain 13.6 33.9 66.1 - - 100.0Sweden 4.6 67.3 32.7 - - 100.0United Kingdom 7.6 80.6 19.4 - - 100.0European Union (28) 162.0 60.3 39.7 - - 100.0Turkey 33.2 34.1 65.9 - - 100.0Others 4.5 44.1 55.9 - - 100.0Other Europe 37.7 35.3 64.7 - - 100.0Russia 70.8 66.9 30.8 2.4 - 100.0Ukraine 24.2 71.7 6.8 21.4 - 100.0Other CIS 7.3 56.9 43.1 - - 100.0CIS 102.4 67.3 26.0 6.7 - 100.0Canada 12.6 55.4 44.6 - - 100.0Mexico 18.8 26.2 73.8 - - 100.0United States 78.5 33.0 67.0 - - 100.0NAFTA 109.9 34.4 65.6 - - 100.0Argentina 4.1 56.7 43.3 - - 100.0Brazil 31.3 77.3 21.1 - 1.6 100.0Chile 1.2 70.7 29.3 - - 100.0Venezuela 0.6 - 100.0 - - 100.0Others 3.8 7.3 92.7 - - 100.0Central and South America 40.9 67.5 31.3 - 1.2 100.0Egypt (e) 5.0 11.4 88.6 - - 100.0South Africa 6.1 62.2 37.8 - - 100.0Other Africa (e) 1.9 33.8 65.9 - 0.3 100.0Africa 13.1 38.5 61.4 - 0.0 100.0Iran 17.9 12.2 87.8 - - 100.0Saudi Arabia 5.5 - 100.0 - - 100.0Other Middle East (e) 8.1 - 100.0 - - 100.0Middle East 31.5 6.9 93.1 - - 100.0China (e) 808.4 94.8 5.2 - - 100.0India 95.6 42.7 57.3 - - 100.0Japan 104.8 77.8 22.2 - - 100.0South Korea 68.6 69.3 30.7 - - 100.0Taiwan, China 21.8 64.2 35.8 - - 100.0Other Asia (e) 25.9 6.9 93.1 - - 100.0Asia 1 125.0 84.6 15.4 - - 100.0Australia 5.3 75.7 24.3 - - 100.0New Zealand 0.6 100.0 - - - 100.0Total of above countries 1 628.3 74.3 25.3 0.4 0.0 100.0
The countries in this table accounted for more than 99% of world crude steel production in 2016
CONTINUOUSLY-CAST STEEL OUTPUT2014 TO 2016
Million tonnes % Crude steel output
2014 2015 2016 2014 2015 2016Austria 7.6 7.4 7.2 96.3 96.6 96.6Belgium 7.3 7.3 7.7 100.0 100.0 100.0Bulgaria 0.6 0.5 0.5 100.0 100.0 100.0Croatia 0.2 0.1 - 100.0 100.0 -Czech Republic 4.9 4.8 4.9 91.6 91.2 92.6Finland 3.8 4.0 4.1 99.5 99.6 99.6France 15.5 14.4 14.0 96.2 96.3 96.9Germany 41.6 41.4 40.1 96.8 97.0 95.3Greece 1.0 0.9 1.2 100.0 100.0 100.0Hungary 1.2 1.7 1.3 100.0 100.0 100.0Italy 22.3 20.8 22.1 94.2 94.3 94.8Luxembourg 2.2 2.1 2.2 100.0 100.0 100.0Netherlands 6.8 6.9 6.8 98.2 98.5 98.7Poland 8.4 9.0 8.9 98.1 98.3 98.3Portugal 2.1 2.0 2.0 99.2 99.3 101.1Romania (e) 3.1 3.3 3.2 98.2 97.9 97.7Slovak Republic 4.7 4.6 4.8 99.8 99.8 99.8Slovenia 0.5 0.5 0.5 80.2 80.1 80.7Spain 13.9 14.6 13.4 97.8 98.2 98.2Sweden 4.0 3.8 4.1 87.6 88.0 89.2United Kingdom 11.9 10.8 7.5 98.6 98.6 98.7European Union (28) 163.6 160.9 156.5 96.6 96.8 96.6Turkey 34.0 31.5 33.2 100.0 100.0 100.0Others 4.3 4.2 4.5 99.8 99.7 99.7Other Europe 38.4 35.8 37.6 100.0 100.0 100.0Russia 58.5 58.0 58.0 81.9 81.8 81.9Ukraine 14.7 11.2 11.8 54.1 48.9 48.8Other CIS 7.4 7.7 7.3 99.9 99.9 99.9CIS 80.6 76.9 77.1 76.0 75.7 75.4Canada 12.5 12.2 9.9 98.0 97.6 78.2Mexico 18.9 18.2 18.8 99.9 99.9 99.8United States 86.9 78.1 78.0 98.5 99.0 99.4NAFTA 118.3 108.5 106.7 98.7 99.0 97.0Argentina 5.5 5.0 4.1 99.7 99.7 99.7Brazil 33.4 32.9 30.9 98.5 99.0 98.7Venezuela 1.5 1.3 0.6 100.0 100.0 100.0Other Latin America 5.4 5.7 5.0 100.0 100.0 100.0Central and South America 45.8 44.9 40.5 98.9 99.2 99.0Egypt (e) 6.5 5.5 5.0 100.0 100.0 100.0South Africa 6.4 6.4 6.1 99.5 99.4 100.0Other Africa (e) 2.0 1.8 1.9 99.7 99.7 99.7Africa 14.8 13.7 13.1 99.8 99.7 100.0Iran 16.3 16.1 17.9 100.0 100.0 100.0Saudi Arabia 6.3 5.2 5.5 100.0 100.0 100.0Other Middle East (e) 7.4 8.0 8.1 99.9 99.9 99.9Middle East 30.0 29.4 31.5 100.0 100.0 100.0China (e) 809.0 789.9 795.0 98.3 98.3 98.3India (e) 72.3 75.0 82.0 82.8 84.2 85.8Japan (e) 108.9 103.5 103.2 98.4 98.4 98.5South Korea 70.4 68.7 67.7 98.4 98.6 98.7Taiwan, China 23.0 21.3 21.7 99.6 99.6 99.6Other Asia (e) 20.6 22.6 25.9 89.5 100.0 100.0Asia 1 104.3 1 076.0 1 095.4 97.0 97.2 97.4Australia 4.6 4.9 5.2 99.4 99.5 99.4New Zealand 0.9 0.8 0.6 100.0 100.0 100.0Total of above countries 1 601.2 1 556.6 1 564.2 96.0 96.2 96.1
The countries in this table accounted for more than 99% of world crude steel production in 2016e = estimate e = estimate
10 11

NAFTA
Central and South America
Japan
China
million tonnes
MONTHLY CRUDE STEEL PRODUCTION 2013 TO 2016
2013 2014 2015 2016115
125
135
145
actual data deseasonalised data
2013 2014 2015 20168
9
10
11
12
actual data deseasonalised data
2013 2014 2015 20163.0
3.5
4.0
4.5
5.0
actual data deseasonalised data
2013 2014 2015 20167.5
8.0
8.5
9.0
9.5
10.0
actual data deseasonalised data
2013 2014 2015 20168.0
8.5
9.0
9.5
10.0
actual data deseasonalised data
2013 2014 2015 201645
55
65
75
85
actual data deseasonalised data
2013 2014 2015 201611
13
15
17
actual data deseasonalised data
*The 66 reporting countriesArgentina, Australia, Austria, Belgium, Bosnia-Herzegovina, Brazil, Bulgaria, Byelorussia, Canada, Chile, China, Colombia, Croatia, Cuba, Czech Republic, Ecuador, Egypt, El Salvador, Finland, France, Germany, Greece, Guatemala, Hungary, India, Iran, Italy, Japan, Kazakhstan, Latvia, Libya, Luxembourg, Macedonia, Mexico, Moldova, Morocco, Netherlands, New Zealand, Norway, Pakistan, Paraguay, Peru, Poland, Portugal, Qatar, Romania, Russia, Saudi Arabia, Serbia, Slovak Republic, Slovenia, South Africa, South Korea, Spain, Sweden, Taiwan, China, Thailand, Trinidad and Tobago, Turkey, Ukraine, United Arab Emirates, United Kingdom, United States, Uruguay, Uzbekistan, and Venezuela.
In 2016, these 66 countries accounted for more than 98% of world crude steel production.
Total 66 reporting countries*
European Union (28)
CIS (6)
million tonnes
12 13

STEEL PRODUCTION AND USE: GEOGRAPHICAL DISTRIBUTION
2016
Others comprise:Africa 0.8 %Middle East 1.9%
Central and South America 2.5 %Australia and New Zealand 0.4 %
Others comprise:Africa 2.5 %Middle East 3.5 %
Central and South America 2.6 %Australia and New Zealand 0.5 %
STEEL PRODUCTION AND USE: GEOGRAPHICAL DISTRIBUTION
2006
Others comprise:Africa 1.5 %Middle East 1.2 %
China33.0%
EU (28)16.7%
Others9.0%
Other Asia14.1%
Japan6.9%
CIS4.3%
NAFTA13.5%
Other Europe2.5%
China45.0%
EU (28)10.4%
Others9.1%
Other Asia16.9% NAFTA
8.7%
Japan4.1%
Other Europe2.7%
CIS3.2%
China33.6%
NAFTA10.4%
Japan9.3%
EU (28)16.6%
Others7.1%
Other Asia11.0%
CIS9.6%
Other Europe2.4%
China49.6%
NAFTA6.7%
EU (28)9.9%
Others5.6%
Other Asia13.1%
Other Europe2.3%
CIS6.3%
Japan6.4%
Apparent steel use (finished steel products)World total: 1 146 million tonnes
Apparent steel use (finished steel products)World total: 1 515 million tonnes
Crude steel productionWorld total: 1 252 million tonnes
Crude steel productionWorld total: 1 630 million tonnes
Central and South America 3.7 %Australia and New Zealand 0.7 %
Others comprise:Africa 1.9 %Middle East 3.2 %
Central and South America 3.3 %Australia and New Zealand 0.7 %
14 15
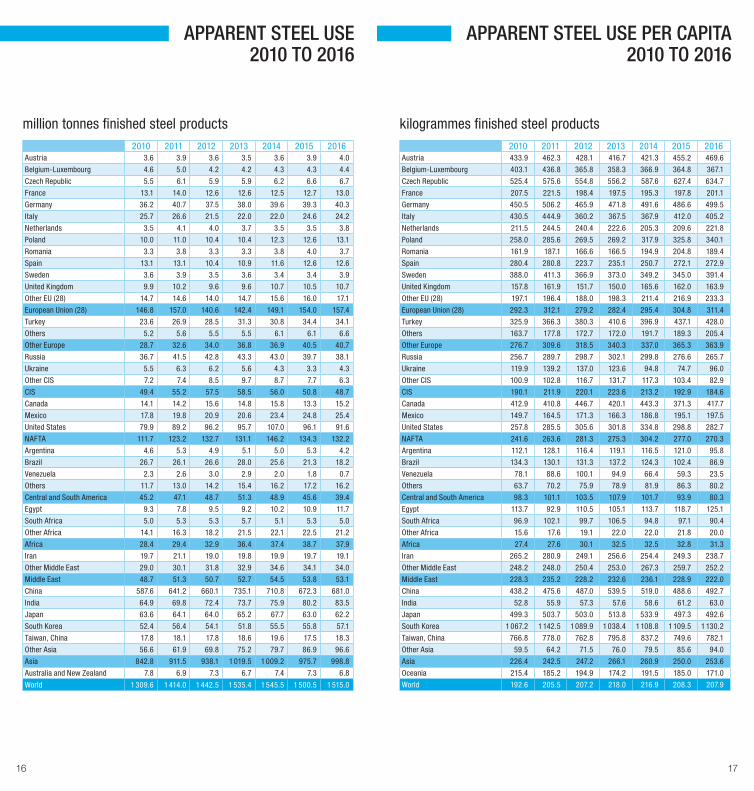
APPARENT STEEL USE PER CAPITA2010 TO 2016
kilogrammes finished steel products
APPARENT STEEL USE 2010 TO 2016
2010 2011 2012 2013 2014 2015 2016Austria 3.6 3.9 3.6 3.5 3.6 3.9 4.0
Belgium-Luxembourg 4.6 5.0 4.2 4.2 4.3 4.3 4.4
Czech Republic 5.5 6.1 5.9 5.9 6.2 6.6 6.7
France 13.1 14.0 12.6 12.6 12.5 12.7 13.0
Germany 36.2 40.7 37.5 38.0 39.6 39.3 40.3
Italy 25.7 26.6 21.5 22.0 22.0 24.6 24.2
Netherlands 3.5 4.1 4.0 3.7 3.5 3.5 3.8
Poland 10.0 11.0 10.4 10.4 12.3 12.6 13.1
Romania 3.3 3.8 3.3 3.3 3.8 4.0 3.7
Spain 13.1 13.1 10.4 10.9 11.6 12.6 12.6
Sweden 3.6 3.9 3.5 3.6 3.4 3.4 3.9
United Kingdom 9.9 10.2 9.6 9.6 10.7 10.5 10.7
Other EU (28) 14.7 14.6 14.0 14.7 15.6 16.0 17.1
European Union (28) 146.8 157.0 140.6 142.4 149.1 154.0 157.4
Turkey 23.6 26.9 28.5 31.3 30.8 34.4 34.1
Others 5.2 5.6 5.5 5.5 6.1 6.1 6.6
Other Europe 28.7 32.6 34.0 36.8 36.9 40.5 40.7
Russia 36.7 41.5 42.8 43.3 43.0 39.7 38.1
Ukraine 5.5 6.3 6.2 5.6 4.3 3.3 4.3
Other CIS 7.2 7.4 8.5 9.7 8.7 7.7 6.3
CIS 49.4 55.2 57.5 58.5 56.0 50.8 48.7
Canada 14.1 14.2 15.6 14.8 15.8 13.3 15.2
Mexico 17.8 19.8 20.9 20.6 23.4 24.8 25.4
United States 79.9 89.2 96.2 95.7 107.0 96.1 91.6
NAFTA 111.7 123.2 132.7 131.1 146.2 134.3 132.2
Argentina 4.6 5.3 4.9 5.1 5.0 5.3 4.2
Brazil 26.7 26.1 26.6 28.0 25.6 21.3 18.2
Venezuela 2.3 2.6 3.0 2.9 2.0 1.8 0.7
Others 11.7 13.0 14.2 15.4 16.2 17.2 16.2
Central and South America 45.2 47.1 48.7 51.3 48.9 45.6 39.4
Egypt 9.3 7.8 9.5 9.2 10.2 10.9 11.7
South Africa 5.0 5.3 5.3 5.7 5.1 5.3 5.0
Other Africa 14.1 16.3 18.2 21.5 22.1 22.5 21.2
Africa 28.4 29.4 32.9 36.4 37.4 38.7 37.9
Iran 19.7 21.1 19.0 19.8 19.9 19.7 19.1
Other Middle East 29.0 30.1 31.8 32.9 34.6 34.1 34.0
Middle East 48.7 51.3 50.7 52.7 54.5 53.8 53.1
China 587.6 641.2 660.1 735.1 710.8 672.3 681.0
India 64.9 69.8 72.4 73.7 75.9 80.2 83.5
Japan 63.6 64.1 64.0 65.2 67.7 63.0 62.2
South Korea 52.4 56.4 54.1 51.8 55.5 55.8 57.1
Taiwan, China 17.8 18.1 17.8 18.6 19.6 17.5 18.3
Other Asia 56.6 61.9 69.8 75.2 79.7 86.9 96.6
Asia 842.8 911.5 938.1 1 019.5 1 009.2 975.7 998.8
Australia and New Zealand 7.8 6.9 7.3 6.7 7.4 7.3 6.8
World 1 309.6 1 414.0 1 442.5 1 535.4 1 545.5 1 500.5 1 515.0
2010 2011 2012 2013 2014 2015 2016Austria 433.9 462.3 428.1 416.7 421.3 455.2 469.6
Belgium-Luxembourg 403.1 436.8 365.8 358.3 366.9 364.8 367.1
Czech Republic 525.4 575.6 554.8 556.2 587.6 627.4 634.7
France 207.5 221.5 198.4 197.5 195.3 197.8 201.1
Germany 450.5 506.2 465.9 471.8 491.6 486.6 499.5
Italy 430.5 444.9 360.2 367.5 367.9 412.0 405.2
Netherlands 211.5 244.5 240.4 222.6 205.3 209.6 221.8
Poland 258.0 285.6 269.5 269.2 317.9 325.8 340.1
Romania 161.9 187.1 166.6 166.5 194.9 204.8 189.4
Spain 280.4 280.8 223.7 235.1 250.7 272.1 272.9
Sweden 388.0 411.3 366.9 373.0 349.2 345.0 391.4
United Kingdom 157.8 161.9 151.7 150.0 165.6 162.0 163.9
Other EU (28) 197.1 196.4 188.0 198.3 211.4 216.9 233.3
European Union (28) 292.3 312.1 279.2 282.4 295.4 304.8 311.4
Turkey 325.9 366.3 380.3 410.6 396.9 437.1 428.0
Others 163.7 177.8 172.7 172.0 191.7 189.3 205.4
Other Europe 276.7 309.6 318.5 340.3 337.0 365.3 363.9
Russia 256.7 289.7 298.7 302.1 299.8 276.6 265.7
Ukraine 119.9 139.2 137.0 123.6 94.8 74.7 96.0
Other CIS 100.9 102.8 116.7 131.7 117.3 103.4 82.9
CIS 190.1 211.9 220.1 223.6 213.2 192.9 184.6
Canada 412.9 410.8 446.7 420.1 443.3 371.3 417.7
Mexico 149.7 164.5 171.3 166.3 186.8 195.1 197.5
United States 257.8 285.5 305.6 301.8 334.8 298.8 282.7
NAFTA 241.6 263.6 281.3 275.3 304.2 277.0 270.3
Argentina 112.1 128.1 116.4 119.1 116.5 121.0 95.8
Brazil 134.3 130.1 131.3 137.2 124.3 102.4 86.9
Venezuela 78.1 88.6 100.1 94.9 66.4 59.3 23.5
Others 63.7 70.2 75.9 78.9 81.9 86.3 80.2
Central and South America 98.3 101.1 103.5 107.9 101.7 93.9 80.3
Egypt 113.7 92.9 110.5 105.1 113.7 118.7 125.1
South Africa 96.9 102.1 99.7 106.5 94.8 97.1 90.4
Other Africa 15.6 17.6 19.1 22.0 22.0 21.8 20.0
Africa 27.4 27.6 30.1 32.5 32.5 32.8 31.3
Iran 265.2 280.9 249.1 256.6 254.4 249.3 238.7
Other Middle East 248.2 248.0 250.4 253.0 267.3 259.7 252.2
Middle East 228.3 235.2 228.2 232.6 236.1 228.9 222.0
China 438.2 475.6 487.0 539.5 519.0 488.6 492.7
India 52.8 55.9 57.3 57.6 58.6 61.2 63.0
Japan 499.3 503.7 503.0 513.8 533.9 497.3 492.6
South Korea 1 067.2 1 142.5 1 089.9 1 038.4 1 108.8 1 109.5 1 130.2
Taiwan, China 766.8 778.0 762.8 795.8 837.2 749.6 782.1
Other Asia 59.5 64.2 71.5 76.0 79.5 85.6 94.0
Asia 226.4 242.5 247.2 266.1 260.9 250.0 253.6
Oceania 215.4 185.2 194.9 174.2 191.5 185.0 171.0
World 192.6 205.5 207.2 218.0 216.9 208.3 207.9
million tonnes finished steel products
16 17
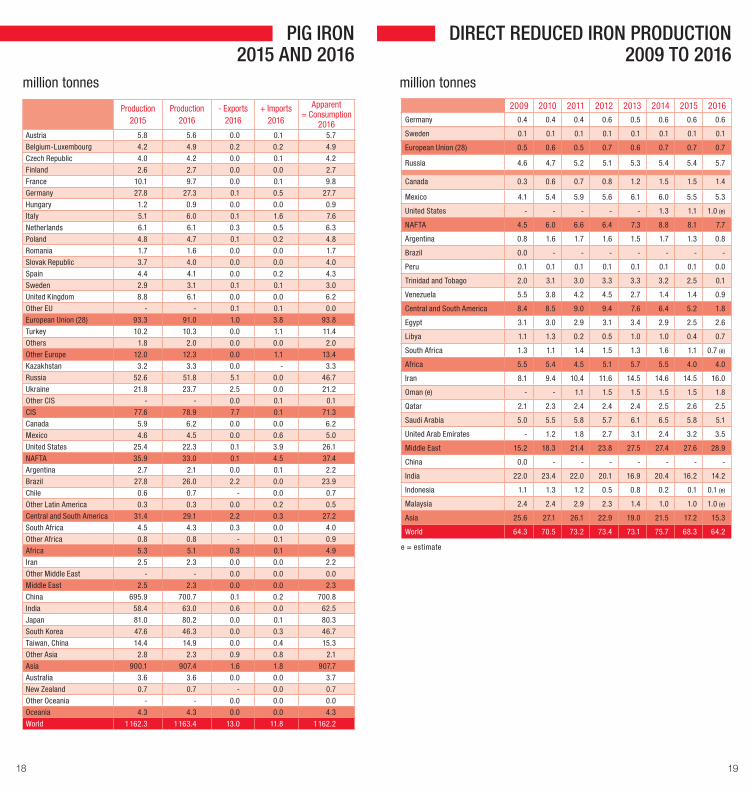
PIG IRON2015 AND 2016
million tonnes
DIRECT REDUCED IRON PRODUCTION 2009 TO 2016
2009 2010 2011 2012 2013 2014 2015 2016
Germany 0.4 0.4 0.4 0.6 0.5 0.6 0.6 0.6
Sweden 0.1 0.1 0.1 0.1 0.1 0.1 0.1 0.1
European Union (28) 0.5 0.6 0.5 0.7 0.6 0.7 0.7 0.7
Russia 4.6 4.7 5.2 5.1 5.3 5.4 5.4 5.7
Canada 0.3 0.6 0.7 0.8 1.2 1.5 1.5 1.4
Mexico 4.1 5.4 5.9 5.6 6.1 6.0 5.5 5.3
United States - - - - - 1.3 1.1 1.0 (e)
NAFTA 4.5 6.0 6.6 6.4 7.3 8.8 8.1 7.7
Argentina 0.8 1.6 1.7 1.6 1.5 1.7 1.3 0.8
Brazil 0.0 - - - - - - -
Peru 0.1 0.1 0.1 0.1 0.1 0.1 0.1 0.0
Trinidad and Tobago 2.0 3.1 3.0 3.3 3.3 3.2 2.5 0.1
Venezuela 5.5 3.8 4.2 4.5 2.7 1.4 1.4 0.9
Central and South America 8.4 8.5 9.0 9.4 7.6 6.4 5.2 1.8
Egypt 3.1 3.0 2.9 3.1 3.4 2.9 2.5 2.6
Libya 1.1 1.3 0.2 0.5 1.0 1.0 0.4 0.7
South Africa 1.3 1.1 1.4 1.5 1.3 1.6 1.1 0.7 (e)
Africa 5.5 5.4 4.5 5.1 5.7 5.5 4.0 4.0
Iran 8.1 9.4 10.4 11.6 14.5 14.6 14.5 16.0
Oman (e) - - 1.1 1.5 1.5 1.5 1.5 1.8
Qatar 2.1 2.3 2.4 2.4 2.4 2.5 2.6 2.5
Saudi Arabia 5.0 5.5 5.8 5.7 6.1 6.5 5.8 5.1
United Arab Emirates - 1.2 1.8 2.7 3.1 2.4 3.2 3.5
Middle East 15.2 18.3 21.4 23.8 27.5 27.4 27.6 28.9
China 0.0 - - - - - - -
India 22.0 23.4 22.0 20.1 16.9 20.4 16.2 14.2
Indonesia 1.1 1.3 1.2 0.5 0.8 0.2 0.1 0.1 (e)
Malaysia 2.4 2.4 2.9 2.3 1.4 1.0 1.0 1.0 (e)
Asia 25.6 27.1 26.1 22.9 19.0 21.5 17.2 15.3
World 64.3 70.5 73.2 73.4 73.1 75.7 68.3 64.2
million tonnes
Production2015
Production2016
- Exports2016
+ Imports2016
Apparent= Consumption
2016Austria 5.8 5.6 0.0 0.1 5.7
Belgium-Luxembourg 4.2 4.9 0.2 0.2 4.9
Czech Republic 4.0 4.2 0.0 0.1 4.2
Finland 2.6 2.7 0.0 0.0 2.7
France 10.1 9.7 0.0 0.1 9.8
Germany 27.8 27.3 0.1 0.5 27.7
Hungary 1.2 0.9 0.0 0.0 0.9
Italy 5.1 6.0 0.1 1.6 7.6
Netherlands 6.1 6.1 0.3 0.5 6.3
Poland 4.8 4.7 0.1 0.2 4.8
Romania 1.7 1.6 0.0 0.0 1.7
Slovak Republic 3.7 4.0 0.0 0.0 4.0
Spain 4.4 4.1 0.0 0.2 4.3
Sweden 2.9 3.1 0.1 0.1 3.0
United Kingdom 8.8 6.1 0.0 0.0 6.2
Other EU - - 0.1 0.1 0.0
European Union (28) 93.3 91.0 1.0 3.8 93.8
Turkey 10.2 10.3 0.0 1.1 11.4
Others 1.8 2.0 0.0 0.0 2.0
Other Europe 12.0 12.3 0.0 1.1 13.4
Kazakhstan 3.2 3.3 0.0 - 3.3
Russia 52.6 51.8 5.1 0.0 46.7
Ukraine 21.8 23.7 2.5 0.0 21.2
Other CIS - - 0.0 0.1 0.1
CIS 77.6 78.9 7.7 0.1 71.3
Canada 5.9 6.2 0.0 0.0 6.2
Mexico 4.6 4.5 0.0 0.6 5.0
United States 25.4 22.3 0.1 3.9 26.1
NAFTA 35.9 33.0 0.1 4.5 37.4
Argentina 2.7 2.1 0.0 0.1 2.2
Brazil 27.8 26.0 2.2 0.0 23.9
Chile 0.6 0.7 - 0.0 0.7
Other Latin America 0.3 0.3 0.0 0.2 0.5
Central and South America 31.4 29.1 2.2 0.3 27.2
South Africa 4.5 4.3 0.3 0.0 4.0
Other Africa 0.8 0.8 - 0.1 0.9
Africa 5.3 5.1 0.3 0.1 4.9
Iran 2.5 2.3 0.0 0.0 2.2
Other Middle East - - 0.0 0.0 0.0
Middle East 2.5 2.3 0.0 0.0 2.3
China 695.9 700.7 0.1 0.2 700.8
India 58.4 63.0 0.6 0.0 62.5
Japan 81.0 80.2 0.0 0.1 80.3
South Korea 47.6 46.3 0.0 0.3 46.7
Taiwan, China 14.4 14.9 0.0 0.4 15.3
Other Asia 2.8 2.3 0.9 0.8 2.1
Asia 900.1 907.4 1.6 1.8 907.7
Australia 3.6 3.6 0.0 0.0 3.7
New Zealand 0.7 0.7 - 0.0 0.7
Other Oceania - - 0.0 0.0 0.0
Oceania 4.3 4.3 0.0 0.0 4.3
World 1 162.3 1 163.4 13.0 11.8 1 162.2
e = estimate
18 19

IRON ORE 2015
Production - Exports + Imports = Apparent
consumption
Austria 2.4 0.0 5.1 7.5
Belgium-Luxembourg - 0.0 6.6 6.6
Czech Republic - 0.0 6.4 6.3
France - 0.1 15.7 15.6
Germany 0.5 0.1 41.0 41.3
Italy - 0.0 8.1 8.1
Netherlands - 23.4 30.9 7.5
Poland - 0.0 7.2 7.2
Romania - 0.0 3.0 3.0
Slovakia - 0.0 5.5 5.5
Spain - 0.0 6.4 6.4
Sweden 24.6 20.1 0.1 4.6
United Kingdom - 0.1 12.0 12.0
Other EU - 0.3 5.1 4.9
European Union (28) 27.5 44.1 153.1 136.5
Bosnia-Herzegovina 2.1 0.1 0.0 2.0
Norway 3.5 3.8 0.0 -0.3
Turkey 6.0 0.3 10.0 15.7
Other Europe - 0.0 3.8 3.8
Europe 39.1 48.3 166.9 157.7
CIS 195.3 75.3 10.5 130.6
Canada 46.0 36.9 6.6 15.7
Mexico 14.4 0.2 1.5 15.7
United States 43.1 8.2 4.5 39.5
NAFTA 103.5 45.2 12.6 70.9
Brazil 422.5 366.2 0.0 56.4
Chile 14.5 14.5 - 0.0
Peru 11.6 11.5 - 0.0
Venezuela 8.0 3.7 - 4.3
Other America 0.7 0.4 13.1 13.4
Central and South America 457.3 396.3 13.1 74.1
Liberia 4.3 5.4 - -1.1
Mauritania 13.1 12.1 - 1.0
South Africa 61.4 65.3 0.4 -3.4
Other Africa 7.1 2.8 2.5 6.8
Africa 85.9 85.6 2.9 3.2
Middle East 39.4 15.3 27.8 51.9
China (1) 123.5 0.1 953.4 1 076.8
India 142.5 4.2 9.5 147.8
Japan - 0.0 131.0 131.0
South Korea 0.1 0.0 73.3 73.3
Other Asia 14.1 27.5 114.1 100.7
Asia 280.2 31.9 1 281.3 1 529.6
Australia 811.2 810.5 2.8 3.5
New Zealand and Other Oceania 3.2 2.1 0.0 1.1
World 2 015.0 1 510.5 1 518.0 2 022.6
million tonnes actual weight
WORLD IRON ORE TRADE BY AREA, 2016
million tonnes
Euro
pean
Uni
on (2
8)
Oth
er E
urop
e
CIS
NAF
TA
Oth
er A
mer
ica
Afric
a an
d M
iddl
e Ea
st
Asia
Oce
ania
Tota
l im
port
s
of w
hich
: ext
ra-r
egio
nal i
mpo
rts
European Union (28)
28.8 2.0 27.7 19.3 52.4 12.0 0.1 - 142.4 113.7
Other Europe 1.7 0.0 4.6 0.7 5.2 0.3 - - 12.4 12.4
CIS 4.7 0.0 1.8 - 2.6 0.0 - - 9.0 7.3
NAFTA 0.4 - 0.0 8.1 4.7 0.5 0.0 - 13.8 5.7
Other America 0.0 - 0.0 1.0 9.3 0.0 - 0.0 10.3 1.0
Africa and Middle East
6.1 0.2 0.1 1.4 17.9 3.0 0.4 0.0 29.1 26.0
China 0.2 0.1 22.6 9.9 236.9 70.5 55.5 629.0 1 024.7 969.2
Japan 0.0 - 1.7 5.3 31.1 4.4 1.7 85.9 130.1 128.3
Other Asia 0.0 0.1 0.9 3.7 44.7 17.7 1.1 141.6 209.8 208.7
Oceania 0.0 - - - 0.2 0.0 0.5 0.1 0.8 0.7
Total exports 42.0 2.4 59.3 49.4 405.0 108.5 59.4 856.5 1 582.5 1 473.1
of which: extra-regional exports*
13.2 2.4 57.5 41.3 395.7 105.5 1.1 856.4 1 473.1
Net exports (exports - imports)
-100.5 -10.1 50.3 35.6 394.7 79.5 -1 305.2 855.7
*Excluding intra-regional trade marked
Destination
Exporting region
(1) Production adjusted so that Fe content is similar to world averageSource: United Nations
20 21
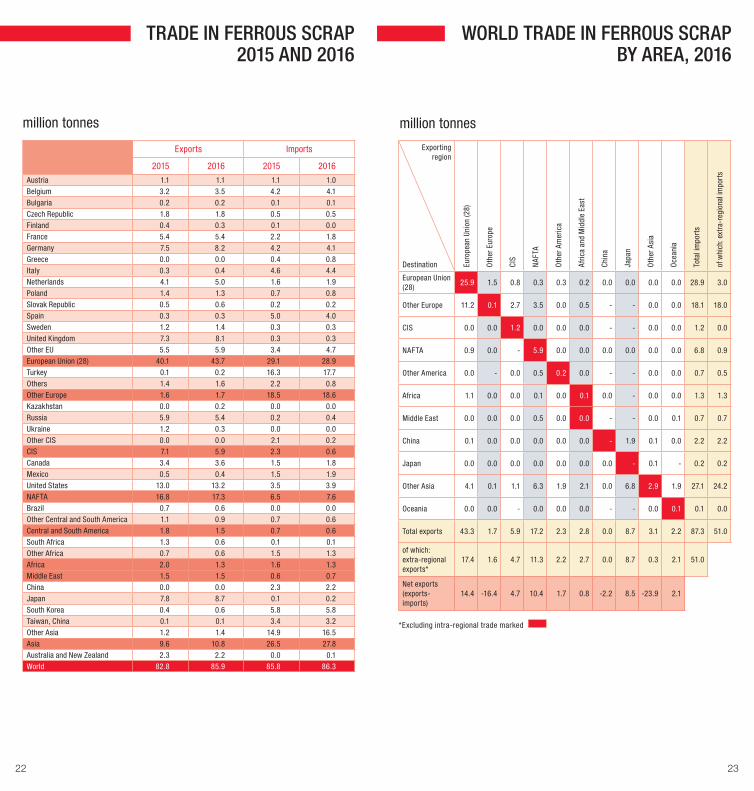
TRADE IN FERROUS SCRAP2015 AND 2016
Exports Imports
2015 2016 2015 2016
Austria 1.1 1.1 1.1 1.0Belgium 3.2 3.5 4.2 4.1Bulgaria 0.2 0.2 0.1 0.1Czech Republic 1.8 1.8 0.5 0.5Finland 0.4 0.3 0.1 0.0France 5.4 5.4 2.2 1.8Germany 7.5 8.2 4.2 4.1Greece 0.0 0.0 0.4 0.8Italy 0.3 0.4 4.6 4.4Netherlands 4.1 5.0 1.6 1.9Poland 1.4 1.3 0.7 0.8Slovak Republic 0.5 0.6 0.2 0.2Spain 0.3 0.3 5.0 4.0Sweden 1.2 1.4 0.3 0.3United Kingdom 7.3 8.1 0.3 0.3Other EU 5.5 5.9 3.4 4.7European Union (28) 40.1 43.7 29.1 28.9Turkey 0.1 0.2 16.3 17.7Others 1.4 1.6 2.2 0.8Other Europe 1.6 1.7 18.5 18.6Kazakhstan 0.0 0.2 0.0 0.0Russia 5.9 5.4 0.2 0.4Ukraine 1.2 0.3 0.0 0.0Other CIS 0.0 0.0 2.1 0.2CIS 7.1 5.9 2.3 0.6Canada 3.4 3.6 1.5 1.8Mexico 0.5 0.4 1.5 1.9United States 13.0 13.2 3.5 3.9NAFTA 16.8 17.3 6.5 7.6Brazil 0.7 0.6 0.0 0.0Other Central and South America 1.1 0.9 0.7 0.6Central and South America 1.8 1.5 0.7 0.6South Africa 1.3 0.6 0.1 0.1Other Africa 0.7 0.6 1.5 1.3Africa 2.0 1.3 1.6 1.3Middle East 1.5 1.5 0.6 0.7China 0.0 0.0 2.3 2.2Japan 7.8 8.7 0.1 0.2South Korea 0.4 0.6 5.8 5.8Taiwan, China 0.1 0.1 3.4 3.2Other Asia 1.2 1.4 14.9 16.5Asia 9.6 10.8 26.5 27.8Australia and New Zealand 2.3 2.2 0.0 0.1World 82.8 85.9 85.8 86.3
million tonnes
WORLD TRADE IN FERROUS SCRAP BY AREA, 2016
Exporting region
Destination Euro
pean
Uni
on (2
8)
Oth
er E
urop
e
CIS
NAF
TA
Oth
er A
mer
ica
Afric
a an
d M
iddl
e Ea
st
Chin
a
Japa
n
Oth
er A
sia
Oce
ania
Tota
l im
port
s
of w
hich
: ext
ra-r
egio
nal i
mpo
rts
European Union (28)
25.9 1.5 0.8 0.3 0.3 0.2 0.0 0.0 0.0 0.0 28.9 3.0
Other Europe 11.2 0.1 2.7 3.5 0.0 0.5 - - 0.0 0.0 18.1 18.0
CIS 0.0 0.0 1.2 0.0 0.0 0.0 - - 0.0 0.0 1.2 0.0
NAFTA 0.9 0.0 - 5.9 0.0 0.0 0.0 0.0 0.0 0.0 6.8 0.9
Other America 0.0 - 0.0 0.5 0.2 0.0 - - 0.0 0.0 0.7 0.5
Africa 1.1 0.0 0.0 0.1 0.0 0.1 0.0 - 0.0 0.0 1.3 1.3
Middle East 0.0 0.0 0.0 0.5 0.0 0.0 - - 0.0 0.1 0.7 0.7
China 0.1 0.0 0.0 0.0 0.0 0.0 - 1.9 0.1 0.0 2.2 2.2
Japan 0.0 0.0 0.0 0.0 0.0 0.0 0.0 - 0.1 - 0.2 0.2
Other Asia 4.1 0.1 1.1 6.3 1.9 2.1 0.0 6.8 2.9 1.9 27.1 24.2
Oceania 0.0 0.0 - 0.0 0.0 0.0 - - 0.0 0.1 0.1 0.0
Total exports 43.3 1.7 5.9 17.2 2.3 2.8 0.0 8.7 3.1 2.2 87.3 51.0
of which: extra-regional exports*
17.4 1.6 4.7 11.3 2.2 2.7 0.0 8.7 0.3 2.1 51.0
Net exports (exports-imports)
14.4 -16.4 4.7 10.4 1.7 0.8 -2.2 8.5 -23.9 2.1
*Excluding intra-regional trade marked
million tonnes
22 23
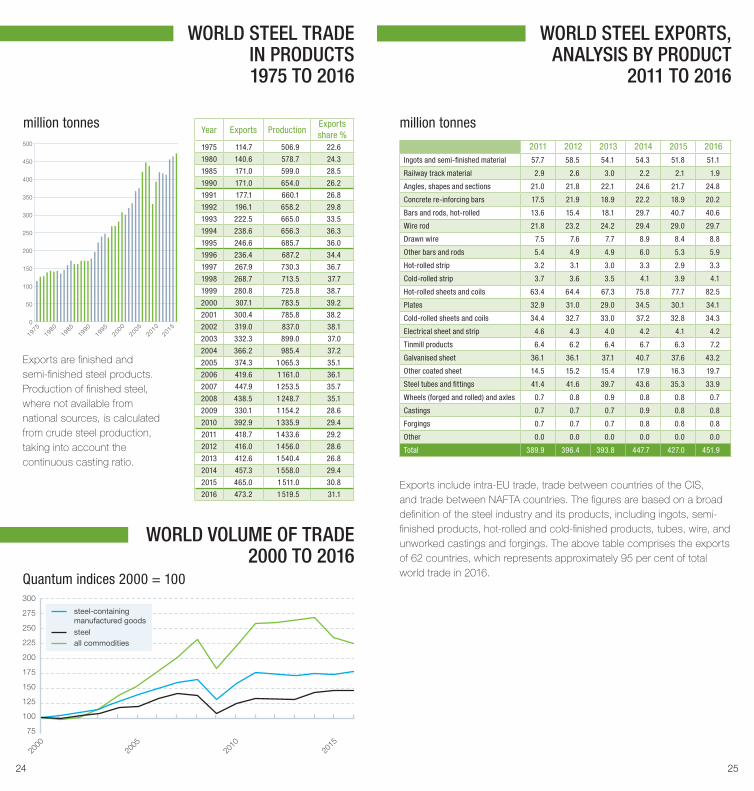
WORLD STEEL EXPORTS,ANALYSIS BY PRODUCT
2011 TO 2016
2011 2012 2013 2014 2015 2016Ingots and semi-finished material 57.7 58.5 54.1 54.3 51.8 51.1
Railway track material 2.9 2.6 3.0 2.2 2.1 1.9
Angles, shapes and sections 21.0 21.8 22.1 24.6 21.7 24.8
Concrete re-inforcing bars 17.5 21.9 18.9 22.2 18.9 20.2
Bars and rods, hot-rolled 13.6 15.4 18.1 29.7 40.7 40.6
Wire rod 21.8 23.2 24.2 29.4 29.0 29.7
Drawn wire 7.5 7.6 7.7 8.9 8.4 8.8
Other bars and rods 5.4 4.9 4.9 6.0 5.3 5.9
Hot-rolled strip 3.2 3.1 3.0 3.3 2.9 3.3
Cold-rolled strip 3.7 3.6 3.5 4.1 3.9 4.1
Hot-rolled sheets and coils 63.4 64.4 67.3 75.8 77.7 82.5
Plates 32.9 31.0 29.0 34.5 30.1 34.1
Cold-rolled sheets and coils 34.4 32.7 33.0 37.2 32.8 34.3
Electrical sheet and strip 4.6 4.3 4.0 4.2 4.1 4.2
Tinmill products 6.4 6.2 6.4 6.7 6.3 7.2
Galvanised sheet 36.1 36.1 37.1 40.7 37.6 43.2
Other coated sheet 14.5 15.2 15.4 17.9 16.3 19.7
Steel tubes and fittings 41.4 41.6 39.7 43.6 35.3 33.9
Wheels (forged and rolled) and axles 0.7 0.8 0.9 0.8 0.8 0.7
Castings 0.7 0.7 0.7 0.9 0.8 0.8
Forgings 0.7 0.7 0.7 0.8 0.8 0.8
Other 0.0 0.0 0.0 0.0 0.0 0.0
Total 389.9 396.4 393.8 447.7 427.0 451.9
Exports include intra-EU trade, trade between countries of the CIS, and trade between NAFTA countries. The figures are based on a broad definition of the steel industry and its products, including ingots, semi-finished products, hot-rolled and cold-finished products, tubes, wire, and unworked castings and forgings. The above table comprises the exports of 62 countries, which represents approximately 95 per cent of total world trade in 2016.
million tonnes
0
50
100
150
200
250
300
350
400
450
500
19751980
19851990
19952000
20052010
2015
WORLD STEEL TRADEIN PRODUCTS 1975 TO 2016
Year Exports ProductionExports share %
1975 114.7 506.9 22.6
1980 140.6 578.7 24.3
1985 171.0 599.0 28.5
1990 171.0 654.0 26.2
1991 177.1 660.1 26.8
1992 196.1 658.2 29.8
1993 222.5 665.0 33.5
1994 238.6 656.3 36.3
1995 246.6 685.7 36.0
1996 236.4 687.2 34.4
1997 267.9 730.3 36.7
1998 268.7 713.5 37.7
1999 280.8 725.8 38.7
2000 307.1 783.5 39.2
2001 300.4 785.8 38.2
2002 319.0 837.0 38.1
2003 332.3 899.0 37.0
2004 366.2 985.4 37.2
2005 374.3 1 065.3 35.1
2006 419.6 1 161.0 36.1
2007 447.9 1 253.5 35.7
2008 438.5 1 248.7 35.1
2009 330.1 1 154.2 28.6
2010 392.9 1 335.9 29.4
2011 418.7 1 433.6 29.2
2012 416.0 1 456.0 28.6
2013 412.6 1 540.4 26.8
2014 457.3 1 558.0 29.4
2015 465.0 1 511.0 30.8
2016 473.2 1 519.5 31.1
Exports are finished and semi-finished steel products. Production of finished steel, where not available from national sources, is calculated from crude steel production, taking into account the continuous casting ratio.
million tonnes
WORLD VOLUME OF TRADE 2000 TO 2016
75
100
125
150
175
200
225
250
275
300
2000
2005
2010
2015
steel-containing manufactured goods
steelall commodities
Quantum indices 2000 = 100
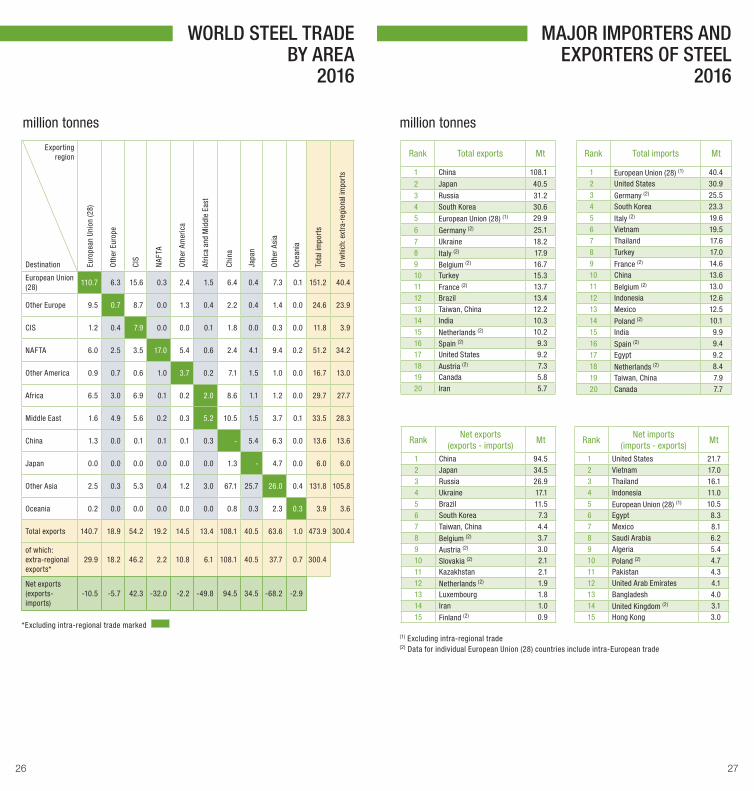
24 25
Exporting region
Destination Euro
pean
Uni
on (2
8)
Oth
er E
urop
e
CIS
NAF
TA
Oth
er A
mer
ica
Afric
a an
d M
iddl
e Ea
st
Chin
a
Japa
n
Oth
er A
sia
Oce
ania
Tota
l im
port
s
of w
hich
: ext
ra-r
egio
nal i
mpo
rts
European Union (28)
110.7 6.3 15.6 0.3 2.4 1.5 6.4 0.4 7.3 0.1 151.2 40.4
Other Europe 9.5 0.7 8.7 0.0 1.3 0.4 2.2 0.4 1.4 0.0 24.6 23.9
CIS 1.2 0.4 7.9 0.0 0.0 0.1 1.8 0.0 0.3 0.0 11.8 3.9
NAFTA 6.0 2.5 3.5 17.0 5.4 0.6 2.4 4.1 9.4 0.2 51.2 34.2
Other America 0.9 0.7 0.6 1.0 3.7 0.2 7.1 1.5 1.0 0.0 16.7 13.0
Africa 6.5 3.0 6.9 0.1 0.2 2.0 8.6 1.1 1.2 0.0 29.7 27.7
Middle East 1.6 4.9 5.6 0.2 0.3 5.2 10.5 1.5 3.7 0.1 33.5 28.3
China 1.3 0.0 0.1 0.1 0.1 0.3 - 5.4 6.3 0.0 13.6 13.6
Japan 0.0 0.0 0.0 0.0 0.0 0.0 1.3 - 4.7 0.0 6.0 6.0
Other Asia 2.5 0.3 5.3 0.4 1.2 3.0 67.1 25.7 26.0 0.4 131.8 105.8
Oceania 0.2 0.0 0.0 0.0 0.0 0.0 0.8 0.3 2.3 0.3 3.9 3.6
Total exports 140.7 18.9 54.2 19.2 14.5 13.4 108.1 40.5 63.6 1.0 473.9 300.4
of which: extra-regional exports*
29.9 18.2 46.2 2.2 10.8 6.1 108.1 40.5 37.7 0.7 300.4
Net exports (exports-imports)
-10.5 -5.7 42.3 -32.0 -2.2 -49.8 94.5 34.5 -68.2 -2.9
*Excluding intra-regional trade marked
MAJOR IMPORTERS AND EXPORTERS OF STEEL
2016
Rank Total exports Mt
1 China 108.1
2 Japan 40.5
3 Russia 31.24 South Korea 30.65 European Union (28) (1) 29.9
6 Germany (2) 25.1
7 Ukraine 18.28 Italy (2) 17.99 Belgium (2) 16.710 Turkey 15.311 France (2) 13.712 Brazil 13.413 Taiwan, China 12.214 India 10.315 Netherlands (2) 10.216 Spain (2) 9.317 United States 9.218 Austria (2) 7.319 Canada 5.820 Iran 5.7
Rank Total imports Mt
1 European Union (28) (1) 40.4
2 United States 30.9
3 Germany (2) 25.5
4 South Korea 23.3
5 Italy (2) 19.6
6 Vietnam 19.5
7 Thailand 17.6
8 Turkey 17.0
9 France (2) 14.6
10 China 13.6
11 Belgium (2) 13.0
12 Indonesia 12.6
13 Mexico 12.5
14 Poland (2) 10.1
15 India 9.9
16 Spain (2) 9.4
17 Egypt 9.2
18 Netherlands (2) 8.4
19 Taiwan, China 7.9
20 Canada 7.7
RankNet exports
(exports - imports)Mt
1 China 94.52 Japan 34.53 Russia 26.94 Ukraine 17.15 Brazil 11.56 South Korea 7.37 Taiwan, China 4.48 Belgium (2) 3.79 Austria (2) 3.010 Slovakia (2) 2.111 Kazakhstan 2.112 Netherlands (2) 1.913 Luxembourg 1.814 Iran 1.015 Finland (2) 0.9
RankNet imports
(imports - exports)Mt
1 United States 21.72 Vietnam 17.03 Thailand 16.14 Indonesia 11.05 European Union (28) (1) 10.56 Egypt 8.37 Mexico 8.18 Saudi Arabia 6.29 Algeria 5.410 Poland (2) 4.711 Pakistan 4.312 United Arab Emirates 4.113 Bangladesh 4.014 United Kingdom (2) 3.115 Hong Kong 3.0
(1) Excluding intra-regional trade(2) Data for individual European Union (28) countries include intra-European trade
million tonnes
WORLD STEEL TRADE BY AREA
2016
million tonnes
26 27
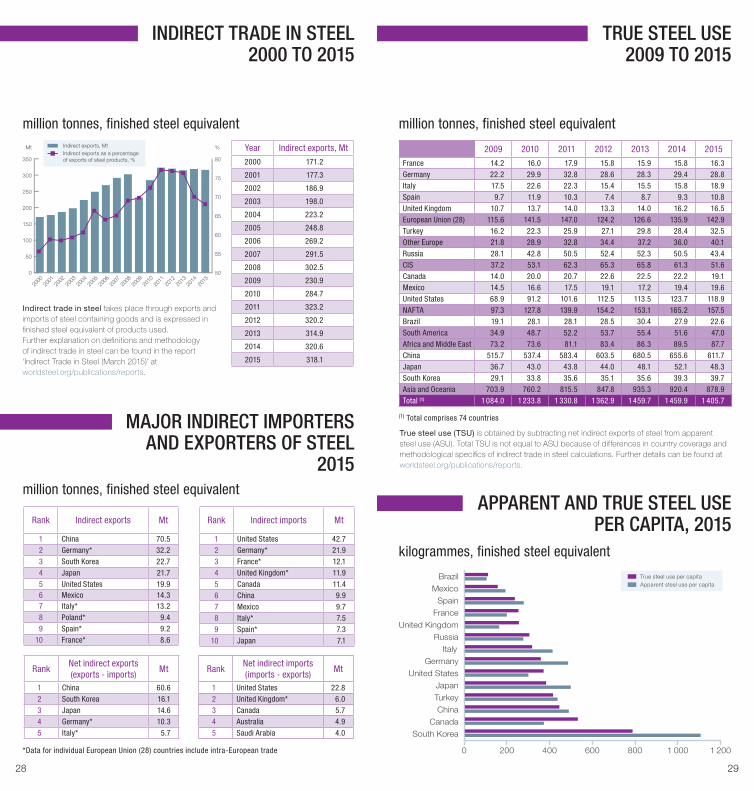
TRUE STEEL USE2009 TO 2015
APPARENT AND TRUE STEEL USE PER CAPITA, 2015
2009 2010 2011 2012 2013 2014 2015
France 14.2 16.0 17.9 15.8 15.9 15.8 16.3Germany 22.2 29.9 32.8 28.6 28.3 29.4 28.8Italy 17.5 22.6 22.3 15.4 15.5 15.8 18.9Spain 9.7 11.9 10.3 7.4 8.7 9.3 10.8United Kingdom 10.7 13.7 14.0 13.3 14.0 16.2 16.5European Union (28) 115.6 141.5 147.0 124.2 126.6 135.9 142.9Turkey 16.2 22.3 25.9 27.1 29.8 28.4 32.5Other Europe 21.8 28.9 32.8 34.4 37.2 36.0 40.1Russia 28.1 42.8 50.5 52.4 52.3 50.5 43.4CIS 37.2 53.1 62.3 65.3 65.8 61.3 51.6Canada 14.0 20.0 20.7 22.6 22.5 22.2 19.1Mexico 14.5 16.6 17.5 19.1 17.2 19.4 19.6United States 68.9 91.2 101.6 112.5 113.5 123.7 118.9NAFTA 97.3 127.8 139.9 154.2 153.1 165.2 157.5Brazil 19.1 28.1 28.1 28.5 30.4 27.9 22.6South America 34.9 48.7 52.2 53.7 55.4 51.6 47.0Africa and Middle East 73.2 73.6 81.1 83.4 86.3 89.5 87.7China 515.7 537.4 583.4 603.5 680.5 655.6 611.7Japan 36.7 43.0 43.8 44.0 48.1 52.1 48.3South Korea 29.1 33.8 35.6 35.1 35.6 39.3 39.7Asia and Oceania 703.9 760.2 815.5 847.8 935.3 920.4 878.9Total (1) 1 084.0 1 233.8 1 330.8 1 362.9 1 459.7 1 459.9 1 405.7
(1) Total comprises 74 countries
True steel use (TSU) is obtained by subtracting net indirect exports of steel from apparent steel use (ASU). Total TSU is not equal to ASU because of differences in country coverage and methodological specifics of indirect trade in steel calculations. Further details can be found at worldsteel.org/publications/reports.
0 200 400 600 800 1 000 1 200
South KoreaCanada
ChinaTurkeyJapan
United StatesGermany
ItalyRussia
United KingdomFranceSpain
MexicoBrazil
million tonnes, finished steel equivalentmillion tonnes, finished steel equivalent
kilogrammes, finished steel equivalent
MAJOR INDIRECT IMPORTERS AND EXPORTERS OF STEEL
2015
INDIRECT TRADE IN STEEL2000 TO 2015
Year Indirect exports, Mt
2000 171.2
2001 177.3
2002 186.9
2003 198.0
2004 223.2
2005 248.8
2006 269.2
2007 291.5
2008 302.5
2009 230.9
2010 284.7
2011 323.2
2012 320.2
2013 314.9
2014 320.6
2015 318.1
Mt %
2000
2001
2002
2003
2004
2005
2006
2007
2008
2009
2010
2011
2012
2013
2014
2015
Indirect exports, MtIndirect exports as a percentage of exports of steel products, %
0
50
100
150
200
250
300
350
50
55
60
65
70
75
80
Indirect trade in steel takes place through exports and imports of steel containing goods and is expressed in finished steel equivalent of products used.Further explanation on definitions and methodology of indirect trade in steel can be found in the report ‘Indirect Trade in Steel (March 2015)’ at worldsteel.org/publications/reports.
Rank Indirect exports Mt
1 China 70.52 Germany* 32.23 South Korea 22.74 Japan 21.75 United States 19.96 Mexico 14.37 Italy* 13.28 Poland* 9.49 Spain* 9.2
10 France* 8.6
Rank Indirect imports Mt
1 United States 42.72 Germany* 21.93 France* 12.14 United Kingdom* 11.95 Canada 11.46 China 9.97 Mexico 9.78 Italy* 7.59 Spain* 7.3
10 Japan 7.1
RankNet indirect exports(exports - imports)
Mt
1 China 60.62 South Korea 16.13 Japan 14.64 Germany* 10.35 Italy* 5.7
RankNet indirect imports(imports - exports)
Mt
1 United States 22.82 United Kingdom* 6.03 Canada 5.74 Australia 4.95 Saudi Arabia 4.0
*Data for individual European Union (28) countries include intra-European trade
million tonnes, finished steel equivalent
True steel use per capitaApparent steel use per capita
28 29
This publication is printed on Olin paper. Olin is certified by
the Forest Stewardship Council as environmentally-responsible paper.
World Steel in Figures
© World Steel Association 2017
ISBN 978-2-930069-88-3
Cover image: Lucky Knot bridge, Changsha, China
by NEXT Architects ; Photography © Julien Lanoo
Design: double-id.com
ABOUT US
The World Steel Association (worldsteel) is one of the largest and most dynamic industry associations in the world. worldsteel represents over 160 steel producers (including 9 of the world’s 10 largest steel companies), national and regional steel industry associations, and steel research institutes. worldsteel members represent around 85% of world steel production.
worldsteel’s mission is to act as the focal point for the steel industry. worldsteel provides global leadership on all major strategic issues affecting the industry, particularly focusing on economic, environmental and social sustainability. worldsteel promotes steel and the steel industry to customers, the industry, media and the general public. It assists its members to develop the market for steel. worldsteel has major projects in the automotive and construction sectors.
Notation used in this publication:
(e) indicates a figure that has been estimated.
0.0 indicates that the quantity concerned is less than 0.05.
- indicates zero or no data.
30
World Steel Association
Rue Colonel Bourg 120B-1140 BrusselsBelgium
T: +32 (0) 2 702 89 00F: +32 (0) 2 702 88 99E: [email protected]
C413 Office BuildingBeijing Lufthansa Center50 Liangmaqiao RoadChaoyang DistrictBeijing 100125 China
T: +86 10 6464 6733 F: +86 10 6468 0728E: [email protected]
worldsteel.org