Embed Size (px)
Citation preview

World Steel recycling in FigureS 2007 – 2011Steel Scrap – a Raw Material for Steelmaking

World Steel Recycling in Figures 2007 – 2011 1
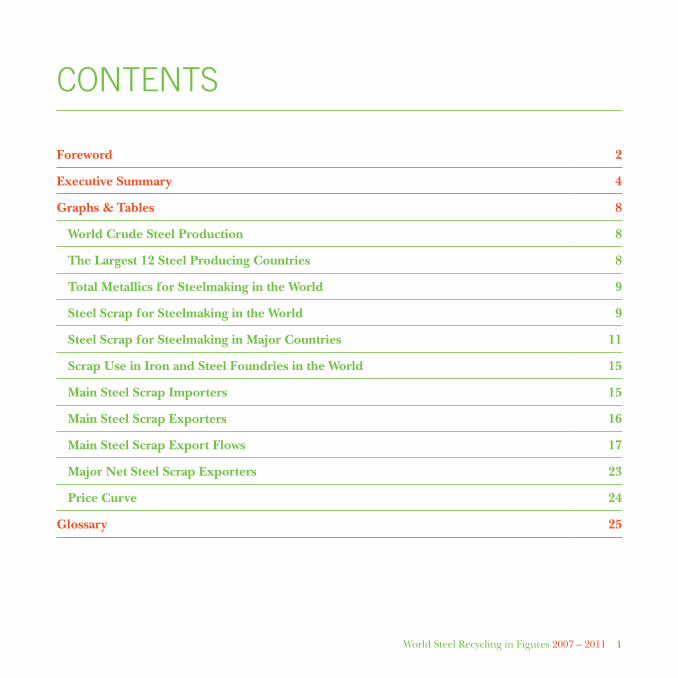
Contents
Foreword 2
Executive Summary 4
Graphs & Tables 8
World Crude Steel Production 8
The Largest 12 Steel Producing Countries 8
Total Metallics for Steelmaking in the World 9
Steel Scrap for Steelmaking in the World 9
Steel Scrap for Steelmaking in Major Countries 11
Scrap Use in Iron and Steel Foundries in the World 15
Main Steel Scrap Importers 15
Main Steel Scrap Exporters 16
Main Steel Scrap Export Flows 17
Major Net Steel Scrap Exporters 23
Price Curve 24
Glossary 25

The third edition of our BIR Ferrous Report “World Steel Recycling in Figures” shows that the steel recycling industry was positively affected in 2011 by the new record in annual world crude steel production.
It is a great pleasure for me to announce the publication of the third edition of our report “World steel Recycling in Figures”.
this important compilation of statistics on the global ferrous scrap markets has enjoyed a very positive reception since it appeared for the first time in 2010.
Covering the five-year period between 2007 and 2011, the third edition contains a total of 31 graphs and tables - five more than its predecessor.
In addition to the main scrap usage information for the eU, China, the UsA, Japan, Russia and turkey, we have updated our calculation models for the entire use of steel scrap as a raw material for steelmaking and for global scrap use in iron and steel foundries.
According to our calculations, global scrap use in steelmaking has been between 440 and 570m tonnes per annum in recent years, while its annual use in iron and steel foundries has amounted to between 56 and 76m tonnes. Global steel scrap consumption achieved a new record of 570m tonnes in 2011.
FoReWoRd
2 World Steel Recycling in Figures 2007 – 2011
World Steel Recycling in Figures 2007 – 2011 3
We have also provided more information about world trade in steel scrap and have completed our third edition with an overview of 2011 export prices for the UsA and the eU. the huge world trade in steel scrap underlines the need for a free raw materials market; our industry lives from worldwide free trade, enabling us to correct the global imbalance between net scrap exporters and net scrap importers.
For an ever more accurate appraisal of the market, we want to continue to improve the steel scrap statistics at our disposal, including our quarterly update of the world statistics.
I would like to extend special thanks to Rolf Willeke, the BIR Ferrous division’s statistics Advisor, who compiled, prepared and evaluated all the figures in our report.
We hope that our report “World steel Recycling in Figures 2007-2011” will be useful to you in your daily business operations.
Brussels, May 2012
Christian RubachPresident of the BIR Ferrous division

4 World Steel Recycling in Figures 2007 – 2011
Final figures for 2011 show a new record in world crude steel output and also in global steel scrap use as a raw material for steelmaking.
World crude steel production reached 1.513bn tonnes in 2011; this represented an increase of 6.9% over 2010 and a new annual output record. All the major steel-producing countries apart from Japan and spain showed production growth in 2011. this was particularly robust in turkey, the Republic of Korea and Italy, according to worldsteel.
Looking at the main scrap-using countries, statistics from worldsteel confirm that China’s crude steel production reached 683.9m tonnes in 2011 for an increase of 9.1% over 2010; the country’s share of world crude steel production increased to 45.2% in 2011. Japan produced 107.6m tonnes of crude steel in 2011, a decrease of 1.8% from 2010; meanwhile, the eU recorded an increase of 2.7% in producing 177.2m tonnes, and the UsA produced 86.4m tonnes of crude steel, or 7.3% more than in 2010. Also in 2011, crude steel production reached 68.9m tonnes in Russia and 34.1m tonnes in turkey for year-on-year increases of, respectively, 2.9% and 17.8%.
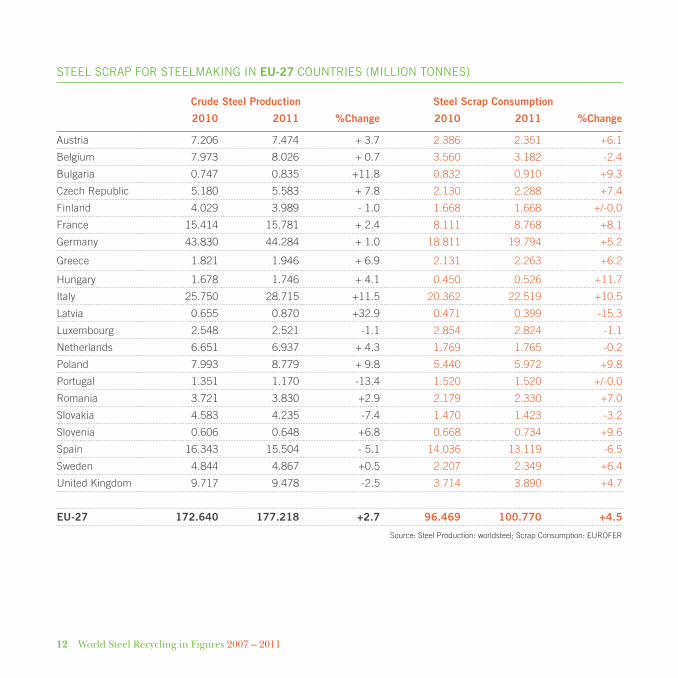
570m tonnes - a new record in global steel scrap use as a raw material for steelmakingthe 2011 update of our ferrous statistics shows increased steel scrap consumption for crude steel production in China, the eU-27 and turkey. But it is worthy of note that the increases in steel scrap usage in the eU-27 (+4.5% to 100.8m tonnes) and in turkey (+21.9% to 30.8m tonnes) were greater than their respective upturns in crude steel production of 2.7% and 17.8%. the biggest steel scrap user in the eU-27 was Italy on 20.519m tonnes (+10.5% over 2010). It is also worth noting that scrap contributed 90.3% of the material used in turkish steel production in 2011 compared to a world average for 2011 of 37.7%.
As the world’s biggest steel producer, China is attracting particular attention regarding its scrap usage. China’s steel industry as a whole should be attempting to increase scrap consumption per tonne of steel produced during the country’s Five-Year Plan running from 2011 to 2015. In 2011, China’s scrap consumption climbed around 3.3% to 91m tonnes whereas the country’s crude steel production grew at an even faster rate of 9.1%.
It is interesting to note that the UsA recorded a crude steel production increase of 7.3% to 86.4m tonnes in 2011 whereas steel scrap usage declined by 6.7% to 56m tonnes, indicating strong steel production based
exeCUtIve sUMMARY

World Steel Recycling in Figures 2007 – 2011 5
on a resurgence in automotive demand as well as for oCtG. electric arc furnaces (eAFs) producing these products operated at higher rates than those producing rebar. From the Us market, it is understood that the commitment made to iron alternatives by eAFs producing sheet products is irreversible.
Furthermore, our figures reveal that steel scrap usage in Russia last year (-2.2% to 21.0m tonnes) failed to keep pace with the country’s growth in crude steel production (+2.9% to 68.9m tonnes). For Japan, the small decline in steel scrap usage (-3% to 37.2m tonnes) was slightly more pronounced than the drop in its crude steel production (-1.8% to 107.6m tonnes).
We are still dependent on estimates for many areas of the world. so we have calculated - in collaboration with experts from the German steel Federation (Wv stahl) - a steel scrap usage in world steel production of around 570m tonnes for 2011. this represents an increase of 7.6% over 2010 and a new annual consumption record, supported by the larger growth in global eAF steel production of around 7.5% to 442m tonnes.
The important role of scrap purchases to the raw materials supply of steelworks and foundriesAccording to our calculations, the gain in steelworks’ own arisings, or circulating scrap, was smaller than that in production last year, rising 5.3% to 200m tonnes as a result of mills’ efforts to improve yields through the wider use of continuous casting and of near-net-shape casting. At the same time, global pig iron production increased around 6.3% to 1.099bn tonnes - slightly smaller than the 6.9% jump in crude steel production. our calculations reveal that scrap purchases by steelworks worldwide increased by 8.8% to a new record of 370m tonnes in 2011, of which 32.4% was attributable to the supply of new steel scrap (process scrap) and 67.6% to old steel scrap (capital scrap).
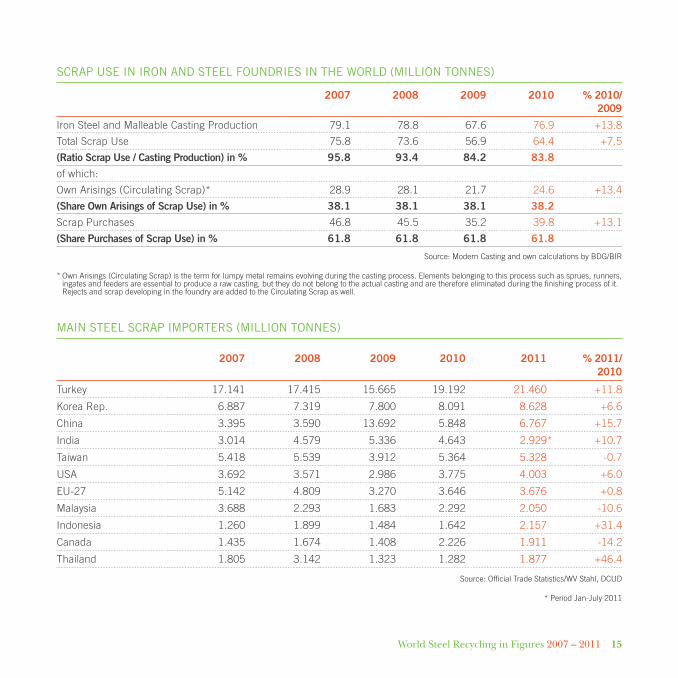
For the second time, we are able to present a calculation model for global scrap use in iron and steel foundries. We have produced this in collaboration with experts from the German Foundry Association (BdG), which is also responsible for the secretariat General of the european Foundry Association (CAeF). our calculations cover theperiod from 2007 to 2010; it was not possible to incorporate 2011 figures because world casting production is determined only by Us magazine “Modern Casting” with a time lag of one year. It should also be pointed out that our calculation model takes into account the high pig iron usage for casting production in the iron and steel foundries of China and India. For 2010, we have calculated global scrap usage of 64.4m tonnes for a world iron, steel and malleable casting production of 76.9m tonnes. In the same year, foundries’ annual scrap purchases amounted to 39.8m tonnes.

6 World Steel Recycling in Figures 2007 – 2011
our calculations show that, in 2011, scrap purchases by steelworks accounted for 64.9% of their total steel scrap usage. For iron and steel foundries, scrap purchases claimed a 61.8% share of their total scrap use. these figures highlight the important role of high-quality recycled scrap to the supply needs of the iron and steel industry worldwide.
The huge world trade in steel scrap underlines the need for a free raw materials marketIn 2011, global trade in steel scrap was particularly influenced by the UsA as the world’s leading exporter and by turkey as its top importer.
the 11.8% increase in turkey’s overseas purchases to 21.460m tonnes enabled the country to reinforce its position as the world’s leading importer. At the same time, it is worth noting the 6.6% increase in the Republic of Korea’s outside purchases to 8.628m tonnes, the 15.7% upturn in Chinese scrap imports to 6.767m tonnes and the 0.7% decline in taiwan’s overseas orders to 5.328m tonnes.
Meanwhile, data obtained from Malaysia reveal that the country’s scrap imports declined by 10.6% to 2.050m tonnes last year, while the totals for thailand and Indonesia climbed 46.4% to 1.877m tonnes and 31.4% to 2.157m tonnes, respectively. For India, official scrap import figures cover only the first seven months of 2011, during which period the country bought 2.929m tonnes of steel scrap (+10.7%).
As for the main steel scrap exporters, there were increases in Us and Russian overseas deliveries but a decline in shipments from the eU-27, Japan and Canada.
After recording a drop in 2010, America’s exports jumped 18.6% to 24.373m tonnes in 2011: the biggest buyers were turkey (+29.2% to 5.624m tonnes), China (+31.5% to 4.226m tonnes), taiwan (+25.6% to 3.540m tonnes) and the Republic of Korea (+4.8% to 2.964m tonnes). the UsA maintained its position as the world’s leading exporter of steel scrap, with support from exchange rate movements in 2011.
turkey was also the biggest buyer of eU steel scrap, but these deliveries recorded a decline of 7.1% last year to 9.936m tonnes. the eU’s total exports to third countries - which have grown significantly in the last five years -
World Steel Recycling in Figures 2007 – 2011 7
fell 1.4% to 18.770m tonnes in 2011, possibly because euro/Us dollar exchange rate movements did not favour the euro-zone’s export position. over the January-december 2011 period, there was a drop in eU steel scrap shipments to egypt (-18.4% to 1.374m tonnes), but an upturn in shipments to India (+5.1% to 2.237m tonnes) and to China (+39.8% to 832,000 tonnes). Last but not least, it is interesting to note an increase in the eU-27’s internal steel scrap exports last year of around 2% to 30.914m tonnes.
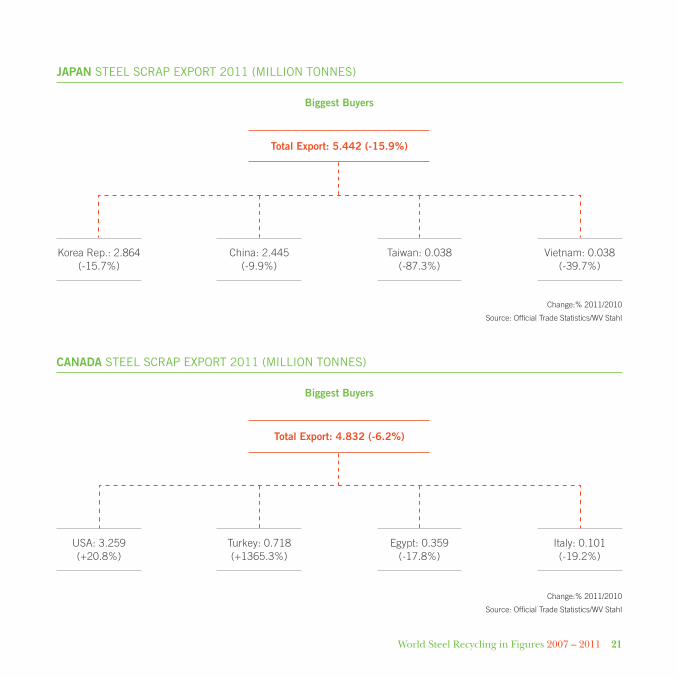
Japan’s scrap export volumes declined by 15.9% to 5.442m tonnes in 2011 - probably as a result of the earthquake and tsunami in March, and also the fact that the Yen/Us dollar exchange rate did not help Japanese exporters. shipments from Japan to the Republic of Korea fell 15.7% to 2.864m tonnes and those to China slid 9.9% to 2.445m tonnes.
In contrast, steel scrap exports from Russia soared 69.1% to 4.042m tonnes in 2011; turkey was the most significant outlet in taking 1.874m tonnes - equivalent to an increase of 75.1%. there were also increases in overseas shipments from Australia (+6.7% to 1.745m tonnes) and from south Africa (+17.3% to 1.436m tonnes).
It is interesting to note that all the world’s leading steel scrap exporters are major net steel scrap exporters: in 2011, the export surplus was 20.4m tonnes for the UsA and 15.1m tonnes for the eU-27.
Meanwhile, figures for 2011 show that steel scrap prices (as illustrated in the export prices of the UsA and the eU) remained volatile, thus emphasising that steel scrap as a raw material is an international commodity subject to world market prices.
Finally, market developments in 2011 highlighted not only the importance of scrap as a global raw material for steelworks and foundries, but also the ecological benefits of steel and iron casting recycling.
Rolf Willekestatistics Advisor of the BIR Ferrous division

8 World Steel Recycling in Figures 2007 – 2011
World crude Steel Production (million tonneS)
the largeSt 12 Steel Producing countrieS (million tonneS)
0
300
600
900
1200
1500
2011
World Steel ProductionChange:%2011/2010
Source: worldsteel
2007 2008 2009 2010
Of which EAF Production
344 411
442(+7.5%)
416 409
1346 13291224
1416
1513(+6.9%)
2007 2008 2009 2010 2011 % 2011/ 2010
China 489.3 500.3 573.6 626.7 683.9 +9.1
Japan 120.2 118.7 87.5 109.6 107.6 -1.8
United states 98.1 91.4 58.2 80.5 86.4 +7.3
India 53.5 57.8 63.5 68.3 71.3 +4.3
Russia 72.4 68.5 60.0 66.9 68.9 +2.9
Korea Rep. 51.5 53.6 48.6 58.9 68.5 +16.2
Germany 48.6 45.8 32.7 43.8 44.3 +1.0
Ukraine 42.8 37.3 29.9 33.5 35.3 +5.6
Brazil 33.8 33.7 26,5 32.9 35.2 +6.8
turkey 25.8 26.8 25.3 29.1 34.1 +17.8
Italy 31.6 30.6 19.8 25.8 28.7 +11.3
taiwan 20.9 19.9 15.9 19.8 22.7 +14.7
source: worldsteel
World Steel Recycling in Figures 2007 – 2011 9
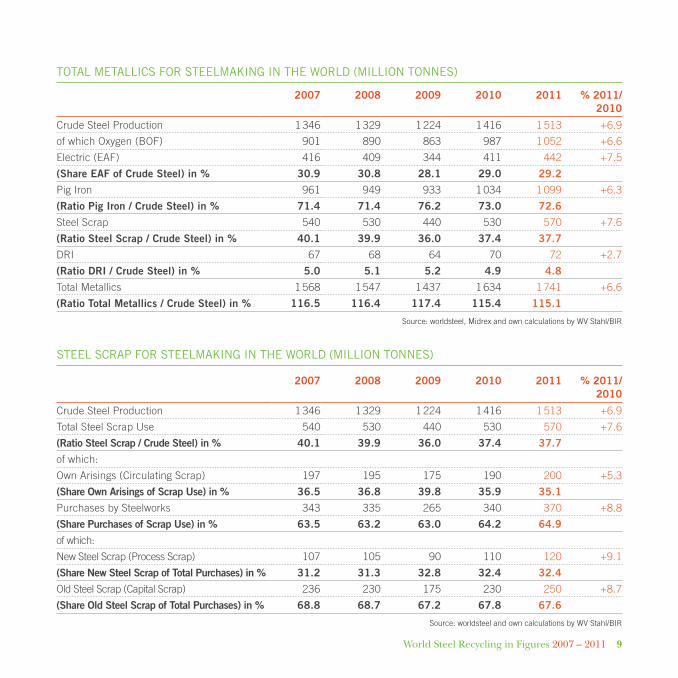
total metallicS For Steelmaking in the World (million tonneS)
Steel ScraP For Steelmaking in the World (million tonneS)
2007 2008 2009 2010 2011 % 2011/ 2010
Crude steel Production 1 346 1 329 1 224 1 416 1 513 +6.9
of which oxygen (BoF) 901 890 863 987 1 052 +6.6
electric (eAF) 416 409 344 411 442 +7.5
(Share EAF of Crude Steel) in % 30.9 30.8 28.1 29.0 29.2
Pig Iron 961 949 933 1 034 1 099 +6.3
(Ratio Pig Iron / Crude Steel) in % 71.4 71.4 76.2 73.0 72.6
steel scrap 540 530 440 530 570 +7.6
(Ratio Steel Scrap / Crude Steel) in % 40.1 39.9 36.0 37.4 37.7
dRI 67 68 64 70 72 +2.7
(Ratio DRI / Crude Steel) in % 5.0 5.1 5.2 4.9 4.8
total Metallics 1 568 1 547 1 437 1 634 1 741 +6.6
(Ratio Total Metallics / Crude Steel) in % 116.5 116.4 117.4 115.4 115.1
source: worldsteel, Midrex and own calculations by Wv stahl/BIR
2007 2008 2009 2010 2011 % 2011/ 2010
Crude steel Production 1 346 1 329 1 224 1 416 1 513 +6.9
total steel scrap Use 540 530 440 530 570 +7.6
(Ratio Steel Scrap / Crude Steel) in % 40.1 39.9 36.0 37.4 37.7
of which:
own Arisings (Circulating scrap) 197 195 175 190 200 +5.3
(Share Own Arisings of Scrap Use) in % 36.5 36.8 39.8 35.9 35.1
Purchases by steelworks 343 335 265 340 370 +8.8
(Share Purchases of Scrap Use) in % 63.5 63.2 63.0 64.2 64.9
of which:
new steel scrap (Process scrap) 107 105 90 110 120 +9.1
(Share New Steel Scrap of Total Purchases) in % 31.2 31.3 32.8 32.4 32.4
old steel scrap (Capital scrap) 236 230 175 230 250 +8.7
(Share Old Steel Scrap of Total Purchases) in % 68.8 68.7 67.2 67.8 67.6
source: worldsteel and own calculations by Wv stahl/BIR
10 World Steel Recycling in Figures 2007 – 2011
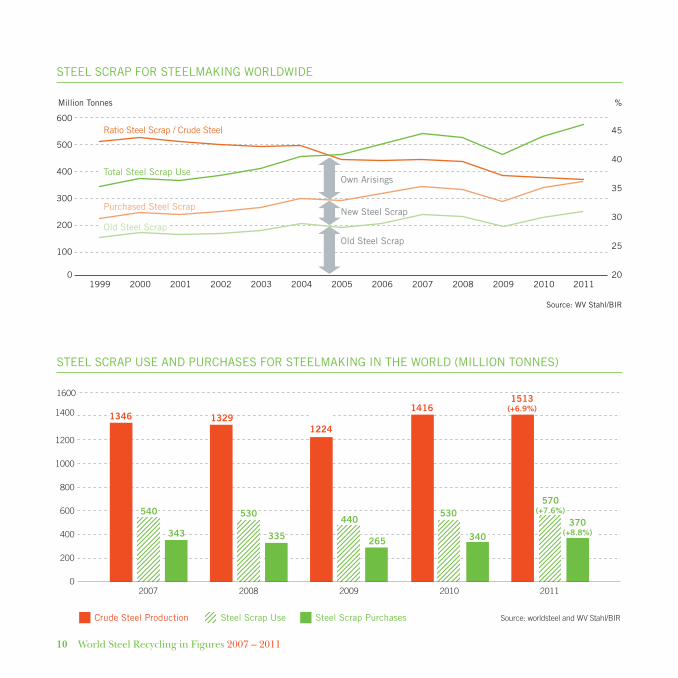
Steel ScraP uSe and PurchaSeS For Steelmaking in the World (million tonneS)
0
600
400
200
800
1000
1200
1400
1600
2007
Crude Steel Production Source: worldsteel and WV Stahl/BIR
2008 2009 2010 2011
Steel Scrap PurchasesSteel Scrap Use
530540 530
340343 335
1416
570(+7.6%)
370(+8.8%)
1513(+6.9%)
1346 13291224
440
265
Steel ScraP For Steelmaking WorldWide
0
100
200
300
400
600
500
20
25
30
35
45
Million Tonnes %
40
Source: WV Stahl/BIR
20092008200720062005200420032002200120001999 2010 2011
Ratio Steel Scrap / Crude Steel
Total Steel Scrap Use
Purchased Steel Scrap
Old Steel Scrap
Own Arisings
New Steel Scrap
Old Steel Scrap

World Steel Recycling in Figures 2007 – 2011 11
Steel ScraP For Steelmaking in ChINA (million tonneS)
Steel ScraP For Steelmaking in the EU-27 (million tonneS)
0
100
160
180
200
220
120
140
80
60
40
20
2007
Crude Steel ProductionChange:%2011/2010
Source: worldsteel and EUROFER
2008 2009 2010 2011
Steel Scrap Use
210.2198.2
139.4
80.996.5
100.8(+4.5%)
116.7 111.3
172.6177.2(+2.7%)
0
200
500
600
700
800
300
400
100
2007
Crude Steel ProductionChange:%2011/2010
Source: worldsteel and CAMU
2008 2009 2010 2011
Steel Scrap Use
489.3 500.3
573.6
83.1 88.191.0
(+3.3%)68.5 72.0
626.7683.9(+9.1%)
12 World Steel Recycling in Figures 2007 – 2011
Steel ScraP For Steelmaking in EU-27 countrieS (million tonneS)
Crude Steel Production Steel Scrap Consumption
2010 2011 %Change 2010 2011 %Change
Austria 7.206 7.474 + 3.7 2.386 2.351 +6.1
Belgium 7.973 8.026 + 0.7 3.560 3.182 -2.4
Bulgaria 0.747 0.835 +11.8 0.832 0.910 +9.3
Czech Republic 5.180 5.583 + 7.8 2.130 2.288 +7.4
Finland 4.029 3.989 - 1.0 1.668 1.668 +/-0,0
France 15.414 15.781 + 2.4 8.111 8.768 +8.1
Germany 43.830 44.284 + 1.0 18.811 19.794 +5.2
Greece 1.821 1.946 + 6.9 2.131 2.263 +6.2
Hungary 1.678 1.746 + 4.1 0.450 0.526 +11.7
Italy 25.750 28.715 +11.5 20.362 22.519 +10.5
Latvia 0.655 0.870 +32.9 0.471 0.399 -15.3
Luxembourg 2.548 2.521 -1.1 2.854 2.824 -1.1
netherlands 6.651 6.937 + 4.3 1.769 1.765 -0.2
Poland 7.993 8.779 + 9.8 5.440 5.972 +9.8
Portugal 1.351 1.170 -13.4 1.520 1.520 +/-0.0
Romania 3.721 3.830 +2.9 2.179 2.330 +7.0
slovakia 4.583 4.235 -7.4 1.470 1.423 -3.2
slovenia 0.606 0.648 +6.8 0.668 0.734 +9.6
spain 16.343 15.504 - 5.1 14.036 13.119 -6.5
sweden 4.844 4.867 +0.5 2.207 2.349 +6.4
United Kingdom 9.717 9.478 -2.5 3.714 3.890 +4.7
EU-27 172.640 177.218 +2.7 96.469 100.770 +4.5
source: steel Production: worldsteel; scrap Consumption: eURoFeR

World Steel Recycling in Figures 2007 – 2011 13
Steel ScraP For Steelmaking in jAPAN (million tonneS)
Steel ScraP For Steelmaking in the USA (million tonneS)
0
100
120
140
60
800
40
20
2007
Crude Steel ProductionChange:%2011/2010
Source: worldsteel and Ministry of Economy, Trade and Industry in Japan
2008 2009 2010 2011
Steel Scrap Use
120.2
87.5
29.838.4
44.4 44.8
109.6
37.2(-3.0%)
107.6(-1.8%)
118.7
0
40
70
80
90
100
50
60
30
20
10
2007
Crude Steel Production Change:%2011/2010
Source: worldsteel and ISRI/USGS
2008 2009 2010 2011
Steel Scrap Use
98.191.4
58.253.0
60.064.0 66.0
80.5
56.0(-6.7%)
86.4(+7.3%)

14 World Steel Recycling in Figures 2007 – 2011
Steel ScraP For Steelmaking in TURkEy (million tonneS)
0
10
15
20
25
30
5
2007
Crude Steel ProductionChange:%2011/2010
Source: worldsteel and DGUD
2008 2009 2010 2011
Steel Scrap Use
25.826.8
25.3
21.5
25.3
22.6 22.9
29.130.8
(+21.9%)
34.1(+17.8%)
Steel ScraP For Steelmaking in RUSSIA (million tonneS)
0
40
70
80
90
100
50
60
30
20
10
2007
Crude Steel Production Change:%2011/2010
Source: worldsteel and UKRMET
2008 2009 2010 2011
Steel Scrap Use
72.4
60.0
13.721.521.4 20.1
21.0(-2.2%)
68.9(+2.9%)66.968.5
World Steel Recycling in Figures 2007 – 2011 15
ScraP uSe in iron and Steel FoundrieS in the World (million tonneS)
2007 2008 2009 2010 % 2010/ 2009
Iron steel and Malleable Casting Production 79.1 78.8 67.6 76.9 +13.8
total scrap Use 75.8 73.6 56.9 64.4 +7.5
(Ratio Scrap Use / Casting Production) in % 95.8 93.4 84.2 83.8
of which:
own Arisings (Circulating scrap)* 28.9 28.1 21.7 24.6 +13.4
(Share Own Arisings of Scrap Use) in % 38.1 38.1 38.1 38.2
scrap Purchases 46.8 45.5 35.2 39.8 +13.1
(Share Purchases of Scrap Use) in % 61.8 61.8 61.8 61.8
source: Modern Casting and own calculations by BdG/BIR
* own Arisings (Circulating scrap) is the term for lumpy metal remains evolving during the casting process. elements belonging to this process such as sprues, runners, ingates and feeders are essential to produce a raw casting, but they do not belong to the actual casting and are therefore eliminated during the finishing process of it. Rejects and scrap developing in the foundry are added to the Circulating scrap as well.
main Steel ScraP imPorterS (million tonneS)
2007 2008 2009 2010 2011 % 2011/2010
turkey 17.141 17.415 15.665 19.192 21.460 +11.8
Korea Rep. 6.887 7.319 7.800 8.091 8.628 +6.6
China 3.395 3.590 13.692 5.848 6.767 +15.7
India 3.014 4.579 5.336 4.643 2.929* +10.7
taiwan 5.418 5.539 3.912 5.364 5.328 -0.7
UsA 3.692 3.571 2.986 3.775 4.003 +6.0
eU-27 5.142 4.809 3.270 3.646 3.676 +0.8
Malaysia 3.688 2.293 1.683 2.292 2.050 -10.6
Indonesia 1.260 1.899 1.484 1.642 2.157 +31.4
Canada 1.435 1.674 1.408 2.226 1.911 -14.2
thailand 1.805 3.142 1.323 1.282 1.877 +46.4
source: official trade statistics/Wv stahl, dCUd
* Period Jan-July 2011

16 World Steel Recycling in Figures 2007 – 2011
main Steel ScraP exPorterS (million tonneS)
2007 2008 2009 2010 2011 % 2010/2009
UsA 16.642 21.712 22.439 20.556 24.373 +18.6
eU-27 10.566 12.799 15.779 19.033 18.770 -1.4
Japan 6.449 5.344 9.398 6.472 5.442 -15.9
Canada 4.100 4.084 4.792 5.154 4.832 -6.2
Russia 7.855 5.128 1.202 2.390 4.042 +69.1
Australia 1.501 1.708 1.925 1.636 1.745 +6.7
south Africa 0.752 1.271 1.144 1.224 1.436 +17.3
source: official trade statistics/Wv stahl
main Steel ScraP exPorterS – develoPment 2007 vS. 2010 (million tonneS)
Source: Official Trade Statistics/WV Stahl
0.752
7.855
1.501
6.449
4.100
1.436
4.042
1.745
5.442
4.832
16.642
10.566
24.373
18.770
JapanUSA EU-27 Canada Russia Australia South Africa
2007 2011

World Steel Recycling in Figures 2007 – 2011 17
1.464(+6.9%)
4.226(+31.5%)
5.624(+29.2%)
1.206(+23.6%)
China
Turkey
Taiwan
India
Canada
Korea Rep.
2.964(+4.8%)
3.540(+25.6%)
Total US exports24.373(+18.6%)
US Steel ScraP exPort 2011 (million tonneS)
main FloWS oF US Steel ScraP exPort 2011 (million tonneS)
Biggest Buyers
Change:% 2011/2010
source: official trade statistics/Wv stahl
Total Export: 24.373 (+18.6%)
turkey: 5.624(+29.2%)
Korea Rep.: 2.964 (+4.8%)
China: 4.226 (+31.5%)
Canada: 1.464 (+6.9%)
taiwan: 3.540 (+25.6%)
India: 1.206 (+23.6%)
Change:% 2011/2010
source: official trade statistics/Wv stahl

18 World Steel Recycling in Figures 2007 – 2011
EU-27 Steel ScraP exPort 2011 (million tonneS)
main FloWS oF EU-27 Steel ScraP exPort 2011 (million tonneS)
Biggest Buyers
Change:% 2011/2010
source: official trade statistics/Wv stahl
Change:% 2011/2010
source: official trade statistics/Wv stahl
Total Export: 18.770 (-1.4%)
turkey: 9.936(-7.1%)
China: 0.832(+39.8%)
India: 2.237(+5.1%)
Indonesia: 0.460(+172.2%)
egypt: 1.374(-18.4%)
switzerland: 0.456(-0.9%)
0.460(+172.2%)
0.832(+39.8%)
9.936(-7.1%)
1.374(-18.4%)
0.456(-0.9%)
2.237(+5.1%)Indonesia
China
India
Switzerland
Turkey
Egypt
Total EU-27 exports18.770(-1.4%)

World Steel Recycling in Figures 2007 – 2011 19
EU-27 external Steel ScraP exPortS by country (million tonneS)
Steel Scrap Exports by Main EU-27 Exporters to Third Countries Exporters 2010 2011 %Change Biggest Buyers 2010 2011 %Change
United Kingdom 5.208 5.376 +3.2 turkey 1.609 2.087 +29.7
India 1.287 1.090 -15.3
Indonesia 0.082 0.315 +284.1
egypt 0.761 0.281 -63.1
China 0.125 0.276 +120.8
netherlands 3.040 2.543 -16.3 turkey 1.824 1.281 -29.8
egypt 0.409 0.359 -12.2
India 0.194 0.226 +16.5
China 0.159 0.180 +13.2
Korea Rep. 0.099 0.161 +62.6
Belgium 2.355 2.250 -4.5 turkey 1.667 1.240 -25.6
egypt 0.463 0.680 +46.9
Romania 2.243 2.055 -8.4 turkey 2.204 2.046 -7.2
Germany 1.741 1.651 -5.2 turkey 0.793 0.692 -12.7
switzerland 0.327 0.321 -1.8
India 0.181 0.251 +38.7
Malaysia 0.037 0.061 +64.9
France 0.692 0.765 +10.5 turkey 0.328 0.321 -2.1
Morocco 0.086 0.167 +94.2
switzerland 0.094 0.100 +6.4
sweden 0.674 0.758 +12.5 turkey 0.251 0.293 +16.7
India 0.095 0.141 +48.4
Bulgaria 0.755 0.709 -6.0 turkey 0.565 0.495 -12,3
Macedonia 0.166 0.200 +20.5
EU-27 Extra Trade 19.033 18.770 -1.4
source: official trade statistics/Wv stahl

20 World Steel Recycling in Figures 2007 – 2011
EU-27 internal Steel ScraP exPortS by country (million tonneS)
Main Steel Scrap Exports between EU-27 Countries Exporters 2010 2011 %Change Biggest Buyers 2010 2011 %Change
Germany 7.917 8.064 +1.9 netherlands 2.025 2.054 +1.4
Italy 1.105 1.530 +38.5
Luxembourg 1.364 1.457 +6.8
France 1.190 1.217 +2.3
Belgium 1.184 0.933 -21.2
France 5.974 5.469 -8.5 spain 1.767 1.655 -6.3
Belgium 1.700 1.610 -5.3
Italy 0.758 0.763 +0.7
Luxembourg 0.816 0.684 -16.2
United Kingdom 2.311 2.411 +4.3 spain 1.226 1.144 -6.7
Portugal 0.317 0.427 +34.7
France 0.353 0.360 +2.0
netherlands 2.555 2.396 -6.2 Belgium 0.849 0.809 -4.7
Germany 0.709 0.792 +11.7
Czech Republic 1.821 1.946 +6.9 Germany 0.895 0.974 +8.8
Italy 0.265 0.366 +38.1
Poland 1.270 1.608 +26.6 Germany 0.833 1.131 +35.8
Czech Republic 0.248 0.283 +14.1
Belgium 1,372 1.287 -6.2 France 0.490 0.520 +6.1
netherlands 0.326 0.290 -11.0
Czech Republic 0.248 0.283 +14.1
Luxembourg 0.338 0.262 -22.5
Germany 0.106 0.122 +15.1
Austria 0.916 0.892 -2.6 Italy 0.410 0.451 +10.0
Germany 0.380 0.337 -11.3
EU-27 Intra Trade 30.313 30.914 +2.0
source: official trade statistics/Wv stahl
World Steel Recycling in Figures 2007 – 2011 21
CANADA Steel ScraP exPort 2011 (million tonneS)
Biggest Buyers
Change:% 2011/2010
source: official trade statistics/Wv stahl
Total Export: 4.832 (-6.2%)
UsA: 3.259(+20.8%)
turkey: 0.718(+1365.3%)
egypt: 0.359(-17.8%)
Italy: 0.101(-19.2%)
jAPAN Steel ScraP exPort 2011 (million tonneS)
Biggest Buyers
Change:% 2011/2010
source: official trade statistics/Wv stahl
Total Export: 5.442 (-15.9%)
Korea Rep.: 2.864(-15.7%)
taiwan: 0.038(-87.3%)
China: 2.445(-9.9%)
vietnam: 0.038(-39.7%)

22 World Steel Recycling in Figures 2007 – 2011
AUSTRAlIA Steel ScraP exPort 2011 (million tonneS)
Biggest Buyers
Change:% 2011/2010
source: official trade statistics/Wv stahl
Total Export: 1.745 (+6.7%)
China: 0.458(+203.3%)
vietnam: 0.202(-36.7%)
thailand: 0.239(+83.8%)
Malaysia: 0.206(+36.4%)
RUSSIA Steel ScraP exPort 2011 (million tonneS)
Biggest Buyers
Change:% 2011/2010
source: official trade statistics/Wv stahl
Total Export: 4.042 (+69.1%)
turkey: 1.874(+75.1%)
spain: 0.347(-6.2%)
Korea Rep.: 0.675(+63.4%)

World Steel Recycling in Figures 2007 – 2011 23
SOUTh AFRICA Steel ScraP exPort 2011 (million tonneS)
Biggest Buyers
Change:% 2011/2010
source: official trade statistics/Wv stahl
Total Export: 1.436 (+17.3%)
India: 0.570(+27.8%)
vietnam: 0.104(-43.2%)
Indonesia: 0.287(+141.2%)
Malaysia: 0.281(+36.4%)
major net Steel ScraP exPorterS 2011 (million tonneS)
0
10
15
20
25
5
USA
Steel Scrap Export Source: Official Trade Statistics/WV Stahl
EU-27 Japan Canada
Steel Scrap Import
4.003 3.676
0.5801.911
24.373
18.770
5.4424.832

24 World Steel Recycling in Figures 2007 – 2011
Price curve january 2011/2012
USA Export Prices (US$/GRT)USA Export HMS 1, heavy steel scrap (1/4 Inch)
Mar Apr May Jun July Aug Sep OctFebJan Dec JanNov
Source: Recycling International
Source: Recycling International
Mar Apr May Jun July Aug Sep OctFebJan Dec JanNov
Fob Rotterdam Export Prices (US$/t)HMS 80/20 heavy steel scrap
Lowest priceHighest price
Fob West Coast priceFob East Coast price
375
370
470
465
420
415
420
415
430
426
460
455445
440
460
455 435
430 410
400
405
400
425
420
350
400
450
500
550
375385
470
370380
448 449465
441440
470 470
465 465460
455 455
470
445
440435
425 410400
395 405
350
400
450
500
550

GLossARY
BIR Bureau of International Recycling, Brussels, Belgium
BDG German Foundry Association, düsseldorf, Germany
CAMU China’s Association of Metalscrap Utilization, Beijing, China
DCUD turkish Iron and steel Producers Association, Ankara, turkey
EFR european Ferrous Recovery & Recycling Federation, Brussels, Belgium
EURoFER european Confederation of Iron and steel Industries, Brussels, Belgium
ISRI Institute of scrap Recycling Industries, Washington, UsA
MIDREX Midrex technologies Inc., Charlotte, UsA
Modern Casting Magazine for Foundries and diecasters, schaumburg, Illinois, UsA
official Trade Statistics Prepared by Wv stahl, düsseldorf, Germany
Recycling International International trade magazine, Arnhem, the netherlands
USGS U.s. Geological survey, Reston, UsA
worldsteel World steel Association, Brussels, Belgium
WV Stahl German steel Federation, düsseldorf, Germany

Bureau of International Recycling aisblAvenue Franklin Roosevelt 241050 BrusselsBelgium
T. +32 2 627 57 70F. +32 2 627 57 73